
Absorption Spectra of Conjugated Dyes - Index of [chemistry ...
Upload
independentCategory
view
5download
0
Detection of Live Circulating Tumor Cells by a Class ofNear-Infrared Heptamethine Carbocyanine Dyes inPatients with Localized and Metastatic Prostate CancerChen Shao1,2,7., Chun-Peng Liao1,2., Peizhen Hu1,2, Chia-Yi Chu1,2, Lei Zhang8, Matthew H. T. Bui4,
Christopher S. Ng4, David Y. Josephson4, Beatrice Knudsen1,2,5, Mourad Tighiouart6, Hyung L. Kim1,2,4,
Haiyen E. Zhau1,2, Leland W. K. Chung1,2,3*, Ruoxiang Wang1,2,3*, Edwin M. Posadas1,2,3*
1Uro-Oncolgy Research Laboratories, Samuel Oschin Comprehensive Cancer Institute at Cedars-Sinai Medical Center, Los Angles, California, United States of America,
2Urologic Oncology Program, Samuel Oschin Comprehensive Cancer Institute at Cedars-Sinai Medical Center, Los Angles, California, United States of America, 3Division
of Hematology Oncology-Department of Medicine, Cedars-Sinai Medical Center, Los Angeles, California, United States of America, 4Divsion of Urology- Department of
Surgery, Cedars-Sinai Medical Center, Los Angeles, California, United States of America, 5 Translational Pathology and Biobank, Cedars-Sinai Medical Center, Los Angeles,
California, United States of America, 6 Biostatistics and Bioinformatics Research Center, Cedars-Sinai Medical Center, Los Angeles, California, United States of America,
7Department of Urology Xijing Hospital, The Fourth Military Medical University, Xi’an, Shaanxi, China, 8Department of Epidemiology, Xijing Hospital, The Fourth Military
Medical University, Xi’an, Shaanxi, China
Abstract
Tumor cells are inherently heterogeneous and often exhibit diminished adhesion, resulting in the shedding of tumor cellsinto the circulation to form circulating tumor cells (CTCs). A fraction of these are live CTCs with potential of metastaticcolonization whereas others are at various stages of apoptosis making them likely to be less relevant to understanding thedisease. Isolation and characterization of live CTCs may augment information yielded by standard enumeration to helpphysicians to more accurately establish diagnosis, choose therapy, monitor response, and provide prognosis. We previouslyreported on a group of near-infrared (NIR) heptamethine carbocyanine dyes that are specifically and actively transportedinto live cancer cells. In this study, this viable tumor cell-specific behavior was utilized to detect live CTCs in prostate cancerpatients. Peripheral blood mononuclear cells (PBMCs) from 40 patients with localized prostate cancer together with 5patients with metastatic disease were stained with IR-783, the prototype heptamethine cyanine dye. Stained cells weresubjected to flow cytometric analysis to identify live (NIR+) CTCs from the pool of total CTCs, which were identified byEpCAM staining. In patients with localized tumor, live CTC counts corresponded with total CTC numbers. Higher live CTCcounts were seen in patients with larger tumors and those with more aggressive pathologic features including positivemargins and/or lymph node invasion. Even higher CTC numbers (live and total) were detected in patients with metastaticdisease. Live CTC counts declined when patients were receiving effective treatments, and conversely the counts tended torise at the time of disease progression. Our study demonstrates the feasibility of applying of this staining technique toidentify live CTCs, creating an opportunity for further molecular interrogation of a more biologically relevant CTCpopulation.
Citation: Shao C, Liao C-P, Hu P, Chu C-Y, Zhang L, et al. (2014) Detection of Live Circulating Tumor Cells by a Class of Near-Infrared Heptamethine CarbocyanineDyes in Patients with Localized and Metastatic Prostate Cancer. PLoS ONE 9(2): e88967. doi:10.1371/journal.pone.0088967
Editor: Joseph Najbauer, University of Pecs Medical School, Hungary
Received September 19, 2013; Accepted January 14, 2014; Published February 14, 2014
Copyright: � 2014 Shao et al. This is an open-access article distributed under the terms of the Creative Commons Attribution License, which permitsunrestricted use, distribution, and reproduction in any medium, provided the original author and source are credited.
Funding: This work was supported by research grants from the Prostate Cancer Foundation, National Institutes of Health/National Cancer Institute(2PO1CA098912 and 1RO1CA122602) and the Board of Governors Cancer Research Chair (LWKC), and by the Program of International Science and TechnologyCooperation of China (No. 2011DFA33110). The funders had no role in study design, data collection and analysis, decision to publish, or preparation of themanuscript.
Competing Interests: The authors have declared that no competing interests exist.
* E-mail: [email protected] (EMP); [email protected] (RW); [email protected] (LWKC)
. These authors contributed equally to this work.
Introduction
Solid tumors are in a constant state of evolution with progressive
heterogeneity [1,2]. The process of metastatic progression is
accompanied by multiple phenotypic alternations that result in
decreased adhesiveness and increased cellular motility among
other alterations [3]. Some motile cancer cells have the capacity to
disseminate to distant sites via the vasculature and lymphatic
channels and invade tissue leading to formation of a metastatic
lesion [4]. Circulating tumor cells (CTCs) thus form a key link
between primary tumors and their distant metastases, demarcating
irreversible progression of the disease. Isolation and characteriza-
tion of these live and active cancer cells may improve disease
prognosis, as has been demonstrated in prostate cancer (PCa) [5].
The shedding of CTCs is a dynamic process that occurs with
both primary and metastatic tumors. The fact that disseminated
tumor cells can be detected in the blood of PCa patients after
prostatectomy [6] suggests that CTCs can be shed from either
residual tumor in the prostate bed or from metastatic deposits.
Molecular investigation of these cells may provide real-time
information on the status of malignant progression. As the
PLOS ONE | www.plosone.org 1 February 2014 | Volume 9 | Issue 2 | e88967

collection of CTCs typically requires low-volume standard
phlebotomy, some have proposed that CTCs may be exploited
as an ideal surrogate tissue or liquid biopsy to gauge disease status
[7]. Such a source of tissue would provide a simple, minimally-
invasive tissue source that could be accessed serially to provide
high temporal definition of the evolution of underlying disease.
The predictive value of CTCs relies on technical advances to
enable reliable detection and isolation. CTCs constitute only a
minute fraction of peripheral blood mononuclear cells (PMBCs).
Many new technologies are presently being tested for CTC
detection and isolation [8]. The most commonly employed
strategy relies on epithelial lineage-specific markers such as
EpCAM [9] or on size differences relative to PBMCs [10]. The
only FDA-approved CTC assay uses an immunomagnetic
separation technique based on the expression of epitheial surface
markers [11,12]. The relatively low sensitivity of the assay, coupled
with the requirement for pre-fixation makes the isolates unsuitable
for molecular analysis beyond immunofluorescence. The depen-
dence on marker expression does not allow for comprehensive
detection of the heterogeneous CTC pool. It is also known that not
every CTC will result in a new metastatic lesion. The pool of
CTCs is composed of live and actively metastasizing cells and
bystanders that are passively shed into the circulation [5,13–15], in
combination with apoptotic tumor cell debris [16–18]. Alternative
CTC detection strategies are needed, to isolate the metastasizing
fraction, which is most likely to be found in the live CTC pool.
To develop a cost-effective method to identify live CTCs, we
assessed the feasibility of using a group of synthetic near infrared
(NIR) heptamethine carbocyanine dyes. We have previously
demonstrated that these organic dyes are specifically transported
into tumor cells and can distinguish malignant from nonmalignant
cells in xenograft models or spontaneous tumors in vivo, and in
surgical tumor specimens in vivo or ex vivo [19,20]. These dyes are
taken up and accumulated by cancer cells through an active
transport system independent of the conventionally employed
epithelial surface marker (EpCAM). Furthermore uptake of the
dye requires active (ATP-driven) transport and thus can be viewed
as a functional assay for tumor cell viability. The results from the
current study suggest that IR-783, the prototype of this group of
selected NIR dyes, can be incorporated into several detection
protocols to identify live CTCs. These live CTCs could be isolated
from cancer patients prior to and during therapeutic intervention
given the relatively non-invasive means of procurement. Further
molecular interrogation could then ensue even at the single-cell
level [21].
Materials and Methods
Antibodies and ReagentsFluorescein isothiocyanate (FITC)-conjugated mouse monoclo-
nal antibody (mAb) to human EpCAM (clone 9C4) and
phycoerythrin (PE)-conjugated mouse mAb to CD45, together
with purified isotype-matched IgG1 and IgG2b, were purchased
from BioLegend (San Diego, CA). The source and use of other
antibodies has been previously reported, including those against
human RANKL, HIF-1a, NRP-1, and VEGF, as well as those to
phosphorylated c-MET and the p65 subunit of NFkB [22]. The
sources and purification of heptamethine carbocyanine dyes have
been reported previously [19,20]. Ficoll-Paque PREMIUM 1.084
was purchased from GE Healthcare (Piscataway, NJ), and
Histopaque-1077 was purchased from Sigma-Aldrich (St. Louis,
MO).
Cell CultureHuman PC-3 cells were obtained from American Type Culture
Collection (Manassas, VA). The cells were cultured in RPMI-1640
medium supplemented with 5% fetal bovine serum (FBS, Gemini
Bio-Products, West Sacramento, CA), penicillin (100 unit/ml) and
streptomycin (100 mg/ml). Cells were detached with 0.05%
trypsin/EDTA (Invitrogen, Carlsbad, CA), washed in Ca2+- and
Mg2+-free phosphate buffered saline (PBS, Invitrogen), and
resuspended in complete culture medium. Cells were counted on
a TC10 Automated Cell Counter (Bio-Rad, Hercules, CA), with
trypan blue exclusion to confirm cell viability.
Clinical Blood SpecimensPatient blood samples were used with written informed consent
through Cedars-Sinai Medical Center institutional review board-
approved bio-banking protocols (IRB #Pro00025217 and
#Pro00030418). Clinical blood samples were collected pre-
operatively from 40 PCa patients undergoing radical prostatecto-
my at Cedars-Sinai Medical Center. Multiple blood samples were
obtained from repeated visits of 5 patients with androgen
independent disease. Additional blood samples from 34 healthy
male donors aged between 32 and 70 years were obtained. About
7.5 ml of venous blood was collected into an EDTA-containing
lavender top tube (BD, Franklin Lakes, NJ), and centrifuged at
1,500 rpm for 20 minutes at room temperature on a Heraeus
CLINIFUGE centrifuge (Thermo Scientific, Logan, UT). After
the plasma fraction was harvested for diagnostic purposes, the
packed blood cell fraction was transported on ice to the research
laboratory within 3 hours of collection.
Isolation of PBMCsPBMCs were isolated with standard density gradient centrifu-
gation. The packed blood sample was diluted with an equal
volume of a balanced salt solution containing 0.01% glucose (w/v),
5 mM CaCl2, 9.8 mM MgCl2, 540 mM KCl, 126 mM NaCl, and
14.5 mM Tris, pH 7.6. A 2-ml aliquot of the diluted sample was
layered onto a 3 ml Ficoll-Paque cushion and subjected to
centrifugation at 4006g at room temperature for 40 minutes.
Cells in the nucleated cell fraction were collected and washed
twice in PBS, and resuspended in RPMI-1640 medium containing
5% FBS for further analyses.
Tumor Cell Spiking and StainingAliquots of the PBMCs were made so that each contained an
equivalent number of cells from 1 ml donor blood, about 26106
cells/aliquot. To spike with cancer cells, known numbers of live
PC-3 cells in RPMI 1640 medium containing 5% FBS were added
to the PBMC aliquot. In control studies spiked with dead cancer
cells, PC-3 cells in single cell suspension were killed in 75% ethanol
and recovered in the same medium. The spiked samples were then
stained with 20 mM NIR dyes at 37uC for 30 minutes. After
washing twice in PBS to remove free dyes, the cells were fixed in
formalin for 10 minutes at room temperature, washed twice in
PBS, and resuspended in 400 ml Cell Staining Buffer (BioLegend).
To further stain for surface markers, the samples were incubated
first with isotype IgG on ice for 10 minutes, and then reacted
simultaneously with FITC-conjugated mAb to EpCAM and PE-
conjugated mAb to CD45 for 20 minutes. The working ratio of the
mAbs was 0.1 mg/106 cells. After washing twice with the Cell
Staining Buffer, the cells were stained with 49,69-diamidino-2-
phenylindole (DAPI, Invitrogen) before being subjected to
detection.
Live Circulating Tumor Cells Detected by NIR Dye
PLOS ONE | www.plosone.org 2 February 2014 | Volume 9 | Issue 2 | e88967

Detection of CTC with Fluorescence Activated CellSorting (FACS)Two FACS instruments (BD Biosciences, MA) were used in the
study. To isolate CTCs, a FACSAria III was used to sort positively
labeled cells onto an APES-coated cytology slide (Bio-World,
Dublin, OH). To enumerate CTCs, an LSRII Flow Cytometer
was used. Manufacturer recommended detection procedures were
followed. In parallel to the detection of each human blood sample,
16104 PC-3 cells were used to spike a 1 ml aliquot of the sample.
The flow cytometric profile of the spiked sample was used to guide
the positivity gating. FACS data was further analyzed with FlowJo
software.
Fluorescence ImagingStained cells isolated with the FACS sorter on slides were
subjected to both fluorescence imaging and near infrared imaging
with our previously reported procedure [19,20,22], with a Nikon
Eclipse Ti fluorescence microscope excited by a xenon arc light
source. Near infrared images were acquired through an INDO
filter (780–840 nm).
Multiple Quantum Dot Labeling (mQDL)Stained cells collected with the FACS sorter on glass slides were
subjected to further staining with the mQDL protocol as
previously reported [22]. In brief, the samples were first treated
with stripping buffer to remove the mAb used for CTC isolation,
and then subjected to successive staining with antibodies reacting
to a group of PCa-related biomarkers, including RANKL, HIF-
1a, NRP-1, VEGF, p-c-MET, and p-p65, as previously reported
[22], with the same staining protocol. Finally, the samples were
counterstained with DAPI before being subjected to spectral
imaging and signal quantification on a CRi spectral imaging
system with Nuance software (Caliper Life Sciences, Hopkinton,
MA).
Statistical AnalysisMeans, standard deviations, and medians were used to
summarize continuous variables. Frequencies and percentages
were calculated for categorical variables. Spearman correlations
were calculated between continuous variables in the data due to
skewed distributions. Comparisons of live CTC between categories
of interest were done using Wilcoxon Rank Sum tests. A linear
mixed model was used to assess the relationship between the
number of cells spiked and retrieved, where the repeated measures
on the donors were modeled with a heterogeneous compound
symmetric covariance structure. All analyses were done using SAS
version 9.3.
Results
We have previously demonstrated active uptake and retention
of NIR dyes by cultured human PCa LNCaP, C4-2, PC-3, DU-
145, ARCaPE and ARCaPM cells [19,20]. As few as ten PC-3 cells
spiked into 1 ml human donor blood can be detected using IR-
783. Dead PC-3 cells spiked in the same fashion failed to exhibit
any IR-783 uptake. Because uptake of IR-783 requires the use of
an ATP-requiring organic anion transporter, dye uptake itself is a
functional assay which points toward tumor cell viability. To assess
applicability of this approach to detecting live CTCs in patient
blood samples, we incorporated NIR dye staining into FACS
analysis. The widely used EpCAM+CD452profile [9,12] was
adopted to consolidate the CTC nature of the detected NIR+ cells.
1. Identification and Isolation of Live (NIR+) Cells fromHuman BloodPatient blood samples were subjected to gradient centrifugation
then sequential staining: first with NIR dye to stain live CTCs,
then with fluorescence-labeled antibodies to EpCAM and CD45
for confirmation. Finally, the sample was stained with DAPI for
the visualization of cell nuclei.
As a control to calibrate the performance of the detection
system, we first tested the staining protocol with healthy donor
blood spiked with PC-3 cells at varying numbers. In FACS
analysis, the stained samples were sorted to isolate the
EpCAM+CD452 population. These cells were then resorted to
determine the number of NIR+DAPI+ cells (Figure 1A). PC-3 cells
were identified as nucleated cells (DAPI+) expressing EpCAM but
not CD45 (Figure S1). In repeated tests when the final
EpCAM+CD452NIR+DAPI+ counts were modeled as a function
of spiked cell number, a significant increasing trend was observed
with a correlation coefficient of 0.997 (Figure 1B and Table S1).
The highly linear correlation suggested that this FACS protocol
was usable for detecting CTCs with a negligible number of non-
specific counts. We further determined that the recovered PC-3
cells on microscope slides could be readily seen by fluorescence
microscopy (Figure 1C). Using the same protocol, we detected
2.861.7 EpCAM+CD452NIR+DAPI+ events in a series of studies
with blood specimens collected from 34 healthy donor subjects
(Figure 1B). This detection was well in agreement with other
studies on EpCAM+ cells in healthy donor blood samples analyzed
using next generation CTC platforms [23], and probably reflects
the background level of circulating epithelial cells. Importantly, in
parallel studies where dead PC-3 cells were used in spiking, the
EpCAM+CD452NIR+DAPI+ counts were maintained at the
background level, suggesting that the spiked dead PC-3 cells did
not pick up the dye (data not shown). These control studies
collectively demonstrate the suitability of NIR dye to stain and
detect live CTCs.
2. Detection of Live CTCs in Patients with Localized PCaUndergoing Radical ProstatectomyUsing the functional FACS assay following NIR staining, we
tested the detection of EpCAM+CD452DAPI+ cells, henceforward
referred to as total CTCs, in clinical PCa patients with emphasis on
the EpCAM+CD452NIR+DAPI+ events (henceforward referred
to as live or NIR+ CTCs). PBMCs were isolated from pre-operative
blood samples of 40 patients diagnosed with localized diseases.
Detailed characteristics of these patients are summarized in
Table 1.
This series of analysis revealed that live CTC counts varied
remarkably among patients. EpCAM+CD452NIR+DAPI+ counts
ranged from 0 to 439 cells/ml (average 25 cells/ml; median 10
cells/ml) for this cohort of perioperative patients (Table 1). In this
study, a count of less than 5 was considered normal, as our healthy
donor pool had 2.861.7 EpCAM+CD452NIR+DAPI+ counts
(Figure 1B). The staining method reproducibly detected more than
5 live CTCs/ml in 30 of the 40 patients. Representative results
from flow cytometric detection are shown in Figure 2A. We
further demonstrated that the CTCs could be isolated directly
onto microscope slides, and could be visualized with fluorescence
microscopy (Figure 2B). In these analyses, live CTCs were
distinguished from dead cells based on uptake of NIR dye
(Figure 2B).
The live CTC counts detected from this cohort did not correlate
significantly with pre-operative serum PSA level (r = 0.12, p=0.47,
Figure S2), pathologic N-stage (given only 1 node positive patient),
Live Circulating Tumor Cells Detected by NIR Dye
PLOS ONE | www.plosone.org 3 February 2014 | Volume 9 | Issue 2 | e88967
Gleason score, or margin status (Figure S3). Comparing CTC
counts to the Stephenson predictive monogram, there was no
statistically significant relationship between live CTC counts and
the Stephenson predictive monogram.
There were 10 patients with 5 or fewer live CTCs/ml (Table 1),
and all had T2 disease with negative surgical margins. Only one of
these patients (patient 26) had a detectable serum PSA concen-
tration 2 weeks after radical prostatectomy. His serum PSA
became undetectable at 6 weeks following the operation. The
patient has since remained relapse-free. There were 3 patients with
positive surgical margins (patients 2, 13, and 25, Table 1). These
patients have also remained relapse-free for more than two years
so far without additional anti-cancer therapies.
There were 3 patients had detectable serum PSA concentrations
within 3 months after radical prostatectomy (Table 1). Patient 26
had a pT2cN0 Gleason 3+3 cancer with negative margins.
Interestingly, he had only 3 live CTCs/ml blood. Serum PSA in
this patient became undetectable later without additional inter-
vention. Patient 29 had a pT3aN0 Gleason 4+5 cancer with
positive margins, and was detected with 46 live CTCs/ml. His
serum PSA level became undetectable after 6 months of androgen
deprivation therapy that continues until this time. Patient 39 had
lymph node metastasis at the time of surgery and was found to
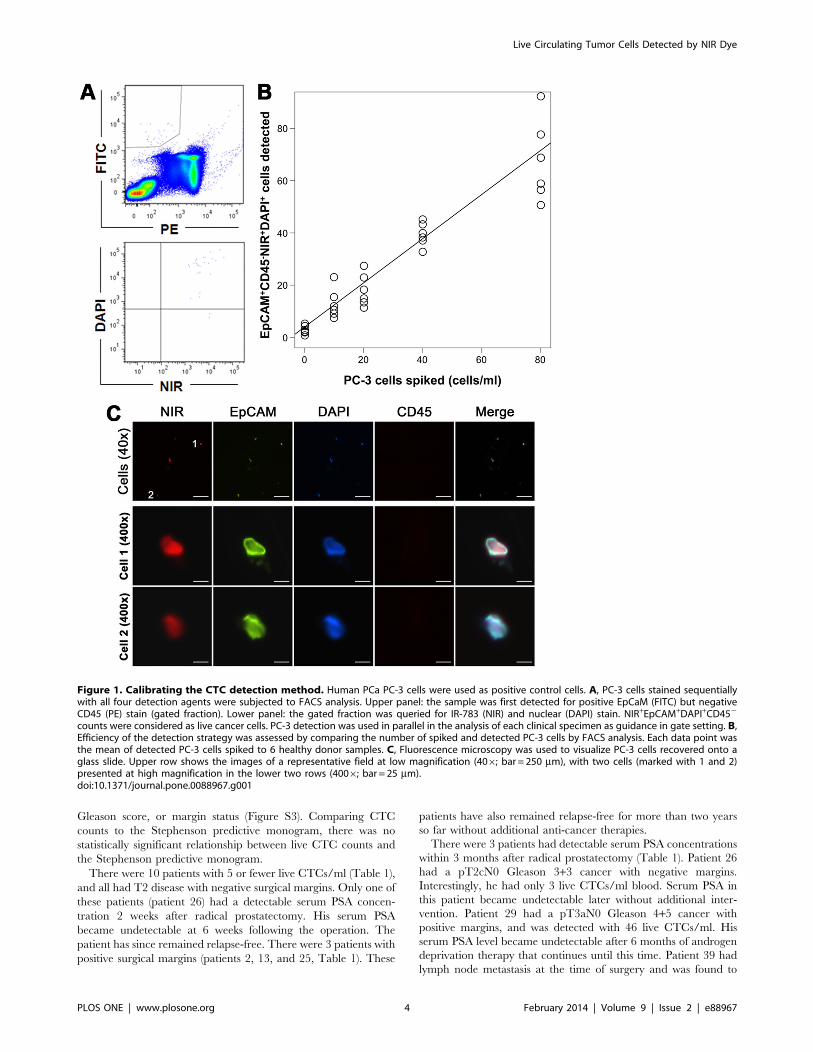
Figure 1. Calibrating the CTC detection method. Human PCa PC-3 cells were used as positive control cells. A, PC-3 cells stained sequentiallywith all four detection agents were subjected to FACS analysis. Upper panel: the sample was first detected for positive EpCaM (FITC) but negativeCD45 (PE) stain (gated fraction). Lower panel: the gated fraction was queried for IR-783 (NIR) and nuclear (DAPI) stain. NIR+EpCAM+DAPI+CD452
counts were considered as live cancer cells. PC-3 detection was used in parallel in the analysis of each clinical specimen as guidance in gate setting. B,Efficiency of the detection strategy was assessed by comparing the number of spiked and detected PC-3 cells by FACS analysis. Each data point wasthe mean of detected PC-3 cells spiked to 6 healthy donor samples. C, Fluorescence microscopy was used to visualize PC-3 cells recovered onto aglass slide. Upper row shows the images of a representative field at low magnification (406; bar = 250 mm), with two cells (marked with 1 and 2)presented at high magnification in the lower two rows (4006; bar = 25 mm).doi:10.1371/journal.pone.0088967.g001
Live Circulating Tumor Cells Detected by NIR Dye
PLOS ONE | www.plosone.org 4 February 2014 | Volume 9 | Issue 2 | e88967

have high pre-operative CTC counts (439/ml). Additional cases of
recurrence have to be examined in order to determine if pre-
operation CTC counts could be used as a parameter for predicting
disease relapse.
We also compared live CTC counts to surgical margin status.
The 25 patients with negative margins had an average of 25 live
CTCs/ml (range 0–148), in comparison to the 15 patients with
positive margins that had an average of 54 live CTCs/ml (range
2–439). The difference was not statistically significant, likely due to
the marked variation between individuals and the limited sample
size.
While most of the patients in our cohort had Gleason 6 or 7
pathologies, no correlation was found between Gleason score and
live CTC numbers. On the other hand, patients with higher live
Table 1. Detailed summary of the patients undergoing prostatectomy.
Patient IDGleasonScore T stage N stage
Marginstatus
Stephensonprediction
Pre-operationPSA(ng/ml)
Post-operationPSA(ng/ml)
Total CTC(counts/ml)
NIR+ CTC(counts/ml)
Live CTC(%)
1 3+3 pT2a pN0 – 98% 4.76 ,0.1 8 4 50%
2 3+4 pT2c pN0 + 95% 2.7 ,0.1 4 2 50%
3 3+4 pT2c pN0 – 98% 1.9 ,0.1 15 10 67%
4 3+4 pT2c pN0 – 96% 4.6 ,0.1 26 19 73%
5 3+4 pT2c pNx + 92% 8.34 ,0.1 65 7 11%
6 3+3 pT2c pN0 – 98% 4.5 ,0.1 10 10 100%
7 3+3 pT2c pN0 + 97% 4.33 ,0.1 12 10 83%
8 3+4 pT2c pN0 – 96% 4.54 ,0.1 34 8 24%
9 3+4 pT2c pNx – 96% 5.2 ,0.1 10 10 100%
10 4+3 pT2c pN0 – 89% 6.96 ,0.1 4 4 100%
11 3+3 pT2c pNx – 97% 9.16 ,0.1 1 1 100%
12 3+4 pT2c pN0 – 96% 4.9 ,0.1 2 2 100%
13 3+4 pT2c pN0 + 93% 5.9 ,0.1 8 5 63%
14 3+4 pT2c pN0 – 96% 5 ,0.1 151 148 98%
15 3+3 pT2c pN0 – 98% 1.53 ,0.1 12 11 92%
16 3+4 pT2c pN0 – 95% 7.69 ,0.1 5 5 100%
17 3+3 pT2c pNx + 97% 4.35 ,0.1 8 8 100%
18 3+3 pT2c pN0 + 96% 5 ,0.1 10 10 100%
19 3+4 pT2c pN0 – 94% 14.02 ,0.1 21 20 95%
20 3+4 pT2c pN0 – 95% 7 ,0.1 23 13 57%
21 3+3 pT2c pN0 – 97% 7.3 ,0.1 54 53 98%
22 3+4 pT2c pN0 + 95% 2.79 ,0.1 117 116 99%
23 3+4 pT2c pN0 – 95% 5.7 ,0.1 0 0
24 3+3 pT2c pN0 – 96% 16.44 ,0.1 26 26 100%
25 3+4 pT2c pNx + 96% 4.26 ,0.1 6 5 83%
26 3+3 pT2c pN0 – 98% 4.02 0.14 3 3 100%
27 3+4 pT3a pN0 + 85% 5 ,0.1 119 87 73%
28 3+4 pT3a pN0 – 89% 6.1 ,0.1 16 11 69%
29 4+5 pT3a pN0 + 34% 33 0.43 57 46 81%
30 4+3 pT3a pN0 – 79% 4.85 ,0.1 14 13 93%
31 3+4 pT3a pN0 – 90% 4.2 ,0.1 53 48 91%
32 3+4 pT3a pNx + 84% 6.09 ,0.1 22 10 45%
33 4+3 pT3a pNx – 78% 5.5 ,0.1 141 132 94%
34 3+4 pT3a pN0 – 87% 9.95 ,0.1 8 7 88%
35 3+4 pT3a pN0 – 89% 5.6 ,0.1 8 8 100%
36 4+3 pT3a pN0 – 77% 6.05 ,0.1 46 43 93%
37 3+4 pT3a pN0 + 86% 4.3 ,0.1 26 19 73%
38 4+3 pT3b pN0 + 32% 10 ,0.1 8 7 88%
39 4+3 pT3b pN1 + 15% 12.6 0.2 440 439 100%
40 3+3 pTx pN0 + N/A 9.67 ,0.1 54 48 89%
doi:10.1371/journal.pone.0088967.t001
Live Circulating Tumor Cells Detected by NIR Dye
PLOS ONE | www.plosone.org 5 February 2014 | Volume 9 | Issue 2 | e88967
CTC counts trended toward having more advanced disease by
tumor staging. There was a significant association between live
CTC counts and T stage, with pT3 patients having higher counts
than pT2 cases (median 8 vs. 19, p=0.02). Notably, the only
patient with node-positive pN1 disease had the highest live CTC
count (439 CTCs/ml, patient 39, Table 1). High live CTC counts,
therefore, seemed correlated to advanced tumor stages.
3. Assessments of Live CTCs in Patients with MetastaticDiseasesConsecutive blood samples were obtained from 5 PCa patients
whose disease had relapsed and metastasized following initial
therapy. These patients were undergoing various types of systemic
treatment. In contrast to the live and total CTC counts in patients
with localized disease, greater disparity between total and live
CTC counts was seen (Table 2), while CTC counts across cases
showed little correlation to serum PSA concentration (Figure 3).
Nonetheless, when analyzed over time for individual patients, we
identified interesting trends in which live CTC counts seemed to
correlate inversely to the observed clinical benefit in response to
therapies.
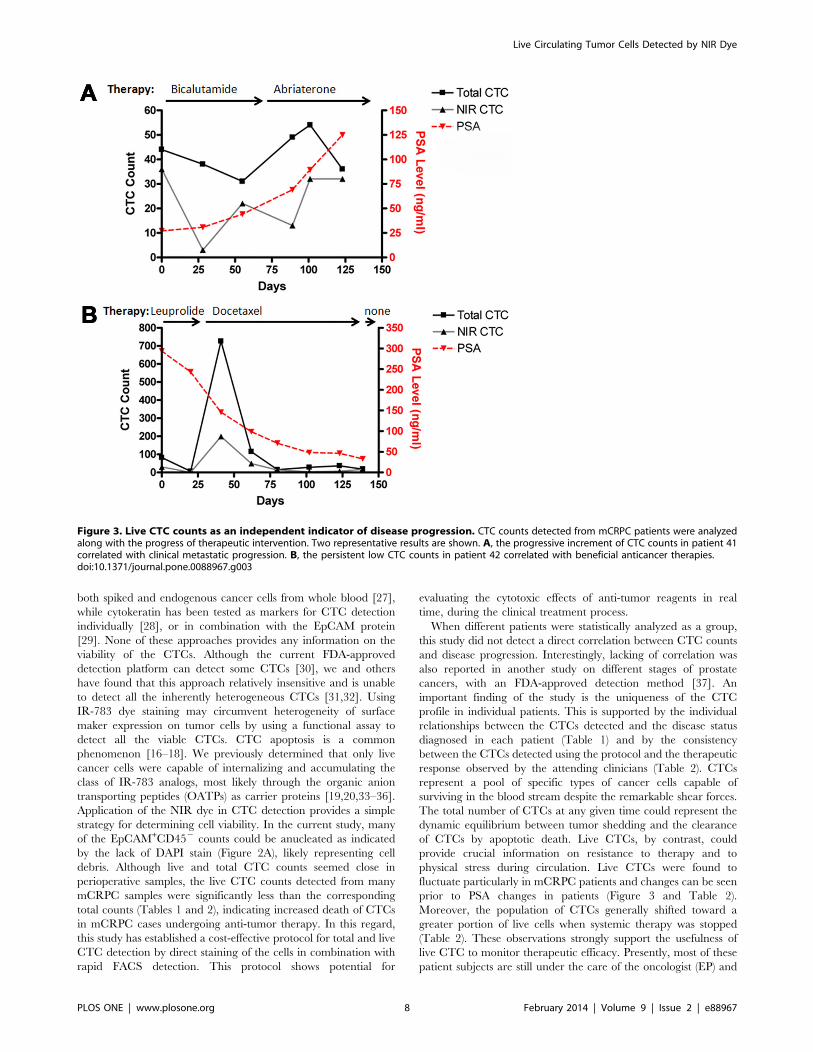
Patient 41 began bicalutamide treatment at the start of sample
collection for metastatic castration-resistant PCa (mCRPC). He
experienced asymptomatic biochemical (i.e., serum PSA) progres-
sion for two months, during which live CTC counts initially
decreased but rebounded quickly. The treatment was changed to
abiraterone acetate, which failed to produce a biochemical
response. The patient developed symptomatic osseous metastatic
disease and required radiation therapy. During disease progres-
sion, total CTC counts were sustained, but the live CTC
proportion increased along with serum PSA level (Table 2 and
Figure 3A).
Patient 42 was subjected to CTC detection before the first cycle
of docetaxel therapy, which resulted in an excellent response
judged by the continued drop of serum PSA level even after the
therapy was ended. The patient remained asymptomatic for
another 4 months before having to undertake another 8 cycles of
docetaxel for symptomatic progression. During the treatment, the
patient’s CTC counts decreased markedly, from 82 down to 6, and
live CTCs decreased accordingly, from 37 to 0%. This patient
experienced a rebound in total and live CTCs during the course of
docetaxel treatment from day-20 to day-139. Toward the end of
docetaxel treatment (from day-102 to day-139), we observed live
CTCs rebounding from 14 to 94% (Table 2 and Figure 3B).
Patient 43 initially received docetaxel therapy on which he
displayed initial biochemical and clinical responses. The second
cycle of docetaxel treatment, however, was followed by rapid
disease progression with progressive clinical deterioration (i.e.,
worsening pain and weight loss) and a rise in serum PSA. We
noted a dramatic elevation in the percentage of live CTCs (from
2% up to 97%) without substantial changes of total CTCs (ranged
from 36 to 44). The patient expired over the next 2 months with
rapid clinical deterioration. The live CTC count rose markedly
along with the deterioration (Table 2).
Patient 44 was treated with bicalutamide for mCRPC. The
treatment did not result in biochemical benefit but a precipitous
drop in CTC counts from 1052 to 54 was noted. Despite this
dramatic drop in total CTCs, however, the percentage of live
CTCs did not change substantially remaining in the range of 63 to
88%. The CTC counts rose from 54 to 196 between day-25 to
day-73 at the time when bicalutamide treatment was terminated.
This patient required palliative radiation and a quaternary
hormonal maneuver (Table 2).
Patient 45 had castration sensitive PCa and was subjected to
intermittent androgen suppression therapy that had been initiated
4 months before the first CTC detection. Live CTC count was
below the threshold of detection, in good agreement with the well-
suppressed serum PSA concentration (Table 2). In this case, the
subsequent rise of live CTC counts was 4 months earlier than the
PSA rebound, which was later suppressed with androgen
deprivation therapy. It is worth noting, however, that this patient
had a high percentage of live CTCs (83–84%) despite hormonal
suppression therapy.
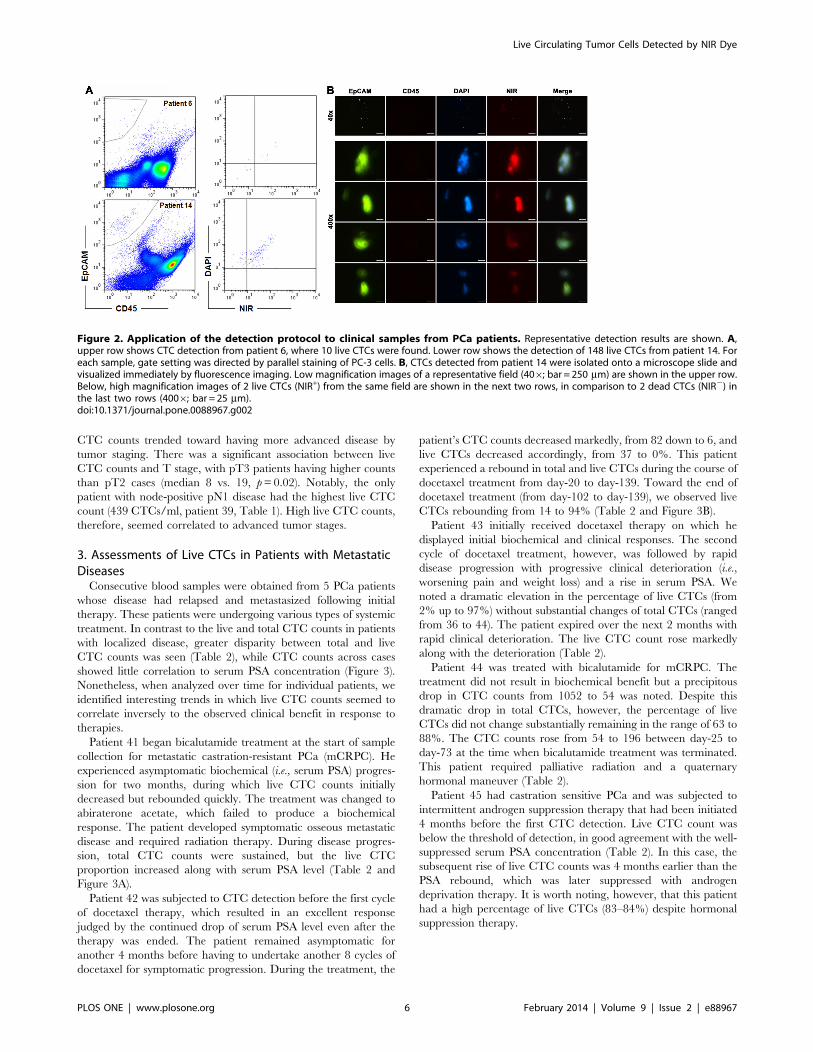
Figure 2. Application of the detection protocol to clinical samples from PCa patients. Representative detection results are shown. A,upper row shows CTC detection from patient 6, where 10 live CTCs were found. Lower row shows the detection of 148 live CTCs from patient 14. Foreach sample, gate setting was directed by parallel staining of PC-3 cells. B, CTCs detected from patient 14 were isolated onto a microscope slide andvisualized immediately by fluorescence imaging. Low magnification images of a representative field (406; bar = 250 mm) are shown in the upper row.Below, high magnification images of 2 live CTCs (NIR+) from the same field are shown in the next two rows, in comparison to 2 dead CTCs (NIR2) inthe last two rows (4006; bar = 25 mm).doi:10.1371/journal.pone.0088967.g002
Live Circulating Tumor Cells Detected by NIR Dye
PLOS ONE | www.plosone.org 6 February 2014 | Volume 9 | Issue 2 | e88967

4. Isolation of Live CTCs for further MolecularCharacterizationNIR staining facilitated the identification and isolation of live
CTCs from clinical blood samples (Figure 2). We tested the
isolated CTCs to further investigate PCa-related molecular
alterations. In one such investigation, CTCs in PCa patients were
isolated based on EpCAM+CD452NIR+DAPI+ staining. Protein
expression in the CTCs was detected by mQDL and was
performed to verify expression of a panel of protein biomarkers
associated with PCa progression and metastasis that our group is
actively studying [22]. These assays demonstrated that the
abnormal expression of RANKL, HIF-1a, NRP-1 and VEGF
proteins seen in clinical PCa tumor specimens [22] could be easily
detected in the isolated CTCs (Figure 4A). Similarly to clinical
tumors, enhanced phosphorylation of c-Met, as well as the p65
subunit of the NFkB, was detected in the same CTC population.
Intriguingly, signal quantification of the stained CTCs revealed
remarkable intercellular heterogeneity, as individual proteins were
detected with varied levels among CTCs (Figure 4B). Further
investigation, however, is needed to assess the extent of CTC
heterogeneity at the gene expression level.
Discussion
We developed a protocol for assessing the presence of live CTCs
based on the active uptake of prototype IR-783 heptamethine
carbocyanine dye [19,20]. In combination with antibodies to
EpCAM, IR-783 staining identified live human PC-3 cells spiked
into healthy donor blood with high reproducibility and correlation
coefficient (Figure 1). We have determined that active transport of
IR-783 into tumor cells can be used as a functional assay to
demonstrate tumor cell viability (Figure 2B). This finding is further
emphasized by the lack of IR-783 dye uptake in dead tumor cells
(freeze-thaw and/or ethanol fixed) spiked into healthy donor blood
(data not shown). We successfully detected and isolated live CTCs
from clinical samples of primary PCa (Figure 2 and Table 1) and
mCRPC patients (Figures 3 and Table 2). In a proof-of-concept
study, the isolated live CTCs were amenable to multiplex
detection of protein levels at the single cell level in freshly isolated
CTCs using an mQDL method (Figure 4). The results collectively
suggest that: 1) IR-783 staining can differentiate live CTCs from a
total enumerated CTC population in a given patient in real time;
2) Correlations between the percentage of live CTCs and the
development of progressive and therapeutic-resistant disease may
be established; and 3) Isolated CTCs are appropriate for biological
analysis such as mQDL analysis for protein expression at the single
cell level. Our results provide for the first time a novel way of
characterizing and even enumerating live CTCs in freshly
harvested patient blood. This approach allowed us still to use
techniques to characterize these live cells by quantifying protein
expression in isolated CTCs.
Detection and characterization of CTCs have been technically
challenging [24–26]. Conventional strategies have used either
surface marker expression or cell size. At this time, new detection
approaches are in development. EpCAM-decorated buoyant
immune-microbubbles, for example, have been used to detect
Table 2. Summary of metastatic prostate cancer patients.
Patient IDDay ofanalysis Clinical information Therapy PSA (ng/ml) Total CTC/ml NIR+ CTC/ml
Live CTC(%)
41 0 Starting bicalutamide 27.1 44 36 82%
28 30.7 38 3 8%
55 Starting abiraterone 44.1 31 22 71%
89 68.9 49 13 27%
101 89.3 54 32 59%
123 Worsening bone pain Starting radiation 124.8 36 32 89%
42 0 Starting docetaxel 293.7 82 30 37%
20 Improved overall constitution 243.3 6 0 0%
41 145.7 726 199 27%
62 98.5 115 49 43%
80 70.8 15 13 87%
102 47.9 28 4 14%
123 46.1 37 7 19%
139 Ending docetaxel 32.8 18 17 94%
43 0 Starting docetaxel 46.4 36 5 14%
36 Progressive bone pain 31 44 1 2%
51 Systemic deterioration Ending docetaxel 31.8 39 38 97%
44 0 On bicalutamide 3.3 1052 922 88%
25 Stopping bicalutamide 7.3 54 35 65%
73 Developing shoulder pain Starting DES 8.5 196 123 63%
45 0 On leuprolide for 6 months 0.1 1 0 0%
27 ,0.1 6 5 83%
55 PSA 0.2 ng/ml in one month ,0.1 207 174 84%
doi:10.1371/journal.pone.0088967.t002
Live Circulating Tumor Cells Detected by NIR Dye
PLOS ONE | www.plosone.org 7 February 2014 | Volume 9 | Issue 2 | e88967
both spiked and endogenous cancer cells from whole blood [27],
while cytokeratin has been tested as markers for CTC detection
individually [28], or in combination with the EpCAM protein
[29]. None of these approaches provides any information on the
viability of the CTCs. Although the current FDA-approved
detection platform can detect some CTCs [30], we and others
have found that this approach relatively insensitive and is unable
to detect all the inherently heterogeneous CTCs [31,32]. Using
IR-783 dye staining may circumvent heterogeneity of surface
maker expression on tumor cells by using a functional assay to
detect all the viable CTCs. CTC apoptosis is a common
phenomenon [16–18]. We previously determined that only live
cancer cells were capable of internalizing and accumulating the
class of IR-783 analogs, most likely through the organic anion
transporting peptides (OATPs) as carrier proteins [19,20,33–36].
Application of the NIR dye in CTC detection provides a simple
strategy for determining cell viability. In the current study, many
of the EpCAM+CD452 counts could be anucleated as indicated
by the lack of DAPI stain (Figure 2A), likely representing cell
debris. Although live and total CTC counts seemed close in
perioperative samples, the live CTC counts detected from many
mCRPC samples were significantly less than the corresponding
total counts (Tables 1 and 2), indicating increased death of CTCs
in mCRPC cases undergoing anti-tumor therapy. In this regard,
this study has established a cost-effective protocol for total and live
CTC detection by direct staining of the cells in combination with
rapid FACS detection. This protocol shows potential for
evaluating the cytotoxic effects of anti-tumor reagents in real
time, during the clinical treatment process.
When different patients were statistically analyzed as a group,
this study did not detect a direct correlation between CTC counts
and disease progression. Interestingly, lacking of correlation was
also reported in another study on different stages of prostate
cancers, with an FDA-approved detection method [37]. An
important finding of the study is the uniqueness of the CTC
profile in individual patients. This is supported by the individual
relationships between the CTCs detected and the disease status
diagnosed in each patient (Table 1) and by the consistency
between the CTCs detected using the protocol and the therapeutic
response observed by the attending clinicians (Table 2). CTCs
represent a pool of specific types of cancer cells capable of
surviving in the blood stream despite the remarkable shear forces.
The total number of CTCs at any given time could represent the
dynamic equilibrium between tumor shedding and the clearance
of CTCs by apoptotic death. Live CTCs, by contrast, could
provide crucial information on resistance to therapy and to
physical stress during circulation. Live CTCs were found to
fluctuate particularly in mCRPC patients and changes can be seen
prior to PSA changes in patients (Figure 3 and Table 2).
Moreover, the population of CTCs generally shifted toward a
greater portion of live cells when systemic therapy was stopped
(Table 2). These observations strongly support the usefulness of
live CTC to monitor therapeutic efficacy. Presently, most of these
patient subjects are still under the care of the oncologist (EP) and
Figure 3. Live CTC counts as an independent indicator of disease progression. CTC counts detected from mCRPC patients were analyzedalong with the progress of therapeutic intervention. Two representative results are shown. A, the progressive increment of CTC counts in patient 41correlated with clinical metastatic progression. B, the persistent low CTC counts in patient 42 correlated with beneficial anticancer therapies.doi:10.1371/journal.pone.0088967.g003
Live Circulating Tumor Cells Detected by NIR Dye
PLOS ONE | www.plosone.org 8 February 2014 | Volume 9 | Issue 2 | e88967

urologists (MHTB, CSG, DYJ and HLK), and data on their
clinical course continues to be collected. Follow-up data will be
evaluated for the applicability of NIR dye-assisted live CTC
detection.
The prototype NIR dye IR-783 is a promising agent for live
CTC detection. Compared with the EpCAM-based method, IR-
783 stain alone was frequently found to be able to detect more
candidate CTCs from the same patient sample (data not shown).
This finding is consistent with the problem that currently utilized
EpCAM-based methods offer incomplete detection and do not
capture the entire CTC population. As an initial study to evaluate
applicability of the IR-783 dye for CTC detection, we resorted to
vestigial EpCAM expression as a reference to confirm the
epithelial origin of the IR-783 stained cells, since there were no
Figure 4. Isolating CTCs for further molecular characterization. Live CTCs from the first sample from patient 44 (Table 2) were isolated onto amicroscope slide and subjected to mQDL staining for the status of a panel of proteins documented to relate to PCa progression. A, Spectral imagesfrom two representative CTCs are shown on the top two panels (8 images each that represent the expression level of RANKL, pc-Met, HIF-1a, pp65,NRP-1 and VEGF; 4006; bar = 50 mm). B, Quantification of spectral image intensities of the six proteins indicated in Panel A from five stained cellsfrom the same patient. The relative level of gene expression was calculated based on the expression of HIF-1a which was assigned as 1.0.doi:10.1371/journal.pone.0088967.g004
Live Circulating Tumor Cells Detected by NIR Dye
PLOS ONE | www.plosone.org 9 February 2014 | Volume 9 | Issue 2 | e88967

surface markers specific for CTCs. It is possible that a significant
fraction of tumor cells may undergo extensive morphologic and
behavioral changes to become migratory and invasive through
epithelial to mesenchymal transition, resulting in CTCs with
marked suppression or loss of EpCAM expression. Conversely, it is
also possible that certain PBMCs in PCa patients have acquired
the capacity for NIR dye uptake and retention, and the abnormal
NIR staining of patient PBMCs is a sign of cancer progression.
Additional investigation is warranted to identify the nature of
NIR+ cells in patient blood.
In summary, we have established a novel method for identifying
live CTCs from clinical samples. This method was demonstrated
to be rapid, sensitive and highly efficient in distinguishing live
CTCs, which are shown to be changing dynamically in response to
therapeutic intervention. Compared to other diagnostic parame-
ters such as serum PSA, alterations in total CTCs and percentage
of live CTCs, coupled with the feasibility of further molecular
characterization at a single cell level, may provide new insights
into the therapeutic response and stress resistance of the disease.
Further modification of these methods for high-throughput
capability will transform the protocol into a cost-effective detection
method that has diagnostic, prognostic and treatment value for
PCa patients.
Supporting Information
Figure S1 Confirmative staining of PC-3 cells with individual
detection agents used in this study. A representative stain is shown.
A, PC-3 cells stained with each individual detection agent were
subjected to FACS analysis. In upper row, PC-3 cells stained by a
mixture of mouse IgG1-FITC and IgG2b-PE were used as control.
In the lower row, PC-3 cells in PBS were used as control. B, PC-3cells were stained first with IR-783, then simultaneously with
FITC-labeled antibody to EpCAM and PE-labeled antibody to
CD45, and finally stained with DAPI. The stained cells were first
detected for EpCAM expression and for CD45 exclusion (upper
panel), and then for NIR and DAPI staining (power panel).
(TIF)
Figure S2 Lack of statistical significance when CTC counts from
different patients were pooled for correlation analyses. Counts of
the candidate CTCs from 40 primary prostate cancer patients and
23 samples from 5 mCRPC cases were analyzed against serum
PSA level.
(TIF)
Figure S3 Lack of statistical significance between CTC counts
and common diagnostic parameters. Counts of the candidate
CTCs from 40 primary prostate cancer patients and 23 samples
from 5 mCRPC cases were analyzed against surgical margin,
Gleason score, T-stage and N-stage of the patient.
(TIF)
Table S1 Detection of PC-3 cells spiked to donor blood.
(TIF)
Author Contributions
Conceived and designed the experiments: LWKC RXW EMP. Performed
the experiments: CS CPL PZH CYC LZ HEZ RXW. Analyzed the data:
CS CPL MT HEZ LWKC RXW EMP. Contributed reagents/materials/
analysis tools: MHTB CSN DYJ BK HLK EMP. Wrote the paper: CS
CPL MHTB CSN DYJ HLK MT LWKC HEZ RXW EMP.
References
1. Diaz-Cano SJ (2012) Tumor heterogeneity: mechanisms and bases for a reliable
application of molecular marker design. Int J Mol Sci 13: 1951–2011.
2. Poste G, Tzeng J, Doll J, Greig R, Rieman D, et al. (1982) Evolution of tumor
cell heterogeneity during progressive growth of individual lung metastases. Proc
Natl Acad Sci U S A 79: 6574–6578.
3. Posadas EM, Kohn EC (2005) Tumor angiogenesis and metastasis: Biology and
clinical experience. In: Hopkins WJ, Young RC, Markman M, Perez CA,
Barakat R et al., editors. Principles and practice of Genecologic Oncology.
Philadelphia, PA: Lippincott Williams & Wilkins. 73–91.
4. Robinson VL, Kauffman EC, Sokoloff MH, Rinker-Schaeffer CW (2004) The
basic biology of metastasis. In: Keller ET, Chung LW, editors. The biology of
skeletal metastasis. Norwell, MA: Kluwer Academic Publishers.
5. de Bono JS, Scher HI, Montgomery RB, Parker C, Miller MC, et al. (2008)
Circulating tumor cells predict survival benefit from treatment in metastatic
castration-resistant prostate cancer. Clin Cancer Res 14: 6302–6309.
6. Morgan TM, Lange PH, Porter MP, Lin DW, Ellis WJ, et al. (2009)
Disseminated tumor cells in prostate cancer patients after radical prostatectomy
and without evidence of disease predicts biochemical recurrence. Clin Cancer
Res 15: 677–683.
7. Pantel K, Alix-Panabieres C (2012) The potential of circulating tumor cells as a
liquid biopsy to guide therapy in prostate cancer. Cancer Discov 2: 974–975.
8. Becker TM, Caixeiro NJ, Lim SH, Tognela A, Kienzle N, et al. (2013) New
frontiers in circulating tumor cell analysis - a reference guide for biomolecular
profiling towards translational clinical use. Int J Cancer. Oct 7. doi: 10.1002/
ijc.28516. [Epub ahead of print].
9. Rao CG, Chianese D, Doyle GV, Miller MC, Russell T, et al. (2005) Expression
of epithelial cell adhesion molecule in carcinoma cells present in blood and
primary and metastatic tumors. Int J Oncol 27: 49–57.
10. Williams A, Balic M, Datar R, Cote R (2012) Size-based enrichment
technologies for CTC detection and characterization. Recent Results Cancer
Res 195: 87–95.
11. Riethdorf S, Fritsche H, Muller V, Rau T, Schindlbeck C, et al. (2007)
Detection of circulating tumor cells in peripheral blood of patients with
metastatic breast cancer: a validation study of the CellSearch system. Clin
Cancer Res 13: 920–928.
12. Coumans FA, Ligthart ST, Uhr JW, Terstappen LW (2012) Challenges in the
enumeration and phenotyping of CTC. Clin Cancer Res 18: 5711–5718.
13. Hogan BV, Peter MB, Shenoy H, Horgan K, Hughes TA (2008) Circulating
tumour cells in breast cancer: Prognostic indicators, metastatic intermediates, or
irrelevant bystanders? (Review). Mol Med Rep 1: 775–779.
14. Schilling D, Todenhofer T, Hennenlotter J, Schwentner C, Fehm T, et al. (2012)
Isolated, disseminated and circulating tumour cells in prostate cancer. Nat Rev
Urol. Jul 10. doi: 10.1038/nrurol.2012.1136. [Epub ahead of print].
15. Smerage JB, Budd GT, Doyle GV, Brown M, Paoletti C, et al. (2013)
Monitoring apoptosis and Bcl-2 on circulating tumor cells in patients with
metastatic breast cancer. Mol Oncol 7: 680–692.
16. Kallergi G, Konstantinidis G, Markomanolaki H, Papadaki MA, Mavroudis D,
et al. (2013) Apoptotic Circulating Tumor Cells (CTCs) in early and metastatic
breast cancer patients. Mol Cancer Ther 12: 1886–1895.
17. Larson CJ, Moreno JG, Pienta KJ, Gross S, Repollet M, et al. (2004) Apoptosis
of circulating tumor cells in prostate cancer patients. Cytometry A 62: 46–53.
18. Rossi E, Basso U, Celadin R, Zilio F, Pucciarelli S, et al. (2010) M30 neoepitope
expression in epithelial cancer: quantification of apoptosis in circulating tumor
cells by CellSearch analysis. Clin Cancer Res 16: 5233–5243.
19. Yang X, Shao C, Wang R, Chu CY, Hu P, et al. (2013) Optical imaging of
kidney cancer with novel near infrared heptamethine carbocyanine fluorescent
dyes. J Urol 189: 702–710.
20. Yang X, Shi C, Tong R, Qian W, Zhau HE, et al. (2010) Near IR heptamethine
cyanine dye-mediated cancer imaging. Clin Cancer Res 16: 2833–2844.
21. Zhao L, Lu YT, Li F, Wu K, Hou S, et al. (2013) High-Purity Prostate
Circulating Tumor Cell Isolation by a Polymer Nanofiber-Embedded Microchip
for Whole Exome Sequencing. Adv Mater. March 26. DOI: 10.1002/
adma.201205237. [Epub ahead of print].
22. Hu P, Chu GC, Zhu G, Yang H, Luthringer D, et al. (2011) Multiplexed
quantum dot labeling of activated c-Met signaling in castration-resistant human
prostate cancer. PLoS One 6: e28670.
23. Karlsson M, Nilsson O, Thorn M, Winqvist O (2008) Detection of metastatic
colon cancer cells in sentinel nodes by flow cytometry. J Immunol Methods 334:
122–133.
24. Hu B, Rochefort H, Goldkorn A (2013) Circulating tumor cells in prostate
cancer. Cancers (Basel) 5: 1676–1690.
25. Alix-Panabieres C, Pantel K (2014) Technologies for detection of circulating
tumor cells: facts and vision. Lab Chip 14: 57–62.
26. Harouaka R, Kang Z, Zheng SY, Cao L (2013) Circulating tumor cells:
Advances in isolation and analysis, and challenges for clinical applications.
Pharmacol Ther. Oct 14. DOI. 10.1016/j.pharmthera.2013.10.004. [Epub
ahead of print].
27. Shi G, Cui W, Benchimol M, Liu YT, Mattrey RF, et al. (2013) Isolation of rare
tumor cells from blood cells with buoyant immuno-microbubbles. PLoS One 8:
e58017.
Live Circulating Tumor Cells Detected by NIR Dye
PLOS ONE | www.plosone.org 10 February 2014 | Volume 9 | Issue 2 | e88967

28. Harb W, Fan A, Tran T, Danila DC, Keys D, et al. (2013) Mutational Analysis
of Circulating Tumor Cells Using a Novel Microfluidic Collection Device andqPCR Assay. Transl Oncol 6: 528–538.
29. Watanabe M, Uehara Y, Yamashita N, Fujimura Y, Nishio K, et al. (2013)
Multicolor detection of rare tumor cells in blood using a novel flow cytometry-based system. Cytometry A. Dec 10. DOI. 10.1002/cyto.a.22422. [Epub ahead
of print].30. Allard WJ, Matera J, Miller MC, Repollet M, Connelly MC, et al. (2004) Tumor
cells circulate in the peripheral blood of all major carcinomas but not in healthy
subjects or patients with nonmalignant diseases. Clin Cancer Res 10: 6897–6904.
31. Lu YT, Zhao L, Shen Q, Garcia MA, Wu D, et al. (2013) NanoVelcro Chip forCTC enumeration in prostate cancer patients. Methods 64: 144–152.
32. Farace F, Massard C, Vimond N, Drusch F, Jacques N, et al. (2011) A directcomparison of CellSearch and ISET for circulating tumour-cell detection in
patients with metastatic carcinomas. Br J Cancer 105: 847–853.
33. Ito A, Yamaguchi K, Tomita H, Suzuki T, Onogawa T, et al. (2003)
Distribution of rat organic anion transporting polypeptide-E (oatp-E) in the rat
eye. Invest Ophthalmol Vis Sci 44: 4877–4884.
34. Kalliokoski A, Niemi M (2009) Impact of OATP transporters on pharmacoki-
netics. Br J Pharmacol 158: 693–705.
35. Svoboda M, Riha J, Wlcek K, Jaeger W, Thalhammer T (2011) Organic anion
transporting polypeptides (OATPs): regulation of expression and function. Curr
Drug Metab 12: 139–153.
36. Zair ZM, Eloranta JJ, Stieger B, Kullak-Ublick GA (2008) Pharmacogenetics of
OATP (SLC21/SLCO), OAT and OCT (SLC22) and PEPT (SLC15)
transporters in the intestine, liver and kidney. Pharmacogenomics 9: 597–624.
37. Thalgott M, Rack B, Maurer T, Souvatzoglou M, Eiber M, et al. (2013)
Detection of circulating tumor cells in different stages of prostate cancer.
J Cancer Res Clin Oncol 139: 755–763.
Live Circulating Tumor Cells Detected by NIR Dye
PLOS ONE | www.plosone.org 11 February 2014 | Volume 9 | Issue 2 | e88967
Copyright © 2022 FDOKUMEN