Detection of Leukocytes in Intravital Video Microscopy Based on the Analysis of Hessian Matrix...
8
Detection of Leukocytes in Intravital Video Microscopy Based on the Analysis of Hessian Matrix Eigenvalues Bruno C. Gregório da Silva, Ricardo J. Ferrari Department of Computer Science Federal University of São Carlos São Carlos, SP, Brazil Email: {bruno.silva, rferrari}@dc.ufscar.br Juliana Carvalho-Tavares Department of Physiology and Biophysics Federal University of Minas Gerais Belo Horizonte, MG, Brazil Email: [email protected] Abstract—Detection of rolling and adhered leukocytes in in- travital microscopy image sequences is an important task in stud- ies of leukocyte-endothelial interactions in the microcirculation of living small animals under different inflammatory conditions. This procedure is usually performed by visual assessment of the image sequences. However, despite being tedious and time consuming, this procedure is prone to the inter- and intra- observer variability. In this work, we developed an automated computer system for the detection of leukocytes in intravital video microscopy. First, the video frames were processed by the bilateral filter to reduce noise while preserving sharp edges. Then, a demons-based image registration technique was applied to minimize animal motion. Finally, the detection of leukocytes was performed by local analysis of Hessian matrix eigenvalues. Quantitative and qualitative evaluation of the proposed method were conducted by using 220 video frames obtained from an experimental study performed on the brain microvasculature of mice. The proposed method was compared with the template matching technique using precision, recall and F1-Score mea- sures. For the Hessian-based method, the results of precision, recall and F1-Score were, respectively, equal to 0.81, 0.86, and 0.83. For direct comparison, the results obtained for the template matching technique were 0.86, 0.73 and 0.79. Keywords—detection of leukocytes; intravital video mi- croscopy; temporal image registration I. I NTRODUCTION Analysis of rolling and adhered leukocytes is an important task to study the mechanisms underlying leukocyte-endothelial interactions in the microcirculation of living small animals under different inflammatory conditions [1]. Such studies may have important implications on the design of new therapeu- tic strategies to fight inflammation. Intravital microscopy is currently the gold standard technique for the study of the in vivo microcirculation because it allows direct observation of leukocyte movement in microvessels of small animals under both normal and pathological conditions [2]. In laboratory experiments, the microscopic images are usually recorded on a digital media during the experiment for further visual analysis. However, visual assessment is a time-consuming, tedious, and an error-prone task. Automatic dynamic analysis of the behavior of rolling and adhered leukocytes is a difficult task in computer vision due to severe image noise and clutter, high variability in contrast between cells and background (due to differences in focal depth) and the unavoidable presence of motion blur in the images, caused by heart beat and respiratory movements of the animal. A number of methods have been described in the literature for the detection and tracking of leukocytes in intravital video microscopy (IVM). Sato et al. [3] have detected only leukocytes rolling along the vessel walls. For that, they have processed the spatial path parallel and near to the vessel contour in the images. Bandpass filtering operation was used to generate spatio-temporal images in which leukocyte traces are enhanced while other components are suppressed. Acton et al. [4] have also proposed a method to auto- matically track leukocytes in IVM. Their tracker first per- forms registration of each pair of consecutive frames. Then, the authors time-average the registered frames to obtain an estimate of the background and proceed by subtracting the background from all frames, leaving only the moving objects in the foreground. An open-close morphological filter was used to eliminate both bright and dark features that are smaller than a structuring element. Finally, adaptive template matching and Kalman filter were applied for cell tracking. By using over 2500 observations of leukocyte positions, the authors demonstrated that automated tracking of rolling leukocytes in vivo can be achieved. Ray et al. [5] proposed an active contour model for tracking leukocytes. In their work, model adaptation was constrained by using shape and size of cells. Detection of leukocytes was then converted into a minimization problem, where the energy functional was composed of three energy components (internal, external and constraint). Despite the good results, the method can track only one leukocyte at a time and it is based on user initialization of the leukocyte center positions, which may not be feasible for analysis of hundreds of cells in an image sequence. Furthermore, their proposed model is sensitive to the proximity of the cell to the vessel wall. Modifications of these previous methods by incorporating the Gradient Vector Flow (GVF) technique [6] and an extension of the GVF for image sequences [7] were published by the same
Transcript of Detection of Leukocytes in Intravital Video Microscopy Based on the Analysis of Hessian Matrix...

Detection of Leukocytes in Intravital VideoMicroscopy Based on the Analysis of Hessian
Matrix EigenvaluesBruno C. Gregório da Silva, Ricardo J. Ferrari
Department of Computer ScienceFederal University of São Carlos
São Carlos, SP, BrazilEmail: {bruno.silva, rferrari}@dc.ufscar.br
Juliana Carvalho-TavaresDepartment of Physiology and Biophysics
Federal University of Minas GeraisBelo Horizonte, MG, BrazilEmail: [email protected]
Abstract—Detection of rolling and adhered leukocytes in in-travital microscopy image sequences is an important task in stud-ies of leukocyte-endothelial interactions in the microcirculationof living small animals under different inflammatory conditions.This procedure is usually performed by visual assessment ofthe image sequences. However, despite being tedious and timeconsuming, this procedure is prone to the inter- and intra-observer variability. In this work, we developed an automatedcomputer system for the detection of leukocytes in intravitalvideo microscopy. First, the video frames were processed bythe bilateral filter to reduce noise while preserving sharp edges.Then, a demons-based image registration technique was appliedto minimize animal motion. Finally, the detection of leukocyteswas performed by local analysis of Hessian matrix eigenvalues.Quantitative and qualitative evaluation of the proposed methodwere conducted by using 220 video frames obtained from anexperimental study performed on the brain microvasculature ofmice. The proposed method was compared with the templatematching technique using precision, recall and F1-Score mea-sures. For the Hessian-based method, the results of precision,recall and F1-Score were, respectively, equal to 0.81, 0.86, and0.83. For direct comparison, the results obtained for the templatematching technique were 0.86, 0.73 and 0.79.
Keywords—detection of leukocytes; intravital video mi-croscopy; temporal image registration
I. INTRODUCTION
Analysis of rolling and adhered leukocytes is an importanttask to study the mechanisms underlying leukocyte-endothelialinteractions in the microcirculation of living small animalsunder different inflammatory conditions [1]. Such studies mayhave important implications on the design of new therapeu-tic strategies to fight inflammation. Intravital microscopy iscurrently the gold standard technique for the study of the invivo microcirculation because it allows direct observation ofleukocyte movement in microvessels of small animals underboth normal and pathological conditions [2]. In laboratoryexperiments, the microscopic images are usually recordedon a digital media during the experiment for further visualanalysis. However, visual assessment is a time-consuming,tedious, and an error-prone task. Automatic dynamic analysisof the behavior of rolling and adhered leukocytes is a difficulttask in computer vision due to severe image noise and clutter,
high variability in contrast between cells and background (dueto differences in focal depth) and the unavoidable presence ofmotion blur in the images, caused by heart beat and respiratorymovements of the animal.
A number of methods have been described in the literaturefor the detection and tracking of leukocytes in intravitalvideo microscopy (IVM). Sato et al. [3] have detected onlyleukocytes rolling along the vessel walls. For that, they haveprocessed the spatial path parallel and near to the vesselcontour in the images. Bandpass filtering operation was usedto generate spatio-temporal images in which leukocyte tracesare enhanced while other components are suppressed.
Acton et al. [4] have also proposed a method to auto-matically track leukocytes in IVM. Their tracker first per-forms registration of each pair of consecutive frames. Then,the authors time-average the registered frames to obtain anestimate of the background and proceed by subtracting thebackground from all frames, leaving only the moving objectsin the foreground. An open-close morphological filter was usedto eliminate both bright and dark features that are smallerthan a structuring element. Finally, adaptive template matchingand Kalman filter were applied for cell tracking. By usingover 2500 observations of leukocyte positions, the authorsdemonstrated that automated tracking of rolling leukocytes invivo can be achieved.
Ray et al. [5] proposed an active contour model for trackingleukocytes. In their work, model adaptation was constrainedby using shape and size of cells. Detection of leukocyteswas then converted into a minimization problem, where theenergy functional was composed of three energy components(internal, external and constraint). Despite the good results,the method can track only one leukocyte at a time and it isbased on user initialization of the leukocyte center positions,which may not be feasible for analysis of hundreds of cellsin an image sequence. Furthermore, their proposed modelis sensitive to the proximity of the cell to the vessel wall.Modifications of these previous methods by incorporating theGradient Vector Flow (GVF) technique [6] and an extension ofthe GVF for image sequences [7] were published by the same

research group. Level set was also used to detect and trackmultiple cells in IVM by searching for candidate cells in theimage level lines (boundaries of connected components withinlevel sets) [8]. The authors also proposed stochastic methodsfor the detection and tracking of leukocytes [9], [10].
In this work we present a new method for the detectionof leukocytes in intravital image sequences that presentstwo main contributions: first, we have developed a videomotion stabilization method that uses two stages of imageregistration (affine and deformable) embedded in a multiscaleframework to allows for a high-accurate alignment of the videoframes; second, we propose a new method for the detectionof leukocytes that is based on the eigenvalue analysis ofHessian matrix. The paper is organized as follows: SectionII describes the methodology and the image dataset used inthis work, followed by results and discussions in Section IIIand conclusions in Section IV.
II. METHODOLOGY
The detection of leukocytes in intravital microscopy imagesequences is a challenge problem due to the high noiselevel present in the images, the wide ranging appearance ofleukocytes (in intensity and shape), and mainly to motion blurand artifacts caused by respiratory and cardiac motion. Inthis work all images were preprocessed using an automatedpipeline, as indicated in Figure 1. In the first stage, all framesstrongly affected by the animal movement were detectedand removed by a technique previously developed for thispurpose [11]. Although image restoration techniques can beused to recover the motion-blurred frames, in this work wehave only extracted them from further analysis. In the nextstage, bilateral filtering [12], which has the ability to reducenoise without introducing noticeable blurring, was applied toimprove image quality. The parameters of the filter (d = 9,σr = 10 and σd = 10 corresponding, respectively, to thediameter of filter neighborhood and to the range and spatialparameters of Gaussian kernels) were experimentally adjustedto provide the best trade-off between noise reduction andlow blurring effect. In order to diminish the photobleachingeffect [13], commonly observed in fluorescence microscopy,and to improve our frame-to-frame image registration method(described in details in Section II-A), the histogram matchingtechnique proposed in [14] was applied to each pair ofconsecutive frames in the video. After registration, the vesselregion was extracted by assessing the temporal variance ofeach pixel, as proposed in [3]. The rationale in this case is thatthe gray level of each pixel in a vessel region, where bloodcells are flowing continuously, will greatly vary within frameswhile the gray level in other regions will be almost constant— i.e., the gray level variance tends to be large in the vesselregion and small in other regions. After that, a binary vesselimage was created and used in further analysis to reduce thenumber of false-positive cells automatically detected in theimages. Finally, all frames were processed for the detectionof the leukocytes, as described in Section II-B.
Fig. 1. Flow diagram of the proposed method to detect leukocytes in intravitalmicroscopy image sequences.
A. Temporal image registration
The temporal image registration framework developed inthis work to correct for small specimen movements is com-prised of four modules: metric, optimizer, interpolator andtransformation. The method, as shown in Figure 2, consistsof finding a transformation T (p) to correct the misalignmentbetween consecutive pair of frames (images) in the video. Theset of parameters p of the transformation T is obtained inan iterative manner by mapping all pixels from the movingframe M(x, y) to their corresponding pixels in the fixedframe F (x, y) so that the similarity metric S(p|F,M, T ) isminimized.
1) Metric: The metric chosen in this work was the mutualinformation (MI) [15], which measures the statistical depen-dency between two data sets (fixed and moving images) bytaking into account the amount of information that one randomvariable has over another. MI is defined in terms of entropyin the following way [15]:
S(p|F,M, T ) = MI (F, T ) (1)= H (F ) +H (M |T )−H (F,M |T ) ,
where H (·) is the entropy of a random variable (in thiscase, images F or M ), which can be calculated from themarginal probability (normalized intensity histogram), P (·),of the images as:
H (F ) = −∑m∈F
P (m) logP (m) , (2)
H (M |T ) = −∑n∈M
P (n|T ) logP (n|T ) . (3)
In Equations (2) and (3), m and n represent, respectively,pixel intensities in the images F and M . The joint entropyof images F and M , which is the last term in Equation (1),
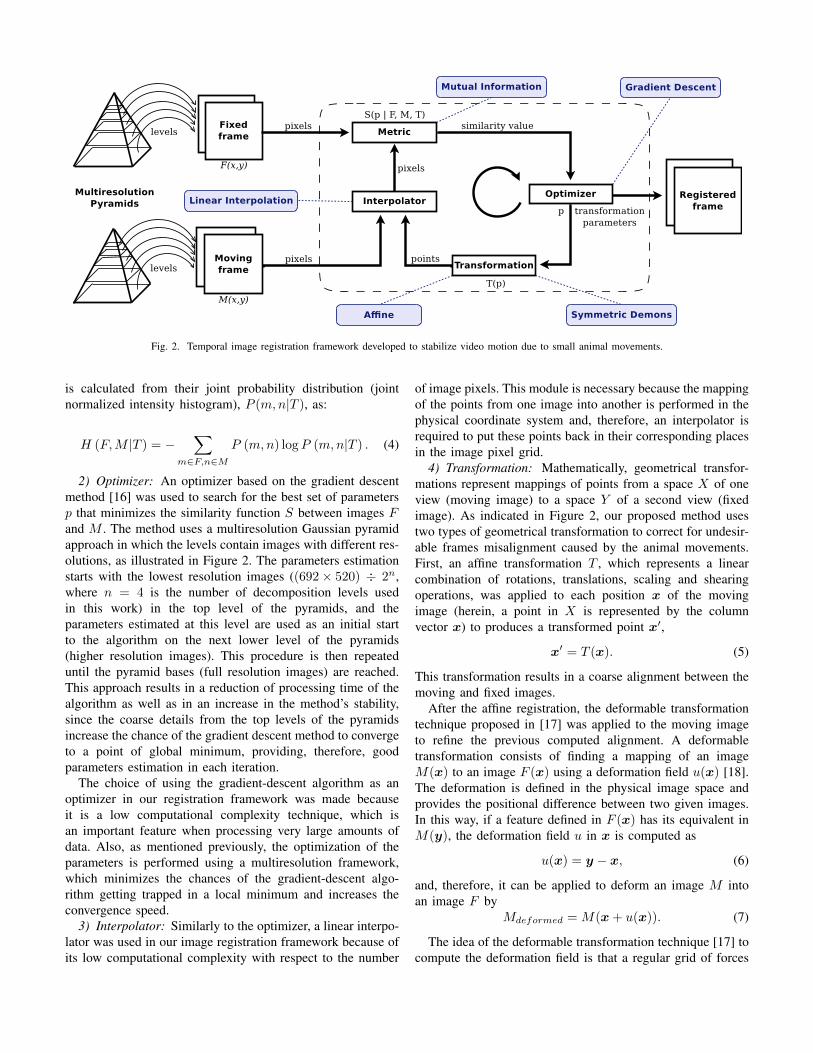
Fig. 2. Temporal image registration framework developed to stabilize video motion due to small animal movements.
is calculated from their joint probability distribution (jointnormalized intensity histogram), P (m,n|T ), as:
H (F,M |T ) = −∑
m∈F,n∈MP (m,n) logP (m,n|T ) . (4)
2) Optimizer: An optimizer based on the gradient descentmethod [16] was used to search for the best set of parametersp that minimizes the similarity function S between images Fand M . The method uses a multiresolution Gaussian pyramidapproach in which the levels contain images with different res-olutions, as illustrated in Figure 2. The parameters estimationstarts with the lowest resolution images ((692× 520) ÷ 2n,where n = 4 is the number of decomposition levels usedin this work) in the top level of the pyramids, and theparameters estimated at this level are used as an initial startto the algorithm on the next lower level of the pyramids(higher resolution images). This procedure is then repeateduntil the pyramid bases (full resolution images) are reached.This approach results in a reduction of processing time of thealgorithm as well as in an increase in the method’s stability,since the coarse details from the top levels of the pyramidsincrease the chance of the gradient descent method to convergeto a point of global minimum, providing, therefore, goodparameters estimation in each iteration.
The choice of using the gradient-descent algorithm as anoptimizer in our registration framework was made becauseit is a low computational complexity technique, which isan important feature when processing very large amounts ofdata. Also, as mentioned previously, the optimization of theparameters is performed using a multiresolution framework,which minimizes the chances of the gradient-descent algo-rithm getting trapped in a local minimum and increases theconvergence speed.
3) Interpolator: Similarly to the optimizer, a linear interpo-lator was used in our image registration framework because ofits low computational complexity with respect to the number
of image pixels. This module is necessary because the mappingof the points from one image into another is performed in thephysical coordinate system and, therefore, an interpolator isrequired to put these points back in their corresponding placesin the image pixel grid.
4) Transformation: Mathematically, geometrical transfor-mations represent mappings of points from a space X of oneview (moving image) to a space Y of a second view (fixedimage). As indicated in Figure 2, our proposed method usestwo types of geometrical transformation to correct for undesir-able frames misalignment caused by the animal movements.First, an affine transformation T , which represents a linearcombination of rotations, translations, scaling and shearingoperations, was applied to each position x of the movingimage (herein, a point in X is represented by the columnvector x) to produces a transformed point x′,
x′ = T (x). (5)
This transformation results in a coarse alignment between themoving and fixed images.
After the affine registration, the deformable transformationtechnique proposed in [17] was applied to the moving imageto refine the previous computed alignment. A deformabletransformation consists of finding a mapping of an imageM(x) to an image F (x) using a deformation field u(x) [18].The deformation is defined in the physical image space andprovides the positional difference between two given images.In this way, if a feature defined in F (x) has its equivalent inM(y), the deformation field u in x is computed as
u(x) = y − x, (6)
and, therefore, it can be applied to deform an image M intoan image F by
Mdeformed =M(x+ u(x)). (7)
The idea of the deformable transformation technique [17] tocompute the deformation field is that a regular grid of forces
deforms an image by pushing the contours in the normaldirections. The orientation and magnitude of the displace-ment vectors are derived from the instantaneous optical flowequation [19]. In this case, the conservation of gray levelintensity of the moving points is assumed to be constant, i.e.,I(x(t), t) = const, with x(t) representing the coordinates ofthe point at time t.
In our case, two consecutive pair of frames (the fixed framedenoted by F (x) and the moving frame M(x)) are comparedto allow the computation of displacement vector u(x) that letM(x) closer to F (x). Then, by considering that F (x) andM(x) are separated by one time unit, ∂I/∂t =M(x)− F (x)and u(x) = dx/dt is the instantaneous velocity of F (x) toM(x), thus
u(x) · ∇F (x) = − (M(x)− F (x)) . (8)
In this case, u(x) is considered to be velocity becausethe images are two successive time frames, i.e., u(x) is thedisplacement during the time interval between the two imageframes [17]. It is well known in optical flow literature thatEquation 8 is not sufficient to define the velocity u(x) locallyand, in this case, it is usually determined using some form ofregularization. For registration, the projection of the vector onthe direction of the intensity gradient is used as:
u(x) = − (M(x)− F (x))∇F (x)‖∇F‖2+(M(x)−F (x))2/K
, (9)
where K is a normalization factor that accounts for the unitsimbalance between intensities and gradients. This factor iscomputed as the mean squared value of the pixel spacings.Inclusion of K makes the force computation to be invariantto pixel scaling in the images. In order to provide a level ofsymmetry in the force calculation, a variation of the equation9 was used. In this case, the gradient of the deformed movingimage is also involved, so that
u(x) = −2 · (M(x)− F (x)) (∇F (x) +∇M(x))‖∇F+∇M‖2+(M(x)−F (x))2/K
. (10)
An elastic-like behavior, smoothing the deformation fieldwith a Gaussian filter between iterations, was included intothe implemented algorithm in order to make it realer.
B. Detection of leukocytes
Although leukocytes slightly change from circular to an ovalshape before transmigrating through the endothelium, in thiswork our assumption is that these cells can be visualized asblob-like structures in IVM. Therefore, our proposed methodfor the automatic detection of leukocytes is based on a salientblob detector approach that uses information of Hessian matrixeigenvalues for the representation of local geometric structures[20] (blob-like structures, in our case) in an image.
Since microscopic images are two-dimensional projectionsof three-dimensional structures (microvessels and cells), leuko-cytes may be positioned above and below the microscope focalplane and, therefore, their size appearance may be distorted,showing cells in a different range of scales. For this reason,
our proposed method was developed based on the analysis oflocal structures in a multiscale framework [20]. The initialidea of our approach is to generate a family of smoothedimages I(x, y;σ), computed by convolving the original imageI0(x, y) with Gaussian kernels G(x, y;σ) of different standarddeviation (σ) values, as
I(x, y;σ) = I0(x, y) ∗G(x, y;σ), (11)
where
G(x, y;σ) =1
σ√2π
exp
(−1
2
(x+ y
σ
)2), (12)
and use a strategy to proper select the local scale parameterto build the Hessian matrix. For that, the response functionR(x, y;σ), computed as
R(x, y;σ) =∂m+nI(x, y;σ)
∂xm∂yn(13)
= I0(x, y) ∗∂m+nG(x, y;σ)
∂xm∂yn, (14)
where m and n are orders of derivatives, was used. The localscale was defined as the value of σ (over a range of values)corresponding to the maximum value of function R(x, y;σ)for each pixel, which indicates the proper Gaussian scaleprobe (Gaussian observation kernel) with the width valuecorresponding to object feature size. Because of the amplitudeof Gaussian derivative operators in (14) tends to decreasewith increasing scale (due to the fact that with increasingscale, the response is increasingly smoothed), the so-calledγ-parameterized normalized derivatives [21],
∂m+n
∂um∂vn= σ(m+n)γ ∂m+n
∂xm∂yn, (15)
with γ = 1.25, was used in this work to overcome this prob-lem. The choice of γ = 1.25 was experimentally determinedto work well on a variety of intensity structure profiles [22].
Based on the intensity responses of the γ-parameterized nor-malized derivative filters, a local measure of image structureis devised from the analysis of Hessian matrix eigenvalues ofimage intensity. For a given scale σ, the Hessian matrix Hσ(I)of an image I is a square and symmetric matrix composed ofsecond-order partial derivatives,
Hσ(I) =
[Iσxx
Iσxy
IσyxIσyy
], (16)
where
Iσxx= I0(x, y) ∗
(σ2γ ∂
2
∂x2G(x, y;σ)
), (17)
Iσyy = I0(x, y) ∗(σ2γ ∂
2
∂y2G(x, y;σ)
), and (18)
Iσxy= Iσyx
= I0(x, y) ∗(σ2γ ∂2
∂x∂yG(x, y;σ)
). (19)
Mutual magnitude of eigenvalues from Hessian matrix is an in-dicative of the underlying object shape. Under the assumptionthat eigenvalues are sorted in order of increasing absolute value(|λ1| ≤ |λ2|), the relations that must hold between the Hessianmatrix eigenvalues for the detection of different structures aresummarized in Table I.
TABLE IPOSSIBLE PATTERNS IN 2D, DEPENDING ON THE VALUE OF THE
EIGENVALUES λk (H=HIGH, L=LOW, N=NOISY, USUALLY SMALL, +/-INDICATE THE SIGN OF THE EIGENVALUE) [23]. THE EIGENVALUES ARE
ORDERED: |λ1| ≤ |λ2|.
λ1 λ2 orientation patternN N noisy, no preferred directionL H- tubular structure (bright)L H+ tubular structure (dark)H- H- blob-like structure (bright)H+ H+ blob-like structure (dark)
In the intravital microscopy images used in this work,leukocytes emerge as bright blob-like structures embedded in adark background. Because of the images are affected by noise,we need to address the problem of effective enhance the cellscontrast without increasing the image noise level.
By treating the problem of leukocyte detection as a Hessianeigenvalue analysis, we can easily incorporate the cell shapeinformation into the solution. In this way, prior informationcan be used as a consistency check to discard structures presentin the dataset with different polarity than the one sought.Isotropic structures, for instance, are associated to eigenvalueshaving a similar non-zero magnitude. Accordingly, we shalllook for structures whose λ1 and λ2 are both, simultaneously,high and negative. By taking this into consideration, a blobnessmeasure function Bσ(λ), defined as
Bσ(λ) =
(1− exp
(− R2
A
2α2
))×(
1− exp(− S2
2β2
))if λ1 < 0 and λ2 < 0,
0 otherwise,(20)
was created by using the ratio and magnitude strength ofthe eigenvalues and used to enhance blob-like structuresrepresenting the leukocytes in the images. In Equation (20),RA = |λ1|/|λ2| helps distinguishing between plate-like andline-like patterns. In addition, the measure S =
√λ21 + λ22
helps to reduce the influence of background noisy pixels inthe blobness measure function, since noisy pixels present loweigenvalues and, therefore, the second term in Equation (20)will considerably reduce the blobness value. Parameters αand β can be adjusted to control the sensitivity of the filtercomponents and, in this work, they were set, respectively, to0.5 and one tenth of the maximum value of the Laplacian ofthe image, as suggested in [20]. The σ footer in Bσ indicatesthat the blobness measure is computed on a smoothed versionof the image and, therefore, it is representative of the variationsof image intensity at the spatial scale σ. The function wasevaluated at range of spatial scales (σ), varying between 2 and
3. This range was based on the size of the observed leukocytesin the images. The maximum response at every pixel was takenas
B(λ) = maxσ∈[σmin,σmax]
Bσ(λ). (21)
As result, we have an image sequence containing allpossible blob-like structures detected by the algorithm. Asmentioned previously, as the leukocytes may be positionedabove and below the microscope focal plane, their apparentsize and, specially their contrast, can significantly change inthe images. For this reason, the multiscale blob detector willproduce real-valued responses. Therefore, to improve cellsdetection, an adaptive thresholding technique was applied tothe blob detector output image. In this case, the local thresholdvalue was calculated as a weighted sum (cross-correlation witha Gaussian window) of an M ×M neighborhood of position(x, y) in the image. The default standard deviation of theGaussian window is defined by the specified neighborhoodsize M . In this approach we set M = 17 by considering theradius of the largest leukocyte.
After binarization by the local threshold technique, pixelscorresponding to candidates cells were extracted from theoriginal frames. Finally, with these pixel values, we refined theoutput images choosing only the regions that have an averagevalue larger than a threshold. This process was conducted toprune low blob responses, probably due to noisy pixels. Thisthreshold value was varied from 1 to 255 at step of 1 and theresults of this stage are analyzed in Section (III).
C. Intravital microscopy dataset
For this work, female C57BL/6 mice between 9 and 10weeks of age were obtained from Animal Care Facilitiesof the Federal University of Minas Gerais (UFMG, Brazil).The Animal Ethics Committee of UFMG approved all exper-imental procedures used in this study. Intravital microscopywas performed on the mouse brain microvasculature as pre-viously described [24]. Each mouse was anesthetized usingan intraperitoneal injection of ketamine/xylazine and its tailvein was cannulated for the i.v. administration of 200 µL ofrhodamine 6G dye (0.5 mg/mL). The animal was restrainedin a stereotactic rodent head holder and craniotomy wasperformed using a high-speed drill. The dura matter wasremoved to expose the underlying pial vasculature. After thesurgeries, each animal was transferred to the microscope stageand was maintained at 37°C using a heating pad (Fine ScienceTools Inc., Canada). The exposed brain window was super-fused continuously with artificial cerebrospinal fluid bufferat 37°C. To assess the leukocyte-endothelial interactions, thefluorescent leukocytes were visualized under a Zeiss ImagerM.2 (x20 long-distance objective lens; Göttingen, Germany)equipped with a fluorescent light source (epi-illumination at510–560 nm, using a 590 nm emission filter). A video camera(Optronics) was mounted on the microscope in order to recordimages with a sampling rate of 16 frames/s, 8 bits depthand spatial resolution of 1.89 pixels/µm with a matrix sizeof 692 × 520 pixels. Microvessels were analyzed in sections
(a) (b)
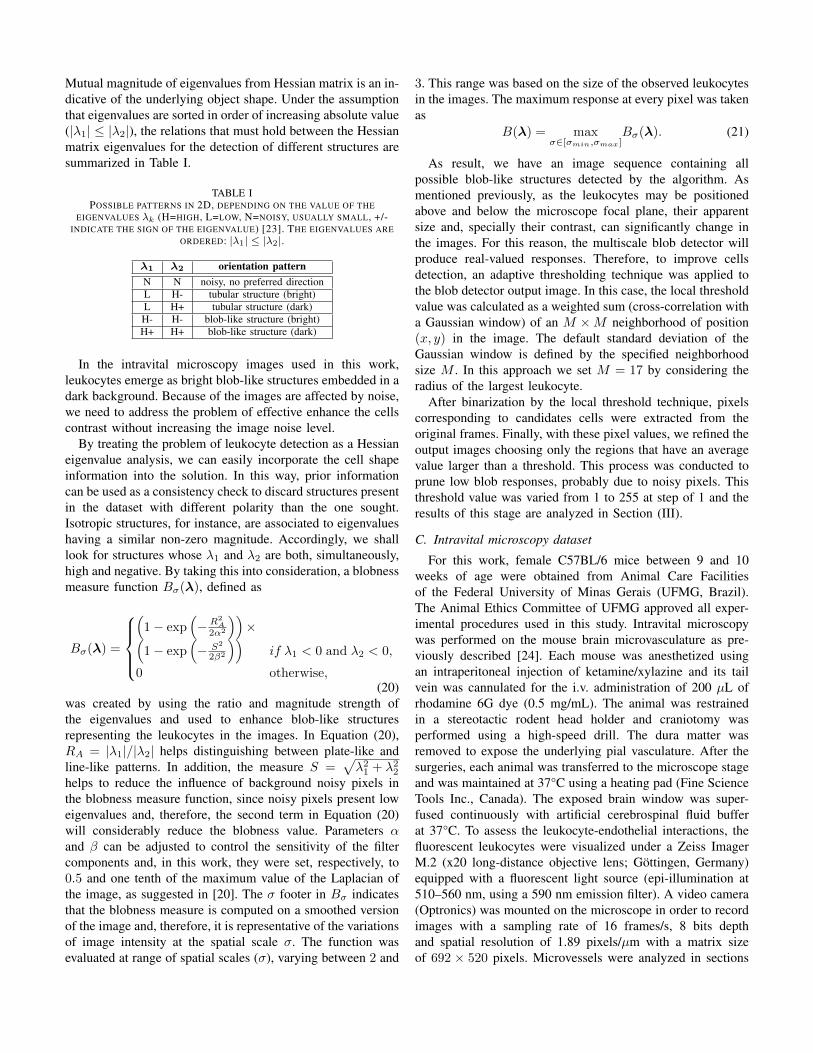
Fig. 3. Line projection results. (a) Line projection image before and (b) after registration technique.
Frames
(a)
Frames
(b)
Fig. 4. PSNR metric processed over all the residual images from all consecutive video frames. (a) PSNR values before and (b) after registration.
of 100 µm in length, and the diameters of the vessels rangedfrom 40 to 115µm in the brain.
D. Ground-truth image dataset
A total of 220 frames of an IVM containing 5851 leuko-cytes (obtained from the experiment described in SectionII-C) was used to quantitatively assess the results of theproposed method. For this purpose, all leukocyte centroidswere manually annotated frame-by-frame with help of a com-puter program. All annotations, containing an average of 26.6leukocytes per frame, were checked by an expert biologist(JCT), co-author of this paper.
III. RESULTS AND DISCUSSIONS
The temporal image registration algorithm, as described inSection II-A, was visually assessed by using the line projectiontechnique. This technique works by stacking the central lineof each video frame to create a new image, where the intensityprofile of each frame line is arranged horizontally while thetime sequence is assessed vertically. The result of applyingthis technique to our image dataset is shown in Figure 3.
By comparing both projections in Figure 3, a noticeablesawtooth pattern can be seen in (a). This pattern indicates
a strong misalignment of the frames throughout the imagesequence before registration. On the other hand, in image(b) the sawtooth pattern is less noticeable, indicating morecontinuous lines and consequently a greater alignment of theframes after the registration process.
Quantitative analysis of the temporal image registrationalgorithm was conducted by calculating the peak signal-to-noise ratio (PSNR) metric for residual images resulting fromsubtraction of consecutive pair of frames, before and afterregistration. This measure defines the ratio between the max-imum possible power of a signal and the power of corruptingnoise that affects the fidelity of its representation on the videoframes. In case of good alignment, the residue will be smalland PSNR value (dB) will be large. Otherwise, if residue islarge, then PSNR value will be small. PSNR values calculated,before and after registration, for all consecutive pairs of framesfrom the same IVM are presented in Figure 4. The meanand standard deviation values of the original frames (beforeregistration - left panel of Figure 4) were, respectively, 35.28dB and 3.13 dB, whereas for registered frames (right panel)they were 37.79 dB and 1.62 dB, respectively. These responsesshow a considerable reduction in image motion despite the
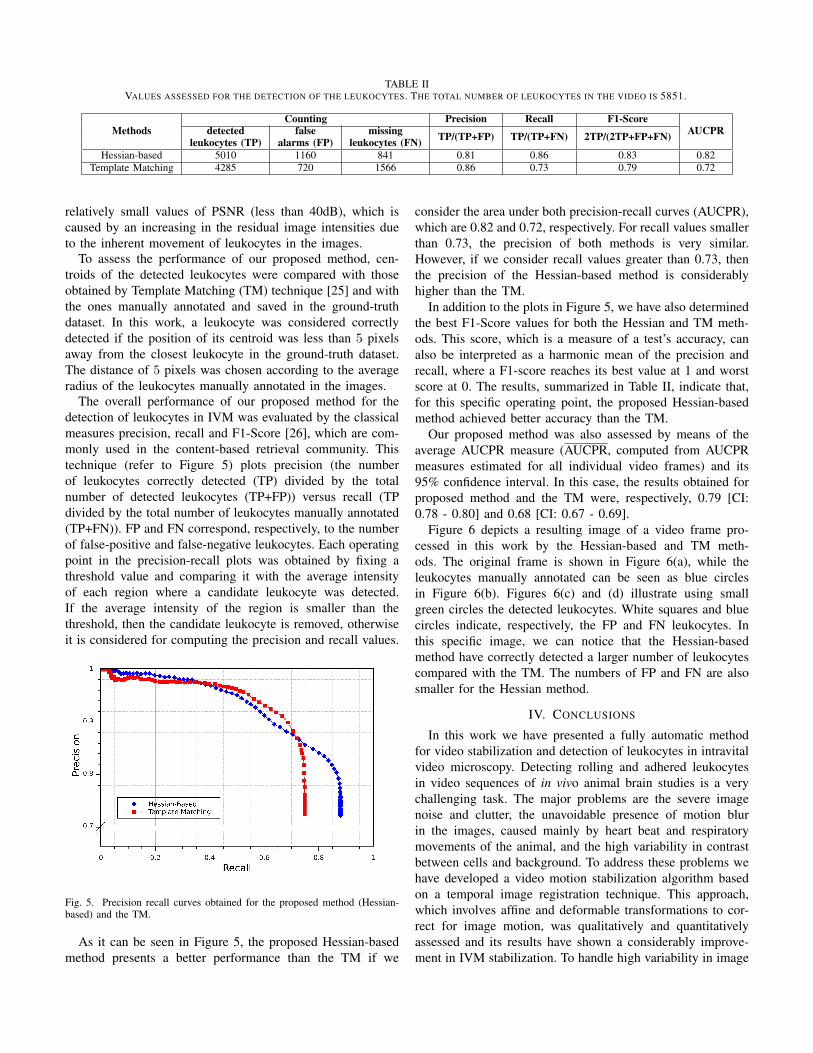
TABLE IIVALUES ASSESSED FOR THE DETECTION OF THE LEUKOCYTES. THE TOTAL NUMBER OF LEUKOCYTES IN THE VIDEO IS 5851.
MethodsCounting Precision Recall F1-Score
AUCPRdetected false missing TP/(TP+FP) TP/(TP+FN) 2TP/(2TP+FP+FN)leukocytes (TP) alarms (FP) leukocytes (FN)Hessian-based 5010 1160 841 0.81 0.86 0.83 0.82
Template Matching 4285 720 1566 0.86 0.73 0.79 0.72
relatively small values of PSNR (less than 40dB), which iscaused by an increasing in the residual image intensities dueto the inherent movement of leukocytes in the images.
To assess the performance of our proposed method, cen-troids of the detected leukocytes were compared with thoseobtained by Template Matching (TM) technique [25] and withthe ones manually annotated and saved in the ground-truthdataset. In this work, a leukocyte was considered correctlydetected if the position of its centroid was less than 5 pixelsaway from the closest leukocyte in the ground-truth dataset.The distance of 5 pixels was chosen according to the averageradius of the leukocytes manually annotated in the images.
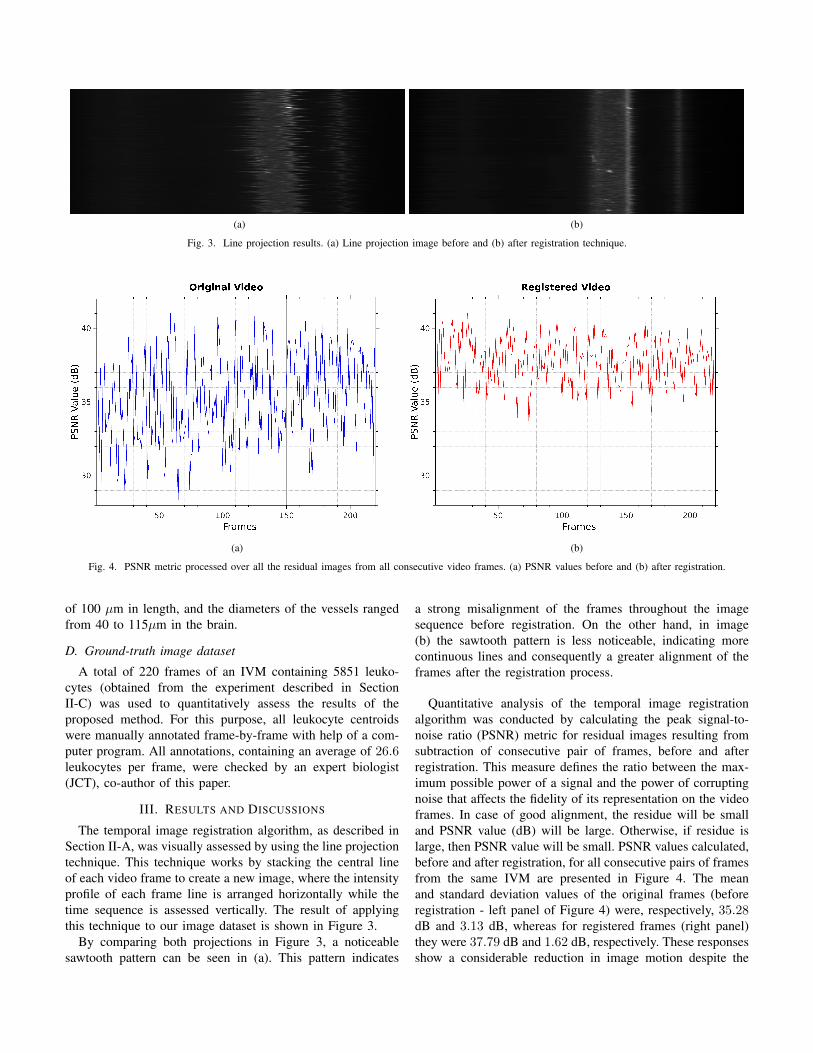
The overall performance of our proposed method for thedetection of leukocytes in IVM was evaluated by the classicalmeasures precision, recall and F1-Score [26], which are com-monly used in the content-based retrieval community. Thistechnique (refer to Figure 5) plots precision (the numberof leukocytes correctly detected (TP) divided by the totalnumber of detected leukocytes (TP+FP)) versus recall (TPdivided by the total number of leukocytes manually annotated(TP+FN)). FP and FN correspond, respectively, to the numberof false-positive and false-negative leukocytes. Each operatingpoint in the precision-recall plots was obtained by fixing athreshold value and comparing it with the average intensityof each region where a candidate leukocyte was detected.If the average intensity of the region is smaller than thethreshold, then the candidate leukocyte is removed, otherwiseit is considered for computing the precision and recall values.
1
Recall1
Fig. 5. Precision recall curves obtained for the proposed method (Hessian-based) and the TM.
As it can be seen in Figure 5, the proposed Hessian-basedmethod presents a better performance than the TM if we
consider the area under both precision-recall curves (AUCPR),which are 0.82 and 0.72, respectively. For recall values smallerthan 0.73, the precision of both methods is very similar.However, if we consider recall values greater than 0.73, thenthe precision of the Hessian-based method is considerablyhigher than the TM.
In addition to the plots in Figure 5, we have also determinedthe best F1-Score values for both the Hessian and TM meth-ods. This score, which is a measure of a test’s accuracy, canalso be interpreted as a harmonic mean of the precision andrecall, where a F1-score reaches its best value at 1 and worstscore at 0. The results, summarized in Table II, indicate that,for this specific operating point, the proposed Hessian-basedmethod achieved better accuracy than the TM.
Our proposed method was also assessed by means of theaverage AUCPR measure (AUCPR, computed from AUCPRmeasures estimated for all individual video frames) and its95% confidence interval. In this case, the results obtained forproposed method and the TM were, respectively, 0.79 [CI:0.78 - 0.80] and 0.68 [CI: 0.67 - 0.69].
Figure 6 depicts a resulting image of a video frame pro-cessed in this work by the Hessian-based and TM meth-ods. The original frame is shown in Figure 6(a), while theleukocytes manually annotated can be seen as blue circlesin Figure 6(b). Figures 6(c) and (d) illustrate using smallgreen circles the detected leukocytes. White squares and bluecircles indicate, respectively, the FP and FN leukocytes. Inthis specific image, we can notice that the Hessian-basedmethod have correctly detected a larger number of leukocytescompared with the TM. The numbers of FP and FN are alsosmaller for the Hessian method.
IV. CONCLUSIONS
In this work we have presented a fully automatic methodfor video stabilization and detection of leukocytes in intravitalvideo microscopy. Detecting rolling and adhered leukocytesin video sequences of in vivo animal brain studies is a verychallenging task. The major problems are the severe imagenoise and clutter, the unavoidable presence of motion blurin the images, caused mainly by heart beat and respiratorymovements of the animal, and the high variability in contrastbetween cells and background. To address these problems wehave developed a video motion stabilization algorithm basedon a temporal image registration technique. This approach,which involves affine and deformable transformations to cor-rect for image motion, was qualitatively and quantitativelyassessed and its results have shown a considerably improve-ment in IVM stabilization. To handle high variability in image

(a) (b)
(c) (d)
Fig. 6. Example of a processed video frame. (a) Original frame, (b) leukocytesmanually annotated - ground-truth, and (c) and (d) are, respectively, the outputof the Hessian-based and TM methods. White squares in images (c) and(d) indicate the FP leukocytes, whereas the blue circles represents the FN.Leukocytes detected by both methods are shown as green circles.
contrast, we have developed a method based on analysisof Hessian matrix eigenvalues to detect leukocytes in theimages. By using an IVM composed of 220 frames (with 5851leukocytes manually annotated), the method was quantitativelyevaluated (in comparison with the ground-truth) and its resultshave demonstrated their effectiveness for the detection ofleukocytes. Besides, our proposed method has shown betterperformance when compared with the TM technique (AUCPRof 0.82 versus 0.72).
ACKNOWLEGMENTS
The authors are grateful to “Conselho Nacional de De-senvolvimento Científico e Tecnológico (CNPq)” (processnumber 481923/2010-1) and to grant #2012/17772-3 and#2013/26171-6, São Paulo Research Foundation (FAPESP) fortheir invaluable financial support during the course of thisresearch.
REFERENCES
[1] P. Kubes and S. Kerfoot, “Leukocyte recruitment in the microcirculation:the rolling paradigm revisited,” News in Physiological Sciences, vol. 16,no. 2, pp. 76–80, 2001.
[2] V. Pinho, F. Matos, G. Batista, and D. Carmona, Light Microscopy- Methods in Molecular Biology, 2011, vol. 689, ch. 6 - IntravitalMicroscopy to Study Leukocyte Recruitment In Vivo, pp. 81–90.
[3] Y. Sato, J. Chen, R. A. Zoroofi, N. Harada, S. Tamura, and T. Shiga, “Au-tomatic extraction and measurement of leukocyte motion in microvesselsusing spatiotemporal image analysis,” IEEE Transactions on BiomedicalEngineering, vol. 44, no. 4, pp. 225–236, 1997.
[4] S. T. Acton, K. Wethmar, and K. Ley, “Automatic tracking of rollingleukocytes in vivo,” Microvascular Research, vol. 63, no. 1, pp. 139–148, 2002.
[5] N. Ray, S. T. Acton, and K. Ley, “Tracking leukocytes in vivo with shapeand size constrained active contours,” IEEE Transactions on MedicalImaging, vol. 21, no. 10, pp. 1222–1235, 2002.
[6] S. T. Acton and N. Ray, “Detection and tracking of rolling leukocytesfrom intravital microscopy,” in Proceedings of the IEEE InternationalSymposium on Biomedical Imaging: Nano to Macro, vol. 2. IEEE,2004, pp. 1235–1238.
[7] N. Ray and S. T. Acton, “Motion gradient vector flow: An external forcefor tracking rolling leukocytes with shape and size constrained activecontours,” IEEE Transactions on Medical Imaging, vol. 23, no. 12, pp.1466–1478, 2004.
[8] D. Mukherjee, N. Ray, and S. Acton, “Level set analysis for leukocytesdetection and tracking,” IEEE Transactions on Medical Imaging, vol. 13,no. 4, pp. 562–572, 2004.
[9] G. Dong, N. Ray, and S. T. Acton, “Intravital leukocyte detection usingthe gradient inverse coefficient of variation,” IEEE Transactions onMedical Imaging, vol. 24, no. 7, pp. 910–924, 2005.
[10] G. Dong and S. T. Acton, “Detection of rolling leukocytes by markedpoint processes,” Journal of Electronic Imaging, vol. 16, no. 3, pp.033 013:1–11, 2007.
[11] R. J. Ferrari, C. H. Villa Pinto, B. C. Gregório da Silva, D. Bernardes,and J. Carvalho-Tavares, “Automatic detection of motion blur in in-travital video microscopy image sequences via directional statisticsof log-gabor energy maps,” Medical and Biological Engineering andComputing, vol. 53, no. 2, pp. 151–163, 2015.
[12] C. Tomasi and R. Manduchi, “Bilateral filtering for gray and color im-ages,” in Proceedings of the Sixth International Conference on ComputerVision, ser. ICCV’98. Bombay, India: IEEE Computer Society, 1998,pp. 839–846.
[13] V. Andresen, K. Pollok, J.-L. Rinnenthal, L. Oehme, R. Günther,H. Spiecker, H. Radbruch, J. Gerhard, A. Sporbert, Z. Cseresnyes, A. E.Hauser, and R. Niesner, “High-resolution intravital microscopy,” PLoSONE, vol. 7, no. 12, pp. e50 915:1–12, 2012.
[14] L. G. Nyúl, J. K. Udupa, and X. Zhang, “New variants of a methodof MRI scale standardization,” IEEE Transactions on Medical Imaging,vol. 19, no. 2, pp. 143–150, 2000.
[15] J. P. W. Pluim, J. B. A. Maintz, and M. A. Viergever, “Mutual-information-based registration of medical images: a survey,” IEEETransactions on Medical Imaging, vol. 22, no. 8, pp. 986–1004, 2003.
[16] S. Klein, J. P. W. Pluim, and M. Staring, “Adaptive stochastic gradientdescent optimisation for image registration,” International Journal ofComputer Vision, vol. 81, no. 3, pp. 227–239, 2009.
[17] J.-P. Thirion, “Image matching as a diffusion process: An analogy withMaxwell’s demons,” Medical Image Analysis, vol. 2, no. 3, pp. 243–260,1998.
[18] B. Avants, N. Tustison, and G. Song, Advanced Normalization Tools(ANTS). University of Pennsylvania, 2009.
[19] B. K. P. Horn and B. G. Schunck, “Determining optical flow,” ArtificialIntelligence, vol. 17, no. 1-3, pp. 185–203, 1981.
[20] O. P. Dzyubak and E. L. Ritman, “Automation of hessian-based tubular-ity measure response function in 3D biomedical images,” InternationalJournal of Biomedical Imaging, vol. 2011, no. Article ID 920401, 16pages, 2011.
[21] T. Lindeberg, “Feature detection with automatic scale selection,” Inter-national Journal of Computer Vision, vol. 30, no. 2, pp. 79–116, 1998.
[22] P. Majer, “The influence of the gamma-parameter on feature detectionwith automatic scale selection,” in Proceedings of the Third InternationalConference on Scale-Space and Morphology in Computer Vision, ser.Scale-Space 2001. Springer-Verlag, 2001, pp. 245–254.
[23] A. F. Frangi, W. J. Niessen, K. L. Vincken, and M. A. Viergever,“Multiscale vessel enhancement filtering,” in Proceedings of the MedicalImage Computing and Computer-Assisted Interventation, vol. 1496.Cambridge, MA, USA: Springer-Verlag, pp. 130–137.
[24] A. C. dos Santos, M. M. Barsante, R. M. Arantes, C. C. Bernard, M. M.Teixeira, and J. Carvalho-Tavares, “CCL2 and CCL5 mediate leukocyteadhesion in experimental autoimmune encephalomyelitis an intravitalmicroscopy study,” Journal of Neuroimmunology, vol. 162, no. 1-2, pp.122–129, 2005.
[25] M. Khosravi and R. W. Schafer, “Template matching based on agrayscale hit-or-miss transforma,” IEEE Transactions on Image Process-ing, vol. 5, no. 6, pp. 1060–1066, 1996.
[26] C. Goutte and E. Gaussier, “A probabilistic interpretation of precision,recall and f-score, with implication for evaluation,” in Proceedings ofthe European Colloquium on IR Research, ser. ECIR’05. Springer,2005, pp. 345–359.