Detection of glycoproteins in polyacrylamide gels and on electroblots using Pro-Q Emerald 488 dye, a...
11
Courtenay Hart Birte Schulenberg Thomas H. Steinberg Wai-Yee Leung Wayne F. Patton Molecular Probes, Eugene, OR, USA Detection of glycoproteins in polyacrylamide gels and on electroblots using Pro-Q Emerald 488 dye, a fluorescent periodate Schiff-base stain Pro-Q Emerald 488 glycoprotein stain reacts with periodic acid-oxidized carbohydrate groups, generating a bright green-fluorescent signal on glycoproteins. The stain per- mits detection of less than 5–18 ng of glycoprotein per band, depending upon the nature and the degree of protein glycosylation, making it roughly 8–16-fold more sensitive than the standard colorimetric periodic acid-Schiff base method using acidic fuchsin dye (pararosaniline). The green-fluorescent signal from Pro-Q Emerald 488 stain may optimally be visualized using charge-coupled device/xenon arc lamp-based imaging systems or 470–488 nm laser-based gel scanners. Though glycoprotein detection may be performed on transfer membranes, direct detection in gels avoids electroblotting and the specificity of staining is better in gels. After detecting glyco- proteins with Pro-Q Emerald 488 dye, total protein profiles may subsequently be detected using SYPRO Ruby protein gel stain. Using computer-assisted registration techniques, images may then be merged to generate differential display maps. Keywords: Fluorescence / Glycoproteins / Laser scanner / Proteomics EL 5300 1 Introduction In eukaryotes, oligosaccharides are commonly co- or post-translationally attached to proteins by a variety of glycosidases and glycosyltransferases [1–3]. Extracellu- lar matrix and cell surface proteins are particularly rich in glycosylation. Protein glycosylation is critical to growth control, cell migration, cell adhesiveness, tissue differen- tiation, and inflammatory reaction cascades. Alterations in glycosylation profiles are often useful indicators for the assessment of disease states. As biomedical investi- gations have increasingly involved proteomics, there has been renewed interest in methodologies for the rapid and sensitive identification of glycoproteins [4–6]. Until recently, there have been relatively few methods available for direct analysis of glycoproteins transferred to mem- branes and most importantly of glycoproteins within poly- acrylamide gels, that do not require the degradation of the proteinaceous component of the glycoprotein [4, 7, 8]. Such methods would be especially suitable for inte- gration into automated proteomics platforms that utilize robotic gel stainers, image analysis workstations, robotic spot excision instruments, protein digestion work sta- tions, and mass spectrometers [9, 10]. The two most widely used methods for the detection of glycoproteins in gels and on blots involve reacting carbo- hydrate groups by a periodate/Schiff’s base (PAS) mech- anism and noncovalent binding of specific carbohydrate epitopes using lectin-based detection systems. The PAS method requires oxidation of carbohydrate groups, followed by conjugation with a chromogenic substrate (acid fuchsin, Alcian Blue), a fluorescent substrate (dansyl hydrazine, 8-aminonaphthalene-1,3,6-trisulfonate, Pro-Q Emerald 300 dye), or a tag (biotin hydrazide or digoxi- genin hydrazide). Signal is detected directly in the case of the chromogenic or fluorescent conjugates and indir- ectly using enzyme conjugates of streptavidin or anti- bodies to the tags. Lectins are most appropriate for the detection of structural subclasses of glycoproteins using methods that are quite similar to standard immuno- blotting approaches. Typically, direct lectin conjugates of biotin in conjunction with reporter enzyme conjugates of streptavidin or conjugates of a lectin and reporter enzyme are used in combination with chromogenic, fluorogenic or chemiluminescent substrates. As with immunoblotting, the most commonly used reporter enzymes employed to detect a lectin or the streptavidin are horseradish per- oxidase and alkaline phosphatase. Recently, we reported that a 300 nm excitable fluorescent hydrazide, Pro-Q Emerald 300 dye is suitable for sensitive direct fluorescence detection of glycoproteins in gels or on electroblots without the use of enzyme amplification systems [11]. However, one problem with the new detec- tion approach is that the glycoproteins cannot be visual- ized using laser-based gel scanners as Pro-Q Emerald Correspondence: Dr. Wayne F. Patton, Proteomics Section, Molecular Probes, Inc., 4849 Pitchford Avenue, Eugene, OR 97402, USA E-mail: [email protected] Fax: +541-344-6504 Abbreviations: PAS, periodic acid – Schiff base; SHG, second- harmonic generation 588 Electrophoresis 2003, 24, 588–598 ª 2003 WILEY-VCH Verlag GmbH & Co. KGaA, Weinheim 0173-0835/03/0402–588 $17.501.50/0
-
Upload
independent -
Category
Documents
-
view
2 -
download
0
Transcript of Detection of glycoproteins in polyacrylamide gels and on electroblots using Pro-Q Emerald 488 dye, a...

Courtenay HartBirte SchulenbergThomas H. SteinbergWai-Yee LeungWayne F. Patton
Molecular Probes,Eugene, OR, USA
Detection of glycoproteins in polyacrylamide gelsand on electroblots using Pro-Q Emerald 488 dye,a fluorescent periodate Schiff-base stain
Pro-Q Emerald 488 glycoprotein stain reacts with periodic acid-oxidized carbohydrategroups, generating a bright green-fluorescent signal on glycoproteins. The stain per-mits detection of less than 5–18 ng of glycoprotein per band, depending upon thenature and the degree of protein glycosylation, making it roughly 8–16-fold moresensitive than the standard colorimetric periodic acid-Schiff base method using acidicfuchsin dye (pararosaniline). The green-fluorescent signal from Pro-Q Emerald 488stain may optimally be visualized using charge-coupled device/xenon arc lamp-basedimaging systems or 470–488 nm laser-based gel scanners. Though glycoproteindetection may be performed on transfer membranes, direct detection in gels avoidselectroblotting and the specificity of staining is better in gels. After detecting glyco-proteins with Pro-Q Emerald 488 dye, total protein profiles may subsequently bedetected using SYPRO Ruby protein gel stain. Using computer-assisted registrationtechniques, images may then be merged to generate differential display maps.
Keywords: Fluorescence / Glycoproteins / Laser scanner / Proteomics EL 5300
1 Introduction
In eukaryotes, oligosaccharides are commonly co- orpost-translationally attached to proteins by a variety ofglycosidases and glycosyltransferases [1–3]. Extracellu-lar matrix and cell surface proteins are particularly richin glycosylation. Protein glycosylation is critical to growthcontrol, cell migration, cell adhesiveness, tissue differen-tiation, and inflammatory reaction cascades. Alterationsin glycosylation profiles are often useful indicators forthe assessment of disease states. As biomedical investi-gations have increasingly involved proteomics, therehas been renewed interest in methodologies for the rapidand sensitive identification of glycoproteins [4–6]. Untilrecently, there have been relatively few methods availablefor direct analysis of glycoproteins transferred to mem-branes and most importantly of glycoproteins within poly-acrylamide gels, that do not require the degradation ofthe proteinaceous component of the glycoprotein [4, 7,8]. Such methods would be especially suitable for inte-gration into automated proteomics platforms that utilizerobotic gel stainers, image analysis workstations, roboticspot excision instruments, protein digestion work sta-tions, and mass spectrometers [9, 10].
The two most widely used methods for the detection ofglycoproteins in gels and on blots involve reacting carbo-hydrate groups by a periodate/Schiff’s base (PAS) mech-anism and noncovalent binding of specific carbohydrateepitopes using lectin-based detection systems. ThePAS method requires oxidation of carbohydrate groups,followed by conjugation with a chromogenic substrate(acid fuchsin, Alcian Blue), a fluorescent substrate (dansylhydrazine, 8-aminonaphthalene-1,3,6-trisulfonate, Pro-QEmerald 300 dye), or a tag (biotin hydrazide or digoxi-genin hydrazide). Signal is detected directly in the caseof the chromogenic or fluorescent conjugates and indir-ectly using enzyme conjugates of streptavidin or anti-bodies to the tags. Lectins are most appropriate for thedetection of structural subclasses of glycoproteins usingmethods that are quite similar to standard immuno-blotting approaches. Typically, direct lectin conjugates ofbiotin in conjunction with reporter enzyme conjugates ofstreptavidin or conjugates of a lectin and reporter enzymeare used in combination with chromogenic, fluorogenic orchemiluminescent substrates. As with immunoblotting,the most commonly used reporter enzymes employedto detect a lectin or the streptavidin are horseradish per-oxidase and alkaline phosphatase.
Recently, we reported that a 300 nm excitable fluorescenthydrazide, Pro-Q Emerald 300 dye is suitable for sensitivedirect fluorescence detection of glycoproteins in gels oron electroblots without the use of enzyme amplificationsystems [11]. However, one problem with the new detec-tion approach is that the glycoproteins cannot be visual-ized using laser-based gel scanners as Pro-Q Emerald
Correspondence: Dr. Wayne F. Patton, Proteomics Section,Molecular Probes, Inc., 4849 Pitchford Avenue, Eugene, OR97402, USAE-mail: [email protected]: +541-344-6504
Abbreviations: PAS, periodic acid – Schiff base; SHG, second-harmonic generation
588 Electrophoresis 2003, 24, 588–598
ª 2003 WILEY-VCH Verlag GmbH & Co. KGaA, Weinheim 0173-0835/03/0402–588 $17.50�.50/0

Electrophoresis 2003, 24, 588–598 Pro-Q Emerald 488 glycoprotein stain 589
300 dye does not possess a visible excitation peak. Con-sequently, a new fluorescent hydrazide, Pro-Q Emerald488 dye, with an excitation maximum of 510 nm andemission maximum of 525 nm was developed. Just aswith Pro-Q Emerald 300 dye, Pro-Q Emerald 488 dye islinked to glycoproteins using a standard PAS conjuga-tion mechanism. The glycols present in glycoproteins areinitially oxidized to aldehydes using periodic acid. Thedye then reacts with the aldehydes on the glycoproteinsto generate the fluorescent conjugate. A reduction stepwith sodium metabisulfite or sodium borohydride is notrequired to stabilize the resulting conjugate. Using com-puter-assisted overlay techniques differential displaymaps of protein glycosylation and expression levels canreadily be generated.
2 Materials and methods
2.1 Materials
Broad-range molecular weight standards for SDS-poly-acrylamide gel electrophoresis, Tris-base, glycine, so-dium dodecyl sulfate, and acrylamide were obtainedfrom Bio-Rad Laboratories (Hercules, CA, USA). Sodiumhydroxide, urea, bromophenol blue, ammonium persul-fate, TEMED, Tris-HCl, glucose oxidase, fetuin, ovalbu-min, �1-acid glycoprotein, and bovine fetal calf serumwere obtained from Sigma Chemical Company (St. Louis,MO, USA). �2-Macroglobulin was obtained from EMScience (Gibbstown, NJ, USA). Immobilon-P poly(vinyli-dene difluoride) (PVDF) membranes were from Millipore(Bedford, MA, USA). Dithiothreitol, avidin, CandyCanemolecular weight markers, Pro-Q Emerald 488 glyco-protein gel stain kit, Pro-Q Fuchsia glycoprotein gelstain kit, Alexa Fluor 488 hydrazide, and SYPRO Rubyprotein gel stain were from Molecular Probes (Eugene,OR, USA). Human liver cancer tissue lysates were ob-tained form GenoTechnology (St. Louis, MO, USA).
2.2 Fluorescence spectroscopy
Excitation/emission profiles of Pro-Q Emerald 488 dyeand SYPRO Ruby protein gel stain were collected usinga Hitachi F-4500 Fluorescence Spectrophotometer (Hita-chi Instruments, Boulder, CO, USA). The emission spec-trum for Pro-Q Emerald 488 dye was collected using anexcitation setting of 480 nm, while the excitation spec-trum was collected using an emission setting of 560 nm.The emission spectrum for SYPRO Ruby protein gel stainwas collected using an excitation setting of 280 nm, whilethe excitation spectrum was collected using an emissionmaximum setting of 600 nm.
2.3 Gel electrophoresis and electroblotting
For SDS-polyacrylamide gel electrophoresis, proteinsamples were prepared in sample buffer (50 mM Tris-HCl,pH 6.8, 2% SDS, 10% glycerol, 0.1 M DTT, 0.2% bromo-phenol blue) by standard procedures. Use of sucroseinstead of glycerol to increase the sample density in thesample buffer may lead to spurious staining, particularlyin the dye front of the gel. CandyCane molecular weightmarkers (a mixture of glycosylated and unglycosylatedprotein standards) were applied to gels at a concentrationof 1–1000 ng/lane in twofold dilutions. In addition, twolanes of protein broad-range molecular weight standardswere applied at a concentration of 1000 and 250 ng/lane.For linearity analysis experiments, individual glyco-proteins were dissolved in water and then diluted into1�sample buffer and applied at a concentration of 0.3–1200 ng/lane in twofold dilutions. Proteins were sepa-rated by SDS-polyacrylamide gel electrophoresis utilizing12%T, 2.4%C linear gradient gels. %T is the total mono-mer concentration expressed in grams per 100 mL and%C is the percentage cross-linker. The 0.75 mm thick,8 cm�9 cm gels were subjected to electrophoresis usingthe Bio-Rad mini-Protean III system according to stan-dard procedures. For 2-D gel electrophoresis, SDS-solu-bilized human liver tumor tissue (GenoTechnology) wassuspended in sample buffer (8 M urea, 2% CHAPS, 0.2%carrier ampholytes, 100 mM DTT) to a concentration of1 mg/mL as previously described [12]. Approximately100 �g protein was applied to 2-D gels. The first-dimen-sional separation was performed by immobilized pH gra-dient isoelectric focusing (11 cm IPG, pH 4–7 strips; Bio-Rad Laboratories). Focusing was conducted for 40 000 Vhafter 8 h passive in-gel rehydration. The second dimen-sion was performed with a pH 7.0 Tris-Tricine gel buffersystem using 10 cm�15 cm�1 mm, 6–15% SDS-poly-acrylamide gels (GelChips; Proteome Systems, Woburn,MA, USA). 2-D gel electrophoresis was performed asdescribed previously [12]. For experiments with transfermembranes, proteins were electroblotted to PVDF mem-branes for 1.5 h using the Investigator semidry blotter(Genomic Solutions, Ann Arbor, MI, USA) and a three-buffer transfer system consisting of 300 mM Tris, 10%methanol, pH 10.4 for the first anode buffer; 100 mM Tris,10% methanol, pH 10.4 for the second anode buffer;and 25 mM Tris, 40 mM glycine, 20% methanol, pH 9.4for the cathode buffer according to the manufacturer’sinstructions.
2.4 Detecting glycoproteins
Pro-Q Emerald 488 dye staining was performed in asimilar manner whether evaluating glycoproteins in poly-acrylamide gels or immobilized on PVDF membranes.
Gen
eral

590 C. Hart et al. Electrophoresis 2003, 24, 588–598
Use of nitrocellulose membranes for Pro-Q Emerald 488dye staining was found to be inferior to PVDF membranesas excessive background staining of the nitrocellulosewas observed. This is not surprising as cellulose is sus-ceptible to oxidation by periodate. All staining and wash-ing steps were performed with continuous, gentle agita-tion (e.g., on an orbital shaker at 50 rpm). Gels were incu-bated in 100 mL of a 50% methanol, 5% acetic acidfixative solution for 1 h then incubated in fresh fixativesolution overnight to completely remove residual SDS. Itis very important that gels be fixed thoroughly, as residualSDS has been found to increase nonspecific staining.Blots were washed twice in 50% methanol for 30 mineach. The gel or blot was then washed three times in 3%acetic acid for 5–10 min each, and glycans were thenoxidized by incubation in 1% periodic acid, 3% aceticacid for 20 min. The gel or blot was washed four timesfor 5–10 min each in 3% acetic acid to remove the resi-dual periodate. The gel or blot was then incubated inPro-Q Emerald 488 dye solution for 30–120 min. Forgels, this solution is prepared by diluting the stock Pro-QEmerald 488 dye solution 1:50 in Pro-Q Emerald 488buffer just prior to staining. For blots, the dye solution isdiluted 1:500 in Pro-Q Emerald 488 buffer just prior tostaining. The diluted reagent degrades upon long-termstorage, so only the amount required for staining shouldbe prepared. For 8 cm�9 cm�0.75 mm minigels or anelectroblot of similar size, a volume of 25 mL is recom-mended. Afterwards, the gel or blot was incubated in 3%acetic acid, three times for 5–10 min each and then rinsedbriefly in water. Blots may be washed in 100% methanolthree times for 5–10 min each to further reduce back-ground staining. Generally, gels were stored in water,while blots were allowed to air-dry. Gels and blots werestained with Alexa Fluor 488 hydrazide as describedfor Pro-Q Emerald 488 dye. The final dye concentrationwas 750 nM for the gel stain and 250 nM for the blotstain. The dye stock (1 mM in DMSO) was diluted in Pro-Q Emerald 488 dilution buffer just prior to staining. Thedye concentrations and staining solution were optimizedto give the highest signal with the lowest amount of non-specific staining. PAS staining of glycoproteins on gelsand blots using acid fuchsin sulfite (aqueous solution ofpararosaniline/sodium metabisulfite/HCl) was performedusing the Pro-Q Fuchsia glycoprotein stain kit (MolecularProbes). Fixation and oxidation were performed as de-scribed previously for Pro-Q Emerald 488 dye. Afterthis point the gels and blots were covered with alumi-num foil to protect the stain from light. Gels and blotswere incubated in Pro-Q Fuchsia reagent (25 mL for an8 cm�9 cm�0.75 mm minigel) for 15 min and thenglycans were reduced in 25 mL of 0.5% sodium metabi-sulfite for 10 min. Afterwards, the gel or blot was incu-bated in 3% acetic acid, four times for 10 min each
and then rinsed briefly in water. Gels were stored inwater or 3% acetic acid, while blots were allowed toair-dry.
2.5 Post-staining with SYPRO Ruby dyes
After detection of glycoproteins with Pro-Q Emerald 488dye, one-dimensional or 2-D SDS-polyacrylamide gelswere post-stained in SYPRO Ruby protein gel stain [13–15]. Gels were incubated in SYPRO Ruby dye stainingsolution for 3 h to overnight. Gels can be left in the dyesolution indefinitely without overstaining. Minimal stainingvolumes were found to be 50 mL for 8 cm�9 cm�0.75 mm minigels. This corresponds to a solution volumethat is roughly 10 times the volume of the gel. Reuse ofthe staining solution results in significant loss of sensitiv-ity. Glass dishes should not be used, as they tend toadsorb dye from the staining solution. All staining andwashing steps were performed with continuous, gentleagitation (e.g., on an orbital shaker at 50 rpm). After stain-ing, gels were incubated for 30–60 min in 10% methanol,7% acetic acid to wash away residual dye in the gelmatrix. Pro-Q Fuchsia dye quenches the fluorescence ofSYPRO Ruby protein gel stain, so dichromatic stainingwith this dye is not feasible. Staining of PVDF membraneswith SYPRO Ruby protein blot stain was performed asdescribed previously with minor modifications [16]. Forbest results, blots previously stained with Pro-Q Emerald488 dye were incubated in 100% methanol for 10–15 minprior to staining with SYPRO Ruby dye. The membranewas then allowed to dry completely, making it refractoryto wetting. The membrane was floated face down in 7%acetic acid, 10% methanol and incubated at room tem-perature twice for 10 min each in a 4 inch diameter poly-styrene weigh boat with continuous, gentle agitation. Themembrane was then incubated in SYPRO Ruby proteinblot stain reagent for 15 min. The membrane was washed2–3 times in deionized water to remove excess dye.Removal of excess dye may be monitored by UV epi-illu-mination. After staining with SYPRO Ruby dye, PVDFmembranes were best preserved by allowing them toair-dry. Once dry, membranes could be handled freely.SYPRO Ruby protein blot stain is fairly permanent, thoughdestaining slowly occurs in protein- and/or detergent-containing blocking solutions commonly employed withimmunodetection procedures.
2.6 Detection of fluorescent signals
The resulting green-fluorescent signal produced by thePro-Q Emerald 488 dye and red-fluorescent signal pro-duced by the SYPRO Ruby dye were visualized utilizingthe 473 nm excitation line of the second-harmonic gen-

Electrophoresis 2003, 24, 588–598 Pro-Q Emerald 488 glycoprotein stain 591
eration (SHG) laser on the Fuji FLA-3000G FluorescenceImage Analyzer (Fuji Photo, Tokyo, Japan) in combinationwith the instrument’s 520 nm long pass filter and 580 nmband-pass filter, respectively. Pro-Q Emerald 488 dyewas found to be spectrally well matched to standardfluorescein emission filters due to its 525 nm emissionmaximum, while SYPRO Ruby dye was found to bespectrally well matched to standard ethidium bromideemission filters due to its emission maximum at appro-ximately 610 nm. SYPRO Ruby dye has significant ab-sorption in the UV region of the spectrum, making itcompatible with standard midrange UV transilluminatorsoperating at 302 nm (UV-B) such as the Foto/UV 450transilluminator (Fotodyne, Hartford, WI, USA) or UVPtransilluminator/Polaroid MP4� camera system (UVPLaboratories, Upland, CA, USA). Though Pro-Q Emerald488 dye may be imaged using a 302 nm UV transillumina-tor, detection sensitivity is poorer than Pro-Q Emerald 300dye using this device. The red-fluorescent signal of Pro-QFuchsia dye was detected utilizing the 532 nm excitationline of the SHG laser on the Fuji FLA-3000G FluorescenceImage Analyzer and a 675 nm long pass filter. The coloredproduct of the stain was also imaged using white lightillumination with the Bio-Rad Fluor-S Max Multi-Imager.The green-fluorescent signal produced by Alexa Fluor488 dye was visualized in the same manner as for Pro-QEmerald 488 dye. Computer-generated differential dis-play maps of protein glycosylation and protein expressionpatterns were generated using Z3, Version 1.5 software(Compugen, Tel-Aviv, Israel). Z3 is a Microsoft Windows-based software package for analyzing 2-D electrophore-sis images. Unlike many commercially available softwarepackages, Z3 uses raw-image-based computation ofregistration, region-based matching, and a complemen-tary pseudocolor visualization technique. With the sys-tem, spots of the reference gel appear green and thoseof the comparative gel appear magenta. When imagesare aligned, similarly expressed spots in the overlayimage appear gray or black, while those that differ inexpression levels appear green or magenta. This facili-tates identification of differentially expressed proteinspots by simple visual inspection.
3 Results
3.1 Spectral properties of Pro-Q Emerald 488 dye
Pro-Q Emerald 488 glycoprotein stain was developedto be spectrally compatible with 473 nm and 488 nm exci-tation sources. The fluorescence excitation spectrumdemonstrates that the dye absorbs maximally at 512 nmand has an additional, minor UV-absorbing peak at354 nm (Fig. 1A). The excitation spectrum of SYPRO
Ruby dye displays a broad peak at 470 nm and a majorUV-absorbing peak at 282 nm (Fig. 1A). Thus, both dyesare suitable for use with SHG and argon ion-based gelscanners, while SYPRO Ruby dye may also be excitedby midrange UV illumination (UV-B). Pro-Q Emerald 488dye maximally emits at 525 nm, while SYPRO Ruby dyemaximally emits at 613 nm (Fig. 1B). The green signalof Pro-Q Emerald 488 dye is readily visualized using afluorescein band-pass or long-pass emission filter, whilethe red signal of SYPRO Ruby dye may be visualizedusing a Texas Red band-pass emission filter. Both dyesmay be imaged on xenon-arc-based imaging devices,provided that suitable excitation and emission filters areinstalled in them. Due to the high intrinsic brightness ofthe fluorophores, both fluorescent signals are readilyvisualized by eye using a standard UV epi- or transillumi-nator. However, Pro-Q Emerald 300 dye is superior toPro-Q Emerald 488 dye in terms of signal strength andlimits of detection when a UV light source is used forillumination [11].
Figure 1. Fluorescence excitation/emission spectra ofPro-Q Emerald 488 dye and SYPRO Ruby protein gelstain. (A) Excitation profiles; (B) emission profiles of thetwo fluorophores.
592 C. Hart et al. Electrophoresis 2003, 24, 588–598
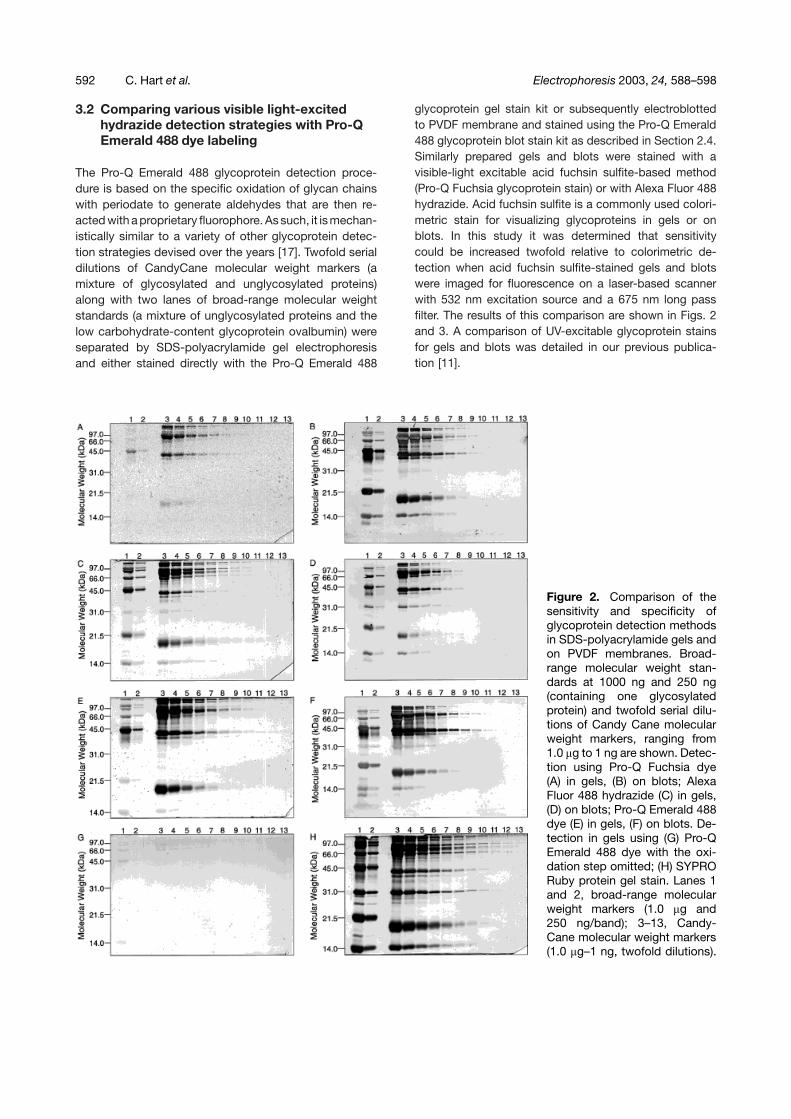
3.2 Comparing various visible light-excitedhydrazide detection strategies with Pro-QEmerald 488 dye labeling
The Pro-Q Emerald 488 glycoprotein detection proce-dure is based on the specific oxidation of glycan chainswith periodate to generate aldehydes that are then re-acted with a proprietary fluorophore. As such, it is mechan-istically similar to a variety of other glycoprotein detec-tion strategies devised over the years [17]. Twofold serialdilutions of CandyCane molecular weight markers (amixture of glycosylated and unglycosylated proteins)along with two lanes of broad-range molecular weightstandards (a mixture of unglycosylated proteins and thelow carbohydrate-content glycoprotein ovalbumin) wereseparated by SDS-polyacrylamide gel electrophoresisand either stained directly with the Pro-Q Emerald 488
glycoprotein gel stain kit or subsequently electroblottedto PVDF membrane and stained using the Pro-Q Emerald488 glycoprotein blot stain kit as described in Section 2.4.Similarly prepared gels and blots were stained with avisible-light excitable acid fuchsin sulfite-based method(Pro-Q Fuchsia glycoprotein stain) or with Alexa Fluor 488hydrazide. Acid fuchsin sulfite is a commonly used colori-metric stain for visualizing glycoproteins in gels or onblots. In this study it was determined that sensitivitycould be increased twofold relative to colorimetric de-tection when acid fuchsin sulfite-stained gels and blotswere imaged for fluorescence on a laser-based scannerwith 532 nm excitation source and a 675 nm long passfilter. The results of this comparison are shown in Figs. 2and 3. A comparison of UV-excitable glycoprotein stainsfor gels and blots was detailed in our previous publica-tion [11].
Figure 2. Comparison of thesensitivity and specificity ofglycoprotein detection methodsin SDS-polyacrylamide gels andon PVDF membranes. Broad-range molecular weight stan-dards at 1000 ng and 250 ng(containing one glycosylatedprotein) and twofold serial dilu-tions of Candy Cane molecularweight markers, ranging from1.0 �g to 1 ng are shown. Detec-tion using Pro-Q Fuchsia dye(A) in gels, (B) on blots; AlexaFluor 488 hydrazide (C) in gels,(D) on blots; Pro-Q Emerald 488dye (E) in gels, (F) on blots. De-tection in gels using (G) Pro-QEmerald 488 dye with the oxi-dation step omitted; (H) SYPRORuby protein gel stain. Lanes 1and 2, broad-range molecularweight markers (1.0 �g and250 ng/band); 3–13, Candy-Cane molecular weight markers(1.0 �g–1 ng, twofold dilutions).

Electrophoresis 2003, 24, 588–598 Pro-Q Emerald 488 glycoprotein stain 593
Figure 3. Signal-to-noise ratiosof glycoproteins visualized ingels using Pro-Q Emerald 488dye compared with Pro-Q Fuch-sia dye. Intensity profiles ofCandyCane molecular weightmarkers stained with (A) Pro-QEmerald 488 dye and subse-quently stained with SYPRORuby dye (overlay); (B) Pro-QFuchsia dye. Intensity profileof a twofold dilution series of�2-macroglobulin ranging from1200 to 2 ng stained with(C) Pro-Q Emerald 488 dye;(D) Pro-Q Fuchsia dye. All pro-files were generated on a FujiFLA-3000G Fluorescent ImageAnalyzer.
Intensity profiles generated from 500 ng of CandyCanemolecular weight markers that had been stained withPro-Q Emerald 488 glycoprotein gel stain (lane 4, Fig. 2E)or with Pro-Q Fuchsia glycoprotein gel stain (lane 4,Fig. 2A) are shown in Figs. 3A and B. The profiles arealso overlaid with the total protein profile, subsequentlygenerated with SYPRO Ruby protein gel stain (lane 4,Fig. 2H). Pro-Q Emerald 488 dye generates sharp signalpeaks at 2, 8, 18, and 47 mm, corresponding to the glyco-sylated proteins present in the CandyCane marker mix.SYPRO Ruby dye displays additional sharp signal peaksat 5, 10, 29, and 57 mm, corresponding to the unglyco-sylated proteins in the mix. Pro-Q Emerald dye displayshigher signal and lower background fluorescence thanPro-Q Fuchsia dye in polyacrylamide gels.
In gels, Pro-Q Emerald 488 glycoprotein gel stain isroughly 4–8 times more sensitive than Pro-Q Fuchsiadye, depending upon the glycoprotein evaluated, if bothdyes are imaged for fluorescence on a laser-based gelscanner (Figs. 2A and E). Some nonspecific staining ofunglycosylated proteins when gels are heavily loaded(250 ng-1.0 �g per band) is observed using both stains.As a colorimetric stain, Pro-Q Fuchsia dye is 8–16-foldless sensitive than the fluorescent Pro-Q Emerald 488dye. Alexa Fluor 488 hydrazide visualized glycoproteinswith a 2-fold poorer detection sensitivity compared withPro-Q Emerald 488 dye (Figs. 2C and E), and nonspecific
staining of unglycosylated proteins was relatively high,particularly with phosphorylase b, bovine serum albumin,and soybean trypsin inhibitor (lanes 1 and 2, Fig. 2C).
When detecting glycans using Pro-Q Emerald 488 glyco-protein gel stain, it is prudent to run control gels in whichthe periodate oxidation step has been omitted. Similarprecautions are advisable when evaluating results usingother glycoprotein detection methods, including the Pro-Q Fuchsia glycoprotein gel stain. This avoids erroneousinterpretation of results arising from low levels of non-covalent binding of dye molecules or confusion arisingfrom the inherent fluorescence of certain proteins. Com-parison of Figs. 2E and G demonstrate that backgroundstaining is quite low using the Pro-Q Emerald 488 glyco-protein stain.
On PVDF membranes, Pro-Q Emerald 488 glycoproteinblot stain is roughly four times more sensitive than Pro-QFuchsia dye, when both dyes are imaged fluorescently(Figs. 2F and B). Nonspecific staining is higher for theblot stains than the corresponding gel stains. It shouldbe noted that both methods strongly labeled the acidicprotein soybean trypsin inhibitor, which lacks carbo-hydrate chains (21.5 kDa protein in Figs. 2B and F). Onblots, Alexa Fluor 488 hydrazide visualized glycopro-teins with 4-fold poorer detection sensitivity than Pro-QEmerald 488 dye (Figs. 2C and E) and produced very high

594 C. Hart et al. Electrophoresis 2003, 24, 588–598
nonspecific staining. Indeed, proteins with low carbo-hydrate content cannot be discerned from the patternof intensities of nonglycosylated proteins using AlexaFluor 488 hydrazide.
Detecting glycoproteins using Pro-Q Emerald 488 dye ingels can be accomplished in 31/2–4 h after an overnightfix and has fewer steps than other commonly employedprocedures. The Pro-Q Emerald 488 dye staining protocoldoes not employ a poststain reduction step with sodiumborohydride or metabisulfite, as required with standardcolorimetric detection of glycoproteins using acid fuchsinsulfite. The fluorescence intensity of Pro-Q Emerald 488dye-labeled proteins in gels is reasonably stable, de-creasing by approximately 20–40% after storage in 3%acetic acid for 20 h. Operationally, background stainingalso decreases with overnight storage, so that detectionsensitivity in stored gels is comparable to freshly stainedgels.
3.3 Comparison of the detection sensitivity andlinear dynamic range of Pro-Q Emerald 488stain with Pro-Q Fuchsia stain for modelglycoproteins of differing carbohydratecontent
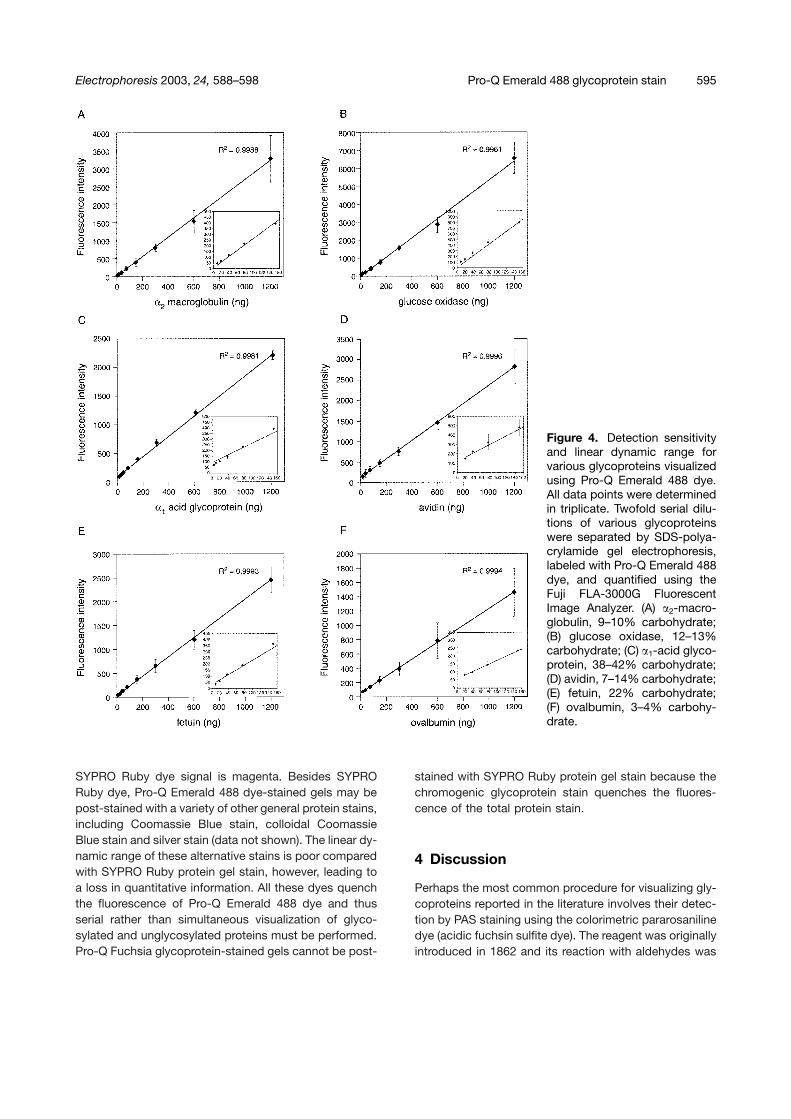
Pro-Q Emerald 488 and Pro-Q Fuchsia glycoprotein gelstains were further evaluated with respect to the sensitiv-ity and linear dynamic range of detection utilizing sixmodel glycoproteins of differing carbohydrate content.�2-Macroglobulin (9–10% carbohydrate), glucose oxi-dase (12–13% carbohydrate), �1-acid glycoprotein (38–42% carbohydrate), avidin (7% carbohydrate), fetuin(22% carbohydrate), and ovalbumin (3–4% carbohydrate)were investigated (Figs. 4, and 5, Table 1). In general, Pro-Q Emerald dye was fourfold more sensitive than Pro-QFuchsia dye, when both were imaged by fluorescence.With the exception of ovalbumin and avidin, all glyco-proteins were readily quantified over a 128–255-fold linearrange for Pro-Q Emerald 488 dye, with a detection sensi-
Table 1. Detection sensitivity
Protein Carbo-hydrate(%)
Pro-QSapphire488 dye(ng)
Pro-QFuchsiadye (ng)
SYPRORuby dye(post-stain;ng)
�2-Macroglobulin 9–10 9.4 37.5 2.3Glucose oxidase 12–13 9.4 37.5 2.3�1-Acid glycoprotein 38–42 4.7 37.5 4.7Avidin 7 18.8 37.5 4.7Fetuin 22 9.4 37.5 4.7Ovalbumin 3–4 18.8 75.0 0.6
tivity of 5–9 ng. The linear dynamic range of the two gly-coproteins with lower carbohydrate content was a moremodest 64-fold, due to the decrease in sensitivity to19 ng for ovalbumin and avidin. Pro-Q Fuchsia dye dis-played a linear dynamic range of 32-fold for all glyco-proteins evaluated except ovalbumin, which had a lineardynamic range of 16-fold. Using Pro-Q Fuchsia dye, thelimits of detection for all glycoproteins evaluated wasroughly 38 ng, except for ovalbumin, which was 75 ng.Fluorescence intensity traces across the width of a gelcontaining different amounts of �2-macroglobulin (1.2 �g–4.7 ng) stained with Pro-Q Emerald 488 glycoprotein gelstain and with Pro-Q Fuchsia glycoprotein gel stain areshown in Figs. 3C and D. This figure demonstrates thatPro-Q Emerald 488 dye-stained glycoproteins displayhigher signal and lower noise than their counterpartsstained with Pro-Q Fuchsia dye.
3.4 Dichromatic detection of glycosylated andnonglycosylated proteins in 2-D gels withPro-Q Emerald 488 and SYPRO Ruby gelstains
SYPRO Ruby dye quenches the fluorescence of Pro-QEmerald 488 dye in gels and on electroblots, makingsimultaneous visualization of glycosylated and unglyco-sylated proteins impractical. Pro-Q Emerald 488 dye andSYPRO Ruby protein gel stain may be used serially todetect glycosylated and unglycosylated proteins in thesame gel or on the same electroblot. We find that it isbest to label the glycoproteins first using Pro-Q Emerald488 dye, record the resulting green-fluorescent signal,stain all the proteins with SYPRO Ruby dye, and thenrecord the resulting red-fluorescent signal. We find thatincubating Pro-Q Emerald 488 dye-labeled PVDF blots in100% methanol improves post-staining with SYPRO Rubyprotein blot stain. Serial two-color detection of glyco-sylated and unglycosylated proteins is demonstrated inFig. 6. Human liver cancer tissue was fractionated by2-D gel electrophoresis and glycoproteins visualized usingPro-Q Emerald 488 dye. Numerous glycoproteins arereadily detected in the profile (Fig. 6A). Subsequent stain-ing with SYPRO Ruby dye reveals a number of unglyco-sylated proteins not visualized by the glycoprotein stain(Fig. 6B). Using Z3 gel analysis software, the glycosyla-tion and protein expression profiles can be merged togenerate a two-color map (Fig. 6C). For Fig. 6C thegreen-fluorescent signal of Pro-Q Emerald 488-stainedproteins has been pseudocolored magenta, while thered-fluorescent signal of the SYPRO Ruby-stained pro-teins has been pseudocolored green. If desired, thecolors can be displayed using the software package sothat the Pro-Q Emerald 488 dye signal is green and the
Electrophoresis 2003, 24, 588–598 Pro-Q Emerald 488 glycoprotein stain 595
Figure 4. Detection sensitivityand linear dynamic range forvarious glycoproteins visualizedusing Pro-Q Emerald 488 dye.All data points were determinedin triplicate. Twofold serial dilu-tions of various glycoproteinswere separated by SDS-polya-crylamide gel electrophoresis,labeled with Pro-Q Emerald 488dye, and quantified using theFuji FLA-3000G FluorescentImage Analyzer. (A) �2-macro-globulin, 9–10% carbohydrate;(B) glucose oxidase, 12–13%carbohydrate; (C) �1-acid glyco-protein, 38–42% carbohydrate;(D) avidin, 7–14% carbohydrate;(E) fetuin, 22% carbohydrate;(F) ovalbumin, 3–4% carbohy-drate.
SYPRO Ruby dye signal is magenta. Besides SYPRORuby dye, Pro-Q Emerald 488 dye-stained gels may bepost-stained with a variety of other general protein stains,including Coomassie Blue stain, colloidal CoomassieBlue stain and silver stain (data not shown). The linear dy-namic range of these alternative stains is poor comparedwith SYPRO Ruby protein gel stain, however, leading toa loss in quantitative information. All these dyes quenchthe fluorescence of Pro-Q Emerald 488 dye and thusserial rather than simultaneous visualization of glyco-sylated and unglycosylated proteins must be performed.Pro-Q Fuchsia glycoprotein-stained gels cannot be post-
stained with SYPRO Ruby protein gel stain because thechromogenic glycoprotein stain quenches the fluores-cence of the total protein stain.
4 Discussion
Perhaps the most common procedure for visualizing gly-coproteins reported in the literature involves their detec-tion by PAS staining using the colorimetric pararosanilinedye (acidic fuchsin sulfite dye). The reagent was originallyintroduced in 1862 and its reaction with aldehydes was

596 C. Hart et al. Electrophoresis 2003, 24, 588–598
Figure 5. Detection sensitivityand linear dynamic range forvarious glycoproteins visualizedusing Pro-Q Fuchsia dye (acidfuchsin sulfite). Conditions andassignment as in Fig. 4.
already well established by 1865 [18]. The dye was lateremployed as a histochemistry stain and subsequently tostain glycoproteins in gels and on electroblots [19–21].Though well known to histologists, the fluorescent prop-erties of pararosaniline dye have apparently escapednotice among scientists engaged in the analysis of glyco-proteins in electrophoresis gels [22, 23]. A major limita-tion of the PAS staining method is that detection sensi-tivity is poorer than Coomassie Blue staining, renderingthe technique obsolete for modern high-sensitivity prote-omics investigations. We find that exploiting the fluores-
cence properties of the dye improves detection sensi-tivity roughly 2–4-fold, but the nonspecific staining ofnonglycosylated proteins also becomes more problem-atic.
A recently developed approach for the detection of glyco-proteins relies upon the utilization of a new fluorescenthydrazide, Pro-Q Emerald 300 dye, that is affixed to gly-coproteins using a standard PAS conjugation mechanism[11]. The glycols present in glycoproteins are initiallyoxidized to aldehydes using periodic acid. The dye then

Electrophoresis 2003, 24, 588–598 Pro-Q Emerald 488 glycoprotein stain 597
Figure 6. Detection of unglyco-sylated and glycosylated pro-teins using Pro-Q Emerald 488dye and SYPRO Ruby proteingel stain in the same gel. (A)Detection of glycosylated pro-teins in a 2-D gel of humantumor tissue lysate stainedwith Pro-Q Emerald 488 dye.(B) Same gel post-stained withSYPRO Ruby protein gel stainto detect the total protein pro-file. (C) Differential display mapdemonstrating glycosylated andunglycosylated proteins in thetumor tissue. Glycoproteins ap-pear magenta in the image whilenonglycosylated proteins ap-pear green. Image acquisitionwas performed on a Fuji FLA-3000G Fluorescent Image Ana-lyzer. The differential displaymap was generated using Z3software.
reacts with the aldehydes on the glycoproteins to gener-ate the fluorescent conjugate. A reduction step withsodium metabisulfite or sodium borohydride is not re-quired to stabilize the resulting conjugate. One limitationof the Pro-Q Emerald 300 dye is that it cannot be usedwith laser-based gel scanners. Consequently, a newfluorescent glycoprotein stain, Pro-Q Emerald 488 dye,was developed. The new fluorescence-based stain per-mits detection of low nanogram amounts of glycoproteinwith a dynamic range of quantitation that encompassestwo orders of magnitude of glycoprotein abundance. Over-all, Pro-Q Emerald 300 dye, in combination with a302 nm UV transillumination source, is capable of detect-ing glycoproteins with a higher sensitivity (300 pg–1 ng)and a broader dynamic range (500–1000-fold) than Pro-QEmerald 488 dye using a 473 nm laser-based gel scanner[11]. Nevertheless, Pro-Q Emerald 488 dye is the mostsensitive dye for the detection of glycoproteins in gelswhen a visible-light source, such as a laser-based gelscanner, is being employed for imaging.
The authors are grateful to Jill Hendrickson and Joe Bee-chem of Molecular Probes, Inc. for intellectual contribu-tions to this project. We also appreciate the excellentgraphics assistance of Rakar West.
Received September 20, 2002
5 References
[1] Beeley, J., in: Burdon, R., van Knippenberg, P. (Eds.), Labora-tory Techniques in Biochemistry and Molecular Biology, Vol.16, Elsevier Press, New York 1985, pp. 5–28.
[2] Reuter, G., Gabius, H., Cell Mol. Life Sci. 1999, 55, 368–422.
[3] Taniguchi, N., Ekuni, A., Ko, J., Ikeda, Y., Nishikawa, A.,Honke, K., Takahashi, M., Proteomics 2001, 1, 239–247.
[4] Packer, N., Ball, M., Devine, P., in: Link, A. (Ed.), Methods inMolecular Biology, Vol. 112, Humana Press, Totowa, NJ 1999,pp. 341–352.
[5] Packer, N., Keatinge, L., in: Pennington, S., Dunn, M. (Eds.),Proteomics: From Protein Sequence to Function, Bios.Scientific Publishers, Oxford, England 2001, pp. 257–275.

598 C. Hart et al. Electrophoresis 2003, 24, 588–598
[6] Hirabayashi, J., Arata Y., Kasai, K., Proteomics 2001, 1, 295–303.
[7] Koketsu, M., Linhardt, R. J., Anal. Biochem. 2000, 283, 146–145.
[8] Raju, T., Anal. Biochem. 2000, 283, 125–132.
[9] Patton, W., Electrophoresis 2000, 21, 1123–1144.
[10] Patton, W., BioTechniques 2000, 28, 944–957.
[11] Steinberg, T., Pretty On Top, K., Berggren, K., Kemper, C.,Jones, L., Diwu, Z., Haugland, R., Patton, W., Proteomics2001, 1, 841–855.
[12] Patton, W., Pluskal, M., Skea, W., Buecker, J., Lopez, M.,Zimmerman, R., Belanger, L., Hatch, P., BioTechniques1990, 8, 518–527.
[13] Berggren, K., Chernokalskaya, E., Steinberg, T., Kemper, C.,Lopez, M., Diwu, Z., Haugland, R., Patton, W., Electropho-resis 2000, 21, 2509–2521.
[14] Berggren, K., Schulenberg, B., Lopez, M., Steinberg, T.,Bogdanova, A., Smeijkal, G., Wang, A., Patton, W., Prote-omics 2002, 2, 486–498.
[15] Lopez, M., Berggren, K., Chernokalskaya, E., Lazarev, A.,Robinson, M., Patton, W., Electrophoresis 2000, 21, 3673–3683.
[16] Berggren, K., Steinberg, T., Lauber, W., Carroll, J., Lopez,M., Chernokalskaya, E., Zieske, L., Diwu, Z., Haugland, R.,Patton, W., Anal. Biochem. 1999, 276, 129–143.
[17] Patton, W., J. Chromatogr. B 2002, 771, 3–31.
[18] Puchtler, H., Meloan, S., Histochemistry 1981, 72, 321–332.
[19] McManus, J., Nature 1946, 158, 202.
[20] Lillie, R., J. Lab. Clin. Med. 1947, 32, 910–912.
[21] Zacharius, R., Zell, T., Morrison, J., Woodlock, J., Anal. Bio-chem. 1969, 30, 148–152.
[22] Changaris, D., Combs, J., Severs, W., Histochemistry 1977,52, 1–15.
[23] Pihlman, K., Linder, E., Histochemistry 1983, 79, 157–165.