Detection and Quantification of Left Atrial Structural Remodeling Using Delayed Enhancement MRI in...
39
CirculationAHA/2008/811877 1 Detection and Quantification of Left Atrial Structural Remodeling Using Delayed Enhancement MRI in Patients with Atrial Fibrillation Robert S. Oakes BS 1,2 , Troy J. Badger MD 1 , Eugene G. Kholmovski PhD 1,3 , Nazem Akoum MD 1 , Nathan S. Burgon BS 1 , Eric N. Fish 1 , Joshua J.E. Blauer BS 1,2 , Swati N. Rao 1 , Edward V.R. DiBella PhD 1,3 , Nathan M. Segerson MD 1 , Marcos Daccarett MD 1 , Jessiciah Windfelder NP 1 , Christopher J. McGann MD 1,3 , Dennis Parker PhD 3 , Rob S. MacLeod PhD 1,2 and Nassir F. Marrouche MD 1 1 Atrial Fibrillation Program. University of Utah School of Medicine. 2 Scientific Computing Institute. University of Utah. 3 Utah Center for Advanced Imaging Research. University of Utah. Circulation Revision Corresponding Author Nassir F. Marrouche, MD Director, Cardiac Electrophysiology Laboratories Director, Atrial Fibrillation Program Division of Cardiology University of Utah Health Sciences Center 30 North 1900 East Room 4A100 Salt Lake City, Utah 84132-2400 [email protected] Phone: +1-801-581-2572 Fax: +1-801-581-7735
-
Upload
independent -
Category
Documents
-
view
3 -
download
0
Transcript of Detection and Quantification of Left Atrial Structural Remodeling Using Delayed Enhancement MRI in...

CirculationAHA/2008/811877 1
Detection and Quantification of Left Atrial Structural Remodeling Using Delayed Enhancement MRI in Patients with Atrial Fibrillation Robert S. Oakes BS 1,2, Troy J. Badger MD 1, Eugene G. Kholmovski PhD 1,3, Nazem Akoum MD 1, Nathan S.
Burgon BS 1, Eric N. Fish 1, Joshua J.E. Blauer BS 1,2, Swati N. Rao 1, Edward V.R. DiBella PhD 1,3, Nathan M.
Segerson MD 1, Marcos Daccarett MD 1, Jessiciah Windfelder NP 1, Christopher J. McGann MD 1,3, Dennis
Parker PhD3, Rob S. MacLeod PhD 1,2 and Nassir F. Marrouche MD 1
1 Atrial Fibrillation Program. University of Utah School of Medicine.
2 Scientific Computing Institute. University of Utah.
3 Utah Center for Advanced Imaging Research. University of Utah.
Circulation Revision
Corresponding Author
Nassir F. Marrouche, MD Director, Cardiac Electrophysiology Laboratories Director, Atrial Fibrillation Program
Division of Cardiology University of Utah Health Sciences Center 30 North 1900 East Room 4A100 Salt Lake City, Utah 84132-2400
[email protected] Phone: +1-801-581-2572 Fax: +1-801-581-7735

CirculationAHA/2008/811877 2
Abstract
Background. Atrial fibrillation (AF) is associated with diffuse left atrial (LA) fibrosis and a reduction in
endocardial voltage. These changes are indicators of AF severity and appear to be predictors of treatment
outcome. In this study we report the utility of delayed enhancement MRI (DE-MRI) in detecting abnormal
atrial tissue prior to radiofrequency ablation and in predicting procedural outcome.
Methods. Eighty-one patients presenting for pulmonary vein antrum isolation (PVAI) for treatment of AF
underwent 3D DE-MRI of the LA prior to the ablation. Six healthy volunteers were also scanned. DE-MRI
images were manually segmented to isolate the LA and custom software was implemented to quantify the
spatial extent of delayed enhancement, which was then compared to the regions of low voltage from
electroanatomical maps from the PVAI procedure. Patients were assessed for AF recurrence at least six months
following PVAI with average follow-up of 9.6 ± 3.7 months (range = 6 to 19 months).
Results. Based on the extent of pre-ablation enhancement, 43 patients were classified as having minimal
enhancement (average enhancement = 8.0% ± 4.2%), 30 as moderate (enhancement = 21.3% ± 5.8%), and 8 as
extensive (enhancement = 50.1% ± 15.4%). The rate of AF recurrence was 6 patients (14.0%) with minimal
enhancement, 13 (43.3%) with moderate and 6 (75%) patients with extensive enhancement (p <0.001).
Conclusion. DE-MRI provides a non-invasive means of assessing LA myocardial tissue in patients suffering
from AF and might provide insight into the progress of the disease. Pre-ablation DE-MRI holds promise to
predict responders to AF ablation and may provide a metric of overall disease progression.
CirculationAHA/2008/811877 3
Background
Pulmonary vein antrum isolation (PVAI) is effective in treating patients with paroxysmal, persistent and
longstanding persistent forms of atrial fibrillation (AF).1-4 PVAI helps restore normal sinus rhythm in a
majority of patients independent of the effects of antiarrhythmic-drug therapy, cardioversion, or both.5, 6
Recent breakthroughs in the understanding of pathophysiology of AF have suggested structural and
functional characteristics that relate to treatment. This progress was initiated by identifying focal points of
electrical activity within the pulmonary veins as a causative factor of the arrhythmia.1 Subsequent exploration of
the left atrial (LA) substrate has suggested that AF may be a self-perpetuating disease wherein chronic or
recurrent fibrillatory activation induces progressive electrical and tissue structural remodeling.7, 8 Although the
mechanisms underlying the remodeling are complex, the changes in electrical activation manifest as reduction
in myocardial voltage and a decrease in the effective refractory period.9, 10 The degree of voltage reduction may
help grade the severity of tissue pathology underlying AF and preliminary results suggest that the success of
PVAI is reduced when substantial low voltage tissue or pre-existing scar are present.11 Histological
examination of LA tissue has confirmed the presence of fibrosis in regions of low voltage tissue,12 but
determining the extent and location of fibrosis in the LA without using invasive techniques has not been
possible. As a result, the effects of such structural remodeling on patient outcome to treatment are poorly
understood.
Delayed enhancement MRI (DE-MRI) is an established method for visualizing tissue necrosis in cardiac
disease processes including myocardial infarction and myocarditis.13-15 Contrast enhancement occurs due to
altered washout kinetics of gadolinium relative to normal surrounding tissue, which may reflect increased
fibrosis or tissue remodeling of the myocardium.13 In this study, we assessed the feasibility of a new DE-MRI
acquisition and processing protocol to detect fibrosis in the LA prior to ablation and its potential to predict
PVAI procedural outcome.

CirculationAHA/2008/811877 4
Materials and Methods
Patients
Atrial Fibrillation Patients
Patients in this study presented to the University of Utah for PVAI of symptomatic AF from December 2006 to
January 2008. The study protocol was reviewed and approved by the University of Utah IRB and was HIPAA
compliant. During the course of the study, DE-MRI scans were performed on 118 patients. Fifteen of the scans
were uninterpretable due to significant wraparound artifact or substantial blurring due to patient motion. An
additional 22 patients were removed from analysis due to an incorrect choice of inversion time or other
concerns regarding DE-MRI quality, leaving 81 patients in the clinical cohort. Table 1 lists the demographics
of the study patients. After informed consent, patients underwent MRI scanning to define pulmonary vein
anatomy, LA area, and LA wall thickness. LA appendage thrombus was ruled out via trans-esophageal
echocardiogram. Left ventricular ejection fraction was obtained via biplane trans-thoracic echocardiogram. LA
volume was determined by segmentation of the blood volume on MRI angiography images.
The baseline AF type was categorized as either paroxysmal AF (episode of AF that self-terminated
within seven days) or persistent AF (episode of AF lasting longer than seven days). Patients who required
either pharmacological treatment or medical or electrical cardioversion were classified as persistent AF. All
antiarrhythmic medications were stopped 24 or 48 hours prior to the procedure. Amiodarone was discontinued
at least three month prior to the procedure. The data regarding the patient’s response to antiarrhythmic drugs
was assessed through retrospective chart review. Failure to respond to a given medication was defined as
having an episode of breakthrough AF while on the antiarrhythmic drug.
Healthy Volunteers
Six healthy volunteers without a history of AF or other cardiac arrhythmias also underwent DE-MRI acquisition
in the same manner as patients presenting for PVAI. The volunteers included four men and two women with a

CirculationAHA/2008/811877 5
mean age of 44.2 ± 21.2 years (range = 26 to 81 years). The volunteers did not undergo electroanatomic (EA)
mapping.
Delayed Enhancement MRI Acquisition
All patients underwent MRI studies on a 1.5 Tesla Avanto clinical scanner (Siemens Medical Solutions,
Erlangen, Germany) using a TIM phased-array receiver coil or 32-channel cardiac coil (Invivo Corp.,
Gainesville, FL). DE-MRI was acquired approximately 15 minutes after the contrast agent injection (dose = 0.1
mmol per kilogram of body weight [Multihance, Braco Diagnostic Inc., Princeton, NJ]) using 3D inversion-
recovery-prepared, respiration navigated, ECG-gated, gradient echo pulse sequence with fat saturation. Typical
acquisition parameters were: free-breathing using navigator-gating, a transverse imaging volume with true
voxel size=1.25x1.25x2.5 mm, flip angle = 22°, repetition time/echo time = 6.1/2.4 ms, inversion time
(TI)=230-320 ms, parallel imaging using GRAPPA technique with R=2 and 42 reference lines. ECG gating
was used to acquire a subset of phase encoding views during diastolic phase of the LA cardiac cycle. Typical
scan time for the DE-MRI study was 5-9 minutes depending on subject respiration and heart rate. Seventy-three
of eighty one patients (90.1%) were in normal sinus rhythm during MRI acquisition. Patients who were in AF
at the time of clinical presentation were often cardioverted to restore normal sinus rhythm prior to MRI
acquisition. Additional details regarding the MRI acquisition methods and data documenting inter and intra
observer variability of the quantification methodology may be found in the technical addendum.
In the volunteer group, the DE-MRI scans were acquired at 15 and again at 30 minutes following
contrast injection. In a subset of four patients, a third DE-MRI scan was acquired 45 minutes following contrast
injection. In total, 16 DE-MRI scans from the healthy volunteers were acquired and analyzed. Image
processing and quantification was performed in the same manner as for AF patients.
Three Dimensional Electroanatomic Mapping
At the beginning of the PVAI procedure, a detailed voltage map of the LA was obtained in all patients using the
three-dimensional EA mapping system CARTOMERGE (Biosense Webster, Diamond Bar, CA). The

CirculationAHA/2008/811877 6
physician performing the PVAI procedure was blinded to the DE-MRI results. Mapping was performed in
sinus rhythm whenever possible. Efforts were made to distribute measurement points evenly throughout the LA
and bipolar voltage was measured from peak to peak with the signal filtered from 30 to 400 Hz. Endocardial
contact of the mapping catheter (Navistar-ThermoCool, Biosense Webster) was confirmed visually using
fluoroscopy and intracardiac echocardiography (ICE) as well as through the CARTO 3-D navigation system to
indicate that the catheter was stable in space and in good contact with the LA wall. Forty-eight of eighty-one
patients (59.3%) were in normal sinus rhythm during EA mapping, 27/81 patients (33.3%) were in AF during
EA mapping and 6/81 (7.4%) were in atrial flutter.
Atrial Fibrillation Ablation Procedure
Ablation was performed under ICE in all study patients as described previously.11, 16, 17 Briefly, a 10 F, 64
element, phased array ultrasound catheter (AcuNav, Siemens Medical Solutions USA, Inc) was used to
visualize the inter-atrial septum and to guide the trans-septal puncture. A circular mapping catheter (Lasso,
Biosense Webster) and an ablation catheter were inserted into the LA. ICE was used to define the PV ostia and
their antra as well as the posterior wall. ICE was additionally used to position the circular mapping catheter and
ablation catheter. All study patients underwent PVAI, defined as electrical disconnection of the PV-antrum
from the LA together with posterior wall and septal debulking.
Follow-Up
Following the procedure, all patients were observed on a telemetry unit for 24 hours. Following discharge,
patients underwent 8 weeks of patient-triggered and auto-detected event monitoring and were instructed to
activate the monitors any time they felt symptoms. Patients continued anti-coagulation therapy with warfarin
(international normalized ratio of 2.0-3.0) for a minimum of three months. Patients were assessed for AF
recurrence at three months, six months, and one year after the procedure. The average follow-up in this study
was 9.6 ± 3.7 months (range 6 to 19 months).

CirculationAHA/2008/811877 7
Procedural success was defined as freedom from AF, atrial tachycardia, and atrial flutter while off of
antiarrhythmic medications three months following PVAI (i.e., blanking period of 90 days).18 To confirm the
absence of asymptomatic AF, all patients received a 48-hour Holter ECG recording within 24 hours following
the procedure and an 8-day Holter ECG at 3, 6, and 12 month follow-up. Recurrences were therefore
determined from patient reporting, event monitoring, Holter monitoring and ECG data and were defined as any
symptomatic or asymptomatic detected episode of AF, atrial tachycardia, or atrial flutter lasting > 30 seconds.
Analysis of DE-MRI Images
Three-dimensional visualization and segmentation of the MRI was performed using OsiriX 2.7.5.19 The LA was
segmented manually in all patients and verified visually in the original image stack prior to rendering. Initial
visualization used a Maximum Intensity Projection (MIP) to assess contrast consistency followed by volume
rendering using a ray-cast engine with linear table opacity. A Color Look-Up Table (CLUT) mask was applied
in order to better differentiate between enhanced and non-enhanced tissue.
Image Quantification. In all images, the epicardial and endocardial borders were manually contoured using
image display and analysis software written in MATLAB (The Mathworks Inc. Natick, MA). The relative
extent of fibrosis was quantified within the LA wall using a threshold based algorithm. Patients were assigned
to one of three groups based on the extent (percentage of LA myocardium) enhancement. The extent of
enhancement was entered into analysis as a categorical variable. Patients with mild enhancement showed
abnormal enhancement in less than 15% of the LA wall. Moderate enhancement was considered to be between
15% and 35% of the LA wall. Extensive enhancement was considered to be greater than 35% LA wall
enhancement. LA volume was also entered into the predictive model as a categorical variable with patients
divided into four separate groups based on the quartile cut-off points. Quartile 1 included patients with LA
volume < 59.89 mL, quartile 2 included patients with LA volume between 59.9 and 85.9 mL, quartile 3
included patients with LA volume between 85.91 to 116.12 mL, and quartile 4 included patients with LA
volume > 116.13 mL.

CirculationAHA/2008/811877 8
Correlation with Electroanatomical Maps. A quantitative and qualitative analysis was performed to correlate
low voltage regions on EA maps and enhancement on DE-MRI. Fifty-four patients with high quality CartoXP
maps (defined as greater than 100 voltage points evenly spread throughout the atrium) were selected. The LA
on the EA map and 3D DE-MRI was subdivided into 18 specific regions; 9 on the posterior wall and 9 on the
anterior and septal wall. Four blinded reviewers (two experts in cardiac MRI and two experts in AF ablation)
scored the MRI models and EA maps on a 0 to 3 scale. For MRI models, 0 was no enhancement, 1 was mild, 2
was moderate, and 3 was extensive enhancement. For the EA maps, 0 was considered healthy tissue (voltage >
1 mV, purple on EA maps), 1 was mild illness (voltage between > 0.1 mV and < 0.5 mV), 2 was moderate
illness (presence of low voltage tissue [voltage > 0.1 mV and < 0.5 mV] as well as fibrotic scar [voltage < 0.1
mV]), and 3 was considered diseased tissue with significant scarring (voltage < 0.1 mV, red on EA maps). The
overall score was an average sum of all nine regions for both the posterior wall and the septum.
The reviewers then qualitatively assessed the relationship between EA maps and MRI models. The
relationship was rated on a 0 to 4 scale where 0 was coded as “No Relationship,” 1 was coded as “Poor”, 2 was
graded as “Mediocre”, 3 as “Good”, and 4 as “Excellent”.
Statistical Analysis
Normal continuous variables are presented as mean ± standard deviation. Continuous data were analyzed by
one-way ANOVA to test for significant differences. Recurrence was analyzed in a time to event Cox regression
model. Recurrence after the blanking period was considered the failure variable, category of fibrosis (mild,
moderate, severe) was considered the predictor variable and available follow up duration was used as the time
variable. A test of the proportional hazards, a required assumption of Cox regression, was performed for each
covariate and globally using a formal significance test based on the unscaled and scaled Schoenfeld residuals.20
A quantitative analysis of the relationship between DE-MRI and EA maps was performed using linear
regression.
Multivariate analysis was conducted using a logistic regression model reporting odds ratios. Predictor

CirculationAHA/2008/811877 9
variables included extent of LA wall enhancement, LA volume, AF type and age. Differences were considered
significant at p < 0.05. Statistical analysis was performed using the SPSS 15.0 Statistical Package (SPSS Inc.;
Chicago, IL), STATA 9 (StataCorp; College Station, TX), and Microsoft Excel 2007 (Microsoft corporation;
Redmond, WA). In addition, a Harrell’s c-statistic was calculated for the Cox regression model.21
The authors had full access to the data and take responsibility for its integrity. All authors have read and
agree to the manuscript as written.
Results
Patients
Eighty-one patients underwent PVAI for treatment of AF. Forty-one patients were classified as paroxysmal AF
and 40 patients as persistent AF. Forty-three patients were identified with mild enhancement, 30 with
moderate enhancement and 8 with extensive enhancement. Table 1 lists the patient demographics for the three
patient groups and overall demographics for the clinical cohort. Twenty-five patients were placed back on
antiarrhythmic medications following the procedure and continued therapy for a total of eight weeks following
the procedure.
Among the healthy volunteers, the average extent of LA wall enhancement was 1.7% ± 0.3%. In the 43
patients classified as having mild LA enhancement, the average LA wall enhancement was 8.0% ± 4.2%. In the
30 patients with moderate enhancement, average LA wall enhancement was 21.3% ± 5.8%. In the 8 patients
with extensive enhancement, the average LA wall enhancement was significantly higher at 50.1% ± 15.4%. All
patients with extensive enhancement presented with persistent AF. While all groups had similar population
characteristics at baseline, a statistically significant difference in LA volume was noted between those with mild
or moderate enhancement and individuals with extensive enhancement (p < 0.001).

CirculationAHA/2008/811877 10
Delayed Enhancement MRI and Electroanatomic Maps
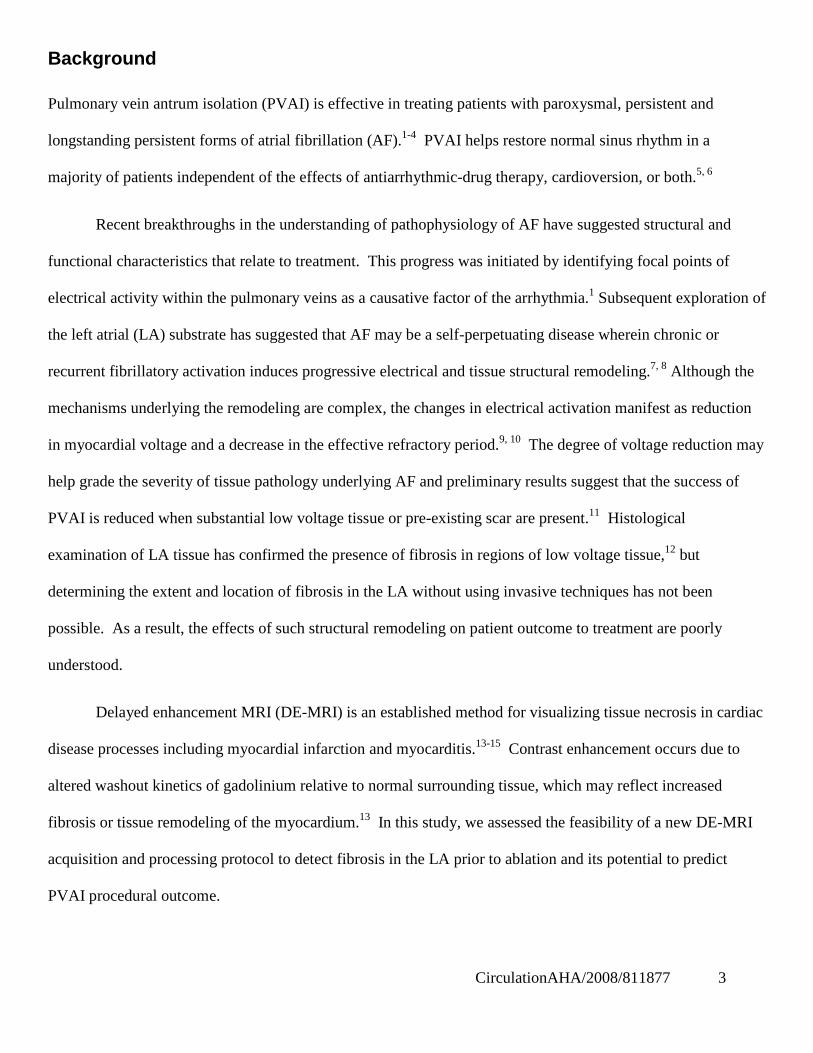
DE-MRI detected enhancement in all patients presenting for PVAI. Figure 1 shows the 3D segmented MRI
(Figure 1A) and color model (Figure 1B) for one patient. Discrete patches of enhancement/fibrosis (green) can
be seen in the posterior wall (PA view) and septum (RAO view) on both the MRI and the EA map. In
comparison, the healthy volunteers showed little to no abnormal enhancement. Figure 3 shows MRI models for
two individuals that lacked the type of enhancement seen in patients with AF.
Figure 4 shows 3D MRI models in patients with mild structural remodeling. The minimal contrast is
suggestive of largely viable and electrically normal atrial myocardium, a finding verified when compared to EA
maps obtained during the procedure (Figure 4D). In all patients, a correlation between regions of enhancement
on DE-MRI and low voltage regions on EA maps was seen (Figures 1, 4-6). Quantitative analysis of this
relationship demonstrated a positive correlation of R2 = 0.61 (Figure 2).
In addition to the extent of LA wall enhancement, the primary location of enhancement differed among
the three patient groups. Among patients with mild and moderate LA wall enhancement, it was primarily seen
in the posterior wall and inter-atrial septum (Figure 4-5). Among patients with extensive low voltage tissue
(Figure 6), enhancement was seen in all portions of the LA wall including the posterior wall, inter-atrial septum,
and anterior wall. This difference resulted in a large statistically significant difference in the location of LA
wall enhancement (p < 0.001). When compared to the EA maps, two distinct patterns emerged: some patients
exhibited continuous regions of enhancement (Figure 5, Patient 1) while others showed a scattered pattern
enhancement (Figure 5, Patient 2).
DE-MRI Quantification and Patient Outcome
Fifty-six of eighty-one patients (69.1%) remained free of AF recurrence while off anti-arrhythmic drugs. Only
6 patients (14.0%) with minimal enhancement suffered AF recurrence while 13 (43.3%) of the moderate and 6
(75%) of the extensive group suffered AF recurrence (Cox regression, p < 0.05). Patients who suffered AF

CirculationAHA/2008/811877 11
recurrences were placed back on anti-arrhythmic drugs and of these, 21/25 (84%) responded favorably to anti-
arrhythmic drug therapy post-ablation and maintained normal sinus rhythm.
Prior to ablation, 70 patients were tried on anti-arrhythmic drugs. 32 patients responded favorably to
anti-arrhythmic drugs and 38 patients did not. A statistically significant difference in the extent of LA
enhancement was also noted between patients who responded to medical therapy (13.3% ± 9.9%) versus those
who did not (21.2% ± 18.7%; Logistic regresison p = 0.038). The extent of delayed enhancement as a single
predictor achieved a c-statistic of 0.62. Table 3 shows that the extent of LA wall enhancement was the
strongest predictor of response to rhythm control response with anti-arrhythmic drugs and ablation.
Figure 7 shows the Cox regression analysis of patients in normal sinus rhythm following ablation of the
LA grouped by the extent of enhancement. In addition to the overall differences in AF recurrence, patients with
moderate and extensive enhancement often suffered recurrence at later time points than those with mild
enhancement. Of special note, after the six month follow-up, no recurrences were noted in the mild
enhancement group.
The cutoff points between mild enhancement and moderate enhancement (15%) and between moderate
and extensive enhancement (35%) were chosen after manual review of the data distribution—and prior to
outcome analysis—as natural breakpoints between populations.
Multivariate Model
Table 3 shows the results of the three multivariate models. For all three outcome metrics of interest, the extent
of LA wall enhancement was the most statistically significant predictor. For baseline AF, both the extent of LA
wall enhancement and LA volume remained as statistically significant predictors of persistent forms of the
arrhythmia though extent of LA wall enhancement had a greater adjusted odds ratio (Adj OR = 3.47; 95% CI =
[1.32, 9.16]) than LA volume (Adj OR = 1.02, 95% CI = [1.01, 1.04]). This finding may reflect the fact that
both variables likely have a degree of correlation with one another; they are both predictors of severe and
persistent forms of the disease. Extent of LA wall enhancement was the most statistically significant predictor

CirculationAHA/2008/811877 12
of the patient’s response to both drug and ablation therapies for AF. After controlling for the effect of LA wall
enhancement in the drug therapy model, none of the other variables achieved statistical significance
Discussion
In this study, we describe a novel, non-invasive method of using DE-MRI to detect pathologic regions of
LA tissue in patients with AF. Our results also indicate that an increased amount of enhancement within the LA
is strongly associated with AF recurrence following PVAI. If substantiated, this method would provide
guidance in determining appropriate candidates for catheter ablation of AF.
The results presented here also correlate well with other studies that considered pre-existent LA low
voltage tissue and scarring (determined by invasive EP study) as an independent predictor of procedural failure
and eventual AF recurrence.11 Our results also demonstrate that not only the extent but also the locations of
LA enhancement appear to be important predictors of ablation success (Table 2). Patients who suffered
recurrent AF showed enhancement in all portions of the LA while patients who responded successfully to
ablation showed enhancement primarily limited to the posterior wall and septum.
The presence of fibrosis/low voltage tissue has been postulated as a potential cause of the abnormalities
in atrial activation that may underlie the initiation and maintenance of fibrillation.22, 23 Animal studies have
confirmed an increased tendency for AF when atrial fibrosis is experimentally induced.24-26 Increased fibrosis
has also been clearly demonstrated in human LA tissue specimens of patients with AF 27-28 and correlations
have been seen between serum markers of atrially selective fibroblasts and clinical AF.29 Other studies have
shown that atrial fibrosis can lead to AF induction by burst or premature atrial pacing that would otherwise fail
to cause AF in normal hearts.25, 30 Spatial distribution and degree of fibrosis/low voltage tissue appears to have
an important influence in fibrillatory dynamics, including both the location and variability of wavefront
breakthroughs.31 By altering the LA substrate, it is therefore likely that fibrotic change and structural
remodeling aid in the formation of circuits needed for re-entry, thus perpetuating the atrial arrhythmia. These

CirculationAHA/2008/811877 13
findings are consistent with the trends noted in this study. In multivariate analysis, the extent of LA wall
enhancement seemed to be most associated with the more persistent form of the atrial arrhythmia (Table 3).
DE-MRI is a well-established method for characterizing fibrosis and tissue remodeling in the ventricle.
It is commonly employed to characterize tissue heterogeneity in ventricular myocardium that may increase
arrhythmia generation and to differentiate hibernating muscle from nonviable tissue in the setting of myocardial
ischemia.32-34 Despite its success, however, the use of DE-MRI has largely been confined to the ventricle due to
the challenges in spatial resolution required to image the LA wall. This study presents an imaging methodology
for successfully obtaining DE-MRI scans with sufficient spatial resolution and signal to noise ratio for
visualization and analysis of LA tissue. In addition to its non-invasive nature, DE-MRI offers other advantages
over invasive EA mapping studies to assess LA tissue health. For example, CARTO based mapping studies
have been associated with a high degree of spatial error, from 0.5 to 1.0 cm, in comparative studies.35, 36 In
contrast, reconstruction utilizing DE-MRI provides information regarding both anatomy and the location of
pathology without spatial distortion.
AF is a progressive disease, which suggest the presence of a self-perpetuating cycle and there is
evidence that causality between fibrillation and fibrosis may be bidirectional. Rapidly paced cardiac myocytes
have been shown to release factors that induce a nearly four-fold increase in collagen-1 and fibronectin-1 in
atrial tissue.37 In this study, patients suffering recurrence exhibited a significant difference in the amount of
structural remodeling as compared to individuals without recurrence. This observation helps corroborate the
link between the degree of fibrosis and the disease severity in AF. In our study, patients with extensive
enhancement presented exclusively with persistent forms of the disease. Further, multivariate analysis
demonstrated that the greatest degree of variance for ablation outcome and response to medical therapy were
explained by the degree of fibrotic enhancement in the LA wall (Table 3). This and the other associated
findings therefore present a disease model that supports the importance of early intervention.

CirculationAHA/2008/811877 14
Determining the extent of low voltage tissue prior to ablative treatment provides an opportunity to
characterize the stage of disease in patients with AF. Based upon the results of this study, ablative treatment of
AF in patients with extensive LA enhancement should be offered with a reduced expectation of long-term
success. Additional research is necessary to determine whether ablation represents a viable treatment option in
patients with extensive enhancement or whether additional medical therapy should be further investigated in
these patients.11 DE-MRI screening will likely allow for better patient selection and may aid in identifying
candidates for repeat procedures who still have patches of tissue suitable for ablation.
Study Limitations
Though statistically significant differences in the degree of enhancement were seen between patients with
paroxysmal and persistent AF, those patients who responded to medical therapy and those who did not, and
patients who suffered a recurrence of AF; the sample size is relatively small and these findings will need to be
verified in larger patient cohorts. Larger studies are also needed to improve the value of the c-statistic in order
to make it a stronger prognostic indicator in clinical practice. In addition, MR imaging in this study was
performed on a 1.5 Tesla scanner and significant improvements in LA wall imaging with greater spatial
resolution and improved signal to noise ratio are expected at higher magnetic field (3 Tesla). The presence of
respiratory navigator artifacts and other MRI noise may lead to the inappropriate detection and quantification of
fibrosis, though such effects appeared to be minimal in this study. Finally, the algorithm used to detect and
quantify fibrosis requires an experienced observer to choose threshold levels.
Conclusion
Delayed Enhancement MRI of the left atrium coupled with advanced image analysis techniques provides a non-
invasive method for quantifying and localizing left atrial changes associated with atrial fibrillation. Patients
with a greater extent of delayed enhancement in the left atrial wall suffer much higher recurrence rates after
PVAI for atrial fibrillation. Delayed enhancement MRI holds great promise to guide physicians in
recommending catheter ablation or medical management for patients with atrial fibrillation.

CirculationAHA/2008/811877 15
Acknowledgements
The authors gratefully acknowledge the aid of Josh Bertola, Duane Richins and Judy Eldredge who aided with
the acquisition of the MRI scans. NIH/NIDDK Grant 5T35 HL00774-15, “Short-Term Training: Students in
Health Professional Schools” provided the funding for Robert Oakes during this study. The authors also
acknowledge the computational support and resources provided by the Scientific Computing and Imaging
Institute and the NIH NCRR Center for Integrative Biomedical Computing (www.sci.utah.edu/cibc), NIH
NCRR Grant No. 5P41RR012553-02. Eugene Kholmovski, Edward DiBella, Dennis Parker and Nassir
Marrouche are partially supported by grants from Siemens Medical and Surgivision.

CirculationAHA/2008/811877 16
References
1. Haissaguerre M, Jais P, Shah DC, Takahashi A, Hocini M, Quiniou G, Garrigue S, Le Mouroux A, Le Metayer P, Clementy J. Spontaneous initiation of atrial fibrillation by ectopic beats originating in the pulmonary veins. The New England journal of medicine. 1998;339(10):659-666.
2. Marrouche NF, Martin DO, Wazni O, Gillinov AM, Klein A, Bhargava M, Saad E, Bash D, Yamada H, Jaber W, Schweikert R, Tchou P, Abdul-Karim A, Saliba W, Natale A. Phased-array intracardiac echocardiography monitoring during pulmonary vein isolation in patients with atrial fibrillation: impact on outcome and complications. Circulation. 2003;107(21):2710-2716.
3. Marrouche NF, Dresing T, Cole C, Bash D, Saad E, Balaban K, Pavia SV, Schweikert R, Saliba W, Abdul-Karim A, Pisano E, Fanelli R, Tchou P, Natale A. Circular mapping and ablation of the pulmonary vein for treatment of atrial fibrillation: impact of different catheter technologies. Journal of the American College of Cardiology. 2002;40(3):464-474.
4. Pappone C, Oreto G, Rosanio S, Vicedomini G, Tocchi M, Gugliotta F, Salvati A, Dicandia C, Calabro MP, Mazzone P, Ficarra E, Di Gioia C, Gulletta S, Nardi S, Santinelli V, Benussi S, Alfieri O. Atrial electroanatomic remodeling after circumferential radiofrequency pulmonary vein ablation: efficacy of an anatomic approach in a large cohort of patients with atrial fibrillation. Circulation. 2001;104(21):2539-2544.
5. Oral H, Pappone C, Chugh A, Good E, Bogun F, Pelosi F, Jr., Bates ER, Lehmann MH, Vicedomini G, Augello G, Agricola E, Sala S, Santinelli V, Morady F. Circumferential pulmonary-vein ablation for chronic atrial fibrillation. The New England journal of medicine. 2006;354(9):934-941.
6. Lemola K, Desjardins B, Sneider M, Case I, Chugh A, Good E, Han J, Tamirisa K, Tsemo A, Reich S, Tschopp D, Igic P, Elmouchi D, Bogun F, Pelosi F, Jr., Kazerooni E, Morady F, Oral H. Effect of left atrial circumferential ablation for atrial fibrillation on left atrial transport function. Heart Rhythm. 2005;2(9):923-928.
7. Kopecky SL, Gersh BJ, McGoon MD, Whisnant JP, Holmes DR, Jr., Ilstrup DM, Frye RL. The natural history of lone atrial fibrillation. A population-based study over three decades. The New England journal of medicine. 1987;317(11):669-674.
8. Wijffels MC, Kirchhof CJ, Dorland R, Allessie MA. Atrial fibrillation begets atrial fibrillation. A study in awake chronically instrumented goats. Circulation. 1995;92(7):1954-1968.
9. Morillo CA, Klein GJ, Jones DL, Guiraudon CM. Chronic Rapid Atrial Pacing : Structural, Functional, and Electrophysiological Characteristics of a New Model of Sustained Atrial Fibrillation. Vol 91; 1995:1588-1595.
10. Jenkins J, Noh KH, Guezennec A, Bump T, Arzbaecher R. Diagnosis of atrial fibrillation using electrograms from chronic leads: evaluation of computer algorithms. Pacing Clin Electrophysiol. 1988;11(5):622-631.
11. Verma A, Wazni OM, Marrouche NF, Martin DO, Kilicaslan F, Minor S, Schweikert RA, Saliba W, Cummings J, Burkhardt JD, Bhargava M, Belden WA, Abdul-Karim A, Natale A. Pre-existent left atrial scarring in patients undergoing pulmonary vein antrum isolation: an independent predictor of procedural failure. Journal of the American College of Cardiology. 2005;45(2):285-292.
12. Boldt A, Wetzel U, Lauschke J, Weigl J, Gummert J, Hindricks G, Kottkamp H, Dhein S. Fibrosis in left atrial tissue of patients with atrial fibrillation with and without underlying mitral valve disease. Heart. 2004;90(4):400-405.
13. Kim RJ, Wu E, Rafael A, Chen E-l, Parker MA, Simonetti o, Klocke FJ, Bonow RO, Judd RM. The Use of Contrast-Enhanced Magnetic Resonance Imaging to identify Reversible Myocardial Dysfunction. The New England journal of medicine. 2000;343(20):1445-1453.
14. De Cobelli F, Pieroni M, Esposito A, Chimenti C, Belloni E, Mellone R, Canu T, Perseghin G, Gaudio C, Maseri A, Frustaci A, Del Maschio A. Delayed gadolinium-enhanced cardiac magnetic resonance in

CirculationAHA/2008/811877 17
patients with chronic myocarditis presenting with heart failure or recurrent arrhythmias. Journal of the American College of Cardiology. 2006;47(8):1649-1654.
15. Rochitte CE, Tassi EM, Shiozaki AA. The emerging role of MRI in the diagnosis and management of cardiomyopathies. Curr Cardiol Rep. 2006;8(1):44-52.
16. Verma A, Marrouche NF, Natale A. Pulmonary vein antrum isolation: intracardiac echocardiography-guided technique. Journal of cardiovascular electrophysiology. 2004;15(11):1335-1340.
17. Marrouche NF, Guenther J, Segerson NM, Daccarett M, Rittger H, Marschang H, Schibgilla V, Schmidt M, Ritscher G, Noelker G, Brachmann J. Randomized comparison between open irrigation technology and intracardiac-echo-guided energy delivery for pulmonary vein antrum isolation: procedural parameters, outcomes, and the effect on esophageal injury. Journal of cardiovascular electrophysiology. 2007;18(6):583-588.
18. Calkins H, Brugada J, Packer DL, Cappato R, Chen SA, Crijns HJ, Damiano RJ, Jr., Davies DW, Haines DE, Haissaguerre M, Iesaka Y, Jackman W, Jais P, Kottkamp H, Kuck KH, Lindsay BD, Marchlinski FE, McCarthy PM, Mont JL, Morady F, Nademanee K, Natale A, Pappone C, Prystowsky E, Raviele A, Ruskin JN, Shemin RJ. HRS/EHRA/ECAS expert consensus statement on catheter and surgical ablation of atrial fibrillation: recommendations for personnel, policy, procedures and follow-up. A report of the Heart Rhythm Society (HRS) Task Force on Catheter and Surgical Ablation of Atrial Fibrillation developed in partnership with the European Heart Rhythm Association (EHRA) and the European Cardiac Arrhythmia Society (ECAS); in collaboration with the American College of Cardiology (ACC), American Heart Association (AHA), and the Society of Thoracic Surgeons (STS). Endorsed and approved by the governing bodies of the American College of Cardiology, the American Heart Association, the European Cardiac Arrhythmia Society, the European Heart Rhythm Association, the Society of Thoracic Surgeons, and the Heart Rhythm Society. Europace. 2007;9(6):335-379.
19. Ratib O. OSIRIX: An Open Source Platform for Advanced Multimodality Medical Imaging. Paper presented at: Information & Communications Technology, 2006. ICICT '06. ITI 4th International Conference on, 2006.
20. Grambsch PM, Therneau TM. Proportional hazards tests and diagnostics based on weighted residuals. Biometrika. 1994;81:515-526.
21. Harrell FE, Jr., Califf RM, Pryor DB, Lee KL, Rosati RA. Evaluating the yield of medical tests. JAMA. 1982;247(18):2543-2546.
22. Spach MS, Boineau JP. Microfibrosis produces electrical load variations due to loss of side-to-side cell connections: a major mechanism of structural heart disease arrhythmias. Pacing Clin Electrophysiol. 1997;20(2 Pt 2):397-413.
23. Spach MS, Josephson ME. Initiating reentry: the role of nonuniform anisotropy in small circuits. Journal of cardiovascular electrophysiology. 1994;5(2):182-209.
24. Li D, Fareh S, Leung TK, Nattel S. Promotion of atrial fibrillation by heart failure in dogs: atrial remodeling of a different sort. Circulation. 1999;100(1):87-95.
25. Verheule S, Sato T, Everett Tt, Engle SK, Otten D, Rubart-von der Lohe M, Nakajima HO, Nakajima H, Field LJ, Olgin JE. Increased vulnerability to atrial fibrillation in transgenic mice with selective atrial fibrosis caused by overexpression of TGF-beta1. Circ Res. 2004;94(11):1458-1465.
26. Tang M, Zhang S, Sun Q, Huang C. Alterations in electrophysiology and tissue structure of the left atrial posterior wall in a canine model of atrial fibrillation caused by chronic atrial dilatation. Circ J. 2007;71(10):1636-1642.
27. Kostin S, Klein G, Szalay Z, Hein S, Bauer EP, Schaper J. Structural correlate of atrial fibrillation in human patients. Cardiovasc Res. 2002;54(2):361-379.
28. Nakai T, Chandy J, Nakai K, Bellows WH, Flachsbart K, Lee RJ, Leung JM. Histologic assessment of right atrial appendage myocardium in patients with atrial fibrillation after coronary artery bypass graft surgery. Cardiology. 2007;108(2):90-96.
29. Li X, Ma C, Dong J, Liu X, Long D, Tian Y, Yu R. The fibrosis and atrial fibrillation: Is the transforming growth factor-beta(1) a candidate etiology of atrial fibrillation. Med Hypotheses. 2007.

CirculationAHA/2008/811877 18
30. Hayashi H, Wang C, Miyauchi Y, Omichi C, Pak HN, Zhou S, Ohara T, Mandel WJ, Lin SF, Fishbein MC, Chen PS, Karagueuzian HS. Aging-related increase to inducible atrial fibrillation in the rat model. Journal of cardiovascular electrophysiology. 2002;13(8):801-808.
31. Tanaka K, Zlochiver S, Vikstrom KL, Yamazaki M, Moreno J, Klos M, Zaitsev AV, Vaidyanathan R, Auerbach DS, Landas S, Guiraudon G, Jalife J, Berenfeld O, Kalifa J. Spatial distribution of fibrosis governs fibrillation wave dynamics in the posterior left atrium during heart failure. Circ Res. 2007;101(8):839-847.
32. Schmidt A, Azevedo CF, Cheng A, Gupta SN, Bluemke DA, Foo TK, Gerstenblith G, Weiss RG, Marban E, Tomaselli GF, Lima JA, Wu KC. Infarct tissue heterogeneity by magnetic resonance imaging identifies enhanced cardiac arrhythmia susceptibility in patients with left ventricular dysfunction. Circulation. 2007;115(15):2006-2014.
33. Assomull RG, Prasad SK, Lyne J, Smith G, Burman ED, Khan M, Sheppard MN, Poole-Wilson PA, Pennell DJ. Cardiovascular magnetic resonance, fibrosis, and prognosis in dilated cardiomyopathy. Journal of the American College of Cardiology. 2006;48(10):1977-1985.
34. Bello D, Fieno DS, Kim RJ, Pereles FS, Passman R, Song G, Kadish AH, Goldberger JJ. Infarct morphology identifies patients with substrate for sustained ventricular tachycardia. Journal of the American College of Cardiology. 2005;45(7):1104-1108.
35. Zhong H, Lacomis JM, Schwartzman D. On the accuracy of CartoMerge for guiding posterior left atrial ablation in man. Heart Rhythm. 2007;4(5):595-602.
36. Malchano ZJ, Neuzil P, Cury RC, Holmvang G, Weichet J, Schmidt EJ, Ruskin JN, Reddy VY. Integration of cardiac CT/MR imaging with three-dimensional electroanatomical mapping to guide catheter manipulation in the left atrium: implications for catheter ablation of atrial fibrillation. Journal of cardiovascular electrophysiology. 2006;17(11):1221-1229.
37. Burstein B, Qi XY, Yeh YH, Calderone A, Nattel S. Atrial cardiomyocyte tachycardia alters cardiac fibroblast function: A novel consideration in atrial remodeling. Cardiovasc Res. 2007.
CirculationAHA/2008/811877 19
Figures Legends
Figure 1. MRI relationship with EA map in posterior (PA) and right anterior oblique (RAO) views. (A) Segmented DE-MRI reveals discrete areas of enhancement in the posterior wall and the septal area. (B) Color 3D models improve dynamic range and better illuminate enhancement patters. (C) EA map acquired during invasive EP study. Discrete patterns of low voltage (within bounded white lines) were detected in the left posterior wall and the septum in the patient shown which correlate with the regions of DE-MRI enhancement.

CirculationAHA/2008/811877 20
Figure 2. Correlation between enhancement on DE-MRI and low voltage regions on EA Map. Linear regression between the extent of enhancement seen on 18 segmented LA models of DE-MRI and the amount of low voltage tissue seen on 18 segmented EA map graded by blinded reviewers.
R² = 0.61
0
10
20
30
40
0 5 10 15 20 25 30 35 40 45
Low
Vol
tage
Tis
sue
(EA
Map
)
Extent of Delayed Enhancement (MRI)
p < .05
95% CI [0.83-1.3]

CirculationAHA/2008/811877 21
Figure 3. Three Dimensional MRI models for Two Healthy Volunteers. (A) Two dimensional slice from the DE-MRI scan. (B) Posterior (PA) view of reconstructed 3D MRI model. (C) Right anterior oblique (RAO) view of the 3D MRI model which shows the inter-atrial septum and the anterior wall. In all volunteers, MRI reveals uniform LA tissue enhancement.

CirculationAHA/2008/811877 22
Figure 4. Three-Dimensional MRI Models in Two Patients with Mild Structural Remodeling. (A) Two dimensional slice from DE-MRI scan. (B) 3D DE-MRI reveals minimal contrast enhancement. (C) 3D color models. (D) EA map showing electrically normal (purple) and abnormal (colored) atrial tissue. The EA map illustrates homogeneous voltages throughout much of the left atrium with small patches of electrically abnormal/low voltage tissue in nearly all patients who successfully responded to PVAI therapy. Abnormally enhanced regions on MRI correlate closely with low voltage areas on the EA maps.

CirculationAHA/2008/811877 23
Figure 5. Three-Dimensional MRI Models in Two Patients with Moderate Structural Remodeling. (A) Two dimensional slice from DE-MRI scan. (B) Segmented DE-MRI reveals increased enhancement in portions of the poster LA wall. (C) MRI images as color 3D models clearly show large regions of abnormal enhancement (green) in comparison to healthy tissue (blue). (D) EA map shows large patches of electrically normal (purple) and abnormal tissue (colored). Electrically non-viable (scar) tissue is shown in red. The most substantial enhancement appears in the posterior wall of the LA, which correlates with the enhancement seen on MRI.

CirculationAHA/2008/811877 24
Figure 6. Three-Dimensional MRI Models in Two Patients with Extensive Structural Remodeling. Both patients shown suffered a recurrence of atrial fibrillation. (A) Two dimensional slice from DE-MRI scan. (B) Segmented DE-MRI reveals large amounts of enhancement in various regions of the LA including anterior wall, posterior wall and septum. (C) MRI images as color 3D models show abnormally enhanced regions (green). (D) EA maps show large regions of electrically non-viable tissue (fibrotic scar) in red interspersed with electrically abnormal tissue (colored).

CirculationAHA/2008/811877 25
Figure 7. Patients in normal sinus rhythm following ablation of the left atrium. Cox regression curves for patients with mild enhancement (blue), moderate enhancement (green) and extensive enhancement (red) are shown. The mean follow-up was 9.6 ± 3.7 months (range = 6 to 19 months).

CirculationAHA/2008/811877 26
Tables
Table 1. Patient Population Characteristics
Total Mild
Enhancement (n=43)
Moderate Enhancement
(n=30)
Extensive Enhancement
(n=8) P-Value *
Age (years) 63.6 ± 12.0 63.3 ± 12.3 62.2 ± 12.5 70.1 ± 6.0 0.25 Left Ventricle Ejection Fraction 52.3 ± 9.8 53.3 ± 10.3 52.4 ± 8.8 46.4 ± 9.0 0.23 Left Atrium Volume – Pre-procedure (cm3) 94.3 ± 41.3 83.7 ± 29.4 98.5 ± 48.3 142.1 ± 36.9 < 0.001
Gender
Female 29 (35.8%) 13 (30.2%) 12 (40.0%) 4 (50.0%) 0.49 Male 52 (64.2%) 30 (69.8%) 18 (60.0%) 4 (50.0%)
Hypertension 42 (51.9%) 25 (58.1%) 13 (43.3%) 4 (50.0%) 0.49 Diabetes 10 (12.3%) 4 (9.3%) 4 (13.3%) 2 (25.0%) 0.36 Coronary Artery Disease 9 (11.1%) 5 (11.6%) 3 (10.0%) 1 (12.5%) 1.00 History of Smoking 9 (11.1%) 6 (14.0%) 1 (3.3%) 2 (25.0%) 0.16 Valve Surgery 3 (3.7%) - 1 (3.3%) 2 (25.0%) 0.01 Myocardial Infarct 2 (2.5%) 2 (4.7%) - - 0.60
Medications at the Time of Ablation ** Antiarryhtmic Medications 22 (27.2%) 9 (20.9%) 11 (36.6%) 2 (25.0%) 0.15
Amiodarone 15 (18.5%) 8 (18,6%) 4 (13.3%) 3 (37.5%) 0.31 Digoxin 12 (14.8%) 6 (14.0%) 5 (16.7%) 1 (12.5%) 0.90
Beta Blockers 42 (%) 23 (53.4%) 15 (50.0%) 4 (50.0%) 0.87 Calcium Channel Blockers 10 (12.3%) 5 (11.6%) 3 (10.0%) 2 (25.0%) 0.52
Response to Antiarrhythmic Medications Failed One or More Medications 32 (39.5%) 14 (32.6%) 12 (40.0%) 6 (75.0%) 0.080
* Continuous measurements are presented as mean ± standard deviation. Categorical measurements are presented as number positive for the condition and percentage of the total. Significance tests for demographic characteristics used One-Way ANOVA to detect statistically significant differences across continuous measurements. Fisher exact tests were used for categorical measurements.
** Many patients were on multiple medications prior to ablative treatment. The reported numbers and percentages add to more than 100%. Patients being treated on Amiodarone had it discontinued at least one month prior to the ablation procedure.

CirculationAHA/2008/811877 27
Table 2. Results of DE-MRI Analysis and Patient Outcome
Total Mild
Enhancement (n=43)
Moderate Enhancement
(n=30)
Extensive Enhancement
(n=8) P-Value *
Extent of Structural Remodeling (% of LA Volume) 17.1 ± 14.2 8.0 ± 4.3 21.3 ± 5.8 50.1 ± 15.4 -
Location of Enhancement (> 50% of Surface Enhanced)
LA Posterior Wall 51 (63.0%) 18 (41.9%) 25 (83.3%) 8 (100.0%) < 0.001
LA Anterior Wall 13 (16.0%) 3 (7.0%) 2 (6.7%) 8 (100.0%) < 0.001
Atrial Septum 24 (29.6%) 7 (16.3%) 9 (30.0%) 8 (100.0%) < 0.001
Type of Atrial Fibrillation - Baseline Paroxysmal 41 (50.6%) 28 (65.1%) 13 (43.3%) -
< 0.001 Persistent 40 (49.4%) 15 (25.6%) 17 (56.7%) 8 (100%)
Recurrence Time to recurrence analysis using Cox
regression
Hazard Ratio 2.4
95% CI [ 1.39-4.08] 0.001

CirculationAHA/2008/811877 28
Table 3. Results of Multivariate Analysis
Predictors
Baseline AF Type* (n = 81; 40 paroxsymal/41 persistent)
Response to Antiarrhythmic Drug Therapy (n = 70; 32 favorable)
Successful AF Ablation (n = 81; 56 successful)
P-Value Adjusted Odds Ratio 95% CI P-Value Adjusted
Odds Ratio 95% CI P-Value Adjusted Odds Ratio 95% CI
Extent of LA Wall Enhancement ** 0.01 3.47 [1.32-9.16] 0.01 3.14 [1.32-7.49] <0.01 4.88 [1.73-13.74]
LA Volume † <0.01 1.02 [1.01-1.04] 0.21 0.99 [0.97-1.01] 0.01 1.02 [1.00-1.05]
Baseline Atrial Fibrillation Type †† - - - 0.96 0.97 [0.29-3.19] 0.04 0.21 [0.05-0.96]
Age 0.71 1.01 [0.96-1.05] - - - - - -
* The baseline AF type calculated was considered as paroxysmal or persistent AF.
** The extent of enhancement was entered into analysis as a categorical variable. Patients with mild enhancement showed abnormal enhancement in less than 15% of the LA wall. Moderate enhancement was considered to be between 15% and 25% abnormal enhancement. Extensive enhancement was considered to be greater than 35% LA wall enhancement.
† LA volume was entered into the predictive model as a categorical variable. Patients were divided into four separate groups by the quartiles. Quartile 1 included patients with LA volume < 59.87 mL, quartile 2 was from 59.9 to 85.9 mL, quartile 3 included patients from 85.91 to 116.12 mL, and quartile 4 included patients with LA volume > 116.13 mL.
†† The baseline atrial fibrillation type (Paroxysmal/Persistent) was only included in predictive models for response to ablation and medical therapy.

Appendix: MRI Acquisition, Image Analysis and Quantification Variability
Circulation Revision – 2008 07-29
Delayed Enhancement MRI Acquisition – Detailed Parameters
Patients who were referred to the University of Utah for pulmonary vein antrum isolation (PVAI) were included
in this analysis. In all patients, a contrast enhanced 3D FLASH angiography sequence and a cine true-FISP
sequence were used to define the anatomy of the left atrium (LA) and the pulmonary veins (PV). To depict
fibrous regions of the left atrium, delayed enhancement MRI was acquired approximately 15 minutes after
contrast agent injection using a 3D inversion recovery prepared, respiration navigated, ECG gated, gradient
echo pulse sequence. The sequence was based upon previously reported work.1, 2 Typical acquisition
parameters were: free-breathing using a respiratory navigator with a 6 mm acceptance window, a transverse
imaging volume with voxel size = 1.25 x 1.25 x 2.5 mm (which was then reconstructed to 0.625 x 0.625 x 1.25
for analysis), TR/TE = 6.3/2.3 ms, TI = 230-270 ms, flip angle = 22°, bandwidth = 220 Hz/pixel, 1 RR interval
between inversion pulses, phase encoding in right-left direction, parallel imaging using the GRAPPA technique
with R = 2 and 32 reference lines, partial Fourier acquisition with 0.875 factors in the phase-encoding direction
and a 0.8 factor in the slice-encoding direction.
ECG gating was used to acquire a small subset of phase encoding views and during the diastolic phase
of the left atrial cardiac cycle. The time interval between the R-peak of the ECG and the start of the data
acquisition was defined by examining the cine images of the left atrium to determine the period of minimal left
atrial motion. The typical value of the interval was 60% of the mean RR interval for patients in sinus rhythm
and 50% of the mean RR for patients with non-regular heart rate. The respiratory navigator was used to acquire
data during the end of the expiration phase the respiratory cycle. To reduce the negative effect of respiration of
image quality and resolution, the navigator was positioned on the right hemi-diaphragm. The acceptance
window was set to ± 3 mm. The typical LA motion due to respiration is predominantly in the superior/inferior
(S/I) direction. This motion has lower amplitude than the corresponding diaphragm motion. From our
observations, we have noted that the typical LA motion amplitude in the S/I direction is about two times smaller

than the diaphragm S/I displacement. Thus, the data acquisition for the delayed enhancement pulse sequence
was active only if the LA displacement was less than 1.5 mm from the baseline. The voxel size (spatial
resolution) of our pulse sequence in the S/I direction 2.5 mm. Therefore, data was only acquired if the LA
displacement in the S/I direction was less than half of the voxel size in the same direction.
To resolve the effect of the left atrial motion due to cardiac activity on image quality and resolution, data
was acquired only during the diastolic phase of the LA. Cine images of the LA were used to identify the time
interval when the LA motion was minimal. The parameters of the delayed enhancement pulse sequence were
adjusted so that the data acquisition occurred during this time interval. It was further restricted to
approximately 120 ms per heartbeat.
Fat saturation was used to suppress the fat signal. The TE of the scan was chosen such that the signal
intensity of partial volume fat-tissue voxels was reduced allowing improved definition of the left atrial wall
boundary. The TI value for the DE-MRI scan was identified using a scout scan. The typical scan time for the
DE-MRI study was between 5 to 9 minutes depending on the subject respiration and heart rate.
Many of the early patient scans included some high signal artifact induced by the respiratory navigator
positioned on the right hemi-diaphragm. Figure A1 shows an example of such a scan where it is possible to see
navigator induced bright blood signal in right pulmonary veins, the most common location of the artifact.
However, despite the presence of navigator artifact, there is a strong qualitative relationship between the color
MRI model (Figure A1c) and the electroanatomic map acquired during the catheter study (Figure A1d). To
remove the artifact complementary re-inversion RF pulse was removed from the product implementation of the
navigation scheme and navigation information was acquired following imaging data. The change preserves the
inversion recovery magnetization preparation in the whole image volume and results in a more uniform blood
signal in the pulmonary vein and left atrium. Figure A2 shows an example of a later scan without the navigator
artifact.

Analysis of Delayed Enhancement-MRI Images
The threshold for fibrosis identification was determined for each patient individually by using a dynamic
threshold algorithm based partly on work in the left ventricle.3, 4 Figure A3 provides an overview of the data
processing steps of the algorithm. First, slices from the DE-MRI scan are windowed and cropped. The
epicardial and endocardial borders are then manually traced to isolate the walls of the left atrium. The
algorithm then automatically selects a threshold intensity which is likely to correspond to the enhanced/fibrotic
voxels of the left atrium by estimating the mean value and the standard deviation of the “normal” tissue.
“Normal” tissue is defined as the lower region of the pixel intensity histogram between 2% and 40% of the
maximum intensity within the region of interest (e.g., the left atrial wall). The enhanced/fibrotic threshold was
then calculated as two to four standard deviations above the mean of “normal.” These values cover from 95% to
99.994% of a Gaussian distribution. The threshold was determined on a slice by slice basis and the region
identified as fibrotic was then compared to the original DE-MRI slice for appropriateness. The most commonly
used cutoff was three standard deviations.
The overall volume of the LA myocardium was calculated as the number of voxels within the
endocardial and epicardial contours. The extent of enhancement was then calculated as the number of pixels
identified as enhanced by the semi-automated algorithm over the volume of the left atrial myocardium for the
slice.
Inter and Intra-Observer Agreement
Inter-observer Agreement
For interobserver agreement, observers 1 and 2 both analyzed a subset of 43 patients from the clinical cohort
with high quality DE-MRI scans. The two observers were blinded to the results obtained by the other observer
and analyzed the studies by following a set protocol. First, the endocardial contour was traced and care was
taken to avoid the pulmonary veins. Second, the epicardial contour was traced. The data was then quantified
using the semi-automated algorithm by a third individual according to the described methodology.

The limits of agreement were calculated by Bland-Altman analysis. The difference between the amount
of enhancement detected from the segmentation of observer 1 and observer 2 was taken and plotted against the
average detected enhancement from the segmentations of observers one and two. The average difference and
95% confidence interval (limits of agreement [LOA]) were calculated from these plots. Figure A4 shows the
Bland-Altman plot for the inter-observer agreement of detected LA wall enhancement in forty-three patients.
The average difference was -0.9% (LOA = -7.9% to 6.1%).
Intra-observer Agreement
The intra-observer agreement was calculated from a set of 10 patients which were segmented two times by the
same observer. The average difference and LOA were calculated in a manner similar to that described for the
inter-observer agreement. The difference between segmentation 1 and segmentation 2 from the same observer
was determined and plotted against the average detected enhancement. Figure A5 shows the Bland-Altman plot
for the intra-observer agreement of detected LA wall enhancement in the ten patients. The average difference
was 0.49% (LOA = -4.96% to 5.95%).
Relationship between EA Maps and MRI Volume Models
Qualitative Assessment
A trained expert qualitatively assessed and graded the relationship between EA maps and MRI color models.
The relationship was rated on a 0 to 4 scale where 0 was coded as “No Relationship,” 1 was coded as “Poor”, 2
was graded as “Mediocre”, 3 as “Good”, and 4 as “Excellent”. The average relationship between EA maps and
MRI models was 3.65 ± 0.55 (range 2 to 4). Figure A6 shows an example of a strong qualitative MRI
correlation with the corresponding EA map. The region of low voltage tissue has been highlighted in white on
the electroanatomic map.
Quantitative Assessment
Fifty-four patients with high quality CartoXP maps (defined as greater than 100 voltage points evenly spread
throughout the atrium) were selected and scored by blinded reviewers. The same was done using three

dimensionally rendered DE-MRI models. The LA was then subdivided into 18 specific regions (9 on the
posterior wall) and 9 on the anterior and septal wall. Figure A6 shows the posterior wall projections of a DE-
MRI volume model and electroanatomic map for the same patient. In both images, the 9 box grid used for
scoring has been applied.
Four blinded reviewers (two individuals experienced in cardiac MRI and two individuals experienced in
atrial fibrillation ablation) separately scored the MRI models and electroanatomic maps. Two views of interest,
the posterior (PA) and right anterior oblique which shows the anterior wall and septum [RAO]), were chosen for
scoring.
The images were scored on a 0 to 3 scale. For MRI models, 0 was scored as no enhancement, 1 as mild
enhancement, 2 as moderate, and 3 as extensive enhancement. For EA maps, 0 was considered healthy tissue
(voltage > 1 mV, purple on EA maps), 1 was considered as mild illness (some abnormal tissue where voltage
was > 0.1 mV and < 0.5 mV), 2 as moderate illness (presence of low voltage tissue [voltage > 0.1 mV and < 0.5
mV] as well as fibrotic scar [voltage < 0.1 mV]), and 3 as scar (voltage < 0.1 mV, red on EA maps). The
overall score was a sum of all nine regions for both the posterior wall and the septum. The reviewer scores
were then averaged to determine the score used in quantitative analysis. The relationship between EA maps and
MRI was then analyzed using pairwise regression.
Figure A8 shows the analysis between the extent of enhancement on MRI and the amount of low
voltage tissue. A positive correlation of R2 = 0.61 was noted.

References
1. McGann C, Kholmovski EG, Oakes RS, et al. Magnetic Resonance Imaging Detects Chronic Left Atrial Wall Injury Post Ablation of Atrial Fibrillation. Paper presented at: Scientific Sessions - AHA 2007, 2007; Orlando, Florida.
2. Peters DC, Wylie JV, Hauser TH, et al. Detection of pulmonary vein and left atrial scar after catheter ablation with three-dimensional navigator-gated delayed enhancement MR imaging: initial experience. Radiology. Jun 1 2007;243(3):690-695.
3. Hsu LY, Natanzon A, Kellman P, Hirsch GA, Aletras AH, Arai AE. Quantitative myocardial infarction on delayed enhancement MRI. Part I: Animal validation of an automated feature analysis and combined thresholding infarct sizing algorithm. J Magn Reson Imaging. Mar 2006;23(3):298-308.
4. Hsu LY, Ingkanisorn WP, Kellman P, Aletras AH, Arai AE. Quantitative myocardial infarction on delayed enhancement MRI. Part II: Clinical application of an automated feature analysis and combined thresholding infarct sizing algorithm. J Magn Reson Imaging. Mar 2006;23(3):309-314.

Appendix – Figure A1. Example of early DE-MRI acquisition showing a substantial artifact induced by the respiratory navigator placed on the right hemidiaphragm. (A) 2D MRI slice from DE-MRI scan. (B) Maximum intensity projection (MIP) of segmented 2D slices. (C) MRI images as volume rendered three dimensional model. (D) Electroanatomic map acquired during invasive EP study. When present, the artifact was primarily localized to the right pulmonary veins and varied substantially in intensity. Despite the presence of an artifact, there is still a relationship between the color MRI (C) and the electroanatomic map (D). The patient shown has minimal enhancement.
Appendix – Figure A2. Example of DE-MRI without navigator induced artifact. 2D MRI slice from DE-MRI scan. In contrast to the image shown in Figure A2, there is no visible navigator artifact on the right side. The patient shown has minimal enhancement.
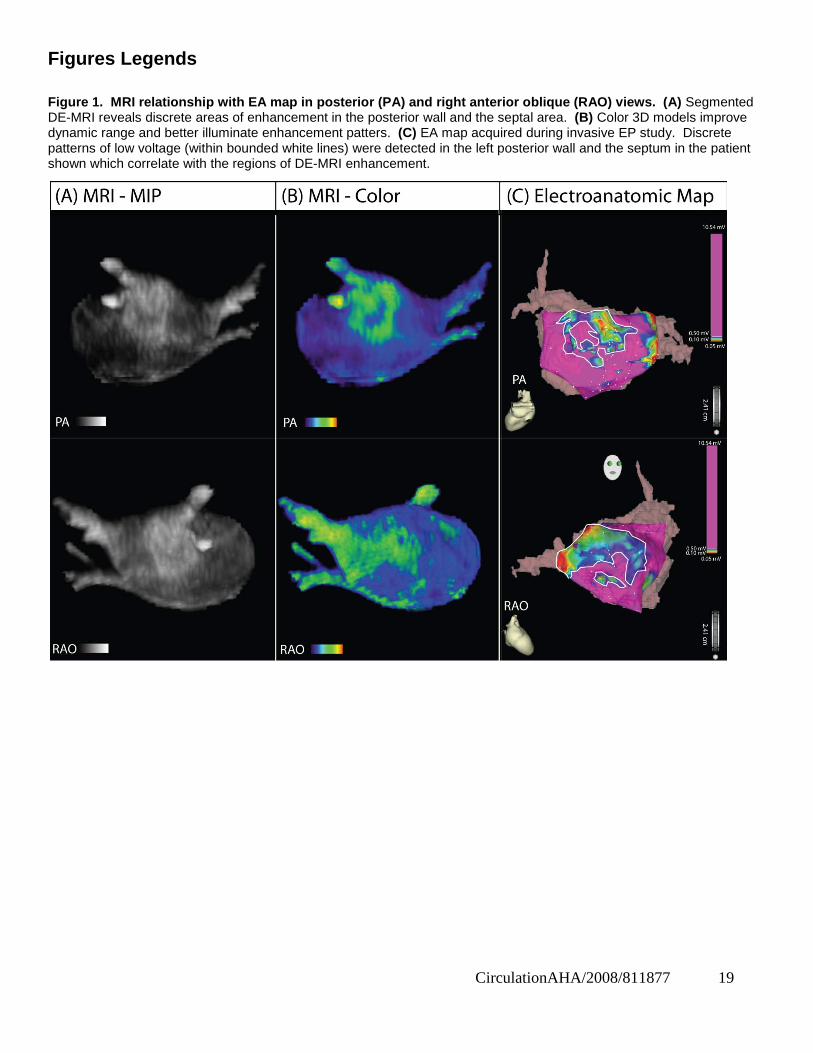
Appendix – Figure A3. Data flow of the semi-automated algorithm used for detection of abnormal enhancement. The input slices from the delayed enhanced scan were windowed and cropped. The epicardial and endocardial borders were then manually segmented. The algorithm then automatically selected a threshold intensity which was likely to correspond to the enhanced/fibrotic voxels of the LA by estimating the mean value and standard deviation of the lower region of the pixel intensity histogram. The threshold cutoff was chosen manually at two to four standard deviations above the mean for the lower histogram region and assessed by an observer for appropriateness. If the algorithm has over estimated or underestimated the degree of enhancement, the cutoff was adjusted appropriately.
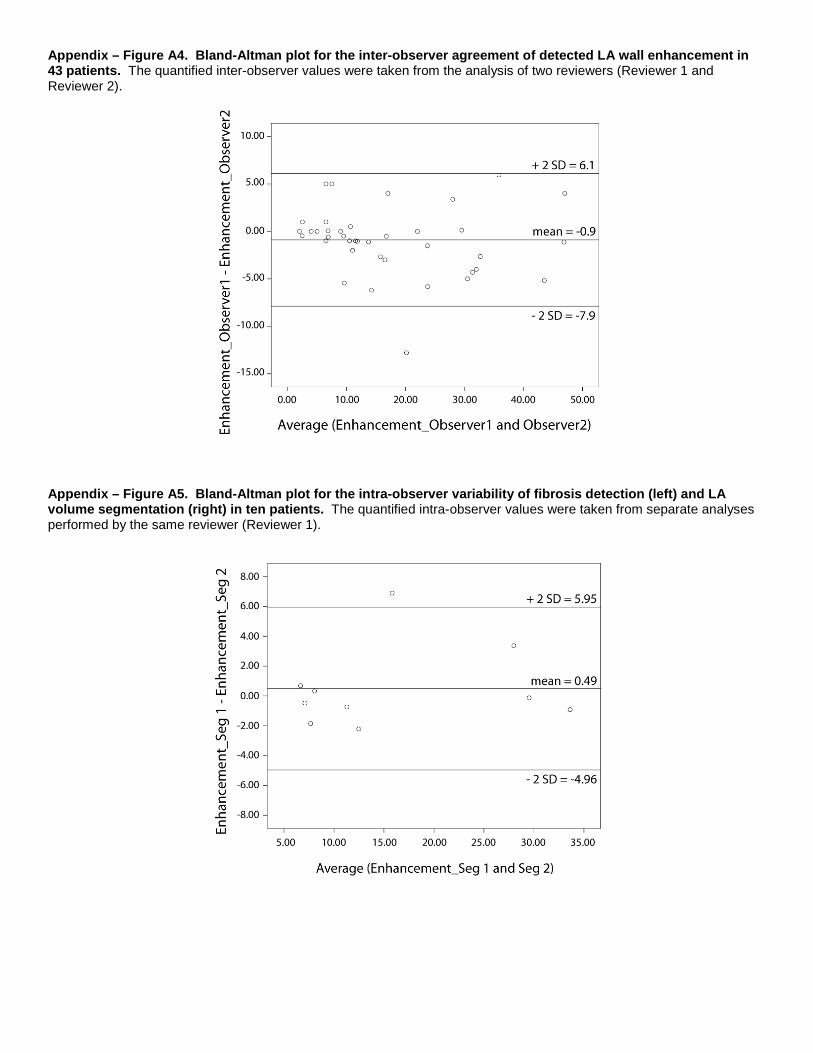
Appendix – Figure A4. Bland-Altman plot for the inter-observer agreement of detected LA wall enhancement in 43 patients. The quantified inter-observer values were taken from the analysis of two reviewers (Reviewer 1 and Reviewer 2).
Appendix – Figure A5. Bland-Altman plot for the intra-observer variability of fibrosis detection (left) and LA volume segmentation (right) in ten patients. The quantified intra-observer values were taken from separate analyses performed by the same reviewer (Reviewer 1).

Appendix – Figure A6. Example of a strong qualitative MRI correlation with EA map, posterior (PA) view.
Appendix – Figure A7. Posterior wall projections of DE-MRI volume model (left) and electroanatomic (EA) map acquired with the CARTO system (right). In both images, the a 9 box grid was used for qualitative scoring. 18 separate regions covering the posterior wall and, the interatrial septum, and the anterior wall were evaluated. Both the DE-MRI models and the EA maps were scored from 0 (no abnormal enhancement/disease) to 3 (severe enhancement/disease). The overall score was a sum of all nine regions for both the posterior wall and the septum.

Appendix – Figure A8. Pairwise regression between the extent of enhancement (MRI) and the amount of low voltage tissue (graded by blinded reviewers).
R² = 0.61
0
10
20
30
40
0 5 10 15 20 25 30 35 40 45
Low
Vol
tage
Tis
sue
(EA
Map
)
Extent of Delayed Enhancement (MRI)