Temporal Organization of Atrial Activity and Irregular Ventricular Rhythm During Spontaneous Atrial...
13
773 Temporal Organization of Atrial Activity and Irregular Ventricular Rhythm During Spontaneous Atrial Fibrillation: An In Vivo Study in the Horse ANNA R.M. GELZER. DR.MED.VET.. N. SYDNEY MOISE. D.V.M., DHANANJAY VAIDYA, M,B.B.S..* KARIN A. WAGNER, D.V.M., and JOSE JALIFE, M.D.* From the Department of Clinical Sciences. College of Veterinary Medicine. Cornell University, Ithaca; atid the "Department of Pharmacology, SUNY Upstate Medical Utiivcrsity, Syracuse. New York Temporal Organization of Atrial Activity. Introduction: Atrial fibrillation (AF) is cominon in healthy horses. We studied the temporal or^ani/ation of AF to test the hypothesis that the arrhythmia is governed hy a high degree of periodicity and therefore is not random in the horse. Further, we surmised that concealed conduction of AF impulses in the AV node results in an inverse relationship hetween AF frequency and ventricular frequency. Methods and Results: Fast Fourier transform (FFT) analysis of atrial activity was done on signal-averaged ECGs (n = II) and atrial electrograms (n = 3) of horses with AF at control (C). after quinidine sulfate (22 mg/kg hy mouth every 2 hours) at 50% time to conversion (T50), and immediately hefore conversion (T90) to sinus rhythm. FFT always revealed a single dominant frequency peak. The mean dominant frequency decreased until conversion (C = 6.84 ± 0.85 Hz. T50 = 4.87 ± 1.5 Hz, T90 = 3.41 ± 1.18 Hz; P < 0.001). Mean AA intervals (n = 5WM gradually increased after quinidinv. Mean RR intervals (n = 5«0), standard deviation of the mean ISDM), Pointare plots, and serial autocorrelograms (SACs) of 500 RR intervals were measured at C" and T9() to delcrmine the ventricular response to AF and quinidine-induced changes in the variability of the ventricular response. Mean RR interval and SDM were reduced after quinidine (C = 1431 ± 266 msec and 695 ± 23 msec; T90 = 974 ± 116 msec and 273 ± 158 msec, respectively: P < 0.01). Poincare plots and SAC at C and at T9(l revealed a signiticant correlation of consecutive RR intervals typical of a system with a deterministic behavior. At T90, the variability of RR intenals was reduced and the overall periodicity of RR intervals was increased after (luinidinc administration. Conclusion: In the horse, AF is a complex arrhythmia characterized by a high degree of underlying periodicity. The inverse AA-to-RR interval relationship and reduced variability of RR intervals after quinidine suggest that the ventricular response during AF results from rate-depen- dent concealment of AF wavelets bombarding the AV node, wbich nevertheless results in a significant degree of short-term predictahility of beat-lo-heat changes in RR intervals. iJ Cardiovasc Electrophysiol. Vol. IL pp. 773-784. July 2000) atrial fibrillation, spectral analysis, ventricular response, periodicity, horse Introduction Atrial fibrillation (AF) is the most common sustained cardiac arrhythmia. It occurs in large numbers of patients Supported by the unrcstricied Alumni Funds from Cornell University College ol" Veterinary Medicine. aniJ in part by Grants PfH-HL39707 and R()1-HL6(IK43 Tmm the National Heurt. Lung, and Blood Institute lit the National Institutes of Health. Address for correspondence: Anna Gelzer. Dr.Med. Vet.. Department of Clinical Studies. Philadelphia. University of Pennsylvania. SchtKtl of Veterinary Medicine. 39(H) Delancey Street. Philadelphia. PA IMKM- 6010. Fax: 215-573-6232; E-mail: [email protected] Manuscript received 13 December 1999; Accepted for publication 27 March 2l)0(). and is increasingly prevalent with advancing age. Most importantly, it is the major cause of embolic events in man.' Yet, despite its significance, treatment of AF re- mains largely empirical and. for the most part, Ineffec- livc. perhaps because its pathophysiologic bases have not been explored adequately. In recent years, there has been a revival of the old controversy of whether AF results from fibrillatory conduction of waves emerging from a single stiurce (a rotor) cycling at a high frequency--^ or from random propagation of wavefronts that tVactionate into multiple daughter wavelets." Today, most authors subscribe to the idea tbat AF is the result of a self- sustaining process involving multiple meandering; wave- lets propagating randomly throughout the atria.'' ** How- ever, recent evidence suggests that AF is accompanied
-
Upload
johnshopkins -
Category
Documents
-
view
3 -
download
0
Transcript of Temporal Organization of Atrial Activity and Irregular Ventricular Rhythm During Spontaneous Atrial...
773
Temporal Organization of Atrial Activity and IrregularVentricular Rhythm During Spontaneous Atrial
Fibrillation: An In Vivo Study in the Horse
ANNA R.M. GELZER. DR.MED.VET.. N. SYDNEY MOISE. D.V.M.,DHANANJAY VAIDYA, M,B.B.S..* KARIN A. WAGNER, D.V.M.,
and JOSE JALIFE, M.D.*
From the Department of Clinical Sciences. College of Veterinary Medicine. Cornell University, Ithaca; atid the"Department of Pharmacology, SUNY Upstate Medical Utiivcrsity, Syracuse. New York
T e m p o r a l Organ iza t ion of Atr ia l Activity. Introduction: Atrial fibrillation (AF) is cominonin healthy horses. We studied the temporal or^ani/ation of AF to test the hypothesis that thearrhythmia is governed hy a high degree of periodicity and therefore is not random in the horse.Further, we surmised that concealed conduction of AF impulses in the AV node results in an inverserelationship hetween AF frequency and ventricular frequency.
Methods and Results: Fast Fourier transform (FFT) analysis of atrial activity was done onsignal-averaged ECGs (n = II) and atrial electrograms (n = 3) of horses with AF at control (C).after quinidine sulfate (22 mg/kg hy mouth every 2 hours) at 50% time to conversion (T50), andimmediately hefore conversion (T90) to sinus rhythm. FFT always revealed a single dominantfrequency peak. The mean dominant frequency decreased until conversion (C = 6.84 ± 0.85 Hz.T50 = 4.87 ± 1.5 Hz, T90 = 3.41 ± 1.18 Hz; P < 0.001). Mean AA intervals (n = 5WM graduallyincreased after quinidinv. Mean RR intervals (n = 5«0), standard deviation of the mean ISDM),Pointare plots, and serial autocorrelograms (SACs) of 500 RR intervals were measured at C" and T9()to delcrmine the ventricular response to AF and quinidine-induced changes in the variability of theventricular response. Mean RR interval and SDM were reduced after quinidine (C = 1431 ± 266msec and 695 ± 23 msec; T90 = 974 ± 116 msec and 273 ± 158 msec, respectively: P < 0.01).Poincare plots and SAC at C and at T9(l revealed a signiticant correlation of consecutive RR intervalstypical of a system with a deterministic behavior. At T90, the variability of RR intenals was reduced andthe overall periodicity of RR intervals was increased after (luinidinc administration.
Conclusion: In the horse, AF is a complex arrhythmia characterized by a high degree ofunderlying periodicity. The inverse AA-to-RR interval relationship and reduced variability of RRintervals after quinidine suggest that the ventricular response during AF results from rate-depen-dent concealment of AF wavelets bombarding the AV node, wbich nevertheless results in asignificant degree of short-term predictahility of beat-lo-heat changes in RR intervals. iJ CardiovascElectrophysiol. Vol. IL pp. 773-784. July 2000)
atrial fibrillation, spectral analysis, ventricular response, periodicity, horse
Introduction
Atrial fibrillation (AF) is the most common sustainedcardiac arrhythmia. It occurs in large numbers of patients
Supported by the unrcstricied Alumni Funds from Cornell UniversityCollege ol" Veterinary Medicine. aniJ in part by Grants PfH-HL39707and R()1-HL6(IK43 Tmm the National Heurt. Lung, and Blood Institutelit the National Institutes of Health.
Address for correspondence: Anna Gelzer. Dr.Med. Vet.. Department ofClinical Studies. Philadelphia. University of Pennsylvania. SchtKtl ofVeterinary Medicine. 39(H) Delancey Street. Philadelphia. PA IMKM-6010. Fax: 215-573-6232; E-mail: [email protected]
Manuscript received 13 December 1999; Accepted for publication 27March 2l)0().
and is increasingly prevalent with advancing age. Mostimportantly, it is the major cause of embolic events inman.' Yet, despite its significance, treatment of AF re-mains largely empirical and. for the most part, Ineffec-livc. perhaps because its pathophysiologic bases have notbeen explored adequately. In recent years, there has beena revival of the old controversy of whether AF resultsfrom fibrillatory conduction of waves emerging from asingle stiurce (a rotor) cycling at a high frequency--^ orfrom random propagation of wavefronts that tVactionateinto multiple daughter wavelets." Today, most authorssubscribe to the idea tbat AF is the result of a self-sustaining process involving multiple meandering; wave-lets propagating randomly throughout the atria.'' ** How-ever, recent evidence suggests that AF is accompanied
774 Journal of Cardiovascular £lectrophysiolog> Vol. II. No. 7. July 2000
by a substantial amount of spatiotemporal periodicityand tberefore i.s not characterized by entirely randompatterns of atrial propagation.'''^ Furthermore, althoughrecent studies have focused on the development of ex-perimental models of sustained AF,'" •'' lo our knowl-edge, no such model reproduces appropriately the dy-namics of AF in humans. Mo.st important, AF does notoccur spontaneously in any of these models. Il usuallyrequires chronic rapid epicardial or transvenous pac-ing.'f''^ a sterile pericarditis.''* or burst pacing,"* and,once terminated, it must be reinitiated by rapid pacing orby the application of a high-energy sbock. In contrast, ithas been known for many years that spontaneous sus-tained AF is a common arrhythmia in the horse.-" Often,the animals are racing atbletes without any detiionstrablestructural heart disease. Administration of quinidine sul-fate is tbe treatment of choice for AF in these animals.-'Ouinidine-induced termination of AF and conversioninto sinus rbythm (SR) usually are preceded by gradualchanges in tbe mean RR interval. Pbarmacologic conver-sion of AF to SR can commonly be achieved in tbe horse,which makes it an excellent model in wbich to studychanges in atrial activity and ventricular response duringAF under relatively controlled experimental conditions.Thus, we took advantage of the availability of tbis modelto study the temporal organization of atrial and ventric-ular activity during AF and during quinidine-inducedchanges in AF behavior.
Our major objective was to tesi tbe applicability of thehypothesis tbat atrial activity during AF in the horse isdetermined by a bigh degree of underlying periodicity.As suggested by previous experiments in the isolatedsheep beart."'^ exceedingly high-frequency excitationby a localized periodic source in an atrium should resultin wavefront fractionation, whicb is manifest as thehighly complex and aperiodic atrial activity, apparent inthe suriace ECG. Similariy. combined fractionation atthe input of, and concealment within, the AV node{AVN) leads to "irregularly iuegular" activation of theventricles, witb complex beat-to-beat changes in tbe RRinterval.----^ On the basis of this hypothesis, we furthersurmise that quinidine-induced slowing of AF sources
leads to a reduction in wavefront fractionation. Thisresults in an increased apparent organization of the atria,as well as a reduced number of concealed impulseswithin the AVN.
Methods
Model of Spontaneous Sustained AF in the Horse
Eleven privately owned horses with a diagnosis of AFwere admitted to Cornell University and the Universityof Pennsylvania's Veterinary Medical Schools. The an-imals bad been performing in equestrian sports (racing,dressage, jumping) before onset of exercise ititolenince,
which is the estimated time of onset of sustained AF.Inclusion in the study was based on echocardiograpbic
and clinical evaluations. Entry criteria included absenceof structural heart disease and other underlying systemicconditions tbat tiiight predispose tbe horse to AF. Thehorses were admitted to tbe veterinary hospitals for con-version of AF to SR so they could return to their previoussports activity.
Study Protocol and Data Acquisition
ECG recordings were acquired in the 11 horses duringAF before initiation of drug administration (control) andafter quinidine administration. Quinidine sulfate 22mg/kg was administered orally every 2 hours until con-version to SR was achieved, according to a standardprotocol in veterinary practice.-' If conversion to SR isnot achieved within 24 hours of treatment, the drugprotocol must be stopped due to side effects of quinidine.Tberefore, to reduce heterogeneity in tbe patient popu-lation, animals tbat could not be medically converted toSR within the first 24 hours of drug administration werenot included in the study. Orthogonal (XYZ) continuousECG recordings were obtained using an ambulatoryHolter monitor (Del Mar. Irvine, CA, USA). AnalogHolter recordings were sampled at 128 Hz. displayed ona Del Mar® Avionics 563 computer system, and digitizedusing a custom-made transformation equation (MAT-LAB® 5.3. The MathWnrks Inc., Natick. MA. USA) fordata analysis on a personal cotnputer. Five hundred RRintervals obtained from 15-minute segments of continu-ous ECG were used. Analysis was carried out duringcontrol (C). at a point in time 50% between initiation ofquinidine administration and conversion to SR (T50) andthen again at a time 9O9f- after initiation of quinidineadministration, that is. HWc of time before conversion toSR (T90). Total time to conversion varied considerablybetween individual borscs.
In 3 of the 11 animals, intracardiac electrograms(EGs) were recorded in addition to the surface ECG.Two simultaneous bipolar rigbt atrial recordings wereobtained at two sites {Fig. I), using a quadripolar elec-trode catheter. The interelectrode spacing was I cm andinterbipole spacing was 3 cm. The unhltcred (0.05 to5,000 Hz) atrial EG and surface ECG were recorded at asampling frequency of 1.000 Hz to an electropbysiologicdata acquisition system (AcqKnowled^e'^?..53. BIOPACSystems, Inc.. Santa Barbara. CA, USA). Fifteen minutesof continuous data were acquired during control and thenat 2-hour intervals after quinidine administration. Be-tween two and five recordings were obtained under quin-idine, depending on the required time to conversion foreach individual horse.
Data Analysis
Frequency domain analysis
For characterization of AF in the frequency domain,power spectral analysis of the atrial electrical activity in

Gelzer et al. Temporal Organizatiun of Atrial Activity 775
a.oulu
time (sec)
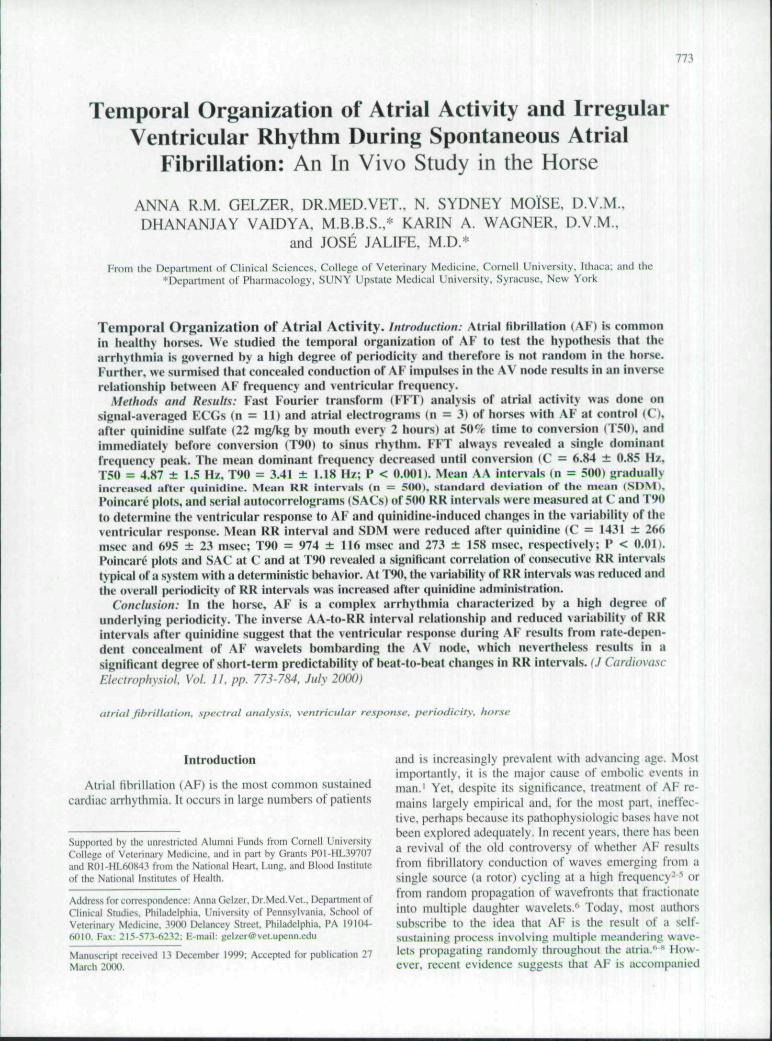
Figure I. ECC and airiat etectrogram (EG) recordinfi.s of alrial jihrittalion (AF) in the hone. The lop recording is the ECG from the Z-phme. EGI(distal) and EG2 (prox) are recorded from two bipak sites located 3 cm apart in the right atrium. Note the slow ventricular re.\ponse during AFin control condition.^. The atrial EG .'ihows a highly aperiodic-appearing activity with variable cycle length and amplitude. The intermittentlylow-amplitude signal in the pro.ximal EG recording is likely due to free floating of the electrode withht the atrial cavity. Note that the oscillationsin amplitude always follow a venlricular contraction (R wave on the ECG), which may result in catheter motion in the airia.
the surface ECG was performed using Fast Fourier trans-forms {FFTs). Ten diastolic windows of the Z-lead ECG{Fig. 2) were selected for analysis during control, at T5(),and at T90. Each window was free of QRST deflectionsof tbe preceding beat and terminated before tbe follow-ing QRS complex. Tbe selected duration of the windowat control was 2,(XX) msec (slow ventricular response)
and after quinidine adtninistration 5{X) or 1.0(X) msec{due to acceleration of tbe ventricular response). In anindividual horse, the same window duration was used forthe ten diastolic windows at each measuring period. Tbefrequency content in the 0.05- to 64-Hz band was ana-lyzed and peak frequencies {Hz) determined. Tbe tenresultant power spectra were signal averaged, and a mean
Surface ECG
U^wJlAJI^^
FFT FFT FFT
5.36 Hz
5,62 Hz 5.37 Hz 5.10 Hz
Frequency
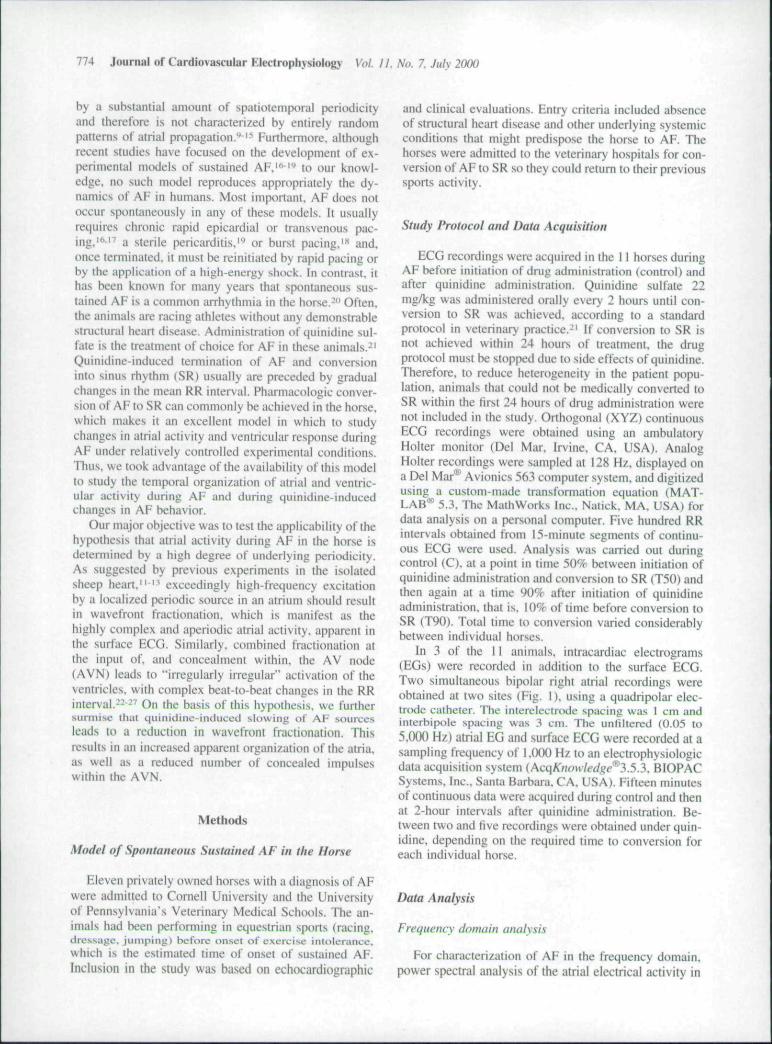
Figure 2. Experimenial setup of spectral signal averaf-ing of atrial fihrillation a.\ applied to three diastolic windows (box arrows) of atrial electricalactivity from the .surface ECG. Fast Fourier transforms (FFT) of each diastolic segment were signal averaged to achieve the resultant powerspectrum- (For demonstration purposes, three successive diastolic wittdows were selected, even though the window duration was variable. For dataanalysis, only winJows of equal duration were signal averaged.)
776 Journal of Cardiovascular FJectrophysiology Vol. 11, No. 7. July 2000
peak frequency of the atrial electrical activity wasobtained at C. T50, and T90. This method was de-scribed and validated by Rosenbaum and Cohen.-'*Mean ± standard deviation of tbe mean (SDM) atrialfrequency was obtained from 11 borses. The ECG wasacquired at 128 Hz. Analysis of tbe segments of 500-to 2,000-msec duration provided a spectral resolutionfrom 0.5 to 0.125 Hz, respectively, over a range from0.05 to 64 Hz.
The intracardiac atrial EG of three horses was ana-lyzed for frequency content using FFT at control and at2-hour intervals {Q2 to QIO) after qttinidine administra-tion. Tbe EG could be analyzed as a continuous signal{no frequency content of QRST complexes) and high-resolution frequency measures could be obtained of longperiods of AF at multiple consecutive time-points. Tbisprovided detailed characterization of tbe change in AFfrequency over time after quinidine administration inthree horses. At the same time, it allowed validation ofthe results obtained using FFT of tbe surface ECG by thesignal-averaged technique described eariier. The EGswere acquired at 1,000 Hz, and segtnents of 15 minutes"duration were analyzed. This provided a spectral resolu-tion of 0.0005 Hz over the range from 0.05 to 500 Hz. Inthe EG, the frequency content in the 0.05- to 64-Hz bandwas analyzed and peak frequencies were determined.The magnitude of the frequency peaks was not compaiedfrom one FFT to another, but the relative amplitudes ofpeaks in each FFT were compared to determine thedominant peak.
Titne domain analysis
We used a computerized peak-detecting algorithm(AcqKnowledge 3.5.3) to measure 500 successive RRintervals from the ECG. Mean RR interval witb SDM of500 RR intervals were calculated in I I horses at C atid atT9(). SD was calculated as an estimate of the degree oforganization and variability of the ventricular responseduring AF at C. compared to T90. In the three animalsfrom whicb atrial EGs were acquired, 500 RR intervalswere measured from the ECG at C and then at 2-hourintervals after quinidine administration CQ2, Q4. Q6, Q8,and QIO).
AF cycle lengtb (AA interval) was measured fromthe right atrial EG in three horses. Five hundred AAintervals were tiieasurcd at C and then at 2-hour in-tervals {Q2, Q4. Q6, Q8, and QIO) to characterize the
change in AA cycle lengtb over time after quinidineadministration. AA intervals were measured using thesame peak-detecting algoritbtn. Mean AA interval ±SDM of 5{)0 AA intervals were calculated in tbreehorses at C and at Q2 through QIO. We aimed tocharacterize the global relationship between AA andRR intervals during AF. Because it requires approxi-mately 15 minutes of ECG recordings to obtain 5{)0RR intervals, our objective was to obtain 500 AAintervals representative of tbe entire 15-minute period.Therefore, we measured five sets of 100 consecutiveAA intervals derived from the 15-minute segment.This allowed us to relate the mean of 500 AA intervalsto the corresponding mean of 500 RR intervals.
Poincare plots of ventricular responses to impulses ofsupraventricular origin have been used to study AVNbehavior.-''-" Tbe Poincare plot is a standard techniquefor analysis of nonlinear dynamic systems sucb as car-diac impulse propagation. This analysis allows one todemonstrate detertninistic behavior, whicb, in contrast torandom behavior, means that tbe present state of a sys-tem is determined by its previous states.'•* We usedPoincare plots to determine whether the apparently ape-riodic behavior of RR intervals during AF also is notrandom. In a Poincare plot, eacb RR interval (n) isplotted as a function of the subsequent RR interval(n+ I). The appearance of a distinct shape or pattern ontbe plot {an attractor) demonstrates a correlation betweensubsequent RR intervals. Tbe scatter of tbe Poincare plotprovides a visual and quantitative measure of tbe beat-to-beat and overall variability of tbe ventricular re-sponse."' The lower envelope of the scatter representsthe AVN functional refractory period (FRP: minimal RRinterval duration).-'* Poincare plots of 5{)0 consecutiveRR intervals were constructed at control and at T9{) in 1 1horses.
To provide a statistical measure of the ventricufarresponse to AF, we u.sed serial autocorrelograms(SACs). SACs were constructed at control and T90 in11 borses. SAC are calculated as described earli-er.23.37..?2 In a series of N (in this case 5{)0) RR inter-vals, the tirst N intervals are correlated with them-selves to obtain tbe correlation coefficient R,, tben theseries of tbe tirst N - 1 intervals are correlated with theseries of immediately succeeding intervals to obtainthe coefficient R , and so forth. Tbe SAC is the seriesof these coefficients R|, calculated as a product-mo-ment correlation and obtained using Equation 1:
N+l-i
j=\, - E
(1)
+ I - iW 1 iRRj.i - + 1 - i

Gelzer et ul. Temporal Organization of Atrial Activity 777
Al
T50 B1
TOO CI
6.5 Hz A2
4.5 HzB2
3.1 Hz C2
Time (sec)10 20 30
Frequency (Hz)40
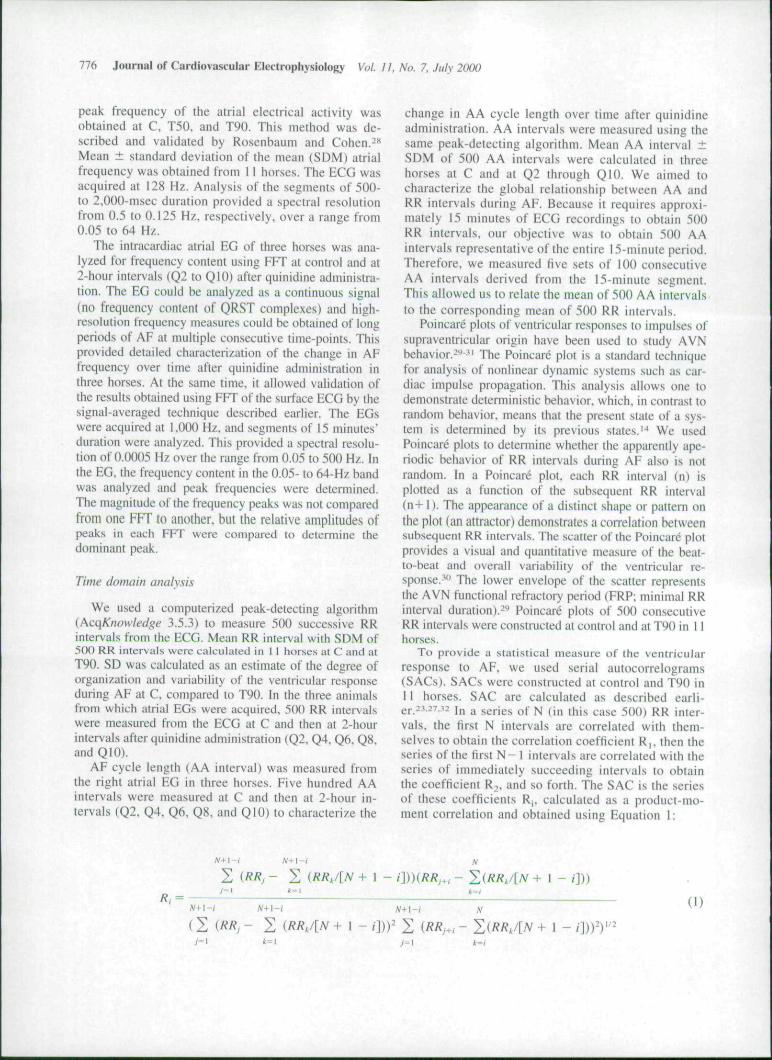
Figure 3. Representative example of ECGs with corresfwnding power spectra of one horsv al control [A I. A2), at T50(Bl. B2\. andT90(CI. C2).The .signal-averaged power specira of the diastolic inier\als of the ECG show a spectrum with a single dominant peak ai control IA2). T50 (B2),and T9O{C2)- Quinidine administration resulted in reduction of the dominant atrial frequency from 6.5 Hz during control to 4.5 Hz after quinidineadministration and J.I Hz immediaiely before conversion to .unus rhythm.
wtiere N represents the tnia! nurnber of RR intervals inthe series, and RR|, RR,, and RR, represent tbe /tb,;th,and Ath RR interval in the series, respectively. We de-termined the correlation of every RR interval to theimmediately succeeding RR interval by calculating tbe tvalue with N - 3 degrees of freedom for Rj, as given inEquation 2:
(2)
Statistical unalvses
Tbe signed rank test for nonparametric data was usedfor statistical analysis. Multiple pairwise comparisonswere performed, and P < 0.05 was considered statisti-cally signiticani. For the SACs, a hypothesis for negativecorrelation of R, was tested using a one-tailed f-test, witba P < 0.05 level criterion. Tbe proportion of RR intervalseries having a negative R2 before and after quinidineadministration were compared using tbe two-tailed exacttest for paired comparison of proportions. Results wereconsidered signiticant if P < 0.05.
Results
In 11 horses, the mean total administered dose ofquinidine sulfate at conversion of AF to SR was 33.2 ±17.9 g (range 10 to 65). The average time for conversionfrom the onset of quinidine administration was 7.95 ±4.82 hours {range 3.2 to 17.9).
Dominant AF Frequency in the Horse
FFT of signal-averaged ECGs and atrial EGs enabledus to study AF in the frequency domain. As illustrated inFigure 2, tbe signal-averaged power spectra of the ven-lricular diastolic inter\als of tbe HCG were all narrowbanded, with a characteristic dominant (i.e., Uu-gest)peak, in this case at 5.36 Hz. In all 11 horses, both tineand coarse AF yielded reproducible power spectra witheasily identifiable dominant peaks. In the absence ofquinidine {control), tbe mean dominant frequency, mea-sured in each horse over a 15-minute interval, was6.84 ± 0.85 Hz {range 5,76 to 8.51), Power spectralanalysis of tbe frequency content of the atrial EG re-vealed a similar pattern. In the three horses from whichatrial EGs were recorded, the mean AF frequency atcontrol obtained from analysis ot a 15-minute .segment ofatrial EGs was 6.5 ± 0.9 Hz {range 5,6 to 7.4).
Effects of Quinidine on AF
Signal-averaged ECGs
FFT analysis of sequential signal-averaged ECGsdemonstrated a gradual decrease in the dominant atrialfrequency in all borses after quinidine administration.Representative examples during control and at T50 andT90 are shown in Figure 3. Under control conditions(panel AD, the ECG demonstrated a highly complexpattern of atrial activation characteristic of Hne AF. Ven-tricular activation also was highly aperiodic, with vari-able RR intervals (Figs. 1 and 2) and long diastolic
778 Journal of Cardiovascular Electrophysiologj Vol. II, No. 7. July 2000
control Al
T50
T90CI
77 HzA2
3.8 Hz
2.6 Hz C2
1 2Time (sec)
10 20 30FrequetKy (Hz)
40
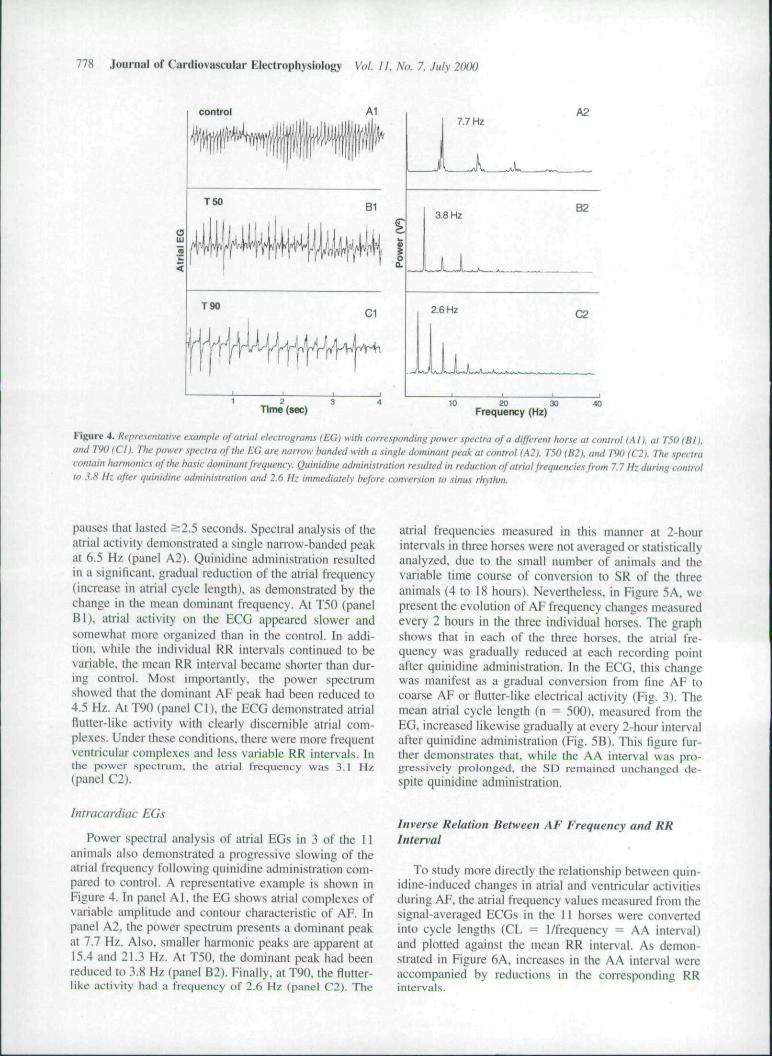
Figure 4. Representative example of atrial electrograms (EG) with corresponding power specira of a differenl horse at control (Al). al T5() (BI).und 'T90{CH The power .tpecira of the EG are narrow banded with a sitigte dominant peak al control (A2). T50(B2). and T90 (C2). The spectracontain harmonics of the basic dominant frequency. Quinidine administration resulted in reduction of atrial frequencies from 7.7 Hz during controlto 3.8 Hz after quinidine administration and 2.6 Hz immediately hefore conversion to sinus rh\thm.
pauses that lasted >2.5 seconds. Spectral analysis of theatriai activity demonstrated a single narrow-banded peakat 6.5 Hz (panel A2). Quinidine administration resultedin a significant, gradual reduction of the atrial frequency{increase in atrial cycle length), as demonstrated by thecbange in tbe mean dominant frequency. At T50 {panelBI), atrial activity on tbe ECG appeared slower andsomewhat more organized than in tbe control. In addi-tion, while the individual RR intervals continued to bevariable, the mean RR interval became shorter than dur-ing control. Most importantly, tbe power spectrumshowed tbat the dominant AF peak bad been reduced to4.5 Hz. At T90 (panel CI), the ECG demonstrated atrialflutter-like activity with clearly discernible atrial com-plexes. Under these conditions, tbere were more frequentventricular complexes and less variable RR intervals. InIhe power spectrurn, the atrial frequency was 3.1 Hz(panel C2).
Intracardiac EGs
Power spectral analysis of atrial EGs in 3 of the 11animals also demonstrated a progressive stowing of theatrial frequency following quinidine administration com-pared to control. A representative example is sbown inFigure 4. In panel Al, the EG shows atrial complexes ofvariable amplitude and contour chatacteristic of AF. Inpanel A2, the power spectrum presents a dominant peakat 7.7 Hz. Also, smaller harmonic peaks are apparent at15.4 and 21.3 Hz. At T50. the dominant peak had beenreduced to 3.8 Hz {panel B2). Finally, at T9{), the flutter-like activity had a frequency of 2.6 Hz (panel C2). The
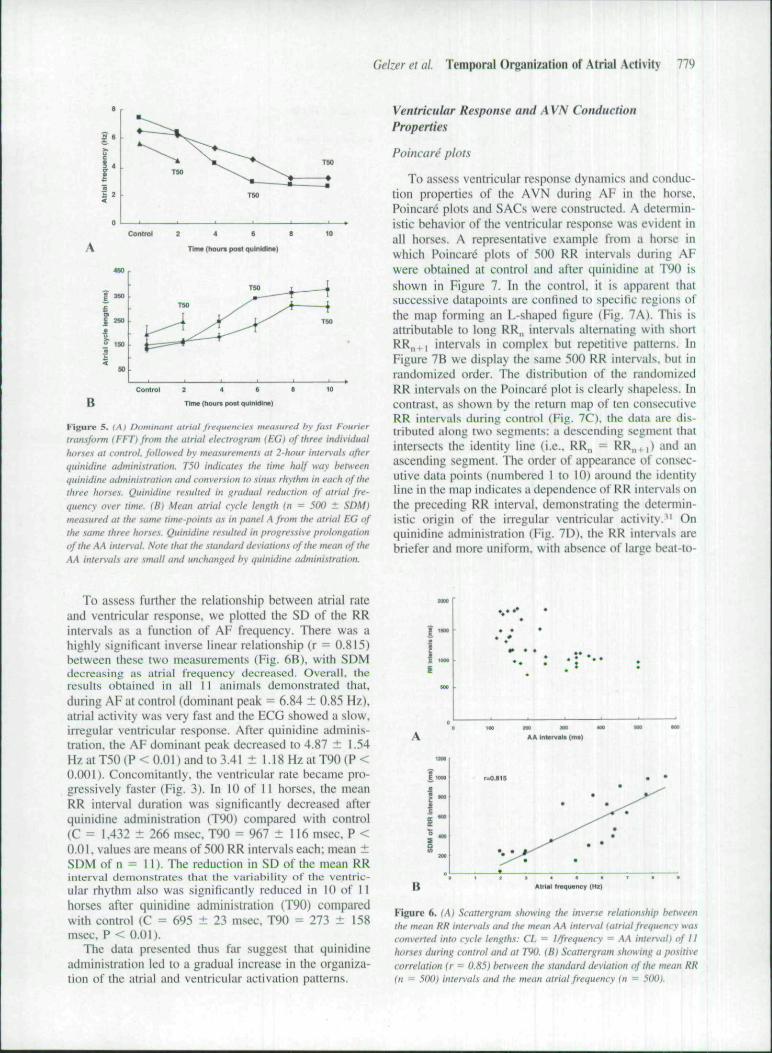
atrial frequencies measured in tbis manner at 2-bourintervals in tbree borses were not averaged or statisticallyanalyzed, due to the small number of animals and tbevariable time course of conversion to SR of tbe tbreeanimals (4 to 18 hours). Nevertheless, in Figure 5A, wepresent the evolution of AF frequency changes measuredevei-y 2 hours in the tbree individual horses. The graphshows that in each of tbe three horse.s, the atrial fre-quency was gradually reduced at each recording pointafter quinidine administration. In the ECG, this cbangewas manifest as a gradual conversion from fine AF tocoarse AF or flutter-like electrical activity (Fig. 3). Tbemean atrial cycle length {n = 500), measured from tbeEG, increased likewise gradually at every 2-bnur intervalafter quinidine administration (Fig. 5B). Tbis figure fur-ther demonstrates that, while the AA interval was pro-gressively prolonged, the SD remained unchanged de-Spite quinidine administration.
Inverse Relation Between AF Frequency and RRInterval
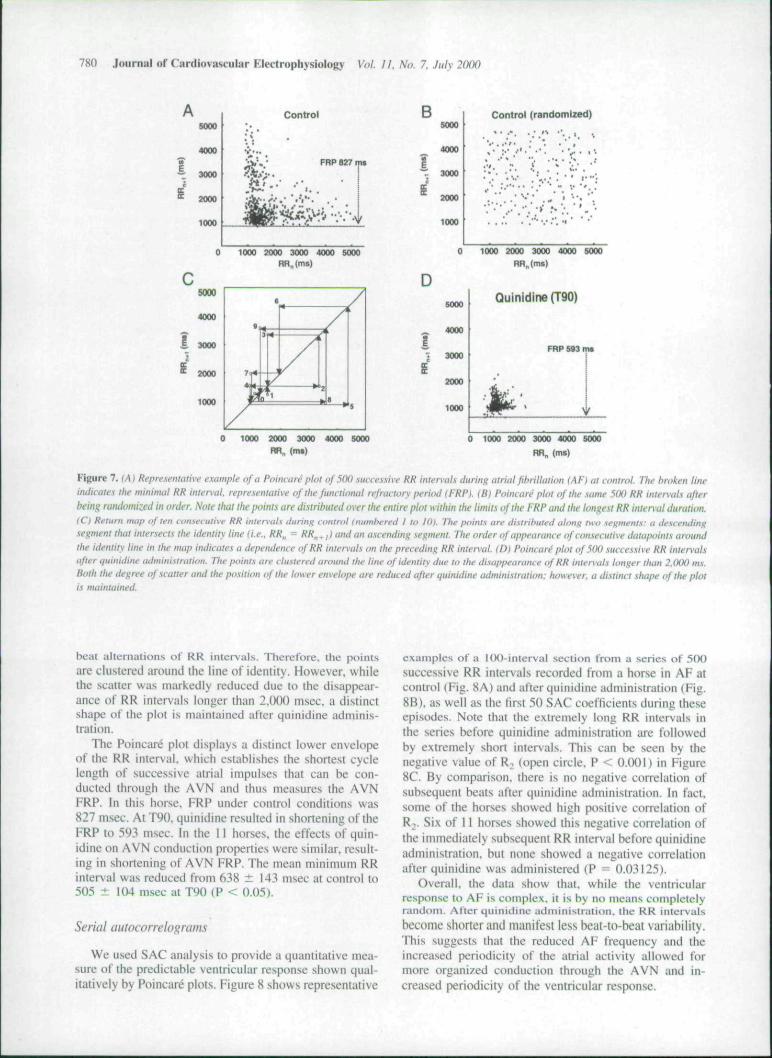
To study more directly the relationship between quin-idine-induced cbanges in atrial and ventricular activitiesduring AF, the atrial frequency values measured from thesignal-averaged ECGs in tbe 11 borses were convertedinto cycle lengths (CL = 1/frequency = AA interval)and plotted against the mean RR interval. As demon-strated in Figure 6A. increases in the AA interval wereaccompanied by reductions in the corresponding RRintervats.
Gelzer el ul. Temporal Organization of Atrial Aclivity 779
I' TBQ
2 4 6 B
Time (hours poat quin Mint)
Be
TInw (noun post quinldlna)
Figure 5. (At Oi'miniini atriat frequencies meu.'.ured hy fii.ti t-'iiurii-r
transform (FET)from the atrial electrogram (EG) of three individualhorses at control, followed hy measurements at 2-hour intervals afterquinidine administration. TSO indicate.^ the time half way betweenquinidine administration and conversion to sinus rhythm in each of thethree horses. Quinidine resulted in gradual reduction of alrial fre-quency over time. (B) Mean alrial cycle length (n = 500 ± SDM)meastired at the same time-points as in panel A from the atrial EG ofthe satne three horses. Quinidine resulted in progressive prolongationof the AA internal. Note thai the standard deviations of the mean of theAA intervals are small and unchanged by quinidine administration.
Ventricular Response and A VN ConductionProperties
Poincare plots
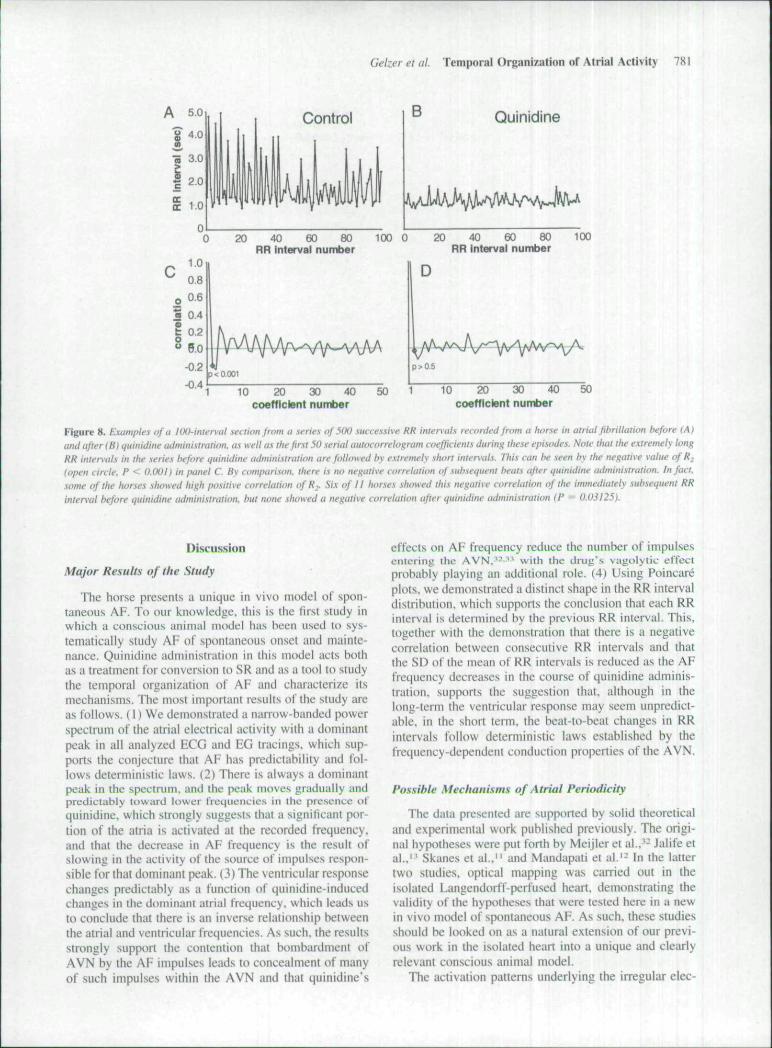
To assess ventricular response dynamics and conduc-tion properties of tbe AVN during AF in the horse,Poincare plots and SACs were constructed. A detertnin-istic behavior of the ventricular response was evident inall horses. A representative example from a horse inwbicb Poincare plots of 5{K) RR intervals during AFwere obtained at control and after quinidine at T90 isshown in Figure 7. In the control, it is apparent thatsuccessive datapoints are contined to specitic regions oftbe map forming an L-shaped figure (Fig. 7A). Tbis isattributable to long RR,, intervals alternating with shortRRn+i intervals in complex but repetitive pattetns. InFigure 7B we display the same 5(X) RR intervals, but inrandomized order. Tbe distribution of the randomizedRR intervals on the Poincare plot is clearly shapeless. Incontrast, as shown by the return map of ten consecutiveRR intervals during control (Fig. 7C), the data are dis-tributed along two segments: a descending segment tbatintersects the identity line (i.e., RR,, = RR,,, |) and anascending segment. The order of appearance of consec-utive data points (numbered 1 to 10) around the identityline in the map indicates a dependence of RR intervals onthe preceding RR interval, demonstrating the determin-istic origin of the irregular ventricular activity." Onquinidine adtninistration (Fig. 7D), tbe RR intervals arebriefer and more uniform, with absence of large beat-to-
To assess furtber tbe relationship between atrial rateand ventricular response, we plotted the SD of the RRintervals as a function of AF frequency. There was ahighly significant inverse linear relationship (r = 0.815)between these two measurements (Fig. 6B), with SDMdecreasing as atrial frequency decreased. Overall, theresults obtained in all 11 animals demonstrated that,during AF at control {dominant peak = 6.84 ± 0,85 Hz),atrial activity was very fast and the ECG showed a slow,irregular ventricular response. After quinidine adminis-tration, tbe AF dotninant peak decreased to 4.87 ± 1.54HzatT50{P<O.OI)andto3.41 ± 1.18 Hz at T90{P <0.001). Concomitantly, the ventricular rate became pro-gressively faster {Fig. 3). In 10 of 11 horses, tbe meanRR interval duration was significantly decreased afterquinidine administration (T90) compared with control{C = 1,432 ± 266 msec, T90 = 967 ± 116 msec, P <0.01, values are means of 500 RR intervals each; mean ±SDM of n = II). Tbe reduction in SD of the mean RRinterval demonstrates that the variability of the ventric-ular rhythm also was significantly reduced in 10 df 11horses after quinidine administration (T90) comparedwitb control (C = 695 ± 23 msec, T90 = 273 ± 158msec, P < 0.01).
Tbe data presented tbus far suggest tbat quinidineadministration led to a gradual increase in the organiza-tion of the atrial and ventricular activation patterns.
B Atriai freqiwney (Hz)
Figure 6. (A) Scattergram showing the inverse relationship betweenthe mean RR internals and the mean AA inten>al {atrial frequency wasconverted into cycle lengths: CI. = I/frequency = AA intfr\al} of IIhorses during control and at TW. (B) Scattergram .shnwinf; a positivecorrelation (r = 0.85) between the .standard deviation of the mean RR(n = 500} intervals and the mean atrial frequency (n ~ 500).
780 Journal of Cardiovascular Electrophysiology Vol. II. No. 7. July 2000
sooo
4000
~ 3000
2000
1000
Control
i>^ • FRP 827 ms
BSOOO
4000
3000
2000
1000
Control (randomized)
. _ " ; • . • : . ' ; • • ' • . . ' . ^
1000 2000 3000 4000 5000 0 10O0 2000 3000 4000 5000
5000
4000
1. 3000
* 2000
1000
s
/
1
/
B
/1
/ — '" s
Dsooo
^ 4000II 3000
2000
1000
Quinidine (T90)
FRP 593 ms
0 1000 2000 3000 4000 SOOO 0 1000 2000 3000 4000 SOOO
Figure 7, (A) Representative example of a Poincar^ plot of 5<H) .successive RR intervats during atrial fibrillation (AF) al control. The broken lineindicates the mitiimal RR inter\-al. represeniative of the functional refractory period (FRP). (B) Poituar,' phi of the same 5(K) RR intervals afterheinfi nmdotnized in order. Note that the points are distributed over the entire plot within the titiitts of the FRP and the hmgest RR ituenat duration.(Cl Return map of ten const-rutive RR inlenal.s during control (numbered I lo 10). 7 he point.s are distributed tilonf; twti segments: a dest endingsegment thai intersects the identity line (i.e.. RR,, = RR,,.,) and an ascending segment. The order of appearance of con.secutive datapoints aroundthe idetitiiy title in the map itidicates a depeiulence of RR intervals on the preceding RR ititerval. (D) Poiticare plot of 500 successive RR intervatsafter quinidine admini.st ration. The points are clu.stered around the line of identity due to the disappearance of RR inten-ah longer than 2.(KX) ms.Both the degree of .scatter and ihe position of the lower envelope are reduced after qttinidine administration: however, a distinct .shape of the plotis mainiaitied.
t>eat alternations of RR intervals. Therefore, the pt)intsare clustered around tbe line of identity. However, whiletbe scatter wa.s markedly reduced due to tbe disappear-ance of RR Intervals longer than 2.{){)() msec, a distinctshape ot' the plot is tiiaintained alter quinidine adminis-tration.
The Poincare plot displays a distinct lower envelopeof the RR interval, which establishes the shortest cyclelengtb of successive atriai impulses that can be con-ducted tbrougb the AVN and thus measures tbe AVNFRP. In this borse, FRP under control conditions was827 msec. At T9{). quinidine resulted in shortening of theFRP to 593 msec. In the I! horses, the effects of quin-idine on AVN conduction properties were similar, result-ing in shortening of AVN FRP. The mean minimum RRinterval was reduced frotn 638 :!: 143 msec at control to505 ± 104 msec at T90 (P < 0.05).
Serial autocorrelograms
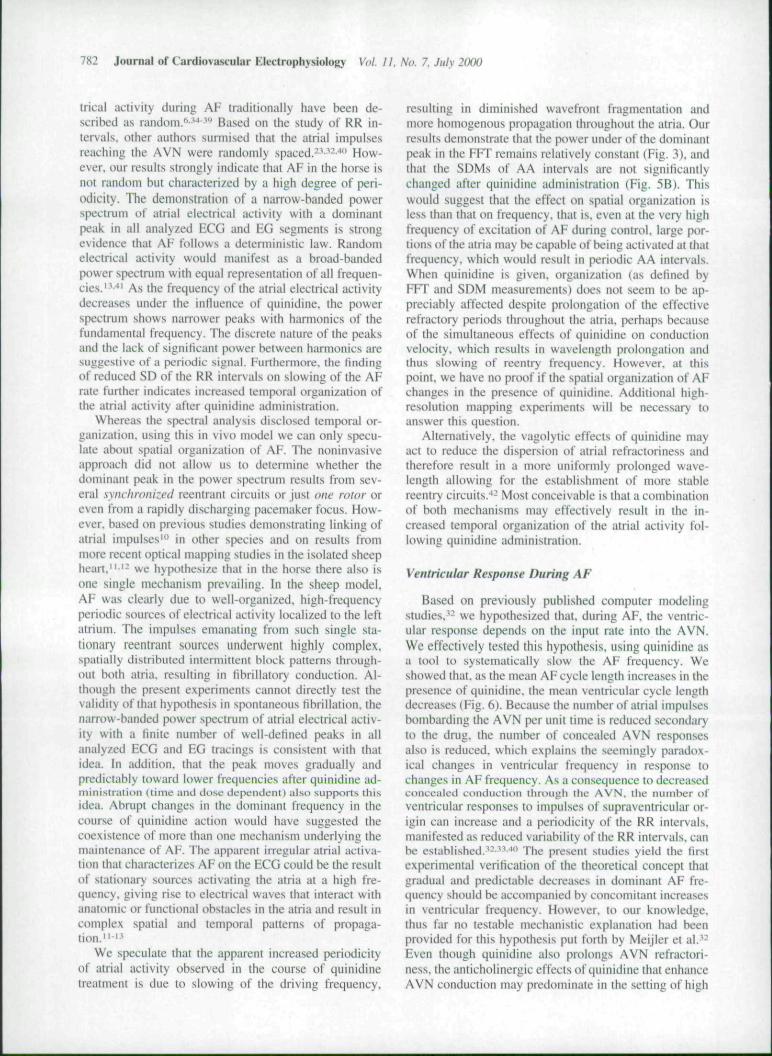
We used SAC analysis to provide a quantitative mea-sure of the predictable ventricular rcsptmse shown qual-itatively by Poincare plots. Figure 8 shows representative
examples of a tOO-interval section from a series of 500successive RR intervals recorded from a horse in AF atcontrol (Fig. 8A) and after quinidine adtninistration (Fig.8B). as well as the first 50 SAC coefficients during tbeseepisodes. Note that tbe extrettiely long RR intervals intbe series before quinidine administration are followedby extremely short intervats. This can be seen by thenegative value nf R (open circle, P < O.(X)1) in Figure8C. By comparison, tbere is no negative correlation ofsubsequent beats after quinidine administration. In fact,sotne of the horses shuwed bigh positive correlation ofRi- Six of 11 horses showed tbis negative correlation ofthe immediately subsequent RR interval before quinidineadministration, but none showed a negative correlationafter quinidine was adtninistered (P = 0.03125).
Overall, the data show tbat, while the ventricularresptinse to AF is complex. i( is by no means completelyratiddtn. Alter quinidine administration, the RK intervalsbecome shorter and manifest less beat-to-beal variability.Tbis suggests that the reduced AF frequency and tfieincreased periodicity of the atria! activity allowed formore organized conduction tbrougb the AVN and in-creased periodicity of tbe ventricular response.
Gelzer et al. Temporal Organization of Atrial Activity 781
Quinidine
20 40 60 80RR Interval number
-0.410 20 30 40
coefficient number50 10 20 30 40
coefficient number
Figure 8. Examples of a IOOinter\-al section from a series of 500 successive RR intenals recorded from a horse in airial fihrillation hefore (A>and after (B) quinidine administration, as well as the first 50 serial outfHorrelogram coefficients during these episodes. Note that the e.\tremely longRR intervals in the series hefore quinidine adniinistratiim are followed by extremely short inter\aLs. This can be seen hy the negative value of R^(open circle. P < 0.001) in panel C By comparison, there is tu> negative correlation vf .subsequent beats after qtiinidine administration. In fact,some of the horses showed high positive correlation of R.. Six of 11 lionses .showed f/ji.v negative correlation of lite immediately subsequent RRinterval hefore quinidine adtninistration. but none showed a negative correlation after quinidine administraiion (P = 0.03125).
Discussion
Major Results of the Study
The horse presents a unique in vivo model ol' spon-taneous AF. To our knowledge, this is the first sludy inwhich a ct)n,scious uninial model has been used U) sys-tematically study AF of spontaneous onset and mainte-nance. Quinidine administration in this model acts bothas a treatment lor conversion to SR and as a tool to studythe temporal organization of AF and characterize itsmechanisms. The most important results of the study areas follows. (1) We demonstrated a narrow-banded powerspectrum of the atria! electrical activity with a dominantpeak in all analyzed ECG and EG tracings, which sup-ports the conjecture that AF has predictability and fol-lows deterministic laws. {2) There is always a dominantpeak in the spectrum, and the peak moves gradually andpredictably toward lower frequencies in the presence ofquinidine. which strongly suggests that a significant por-tion of the atria is activated at the recorded frequency,and that the decrea.se in AF frequency is the result ofslowing in ihe activity of the source of impulses respon-sible for that dominant peak. (3) The ventricular responsechanges predictably as a function of quinidine-inducedchanges in the dominant atrial frequency, which leads usto conclude that there is an inverse relationship betweenthe atrial and ventricular frequencies. As such, the resultsstrongly support the contention that bombardment ofAVN by the AF impulses leads to concealment of manyof such impulses within the AVN and that quinidine's
effects on AF frequency reduce the number of impulsesentering the AVN.^-" with the drug's vagolytic effectprobably playing an additional role. (4) Using Poincareplots, we demonstrated a distinct shape in the RR intervaldistribution, which supports the conclusion that each RRinterval is detcniiined by the previous RR interval. This,together with the demonstration that there is a negativecorrelation between consecutive RR intervals and thatthe SD of the mean of RR intervals is reduced as the AFtrequency decreases in the course of quinidine adminis-tration, supports the suggestion that, although in thelong-term the ventricular response may seem unpredict-able, in the short term, the beat-to-beat changes in RRintervals Ibllow deterministic laws established by thefrequency-dependent conduction properties of the AVN.
Possible Mechanisms of Atriai Periodicity
The data presented are supported by solid theoreticaland e.xperimental work published previously. The origi-nal hyptitheses were put forth by Meijler et al.,'- Jalife etal.,'* Skanes et al.." and Mandapati et al.'- In the lattertwo studies, optical mapping was carried out in theisolated Lani<endt)rff-perfused heart, demonstrating thevalidity of the hypotheses that were tested here in a newin vivo model of sptintaneous AF. As such, these studiesshould be looked on as a natural extension of our previ-ous work in the isolated heart into a unique and clearlyrelevant conscious animal model.
The activation patterns underlying the irregular elec-
782 Journal of Cardiova.<>cular KlvLtrophysiolog> Vol. 11. No. 7, Jtily 2000
trical activity during AF traditionally have been de-scribed as random. - -* ''* Based on the study of RR in-tervals, other authors surmised that the atrial impulsesreaching the AVN were randt)mly spaced.-^-'^-"' How-ever, our results strongly indicate that AF in the horse isnot random but characterized by a high degree of peri-odicity. The demonstration of a narrow-banded powerspectrum of atrial electrical activity with a dominantpeak in all analyzed ECG and EG segments is strongevidence that AF follows a deterministic law. Randomelectrical activity would manifest as a broad-bandedpower spectrum with equal representation of all frequen-cies.'^"" As the frequency of the atrial electrical activitydecreases under the influence of quinidine. the powerspectrum shows narrower peaks with harmonics of thefundamental frequency. The discrete nature of the peaksand the lack of signiticant power between harmonics aresuggestive of a periodic signal. Furthermore, the findingof reduced SD of the RR inter\ais on slowing of the AFrate further indicates increased temporal organization ofIhe atrial activity after quinidine administration.
Whereas the spectral analysis disclosed temporal or-ganization, using this in vivo mode! we can only specu-late about spatial organization of AF. The noninvasiveapproach did not allow us to determine whether thedominant peak in the power spectrum results from sev-eral synchronized reentrant circuits or just ime rotor oroven from a rapidly discharging pacemaker focus. How-ever, based on previous studies demonstrating linking ofatrial impulses'" in other species and on results frommore recent optical mapping studies in the isolated sheepheart," '- we hypothesize that in the horse there also isone single mechanism prevailing. In the sheep model.AF was clearly due to well-organized, high-frequencyperiodic sources of electrical activity localized to the leftatrium. The impulses emanating from such single sta-tionary reentrant sources underwent highly complex,spatially distributed intermiitent block patterns through-out both atria, resulting in tibrillatory conduction. Al-though the present experiments cannt)t directly test thevalidity of that hypothesis in spontaneous fibrillation, thenarrow-banded power spectrum of atrial electrical activ-ity with a finite number of well-defined peaks in allanalyzed HCG and EG tracings is consistent with thatidea. In addition, that the peak moves gradually andpredictably toward lower frequencies after quinidine ad-ministraiion (time and dose dcpendcnU also supports thisidea. Abrupt changes in the dominant frequency in thecourse of quinidine action would have suggested thecoexistence of more than one mechanism underlying themaintenance of AF. The apparent irregular atrial activa-tion that characterizes AF on the ECG could be the resultof stationary sources activating the atria at a high fre-quency, giving rise to electrical waves that interact withanatomic or functional obstacles in the atria and result incomplex spatial and temporal patterns of propaga-lion."'-'
We speculate that the apparent increased periodicityof attial activity observed in the course of quinidineireatment is due to slowing of the driving frequency.
resulting in diminished wavefront fragmentation andmore homogenous propagation throughotit the atria. Ourresults demonstrate that the power under of the dominantpeak in the FFT remains relatively constant (Fig. 3), andthat the SDMs of AA intervals are not significantlychanged after quinidine administration (Fig. .SB). Thiswould suggest that the effect on spatial organization isless than that on frequency, that is. even at the very highfrequency of excitation of AF during control, large por-tions of the atria may be capable of being activated at thatfrequency, which would result in periodic AA intervals.When quinidine is given, organization (as defined byFFT and SDM measurements) does not seem to be ap-preciably affected despite prolongation of the effectiverefractory periods throughout the atria, perhaps becauseof the simultaneous effects of quinidine on conductionvelocity, which results in wavelength prolongation andthus slowing of reentry frequency. However, al thispoint, we have no proof if the spatial organization of AFchanges in the presence of quinidine. Additional high-resolution mapping experimenis wilt be necessary toanswer this question.
Alternatively, the vagolytic effects of quinidine mayact to reduce the dispersion of atrial refractoriness andtherefore result in a more uniformly prolonged wave-length allowing for the establishment of more stablereentry circuits.-*- Most conceivable is that a combinationof both mechanisms may effectively result in the in-creased temporal organization of the atrial activity fol-lowing quinidine administration.
Ventricular Response During AF
Based on previously published computer modelingstudies,'- we hypothesized that, during AF. the ventric-ular response depends on the input rate into the AVN.We effectively tested this hypothesis, using quinidine asa tool to systematically slow the AF frequency. Weshowed that, as the mean AF cycle length increases in thepresence of quinidine. the mean ventricular cycle lengthdecreases (Fig. 6). Because the number of atrial impulsesbombarding the AVN per unit time is reduced .secondaryto the drug, the nutnber of concealed AVN responsesalso is reduced, which explains the seemingly paradox-ical changes in ventricular frequency in response tochanges in AF frequency. As a consequence to decreasedconcealed conduction ihrough the AVN, the number ofventricular responses to impulses of supraventricular or-igin can increase and a periodicity of the RR intervals,manifested as reduced variability of the RR intervals, canbe established.^-•'^^" The present studies yield the firstexperimental verification of the theoretical concept thatgradual and predictable decreases in dominant AF fre-quency should be accompanied by concomitant Increasesin ventricular frequency. However, to our knowledge,thus far no testable mechanistic explanation had beenprovided for this hypothesis put forth by Meijler et al.'^Even though quinidine also prolongs AVN refractori-ness, the antichoiinergic effects of quinidine that enhanceAVN conduction may predominate in the setting of high
Gelzer et al. Temporal Organiii^tion of Atrial AcUvity 783
vagal tone'*- typically present in the horse.- ^ Togetherwith the reduction of concealment of AVN impulses,these antichoiinergic effects may contribute to more or-ganized propagation into the ventricles.
The shortest RR interval during AF represents theAVN FRP with no or minimal concealment; the longestRR reflects maximal concealment.-'' Prolongation of theatrial cycle length after quinidine administration is ex-pected to result in lengthening of the FRP due to theknown rate dependency of AVN refractoriness,^ Fur-thermore, the direct effects of quinidine on AVN cellsproduce prolongation of FRP. However, in the horse wefound significant shortening of AVN FRP after quinidineadministration. This is probably a consequence of thevagolytic effects of quinidine.-*-^ The degree of scatterabove the lower envelope in a Poincare plot indicates thebeat-to-beat variability o\' RR intervals and may be amarker of the degt ee of concealed AV conduction.^" In ourstudies, quinidine-induced slowing of the aUial cycle lengthresulted in a decrease of the scatter of RR intervals. Thisprovided further indirect evidence that the major effect ofquinidine on the ventricuhir response behavior during AFcan be attributed to a reduction of the number of atrialimpulses that are concealed at the AVN.
Study Limitations
Spontaneous AF in the horse represents an invaluablemodel in which to study the dynamics and mechanismsof this complex urrhythtnia. However, both ethical andfinancial constraints severely limited our ability to carryout a more invasive study in these horses. From a meth-odologic standpoint, it would be preferable to analyzeonly atrial EGs rather than surface ECGs for frequencycontent. Unfortunately, the subjects in the present studywere privately owned horses that could be investigatedonly based on the "good will" of their owners. Therefore,it was impossible to obtain atrial EGs in all animals,because there was no medical indication for right atrialcatheterization. We refrained from using spectral analy-sis methods that require cutting or filtering out the QRSTcomplexes from the surface ECG. Even though it wouldbe preferable to have long sequences of uninterruptedatrial electrical activity for analysis, removal of theQRST complex from the ECG signal in itself mightinduce erroneous changes in the frequency content of theremaining electrical signal. However, we took advantageof the fact that the heart rate in the horse is very slow,which allowed adequate ECG spectral analysis of onlythe diastolic intervals. Furthermore, because it is an invivo model, it was not possible to obtain data that couldhelp determine if the detailed mechanisni of AF in thehorse is based on a single or multiple rotors, or toevaluate the spatial organization of AF.
References
1. Cabin HS. Ciubb KS. Hull C, Pcrlmutter RA. Feinstein AR: Riskof systemic emb<Mi/.ation of atrial fibrillation without mitral steno-sis. Am J Cardiol 1990:61:714-717.
2. Lewis T: The nature ot clinical librillation of the auricles In: TheMechanistns and Graphic Registration of the Heart Beat. ThirdEdition. Shaw & Sons. London, 1 2. . pp, 319-374.
3. Carrey W: The nature of librillatory contraciion of the hean. Itsrelation lo tissue mass and form. Am J Pliysiol IV14;33:.W7-4I4.
4. Schuessler RB, Kawamoto T. Hand DE. Milsuno M. Bromberg BI,Cox JL. Boineau JP: Simtillaneous epicardial and endtK'ardialactivation sequence mapping in the isolated canine right atrium.Circulation 1993:95:511-S21.
5. Ortiz J. Ntrwano S, Harxihiko A. Rudy Y. Johnson NJ, Waldo AL:Mapping the conversion of atrial flutter to alrial fibrillation andatriai fibrillation to atrial flutter: Insights into mechanisms. CircRes 1994:7:882-894.
6. Moe GK. Rheinboidl WC. Abildskov JA: A computer mtxlel ofatrial fibrillation. Am Heart J I964:67:2()()-22O.
7. Kirchhof C. Chorro F. Scheffer GJ. Brugada J. Konings K.Zetelaki Z. Allessie M: Regional entrainmeni of atrial tibrillationstudied by high-resolution mapping in open-chest dogs. Circula-tion 1993:2:736-749.
8. Allessie MA. Lammers WJEP. Bonke RM, Hollen J: Experimen-tal evaluation of Moe's wavelet hypothesis of* atrial fibrillation. InZipes DP. Jalife J. eds: Cardiac Electrophysiology and Arrhyth-mias. Grune and Stratton, Orlando. 1985. pp. 2(iS-275.
9. Botteron GW. Smith JM: Quantitative assessment of spatial orga-nization of atriai fibrillation in the intact human heart. Circulation
Acknowtecigments: The iiiilhiirs wish lo th;ink Drs. Virginia Reef.Virginia Reimers, Dtirothy Ainswonh. and Gillian Perkins for ttieirhelp in providing Holier recordings and management of the quinidineproUKol of the horses treated for AF at their institutions. We thankShari Renaud-Farrel for her skilled technical a.ssis(ance.
to. Schoenwald AT. Sahakian AV, Sih HJ, Swiryn S: Further obser-vatiotis of "linking" of atrial excitation dtjring clitiical atrial fibril-lation. PACE 1998:1:25-34.
11. Skanes AC. Mandapati R. Berenfeld O. Davidenko JM, Jalife J:Spatiotemporal periodicity during atrial librillation in the isolatedsheep heart. Circulation I998;8:I236-I248.
12. Mandapati R. Skanes A. Chen J. Berenfeld O, Jalife J: Stablemicrareentrant sources as a mechanism of atrial librillation in theisolated sheep heart. Circulation 2(MH):2:I94-199.
13. Jalife J. Berenfeid O. Skanes A. Mandapati R: Mechanisms ofatrial fibrillation: Mother rotors or multiple daughter wavelets, orboth> J Cardiovasc Electrophysiol I998:9:S2-S12.
14. Garfinkel A, Chen P. Walter DO. Karagueuzian HS, Kogan B,Evans SJ. Karpoukhin M. Hwang C. Uchida T. Gotoh M. Nwa-sokwa O, Sager P: Quasii>eriodicity and chaos in cardiac fihrilla-tion. J Clin invest 1997:99:305-314.
15. Gray RA, Pertsov AM. Jalife J: Spatial and temporal organizationduring cardiac rihrillation. Nature 1998:392:76-78.
16. Wijffels MCEF, Kirchhof CJHJ, Dorland R. Allessie MA: Atriallibrillation hegets atrial fibrillation. Circulation 1995:92:1954-1968.
17. Morillo CA. Klein GJ. Jones DL. Guiraudon CM: Chronic rapidatrial pacing. Structural, functional, and electrophysiological char-acteristics of a new mtxJel of sustained atrial fibrillation. Circula-tion 1995:1:1588-1595.
IS. Whittington JR. Cross MR. Raflery EB: An effective consciousanimal model of atrial [ihrillation. Cardiovasc Res 1979:13:105-112.
19. Page PL. Plump VJ. Okumura K. Waldo AL: A new animal modelof atrial flutter. J Am Coll Cardiol 19K6;8:872-879.
20. Lewis T: Irregularity of the heart's action in horses and iLs rela-tionship to fibrillation of the auricles in experiment and to completeirregularity of the human heart. Heart 1912:3:161-171.
21. Reef VB. Reimers JM. Sjwncer PA: Treatment of atrial fihrillationin horses: New perspectives. J Vet Intern Med 1995:9:57-67.
22. t,angendorf R. Pick A. Katz LN: Ventricular response in atriallibrilliition. Role of coni-caleiJ conduciion in ihe AV juiKtion.Circulation 1965;32:6y-75.
23. Btxitsma BK. Hoelen AJ. Strackee J. Meijler FL: Analysis of theRR intervals in patients with atrial Hbritlation at rest and duringexercise. Circulation 1970:41:783-794.
24. Van den Berg MP. Crijns HJGM, Haaksma J. Brouwcr J. Lie KI:

784 Journal of Cardiovascular Eleclrophysiolc^ Vol. 11, No. 7, July 2000
Analysis of vagal effects on venlricular rhyihm in patienis withatrial fibdllalion. Clin Sci 1994:86:531-535.
25. Mcijlcr I'l.. Kmntman J. Tweel I. Herhschlcb JN. Heelhaar RM,Borst C: Nnnrandum ventricular rhyihm in horses with atrialRbrillation and its significance for palienls. J Am Coll Cardiol1984.4:316-323.
26. l^ffler CT, Saul JP. Cohen RJ: Rate-related and autonomic effectson atriovcnlricular conduciion assessed through beat-to-beal PRinterval and cycle length variabilily. J Cardiovasc Electrophysiol1994:5:2-15.
27. Cohen RJ, Berger RD, Dushane TE: A quantitative model of theventricular response during atrial fibrillation. IEEE BME 1983:30:769-780.
28. Rosenbaum DS. Cohen RJ: Frequency based measures of atrialtibrillaiion in man, IEEE EMBS l9W:i::5H2-583-
29. Chishaki AS. Siinagawa K. Hayashida K. Sugimachi M. NakamuraM: Idenlilication o! the rate-dependent lunctional refractory pericxlof the atrio-ventricular node in simtilated atrial fibrillation. AmHeart J l9<Jl;121:X20-826.
30. Hayano H, Sakata S, Okada A, Mukai S, Fujinami T: Cireadianrhythms of alriovenlricuiar conducUon properties in chronic alrialfibrillaiion wiih and without heart lailure. J Am Coll CanJioi1998:31:I.S8-Uih.
31. Chialvo DR. Gilniour RF Jr. Jalife J: Low dimensional chaos incardiac lissue. Nature 1990;6259:653-657.
32. Meijler FL, Jalite J, Beaumont J. Vaidya D: AV nodal functionduring atrial fibrillation: The role of eleclrotonic modulation ofpropagation. J Cardiovasc Eleclrophysiol 1996:7:843-861.
33. Moe GK. Ahildskov JA: Observations on the ventricular dysrhyth-mia associated with alrial tibrillation in the dog hean. Circ ResI964:14:447-4(>O.
34. Van den Berg MP. De Langen CDJ, Haaksma J. Bel KJ, CrijnsHJGM. Dijk WA. Lie KI: Analysis of randomness of airial andventricular rhythm in atnal fibrillation, Eur Heart J 1995:16:971-976.
35. Meijler FL, van der Twee! I: Comparative study of atrial fibrilla-tion and AV conduction in mammals. Heart Vessels Suppl 1987:2:24-31.
36, Chorro FJ. Mainar L. Sanchis J. Canoves J. Porres JC, Guerrero J.Miilci J. Llavador E. Such LM. Egca S. Lopez-Merino V. Such L:The activation patterns during atrial fibrillation in an experimentalmodel. Rev Esp Cardiol 1999;52:327-338,
.17. Konings KT. Kirchhof CJ. Smeets JR. Wellens HJ, Penn OC,Ailessie MA: High-density mapping oC elecirically induced atrialfibrillation in humans, Circulalion l')y4:89:166.'i-1680,
38. Kumagai K. Khrestian C. Waldo AL: Simullaneous muliisiie map-ping studies during induced atrial fibrillation in the sterile pericar-ditis model. Insights into the mechanism of its maintenance. Cir-culation 1997:2:511-521.
39. Hoffman BF. Rosen MR: Cellular mechanisms for cardiac arrhyth-mias. Circ Res 19X1:1:1-15.
4{), Langendorf R: Concealed A-V amduction: The effect of hlockedimpulses on ihc lonn;iiion and conduciion of suhsequeni impulses.Am Hean J iy48:3.S:.S42-552,
41. Karagueuzian HS. Khan SS. Peters M. Mandel WJ. Diamond GA:Nonhomogenous local mrial aclivity during acute airial tibrillation:Spectral and dynamic analysis. PACE I'M):1.1:I937-I942.
42. Stanton MS: Class I antiarrhylhmic drugs: Quinidine. prwain-amide. disopyramide. lidocaine. mexiletine. tiK'ainide. phenytoin.moricizine. llecainide. propafenone. In Zipes DP, Jalife J, eds:Cardiac Electrophysiology: From Cell to Bedside. WB Sauntlcrs.Philadelphia, 1995. p. 1298.
43. Yamaya Y. Kubo K. Amada A. Salo K: Intrinsic atrioventricularconductive funclion in horses with a second degree atrioventricularblock. J Vei Med Sci 1997:59:149-151,
44. Billette J: Atrioventricular nodal activation during periodicpremature siimulation of the atrium. Am J Physioi 1987:252:HI63-HI77.