Detecting the skew angle in document images
14
ELSEVIER Signal Processing: Image Communication 6 (1994) 101 114 SIGNAL PROCESSING: IMAGE COMMUNICATION Detecting the skew angle in document images G.S.D. Farrow, M.A. Ireton, C.S. Xydeas* Multimedia Information Systems Laboratory, Department of Electrical Engineering, University of Manchester, Dover Street, Manchester M13 9PL, UK Received 1 June 1993 Abstract In the iield of document image analysis, accurate detection and removal of intrinsic skew is of paramount importance as a first step in the processing of document images. Here we present an efficient scheme for detecting the degree of misalignment in a document page. The proposed algorithm operates directly on the raw digitised image and is shown to achieve a high skew detection accuracy for mixed mode document formats which contain typewritten text, cursive script, !ine-art and photographic pictures. We also discuss efficiency considerations for a practical real-time hardware implementation of the algorithm. Furthermore, in a practical document image processing environment, it is necessary to process documents that are landscape or portrait oriented. In this context we present an algorithm which determines the page orientation prior to skew detection. Key words: Hough transform; Document image analysis; Skew removal 1. Introduction There are two possible causes of skewness in scanned document images: physical misalignment of a document on the scanner and scanning a docu- ment in which the content is already skewed, such as a misaligned photocopy. In the context of docu- ment image processing systems it is desirable to be able to detect and correct any skewness present in the image for a number of reasons. Firstly, in a document image archiving system, viewing of skewed pages is tiresome and hence undesirable and secondly, in more advanced document process- ing systems which utilise document segmentation and OCR algorithms, tile overall performance can * Corresponding author. 0923-5965/94/$7.00 © 1994 Elsevier Science B.V. All rights reserved SSDI 0923-5965(93)E0039-7 be severely degraded by the presence of skew. For example, the partitioning of a document page based on recursive decomposition, using horizontal and vertical projections, such as that described by Nagy and Seth [5], will fail for relatively small skew angles. Several skew detection and correction algo- rithms can be found in the literature with a varying degree of performance and complexity. Hashizume et al. [3] describe a technique which detects the orientation of components located along parallel lines by analysing a histogram of nearest-neighbour directions~ No implementation details are discussed and the technique possesses an inherent disadvan- tage in that it requires an initial segmentation of the image into characters. Another technique requiring initial character segmentation is proposed by Baird [1] in which an energy function is calculated on sets
-
Upload
independent -
Category
Documents
-
view
0 -
download
0
Transcript of Detecting the skew angle in document images
E L S E V I E R Signal Processing: Image Communication 6 (1994) 101 114
SIGNAL PROCESSING:
IMAGE COMMUNICATION
Detecting the skew angle in document images
G.S.D. Farrow, M.A. Ireton, C.S. Xydeas*
Multimedia Information Systems Laboratory, Department of Electrical Engineering, University of Manchester, Dover Street, Manchester M13 9PL, UK
Received 1 June 1993
Abstract
In the iield of document image analysis, accurate detection and removal of intrinsic skew is of paramount importance as a first step in the processing of document images. Here we present an efficient scheme for detecting the degree of misalignment in a document page. The proposed algorithm operates directly on the raw digitised image and is shown to achieve a high skew detection accuracy for mixed mode document formats which contain typewritten text, cursive script, !ine-art and photographic pictures. We also discuss efficiency considerations for a practical real-time hardware implementation of the algorithm. Furthermore, in a practical document image processing environment, it is necessary to process documents that are landscape or portrait oriented. In this context we present an algorithm which determines the page orientation prior to skew detection.
Key words: Hough transform; Document image analysis; Skew removal
1. Introduction
There are two possible causes of skewness in scanned document images: physical misalignment of a document on the scanner and scanning a docu- ment in which the content is already skewed, such as a misaligned photocopy. In the context of docu- ment image processing systems it is desirable to be able to detect and correct any skewness present in the image for a number of reasons. Firstly, in a document image archiving system, viewing of skewed pages is tiresome and hence undesirable and secondly, in more advanced document process- ing systems which utilise document segmentation and OCR algorithms, tile overall performance can
* Corresponding author.
0923-5965/94/$7.00 © 1994 Elsevier Science B.V. All rights reserved SSDI 0 9 2 3 - 5 9 6 5 ( 9 3 ) E 0 0 3 9 - 7
be severely degraded by the presence of skew. For example, the partitioning of a document page based on recursive decomposition, using horizontal and vertical projections, such as that described by Nagy and Seth [5], will fail for relatively small skew angles.
Several skew detection and correction algo- rithms can be found in the literature with a varying degree of performance and complexity. Hashizume et al. [3] describe a technique which detects the orientation of components located along parallel lines by analysing a histogram of nearest-neighbour directions~ No implementation details are discussed and the technique possesses an inherent disadvan- tage in that it requires an initial segmentation of the image into characters. Another technique requiring initial character segmentation is proposed by Baird [1] in which an energy function is calculated on sets

102 G.S.D. Farrow et al. / Signal Processing: Image Communication 6 (1994) 101-114
of projection counts of character locations. Since these two methods only operate on segmented characters their robustness is limited and they are therefore unsuitable for images containing large areas of line-art and photographic pictures. In ad- dition, the initial segmentation of the image is rather complex. Rastogi and Srihari [8] have pro- posed a technique which uses the Hough transform. However, the reported accuracy is only to the near- est 15 °. The 'simulated skew' method, proposed by Postl [7], employs no character segmentation, but nevertheless its complexity is such that a 2.4 million pixel document image required 5.1 s for skew deter- mination when programmed in 'C' on a SUN 3 workstation. A recent scheme for extracting global features from document images, including the es- timated skew angle, has been presented by O'Gor- man [6]. This also requires an initial segmentation of the page into connected components.
In this paper a new application of the Hough transform is shown to be successful at determin- ing the skew angle of printed documents both effi- ciently and to a high degree of accuracy. Our results indicate that the algorithm achieves a detection accuracy typically to within 0.1 °. Unlike other pro- posed techniques no prior partitioning of the page into character/non-character symbols is required, thus improving the speed of operation and guaran- teeing robustness over a wide range of input docu- ment formats containing typewritten text, cursive script, line-art and photographic pictures.
In a practical document image processing envi- ronment, it is useful to be able to process both landscape and portrait oriented documents. To re- duce operator interaction in these circumstances it is necessary to automatically detect the orientation of the page. In this paper we also present an algo- rithm which is capable of detecting the page ori- entation prior to skew removal.
2. Using the Hough transform for skew angle determination
The generic term 'Hough transform' [4] is most often used to denote a particular mapping which maps straight lines to points and points to curves. This mapping is very useful in many areas of image
analysis and has been used previously for detecting lines and curves in pictures in the context of scene analysis [2].
Consider a bilevel rectangular grid input image and assume that the foreground colour is due to a pixel being 'on' and the background colour to it being 'off'. In order to perform the Hough trans- form each pixel with co-ordinates (x, y), that is, 'on' in the input domain is represented by the set of points lying on the curve 6 = x cos 0 + y sin 0 in the codomain. All such curves, for any particular given straight line in the input domain, cross at a single point (6, 0). Thus, detecting points where many of the codomain curves cross is equivalent to detecting straight lines in the domain.
In practice this technique is implemented as fol- lows: 1. Quantise and restrict the codomain to a two-
dimensional array of elements, H[6, 0], all of which are initially set to zero.
2. For each 'on' pixel in the domain increment every element of HIp, 0] through which the curve 6 = x cos 0 + y sin 0 passes.
3. Identify straight lines in the domain correspond- ing to the most densely populated elements in the codomain array H [6, 0].
The great power of this technique is that it will identify a set of non-connected points which all lie on a straight line. Lines of text in documents fall into this category and thus are suitable for detec- tion using the Hough transform.
Before proceeding it is instructive to consider the significance of the values of 6 and 0. The point (6, 0) corresponds to a line at an angle 0 and for which the perpendicular distance to the origin is 6. Thus the text lines on a page will have an approximately equal value of 0 but different values of 6. We desire a technique which will accurately identify globally dominant linear features in an image without un- due influence from local, non-conforming linear features such as lines in a diagram. Thus selecting the N densest points in the HI,o, 0] array and averaging the values of 0 is likely to lead to erron- eous results because the average may contain components from local linear features which are non-textual.
It is clear that the lines of text in a document page should all contribute to peaks in the H [6, 0]

G.S.D. Farrow et al. / Signal Processing." Image Communication 6 (1994) 101-114 103
12(3
8C
.E
4(
0
120,
50 100 150 200 250 Q
(a) Theta not equal to skew angle
8 I
~40]
' Ll 0 I
0 50 100 150 200 250 P
(b) Theta equal to skew angle
Fig. 1. Comparison of graphs of constant 0.
array that all lie on a particular line of constant 0 corresponding to the skew angle of the document. Of course, there will be isolated peaks on other lines of constant 0. It is also important to notice that for each value of 0, for a particular pixel, there is one and only one value of 69. Thus, for any given fixed value of 0 the area under the curve, formed by the surface of H [0, 0] as 0 is varied, is constant. Fig. 1 shows two such graphs for fixed 0. When 0 is equal to the skew angle the graph contains notice- ably more peaks with the locations of the peaks corresponding to the locations of the lines of text on the page. As the area under the two graphs is the same, it is necessary to be able to distinguish be- tween the two cases using only the shape of the graph. There are a number of mechanisms through which the desired selection of the most likely skew angle can be achieved. In the sequel we use a sum of squares of the graphs of constant 0 which will give a greater value to the graph with the sharper peaks. 1
1 Another approach would be to threshold the graphs at a level determined by the average density of the points and then sum some function of the remaining data. This may simplify the implementation of the decision algorithm in systems not con- taining a single cycle hardware multiplier.
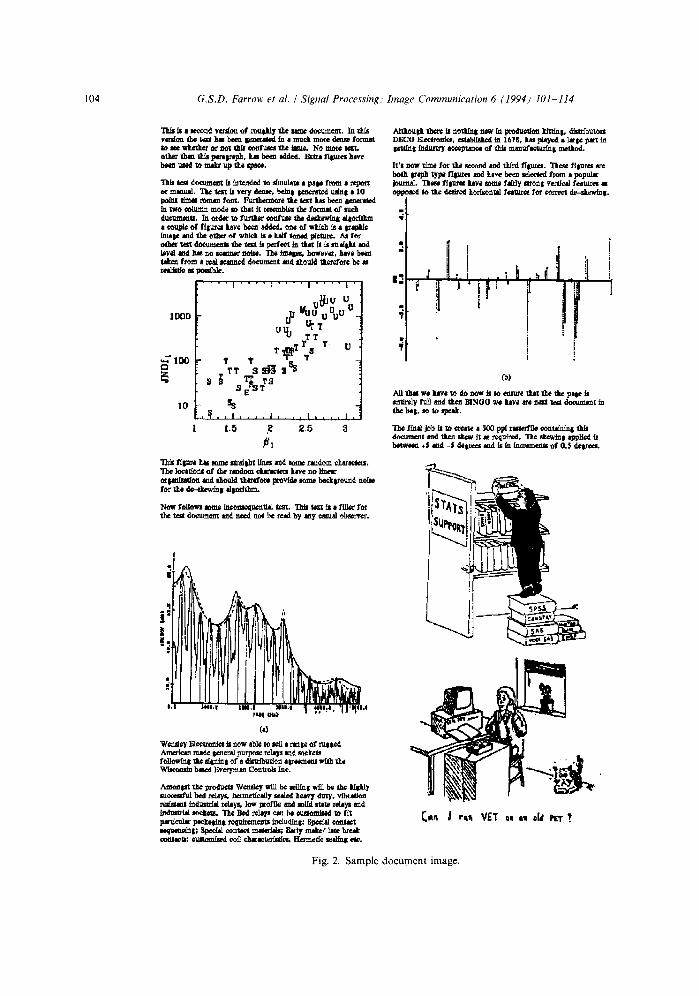
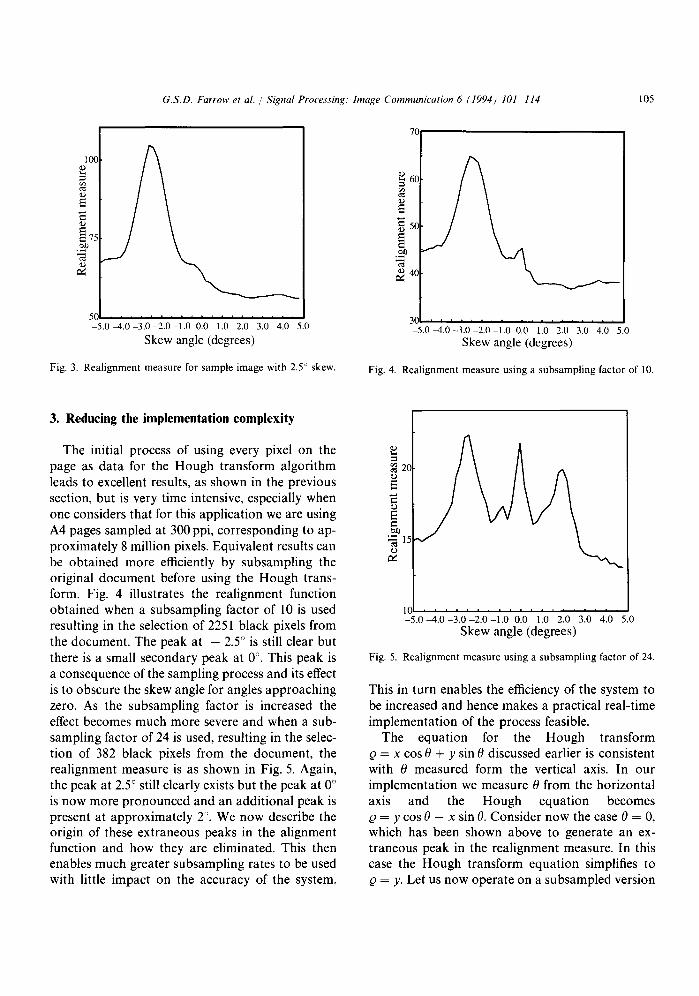
Thus, to summarise, we calculate the sum of the squares of the graphs of constant 0 under the sur- face H [Q, 0], and take the value of 0 for which this function is maximised as the skew angle of the text on the document page. We call this measure the realignment measure, R(O). Fig. 2 shows a sample document page at a reduced scale. Fig. 3 illustrates the realignment measure for this sample document rotated anti-clockwise by 2.5 ° . It is immediately clear that the peak of this graph, and hence the skew angle, is well defined.
It is interesting to note that the width of the peak is approximately 2 ° . If one considers the difference in the angles of the lines between, the top left and bottom right corners, and, the bottom left and top right corners of a text line, then this is also found to be approximately 2 ° . It is apparent that the font size is a governing factor in the spread of the peak in the realignment measure and in practice, the larger the font the less precise the results that can be expected. This problem is compounded by the existence of large black areas in the input material from diagrams or photographs. The effect of such items is to raise the 'background noise level' in the realignment function, rendering the peak less dis- tinct and further reducing the discriminatory power of the realignment function and hence the accuracy of the system. A means of reducing the detrimental effects of such areas is proposed in Section 4.
104 G.S.D. Farrow et al. / Signal Processing: Image Communication 6 (1994) 101-114
Thk k a ~ o n d v ~ o n of roughly the aa~e do¢~enL I n , i s vczzinn the 1~1 km been ~ t ~ in a much more ~ fo~n~ to st~ w~-ther or nol thk eonft.m~ d~.e ksu~, No mc~ t ~ , ot.]~f ~ tl6s pa~ral~'aplt, ~ been sdded. E~Ira filtures kt-¢e ~ used "re nud~ up the sp~e.
"rhk lest document k intended to s~nula~ a p~te from a repofl
point time~ ram~m font. ~rtketmore tl~ text It~ boe~ lemef*aed in two ~.[m~ mode so that it t'¢z~bl~l tl~ format of suck du~m~e~. Iu ord~ xo ~ ~ the deskewfn* alltor[thm a ec.uple of fitu-,~ l ~ e bo~ ~lded, one of wE~ is a I=spE¢ imsp ~tt~d the oth~ ,~f wE¢,I~ ~ * ItMf ton~ p~ct'~. A~ fc.r other te~t doetun~xl~ tlae t~ t k l~e~'feet in that it ~ st~titll~z ~ad level a~d h~ no ~nner noise. Tke ic~ees, kowe~, have Seen
f ~ ~ tea[ ~nned do~nen~ ~ d thould Zke~fofe be
~ r " " I . . . . 4 . . . . I . . . . t '
aooo ~p , , .u u ~ " -- u ~ Ur7
T T ,p ,~T T. U
,-T 100 1' T T
]o ss ~ i , I . . . . 1 . . . . I . . . . I .
1.5 ,~ ~,5 3
"INs f[ lau~ ! ~ mrm~ sltr~dldat ~ mad ~ r ~ d ~ e ) ~ r s , l~ .m6o~ o f t ~ ramdom ¢,karaa"lcrs la~v~ -ao L ~
o r l ~ o t t ~md thould t l ~ o r ~ provid~ som~ b ~ l t r o u n d noise for tke de-4kev~l~ Ml~rdtlua.
~ l o w follows some. l n c o m ~ u ~ t l ~ l ~ t , *l'hk ~ is s f f l l ~ for xe~ document ~ d need not b~e read. by .Imy ~ ~ b s e ~ .
i |,1 ~,IIi,I | l I l . I I n I , I ~ i I I i I , ' ll 'I|*I.!
~Slll Iliil.
{.Z)
f c . l l ~ t the ~ t ~ t of a dlmibu~n a ~ z 'with the Wis~on~ b~ed B~e~"tn~n gonU~k In©.
Amonpt t ~ produ~ Wensl~ ~ be ~enin~ ~ b~ the ki~ly *'uo,:~m~ bed ~ h~me~e..Mly sealed ~ ~ux~, vib~m~on r~ [ .~ [ lndu~"~ rcla~, inw proft]~ m~d :m.ffd m~l~ rel*~ mad indmm~ ~ * ~ . "l'be P~d ~ l r ~ can be ~'m~mised ~o fft p~tt[cular psek*lin$ req~r~enls in¢ludinll: Bl~x~d eoat~t s e q t t t ~ t ; ~pe~I eo, flt~t ma~'lak; E~rly make/]tte bte~ ¢on~c~: e u ~ m k ~ ~ r k ~ . ~ c s . I - I ~ © seal~ elc.
AlthouIJL lhe~e ~ nox.~n$ new In ~oauc~on kltt~l. ~ u ~ DECO E~¢~nla , e ~ b l k , ~ in 1676, hm p~e~ s l~r~e pm~ in
both lr~pl~ lype l I ~ t~d l~v¢ b¢~ ~eleeted from a popul~ ~urnal. ~ f[gm~ ]z~ve mine f~[rly ~ 1 v ~ d f ~ u ~ oppo~d to the ~ ko,dzont~l f ¢ ~ for ~ d e - ~ $ ,
i
i ,
'i ,! ' I "'it' ' fD~
i'l! i i ! 1 1
.MI tha~ we kave ~ do .~ow :[s so ,ei~,u'e r.]b~ the the pi i le Is ~lt~'ely fun ~ d ~ BlrNO0 we l r , ,e ~ n a t t e l d~,,uu~t in the bsl. Jo to spe.tk.
"1~ fintl j~b ts to ~ . t t e , ]~0 p~ rmetffle ¢oat~ainl ~I* d ~ t and tlteu skcw tt u l~!uLred. "lke Mtew~l applied ~ hetW~ +5 md -5 detr*~ t~d k In i n ~ u m t s of 0.5 det~s~.
if!.
<
G,. J r ~ VET ol o 0St ~tl"?
Fig . 2. S a m p l e d o c u m e n t image .
G.S.D. Farrow et al. / Signal Processing." Image Communication 6 (1994) 101-114 105
llX
= ©
E
0.)
=~ 7~
0.)
5 ( . . . . . . . . . . . . . . . . . . .
-5.0 4 .0-3 .0-2 .0-1 .0 0.0 1.0 2.0 3.0 4.0 5.0
Skew angle (degrees)
o 60
~D
~ 50
..~
~ 40
30
;-~15 0
70]
-5.0-4.0-3.0-2.0-1.0 0.0 1.0 2.0 3.0 4.0 5.0 Skew angle (degrees)
Fig. 3. Realignment measure for sample image with 2.5 ° skew. Fig. 4. Realignment measure using a subsampling factor of 10.
3. Reducing the implementation complexity
The initial process of using every pixel on the page as data for the Hough transform algorithm leads to excellent results, as shown in the previous section, but is very time intensive, especially when one considers that for this application we are using A4 pages sampled at 300 ppi, corresponding to ap- proximately 8 million pixels. Equivalent results can be obtained more efficiently by subsampling the original document before using the Hough trans- form. Fig. 4 illustrates the realignment function obtained when a subsampling factor of 10 is used resulting in the selection of 2251 black pixels from the document. The peak at - 2.5 ° is still clear but there is a small secondary peak at 0 °. This peak is a consequence of the sampling process and its effect is to obscure the skew angle for angles approaching zero. As the subsampling factor is increased the effect becomes much more severe and when a sub- sampling factor of 24 is used, resulting in the selec- tion of 382 black pixels from the document, the realignment measure is as shown in Fig. 5. Again, the peak at 2.5 ° still clearly exists but the peak at 0 ° is now more pronounced and an additional peak is present at approximately 2 ° . We now describe the origin of these extraneous peaks in the alignment function and how they are eliminated. This then enables much greater subsampling rates to be used with little impact on the accuracy of the system.
10 ~
,-,,.,_
-5 .0 -4 .0 -3 .0 -2 .0 -1 .0 0.0 1.0 2.0 3.0 4.0 5.0 Skew angle (degrees)
Fig. 5. Realignment measure using a subsampling factor of 24.
This in turn enables the efficiency of the system to be increased and hence makes a practical real-time implementation of the process feasible.
The equation for the Hough transform 0 = x cos 0 + y sin 0 discussed earlier is consistent with 0 measured form the vertical axis. In our implementation we measure 0 from the horizontal axis and the Hough equation becomes Q = y cos 0 - x sin 0. Consider now the case 0 = 0, which has been shown above to generate an ex- traneous peak in the realignment measure. In this case the Hough transform equation simplifies to 0 = Y. Let us now operate on a subsampled version

106 G.S.D. Farrow et al. / Signal Processing: Image Communication 6 (1994) 101-114
of the image, with pixels having coordinates (x', y'), subsampled in a rectangular grid at a rate S. Thus the pixel coordinates of the subsampled image now have the correspondence (x, y) = (Sx ' , Sy ' ) to those of the original image. Hence the subsampled ver- sion of the Hough transform equation when 0 = 0 is 0 = Sy'.
In order to create a practical implementation it is necessary to quantise 0 into a number of bins B, such that the bins cover the maximum range D of values for ~o. The range of possible values for Q is easily shown to be the diagonal size of the page. Thus, for the case 0 = 0 quantisation of Q is achieved according to the following equation:
I-Bs ,J = , 11)
where ~ i , denotes the index of the quantised bin and [.] denotes the operation of taking the nearest integer value.
Our system has been designed to be applied to an A4 page sampled at 300 ppi and to achieve suffi- cient resolution to identify 100 horizontal text lines (more than this is unlikely in a practical text docu- ment). This results in parameter values of B = 280 and D = 4181.3. With our stated subsampling rate of S = 24, substituting these values in Eq. (1) gives
~ i , = [1.6071y']. (2)
Since y' is an integer value, Eq. (2) implies that it is not possible to select certain of the bins, resulting in an uneven accumulation within the bins and conse- quently a higher value of the realignment measure than expected. From Eq. (1) it is seen this effect would be accentuated with higher values of S, as has been demonstrated in practice. There is also an extraneous peak in the realignment function at an angle other than 0 ° which we have found to be dependent on input resolution, actual skew angle and subsampling rate. We believe this peak is a consequence of aliasing and can be easily re- moved using the same mechanism as that used to remove the peak at 0 °.
We remove the extraneous peaks in the realign- ment function by the use of an interlaced sampling lattice. Using this technique we reduce the number of sample points on a given line, but increase the
number of sampling lines. This results in a lower effective subsampling rate, S in the vertical direc- tion. By shifting each successive sampling line by a 'shift factor', we maintain an even distribution of the sampling points over the document image. An example of a sampling lattice that we have used is illustrated in Fig. 6. In this example the 'shift factor' is 3 but in practice any integer value can be used. For our experiments the 'shift factor' is set so that the spacing between consecutive horizontal samp- ling lines is either 5 or 6 pixels. This restriction limits the range of subsampling rates that are avail- able for use to integer multiples of 5 or 6. In prac- tice this is not a problem. Using this modified lattice and the same data and parameters as used to generate the realignment measure of Fig. 5, the new realignment measure is shown in Fig. 7. It is im- mediately obvious that this new measure is a great improvement over that of Fig. 5 and that the docu- ment skew angle is now well defined.
When such coarse sampling is used the graph of the realignment measure becomes locally erratic but globally the skew angle is accurately located. This can be used advantageously in a two-stage search for determining the skew angle. In the first stage of the search a coarse sampling is used and
(a) Regular sampling lattice
(b) Interlaced sampling lattice
Fig. 6. A comparison of regular and interlaced sampling latti- ces.

G.S.D. Farrow et al. / Signal Processing. Image Communication 6 (1994) 101-114 107
2£
+
-5 .0 -4 .0 -3 .0 -2 .0 -1 .0 0.0 1.0 2.0 3.0 4.0 5.0
Skew angle
Fig. 7. Realignment measure using interlaced sampling lattice.
the skew angle is determined only to a low accu- racy. A 0 increment value of 0.5 ° can safely be used over the given range of + 5 °. In the second stage of the search more samples can be used together with an increase in the resolution on the 0 scale and a reduction in the search range to accurately and efficiently locate the skew angle of the document.
4. Minimising the effects of non-textual areas
Non-textual areas within a document image such as line-art and thresholded photographs can reduce the performance of the skew angle detection pro- cedure in a number of significant ways. The most obvious is that a geometrical figure or chart may contain straight lines at an angle other than that of the text on the page. This is not a serious problem since such lines are usually thin and the subsamp- ling procedures ensure that their contribution to the realignment measure is small. More serious problems are created by large areas of connected black pixels in a document. These pixels have the effect of increasing the background noise level with- in the realignment measure and introduce the pos- sibility of obscuring the peak that we wish to ob- serve. Furthermore, the system performs most of its calculations in response to the detection of a black pixel. Those in non-text areas thus consume con- siderable computation time whilst at the same time
reducing its skew angle determination perfor- mance. This problem is accentuated if the adaptive sampling technique described below is adopted.
In adaptive sampling the document page is coarsely sampled to determine the density of black points in the image. The subsampling rate is then adjusted so as to approximately hit a desired num- ber of black pixels. This is advantageous because it means that roughly the same amount of informa- tion will be extracted from a 5 line document as from a 25 line document. This in turn provides efficient performance and consistent computation time across a wide variety of document types. Un- fortunately, this type of adaptive subsampling sys- tem can be hijacked by a large black area which will cause the sampling rate to be less than that re- quired to extract sufficient information from the text contained on the page. There are two ways to avoid this problem: the first is to set the target number of black pixels high so that sufficient text pixels will be obtained to generate a peak against a high background noise level in the realignment function. This significantly increases the overall computation time of the system and will still fail, for instance, if 80% of the page is black. A better solution is to identify and discard large dark areas of the image. In the following paragraphs we de- scribe a very efficient scheme for performing this function.
The procedure that we use is to make a decision on the nature of the document in each partition of a square grid. During an initial analysis phase the entire document is subsampled using a coarse square sampling lattice. Approximate statistics for each partition of the square grid are compiled using this sampling information. Specifically, we deter- mine the propor t ion of black pixels within each partition. We have found text to produce a black pixel proportion of between 5% and 25% and retain only partitions having such black pixel pro- portions. Not only does this eliminate large dark areas of the image, and the problems that they cause, but it also prevents sampling large white areas which serves little purpose. The sampling rates for the Hough analysis passes are then cal- culated so as to hit the desired number of black pixels with the search restricted to the selected partitions.

108 G.S.D. Farrow et al. / Signal Processing." Image Communication 6 (19943 101 114
It is important to notice that, due to the statist- ical nature of the skew detection procedure, it is neither necessary to eliminate all of the large dark areas nor is it necessary to ensure that none of the text is discarded erroneously. Obviously, one can- not be too cavalier or timid in the rejection process but the proposed procedure is robust and only needs to be accurate at a coarse scale.
The reader should also note that the current table of values for y sin 0 changes only at the end of each sampling line. Thus the Hough analysis complexity is reduced to approximately 2 additions per 0 value per black pixel.
6. Orientation detection
5. Hardware implementation considerations
For any algorithm intended for real-time imple- mentation it is important to consider the efficiency of the implementation and techniques for ensuring that the rate of operation is maximised. In the previous section we have already described a number of techniques which enable the subsampling rate to be maximised and the number of potential skew angles to be checked to be minimised. Furthermore, we have described an adaptive sampling procedure which ensures that only a necessary minimum number of sample points are analysed for each docu- ment. It is, however, possible to go further than this.
The complexity of the sampling procedure can be minimised by pre-calculating and storing memory offsets and AND masks for bit isolation during the sampling process. It is easy to see that this informa- tion only needs to be calculated for the number of points on one line of the image subsampled at the determined subsampling rate. Once calculated the subsampled values throughout the whole image are easily obtained by reference to the memory offset to the start of the given image line.
On many modern processors there are single cycle multipliers and hence it is only necessary to store a table of values for cos 0 and sin 0 in order to be able to calculate ~ efficiently. On some proces- sors, however, multiplication is still a complex pro- cess requiring many processor cycles to complete. On such processors it is possible to store tables of multiples of cos 0 and sin0 so that the required values can be computed by addition. These tables may be computed at the start of operations to take into account the current subsampling rate. Given that the difference between successive hits will only be a few samples, most of the time, only a relatively small number of tables will need to be generated.
It is often considered that typical skew angles aris- ing from document misalignment on a scanner will be of the order of only a few degrees. In this respect the skew detection system is designed to operate over a relatively small range, for example __+ 5 °.
In a practical document image processing envi- ronment, such as a modern office, it would be convenient to process both landscape and portrait oriented documents. Scanner requirements are such that a document page is physically oriented the same way regardless of actual text orientation. For the case of a landscape document, this results in an image which is effectively rotated through 90 ° . In addition to this angle there would be a nominal skew angle of + 5 °. Thus the required detection range for our system becomes + 95 °. This operat- ing range does not result in a realistic system as it would not be possible to distinguish between a skew angles of, say, + 95 ° and a skew angle of - 8 5 °. Therefore, the approach we adopt is to
firstly detect the orientation of the page using a sep- arate algorithm prior to application of the skew removal procedure. We now describe an algorithm to perform orientation detection.
Consider, the x- and y-projection profiles of a bi- nary image obtained by summing the number of black pixels along the x- and y-axes, respectively. These are shown for a small text segment of an image in Fig. 8. Note that there are similarities in each of these functions to a graph of a constant 0 from the Hough transform described previously in that the areas under each of the curves is the same, corresponding to the total number of black pixels. If we were to calculate the realignment measure for each of the two projections shown we find that the value obtained from the x-projection is higher since the graph contains well-defined peaks. This discrimination forms the basis of our orientation detection algorithm.

G.S.D. Farrow et al. / Signal Processing." Image Communication 6 (1994) 101 114 109
Working in tandem with r The Telegraph's eommuni- ----- cations team, British Tele- w
corn were able to gradually transfer data and voice links from one site to another.
Fig. 8. x- and },-projection profiles for a text segment.
Experiments have indicated that it is not suffi- cient to determine the orientation from a single application of the x- and y-projections to the entire image. Instead we divide the image into a number of regular blocks and determine the x- and y-pro- jection profiles for each block. For each of these profiles within the block we then calculate the re- alignment measure. If the realignment measure for the x-projection profile is the greater, this counts as one vote in an accumulator for portrait orientation. Conversely, if the alignment measure calculated on the y-projection profile is greater this counts as one vote in an accumulator for landscape orientation. The accumulator with the largest value is taken to be the correct orientation of the page. Since the operation of the scheme is again dependent on the dominance of the text line orientation, in our imple- mentation we use the same procedure previously described for rejecting blocks which have a black pixel count outside the range 5 25% of the total, eliminating non-text areas which could have a de- grading effect on performance.
Note that if a page is detected as being landscape oriented, then it is rotated through 90 ° prior to skew detection. Rotation in this instance can be achieved via a simple transposition of axes such that there is no additional computational expense involved.
7. R e s u l t s and c o n c l u s i o n
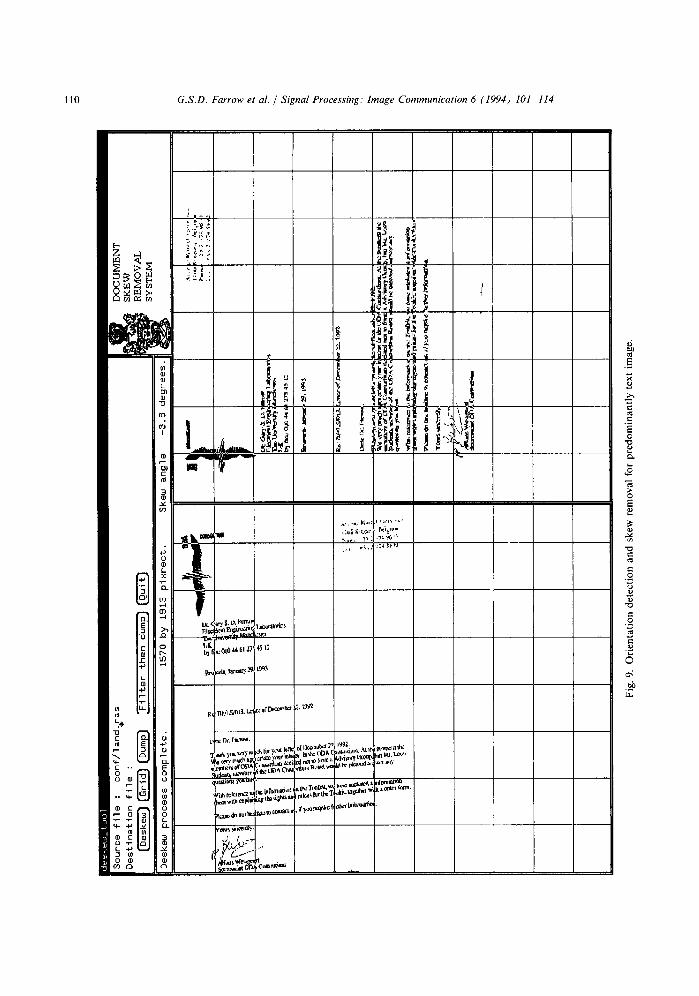
The algorithms have been tested on a large num- ber of input document formats and have been found to detect the page orientation and existing skew successfully. Fig. 9 shows the operation of
the complete system on a pure text image of a letter. To illustrate the robustness of the system, Fig. 10 shows the operation of the system on a complex, mixed mode image.
The characteristics of the system we have pres- ented are as follows. The Hough transform accu- mulator array has been quantised into 280 ~ bins by 50 0 bins over a maximum range of 0 of ± ~ Prior to applying the Hough transform, the page i:, divided into 20 by 30 regular blocks and the black pixel percentage is determined for each of these blocks. Blocks with a black pixel percentage out- side the range 5 25% are flagged and discounted from the subsequent analysis. The skew angle is then determined by a two pass application of the Hough transform and realignment measure. Dur- ing each pass we subsample the image using an interlaced lattice with a 'shift factor' of 4. In the first pass we determine the total number of black pixels in the unflagged blocks and calculate a sampling rate so as to hit approximately 400 black pixels. The Hough transform is then performed using a step size for 0 of 1 ° over the range _+5 ° . This results in a sparsely populated Hough accumulator array from which we find an estimate of the skew angle to the nearest 1 ° using the realignment measure. During the second pass we adjust the sampling rate to hit approximately 2500 black pixels from the unflagged blocks in the image and we perform a localised Hough transform using a step size for 0 of 0.1 ° over the range + 1 ° centred about the estimated skew angle. We then determine the realignment measure and from this obtain a more accurate estimate of the skew angle to the nearest 0.1 °.
To quantify the accuracy of the skew detection algorithm, a document image consisting of a num- ber of lines of typewritten text in the style of a typi- cal letter, has been created using a drawing pack- age. No scanning is involved in producing this image and thus there are no local distortions or noise in the image. The angle of zero skew is thus exactly defined by the text baseline. The perfor- mance of the algorithm has been measured on a series of images derived by rotation of this %yn- thetic' image through a number of fixed angles using commercial software. The results are pres- ented in Fig. 11 for a series of clockwise (positive)
F :-
1~
Source {ile
: Destina%ion {~]e :
Deskew process complete.
con
{/la
nd
.~ra
s "Fil
ter
%he
n du
mpJ
15
70
by
$9
13
pix
rect
.
~.
"C,:
" -q
%
-=
~ ~
.~-~
. ~
,~
~.~
!.~
.~ ~.~
2~
I~o ~,
~w~
5-
Skew
ang
le
-9.8 degrees.
~.=
: P
~a,~
'2.,
n'L=
.
:.L~.
!;
~. :2
i~ :
e -
~ ~-::.
~
DOCUMENT
SKEW
REMOVAL
SY STEM
.~,.
~.~
-.
~-~
...~
.~ ~
=.
c~
e~
;n
Q
;n 2"
0~ R" I
Fig.
9.
Ori
enta
tion
det
ecti
on a
nd s
kew
rem
oval
for
pre
dom
inan
tly
text
im
age.

Sou
rce
file
:
imag
es/t
est_
2cel
_8_a
~ra
s D
esti
nati
on
file
:
~ ~
(Fil
±er
then
du
mp)
Cal
cula
ting
al
lign
men
t m
easu
re,
2400
by
~424
pi
xrec
t.
Ske
w
angl
e
~ D
OC
UM
EN
T
SK
EW
R
EM
OV
AL
SY
STE
M
-4.8
degr
ees.
u !
~r
!
', ,
.... .
...[
...
....
. ..
....
..
_..
~-'
_ ~
~ .-
.-.
.,,
.. -
....
...
' ".
~%..~
. ,,-
- ;
'" '!.
'~.
'L~,
~"
"~-~
~ :.~i-~.-'/'.':.y'T:;;.4~:.
............ , ..............
,'~'~
;~M
-.,. E. ...
......
.. ; -
~4
: '~
."
" .....
... :~
'-',
1 ~
"t/~
' F'
."
~- ~'~
'"~
'V":
" '-"
:"
~.:,.
!' !,
,:;
. .,
;,
":,
",;.
. ,,~
.
" '
!','¢,
' i,"
,,
,'",i
i,L~.
....
.
........
.... 'P"
'2 .....
........
.... !:,
,.-:.~-
-.:,;:' --'
m:i'
--.-': "
S' :S
L,.';~
:: ,A
,~,. ~
': ~" "~
~;
,:Z...
:-,. ';,
..
...
• i-
~.,'.
•
• ~-
""
R ~,
;~-.
.~.~
.~
~."
~~--
-,-~
'~.'
~ *:
~':?
'--':-
:."
--~
:'.
'?~
,."d
-.'~
"'-
'- 7
5, .
'. '..
',',%
-."
.~:"
~
....
....
....
.
• _-
-~::.
-:'>V
:.:~,
,~
........
. ,~
-.-.':#
~,:-,~
_s.~!
'.;:..,:
't-;::,'
: ...
......
......
......
......
.. ]~
.:
~- /:.
, ..,
.',
r/i
i1!1
. ..
~'t
.-.~
.,..
"!
- ;
•
=.
.rr
': nx
:"
' ~
4 ...
.. ~r
:r'
,~:: .'
~,"-';
,;:~:~
: ....
....
~.:: ...
.... ;
.....
I ~
'1 ril}
t~ H,I
',~.,
/ .....
........ !-
!.i::ipil
~@
I~"~
' ' ~
'~'" :
" ~ ' "
'~i
~l
,
:! '.~
.~ ";~
' ~
..
..
..
..
I.~
'~
,,
I 1
~ ~
":~'
~"
..:?z~
,, "7
-~:!'~
.~:~s
,;'.;:.~
;r:~t
~,-~!
:~'..~
,,:~. ,
~ @
.~-~
b~
2 ¢m R'
~D
I
Fig,
10.
Sys
tem
ope
rati
on o
n m
ixed
-mod
e im
age.

112 G.S.D. Farrow et al. / Signal Processing." Image Communication 6 (1994) 101-114
liliiiilililiiilmuiIlilIIEmiiIlililii : lu nl l l l mml l m u mummlllN mmmu
Fig. 11. Performance of the algorithm on synthetic test images.
¢~AJ.
C C I T T I
. . . . . * . . . . . . . . . . . . . . . . . . . . . . . . . . . . . . . . . . . . . . . . . . . . . . . .
IzG':~!!:5-3.:.£~-?~:.33:3:!~U:2,~£,T:." ::'~,::.:::~:::,: :,:
C C I T F 4
, ° ,
[
C C I I q " 5
Fig. 12. CCITT test documents used for experimentation.

G.S.D. Farrow et al. / Signal Processing." lmage Communication 6 (1994) 101-114 113
CCITT1 Actual Rotation
Measured Rotation
4 . 7 -2.7 -1 .7 -1 .2 4 . 7 -0 .4 0.0 0.3 0.8 1,3 2.3 4.3
4 . 6 -2 ,6 -1 .6 -1 ,0 -0 .6 4 . 2 0.0 0.2 0.8 1.4 2.4 4.2
CCI'Iq'4 Actual Rotation
Measured Rotation . t l l ~ B I l l Blml IBIm l!ilm I~IB a a a UW~l~lB B
CCITT5 Actual Rotation
Measured Rotation
4 . 9 -2 .9 -1 .9 -1 .4 -0 .9 4 . 6 4 . 2 0.0 0.1 0.6 1.1 2.1 4.1
-5 ,0 -2 ,8 -1 .8 -1 .4 -0.8 -0 .4 -0.1 0.0 0.0 0,6 1.2 2.2 4.0
Fig. 13. Performance of the algorithm on skewed CCITT test images.
and anti-clockwise rotations over the operating range of the system and indicate that the inherent system accuracy is to within 0.1 °.
In measuring the performance of the system on real document images, an issue arises concerning how to define precisely the angle of zero skew. It is not sufficient merely to align a document exactly on the scanner bed since the scanning process itself may introduce local distortion and skew. A refer- ence representing nominal zero skew can only be established via a subjective analysis.
We have chosen to measure practical perfor- mance on a set of images derived from CCITT test documents. For each of the test images a zero skew reference image was determined subjectively by making minor adjustments to the alignment of the scanned image until the most visually acceptable image was found. Having established the zero skew reference image, test images were then generated by rotating this image through a series of angles, again using commercial software. We present results for three of the CCITT test documents illustrated in Fig. 12. Fig. 13 shows the results over a range of clockwise and anti-clockwise rotations applied to a zero skew reference image of each of the chosen CCITT test documents. Again, the projected sub- degree accuracy of the system is confirmed.
Furthermore, to illustrate the benefits of skew removal, we have measured the performance of a 'state-of-the-art ' commercial OCR package 2 on CCITT test document 1 under conditions of vary-
2 Calera WordScan Plus.
Skew Misclassified Incorrect Text lines Angle Characters Attributes Misintepreted
4.3 >150 4 15
2.8 16 12 3
2.3 34 10 2
1.3 1 6 0
0.8 1 2 0
0.0 1 1 0
-0.4 1 1 0
-0.7
-1.2 0 6 0
i -1,7 1 1 0
i -2 .2 8 5 1
-2.7 33 3 4
-4.7 >t50 5 18
Fig. 14. Effects of skew on OCR performance.
ing skew. The package is able to determine certain character and layout attributes such as font style and the position of text lines. We measure perfor- mance of the OCR package in terms of the number of misclassified or missing characters, the number of incorrect word attributes and the number of text lines incorrectly interpreted. The results are given in Fig. 14 and show that beyond a skew of + 2.0 ° OCR performance begins to degrade severely.
In conclusion, we have presented an efficient document skew detection approach which is suit- able for real-time hardware implementation. By using an interlaced sampling grid, we are able to maximise the subsampling of the input image

114 G.S.D. Farrow et al. / Signal Processing." Image Communication 6 (1994) 101-114
without compromising the overall performance, en- abling a significant reduction in computation time. The performance of the skew detection procedure is further optimised by pre-processing the input im- age on a block by block basis and discounting blocks containing dense black areas from the Hough transform derivation. The skew detection algorithm is faster than previously reported tech- niques and, because it works directly on the raw pixel level image is suitable as a pre-processing operation for a document analysis system. The ro- bustness of the technique implies that it is useful over a wide variety of input document formats which may contain line-art and photographic pic- tures supplemental to typewritten text. The orienta- tion detection algorithm described successfully determines the page orientation for portrait or landscape documents which contain skew. The combination of orientation detection and skew re- moval allows the process of scanning document images to be fully automated enabling faster throughput in practical document image process- ing systems.
References
[1] H.S. Baird, "The skew angle of printed documents", Proc. SPSE 4th Conf. Syrup. on Hybrid Image Systems, Rochester, New York, 1987, pp. 21-42.
[2] R.O. Duda and P.E. Hart, "Use of the Hough transform to detect lines and curves in pictures", Comm. ACM, Vol. 15, No. 1, January 1972, pp. 11 15.
[3] A. Hashizume, P.S. Yen and A. Rosenfeld, '" A method of detecting the orientation of aligned components", Pattern Recognition Lett., Vol. 4, 1986, pp. 125-132.
[4] P.V.C. Hough, 'Method and means for recognizing complex patterns', U.S. Patent 3,069,654, 18 December 1962.
I-5] G. Nagy and S. Seth. "Hierarchical representations of op- tically scanned documents", Proc. 7th lnternat. Conf. on Pattern Recognition, 1984, pp. 347 349.
[-6] L. O'Gorman, "Image and document processing tech- niques for the right pages electronic library system", Proc. l l th IAPR Internat. Conf. on Pattern Recognition, Vol. 11, IEEE CS Press, Los Alimintos, CA, 1992, pp. 260-263.
I-7] W. Postl, "Detection of linear oblique structures and skew scan in digitised documents", Proc. 8th Internat. Conf. on Pattern Recognition, 1984, pp. 687-689.
1-8] A. Rastogi and S. Srihari, Recognising textual blocks using the Hough transform, TR 86-01, Department of Computer Science, University of Buffalo (SUNY), 1986.