
A Robust Document Skew Estimation Algorithm Using Mathematical Morphology
8
k-Attractors: A Clustering Algorithm for Software Measurement Data Analysis Yiannis Kanellopoulos 1,2 , Panagiotis Antonellis 1 , Christos Tjortjis 2 and Christos Makris 1 1. University οf Patras, Department of Computer Engineering and Informatics, Greece 2. The University οf Manchester, School οf Computer Science, U.K. [email protected], {adonel, makri}@ceid.upatras.gr, [email protected] Abstract Clustering is particularly useful in problems where there is little prior information about the data under analysis. This is usually the case when attempting to evaluate a software system’s maintainability, as many dimensions must be taken into account in order to reach a conclusion. On the other hand partitional clustering algorithms suffer from being sensitive to noise and to the initial partitioning. In this paper we propose a novel partitional clustering algorithm, k-Attractors. It employs the maximal frequent itemset discovery and partitioning in order to define the number of desired clusters and the initial cluster attractors. Then it utilizes a similarity measure which is adapted to the way initial attractors are determined. We apply the k-Attractors algorithm to two custom industrial systems and we compare it with WEKA’s implementation of K-Means. We present preliminary results that show our approach is better in terms of clustering accuracy and speed. 1. Introduction Software systems have become very complex and beset with problems concerning their maintenance and evolution. They have also become larger, and it is difficult for a single person to understand a system in its entirety. According to N.I.S.T. [1], software errors cost the U.S. economy $60 billion per year. Essentially, a correct and consistent behavior of a software system is a fundamental part of users’ expectations. As a result, maintenance processes can be considered an area of competitive advantage. There are several studies on evaluating a system’s maintainability and controlling the effort required to carry out maintenance activities. According to ISO/IEC-9126 [2] maintainability is the capability of a software product to be modified. Evaluating maintainability is difficult because many contradictory criteria must be considered in order to reach a decision. Data mining and its capacity to deal with large volumes of data and to uncover hidden patterns has been proposed as a means to support the evaluation and assessment of the maintainability of industrial scale software systems. Furthermore, the use of metrics (measurement data) provides a systematic approach for maintainability evaluation. It also enables the engineers of a system to track status, identify potentially problematic areas, and make decisions related to their tasks. We propose in this paper a novel partitional clustering algorithm, k-Attractors, which is tailored for the analysis of this type of data. The main characteristics of k- Attractors are: • It defines the desired number of clusters (i.e. the number of k), without user intervention. • It locates the initial attractors of cluster centers with great precision. • It measures similarity based on a composite metric that combines the Hamming distance and the inner product of transactions and clusters’ attractors. • It can be used for large data sets. The remaining of the paper is organized as follows: section 2 discusses the background on clustering an related problems, section 3 proposes our approach, section 4 details k-Attractors, section 5 presents experimental results and section 6 concludes with directions for future work. 2. Background This section presents the main clustering problems that the proposed algorithm addresses and the main concepts we used for its development.
-
Upload
independent -
Category
Documents
-
view
1 -
download
0
Transcript of A Robust Document Skew Estimation Algorithm Using Mathematical Morphology

k-Attractors: A Clustering Algorithm for Software Measurement Data Analysis
Yiannis Kanellopoulos1,2, Panagiotis Antonellis1, Christos Tjortjis2 and Christos Makris1 1. University οf Patras, Department of Computer Engineering and Informatics, Greece
2. The University οf Manchester, School οf Computer Science, U.K.
[email protected], {adonel, makri}@ceid.upatras.gr,
Abstract
Clustering is particularly useful in problems where
there is little prior information about the data under
analysis. This is usually the case when attempting to
evaluate a software system’s maintainability, as many
dimensions must be taken into account in order to reach a
conclusion. On the other hand partitional clustering
algorithms suffer from being sensitive to noise and to the
initial partitioning. In this paper we propose a novel
partitional clustering algorithm, k-Attractors. It employs
the maximal frequent itemset discovery and partitioning in
order to define the number of desired clusters and the
initial cluster attractors. Then it utilizes a similarity
measure which is adapted to the way initial attractors are
determined. We apply the k-Attractors algorithm to two
custom industrial systems and we compare it with
WEKA’s implementation of K-Means. We present
preliminary results that show our approach is better in
terms of clustering accuracy and speed.
1. Introduction Software systems have become very complex and beset with problems concerning their maintenance and evolution. They have also become larger, and it is difficult for a single person to understand a system in its entirety. According to N.I.S.T. [1], software errors cost the U.S. economy $60 billion per year. Essentially, a correct and consistent behavior of a software system is a fundamental part of users’ expectations. As a result, maintenance processes can be considered an area of competitive advantage. There are several studies on evaluating a system’s maintainability and controlling the effort required to carry out maintenance activities. According to ISO/IEC-9126 [2] maintainability is the capability of a software product to be modified. Evaluating
maintainability is difficult because many contradictory criteria must be considered in order to reach a decision. Data mining and its capacity to deal with large volumes of data and to uncover hidden patterns has been proposed as a means to support the evaluation and assessment of the maintainability of industrial scale software systems. Furthermore, the use of metrics (measurement data)
provides a systematic approach for maintainability evaluation. It also enables the engineers of a system to track status, identify potentially problematic areas, and make decisions related to their tasks. We propose in this paper a novel partitional clustering
algorithm, k-Attractors, which is tailored for the analysis of this type of data. The main characteristics of k-Attractors are:
• It defines the desired number of clusters (i.e. the number of k), without user intervention.
• It locates the initial attractors of cluster centers with great precision.
• It measures similarity based on a composite metric that combines the Hamming distance and the inner product of transactions and clusters’ attractors.
• It can be used for large data sets. The remaining of the paper is organized as follows:
section 2 discusses the background on clustering an related problems, section 3 proposes our approach, section 4 details k-Attractors, section 5 presents experimental results and section 6 concludes with directions for future work.
2. Background This section presents the main clustering problems that
the proposed algorithm addresses and the main concepts we used for its development.

k-Attractors Algorithm
/*Input Parameters*/ Support: s Number of dimensions: n Hamming distance power: h Inner product power: i Attractor similarity ratio: r Outlier factor: d
Given a set of m data items 1 2, , , mt t tK
/*Initialization Phase*/ (1) Generate frequent itemsets using the APriori Algorithm; (2) Construct the itemset graph and partition it using the confidence similarity criteria related to the support of these
itemsets; (3) Use the number of partitions as the final k; (4) Select the maximal frequent itemset of every cluster in order to form a set of k initial attractors; /*Main Phase*/ Repeat
(6) Assign each data item to the cluster that has the minimum ( )i j
Score C t→ ;
(7) When all data items have been assigned, recalculate new attractors;
Until it don’t_move
(8) Search all clusters to find outliers and group them in a new cluster
Figure 1 - k-Attractors overview
source code elements. A combination of clustering and association rules is applied on data extracted from object oriented code. K-Means clustering produces system overviews and deductions, which support further employment of an improved version of MMS Apriori to identify hidden relationships between classes, methods and member data.
3. Our approach
In this research work we propose a partitional algorithm that utilizes a preprocessing method for its initial partitioning and incorporates a similarity measure adapted on the rationale for this method. More specifically, the k-Attractors algorithm employs
the maximal frequent itemset discovery and partitioning, similarly to [6], [9] in order to define the number of desired clusters and the initial attractors of the centers of these clusters. What differentiates it at first, from the work presented above, is that it is used in a different (than document clustering) context. The intuition is that a frequent itemset in the case of software metrics is a set of measurements that occur together in a minimum part of a software system’s classes. Classes with similar measurements are expected to be on the same cluster. The term attractor is used instead of centroid, as it is not
determined randomly, but by its frequency in the whole population of a software system’s classes. The main contribution of k-Attractors is that it
proposes a similarity measure which is adapted to the way initial attractors are determined by the preprocessing method. Hence, it is primarily based on the comparison of frequent itemsets. More specifically, a composite metric based on the Hamming distance and the dot (inner) product between each transaction and the attractors of each cluster is utilized. Hamming distance is given by the number of positions
that a pair of strings is different. Put another way, it measures the number of substitutions required to change one string to another. In our case a string is a set of data items and more specifically a vector containing software measurement data. Furthermore, the dot product of two vectors is a measure of the angle and the orthogonality of two vectors. It is used in order to compensate for the position of both vectors in Euclidean space.
4. Algorithm Description This section details the basic steps of the k-Attractors algorithm along with some representative examples.
4.1. Overview The two basic steps of the k-Attractors algorithm are:
• Initialization phase: o The first step of this phase is to generate frequent itemsets using the APriori algorithm. The derived frequent itemsets are used to construct the itemset graph, and a graph partitioning algorithm is used to find the number of the desired clusters and assign each frequent itemset into the appropriate cluster.
o As soon as the number of the desired clusters (k) is determined, we select the maximal frequent itemsets of every cluster, forming a set of k frequent itemsets as the initial attractors.
• Main Phase: o As soon as the attractors have been found, we assign each transaction to the cluster that has the
minimum ( )i j
Score C t→ against its attractor.
o When all transactions have been assigned to clusters we recalculate the attractors for each cluster in the same way as during the initialization phase.
Figure 1 illustrates an overview of the k-Attractors algorithm. We detail its two phases next.
4.2. Initialization Phase
The goal of the initialization phase is twofold: firstly to
identify the most frequent itemsets of the input data and secondly to determine the number of clusters. In order for the most frequent itemsets to be
discovered, we apply the APriori algorithm against the input data file. The APriori algorithm takes as parameter
the absolute support s of the required itemsets and returns
all the one-dimensional and multi-dimensional itemsets
with support greater than or equal to s .
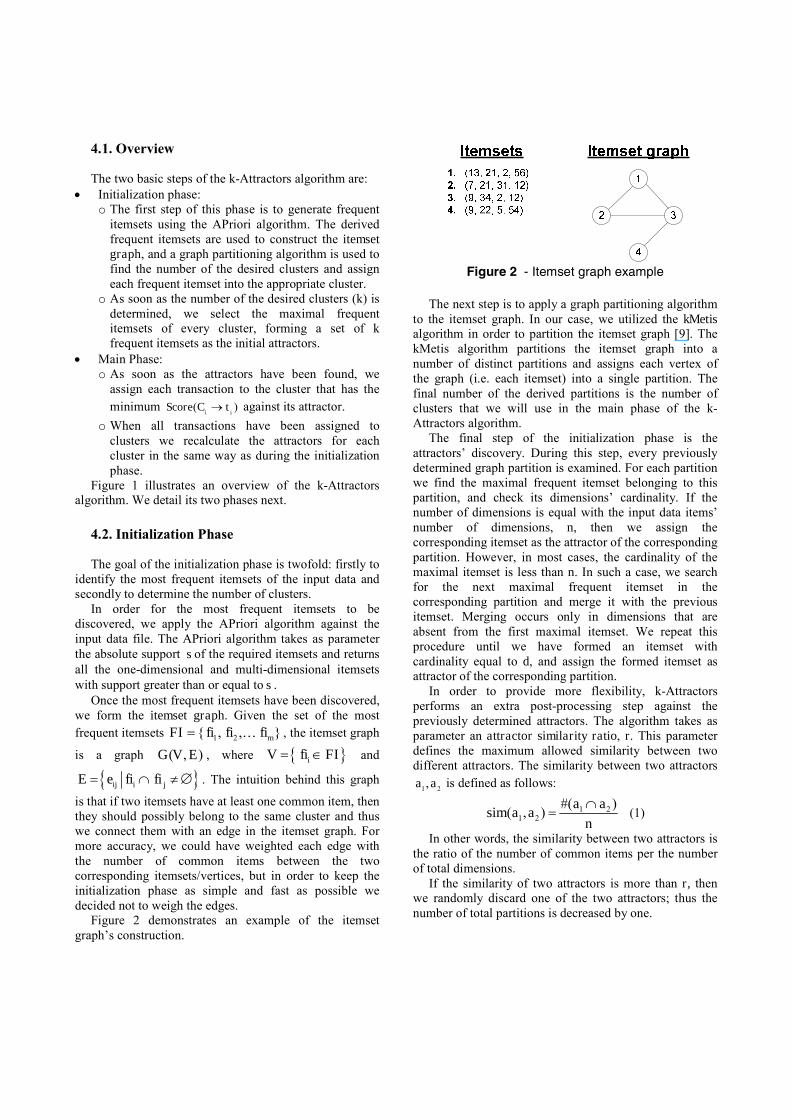
Once the most frequent itemsets have been discovered, we form the itemset graph. Given the set of the most
frequent itemsets 1 2{ , , }mFI fi fi fi= K , the itemset graph
is a graph ( , )G V E , where { }iV fi FI= ∈ and
{ }ij i jE e fi fi= ∩ ≠∅ . The intuition behind this graph
is that if two itemsets have at least one common item, then they should possibly belong to the same cluster and thus we connect them with an edge in the itemset graph. For more accuracy, we could have weighted each edge with the number of common items between the two corresponding itemsets/vertices, but in order to keep the initialization phase as simple and fast as possible we decided not to weigh the edges. Figure 2 demonstrates an example of the itemset
graph’s construction.
Figure 2 - Itemset graph example
The next step is to apply a graph partitioning algorithm
to the itemset graph. In our case, we utilized the kMetis algorithm in order to partition the itemset graph [9]. The kMetis algorithm partitions the itemset graph into a number of distinct partitions and assigns each vertex of the graph (i.e. each itemset) into a single partition. The final number of the derived partitions is the number of clusters that we will use in the main phase of the k-Attractors algorithm. The final step of the initialization phase is the
attractors’ discovery. During this step, every previously determined graph partition is examined. For each partition we find the maximal frequent itemset belonging to this partition, and check its dimensions’ cardinality. If the number of dimensions is equal with the input data items’ number of dimensions, n, then we assign the corresponding itemset as the attractor of the corresponding partition. However, in most cases, the cardinality of the maximal itemset is less than n. In such a case, we search for the next maximal frequent itemset in the corresponding partition and merge it with the previous itemset. Merging occurs only in dimensions that are absent from the first maximal itemset. We repeat this procedure until we have formed an itemset with cardinality equal to d, and assign the formed itemset as attractor of the corresponding partition. In order to provide more flexibility, k-Attractors
performs an extra post-processing step against the previously determined attractors. The algorithm takes as parameter an attractor similarity ratio, r. This parameter defines the maximum allowed similarity between two different attractors. The similarity between two attractors
1 2,a a is defined as follows:
1 21 2
#( )( , )
a asim a a
n
∩= (1)
In other words, the similarity between two attractors is the ratio of the number of common items per the number of total dimensions. If the similarity of two attractors is more than r, then
we randomly discard one of the two attractors; thus the number of total partitions is decreased by one.

4.3. Main Phase The goal of k-Attractor’s main phase is to assign each


dataset consisting of the calculated metrics for 50 classes of an analysis application. Every data item contained only 4 metrics of the corresponding class (LOC, CBO, DIT, WMC/LOC), thus the dataset consisted of 50 4-dimensional data items. The main reason for reducing the size of the example is that it is was easier for human experts to cluster manually a small subset of classes with low dimensions. Domain experts of the corresponding software system grouped manually the data items into 4 clusters. The utilized 4 metrics mentioned above were chosen by the domain expert as the most representative of the quality of each class. We then applied k-Attractors and k-Means against the data items and calculated the precision and recall of the formed clusters in both cases. The values of input arguments to k-Attractors are
presented in Table 3. The only differences between those input arguments and the input arguments of the previous experiment (performance evaluation) are related to the number of dimensions and the outlier factor. In this experiment we chose to relax the outlier factor and set it equal to 2, because of the small dataset and the small set of chosen metrics. The number of dimensions was set to 4 because we used only 4 metrics for every parsed system class.
Table 3 - k-Attractors input arguments (quality
evaluation) Argument Value
Support: s 0.1
Number of dimensions: n 4
Attractors similarity ratio: r 1
Hamming distance power: h 1
Inner product power: i 3
Outlier factor: d 2
For every formed cluster by k-Attractors and k-Means,
we calculated its precision and recall regarding the corresponding cluster formed by the domain expert.
The recall of a cluster j
c regarding the corresponding
domain expert’s group it is defined as:
( )( )#
Recall ,#
j i
j i
i
c tc t
t
∩= (5)
Similarly, the precision is defined as:
( )( )#
Precision ,#
j i
j i
j
c tc t
c
∩= (6)
The calculated precision and recall for every formed cluster by k-Attractors is presented in Table 4. The calculated precision and recall for every formed cluster by k-Means is presented in Table 5.
Table 4 - k-Attractors recall and precision Cluster Population Precision Recall
1 35 0.88 0.97
2 9 0.88 0.8
3 4 0.66 0.66
4 2 0.5 0.25
Table 5 - k-Means recall and precision
Cluster Population Precision Recall
1 27 0.8 0.65
2 13 0.15 0.5
3 7 1.0 0.7
4 3 0.0 0.0
It is obvious from the above tables, that k-Attractors’
clusters are closer to the domain expert’s clusters. Especially, regarding the two largest clusters (cluster 1 and cluster 2), the corresponding calculated recall and precision are very high and better than the two corresponding k-Means clusters. Additionally, consider the smallest cluster in k-Attractors (cluster 4) and k-Means (cluster 4): those clusters correspond to the domain expert’s outlier cluster. It is obvious that k-Attractors approximates the domain expert’s cluster because of the application of the outlier handling phase. k-Means lacks such a phase, thus the recall and the precision of the corresponding cluster are both 0. Hence, the experimental results show that k-Attractors
forms more quality clusters than k-Means, approximating the domain expert’s manually created clusters. This is due to the fact that k-Attractors is designed for the semantics of software measurement data, thus it outperforms k-Means both in performance and quality.
6. Conclusions and Future Work The aim of this work was the development of a new
partitional clustering algorithm, k-Attractors, which could be tailored for the analysis of software measurement data and overcome the weaknesses of other partitional algorithms. The first step of the proposed algorithm is the
application of a preprocessing step which calculates the initial partitions for the k-Attractors partitional algorithm. During this step, we discover the maximal frequent itemsets of the input software measurement data using the Apriori algorithm. After the frequent itemsets’ discovery, we form the itemset graph and apply a graph partitioning algorithm, kMetis. The number of the resulted partitions defines the number of k-Attractors clusters. Thus defining the number of clusters, the common problem for all clustering algorithms, is resolved. Additionally, instead of randomly choosing the clusters’ centers, for every formed partition, we merge its maximal frequent itemsets,
constructing that way the attractor of the corresponding cluster. As a result, the constructed initial attractors approximate the real clusters’ attractors, improving that way the convergence speed of the proposed algorithm The next step is the application of the k-Attractors
main phase. During this phase, all the input software measurement data are clustered into appropriate clusters. As a distance metric we employ a composite metric consisting of the Hamming distance and the inner product. Thus, the employed metric is adapted to the way initial attractors are determined by the preprocessing step. The last step deals with outliers. Handling outliers
includes outlier discovery and grouping into a separate cluster. The discovery of outliers is based on the composite distance between a data item and its cluster’s attractors. The corresponding distance is compared with the average distance inside this cluster and if it is greater than a factor, then the corresponding data item is considered as an outlier and is grouped into a designated cluster. Preliminary results showed that the proposed clustering
algorithm is about 600% faster than k-Means, the state-of-the-art partitional algorithm. Additionally, regarding software measurement data, k-Attractors appears to form better, in terms of quality, and more concrete clusters. We intend to investigate ways to further evaluate and
improve the k-Attractors algorithm. At first we are interested in conducting more experiments in order to see its effectiveness and clustering quality with other types of datasets. Another interesting topic is to improve the way the initial attractors are derived by employing more innovative versions of APriori.
Acknowledgements This research work has been partially supported by the
Greek General Secretariat for Research and Technology (GSRT) and Dynacomp S.A. within the program “P.E.P. of Western Greece Act 3.4”. We would also like to thank Rob van der Leek and Patrick Duin from the Software Improvement Group for their valuable comments and feedback concerning our clustering results.
References 1. National Institute of Standards and Technology (NIST),
“The Economic Impacts of Inadequate Infrastructure for Software Testing”, Washington D.C. 2002.
2. ISO/IEC 9126, Software Engineering – Product Quality International Standard Quality Model, Geneva 2003.
3. A.K. Jain, M.N. Murty, and P.J. Flynn, “Data Clustering: A Review”, ACM Computing Surveys, ACM, Vol. 31, No 3, September 1999, pp. 264-323.
4. J. Han and M. Kamber, Data Mining: Concepts and Techniques, (Academic Press 2001).
5. R. Agarwal, and R. Srikant, Fast Algorithms for Mining Association Rules in Large Databases, in: Proc. 20th Int’l Conf. VLDB (1994) 487-499
6. L. Zhuang, H. Dai, “A Maximal Frequent Itemset Approach for Web Document Clustering”, Proc. of the 4th IEEE Int’l Conf. on Computer and Information Technology (IEEE CIT’04), 2004
7. B.C.M. Fung, K. Wang, Martin Ester, “Hierarchical Document Clustering Using Frequent Itemsets”, Proc. of the 3rd SIAM Int’l Conf. on Data Mining, 2003
8. K. Wang, C. Xu, B. Liu, “Clustering Transactions Using Large Items”, Proc. of the 8th ACM Int’l Conf. on Information and Knowledge Management, pp.483-490, 1999
9. E.H. Han, G. Karypis, V. Kumar, B. Mobasher, “Clustering Based on Association Rule Hypergraphs”, In Research Issues on Data Mining and Knowledge Discovery, 1997
10. W.A. Kosters, E. Marchiori and A.A.J. Oerlemans, Advances in Intelligent Data Analysis, pp: 39-50, Lecture Notes in Computer Science 1642, Springer, 1999
11. S. R. Chidamber and C. F. Kemerer. A metrics suite for object oriented design. IEEE Transactions on Software Engineering, 20(6):pp. 476–493, 1994
12. J. Bansiya, C.G Davis, “A Hierarchical Model for Object-Oriented Design Quality Assessment”, IEEE Transactions on Software Engineering, 28: pp. 4—19, 2002.
13. Y. Kanellopoulos, T. Dimopoulos, C. Tjortjis and C. Makris, “Mining Source Code Elements for Comprehending Object-Oriented Systems and Evaluating Their Maintainability” ACM SIGKDD Explorations Vol.8 Issue 1, Special Issue on Successful Real-World Data Mining Applications, pp 33-40 June 2006.
14. Y. Kanellopoulos, C. Makris and C. Tjortjis, “An Improved Methodology on Information Distillation by Mining Program Source Code”, Elsevier’s Data & Knowledge Engineering, May 2007, Volume 61, Issue 2, pp. 359 - 383.
15. www.code4thought.org