
Development of a Regional Database for Studying Epidemiology of Maxillofacial Trauma

Detecting Interaction Variables in a Mixed Reality Systemfor Maxillofacial-guided Surgery
Daniela G. Trevisan1,3, Luciana P. Nedel2, Benoit Macq1, Jean Vanderdonckt3
1Communications and Remote Sensing LaboratoryUniversite catholique de Louvain (UCL)
Place du Levant 2, Bat. Stevin, 1348 – Louvain-la-Neuve – Belgium
2Instituto de Informatica – Universidade Federal do Rio Grande do Sul (UFRGS)Caixa Postal 15.064 – 91.501-970 – Porto Alegre – RS – Brazil
3Belgium Laboratory of Human Computer InteractionUniversite catholique de Louvain (UCL)
Place de Doyens 1, 1348 – Louvain-la-Neuve – Belgium
{trevisan,macq}@tele.ucl.ac.be, [email protected]
Abstract. To establish a relation between the user preferences and accuracywhile using a VR or MR system and the set of components (technical, functionaland perceptual) used in the system conception is yet a challenge. In this workwe study the user reaction in relation to image guided surgery applications us-ing different kind of visualization and guidance. Our goal is to identify practicalbasis that explains how mixed reality interfaces might provide support and aug-mentation for interactive applications. To accomplish that, we propose a modelthat allows the identification of the contribution of each independent variablein the final user interaction. The contribution rates were identified by applyinguser tests.
1. IntroductionOne of the most challenging aspects on the new interactive systems development lies onthe ability to integrate computer-based information into the real world. These kind ofsystems, so called mixed reality (MR) systems, are promising since they are capable ofoverlaying and registering digital information on the user’s workspace in a spatially mean-ingful way. This characteristic allows MR systems to be an extremely effective operatingmedium, once it is based on monitoring the state of the user and/or the environment inreal time, and adapting or augmenting the computational interface to significantly im-prove the user performance on the task execution. When applied to the medical surgerydomain, MR systems allow users to keep their environmental perception while havingintuitively access to more contextual information, such as the incisions location, regionsto be avoided, diseased tissues, and so on.
Human-computer interaction (HCI) research usually focuses on the design, im-plementation and evaluation of interactive systems in the context of a user’s task andwork [Dix et al. 1998]. Concerning medical applications, the generic design of human-computer interfaces for image-guided surgery (IGS) should deal with pre and intra-operative images displayed in the surgical environment to provide surgeons with some

kind of guidance [Trevisan et al. 2003]. In this typical application of MR systems, thevirtual world involves the pre-operative information (i.e. information acquired beforesurgery), while the real world corresponds to the intra-operative live information (i.e. in-formation acquired during the surgery). Both should be correctly aligned and displayedin real time. This scenario highlights the description of user interfaces for image-guidedsystems is not a trivial task.
In this work we are studying the user reaction in relation to IGS applications usingdifferent kind of augmentation. Our main objective with this usability test is to identifytheoretical and practical basis that explains how mixed reality interfaces might providesupport and augmentation for interactive applications. To accomplish that, we are usingthe results provided by user tests to find a model that allows the identification of thecontribution factor of each independent variable in the final user interaction. With thatother interactive mixed systems designed with the same variables can be described by theproposed model, reducing the time for user interaction estimation.
The paper is organized as follows. In Section 2 we presented the testbed ap-plication developed to carry on the evaluation method proposed, as well as the methodproposed by us to measure the system accuracy. In Section 3 we present all the aspectsneeded to proceed with the system usability evaluation and in Section 4 we describe ourexperiment preparation. In Section 5 we present our results and the discussion. Finally,in Section 6 we make final comments and about our on-going research.
2. Testbed Application2.1. System designIn collaboration with the Service de Stomatologie et Chirurgie Maxillo-faciale at SaintLuc Hospital, in Brussels, we proposed the development of an application using a mixedreality interface to guide surgeons in a maxillofacial surgery. The goal of this applicationis to increase the first surgery success, avoiding a second intervention. To achieve thisobjective, we are mixing real and virtual images by projecting a virtual guidance path-line on the patient mandible live video images. Then, the surgeon should cut the patientmandible paying attention to follow this path-line and avoiding touching the dental nerve.The time involved in this procedure is not important, but the accuracy is mandatory.
Two main scenarios are explored in this study, considering virtual and augmentedguidance. The virtual guidance scenario provides the 3D visualization (in the screen) ofthe tool trackers and the reconstructed mandible. The interactive task consists in cuttingthe mandible following, as best as possible, the path-line shown in the screen. When thesurgeon touches the good position (over the real object), the virtual representation of thesurgical tracked tool becomes green (see Figure 1(b)). Another dynamic sphere attachedto the tracked tool indicates the distance from the tool to the dental nerve. Additionalinformation, such as, where is located the internal structure (dental nerve), are providedby using transparency visualization effects. Manipulations with the virtual object such asrotation, scale and zooming are allowed at any time. The augmented guidance scenarioprovides the visualization (in the screen) of the 3D elements superposed to live videoimages. This scenario presents two alternatives according to which information are dis-played in the scene. In the first variant, the path-line is projected over the video image.When the user touches the correct position (over the real object), a sphere representing the
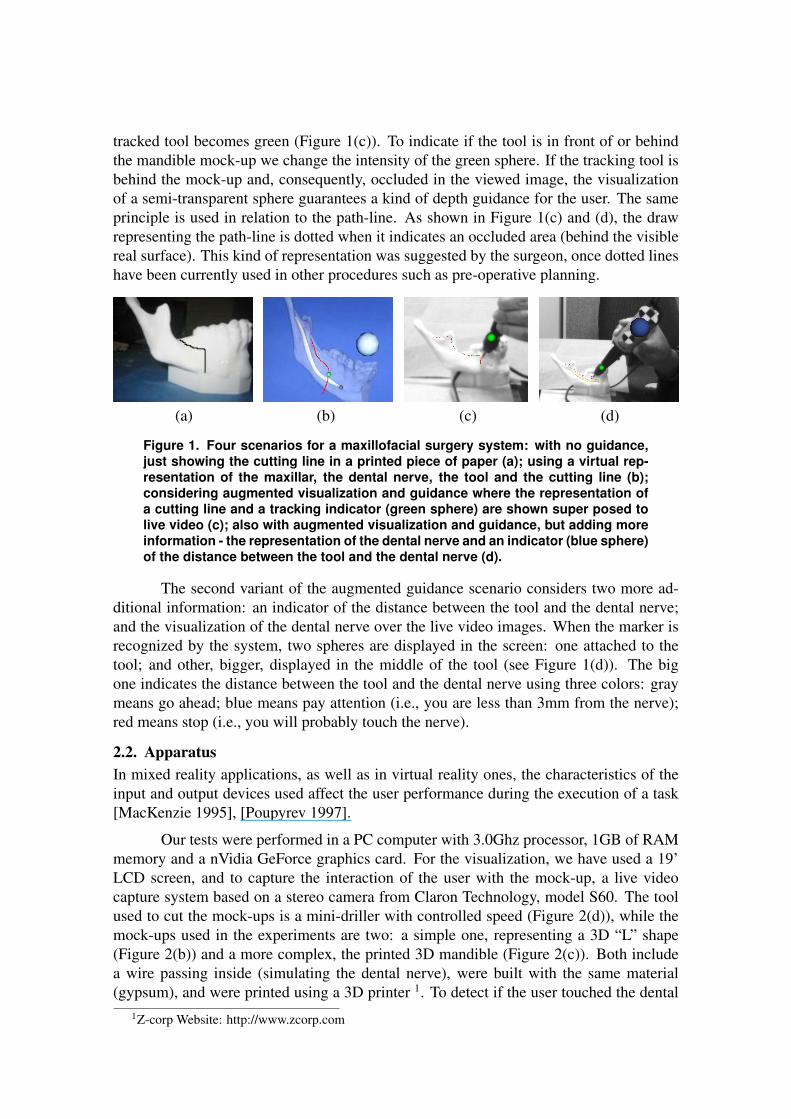
tracked tool becomes green (Figure 1(c)). To indicate if the tool is in front of or behindthe mandible mock-up we change the intensity of the green sphere. If the tracking tool isbehind the mock-up and, consequently, occluded in the viewed image, the visualizationof a semi-transparent sphere guarantees a kind of depth guidance for the user. The sameprinciple is used in relation to the path-line. As shown in Figure 1(c) and (d), the drawrepresenting the path-line is dotted when it indicates an occluded area (behind the visiblereal surface). This kind of representation was suggested by the surgeon, once dotted lineshave been currently used in other procedures such as pre-operative planning.
(a) (b) (c) (d)
Figure 1. Four scenarios for a maxillofacial surgery system: with no guidance,just showing the cutting line in a printed piece of paper (a); using a virtual rep-resentation of the maxillar, the dental nerve, the tool and the cutting line (b);considering augmented visualization and guidance where the representation ofa cutting line and a tracking indicator (green sphere) are shown super posed tolive video (c); also with augmented visualization and guidance, but adding moreinformation - the representation of the dental nerve and an indicator (blue sphere)of the distance between the tool and the dental nerve (d).
The second variant of the augmented guidance scenario considers two more ad-ditional information: an indicator of the distance between the tool and the dental nerve;and the visualization of the dental nerve over the live video images. When the marker isrecognized by the system, two spheres are displayed in the screen: one attached to thetool; and other, bigger, displayed in the middle of the tool (see Figure 1(d)). The bigone indicates the distance between the tool and the dental nerve using three colors: graymeans go ahead; blue means pay attention (i.e., you are less than 3mm from the nerve);red means stop (i.e., you will probably touch the nerve).
2.2. ApparatusIn mixed reality applications, as well as in virtual reality ones, the characteristics of theinput and output devices used affect the user performance during the execution of a task[MacKenzie 1995], [Poupyrev 1997].
Our tests were performed in a PC computer with 3.0Ghz processor, 1GB of RAMmemory and a nVidia GeForce graphics card. For the visualization, we have used a 19’LCD screen, and to capture the interaction of the user with the mock-up, a live videocapture system based on a stereo camera from Claron Technology, model S60. The toolused to cut the mock-ups is a mini-driller with controlled speed (Figure 2(d)), while themock-ups used in the experiments are two: a simple one, representing a 3D “L” shape(Figure 2(b)) and a more complex, the printed 3D mandible (Figure 2(c)). Both includea wire passing inside (simulating the dental nerve), were built with the same material(gypsum), and were printed using a 3D printer 1. To detect if the user touched the dental
1Z-corp Website: http://www.zcorp.com

nerve or not during the experiment, we have developed an electronic circuit (Figure 2(a))connecting the wire and the tool. It produces a sound alarm and a visual feedback (usinga LED) when the tool touches the wire.
Figure 2. Experimental scenario tools
2.3. Accuracy measurement
A huge problem involved in the evaluation of virtual and mixed reality system is thenumber of constraints imposed by its components and the dependencies identified amongthese components [Azuma 1997]. Trying to minimize the intervention of each componentof the system in the final evaluation, we calculated our system performance by estimatingthe global and local errors.
The local error (el) is calculated by computing the sum of the error estimation forall factors that can insert noise in the system: the tracker (etr), the user interaction (eui),the registration (ereg) and the printed model (epm).
el = etr + eui + ereg + epm (1)
The global error (eg) is provided by calculating the distance from the points pickedby the user to the registered object. We can say that global error is approximately equalto the local error estimation.
Error estimation for our system is calculated as follows.
2.3.1. Tracking error
A relevant factor for the tracked object accuracy relates to the way we dispose the markers.Due to the lever effect, the farther apart the Xpoints (Figure 3) at the ends of a vector, thelower the error in measuring the vector’s orientation in space, and, therefore, the lowerthe error in extrapolating object positions of interest, such as the tool used by us to cutthe jaw. The drawing in Figure 3 demonstrates this effect by showing a tool position errorrange for two different placements of the Xpoints. To minimize extrapolation error, oneend of the longer vector should be placed as close to the tool tip as possible, and the otheras further away from it as possible. We have tested two designs of markers for our trackedtool. We have computed 1000 poses for each design and the RMS errors for the trackedtool tips positions are depicted in Table 1.

Figure 3. Relating the tool tip definition accuracy and the markers placement
Table 1. Tool tip precision error for 1000 posesRMSE for the
Design l(mm) d(mm) ef ett tool tiptracked poses
1 60.55 118.91 0.17 0.5564 0.56802 117.1933 58.5695 0.20 0.3470 0.3620
If d is small relative to l, the tip error is dominated by the Xpoint error (roughly,calibration error + jitter, typically in the range 0.2mm to 0.4mm RMS2). If d is largerelative to l, the error is dominated by the ratio d/l. As a rule of thumb, to ensure thatRMS error at the tip is sub-millimeter, keep l ≥ d. Analyzing the Table 1, we verify thatthe marker configuration for the Design 2 is most accurate then the one used for Design 1fitting the expected range (0.2mm to 0.4mm). We have used such design for our tests.
2.3.2. User interaction error
We call user interaction error, the imprecision of the user while interacting with the systemand is directly related to the dexterous ability of each user. To evaluate the precision ofsuch interaction we have performed a sequence of 15 tests with 15 users that provideus the RMS and the standard deviation for the user interaction error. The test consists inpicking the 4 corners of one of the faces of the L mock-up. As the real distance and anglesbetween these points are known, we can compare it with the distances and angles givenby the acquired 3D points. Table 2 shows the RMS error and standard deviation computedfrom 15 users essays. As these points were acquired by the users while using the trackingsystem and the tracking error (etr) is known, the user interaction error (eui) should bethe values collected during the experiments, minus the tracking error, or yet 0.048mm.If the user that will operate the system performs such calibration procedure before theregistration procedure, the system will be able to compute a personalized performance forthis user.
2Information given by the manufacter.

Table 2. RMS error and standard deviation for distances and angles calculatedfrom the points picked by the users to the real corners positions.
RMSE STDDistances (mm) 0.41 0.66Angles (radians) 0.06 0.025
2.3.3. Printed model error
The final printed object were scanned (with a laser scanner) and compared with the initial3D model using the Inspector Software to align and register the models. For the “L”shape,virtual and real mock-ups are overlapped with a precision of 0.20mm.
2.3.4. Registration error
For the registration between virtual and real objects we are using the method describedin [Quentin et al. 2004]. While using such algorithm we should pay attention to threeparameters that influence the accuracy of the method: the number of points one shouldacquire to characterize the object surface, the pattern along which those points should beacquired, and the resolution needed for the Euclidean distance map. For the resolution,we assume the values found by [Quentin et al. 2004], where a resolution similar to theinternal slice resolution of the image yields good results. Improving the distance trans-formation resolution further does not benefit to the accuracy. For the number of pointsand which pattern to consider we have performed a sequence of tests and found 20 pointsalong the contour of the mandible and 12 points on the corners of the “L” has producedacceptable registration matching. We can verify it comparing the global error estimationwith the sum of the local errors. As a result of the registration step we are able to com-pute the global error by calculating the distance from the points picked by the user to theregistered object. Then using equation (1) we can find the registration error
ereg ≈ eg − etr − eui − epm (2)
We have found global registration error from 0.8mm to 1.5mm which give us afiltered registration error from 0.24mm to 0.94mm. Such results seem to fit the rangeerror of 0.17mm to 0.38mm previously computed in simulations [Quentin et al. 2004].
3. Evaluating the System UsabilityMany new interaction techniques are emerging from 3D and virtual technologies look-ing for more natural interactions. However, the same problems regarding the 3D visu-alization are still there in addition to other specific factors. We can resume the differ-ent results found in experiments regarding evaluation of 3D interactions in VR worlds[Poupyrev 1997], [Forsberg et al. 1996], [Bowman et al. 2002], [Nedel et al. 2003] bysaying that the 3D visualization could help the user interaction if the dominant perceptualcues (i.e. depth cues involving motion parallax, shadows, transparency, etc.) are identi-fied and adapted for each application. In the next section we describe how we designedour scenarios for usability tests.

Table 3. Scenarios used in the tests sessions. The numbers in the “kind ofguidance” column correspond to: (1) no guidance; (2) visualization of the path-line with distance indicator; (3) visualization of the path-line with its distanceindicator and the internal structure (dental nerve) visualization with its distanceindicator.
Scenario Kind of Kind of Kind ofvisualization guidance display
1 none (1) —-2 virtual (3) screen3 augmented (2) screen4 augmented (3) screen
3.1. Scenarios considered
For the evaluation tests, we considered 4 different scenarios: (1) no guidance and novisualization scenario; (2) virtual guidance and visualization scenario; (3) augmentedguidance and visualization scenario; (4) augmented guidance and visualization scenariowith feedback about the contact with the dental nerve.
In the no guidance scenario none computer guidance is provided to the user. Threedifferent views of the path-line (as seen in Figure 1(a)) are shown to the user in a pieceof paper and the user should cut the mock-up just checking this piece of paper. Thisscenario corresponds to the real currently situation and will serve as reference scenarioto measure the value added by the guidance provided by the other scenarios. The other 3scenarios were previously explained in Section 2.1. Table 3 summarizes the 4 proposedscenarios. For technical limitations, at this stage of the work we are just considering the“L” mock-ups. Despite we also made some tests using mandible mock-ups, these are notyet sufficient to correctly evaluate interaction in our system.
3.2. Independent and dependent variables
Independent variables are the experiment variables that are manipulated to generate dif-ferent conditions to compare. In this mixed reality experience, we established the kindof guidance and visualization as independent variables. Dependent variables are the mea-sures taken as the performance indicative or level of acceptance of the technique by theusers. The dependent variables used in our experiment were: precision on task execu-tion (we measure the user precision by calculating the distance between the path-lineand the line drawn by the user); time to perform the task; task performance (Preci-sion/Time); workload (based on the result given by the subjective NasaTLX post-test[Hart and Staveland 1988]).
4. The Experiment
4.1. Task description
The task is always the same for the 4 considered scenarios and consists in cutting themock-up reproducing as best as possible the indicated trajectory without touching theinternal hidden structure (dental nerve). There is no limit time to accomplish the task.Before starting the main task execution, the user has free time for training. The trainingconsists in performing sub-tasks that allow the user to understand how the system will
provide guidance in each scenario. We proposed two sub-tasks: user perception calibra-tion and motor calibration.
In the perception calibration task the user should select arbitrary points over themock-up surface. These points are indicated in the virtual or augmented scene. This taskis done once without guidance (i.e., the user perceives the point in the virtual or augmentedscene and then performs the task) and then with guidance (i.e., when the user is pointingthe good position, a small sphere representing the tracked tool tip becomes green). Thistask is performed in the virtual and augmented scenarios. In the augmented scenarios, thetracked tool tip becomes transparent and the path-line visualization is dotted if the surfaceis occlusion. Time and precision (i.e., performance) for the user task accomplishment arecomputed.
In the motor calibration procedure, the user should cut a trajectory drawn over themock-up surface. In this case, the mock-up resistance is the same used to execute themain task. Time and precision (i.e., performance) for the user task accomplishment arecomputed.
4.2. Subjects and procedure
Sixteen users volunteered for experience the tasks: 14 males and 2 females, with a meanage of 24 years. Each participant tested only one of the designed scenarios to avoid thelearning effect. Each scenario was tested 4 times. Before each session, the mock-upshould be calibrated and registered. Session length varied according to the index of diffi-culty given by the kind of guidance, kind of visualization, and the level of the individualmotor coordination of each user. The subjects were tested individually. Considering thevirtual 3D scenario, users were carefully informed how to use the manipulation com-mands (i.e. translation, rotation and zoom), but they were left free to use it or not duringexperimental trial. At the end of the test, each user was asked to answer the NasaTLXquestionnaire [Hart and Staveland 1988].
5. Results and Discussion
We are not interested just in find a number representing the final user performance; wewant to be able to decompose such result by identifying all parameters involved in thefinal performance. The goal of such model is to assist in the design of future user mixedinterfaces as well as to predict the performance of operators avoiding to apply series ofusability user tests.
Some known metrics has been used to compute performance and movement timein many experiments. For instance, the Fitts’ law [Fitts 1954] is an effective method ofmodeling rapid, aimed movements, where one appendage (like a hand) starts at a spe-cific start position, and moves to rest within a target area. However, Fitts’ law predictsmovement in just one dimension. Fitts’ original experiments tested human performancein making horizontal moves toward a target. Both the amplitude of the move and thewidth of the terminating region were measured along the same axis. It follows that themethod is inherently one-dimensional. So, when dealing with two or three dimensionaltarget acquisition tasks, new interpretations of target width must be considered. Anothermajor deficiency is the absence of a consistent technique for dealing with errors.

5.1. Computing precision
For each tested scenario, the Euclidean distance between the reference and the final path-line performed by the user were calculated, providing the final user precision. Both path-lines (i.e. reference and final, Figure 4) were acquired in the same way, i.e., digitalizingpoints over the surface trajectory with the tracked tool. The task accomplishment involvesthe cutting of the real mock-up. However, to calculate the Euclidean distance between thereference and the user performed path-lines, we are first projecting the line designed bythe user on the mock-up surface to fit the requirements of the reference line, also designedon the mock-up surface.
(a) (b)
Figure 4. Result of user interaction for variables configuration given by scenario2 (a), and by scenario 1 (b). Red line represents the ideal suggested path whilethe white line represents the final user interaction.
Our results are expressed in terms of the mean distance and standard deviationcalculated for each scenario. We are not considering the time variation because the preci-sion of the task is more important than time for our tests. Smaller is the distance, betterwill be the interaction technique (Figure 5(a)). As we are not using all functionalities thatcould be provided by AR systems, such as the use of a head mounted display, we arenot interested in a comparison between 3D visualization and AR. Instead, we are moreinterested in identifying how the independent variables involved in these two types oftechniques (3D and AR) are influencing the interaction. Despite the 3D visualization of-fers better spatial perception, AR visualization presents more realistic representation ofthe real scene by projecting virtual objects over the video live images. Once the final userperformance was calculated for each scenario, we can compare the scenarios 2, 3 and 4with the scenario 1 (neither guidance nor visualization) and extract the performance gainof each one. Such gain is attributed to the influence of the guidance and visualization onthe task accomplishment.
The performance gain given by the visualization can be deduced from the assessedperception calibration task (Section 4.1). We assume that the remaining performance gainis divided between user motor performance and guidance. User motor performance wasassessed during the motor calibration tests (Section 4.1) and we assume it is constant forall scenarios. We found a mean of 1.31mm with a deviation standard of 0.47mm.
Concerning the workload we obtained that the higher workload rating coincidewith the kind of guidance 3, where the user has more guidance information. The work-load rating was normalized to be plotted together with the other two assessed variables(Figure 5(b)).

(a) (b)
Figure 5. Precision of the user interaction in the four proposed scenarios (a), andindependent variables influence in each scenario (b).
As the users were not experts in the application domain and very poor informationwas provided in scenario 1, users were not very aware about the path to follow and lessmental effort was spent for the task execution in this scenario. It reflects the low workloadlevel found in scenario 1 (Figure 5(b)).
5.2. Defining the model
Once we have created our data set we want to identify how the captured variables are re-lated. To do that we have used the Spearman’s test where significant correlation was foundbetween precision and visualization (p = 0.0241), and between precision and guidance(p = 0.0306). No significant correlation was found between visualization and guidance.
Based on such analysis the user interaction can be expressed by the followingexpression:
I ≈ αVi + βGj + γ + ε (3)
where the indexes i, j represent the values that the variables Vi (kind of visualiza-tion with i= 1, 2, 3), Gj (kind of guidance with j= 1, 2, 3), γ (constant for the user motorcalibration), α and β (contribution factors for the final interaction I), and ε (error factor)can assume.
To solve such linear system we applied a SVD (Singular Value Decom-position) method which uses the least squares and pseudo-inverse computation[Peters and Wilkinson 1970]. Least square is a mathematical optimization technique thatattempts to find a best fit to a set of data by attempting to minimize the sum of the squaresof the ordinate differences (called residuals) between the fitted function and the data.
In mathematical terms, we want to find a solution for the equation[AT A
]C = AT I (4)
where A is an m-by-n matrix of variables (with m > n) and C and I are n-respectively (vector of constants α, β,γ) m-dimensional (vector of final user interactions)column vectors.
We have found α = 0.6, β = 0.5 (for visualization and guidance respectively), γ =1.31 (value previously measured in Section 4.1).
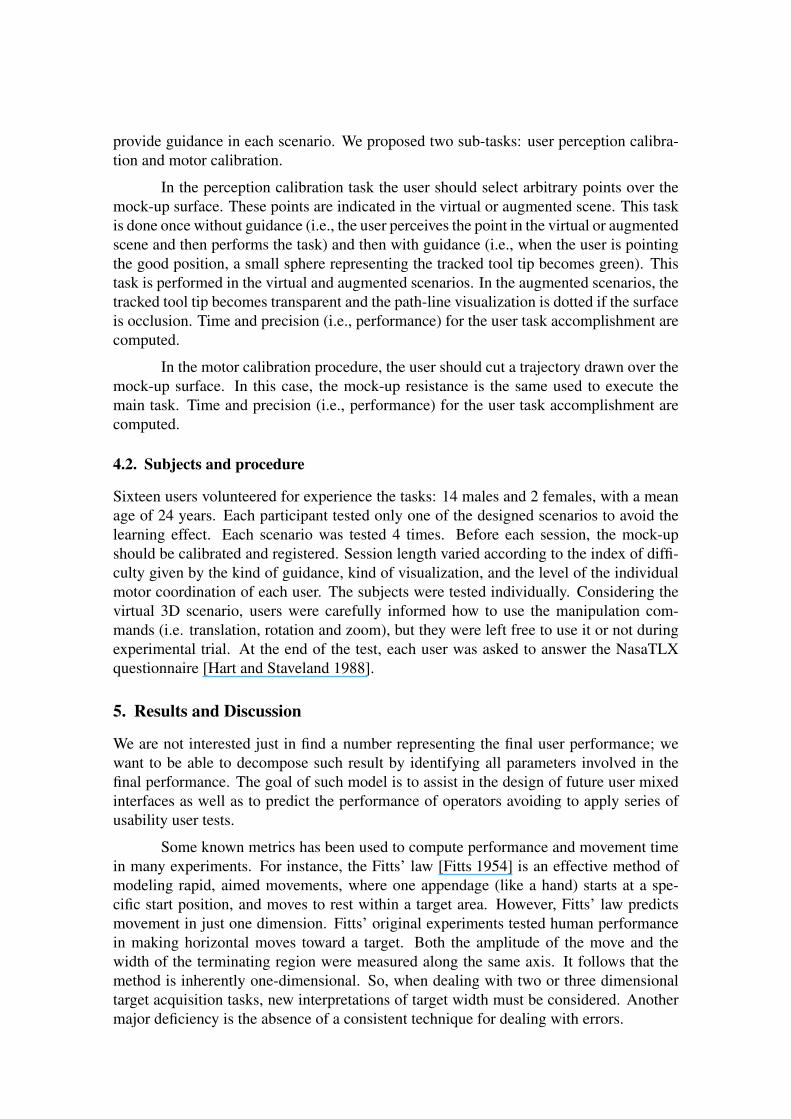
Figure 6. Approximation given by the proposed model
By plotting the data set (Figure 6) we observe a good approximation with theproposed model. As a preliminary result we observe that visualization has more influencethan guidance for our experiment. It reinforces the results shown in Figure 5(a), wherethe virtual visualization with the same amount of guidance has provided better precision.
6. Conclusions and Future Work
In this paper we presented the strategy we developed to evaluate the usability of mixedreality systems, precisely, the use of mixed reality in surgery. First of all, we brieflypresented the problem we are trying to solve and the application developed to be usedas a testbed application. Then, we explained how we have calculated the errors inherentfrom the computer system, devices used and user interaction. That is used for measuringthe overall accuracy. The experiment was described in detail and the method we usedto evaluate the system interaction presented. By analyzing the interaction between ourassessed variables, it is apparent that the workload augments according to the amountof guidance provided. As the workload index was measured with very subjective tests,more concrete and objective evaluation should be envisaged to assess such influence. Forinstance, analysis of biological signals to capture user’ state (such as stress) could becombined with the NasaTLX results.
On the other hand, the precision of the interaction technique varies according tothe guidance and visualization choices. In this way a model to describe the final userinteraction based on such variables influence was proposed. As a result, future interac-tive mixed systems can use such model to estimate interaction at early stages of systemdevelopment or adapt the model to better fit your own system variables.
At the moment we have just tested our model taking into account the error factorfound to best fit our first data set. In our on-going work we are doing the user tests withthe mandible mock-up, what will augment our results reliability. Then, we will tabulatethe tests results and extract our conclusions related to the index of task difficulty. Withthis procedure, we intend to highlight the influence of each system component (kind ofvisualization, kind of guidance, and kind of mock-up) in the final user performance. Theresults obtained from this evaluation will be then combined with the suggestions proposedby the use of DesMiR [Trevisan et al. 2004] design space.

AcknowledgementsWe gratefully acknowledge the support from the MERCATOR project under con-tract WALEO 21/5129 and SIMILAR Network of Excellence (FP6-507609), CNPq(Brazilian Council for Research and Development) projects number 478721/2003-0 and306099/2004-7, and the Brazilian Education Ministry (MEC-CAPES) for financial sup-port. We also thank all the colleagues that participated as subjects in the experiments.
ReferencesAzuma, R. T. (1997). A survey of augmented reality. Presence: Teleoperators and Virtual
Environments, 6(4):355–385.
Bowman, D., Gabbard, J., and Hix, D. (2002). A survey of usability evaluation in virtualenvironments: Classification and comparison of methods. Presence: Teleoperatorsand Virtual Environments, 11(4):404–424.
Dix, A., Finlay, J., Abowd, G., and Beale, R. (1998). Human Computer Interaction.Prentice Hall Europe.
Fitts, P. M. (1954). The information capacity of the human motor system in controllingthe amplitude of movement. Journal of Experimental Psychology, 47:381–391.
Forsberg, A., Herndon, K., and Zeleznik, R. (1996). Effective techniques for selectingobjects in immersive virtual environments. In Proc. ACM UIST’96 Symposium onUser Interface Software and Technology (UIST). ACM Press.
Hart, S. G. and Staveland, L. E. (1988). Development of NASA-TLX (Task Load Index):results of empirical and theoretical research. Elsevier Science, North-Holland.
MacKenzie, I. (1995). Virtual Environments and Advanced Interface Design. OxfordUniversity Press, NY.
Nedel, L. P., Freitas, C. M. D. S., Jacob, L. J., and Pimenta, M. (2003). Testing the use ofegocentric interactive techniques in immersive virtual environments. In Interact 2003,pages 471–478. IFIP.
Peters, G. and Wilkinson, J. H. (1970). The least squares problem and pseudo-inverses.Comput. J., 13:309–316.
Poupyrev, I. e. a. (1997). A framework and testbed for studying manipulation techniquesfor immersive vr. In ACM Symposium on Virtual Reality Software and Technology,Lausanne, Switzerland. ACM.
Quentin, N., Matthieu, F., Yves, V., Etienne, O., Benoit, M., and Olivier, B. (2004).Registration and real-time visualization of transcranial magnetic stimulation with 3-dmr images. IEEE Transactions on Biomedical Engineering, 51:1994–2005.
Trevisan, D., Vanderdonckt, J., Macq, B., and Raftopoulos, C. (2003). Modeling in-teraction for image-guided procedures. In Proceedings of International Conferenceon Medical Imaging SPIE2003 (San diego, 15-20 February 2003), K. Hanson, C.-T.Chen, E.L. Siegel (eds.), volume 5029, pages 108–118. International Society for Opti-cal Engineering.
Trevisan, D. G., Vanderdonckt, J., and Macq, B. (2004). Conceptualizing mixed spaces ofinteraction for designing continuous interaction. Virtual Reality Journal, 8(2):83–95.
Copyright © 2022 FDOKUMEN