Detail Engineering Completion Rating Index System (DECRIS ...
31
sustainability Article Detail Engineering Completion Rating Index System (DECRIS) for Optimal Initiation of Construction Works to Improve Contractors’ Schedule-Cost Performance for Offshore Oil and Gas EPC Projects Myung-Hun Kim 1,2 , Eul-Bum Lee 2, * and Han-Suk Choi 2 1 POSTECH University & Hyundai Heavy Industries, Engineering Management Team, 400 Bangeojinsunhwan-doro, Dong-gu, Ulsan 44114, Korea; [email protected] 2 Graduate Institute of Ferrous Technology & Graduate School of Engineering Mastership, Pohang University of Science and Technology (POSTECH), 77 Cheongam-Ro, Nam-Ku, Pohang 37673, Korea; [email protected] * Correspondence: [email protected]; Tel.: +82-54-279-0136 Received: 9 April 2018; Accepted: 12 July 2018; Published: 14 July 2018 Abstract: Engineering, Procurement, and Construction (EPC) contractors with lump-sum turnkey contracts have recently been suffering massive profit losses due to re-works and schedule delays in offshore oil and gas EPC megaprojects. The main objective of this research is to develop and implement a detail engineering completion rating index system (DECRIS) to assist EPC contractors to optimize fabrication and construction works schedules while minimizing potential re-work/re-order. This is achieved through adequate detail design development and results in minimizing schedule delays and potential liquidated damages (i.e., delay penalties). The developed DECRIS was based on findings from an extensive review of existing literature, industry-led studies, expert surveys, and expert workshops. The DECRIS model is an evolution, and improvement of existing tools such as the project definition raking index (PDRI) and front-end loading (FEL) developed specifically for the early stage of engineering maturity assessment (i.e., planning, basic design, and front-end engineering design (FEED)), prior to EPC projects. The DECRIS was evaluated and validated with thirteen sample as-built offshore megaprojects completed recently. When the DECRIS was applied to the completed projects post-hoc, a correlation (R-squared 0.71) was found between DECRIS scores and schedule/cost performances. This is much superior to the PDRI-Industrial model’s correlation (R-squared 0.04), which was primarily devised for owners’ basic engineering or FEED completion assessment. Finally, as a means of further validation, project schedule and cost performance of an ongoing project was predicted based on the correlations found on the thirteen completed projects. The resultant predicted schedule and cost performance was well matched with the current project performance status. Based on the accuracy of the DECRIS model found in the validation, said model is an effective prospective tool for EPC contractors to manage their engineering and procurement/construction risks during the initial detail design stages. Keywords: oil and gas megaproject; engineering; procurement and construction (EPC) project; DECRIS; schedule and cost integration; risks control; profitability; sustainability 1. Introduction Crude oil was historically supplied solely by onshore reservoirs until the 1970s, when these reservoirs were found to be insufficient to meet the growing global oil and gas demand. To supplement demand, deep-water offshore projects were initiated in the 1990s and they now account for about 10% Sustainability 2018, 10, 2469; doi:10.3390/su10072469 www.mdpi.com/journal/sustainability
-
Upload
khangminh22 -
Category
Documents
-
view
1 -
download
0
Transcript of Detail Engineering Completion Rating Index System (DECRIS ...

sustainability
Article
Detail Engineering Completion Rating Index System(DECRIS) for Optimal Initiation of ConstructionWorks to Improve Contractors’ Schedule-CostPerformance for Offshore Oil and Gas EPC Projects
Myung-Hun Kim 1,2, Eul-Bum Lee 2,* and Han-Suk Choi 2
1 POSTECH University & Hyundai Heavy Industries, Engineering Management Team,400 Bangeojinsunhwan-doro, Dong-gu, Ulsan 44114, Korea; [email protected]
2 Graduate Institute of Ferrous Technology & Graduate School of Engineering Mastership, Pohang Universityof Science and Technology (POSTECH), 77 Cheongam-Ro, Nam-Ku, Pohang 37673, Korea;[email protected]
* Correspondence: [email protected]; Tel.: +82-54-279-0136
Received: 9 April 2018; Accepted: 12 July 2018; Published: 14 July 2018�����������������
Abstract: Engineering, Procurement, and Construction (EPC) contractors with lump-sum turnkeycontracts have recently been suffering massive profit losses due to re-works and schedule delaysin offshore oil and gas EPC megaprojects. The main objective of this research is to develop andimplement a detail engineering completion rating index system (DECRIS) to assist EPC contractors tooptimize fabrication and construction works schedules while minimizing potential re-work/re-order.This is achieved through adequate detail design development and results in minimizing scheduledelays and potential liquidated damages (i.e., delay penalties). The developed DECRIS was basedon findings from an extensive review of existing literature, industry-led studies, expert surveys,and expert workshops. The DECRIS model is an evolution, and improvement of existing tools suchas the project definition raking index (PDRI) and front-end loading (FEL) developed specificallyfor the early stage of engineering maturity assessment (i.e., planning, basic design, and front-endengineering design (FEED)), prior to EPC projects. The DECRIS was evaluated and validatedwith thirteen sample as-built offshore megaprojects completed recently. When the DECRIS wasapplied to the completed projects post-hoc, a correlation (R-squared 0.71) was found betweenDECRIS scores and schedule/cost performances. This is much superior to the PDRI-Industrialmodel’s correlation (R-squared 0.04), which was primarily devised for owners’ basic engineering orFEED completion assessment. Finally, as a means of further validation, project schedule and costperformance of an ongoing project was predicted based on the correlations found on the thirteencompleted projects. The resultant predicted schedule and cost performance was well matched withthe current project performance status. Based on the accuracy of the DECRIS model found in thevalidation, said model is an effective prospective tool for EPC contractors to manage their engineeringand procurement/construction risks during the initial detail design stages.
Keywords: oil and gas megaproject; engineering; procurement and construction (EPC) project;DECRIS; schedule and cost integration; risks control; profitability; sustainability
1. Introduction
Crude oil was historically supplied solely by onshore reservoirs until the 1970s, when thesereservoirs were found to be insufficient to meet the growing global oil and gas demand. To supplementdemand, deep-water offshore projects were initiated in the 1990s and they now account for about 10%
Sustainability 2018, 10, 2469; doi:10.3390/su10072469 www.mdpi.com/journal/sustainability

Sustainability 2018, 10, 2469 2 of 31
of the total global oil supply [1]. In 2011, shale oil and gas were introduced to the oil and gas marketwith the development of cost-effective hydrofracturing technologies. This has led to an over-supply ofoil and gas and, consequently, an era of low oil prices decreasing major oil companies’ profits [2].
An offshore project requires a significant amount of early investment for drilling and productionfacility design and construction. To combat lower revenues and increase profits, major oil companieshave placed a great deal of attention on cost-saving strategies in these early stages for offshore oiland gas projects [3]. However, these strategies are often poorly planned and implemented, leading toinadequate resource allocation, and improperly accelerated design and construction. This all results inpoor quality of work, schedule overrun, and even safety-related accidents on site [2].
Therefore, how can planning be improved? Merrow collected and analyzed project performancedata on 100 megaprojects, finding that the success of upstream activities (i.e., planning and earlydesign) is one of the important factors for project success. Without this planning, Merrow found over65% of the projects studied (>65%) reported project failure in cost, schedule, and/or production [4].Decisions made during the detail design stage have significant impact on the overall constructioncost and schedule. Errors and omissions at this stage cause construction delays and often result inreconstruction, especially in lump-sum turnkey contracts, which are overwhelmingly adopted forEngineering, Procurement, and Construction (EPC) megaprojects. The resultant construction delayand reconstruction results in owners’ claims, namely liquidated damages and performance liquidateddamages, which are major reasons for the EPC Contractor’s profit losses. In particular, incompleteand/or inaccurate designs for fabrication (i.e., steel cutting), one of the most critical contract milestoneswhen initiating construction work stipulated on the contract, results in significant reconstruction andassociated labor hours. Oil and gas EPC contractors need a customized engineering completion modelto measure the completion rating in their engineering management decision-making process at thedesign stage to mitigate reconstruction and avoid costly consequences. As such, this paper focuses onaiding contractors in the initial design stages.
To compound the negative impacts of poor upfront project planning, many megaprojects areperformed to a very tight schedule. A tight schedule usually forces the EPC contractor to concurrentlydesign and construct the project, hoping to meet the owner’s deadline and avoid costly liquidateddamages. However, this concurrent design and construction, unless well planned, may lead to acostlier option due to a catastrophic ripple effect when the final design is significantly different fromthe partially complete design when construction started.
Concerning the contractor-owner relationship on conventional oil and gas projects, the owner hiresa contractor for construction only with fully approved for construction (AFC) engineering drawingsafter AFC completion. Alternatively, in EPC projects, the owner hires a contractor for engineering (finaldesign), procurement of equipment, and construction. This type of contract means that the selectedcontractor is responsible for completing the remaining design and procurement activities based on thefront-end engineering design (FEED) package developed by the project owner. Therefore, the contractormust consider all risks of detail design and procurement, including undetected discrepancies duringthe FEED verification period that may cause serious cost overrun and/or schedule delay.
Since the early 2000s, South Korean companies have been working as major EPC contractorsfor offshore oil and gas EPC projects, specifically upstream production facility projects. Three majorshipbuilders in South Korea have executed over 50% of worldwide offshore oil and gas EPC mega projects:H company, S company and D company. Since 2008, they have completed about 30 mega projects includingfixed platforms and floaters, typically so-called FPSO (Floating projection, storage and offloading) or FLNG(floating Liquefied Natural Gas). The offshore oil and gas EPC contractors have recently reported massiveprofit losses over US$ 10 bn as shown in Figure 1, between 2013 and 2015, after being awarded many EPCprojects since 2010.

Sustainability 2018, 10, 2469 3 of 31Sustainability 2018, 10, x FOR PEER REVIEW 3 of 31
Figure 1. Profit losses of EPC Contractor (Modified from Press Release [5]).
The reasons for recent profit losses and damages for Korean offshore EPC contractors in dealing with EPC megaprojects with lump-sum turnkey contracts are likely as follows (identified through subject matter expert interviews and literature review):
1. Lack of EPC Contractor’s capability of FEED verification to justify complex owner requirements; 2. Lack of experience in the use of exotic materials, and installation of special equipment; 3. Lack of experience in performing a fast-track process with a limited schedule; 4. Sub-order items including local content requirements in the host country that may impact on
project schedule; 5. Mandatory requirements to procure equipment from approved vendor list (AVL); 6. Owner requirements of single-point responsibility for various contractual liabilities; 7. Delay liquidated damages (so-called penalties) following schedule delay on EPC contractor are
unrealistically high (as much as US$ 1–2 million/day); and 8. Re-order for major equipment and critical bulk materials and reconstruction (re-work) due to early
fabrication start with incomplete detail design to comply with the completion date and milestones. [6]
Many, if not most, of these issues result from improper front-end project planning. To aid contractors in minimizing these issues, the focus of this study is to develop and implement a detail engineering completion rating index system to assist EPC contractors during the initial planning stages. The model aids contractors in determining the optimal starting time for fabrication and construction works to minimize potential re-work/re-order through adequate detail design development.
2. Literature Review
There has been minimal literature dedicated to incorporating an engineering completion rating index to the project schedule and cost performance for oil and gas EPC projects. The most significant existing index models found were the project definition rating index (PDRI) by the Construction International Institute (CII) [7–10] and the front-end loading (FEL) index by Independent Project Analysis (IPA) [4]. These tools are mainly developed and utilized to define the level of completion of FEED, which is an engineering task prior to EPC detail engineering. These two indexes are typically used by the project owner to quantify the level of project definition and basic engineering maturity and to determine whether the project can move to the next project development stage, typically an EPC contract. The model developed and presented within this paper evolved from these two indexes. As such, a detailed discussion on each model, and associated literature, is discussed below.
FEL measures the level of project definition at the front-end stage of a project, which is broken down into three stages. At the FEL-1 stage, the project definition is reviewed based on the conceptual design and business case evaluation results. In FEL-2, the result of basic design is reviewed. At the end of FEED (FEL-3), the entire FEED package is reviewed for the owner to make the final “Go” or “No-Go” decision, which will result in a significant financial investment and commitment by hiring an EPC
-4000
-3000
-2000
-1000
0
1000
2000
2014 2015 2016Pr
ofit
Loss
(Mill
ion
USD
)
H Company S Company D Company
Figure 1. Profit losses of EPC Contractor (Modified from Press Release [5]).
The reasons for recent profit losses and damages for Korean offshore EPC contractors in dealingwith EPC megaprojects with lump-sum turnkey contracts are likely as follows (identified throughsubject matter expert interviews and literature review):
1. Lack of EPC Contractor’s capability of FEED verification to justify complex owner requirements;2. Lack of experience in the use of exotic materials, and installation of special equipment;3. Lack of experience in performing a fast-track process with a limited schedule;4. Sub-order items including local content requirements in the host country that may impact on
project schedule;5. Mandatory requirements to procure equipment from approved vendor list (AVL);6. Owner requirements of single-point responsibility for various contractual liabilities;7. Delay liquidated damages (so-called penalties) following schedule delay on EPC contractor are
unrealistically high (as much as US$ 1–2 million/day); and8. Re-order for major equipment and critical bulk materials and reconstruction (re-work) due to
early fabrication start with incomplete detail design to comply with the completion date andmilestones [6].
Many, if not most, of these issues result from improper front-end project planning. To aidcontractors in minimizing these issues, the focus of this study is to develop and implement a detailengineering completion rating index system to assist EPC contractors during the initial planning stages.The model aids contractors in determining the optimal starting time for fabrication and constructionworks to minimize potential re-work/re-order through adequate detail design development.
2. Literature Review
There has been minimal literature dedicated to incorporating an engineering completion ratingindex to the project schedule and cost performance for oil and gas EPC projects. The most significantexisting index models found were the project definition rating index (PDRI) by the ConstructionInternational Institute (CII) [7–10] and the front-end loading (FEL) index by Independent ProjectAnalysis (IPA) [4]. These tools are mainly developed and utilized to define the level of completion ofFEED, which is an engineering task prior to EPC detail engineering. These two indexes are typicallyused by the project owner to quantify the level of project definition and basic engineering maturityand to determine whether the project can move to the next project development stage, typically anEPC contract. The model developed and presented within this paper evolved from these two indexes.As such, a detailed discussion on each model, and associated literature, is discussed below.
FEL measures the level of project definition at the front-end stage of a project, which is broken downinto three stages. At the FEL-1 stage, the project definition is reviewed based on the conceptual design andbusiness case evaluation results. In FEL-2, the result of basic design is reviewed. At the end of FEED (FEL-3),

Sustainability 2018, 10, 2469 4 of 31
the entire FEED package is reviewed for the owner to make the final “Go” or “No-Go” decision, whichwill result in a significant financial investment and commitment by hiring an EPC contractor. The projectdefinition is classified according to three sections: site factors, design status, and project execution plan.FEL is used to assess the project by numerically quantifying the project definition of each element undereach section and then aggregating them into a numeric index. When the FEL index is lower than apre-determined threshold value at each stage of FEL-1/2/3, over 50% of projects were successful in termsof cost and schedule performance. On the other hand, projects in the high range of the FEL index showedpoor project performance [4].
CII’s PDRI is an alternate assessment tool to IPA’s FEL as it serves the same purpose of measuringproject definition from the conceptual design stage to the FEED stage of a project. The PDRI’shierarchical structure is comprised of three sections, categories, and elements [7,8,10]. Three sectionsinclude: (a) the basis of project decisions; (b) basis of design; and (c) execution approach to holisticallyevaluate the project value, scope, definition, and readiness for next stages. The PDRI has 8 to 15 typesof categories for each section [7–10]. At the bottom of the PDRI hierarchy, each element specifies detailsthat can be individually reviewed. Each element is assessed on a scale of 1 to 5 (1 being highly welldefined and 5 being not defined at all) and an overall PDRI index is calculated using a scoresheetweighted and normalized for each element. Three to six PDRI reviews are recommended for the ownerduring the project planning, and FEED stages [11]. The most important PDRI review should be carriedout prior to the EPC contract, which is the final investment decision (FID). The CII recommends thatthe cutoff score of the PDRI at the end of the FEED stage should be 200 as the performance of a projectwith a score higher than 200 was historically not satisfactory in terms of cost and schedule [10,12].PDRI can help the owner manage project scope prior to a project authorization and/or the contractoridentify incomplete elements related to project scope definition [13].
Multiple publications were dedicated to testing PDRI’s effectiveness. Chu et al. [14] studied PDRIfor intelligent green building projects and adjusted weight factors for each element using an analyticalnetwork process, and they also expanded PDRI elements up to the project execution phase. In anotherstudy, with 51 surveys and statistical analysis, George et al. [15] found that seven major activities havemore impact on achieving project success among all activities conducted during front-end planning.This finding is aligned with the fact that PDRI elements are assigned different weights dependingupon the level of influence on project outcome. Pheng and Chuan [16] also identified using an analysisof variance (ANOVA) test the five most significant variables that affect work performance in theconstruction industry and recommended focusing on those significant variables to develop a betterworking environment. Since previous studies are limited to the front-end planning stage before anEPC contract is established, EPC contractors cannot directly apply the study results to the detaildesign process.
In the offshore oil and gas sector, FEL and PDRI are being used as an owner’s risk analysis tool [11].However, these tools focus on the earliest planning phases, stopping once the EPC contractor is selected.This means the tools are lacking and cannot cover the range of detail design and construction phaseactivities. Additionally, the characteristics of offshore oil and gas projects significantly differ fromthose of the other construction sectors, making the current FEL and PDRI tools difficult to use as anEPC contractor’s risk management tools.
3. Research Objectives and Contributions
The main objective of this research is to develop a detail engineering completion rating indexsystem (DECRIS) to calculate the engineering completion rating for offshore oil and gas EPC projects,validating efficacy using existing projects. The main objective of the DECRIS is to aid contractors inknowing when they have performed enough project development to begin fabrication. As schedulesare often very tight, it is important for fabrication to start as soon as possible. Thus, this paper focuseson the optimal point of fabrication start—steel cutting—in which the design is developed just enough(not more) to minimize re-work during the construction stage.

Sustainability 2018, 10, 2469 5 of 31
The main goals for this research are as follows:
• Research Goal 1—modeling of DECRIS by adjusting previous assessment tools such as PDRI canbe developed to measure the optimal progress of detail engineering to initiate the fabrication ofinitial modules in the scheduling critical path.
• Research Goal 2—the correlation between the developed DECRIS score and the construction costand schedule performance.
The research scope of building the DECRIS framework is limited to fixed platforms and floaterssuch as FPSO and FLNG in offshore oil and gas EPC projects. Other types of offshore structures andsubsea structures are excluded in this study.
From discussion with industry experts, and as defined within this paper, the existing tools (PDRIand FEL) are more than adequate in aiding owners through pre-planning of specific types. However,they generally stop at the stage of executing a contract with the contractor and are not tailored forcontractor procurement/fabrication scheduling nor the oil and gas industries. As such, one of the maincontributions of this research is to present a superior tool than before, focusing on FEED engineeringcompletion prior to EPC projects. What is most lacking for oil and gas projects in using the PDRIand/or FEL methods is when to begin fabrication (discussed above). As such, the DECRIS’s addedbenefit to the industry is most significantly aiding the contractor in finding the optimal point of thefabrication start of the oil and gas EPC projects.
To provide support that the presented tool is better than existing tools, thirteen offshore EPCmegaprojects recently completed are presented (in Section 6.1) for the verification of the DECRISmodel. Analysis is performed on the tool’s ability to predict the real projects’ actual cost and scheduleperformance data. The DECRIS model can contribute to industry as a decision support tool during theEPC contract execution stage to assist EPC contractors in making informed and timely decisions oninitiating their construction work activities.
4. Research Methodology for the DECRIS Model
The DECRIS methodology follows the PDRI approaches in its development, which has beenproven through existing literature to develop a simple assessment model to solve a complex projectproblem. The methodology used to develop the model of the DECRIS model is depicted in Figure 2.
It involves six steps:
(1) DECRIS model scope determination: collect the preliminary elements from the existing literatureand develop the element description
(2) Data collection: a workshop was performed with industry experts to determine elements thataffect the calculation of the detail engineering completion rating and to organize the identifiedelements in proper sections and categories. The expert survey was also used for data collection tocalculate the relative importance of each element to engineering completion.
(3) Data normalization: to determine the weight factor for each of the DECRIS elements usingthe data from the expert survey, data normalization, preliminary estimate, validation process,element average weight calculation, and interpolation were carried out.
(4) Data analysis: one sample t-test is used to finalize the weight factor of each element. The weightfactor of each element indicates the level of importance of the element’s contribution to the detailengineering completion rating index.
(5) Data application: the DECRIS model developed through the previous research stages isverified by applying it to the 13 sample projects. Each project was assessed using the DECRISlevel assessments.
(6) Model verification: the score outputs were then compared with the project performances ofeach project (using statistical analyses) to see the level at which the model could predict projectperformance. A cutoff score was then developed based on the model and sample projects.

Sustainability 2018, 10, 2469 6 of 31Sustainability 2018, 10, x FOR PEER REVIEW 6 of 31
Figure 2. DECRIS Model Development Flowchart.
5. DECRIS Model Development
5.1. Step 1: DECRIS Model Scope Determination: Preliminary Elements
In this step, the authors collect preliminary elements (so-called draft of DECRIS elements) from existing literature. This acts as a starting point to define, roughly, the elements which affect detail engineering completion. The preliminary element list is the full set of the possible element items, discovered through a literature review, to determine the assessment scope of DECRIS. This is also used for step two when discussing and refining said exhaustive list of elements to be used in the final model.
The most important elements of pre-planning have been identified through existing PDRI and FEL literature and models. As such, the preliminary elements for the DECRIS model were taken from the PDRI-Industrial, PDRI-small industrial, PDRI-infrastructure, and front-end loading phase 2 and 3 models. To ensure the model fit EPC oil and gas projects, the authors also consulted the contractor’s information flow network for an oil and gas EPC project, and the oil and gas engineering guide.
Research Stage
Preliminary DECRISelements
Element descriptiondevelopment
Step2. Data Collection (Section 5.2)
Finalized draft of DECRISelements and project score
sheet (unweighted)
Step3. Data Normalization (Section 5.3)
Weight factornormalization
Step4. Data Analysis (Section 5.4)
Analytical review
Finalize project score sheet(weighted)
Step5. Data Application (Section 6.1)
Develop level assessmentquestionnaires
Collect projects for DECRISassessment
Step6. Model Verification (Section 6.2)
Analytical review for scorerange for gate review
Validate DECRIS reserchhypotheses
Collect information for scoring the project
ResearchersIndustrial
Participants
Workshop and questionnaire surveyto weight of each DECRIS elements
Workshop to definitionof DECRIS elements and element description
Step1. DECRIS Model Scope Determination (Section 5.1)
Feedback
Figure 2. DECRIS Model Development Flowchart.
5. DECRIS Model Development
5.1. Step 1: DECRIS Model Scope Determination: Preliminary Elements
In this step, the authors collect preliminary elements (so-called draft of DECRIS elements) fromexisting literature. This acts as a starting point to define, roughly, the elements which affect detailengineering completion. The preliminary element list is the full set of the possible element items,discovered through a literature review, to determine the assessment scope of DECRIS. This is also usedfor step two when discussing and refining said exhaustive list of elements to be used in the final model.
The most important elements of pre-planning have been identified through existing PDRI andFEL literature and models. As such, the preliminary elements for the DECRIS model were taken fromthe PDRI-Industrial, PDRI-small industrial, PDRI-infrastructure, and front-end loading phase 2 and 3

Sustainability 2018, 10, 2469 7 of 31
models. To ensure the model fit EPC oil and gas projects, the authors also consulted the contractor’sinformation flow network for an oil and gas EPC project, and the oil and gas engineering guide.Through the content analysis, a data set of 98 preliminary DECRIS elements was initially developed.A part of preliminary element set which is related to engineering deliverables (18 elements shown inFigure 3 among the overall 98 elements collected from contents analysis) is shown in Figure 3.
Sustainability 2018, 10, x FOR PEER REVIEW 7 of 31
Through the content analysis, a data set of 98 preliminary DECRIS elements was initially developed. A part of preliminary element set which is related to engineering deliverables (18 elements shown in Figure 3 among the overall 98 elements collected from contents analysis) is shown in Figure 3.
Figure 3. Sample of Preliminary Elements (Engineering Deliverable).
5.2. Step 2: DECRIS Element Finalization
For the second step, a workshop and survey were performed. The focus group workshop was performed with nine industry experts with over 10 years of experience in detail engineering of offshore oil and gas projects. The goal of this workshop was to determine elements that affect the calculation of the detail engineering completion rating and to organize the identified elements in its proper section and category. Random sampling might be more efficient to increase the representativeness of the population [17]. However, because of the limit on the availability of knowledgeable experts (SME: subject matter expert) in the local industry from a practical point of view, judgmental and snowball sampling were used with various discipline experts invited in this research.
The 98 preliminary elements were reduced to 69 DECRIS key elements through brainstorming session in the focus group and individual interviews, and the sections and categories were structured as shown in Table 1. The number of elements and categories in each section are shown in Table 2. The overall hierarchy and its structure was benchmarked from the PDRI framework. However, each element for DECRIS was identified, defined, and customized for detail engineering for offshore oil and gas projects.
Process Flow Sheets O O O
Heat and Material Balances O O O
Piping & Instrumentation Diagrams O O O O O
Process Safety Manangement (PSM) O O O
Utility Flow Diagrams O
Equipment Process Datasheet O O
Equipment Mechanical Datasheet O O
Instrument Process Datasheet O
Inline Valve Datasheet O
Specifications O O O O
Piping System Requirements O O O
Plot Plan O O O O O
Mechanical Equipment List O O O O
Line List O O
Tie-in List O
Piping Stress Analysis O O O
Piping Isometric Drawing O
Piping Secialty Items List O
Element DefinitionPDRI
Industrial(1999)
FEL-2 / 3Information
Flow Network(2015)
Oil and GasEngineering
Guide(2015)
PDRIInfrastructure
(2011)
PDRIIndustrial
Small Projec t(2015)
Figure 3. Sample of Preliminary Elements (Engineering Deliverable).
5.2. Step 2: DECRIS Element Finalization
For the second step, a workshop and survey were performed. The focus group workshop wasperformed with nine industry experts with over 10 years of experience in detail engineering of offshoreoil and gas projects. The goal of this workshop was to determine elements that affect the calculationof the detail engineering completion rating and to organize the identified elements in its propersection and category. Random sampling might be more efficient to increase the representativenessof the population [17]. However, because of the limit on the availability of knowledgeable experts(SME: subject matter expert) in the local industry from a practical point of view, judgmental andsnowball sampling were used with various discipline experts invited in this research.
The 98 preliminary elements were reduced to 69 DECRIS key elements through brainstormingsession in the focus group and individual interviews, and the sections and categories were structured asshown in Table 1. The number of elements and categories in each section are shown in Table 2. The overallhierarchy and its structure was benchmarked from the PDRI framework. However, each element forDECRIS was identified, defined, and customized for detail engineering for offshore oil and gas projects.

Sustainability 2018, 10, 2469 8 of 31
Table 1. DECRIS Sections, Categories and Elements.
Code Description Code Description
I Basis of Detail design F Structural and ArchitecturalA Project Scope F1 Structural RequirementsA1 Project Objectives Statement F2 Structural AnalysisA2 Project Scope of Work F3 Structural and Architectural Arrangement DrawingA3 Project Philosophies F4 Weight Control ReportB Project Performance Requirement G Instrument and Electrical
B1 Products G1 Control PhilosophyB2 Capacities G2 Logic DiagramsB3 Technology G3 Cable ScheduleB4 Processes G4 Hook-up DiagramC Design Guideline G5 Critical Electrical Item lists
C1 Process Design Criteria G6 Electrical Single Line DiagramsC2 Project Site Assessment G7 Instrument and electrical SpecificationsC3 Lead discipline Scope of Work H Material Take-OffC4 Project Schedule H1 Piping MTO (Material Take Off)C5 Constructability Analysis H2 Structural and Architectural MTOII Engineering Deliverables H3 Instrument and Electrical Bulk Item MTOD Process/Mechanical/Piping I 3D modelingD1 Process Flow Diagrams I1 3D Modeling ReviewD2 Heat and Material Balances I2 3D Modeling Input (Equipment/Piping)D3 Piping and Instrumentation Diagrams I3 3D Modeling Input (Structural)D4 Process Safety Management (PSM) I4 3D Modeling Input (Architectural)D5 Utility Flow Diagrams I5 3D Modeling Input (Instrument and Electrical)D6 Process Datasheets J General Facility RequirementD7 Equipment Mechanical Datasheets J1 Preservation and Storage RequirementD8 Specifications J2 Transportation RequirementD9 Piping System Requirements J3 Welding Procedure Specification
D10 Plot Plan III Execution ApproachD11 Mechanical Equipment List K Engineering Project ManagementD12 Line Lists K1 Team Participants and RolesD13 Tie-in Lists K2 Engineering/Construction MethodologyD14 Piping Stress Analysis K3 Deliverables for Design and ConstructionD15 Piping Isometric Drawings K4 Deliverables for Commissioning and Close-outD16 Piping Specialty Items Lists K5 Owner Approval RequirementsD17 Instrument Index K6 Interface Management and Communication Plan
E Equipment Vendor K7 Risk AnalysisE1 Equipment Procurement Status K8 Identify Long Lead/Critical Equipment and MaterialsE2 In-line and Instrument Procurement Status L Project Execution PlanE3 Equipment General Arrangement Drawings L1 Project Cost Estimate and ControlE4 Process and Mechanical Documents L2 Procurement Procedures and PlansE5 Instrument and Electrical Documents L3 Project Change ControlE6 Structural and Architectural DocumentsE7 Equipment Utility Requirements
Table 2. Categories and Elements for each Section.
Section No of Category No of Element
Basis of Detail Design 3 12Engineering Deliverables 7 46
Execution Approach 2 11Total 12 69
The first section, the basis of detail design, consists of three categories (project scope,project performance requirements, and design guidelines) and 12 elements that assist in understandingthe project’s objectives. Completion rating of this section specifies how the project is sufficientlyorganized in line with the project objectives.
The second section, engineering deliverables, includes 46 elements that provide technicalinformation to understand and assess the technical requirements for the detail design of a project.The elements included in this section are generally finalized in sequential submissions and revisioncontrol for engineering documents in the process of approval from the owners during the detail designstage including (a) the preliminary issue, (b) issue for approval (IFA), (c) approved for design (AFD)and (d) AFC. The terms can vary according to the specific project requirements or type of engineeringdeliverable. The seven categories in this section consist of process/mechanical/piping, equipmentvendor, structural/architectural, instrument/electrical, material take-off, 3D modeling, and generalfacility requirement.

Sustainability 2018, 10, 2469 9 of 31
The third section, execution approach, consists of two categories and 11 elements that definethe approach method for the contractor’s strategies and execution from engineering to construction.Categories of this section consist of engineering project management and project execution plan.
Each element selected through the expert group workshop is assigned a different weight tomeasure the detail engineering completion rating. To verify the importance of an element, a weightfactor for each element was recalibrated through an expert survey and an additional statistical analysis.Prior to the expert survey, an unweighted project scoresheet and descriptions of the elements wereprovided to increase the survey participants’ understanding of each element.
The DECRIS element description Box 1. “E1. Equipment Procurement Status” is shown below asan example.
Box 1. E1. Equipment Procurement Status.
E1. Equipment Procurement StatusThe equipment procurement status refers to all of the Vendor’s processes from material requisition to
equipment (mechanical, electrical, etc.) delivery in line with the Required on Site (ROS). In a project, the overallprocesses for equipment procurement status should be managed without delay during the detail design andconstruction stages. The following items need to be considered.
Sustainability 2018, 10, x FOR PEER REVIEW 9 of 31
for engineering documents in the process of approval from the owners during the detail design stage including (a) the preliminary issue, (b) issue for approval (IFA), (c) approved for design (AFD) and (d) AFC. The terms can vary according to the specific project requirements or type of engineering deliverable. The seven categories in this section consist of process/mechanical/piping, equipment vendor, structural/architectural, instrument/electrical, material take-off, 3D modeling, and general facility requirement.
The third section, execution approach, consists of two categories and 11 elements that define the approach method for the contractor’s strategies and execution from engineering to construction. Categories of this section consist of engineering project management and project execution plan.
Each element selected through the expert group workshop is assigned a different weight to measure the detail engineering completion rating. To verify the importance of an element, a weight factor for each element was recalibrated through an expert survey and an additional statistical analysis. Prior to the expert survey, an unweighted project scoresheet and descriptions of the elements were provided to increase the survey participants’ understanding of each element.
The DECRIS element description Box 1. “E1. Equipment Procurement Status” is shown below as an example.
Box 1. E1. Equipment Procurement Status
The expert survey was also used for data collection to weigh each element. Thomson [18] studied the optimum sample size for surveys or interviews and concluded it to be 25, from a review of over 100 studies using grounded theory. In this research, 32 survey participants were assigned for data collection to weigh each element. To collect a meaningful sampling group with over cumulative 400 years of experience in offshore oil and gas EPC projects, judgmental sampling and snowball sampling methods were used. Once again, random sampling might be more efficient to increase the representativeness of the population [17]. However, because of the limit on the availability of knowledgeable experts in the local industry from a practical point of view, judgmental and snowball sampling were used with various discipline experts invited in this research. On average, each expert participant has over 13 years of experience in detail design engineering or project management for offshore oil and gas EPC projects or over 10 years of experience in project management consultancy. Most of the survey participants were selected from two major EPC contractors (H company and S company in South Korea). To increase survey reliability, the expert survey was carried out using only face-to-face interviews. The information on the experience of the survey participants is shown in Table 3.
E1. Equipment Procurement Status The equipment procurement status refers to all of the Vendor’s processes from material requisition to
equipment (mechanical, electrical, etc.) delivery in line with the Required on Site (ROS). In a project, the overall processes for equipment procurement status should be managed without delay during the detail design and construction stages. The following items need to be considered. ❏ Material Requisition ❏ Bid Closing ❏ Technical Bid Evaluation / Tabulation ❏ Updated Material Requisition ❏ Purchase Order ❏ Vendor documentation ❏ Fabrication Work Commence ❏ Factory Acceptance Test ❏ Equipment Delivery along with ROS ❏ Others
Material Requisition
Sustainability 2018, 10, x FOR PEER REVIEW 9 of 31
for engineering documents in the process of approval from the owners during the detail design stage including (a) the preliminary issue, (b) issue for approval (IFA), (c) approved for design (AFD) and (d) AFC. The terms can vary according to the specific project requirements or type of engineering deliverable. The seven categories in this section consist of process/mechanical/piping, equipment vendor, structural/architectural, instrument/electrical, material take-off, 3D modeling, and general facility requirement.
The third section, execution approach, consists of two categories and 11 elements that define the approach method for the contractor’s strategies and execution from engineering to construction. Categories of this section consist of engineering project management and project execution plan.
Each element selected through the expert group workshop is assigned a different weight to measure the detail engineering completion rating. To verify the importance of an element, a weight factor for each element was recalibrated through an expert survey and an additional statistical analysis. Prior to the expert survey, an unweighted project scoresheet and descriptions of the elements were provided to increase the survey participants’ understanding of each element.
The DECRIS element description Box 1. “E1. Equipment Procurement Status” is shown below as an example.
Box 1. E1. Equipment Procurement Status
The expert survey was also used for data collection to weigh each element. Thomson [18] studied the optimum sample size for surveys or interviews and concluded it to be 25, from a review of over 100 studies using grounded theory. In this research, 32 survey participants were assigned for data collection to weigh each element. To collect a meaningful sampling group with over cumulative 400 years of experience in offshore oil and gas EPC projects, judgmental sampling and snowball sampling methods were used. Once again, random sampling might be more efficient to increase the representativeness of the population [17]. However, because of the limit on the availability of knowledgeable experts in the local industry from a practical point of view, judgmental and snowball sampling were used with various discipline experts invited in this research. On average, each expert participant has over 13 years of experience in detail design engineering or project management for offshore oil and gas EPC projects or over 10 years of experience in project management consultancy. Most of the survey participants were selected from two major EPC contractors (H company and S company in South Korea). To increase survey reliability, the expert survey was carried out using only face-to-face interviews. The information on the experience of the survey participants is shown in Table 3.
E1. Equipment Procurement Status The equipment procurement status refers to all of the Vendor’s processes from material requisition to
equipment (mechanical, electrical, etc.) delivery in line with the Required on Site (ROS). In a project, the overall processes for equipment procurement status should be managed without delay during the detail design and construction stages. The following items need to be considered. ❏ Material Requisition ❏ Bid Closing ❏ Technical Bid Evaluation / Tabulation ❏ Updated Material Requisition ❏ Purchase Order ❏ Vendor documentation ❏ Fabrication Work Commence ❏ Factory Acceptance Test ❏ Equipment Delivery along with ROS ❏ Others
Bid Closing
Sustainability 2018, 10, x FOR PEER REVIEW 9 of 31
for engineering documents in the process of approval from the owners during the detail design stage including (a) the preliminary issue, (b) issue for approval (IFA), (c) approved for design (AFD) and (d) AFC. The terms can vary according to the specific project requirements or type of engineering deliverable. The seven categories in this section consist of process/mechanical/piping, equipment vendor, structural/architectural, instrument/electrical, material take-off, 3D modeling, and general facility requirement.
The third section, execution approach, consists of two categories and 11 elements that define the approach method for the contractor’s strategies and execution from engineering to construction. Categories of this section consist of engineering project management and project execution plan.
Each element selected through the expert group workshop is assigned a different weight to measure the detail engineering completion rating. To verify the importance of an element, a weight factor for each element was recalibrated through an expert survey and an additional statistical analysis. Prior to the expert survey, an unweighted project scoresheet and descriptions of the elements were provided to increase the survey participants’ understanding of each element.
The DECRIS element description Box 1. “E1. Equipment Procurement Status” is shown below as an example.
Box 1. E1. Equipment Procurement Status
The expert survey was also used for data collection to weigh each element. Thomson [18] studied the optimum sample size for surveys or interviews and concluded it to be 25, from a review of over 100 studies using grounded theory. In this research, 32 survey participants were assigned for data collection to weigh each element. To collect a meaningful sampling group with over cumulative 400 years of experience in offshore oil and gas EPC projects, judgmental sampling and snowball sampling methods were used. Once again, random sampling might be more efficient to increase the representativeness of the population [17]. However, because of the limit on the availability of knowledgeable experts in the local industry from a practical point of view, judgmental and snowball sampling were used with various discipline experts invited in this research. On average, each expert participant has over 13 years of experience in detail design engineering or project management for offshore oil and gas EPC projects or over 10 years of experience in project management consultancy. Most of the survey participants were selected from two major EPC contractors (H company and S company in South Korea). To increase survey reliability, the expert survey was carried out using only face-to-face interviews. The information on the experience of the survey participants is shown in Table 3.
E1. Equipment Procurement Status The equipment procurement status refers to all of the Vendor’s processes from material requisition to
equipment (mechanical, electrical, etc.) delivery in line with the Required on Site (ROS). In a project, the overall processes for equipment procurement status should be managed without delay during the detail design and construction stages. The following items need to be considered. ❏ Material Requisition ❏ Bid Closing ❏ Technical Bid Evaluation / Tabulation ❏ Updated Material Requisition ❏ Purchase Order ❏ Vendor documentation ❏ Fabrication Work Commence ❏ Factory Acceptance Test ❏ Equipment Delivery along with ROS ❏ Others
Technical Bid Evaluation/Tabulation
Sustainability 2018, 10, x FOR PEER REVIEW 9 of 31
for engineering documents in the process of approval from the owners during the detail design stage including (a) the preliminary issue, (b) issue for approval (IFA), (c) approved for design (AFD) and (d) AFC. The terms can vary according to the specific project requirements or type of engineering deliverable. The seven categories in this section consist of process/mechanical/piping, equipment vendor, structural/architectural, instrument/electrical, material take-off, 3D modeling, and general facility requirement.
The third section, execution approach, consists of two categories and 11 elements that define the approach method for the contractor’s strategies and execution from engineering to construction. Categories of this section consist of engineering project management and project execution plan.
Each element selected through the expert group workshop is assigned a different weight to measure the detail engineering completion rating. To verify the importance of an element, a weight factor for each element was recalibrated through an expert survey and an additional statistical analysis. Prior to the expert survey, an unweighted project scoresheet and descriptions of the elements were provided to increase the survey participants’ understanding of each element.
The DECRIS element description Box 1. “E1. Equipment Procurement Status” is shown below as an example.
Box 1. E1. Equipment Procurement Status
The expert survey was also used for data collection to weigh each element. Thomson [18] studied the optimum sample size for surveys or interviews and concluded it to be 25, from a review of over 100 studies using grounded theory. In this research, 32 survey participants were assigned for data collection to weigh each element. To collect a meaningful sampling group with over cumulative 400 years of experience in offshore oil and gas EPC projects, judgmental sampling and snowball sampling methods were used. Once again, random sampling might be more efficient to increase the representativeness of the population [17]. However, because of the limit on the availability of knowledgeable experts in the local industry from a practical point of view, judgmental and snowball sampling were used with various discipline experts invited in this research. On average, each expert participant has over 13 years of experience in detail design engineering or project management for offshore oil and gas EPC projects or over 10 years of experience in project management consultancy. Most of the survey participants were selected from two major EPC contractors (H company and S company in South Korea). To increase survey reliability, the expert survey was carried out using only face-to-face interviews. The information on the experience of the survey participants is shown in Table 3.
E1. Equipment Procurement Status The equipment procurement status refers to all of the Vendor’s processes from material requisition to
equipment (mechanical, electrical, etc.) delivery in line with the Required on Site (ROS). In a project, the overall processes for equipment procurement status should be managed without delay during the detail design and construction stages. The following items need to be considered. ❏ Material Requisition ❏ Bid Closing ❏ Technical Bid Evaluation / Tabulation ❏ Updated Material Requisition ❏ Purchase Order ❏ Vendor documentation ❏ Fabrication Work Commence ❏ Factory Acceptance Test ❏ Equipment Delivery along with ROS ❏ Others
Updated Material Requisition
Sustainability 2018, 10, x FOR PEER REVIEW 9 of 31
for engineering documents in the process of approval from the owners during the detail design stage including (a) the preliminary issue, (b) issue for approval (IFA), (c) approved for design (AFD) and (d) AFC. The terms can vary according to the specific project requirements or type of engineering deliverable. The seven categories in this section consist of process/mechanical/piping, equipment vendor, structural/architectural, instrument/electrical, material take-off, 3D modeling, and general facility requirement.
The third section, execution approach, consists of two categories and 11 elements that define the approach method for the contractor’s strategies and execution from engineering to construction. Categories of this section consist of engineering project management and project execution plan.
Each element selected through the expert group workshop is assigned a different weight to measure the detail engineering completion rating. To verify the importance of an element, a weight factor for each element was recalibrated through an expert survey and an additional statistical analysis. Prior to the expert survey, an unweighted project scoresheet and descriptions of the elements were provided to increase the survey participants’ understanding of each element.
The DECRIS element description Box 1. “E1. Equipment Procurement Status” is shown below as an example.
Box 1. E1. Equipment Procurement Status
The expert survey was also used for data collection to weigh each element. Thomson [18] studied the optimum sample size for surveys or interviews and concluded it to be 25, from a review of over 100 studies using grounded theory. In this research, 32 survey participants were assigned for data collection to weigh each element. To collect a meaningful sampling group with over cumulative 400 years of experience in offshore oil and gas EPC projects, judgmental sampling and snowball sampling methods were used. Once again, random sampling might be more efficient to increase the representativeness of the population [17]. However, because of the limit on the availability of knowledgeable experts in the local industry from a practical point of view, judgmental and snowball sampling were used with various discipline experts invited in this research. On average, each expert participant has over 13 years of experience in detail design engineering or project management for offshore oil and gas EPC projects or over 10 years of experience in project management consultancy. Most of the survey participants were selected from two major EPC contractors (H company and S company in South Korea). To increase survey reliability, the expert survey was carried out using only face-to-face interviews. The information on the experience of the survey participants is shown in Table 3.
E1. Equipment Procurement Status The equipment procurement status refers to all of the Vendor’s processes from material requisition to
equipment (mechanical, electrical, etc.) delivery in line with the Required on Site (ROS). In a project, the overall processes for equipment procurement status should be managed without delay during the detail design and construction stages. The following items need to be considered. ❏ Material Requisition ❏ Bid Closing ❏ Technical Bid Evaluation / Tabulation ❏ Updated Material Requisition ❏ Purchase Order ❏ Vendor documentation ❏ Fabrication Work Commence ❏ Factory Acceptance Test ❏ Equipment Delivery along with ROS ❏ Others
Purchase Order
Sustainability 2018, 10, x FOR PEER REVIEW 9 of 31
for engineering documents in the process of approval from the owners during the detail design stage including (a) the preliminary issue, (b) issue for approval (IFA), (c) approved for design (AFD) and (d) AFC. The terms can vary according to the specific project requirements or type of engineering deliverable. The seven categories in this section consist of process/mechanical/piping, equipment vendor, structural/architectural, instrument/electrical, material take-off, 3D modeling, and general facility requirement.
The third section, execution approach, consists of two categories and 11 elements that define the approach method for the contractor’s strategies and execution from engineering to construction. Categories of this section consist of engineering project management and project execution plan.
Each element selected through the expert group workshop is assigned a different weight to measure the detail engineering completion rating. To verify the importance of an element, a weight factor for each element was recalibrated through an expert survey and an additional statistical analysis. Prior to the expert survey, an unweighted project scoresheet and descriptions of the elements were provided to increase the survey participants’ understanding of each element.
The DECRIS element description Box 1. “E1. Equipment Procurement Status” is shown below as an example.
Box 1. E1. Equipment Procurement Status
The expert survey was also used for data collection to weigh each element. Thomson [18] studied the optimum sample size for surveys or interviews and concluded it to be 25, from a review of over 100 studies using grounded theory. In this research, 32 survey participants were assigned for data collection to weigh each element. To collect a meaningful sampling group with over cumulative 400 years of experience in offshore oil and gas EPC projects, judgmental sampling and snowball sampling methods were used. Once again, random sampling might be more efficient to increase the representativeness of the population [17]. However, because of the limit on the availability of knowledgeable experts in the local industry from a practical point of view, judgmental and snowball sampling were used with various discipline experts invited in this research. On average, each expert participant has over 13 years of experience in detail design engineering or project management for offshore oil and gas EPC projects or over 10 years of experience in project management consultancy. Most of the survey participants were selected from two major EPC contractors (H company and S company in South Korea). To increase survey reliability, the expert survey was carried out using only face-to-face interviews. The information on the experience of the survey participants is shown in Table 3.
E1. Equipment Procurement Status The equipment procurement status refers to all of the Vendor’s processes from material requisition to
equipment (mechanical, electrical, etc.) delivery in line with the Required on Site (ROS). In a project, the overall processes for equipment procurement status should be managed without delay during the detail design and construction stages. The following items need to be considered. ❏ Material Requisition ❏ Bid Closing ❏ Technical Bid Evaluation / Tabulation ❏ Updated Material Requisition ❏ Purchase Order ❏ Vendor documentation ❏ Fabrication Work Commence ❏ Factory Acceptance Test ❏ Equipment Delivery along with ROS ❏ Others
Vendor documentation
Sustainability 2018, 10, x FOR PEER REVIEW 9 of 31
for engineering documents in the process of approval from the owners during the detail design stage including (a) the preliminary issue, (b) issue for approval (IFA), (c) approved for design (AFD) and (d) AFC. The terms can vary according to the specific project requirements or type of engineering deliverable. The seven categories in this section consist of process/mechanical/piping, equipment vendor, structural/architectural, instrument/electrical, material take-off, 3D modeling, and general facility requirement.
The third section, execution approach, consists of two categories and 11 elements that define the approach method for the contractor’s strategies and execution from engineering to construction. Categories of this section consist of engineering project management and project execution plan.
Each element selected through the expert group workshop is assigned a different weight to measure the detail engineering completion rating. To verify the importance of an element, a weight factor for each element was recalibrated through an expert survey and an additional statistical analysis. Prior to the expert survey, an unweighted project scoresheet and descriptions of the elements were provided to increase the survey participants’ understanding of each element.
The DECRIS element description Box 1. “E1. Equipment Procurement Status” is shown below as an example.
Box 1. E1. Equipment Procurement Status
The expert survey was also used for data collection to weigh each element. Thomson [18] studied the optimum sample size for surveys or interviews and concluded it to be 25, from a review of over 100 studies using grounded theory. In this research, 32 survey participants were assigned for data collection to weigh each element. To collect a meaningful sampling group with over cumulative 400 years of experience in offshore oil and gas EPC projects, judgmental sampling and snowball sampling methods were used. Once again, random sampling might be more efficient to increase the representativeness of the population [17]. However, because of the limit on the availability of knowledgeable experts in the local industry from a practical point of view, judgmental and snowball sampling were used with various discipline experts invited in this research. On average, each expert participant has over 13 years of experience in detail design engineering or project management for offshore oil and gas EPC projects or over 10 years of experience in project management consultancy. Most of the survey participants were selected from two major EPC contractors (H company and S company in South Korea). To increase survey reliability, the expert survey was carried out using only face-to-face interviews. The information on the experience of the survey participants is shown in Table 3.
E1. Equipment Procurement Status The equipment procurement status refers to all of the Vendor’s processes from material requisition to
equipment (mechanical, electrical, etc.) delivery in line with the Required on Site (ROS). In a project, the overall processes for equipment procurement status should be managed without delay during the detail design and construction stages. The following items need to be considered. ❏ Material Requisition ❏ Bid Closing ❏ Technical Bid Evaluation / Tabulation ❏ Updated Material Requisition ❏ Purchase Order ❏ Vendor documentation ❏ Fabrication Work Commence ❏ Factory Acceptance Test ❏ Equipment Delivery along with ROS ❏ Others
Fabrication Work Commence
Sustainability 2018, 10, x FOR PEER REVIEW 9 of 31
for engineering documents in the process of approval from the owners during the detail design stage including (a) the preliminary issue, (b) issue for approval (IFA), (c) approved for design (AFD) and (d) AFC. The terms can vary according to the specific project requirements or type of engineering deliverable. The seven categories in this section consist of process/mechanical/piping, equipment vendor, structural/architectural, instrument/electrical, material take-off, 3D modeling, and general facility requirement.
The third section, execution approach, consists of two categories and 11 elements that define the approach method for the contractor’s strategies and execution from engineering to construction. Categories of this section consist of engineering project management and project execution plan.
Each element selected through the expert group workshop is assigned a different weight to measure the detail engineering completion rating. To verify the importance of an element, a weight factor for each element was recalibrated through an expert survey and an additional statistical analysis. Prior to the expert survey, an unweighted project scoresheet and descriptions of the elements were provided to increase the survey participants’ understanding of each element.
The DECRIS element description Box 1. “E1. Equipment Procurement Status” is shown below as an example.
Box 1. E1. Equipment Procurement Status
The expert survey was also used for data collection to weigh each element. Thomson [18] studied the optimum sample size for surveys or interviews and concluded it to be 25, from a review of over 100 studies using grounded theory. In this research, 32 survey participants were assigned for data collection to weigh each element. To collect a meaningful sampling group with over cumulative 400 years of experience in offshore oil and gas EPC projects, judgmental sampling and snowball sampling methods were used. Once again, random sampling might be more efficient to increase the representativeness of the population [17]. However, because of the limit on the availability of knowledgeable experts in the local industry from a practical point of view, judgmental and snowball sampling were used with various discipline experts invited in this research. On average, each expert participant has over 13 years of experience in detail design engineering or project management for offshore oil and gas EPC projects or over 10 years of experience in project management consultancy. Most of the survey participants were selected from two major EPC contractors (H company and S company in South Korea). To increase survey reliability, the expert survey was carried out using only face-to-face interviews. The information on the experience of the survey participants is shown in Table 3.
E1. Equipment Procurement Status The equipment procurement status refers to all of the Vendor’s processes from material requisition to
equipment (mechanical, electrical, etc.) delivery in line with the Required on Site (ROS). In a project, the overall processes for equipment procurement status should be managed without delay during the detail design and construction stages. The following items need to be considered. ❏ Material Requisition ❏ Bid Closing ❏ Technical Bid Evaluation / Tabulation ❏ Updated Material Requisition ❏ Purchase Order ❏ Vendor documentation ❏ Fabrication Work Commence ❏ Factory Acceptance Test ❏ Equipment Delivery along with ROS ❏ Others
Factory Acceptance Test
Sustainability 2018, 10, x FOR PEER REVIEW 9 of 31
for engineering documents in the process of approval from the owners during the detail design stage including (a) the preliminary issue, (b) issue for approval (IFA), (c) approved for design (AFD) and (d) AFC. The terms can vary according to the specific project requirements or type of engineering deliverable. The seven categories in this section consist of process/mechanical/piping, equipment vendor, structural/architectural, instrument/electrical, material take-off, 3D modeling, and general facility requirement.
The third section, execution approach, consists of two categories and 11 elements that define the approach method for the contractor’s strategies and execution from engineering to construction. Categories of this section consist of engineering project management and project execution plan.
Each element selected through the expert group workshop is assigned a different weight to measure the detail engineering completion rating. To verify the importance of an element, a weight factor for each element was recalibrated through an expert survey and an additional statistical analysis. Prior to the expert survey, an unweighted project scoresheet and descriptions of the elements were provided to increase the survey participants’ understanding of each element.
The DECRIS element description Box 1. “E1. Equipment Procurement Status” is shown below as an example.
Box 1. E1. Equipment Procurement Status
The expert survey was also used for data collection to weigh each element. Thomson [18] studied the optimum sample size for surveys or interviews and concluded it to be 25, from a review of over 100 studies using grounded theory. In this research, 32 survey participants were assigned for data collection to weigh each element. To collect a meaningful sampling group with over cumulative 400 years of experience in offshore oil and gas EPC projects, judgmental sampling and snowball sampling methods were used. Once again, random sampling might be more efficient to increase the representativeness of the population [17]. However, because of the limit on the availability of knowledgeable experts in the local industry from a practical point of view, judgmental and snowball sampling were used with various discipline experts invited in this research. On average, each expert participant has over 13 years of experience in detail design engineering or project management for offshore oil and gas EPC projects or over 10 years of experience in project management consultancy. Most of the survey participants were selected from two major EPC contractors (H company and S company in South Korea). To increase survey reliability, the expert survey was carried out using only face-to-face interviews. The information on the experience of the survey participants is shown in Table 3.
E1. Equipment Procurement Status The equipment procurement status refers to all of the Vendor’s processes from material requisition to
equipment (mechanical, electrical, etc.) delivery in line with the Required on Site (ROS). In a project, the overall processes for equipment procurement status should be managed without delay during the detail design and construction stages. The following items need to be considered. ❏ Material Requisition ❏ Bid Closing ❏ Technical Bid Evaluation / Tabulation ❏ Updated Material Requisition ❏ Purchase Order ❏ Vendor documentation ❏ Fabrication Work Commence ❏ Factory Acceptance Test ❏ Equipment Delivery along with ROS ❏ Others
Equipment Delivery along with ROS
The expert survey was also used for data collection to weigh each element. Thomson [18] studiedthe optimum sample size for surveys or interviews and concluded it to be 25, from a review of over100 studies using grounded theory. In this research, 32 survey participants were assigned for datacollection to weigh each element. To collect a meaningful sampling group with over cumulative400 years of experience in offshore oil and gas EPC projects, judgmental sampling and snowballsampling methods were used. Once again, random sampling might be more efficient to increasethe representativeness of the population [17]. However, because of the limit on the availability ofknowledgeable experts in the local industry from a practical point of view, judgmental and snowballsampling were used with various discipline experts invited in this research. On average, each expertparticipant has over 13 years of experience in detail design engineering or project management foroffshore oil and gas EPC projects or over 10 years of experience in project management consultancy.Most of the survey participants were selected from two major EPC contractors (H company and Scompany in South Korea). To increase survey reliability, the expert survey was carried out using onlyface-to-face interviews. The information on the experience of the survey participants is shown inTable 3.
Table 3. Experience Information of Participants for the DECRIS model.
Details Number
Participant 32 peopleOverall Experience 425 years
Over 10 years of Experience 25 peopleDirector 2 people
Team Leader/Department Head 9 peopleProject Management Professionals (PMPs) 5 people

Sustainability 2018, 10, 2469 10 of 31
5.3. Step 3: Data Normalization
To determine the weight factor for each of the DECRIS elements using the data from theexpert survey, data normalization, preliminary estimate, validation process, element average weightcalculation, and interpolation were carried out. Excel software was used for data input and weightcalculation and Statistical Analysis Software (SASTM) was utilized for statistical analysis of the data set.Upon collecting the data set from the expert survey, data normalization was carried out to normalizeeach survey participant’s input data.
The maximum DECRIS score is defined as 1000 as equivalent to PDRI maximum index score, when allelements in the DECRIS scoresheet were marked as Level 5 (as with the PDRI, DECRIS has five definitionlevels for each element with Level 1 being complete and Level 5 being incomplete). The scoresheetsummation for 69 elements by 32 participants ranged from 262 to 620. Each participant’s scoresheetwas given a normalizing multiplier, calculated as the maximum DECRIS score of 1000 divided by thesum of the answered scores for 69 elements (i.e., if a participant’s summation of 69 elements equated to250, the scoresheet would receive a normalizing multiplier of four). The weight factor of each elementwas pre-estimated as an average value of the normalized weights of the 32 participants. The value waspreliminary because the validation process had not yet been performed.
5.4. Step 4: Data Analysis
When sampling data do not comply with normal distribution, the inaccuracies of the result ofregression analysis or independent sampling t-test increase. To enhance the similarity between thesampling data set and the normal distribution, a data validation process was carried out with a boxplot.
Using a data set of normalized element weight factors, the smallest data point, 25th percentile,median, 75th percentile, and largest data point were calculated and specified on a boxplot. Appendix A(Figures A1–A3) illustrates the boxplots which indicates the distribution of participant response for theweight factor of each element including outliers for all 69 DECRIS elements. To secure reliability of thedata set and similarity with normal distribution, number of extremes and outliers were collected fromeach participant, and the contribution score was calculated using Equation (1). The survey results witha high contribution score were eliminated [8].
Contribution score = 3 × (number of extremes) + 1 × (number of outlier) (1)
Kline [19] suggested that, for a sampling data set which has an absolute value of skewnessless than 3 and an absolute value of kurtosis less than 10, its population can be assumed to bedistributed as normal distribution. To minimize the quantity of eliminated survey results whilemaintaining the normal distribution assumption, skewness and kurtosis calculation using SASTM wasrepeatedly conducted. Consequently, survey results with a contribution score of over 80 were removed.The remaining survey data set has a skewness value of 2.02 and kurtosis value of 7.34 as the maximumvalue among 69 elements; the statistical result thus shows that the population of all 69 elements can beassumed as having a normal distribution. Through one sample t-test, individual elements were shownto be in favor of alternative hypothesis (|t| < 0.0001) and were statistically verified as elements thataffect the detail engineering rating.
The basic relationship for each element was reviewed in the focus group workshop. The purposeof one sample t-test for individual elements is to verify whether the weight factor as a survey result canbe considered as zero or not. If the previous workshop was well conducted, then expert participantsmay give the weight factor higher than zero. Unless most experts judged that each element didnot affect the detail engineering completion, one sample t-test with zero basis for that element canbe passed.
In this research, the measurement range of DECRIS was defined as a minimum of 70 to a maximumof 1000. This means that the DECRIS score is 70 when the level of all elements is Level 1 (i.e., all detailengineering deliverables are completed thoroughly without further need for action), and 1000 when all

Sustainability 2018, 10, 2469 11 of 31
elements are Level 5 (i.e., detail engineering is in the pre-matured status far from full completion yet).Simply speaking, similar to PDRI assessment trend, a lower DECRIS score means lower engineeringdeficiency and therefore less re-work and re-order at the fabrication starting session. The calculatedweight factor for each element was at a Level 5 weight, while the Level 1 weight was calculated usinganother normalizing multiplier based on the minimum DECRIS score of 70. The weights of Levels2, 3, and 4 for each element was also calculated using a linear interpolation formula. Through theaforementioned calculation, the weight of each element and its levels was assigned into the unweightedDECRIS scoresheet, which results in the development of the weighted DECRIS scoresheet (refer toAppendix B). A part of the weighted DECRIS scoresheet is shown in Figure 4.
Sustainability 2018, 10, x FOR PEER REVIEW 11 of 31
be considered as zero or not. If the previous workshop was well conducted, then expert participants may give the weight factor higher than zero. Unless most experts judged that each element did not affect the detail engineering completion, one sample t-test with zero basis for that element can be passed.
In this research, the measurement range of DECRIS was defined as a minimum of 70 to a maximum of 1000. This means that the DECRIS score is 70 when the level of all elements is Level 1 (i.e., all detail engineering deliverables are completed thoroughly without further need for action), and 1000 when all elements are Level 5 (i.e., detail engineering is in the pre-matured status far from full completion yet). Simply speaking, similar to PDRI assessment trend, a lower DECRIS score means lower engineering deficiency and therefore less re-work and re-order at the fabrication starting session. The calculated weight factor for each element was at a Level 5 weight, while the Level 1 weight was calculated using another normalizing multiplier based on the minimum DECRIS score of 70. The weights of Levels 2, 3, and 4 for each element was also calculated using a linear interpolation formula. Through the aforementioned calculation, the weight of each element and its levels was assigned into the unweighted DECRIS scoresheet, which results in the development of the weighted DECRIS scoresheet (refer to Appendix B). A part of the weighted DECRIS scoresheet is shown in Figure 4.
Figure 4. Sample of DECRIS Scoresheet for “Execution Approach” Section.
The weight factor of each element indicates the level of importance of the element’s contribution to the detail engineering completion rating index. Then the relative importance of each section, category, and element is determined. Figure 5 shows the calculated relative importance of each section and category. The weight factor of section II, engineering deliverables, the most important section for the DECRIS of offshore oil and gas EPC projects, is 67.3% of the total weight. Figure 5 also specifies that the weight factor of the process/mechanical/piping category is the highest as 246 points; it is, therefore, the most important category in the DECRIS framework. To increase the detail engineering completion rating, it implies that the engineering manager and project manager need to focus on this category.
A DECRIS level assessment questionnaire was developed to inform assessment participants of a descriptive definition of each level. The main purpose of the level assignment questionnaire is to provide the assessment criteria for the definition level of each DECRIS element. The sample questionnaire included in Appendix C covers Section II—Category D. An individual questionnaire was prepared based on each element’s completion rating required to be achieved in each milestone. When a project is assessed, any element given Level 0 was considered not applicable. This means that the element will not be considered for measuring the engineering completion rating. The DECRIS level
Figure 4. Sample of DECRIS Scoresheet for “Execution Approach” Section.
The weight factor of each element indicates the level of importance of the element’s contribution tothe detail engineering completion rating index. Then the relative importance of each section, category,and element is determined. Figure 5 shows the calculated relative importance of each section andcategory. The weight factor of section II, engineering deliverables, the most important section for theDECRIS of offshore oil and gas EPC projects, is 67.3% of the total weight. Figure 5 also specifies that theweight factor of the process/mechanical/piping category is the highest as 246 points; it is, therefore,the most important category in the DECRIS framework. To increase the detail engineering completionrating, it implies that the engineering manager and project manager need to focus on this category.
A DECRIS level assessment questionnaire was developed to inform assessment participantsof a descriptive definition of each level. The main purpose of the level assignment questionnaireis to provide the assessment criteria for the definition level of each DECRIS element. The samplequestionnaire included in Appendix C covers Section II—Category D. An individual questionnairewas prepared based on each element’s completion rating required to be achieved in each milestone.When a project is assessed, any element given Level 0 was considered not applicable. This means thatthe element will not be considered for measuring the engineering completion rating. The DECRISlevel assessment questionnaires provide the information required to understand and assess technicalrequirements for the detail engineering stage. For example, in the case of elements in section II,engineering deliverables, the element level is assessed as the stage of repeated submissions of thedocuments during detail engineering.

Sustainability 2018, 10, 2469 12 of 31
Sustainability 2018, 10, x FOR PEER REVIEW 12 of 31
assessment questionnaires provide the information required to understand and assess technical requirements for the detail engineering stage. For example, in the case of elements in section II, engineering deliverables, the element level is assessed as the stage of repeated submissions of the documents during detail engineering.
Figure 5. DECRIS Weight for each Section and Category.
5.5. Comparison of DECRIS vs. Previous Engineering Assessment Tools Layout and Use
As with any research endeavor, it is required that said research be an advancement of the general body of knowledge. Although the PDRI and FEL are valid assessment tools, the PDRI was used by the authors of this paper more heavily in DECRIS development. As such, it is important to illustrate the differences between these models for reader understanding and as a basis of support for the DECRIS value-adding potential. Table 4 provides an illustration of the differences between the DECRIS, PDRI-Industrial, and PDRI-Infrastructure elements. The main distinctions between the DECRIS model and the previous assessment models is summarized as below.
1. The sections, based on project decision and front-end definition, are thus major components of PDRI-Industrial (given a 922 score) [7] and PDRI-Infrastructure (given a 730 score) [8]. PDRI focuses on front-end planning and does not represent work packages in the detail engineering stage. The hierarchy overview of the PDRI-Industrial model is briefly outlined in Appendix D for reference purposes. As described in the introduction, the major target of DECRIS is the detail design conducted by the EPC contractor; it is thus reasonable that the engineering deliverables of detail engineering is the most important section.
2. From the project size point of view, PDRI-Industrial is for midsize industrial projects whereas the DECRIS is for oil and gas EPC megaprojects over US$ 500 m.
3. The Scope of detail engineering in PDRI-Infrastructure is basically the owner’s responsibility (whereas in case of EPC, it belongs to the EPC contractor, therefore the completion of the impact of detail engineering completion to the schedule and cost performance is less severe than the EPC case).
Weight
II Engineering Deliverables 673
I Basis of Detail Design 166
III Execution Approach 161
1000
Weight
D Process / Mechanical / Piping 246
K Engineering Project Management 116
G Instrument and Electrical 102
E Equipment Vendor 101
I 3D modeling 79
C Design Guideline 76
F Structural and Architectural 59
B Project Performance Requirement 51
H Material Take-Off 45
L Project Execution Plan 45
J General Facility Requirement 41
A Project Scope 39
1000
Section
Category
Total
Total
Figure 5. DECRIS Weight for each Section and Category.
5.5. Comparison of DECRIS vs. Previous Engineering Assessment Tools Layout and Use
As with any research endeavor, it is required that said research be an advancement of the generalbody of knowledge. Although the PDRI and FEL are valid assessment tools, the PDRI was usedby the authors of this paper more heavily in DECRIS development. As such, it is important toillustrate the differences between these models for reader understanding and as a basis of supportfor the DECRIS value-adding potential. Table 4 provides an illustration of the differences betweenthe DECRIS, PDRI-Industrial, and PDRI-Infrastructure elements. The main distinctions between theDECRIS model and the previous assessment models is summarized as below.
1. The sections, based on project decision and front-end definition, are thus major componentsof PDRI-Industrial (given a 922 score) [7] and PDRI-Infrastructure (given a 730 score) [8].PDRI focuses on front-end planning and does not represent work packages in the detailengineering stage. The hierarchy overview of the PDRI-Industrial model is briefly outlinedin Appendix D for reference purposes. As described in the introduction, the major target ofDECRIS is the detail design conducted by the EPC contractor; it is thus reasonable that theengineering deliverables of detail engineering is the most important section.
2. From the project size point of view, PDRI-Industrial is for midsize industrial projects whereas theDECRIS is for oil and gas EPC megaprojects over US$ 500 m.
3. The Scope of detail engineering in PDRI-Infrastructure is basically the owner’s responsibility (whereasin case of EPC, it belongs to the EPC contractor, therefore the completion of the impact of detailengineering completion to the schedule and cost performance is less severe than the EPC case).
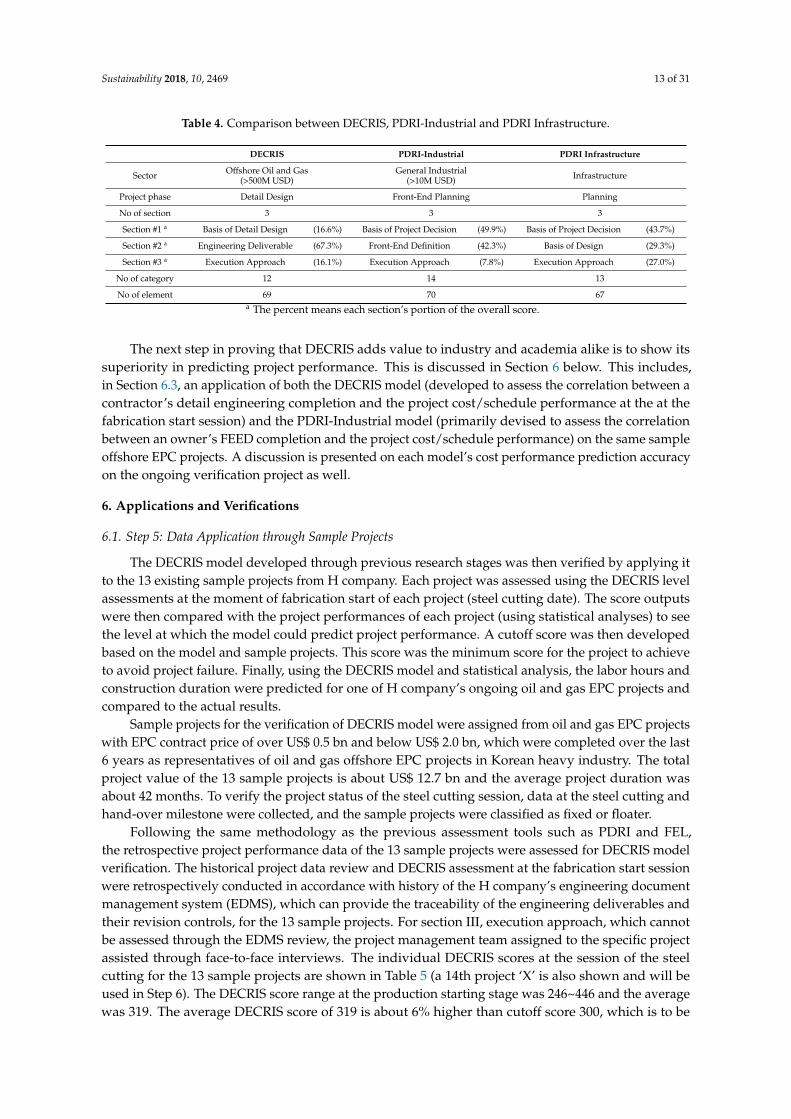
Sustainability 2018, 10, 2469 13 of 31
Table 4. Comparison between DECRIS, PDRI-Industrial and PDRI Infrastructure.
DECRIS PDRI-Industrial PDRI Infrastructure
Sector Offshore Oil and Gas(>500M USD)
General Industrial(>10M USD) Infrastructure
Project phase Detail Design Front-End Planning Planning
No of section 3 3 3
Section #1 a Basis of Detail Design (16.6%) Basis of Project Decision (49.9%) Basis of Project Decision (43.7%)
Section #2 a Engineering Deliverable (67.3%) Front-End Definition (42.3%) Basis of Design (29.3%)
Section #3 a Execution Approach (16.1%) Execution Approach (7.8%) Execution Approach (27.0%)
No of category 12 14 13
No of element 69 70 67a The percent means each section’s portion of the overall score.
The next step in proving that DECRIS adds value to industry and academia alike is to show itssuperiority in predicting project performance. This is discussed in Section 6 below. This includes,in Section 6.3, an application of both the DECRIS model (developed to assess the correlation between acontractor’s detail engineering completion and the project cost/schedule performance at the at thefabrication start session) and the PDRI-Industrial model (primarily devised to assess the correlationbetween an owner’s FEED completion and the project cost/schedule performance) on the same sampleoffshore EPC projects. A discussion is presented on each model’s cost performance prediction accuracyon the ongoing verification project as well.
6. Applications and Verifications
6.1. Step 5: Data Application through Sample Projects
The DECRIS model developed through previous research stages was then verified by applying itto the 13 existing sample projects from H company. Each project was assessed using the DECRIS levelassessments at the moment of fabrication start of each project (steel cutting date). The score outputswere then compared with the project performances of each project (using statistical analyses) to seethe level at which the model could predict project performance. A cutoff score was then developedbased on the model and sample projects. This score was the minimum score for the project to achieveto avoid project failure. Finally, using the DECRIS model and statistical analysis, the labor hours andconstruction duration were predicted for one of H company’s ongoing oil and gas EPC projects andcompared to the actual results.
Sample projects for the verification of DECRIS model were assigned from oil and gas EPC projectswith EPC contract price of over US$ 0.5 bn and below US$ 2.0 bn, which were completed over the last6 years as representatives of oil and gas offshore EPC projects in Korean heavy industry. The totalproject value of the 13 sample projects is about US$ 12.7 bn and the average project duration wasabout 42 months. To verify the project status of the steel cutting session, data at the steel cutting andhand-over milestone were collected, and the sample projects were classified as fixed or floater.
Following the same methodology as the previous assessment tools such as PDRI and FEL,the retrospective project performance data of the 13 sample projects were assessed for DECRIS modelverification. The historical project data review and DECRIS assessment at the fabrication start sessionwere retrospectively conducted in accordance with history of the H company’s engineering documentmanagement system (EDMS), which can provide the traceability of the engineering deliverables andtheir revision controls, for the 13 sample projects. For section III, execution approach, which cannotbe assessed through the EDMS review, the project management team assigned to the specific projectassisted through face-to-face interviews. The individual DECRIS scores at the session of the steelcutting for the 13 sample projects are shown in Table 5 (a 14th project ‘X’ is also shown and will beused in Step 6). The DECRIS score range at the production starting stage was 246~446 and the averagewas 319. The average DECRIS score of 319 is about 6% higher than cutoff score 300, which is to be

Sustainability 2018, 10, 2469 14 of 31
described at the later section on this paper. The result means that maturity of detail engineering onthe construction starting session (steel cutting) is lower than the optimal point so that low scheduleperformance and cost overrun is expected.
Table 5. Selection of Sample Offshore EPC Project.
Project Type Steel Cutting Hand-Over DECRIS Score
A Fixed 2012-07-13 2015-07-15 346B Floater 2011-07-01 2015-02-14 446C Fixed 2012-04-02 2013-08-27 250D Floater 2012-09-07 2015-12-17 304E Fixed 2013-09-16 2015-06-30 299F Floater 2014-06-13 2017-07-15 367G Floater 2013-10-04 2015-11-30 367H Floater 2014-05-02 2016-10-03 389I Fixed 2015-03-03 2017-02-20 264J Fixed 2015-09-15 2016-11-28 248K Fixed 2016-01-25 2017-05-12 273L Fixed 2008-09-23 2013-11-14 258M Fixed 2011-03-04 2012-11-21 324X Fixed 2016-07-01 2020-05-08 368
As shown in Table 6, the construction labor hours increase rate which is the primary cause of costoverrun and construction duration delay of the sample projects were collected to validate the researchgoals, to apply the DECRIS model for the offshore oil and gas EPC projects. The verification with thesample projects is to assess the influence of the DECRIS score on the construction in the offshore oiland gas EPC project.
Table 6. Impact on Construction in the Sample Projects.
Project CLIR 1 (%) CDD 2 (days) Project CLIR (%) CDD (days)
B 17.14% 411 L 0.82% 105H 8.71% 246 E 1.61% 82F 6.09% 305 K 2.44% 16G 6.02% 210 I 2.84% 82A 3.37% 246 C 2.22% -6D 4.06% 102 J 3.24% 0M 9.70% 111
1 CLIR = Construction labor hours increase rate; 2 CDD = Construction duration delay.
The following Equations (2) and (3) were used to calculate the construction labor hours increaserate (cost overrun) and construction duration delay.
CLIR = (Construction labor hours increase)/(Budgeted construction labor hours) (2)
CDD = (Actual construction duration) − (Planned construction duration) (3)
The calculated construction labor hours increase includes all design changes caused by a lowdetail engineering completion rating and detail engineer’s error and omission. Construction durationdelay includes not only the design changes due to low detail engineering completion, but also otherminor factors such as the owner’s change order, procurement impact and construction problemsduring fabrication. Considering industry practices and expert judgments, most of the cost overrunand schedule delay is caused by premature detail engineering and design change during constructionphase. It should be noted here that a considerable number of factors have an impact on construction,performance, and the DECRIS model cannot explain all these factors.

Sustainability 2018, 10, 2469 15 of 31
In the case of conventional PDRI, the PDRI cutoff score was determined as 200 [7]. The DECRIS isnot used for project definition of the FEED package but is used for demonstrating the detail engineeringcompletion rating; it is thus considered in this study that the existing PDRI cutoff score cannot beused for DECRIS without further verification. To determine the DECRIS cutoff score, the independentt-test was repeatedly conducted with a 0.05 level of significance to review the statistical differenceof average value between the two groups (high and low DECRIS score groups) of projects dividedby the DECRIS scores of 280, 300, and 320. The statistical difference was found in the t-test to havea 95% level of confidence between the two groups of projects divided by 300. As shown in Table 7,the sample projects were grouped as high- and low-score groups based on the DECRIS score of 300.
Table 7. Group of the Sample Projects based on DECRIS Score of 300.
Project Group DECRIS Score CLIR (%) CDD (days) Project Group DECRIS Score CLIR (%) CDD (days)
B High 446 17.14 411 E low 299 1.61 82H High 389 8.71 246 K low 273 2.44 16F High 367 6.09 305 I low 264 2.84 82G High 367 6.02 210 C low 250 2.22 −6A High 346 3.37 246 J low 248 3.24 0D High 304 4.06 102 L Low 258 0.82 105
CLIR = Construction labor hours increase rate; CDD = Construction duration delay.
If a project’s DECRIS score at the steel cutting session is higher than 300, the project was thenincluded in the high-score group, otherwise it was included in the low-score group. The DECRIS scorerange of the six projects included in the high-score group was 304–446 and their construction laborhours increase rate (cost overrun) was from 3.4% to 17.1% with an average of 7.7%. For the low-scoregroup, the DECRIS score range was from 258 to 299, with an increase rate of from 0.8% to 3.2% ofconstruction labor hours, with an average increase rate of 2.2%. Through an independent samplet-test, the test statistic of project F was 33.60 and the significant probability for population varianceand average difference was 0.0015 and 0.0475. An alternative hypothesis for both population varianceand average difference were concluded with a 95% level of significance.
To verify that the DECRIS cutoff score is also applicable for project schedule performance, anotherindependent sample t-test was performed. As shown in Table 7, the DECRIS score range of six projectsincluded in the high-score group was 304–446 and their construction duration delay ranged from 102to 411 days with an average of 255 days (significant delay). The low-score group shows a DECRISscore range of from 258 to 299 with -6 to 105 days of construction duration delay and an average of47 days. The test statistic F-value was 4.45 and the significant probability for population variance andaverage difference was 0.127 and 0.0012, respectively. The null hypothesis for population variance andalternative hypothesis for average difference were thus concluded with a 95% level of significance.The results of two statistical reviews using project cost and schedule performance showed that theDECRIS cutoff score for the steel cutting session for offshore oil and gas EPC projects was 300.
From a theoretical point of view, this DECRIS cutoff score (300) is the most optimal fabricationstarting session with some adjustment according to the project completion schedule requirement andresource availability of both engineering and construction.
Finally, the authors tested the DECRIS score’s ability to predict a project’s performance successfully.To test this, a regression analysis was conducted to determine the correlation between the DECRISscore and the construction labor hours increase rate with the sample projects. A scatter plot with theDECRIS score (X-axis) and project performance (Y-axis) was generated and simple linear regressionwas performed as shown in Figure 6. R-squared value was 0.7054; the regression function thus clearlyrepresents the correlation of the population. Following the same method, regression analysis wasconducted to realize the correlation between the DECRIS score and the construction duration delayapplied to the sample projects. A scatter plot with the DECRIS score (X-axis) and project performance(Y-axis) was generated and simple linear regression was performed as shown in Figure 7. The project

Sustainability 2018, 10, 2469 16 of 31
R-squared value was 0.8881, so that the regression function clearly represents the correlation ofthe population.
Sustainability 2018, 10, x FOR PEER REVIEW 16 of 31
duration delay applied to the sample projects. A scatter plot with the DECRIS score (X-axis) and project performance (Y-axis) was generated and simple linear regression was performed as shown in Figure 7. The project R-squared value was 0.8881, so that the regression function clearly represents the correlation of the population.
Figure 6. Correlation between DECRIS Score and Construction Labor Hours Increase Rate (Cost overrun).
Figure 7. Correlation between DECRIS Score and Construction Duration Delay.
As highlighted in the literature review, other engineering assessment tools (such as FEL and PDRIs as they were developed to evaluate the project definition level and basic engineering (FEED) maturity in the initial project stage, prior to EPC contracts, by the project owner) were not adequate to apply to predict the influence of detail engineering completion on the construction re-work/re-order by the EPC contractor. On the other hand, DECRIS shows reliable indicators to predict the correlations between DECRIS score (i.e., detail engineering progress and maturity) at the fabrication start session and potential construction cost and schedule performance.
y = 0.0006x - 0.1409R² = 0.7054
0%
5%
10%
15%
20%
200 250 300 350 400 450 500
Cos
t Ove
rrun
(C
onst
ruct
ion
Man
hour
incr
easi
ng
rate
)
DECRIS Score
y = 1.942x - 470.79R² = 0.8881
(100)
0
100
200
300
400
500
600
200 250 300 350 400 450 500
Sche
dule
Del
ay
(Con
stru
ctio
n D
urat
ion
Del
ay)
DECRIS Score
Figure 6. Correlation between DECRIS Score and Construction Labor Hours Increase Rate (Cost overrun).
Sustainability 2018, 10, x FOR PEER REVIEW 16 of 31
duration delay applied to the sample projects. A scatter plot with the DECRIS score (X-axis) and project performance (Y-axis) was generated and simple linear regression was performed as shown in Figure 7. The project R-squared value was 0.8881, so that the regression function clearly represents the correlation of the population.
Figure 6. Correlation between DECRIS Score and Construction Labor Hours Increase Rate (Cost overrun).
Figure 7. Correlation between DECRIS Score and Construction Duration Delay.
As highlighted in the literature review, other engineering assessment tools (such as FEL and PDRIs as they were developed to evaluate the project definition level and basic engineering (FEED) maturity in the initial project stage, prior to EPC contracts, by the project owner) were not adequate to apply to predict the influence of detail engineering completion on the construction re-work/re-order by the EPC contractor. On the other hand, DECRIS shows reliable indicators to predict the correlations between DECRIS score (i.e., detail engineering progress and maturity) at the fabrication start session and potential construction cost and schedule performance.
y = 0.0006x - 0.1409R² = 0.7054
0%
5%
10%
15%
20%
200 250 300 350 400 450 500
Cos
t Ove
rrun
(C
onst
ruct
ion
Man
hour
incr
easi
ng
rate
)
DECRIS Score
y = 1.942x - 470.79R² = 0.8881
(100)
0
100
200
300
400
500
600
200 250 300 350 400 450 500
Sche
dule
Del
ay
(Con
stru
ctio
n D
urat
ion
Del
ay)
DECRIS Score
Figure 7. Correlation between DECRIS Score and Construction Duration Delay.
As highlighted in the literature review, other engineering assessment tools (such as FEL andPDRIs as they were developed to evaluate the project definition level and basic engineering (FEED)maturity in the initial project stage, prior to EPC contracts, by the project owner) were not adequate toapply to predict the influence of detail engineering completion on the construction re-work/re-orderby the EPC contractor. On the other hand, DECRIS shows reliable indicators to predict the correlationsbetween DECRIS score (i.e., detail engineering progress and maturity) at the fabrication start sessionand potential construction cost and schedule performance.

Sustainability 2018, 10, 2469 17 of 31
6.2. Step 6: Model Verification with a Case Study
Step 5 proves that the model works well for the thirteen sample projects. However, the goal is forthe model to work on all EPC oil and gas projects. To review that the regression functions developedin this research are applicable to ongoing projects, the project performance data of ongoing Project Xspecified in Table 5 was collected.
As of November 2017, the forecasting cost and schedule performance were calculated usinglinear interpolation based on current construction labor hours and duration increase. According tointerpolation results, a construction labor hours increase rate of 8.26% and a construction durationdelay of 177 days are calculated.
The DECRIS score of Project X is assessed as 368 which is much higher than the average of the13 sample offshore projects. Therefore, DECRIS model predicts that underperformance risks on theProject X are more severe than other projects.
Based on the DECRIS regression functions developed in this research, project performance ofongoing Project X was predicted with Equations (4) and (5).
y = 0.0006x − 0.1409 = 7.99% (4)
z = 1.942x − 479.79 = 235 days (5)
where
x = DECRIS score at steel cutting session in Project X = 368y = Construction labor hours increase rate (cost overrun) as per design changesz = Construction duration delay
The result means that the construction labor hours increase rate of 7.99% (about US$ 12 m) and235 days construction duration delay are expected for the ongoing Project X. This cost estimation is onlyfor construction labor hours; therefore, actual cost overrun including management cost, warehousecost, engineering cost and subsequent liquidated damages will be much higher than the calculated cost.
According to the comparison between actual results and DECRIS prediction, researchers foundthat a construction labor hours increase rate of 8.26% and a construction duration delay of 177 days aresimilar with 7.99% and 235 days predicted in the DECRIS model.
This result indicates that the DECRIS model predicts the cost and schedule performance of theongoing project. EPC contractors can use the DECRIS score at the steel cutting session to predict projectperformance using the aforementioned regression functions, Equations (4) and (5).
As the limitation of this research, the case study is just to forecast the cost and scheduleimpact of the project. As the continuation of the research, the DECRIS model will be continuouslyimplemented further for the engineering progress control to incorporate the initiation of modulefabrication start-time.
6.3. Comparison of DECRIS and PDRI (Existing Assessment Tool) Performance
As described in the previous section, the DECRIS model in this study is an evolution of theFEL and PDRI models, modified to work more accurately on offshore oil and gas EPC megaprojects.DECRIS was developed for offshore oil and gas by receiving assessments from both the owner’s FEEDcompletion assessment and EPC contractor’s detail engineering completion assessment. Although theprevious sections depict the DECRIS model’s accuracy, no comparison has been made with the existingprocesses. As such, below is a simple comparison between the DECRIS and previous assessmenttools, with a focus on the PDRI-Industrial model as it most closely resembles the DECRIS model.This presentation demonstrates the uniqueness and value-addition potential of the DECRIS model foran EPC contractor’s project progress control, particularly for balancing between detail engineering,procurement, and construction.

Sustainability 2018, 10, 2469 18 of 31
Through the PDRI-Industrial assessments at the fabrication start stage of the 13 sample recentlycompleted EPC offshore projects listed in Table 5 by the industrial experts and the project managementteam, the correlation between the PDRI score and the construction cost performances was analyzedusing linear regression function. As a result of PDRI-Industrial assessment, PDRI score was calculatedwithin the range of 70 to 83 and plotted with the construction cost performances using scatter plot,as shown in Figure 8.
Sustainability 2018, 10, x FOR PEER REVIEW 18 of 31
team, the correlation between the PDRI score and the construction cost performances was analyzed using linear regression function. As a result of PDRI-Industrial assessment, PDRI score was calculated within the range of 70 to 83 and plotted with the construction cost performances using scatter plot, as shown in Figure 8.
Figure 8. Correlation between PDRI Score and Construction Labor Hours Increase Rate.
In comparing the results of the DECRIS’s (Figure 7) and PDRI’s (Figure 8) abilities to accurately predict cost overrun on offshore oil and gas EPC megaprojects, the DECRIS is found to be significantly superior. This is depicted in comparing the correlation coefficient (R-squared) value for the PDRI model (0.04) and the DECRIS model (0.70). (Due to the significant difference is cost overrun-model score correlation, no schedule-model score analysis was performed for the PDRI). This regression analysis result means that the DECRIS model is a more precise and reliable tool to estimate the correlation between detail engineering assessment score and construction cost performance and to identify the optimal time point of fabrication start, compared to the previous assessment model (PDRI).
Furthermore, in using the linear regression function generated by PDRI model assessment and the 13 sample projects’ construction cost performance data, the cost performance (i.e., Construction Labor Hours Increase Rate) for the ongoing Project X (described in the previous Section 6.2), was predicted with the result of the cost overrun of about 6.96%. This cost overrun prediction value is less than the DECRIS model (7.99% of cost overrun) and actual measured cost performance (8.26% of cost overrun). In summary, from these analyses, the DECRIS model is more accurate in predicting cost/schedule performance and is therefore superior in aiding EPC contractors in their preconstruction processes.
7. Conclusions and Discussion
7.1. Summary and Contributions
The objective of this research is to develop a tool to calculate the engineering completion rating of offshore oil and gas EPC projects, and to validate research goals using regression analysis with the sample projects and comparison between the predicted project performances and actual performance of an ongoing project.
Preliminary DECRIS elements were collected using content analysis from the literature. Through an expert workshop, an expert survey, and statistical analysis, the individual elements, DECRIS hierarchy, and weight factor of each element were determined, and a DECRIS model for the steel cutting session for offshore oil and gas EPC projects was established.
y = 0.0027x - 0.1437R² = 0.0415
0%
5%
10%
15%
20%
25%
60 65 70 75 80 85 90
Cos
t Ove
rrun
(Con
stru
ctio
n M
anho
ur
incr
easi
ng ra
te)
PDRI Score
Figure 8. Correlation between PDRI Score and Construction Labor Hours Increase Rate.
In comparing the results of the DECRIS’s (Figure 7) and PDRI’s (Figure 8) abilities to accuratelypredict cost overrun on offshore oil and gas EPC megaprojects, the DECRIS is found to be significantlysuperior. This is depicted in comparing the correlation coefficient (R-squared) value for the PDRI model(0.04) and the DECRIS model (0.70). (Due to the significant difference is cost overrun-model scorecorrelation, no schedule-model score analysis was performed for the PDRI). This regression analysisresult means that the DECRIS model is a more precise and reliable tool to estimate the correlationbetween detail engineering assessment score and construction cost performance and to identify theoptimal time point of fabrication start, compared to the previous assessment model (PDRI).
Furthermore, in using the linear regression function generated by PDRI model assessment and the13 sample projects’ construction cost performance data, the cost performance (i.e., Construction LaborHours Increase Rate) for the ongoing Project X (described in the previous Section 6.2), was predictedwith the result of the cost overrun of about 6.96%. This cost overrun prediction value is less than theDECRIS model (7.99% of cost overrun) and actual measured cost performance (8.26% of cost overrun).In summary, from these analyses, the DECRIS model is more accurate in predicting cost/scheduleperformance and is therefore superior in aiding EPC contractors in their preconstruction processes.
7. Conclusions and Discussion
7.1. Summary and Contributions
The objective of this research is to develop a tool to calculate the engineering completion rating ofoffshore oil and gas EPC projects, and to validate research goals using regression analysis with thesample projects and comparison between the predicted project performances and actual performanceof an ongoing project.

Sustainability 2018, 10, 2469 19 of 31
Preliminary DECRIS elements were collected using content analysis from the literature. Through anexpert workshop, an expert survey, and statistical analysis, the individual elements, DECRIS hierarchy,and weight factor of each element were determined, and a DECRIS model for the steel cutting session foroffshore oil and gas EPC projects was established.
Thirteen existing sample projects were selected for DECRIS review. The performance reviewof those thirteen projects using the DECRIS model resulted in six projects in the low DECRIS scoregroup for the steel cutting session which were completed with an average construction labor hoursincrease rate of 2.2% and a construction duration delay of 47 days. In contrast, the other six projects inthe high group were completed with an average construction labor hours increase rate of 7.7% and aconstruction duration delay of 255 days. When steel cutting is conducted with the DECRIS cutoff score(<300) achieved, the project cost and schedule performance of the project are statistically superior toother projects that failed to achieve the cutoff score. Through regression analysis with the 13 sampleprojects, the correlation and regression functions between the DECRIS score and project performancewere found. Based on the regression functions developed in this research, the project performance foran ongoing project was predicted, and the predicted performance was well matched with the currentproject status.
The research results mean that early detail engineering completion prior to construction makesthe EPC project successful and sustainable without considerable schedule delay and associated costoverrun. The DECRIS model contributes to EPC contractor as decision-making tools at the momentof fabrication start. EPC contractor can acknowledge the project risks with the predicted cost andschedule performance calculated by DECRIS, and they are able to find out mitigation plans such asadditional workforce involvement on engineering or construction works or postpone the fabricationstart after risk comparison.
The DECRIS model can contribute to the project success on the construction execution stageby forecasting project performance and potentially reducing the project underperformance risks.The on-time delivery within budget for offshore oil and gas EPC projects using the DECRIS modelwill also give a positive motivation for major oil companies who place a great deal of attention onproject success.
7.2. Future Directions
In future research, the correlation between each DECRIS element and project performance can beevaluated using statistical tools and more offshore EPC project samples. Consequently, the benefits offurther sample projects such as minimum 50 EPC projects in the long run, multivariate tools such asFuzzy Set Qualitative Comparative Analysis (fsQCA), or Principal Component Analysis (PCA) mightbe applicable.
The DECRIS model in this research is focused on the fabrication start session. To improve thelimitation of PDRI and DECRIS current approach of retroactive verification, proactive implementationof the DECRIS model to incorporate into engineering management control will be continued in thefuture. For the prospective check during the entire EPC stage, the DECRIS cutoff score for the othermilestones such as contract award, FEED verification, major equipment procurement and engineeringtransfer should be set. With the set of DECRIS cutoff scores for each milestone, the EPC contractor canestimate the engineering performance in the project and find mitigation plans to reduce DECRIS scoreto reduce the project cost and schedule risks.
The DECRIS module “Part A” as reported in this paper is a part of overall research frameworkas shown in Figure 9. Currently the DECRIS module is in the process of further extension to “Part B”illustrated in Figure 9 to eventually develop a comprehensive application program to corporate withintegrated project cost-schedule control such as earned value management systems (EVMS) based onsome kind of artificial intelligence analytics and big data database for oil and gas offshore EPC projects.

Sustainability 2018, 10, 2469 20 of 31Sustainability 2018, 10, x FOR PEER REVIEW 20 of 31
9 Figure 9. Research Framework for DECRIS.
If in future research, the engineering labor hours spent on each preparation and submission of engineering deliverables are collected from the historical database, and EDMS and its quantitative information are applied for the weight factor of each level, DECRIS can be used as a tool to calculate the earned value of the detail engineering activities. In this case, DECRIS can contribute as an engineering cost control tool to calculate the engineering progress during the detail engineering stage.
Author Contributions: M.H.K. developed the concept and drafted the manuscript. H.S.C. provided industry feedback on the study and E.-B.L. reviewed and revised the manuscript and supervised the overall work. All the authors read and approved the final manuscript.
Funding: The authors acknowledge that this research was sponsored by the Ministry of Trade Industry and Energy (MOTIE/KEIT) Korea through the Technology Innovation Program funding (Developing Intelligent Project Management Information Systems (i-PMIS) for Engineering Projects; Grant number=10077606).
Acknowledgments: The authors of this study would like to thank Hyundai Heavy Industry Co for their informational support and technical cooperation. The authors would like to thank Prof. H. D. Jeong at Iowa State University and D. S. Alleman (a Ph. D. candidate in Univ. of Colorado at Boulder) for their academic inputs and feedback on this research.
Conflicts of Interest: The authors declare no conflicts of interest
Abbreviations
AFC Approval for Construction CDD Construction Duration Delay CLIR Construction Labor hours Increase Rate DECRIS Detail engineering Completion Rating Index System EDMS Electronic Document Management System EPC Engineering, Procurement and Construction FEED Front-End Engineering and Design FEL Front-End Loading FPSO Floating Production, Storage and Offloading FLNG Floating LNG PDRI Project Definition Rating Index fsQCA Fuzzy Set Qualitative Comparative Analysis PCA Principal Component Analysis
Appendix A. Boxplot of Weight Factor by Elements
* Note: The main purpose of the “boxplot” below is to secure reliability of the data set and similarity with normal distribution, number of extreme and outlier was collected from each participant, and the contribution score was calculated. The survey results with a high contribution score were eliminated.
Part ADevelopment of DECRIS model for project scale
DECRIS Model verification (12 sample projects)
Validation to the on-going project
Part BDevelopment of earned value calculation model
Using DECRIS and big data (EDMS)
EV calculation model verification
Application to use in detail engineering
Figure 9. Research Framework for DECRIS.
If in future research, the engineering labor hours spent on each preparation and submission ofengineering deliverables are collected from the historical database, and EDMS and its quantitativeinformation are applied for the weight factor of each level, DECRIS can be used as a tool to calculate theearned value of the detail engineering activities. In this case, DECRIS can contribute as an engineeringcost control tool to calculate the engineering progress during the detail engineering stage.
Author Contributions: M.H.K. developed the concept and drafted the manuscript. H.S.C. provided industryfeedback on the study and E.-B.L. reviewed and revised the manuscript and supervised the overall work. All theauthors read and approved the final manuscript.
Funding: The authors acknowledge that this research was sponsored by the Ministry of Trade Industry andEnergy (MOTIE/KEIT) Korea through the Technology Innovation Program funding (Developing IntelligentProject Management Information Systems (i-PMIS) for Engineering Projects; Grant number = 10077606).
Acknowledgments: The authors of this study would like to thank Hyundai Heavy Industry Co for theirinformational support and technical cooperation. The authors would like to thank H. D. Jeong at Iowa StateUniversity and D. S. Alleman (a candidate in Univ. of Colorado at Boulder) for their academic inputs and feedbackon this research.
Conflicts of Interest: The authors declare no conflicts of interest.
Abbreviations
AFC Approval for ConstructionCDD Construction Duration DelayCLIR Construction Labor hours Increase RateDECRIS Detail engineering Completion Rating Index SystemEDMS Electronic Document Management SystemEPC Engineering, Procurement and ConstructionFEED Front-End Engineering and DesignFEL Front-End LoadingFPSO Floating Production, Storage and OffloadingFLNG Floating LNGPDRI Project Definition Rating IndexfsQCA Fuzzy Set Qualitative Comparative AnalysisPCA Principal Component Analysis
Appendix A. Boxplot of Weight Factor by Elements
* Note: The main purpose of the “boxplot” below is to secure reliability of the data set and similarity withnormal distribution, number of extreme and outlier was collected from each participant, and the contributionscore was calculated. The survey results with a high contribution score were eliminated.

Sustainability 2018, 10, 2469 21 of 31Sustainability 2018, 10, x FOR PEER REVIEW 21 of 31
Figure A1. The Boxplot for DECRIS Elements A1 to D9.
Figure A2. The Boxplot for DECRIS Elements E1 to H3.
Figure A1. The Boxplot for DECRIS Elements A1 to D9.
Sustainability 2018, 10, x FOR PEER REVIEW 21 of 31
Figure A1. The Boxplot for DECRIS Elements A1 to D9.
Figure A2. The Boxplot for DECRIS Elements E1 to H3.
Figure A2. The Boxplot for DECRIS Elements E1 to H3.
Sustainability 2018, 10, x FOR PEER REVIEW 21 of 31
Figure A1. The Boxplot for DECRIS Elements A1 to D9.
Figure A2. The Boxplot for DECRIS Elements E1 to H3.
Figure A3. The Boxplot for DECRIS Elements I1 to L3.

Sustainability 2018, 10, 2469 22 of 31
Appendix B. Weighted Scoresheet
* Note: The main purpose of the “Weighted Scoresheet” listed below is to assign weighted scores for mappingthem to the “Definition Level” (scale 0~5) for each DECRIS element based on the experts’ practices collected fromthe workshops.
SECTION I-BASIS OF DETAIL DESIGN
CATEGORY ElementDefinition Level
Score0 1 2 3 4 5
A. PROJECT SCOPE
A1. Project Objectives Statement 0 1 3 5 7 9
A2. Project Scope of Work 0 1 5 9 13 17
A3. Project Philosophies 0 1 4 7 10 13
B. PROJECT PERFORMANCE REQUIREMENT
B1. Products 0 1 4 7 10 12
B2. Capacities 0 1 4 7 10 13
B3. Technology 0 1 4 7 10 12
B4. Processes 0 1 5 9 13 14
C. DESIGN GUIDELINE
C1. Process Design Criteria 0 1 5 9 13 16
C2. Project Site Assessment 0 1 5 9 13 14
C3. Lead Discipline Scope of Work 0 1 5 9 13 14
C4. Project Schedule 0 1 5 9 13 17
C5. Constructability Analysis 0 1 5 9 13 15
SECTION II-ENGINEERING DELIVEABLES
D. PROCESS/MECHANICAL/PIPING
D1. Process Flow Diagrams 0 1 5 9 13 15
D2. Heat and Material Balance 0 1 5 9 13 15
D3. Piping & Instrumentation Diagrams 0 2 7 12 17 18
D4. Process Safety Management (PSM) 0 1 5 9 13 15
D5. Utility Flow Diagram 0 1 5 9 13 14
D6. Process Datasheets 0 1 5 9 13 15
D7. Equipment Mechanical Datasheets 0 1 5 9 13 15
D8. Specifications 0 1 5 9 13 16
D9. Piping System Requirements 0 1 5 9 13 15
D10. Plot Plan 0 1 5 9 13 16
D11. Project Equipment List 0 1 4 7 10 13
D12. Line Lists 0 1 4 7 10 13
D13. Tie-in Lists 0 1 4 7 10 13
D14. Piping Stress Analysis 0 1 5 9 13 15
D15. Piping Isometric Drawings 0 1 4 7 10 13
D16. Piping Specialty Items Lists 0 1 4 7 10 12
D17. Instrument Index 0 1 4 7 10 13

Sustainability 2018, 10, 2469 23 of 31
SECTION I-BASIS OF DETAIL DESIGN
CATEGORY ElementDefinition Level
Score0 1 2 3 4 5
E. EQUIPMENT VENDOR
E1. Equipment Procurement Status 0 1 5 9 13 15
E2. In-line and Instrument Procurement Status 0 1 5 9 13 14
E3. Equipment General Arrangement Drawings 0 1 5 9 13 17
E4. Process and Mechanical Documents 0 1 5 9 13 14
E5. Instrument and Electrical Documents 0 1 5 9 13 14
E6. Structural and Architectural Documents 0 1 4 7 10 13
E7. Equipment Utility Requirements 0 1 5 9 13 14
F. STRUCTURAL AND ARCHITECTURAL
F1. Structural Specifications 0 1 5 9 13 15
F2. Structural Analysis 0 1 5 9 13 16
F3. Architectural Arrangement Drawing 0 1 4 7 10 13
F4. Weight Control Report 0 1 5 9 13 15
G. INSTRUMENT AND ELECTRICAL
G1. Control Philosophy 0 1 5 9 13 15
G2. Logic Diagrams 0 1 5 9 13 15
G3. Cable Schedule 0 1 5 9 13 14
G4. Hook-up Diagram 0 1 5 9 13 14
G5. Critical Electrical Item List 0 1 5 9 13 14
G6. Electrical Single Line Diagrams 0 1 5 9 13 15
G7. Instrument and Electrical Specifications 0 1 5 9 13 15
H. MATERIAL TAKE-OFF
H1. Piping MTO 0 1 5 9 13 15
H2. Structural and Architectural MTO 0 1 5 9 13 15
H3. Instrument and Electrical Bulk Item MTO 0 1 5 9 13 15
I. 3D MODELING
I1. 3D Modeling Review 0 1 5 9 13 17
I2. 3D Modeling (Equipment/Piping) 0 1 5 9 13 17
I3. 3D Modeling (Structural) 0 1 5 9 13 15
I4. 3D Modeling (Architectural) 0 1 5 9 13 15
I5. 3D Modeling (Instrument and Electrical) 0 1 5 9 13 15
J. GENERAL FACILITY REQUIREMENT
J1. Preservation and Storage Requirement 0 1 4 7 10 12
J2. Transportation Requirements 0 1 4 7 10 13
J3. Welding Procedure Specification 0 1 5 9 13 16

Sustainability 2018, 10, 2469 24 of 31
SECTION I-BASIS OF DETAIL DESIGN
CATEGORY ElementDefinition Level
Score0 1 2 3 4 5
SECTION III-EXECUTION APPROACH
K. ENGINEERING PROJECT MANAGEMENT
K1. Team Participants and Roles 0 1 4 7 10 13
K2. Engineering/Construction Methodology 0 1 5 9 13 15
K3. Deliverables for Design and Construction 0 1 5 9 13 15
K4. Deliverables for Commissioning and Close-out 0 1 4 7 10 13
K5. Owner Approval Requirements 0 1 5 9 13 14
K6. Interface Management 0 1 5 9 13 16
K. ENGINEERING PROJECT MANAGEMENT
K7. Risk Analysis 0 1 5 9 13 15
K8. Identify Long Lead/Critical Equipment andMaterials 0 1 5 9 13 15
L. PROJECT EXECUTION PLAN
L1. Project Cost Estimate and Control 0 1 5 9 13 15
L2. Procurement Procedures and Plans 0 1 5 9 13 15
L3. Project Change Control 0 1 5 9 13 15
Appendix C. DECSIS Level Assessment Questionnaires (Selected Samples)
* Note: The main purpose of the “Level Assignment Questionnaires” listed below is to provide the assessmentcriteria for the “Definition Level” of each DECRIS element. The sample “Questionnaires” included in thisAppendix C is covering Section II—Category D only, which is about 25% of the total full questionnaires descriptions(17 elements in Category D among 69 total elements), due to the space limit. The full questionnaire descriptionswill be available on the main author’s (M.H. Kim) doctoral thesis later.
Section II: Engineering DeliverablesCategory D. Process/Mechanical/Piping
D1. Process Flow Diagrams
Level Description1 Final Process Simulation was carried out and AFC stage Process Flow Diagram (PFD) was approved
without comment. No further design change in Process Flow Diagram is foreseen.2 Updated Process Simulation in detail engineering was performed according to project requirements,
as well as Client comments from PFD and major design changes. Revised PFD (AFD) was issued.No further major design change in Process flow diagram is foreseen.
3 Process simulation in detail engineering was performed in line with Project Requirements, and itsresult including PFD (IFA, first revision) was updated and submitted to the Client.
4 There is no discrepancy between process simulation, PFD, and Heat and Material Balance in FEED.In addition, they comply with Basis of Design. No process simulation in detail engineering stagewas performed.
5 There is no process simulation performed in FEED, or many discrepancies between processsimulation, PFD and Heat and Material Balance were found. No process simulation in detailengineering was performed.

Sustainability 2018, 10, 2469 25 of 31
D2. Heat and Material Balances
Level Description1 AFC Heat and Material Balance and Process Description were approved without comment.
No further design change in Heat and Material Balance is foreseen.2 Updated Heat and Material Balance and Process description in detail engineering were developed
according to Project requirements, as well as Client comments from previous documents and majordesign changes. Revised Heat and Material Balance and Process description (AFD) were issued.No further major design change in Heat and Material Balance and Process Description is foreseen.
3 Heat and Material Balance and Process Description in detail engineering were developed in linewith Project Requirements, and issued with IFA (first revision).
4 There is no discrepancy between PFD, Heat and Mass Balance and Process description in FEED.In addition, they comply with Basis of Design and design capacity margin. No Heat and MaterialBalance in detail engineering was developed.
5 Many discrepancies between PFD, Process Description and Heat and Material Balance were found.No PFD and Heat and Material Balance in detail engineering were issued.
D3. Piping and Instrumentation Diagrams
Level Description1 AFC Piping and Instrumentation Diagram (P&ID) was issued with incorporated Final Equipment
P&ID (Vendor) and In-line instrument Vendor data, and approved without comment. All Hazardand operability (HAZOP) recommendations were closed and incorporated in P&ID. No furtherdesign change in P&ID is foreseen.
2 Updated P&ID in detail engineering were developed according to Project Requirements,Client comments from previous P&ID and 30% Modeling Punch, and major design changes.Revised P&ID (AFD) was issued. Process HAZOP and Package Unit HAZOP were performed andProcess Line List and Line diagram was issued. No further major change in P&ID is foreseen.
3 P&ID in detail engineering was developed in line with Project Requirements, and issued with IFA(first revision). Preliminary Vendor Documents or Value Improving Practices for major equipmentwas incorporated in IFA P&ID. Hazardous Identification (HAZID) recommendation wasincorporated.
4 There is no discrepancy between PFD, Process description, Utility Flow Diagram (UFD), P&ID inFEED. In addition, it complies with Basis of Design and design capacity margin. No P&ID in detailengineering was developed.
5 Many discrepancies between PFD, Process Description, UFD and P&ID were found. No P&ID indetail engineering was issued.
D4. Process Safety Management
Level Description1 All HAZOP/HAZID recommendations were concluded and approved by the client. In addition,
the relevant engineering deliverables were properly documented and approved.2 HAZOP for Vendor packaged unit and Contractor’s system were finished based on updated P&IDs.
Major HAZOP/HAZID recommendations were concluded and approved by the client.3 HAZOP has been performed for the Contractor’s system based on P&ID issued by Contractor.
Major HAZID recommendations were concluded and approved by the client.4 HAZID was performed during FEED stage. Environmental/Human/Process/Facility Operation
hazards have been defined. HAZOP was not performed.5 No HAZID was performed during FEED stage. Environmental/Human/Process/Facility Operation
hazards have not been defined yet.

Sustainability 2018, 10, 2469 26 of 31
D5. Utility Flow Diagrams
Level Description1 AFC stage UFD was approved without comment. No further design change in the UFD is foreseen.2 From incorporating Client comments in UFD, Vendor information for utility consumption and major
design changes, revised UFD (AFD) was issued. No further major design change in UFD is foreseen.3 Heat and Material Balance and UFD in detail engineering were developed in line with Project
Requirements, and issued with IFA (first revision).4 There is no discrepancy between UFD and Heat and Material Balance in FEED. In addition,
they comply with Basis of Design. Utility requirements for major consumer were defined throughequipment information.
5 Many discrepancies between UFD and Heat and Material Balance in FEED were found.Utility requirements for consumer were estimated only with historical data and no equipmentinformation was developed.
D6. Process Datasheets
Level Description1 Final Process datasheets were approved without comment. No further design change in the process
datasheet is foreseen.2 From incorporating Client comments in process datasheet, Selected Vendor’s information and major
design changes, the revised process datasheets were issued. No further major design change in processdatasheet is foreseen.
3 Process datasheets in detail engineering were developed in line with Project Requirements, andissued with IFA (first revision). Value Improving Practices for major equipment were incorporatedin the process datasheet.
4 All process datasheets for major equipment were developed during FEED stage. There is no majordiscrepancy between FEED P&ID and process datasheets. No process datasheet in detailengineering was developed.
5 No process datasheet was included in FEED packages, or process datasheets were developed forLong Lead Items (LLI) only during FEED stage. There are many discrepancies in FEED P&ID andprocess datasheets.
D7. Equipment Mechanical Datasheets
Level Description1 AFC stage equipment mechanical datasheets were completed with Vendor’s firm information and
approved without comment. No further design change in the equipment mechanical datasheet isforeseen.
2 From incorporating Client comments in equipment mechanical datasheet, Selected Vendor’sinformation and major design changes, the revised equipment mechanical datasheets were issued.No further major design change in equipment mechanical datasheet is foreseen.
3 Equipment mechanical datasheets in detail engineering were developed in line with ProjectRequirements, and issued with IFA (first revision). Value Improving Practices and applicableCode/Standard requirements for major equipment were incorporated in the equipment mechanicaldatasheet.
4 All equipment mechanical datasheets for major equipment were developed during FEED stage.There is no major discrepancy between FEED P&ID and equipment mechanical datasheets.No equipment mechanical datasheet in detail engineering was developed.
5 No equipment mechanical datasheet was included in FEED packages, or equipment mechanicaldatasheets were developed for LLI only during FEED stage. There are many discrepancies in FEEDP&ID and equipment mechanical datasheets.

Sustainability 2018, 10, 2469 27 of 31
D8. Specifications
Level Description
1 AFC stage process, mechanical and piping specifications were approved without comment.No further design change in the specification is foreseen.
2 From incorporating Client comments in specification and major design changes, the revisedspecifications were issued. No further major design change in specification is foreseen.
3 Specifications in detail engineering were developed in line with Project Requirements, and issuedwith IFA (first revision). The specification includes equipment type, packaged units,piping specifications, protective coating and insulation.
4 All major specifications were developed during FEED stage. There is no major discrepancy betweenspecifications. No specification in detail engineering was developed.
5 No specification was included in FEED packages, or there are many discrepancies in FEEDspecifications.
D9. Piping System Requirements
Level Description1 AFC stage piping material classes were completed with Vendor’s firm information and approved
without comment. No further design change in the piping material class is foreseen.2 From incorporating Client comments in piping material class, additional piping materials and major
design changes, the revised piping material class was issued. No further major design change inequipment mechanical datasheet is foreseen.
3 Piping material classes in detail engineering were developed in line with Project Requirements, andissued with IFA (first revision). Value Improving Practices and applicable Code/Standardrequirements were incorporated in the piping material class.
4 All piping material classes were developed in line with material selection in FEED stage.All relevant devices including straight runs, elbows, tees, flanges, reducers, manual valves,gaskets, bolts and nuts were defined in the piping material classes.
5 No piping material class was developed during FEED stage, or piping material class was partiallydeveloped.
D10. Plot Plan
Level Description1 AFC stage plot plan was completed with Vendor’s firm information, 60% and 90% modeling review
punch and approved without comment. No further design change in the plot plan is foreseen.2 From incorporating Client comments in plot plan, 30% modeling review punch and major design
changes, the revised plot plan (AFD stage) was issued. No further major design change in plot planis foreseen.
3 Plot plan in detail engineering was developed in line with Project Requirements and preliminaryequipment Vendor documents, and issued with IFA (first revision). Value Improving Practicesincluding process function group and interconnection optimization were incorporated in theplot plan.
4 Plot plan was developed with all equipment, evacuation path, access/handling volume, largediameter pipe (including flexibility requirement), and access way and hazard area risks.
5 Plot plan was developed with limited equipment and device information during FEED stage.

Sustainability 2018, 10, 2469 28 of 31
D11. Project Equipment Lists
Level Description1 AFC stage project equipment list was completed with Vendor’s firm information and approved without
comment.2 From incorporating Client comments in project equipment datasheet, Vendor information and major
design changes, the revised project equipment list was issued. All disciplines’ input wasincorporated and no additional equipment in project equipment list is foreseen.
3 Project equipment list in detail engineering was developed in line with Project Requirements,and issued with IFA (first revision). Value Improving Practices and potential Vendor’s informationfor equipment were incorporated in the package equipment list. Additionally, equipment listincludes Vendor name, equipment model, insulation and fire proofing requirements.
4 Project equipment list for all major equipment was developed during FEED stage. There is no majordiscrepancy between FEED P&ID and equipment list. Equipment list includes tag number,equipment description, equipment type, capacity/quantity, position/module/deck,assumed dimension/weight.
5 Project equipment list was developed for major equipment only during FEED stage. No auxiliaryequipment was considered in the project equipment list. There are many discrepancies in projectequipment list and P&ID.
D12. Line Lists
Level Description1 AFC stage line list was completed with all pipelines and approved without comment.2 From incorporating Client comments in line list and major design changes in P&IDs, the revised line
list (AFD) was issued. All lines over 2” with insulation and Passive Fire Protection (PFP)requirements shall be included in the line list.
3 Line list in detail engineering was developed in line with IFA P&IDs, and issued with IFA(first revision). Line list should include large bore and exotic material lines for 1st MTO forpiping materials.
4 Line list for all major pipe route was developed during FEED stage. There is no major discrepancybetween FEED P&ID and line list. Line list includes tag number, operating and design condition,pipe specification, insulation/tracing and painting requirement.
5 No line list was developed during FEED stage.
D13. Tie-in Lists
Level Description1 AFC stage tie-in list was completed with AFC P&ID, verified with Vendor documents and/or
confirmations, and approved without comment.2 From incorporating Client comments in tie-in list, Vendor documents (General Arrangement
Drawing for Equipment) and major design change in P&IDs, the revised tie-in list (AFD) was issued.All lines over 2” with insulation and PFP requirements shall be included in the tie-in list.
3 Tie-in list in detail engineering were developed in line with IFA P&IDs, and issued with IFA (firstrevision). Tie-in list should crosscheck with preliminary Vendor information for major equipment.Structured process to validate tie-ins and tie-in strategy was documented.
4 Tie-in list for major pipe connections was developed during FEED stage. There is no majordiscrepancy between FEED P&ID and tie-in list. The tie-in list includes line tag number,reference drawings, pipe specification, and type and size of tie-in.
5 No tie-in list was developed during FEED stage.

Sustainability 2018, 10, 2469 29 of 31
D14. Pipe Stress Analysis
Level Description1 AFC stage piping stress analysis was completed with AFC P&ID, verified with Vendor documents
and/or confirmations, and approved without comment. All support and anchor locations weresettled, and no further design change is expected.
2 From incorporating Client comments in piping stress analysis, Vendor information for boundarycondition (allowable nozzle load) and major design changes in P&IDs, the revised piping stressanalysis (AFD) was performed.
3 Piping stress analysis in detail engineering was conducted in line with IFA P&IDs, and issued withIFA (first revision). Support and anchor locations, and pipe wall thickness were updated as per thepiping stress analysis.
4 Guidelines for piping stress analysis were developed in FEED package. Applications for hightemperature, large diameter, and heavy wall thickness, upstream and downstream of rotatingequipment were well defined.
5 No guidelines for piping stress analysis were developed during FEED stage. FEED package doesnot specify the extent of piping stress analysis.
D15. Piping Isometric Drawings
Level Description1 AFC stage piping isometric drawings were completed with AFC P&ID, and approved without
comment. All support and anchor locations were settled, and no further design change is expected.2 From incorporating Client comments in piping isometric drawings and major design changes in
P&IDs, the revised piping isometric drawing (AFD) was generated and submitted.3 Methodology to generate piping isometric drawing was settled. Piping isometric drawings in detail
engineering were generated from 3D modeling, and issued with IFA (first revision). Support andanchor locations, and pipe wall thickness were updated as per the piping stress analysis.
4 Guidelines for piping isometric drawing were developed in FEED package. Requirements forpiping isometric drawings were well defined.
5 No guidelines for piping isometric drawing were developed during FEED stage.
D16. Piping Specialty Items Lists
Level Description1 AFC stage piping specialty items list was completed with AFC P&ID, and approved without
comment. Catalog for 3D modeling was settled, and no further design change is expected.2 From incorporating Client comments in piping specialty items list and major design changes in
P&IDs, the revised piping specialty items list (AFD) was generated and submitted.3 Piping specialty items list in detail engineering was developed in line with IFA P&IDs, and issued
with IFA (first revision). Scope of supply was defined and preliminary Vendor informationwas given.
4 Guidelines for piping specialty items were developed in FEED package. Types of piping specialtyitems including strainers, steam traps, flexible hoses, and expansion joints were defined.
5 No guidelines for piping specialty items were developed during FEED stage.

Sustainability 2018, 10, 2469 30 of 31
D17. Instrument Index
Level Description1 AFC stage instrument index was completed with approved AFC P&ID, and approved without
comment. All information on instrument index was settled, and no further design change isexpected.
2 From incorporating Client comments in instrument index and major design changes in P&IDs,the revised instrument index (AFD) was generated and submitted. No major change on instrumentindex is foreseen.
3 Instrument index in detail engineering was developed in line with IFA P&IDs, and issued with IFA(first revision). Information of tag numbers, service conditions, instrument type, and signal output,material of construction, range and set point was provided.
4 Guidelines for instrument index were developed in FEED package. Requirement for instrumentindex was defined.
5 No guidelines for instrument index were developed during FEED stage.
Appendix D. PDRI-Industrial Hierarchy
* Note: The PDRI section grouping was referred in order to provide a comparison with DECRIS [7].The sections, basis of project decision and front-end definition, are thus major components of PDRI-Industrial.PDRI focuses on front-end planning and does not represent work packages in the detail engineering stage.The major target of DECRIS is the detail design conducted by EPC contractor; it is thus reasonable that theengineering deliverables of detail engineering is the most important section.
Section I—Basis of Project DecisionSection II—Front-End DefinitionSection III—Execution Approach
The Sub-section groupings are: (3 sub-sections and 70 elements—max score 1000)
Section I—Basis of Project Decision (5 sub-sections and 22 elements-max score 499)
A Manufacturing Objectives Criteria (3 elements—max score 45)B Business Objectives (8 elements—max score 213)C Basic data research & development (2 elements—max score 94)D Project scope (6 elements—max score 120)E Value engineering (3 elements—max score 27)
Section II—Front-End Definition (6 sub-sections and 33 elements—max score 423)
F Site Information (6 elements—max score 104)G Process/Mechanical (13 elements—max score 196)H Equipment Scope (3 elements—max score 33)I Civil, Structural, & Architectural (2 elements—max score 19)J Infrastructure (3 elements—max score 25)K Instrument & Electrical (6 elements—max score 46)
Section III—Execution Approach (4 sub-sections and 15 elements—max score 78)
L Procurement strategy (3 elements—max score 16)M Deliverables (3 elements—max score 9)N Project Control (3 elements—max score 17)P Project Execution Plan (6 elements—max score 36)
References
1. Leffler, W.L.; Pattarozzi, R.; Sterling, G. Deepwater Petroleum Exploration & Production: A Nontechnical Guide;PennWell Books: Houston, TX, USA, 2011.
2. Tanmay. Oil & Gas EPC Market Perspective and Comprehensive Analysis to 2023. 2018. Available online: https://theexpertconsulting.com/oil-gas-epc-market-perspective-and-comprehensive-analysis-to-2023/ (accessed on20 May 2018).

Sustainability 2018, 10, 2469 31 of 31
3. Rijtema, S.; de Haas, R. Creating Sustainable Offshore Developments in the Ultra-Deep Water. In Proceedingsof the Offshore Technology Conference, Houston, TX, USA, 4–7 May 2015.
4. Merrow, E.W. Industrial Megaprojects: Concepts, Strategies, and Practices for Success; Wiley: Hoboken, NJ, USA,2011; Volume 8.
5. Edaily. Available online: http://www.edaily.co.kr/news/news_detail.asp?newsId=03332486612810296&mediaCodeNo=257 (accessed on 10 March 2018).
6. Ahn, B. Managing the Efficiency of Foreign Engineering Contracts: A Study of a Norwegian and South KoreanProject Interface; University of Stavanger: Stavanger, Norway, 2015.
7. Gibson, G.; Dumont, P.R. Project Definition Rating Index (PDRI) for Industrial Projects; Construction IndustryInstitute Implementation Resource: Texas, Austin, 1996.
8. Bingham, E. Development of the Project Definition Rating Index (PDRI) for Infrastructure Projects; Arizona StateUniversity: Tempe, AZ, USA, 2010.
9. Collins, W.A. Development of the Project Definition Rating Index (PDRI) for Small Industrial Projects; Arizona StateUniversity: Tempe, AZ, USA, 2015.
10. Collins, W.; Parrish, K.; Gibson, G.E., Jr. Development of a Project Scope Definition and Assessment Tool forSmall Industrial Construction Projects. J. Manag. Eng. 2017, 33, 04017015. [CrossRef]
11. Zaheer, S.H.; Fallows, C. Document Project Readiness by Estimate Class Using PDRI; EST. 604; AACE InternationalTransactions: Morgantown, WV, USA, 2011.
12. Bingham, E.; Gibson, G.E., Jr. Infrastructure project scope definition using project definition rating index.J. Manag. Eng. 2016, 33, 04016037. [CrossRef]
13. Dumont, P.R.; Gibson, G.E., Jr.; Fish, J.R. Scope management using project definition rating index. J. Manag. Eng.1997, 13, 54–60. [CrossRef]
14. Tih-Ju, C.; An-Pi, C.; Chao-Lung, H.; Jyh-Dong, L. Intelligent Green Buildings Project Scope Definition UsingProject Definition Rating Index (PDRI). Procedia Econ. Financ. 2014, 18, 17–24. [CrossRef]
15. George, R.; Bell, L.C.; Back, W.E. Critical activities in the front-end planning process. J. Manag. Eng. 2008, 24,66–74. [CrossRef]
16. Pheng, L.S.; Chuan, Q.T. Environmental factors and work performance of project managers in theconstruction industry. Int. J. Proj. Manag. 2006, 24, 24–37. [CrossRef]
17. Stenhouse, L. The study of samples and the study of cases. Br. Educ. Res. J. 1980, 6. [CrossRef]18. Thomson, S.B. Sample size and grounded theory. J. Adm. Gov. 2010, 5, 45–52.19. Kline, R.B. Principles and Practice of Structural Equation Modeling; Guilford Publications: New York, NY, USA, 2015.
© 2018 by the authors. Licensee MDPI, Basel, Switzerland. This article is an open accessarticle distributed under the terms and conditions of the Creative Commons Attribution(CC BY) license (http://creativecommons.org/licenses/by/4.0/).