Desirable construction management skills in the South African construction industry: methodology for...
12
DESIRABLE CONSTRUCTION MANAGEMENT SKILLS IN THE SOUTH AFRICAN CONSTRUCTION INDUSTRY: METHODOLOGY FOR ASSESSMENT Dr Nicholas Chileshe 1 , Ph.D., MSc (Eng), MSc(Mgt), MCIOB, MBEng, MCIM, PgCertLT, ILTHEM School of Environment & Development, Sheffield Hallam University, UK [email protected] 1 Visiting Research Fellow, SABERC, Cape Peninsula University of Technology [email protected] Ferdi Fester University of Johannesburg [email protected] Dr Theo C. Haupt, Ph.D., M.Phil., FCIOB, MASI Cape Peninsula University of Technology [email protected] ABSTRACT Within the South African Construction Industry and indeed worldwide, the issue of what should be the desirable skills that construction management graduates should posses varies between academia and industry's expectations. Despite the existence of a range of intervention strategies used to assess the quality of construction graduates emanating from universities in the disciplines of construction management, little research has been undertaken to examine if these interventions can be applied to the South African Construction Industry. Thus the noted omission has been the motivation for this research project. The main aims of this paper are twofold; firstly, to identify the major skills desirable for construction management graduates, secondly to develop a technique for evaluating the construction management graduate skills. Through a survey of 58 South African construction related organisations, this study identifies the 37 skills that are lacking from technikon graduates in construction management disciplines. The survey results indicate that industry rate trust and honesty as the most desirable skill that graduates should posses. Ability to conduct research is the least ranked skill by industry. The findings indicate that the methodology adopted is reliable, valid and undimensional. This paper concludes by presenting the instrument which contributes to the formulation and design of improved model of delivery that addresses the perceived gap between industry and academia. KEYWORDS: Construction Industry, Construction Management, Skills, South Africa, 1.0 INTRODUCTION The South African educational landscape has changed to accord with government’s commitment to transformation and increased access to higher education by all its citizens. Consequently, institutions previously known as Technikons are being transformed into Universities of Technology, charged with the responsibility of delivering instructional offerings that are both relevant and responsive to the needs and priorities of the national economy. These institutions are expected to offer career-oriented educational programs designed to meet the needs of industry and commerce in a hi-tech global economic environment. Their approach to education is practical and outcomes-based, with the intent
Transcript of Desirable construction management skills in the South African construction industry: methodology for...
DESIRABLE CONSTRUCTION MANAGEMENT SKILLS IN THE
SOUTH AFRICAN CONSTRUCTION INDUSTRY:
METHODOLOGY FOR ASSESSMENT
Dr Nicholas Chileshe1, Ph.D., MSc (Eng), MSc(Mgt), MCIOB, MBEng, MCIM, PgCertLT, ILTHEM
School of Environment & Development, Sheffield Hallam University, UK
[email protected] 1Visiting Research Fellow, SABERC, Cape Peninsula University of Technology
Ferdi Fester
University of Johannesburg
Dr Theo C. Haupt, Ph.D., M.Phil., FCIOB, MASI
Cape Peninsula University of Technology
ABSTRACT
Within the South African Construction Industry and indeed worldwide,
the issue of what should be the desirable skills that construction management
graduates should posses varies between academia and industry's expectations.
Despite the existence of a range of intervention strategies used to assess the
quality of construction graduates emanating from universities in the
disciplines of construction management, little research has been undertaken to
examine if these interventions can be applied to the South African
Construction Industry. Thus the noted omission has been the motivation for
this research project. The main aims of this paper are twofold; firstly, to
identify the major skills desirable for construction management graduates,
secondly to develop a technique for evaluating the construction management
graduate skills.
Through a survey of 58 South African construction related organisations,
this study identifies the 37 skills that are lacking from technikon graduates in
construction management disciplines. The survey results indicate that
industry rate trust and honesty as the most desirable skill that graduates
should posses. Ability to conduct research is the least ranked skill by industry.
The findings indicate that the methodology adopted is reliable, valid and
undimensional.
This paper concludes by presenting the instrument which contributes to
the formulation and design of improved model of delivery that addresses the
perceived gap between industry and academia.
KEYWORDS: Construction Industry, Construction Management, Skills,
South Africa,
1.0 INTRODUCTION
The South African educational landscape has changed to accord with government’s
commitment to transformation and increased access to higher education by all its citizens.
Consequently, institutions previously known as Technikons are being transformed into
Universities of Technology, charged with the responsibility of delivering instructional
offerings that are both relevant and responsive to the needs and priorities of the national
economy. These institutions are expected to offer career-oriented educational programs
designed to meet the needs of industry and commerce in a hi-tech global economic
environment. Their approach to education is practical and outcomes-based, with the intent
Chileshe, Fester and Haupt- Desirable Construction Management Skills in the South African
Construction Industry: Methodology for Assessment
2
that their graduates are immediately employable and productive. A key component that
ensures this productivity is the inclusion into technikon programmes of periods of experiential
learning spent in industry (Haupt 2003). This collaborative approach to education, also known
as co-operative education, has 3 stakeholders namely, the institution, industry and students.
Co-operative education includes periods of academic study alternating with a period of related
work experience and prepares the student well for the class-to-work transition. For this goal to
be reached it is necessary that Technikons offer relevant training to adequately prepare their
graduates for the workplace. As observed by McCaffer (2004), "universities and companies
have to work together to promote degree programmes..." (page 19). One way of achieving this
goal would be through the incorporation and integration of Courses offered at National
Building diploma into Construction Management and Quantity Surveying learning outcomes.
Watson and Chileshe (2004) provided a 'unit guide learning outcomes frameworks' using the
example of Project Management drawing some of the experiences from the Chartered
Institute of Building (CIOB) code of Practice for Project Management for Construction and
Development (1996). Furthermore, experiential learning has long been recognized as among
the most effective means of acquiring professional education and training (Tinker and Tramel,
2002; Beliveau and David, 2002, Hicks, 1996)
The views of samples were canvassed nationally using self administered structured
questionnaires of 162 first year students drawn from three institutions and two disciplines
namely construction management and quantity surveying on the nation diploma program.
This paper reports on the findings of the first year students in the National Diploma for the
B.Tech programs. The findings are statistically reported descriptively together with measures
of central tendency, particulaly the means of responses. Equations are also computed to
generate various ranges of indices to enable the assessment of readiness of the building
diplomates. One of the objectives of this study was to examine the levels of knowledge and
skills and attributes needs of industry vis-à-vis Technikon education in the fields of
construction management in order to establish the extent of the perceived mismatch between
sector needs and academic programs at Universities of Technologies within the South African
Construction Industry.
1.1 Academic Subjects Offered in the Built Environment Programme
It is generally accepted that industries that make up the built environment need professionals
with qualifications to increase their effectiveness and create a well trained and motivated
workforce. South Africa is no different, as such during the 1980s the employment market
identified the skills that technicians should possess. These skills were quantified in terms of
time required to acquire each critical skill, and the best place at which to acquire them. It is
against this background that for all engineering programs, approximately one third of the
required skills could be learnt in the work place, and the remainder in the classroom.
2.0 METHODOLOGY
For any research, it is recommended that the response rate should be reported to indicate the
extent of the sample frame polled. What then should be the acceptable response rate? Also,
what should be the appropriate mechanism for managing the questionnaires? According to
Moser and Kalton (1979), the probable numbers of refusals and non-contacts can be roughly
estimated from the pilot survey and the effectiveness of various ways of reducing non-
responses can be compared. It is generally acknowledged that the main problem with mail
surveys is that of getting an adequate response rate. Moser and Kalton (1979) identified
among the factors influencing the response rate as that of its sponsorship, population and
subject matter. Depending on the nature of research, response rates may vary. However for
survey-based research, a 20% response rate is acceptable. (Malhotra and Grover, 1998).
Based on Frolich (2002), the following techniques were adopted to improve the response rate:
existing scales, results, pre-notice and multiple mailings.
Chileshe, Fester and Haupt- Desirable Construction Management Skills in the South African
Construction Industry: Methodology for Assessment
3
2.1 Missing Data It is acknowledged by various researchers that missing and incomplete data of any studies
could lead to wrong conclusions being drawn. Missing data is normally of two types, one
called item non-response, where a question is left unanswered, and unit non-response, where
the whole questionnaire is omitted. The first type was resolved by a commonly used method
known as ‘simple mean imputation’. Alternatively, the approach would be to exclude the
data, though this approach could be misleading. Where a value for a sliding scale was
missing, the ‘median’ for that particular question was included. The median was used for a
number of different reasons. Firstly, the rest of the questions were all whole numbers and to
include the ‘mean’ would have moved away from this. Secondly, a number of questions
were skewed (see the results of the descriptive statistics in the appendix D), with a number of
outlying responses lowering the mean. Therefore the median value can be seen to give a
more accurate picture of what the average respondent thought.
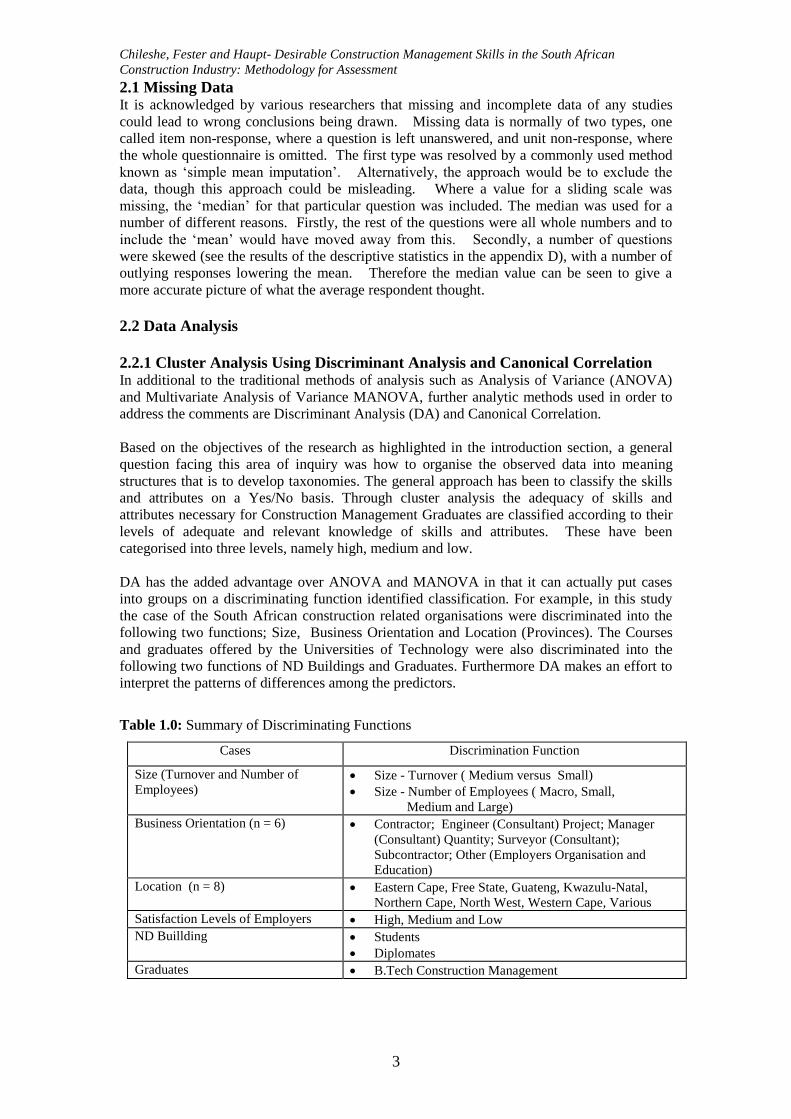
2.2 Data Analysis
2.2.1 Cluster Analysis Using Discriminant Analysis and Canonical Correlation In additional to the traditional methods of analysis such as Analysis of Variance (ANOVA)
and Multivariate Analysis of Variance MANOVA, further analytic methods used in order to
address the comments are Discriminant Analysis (DA) and Canonical Correlation.
Based on the objectives of the research as highlighted in the introduction section, a general
question facing this area of inquiry was how to organise the observed data into meaning
structures that is to develop taxonomies. The general approach has been to classify the skills
and attributes on a Yes/No basis. Through cluster analysis the adequacy of skills and
attributes necessary for Construction Management Graduates are classified according to their
levels of adequate and relevant knowledge of skills and attributes. These have been
categorised into three levels, namely high, medium and low.
DA has the added advantage over ANOVA and MANOVA in that it can actually put cases
into groups on a discriminating function identified classification. For example, in this study
the case of the South African construction related organisations were discriminated into the
following two functions; Size, Business Orientation and Location (Provinces). The Courses
and graduates offered by the Universities of Technology were also discriminated into the
following two functions of ND Buildings and Graduates. Furthermore DA makes an effort to
interpret the patterns of differences among the predictors.
Table 1.0: Summary of Discriminating Functions
Cases Discrimination Function
Size (Turnover and Number of
Employees) Size - Turnover ( Medium versus Small)
Size - Number of Employees ( Macro, Small,
Medium and Large)
Business Orientation (n = 6) Contractor; Engineer (Consultant) Project; Manager
(Consultant) Quantity; Surveyor (Consultant);
Subcontractor; Other (Employers Organisation and
Education)
Location (n = 8) Eastern Cape, Free State, Guateng, Kwazulu-Natal,
Northern Cape, North West, Western Cape, Various
Satisfaction Levels of Employers High, Medium and Low
ND Buillding Students
Diplomates
Graduates B.Tech Construction Management
Chileshe, Fester and Haupt- Desirable Construction Management Skills in the South African
Construction Industry: Methodology for Assessment
4
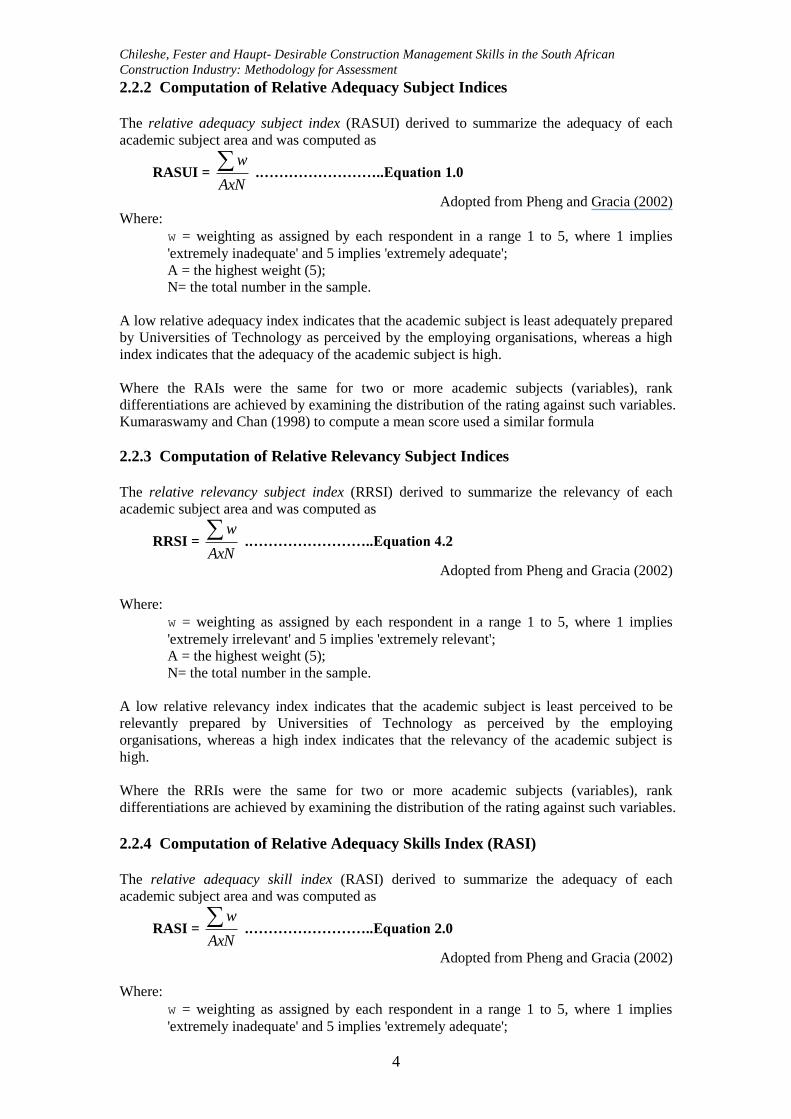
2.2.2 Computation of Relative Adequacy Subject Indices
The relative adequacy subject index (RASUI) derived to summarize the adequacy of each
academic subject area and was computed as
RASUI = AxN
w .……………………..Equation 1.0
Adopted from Pheng and Gracia (2002)
Where:
w = weighting as assigned by each respondent in a range 1 to 5, where 1 implies
'extremely inadequate' and 5 implies 'extremely adequate';
A = the highest weight (5);
N= the total number in the sample.
A low relative adequacy index indicates that the academic subject is least adequately prepared
by Universities of Technology as perceived by the employing organisations, whereas a high
index indicates that the adequacy of the academic subject is high.
Where the RAIs were the same for two or more academic subjects (variables), rank
differentiations are achieved by examining the distribution of the rating against such variables.
Kumaraswamy and Chan (1998) to compute a mean score used a similar formula
2.2.3 Computation of Relative Relevancy Subject Indices
The relative relevancy subject index (RRSI) derived to summarize the relevancy of each
academic subject area and was computed as
RRSI = AxN
w .……………………..Equation 4.2
Adopted from Pheng and Gracia (2002)
Where:
w = weighting as assigned by each respondent in a range 1 to 5, where 1 implies
'extremely irrelevant' and 5 implies 'extremely relevant';
A = the highest weight (5);
N= the total number in the sample.
A low relative relevancy index indicates that the academic subject is least perceived to be
relevantly prepared by Universities of Technology as perceived by the employing
organisations, whereas a high index indicates that the relevancy of the academic subject is
high.
Where the RRIs were the same for two or more academic subjects (variables), rank
differentiations are achieved by examining the distribution of the rating against such variables.
2.2.4 Computation of Relative Adequacy Skills Index (RASI)
The relative adequacy skill index (RASI) derived to summarize the adequacy of each
academic subject area and was computed as
RASI = AxN
w .……………………..Equation 2.0
Adopted from Pheng and Gracia (2002)
Where:
w = weighting as assigned by each respondent in a range 1 to 5, where 1 implies
'extremely inadequate' and 5 implies 'extremely adequate';
Chileshe, Fester and Haupt- Desirable Construction Management Skills in the South African
Construction Industry: Methodology for Assessment
5
A = the highest weight (5);
N= the total number in the sample.
A low relative skills adequacy index indicates that the construction management skill is least
adequately prepared by Universities of Technologies as perceived by the staff and employing
organisations (Industry), whereas a high index indicates that the adequacy of the skill is high.
Where the RASIs were the same for two or more construction management skills (variables),
rank differentiations are achieved by examining the distribution of the rating against such
variables. Kumaraswamy and Chan (1998) to compute a mean score used a similar formula
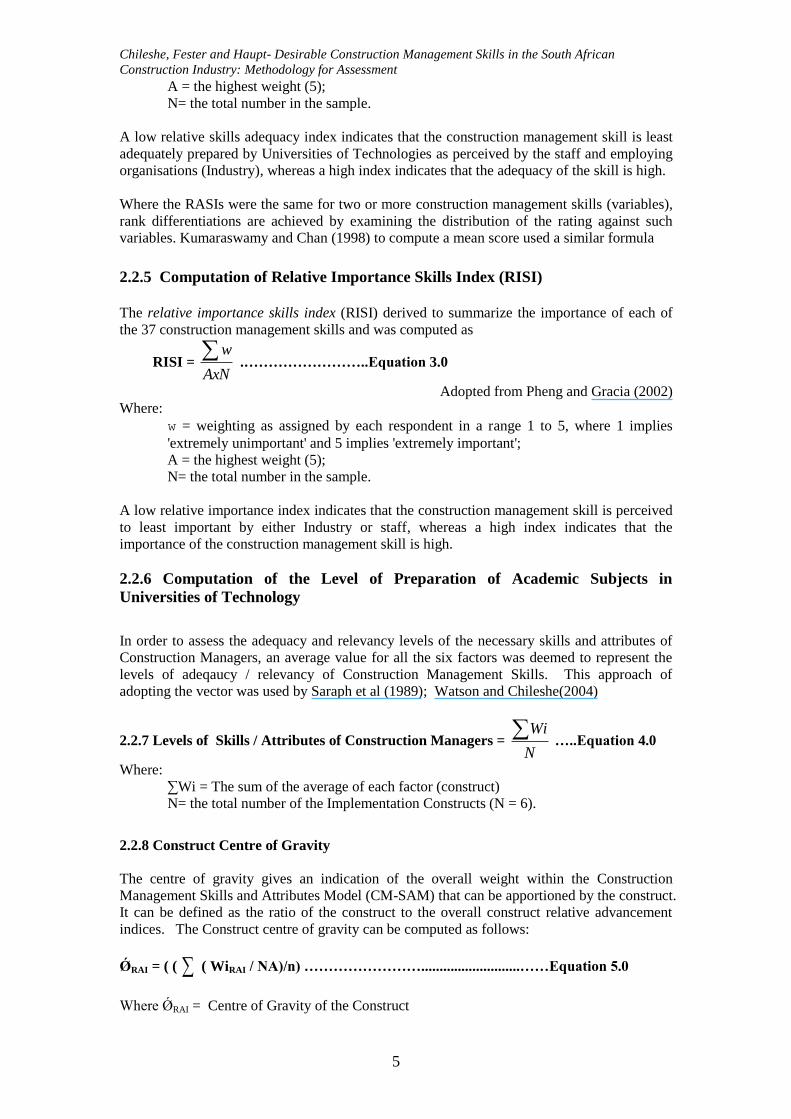
2.2.5 Computation of Relative Importance Skills Index (RISI)
The relative importance skills index (RISI) derived to summarize the importance of each of
the 37 construction management skills and was computed as
RISI = AxN
w .……………………..Equation 3.0
Adopted from Pheng and Gracia (2002)
Where:
w = weighting as assigned by each respondent in a range 1 to 5, where 1 implies
'extremely unimportant' and 5 implies 'extremely important';
A = the highest weight (5);
N= the total number in the sample.
A low relative importance index indicates that the construction management skill is perceived
to least important by either Industry or staff, whereas a high index indicates that the
importance of the construction management skill is high.
2.2.6 Computation of the Level of Preparation of Academic Subjects in
Universities of Technology
In order to assess the adequacy and relevancy levels of the necessary skills and attributes of
Construction Managers, an average value for all the six factors was deemed to represent the
levels of adeqaucy / relevancy of Construction Management Skills. This approach of
adopting the vector was used by Saraph et al (1989); Watson and Chileshe(2004)
2.2.7 Levels of Skills / Attributes of Construction Managers = N
Wi …..Equation 4.0
Where:
∑Wi = The sum of the average of each factor (construct)
N= the total number of the Implementation Constructs (N = 6).
2.2.8 Construct Centre of Gravity
The centre of gravity gives an indication of the overall weight within the Construction
Management Skills and Attributes Model (CM-SAM) that can be apportioned by the construct.
It can be defined as the ratio of the construct to the overall construct relative advancement
indices. The Construct centre of gravity can be computed as follows:
ǾRAI = ( ( ( WiRAI / NA)/n) ……………………...........................……Equation 5.0
Where ǾRAI = Centre of Gravity of the Construct
Chileshe, Fester and Haupt- Desirable Construction Management Skills in the South African
Construction Industry: Methodology for Assessment
6
Table 2.0: Scoring the Levels of CM-SA Preparation
Average Score (∑Wi) RAI/RRI CMS Level
4.0 to 5.0 0.8 to 1.0 High (H)
3.0 to < 4.0 0.6 to < 0. 8 Medium (M)
1.0 to < 3. 0 0.2 to < 0.6 Low (L)
The generated scores are from the relative advancement indices and the mean values. These
values will form the basis for the classification of the proposed new assessment and
monitoring tool.
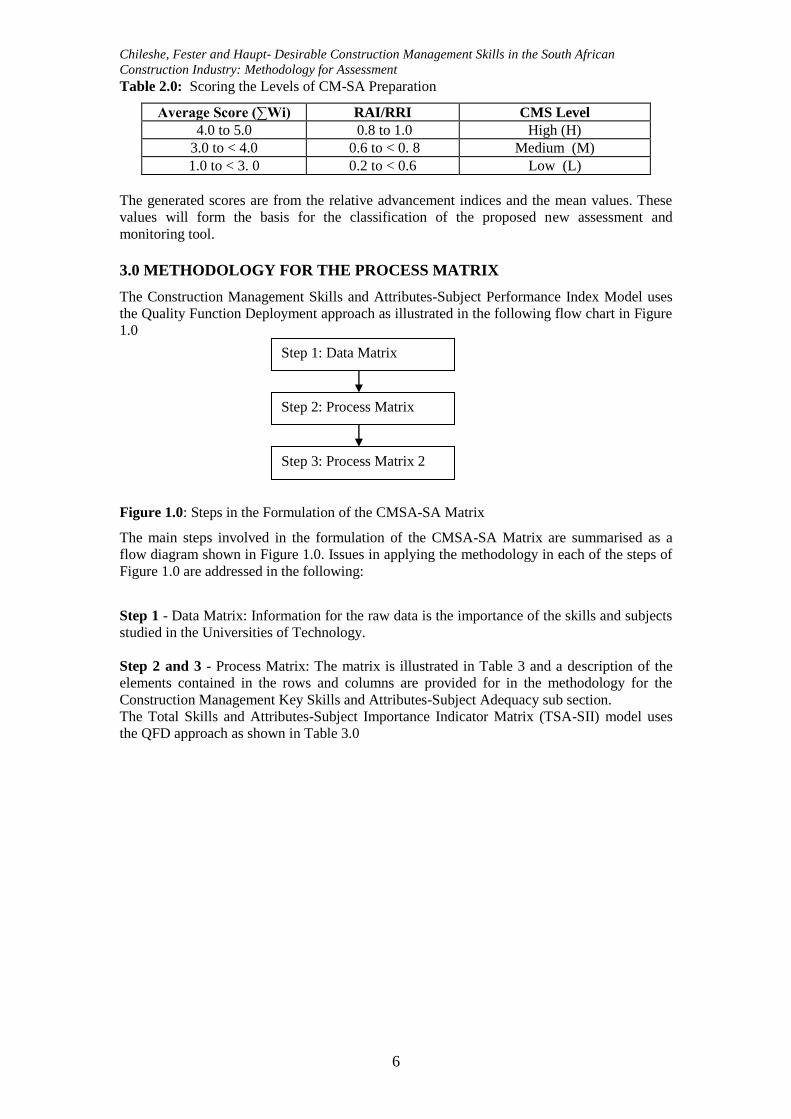
3.0 METHODOLOGY FOR THE PROCESS MATRIX
The Construction Management Skills and Attributes-Subject Performance Index Model uses
the Quality Function Deployment approach as illustrated in the following flow chart in Figure
1.0
Figure 1.0: Steps in the Formulation of the CMSA-SA Matrix
The main steps involved in the formulation of the CMSA-SA Matrix are summarised as a
flow diagram shown in Figure 1.0. Issues in applying the methodology in each of the steps of
Figure 1.0 are addressed in the following:
Step 1 - Data Matrix: Information for the raw data is the importance of the skills and subjects
studied in the Universities of Technology.
Step 2 and 3 - Process Matrix: The matrix is illustrated in Table 3 and a description of the
elements contained in the rows and columns are provided for in the methodology for the
Construction Management Key Skills and Attributes-Subject Adequacy sub section.
The Total Skills and Attributes-Subject Importance Indicator Matrix (TSA-SII) model uses
the QFD approach as shown in Table 3.0
Step 1: Data Matrix
Step 2: Process Matrix
Step 3: Process Matrix 2
Chileshe, Fester and Haupt- Desirable Construction Management Skills in the South African
Construction Industry: Methodology for Assessment
7
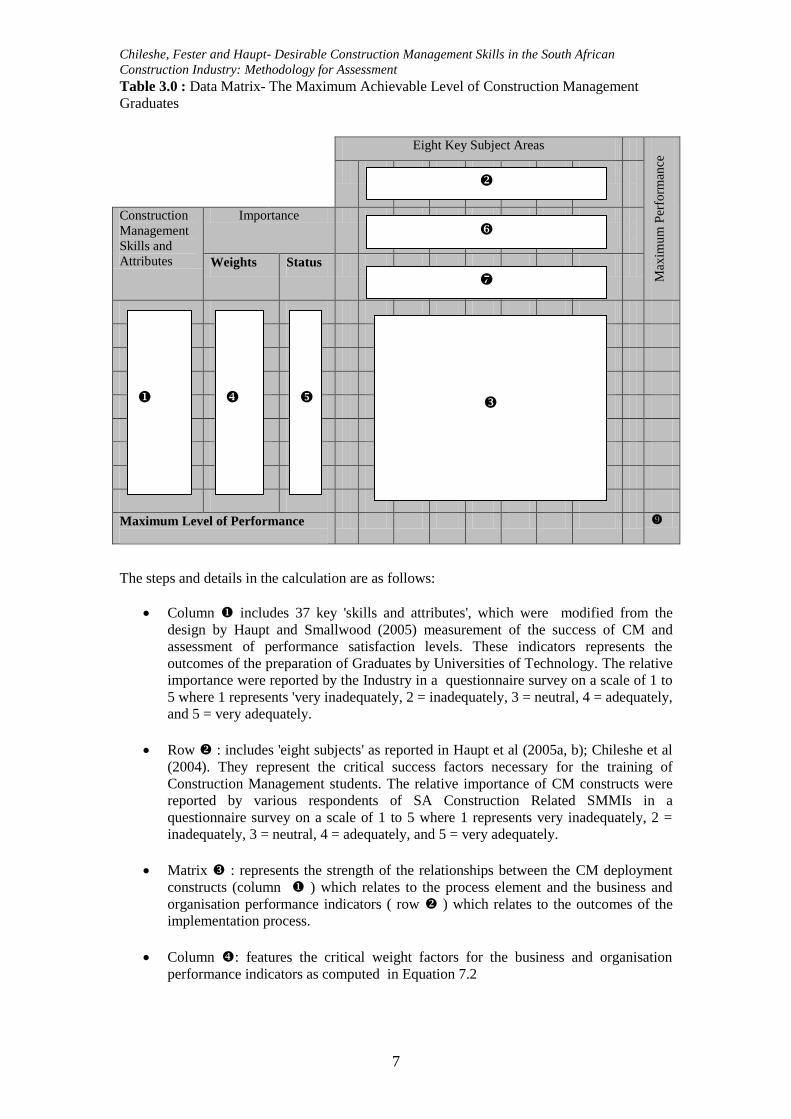
Table 3.0 : Data Matrix- The Maximum Achievable Level of Construction Management
Graduates
Eight Key Subject Areas
Max
imu
m P
erfo
rman
ce
Construction
Management
Skills and
Attributes
Importance
Weights Status
Maximum Level of Performance
The steps and details in the calculation are as follows:
Column includes 37 key 'skills and attributes', which were modified from the
design by Haupt and Smallwood (2005) measurement of the success of CM and
assessment of performance satisfaction levels. These indicators represents the
outcomes of the preparation of Graduates by Universities of Technology. The relative
importance were reported by the Industry in a questionnaire survey on a scale of 1 to
5 where 1 represents 'very inadequately, 2 = inadequately, 3 = neutral, 4 = adequately,
and 5 = very adequately.
Row : includes 'eight subjects' as reported in Haupt et al (2005a, b); Chileshe et al
(2004). They represent the critical success factors necessary for the training of
Construction Management students. The relative importance of CM constructs were
reported by various respondents of SA Construction Related SMMIs in a
questionnaire survey on a scale of 1 to 5 where 1 represents very inadequately, 2 =
inadequately, 3 = neutral, 4 = adequately, and 5 = very adequately.
Matrix : represents the strength of the relationships between the CM deployment
constructs (column ) which relates to the process element and the business and
organisation performance indicators ( row ) which relates to the outcomes of the
implementation process.
Column : features the critical weight factors for the business and organisation
performance indicators as computed in Equation 7.2
Chileshe, Fester and Haupt- Desirable Construction Management Skills in the South African
Construction Industry: Methodology for Assessment
8
Column : represents the status of the key 37 skills and attributes performance
indicators under the conditions of the world class Universities of Technologies ( i.e.
maximum score of 5)
Row : features the critical weight factors for the Construction Management
deployment subjects as computed in Equation 2.2
Row : represents the status of the adequacy of Construction Management
deployment subjects under the conditions of the world class Universities of
Technologies ( i.e. maximum score of 5)
Matrix : the point scores were calculated by the synthesis of the information in
attributes , , , , and according to equation 1.11
Cell : in Table 3.0 is the actual level of the Construction Management Key Skills
and Attributes (37) - and Subject Adequacy Indicator Level under the actual
conditions for the Organisation 8 which is computed the procedure outlined.
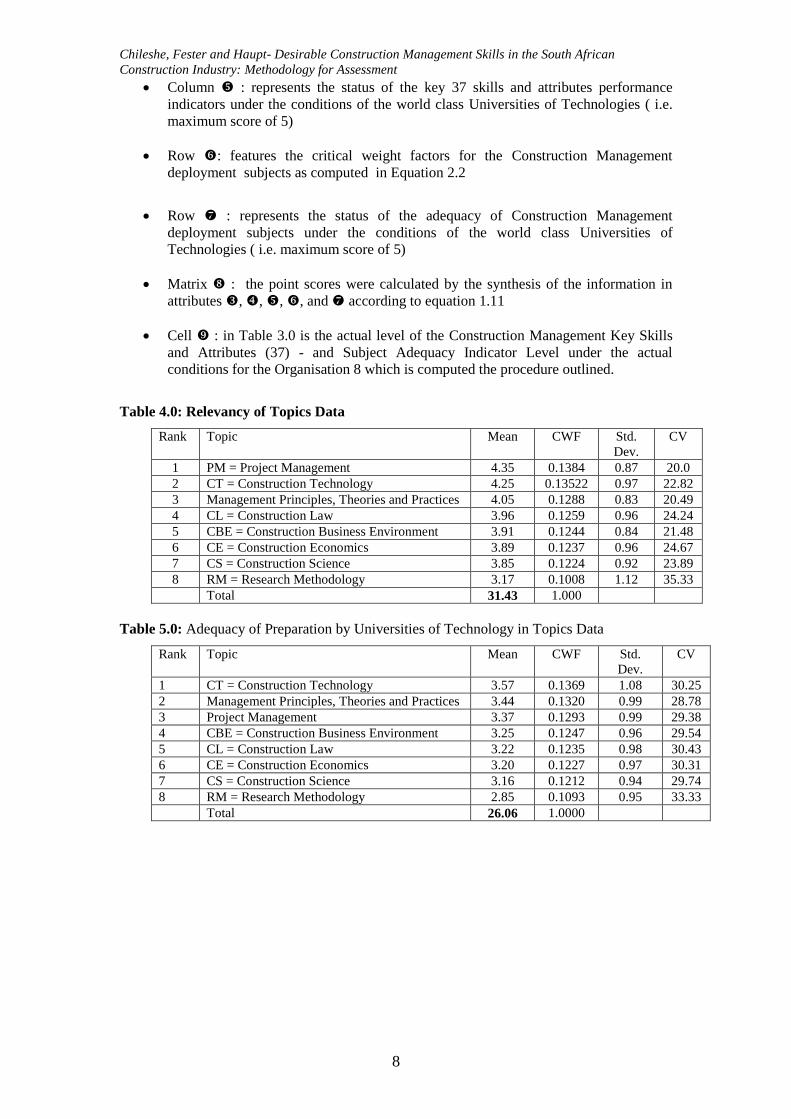
Table 4.0: Relevancy of Topics Data
Rank Topic Mean CWF Std.
Dev.
CV
1 PM = Project Management 4.35 0.1384 0.87 20.0
2 CT = Construction Technology 4.25 0.13522 0.97 22.82
3 Management Principles, Theories and Practices 4.05 0.1288 0.83 20.49
4 CL = Construction Law 3.96 0.1259 0.96 24.24
5 CBE = Construction Business Environment 3.91 0.1244 0.84 21.48
6 CE = Construction Economics 3.89 0.1237 0.96 24.67
7 CS = Construction Science 3.85 0.1224 0.92 23.89
8 RM = Research Methodology 3.17 0.1008 1.12 35.33
Total 31.43 1.000
Table 5.0: Adequacy of Preparation by Universities of Technology in Topics Data
Rank Topic Mean CWF Std.
Dev.
CV
1 CT = Construction Technology 3.57 0.1369 1.08 30.25
2 Management Principles, Theories and Practices 3.44 0.1320 0.99 28.78
3 Project Management 3.37 0.1293 0.99 29.38
4 CBE = Construction Business Environment 3.25 0.1247 0.96 29.54
5 CL = Construction Law 3.22 0.1235 0.98 30.43
6 CE = Construction Economics 3.20 0.1227 0.97 30.31
7 CS = Construction Science 3.16 0.1212 0.94 29.74
8 RM = Research Methodology 2.85 0.1093 0.95 33.33
Total 26.06 1.0000
Chileshe, Fester and Haupt- Desirable Construction Management Skills in the South African
Construction Industry: Methodology for Assessment
9
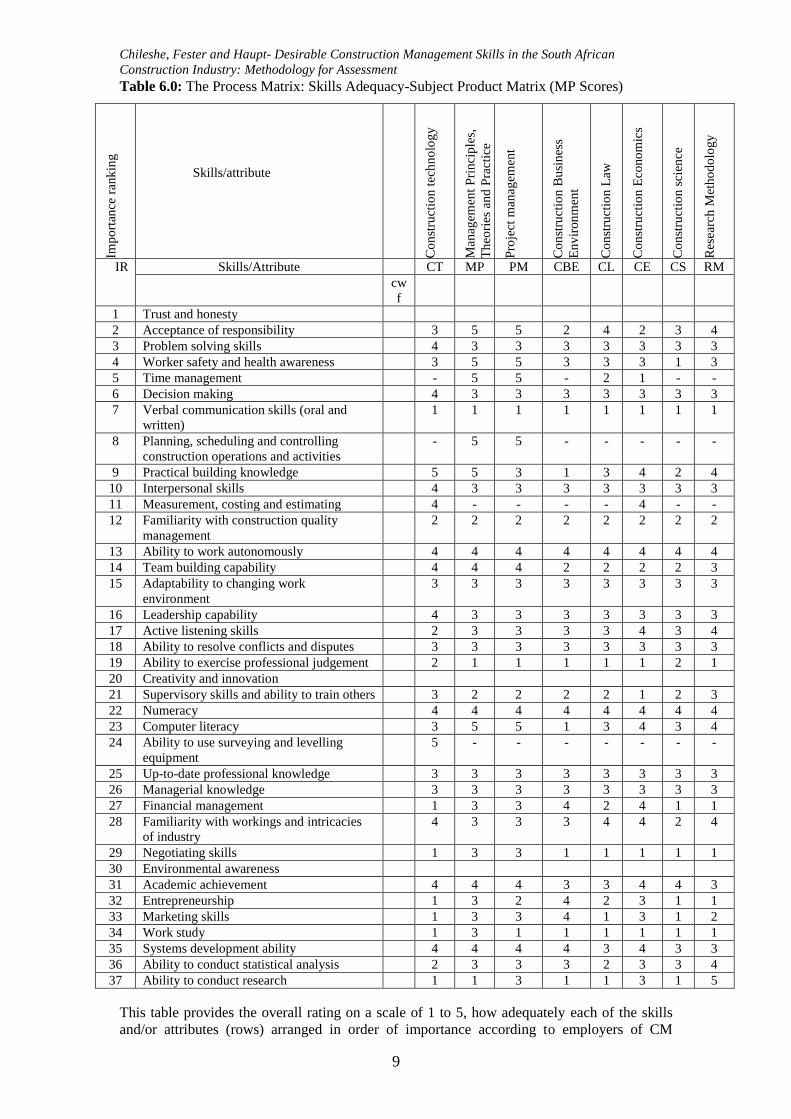
Table 6.0: The Process Matrix: Skills Adequacy-Subject Product Matrix (MP Scores)
Imp
ort
ance
ran
kin
g
Skills/attribute
Co
nst
ruct
ion
tec
hn
olo
gy
Man
agem
ent
Pri
nci
ple
s,
Th
eori
es a
nd
Pra
ctic
e
Pro
ject
man
agem
ent
Co
nst
ruct
ion
Bu
sin
ess
En
vir
on
men
t
Co
nst
ruct
ion
Law
Co
nst
ruct
ion
Eco
no
mic
s
Co
nst
ruct
ion
sci
ence
Res
earc
h M
eth
od
olo
gy
IR Skills/Attribute CT MP PM CBE CL CE CS RM
cw
f
1 Trust and honesty
2 Acceptance of responsibility 3 5 5 2 4 2 3 4
3 Problem solving skills 4 3 3 3 3 3 3 3
4 Worker safety and health awareness 3 5 5 3 3 3 1 3
5 Time management - 5 5 - 2 1 - -
6 Decision making 4 3 3 3 3 3 3 3
7 Verbal communication skills (oral and
written)
1 1 1 1 1 1 1 1
8 Planning, scheduling and controlling
construction operations and activities
- 5 5 - - - - -
9 Practical building knowledge 5 5 3 1 3 4 2 4
10 Interpersonal skills 4 3 3 3 3 3 3 3
11 Measurement, costing and estimating 4 - - - - 4 - -
12 Familiarity with construction quality
management
2 2 2 2 2 2 2 2
13 Ability to work autonomously 4 4 4 4 4 4 4 4
14 Team building capability 4 4 4 2 2 2 2 3
15 Adaptability to changing work
environment
3 3 3 3 3 3 3 3
16 Leadership capability 4 3 3 3 3 3 3 3
17 Active listening skills 2 3 3 3 3 4 3 4
18 Ability to resolve conflicts and disputes 3 3 3 3 3 3 3 3
19 Ability to exercise professional judgement 2 1 1 1 1 1 2 1
20 Creativity and innovation
21 Supervisory skills and ability to train others 3 2 2 2 2 1 2 3
22 Numeracy 4 4 4 4 4 4 4 4
23 Computer literacy 3 5 5 1 3 4 3 4
24 Ability to use surveying and levelling
equipment
5 - - - - - - -
25 Up-to-date professional knowledge 3 3 3 3 3 3 3 3
26 Managerial knowledge 3 3 3 3 3 3 3 3
27 Financial management 1 3 3 4 2 4 1 1
28 Familiarity with workings and intricacies
of industry
4 3 3 3 4 4 2 4
29 Negotiating skills 1 3 3 1 1 1 1 1
30 Environmental awareness
31 Academic achievement 4 4 4 3 3 4 4 3
32 Entrepreneurship 1 3 2 4 2 3 1 1
33 Marketing skills 1 3 3 4 1 3 1 2
34 Work study 1 3 1 1 1 1 1 1
35 Systems development ability 4 4 4 4 3 4 3 3
36 Ability to conduct statistical analysis 2 3 3 3 2 3 3 4
37 Ability to conduct research 1 1 3 1 1 3 1 5
This table provides the overall rating on a scale of 1 to 5, how adequately each of the skills
and/or attributes (rows) arranged in order of importance according to employers of CM
Chileshe, Fester and Haupt- Desirable Construction Management Skills in the South African
Construction Industry: Methodology for Assessment
10
graduates are addressed in each of the subject areas (columns), where 1 = very inadequately, 2
= inadequately, 3 = neutral, 4 = adequately, and 5 = very adequately. These ratings were
obtained by work-shopping the matrix with a sample of educators, alumni and employers.
Clearly there are areas of deficiency in the present subject offerings relative to the desirable
skills and attributes that graduates need to perform as CMs.
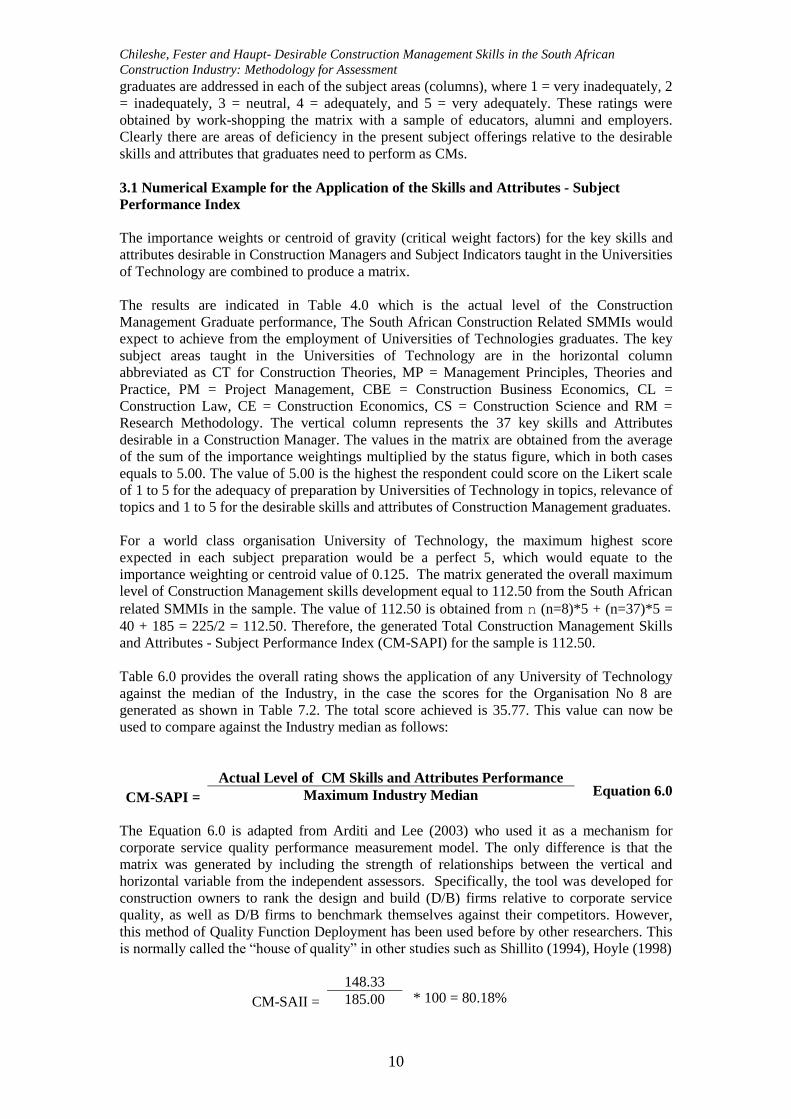
3.1 Numerical Example for the Application of the Skills and Attributes - Subject
Performance Index
The importance weights or centroid of gravity (critical weight factors) for the key skills and
attributes desirable in Construction Managers and Subject Indicators taught in the Universities
of Technology are combined to produce a matrix.
The results are indicated in Table 4.0 which is the actual level of the Construction
Management Graduate performance, The South African Construction Related SMMIs would
expect to achieve from the employment of Universities of Technologies graduates. The key
subject areas taught in the Universities of Technology are in the horizontal column
abbreviated as CT for Construction Theories, MP = Management Principles, Theories and
Practice, PM = Project Management, CBE = Construction Business Economics, CL =
Construction Law, CE = Construction Economics, CS = Construction Science and RM =
Research Methodology. The vertical column represents the 37 key skills and Attributes
desirable in a Construction Manager. The values in the matrix are obtained from the average
of the sum of the importance weightings multiplied by the status figure, which in both cases
equals to 5.00. The value of 5.00 is the highest the respondent could score on the Likert scale
of 1 to 5 for the adequacy of preparation by Universities of Technology in topics, relevance of
topics and 1 to 5 for the desirable skills and attributes of Construction Management graduates.
For a world class organisation University of Technology, the maximum highest score
expected in each subject preparation would be a perfect 5, which would equate to the
importance weighting or centroid value of 0.125. The matrix generated the overall maximum
level of Construction Management skills development equal to 112.50 from the South African
related SMMIs in the sample. The value of 112.50 is obtained from n (n=8)*5 + (n=37)*5 =
40 + 185 = 225/2 = 112.50. Therefore, the generated Total Construction Management Skills
and Attributes - Subject Performance Index (CM-SAPI) for the sample is 112.50.
Table 6.0 provides the overall rating shows the application of any University of Technology
against the median of the Industry, in the case the scores for the Organisation No 8 are
generated as shown in Table 7.2. The total score achieved is 35.77. This value can now be
used to compare against the Industry median as follows:
CM-SAPI =
Actual Level of CM Skills and Attributes Performance Equation 6.0 Maximum Industry Median
The Equation 6.0 is adapted from Arditi and Lee (2003) who used it as a mechanism for
corporate service quality performance measurement model. The only difference is that the
matrix was generated by including the strength of relationships between the vertical and
horizontal variable from the independent assessors. Specifically, the tool was developed for
construction owners to rank the design and build (D/B) firms relative to corporate service
quality, as well as D/B firms to benchmark themselves against their competitors. However,
this method of Quality Function Deployment has been used before by other researchers. This
is normally called the “house of quality” in other studies such as Shillito (1994), Hoyle (1998)
CM-SAII =
148.33 * 100 = 80.18% 185.00
Chileshe, Fester and Haupt- Desirable Construction Management Skills in the South African
Construction Industry: Methodology for Assessment
11
What is novel about its application to this study, is that in this particular example, all the
Construction Management Key Skills and Attributes are assumed to carry equal weightings in
the contributions to the development and preparation of Universities of Technolgies
Graduates.
The results of the process matrix indicate that the "Academic Achievement" key skill and
attribute has the highest (mean = 3.64) impact in terms of importance on the development of
Construction Managers whereas Construction Technology is considered by Industry as a key
subject areas in terms of preparing the adequacy (mean= 3.57) of graduates. This is indicated
by the total value which is obtained by summing up the product of the matrix for each
individual construct. In this case, "Academic Achievement" has a total median score
of 3.11 (Table 5.20a). On a comparative basis, the industry has a score of 3.04 (Table 7.19)
which is above the Industry median. Similarly, the total score in the first subject, Construction
Technology which is designated as “CT” has a total score of 15.17 which is more than the
Industry median of 14.06. The potential of application of this method would be competitive
benchmarking across the Universities of Technology by the CIOB Africa Accreditation Panel.
The competing UoTs would compare their scores against the industry median, thus assist
management in making strategic decisions. From the matrix, it can be noted that the
"Marketing Skills" is low in terms of contributing to the overall performance as the score of
2.98 is the lowest across all the thirty-seven skills whereas the adequacy of "Research
Methodology" also ranked lowly (total mean = 12.62) out of a possible 14.06.
4.0 CONCLUSIONS
5.0 REFERENCES
Arditi, D. and Lee, D.E. (2003) Assessing the corporate service quality performance of
design-build contractors using Quality Function Deployment, Construction Management
and Economics, 21: 175-185.
Beliveau, Y.J. and Peter, D. (2002) Educating the builder of tomorrow -Constructivist
educational model, ASC Proceedings of the 38th Annual Conference, Virginia Polytechnic
Institute and State University-Blacksburg, Virginia April 11-13, 221-230.
Chileshe, N. and Haupt, T.C. (2005) Validation of BEP-SMART: Built Environment
Programs-Skills Monitoring and Assessment Rating Tool Using the Structural Equation
Modelling (SEM) Approach. In Proceedings of the INTER SYMP-2005 17th International
Conference on Systems Research, Informatics and Cybernetics, the Special Focus
Symposium on Systems Research in the Architecture, Engineering and Construction
(AEC) of Built Environments, 1-7 August 2005, Baden-Baden, Germany.
Chileshe, N. and Haupt, T.C. (2005) Industry and Academia Perceptions of Construction
Management Education – The Case of South Africa. In Proceedings of The First Annual
Built Environment Education Conference (BEE Conference), 5-6 September 2005, RICS,
London. The Construction Industry Council (CIC) and The Centre for Education in the
Built Environment (CEBE)
Chileshe, N., Haupt, T.C. and Fester, F. (2005) Assessing the Readiness of Building
Diplomates for the South African Construction Industry. In: Smallwood, J.J. and Haupt,
T.C. (Eds) CIB WW99 Working Commission, 4th Triennial International
Conference,"Rethinking and Revitalizing Construction Safety, Health, Environment and
Quality". Port Elizabeth, South Africa, May 17-20 2005. pp. 417-430. ISBN 0-620-
33919-5.
Frolich, M.T (2002) Techniques for Improving Response Rates in OM Survey Research,
Journal of Operations Management, 20: 53-62.
Haupt, T.C. (2003) Student attitudes towards cooperative construction education
experience. Australian Journal of Construction Economics and Building, 3(1),
31-42.
Haupt, T.C., Chileshe, N., and Miller, S. (2005) Report on Construction Management and
Chileshe, Fester and Haupt- Desirable Construction Management Skills in the South African
Construction Industry: Methodology for Assessment
12
Civil Engineering Education at Universities of Technology, Working Report 0205,
ETDP-SETA and Cape Peninsula University of Technology, ISBN 0-620-34715-5
Haupt, T.C., Chileshe, N., and Miller, S. (2005) Report on Construction Management and
Civil Engineering Education at Universities of Technology, Working Report 0205, ETDP-
SETA and Cape Peninsula University of Technology, ISBN 0-620-34715-5
Hicks, R.E. (1996) Experiential learning in a postgraduate project management
programme, Education + Training, 38(3), 28-38.
Hoyle, D. (1998) ISO 9000 Quality Systems Handbook, 3rd
edition, Butterworth-Heinemann
Ltd, Boston, MA.
Kumaraswamy, M.M. and Chan, D.W.M. (1998) Contributors to construction delays,
Construction Management and Economics, 16(1),17-29.
McCaffer, R. (2004) Academia - Delivering for Industry, In: Ellis, R. and Bell, M.
(Eds.) COBRA2004, The International Construction Conference: responding to
change, 7-8 September 2004, Leeds, Construction Building Research, 1: 17-26.
Malhotra, M.K. and Grover, V. (1998) An assessment of survey research in POM:
from constructs to theory, Journal of Operations Management, 16:407-425.
Moser, C.A. and Kalton, G. (1979) Survey Methods in Social Investigation, 2nd Ed.
Darthmouth.
Pheng, L.S. and Gracia, T.S.L. (2002) Relationship marketing: a survey of QS firms in
Singapore, Construction Management and Economics, 20: 707-721.
Saraph, J.V., Benson, P.G. and Schroeder, R.G. (1989) An Instrument for Measuring the
Critical factors of Quality Management, Decision Sciences, 20: 810-829.
Shillito, M.L. (1994) Advanced QFD: Linking Technology to Market and Company Needs,
Wiley, New York.
Tinker, A. and Tramel, M. (2002) Incorporating service learning courses into construction
management programmes. In ASC Proceedings of the 38th Annual Conference Virginia
Polytechnic Institute and State University-Blacksburg, Virginia, April 11-13, 215-220.
Watson, P.A. and Chileshe, N. (2004) Establishing a Valid Methodology for Measuring The
Effectiveness of Total Quality Management (TQM) Deployment Initiatives, In: Ellis, R.
and Bell, M. (Eds.) COBRA2004, The International Construction Conference:
responding to change, 7-8 September 2004, Leeds, Construction Building Research, Vol.
1, ISBN 1-842-19193-3