Design procedure of ultrasonic tomography system with steel pipe conveyor
10
Sensors and Actuators A 203 (2013) 215–224 Contents lists available at ScienceDirect Sensors and Actuators A: Physical jo ur nal homepage: www.elsevier.com/locate/sna Design procedure of ultrasonic tomography system with steel pipe conveyor Javad Abbaszadeh ∗ , Herlina Abdul Rahim, Ruzairi Abdul Rahim, Sahar Sarafi, Muzakkir Nor Ayob, Mehdi Faramarzi Control & Instrumentation Engineering Department, Universiti Teknologi Malaysia, Johor, Malaysia a r t i c l e i n f o Article history: Received 20 February 2013 Received in revised form 13 August 2013 Accepted 13 August 2013 Available online 12 September 2013 Keywords: Ultrasonic tomography Ultrasonic sensors Ultrasonic wave Non-invasive tomography Frequency analysis a b s t r a c t Non-invasive ultrasonic tomography has a dominant role in extracting cross-sectional images of objects. The front-end structure of the proposed ultrasonic tomography system with a steel pipe conveyor is explained in this paper. In the novel ultrasonic tomography system presented, a non-invasive sensing technique is applied for detecting gas bubbles inside the steel pipe. A method of visualising the struc- ture of the steel pipe with finite element software (COMSOL Multiphysics 4.2) is also presented in this paper. An appropriate sensor with 40 kHz resonance frequency, based on simulation results, is selected and experimentally mounted on the periphery of the vessel. Several reviews regarding the common tomography technique proposed and hardware preparation are also discussed. Twelve dual-function (transmitter/receiver) ultrasonic sensors with a fan-shaped beam projection capability are used as the sensory part of the system. Details of the circuitry of the system are also presented, which consists of various parts such as a signal generator, signal conditioning and signal acquisition strategy. Finally, the experimental results of the proposed system, which are useful for further investigation for the application of ultrasonic tomography in industry, are illustrated. © 2013 Elsevier B.V. All rights reserved. 1. Introduction In the late 1980s and early 1990s, process tomography was investigated in order to determine component concentration in various industries, especially for measurements in the oil industry in Europe and the coal industry in the USA [1]. Some of the stud- ies included the measurement of water content in oil [2] and the visualisation of component distribution in multi-component flow pipelines [3–5]. Ultrasonic tomography (UT) has the advantage of imaging two-component flows, and provides the opportunity to present quantitative and real-time data on chemical media within a full-scale industrial process, such as filtration, without the need for process interruption [6,7]. The major potential benefit of UT sys- tems is their capability of online monitoring for the development of closed-loop control systems [8]. Ultrasonic sensors in UT systems are used to extract the data inside a pipe based on changes in fluid density. To date, the majority of investigations on UT systems have been done on pipes made from materials such as acrylic, PVC and plastic [9,10]. The main reason why steel pipes are rarely studied as the conveyor of UT systems is their high attenuation of ultrasonic ∗ Corresponding author. Tel.: +60 0197063473. E-mail addresses: [email protected], [email protected] (J. Abbaszadeh), [email protected] (H.A. Rahim), [email protected] (R.A. Rahim). energy and the high influence of bulk waves compared with other kinds of pipe materials. The majority of researchers have concluded that steel pipes have the greatest disadvantage with regard to internal reflections within enclosed pipes [11]. The significant role of steel pipes in industry as the conveyor of liquid/gas has, however, led to alternative solutions, such as the utilisation of UT systems, as proposed in this research. 2. Principles of ultrasonic tomography Principally an UT system consists of two general parts. The soft- ware and hardware elements are shown in Fig. 1. The hardware part of UT systems consists of various elements such as: - Pulse generator: a microcontroller that produce pulses with a frequency equal to the resonance frequency of the sensor. - Transmitter circuit: amplifying the pulses generated to actuate the ultrasonic sensor. - Ultrasonic sensors: applied sensors capable of dual functions, act- ing as a transmitter and receiver. Ultrasonic transmitter sensors are connected to the amplifier part and they convert the electrical signal to an ultrasonic wave on one side of the pipe, and on the other side an ultrasonic receiver sensor can receive the ultrasonic wave propagated and convert the received ultrasonic wave to an electrical signal. - Receiver circuit: this part consists of a low noise amplifier, band bass filter, and data acquisition. Reducing the added noise and 0924-4247/$ – see front matter © 2013 Elsevier B.V. All rights reserved. http://dx.doi.org/10.1016/j.sna.2013.08.020
-
Upload
teknologimalaysia -
Category
Documents
-
view
0 -
download
0
Transcript of Design procedure of ultrasonic tomography system with steel pipe conveyor

Dp
JMC
a
ARRAA
KUUUNF
1
iviivpipaftcad
bpt
((
0h
Sensors and Actuators A 203 (2013) 215– 224
Contents lists available at ScienceDirect
Sensors and Actuators A: Physical
jo ur nal homepage: www.elsev ier .com/ locate /sna
esign procedure of ultrasonic tomography system with steelipe conveyor
avad Abbaszadeh ∗, Herlina Abdul Rahim, Ruzairi Abdul Rahim, Sahar Sarafi,uzakkir Nor Ayob, Mehdi Faramarzi
ontrol & Instrumentation Engineering Department, Universiti Teknologi Malaysia, Johor, Malaysia
r t i c l e i n f o
rticle history:eceived 20 February 2013eceived in revised form 13 August 2013ccepted 13 August 2013vailable online 12 September 2013
eywords:ltrasonic tomography
a b s t r a c t
Non-invasive ultrasonic tomography has a dominant role in extracting cross-sectional images of objects.The front-end structure of the proposed ultrasonic tomography system with a steel pipe conveyor isexplained in this paper. In the novel ultrasonic tomography system presented, a non-invasive sensingtechnique is applied for detecting gas bubbles inside the steel pipe. A method of visualising the struc-ture of the steel pipe with finite element software (COMSOL Multiphysics 4.2) is also presented in thispaper. An appropriate sensor with 40 kHz resonance frequency, based on simulation results, is selectedand experimentally mounted on the periphery of the vessel. Several reviews regarding the common
ltrasonic sensorsltrasonic waveon-invasive tomographyrequency analysis
tomography technique proposed and hardware preparation are also discussed. Twelve dual-function(transmitter/receiver) ultrasonic sensors with a fan-shaped beam projection capability are used as thesensory part of the system. Details of the circuitry of the system are also presented, which consists ofvarious parts such as a signal generator, signal conditioning and signal acquisition strategy. Finally, the
e pro in in
experimental results of thof ultrasonic tomography
. Introduction
In the late 1980s and early 1990s, process tomography wasnvestigated in order to determine component concentration inarious industries, especially for measurements in the oil industryn Europe and the coal industry in the USA [1]. Some of the stud-es included the measurement of water content in oil [2] and theisualisation of component distribution in multi-component flowipelines [3–5]. Ultrasonic tomography (UT) has the advantage of
maging two-component flows, and provides the opportunity toresent quantitative and real-time data on chemical media within
full-scale industrial process, such as filtration, without the needor process interruption [6,7]. The major potential benefit of UT sys-ems is their capability of online monitoring for the development oflosed-loop control systems [8]. Ultrasonic sensors in UT systemsre used to extract the data inside a pipe based on changes in fluidensity.
To date, the majority of investigations on UT systems have
een done on pipes made from materials such as acrylic, PVC andlastic [9,10]. The main reason why steel pipes are rarely studied ashe conveyor of UT systems is their high attenuation of ultrasonic∗ Corresponding author. Tel.: +60 0197063473.E-mail addresses: [email protected], [email protected]
J. Abbaszadeh), [email protected] (H.A. Rahim), [email protected]. Rahim).
924-4247/$ – see front matter © 2013 Elsevier B.V. All rights reserved.ttp://dx.doi.org/10.1016/j.sna.2013.08.020
posed system, which are useful for further investigation for the applicationdustry, are illustrated.
© 2013 Elsevier B.V. All rights reserved.
energy and the high influence of bulk waves compared with otherkinds of pipe materials. The majority of researchers have concludedthat steel pipes have the greatest disadvantage with regard tointernal reflections within enclosed pipes [11]. The significantrole of steel pipes in industry as the conveyor of liquid/gas has,however, led to alternative solutions, such as the utilisation of UTsystems, as proposed in this research.
2. Principles of ultrasonic tomography
Principally an UT system consists of two general parts. The soft-ware and hardware elements are shown in Fig. 1. The hardwarepart of UT systems consists of various elements such as:
- Pulse generator: a microcontroller that produce pulses with afrequency equal to the resonance frequency of the sensor.
- Transmitter circuit: amplifying the pulses generated to actuatethe ultrasonic sensor.
- Ultrasonic sensors: applied sensors capable of dual functions, act-ing as a transmitter and receiver. Ultrasonic transmitter sensorsare connected to the amplifier part and they convert the electricalsignal to an ultrasonic wave on one side of the pipe, and on theother side an ultrasonic receiver sensor can receive the ultrasonic
wave propagated and convert the received ultrasonic wave to anelectrical signal.- Receiver circuit: this part consists of a low noise amplifier, bandbass filter, and data acquisition. Reducing the added noise and

216 J. Abbaszadeh et al. / Sensors and Actuators A 203 (2013) 215– 224
-
dffsrAbmcst
iafstmmootts
trta
3
tIqwtpotfaso
Table 1Pressure levels of received ultrasonic wave on opposite side of the transmitter at42 �s for different frequencies.
Frequency (kHz) Pressure level (pa)
40 0.17
the pressure level of the longitudinal wave. It is obvious from acomparison of the results that the amplitude of the pressure waveon the boundary of the pipe (Lamb wave) will increase as the fre-quency increases. On the other hand, as the frequency increases
Table 2Pressure levels of longitudinal wave on opposite side of the transmitter at 78 �s fordifferent frequencies.
Frequency (kHz) Pressure level (pa)
Fig. 1. General block diagram of an ultrasonic tomography system.
amplifying the received signal and finally converting the ana-logue data into digital data are the procedures carried out by theaforementioned parts in the receiver.
Image reconstruction: digital data gathered in the software isutilised to construct the cross-sectional image of the pipe by theapplication of various algorithms such as the linear back projec-tion algorithm.
The first and significant steps in the design approach are toetermine the appropriate ultrasonic sensors based on their per-ormance. Ultrasound waves propagate above audible sound; usingrequencies from 20 kHz up to several gigahertzes. The twelve ultra-onic sensors applied are mounted on the periphery of the pipe as aing-shaped structure with an equal distance between the sensors.s the suspended solids’ concentration fluctuates, the ultrasoniceam is scattered and the received signal fluctuates in a randomanner about a mean value. The continuous signaler pulsed signal
an be used to excite the ultrasonic sensors [12]. Since a continuousignal may lead to the formation of standing waves inside the pipe,he pulsed system will be used [13].
Various interactions may be used to gain information relat-ng to the internal nature of the process. These possibilities yield
variety of sensor configurations which may provide raw dataor processing, in order to yield both one- and two-dimensionalcalar and three-dimensional vector tomographic results. Theseechniques are categorised in three distinct modes: transmission
ode, reflection mode, and diffraction mode. The transmission-ode technique is the acquisition of data due to the measurement
f forward scattering and the reconstruction algorithm used basedn the inverse solution of the wave equation. The amplitude and/orime of flight, and a reconstruction algorithm based on the assump-ion of straight line propagation, are the only significant issues thathould be considered in transmission mode [14,15].
The reflection-mode technique is based on the measurement ofhe position and change in physical properties of a wave or a particleeflected on an interface. Similar to the reflection-mode technique,here are some techniques based on the diffraction or refraction of
wave at a discrete or continuous interface in the object space [14].
. Design approach of sensory part
Piezoelectric-based ultrasonic transducers have the ability toransform mechanical energy into electrical energy, and vice versa.f the frequency of the applied signal equals the resonance fre-uency of the piezoelectric transducer, it will result in an ultrasonicave of similar frequency [16]. Ultrasound can propagate as longi-
udinal waves, shear waves, surface waves, and in thin materials aslate waves [17]. Longitudinal and shear waves are the two modesf propagation most widely used in ultrasonic testing [18,19]. Sincehe transmission-mode technique is selected as the sensing modeor the proposed UT system, a straight-line signal is considered
s the data signal. In other words, the longitudinal mode of ultra-onic wave propagation is the desired mode and the other modesf propagation are neglected.80 0.42120 1.76
Since the steel pipe is used as the conveyor of the UT system, theappropriate ultrasonic sensor should be chosen with regard to itsperformance. As a consequence of using the transmission-mode,the amplitude of the receiving waves with the receiver sensorshould only relate to the longitudinal mode and not the Lamb mode.The Lamb waves do not provide any information on the ultrasonicdisturbances caused by object obstruction inside the pipe, becausethe Lamb wave propagates within the pipe boundary. Finite ele-ment simulations with COMSOL software are used to determinethe optimum frequency of the ultrasonic sensor and to determinethe receiving time of the longitudinal waves and Lamb waves.
It is possible to diagnose the manner of ultrasonic wave propa-gation in the pipe and find a way to reduce the Lamb wave effectby changing the frequency. The travelling rate of the longitudinalmode and Lamb wave are detected and compared with each otherusing this software.
For a better demonstration of ultrasonic wave propagation indifferent layers, a 2D simulation is investigated. The pipe mate-rial and the fluid inside the pipe are considered to be steel andwater, respectively. The geometry of the simulated pipe is: innerdiameter = 10 cm, pipe wall thickness = 0.8 cm.
Based on the simulation results, the frequency of the ultrasonicwave plays an important role in the manner of the ultrasonic wavepropagation. Fig. 2 shows 3D views of the scattered ultrasonic pres-sure at different frequencies. The transient mode of simulation wascarried out and the simulation results for each frequency at threedifferent times: 15 �s, 30 �s and 45 �s are shown in Fig. 2. Highpressures are denoted by peaks (red) while low pressures are rep-resented by troughs (violet).
From the simulation results shown in Fig. 2, it can be concludedthat the Lamb wave reaches the receiver (opposite side of trans-mitter) before the longitudinal wave. The Lamb wave exists for thewhole of the propagation time, which causes disturbance in receiv-ing the longitudinal wave and acts as a noise effect. As can be seenin Fig. 2, the pressure levels of the ultrasonic wave in the receiver(opposite side of transmitter) at 42 �s are completely related tothe Lamb wave. The pressure levels of the ultrasonic wave at thereceiver point at 42 �s are given in Table 1. From these pressurelevels, it can be seen that increase of frequency leads to increaseof the pressure level of the Lamb wave. The observation time ofthe longitudinal wave (time-of-flight) is 78 �s. The pressure lev-els obtained at different frequencies at 78 �s, for the case of thereceiving ultrasonic wave devote to the longitudinal wave and lambwave is neglected, are presented in Table 2. The pressure levels inTable 2 show the increase of frequency leading to the decrease of
40 0.1880 0.15
120 0.11

J. Abbaszadeh et al. / Sensors and Actuators A 203 (2013) 215– 224 217
iffere
td
tFdartt(od
Fig. 2. Manner of ultrasonic wave propagation at d
he amplitude of the longitudinal mode of the ultrasonic wave willecrease considerably.
For ease of analysis, the scattered pressure wave received onhe opposite side of the transmitter is illustrated in trend form inig. 3. As can be seen in the figure, Lamb waves which create aisturbance in the receiving of the transmission-mode signal existt all frequencies. In the figures, the time taken by the Lamb wave toeach the receiver is specified as the tl (42 �s), and time-of-flight ofhe longitudinal wave is specified as ts (78 �s). From comparison of
he pressure levels of the received signals at the determined timests and tl), it is clear that the Lamb wave effect at 40 kHz is the lowestne. In other words, the strength of the Lamb wave can cause aisturbance in the longitudinal wave such that the pressure levelnt frequencies: (a) 40 kHz; (b) 80 kHz; (c) 120 kHz.
of the longitudinal wave at ts at 120 kHz is not as clear as at 40 kHz.From comparison of the pressure levels of signals at tl and ts in Fig. 3,it is possible to see that increase of the frequency leads to increaseof the Lamb wave’s strength and increase of the attenuation of thelongitudinal wave.
The fundamental of transmission-mode sensing in UT processesis based on the measurement of the amplitude variation in thestraight-path signal due to the existence of an object between thetransmitter and receiver. When the path between the transmit-
ter and receiver is blocked with an object, the amplitude of thereceived straight-path signal decreases. This is significant step inthe reconstruction of the cross-sectional image using the tomogra-phy process. If the amplitude variation of the straight-path signal
218 J. Abbaszadeh et al. / Sensors and Act
F(
ivsaltttopsbrwttiF
oisp
[ ]
ig. 3. Receiving pressure wave form on opposite side of transmitter: (a) 40 kHz;b) 80 kHz; (c) 120 kHz.
s not recognisable, it is impossible to produce a scan image of theessel to show the accurate location of the object. Fig. 4 shows theimulation results of the placement of a gas bubble inside the pipet a frequency of 40 kHz. As can be seen in this figure, due to thearge difference in acoustic impedance between the air and water,he majority of ultrasonic waves are reflected or refracted whenhey reach the gas bubble. In other words, the gas bubble blockshe path between the transmitter and receiver. From a comparisonf the received signals (at tl and ts) in Fig. 4(b) and Fig. 3(a), it isossible to determine the amplitude variation of the straight-pathignal. The same simulations due to the placement of the gas bub-le inside the pipe are repeated for the other frequencies and theesulting signals are shown in Fig. 4. Since the amplitudes of Lambaves at 80 kHz and 120 kHz are higher than at 40 kHz (based on
he simulation results shown in Fig. 2), the amplitude variation inhe straight-path signal due to the blocking effect of the gas bubbles not obvious. However, it can be concluded from comparison ofig. 4(c) with Fig. 3(b), and Fig. 4(d) with Fig. 3(c).
Various simulations for the different frequencies were carried
ut and their results are shown as a trend (a trend such that pressures the function of the frequency) in Fig. 5. In this figure, the pres-ure level of the Lamb wave and longitudinal wave at the receiveroint of the pipe are measured separately. As can be seen in Fig. 5,uators A 203 (2013) 215– 224
frequencies below 40 kHz satisfy both criteria: a strong longitudi-nal wave and weak Lamb wave. In ultrasonic tomography systems,increase of the frequency leads to improvement of the capability ofthe system to diagnose small particles [11,12]. In other word, theminimum size of the detectable objects inside the metal pipe at20 kHz is larger than 40 kHz. Consequently, for the case of a metalpipe conveyor, 40 kHz is selected as the optimum frequency.
4. Electronic circuitry
For the actuation of the ultrasonic sensors, proper signals shouldbe applied to the sensors. Since continuous waves cause stand-ing waves to be created inside the pipe, pulse signals are usedas the applied signals. To produce the pulse signals according tothe datasheet of the used sensor, a proper transmitter circuit isdesigned. The block diagram of the electronic part of the UT sys-tem for the purposes of measurement is shown in Fig. 6. Since theresonance frequency of the selected sensors is 40 kHz, the micro-controller will generate dual-frequency burst tones as 40 kHz and40 Hz, as shown in Fig. 7. The ultrasonic signal with a frequency of40 kHz consists of two cycles of ultrasonic pulses with a duty cycleof 50% at each pulse. A signal with a frequency of 40 Hz is used inorder to remove the reverberation effect of the other transmitters.The reverberation effect delays are needed to avoid overlappingechoes at the receiving transceiver due to two separate ultrasoundexcitations.
An opto-isolator in the transmitter circuit is applied to preventhigh voltages or rapidly changing voltages on one side of the cir-cuit from damaging components or distorting transmissions onthe other side. This part is used to protect the microcontrollerfrom backward high voltage signals which cause damage to themicrocontroller. Another advantage of the isolator is to prevent theinduction of noise in the generated pulses.
According to the acoustic impedance difference between themetal pipe and liquid (water), transmission and reflection percent-age of ultrasonic wave can be calculated according to the Eqs. (1)and (2), respectively. Where pe is the incident wave sound pres-sure, pr is the reflected wave sound pressure and pd represents thetransmitted wave sound pressure.
Based on Eq. (4), only 6.42 percent of the ultrasonic energy canpenetrate inside the metal pipe where the liquid is water. Due tothe various interactions between the transmitter and receiver, andtheir attenuation effect on the ultrasonic wave (based on Eq. (1)),totally 0.4 percent of the produced ultrasonic energy with trans-mitter sensor is possible to detect by the receiver sensor. Therefore,amplification of the signals applied to the sensors leads to increaseof both the amplitude of the ultrasonic wave penetrating inside themetal pipe and the amplitude of the received signal. For this pur-pose, a low noise, high speed op-amp forms the amplifier part ofthe transmitter circuit.
Reflection coefficient, R = Pr
Pe=
[Z2 − Z1
Z2 + Z1
](1)
Transmission coefficient, D = Pd
Pe=
[2Z2
Z2 + Z1
](2)
By finding the acoustic impedance for both materials and thecalculation for R and D on the pipe-section (metal)/liquid (water)interface according to Fig. 8 can be calculated as below:
Z1 = 45.16 × 10⁶ kg/m2s (stainless steel)Z2 = 1.5 × 10⁶ kg/m2s (water)
R(metal/liquid) = Pr
Pe=
[Z2 − Z1
Z2 + Z1
]= 1.5 × 10⁶ − 45.16 × 10⁶
1.5 × 10⁶ + 45.16 × 106
= −0.9348 → 93.48% (3)

J. Abbaszadeh et al. / Sensors and Actuators A 203 (2013) 215– 224 219
F ble at
i
D
h
ig. 4. (a) Scattered ultrasonic pressure wave inside the steel pipe with a gas bubnside the pipe; (b) 40 kHz; (c) 80 kHz; (d) 120 kHz.
(metal/liquid) = Pd
Pe=
[2Z2
Z2 + Z1
]=
[2 × 1.5 × 106
1.5 × 10⁶ + 45.16 × 10⁶
]
= −0.0642 → 6.42% (4)
The transmitter circuit is shown in Fig. 9. The applied op-ampas properties such as a supply voltage of ±30 V and slew rate of
40 kHz, receiving pressure wave forms for the case of existence of the gas bubble
24 V/�s. Since the op-amp is used in comparator mode, it is possi-ble to generate a 60 Vp–p tone burst of 40 kHz with reverberationdelays of 40 Hz. The produced signal proceeds to the ultrasonictransmitter sensors to generate the ultrasonic wave.
Since the ultrasonic wave is attenuated due to the variousinteractions mentioned above, a weak ultrasonic wave can besensed by the receivers. For the first step in the receiver part, it isnecessary to amplify the received signal. For this purpose, a

220 J. Abbaszadeh et al. / Sensors and Actuators A 203 (2013) 215– 224
Fig. 5. Pressure level variation of Lamb wave and longitudinal wave based on thefrequency variation.
lr
mscs
iasdttslsralr
psdTrbt
Fig. 8. Ultrasonic wave propagation from pipe-section (metal layer) to liquid media.
Fig. 6. Block diagram of UT system.
ow noise, high-speed op-amp is used as the first part of theeceiver.
Due to the mix of the original signal with noise and other har-onic signals of 40 kHz, it is necessary to remove the redundant
ignals from the original signal. A narrow band pass filter with aentre frequency of 40 kHz is designed to remove these unwantedignals.
After filtering the received signal, it needs to be amplifiedn order to prepare the signal for proceeding to the sample-nd-hold part. The same op-amp as the one used in the firsttage is used in the amplifier part to boost the amplitude of theesired signal. After amplifying the received signal, it is readyo be analysed. Based on the discussions in the previous sec-ion, it is important to determine the observation time of thetraight-path (ts) signal. Based on the observation time of theongitudinal wave, sampling is done at the time-of-flight of thetraight-path signal (ts) and the sampled value is held. This is car-ied out with a sample-and-hold IC which is controllable with thepplied pulses from microcontroller. The typical manner of samp-ing and holding for the received signal is shown in Fig. 10. Theeceiver circuit of the UT system is shown in Fig. 11.
Ultimately, the held signals proceed to the DAQ part to be pre-ared in order to send them to the computer. The DAQ elementerves as the analogue to digital converter in the UT system, wheresPIC30F6011A IC is used as the DAQ of the proposed UT system.
he gathered digital signals are sent to the computer in order toeconstruct the cross-sectional image. There is a linear relationshipetween the sensor value voltage and the size of the gas bubbles inhe measurement area, and detailed explanations can be found inFig. 7. Generated applied pulse for a
Fig. 9. Circuit schematic of the transmitter part.
[11]. The mentioned relation is important in image reconstruction,along with various algorithms such as back projection, linear backprojection, etc.
5. Experimental results
Based on the concept of the previous sections, an ultrasonictomography system with a steel pipe conveyor is designed andmanufactured. Two different frequency sensors at 40 kHz and333 kHz are mounted separately in a ring shape on the peripheryof the pipe. These two sensors are used to check the validity of thesimulations. In practice, the mounting of the sensors on the periph-ery of the pipe is one of the significant steps in the preparation ofthe hardware of the UT system. For the adhesion of the sensors onthe boundary of the pipe, a layer should be used as a couplant toprevent the trapping of air gaps due to their high acoustic atten-uation. Preparation of the pipe’s surface must be carefully done inorder to preserve the original curvature of the pipe. It is importantthat the transducer faces and the pipe axis are parallel, since a onedegree error could lead to approximately a one percent change inthe path length [11]. To avoid this problem and for proper trans-ducer arrangement, a ‘transducer ring’ has been designed. This ringwas made using a PE hollow shape with 12 holes for the transducersto be slotted in.
The first step in UT systems to reconstruct the cross-sectionalimage of the pipe is sending and receiving the ultrasonic signalsvia ultrasonic sensors. For this purpose, as mentioned in previoussections, transmitter and receiver circuits are designed and theseconnect to the sensors. After filtering the received signal, the signalshave the shapes shown in Fig. 12. The main problem is finding a
point on the time-domain to sample as the data signal. Since thedata signal is completely related to the straight-path signal, thesampling point of the signal should be considered as the time-of-flight of a straight-path signal. Fig. 12 shows the signals receivedctuation of ultrasonic sensors.

J. Abbaszadeh et al. / Sensors and Actuators A 203 (2013) 215– 224 221
Fig. 10. Manner of sample-and-hold process.
matic
apItsaicL
Fig. 11. Circuit sche
t two different frequencies. The observation times of the straight-ath signal (ts) and Lamb wave (tl) are determined in this figure.
n order to determine the frequency at which the Lamb wave ishe highest and causes a disturbance in the measurement of thetraight-path signal, an object is placed between the transmitter
nd receiver to block the longitudinal wave. The signals receivedn the case of an object inside the pipe are shown in Fig. 13. Fromomparison of the results in Figs. 12 and 13, it is obvious that theamb wave effect (at tl) at 333 kHz is much greater than at 40 kHz. ItFig. 12. Receiving signals by the ultrasonic r
of the receiver part.
is impossible to recognise the variation in amplitude of the straight-path signal (at ts) at 333 kHz, but at 40 kHz the variation (at ts) isclear. Therefore the experimental results confirm the simulationresults, in that an increase in the ultrasonic frequency leads to anincrease in the Lamb wave amplitude.
After receiving the straight-path signal, and filtration and ampli-fication, the next important step is the conversion of the analoguesignal into a digital signal. Digital signals proceed to the computerto provide the fundamental data in the reconstruction of the image.
eceiver sensor (a) 40 kHz; (b) 333 kHz.

222 J. Abbaszadeh et al. / Sensors and Actuators A 203 (2013) 215– 224
the ca
TbtatsttmoStr
tscmcdtLori(frpt
Fig. 13. Receiving signals by the ultrasonic receiver sensor in
he issue is determining which part of the received signal shoulde sampled as the data signal. To date, various similar investiga-ions have been done on acrylic pipes and PVC pipes [9,20]. Incrylic pipes, the observation time is denoted by the first peak afterhe time-of-flight corresponding to a straight path, and when thetraight-path signal is blocked by any object, such as a gas bubble,here will be no directly transmitted signals from the transmittero the receiver [21]. As a consequence of using the transmission-
ode method, the amplitude of the observation time should bebtained from the longitudinal waves and not the Lamb waves.ince Lamb waves in acrylic pipes reach the receiver sensors laterhan a straight-line wave, the first peak of the detected signaleceiver part relates to the straight-path wave [21].
To digitalise the analogue signal it is necessary to determine theime of flight of the straight-path signal and Lamb wave. From theimulation results, the observation time of the straight-path signalan be considered as the second maximum peak, where the firstaximum peak relates to the Lamb wave. In practice, to prove this
laim, the case of steel pipe empty of liquid is tested. Due to the largeifference between the acoustic impedance of air and steel, longi-udinal waves reflect on the inner surface of the steel pipe and onlyamb waves can propagate on the wall of pipe. Hence, the wholef the signal received by the receiver sensor is the Lamb wave. Theeceived signal in the case of a steel pipe empty of liquid is shownn Fig. 14(a). The first peak of the received signal occurred at 35 �stl = 35 �s) from the starting point of the generated pulse bursts. Inact, the time taken for the Lamb wave to pass from transmitter to
eceiver is 35 �s. The same process is replicated for the case of aipe full of liquid. In this case, two modes of propagation (longi-udinal mode and Lamb mode) can be achieved with the receiverFig. 14. (a) Received signal for the pipe empty of liqu
se of object existence inside the pipe (a) 40 kHz; (b) 333 kHz.
sensor. Due to the acoustic impedance difference between the liq-uid and steel pipe, a lower percentage of the ultrasonic wave canpenetrate inside the liquid. However, there is a straight path fromthe transmitter to the receiver in the steel pipe full of liquid throughwhich the straight-line signal can transfer. The received signal forthe case of a pipe full of liquid is shown in Fig. 14(b), from which itis obvious that the first maximum peak of the straight-path signal(ts = 122 �s) is received after the Lamb wave (tl = 35 �s). Based onthe achieved signal, the simulation results are proven.
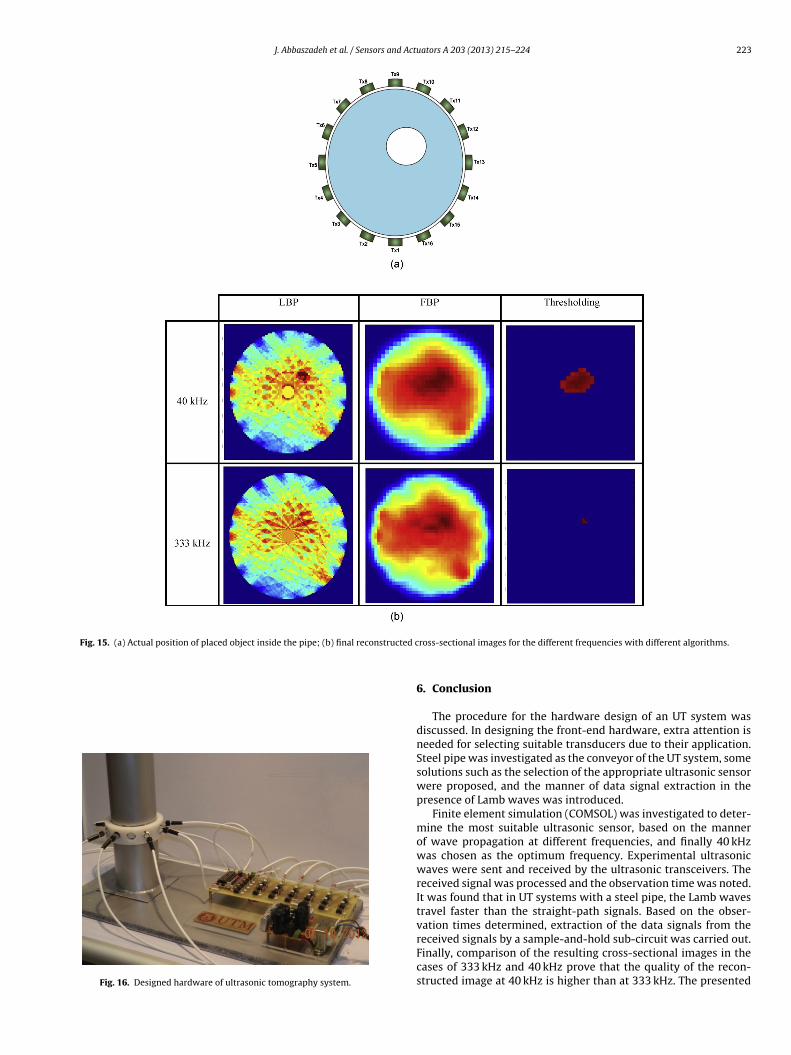
For comparison of the final results of the UT system with steelpipe conveyor, the reconstructed cross-sectional images at 333 kHzand 40 kHz are shown in Fig. 15. In this experiment, the same ellip-tical object is placed in a constant position inside the steel pipe forthe cases of 40 kHz and 333 kHz. The actual position and dimensionof the placed object is demonstrated in this figure. The occupiedarea with the applied object is 8.7% of the whole cross-sectionalarea of the metal pipe. As mentioned above, the straight-path sig-nal variation with an object at 333 kHz is not as clear as at 40 kHz,which results in the worse image of the object. Based on the shapeand dimension of the used object inside the pipe, the reconstructedimage at 40 kHz is clearer than the reconstructed image at 333 kHz.The occupied area with the used object in reconstructed images dueto the applied thresholding algorithm for the 40 kHz is 7.6% and forthe 333 kHz is just 0.37% of the whole inside area of the pipe. Inother words, these experimental results, compared with the simu-lation results, prove the claim that in the case of a steel pipe used asthe conveyor of the UT system, 40 kHz is the optimum frequency for
producing a high-quality, non-invasive and cross-sectional image.The hardware front-end of the designed UT system with a steel pipeconveyor is presented in Fig. 16.id; (b) received signal for the pipe full of liquid.
J. Abbaszadeh et al. / Sensors and Actuators A 203 (2013) 215– 224 223
Fig. 15. (a) Actual position of placed object inside the pipe; (b) final reconstructed c
Fig. 16. Designed hardware of ultrasonic tomography system.
ross-sectional images for the different frequencies with different algorithms.
6. Conclusion
The procedure for the hardware design of an UT system wasdiscussed. In designing the front-end hardware, extra attention isneeded for selecting suitable transducers due to their application.Steel pipe was investigated as the conveyor of the UT system, somesolutions such as the selection of the appropriate ultrasonic sensorwere proposed, and the manner of data signal extraction in thepresence of Lamb waves was introduced.
Finite element simulation (COMSOL) was investigated to deter-mine the most suitable ultrasonic sensor, based on the mannerof wave propagation at different frequencies, and finally 40 kHzwas chosen as the optimum frequency. Experimental ultrasonicwaves were sent and received by the ultrasonic transceivers. Thereceived signal was processed and the observation time was noted.It was found that in UT systems with a steel pipe, the Lamb wavestravel faster than the straight-path signals. Based on the obser-vation times determined, extraction of the data signals from the
received signals by a sample-and-hold sub-circuit was carried out.Finally, comparison of the resulting cross-sectional images in thecases of 333 kHz and 40 kHz prove that the quality of the recon-structed image at 40 kHz is higher than at 333 kHz. The presented
2 d Act
sp
R
[
[
[
[
[
[
[
[
[
[
[
[
24 J. Abbaszadeh et al. / Sensors an
tudy shows a strategy to develop UT systems which use a steelipe as the conveyor.
eferences
[1] R.A. Rahim, et al., Determination of water and oil flow composition using ultra-sonic tomography, Elektrika Journal of Electrical Engineering 9 (2007) 19–23.
[2] A. Plaskowski, et al., Imaging Industrial Flows: Applications of Electrical ProcessTomography, Taylor & Francis, Oxford, UK, 1995.
[3] M.S. Beck, Process Tomography-95: Implementation for Industrial Processes,UMIST, Department of Electrical Engineering & Electronics, Manchester, UK,1995.
[4] S. Wöckel, et al., Acousto-capacitive tomography of liquid multiphase systems,Sensors and Actuators A: Physical 172 (2011) 322–329.
[5] E.J. Mohamad, et al., An introduction of two differential excitation potentialstechnique in electrical capacitance tomography, Sensors and Actuators A: Phys-ical 180 (2012) 1–10.
[6] B. Hoyle, Process tomography using ultrasonic sensors, Measurement Scienceand Technology 7 (1999) 272.
[7] M.R. Widyanto, et al., Local gas holdup measurement of a bubble column usingSONIA-ultrasonic non-invasive method, Sensors and Actuators A: Physical 126(2006) 447–454.
[8] W. Li, B. Hoyle, Ultrasonic process tomography using multiple active sensorsfor maximum real-time performance, Chemical Engineering Science 52 (1997)2161–2170.
[9] R.A. Rahim, et al., Non-invasive imaging of liquid/gas flow using ultrasonictransmission-mode tomography, Sensors and Actuators A: Physical 135 (2007)337–345.
10] M.H.F. Rahiman, et al., Design and modelling of ultrasonic tomography fortwo-component high-acoustic impedance mixture, Sensors and Actuators A:Physical 147 (2008) 409–414.
11] M.H.F. Rahiman, et al., Ultrasonic transmission-mode tomography imaging forliquid/gas two-phase flow, IEEE Sensors Journal 6 (2006) 1706–1715.
12] B. Hoyle, L. Xu, Ultrasonic sensors, in: Process Tomography: Principles, Tech-niques and Applications, Butterworth-Heinemann, Oxford, UK, 1995, pp.119–149.
13] P. Hauptmann, et al., Ultrasonic sensors for process monitoring and chemi-cal analysis: state-of-the-art and trends, Sensors and Actuators A: Physical 67(1998) 32–48.
14] R.A. Williams, M.S. Beck, Process Tomography: Principles, Techniques, andApplications, Butterworth-Heinemann, Oxford, UK, 1995.
15] S. Ohyama, et al., Temperature distribution and wind vector measurementusing ultrasonic CT based on the time of flight detection, Sensors and ActuatorsA: Physical 151 (2009) 159–167.
16] G. Gu, L. Zhu, Modeling of rate-dependent hysteresis in piezoelectric actua-tors using a family of ellipses, Sensors and Actuators A: Physical 165 (2011)303–309.
17] Z. Zhu, et al., A general dispersion relation for Lamb-wave sensors with liquid-layer loading, Sensors and Actuators A: Physical 49 (1995) 79–84.
uators A 203 (2013) 215– 224
18] J.K. Na, et al., Design, fabrication, and characterization of single-element inter-digital transducers for NDT applications, Sensors and Actuators A: Physical 148(2008) 359–365.
19] S.W. Or, et al., Ultrasonic wire-bond quality monitoring usingpiezoelectric sensor, Sensors and Actuators A: Physical 65 (1998)69–75.
20] Y. Haga, et al., Batch fabrication of intravascular forward-looking ultrasonicprobe, Sensors and Actuators A: Physical 104 (2003) 40–43.
21] M.H.F. Rahiman, et al., The front-end hardware design issue in ultrasonictomography, IEEE Sensors Journal 10 (2010) 1276–1281.
Biographies
Javad Abbaszadeh received the B.Eng. degree (Honours) in electrical engineering(electronics) from Urmia University, Urmia, Iran, in 2007. He received the M.Sc.degree in electrical engineering (electronics) from Sahand University of Technology,Tabriz, Iran. He is currently working towards the Ph.D. degree in process tomogra-phy in Universiti Teknologi Malaysia, Skudai, Johor Bahru, Malaysia. His currentresearch interests include process tomography, signal processing, and advancedsensing systems.
Herlina Abdul Rahim received a B.Eng. in electrical engineering (control and instru-mentation) and M.Sc. in electrical engineering from Universiti Teknologi Malaysiain 1998 and 2000, respectively. She received his Ph.D. in electrical engineeringfrom Universiti Teknologi MARA, in 2009. At present she is a senior lecturer at Fac-ulty of Electrical Engineering, Universiti Teknologi Malaysia. Her current researchinterests are process tomography, sensor technology and artificial intelligentsystem.
Ruzairi Abdul Rahim received the B.Eng. degree (Honours) in electronic system andcontrol engineering from Sheffield City Polytechnic, Sheffield, U.K., in 1992 and thePh.D. degree in instrumentation and electronics engineering from Sheffield HallamUniversity, Sheffield, U.K., in 1996. He is currently a Professor and the Director ofthe Research Management Centre, Universiti Teknologi Malaysia, Skudai, Malaysia,where he is also currently with the Department of Control and InstrumentationEngineering at the Faculty of Electrical Engineering. His research interests includeprocess tomography and sensor technology.
Sahar Sarafi received the B.Eng. degree (Honours) in electrical engineering (elec-tronics) and M.Sc. degree in electrical engineering (electronics) from UrmiaUniversity, Urmia, Iran, in 2007. She is currently working towards the Ph.D. degree inUniversiti Teknologi Malaysia, Skudai, Johor Bahru, Malaysia. Her current researchinterests include process tomography, signal processing, and analogue to digitalconverters.
Muzakkir Nor Ayob received the B.Eng. degree (Honours) in mechatronic engi-neering and M.Sc. in electrical engineering from Universiti Malaysia Perlis, Perlis,Malaysia, in 2008. He is working towards the Ph.D. degree in electrical engineeringin Universiti Teknologi Malaysia, Skudai, Johor Bahru, Malaysia. His current researchinterests include process tomography and image reconstruction.