Design principles of cell-free replicators
119
Design principles of cell-free replicators Kai Libicher München 2021
-
Upload
khangminh22 -
Category
Documents
-
view
0 -
download
0
Transcript of Design principles of cell-free replicators
Design principles of cell-free replicators
Kai Libicher
München 2021


Design principles of cell-free replicators
Kai Libicher
Dissertation
zur Erlangung des Grades Dr. rer. nat.
an der Fakultät für Physik der
Ludwig-Maximilians-Universität München
vorgelegt von
Kai Libicher
aus Schwetzingen
München, den 12.01.2021

Erstgutachter: Prof. Dr. Dieter Braun
Zweitgutachter: Prof. Dr. Ralf Jungmann
Tag der mündlichen Prüfung: 1. März 2021
Freudig war vor vielen Jahren
Eifrig so der Geist bestrebt,
Zu erforschen, zu erfahren,
Wie Natur im Schaffen lebt.
Und es ist das ewig Eine,
Das sich vielfach offenbart;
Klein das Große, groß das Kleine,
Alles nach der eignen Art.
Immer wechselnd, fest sich haltend,
Nah und fern und fern und nah;
So gestaltend, umgestaltend –
Zum Erstaunen bin ich da.
Parabase, J.W. Goethe1
Zusammenfassung
Der heilige Gral der synthetischen Biologie ist die Erschaffung einer minimalen Zelle, welche
sowohl zu autonomer Selbstreplikation als auch zu natürlicher Evolution befähigt ist. Bereits
heute ist es möglich das zentrale Dogma der Molekularbiologie, also die Implementierung des
genetischen Codes mittels Transkription-Translation, in vitro zu rekonstruieren. Doch die
Kopplung dieses Prozesses mit einem vollständigen DNA-Selbstreplikationssystem war
bisher nur auf ein paar Kilobasen (kbp) beschränkt, weit entfernt von den vorgeschlagenen
113 kbp die für eine minimale Zelle nötig wären.2
In dieser Arbeit wird die Entwicklung einer Plattform für die transkriptions-translations-
gekoppelte DNA-Replikation vorgestellt, genannt PURErep, welche in der Lage ist Genome
mit der vorhergesagten Größe einer Minimalzelle zu replizieren. Als wichtiger Schritt in
Richtung natürlicher Evolution kann sich der hier beschriebene Selbstreplikator pREP über
mehrere Generationen fortpflanzen, sowohl in vitro als auch in vivo. PURErep ist modular
aufgebaut und frei verfügbar, sodass es mit beliebigen Funktionen erweitert werden kann.
Neben der DNA gibt es weitere Komponenten, die zum Selbsterhalt einer Zelle vermehrt
werden müssen. Es konnte gezeigt werden, dass PURErep die simultane Co-Expression
mehrerer seiner Proteinkomponenten ermöglicht. Diese Faktoren waren in der Lage sich aktiv
an der Selbst-Regeneration des Systems beteiligen, was einen wichtigen Schritt in Richtung
biochemischer Autonomie darstellt.
Weiterhin wurden Möglichkeiten zur Selbstreplikation des komplexen Ribosoms erforscht,
einem wesentlichen Bestandteil des Translationsapparates. Die de novo Synthese und
Assemblierung solcher Ribosomen wird eine entscheidende Rolle für zukünftige
Entwicklungen spielen. Ein weiteres Merkmal von Zellen stellt ihre Hülle dar, die
Zellmembran. Eine von Grund auf neu geschaffene Minimalzelle müsste in der Lage sein,
eine ähnliche Hülle selbst zu produzieren. Es wurde ein effizientes Konzept zur Selbst-
Verkapselung des pREP Replikators entwickelt, welches vollkommen ohne zusätzlichen
Energiebedarf auskommt. Es konnte gezeigt werden, dass diese sogenannten DNA-
Nanoflowers Kernstrukturen bildeten und sich über Generation hinweg vermehren können.
Insgesamt dienen die in dieser Arbeit dargelegten Entwürfe der Weiterentwicklung
unabhängiger Selbstreplikatoren, welche vielleicht in der Lage sein werden eines Tages
natürliche Zellen zu imitieren.
Abstract
The holy grail of bottom-up synthetic biology is the creation of a minimal cell capable of
autonomous self-replication and open-ended Darwinian evolution. Reconstituting molecular
biology’s central dogma, the implementation of genetic information via transcription-
translation, is already feasible in vitro. Yet coupling this process to a DNA self-replication
system has so far been limited to only a few kilobases (kbp), a far cry from the proposed 113
kbp proposed for a minimal cell.2
This work presents the development of a transcription-translation coupled DNA replication
platform, called PURErep, which is capable of replicating DNA genomes approaching the
proposed size of a minimal cell. As an important step towards Darwinian evolution, the herein
described self-replicator pREP can propagate over several generations, both in vitro and in
vivo. PURErep is modular and freely available, so that it can be extended with further
functions as desired. In addition to DNA, there are other components that need to be
replicated for the self-preservation of a cell. It could be shown that PURErep enables the
simultaneous co-expression for several of its protein components. These factors were able to
actively participate in the self-regeneration of the system, representing an important hallmark
of biochemical autonomy.
Furthermore, the self-reproduction of the complex ribosome was investigated, an essential
component of the translational apparatus. The de novo synthesis and assembly of such
ribosomes will be a crucial step towards future developments. Another feature of cells is their
envelope, the cell membrane. A minimal cell created from scratch should be able to produce a
similar compartment by itself. An efficient concept for the self-compartmentalization of the
pREP replicator has been developed, which requires no additional energy and is entirely
based on self-organization. It could be shown that these so-called DNA nanoflowers formed
nuclear structures and could reproduce over generations.
Overall, the designs laid out in this work serve to further develop independent self-replicators,
which may one day be able to mimic a natural cell.
Contents
I General introduction ........................................................................................................ 1
I-1 Replicators as a basic concept for the origin of life ................................................................ 1
I-2 Minimal cells ........................................................................................................................... 6
I-2.1 Reductive (top-down) approach .......................................................................................... 6
I-2.2 Constructive (bottom-up) approach ..................................................................................... 7
I.3 Aim and outline of the thesis ................................................................................................. 12
II Genome self-replication .................................................................................................. 13
II-1 Introduction ........................................................................................................................... 14
II-2 Transcription-translation-coupled DNA-replication ............................................................. 16
II-2.1 The replicator plasmid pREP ............................................................................................. 16
II.2.2 The TTcDR platform PURErep ........................................................................................ 17
II.2.3 Concatemer processing ..................................................................................................... 20
II-3 Co-replication ........................................................................................................................ 22
II-4 Discussion ............................................................................................................................. 25
II-5 Methods ................................................................................................................................. 29
III Proteome self-regeneration ............................................................................................ 37
III-1 Introduction ........................................................................................................................... 38
III-2 Co-expression ........................................................................................................................ 40
III-3 Continuous regeneration ........................................................................................................ 43
III-4 Discussion ............................................................................................................................. 48
III-5 Methods ................................................................................................................................. 52
IV Ribosome synthesis & assembly .................................................................................... 57
IV-1 Introduction .......................................................................................................................... 58
IV-2 In-vitro synthesis, assembly and translation of ribosomes ................................................... 60
IV-3 Extract-based TTcDR ........................................................................................................... 63
IV-4 Discussion ............................................................................................................................ 65
IV-5 Methods ................................................................................................................................ 69
V Self-compartmentalization ............................................................................................ 75
V-1 Introduction .......................................................................................................................... 76
V-2 DNA hydrogels ..................................................................................................................... 78
V-3 DNA nanoflowers ................................................................................................................. 79
V-4 Discussion ............................................................................................................................ 82
V-5 Methods ................................................................................................................................ 85
VI Conclusion ...................................................................................................................... 86
VII Bibliography ................................................................................................................... 89
VIII List of figures ................................................................................................................ 102
IX List of tables .................................................................................................................. 105
X List of publications ....................................................................................................... 106
XI Notable acronyms ......................................................................................................... 107
XII Acknowledgments ........................................................................................................ 108
1
I General introduction
I-1 Replicators as a basic concept for the origin of life
The question for the origin of life has captivated humanity for ages and it still eludes us
today.3 How could a primordial soup
4 have spawned the plethora of living beings around us?
Prebiotic chemists pursue this issue by identifying life’s building blocks and the plausible
ways that could have led to its origin. The modern pursuit arguably started in 1953 with the
renowned experiment by Urey and Miller,5 who demonstrated that running an electric current
though a gas mixture containing methane, ammonia and hydrogen (CH4, NH3 and H2),
putative components of a primordial atmosphere on Earth, above a heated water source was
sufficient to produce many of the molecules we observe in living organisms today. This was
an important milestone as it provided a plausible explanation for the formation of life’s
building blocks on early Earth, thus setting the stage for a theory of abiogenesis, the
emergence of life from non-living matter.4
But what is life, this property attributed to some but not all forms of matter? At first sight, this
question seems blatantly trivial seeing that we are interacting with living things on a daily
basis. Yet all attempts for a definition have so far struggled to become universally accepted.6,7
Viruses are a typical subject of controversy: they do evolve and multiply, yet lack the ability
to reproduce without a host.8 Bacterial spores and similarly dormant cells can stay inactive for
years, but are still capable of growth and reproduction when certain criteria are met.9 What
about life in outer space? Would we even be able to recognize it?
NASA defines life as a "self-sustaining chemical system capable of Darwinian evolution”.6
This definition builds on Darwin’s proposal that life forms imperfectly pass on their
hereditary information during reproduction, giving rise to variation which is subject to natural
selection.10
Individual life forms with the highest fitness to their local environment are
favored in the next round of reproduction, thus transmitting pre-existing variations while
introducing new ones. NASA’s inclusion of Darwinian evolution successfully excluded a
variety of inanimate replicators, such as crystals and chemical oscillators,11
yet still was
incapable of reaching unequivocal consent. If anything, the failed attempts may have shown
that defining life appears to be highly subjective. Rather, we may turn our focus to the
2
objectively measurable, such as the foundation of all organisms: cells. The question for an
origin of life might thus be restated as to how cells could have arisen from cell-free matter.
From single-celled microbes to multi-cellular vertebrates, all organisms consist of cells.12
Within their membrane-encapsulated cytoplasm, cells host an incredibly complex network of
chemical reactions, the metabolism, which maintains cellular viability: the ability to grow and
reproduce.12
From a physicist’s perspective, viable cells reside in a far-from-equilibrium state
that is sustained by a continuous, yet selective flux of matter.3 They evade thermodynamic
decay by establishing a delicate homeostasis driven by the consumption of energy at the
expense of environmental negentropy.3 In other words, cells sustain themselves by
accelerating local entropy growth.
From a biochemist’s view, cells metabolize compatible matter to form their molecular
building blocks.13
Next to membrane lipids, these are predominantly deoxyribonucleic acid
(DNA), ribonucleic acid (RNA) and protein.12
The consumption and secretion of matter
serves to replicate the cells’ components. Following the proposal of Koonin &
Starokadomskyy, units of replication can be defined as replicons.8 Instances that facilitate the
replication of replicons are called replicators. In line with this view, the genome inside a cell
can be considered a self-replicator with individual genes as its replicons.
As Oswald showed in 1943, the cell’s genome stores its hereditary information in the form of
DNA.14
The encoded genes represent sequences for all cellular RNA and protein molecules.
The set of all genetic RNAs is referred to as the transcriptome; the set of all encoded proteins
is called the proteome.15
In analogy to machine code and programming languages,
transcriptome and proteome can be understood as more abstract hierarchy levels on top of the
genetic code.16
Whereas genes store information, RNA and protein molecules fold into a
variety of three-dimensional structures. Every molecular species displays distinct structural
features and chemical moieties according to which they perform different tasks in the cell.13
Hence, genes encode cellular functions implicitly in DNA.
The genetic information is implemented by a process called gene expression. Here, a DNA-
based gene is transcribed to produce an RNA molecule, which in turn may get translated to
synthesize protein molecules.12
As a result, genome, transcriptome and proteome all have to
be replicated for cellular propagation. Yet if the birth of any new cell required these
molecules to exist a priori, how could the first one have arisen to begin with? A chicken and
egg problem, so it seems.
3
The last universal common ancestor (LUCA) of all cells, be it prokaryote, eukaryote or
archaeon, is understood as a primordial cell bearing common traits of its modern successors.17
It must have at least had a lipid membrane, a genome, a transcriptome and a proteome to
synthesize all of the bio-molecules above. Granted the LUCA evolved according to Darwinian
principles,10
it appears reasonable to assume that its predecessor must have been a non-
cellular, or cell-free system of bio-molecules capable of evolution and autonomous
reproduction.
In an effort to explain the transition of cell-free, chemical reactions to cells, Gánti defined the
“chemoton” as the smallest entity which could still be called living.18
This theoretical model
comprises three core modules: metabolism, information and compartment. Accordingly, each
of these modules would assemble from self-organizing reaction networks, the sum of which
formed a chemical super-system: the chemoton. A predecessor to a cell could thus be
imagined as an information-encoding, metabolic network of encapsulated molecules. It seems
plausible that the components of this network were akin to the bio-molecules we observe in
cells today, namely DNA (information), RNA, protein (metabolism) and lipids
(compartment).
In similar fashion, von Neumann suggested in his theory of cellular automata that self-
reproducing machines required three modules to propagate: an instruction, a constructor and a
copy machine.19
The constructor module, capable of reading and implementing any
instruction, was capable of constructing both copies of itself and of the copy machine. The
universal copying module was capable of replicating any instruction. This way, cellular
automata could self-replicate given the consumption of resources.20
If we applied this concept
to nature, cells could be viewed as forms of biological automata. In this context, the DNA
genome would be the instruction module, whereas RNA served as the constructor next to
proteins which could further take on the role of the copy machine.21
In order to drive
metabolism, constructors and copy machines could act as chemical catalysts. Indeed,
autocatalytic reactions, wherein the product catalyzed its own synthesis, bear significance in
many biological processes, from self-replication to morphogenesis.22,23
Following this line of
thought, the whole cell’s metabolism could be understood as an incredibly complex
autocatalytic network.
Intriguingly, RNA has the potential to both be information storage (instruction) and catalyst
(constructor and copy machine).24
Catalytic RNA molecules, so-called ribozymes, could have
been simultaneously template and replicase at some stage prior to the emergence of the
4
LUCA.25
It is hypothesized that there might have been a period on prebiotic Earth were
consortia of self-replicating RNA molecules formed primitive metabolic systems, known as
the RNA world.26
This theory was supported by the finding that catalytic RNA was capable of
transcribing other ribozymes.27
Interesting support for this theory comes from the relevance of
ribosomes in cells today.28
The ribosome can be viewed as a molecular assembler,29
it is
crucial in translating the genetic code during gene expression.12
Due to its key role in every
cell, the ribosome forms the foundation to what Crick called the central dogma: the flow of
information from genes to RNA and proteins.30
More so, the ribosome itself consists of both
RNA and protein, and its catalytic core is entirely RNA-based.31
Could this ribozyme be a
relic of the RNA world that still persists to this day?32,33
In support of the RNA world
concept, RNA self-replication and evolution was demonstrated by the Spiegelman group.34
They showed that in a cell-free setting, the RNA-based Qβ-replicase could replicate its
template, the Qβ-bacteriophage, and spawn new faster-replicating progeny, coined
Spiegelman’s monster.35
In similar fashion to the Uri-Miller experiment, this replicator
became the spiritual predecessor to all in vitro replicators that followed.36,37
Spiegelman’s RNA molecule was evolved according to Darwinian principles, which obligate
genetic variation of individual replicators, heritability of their genes and natural selection for
the fittest variant.10
However, Darwinian evolution alone could not compensate for the
emergence of primitive replicators. In fact, genetic variation arises from erroneous replication,
which inevitably leads to information loss up to the point where self-replication is entirely
disrupted.38
This circumstance imposes a limit on the size of a replicator’s genome, which can
only be overcome by introducing an error-correcting gene. Yet doing so would expand the
size of the genome further making it even more prone to errors. Eigen and Schuster proposed
that this so-called error-threshold problem could be solved if several autocatalytic replicators
formed a mutually catalyzing hypercycle. Through cooperation they could overcome the
error-threshold whilst maintaining genetic diversity.39,40,41
Hence, a predecessor to the LUCA could have been a bio-molecular network of self-
organizing hypercycles. Given that modern cell-replication is split between DNA, RNA and
protein, it seems entirely conceivable that these molecules formed sub-systems akin to the
cellular automata.18,42,43
Natural selection could have pressured the reaction networks to
evolve traits like cooperation and sub-functionalization.38,44
It was shown that self-encoded
RNA co-replication systems expressing a replicase and a PURE enzyme (NDK) could lead to
cooperative co-evolution.45
Yet hypercycle networks would still fall prey to faster replicating
parasites.46
Considering Gánti’s chemoton model, the issue might be resolved with the
5
remaining piece of the puzzle: spatial compartmentalization.18
It was shown that physical
boundaries between self-replicators could relieve the detrimental effects of parasite
emergence during Darwinian evolution.47,48,49
This way, the replicator’s instruction (genome)
would be directly coupled to its implementation (transcriptome, proteome).50
A
semipermeable barrier to the environment would further allow the system to evade
thermodynamic equilibrium by establishing chemical homeostasis in a defined space.3
In cells, the cytoplasm is encapsulated by a complex lipid bilayer. The growth and division of
this structure demands a lot of energy which is provided by the utilization of electrochemical
potential gradients across membranes.51,52
Yet this raises the question: How did the first
membranes arise without an abundance in resources and energy? A possible alternative prior
to lipid bilayers might have been membrane-less compartments, which were already
considered a century ago by Oparin and Haldane.4,53
Coacervates in particular form
spontaneously from the liquid-liquid phase separation of molecules such as nucleic acids and
polypeptides.54,55,56
Dense microenvironments like these could have provided both
compartmentalization and favorable reaction conditions for catalysis.57,58
Despite their
simplicity, growth and division could still be conceivable for these droplets putting them in
favor as protocell candidates.59
Prebiotic chemists are interested in plausible conditions that might have led to emergence of
the first cell. In recent years, this pursuit was complimented by a pragmatic approach:
synthetic biology. The ultimate goal of this new field is the creation of a self-sustaining cell
capable of Darwinian evolution. Synthetic biologists are equally interested in the minimal set
of molecules for cellular viability, yet at the at the expense of prebiotic plausibility.
Abandoning this concept comes with a substantial advantage: the repertoire of molecules to
choose from increases by a large extent. Any part could be utilized according to the motto:
“we don’t understand it until we know how to build it”.60
The creation of a minimal cell from
clearly defined components could thus help identify key mechanisms that give rise to this
elusive thing called life.
6
I-2 Minimal cells
There are two opposing paths towards the creation of a minimal cell, yet both involve the
development of a minimal genome that encodes its essential functions. A long-standing
tradition in natural science is the “divide-and-conquer” or reductionist approach. In the
minimal cell field, this is referred to as the top-down method, whereby non-essential genes are
excised from naturally occurring genomes until none can be removed without compromising
viability.
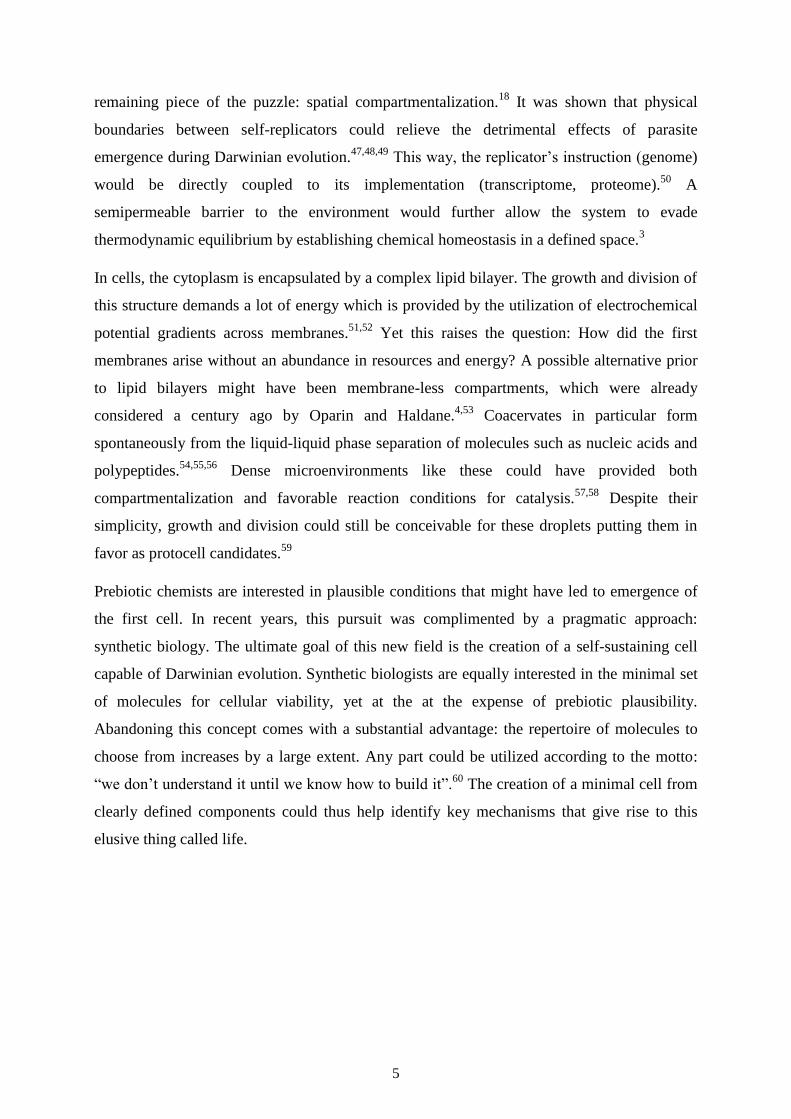
I-2.1 Reductive (top-down) approach
There are single-celled organisms in nature that stand
out by having very small genomes. They serve as
interesting candidates for minimal cells, because
evolution ought to have distilled the most basic
functions from their genomes over time. The smallest
known genome of free-living bacteria in nature is found
in Mycoplasma genitalium with a size of 580 kbp (kilo-
basepairs).61,62
In comparison, the standard workhorse in
synthetic biology, Escherichia coli, carries a genome
spanning 4.6 mbp (mega-basepairs).63
Yet smaller genomes can be found amongst those
organisms that have evolved to benefit from parasitism
or symbiosis. One of the smallest genomes in nature
originates from the endosymbiont Nasuia
deltocephalinicola with a size of 112 kbp.64
The
nutrient-rich environment of symbiotic relationships
enables these cells to live with a minimal set of genes.
They can even afford to lose some genes that would
otherwise be essential over the course of Darwinian
evolution.10
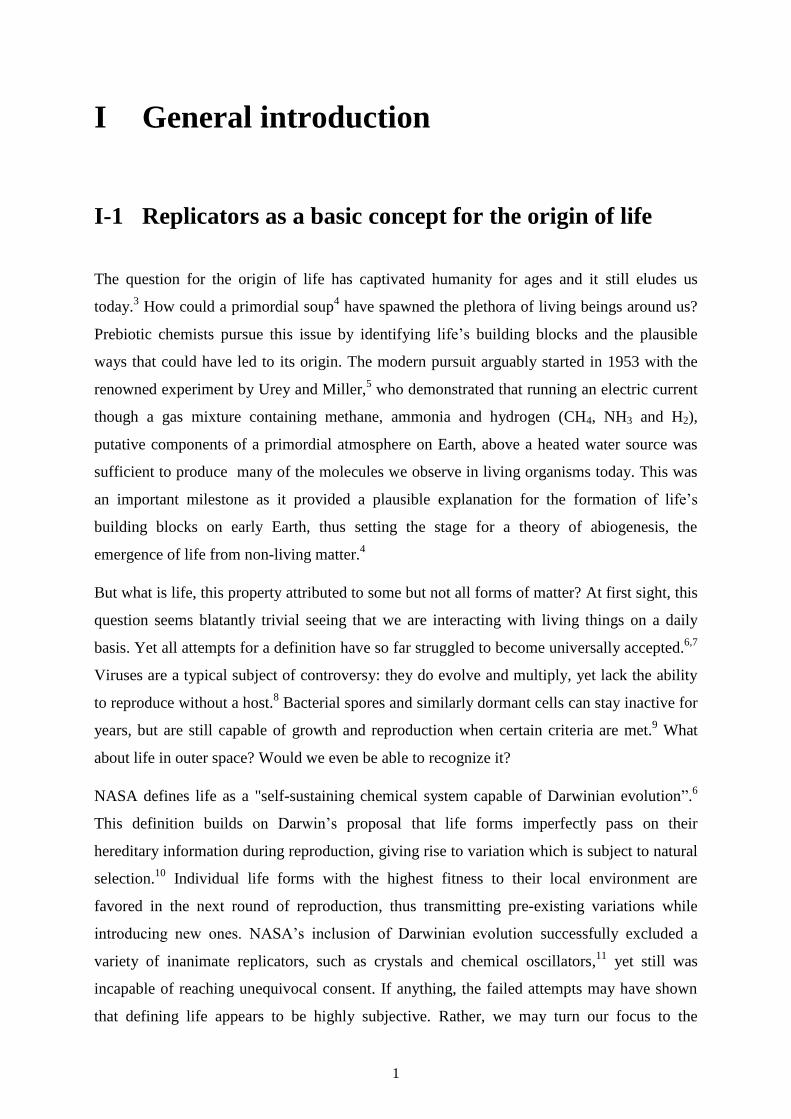
Figure 1: Top-down and bottom-up synthetic
biology aim to create a minimal cell from
opposite starting points. The reductive
approach takes an already existing cell and
deprives it of non-essential components until
only essential ones remain. The constructive
approach tries to assemble a minimal cell from
inanimate building blocks.
7
Similarly, Mycoplasma mycoides is another parasite with a small genome, just 1 mbp in size,
which lacks anabolic enzymes for the amino acid, purine and pyrimidine pathways.65
Small
organisms such as M. mycoides have formed the starting point for top-down synthetic
biologists to create a minimal cell from a chemically synthesized genome.66
The Venter lab
has succeeded using this strategy to generate an even smaller variant of M. mycoides. The
researchers excised 100 non-essential genes from the wild-type (WT) genome to generate a
version with only 473 genes and half the original genome size (532 kbp). Out of these, 149
were of unknown function which emphasized how much was still unknown about the inner
workings of even of the “simplest” of organisms.67
I-2.2 Constructive (bottom-up) approach
In contrast to its reductionist cousin, the so-called bottom-up approach aims at incrementally
adding genes to a nascent genome until it is able to sustain a minimal cell. That is, until it is
able to replicate its components as well as to autonomously remain in a non-equilibrium state.
The fact that no bottom-up minimal cell has been created so far arguably demonstrates the
magnitude of the challenge.68
Taking the 149 unknown genes from above as an example, how
could any function be implemented, if it is not yet fully understood? Building a cell from
scratch could shed more light on these functions.
Self-encoded reproduction requires a cell-free, in-vitro platform for gene expression. This
process is known as the central dogma of molecular biology, because it depicts the flow of
information from a DNA source to RNA and protein.30
During protein expression, a gene is
transcribed to yield a messenger RNA (mRNA) copy which serves as a template for the
translation into a polypeptide. This polymer may ultimately fold into a functional protein to
serve a plethora of functions inside and outside the cell. The translation apparatus itself
consists of both protein and RNA, so these ought to be regenerated in addition to the genome
in order to truly complete the self-replication cycle.
Libchaber and his lab were among the first to experimentally realize in vitro gene expression
in membrane-based protocells.69–71
The group achieved this by encapsulating E. coli cell
extract with tiny lipid vesicles containing all the components required for cell-free protein
synthesis. The central dogma could be sustained continuously by matter exchange through α-
hemolysin pores, which were expressed from Staphylococcus aureus genes in vesiculo.
8
However, cellular extracts are not well-defined mixtures, because they contain many
unknown components, so-called “black boxes”. This limits their utility to elucidate unknown
factors in minimal cells. Ideally, an in vitro protein synthesis platform would be entirely
reconstituted from purified components to limit the occurrence of these “black boxes”. In
2001, Shimizu et al. presented a cell-free system called PURE (protein synthesis using
recombinant elements) which revolutionized the field of bottom-up synthetic biology.72
For
the first time, it was possible to conduct protein biosynthesis in vitro without any unknown
factors. In total, PURE consisted of 31 enzymes with their coenzymes, E. coli ribosomes,
nutrients, buffers and salts. The enzymes were mainly translation factors and tRNA
synthetases, but also included a T7-RNA-polymerase (T7-RNAP) for transcription and
metabolic enzymes for energy conversion (nucleoside-diphosphate kinase (NDK), adenylate
kinase (AK), creatine kinase (CK)). The advantage of an unlimited building block repertoire
in bottom-up biology was revealed with PURE: the proteins were of bacterial, eukaryote and
viral origins. A viral T7-RNA-polymerase transcribed DNA genes which were subsequently
translated by bacterial ribosomes. The basic energy metabolism originated from a vertebrate
source. In concert, these enzymes formed a minimal viable transcription-translation apparatus
which could be used to express almost any gene with the appropriate T7-promoter.
In 2008, the Yomo group developed liposome-encapsulated protocells akin to the ones
published by the Libchaber lab containing the PURE system instead of cellular extract.73
These liposomes enabled the self-replication of an in situ expressed RNA replicase derived
from the Qβ-bacteriophage, paving the way for genome replication in PURE. However, the
replicase was sensitive to RNA secondary structure formation in the RNA genome. These
structural motifs were dependent on the RNA sequence and ensured the specific propagation
of the Qβ-template.74
Larger genomes necessitate the inclusion of many sequences which
could result in the formation of inhibitive structures that are not anymore recognized by the
replicase.48,45
Furthermore, RNA as an information carrier is susceptible to spontaneous
hydrolysis and degradation from ubiquitous nucleases75
rendering it a less favorable candidate
for larger genomes.
A DNA-based genome on the other hand is chemically stable and capable of storing long
genetic sequences.13
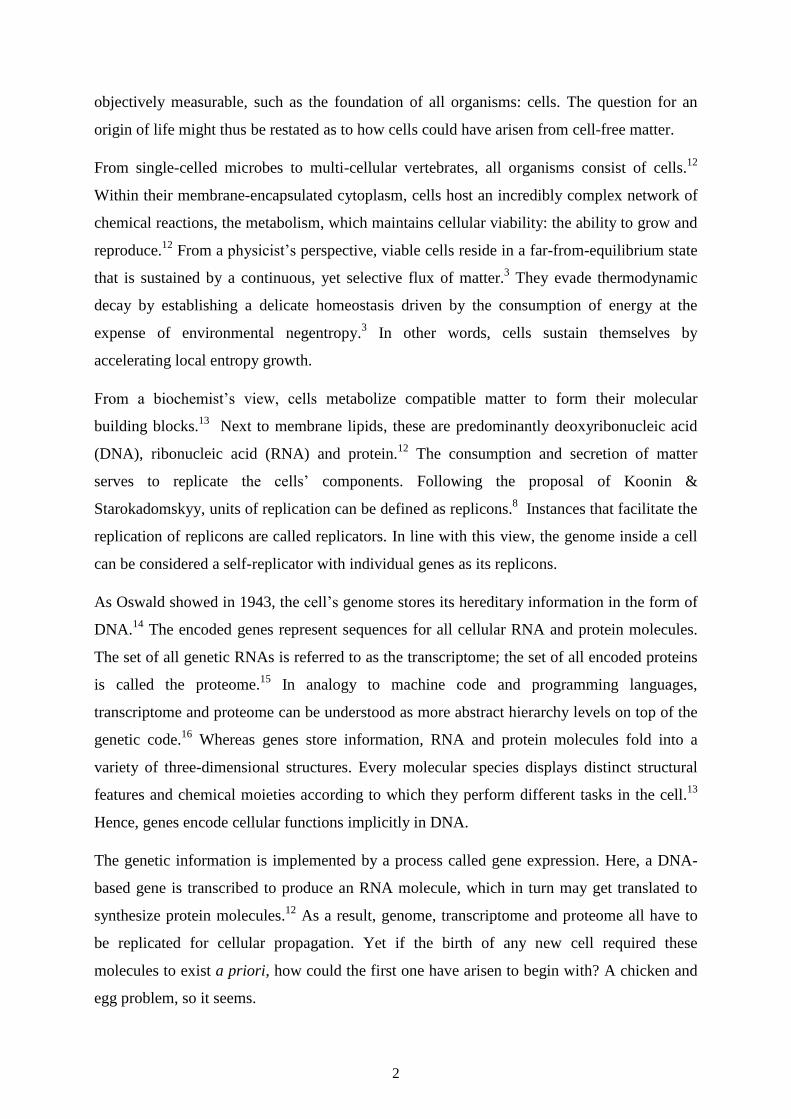
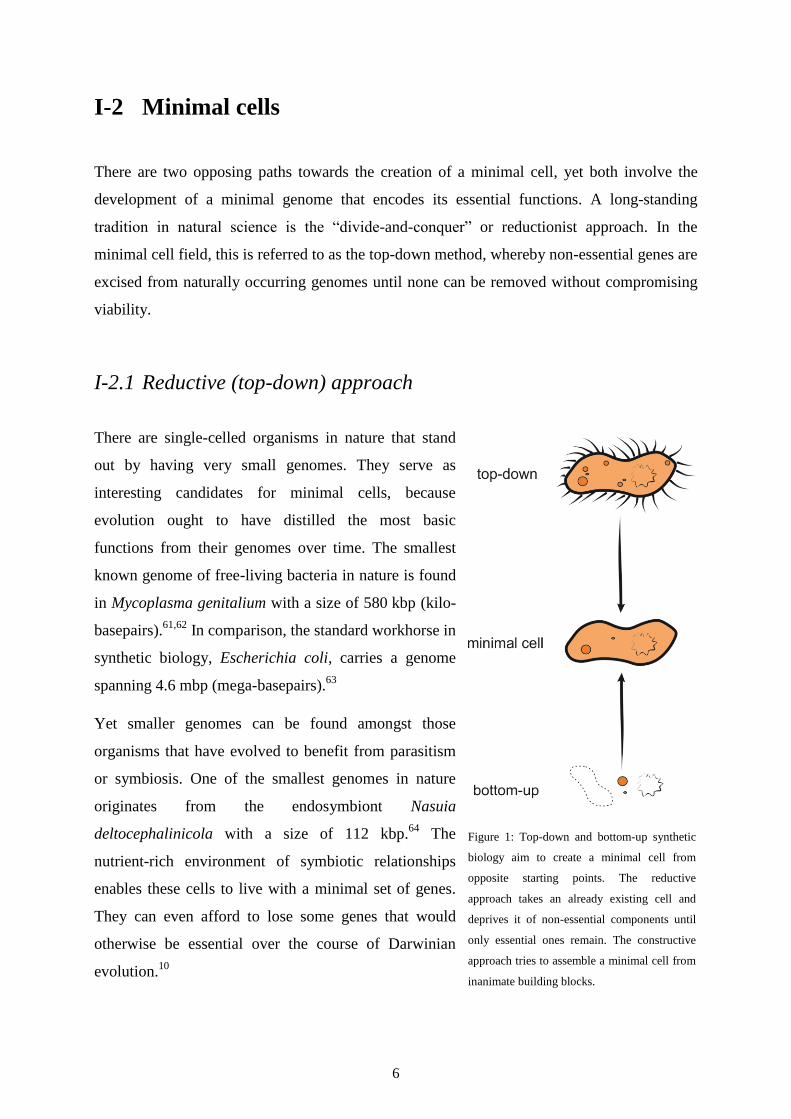
In 2006, Forster and Church proposed a DNA-based 113-kbp-genome
comprising 150 genes for a bottom-up constructed minimal cell (Figure 2).2 In this theoretical
model, DNA-replication was facilitated by a simplistic module containing the phi29-DNA-
polymerase (phi29-DNAP) and the Cre-recombinase.
9
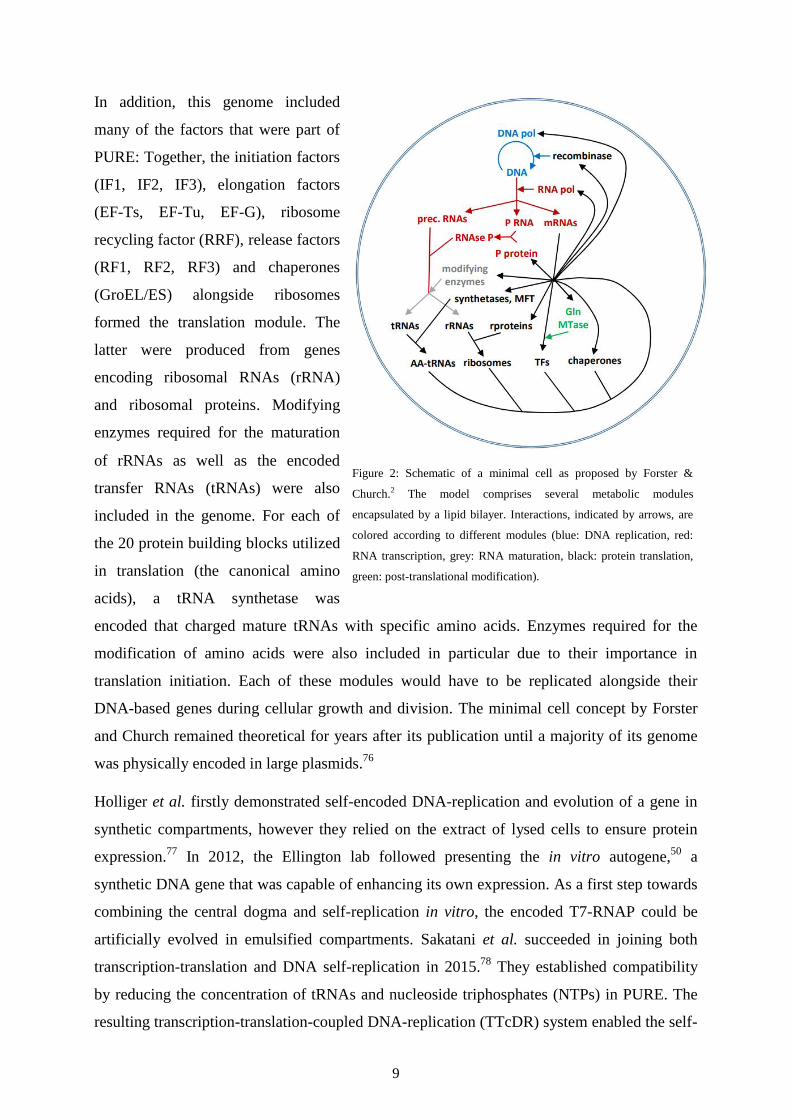
In addition, this genome included
many of the factors that were part of
PURE: Together, the initiation factors
(IF1, IF2, IF3), elongation factors
(EF-Ts, EF-Tu, EF-G), ribosome
recycling factor (RRF), release factors
(RF1, RF2, RF3) and chaperones
(GroEL/ES) alongside ribosomes
formed the translation module. The
latter were produced from genes
encoding ribosomal RNAs (rRNA)
and ribosomal proteins. Modifying
enzymes required for the maturation
of rRNAs as well as the encoded
transfer RNAs (tRNAs) were also
included in the genome. For each of
the 20 protein building blocks utilized
in translation (the canonical amino
acids), a tRNA synthetase was
encoded that charged mature tRNAs with specific amino acids. Enzymes required for the
modification of amino acids were also included in particular due to their importance in
translation initiation. Each of these modules would have to be replicated alongside their
DNA-based genes during cellular growth and division. The minimal cell concept by Forster
and Church remained theoretical for years after its publication until a majority of its genome
was physically encoded in large plasmids.76
Holliger et al. firstly demonstrated self-encoded DNA-replication and evolution of a gene in
synthetic compartments, however they relied on the extract of lysed cells to ensure protein
expression.77
In 2012, the Ellington lab followed presenting the in vitro autogene,50
a
synthetic DNA gene that was capable of enhancing its own expression. As a first step towards
combining the central dogma and self-replication in vitro, the encoded T7-RNAP could be
artificially evolved in emulsified compartments. Sakatani et al. succeeded in joining both
transcription-translation and DNA self-replication in 2015.78
They established compatibility
by reducing the concentration of tRNAs and nucleoside triphosphates (NTPs) in PURE. The
resulting transcription-translation-coupled DNA-replication (TTcDR) system enabled the self-
Figure 2: Schematic of a minimal cell as proposed by Forster &
Church.2 The model comprises several metabolic modules
encapsulated by a lipid bilayer. Interactions, indicated by arrows, are
colored according to different modules (blue: DNA replication, red:
RNA transcription, grey: RNA maturation, black: protein translation,
green: post-translational modification).
10
replication of circular DNA encoding a DNA-polymerase gene. Yet customizing the PURE
system was tedious and resource-intensive, which is why TTcDR remained limited to the few
working groups with access to customizable PURE systems. Moreover, the replication
product was not entirely identical to the template. True self-replication required not only
sequence-replication, but also regeneration of the replicator’s original form. In 2018, the
group managed to integrate a Cre-Lox recombination system that would re-circularize the
TTcDR product into its monomeric form.79
During the same year, van Nies et al. achieved
compartmentalized TTcDR in the commercially
available PUREfrex system.80
They could show that
linear DNA templates were able to be replicated by
a self-encoded DNA polymerase in parallel to
transcription-translation. Yet true self-replication
was not achieved due to the necessity of a pre-
incubation step with exogenous proteins. The
overall protein synthesis yield was too low to
synthesize sufficient amounts of these additional
proteins in situ. Still, both 2018 publications were
important stepping stones towards the creation of a
minimal cell. Chapter II will go into more detail on
this issue.
Yet genome self-replication is but a part of the whole picture. Upon division, a cell passes on
its proteome to two daughter cells. In order to prevent protein depletion from serial dilution,
the cell generates enough protein for its progeny prior to division. However, cell-free systems
are notorious for their low yields in protein biosynthesis.81,82
Ribosome stalling, RNA
degradation, protein misfolding or unspecific side reactions are known to impair efficient
yields.82–84
These issues could partly be resolved by fine-tuning the concentration of
translation factors, introducing transcriptional regulation and adding chaperones to increase
the proportion of functional product.83,85
Improved protein yields may finally enable the full
self-regeneration of a minimal cell proteome in vitro. The Yomo group for instance has
shown that the co-expression of all 20 tRNA synthetases was indeed possible in PURE.86
The
partial self-regeneration of PURE factors was recently realized as well using continuous-flow
dialysis.21,87
Yet a truly autonomous, minimal cell would have to self-regenerate all of its
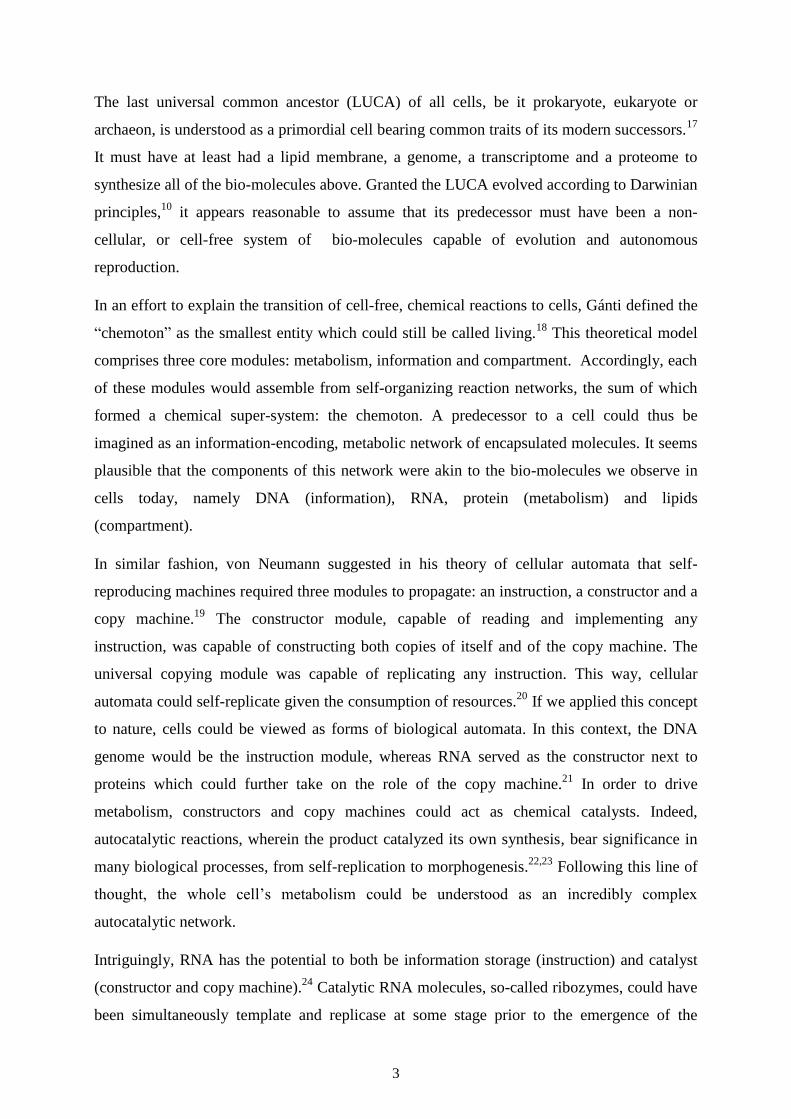
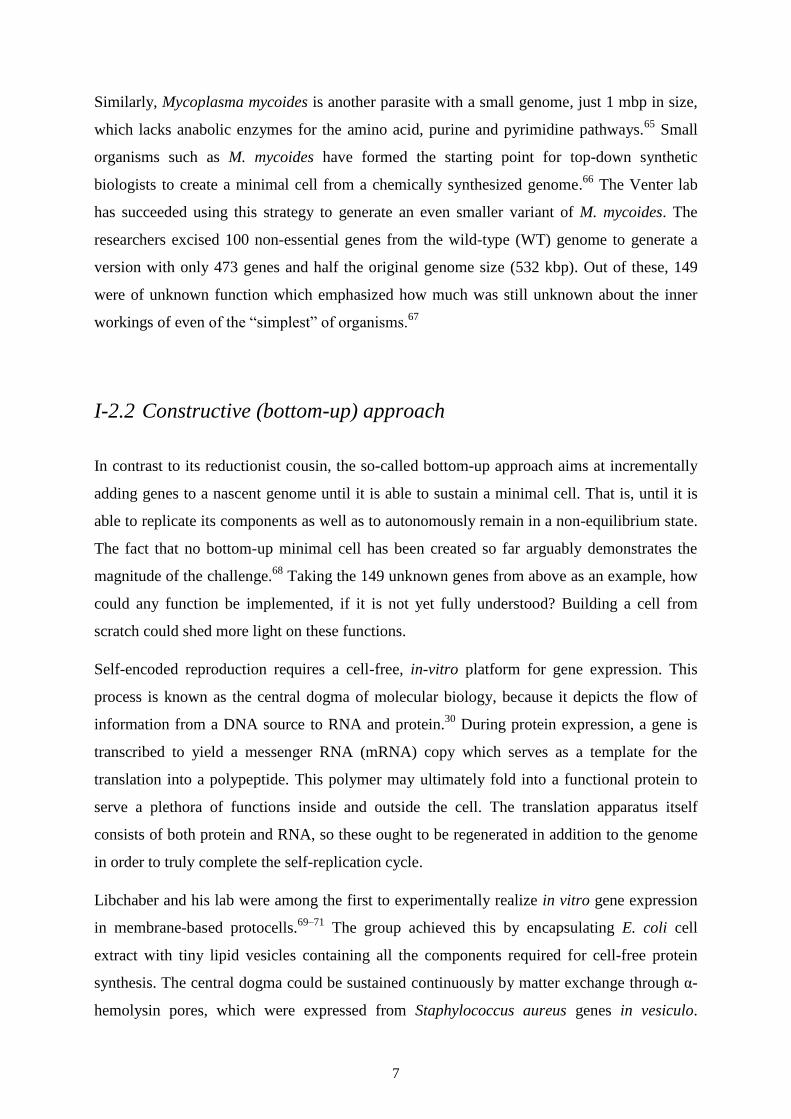
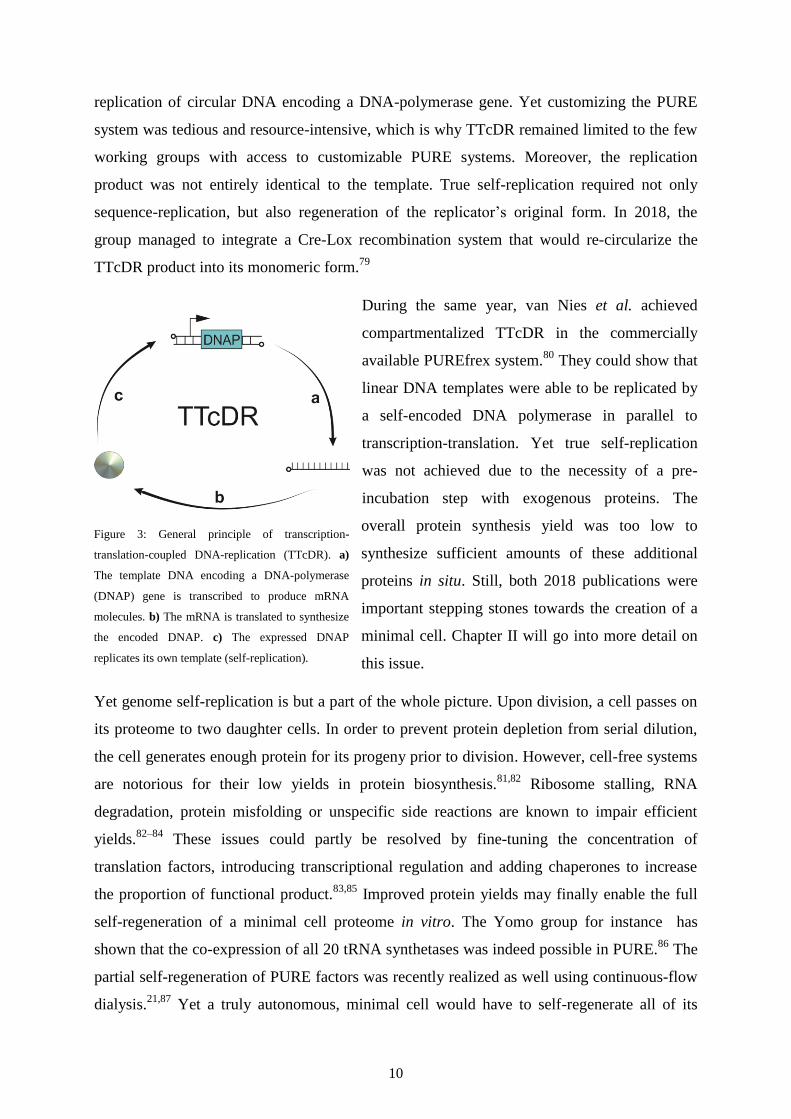
Figure 3: General principle of transcription-
translation-coupled DNA-replication (TTcDR). a)
The template DNA encoding a DNA-polymerase
(DNAP) gene is transcribed to produce mRNA
molecules. b) The mRNA is translated to synthesize
the encoded DNAP. c) The expressed DNAP
replicates its own template (self-replication).

11
components without any non-encoded, exogenous factor such as microfluidic flow-reactors.
This issue will be explored further in chapter III.
Next to DNA and protein, RNA is another crucial component that needs to be regenerated.
Recently, the feasibility of synthesizing all 20 canonical tRNAs was demonstrated in a
reconstituted in vitro system.88
Large parts of the ribosome consist of heavily modified
rRNA. A newly devised method by the Jewett lab, called iSAT (in vitro synthesis, assembly
and translation of ribosomes),89
could be utilized in order to replicate ribosomes in a minimal
cell. Even though iSAT was not based on PURE initially, a novel ribosome was recently
evolved to implement iSAT in PURE.90
This new development was tested in this study, the
results of which are presented in chapter IV.
Following the definition of Gánti’s chemoton,18
the information and metabolism modules
were so far covered by the genome, RNA and the proteome. The remaining module missing
for complete reproduction is the compartment. TTcDR has recently been realized in liposome
compartments, yet these protocells did not display either growth or division features.80
Other
groups have demonstrated that the amplification of DNA was feasible in growing and
dividing lipid vesicles.91
But cellular organelles are not necessarily encapsulated by lipid
membranes. In fact, membrane-less compartments bear significance in many cellular
processes.55,92,93
Recently, biologically relevant functions such as ribozyme catalysis and gene
expression were carried out in these micro-sized droplets.57,58
As an alternative to lipids,
elastin-like peptides or other polymers may be employed to form respectively peptidosomes
or polymersomes.94,95
These compartments show similar self-organizing properties as their
lipid counterparts and can even grow as a result of cell-free gene expression in vesiculo.96
Taken together, there are a number of alternatives to lipid membranes for the encapsulation of
a future minimal cell, yet how would a minimal cell compartmentalize itself to begin with?
Ideally, it should bootstrap and proceed to grow without any external support. However, the
synthesis of membranes requires a considerate amount of energy, limiting their feasibility in a
system already constrained in resources. A simple but efficient alternative to this self-
compartmentalization problem will be presented in chapter V.
Needless to say, a lot of work remains to be done in the pursuit of a minimal cell. This thesis
will touch upon all of these aspects in order to provide a stepping stone for the realization of
the bottom-up approach.
12
I.3 Aim and outline of the thesis
The aim of this work is to set the stage for a publicly available, well-defined TTcDR system
with sufficient synthetic capabilities to regenerate both its genome and its proteome. Ideally, it
would enable the de novo formation of self-encoded ribosomes, cellular compartments and
their subsequent division. This thesis is structured according to a list of initial subjects of
replication (replicons) which is by no means exhaustive. The first chapter revolves around
designing a genome for a DNA self-replicator and finding a suitable environment for TTcDR
to achieve self-replication on the DNA hierarchy layer.
Building on this TTcDR platform, the second chapter will focus on improving the synthetic
capabilities such that the PURE proteome can generate more of its own components. This
chapter aims to establish the self-regeneration of the proteome hierarchy layer.
The third chapter moves beyond DNA and protein towards other replicons. Ribosomes, part
RNA part protein, would need to be synthesized and assembled de novo in replicating cells.
How could the self-replication of ribosomes be facilitated in a well-defined TTcDR system?
The fourth chapter goes into more detail about the topic of self-compartmentalization in
TTcDR systems without the use of resource-intensive membranes. In order to create a
minimal cell, an autonomously self-replicating cytoplasm would have to be encapsulated.
Within this compartment, the replication of genome, proteome and ribosomes must be
integrated into a single platform to enable future minimal cell development.
This is a complex challenge, but it is attempted to at least partially achieve these goals. As the
unknown portion of the minimal M. mycoides genome has shown, even in failure
opportunities for discovery may arise. Similarly, pursuing this task could contribute to other
basic research areas such as the study of transcription-translation, DNA replication and cell-
free protein synthesis.
13
II Genome self-replication
Some of the results presented in this chapter are part of the publication:
Libicher et al., (2020) Nature Communications 97

14
II-1 Introduction
Self-replication of minimal cells necessitates the full reconstitution of transcription,
translation and DNA-replication within the same reaction container. Cell-free protein
synthesis from DNA templates can be implemented in the PURE system,98
which combines
viral, prokaryote and eukaryote enzymes to establish transcription, translation and energy-
regeneration. The PURE system is well-defined and minimalistic in nature, making it an ideal
candidate to form a “kernel” upon which more biological functions could be implemented.
Recently, it was shown that circular dsDNA (double-stranded DNA) replication was feasible
in vitro using the reconstituted E. coli replication machinery.99
Up to 200 kbp were
successfully propagated this way. 25 polypeptides were involved in this replication cycle
rendering it quite resource-intensive considering the weakness of cell-free systems. The
synthesis of these proteins from self-encoded genes might serve as a difficult challenge, since
individual protein levels would have to be finely tuned according to the natural state. In 2012,
the Noireaux group established in vitro DNA-replication from endogenously synthesized
proteins. A transcription-translation-coupled DNA-replication (TTcDR) platform was
developed based on the 40 kbp T7-bacteriophage genome using bacterial S30 extract.100
This
cell-free system exhibited parallel gene expression, DNA replication and virion assembly.
Billions of infectious particles could be generated this way. Still, using bacterial extracts goes
against the principle of the bottom-up approach since they are not well-defined. In an effort to
reconstitute TTcDR in a well-defined system truly from scratch, a system like PURE would
have to be used. Yet strikingly, DNA-replication was not as easily integrated in PURE.
There were several compatibility issues concerning different ingredients of PURE. A
compromise was required sacrificing some of the central dogma’s synthetic capability in
order to draw out more DNA polymerization activity.78
As a consequence of the limited
energy supply, a simpler DNA replication scheme would have to be preferred. Inspired by
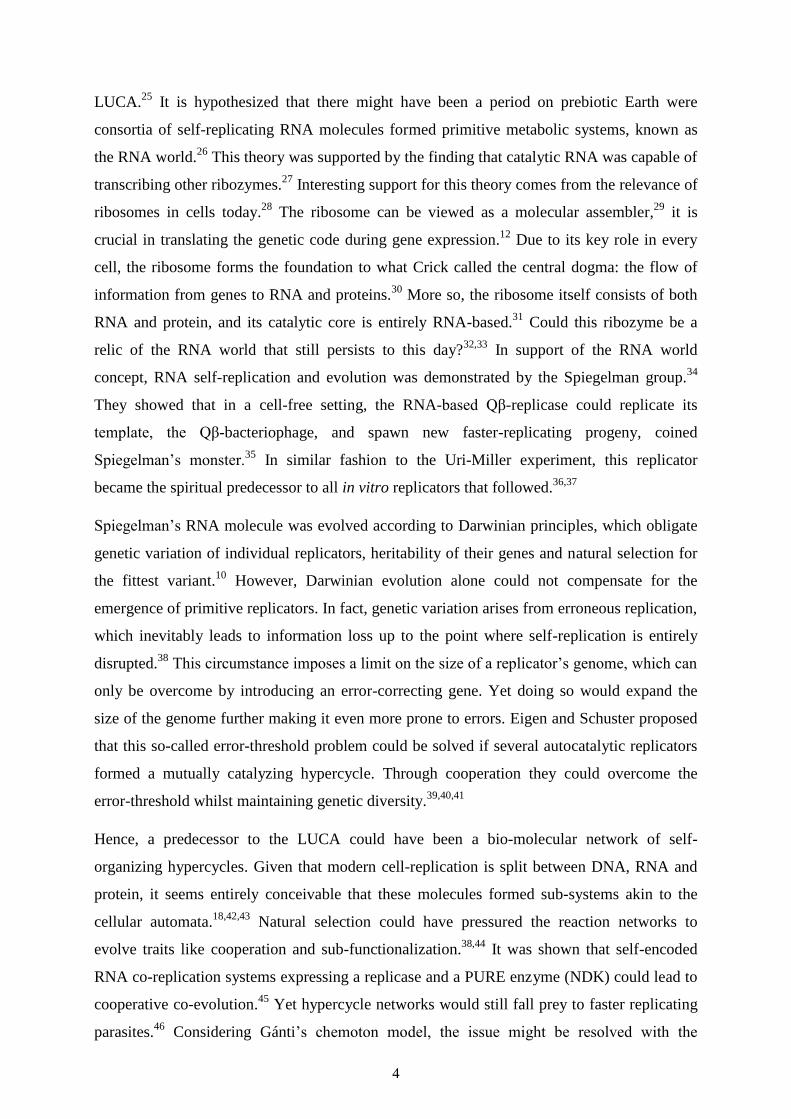
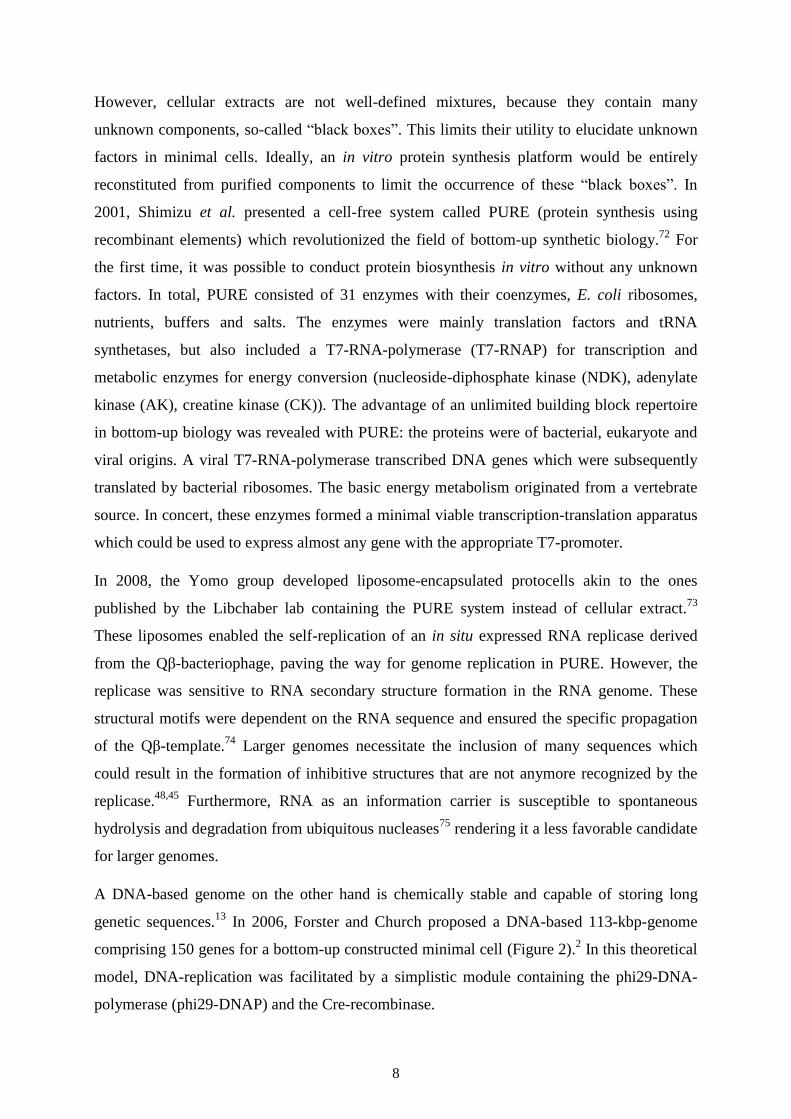
viral DNA replication schemes, rolling-circle-amplification (RCA) was chosen by Forster and
Church for their minimal cell proposal.2 Just recently TTcDR utilizing this replication scheme
was experimentally realized by Sakatani et al. (Figure 4).78,79
The expression of just one
replicase gene has the advantage of leaving enough energy to be consumed for other
functions. The drawback to this solution was a lack of adherence to template form. The
replication products of RCA, so-called concatemers, were strings of concatenated replicons,
much unlike the circular template. This posed a problem for the replication of future
15
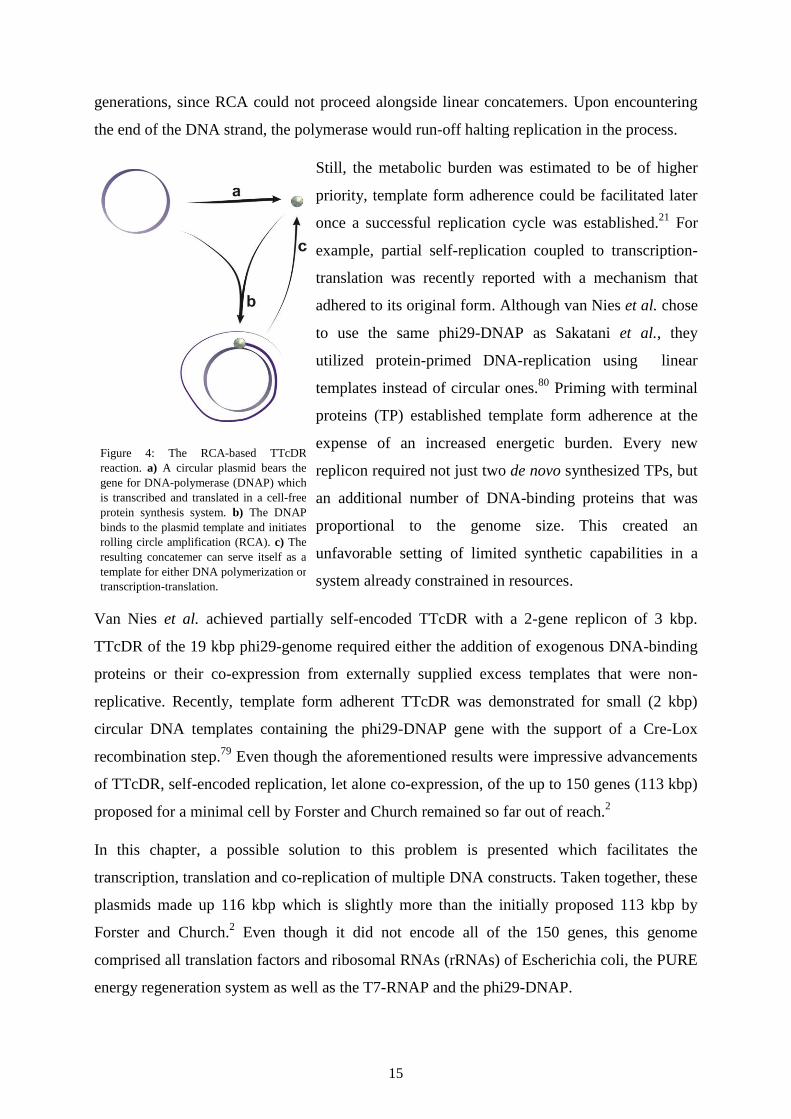
generations, since RCA could not proceed alongside linear concatemers. Upon encountering
the end of the DNA strand, the polymerase would run-off halting replication in the process.
Still, the metabolic burden was estimated to be of higher
priority, template form adherence could be facilitated later
once a successful replication cycle was established.21
For
example, partial self-replication coupled to transcription-
translation was recently reported with a mechanism that
adhered to its original form. Although van Nies et al. chose
to use the same phi29-DNAP as Sakatani et al., they
utilized protein-primed DNA-replication using linear
templates instead of circular ones.80
Priming with terminal
proteins (TP) established template form adherence at the
expense of an increased energetic burden. Every new
replicon required not just two de novo synthesized TPs, but
an additional number of DNA-binding proteins that was
proportional to the genome size. This created an
unfavorable setting of limited synthetic capabilities in a
system already constrained in resources.
Van Nies et al. achieved partially self-encoded TTcDR with a 2-gene replicon of 3 kbp.
TTcDR of the 19 kbp phi29-genome required either the addition of exogenous DNA-binding
proteins or their co-expression from externally supplied excess templates that were non-
replicative. Recently, template form adherent TTcDR was demonstrated for small (2 kbp)
circular DNA templates containing the phi29-DNAP gene with the support of a Cre-Lox
recombination step.79
Even though the aforementioned results were impressive advancements
of TTcDR, self-encoded replication, let alone co-expression, of the up to 150 genes (113 kbp)
proposed for a minimal cell by Forster and Church remained so far out of reach.2
In this chapter, a possible solution to this problem is presented which facilitates the
transcription, translation and co-replication of multiple DNA constructs. Taken together, these
plasmids made up 116 kbp which is slightly more than the initially proposed 113 kbp by
Forster and Church.2 Even though it did not encode all of the 150 genes, this genome
comprised all translation factors and ribosomal RNAs (rRNAs) of Escherichia coli, the PURE
energy regeneration system as well as the T7-RNAP and the phi29-DNAP.
Figure 4: The RCA-based TTcDR
reaction. a) A circular plasmid bears the
gene for DNA-polymerase (DNAP) which
is transcribed and translated in a cell-free
protein synthesis system. b) The DNAP
binds to the plasmid template and initiates
rolling circle amplification (RCA). c) The
resulting concatemer can serve itself as a
template for either DNA polymerization or
transcription-translation.
16
II-2 Transcription-translation-coupled DNA-replication
II-2.1 The replicator plasmid pREP
A minimal genome based on DNA may consist of circular or linear molecules, single-
stranded (ss) or double-stranded (ds), and could be encoded within one molecule or in a set of
molecules akin to a chromosome set. A circular genome was preferred, because it could easily
be replicated using RCA and a single gene, conserving resources in the process.
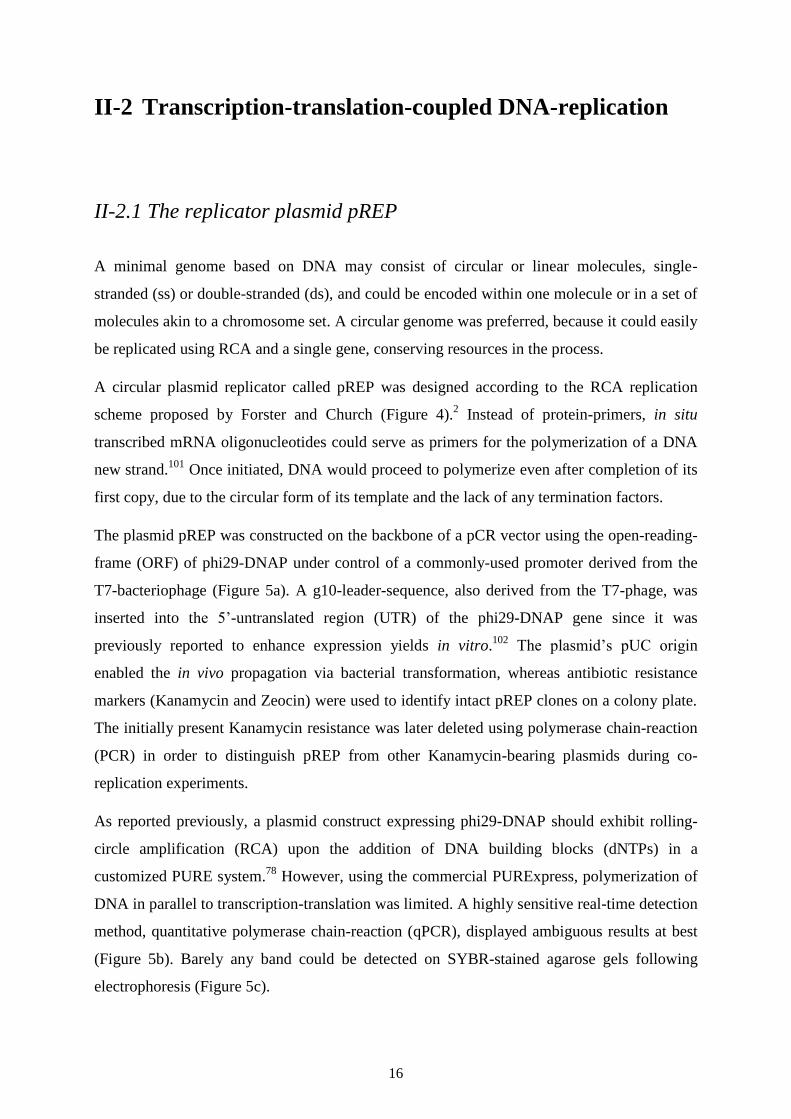
A circular plasmid replicator called pREP was designed according to the RCA replication
scheme proposed by Forster and Church (Figure 4).2 Instead of protein-primers, in situ
transcribed mRNA oligonucleotides could serve as primers for the polymerization of a DNA
new strand.101
Once initiated, DNA would proceed to polymerize even after completion of its
first copy, due to the circular form of its template and the lack of any termination factors.
The plasmid pREP was constructed on the backbone of a pCR vector using the open-reading-
frame (ORF) of phi29-DNAP under control of a commonly-used promoter derived from the
T7-bacteriophage (Figure 5a). A g10-leader-sequence, also derived from the T7-phage, was
inserted into the 5’-untranslated region (UTR) of the phi29-DNAP gene since it was
previously reported to enhance expression yields in vitro.102
The plasmid’s pUC origin
enabled the in vivo propagation via bacterial transformation, whereas antibiotic resistance
markers (Kanamycin and Zeocin) were used to identify intact pREP clones on a colony plate.
The initially present Kanamycin resistance was later deleted using polymerase chain-reaction
(PCR) in order to distinguish pREP from other Kanamycin-bearing plasmids during co-
replication experiments.
As reported previously, a plasmid construct expressing phi29-DNAP should exhibit rolling-
circle amplification (RCA) upon the addition of DNA building blocks (dNTPs) in a
customized PURE system.78
However, using the commercial PURExpress, polymerization of
DNA in parallel to transcription-translation was limited. A highly sensitive real-time detection
method, quantitative polymerase chain-reaction (qPCR), displayed ambiguous results at best
(Figure 5b). Barely any band could be detected on SYBR-stained agarose gels following
electrophoresis (Figure 5c).
17
II.2.2 The TTcDR platform PURErep
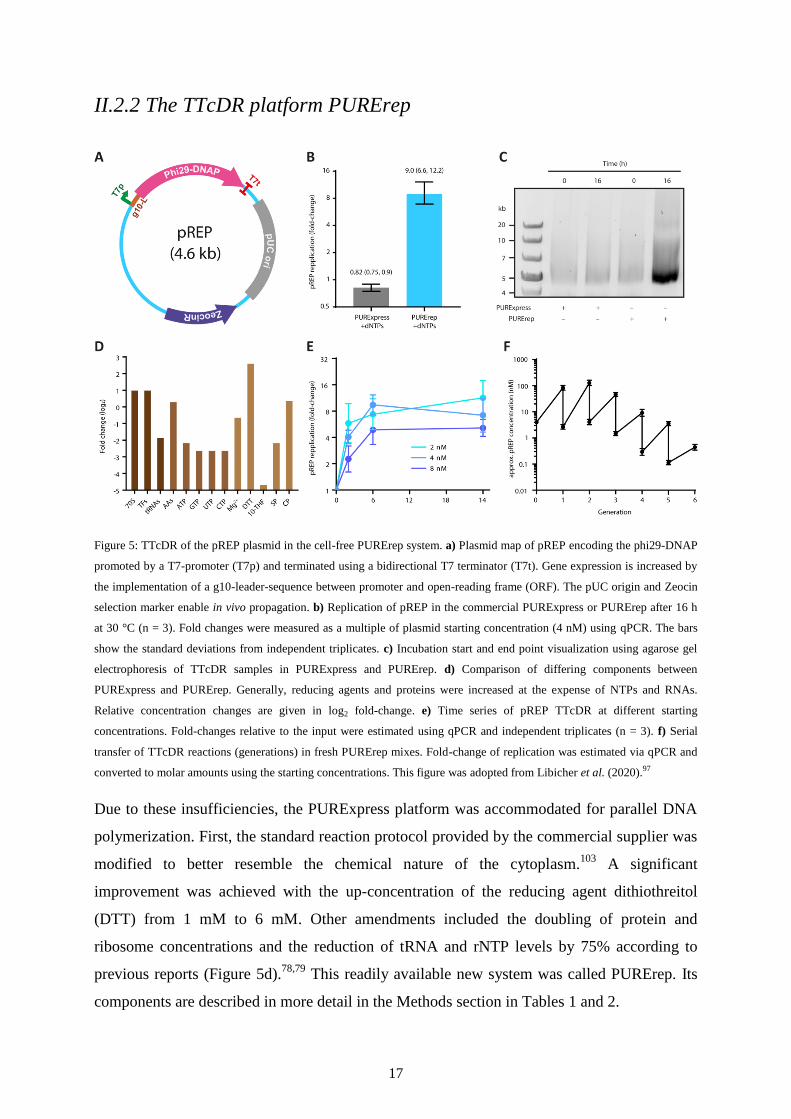
Figure 5: TTcDR of the pREP plasmid in the cell-free PURErep system. a) Plasmid map of pREP encoding the phi29-DNAP
promoted by a T7-promoter (T7p) and terminated using a bidirectional T7 terminator (T7t). Gene expression is increased by
the implementation of a g10-leader-sequence between promoter and open-reading frame (ORF). The pUC origin and Zeocin
selection marker enable in vivo propagation. b) Replication of pREP in the commercial PURExpress or PURErep after 16 h
at 30 °C (n = 3). Fold changes were measured as a multiple of plasmid starting concentration (4 nM) using qPCR. The bars
show the standard deviations from independent triplicates. c) Incubation start and end point visualization using agarose gel
electrophoresis of TTcDR samples in PURExpress and PURErep. d) Comparison of differing components between
PURExpress and PURErep. Generally, reducing agents and proteins were increased at the expense of NTPs and RNAs.
Relative concentration changes are given in log2 fold-change. e) Time series of pREP TTcDR at different starting
concentrations. Fold-changes relative to the input were estimated using qPCR and independent triplicates (n = 3). f) Serial
transfer of TTcDR reactions (generations) in fresh PURErep mixes. Fold-change of replication was estimated via qPCR and
converted to molar amounts using the starting concentrations. This figure was adopted from Libicher et al. (2020).97
Due to these insufficiencies, the PURExpress platform was accommodated for parallel DNA
polymerization. First, the standard reaction protocol provided by the commercial supplier was
modified to better resemble the chemical nature of the cytoplasm.103
A significant
improvement was achieved with the up-concentration of the reducing agent dithiothreitol
(DTT) from 1 mM to 6 mM. Other amendments included the doubling of protein and
ribosome concentrations and the reduction of tRNA and rNTP levels by 75% according to
previous reports (Figure 5d).78,79
This readily available new system was called PURErep. Its
components are described in more detail in the Methods section in Tables 1 and 2.
18
In contrast to the commercial version, PURErep enabled pREP to self-replicate into
concatemers following the expression of the phi29-DNAP gene. This was confirmed by qPCR
and gel electrophoresis following digestion by the Mlu1 restriction enzyme (Figure 5b,c).
Restriction enzymes are commonly used in molecular biology as tools to cut nucleic acids
such as DNA at specific sites. Each enzyme recognizes a specific motif on a target sequence.
This way, a restriction digests of DNA polymers yields sequence-specific band patterns on an
agarose gel. According to the sequence, Mlu1 cuts pREP only at one site. Since the RCA-
product is a concatenated string of pREP copies, cutting with Mlu1 would lead to a split into
monomers the size of pREP (4.6 kbp). This has been confirmed by the monomer band size on
an agarose gel (Figure 5c).
Fold-changes of replication were largely independent of the initial pREP concentrations
(Figure 5e). The doubling time of replication was estimated using real-time qPCR and a
primer pair specific for a sequence in the phi29-DNAP gene (Table 3). Here, only copies of
pREP would serve as templates for qPCR producing a fluorescent signal in the process. The
more pREP was present in the sample, the earlier the fluorescence would cross the noise
threshold. This way, the amount of pREP copies could be estimated relative to the initial
starting concentrations. Regardless of the input level, pREP exhibited a doubling time
between one and two hours at 30 °C incubation temperature.
An important hallmark of cells is their replication over multiple generation cycles. How could
the continuous growth and division of cells be efficiently mimicked in cell-free systems? A
simple way of emulating the effects of cellular division is serial dilution, where an aliquot of
the reaction is transferred into a new mixture containing fresh substrates that have been
consumed during self-replication.104,105
Serial dilution has previously been employed to
elucidate the behavior and evolution of other replicators in vitro.25,47,106,107
Similarly, pREP
was observed to replicate over five rounds of serial dilution, with each round representing one
generation (Figure 5f). However, replication yields decreased continuously after generation 2.
In an ideal scenario, this yield would remain constant over any number of generations. The
ability to propagate over several generations will inevitably become important later on during
the construction of a minimal cell.
19
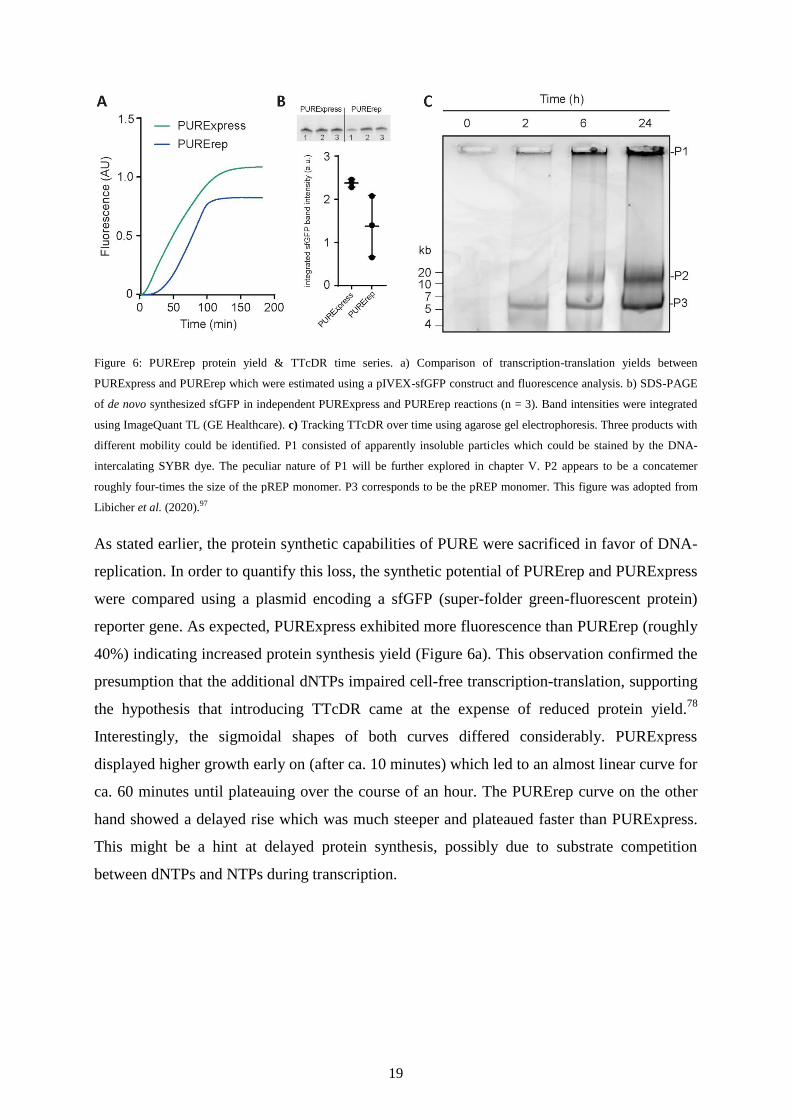
Figure 6: PURErep protein yield & TTcDR time series. a) Comparison of transcription-translation yields between
PURExpress and PURErep which were estimated using a pIVEX-sfGFP construct and fluorescence analysis. b) SDS-PAGE
of de novo synthesized sfGFP in independent PURExpress and PURErep reactions (n = 3). Band intensities were integrated
using ImageQuant TL (GE Healthcare). c) Tracking TTcDR over time using agarose gel electrophoresis. Three products with
different mobility could be identified. P1 consisted of apparently insoluble particles which could be stained by the DNA-
intercalating SYBR dye. The peculiar nature of P1 will be further explored in chapter V. P2 appears to be a concatemer
roughly four-times the size of the pREP monomer. P3 corresponds to be the pREP monomer. This figure was adopted from
Libicher et al. (2020).97
As stated earlier, the protein synthetic capabilities of PURE were sacrificed in favor of DNA-
replication. In order to quantify this loss, the synthetic potential of PURErep and PURExpress
were compared using a plasmid encoding a sfGFP (super-folder green-fluorescent protein)
reporter gene. As expected, PURExpress exhibited more fluorescence than PURErep (roughly
40%) indicating increased protein synthesis yield (Figure 6a). This observation confirmed the
presumption that the additional dNTPs impaired cell-free transcription-translation, supporting
the hypothesis that introducing TTcDR came at the expense of reduced protein yield.78
Interestingly, the sigmoidal shapes of both curves differed considerably. PURExpress
displayed higher growth early on (after ca. 10 minutes) which led to an almost linear curve for
ca. 60 minutes until plateauing over the course of an hour. The PURErep curve on the other
hand showed a delayed rise which was much steeper and plateaued faster than PURExpress.
This might be a hint at delayed protein synthesis, possibly due to substrate competition
between dNTPs and NTPs during transcription.
20
II.2.3 Concatemer processing
When submitted to agarose gels, unprocessed DNA replication samples displayed bands with
low electrophoretic mobility, as expected for high molecular weight concatemers. In addition,
the gel pockets of post-replication samples were consistently filled with SYBR-stained
particles (Figure 6c). The intercalation of SYBR indicated the presence of RNA or DNA, yet
none of these particles were able to migrate into the gel matrix. The high-weight bands
indicated the production of tetrameric or pentameric concatemers, which were 4- to 5-times
the monomer size of 4.6 kbp. Unexpectedly, the monomer band was amplified just as well
over the course of TTcDR. If monomeric copies were indeed produced during TTcDR, then
the replication scheme could not follow the RCA mechanism as depicted in Figure 4 alone.
The exact course of replication should be subject of more detailed studies in the future.101
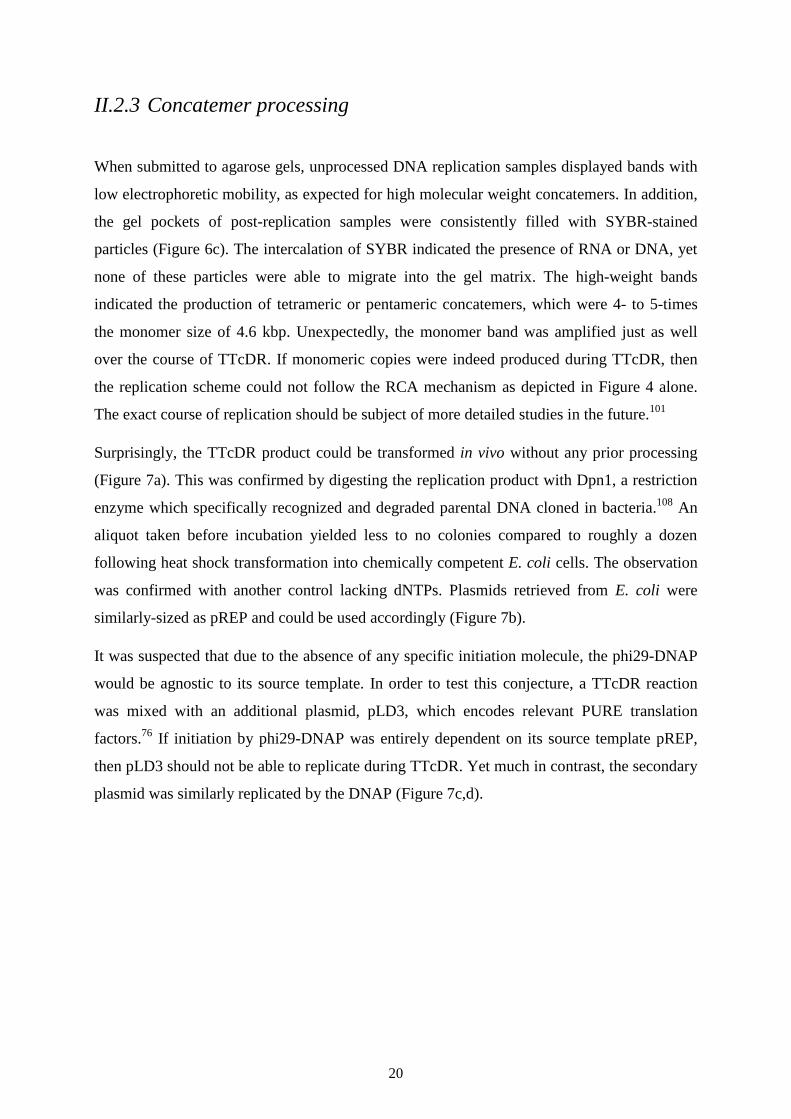
Surprisingly, the TTcDR product could be transformed in vivo without any prior processing
(Figure 7a). This was confirmed by digesting the replication product with Dpn1, a restriction
enzyme which specifically recognized and degraded parental DNA cloned in bacteria.108
An
aliquot taken before incubation yielded less to no colonies compared to roughly a dozen
following heat shock transformation into chemically competent E. coli cells. The observation
was confirmed with another control lacking dNTPs. Plasmids retrieved from E. coli were
similarly-sized as pREP and could be used accordingly (Figure 7b).
It was suspected that due to the absence of any specific initiation molecule, the phi29-DNAP
would be agnostic to its source template. In order to test this conjecture, a TTcDR reaction
was mixed with an additional plasmid, pLD3, which encodes relevant PURE translation
factors.76
If initiation by phi29-DNAP was entirely dependent on its source template pREP,
then pLD3 should not be able to replicate during TTcDR. Yet much in contrast, the secondary
plasmid was similarly replicated by the DNAP (Figure 7c,d).
21
Figure 7: pREP in vivo shuttling. a) Observed colonies on Zeocin-LB agar plates following transformation of TTcDR
products. b) The transformed plasmids could be retrieved from bacterial colonies. Agarose gel electrophoresis revealed them
to be clones of pREP. c) The plasmid pLD3 was co-replicated alongside pREP, as indicated by submitting transformants to
an antibiotic medium selective for pLD3 (Kanamycin). d) Restriction digest analysis using Mlu1 revealed that the cloned
plasmids from the respective plates in c) were indeed pREP and pLD3. This figure was adopted from Libicher et al. (2020).97
22
II-3 Co-replication
A minimal cell would require more than one gene to be viable. A genome the size of at least
113 kb was proposed to be necessary for that purpose.2 However, large plasmids of this length
were reported to be unstable in vivo.76
For long sequences bacterial artificial chromosomes
(BACs)109
or their yeast variants110
are typically employed. Alternatively, the minimal
genome could be encoded over multiple smaller plasmids.
Inspired by the co-replication results in the previous chapter (Figure 7c,d), a genome was
assembled from several plasmids with the aim of co-replicating them alongside pREP during
TTcDR. The genome was expanded using genes encoding the E. coli translation factors due to
their relevance in PURE and in the Forster and Church proposal.2 The corresponding genes
were encoded by three plasmids called pLD1, pLD2 and pLD3 – a generous gift from the
Forster group.76
Taken together, these plasmids consisted of 73 kbp encoding 30 T7-promoted
genes, which comprised all 20 tRNA synthetases, a methyl-transferase for translation
initiation and all initiation, elongation and release factors except for EF-tu.
Following TTcDR incubation with pREP, replication products were gel-purified, digested
with Mlu1 and Dpn1, and then loaded on a final agarose gel for analysis. The restriction
patterns corresponded to the bands of plasmids cloned in vivo confirming successful co-
replication (Figure 8a,b). Similarly to the results in Figure 7, the co-replication products could
further be cloned in E. coli on antibiotic plates to yield plasmids with the corresponding
resistance markers (Kanamycin for the pLDs, Zeocin for pREP).
In total, this genome comprised ca. 78 kbp. In order to test whether replicating the 113 kbp
proposed for a minimal cell was also possible in PURErep, the genome was expanded further.
The plasmid pRibo included the native ribosomal operon rrnB from E. coli encoding all three
ribosomal RNAs.111,112
The plasmid pEF-tu encoded the last remaining translation factor that
was missing in the pLDs, EF-tu. Respective replication products were quantified with specific
primers using qPCR (Table 3). The amplification curves revealed that although individual
yields of replication were reduced, especially for pREP, the genome was overall replicated
(Figure 8c). The observation was again confirmed by the restriction patterns of the plasmids
prepared from transformed E. coli. Virtually no colonies were observed for control reactions
lacking dNTPs (Figure 8d,e).
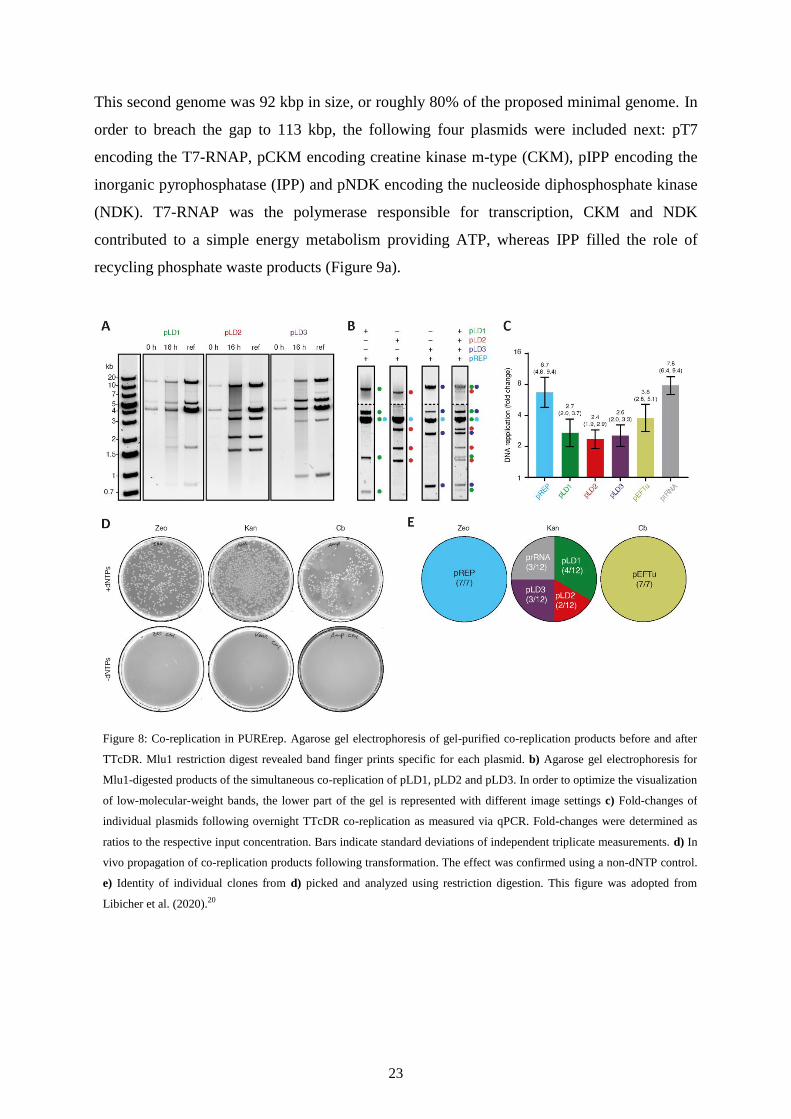
23
This second genome was 92 kbp in size, or roughly 80% of the proposed minimal genome. In
order to breach the gap to 113 kbp, the following four plasmids were included next: pT7
encoding the T7-RNAP, pCKM encoding creatine kinase m-type (CKM), pIPP encoding the
inorganic pyrophosphatase (IPP) and pNDK encoding the nucleoside diphosphosphate kinase
(NDK). T7-RNAP was the polymerase responsible for transcription, CKM and NDK
contributed to a simple energy metabolism providing ATP, whereas IPP filled the role of
recycling phosphate waste products (Figure 9a).
Figure 8: Co-replication in PURErep. Agarose gel electrophoresis of gel-purified co-replication products before and after
TTcDR. Mlu1 restriction digest revealed band finger prints specific for each plasmid. b) Agarose gel electrophoresis for
Mlu1-digested products of the simultaneous co-replication of pLD1, pLD2 and pLD3. In order to optimize the visualization
of low-molecular-weight bands, the lower part of the gel is represented with different image settings c) Fold-changes of
individual plasmids following overnight TTcDR co-replication as measured via qPCR. Fold-changes were determined as
ratios to the respective input concentration. Bars indicate standard deviations of independent triplicate measurements. d) In
vivo propagation of co-replication products following transformation. The effect was confirmed using a non-dNTP control.
e) Identity of individual clones from d) picked and analyzed using restriction digestion. This figure was adopted from
Libicher et al. (2020).20
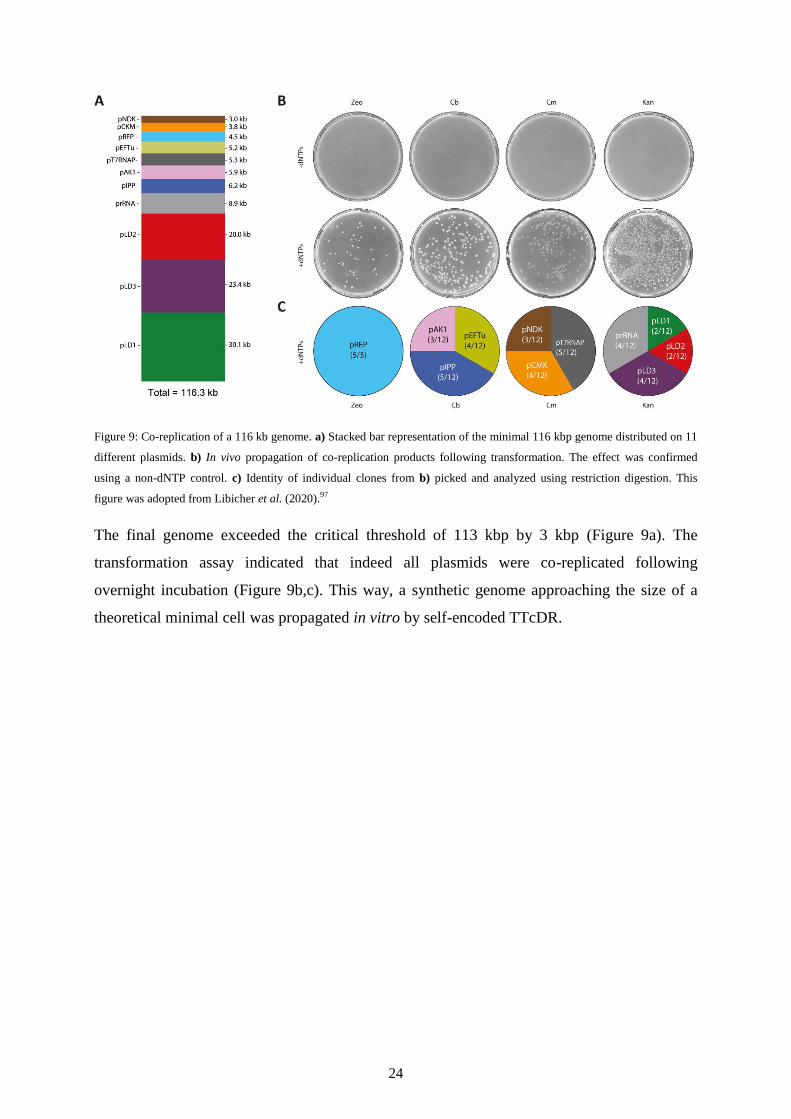
24
Figure 9: Co-replication of a 116 kb genome. a) Stacked bar representation of the minimal 116 kbp genome distributed on 11
different plasmids. b) In vivo propagation of co-replication products following transformation. The effect was confirmed
using a non-dNTP control. c) Identity of individual clones from b) picked and analyzed using restriction digestion. This
figure was adopted from Libicher et al. (2020).97
The final genome exceeded the critical threshold of 113 kbp by 3 kbp (Figure 9a). The
transformation assay indicated that indeed all plasmids were co-replicated following
overnight incubation (Figure 9b,c). This way, a synthetic genome approaching the size of a
theoretical minimal cell was propagated in vitro by self-encoded TTcDR.
25
II-4 Discussion
This chapter illustrated that it was possible for in vitro transcription-translation systems to
permit parallel DNA-polymerization. Large, synthetic genomes approaching the size of a
proposed minimal cell were capable of self-replication under the conditions described herein.
The reaction was not limited to DNA synthesis; gene expression took place simultaneously
with a moderate loss of yield (Figure 6a). Its modularity and broad availability makes the
PURErep a platform fit for further minimal cell prototypes.
The sequence space of the 116 kb genome presented in this chapter (Figure 9a) was mostly
filled by inactive sequences. It contained just 26% of the genes proposed by Forster and
Church.2 In the future, this essentially blank sequence space could be filled with the
remaining 110 genes of the proposal or other regulatory sequences. Essential genes such as
those encoding ribosomal proteins, metabolic enzymes and tRNAs are still missing from the
genome but are crucial for cellular viability.
The multipartite genome presented in this chapter could already be compared to the genome
of a naturally living organism introduced in the beginning of this thesis: the endosymbiont
N. deltocephalinicola.64
Both are similar in size (116 kbp vs 112 kbp) and both encode all the
translation factors, an rRNA operon, an RNA-polymerase and a DNA-polymerase. The
genome of N. deltocephalinicola further encompasses ca. 100 more protein-coding genes and
a set of 29 tRNA genes. Still, N. deltocephalinicola is incapable of sustaining itself on its
own. The symbiont’s survival largely depends on the host and the resources it provides,
illustrating how far autonomous self-replication is still out of reach for the much smaller
pREP-based genome presented in this chapter.
In contrast to the symbiotic relationship between N. deltocephalinicola and its host, the
plasmid pREP was more reminiscent of a parasitic virus. It exploited the resources provided
in PURErep to uncontrollably replicate itself. The serial dilution of pREP (Figure 5f)
suggested that Darwinian evolution akin to Spiegelman’s experiments might not be out of
reach, yet it clearly expressed current limitations.113,114
Despite exhibiting strong replication in
the first round, the copy number of subsequent generations was quickly depleted. The
formation of inhibitive side products or non-replicative sequences could explain this
observation, yet remains to be tested.
26
Using an efficient DNAP with a strong affinity for DNA binding replaced the need for a
helicase or other DNA-binding proteins, which in turn increased the synthetic potential of the
cell-free system. In contrast to the linear TTcDR model of van Nies et al.,80
neither DNA-
binding proteins nor additional enzymes were needed in order to assist in replication. This
came at the expense of template form adherence, where long replicative concatemers were
produced instead of circular plasmid copies. However, using just a single-gene for DNA
replication opens the opportunity for other more resource-intensive processes to take place in
parallel. Recent work has further shown that concatemer resolution might not be much of an
issue for the in vitro propagation of RCA-based replicators.79
Indeed, monomeric plasmids
could easily be restored after bacterial transformation, presumably by in vivo homologous
recombination.97,115,116
Over the course of TTcDR, monomer-sized sequences were amplified just as well as
concatemers (Figure 6c), an observation which contradicted the general principle of RCA
(Figure 4). Okauchi et al. recently postulated a scheme, called repetitive sequence replication
(RSR), to explain the in vitro amplification of DNA by phi29-DNAP without exogenous
primers.101
With RSR, any DNA template could be continuously replicated as long as it
contained at least two repetitive motifs. The occurrence of shifted DNA hybridization
positions during replication would lead to an incremental shortening of template sequences.
Indeed, this mechanism would not only explain the amplification of monomer-sized replicons
in Figure 6c, but also the observed copy number decline during serial dilution (Figure 5f).
In order to enhance replication yields, the sequence of pREP could be further evolved in vitro.
For example, so-called mutagenesis strains such as XL1-red (Agilent) could be transformed
with the replicator plasmid, whereas selection pressures could be facilitated with
modifications to either in vivo or in vitro conditions. However, a common issue with in vitro
evolution experiments like these is the emergence of replicative parasites.48
These are
replicative mutants which have lost their ability to contribute functional replicases. In the case
of pREP, this might be a plasmid encoding a defunct version of phi29-DNAP. Despite their
lack of a functional gene, these parasites may still be replicated exploiting replicases produced
by other replicators. In the worst case, the parasite would replicate faster than the replicator
leading to the collapse of the system. One solution for this issue is compartmentalization.
Creating physical boundaries between replicators prevents parasitic replicons from exploiting
other replicases, thus avoiding the eventual demise of the evolving population of self-
replicators.48,49
27
Using compartmentalization, the replication yield of phi29-based TTcDR was recently
enhanced using a novel mutant of phi29-DNAP with significantly higher RCA activity.117
The
mutation, originating from just two base changes near the end of the coding region, was
discovered as a result of directed evolution. In analogy to the evolutionary optimization
algorithm, directed evolution explores the local fitness landscape via iterations of variation
and selection to find an optimal fit for the genetic sequence.10,118
Similarly, the evolution of other genes-of-interest (GOI) could be facilitated using the pREP
system. In order to circumvent the emergence of parasites, the replicator could be
encapsulated in surfactant-stabilized water-in-oil emulsions.119
After TTcDR, this emulsion
could be broken to pool the replication products. The better the performance of the GOI, the
greater will be its contribution to the subsequent progeny. The gene pool could further be
transformed in a mutagenesis strain such as XL1-red to both amplify and diversify the library
for the next round of selection.
Regulating the expression of phi29-DNAP may further offer the opportunity to implement the
directed evolution of genes akin to phage-assisted continuous evolution (PACE).120
To
illustrate, let there be a plasmid encoding a T7-promoted gene-of-interest (GOI) and a
regulated phi29-DNAP in PURErep that can replicate only upon DNAP expression. If the
function of GOI is coupled to the initiation of phi29-DNAP transcription, the GOI could be
evolved according to Darwinian principles. For example, the GOI could be an operator for the
phi29-DNAP gene that activates its expression upon binding a secondary compound.
Therefore, the GOI could be evolved towards becoming an optimized sensor for this
respective compound. The GOI could be further diversified into a variant library using error-
prone PCR, synthetic codon libraries or similar methods.121–123
Another way devised for the rapid evolution of proteins or other gene functions could be a
method coined “Molecular Colony Display”. Here, an initial library containing a GOI would
be subjected to TTcDR using pREP and PURErep. Mutagenesis in replication products could
be introduced using manganese ions similar to error-prone PCR.121
After incubation,
replication products would be transformed and plated on LB agar plates containing an
antibiotic specific for the construct bearing the GOI. Other substrates could be added to the
medium in order to apply a selection pressure or to help screening the candidate colonies for a
specific function. Screening conditions could be fluorescence, substrate digestion or
compound production. The most promising candidates would be purified and subjected to
another round of TTcDR to repeat the cycle.
28
Another issue faced by synthetic biologists is the time it takes prototyping novel genetic parts.
Commercially ordered, linearized genes typically come in fairly low amounts. Before using
them for cell-free protein synthesis, these DNA parts would have to be amplified via PCR or
other cloning methods. Instead, TTcDR in PURErep could be used to amplify minuscule
template amounts in situ to rapidly create sufficient material for higher protein yields in
subsequent transcription-translation reactions.
The propagation of cells is not solely confined to DNA, other replicons such as proteins,
ribosomes and compartments would have to be replicated as well. The self-replication of
genes differs from the reproduction of proteins, which comprise a bulk of the cellular biomass
and are already present in large copy numbers. Rather than creating a single copy of each
protein species, sufficient protein molecules of a single species would have to be generated.
The absolute number of replicated proteins is not so crucial as long as enough material was
generated. Therefore, the term ‘self-regeneration’ would be more fit than self-replication in
the protein context. After having successfully demonstrated TTcDR in vitro, the next step
would be full proteome self-regeneration, which will be presented in the following chapter.
29
II-5 Methods
Applying to all chapters
Sterile filter tips were used for all pipetting procedures. If not stated otherwise, ProFlex
thermal cyclers (Applied Biosystems) were used for all incubation steps. DNA bands were
analyzed using 1x TAE (tris-acetate-EDTA) agarose gels stained with SYBR-safe (Thermo
Fisher). DNA concentrations were obtained from NanoDrop One-c (Thermo Scientific)
measurements. All cloning steps were conducted with either chemically competent (DH5-
alpha or Top10) or electrically competent (10-beta or Top10) E. coli cells using a shaking
incubator from Eppendorf. Polymerase chain reactions (PCR) were performed using the Q5
master mix from NEB.
Plasmid construction
Primers used in this study are listed in Table 3. All oligonucleotides have been ordered from
either Eurofins or Integrated DNA Technologies (IDT). Larger dsDNA parts have been
ordered from IDT as so-called “gblocks”. Plasmids were ordered as bacterial agar stabs from
the Addgene online repository. Construct identities were verified with sequencing by either
Eurofins Genomics or Seqlab (Microsynth).
The plasmid pREP was constructed on the basis of the phi29-DNAP ORF (Gene ID:
6446511) which was ordered as a gblock flanked by 5’ and 3’ UTRs containing a ribosome-
binding-site (RBS) and a bidirectional transcription terminator respectively. The synthetic
gene was integrated with a pCR-blunt backbone using the ZeroBlunt Cloning kit by Thermo
Fisher. This vector already contained a pUC origin for in vivo propagation, Zeocin and
Kanamycin resistance markers, and a T7 promoter. The Kanamycin resistance was later
excised using PCR. The initial 5’-UTR of the phi29-DNAP gene was later replaced with a
g10-leader sequence using site-directed mutagenesis PCR.
The plasmids pLD1, pLD2 and pLD3 were a generous gift from the Forster lab (Uppsala
University).76
The plasmids were observed to be unstable even when stored in buffer at -
20 °C. In order to assure sample quality, individual clones were digested using FD-Mlu1
(Thermo Fisher) to yield characteristic restriction patterns which were subsequently analyzed
by agarose gel electrophoresis. Issues with transformation were also common with the pLD
plasmids. Extra care was therefore taken when handling the tubes (for example no vigorous
30
shaking) and during transformation. The pLD plasmid stocks were purified from electro-
competent transformants using the Macherey-Nagel MaxiPrep kit following the
manufacturer’s instructions. Also here, plasmid quality had to be ensured beforehand,
presumably due to recombination-activity during in vivo incubation.
The pIVEX2.3d-sfGFP plasmid was a gift from the Schwille lab (MPI of Biochemistry).
The plasmid pEF-tu was constructed using the Gibson Assembly method.124
For this purpose,
the HiFi kit by NEB was used with linear dsDNA parts containing the genes for EF-tu and IF1
and a pIVEX2.3d backbone cloned from the pIVEX2.3d-sfGFP plasmid. A first intermediate
of pEF-tu was assembled from an IF1-fragment and the pIVEX backbone using overhang
PCR. This intermediate was linearized and assembled with two other linear PCR products
containing the EF-tu gene and a spacer region respectively to form the final plasmid.
The plasmid pRibo was constructed similarly to pREP using the ZeroBlunt Cloning kit
(Thermo Fisher). Specifically, the ribosomal RNA operon rrnB (containing tRNA genes) was
cloned from Top10 E. coli using colony PCR. The linear product was subsequently ligated to
the pCR-backbone according to the manufacturer’s instructions.
The plasmids pT7 (ID:124138), pNDK (ID:124136), pIPP (ID:118978), pAK (ID:118977)
and pCKM (ID:124134) were ordered from Addgene. The Ampicillin resistance genes of
pT7, pNDK and pCKM were excised via PCR to yield plasmids bearing Chloramphenicol
resistance only.
All plasmids used in this chapter are listed in Table 4.
Fluorescence detection of expression products
Gene expression yields between PURErep and PURExpress (NEB) were compared by
detecting the fluorescence of sfGFP encoded on the plasmid pIVEX2.3d-sfGFP. PURExpress
reactions were mixed according to the manufacturer’s instructions. 25 µL PURErep reactions
were assembled from 2.5 µL 10x energy mix (10xEM, Table 1), 1 µL solution A
(PURExpress, NEB), 15 µL solution B (PURExpress, NEB) or enzyme mix (Table 2), 0.6 µL
25 mM equimolar dNTP, 0.5 µL rNTP mix (18.75 mM ATP, 12.5 mM GTP, 6.25 mM UTP,
6.25 mM CTP). Volumes were adjusted using ultra-pure ddH2O.
31
Both reactions were initiated by the addition of 150 ng pIVEX2.3d-sfGFP plasmid and
incubation for 2 h at 37 °C. A StepOne Real-Time PCR system (Thermo Fisher) was used to
track fluorescence during incubation.
Alternatively, samples were analyzed using SDS-polyacrylamide gel electrophoresis (SDS-
PAGE) to detect fluorescent bands. For this purpose, the transcription-translation reactions
were mixed with 2xSDS loading buffer after expression and incubated for 5 min at only 55 °C
in order to retain fluorescence. Samples were subsequently run on 12% polyacrylamide gels
and visualized using a Typhoon FLA 7000 (GE Healthcare Life Sciences). Band intensities
were quantified using ImageQuant by GE Healthcare Life Sciences.
In order to assess the expression of proteins not fluorescent in their native states, FluoroTect
GreenLys (Promega) was used to label products with fluorescent lysine residues according to
the manufacturer’s instructions. Similarly to sfGFP, samples could be analyzed after SDS-
PAGE on a Typhoon FLA 7000 (GE Healthcare Life Sciences). Prior to SDS loading buffer
incubation, samples were digested with RNase cocktail (Thermo Fisher Scientific) to avoid
excess fluorescence from charged GreenLys-tRNAs.
Transcription-translation-coupled DNA replication (TTcDR)
A 25 µL TTcDR reaction was setup using 2.5 µL 10x energy mix (10xEM, Table 1), 1 µL
solution A (PURExpress, NEB), 15 µL solution B (PURExpress, NEB) or enzyme mix (Table
2), 0.6 µL 25 mM equimolar dNTP, 0.5 µL rNTP mix (18.75 mM ATP, 12.5 mM GTP, 6.25
mM UTP / CTP), 4 to 8 nM pREP and other optional plasmids at 0.5 to 2 nM as specified in
the main text. Volumes were adjusted using ddH2O. Reactions were incubated at 30 °C
overnight. Prior to incubation, time point zero (T0) samples were flash-frozen and stored at
minus 80 °C.
TTcDR replicon analysis
After incubation, crude TTcDR samples could be analyzed directly on agarose gels. Doing so
revealed that a portion of the product remained in the gel pocket, presumably due to the
formation of solid or gel-like side products. As a consequence, samples were digested using
FD-Mlu1 (Thermo Fisher) according to the manufacturer's instructions when distinct bands
were required.
32
Co-replication products were analyzed similarly. Yet prior to analytical gel electrophoresis,
samples were processed and gel purified. First, TTcDR samples were digested overnight at
37 °C using 1 µL RNAse cocktail (Thermo Fisher) and 1 mg/ml Proteinase K (NEB).
Subsequently, the mixture was purified by excision of the 20-30 kbp bands from a 0.8 %
agarose gel after electrophoresis using the Zymoclean Large DNA Fragment Extraction Kit
(Zymo Research). Purified products were digested with FD-Mlu1 to yield characteristic
restriction patterns that could be analyzed via 1% agarose gel electrophoresis.
TTcDR replicon quantification
Replicon copy numbers were quantified relative to starting amounts (T0) using the qPCR
method. An aliquot of the post-incubation TTcDR mixture was diluted 4000-fold in ddH2O
and added to a qPCR reaction containing the Luna Universal Mix (NEB) and specific primers
(80,000 final dilution) according to the manufacturer’s instructions. Real-time fluorescence
data was tracked using a StepOne Real-Time PCR system (Thermo Fisher). The fold change f
at time point t was calculated using the PCR efficiency E and the difference between qPCR
cycle thresholds ∆Cq(t):
𝑓(𝑡) = 𝐸∆𝐶𝑞(𝑡)
∆Cq(t) was obtained by subtracting the cycle threshold Cq(t) of a post-incubation sample from
its T0 cycle threshold Cq(t=0). Values for E and Cq were determined as averages from replicate
experiments using the program LinRegPCR (Version 2018.0).125
Upper and lower confidence
intervals were estimated using standard deviations of measured Cq(t) values.
TTcDR transformation assay
TTcDR products could be propagated in vivo using electro-competent E. coli cells (10-
beta, NEB). First, samples were incubated with methylation-specific FD-Dpn1 (Thermo
Fisher) for at least 1 h at 37 °C. Depending on the number of plasmids, incubation could be
extended up to 16 h overnight. Transformed cells were selected using the appropriate
antibiotic-infused LB-agar plates. Clones were purified from individual colonies using the
Macherey-Nagel Nucleospin MiniPrep kit following the manufacturer’s instructions. Plasmids
were identified using restriction digestion patterns following agarose gel electrophoresis.
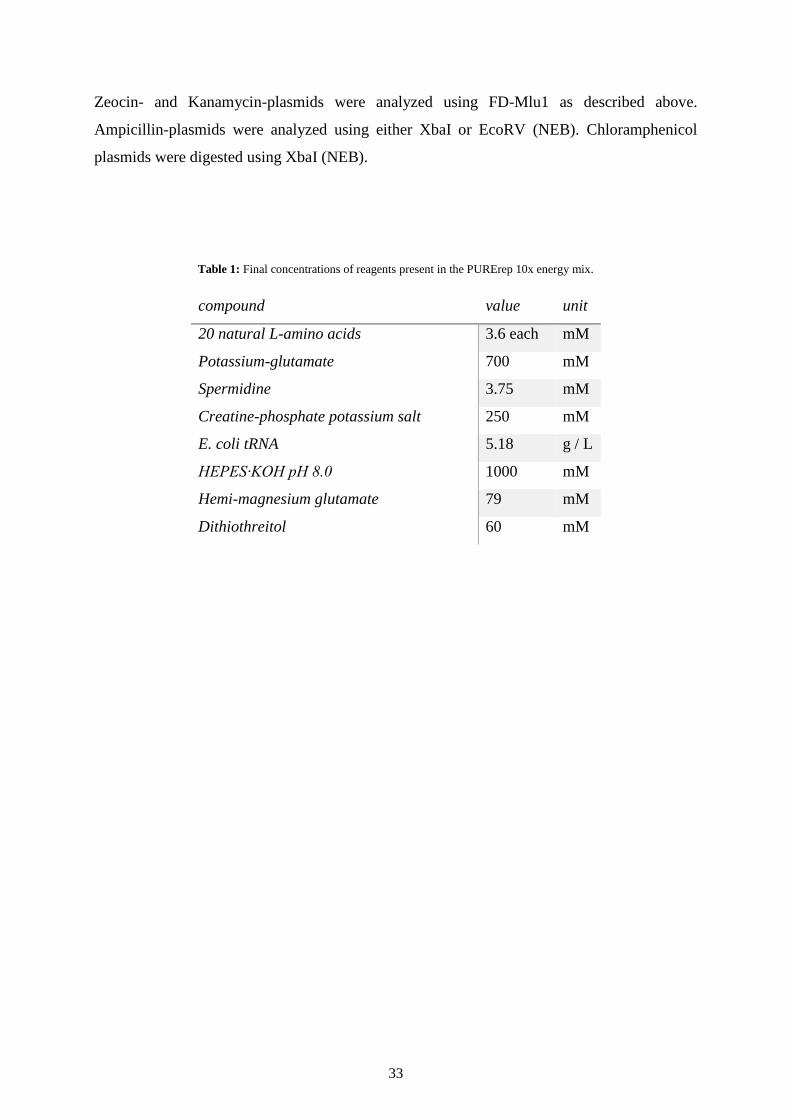
33
Zeocin- and Kanamycin-plasmids were analyzed using FD-Mlu1 as described above.
Ampicillin-plasmids were analyzed using either XbaI or EcoRV (NEB). Chloramphenicol
plasmids were digested using XbaI (NEB).
Table 1: Final concentrations of reagents present in the PURErep 10x energy mix.
compound value unit
20 natural L-amino acids 3.6 each mM
Potassium-glutamate 700 mM
Spermidine 3.75 mM
Creatine-phosphate potassium salt 250 mM
E. coli tRNA 5.18 g / L
HEPES∙KOH pH 8.0 1000 mM
Hemi-magnesium glutamate 79 mM
Dithiothreitol 60 mM
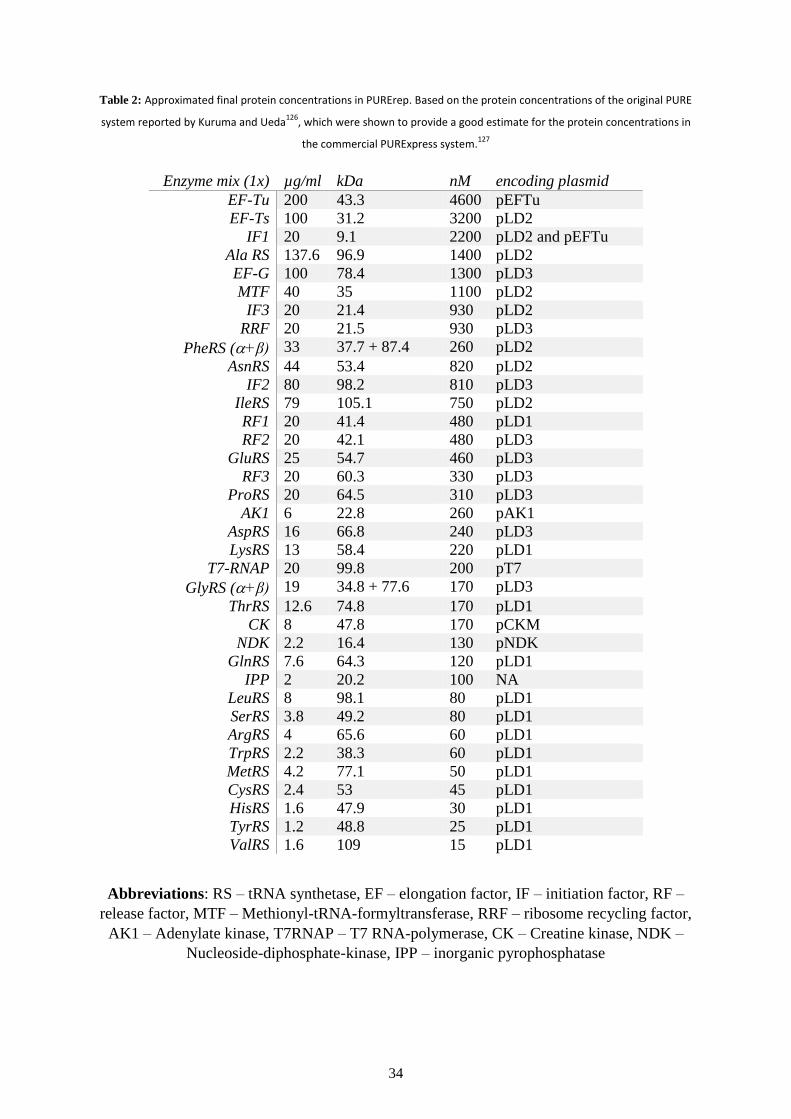
34
Table 2: Approximated final protein concentrations in PURErep. Based on the protein concentrations of the original PURE
system reported by Kuruma and Ueda126
, which were shown to provide a good estimate for the protein concentrations in
the commercial PURExpress system.127
Enzyme mix (1x) µg/ml kDa nM encoding plasmid
EF-Tu 200 43.3 4600 pEFTu
EF-Ts 100 31.2 3200 pLD2
IF1 20 9.1 2200 pLD2 and pEFTu
Ala RS 137.6 96.9 1400 pLD2
EF-G 100 78.4 1300 pLD3
MTF 40 35 1100 pLD2
IF3 20 21.4 930 pLD2
RRF 20 21.5 930 pLD3
PheRS (+β) 33 37.7 + 87.4 260 pLD2
AsnRS 44 53.4 820 pLD2
IF2 80 98.2 810 pLD3
IleRS 79 105.1 750 pLD2
RF1 20 41.4 480 pLD1
RF2 20 42.1 480 pLD3
GluRS 25 54.7 460 pLD3
RF3 20 60.3 330 pLD3
ProRS 20 64.5 310 pLD3
AK1 6 22.8 260 pAK1
AspRS 16 66.8 240 pLD3
LysRS 13 58.4 220 pLD1
T7-RNAP 20 99.8 200 pT7
GlyRS (+β) 19 34.8 + 77.6 170 pLD3
ThrRS 12.6 74.8 170 pLD1
CK 8 47.8 170 pCKM
NDK 2.2 16.4 130 pNDK
GlnRS 7.6 64.3 120 pLD1
IPP 2 20.2 100 NA
LeuRS 8 98.1 80 pLD1
SerRS 3.8 49.2 80 pLD1
ArgRS 4 65.6 60 pLD1
TrpRS 2.2 38.3 60 pLD1
MetRS 4.2 77.1 50 pLD1
CysRS 2.4 53 45 pLD1
HisRS 1.6 47.9 30 pLD1
TyrRS 1.2 48.8 25 pLD1
ValRS 1.6 109 15 pLD1
Abbreviations: RS – tRNA synthetase, EF – elongation factor, IF – initiation factor, RF –
release factor, MTF – Methionyl-tRNA-formyltransferase, RRF – ribosome recycling factor,
AK1 – Adenylate kinase, T7RNAP – T7 RNA-polymerase, CK – Creatine kinase, NDK –
Nucleoside-diphosphate-kinase, IPP – inorganic pyrophosphatase
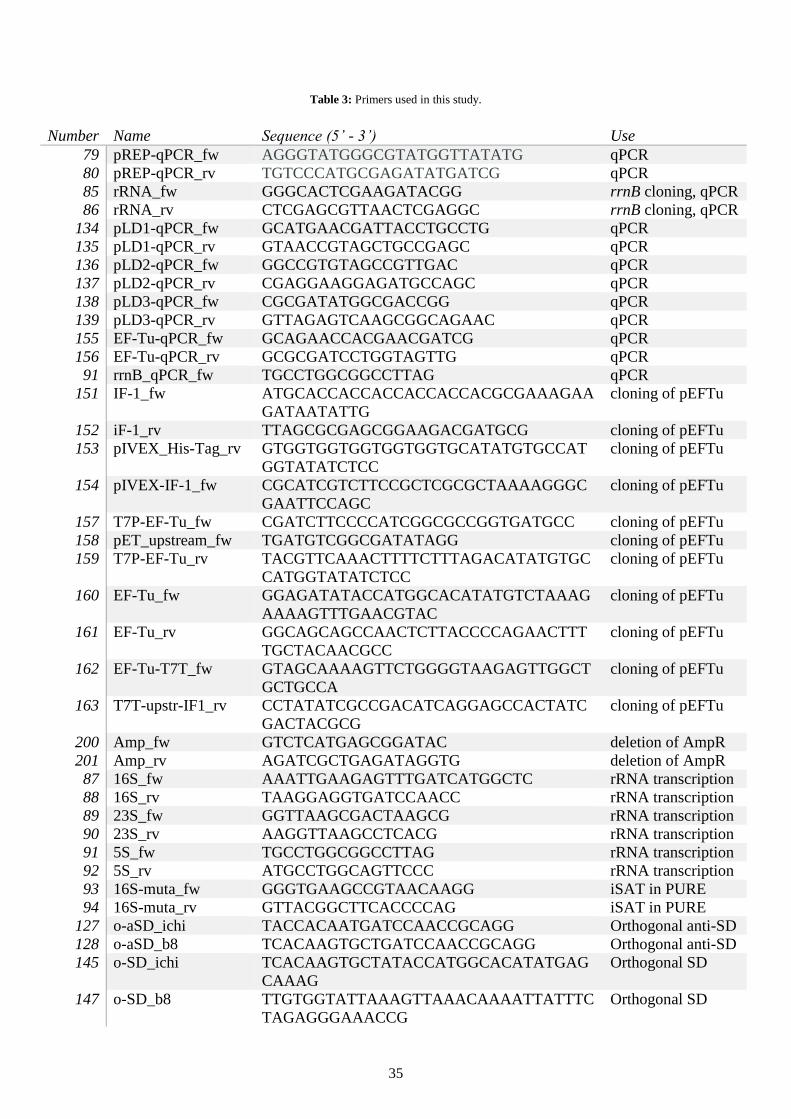
35
Table 3: Primers used in this study.
Number Name Sequence (5’ - 3’) Use
79 pREP-qPCR_fw AGGGTATGGGCGTATGGTTATATG qPCR
80 pREP-qPCR_rv TGTCCCATGCGAGATATGATCG qPCR
85 rRNA_fw GGGCACTCGAAGATACGG rrnB cloning, qPCR
86 rRNA_rv CTCGAGCGTTAACTCGAGGC rrnB cloning, qPCR
134 pLD1-qPCR_fw GCATGAACGATTACCTGCCTG qPCR
135 pLD1-qPCR_rv GTAACCGTAGCTGCCGAGC qPCR
136 pLD2-qPCR_fw GGCCGTGTAGCCGTTGAC qPCR
137 pLD2-qPCR_rv CGAGGAAGGAGATGCCAGC qPCR
138 pLD3-qPCR_fw CGCGATATGGCGACCGG qPCR
139 pLD3-qPCR_rv GTTAGAGTCAAGCGGCAGAAC qPCR
155 EF-Tu-qPCR_fw GCAGAACCACGAACGATCG qPCR
156 EF-Tu-qPCR_rv GCGCGATCCTGGTAGTTG qPCR
91 rrnB_qPCR_fw TGCCTGGCGGCCTTAG qPCR
151 IF-1_fw ATGCACCACCACCACCACCACGCGAAAGAA
GATAATATTG
cloning of pEFTu
152 iF-1_rv TTAGCGCGAGCGGAAGACGATGCG cloning of pEFTu
153 pIVEX_His-Tag_rv GTGGTGGTGGTGGTGGTGCATATGTGCCAT
GGTATATCTCC
cloning of pEFTu
154 pIVEX-IF-1_fw CGCATCGTCTTCCGCTCGCGCTAAAAGGGC
GAATTCCAGC
cloning of pEFTu
157 T7P-EF-Tu_fw CGATCTTCCCCATCGGCGCCGGTGATGCC cloning of pEFTu
158 pET_upstream_fw TGATGTCGGCGATATAGG cloning of pEFTu
159 T7P-EF-Tu_rv TACGTTCAAACTTTTCTTTAGACATATGTGC
CATGGTATATCTCC
cloning of pEFTu
160 EF-Tu_fw GGAGATATACCATGGCACATATGTCTAAAG
AAAAGTTTGAACGTAC
cloning of pEFTu
161 EF-Tu_rv GGCAGCAGCCAACTCTTACCCCAGAACTTT
TGCTACAACGCC
cloning of pEFTu
162 EF-Tu-T7T_fw GTAGCAAAAGTTCTGGGGTAAGAGTTGGCT
GCTGCCA
cloning of pEFTu
163 T7T-upstr-IF1_rv CCTATATCGCCGACATCAGGAGCCACTATC
GACTACGCG
cloning of pEFTu
200 Amp_fw GTCTCATGAGCGGATAC deletion of AmpR
201 Amp_rv AGATCGCTGAGATAGGTG deletion of AmpR
87 16S_fw AAATTGAAGAGTTTGATCATGGCTC rRNA transcription
88 16S_rv TAAGGAGGTGATCCAACC rRNA transcription
89 23S_fw GGTTAAGCGACTAAGCG rRNA transcription
90 23S_rv AAGGTTAAGCCTCACG rRNA transcription
91 5S_fw TGCCTGGCGGCCTTAG rRNA transcription
92 5S_rv ATGCCTGGCAGTTCCC rRNA transcription
93 16S-muta_fw GGGTGAAGCCGTAACAAGG iSAT in PURE
94 16S-muta_rv GTTACGGCTTCACCCCAG iSAT in PURE
127 o-aSD_ichi TACCACAATGATCCAACCGCAGG Orthogonal anti-SD
128 o-aSD_b8 TCACAAGTGCTGATCCAACCGCAGG Orthogonal anti-SD
145 o-SD_ichi TCACAAGTGCTATACCATGGCACATATGAG
CAAAG
Orthogonal SD
147 o-SD_b8 TTGTGGTATTAAAGTTAAACAAAATTATTTC
TAGAGGGAAACCG
Orthogonal SD
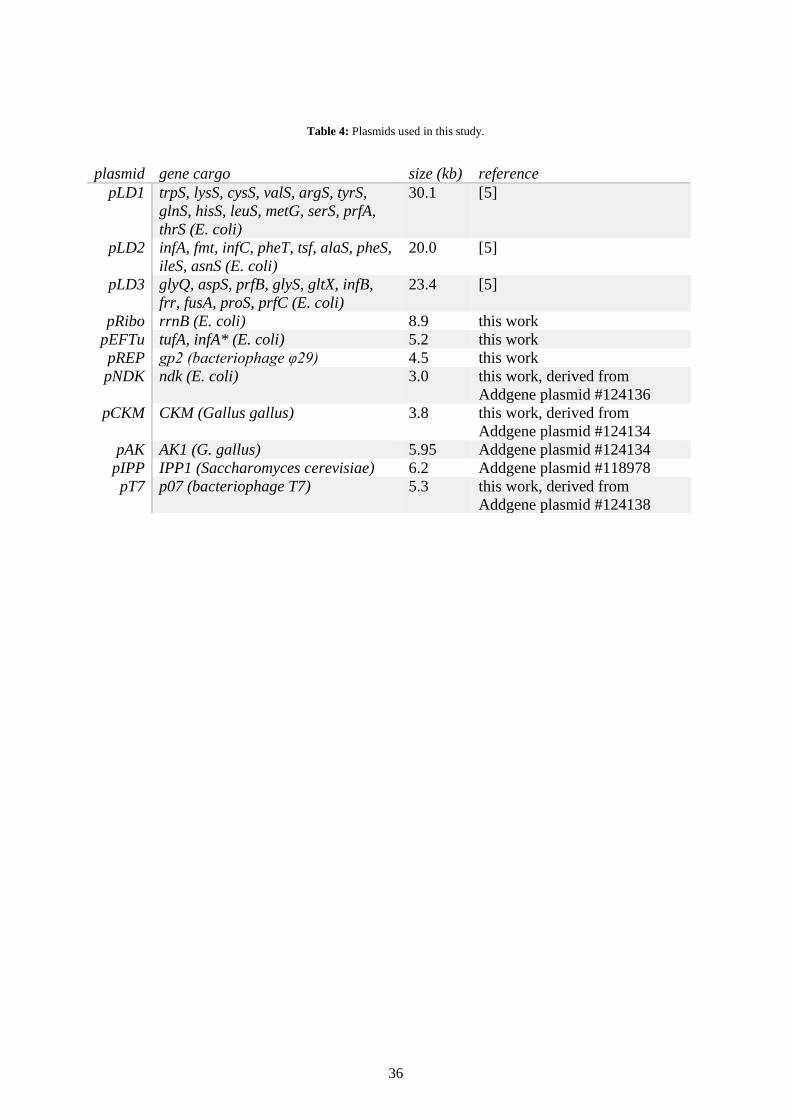
36
Table 4: Plasmids used in this study.
plasmid gene cargo size (kb) reference
pLD1 trpS, lysS, cysS, valS, argS, tyrS,
glnS, hisS, leuS, metG, serS, prfA,
thrS (E. coli)
30.1 [5]
pLD2 infA, fmt, infC, pheT, tsf, alaS, pheS,
ileS, asnS (E. coli)
20.0 [5]
pLD3 glyQ, aspS, prfB, glyS, gltX, infB,
frr, fusA, proS, prfC (E. coli)
23.4 [5]
pRibo rrnB (E. coli) 8.9 this work
pEFTu tufA, infA* (E. coli) 5.2 this work
pREP gp2 (bacteriophage φ29) 4.5 this work
pNDK ndk (E. coli) 3.0 this work, derived from
Addgene plasmid #124136
pCKM CKM (Gallus gallus) 3.8 this work, derived from
Addgene plasmid #124134
pAK AK1 (G. gallus) 5.95 Addgene plasmid #124134
pIPP IPP1 (Saccharomyces cerevisiae) 6.2 Addgene plasmid #118978
pT7 p07 (bacteriophage T7) 5.3 this work, derived from
Addgene plasmid #124138
37
III Proteome self-regeneration
Some of the results presented in this chapter are part of the following publications:
Libicher et al., (2020) Nature Communications 97
Libicher et al., (2020) Chemical Communications 128
38
III-1 Introduction
A cellular proteome can be understood as the cell’s set of expressed proteins.129
Next to
genome-replication, cells regenerate their proteomes which are passed on to their progeny.
For a dividing minimal cell based on TTcDR, this implies that protein factors would have to
be multiplied to as many times as the system is split. In the case of two daughter cells, the
concentration of each protein would have to be doubled.
Already in 2017, the Church lab has shown that the co-expression of 54 E. coli ribosomal
proteins was feasible in PURE.130
They used micro-dialysis chambers in order to replenish
substrates and remove inhibitive waste products. Similarly, Lavickova et al. demonstrated the
simultaneous self-regeneration of up to seven PURE factors from DNA templates using
microfluidic flow reactors.21
Protein biosynthesis was kept in a steady-state by supplying
resources and washing out waste products through continuous flow. They found that the
optimal allocation of resources was just as crucial as the minimal competition for them in
order to increase the robustness of self-regeneration. Despite regenerating multiple proteins
over several hours, the author’s conceded that the PURE system was unlikely to self-
regenerate more than ca. 50% of its proteome under the current conditions. Rather, synthesis
rates would have to be amplified 25-fold without the addition of any more proteins or genes
competing for resources.
Co-expressing protein-coding genes is not equivalent to achieving a self-regenerating PURE
proteome. De novo synthesized proteins would have to be functional in order to participate in
further transcription-translation events. Last year, Blanken et al. showed that multiple
enzymes expressed in vitro were indeed functional and able to reconstitute biosynthesis
pathways.131
For a minimal cell, all PURE genes would have to be expressed in functional
amounts equal to or greater than their respective starting concentrations whilst permitting
DNA replication.
This chapter demonstrates that PURErep permits the co-expression of relevant PURE proteins
illustrating that full self-regeneration might be feasible in a PURE system. It will be shown
that PURErep enables the simultaneous co-expression of up to 30 translation factors during
TTcDR. It will further be investigated whether the PURE system is capable of regenerating a
selected few of its own enzymatic components in batch to such a degree that translation
remained active over the course of serial dilution. Using an experimental setup that allowed
the depletion of individual PURE components, it was shown that regenerating up to 13 active

39
translation factors was indeed feasible while maintaining stable gene expression for up to
three generations of serial dilution.
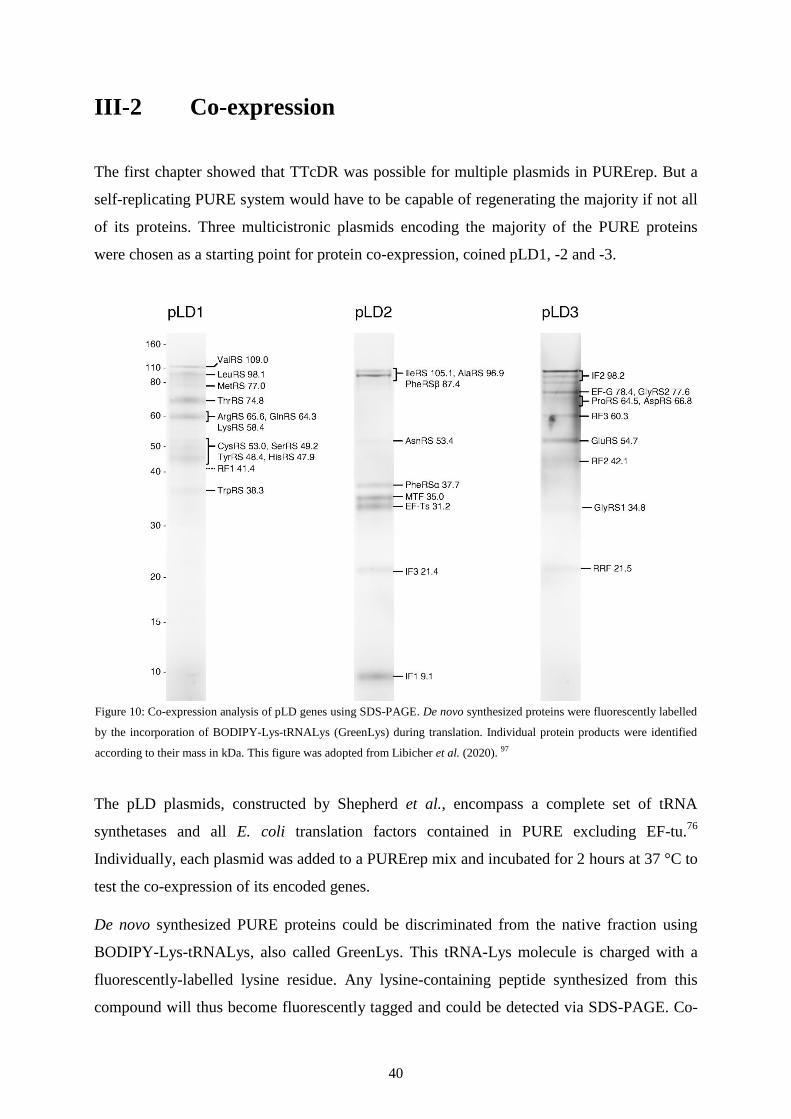
40
III-2 Co-expression
The first chapter showed that TTcDR was possible for multiple plasmids in PURErep. But a
self-replicating PURE system would have to be capable of regenerating the majority if not all
of its proteins. Three multicistronic plasmids encoding the majority of the PURE proteins
were chosen as a starting point for protein co-expression, coined pLD1, -2 and -3.
The pLD plasmids, constructed by Shepherd et al., encompass a complete set of tRNA
synthetases and all E. coli translation factors contained in PURE excluding EF-tu.76
Individually, each plasmid was added to a PURErep mix and incubated for 2 hours at 37 °C to
test the co-expression of its encoded genes.
De novo synthesized PURE proteins could be discriminated from the native fraction using
BODIPY-Lys-tRNALys, also called GreenLys. This tRNA-Lys molecule is charged with a
fluorescently-labelled lysine residue. Any lysine-containing peptide synthesized from this
compound will thus become fluorescently tagged and could be detected via SDS-PAGE. Co-
Figure 10: Co-expression analysis of pLD genes using SDS-PAGE. De novo synthesized proteins were fluorescently labelled
by the incorporation of BODIPY-Lys-tRNALys (GreenLys) during translation. Individual protein products were identified
according to their mass in kDa. This figure was adopted from Libicher et al. (2020). 97
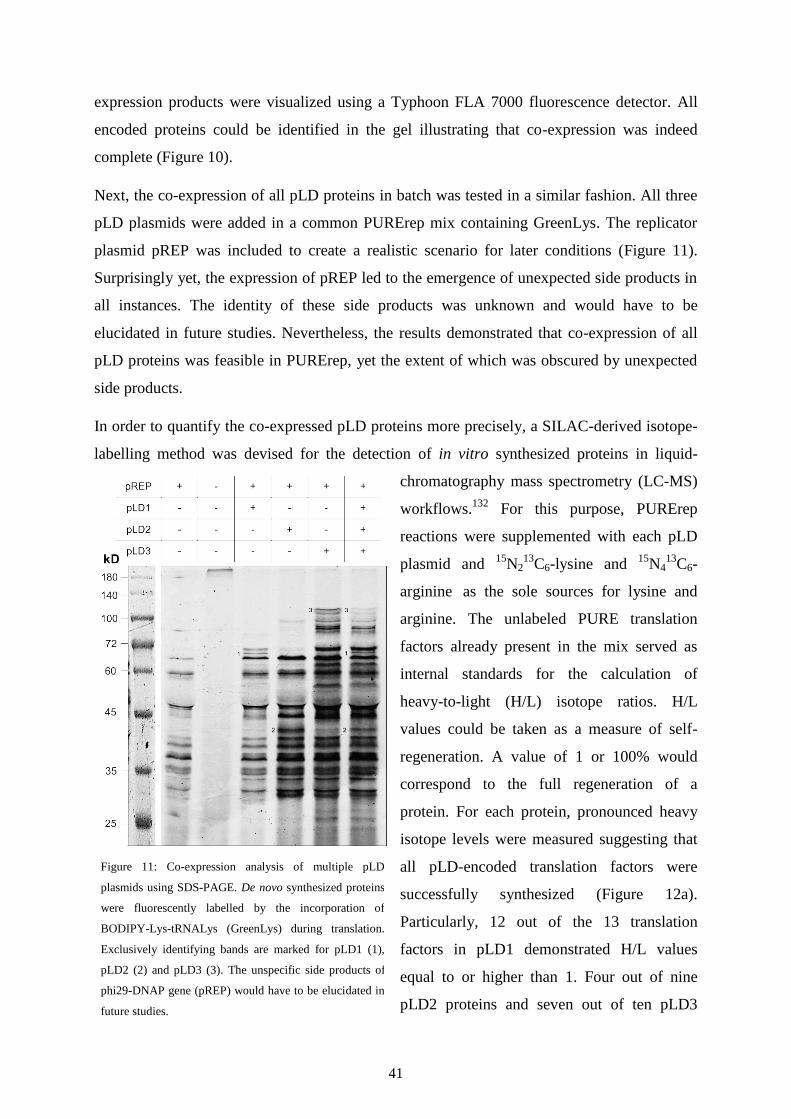
41
expression products were visualized using a Typhoon FLA 7000 fluorescence detector. All
encoded proteins could be identified in the gel illustrating that co-expression was indeed
complete (Figure 10).
Next, the co-expression of all pLD proteins in batch was tested in a similar fashion. All three
pLD plasmids were added in a common PURErep mix containing GreenLys. The replicator
plasmid pREP was included to create a realistic scenario for later conditions (Figure 11).
Surprisingly yet, the expression of pREP led to the emergence of unexpected side products in
all instances. The identity of these side products was unknown and would have to be
elucidated in future studies. Nevertheless, the results demonstrated that co-expression of all
pLD proteins was feasible in PURErep, yet the extent of which was obscured by unexpected
side products.
In order to quantify the co-expressed pLD proteins more precisely, a SILAC-derived isotope-
labelling method was devised for the detection of in vitro synthesized proteins in liquid-
chromatography mass spectrometry (LC-MS)
workflows.132
For this purpose, PURErep
reactions were supplemented with each pLD
plasmid and 15
N213
C6-lysine and 15
N413
C6-
arginine as the sole sources for lysine and
arginine. The unlabeled PURE translation
factors already present in the mix served as
internal standards for the calculation of
heavy-to-light (H/L) isotope ratios. H/L
values could be taken as a measure of self-
regeneration. A value of 1 or 100% would
correspond to the full regeneration of a
protein. For each protein, pronounced heavy
isotope levels were measured suggesting that
all pLD-encoded translation factors were
successfully synthesized (Figure 12a).
Particularly, 12 out of the 13 translation
factors in pLD1 demonstrated H/L values
equal to or higher than 1. Four out of nine
pLD2 proteins and seven out of ten pLD3
Figure 11: Co-expression analysis of multiple pLD
plasmids using SDS-PAGE. De novo synthesized proteins
were fluorescently labelled by the incorporation of
BODIPY-Lys-tRNALys (GreenLys) during translation.
Exclusively identifying bands are marked for pLD1 (1),
pLD2 (2) and pLD3 (3). The unspecific side products of
phi29-DNAP gene (pREP) would have to be elucidated in
future studies.
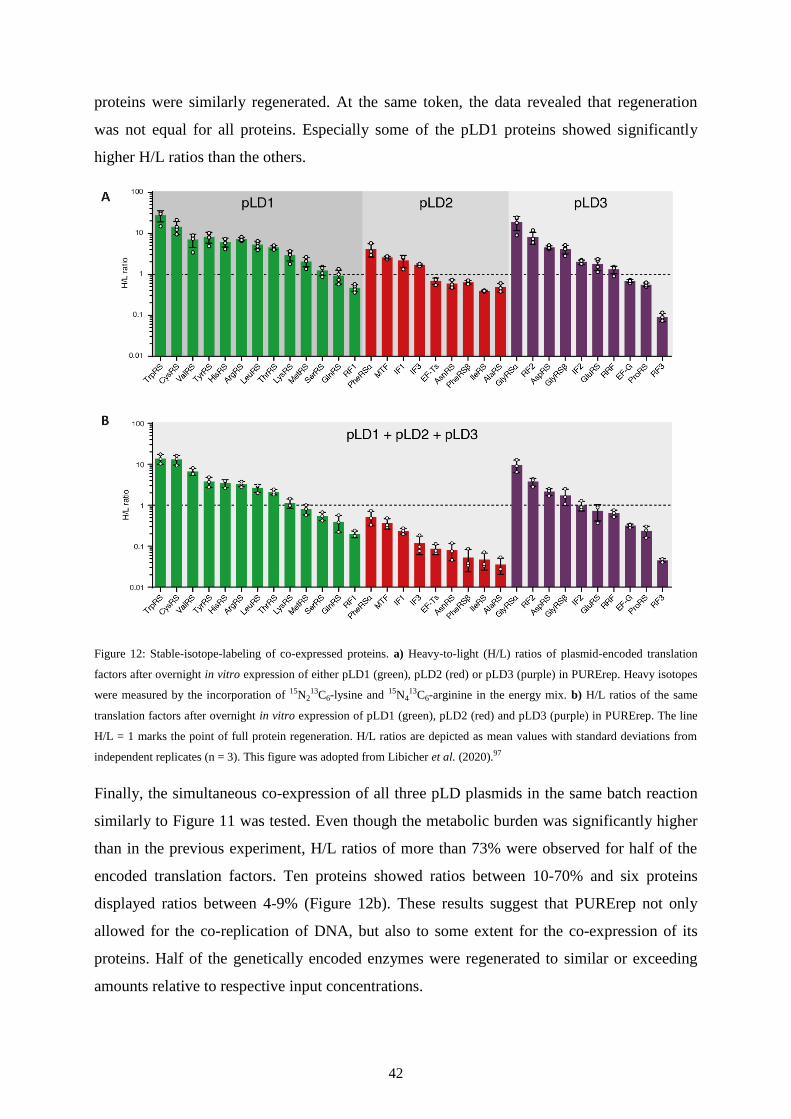
42
proteins were similarly regenerated. At the same token, the data revealed that regeneration
was not equal for all proteins. Especially some of the pLD1 proteins showed significantly
higher H/L ratios than the others.
Figure 12: Stable-isotope-labeling of co-expressed proteins. a) Heavy-to-light (H/L) ratios of plasmid-encoded translation
factors after overnight in vitro expression of either pLD1 (green), pLD2 (red) or pLD3 (purple) in PURErep. Heavy isotopes
were measured by the incorporation of 15N213C6-lysine and 15N4
13C6-arginine in the energy mix. b) H/L ratios of the same
translation factors after overnight in vitro expression of pLD1 (green), pLD2 (red) and pLD3 (purple) in PURErep. The line
H/L = 1 marks the point of full protein regeneration. H/L ratios are depicted as mean values with standard deviations from
independent replicates (n = 3). This figure was adopted from Libicher et al. (2020).97
Finally, the simultaneous co-expression of all three pLD plasmids in the same batch reaction
similarly to Figure 11 was tested. Even though the metabolic burden was significantly higher
than in the previous experiment, H/L ratios of more than 73% were observed for half of the
encoded translation factors. Ten proteins showed ratios between 10-70% and six proteins
displayed ratios between 4-9% (Figure 12b). These results suggest that PURErep not only
allowed for the co-replication of DNA, but also to some extent for the co-expression of its
proteins. Half of the genetically encoded enzymes were regenerated to similar or exceeding
amounts relative to respective input concentrations.
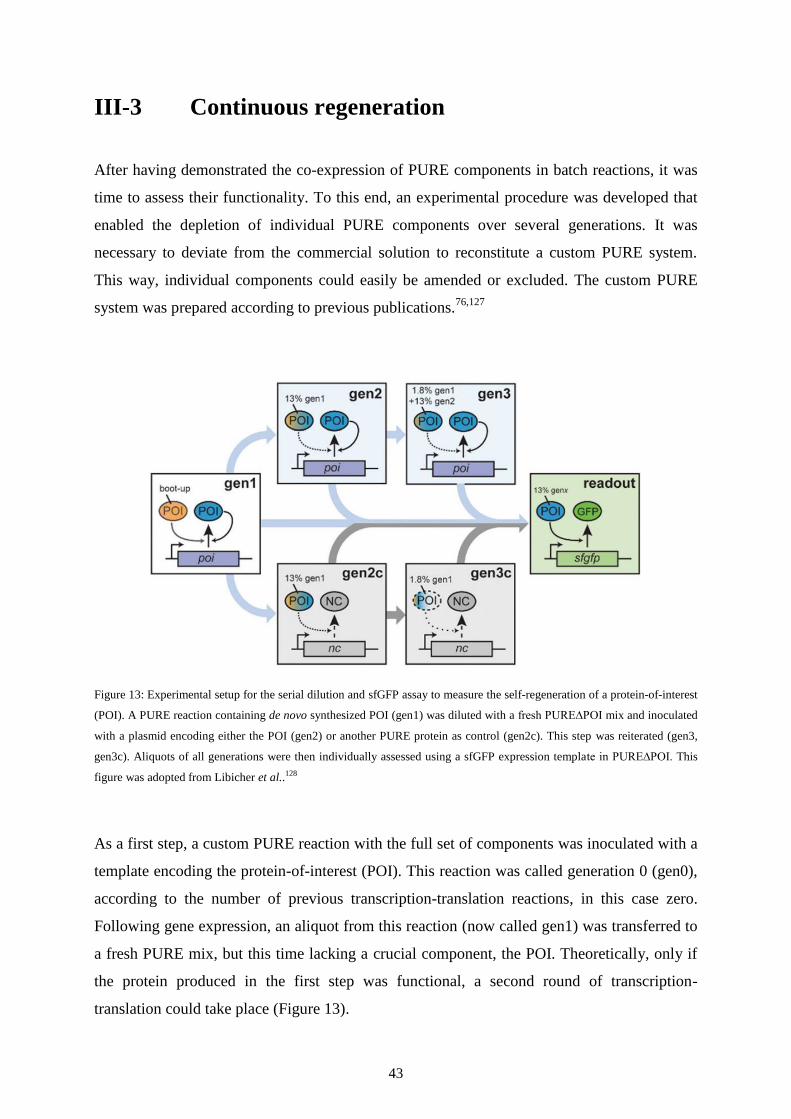
43
III-3 Continuous regeneration
After having demonstrated the co-expression of PURE components in batch reactions, it was
time to assess their functionality. To this end, an experimental procedure was developed that
enabled the depletion of individual PURE components over several generations. It was
necessary to deviate from the commercial solution to reconstitute a custom PURE system.
This way, individual components could easily be amended or excluded. The custom PURE
system was prepared according to previous publications.76,127
Figure 13: Experimental setup for the serial dilution and sfGFP assay to measure the self-regeneration of a protein-of-interest
(POI). A PURE reaction containing de novo synthesized POI (gen1) was diluted with a fresh PURE∆POI mix and inoculated
with a plasmid encoding either the POI (gen2) or another PURE protein as control (gen2c). This step was reiterated (gen3,
gen3c). Aliquots of all generations were then individually assessed using a sfGFP expression template in PURE∆POI. This
figure was adopted from Libicher et al..128
As a first step, a custom PURE reaction with the full set of components was inoculated with a
template encoding the protein-of-interest (POI). This reaction was called generation 0 (gen0),
according to the number of previous transcription-translation reactions, in this case zero.
Following gene expression, an aliquot from this reaction (now called gen1) was transferred to
a fresh PURE mix, but this time lacking a crucial component, the POI. Theoretically, only if
the protein produced in the first step was functional, a second round of transcription-
translation could take place (Figure 13).
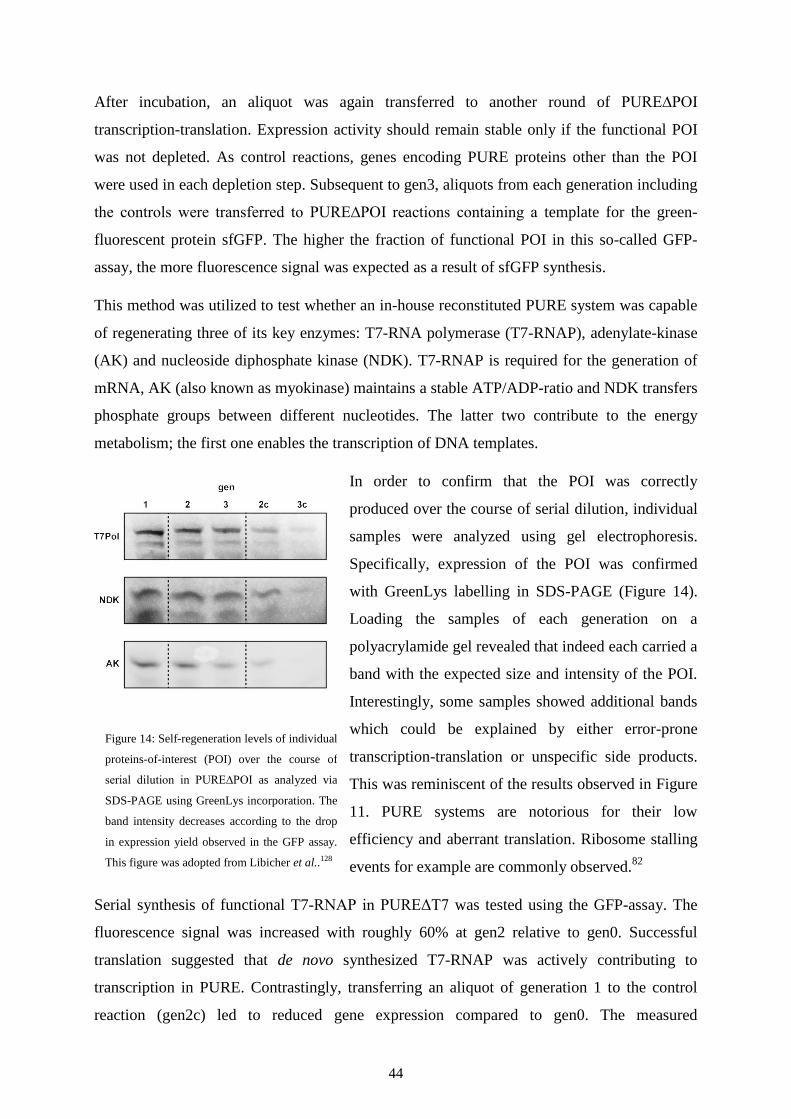
44
After incubation, an aliquot was again transferred to another round of PURE∆POI
transcription-translation. Expression activity should remain stable only if the functional POI
was not depleted. As control reactions, genes encoding PURE proteins other than the POI
were used in each depletion step. Subsequent to gen3, aliquots from each generation including
the controls were transferred to PURE∆POI reactions containing a template for the green-
fluorescent protein sfGFP. The higher the fraction of functional POI in this so-called GFP-
assay, the more fluorescence signal was expected as a result of sfGFP synthesis.
This method was utilized to test whether an in-house reconstituted PURE system was capable
of regenerating three of its key enzymes: T7-RNA polymerase (T7-RNAP), adenylate-kinase
(AK) and nucleoside diphosphate kinase (NDK). T7-RNAP is required for the generation of
mRNA, AK (also known as myokinase) maintains a stable ATP/ADP-ratio and NDK transfers
phosphate groups between different nucleotides. The latter two contribute to the energy
metabolism; the first one enables the transcription of DNA templates.
In order to confirm that the POI was correctly
produced over the course of serial dilution, individual
samples were analyzed using gel electrophoresis.
Specifically, expression of the POI was confirmed
with GreenLys labelling in SDS-PAGE (Figure 14).
Loading the samples of each generation on a
polyacrylamide gel revealed that indeed each carried a
band with the expected size and intensity of the POI.
Interestingly, some samples showed additional bands
which could be explained by either error-prone
transcription-translation or unspecific side products.
This was reminiscent of the results observed in Figure
11. PURE systems are notorious for their low
efficiency and aberrant translation. Ribosome stalling
events for example are commonly observed.82
Serial synthesis of functional T7-RNAP in PUREΔT7 was tested using the GFP-assay. The
fluorescence signal was increased with roughly 60% at gen2 relative to gen0. Successful
translation suggested that de novo synthesized T7-RNAP was actively contributing to
transcription in PURE. Contrastingly, transferring an aliquot of generation 1 to the control
reaction (gen2c) led to reduced gene expression compared to gen0. The measured
Figure 14: Self-regeneration levels of individual
proteins-of-interest (POI) over the course of
serial dilution in PURE∆POI as analyzed via
SDS-PAGE using GreenLys incorporation. The
band intensity decreases according to the drop
in expression yield observed in the GFP assay.
This figure was adopted from Libicher et al..128
45
fluorescence signal might have been the result of residual T7-RNAP from the source reaction.
In generation 3 of the T7-RNAP reaction, the fluorescence signal was depleted albeit still
higher than the control, for which yet lower levels of background transcription were observed.
The continuous production of fresh T7-RNAP facilitated the central dogma over several
generations, an important hallmark for any self-replicating cytoplasm. Low level of
background transcription could still be observed for the control reactions, suggesting carry-
over of active T7-RNAP protein and pT7 template in the form of plasmid or mRNA.
A more pronounced effect was observed for the PURE systems replenishing parts of their
own energy metabolism, AK and NDK. AK facilitates ATP regeneration, whereas NDK
established a steady state between all NTPs. Already in gen1, the yield of sfGFP was twice as
much as in gen0. The following generation exhibited even higher fluorescence. Contrastingly,
a sharp drop of translational activity was observed for the control reactions.
Quantifying post-incubation protein bands was just an indirect measure of protein self-
regeneration. In order to provide a more comprehensive view on transcription-translation, the
GFP assay was employed as illustrated in Figure 13. Each generation was probed by diluting
13% of the post-incubation volume with a fresh PURE∆POI reaction containing a pIVEX-
sfGFP plasmid. If the proportion of functionally active de novo synthesized POI was
maintained, it would reach fluorescence levels comparable to previous generations.
For T7-RNAP, sfGFP fluorescence stayed relatively constant during gen1 to gen3, whereas
the controls displayed a sharp decline (Figure 15a). The functional protein was therefore
synthesized in sufficient amounts to rescue transcription. Still, there was GFP gene expression
in the control reactions, which could be attributed to carryover T7-RNAP or T7-RNAP-
plasmid from previous reactions.

46
Figure 15: Self-regeneration levels of different proteins-of-interest (POI) over the course of serial dilution in PURE∆POI, as
estimated via GFP assay. The generation number (gen) depicts the number of previous PURE reactions. Fluorescence values
were normalized against the sum of all respective values (s. Methods). Measurements were taken as independent replicates
(n = 3). This figure was adopted from Libicher et al..128
Self-regeneration of proteins was similarly maintained throughout gen1 to gen3 for AK
(Figure 15b) and NDK (Figure 15c), while being absent in the respective controls.
Interestingly, NDK gen3 showed much lower fluorescence than gen1, which could be a
possible indication that the proportion of functional variants among all synthesized proteins
was depleted.
Finally the limit of self-regeneration was challenged with the regeneration of multiple
proteins in parallel (Figure 16). Success appeared to be most likely for pLD1, since the
plasmid encoded genes of mostly low-concentrated tRNA-synthetases. To this end, the pLD1-
plasmid encoding 12 tRNA aminoacyltransferases and 1 release factor was utilized as an
expression template. The plasmid encodes multiple translation factors that are easily
replenished even at low yield. During serial dilution, the pLD1 protein fraction was omitted in
all generations except the starting gen0. For the negative control experiments, pLD2 was used
as template instead of pLD1. This way, only if all pLD1 proteins were indeed functional and
translated in sufficient amounts, subsequent generations could maintain gene expression
activity. Any pLD2 protein could not rescue the ∆pLD1 phenotype.
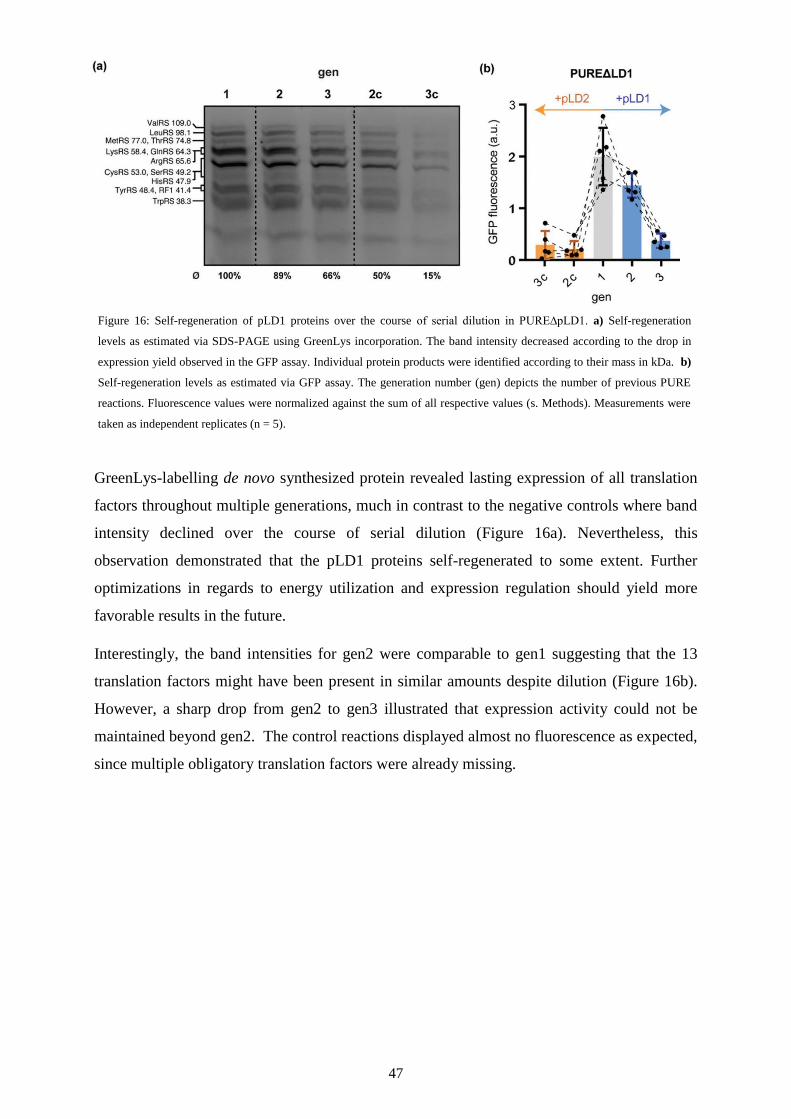
47
GreenLys-labelling de novo synthesized protein revealed lasting expression of all translation
factors throughout multiple generations, much in contrast to the negative controls where band
intensity declined over the course of serial dilution (Figure 16a). Nevertheless, this
observation demonstrated that the pLD1 proteins self-regenerated to some extent. Further
optimizations in regards to energy utilization and expression regulation should yield more
favorable results in the future.
Interestingly, the band intensities for gen2 were comparable to gen1 suggesting that the 13
translation factors might have been present in similar amounts despite dilution (Figure 16b).
However, a sharp drop from gen2 to gen3 illustrated that expression activity could not be
maintained beyond gen2. The control reactions displayed almost no fluorescence as expected,
since multiple obligatory translation factors were already missing.
Figure 16: Self-regeneration of pLD1 proteins over the course of serial dilution in PURE∆pLD1. a) Self-regeneration
levels as estimated via SDS-PAGE using GreenLys incorporation. The band intensity decreased according to the drop in
expression yield observed in the GFP assay. Individual protein products were identified according to their mass in kDa. b)
Self-regeneration levels as estimated via GFP assay. The generation number (gen) depicts the number of previous PURE
reactions. Fluorescence values were normalized against the sum of all respective values (s. Methods). Measurements were
taken as independent replicates (n = 5).
48
III-4 Discussion
This chapter demonstrated that proteome self-regeneration was at least partially feasible in
PURE. The next step would be to optimize the process to ensure concentration doubling of
each protein during one reaction cycle.
Gene expression is an energy-intensive process. In fact, about 50% of the energy consumed
by propagating bacteria can be attributed to ribosomal translation.133
Without further
metabolic modules, this is a tough issue to tackle. The coupling of genotype and phenotype,
as currently realized by the central dogma, is based on the transcription-translation of genes.
So far, there is no alternative to reproduce the cellular proteome other than gene expression.
Therefore, the transcription-translation of proteins in batch would have to be optimized in
order to be compatible with continuous cellular divisions, as emulated during serial dilution.
It was found that PURErep allowed the co-expression of up to 30 translation factors. For
reactions with individual pLD plasmids, the regeneration of co-expressed translation factors
was higher than with a three-plasmid ensemble corresponding to the degree of the imposed
metabolic burden. The results are representative to initial starting concentrations of the
respective factors. The lowest-concentrated factors are the fastest to regenerate, even in the
face of low expression yields. Contrastingly, high-concentrated proteins exhibited relatively
low H/L values in terms of regeneration, suggesting that they could not be regenerated
efficiently under the current conditions. However, the H/L ratios could have been influenced
by factors independent of transcription-translation, such as insufficient peptide labelling,
incomplete digestion with trypsin, solubility issues or too few distinctive peptides.
Since mass spectrometry could not reveal functional information about the synthesized
proteins, a so-called GFP-assay was established to estimate enzymatic activities over several
generations. Functional feedback between de novo expressed translation factors and fresh
transcription-translation mixtures is a crucial feature for the cytoplasmic regeneration in
future minimal cell models. Indeed, the results of the GFP-assay suggested the conceivability
of a PURE system that regenerated its low-concentrated protein fraction in a self-encoded
manner. But would the synthetic potential of PURE be enough to at least theoretically
regenerate a proteome?
At present, cell-free protein synthesis is not as efficient as in vivo. For example, the average
transcription and translation rates in vitro are 1 nucleotide per second (nt/s) and 4 amino acids
49
per second (aa/s) respectively which is between one and two orders of magnitude lower than
the conditions measured in vivo.134
This ratio is consistent with the approximate difference in
protein concentration between cell-free systems and cells (ca. 5 mg/ml in vitro, ca. 0.3 mg/ml
in vivo).134
In order to self-regenerate, a minimal cell would have to form at least as many peptide bonds
as contained within its proteome. For the model genome proposed by Forster and Church this
would add up to 37600 peptide bonds.2 At this point it should be noted that the Forster and
Church proteome would not truly be self-sufficient as it lacks enzymes for lipid and
carbohydrate metabolism or other unmentioned functions that are essential nonetheless.62
However given these numbers, are the current cell-free conditions in principle sufficient for a
PURE-based minimal cell to self-regenerate the Forster and Church proteome?
To illustrate, consider a minimal cell of 1 femtoliter (fL) volume which is comparable to E.
coli.135
Current conditions in PURE provide ribosomes at 5 µM concentration (Table 6: 6x
ZM – Enzyme Mix Concentrate). In other words, 3000 ribosomes would be contained within
a PURE-based minimal cell, which is roughly a tenth of what has been observed for E. coli.136
At an operating speed of 4 aa/s per ribosome, a PURE-based cell would yield 12000 aa/s. This
translation rate would be enough to duplicate every protein of the Forster and Church
proteome once within 4 s. However, this scenario is based on a few unlikely assumptions.
First, it assumes that each ribosome was working perfectly without the occurrence of stalling
events or any other errors.137
Second, the translation rate of 4 aa/s is not constant for every
amino acid,138
and the amount of synthesized protein would have to be stoichiometrically
balanced according to the desired concentrations. Furthermore it is unlikely that that each
ribosome was polymerizing amino acids at the same rate. Still, these ballpark numbers
provide a rough estimation to show that ribosomal translation would not be limiting in vitro
despite their lower concentration.
A self-regenerating cytoplasm regenerates each protein at its respectively suitable
concentration level. Yet balanced stoichiometry depends on the introduction of gene
regulation, as realized with logical operators and circuits to control transcription and
translation. Implementing those would likely require the expression of additional proteins
further increasing the metabolic burden. But how do we increase energy efficiency without
adding more energy-demanding modules to the genome? It seems like a chicken-and-egg
problem: in order to supply more energy to the system more enzymes would need to be
synthesized, which in turn demand more energy. This issue could only get resolved if the
50
added enzymes either by themselves or in concert provided more energy than initially
consumed during biosynthesis. Many of today’s energy metabolisms make use of lipid
membranes, such as in mitochondria (oxidative phosphorylation) or chloroplasts
(photosynthesis).12
Yet the production of lipid bilayers is too energy-intensive for the cell-free
system to bootstrap itself.94
Another problem hindering productivity is the sequestration of magnesium ions from the
medium.139
Mg2+
is an important cofactor for transcription, translation and DNA replication.12
General yield deprecation during cell-free synthesis could thus be attributed to its loss from
solution by the formation of inorganic phosphate precipitates.82
These nanoparticles appear to
be quite ubiquitous in cell-free reaction settings, and they emerge wherever inorganic
phosphate or pyrophosphate accumulates.140,141
Nevertheless, one ancient metabolism might offer a solution to both aforementioned issues:
mixed acid fermentation.142
Shared by many prokaryotes, this pathway requires neither
membranes nor an extensive variety of enzymes. Simple pyruvate could be used as an energy
source which would be converted to the final product acetic acid (via coenzyme A) in an
anaerobic milieu.142
This three-enzyme metabolism would efficiently prevent magnesium
sequestration and simultaneously recycle phosphate for ATP generation. Deleterious effects
of its waste product, the proton, could get buffered by the intrinsic buffering system of PURE.
In general, the implementation of inorganic phosphate recycling in biological systems might
be a way of relaying an otherwise deleterious waste product into one that is more easily
discarded (via solvation), such as acids or gases.
In order to improve protein synthesis yield further, ribosome binding sites or promoters of
varying strength could be employed. Currently, the concentrations of amino acids are
equimolar. They could be adapted alongside tRNA levels to fit different transcription-
translation rates. The relatively even H/L levels for the comparable translation factors
encoded by pLD1 suggested that expression yield is indiscriminate to gene positioning.82
Another way of improving protein synthesis yield is the implementation of a continuous-flow
reactor, as realized in microfluidic chips or dialysis chambers.130
However, this method is
incompatible to the minimal cell approach if any part involved was not biologically
reproducible. A semipermeable reaction container built from biomolecules, such as giant
unilamellar vesicles (GUVs), could be a reasonable compromise.69
Van Nies et al.
successfully demonstrated TTcDR in similar liposomes.80
It could be conceivable that the
same setup also facilitated proteome regeneration in a continuous fashion.
51
To summarize, it was shown that self-regeneration of functional proteins over more than one
generation, as emulated via serial dilution, was indeed possible in PURE. This development
marks a crucial step towards the creation of self-regenerating proteomes. However, the
efficiency of these reactions needs to be further improved in order to keep the amount of de
novo protein functional and stable. One of these factors may be the input concentration of
template DNA, which has been recently shown to be pivotal to maintain the reliable
regeneration of several proteins.87
Moreover, additives such as chaperones might further
enhance the fraction of functional protein among the total polypeptides synthesized.
Going further, a self-reproducing minimal cell would also have to synthesize self-encoded
ribosomes to pass on to its progeny. Using a microfluidic chemostat, the Church lab recently
demonstrated that the co-expression of multiple ribosomal proteins was feasible in PURE.130
Yet the in vitro biogenesis of ribosomes is not restricted to ribosomal proteins alone. The
three ribosomal RNAs need to be transcribed and modified in an elaborate process in order to
assemble into functional ribosomes. Along with tRNA reproduction, transcriptome replication
remains a particular challenge, as will be seen in the following chapter.
52
III-5 Methods
Plasmids
All plasmids used in this chapter are listed in Table 4. Primers are listed in Table 3.
The plasmids pT7 (ID: 124138), pNDK (ID: 124136), pIPP (ID: 118978), pAK (ID: 118977)
and pCKM (ID: 124134) were ordered from Addgene. Construct identities were verified with
sequencing by either Eurofins Genomics or Seqlab (Microsynth).
The plasmids pLD1, pLD2 and pLD3 were a gift from the Forster lab (Uppsala University)
and are described in more detail elsewhere.76
The pIVEX2.3d-sfGFP plasmid was a gift from the Schwille lab (MPI of Biochemistry).
Stable isotope labelling of de novo synthesized protein
In order to quantify co-expression products, TTcDR samples were assembled with an energy
mix containing the heavy isotope variant amino acids 15
N213
C6-lysine (∆8) and 15
N413
C6-
arginine (∆10) instead of their conventional counterparts. This way, de novo synthesized
proteins could easily be identified by characteristic isotope shifts in peptide weights when
measured with a mass spectrometer.
A sample was analyzed after 2 h incubation at 37 °C. Subsequently, the reaction was 1:1
diluted with a 25 mM Tris-HCl buffer at pH 8.5 containing 1% sodium deoxycholate, 40 mM
chloroacetamide and 10 mM TCEP as a reducing agent. The mixture was incubated for
another 20 min at 37 °C. Afterwards, 1 µg trypsin was added to digest the proteins overnight.
The next day, the resulting peptide mix was acidified using 4% HCl and purified using a
strong cation exchanger (Thermo Scientific StageTips).
A liquid chromatography process was connected upstream to the mass spectrometer in order
to separate individual peptides (LC-MS). For this purpose, a Q-Exactive HF mass
spectrometer (Thermo Scientific) was used operating in a data-dependent mode. Raw data
was processed using MaxQuant143
and peptide identifications were filtered using a 1% false
positive rate. Using the MaxQuant platform, the peak list was queried against the E. coli K12-
strain proteome (proteome ID: UP00000000625) to yield a table with individual protein
entries and their corresponding H/L values.
53
Purifying PURE proteins
PURE was reconstituted from purified protein fractions. For this purpose, BL21 DE3 E. coli
cells (NEB) were transformed with plasmids encoding his-tagged gene(s) of the
corresponding fraction. The respective plasmids are described in more detail in the previous
chapter. Individual colonies were picked and expanded at 37°C in LB with the corresponding
antibiotic. After overnight incubation, an aliquot was prepared using the Macherey Nagel
MiniPrep kit and its restriction pattern analyzed by gel electrophoresis. If the correct finger
print was verified, the rest of the cell culture was added to a 1 L culture for protein
expression.
Protein biosynthesis was auto-induced with a lactose-containing culture medium. Specifically,
12 g Na2HPO4 (heptahydrate), 6 g KH2PO4 (anhydrous), 40 g Tryptone, 10 g Yeast Extract
and 10 g NaCl were dissolved in ddH2O and sterilized with an autoclave to yield a 2 L base
broth. 80 mL of sterile-filtered sugar mix and the corresponding antibiotic were added to 2 L
base broth prior to cultivation. 1 L of sugar mix was obtained by mixing 150 mL of 99%
glycerol with 12.5 g D-glucose and 50 g D-lactose dissolved in ddH2O.
Following overnight incubation in a rotary shaker at 37 °C and 330 rpm, the cells were
collected by centrifugation for 15 min at 5000 g. The pellet was washed twice in ice-cold
washing buffer (50 mM Tris-HCl pH 7.5, 50 mM NaCl) and subsequently dissolved in 40 to
50 mL lysis buffer containing 50 mM HEPES-KOH at pH 7.6, 250 mM NH4Cl, 10 mM
MgCl2, 5 mM DTT. Cells were lysed by sonication (4 cycles, 5 min). The lysate was cleared
by centrifugation at 16,500 g for 45 min at 4 °C.
The lysate was subsequently loaded on an ÄKTA start chromatography system (GE
Healthcare) using a 1 mL HisTrap FF (GE Healthcare) column. The resin was washed with 5
mL lysis buffer and 5 mL lysis buffer containing an additional 20mM imidazole. The
expression product was eluted using elution buffer (50 mM HEPES-KOH at pH 7.6, 250 mM
NH4Cl, 10 mM MgCl2, 5 mM DTT, 300 mM imidazole). Eluted fractions were collected in 2
mL tubes and those with the presumed product were analyzed via SDS-PAGE. If the product
was present in sufficient amounts with low background, fractions were collected and diluted
using storage buffer (50 mM HEPES KOH at pH7.6, 100 mM KCl, 10 mM MgCL2, 30%
(v/v) glycerol, 7 mM DTT).
54
The up-concentration process was coupled to a buffer exchange using Amicon UltraSpin
columns (Merck Millipore) with the appropriate molecular weight cut-off (MWCO) according
to the manufacturer’s instructions. Centrifugation was suspended in several intervals to avoid
protein precipitation, to re-mix the solution via pipetting and to refill the volume with storage
buffer at least twice. The sample was up-concentrated until it reached a volume of 1 to 3 ml,
which took 4 to 6 h centrifugation time. Protein concentration was estimated by a standard
Bradford assay and measuring optical density, both done using a NanoDrop One-c system
(Thermo Scientific).
Reconstituting PURE
PURE reactions were assembled from protein fractions purified as described above. A 20 µL
reaction was set up with 5 µL 4xEM, 2 µL 10xAA20, 3.34 µL 6xZM, 2 µL each of the pLD1,
pLD2 and pLD3 protein fractions at 1 mg/mL final concentration respectively, 4 nM plasmid
DNA bearing the GOI and either 13.3% (v/v) of a previous generation (in the case of the self-
regeneration experiment below) or ddH2O ad 20 µL.
The compositions of 4xEM energy mix and 6xZM enzyme mix are listed in Table 5 and Table
6 respectively. The 10xAA20 amino acid mix was obtained by ten-fold diluting an aliquot of
vigorously mixed “amino acid milk”.
Amino Acid Milk
PURE reactions are assembled from many different stock solutions. It is therefore necessary
to devise a method of producing highly concentrated stocks to achieve the required final
concentrations. For example, commercial amino acid solutions are too low-concentrated to fit
into the reaction setup. The amino acid milk is a suspension of all 20 canonical amino acids at
neutral pH that can readily be diluted to form 10xAA20 working solutions. It was conceived
by Caschera & Noireaux and is described in more detail elsewhere.144
In brief, solid amino acid powders were dissolved in 5 M KOH to obtain final concentrations
in the range of 1 to 4 M. The 20 amino acid stocks prepared this way were then mixed in
equimolar ratios at 50 mM each. Upon neutralizing the pH with a few drops of glacial acetic
acid some amino acids fell out of solution to form a white suspension reminiscent of milk.
This “powdery suspension” was stable at -20 °C for roughly two weeks.
55
Self-regeneration of PURE components
The functionality of de novo synthesized proteins-of-interest (POI) was tested using a serial
transfer of PURE reactions. These transcription-translation setups were mixed as described
above. Prior to incubation, an aliquot called gen0 was stored at 4 °C to be used as an internal
control later on. POI and control plasmids are shown in Table 7. After incubating the
remaining mixture, called gen1, for 1 hour at 37 °C, a fresh PURE reaction lacking the POI
was filled up to 10 µl final volume with an aliquot of gen1. The rest of gen1 was stored at
4 °C until further use. Any subsequent generation “genX” was similarly mixed, where “X”
denotes the number of previous incubations. Control reactions “genXc” were formulated by
replacing the plasmid encoding the POI. Protein expression during serial dilution could be
followed using FluoroTect GreenLys (Promega). This way, de novo synthesized protein was
labelled with fluorescent lysine residues. Individual reactions could then be analyzed via
SDS-PAGE by digesting them with 1 µl RNase Cocktail (Thermo Fisher Scientific) for 30
min at 37 °C before adding SDS loading buffer. Tagged protein bands were visualized using a
Typhoon FLA 7000 scanner (GE Healthcare) and quantified using Image Lab v6 (Invitrogen).
GFP-assay
An indirect measure of de novo POI functionality was facilitated by the so-called GFP-assay.
A PURE∆POI reaction was set up as described above. 13% v/v of the reaction consisted of
the genX to be tested, stored at 4 °C after incubation. Instead of plasmid DNA encoding the
POI, a pIVEX-sfGFP reporter gene was used. The newly assembled PURE reactions were
incubated at 37°C in a StepOne Real-Time PCR System (Thermo Fisher Scientific) recording
fluorescence at 1 measurement per min. Independent replicates were measured to obtain
average fluorescence values 𝑓𝑔𝑒𝑛𝑥 for genX after 100 min which were normalized against the
sum of all generations’ fluorescence endpoints 𝐹 using:
𝑓𝑔𝑒𝑛𝑥 =𝐹𝑔𝑒𝑛𝑥
𝐹𝑔𝑒𝑛0 + 𝐹𝑔𝑒𝑛1 + 𝐹𝑔𝑒𝑛2 + 𝐹𝑔𝑒𝑛2𝑐 + 𝐹𝑔𝑒𝑛3 + 𝐹𝑔𝑒𝑛3𝑐
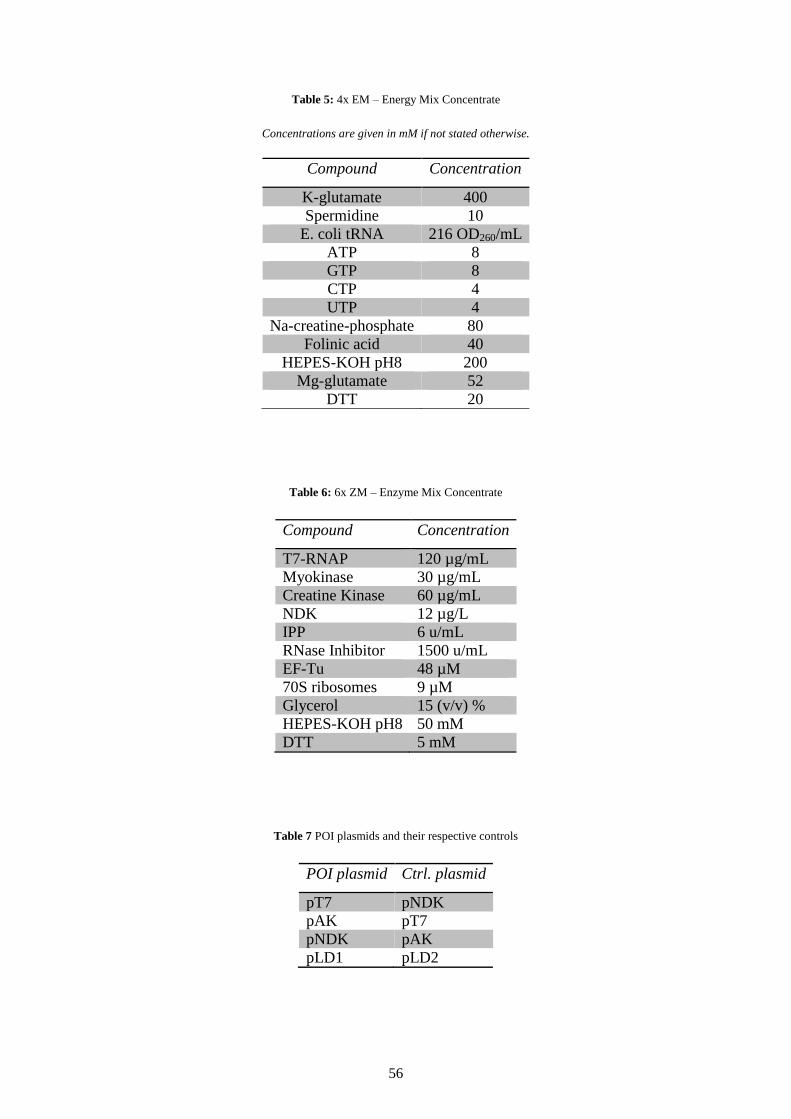
56
Table 5: 4x EM – Energy Mix Concentrate
Concentrations are given in mM if not stated otherwise.
Compound Concentration
K-glutamate 400
Spermidine 10
E. coli tRNA 216 OD260/mL
ATP 8
GTP 8
CTP 4
UTP 4
Na-creatine-phosphate 80
Folinic acid 40
HEPES-KOH pH8 200
Mg-glutamate 52
DTT 20
Table 6: 6x ZM – Enzyme Mix Concentrate
Compound Concentration
T7-RNAP 120 µg/mL
Myokinase 30 µg/mL
Creatine Kinase 60 µg/mL
NDK 12 µg/L
IPP 6 u/mL
RNase Inhibitor 1500 u/mL
EF-Tu 48 µM
70S ribosomes 9 µM
Glycerol 15 (v/v) %
HEPES-KOH pH8 50 mM
DTT 5 mM
Table 7 POI plasmids and their respective controls
POI plasmid Ctrl. plasmid
pT7 pNDK
pAK pT7
pNDK pAK
pLD1 pLD2

57
IV Ribosome synthesis & assembly
58
IV-1 Introduction
In contrast to the transcription process in PURE, translation employs more than one molecule.
Regenerating the translation machinery during minimal cell propagation is a much more
daunting task than just regenerating the T7RNAP. In addition to the translation factors
introduced in the previous chapters, the most crucial part of translation has so far been
neglected: the ribosome.28
This nano-machine can be considered a molecular assembler29
which implements the genetic code through proteins. So far, all ribosomes in PURE have
been purified from a bacterial source (E. coli), although truly autonomous systems would
have to synthesize and assemble their own ribosomes.
The E. coli ribosome is a macromolecular complex consisting of a large and a small
ribosomal subunit.145
Both are composed of RNA and protein parts.28
In bacteria, the large
and small subunits are referred to as 50S and 30S respectively according to their Svedberg
sedimentation coefficients.12,146
Similarly, the completely assembled ribosome is annotated
with 70S. The 50S subunit consists of the 23S ribosomal RNA (rRNA), the 5S rRNA and 33
ribosomal proteins.130
The 30S subunit contains the 16S rRNA and 21 ribosomal proteins.
Together, the 70S ribosome comprises 3 RNA and 54 protein molecules.130
Prior to translation, the two subunits 30S and 50S are separated.12
When the small subunit
recognizes an mRNA molecule, it recruits other protein factors to form the so-called initiation
complex. In bacteria, the site at which this recognition takes place is named after its
discoverers, Shine and Dalgarno.147
The Shine-Dalgarno (SD) region is a characteristic
sequence that signifies the beginning of a gene. It is located in the 5’-untranslated region
(UTR) upstream of the open-reading-frame (ORF). Upon formation, the initiation complex
ultimately recruits the large 50S subunit to assemble into a functional ribosome.12
During translation, the ribosome moves physically along the mRNA strand towards its 3’-end
polymerizing an amino acid chain in the process. The drivers of this reaction are the
elongation factors which provide a continuous supply of chemical energy in the form of
GTP.13
During translocation, the ribosome synthesizes a polypeptide from amino acid
building blocks which correspond to base triplets, so-called codons, on the mRNA template.12
Each codon signifies either one specific amino acid or a termination signal. Every amino acid
is provided by a tRNA molecule which recognizes its corresponding codon in the ribosomal
core.13

59
Recent efforts have shown that building a ribosome from scratch was possible in PURE.149,150
In particular, all of the 21 small subunit ribosomal proteins could be synthesized in a
continuous PURE reaction and subsequently assembled with native 16S rRNA and the 50S
subunit to form a functional ribosome.130
Yet in order to make ribosomes, both RNA and
protein have to be produced in sufficient amounts and appropriate stoichiometry. Furthermore
some molecules, particularly rRNAs, require additional modifications to mature into
ribosomal parts.149
In order to circumvent the problem of post-transcriptional modifications,
the 16S rRNA sequence has been mutated by the Ichihashi lab using directed evolution to
form functional ribosomes even in the absence of biogenesis factors, provided the mixture
contained all the other missing parts.150
These results may be an important starting point for
PURE-based minimal cells, such as the one presented in this study.
Recently, a cell-free protein synthesis platform for the construction of ribosomes was
developed by the Jewett group.89
This so-called S150 extract was depleted in ribosomes but
retained the biogenesis factors required for rRNA maturation. It enabled the in-vitro
integration of synthesis, assembly and translation of ribosomes (iSAT) which is illustrated in
Figure 17. The iSAT method eventually became an important milestone in the development of
minimal ribosome-based cells. Contrastingly to the PURE system, incorporating iSAT and
S150 with existing TTcDR schemes has so far remained out of reach.
Figure 17: Overview of iSAT, the synthesis and assembly of ribosomes from in vitro-transcribed rRNA followed by the
transcription-translation of a reporter gene (sfGFP). a) Both rRNA and reporter mRNA are transcribed from plasmids by a T7
RNA polymerase (T7RNAP). b) The rRNA assembles with purified ribosomal proteins (TP70) into ribosomal subunits (the
small 30S and the large 50S). c) The reporter mRNA is translated using de novo assembled ribosomes. Functional sfGFP
synthesis yield is measured by fluorescence detection. This way, the efficiency of the iSAT reaction can be indirectly
quantified.
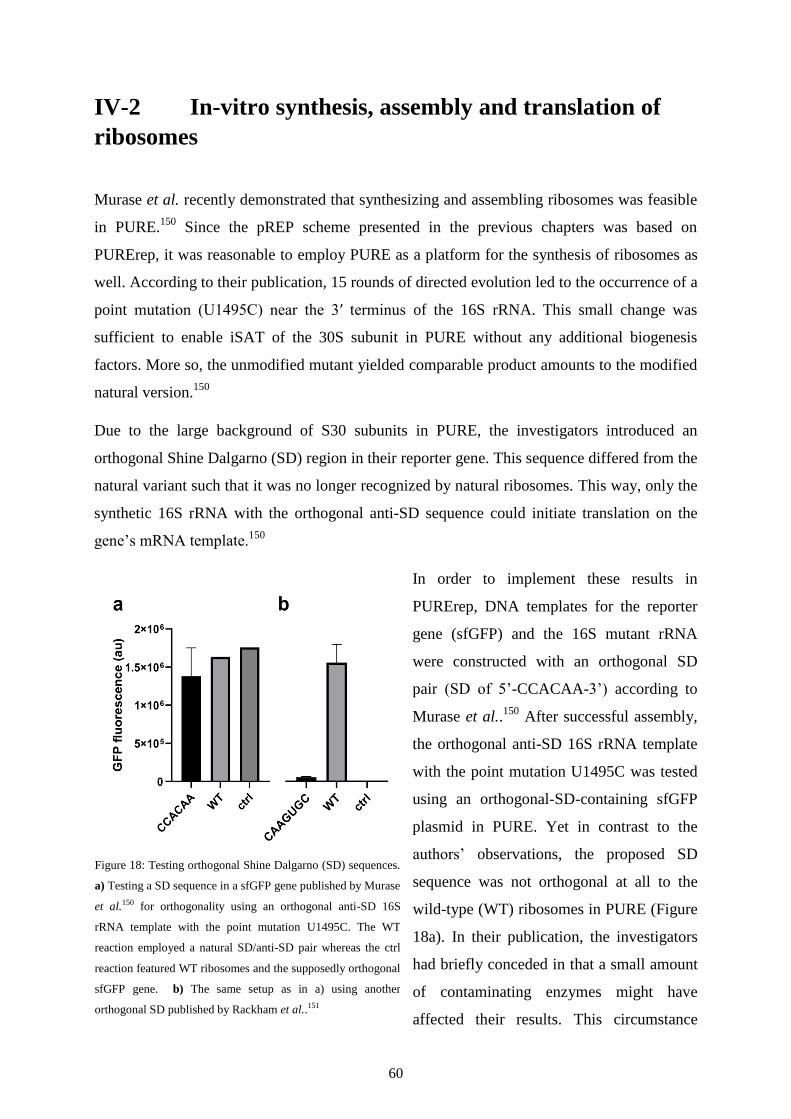
60
IV-2 In-vitro synthesis, assembly and translation of
ribosomes
Murase et al. recently demonstrated that synthesizing and assembling ribosomes was feasible
in PURE.150
Since the pREP scheme presented in the previous chapters was based on
PURErep, it was reasonable to employ PURE as a platform for the synthesis of ribosomes as
well. According to their publication, 15 rounds of directed evolution led to the occurrence of a
point mutation (U1495C) near the 3′ terminus of the 16S rRNA. This small change was
sufficient to enable iSAT of the 30S subunit in PURE without any additional biogenesis
factors. More so, the unmodified mutant yielded comparable product amounts to the modified
natural version.150
Due to the large background of S30 subunits in PURE, the investigators introduced an
orthogonal Shine Dalgarno (SD) region in their reporter gene. This sequence differed from the
natural variant such that it was no longer recognized by natural ribosomes. This way, only the
synthetic 16S rRNA with the orthogonal anti-SD sequence could initiate translation on the
gene’s mRNA template.150
In order to implement these results in
PURErep, DNA templates for the reporter
gene (sfGFP) and the 16S mutant rRNA
were constructed with an orthogonal SD
pair (SD of 5’-CCACAA-3’) according to
Murase et al..150
After successful assembly,
the orthogonal anti-SD 16S rRNA template
with the point mutation U1495C was tested
using an orthogonal-SD-containing sfGFP
plasmid in PURE. Yet in contrast to the
authors’ observations, the proposed SD
sequence was not orthogonal at all to the
wild-type (WT) ribosomes in PURE (Figure
18a). In their publication, the investigators
had briefly conceded in that a small amount
of contaminating enzymes might have
affected their results. This circumstance
Figure 18: Testing orthogonal Shine Dalgarno (SD) sequences.
a) Testing a SD sequence in a sfGFP gene published by Murase
et al.150 for orthogonality using an orthogonal anti-SD 16S
rRNA template with the point mutation U1495C. The WT
reaction employed a natural SD/anti-SD pair whereas the ctrl
reaction featured WT ribosomes and the supposedly orthogonal
sfGFP gene. b) The same setup as in a) using another
orthogonal SD published by Rackham et al..151

61
could at least not be ruled out by their findings. Since no orthogonality was observed, a
different orthogonal SD sequence (5’-CAAGUGC-3’) published by another group151
was
introduced in order to test the U1495C point mutation. This new sequence proved to be
indeed orthogonal to the WT ribosome, yet the extremely low yields of the iSAT reaction
indicated that the point mutation was not as efficient as initially assumed (Figure 18b).
For this reason, the iSAT process was established in its original form using the ribosome-
depleted S150 cell extract published by Jewett et al.89
In contrast to the PURE system, this
extract was not assembled from individually purified components but rather collectively
purified from cellular cytoplasm. Hence, a majority of the extract’s proteins did not actively
contribute to transcription-translation. Metabolic fluxes might be redirected towards other
unproductive sided reactions. Moreover, house-keeping proteins such as GamS could degrade
synthetic DNA templates altogether. At first sight, these factors would render extracts quite
undesirable for the development of a minimal cell.
The “black box” nature of extracts seems to contradict the constructive bottom-up approach.
Yet cellular extracts are an interesting source for more complex metabolic pathways, such as
the ribosome maturation (biogenesis) system. Rather than using unmodified rRNA as in
Murase et al.,90
extract-based iSAT makes use of the biogenesis system inherent to S150
extracts in order to facilitate the maturation of ribosomal subunits. Indeed, the original
demonstration of iSAT was facilitated in S150 extract by Jewett et al..152
The S150 extract was purified according to their publication.152
For biosafety reasons, D10
cells were used instead of MRE600. The preparation led to the separation of a crude
ribosomal pellet which could further be purified to yield coupled 70S subunits. From these,
both ribosomal RNA (rRNA) and protein (TP70) were isolated using respectively acetic acid
and acetone precipitation. Upon S150 extract preparation, gene expression activity was first
confirmed using transcription-translation of a pIVEX-sfGFP template and an additional T7-
RNAP. When compared to the commercial PURExpress system, the S150 extract yielded
similar fluorescence. This was expected since both reaction schemes were supplied with
similar amounts of energy supplements and building blocks (Figure 19a).
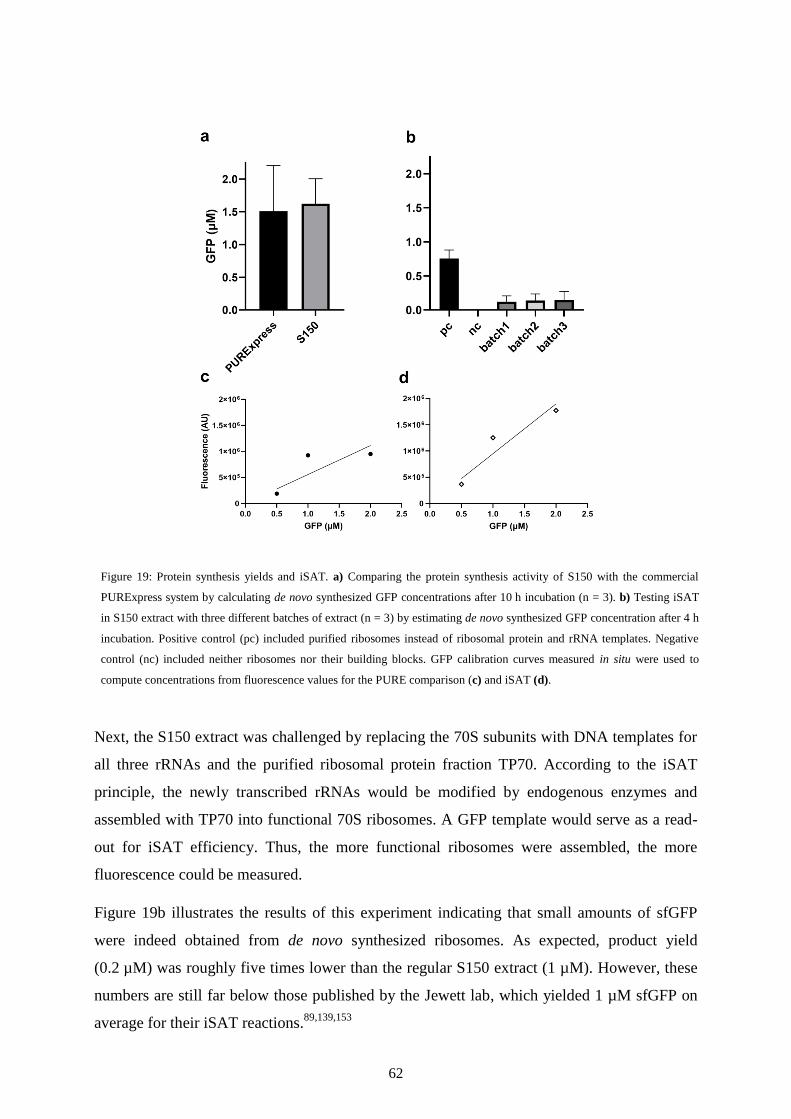
62
Next, the S150 extract was challenged by replacing the 70S subunits with DNA templates for
all three rRNAs and the purified ribosomal protein fraction TP70. According to the iSAT
principle, the newly transcribed rRNAs would be modified by endogenous enzymes and
assembled with TP70 into functional 70S ribosomes. A GFP template would serve as a read-
out for iSAT efficiency. Thus, the more functional ribosomes were assembled, the more
fluorescence could be measured.
Figure 19b illustrates the results of this experiment indicating that small amounts of sfGFP
were indeed obtained from de novo synthesized ribosomes. As expected, product yield
(0.2 µM) was roughly five times lower than the regular S150 extract (1 µM). However, these
numbers are still far below those published by the Jewett lab, which yielded 1 µM sfGFP on
average for their iSAT reactions.89,139,153
Figure 19: Protein synthesis yields and iSAT. a) Comparing the protein synthesis activity of S150 with the commercial
PURExpress system by calculating de novo synthesized GFP concentrations after 10 h incubation (n = 3). b) Testing iSAT
in S150 extract with three different batches of extract (n = 3) by estimating de novo synthesized GFP concentration after 4 h
incubation. Positive control (pc) included purified ribosomes instead of ribosomal protein and rRNA templates. Negative
control (nc) included neither ribosomes nor their building blocks. GFP calibration curves measured in situ were used to
compute concentrations from fluorescence values for the PURE comparison (c) and iSAT (d).
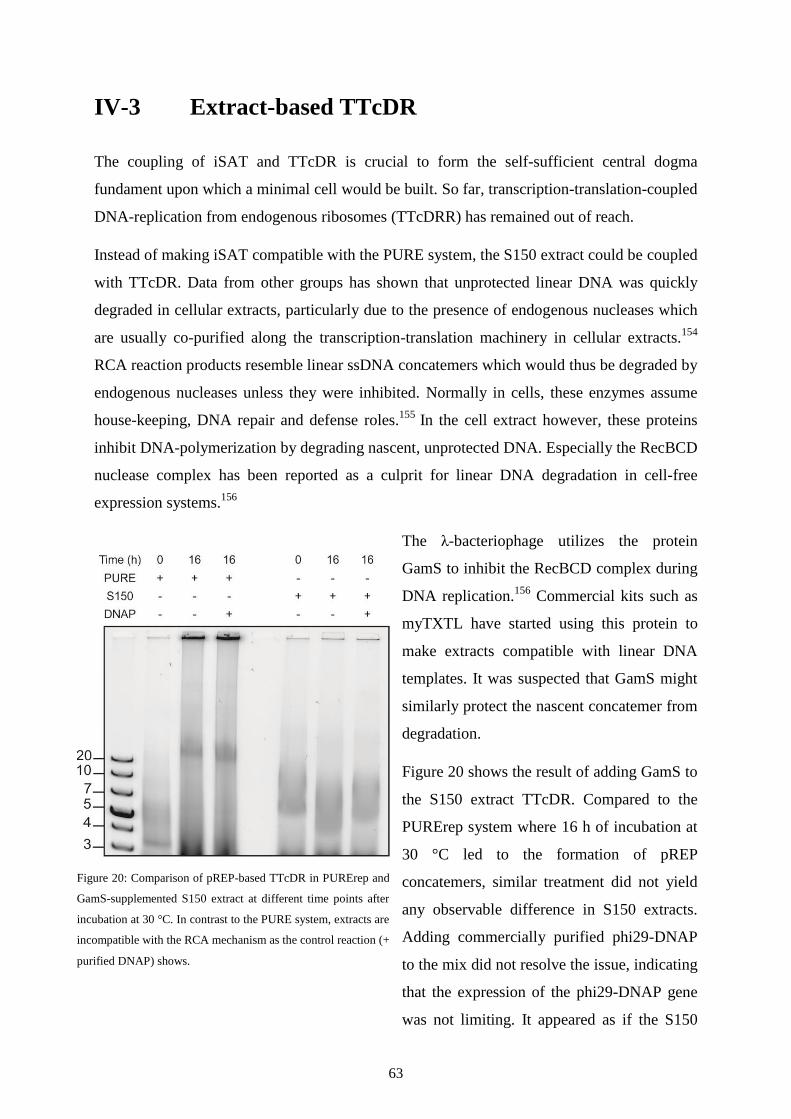
63
IV-3 Extract-based TTcDR
The coupling of iSAT and TTcDR is crucial to form the self-sufficient central dogma
fundament upon which a minimal cell would be built. So far, transcription-translation-coupled
DNA-replication from endogenous ribosomes (TTcDRR) has remained out of reach.
Instead of making iSAT compatible with the PURE system, the S150 extract could be coupled
with TTcDR. Data from other groups has shown that unprotected linear DNA was quickly
degraded in cellular extracts, particularly due to the presence of endogenous nucleases which
are usually co-purified along the transcription-translation machinery in cellular extracts.154
RCA reaction products resemble linear ssDNA concatemers which would thus be degraded by
endogenous nucleases unless they were inhibited. Normally in cells, these enzymes assume
house-keeping, DNA repair and defense roles.155
In the cell extract however, these proteins
inhibit DNA-polymerization by degrading nascent, unprotected DNA. Especially the RecBCD
nuclease complex has been reported as a culprit for linear DNA degradation in cell-free
expression systems.156
The λ-bacteriophage utilizes the protein
GamS to inhibit the RecBCD complex during
DNA replication.156
Commercial kits such as
myTXTL have started using this protein to
make extracts compatible with linear DNA
templates. It was suspected that GamS might
similarly protect the nascent concatemer from
degradation.
Figure 20 shows the result of adding GamS to
the S150 extract TTcDR. Compared to the
PURErep system where 16 h of incubation at
30 °C led to the formation of pREP
concatemers, similar treatment did not yield
any observable difference in S150 extracts.
Adding commercially purified phi29-DNAP
to the mix did not resolve the issue, indicating
that the expression of the phi29-DNAP gene
was not limiting. It appeared as if the S150
Figure 20: Comparison of pREP-based TTcDR in PURErep and
GamS-supplemented S150 extract at different time points after
incubation at 30 °C. In contrast to the PURE system, extracts are
incompatible with the RCA mechanism as the control reaction (+
purified DNAP) shows.

64
extract was entirely incompatible with the RCA reaction. Possible explanations for this
observation will be discussed in the following. Needless to say, either extract-based TTcDR
or PURE-based iSAT need to be established in the near future to realize TTcDRR as a
stepping stone towards creating a minimal cell.
65
IV-4 Discussion
In this chapter the possibilities of implementing de novo ribosome synthesis, assembly and
translation (iSAT) in current cell-free systems was explored. The issue outlined in this study
was the efficient coupling of transcription-translation-coupled DNA replication and iSAT.
TTcDR was originally conceived in the PURE system, whereas iSAT was developed for
cellular S150 extracts. According to the results presented in this chapter, PURE appeared to
be just as incompatible with iSAT as TTcDR was with extract systems.
However, either one would have to be implemented in order to achieve an autonomously
propagating system employing transcription-translation-coupled DNA-replication from
endogenous ribosomes (TTcDRR). The S150 extract in particular was unsuited for the RCA
reaction to take place. Possible reasons for this observation could be attributed to the
following issues: RCA initiation, DNA polymerization and DNA degradation.
So far it remained unclear as to how exactly RCA initiated during TTcDR. The Ichihashi lab
provided strong evidence that de novo transcribed mRNA could serve as a primer for the
polymerization of DNA.78,101
If this were indeed the case, then the eventual lack of TTcDR
might have been caused at the transcription level. The degradation of mRNA by endogenous
nucleases is yet unlikely since regular transcription-translation of other genes such as sfGFP is
still quite feasible in extracts. Rather, the annealing of mRNA to the template strand might be
inhibited, or the DNA binding site of the DNAP blocked. In the former case this could be
tested in the future using DNA primers (random hexamer oligos).
The DNA polymerization could have been blocked by some unknown factor in the extract,
probably one that inhibits the polymerization of dNTPs or even the DNAP itself. Due to the
viral origin of phi29-DNAP this circumstance appears reasonable. It could be tested using
alternative DNA polymerases for extract-based TTcDR, preferably ones of non-viral descent.
The degradation of nascent DNA via endogenous nucleases still seems like the most credible
explanation for the observed lack of RCA in the S150 extract. The inactivation of RecBCD
using commercial GamS in Figure 20 might have either been insufficient and/or other
nucleases could have been involved in the digestion of RCA concatemers. Mass spectrometric
analysis of the S150 proteome might be able to reveal other potentially limiting factors.
Moving on to the issue of PURE-based iSAT, Murase et al. seemed to have solved the
problem by introducing a single point mutation in the 16S rRNA gene. However, this
66
observation could not be reproduced in this work (Figure 18a).150
Rather, the supposedly
orthogonal SD pair turned out to be just as compatible with WT ribosomes as the natural
sequence. The lack of any biogenesis system (the ribosomal maturation factors) in PURE still
proved to be a hindrance towards endogenous ribosome assembly. Ribosomal RNA is heavily
altered after transcription. Many different proteins are required to prune, splice and modify
the RNA. As a temporary solution, the biogenesis system could be provided externally in a
reconstituted fashion in PURE. Eventually, these proteins would have to be encoded and
expressed in situ, imposing a large metabolic burden on an already weak system. More so,
they might require stoichiometrically balanced expression and post-translational
modifications themselves.130,157,158
Strikingly yet, the Ichihashi lab realized iSAT from
ribosomal proteins expressed in vitro, suggesting that at least for the small subunit, post-
translational modifications were negligible.159
Also cellular extracts show notoriously weaker synthesis yields when compared to the state in
vivo.160
The S150-based iSAT reaction produced relatively small amounts of sfGFP as
illustrated in Figure 19b. The yield reduction caused by iSAT further limits the
implementation of other modules such as DNA-replication in the extract. To illustrate,
consider how much energy in the form of ATP equivalents is provided currently within PURE
(Table 5). Adding up NTPs and creatine phosphate molecules leads to a general supply of
26 mM ATP equivalents at 1x concentration. The expression of the sfGFP gene typically
yielded 1.5 µM protein in a cell-free system like PURE (Figure 19a). This amount equals to
1.9 mM ATP provided the amino acid condensation during translation demanded 5 ATP per
amino acid.161
Comparing this with the total supply of 26 mM ATP equivalents in PURE
illustrates the dramatic inefficiency of cell-free protein synthesis. Only 7.3% of the ATP
energy supply has been converted into the final product.
This stands in line with the weaker transcription and translation rates which were observed for
cell-free systems, with more than one order of magnitude difference compared to in vivo
conditions.134
Therefore, the product yield of iSAT needs to be considerably improved. As
others have already stated, this could be achieved via transcriptional adjustment, mitigating
substrate limitations and elevating both macromolecular crowding and reduction potential to
further approximate the cellular microenvironment.89,139,153,162
Another interesting method of improving the efficiency of ribosome assembly is the coupling
of both subunits. This so-called tethered ribosome (Ribo-T) was recently conceived from
joining both 16S and 23S rRNA sequences into a combined region.163
Ribo-T did not forfeit
67
much of its translation efficiency; it was capable of sustaining bacterial growth even in the
absence of any WT ribosome.164
Due to the coupling of both subunits, tethered ribosomes are
probably less limited by RNA maturation, ribosome assembly and translation initiation. The
latter has been described to be the most rate-limiting step for protein synthesis.165,166
Hence,
Ribo-T might also be a candidate worth considering for more efficient and/or biorthogonal
cell-free systems in the near future.
Creating minimal cells from scratch offers the opportunity to rethink the fundamental aspects
of biological processes. The engineering of ribosomes in particular offers intriguing
opportunities beyond iSAT and TTcDR coupling. They could be modified to synthesize
various polymers other than polypeptides, or to integrate unnatural amino acids into proteins
conveying exotic functions. The latter may convey fascinating abilities going well beyond to
what is currently known in nature. Examples are heavy isotopes for the structural study of
proteins, photo-caged residues to render processes controllable by light, fluorescence labelling
(like GreenLys), mirror-inverted D-amino acids to avoid biological recognition and so on.167–
169 The genetic code could also be expanded to incorporate unnatural building blocks and
redesigned to utilize quadruplet codons170
or unnatural base pairs (XNA).171,172
The catalytic
center of the ribosome itself could be altered to accommodate unnatural polymer translation
apart from polypeptide synthesis.59
Next to the regeneration of ribosomal RNA and proteins, another remaining challenge is
posed by tRNA-regeneration. Similarly to rRNA, every transfer RNA (tRNA) undergoes a
distinct maturation processes involving different enzymes. Recently, the synthesis of 21
tRNAs representing all 20 codons and one stop codon was demonstrated in PURE by Shimizu
et al.173
This synthetic set of tRNAs did not require any modifications to translate mRNA
templates into functional proteins. With a mere set of 21 genes, the results clearly illustrated
that the regeneration of tRNA would be much more feasible compared to rRNA. Altering the
composition of the tRNA pool enabled the investigators to further manipulate the genetic
code, thus offering another possibility to introduce unnatural building blocks in future cell-
free systems.
As stated in the general introduction, a life-like chemoton would obligate the integrated self-
replication of the information, metabolism and compartment modules. So far, the genome was
covered as the information storage and transcriptome and proteome were discussed as
metabolic modules. Yet even if iSAT were to be completely realized in a TTcDRR system, it
would still be lacking the necessary compartment that forms a clear boundary to the inanimate

68
medium. Thus, the self-compartmentalization of such a system into a distinct, replicative
entity will mark another key mile stone for the creation of a minimal cell.
69
IV-5 Methods
Plasmid construction
Primers used in this study are listed in Table 3. All oligonucleotides have been ordered from
either Eurofins or Integrated DNA Technologies (IDT). All plasmids used in this chapter are
listed in Table 4.
The pIVEX2.3d-sfGFP plasmid was a gift from the Schwille lab (MPI of Biochemistry).
pRibo was constructed using the ZeroBlunt Cloning kit (Thermo Fisher). Specifically, the
ribosomal RNA operon rrnB (containing three tRNA genes) was cloned from Top10 E. coli
using colony PCR. The linear product was subsequently ligated into the provided pCR-
backbone according to the manufacturer’s instructions.
Templates for the transcription of individual rRNAs were constructed by cloning copies of the
respective rRNA sequence from pRibo using PCR. The linear clones were integrated into pET
backbones using overlap PCR. Linear dsDNA templates for the mRNA run-off transcription
were constructed using overhang PCR.
S150 extract and 70S ribosome preparation
During preparation, the extract was kept on ice at all times. Each step was executed as quickly
as possible to avoid degradation. All buffers and reagents were freshly mixed before
conducting the preparation. Reducing agents were added immediately before use. This
protocol is based on previous publications.89,149,174
The S150 system was extracted from a D10 E. coli strain with low RNase activity.
Alternatively, MRE600 could be used. Cells were grown in 2xYTPG media buffered to pH
7.2 with NaOH containing 16 g/L tryptone, 10 g/L yeast extract, and 5 g/L NaCl, 22 mM
KH2PO4, 40 mM K2HPO4 and 100 mM D-glucose. The cultivation chamber was a Sartorius
C‐10 fermenter containing 10 L of 2xYTPG growth media and 1 mL antifoam A
(Sigma). Cells were grown to OD600 = 3 and pelleted by centrifugation at 5000 x g and 4 °C.
Pellets were flash-frozen in liquid nitrogen until further use.
Pellets were brought up in 5 mL Buffer A (Table 9) per 1 g of dry biomass. Cells were re-
suspended by vortexing and pipetting. 100 µL HALT Protease Inhibitor Cocktail
70
(Thermofisher) per 10 mL cell suspension and 75 µL RNase inhibitor (Qiagen) per 4 g of dry
biomass were added.
Cells were homogenized using a French Press and 15,000 to 17,000 psi. Subsequently, 3 L
of 1 M DTT per 1 mL lysate, 100 µL HALT Protease Inhibitor Cocktail (Thermofisher) per
10 mL cell suspension and 75 µL RNase inhibitor (Qiagen) per 4 g of dry biomass were
added. The lysate was centrifuged at 30,000 x g and 4 °C for 30 min using a pre-chilled Ti70
rotor.
The supernatant was collected into pre-chilled falcons. 13 mL of buffer B + sucrose (
Table 10) were added to Ti70 ultra-centrifugation tubes. The lysate was again centrifuged
under the same conditions. The supernatant was then collected into fresh, pre-chilled falcons.
The lysate was diluted using buffer A such that a hundred-fold dilution had an A280 of 0.585.
The extract was gently layered onto a sucrose cushion to fill the other half of pre-chilled Ti70
tubes. Buffer A was used for balancing. The tubes were centrifuged at 90,000 x g and 4 °C for
18 hours overnight and put on ice afterwards.
The supernatant was transferred to new pre-chilled Ti70 tubes. This time, S150 buffer (Table
8) was used to balance the tubes which were subsequently centrifuged at 150,000 x g and 4 °C
for 3 hours. 2/3 of the supernatant were then transferred into fresh pre-chilled falcons. This
was the unprocessed S150 extract. The remaining 1/3 supernatant were used to measure A280
an A260 of hundred-fold dilutions to ensure that no sample was lost. The unprocessed S150
extract was transferred to a SnakeSkin dialysis tubing (MWCO 3,500) and dialyzed twice
against 3 L S150 buffer for 1.5 h at 4 °C. The 3rd dialysis was done in a fresh 3 L bath of
S150 buffer at 4 °C for 16 h.
The ribosome-containing pellet from the overnight centrifugation was rinsed with buffer C (
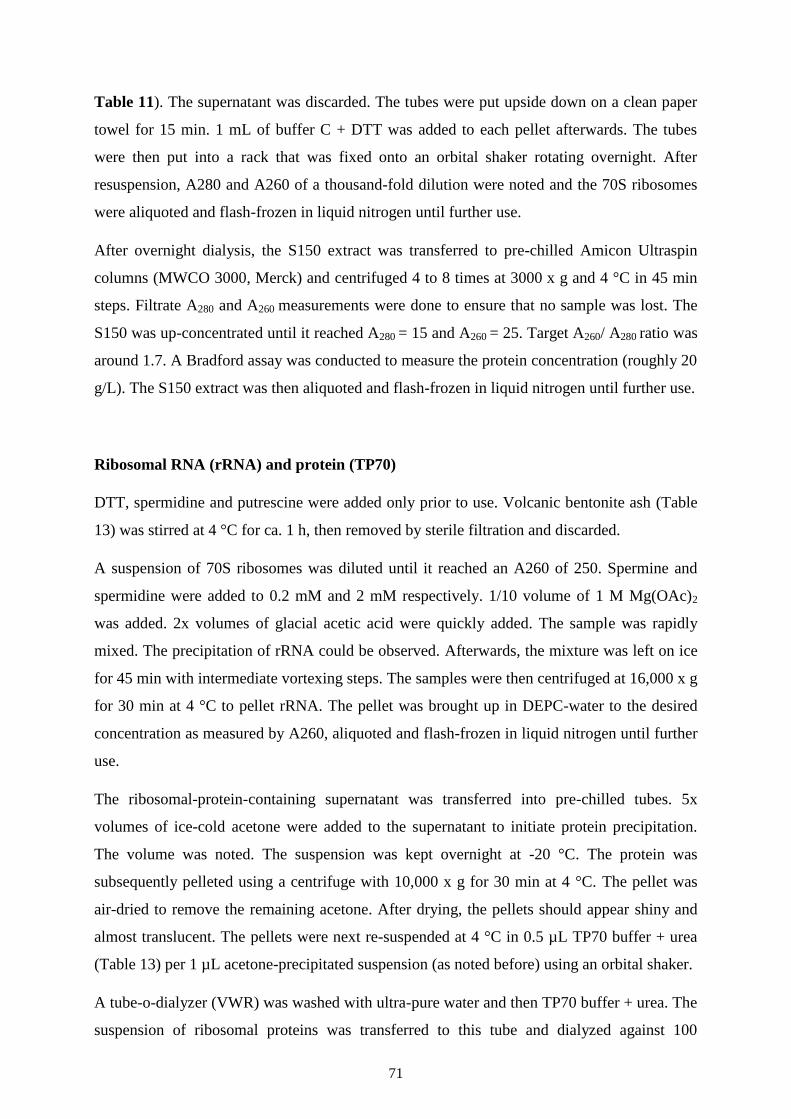
71
Table 11). The supernatant was discarded. The tubes were put upside down on a clean paper
towel for 15 min. 1 mL of buffer C + DTT was added to each pellet afterwards. The tubes
were then put into a rack that was fixed onto an orbital shaker rotating overnight. After
resuspension, A280 and A260 of a thousand-fold dilution were noted and the 70S ribosomes
were aliquoted and flash-frozen in liquid nitrogen until further use.
After overnight dialysis, the S150 extract was transferred to pre-chilled Amicon Ultraspin
columns (MWCO 3000, Merck) and centrifuged 4 to 8 times at 3000 x g and 4 °C in 45 min
steps. Filtrate A280 and A260 measurements were done to ensure that no sample was lost. The
S150 was up-concentrated until it reached A280 = 15 and A260 = 25. Target A260/ A280 ratio was
around 1.7. A Bradford assay was conducted to measure the protein concentration (roughly 20
g/L). The S150 extract was then aliquoted and flash-frozen in liquid nitrogen until further use.
Ribosomal RNA (rRNA) and protein (TP70)
DTT, spermidine and putrescine were added only prior to use. Volcanic bentonite ash (Table
13) was stirred at 4 °C for ca. 1 h, then removed by sterile filtration and discarded.
A suspension of 70S ribosomes was diluted until it reached an A260 of 250. Spermine and
spermidine were added to 0.2 mM and 2 mM respectively. 1/10 volume of 1 M Mg(OAc)2
was added. 2x volumes of glacial acetic acid were quickly added. The sample was rapidly
mixed. The precipitation of rRNA could be observed. Afterwards, the mixture was left on ice
for 45 min with intermediate vortexing steps. The samples were then centrifuged at 16,000 x g
for 30 min at 4 °C to pellet rRNA. The pellet was brought up in DEPC-water to the desired
concentration as measured by A260, aliquoted and flash-frozen in liquid nitrogen until further
use.
The ribosomal-protein-containing supernatant was transferred into pre-chilled tubes. 5x
volumes of ice-cold acetone were added to the supernatant to initiate protein precipitation.
The volume was noted. The suspension was kept overnight at -20 °C. The protein was
subsequently pelleted using a centrifuge with 10,000 x g for 30 min at 4 °C. The pellet was
air-dried to remove the remaining acetone. After drying, the pellets should appear shiny and
almost translucent. The pellets were next re-suspended at 4 °C in 0.5 µL TP70 buffer + urea
(Table 13) per 1 µL acetone-precipitated suspension (as noted before) using an orbital shaker.
A tube-o-dialyzer (VWR) was washed with ultra-pure water and then TP70 buffer + urea. The
suspension of ribosomal proteins was transferred to this tube and dialyzed against 100
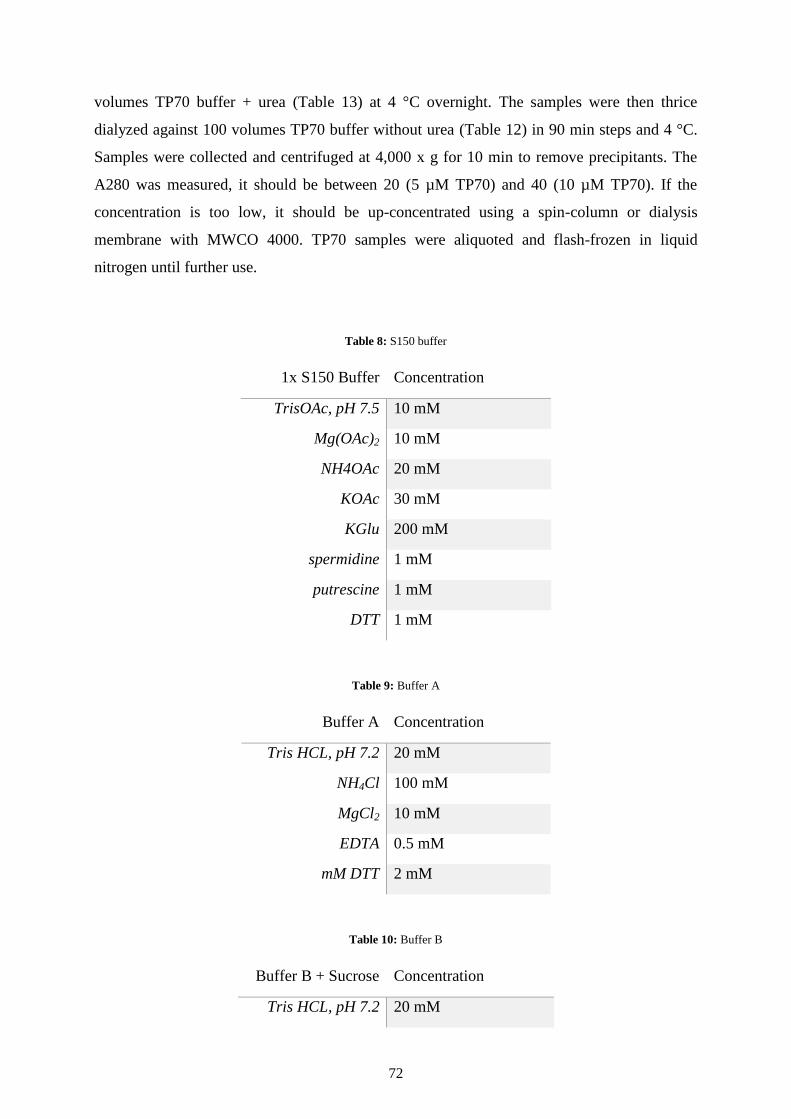
72
volumes TP70 buffer + urea (Table 13) at 4 °C overnight. The samples were then thrice
dialyzed against 100 volumes TP70 buffer without urea (Table 12) in 90 min steps and 4 °C.
Samples were collected and centrifuged at 4,000 x g for 10 min to remove precipitants. The
A280 was measured, it should be between 20 (5 µM TP70) and 40 (10 µM TP70). If the
concentration is too low, it should be up-concentrated using a spin-column or dialysis
membrane with MWCO 4000. TP70 samples were aliquoted and flash-frozen in liquid
nitrogen until further use.
Table 8: S150 buffer
1x S150 Buffer Concentration
TrisOAc, pH 7.5 10 mM
Mg(OAc)2 10 mM
NH4OAc 20 mM
KOAc 30 mM
KGlu 200 mM
spermidine 1 mM
putrescine 1 mM
DTT 1 mM
Table 9: Buffer A
Buffer A Concentration
Tris HCL, pH 7.2 20 mM
NH4Cl 100 mM
MgCl2 10 mM
EDTA 0.5 mM
mM DTT 2 mM
Table 10: Buffer B
Buffer B + Sucrose Concentration
Tris HCL, pH 7.2 20 mM
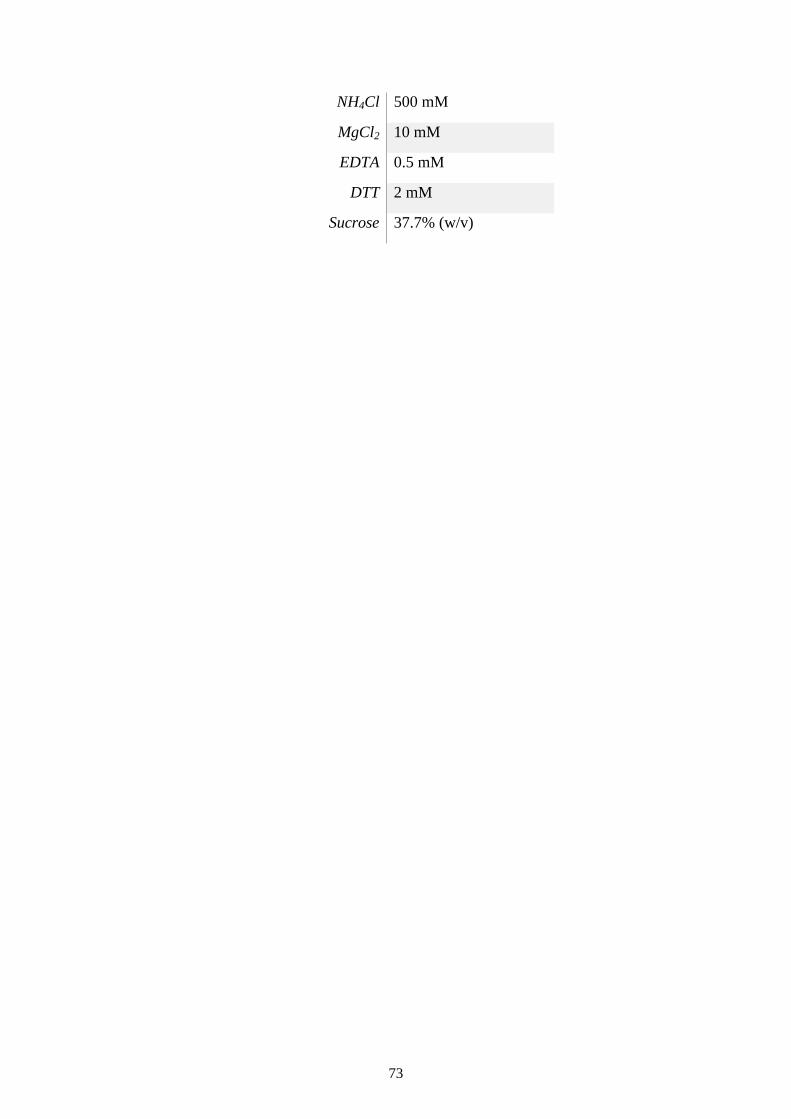
73
NH4Cl 500 mM
MgCl2 10 mM
EDTA 0.5 mM
DTT 2 mM
Sucrose 37.7% (w/v)
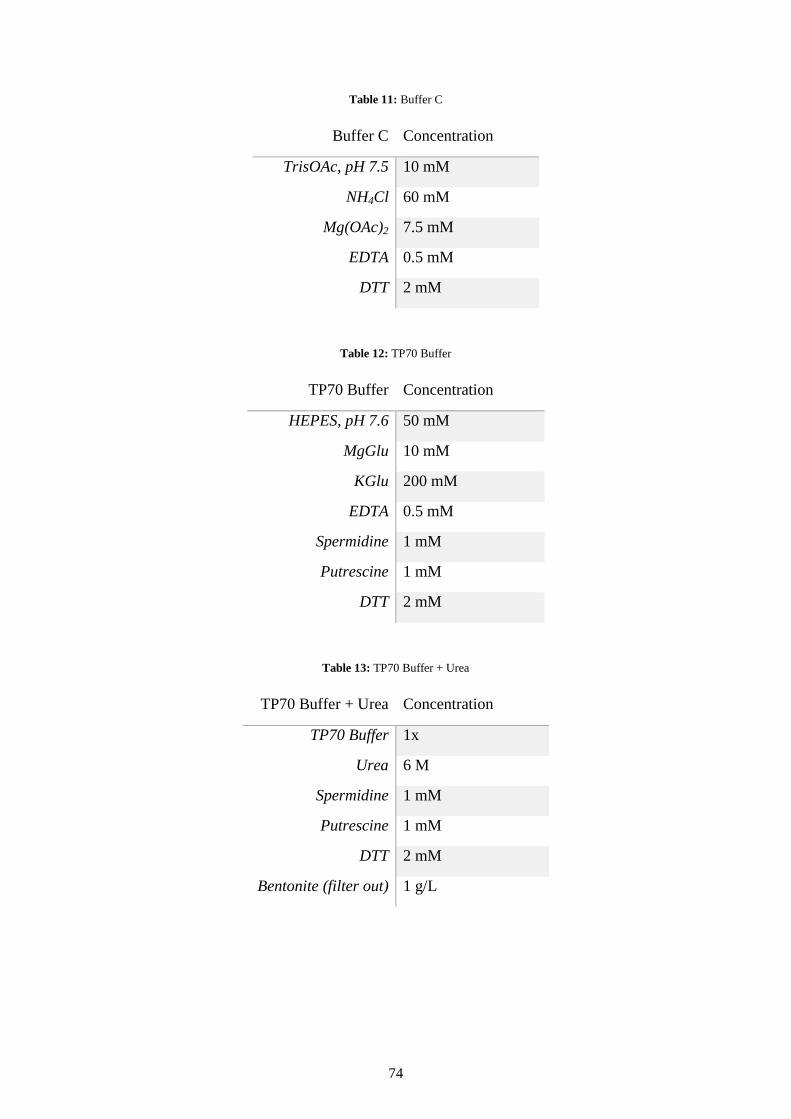
74
Table 11: Buffer C
Buffer C Concentration
TrisOAc, pH 7.5 10 mM
NH4Cl 60 mM
Mg(OAc)2 7.5 mM
EDTA 0.5 mM
DTT 2 mM
Table 12: TP70 Buffer
TP70 Buffer Concentration
HEPES, pH 7.6 50 mM
MgGlu 10 mM
KGlu 200 mM
EDTA 0.5 mM
Spermidine 1 mM
Putrescine 1 mM
DTT 2 mM
Table 13: TP70 Buffer + Urea
TP70 Buffer + Urea Concentration
TP70 Buffer 1x
Urea 6 M
Spermidine 1 mM
Putrescine 1 mM
DTT 2 mM
Bentonite (filter out) 1 g/L

75
V Self-compartmentalization

76
V-1 Introduction
Compartmentalization is a prerequisite for minimal cells. The compartment forms a physical
boundary separating cytoplasm and environment to maintain non-equilibrium dynamics via
chemical homeostasis, whilst facilitating the effective coupling of genotype and phenotype.50
Hence, the compartmentalization of self-replicators is an absolutely crucial prerequisite for
Darwinian evolution.10,47
Without physical boundaries between replicators, weaker or defunct
mutants would eventually cause the entire population to collapse.48,49
In cells, the cytoplasm is encapsulated by a lipid bilayer membrane which is synthesized by
an elaborate metabolism.12
Producing such a membrane requires a lot of energy in the form of
ATP, GTP and lipid building blocks.13
Cells meet the majority of this demand by exploiting
gradients of electrochemical potential across pre-existing membranes.51,52
So-called electron-
transport chains fuel the recycling of ATP as a chemical energy storage in mitochondria and
chloroplasts.12,176 This leads to a chicken-and-egg paradox: Lipid biosynthesis is driven by the
energy harvested from membrane-bound engines, which themselves presume already existing
membranes to function. How then did the first membrane-based machinery arise? Has there
been a way of compartmentalization prior to lipid membranes?
The biosynthesis of lipids in PURE has lately been realized using in vitro gene expression of
entire metabolic pathways.177,131
Once encapsulated, the respective enzymes were able to
grow their surrounding membranes by synthesizing more lipids.178
Cell-free protein synthesis
and TTcDR have also been realized in liposomes.80
Yet in all these cases, lipid vesicles had to
be externally provided. The bootstrapping of a minimal cell from scratch however would
require the de novo formation of membrane compartments. In 2019, a self-encoded
biochemical route was devised for the cell-free synthesis of phospholipids which indeed led to
the formation and growth of endogenous liposomes.179
As an alternative to these resource-
intensive synthesis pathways, non-lipid compartments such as polymersomes and
peptidosomes have been developed to grow as a result of in situ gene expression.94,95
Another way of compartmentalization is represented by membrane-less organelles in cells,54
condensates that arise from spontaneous liquid-liquid phase separation of biomolecules into a
dense phase and a dilute phase.55
These so-called coacervates generally consist of tightly
packed, oppositely charged polymers such as polypeptides and RNAs.56
The biological
significance of these molecules has led researchers like Oparin and Haldane to consider
coacervates as potential candidates for the origin of cells.4,53
Intriguingly, the crowded
77
microenvironment in a coacervate still permits RNA catalysis and even gene expression.57,58
Hence, biomolecular condensates such as coacervates have certainly become a viable
alternative to mimic life-like functions such as macromolecular crowding and phase-
separation.57
More so, membrane-less all-DNA protocells were recently reported that sense
and produce signals emulating primitive intercellular communication, growth and divison.180
In chapter II, the occurrence of insoluble particles among TTcDR products was observed
during agarose gel electrophoresis. This chapter will go into more detail about the nature of
these peculiar entities and whether they could be exploited to provide a simple solution for
self-compartmentalization in PURErep.
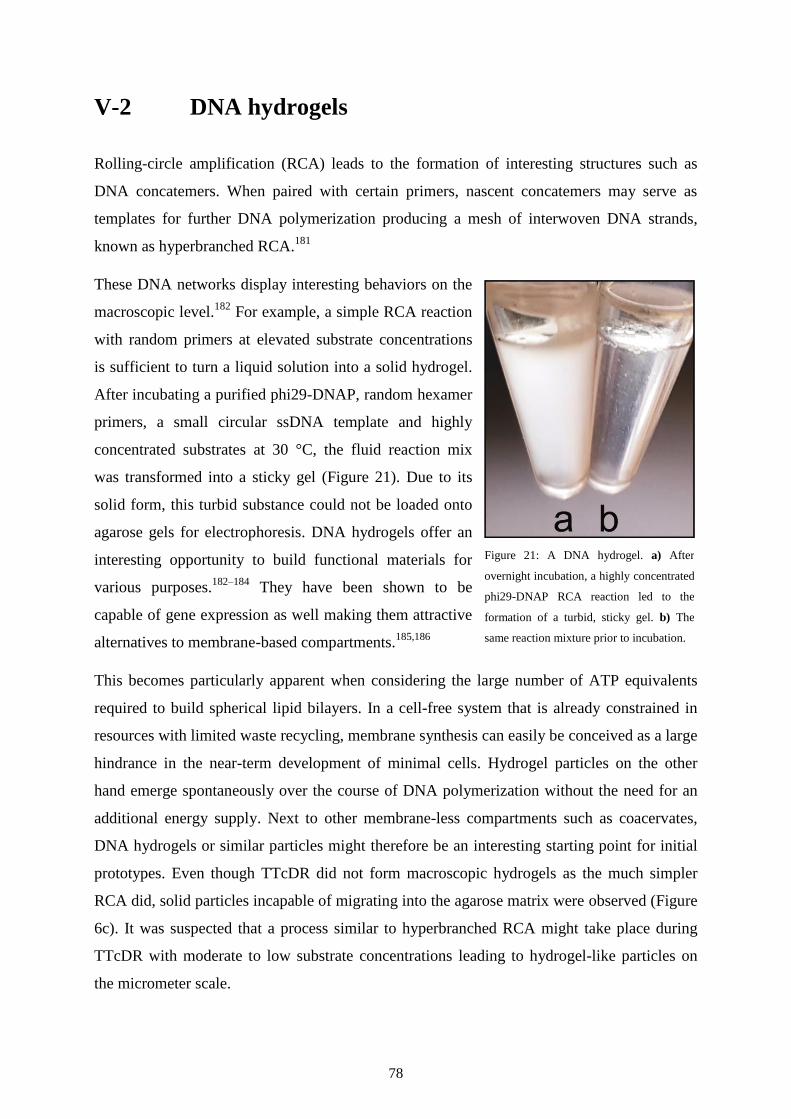
78
V-2 DNA hydrogels
Rolling-circle amplification (RCA) leads to the formation of interesting structures such as
DNA concatemers. When paired with certain primers, nascent concatemers may serve as
templates for further DNA polymerization producing a mesh of interwoven DNA strands,
known as hyperbranched RCA.181
These DNA networks display interesting behaviors on the
macroscopic level.182
For example, a simple RCA reaction
with random primers at elevated substrate concentrations
is sufficient to turn a liquid solution into a solid hydrogel.
After incubating a purified phi29-DNAP, random hexamer
primers, a small circular ssDNA template and highly
concentrated substrates at 30 °C, the fluid reaction mix
was transformed into a sticky gel (Figure 21). Due to its
solid form, this turbid substance could not be loaded onto
agarose gels for electrophoresis. DNA hydrogels offer an
interesting opportunity to build functional materials for
various purposes.182–184
They have been shown to be
capable of gene expression as well making them attractive
alternatives to membrane-based compartments.185,186
This becomes particularly apparent when considering the large number of ATP equivalents
required to build spherical lipid bilayers. In a cell-free system that is already constrained in
resources with limited waste recycling, membrane synthesis can easily be conceived as a large
hindrance in the near-term development of minimal cells. Hydrogel particles on the other
hand emerge spontaneously over the course of DNA polymerization without the need for an
additional energy supply. Next to other membrane-less compartments such as coacervates,
DNA hydrogels or similar particles might therefore be an interesting starting point for initial
prototypes. Even though TTcDR did not form macroscopic hydrogels as the much simpler
RCA did, solid particles incapable of migrating into the agarose matrix were observed (Figure
6c). It was suspected that a process similar to hyperbranched RCA might take place during
TTcDR with moderate to low substrate concentrations leading to hydrogel-like particles on
the micrometer scale.
Figure 21: A DNA hydrogel. a) After
overnight incubation, a highly concentrated
phi29-DNAP RCA reaction led to the
formation of a turbid, sticky gel. b) The
same reaction mixture prior to incubation.
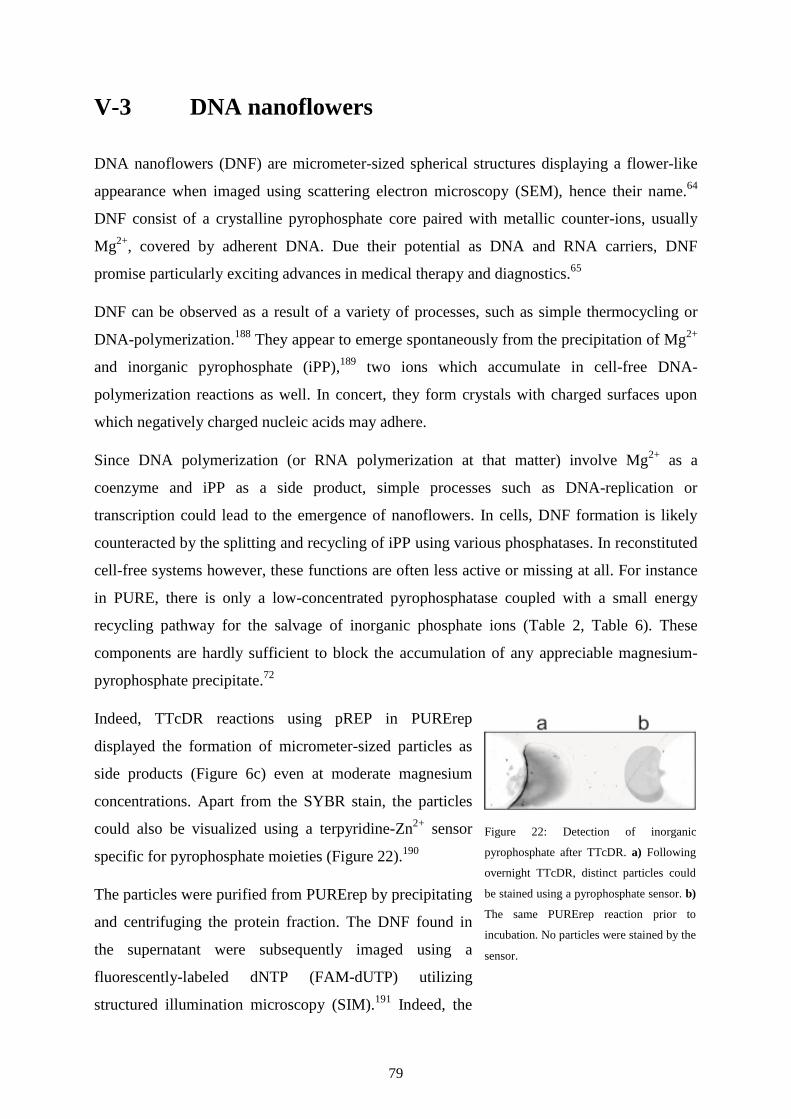
79
V-3 DNA nanoflowers
DNA nanoflowers (DNF) are micrometer-sized spherical structures displaying a flower-like
appearance when imaged using scattering electron microscopy (SEM), hence their name.64
DNF consist of a crystalline pyrophosphate core paired with metallic counter-ions, usually
Mg2+
, covered by adherent DNA. Due their potential as DNA and RNA carriers, DNF
promise particularly exciting advances in medical therapy and diagnostics.65
DNF can be observed as a result of a variety of processes, such as simple thermocycling or
DNA-polymerization.188
They appear to emerge spontaneously from the precipitation of Mg2+
and inorganic pyrophosphate (iPP),189
two ions which accumulate in cell-free DNA-
polymerization reactions as well. In concert, they form crystals with charged surfaces upon
which negatively charged nucleic acids may adhere.
Since DNA polymerization (or RNA polymerization at that matter) involve Mg2+
as a
coenzyme and iPP as a side product, simple processes such as DNA-replication or
transcription could lead to the emergence of nanoflowers. In cells, DNF formation is likely
counteracted by the splitting and recycling of iPP using various phosphatases. In reconstituted
cell-free systems however, these functions are often less active or missing at all. For instance
in PURE, there is only a low-concentrated pyrophosphatase coupled with a small energy
recycling pathway for the salvage of inorganic phosphate ions (Table 2, Table 6). These
components are hardly sufficient to block the accumulation of any appreciable magnesium-
pyrophosphate precipitate.72
Indeed, TTcDR reactions using pREP in PURErep
displayed the formation of micrometer-sized particles as
side products (Figure 6c) even at moderate magnesium
concentrations. Apart from the SYBR stain, the particles
could also be visualized using a terpyridine-Zn2+
sensor
specific for pyrophosphate moieties (Figure 22).190
The particles were purified from PURErep by precipitating
and centrifuging the protein fraction. The DNF found in
the supernatant were subsequently imaged using a
fluorescently-labeled dNTP (FAM-dUTP) utilizing
structured illumination microscopy (SIM).191
Indeed, the
Figure 22: Detection of inorganic
pyrophosphate after TTcDR. a) Following
overnight TTcDR, distinct particles could
be stained using a pyrophosphate sensor. b)
The same PURErep reaction prior to
incubation. No particles were stained by the
sensor.
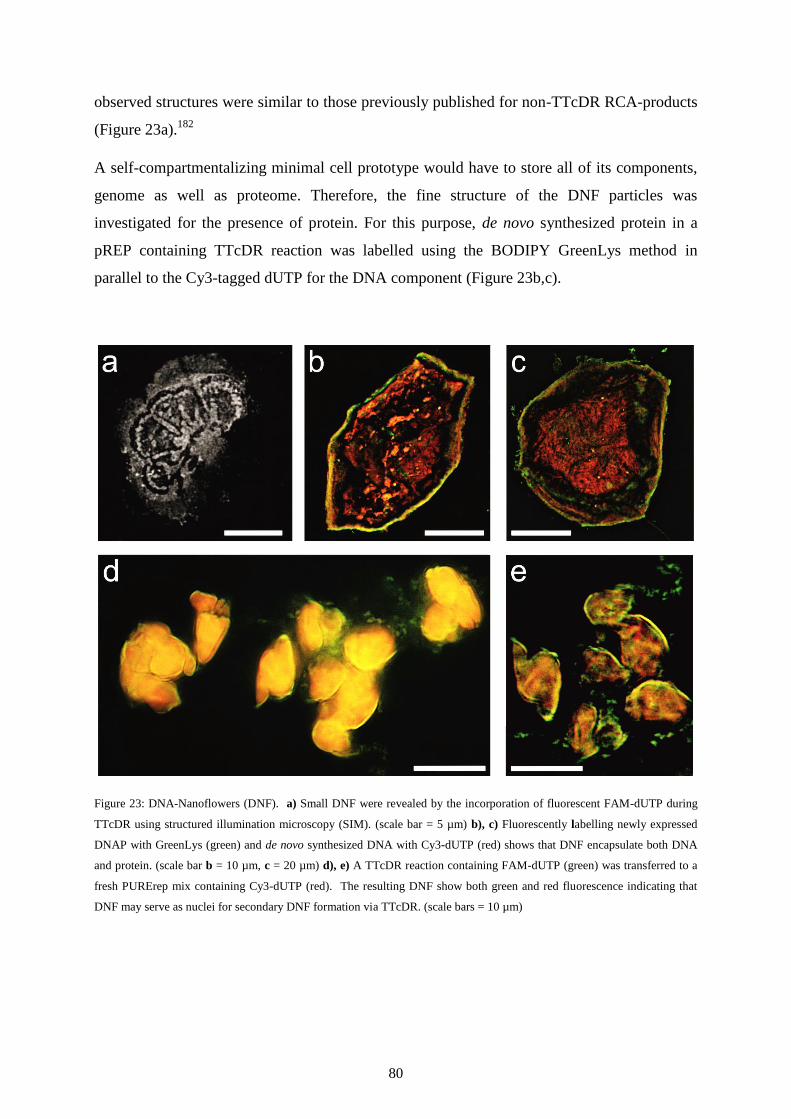
80
observed structures were similar to those previously published for non-TTcDR RCA-products
(Figure 23a).182
A self-compartmentalizing minimal cell prototype would have to store all of its components,
genome as well as proteome. Therefore, the fine structure of the DNF particles was
investigated for the presence of protein. For this purpose, de novo synthesized protein in a
pREP containing TTcDR reaction was labelled using the BODIPY GreenLys method in
parallel to the Cy3-tagged dUTP for the DNA component (Figure 23b,c).
Figure 23: DNA-Nanoflowers (DNF). a) Small DNF were revealed by the incorporation of fluorescent FAM-dUTP during
TTcDR using structured illumination microscopy (SIM). (scale bar = 5 µm) b), c) Fluorescently labelling newly expressed
DNAP with GreenLys (green) and de novo synthesized DNA with Cy3-dUTP (red) shows that DNF encapsulate both DNA
and protein. (scale bar b = 10 µm, c = 20 µm) d), e) A TTcDR reaction containing FAM-dUTP (green) was transferred to a
fresh PURErep mix containing Cy3-dUTP (red). The resulting DNF show both green and red fluorescence indicating that
DNF may serve as nuclei for secondary DNF formation via TTcDR. (scale bars = 10 µm)
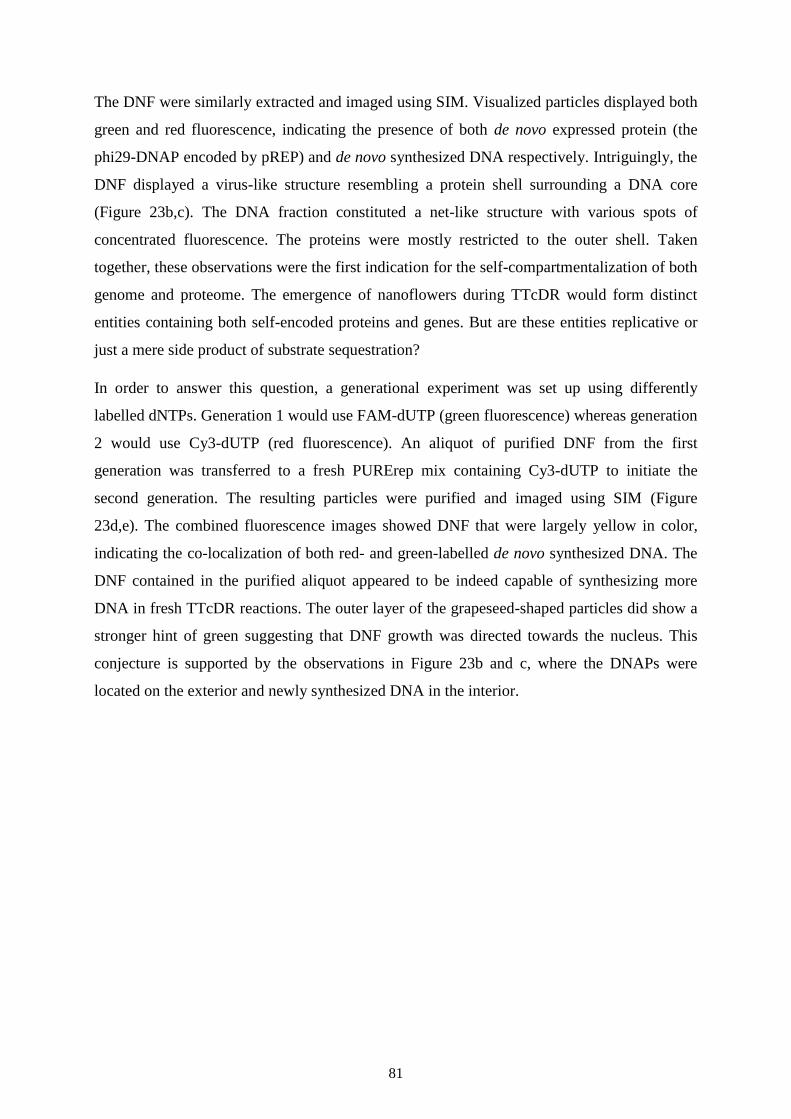
81
The DNF were similarly extracted and imaged using SIM. Visualized particles displayed both
green and red fluorescence, indicating the presence of both de novo expressed protein (the
phi29-DNAP encoded by pREP) and de novo synthesized DNA respectively. Intriguingly, the
DNF displayed a virus-like structure resembling a protein shell surrounding a DNA core
(Figure 23b,c). The DNA fraction constituted a net-like structure with various spots of
concentrated fluorescence. The proteins were mostly restricted to the outer shell. Taken
together, these observations were the first indication for the self-compartmentalization of both
genome and proteome. The emergence of nanoflowers during TTcDR would form distinct
entities containing both self-encoded proteins and genes. But are these entities replicative or
just a mere side product of substrate sequestration?
In order to answer this question, a generational experiment was set up using differently
labelled dNTPs. Generation 1 would use FAM-dUTP (green fluorescence) whereas generation
2 would use Cy3-dUTP (red fluorescence). An aliquot of purified DNF from the first
generation was transferred to a fresh PURErep mix containing Cy3-dUTP to initiate the
second generation. The resulting particles were purified and imaged using SIM (Figure
23d,e). The combined fluorescence images showed DNF that were largely yellow in color,
indicating the co-localization of both red- and green-labelled de novo synthesized DNA. The
DNF contained in the purified aliquot appeared to be indeed capable of synthesizing more
DNA in fresh TTcDR reactions. The outer layer of the grapeseed-shaped particles did show a
stronger hint of green suggesting that DNF growth was directed towards the nucleus. This
conjecture is supported by the observations in Figure 23b and c, where the DNAPs were
located on the exterior and newly synthesized DNA in the interior.
82
V-4 Discussion
Once genome replication, iSAT, transcriptome and proteome regeneration are integrated, self-
compartmentalization might arguably be one of the final steps to build a minimal cell. In this
chapter, a possible route towards the realization of this goal has been explored. The
hyperbranched RCA reaction is known to produce hydrogels at high substrate
concentrations.192
At moderate levels, the side products of DNA replication may precipitate as
magnesium pyrophosphate crystals which serve as nuclei to form DNF via the adherence of
DNA polymers.141
TTcDR reactions such as the one employing pREP and PURErep do also yield DNF as a
result of DNA replication. These particles emerge in addition to the freely diffusing DNA
concatemers and are capable of encapsulating DNA as well as protein molecules. The capture
of RNA molecules such as mRNA, tRNA or rRNA remains to be clarified, yet stands as a
crucial factor for complete self-compartmentalization. Purified DNF may further spawn new
DNF via the expression of a self-encoded DNAP that initiates DNA-replication and
subsequent DNF formation.
Hydrogel particles could serve as another alternative for membrane-free compartments.193
Zhou et al. recently demonstrated long-lived cell-free protein-synthesis in small
polyacrylamide gel particles.186
The polymer backbone was functionalized with nickel (II)–
nitrilotriacetic acid (Ni2+
–NTA) moieties to co-localize his-tagged proteins of the PURE
system. By continuously supplying reaction substrates, the expression of genes was kept
constant and lasted around 11 days. Still, these particles lacked the ability to trap nucleic acids
rendering them less attractive than DNF in regards to a minimal cell design.186
Synthetic biomimicry does not have to be confined to the concept of cell-based life forms
however. One can envision the development of a DNA hydrogel-based bio-mimic, not much
unlike plasmodial slime mold. Here, a hydrogel from functionalized DNA could give rise to a
physical matrix separate from its environment that permits the diffusion of substrates and
waste products. Genes would be encoded on structural elements to be expressed right where
their products are needed. This way, sub-localization of functional modules could be achieved
by various genes at different sites of the gel. Essential proteins and other macromolecules
would have to be trapped in this matrix as well, but as the DNF experiments in this study and
others have shown,194
they might adhere to the matrix even without the need for
functionalized moieties.
83
Other interesting candidates for the self-compartmentalization of minimal cells were not yet
explored in this study. Membrane-free compartments such as coacervates have been
considered as putative precursors to cellular life on Earth.53
These condensates form
spontaneously from the liquid-liquid phase separation between polar macromolecules of
opposite charge and their aqueous environment.56
Their components tend to be long polymers
with charged residues, such as polypetides (proteins) and RNA. Coacervates have been shown
to encapsulate other biomolecules and to allow biologically relevant processes such as
catalysis, gene expression and RNA replication.57,58
Amphiphilic elastin-like peptides (ELPs) self-assemble spontaneously into non-lipid vesicles,
another interesting candidate for self-compartmentalization.195
ELPs can be directly encoded
within the genome as opposed to the metabolic pathways required for natural lipids, making
them an alternative to regular membrane-based liposomes, so-called polymersomes.95
It was
recently shown that these vesicles can encapsulate and maintain entire cell-free protein
synthesis systems enabling the in situ expression of ELPs to further drive polymersome
growth.94,96
Water-in-oil emulsions have also been explored for the development of minimal cell
mimics.175
Large amounts of aqueous picoliter (pL) droplets were produced in particular using
microfluidic chips and encapsulated cell-free gene expression systems like PURE or
extracts.196
Further emulsification of the oil phase has led to the synthesis of entire liposomes
with semipermeable membranes and to the formation of reaction containers with membrane-
based ATP regeneration systems resembling cellular respiration.175,197
Being the sole standard among cellular life, lipid membranes are of course to be considered
for the construction of a minimal cell in the long run. Other groups have already demonstrated
that the amplification of DNA is feasible in self-reproducing lipid vesicles.91
TTcDR has also
been realized in liposomes yet without displaying either growth or division.80
Furthermore,
the synthesis of lipids in vesiculo was carried out from simple precursors in an encapsulated
cell-free protein synthesis system using eight self-encoded enzymes.177
Endogenous
membrane reconfiguration is not limited to lipid biosynthesis either, entire protein pores have
been synthesized and integrated in vesiculo.71
Liposomes require a delicately balanced osmotic pressure to prevent bursting.80
In addition,
the demand of energy expenditure to build lipid membranes far exceeds current limitations in
cell-free systems. To illustrate, consider a theoretical minimal cell bootstrapping in a 1
femtoliter (fL) volume (roughly the size of E. coli).135,198
Approximately 23 ATP molecules
84
are required to make 1 lipid molecule (palmitic acid) from acetyl-coenzyme A precursors.199
An E. coli cell contains roughly 2.2e7 lipid molecules, leading to an estimated 5.6e8
molecules or 0.93 fmol of ATP equivalents to build one full membrane per cell.200
Normally, one ATP molecule may get recycled to be used more than once in the cell. But in
order to compare the cell with the PURE system, it is necessary to disregard ATP recycling
due to the lack of any considerable salvage mechanism in PURE (f. e. the citric acid cycle).
Hence, if all substrates were present initially and recycling was neglected, these 0.93 fmol
divided by a cellular volume of 1 fL would equal a concentration of 0.93 M or 930 mM ATP
equivalents.
Adding the NTPs and creatine phosphate molecules supplied with the PURE system (Table 5)
leads to an initial supply of 26 mM ATP equivalents at 1x concentration. Not taking into
account any metabolic inefficiency, this is just 3% of the 930 mM required to build a
membrane surrounding a PURE-based cell. Already this is not enough, and ATP equivalents
are further consumed during transcription, translation and DNA-replication. It has become
apparent that the implementation of ATP recycling is one of the immediate next steps in
liposome-based minimal cell development
Of course, the 0.93 fmol of ATP equivalents may originate from a reaction volume far larger
than 1 fL thus relaxing concentration requirements. For a minimal cell bootstrapping in a
larger vessel with an excess of substrates, the issue becomes rather one of molecular self-
organization. How could the self-compartmentalization of fL-sized membrane-based cells be
directed on the molecular level?
85
V-5 Methods
DNA hydrogel formation
DNA hydrogels were synthesized over night at 30 °C in a mixture of 5 µL circular ssDNA
template at 0.6 µM final concentration, 1 µM random hexamers, phi29-DNAP (NEB) at 1
u/µL final concentration, 5 µL phi29-buffer (NEB), 2 µL 25 mM dNTP mix and ddH2O ad 25
µL. After incubation, the gelled solution was turbid and sticky to the point that it could not be
pipetted.
DNF purification and analysis
DNF were formed according to the following protocol: 2.5 µL of 10x energy mix (10xEM,
Table 1) were mixed with 1 µL Solution A (PURExpress), 15 µL Solution B (PURExpress),
0.5 µL 50x rNTP mix (18.75 mM ATP, 12.5 mM GTP, 6.25 mM UTP, 6.25 mM CTP), 0.6
µL 25 mM dNTP mix, 556 ng pREP and ddH2O ad 25 µL. Optionally, de novo synthesized
DNA or protein could be labelled using Cy3-dUTP (Thermofisher), FAM-dUTP
(Thermofisher) or BODIPY GreenLys (Promega) according to the manufacturers’
instructions. After overnight incubation at 30 °C, the reaction was quenched by heating at
65 °C for 10 minutes. After centrifugation for 5 min at 5000 rcf, the DNF were found in the
supernatant. The pellet contained denatured PURE proteins. The DNF were visualized using a
Zeiss Elyra fluorescence microscope equipped with a SIM (Structured Illumination
Microscopy) module, two high-frequency cameras and an image splitter. All microscopy
images were analyzed using the Zen software package (Zeiss).
The terpyridine-Zn2+
pyrophosphate sensor was synthesized by Stephan Uebel (Core Facility,
MPI of Biochemistry) according to Bhowmik et al.190
The generation experiment illustrated in Figure 23d,e followed the same protocol as above.
For the second generation, a naïve (no template containing) PURErep mix was inoculated
with 2 µL of the supernatant from generation 1 to yield a fresh 25 µL reaction. A different
dNTP label was used for each generation to differentiate de novo synthesized DNF.
86
VI Conclusion
What is life? This study was one amongst many efforts to contemplate this question, but
followed Feyman’s principle of understanding through creating.60
In this work, the attempt of
building the most basic living entity, a minimal cell, elucidated some fascinating of aspects
ranging from self-replication to self-organization.
First, genome self-replication was established using the new PURErep transcription-
translation-coupled DNA replication (TTcDR) system.97
It was shown that PURErep
facilitated the co-replication of more than the 113 kbp necessary to genetically encode the
minimal cell genome proposed by Forster and Church.2 The replication products could
propagate both in vitro and in vivo whilst persisting over several division cycles, as emulated
via serial dilution. A next step would be the replacement of inactive backbone parts with
essential genes and regulatory sequences. In the long-term, other modules such as ATP
regeneration and ribosome maturation would have to be included. For genome expansion, the
integration of all plasmids into one or more artificial chromosomes (BACs/YACs) might be
an attractive solution.109,110
Proteome self-regeneration was presented and discussed in the subsequent chapter. It was
revealed that higher protein synthesis yields coupled with regulated gene expression were
necessary means. So far, the PURE system was capable of regenerating individual proteins or
sets of low-concentrated translation factors for up to three generations. It was illustrated that
the next candidates for genome expansion should be energy recycling and waste relay
systems. This way, the system could bootstrap itself to become energy-sufficient given a
constant influx of resources and disposal of waste. In particular, the sequestration of crucial
Mg2+
coenzymes by pyrophosphate side products would decrease the synthesis rates until it
halted altogether.87
A simple ATP salvage system such as mixed acid fermentation might be
sufficient to both recycle chemical energy and relay waste products to a more manageable
form.142
The creation of a minimal cell that runs on the central dogma necessitates the coupling of
TTcDR with the integrated synthesis, assembly, and translation (iSAT)152
of endogenous
ribosomes. However, TTcDR is not compatible with the S150 extract that iSAT is based on,
whereas iSAT appears to be unsuitable for PURE systems. The issue was elaborated and
possible solutions were discussed, such as the integration of ribosome maturation factors in
87
PURE or the addition of nuclease inhibitors in S150. Similarly to the yield problem in the
proteome regeneration chapter, more efficient resource recycling systems or dialysis micro-
reactors would be required to co-generate all the parts required for ribosome assembly.130
Even if transcription-translation-coupled DNA-replication from endogenous ribosomes
(TTcDRR) was realized, a piece to the puzzle would still remain: self-compartmentalization.
Various models to achieve this feat were discussed, the current favorite being DNA
nanoflowers (DNF).194
These micron-sized particles arose spontaneously from the
precipitation of TTcDR side products, phosphate and pyrophosphate. Indeed, the
aforementioned sequestration of Mg2+
-ions might be exploited to form distinct entities
encapsulating both genome and proteome. Initial experiments showed that DNF were defined
by an outer protein shell and an inner DNA core which could be propagated over several
generations. DNF formation provided the benefit of not consuming additional resources while
simultaneously abolishing the need for template form adherent DNA replication. Even if not
all proteins and genes were encapsulated into a single entity, DNF consortia equipped with
different genes and proteins might manage to replicate in a cooperative fashion. Of course,
this route would stray from the initial objective of a minimal membrane-encapsulated cell, but
might nevertheless form a biomimetic entity reminiscent of slime molds or giant cells.201,202
Taken together, this work demonstrated that the construction of a chemoton according to
Gánti is very much conceivable.18
The modules information (genome) and metabolism
(proteome) and compartment (DNF) were shown to at least partially self-replicate in vitro.
Still, various challenges remain, in particular the enhancement of cell-free protein synthesis.
Current yields fall well behind to what was required for complete self-regeneration. The
expression strengths of highly concentrated factors will have to be modulated using gene
regulation and more efficient energy recycling systems. Promising advances were recently
published,21,197
although truly autonomous systems would have to sustain themselves without
the external support of non-encoded dialysis chambers, micro-reactors or organelles. Yet
another challenge was raised by the efficient implementation of iSAT in a TTcDR system
which so far remained out of reach. This development would arguably be the most time
consuming due to the multitude of ribosomal parts and modifications involved.
Nevertheless, the last decade has seen tremendous strides being made towards the creation of
a synthetic, minimal cell. Many issues solving the puzzle might still lie ahead, but its pieces
have begun to fall into place. Thus, it seems entirely plausible that the first synthetic cell will
see the light of day in the not too distant future.
88
Kein Wesen kann zu Nichts zerfallen!
Das Ew’ge regt sich fort in allen,
Am Sein erhalte dich beglückt!
Das Sein ist ewig; denn Gesetze
Bewahren die lebend’gen Schätze,
Aus welchen sich das All geschmückt.
Vermächtnis, J.W. Goethe 203
89
VII Bibliography
1. Goethe, J. W. Poetische Werke - Berliner Ausgabe Band 1. (Aufbau-Verlag,
1960).
2. Forster, A. C. & Church, G. M. Towards synthesis of a minimal cell. Mol. Syst.
Biol. 2, 45 (2006).
3. Schrödinger, E. What Is Life? The Physical Aspect of the Living Cell.
(Cambridge University Press, 1944).
4. Haldane, J. B. S. Origin of Life. Ration. Annu. 148, (1929).
5. Miller, S. L. & Urey, H. C. Organic compound synthesis on the primitive earth.
Science (80-. ). 130, 245–251 (1959).
6. Tsokolov, S. A. Why is the definition of life so elusive? Epistemological
considerations. Astrobiology 9, 401–412 (2009).
7. Benner, S. A. Defining life. Astrobiology 10, 1021–1030 (2010).
8. Koonin, E. V. & Starokadomskyy, P. Are viruses alive? The replicator paradigm
sheds decisive light on an old but misguided question. Stud. Hist. Philos. Sci.
Part C Stud. Hist. Philos. Biol. Biomed. Sci. 59, 125–134 (2016).
9. Moir, A. & Cooper, G. Spore Germination. Microbiol. Spectr. 3, (2015).
10. Darwin, C. On the Origin of Species by Means of Natural Selection. (1859).
11. Hudson, J. L. & Mankin, J. C. Chaos in the Belousov-Zhabotinskii reaction. J.
Chem. Phys. 74, 6171–6177 (1981).
12. Bruce Alberts, Alexander Johnson, Julian Lewis, Martin Raff, Keith Roberts,
and P. W. Molecular Biology of the Cell. Garland Science, NY
https://www.ncbi.nlm.nih.gov/books/NBK21054/ (2002).
13. Donald Voet, J. G. Voet Biochemistry. (Wiley, 2011).
14. Avery, O. T., Macleod, C. M. & McCarty, M. Studies on the chemical nature of
the substance inducing transformation of pneumococcal types: Induction of
transformation by a desoxyribonucleic acid fraction isolated from pneumococcus
type III. J. Exp. Med. 149, 297–326 (1979).
15. Jiménez-Chillarón, J. C., Díaz, R. & Ramón-Krauel, M. Omics Tools for the
Genome-Wide Analysis of Methylation and Histone Modifications. in
Comprehensive Analytical Chemistry vol. 63 81–110 (Elsevier B.V., 2014).
16. Hofstadter, D. R. Godel, Escher, Bach: An Eternal Golden Braid. Basic Books
vol. 77 (Basic Books, 1979).
17. Theobald, D. L. A formal test of the theory of universal common ancestry.
Nature 465, 219–222 (2010).
90
18. Ganti, T. The Principles of Life. (Oxford University Press, 2003).
19. Neumann, J. V. A Model of General Economic Equilibrium. Rev. Econ. Stud.
13, 1 (1945).
20. von Neumann, J. The general and logical theory of automata. in Cerebral
mechanisms in behavior; the Hixon Symposium. 1–41 (Wiley, 1951).
21. Lavickova, B., Laohakunakorn, N. & Maerkl, S. J. A partially self-regenerating
synthetic cell. Nat. Commun. 1–11 (2020) doi:10.1038/s41467-020-20180-6.
22. Kauffman, S. A. At home in the universe. (Oxford University Press, 1995).
23. Turing, A. The chemical basis of morphogenesis. Philos. Trans. R. Soc. Lond. B.
Biol. Sci. 237, 37–72 (1952).
24. Cech, T. The chemistry of self-splicing RNA and RNA enzymes. Science (80-. ).
236, 1532–1539 (1987).
25. Lincoln, T. A. & Joyce, G. F. Self-sustained replication of an RNA enzyme.
Science (80-. ). 323, 1229–1232 (2009).
26. Rich, A. On the problems of evolution and biochemical information transfer.
Horizons Biochem. 103–126. (1962).
27. Wochner, A., Attwater, J., Coulson, A. & Holliger, P. Ribozyme-catalyzed
transcription of an active ribozyme. Science (80-. ). 332, 209–212 (2011).
28. Palade, G. E. A small particulate component of the cytoplasm. J. Biophys.
Biochem. Cytol. 1, 59–68 (1955).
29. Engwerda, A. H. J. & Fletcher, S. P. A molecular assembler that produces
polymers. Nat. Commun. 11, (2020).
30. Crick, F. Central dogma of molecular biology. Nature 227, 561–563 (1970).
31. Cech, T. R. The ribosome is a ribozyme. Science vol. 289 878–879 (2000).
32. Root-Bernstein, R. & Root-Bernstein, M. The ribosome as a missing link in
prebiotic evolution II: Ribosomes encode ribosomal proteins that bind to
common regions of their own mRNAs and rRNAs. J. Theor. Biol. 397, 115–127
(2016).
33. Lilley, D. M. . The origins of RNA catalysis in ribozymes. Trends Biochem. Sci.
28, 495–501 (2003).
34. Haruna, I., Nozu, K., Ohtaka, Y. & Spiegelman, S. An RNA ‘Replicase’ induced
by and selective for a viral RNA: Isolation and Properties. Proc. Natl. Acad. Sci.
U. S. A. 50, 905–11 (1963).
35. Spiegelman, S., Haruna, I., Holland, I. B., Beaudreau, G. & Mills, D. The
synthesis of a self-propagating and infectious nucleic acid with a purified
enzyme. Proc. Natl. Acad. Sci. U. S. A. 54, 919–27 (1965).
36. Ellington, A. D. & Szostak, J. W. In vitro selection of RNA molecules that bind
specific ligands. Nature 346, 818–822 (1990).
91
37. Tuerk, C. & Gold, L. Systematic evolution of ligands by exponential
enrichment: RNA ligands to bacteriophage T4 DNA polymerase. Science (80-. ).
249, 505–510 (1990).
38. Eigen, M. Selforganization of matter and the evolution of biological
macromolecules. Naturwissenschaften 58, 465–523 (1971).
39. Eigen, M. & Schuster, P. The hypercycle, a principle of natural self-
organization. (Springer-Verlag, 1979).
40. Eigen, M. & Schuster, P. Stages of emerging life -Five principles of early
organization. J. Mol. Evol. 19, 47–61 (1982).
41. Eigen, M. & Schuster, P. A principle of natural self-organization - Part A:
Emergence of the hypercycle. Naturwissenschaften 64, 541–565 (1977).
42. Piette, B. M. A. G. & Heddle, J. G. A Peptide–Nucleic Acid Replicator Origin
for Life. Trends in Ecology and Evolution vol. 35 397–406 (2020).
43. John von Neumann. Theory of Self-Reproducing Automata. University of
Illinois Press. (Urbana, niversity of Illinois Press., 1966).
44. Cheng, X. & Ferrell, J. E. Spontaneous emergence of cell-like organization in
Xenopus egg extracts. Science (80-. ). 366, 631–637 (2019).
45. Mizuuchi, R. & Ichihashi, N. Sustainable replication and coevolution of
cooperative RNAs in an artificial cell-like system. Nat. Ecol. Evol. 2, 1654–
1660 (2018).
46. Bresch, C., Niesert, U. & Harnasch, D. Hypercycles, parasites and packages. J.
Theor. Biol. 85, 399–405 (1980).
47. Ichihashi, N. et al. Darwinian evolution in a translation-coupled RNA
replication system within a cell-like compartment. Nat. Commun. 4, 2494
(2013).
48. Furubayashi, T. & Ichihashi, N. Sustainability of a Compartmentalized Host-
Parasite Replicator System under Periodic Washout-Mixing Cycles. Life (2018)
doi:10.3390/life8010003.
49. Bansho, Y. et al. Importance of Parasite RNA Species Repression for Prolonged
Translation-Coupled RNA Self-Replication. Chem. Biol. 19, 478–487 (2012).
50. Davidson, E. A., Meyer, A. J., Ellefson, J. W., Levy, M. & Ellington, A. D. An
in vitro Autogene. (2012) doi:10.1021/SB3000113.
51. Anraku, Y. Bacterial Electron Transport Chains. Annu. Rev. Biochem. 57, 101–
132 (1988).
52. Zorova, L. D. et al. Mitochondrial membrane potential. Anal. Biochem. 552, 50–
59 (2018).
53. Oparin, A. I. & Synge, A. The origin of life on the earth. The origin of life on the
earth (Academic Press, 1957). doi:10.5962/bhl.title.4528.
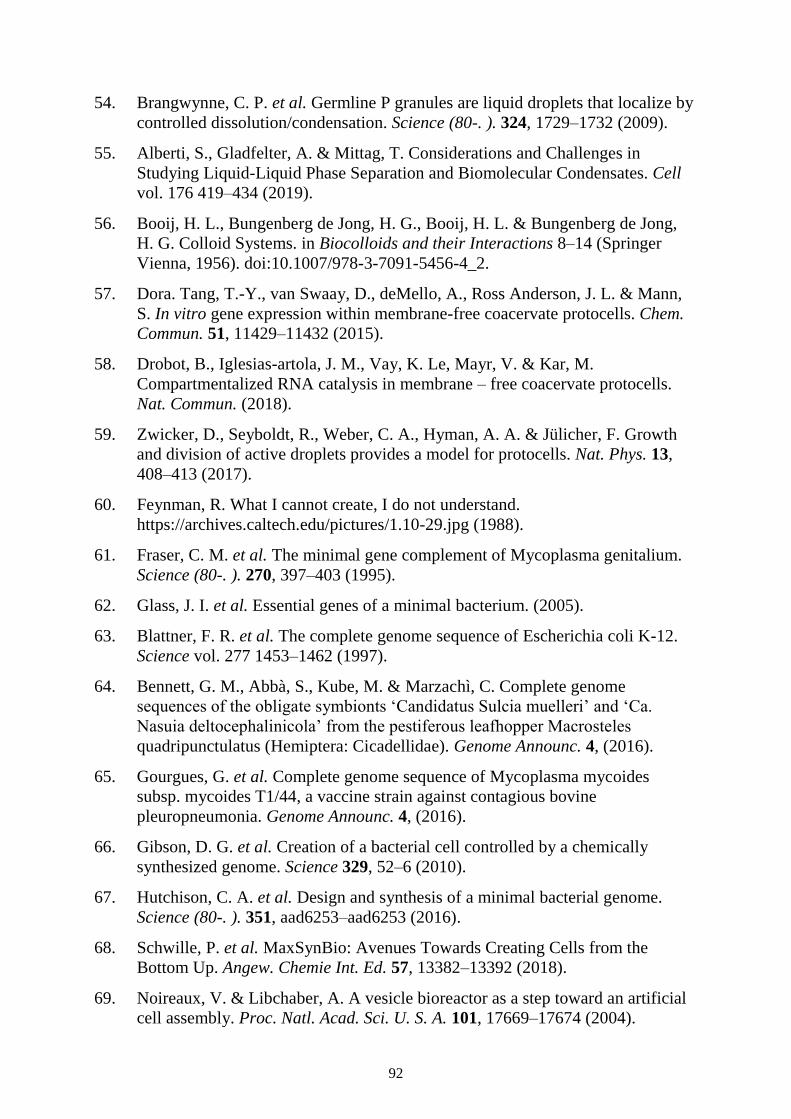
92
54. Brangwynne, C. P. et al. Germline P granules are liquid droplets that localize by
controlled dissolution/condensation. Science (80-. ). 324, 1729–1732 (2009).
55. Alberti, S., Gladfelter, A. & Mittag, T. Considerations and Challenges in
Studying Liquid-Liquid Phase Separation and Biomolecular Condensates. Cell
vol. 176 419–434 (2019).
56. Booij, H. L., Bungenberg de Jong, H. G., Booij, H. L. & Bungenberg de Jong,
H. G. Colloid Systems. in Biocolloids and their Interactions 8–14 (Springer
Vienna, 1956). doi:10.1007/978-3-7091-5456-4_2.
57. Dora. Tang, T.-Y., van Swaay, D., deMello, A., Ross Anderson, J. L. & Mann,
S. In vitro gene expression within membrane-free coacervate protocells. Chem.
Commun. 51, 11429–11432 (2015).
58. Drobot, B., Iglesias-artola, J. M., Vay, K. Le, Mayr, V. & Kar, M.
Compartmentalized RNA catalysis in membrane – free coacervate protocells.
Nat. Commun. (2018).
59. Zwicker, D., Seyboldt, R., Weber, C. A., Hyman, A. A. & Jülicher, F. Growth
and division of active droplets provides a model for protocells. Nat. Phys. 13,
408–413 (2017).
60. Feynman, R. What I cannot create, I do not understand.
https://archives.caltech.edu/pictures/1.10-29.jpg (1988).
61. Fraser, C. M. et al. The minimal gene complement of Mycoplasma genitalium.
Science (80-. ). 270, 397–403 (1995).
62. Glass, J. I. et al. Essential genes of a minimal bacterium. (2005).
63. Blattner, F. R. et al. The complete genome sequence of Escherichia coli K-12.
Science vol. 277 1453–1462 (1997).
64. Bennett, G. M., Abbà, S., Kube, M. & Marzachì, C. Complete genome
sequences of the obligate symbionts ‘Candidatus Sulcia muelleri’ and ‘Ca.
Nasuia deltocephalinicola’ from the pestiferous leafhopper Macrosteles
quadripunctulatus (Hemiptera: Cicadellidae). Genome Announc. 4, (2016).
65. Gourgues, G. et al. Complete genome sequence of Mycoplasma mycoides
subsp. mycoides T1/44, a vaccine strain against contagious bovine
pleuropneumonia. Genome Announc. 4, (2016).
66. Gibson, D. G. et al. Creation of a bacterial cell controlled by a chemically
synthesized genome. Science 329, 52–6 (2010).
67. Hutchison, C. A. et al. Design and synthesis of a minimal bacterial genome.
Science (80-. ). 351, aad6253–aad6253 (2016).
68. Schwille, P. et al. MaxSynBio: Avenues Towards Creating Cells from the
Bottom Up. Angew. Chemie Int. Ed. 57, 13382–13392 (2018).
69. Noireaux, V. & Libchaber, A. A vesicle bioreactor as a step toward an artificial
cell assembly. Proc. Natl. Acad. Sci. U. S. A. 101, 17669–17674 (2004).
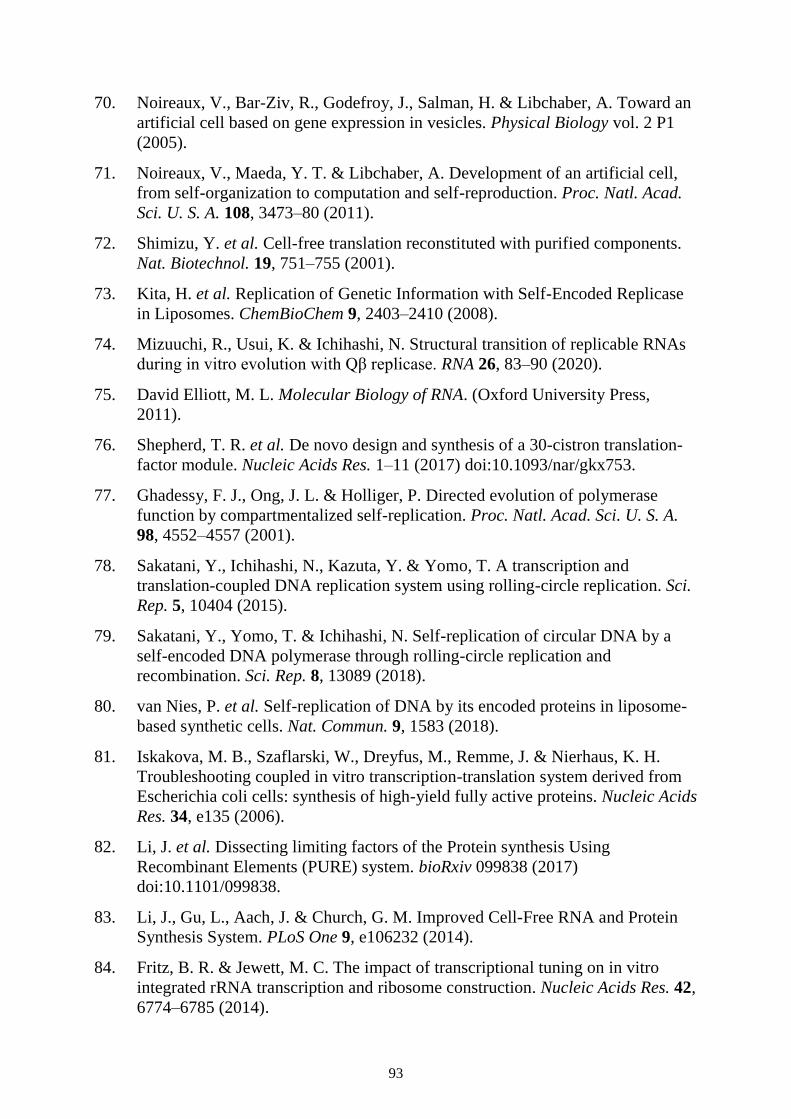
93
70. Noireaux, V., Bar-Ziv, R., Godefroy, J., Salman, H. & Libchaber, A. Toward an
artificial cell based on gene expression in vesicles. Physical Biology vol. 2 P1
(2005).
71. Noireaux, V., Maeda, Y. T. & Libchaber, A. Development of an artificial cell,
from self-organization to computation and self-reproduction. Proc. Natl. Acad.
Sci. U. S. A. 108, 3473–80 (2011).
72. Shimizu, Y. et al. Cell-free translation reconstituted with purified components.
Nat. Biotechnol. 19, 751–755 (2001).
73. Kita, H. et al. Replication of Genetic Information with Self-Encoded Replicase
in Liposomes. ChemBioChem 9, 2403–2410 (2008).
74. Mizuuchi, R., Usui, K. & Ichihashi, N. Structural transition of replicable RNAs
during in vitro evolution with Qβ replicase. RNA 26, 83–90 (2020).
75. David Elliott, M. L. Molecular Biology of RNA. (Oxford University Press,
2011).
76. Shepherd, T. R. et al. De novo design and synthesis of a 30-cistron translation-
factor module. Nucleic Acids Res. 1–11 (2017) doi:10.1093/nar/gkx753.
77. Ghadessy, F. J., Ong, J. L. & Holliger, P. Directed evolution of polymerase
function by compartmentalized self-replication. Proc. Natl. Acad. Sci. U. S. A.
98, 4552–4557 (2001).
78. Sakatani, Y., Ichihashi, N., Kazuta, Y. & Yomo, T. A transcription and
translation-coupled DNA replication system using rolling-circle replication. Sci.
Rep. 5, 10404 (2015).
79. Sakatani, Y., Yomo, T. & Ichihashi, N. Self-replication of circular DNA by a
self-encoded DNA polymerase through rolling-circle replication and
recombination. Sci. Rep. 8, 13089 (2018).
80. van Nies, P. et al. Self-replication of DNA by its encoded proteins in liposome-
based synthetic cells. Nat. Commun. 9, 1583 (2018).
81. Iskakova, M. B., Szaflarski, W., Dreyfus, M., Remme, J. & Nierhaus, K. H.
Troubleshooting coupled in vitro transcription-translation system derived from
Escherichia coli cells: synthesis of high-yield fully active proteins. Nucleic Acids
Res. 34, e135 (2006).
82. Li, J. et al. Dissecting limiting factors of the Protein synthesis Using
Recombinant Elements (PURE) system. bioRxiv 099838 (2017)
doi:10.1101/099838.
83. Li, J., Gu, L., Aach, J. & Church, G. M. Improved Cell-Free RNA and Protein
Synthesis System. PLoS One 9, e106232 (2014).
84. Fritz, B. R. & Jewett, M. C. The impact of transcriptional tuning on in vitro
integrated rRNA transcription and ribosome construction. Nucleic Acids Res. 42,
6774–6785 (2014).
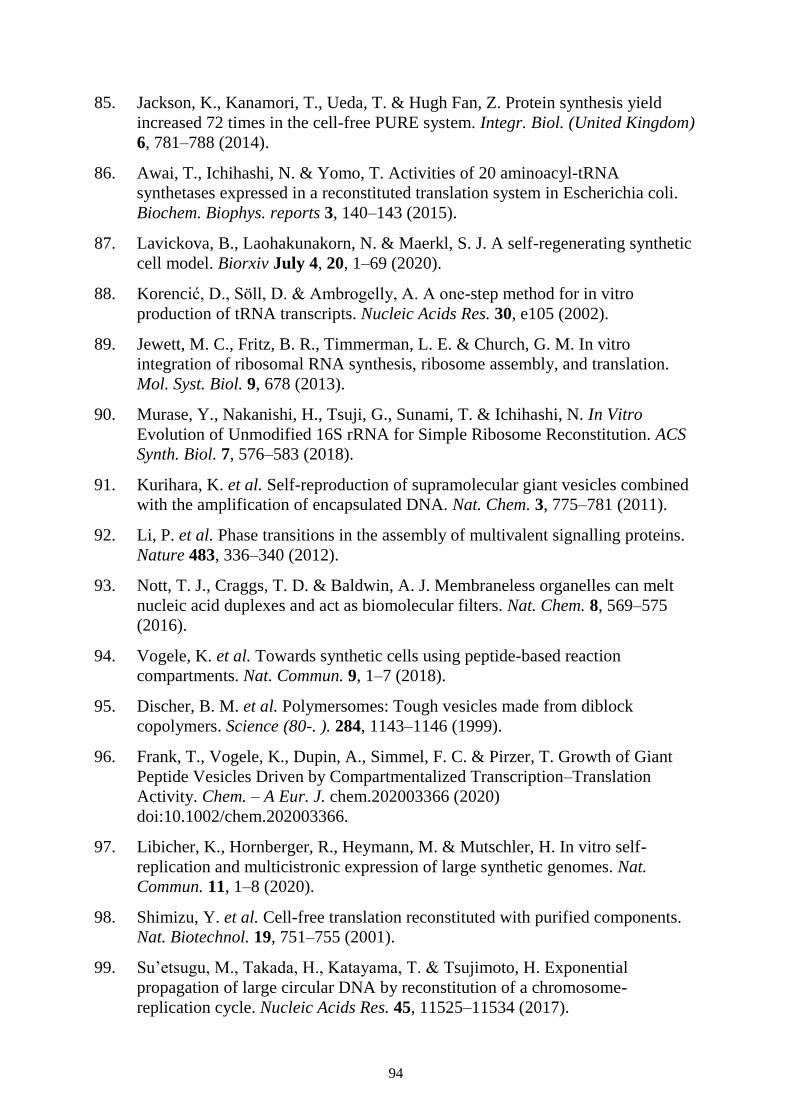
94
85. Jackson, K., Kanamori, T., Ueda, T. & Hugh Fan, Z. Protein synthesis yield
increased 72 times in the cell-free PURE system. Integr. Biol. (United Kingdom)
6, 781–788 (2014).
86. Awai, T., Ichihashi, N. & Yomo, T. Activities of 20 aminoacyl-tRNA
synthetases expressed in a reconstituted translation system in Escherichia coli.
Biochem. Biophys. reports 3, 140–143 (2015).
87. Lavickova, B., Laohakunakorn, N. & Maerkl, S. J. A self-regenerating synthetic
cell model. Biorxiv July 4, 20, 1–69 (2020).
88. Korencić, D., Söll, D. & Ambrogelly, A. A one-step method for in vitro
production of tRNA transcripts. Nucleic Acids Res. 30, e105 (2002).
89. Jewett, M. C., Fritz, B. R., Timmerman, L. E. & Church, G. M. In vitro
integration of ribosomal RNA synthesis, ribosome assembly, and translation.
Mol. Syst. Biol. 9, 678 (2013).
90. Murase, Y., Nakanishi, H., Tsuji, G., Sunami, T. & Ichihashi, N. In Vitro
Evolution of Unmodified 16S rRNA for Simple Ribosome Reconstitution. ACS
Synth. Biol. 7, 576–583 (2018).
91. Kurihara, K. et al. Self-reproduction of supramolecular giant vesicles combined
with the amplification of encapsulated DNA. Nat. Chem. 3, 775–781 (2011).
92. Li, P. et al. Phase transitions in the assembly of multivalent signalling proteins.
Nature 483, 336–340 (2012).
93. Nott, T. J., Craggs, T. D. & Baldwin, A. J. Membraneless organelles can melt
nucleic acid duplexes and act as biomolecular filters. Nat. Chem. 8, 569–575
(2016).
94. Vogele, K. et al. Towards synthetic cells using peptide-based reaction
compartments. Nat. Commun. 9, 1–7 (2018).
95. Discher, B. M. et al. Polymersomes: Tough vesicles made from diblock
copolymers. Science (80-. ). 284, 1143–1146 (1999).
96. Frank, T., Vogele, K., Dupin, A., Simmel, F. C. & Pirzer, T. Growth of Giant
Peptide Vesicles Driven by Compartmentalized Transcription–Translation
Activity. Chem. – A Eur. J. chem.202003366 (2020)
doi:10.1002/chem.202003366.
97. Libicher, K., Hornberger, R., Heymann, M. & Mutschler, H. In vitro self-
replication and multicistronic expression of large synthetic genomes. Nat.
Commun. 11, 1–8 (2020).
98. Shimizu, Y. et al. Cell-free translation reconstituted with purified components.
Nat. Biotechnol. 19, 751–755 (2001).
99. Su’etsugu, M., Takada, H., Katayama, T. & Tsujimoto, H. Exponential
propagation of large circular DNA by reconstitution of a chromosome-
replication cycle. Nucleic Acids Res. 45, 11525–11534 (2017).
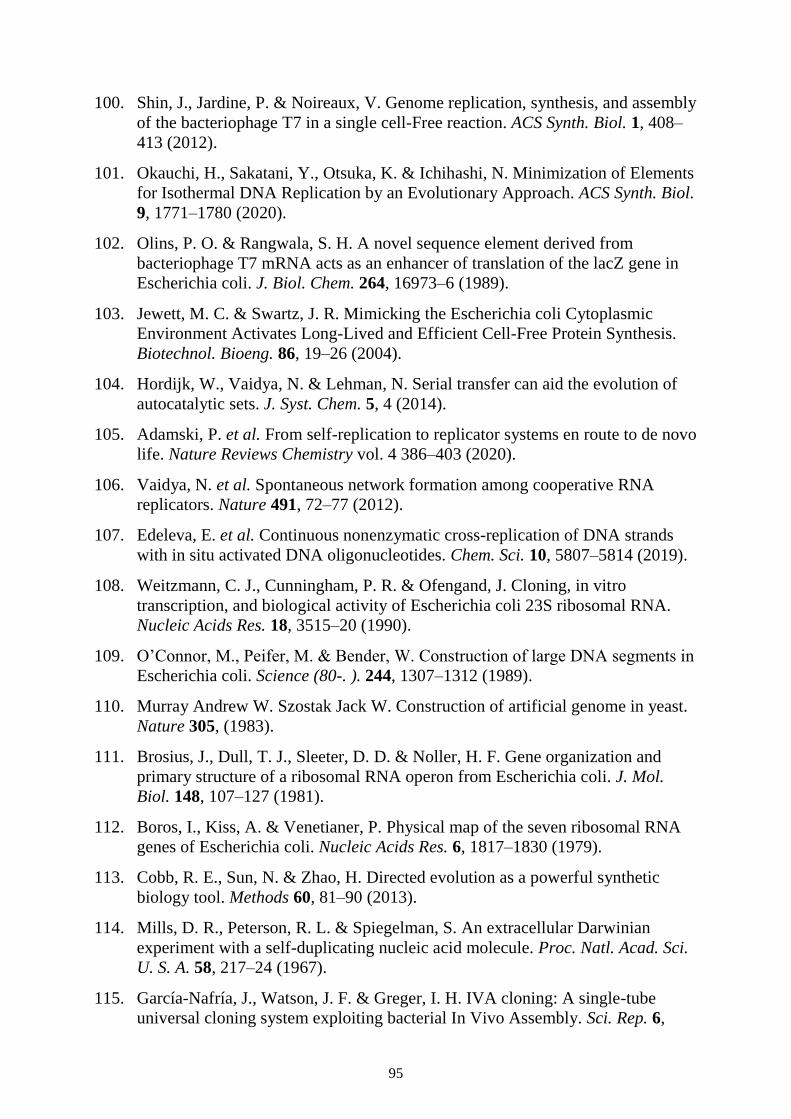
95
100. Shin, J., Jardine, P. & Noireaux, V. Genome replication, synthesis, and assembly
of the bacteriophage T7 in a single cell-Free reaction. ACS Synth. Biol. 1, 408–
413 (2012).
101. Okauchi, H., Sakatani, Y., Otsuka, K. & Ichihashi, N. Minimization of Elements
for Isothermal DNA Replication by an Evolutionary Approach. ACS Synth. Biol.
9, 1771–1780 (2020).
102. Olins, P. O. & Rangwala, S. H. A novel sequence element derived from
bacteriophage T7 mRNA acts as an enhancer of translation of the lacZ gene in
Escherichia coli. J. Biol. Chem. 264, 16973–6 (1989).
103. Jewett, M. C. & Swartz, J. R. Mimicking the Escherichia coli Cytoplasmic
Environment Activates Long-Lived and Efficient Cell-Free Protein Synthesis.
Biotechnol. Bioeng. 86, 19–26 (2004).
104. Hordijk, W., Vaidya, N. & Lehman, N. Serial transfer can aid the evolution of
autocatalytic sets. J. Syst. Chem. 5, 4 (2014).
105. Adamski, P. et al. From self-replication to replicator systems en route to de novo
life. Nature Reviews Chemistry vol. 4 386–403 (2020).
106. Vaidya, N. et al. Spontaneous network formation among cooperative RNA
replicators. Nature 491, 72–77 (2012).
107. Edeleva, E. et al. Continuous nonenzymatic cross-replication of DNA strands
with in situ activated DNA oligonucleotides. Chem. Sci. 10, 5807–5814 (2019).
108. Weitzmann, C. J., Cunningham, P. R. & Ofengand, J. Cloning, in vitro
transcription, and biological activity of Escherichia coli 23S ribosomal RNA.
Nucleic Acids Res. 18, 3515–20 (1990).
109. O’Connor, M., Peifer, M. & Bender, W. Construction of large DNA segments in
Escherichia coli. Science (80-. ). 244, 1307–1312 (1989).
110. Murray Andrew W. Szostak Jack W. Construction of artificial genome in yeast.
Nature 305, (1983).
111. Brosius, J., Dull, T. J., Sleeter, D. D. & Noller, H. F. Gene organization and
primary structure of a ribosomal RNA operon from Escherichia coli. J. Mol.
Biol. 148, 107–127 (1981).
112. Boros, I., Kiss, A. & Venetianer, P. Physical map of the seven ribosomal RNA
genes of Escherichia coli. Nucleic Acids Res. 6, 1817–1830 (1979).
113. Cobb, R. E., Sun, N. & Zhao, H. Directed evolution as a powerful synthetic
biology tool. Methods 60, 81–90 (2013).
114. Mills, D. R., Peterson, R. L. & Spiegelman, S. An extracellular Darwinian
experiment with a self-duplicating nucleic acid molecule. Proc. Natl. Acad. Sci.
U. S. A. 58, 217–24 (1967).
115. García-Nafría, J., Watson, J. F. & Greger, I. H. IVA cloning: A single-tube
universal cloning system exploiting bacterial In Vivo Assembly. Sci. Rep. 6,
96
27459 (2016).
116. Watson, J. F. & García-Nafría, J. In vivo DNA assembly using common
laboratory bacteria: A re-emerging tool to simplify molecular cloning. J. Biol.
Chem. 294, 15271–15281 (2019).
117. Sakatani, Y., Mizuuchi, R. & Ichihashi, N. In vitro evolution of phi29 DNA
polymerases through compartmentalized gene expression and rolling-circle
replication. Protein Eng. Des. Sel. 32, 481–487 (2019).
118. Vikhar, P. A. Evolutionary algorithms: A critical review and its future prospects.
in Proceedings - International Conference on Global Trends in Signal
Processing, Information Computing and Communication, ICGTSPICC 2016
261–265 (Institute of Electrical and Electronics Engineers Inc., 2017).
doi:10.1109/ICGTSPICC.2016.7955308.
119. Furubayashi, T. et al. Emergence and diversification of a host-parasite RNA
ecosystem through Darwinian evolution. Elife (2020) doi:10.7554/eLife.56038.
120. Esvelt, K. M., Carlson, J. C. & Liu, D. R. A system for the continuous directed
evolution of biomolecules. Nature 472, 499–503 (2011).
121. McCullum, E. O., Williams, B. A. R., Zhang, J. & Chaput, J. C. Random
mutagenesis by error-prone PCR. Methods Mol. Biol. 634, 103–109 (2010).
122. Reetz, M. T. & Carballeira, J. D. Iterative saturation mutagenesis (ISM) for
rapid directed evolution of functional enzymes. Nat. Protoc. 2, 891–903 (2007).
123. Fujii, R., Kitaoka, M. & Hayashi, K. Error-prone rolling circle amplification: the
simplest random mutagenesis protocol. Nat. Protoc. 1, 2493–2497 (2006).
124. Gibson, D. G. et al. Enzymatic assembly of DNA molecules up to several
hundred kilobases. Nat. Methods 6, 343–345 (2009).
125. Ruijter, J. M., Van Der Velden, S. & Ilgun, A. LinRegPCR (11.0) Analysis of
quantitative RT-PCR data. http://linregpcr.nl (2020).
126. Kuruma, Y. & Ueda, T. The PURE system for the cell-free synthesis of
membrane proteins. Nat. Protoc. 10, 1328–1344 (2015).
127. Lavickova, B. & Maerkl, S. J. A Simple, Robust, and Low-Cost Method To
Produce the PURE Cell-Free System. ACS Synth. Biol. 8, 455–462 (2019).
128. Libicher, K. & Mutschler, H. Probing self-regeneration of essential protein
factors required for in vitro translation activity by serial transfer . Chem.
Commun. (2020) doi:10.1039/d0cc06515c.
129. Wilkins, M. Proteomics data mining. Expert Review of Proteomics vol. 6 599–
603 (2009).
130. Li, J. et al. Cogenerating Synthetic Parts toward a Self-Replicating System. ACS
Synth. Biol. 6, 1327–1336 (2017).
131. Blanken, D., Foschepoth, D., Serrão, A. C. & Danelon, C. Genetically controlled
membrane synthesis in liposomes. Nat. Commun. 11, 1–13 (2020).
97
132. Oda, Y., Huang, K., Cross, F. R., Cowburn, D. & Chait, B. T. Accurate
quantitation of protein expression and site-specific phosphorylation. Proc. Natl.
Acad. Sci. U. S. A. 96, 6591–6596 (1999).
133. Russell, J. B. The energy spilling reactions of bacteria and other organisms.
Journal of Molecular Microbiology and Biotechnology vol. 13 1–11 (2007).
134. Karzbrun, E., Shin, J., Bar-Ziv, R. H. & Noireaux, V. Coarse-grained dynamics
of protein synthesis in a cell-free system. Phys. Rev. Lett. 106, 048104 (2011).
135. Robert Brooks Phillips, Jane Kondev, J. T. Physical Biology of the Cell. 2009
(Garland Science).
136. Ortiz, J. O., Förster, F., Kürner, J., Linaroudis, A. A. & Baumeister, W.
Mapping 70S ribosomes in intact cells by cryoelectron tomography and pattern
recognition. J. Struct. Biol. 156, 334–341 (2006).
137. Keiler, K. C. Mechanisms of ribosome rescue in bacteria. Nat. Rev. Microbiol.
13, 285–297 (2015).
138. Nedialkova, D. D. & Leidel, S. A. Optimization of Codon Translation Rates via
tRNA Modifications Maintains Proteome Integrity. Cell 161, 1606–1618 (2015).
139. Liu, Y., Fritz, B. R., Anderson, M. J., Schoborg, J. A. & Jewett, M. C.
Characterizing and alleviating substrate limitations for improved in vitro
ribosome construction. ACS Synth. Biol. 4, 454–462 (2015).
140. Danilevich, V. N. et al. New insight into formation of DNA-containing
microparticles during PCR: The scaffolding role of magnesium pyrophosphate
crystals. J. Biomol. Struct. Dyn. 34, 625–639 (2016).
141. Lee, S. W., Cheon, S. A., Kim, M. Il & Park, T. J. Organic-inorganic hybrid
nanoflowers: Types, characteristics, and future prospects. Journal of
Nanobiotechnology vol. 13 54 (2015).
142. Förster, A. H. & Gescher, J. Metabolic engineering of Escherichia coli for
production of mixed-acid fermentation end products. Frontiers in
Bioengineering and Biotechnology vol. 2 16 (2014).
143. Cox, J. & Mann, M. MaxQuant enables high peptide identification rates,
individualized p.p.b.-range mass accuracies and proteome-wide protein
quantification. Nat. Biotechnol. 26, 1367–1372 (2008).
144. Caschera, F. & Noireaux, V. Preparation of amino acid mixtures for cell-free
expression systems. Biotechniques 58, 40–43 (2015).
145. Kurland, C. G. Molecular characterization of ribonucleic acid from Escherichia
coli ribosomes: I. Isolation and molecular weights. J. Mol. Biol. 2, 83–91 (1960).
146. Svedberg, T. & Nichols, J. B. Determination of size and distribution of size of
particle by centrifugal methods. J. Am. Chem. Soc. 45, 2910–2917 (1923).
147. Shine, J. & Dalgarno, L. Occurrence of heat-dissociable ribosomal RNA in
insects: The presence of three polynucleotide chains in 26 S RNA from cultured
98
Aedes aegypti cells. J. Mol. Biol. 75, 57–72 (1973).
148. Noll, M., Hapke, B., Schreier, M. H. & Noll, H. Structural dynamics of bacterial
ribosomes. I. Characterization of vacant couples and their relation to complexed
ribosomes. J. Mol. Biol. 75, 281–294 (1973).
149. Nierhaus, K. H. Reconstitution of ribosomes. Oxford Univ. Press (1990).
150. Murase, Y., Nakanishi, H., Tsuji, G., Sunami, T. & Ichihashi, N. In Vitro
Evolution of Unmodified 16S rRNA for Simple Ribosome Reconstitution. ACS
Synth. Biol. acssynbio.7b00333 (2017) doi:10.1021/acssynbio.7b00333.
151. Rackham, O. & Chin, J. W. A network of orthogonal ribosome·mrna pairs. Nat.
Chem. Biol. 1, 159–166 (2005).
152. Jewett, M. C., Fritz, B. R., Timmerman, L. E. & Church, G. M. In vitro
integration of ribosomal RNA synthesis, ribosome assembly, and translation.
Mol. Syst. Biol. 9, 678 (2013).
153. Fritz, B. R. & Jewett, M. C. The impact of transcriptional tuning on in vitro
integrated rRNA transcription and ribosome construction. 42, 6774–6785
(2014).
154. Didovyk, A., Tonooka, T., Tsimring, L. & Hasty, J. Rapid and Scalable
Preparation of Bacterial Lysates for Cell-Free Gene Expression. ACS Synth.
Biol. 6, 2198–2208 (2017).
155. Singleton, M. R., Dillingham, M. S., Gaudier, M., Kowalczykowski, S. C. &
Wigley, D. B. Crystal structure of RecBCD enzyme reveals a machine for
processing DNA breaks. Nature 432, 187–193 (2004).
156. Yim, S. S., Johns, N. I., Noireaux, V. & Wang, H. H. Protecting Linear DNA
Templates in Cell-Free Expression Systems from Diverse Bacteria. ACS Synth.
Biol. 9, 2851–2855 (2020).
157. Connolly, K. & Culver, G. Deconstructing ribosome construction. Trends
Biochem. Sci. 34, 256–263 (2009).
158. Tamaru, D., Amikura, K., Shimizu, Y. & Nierhaus, K. H. Reconstitution of 30S
ribosomal subunits in vitro using ribosome biogenesis factors. 1512–1519
(2018) doi:10.1261/rna.065615.118.
159. Shimojo, M. et al. In vitro reconstitution of functional small ribosomal subunit
assembly for comprehensive analysis of ribosomal elements in E. coli. Commun.
Biol. 3, (2020).
160. Perez, J. G., Stark, J. C. & Jewett, M. C. Cell-Free Synthetic Biology:
Engineering Beyond the Cell. Cold Spring Harb. Perspect. Biol. 1–26 (2016)
doi:10.1101/cshperspect.a023853.
161. JS, A. The McCree-de Wit-Penning de Vries respiration paradigms. Ann. Bot.
(2000).
162. Fritz, B. R., Jamil, O. K. & Jewett, M. C. Implications of macromolecular
99
crowding and reducing conditions for in vitro ribosome construction. Nucleic
Acids Res. 43, 4774–4784 (2015).
163. Orelle, C. et al. Protein synthesis by ribosomes with tethered subunits. Nature
524, 119–124 (2015).
164. d’Aquino, A. E., Kim, D. S. & Jewett, M. C. Engineered Ribosomes for Basic
Science and Synthetic Biology. Annu. Rev. Chem. Biomol. Eng. 9, 311–340
(2018).
165. Reeve, B., Hargest, T., Gilbert, C. & Ellis, T. Predicting translation initiation
rates for designing synthetic biology. Frontiers in Bioengineering and
Biotechnology vol. 2 (2014).
166. Borujeni, A. E. & Salis, H. M. Translation Initiation is Controlled by RNA
Folding Kinetics via a Ribosome Drafting Mechanism. J. Am. Chem. Soc.
(2016) doi:10.1021/jacs.6b01453.
167. Young, T. S. & Schultz, P. G. Beyond the canonical 20 amino acids: Expanding
the genetic lexicon. Journal of Biological Chemistry vol. 285 11039–11044
(2010).
168. Cload, S. T., Liu, D. R., Froland, W. a & Schultz, P. G. Proteins Containing
Unnatural Amino Acids. Chem. Biol. 1033–1038 (1996).
169. Wang, L., Xie, J. & Schultz, P. G. EXPANDING THE GENETIC CODE. Annu.
Rev. Biophys. Biomol. Struct. 35, 225–249 (2006).
170. Cui, Z., Stein, V., Tnimov, Z., Mureev, S. & Alexandrov, K. Semisynthetic
tRNA Complement Mediates in Vitro Protein Synthesis. J. Am. Chem. Soc. 137,
4404–4413 (2015).
171. Chaput, J. C. & Herdewijn, P. What Is XNA? Angew. Chemie - Int. Ed. 58,
11570–11572 (2019).
172. Pinheiro, V. B. et al. Synthetic genetic polymers capable of heredity and
evolution. Science (80-. ). 336, 341–344 (2012).
173. Hibi, K. et al. Reconstituted cell-free protein synthesis using in vitro transcribed
tRNAs. Commun. Biol. 3, (2020).
174. Blanchard, S. C. et al. tRNA dynamics on the ribosome during translation. Proc.
Natl. Acad. Sci. U. S. A. 101, 12893–8 (2004).
175. Weiss, M. et al. Sequential bottom-up assembly of mechanically stabilized
synthetic cells by microfluidics. Nat. Mater. 17, 89–95 (2018).
176. Höhner, R., Aboukila, A., Kunz, H. H. & Venema, K. Proton gradients and
proton-dependent transport processes in the chloroplast. Frontiers in Plant
Science vol. 7 (2016).
177. Scott, A. et al. Cell-Free Phospholipid Biosynthesis by Gene-Encoded Enzymes
Reconstituted in Liposomes. PLoS One 11, e0163058 (2016).
178. Exterkate, M., Caforio, A., Stuart, M. C. A. & Driessen, A. J. M. Growing
100
Membranes in Vitro by Continuous Phospholipid Biosynthesis from Free Fatty
Acids. ACS Synth. Biol. 7, 153–165 (2018).
179. Bhattacharya, A., Brea, R. J., Niederholtmeyer, H. & Devaraj, N. K. A minimal
biochemical route towards de novo formation of synthetic phospholipid
membranes. Nat. Commun. 10, 1–8 (2019).
180. Samanta, A., Sabatino, V., Ward, T. R. & Walther, A. Functional and
morphological adaptation in DNA protocells via signal processing prompted by
artificial metalloenzymes. Nat. Nanotechnol. (2020) doi:10.1038/s41565-020-
0761-y.
181. Zhu, X. et al. A netlike rolling circle nucleic acid amplification technique.
Analyst 140, 74–78 (2015).
182. Yata, T. et al. Efficient amplification of self-gelling polypod-like structured
DNA by rolling circle amplification and enzymatic digestion. Sci. Rep. 5, 1–9
(2015).
183. Thiele, J. et al. DNA-functionalized hydrogels for confined membrane-free in
vitro transcription / translation. (2014).
184. Mao, X., Chen, G., Wang, Z., Zhang, Y. & Zhu, X. Surface-Immobilized and
Self-Shaped DNA Hydrogel and its Application for Biosensing. (2017).
185. Park, N., Um, S. H., Funabashi, H., Xu, J. & Luo, D. A cell-free protein-
producing gel. Nat. Mater. 8, 432–437 (2009).
186. Zhou, X., Wu, H., Cui, M., Lai, N. & Zheng, B. Long-lived protein expression
in hydrogel particles: towards artificial cells. Chem. Sci. (2018)
doi:10.1039/c8sc00383a.
187. Zhu, G. et al. Noncanonical self-assembly of multifunctional DNA nanoflowers
for biomedical applications. J. Am. Chem. Soc. 135, 16438–16445 (2013).
188. Danilevich, V. N., Barinova, E. S. & Grishin, E. V. Microparticles from
condensed DNA formed in the process of polymerase chain reaction. Russ. J.
Bioorganic Chem. 35, 207–218 (2009).
189. Mori, Y., Nagamine, K., Tomita, N. & Notomi, T. Detection of loop-mediated
isothermal amplification reaction by turbidity derived from magnesium
pyrophosphate formation. Biochem. Biophys. Res. Commun. 289, 150–154
(2001).
190. Bhowmik, S., Ghosh, B. N., Marjomäki, V. & Rissanen, K. Nanomolar
pyrophosphate detection in water and in a self-assembled hydrogel of a simple
terpyridine-Zn2+ complex. J. Am. Chem. Soc. 136, 5543–5546 (2014).
191. Gustafsson, M. G. L. Surpassing the lateral resolution limit by a factor of two
using structured illumination microscopy. J. Microsc. 198, 82–87 (2000).
192. Zhu, X. et al. A netlike rolling circle nucleic acid amplification technique.
Analyst 140, 74–78 (2015).
101
193. Aufinger, L. & Simmel, F. C. Artificial Gel-based Organelles for Spatial
Organization of Cell-free Gene Expression Reactions. Angew Chem Int Ed Engl
57, 17245–17248 (2018).
194. Kim, E. et al. One-Pot Synthesis of Multiple Protein-Encapsulated DNA
Flowers and Their Application in Intracellular Protein Delivery. Adv. Mater. 29,
(2017).
195. Huber, M. C. et al. Designer amphiphilic proteins as building blocks for the
intracellular formation of organelle-like compartments. Nat. Mater. 14, 125–132
(2015).
196. Wang, S., Majumder, S., Emery, N. J. & Liu, A. P. Simultaneous monitoring of
transcription and translation in mammalian cell-free expression in bulk and in
cell-sized droplets. (2018) doi:10.1093/synbio/ysy005.
197. Otrin, L. et al. Artificial Organelles for Energy Regeneration. Adv. Biosyst. 3,
(2019).
198. Kubitschek, H. E. Growth During the Bacterial Cell Cycle: Analysis of Cell Size
Distribution. Biophys. J. 9, 792–809 (1969).
199. Rose, S. The Chemistry of Life. (Penguin Books Ltd., 1979).
200. Frederick Carl Neidhardt, R. C. Escherichia Coli and Salmonella: Cellular and
Molecular Biology. (ASM Press, 1996).
201. Bonner, J. T. The Social Amoebae: The Biology of Cellular Slime Molds.
(Princeton University Press, 2009).
202. Milde, R. et al. Multinucleated Giant Cells Are Specialized for Complement-
Mediated Phagocytosis and Large Target Destruction. Cell Rep. 13, 1937–1948
(2015).
203. Goethe, J. W., Gedichte und Epen I, Goethes Werke, Hamburger Ausgabe, Band
IX, C.H. Beck, München 1998, p. 369
102
VIII List of figures
Figure 1: Top-down and bottom-up synthetic biology aim to create a minimal cell from opposite starting points.
The reductive approach takes an already existing cell and deprives it of non-essential components until only
essential ones remain. The constructive approach tries to assemble a minimal cell from inanimate modules. ...... 6
Figure 2: Schematic of a minimal cell as proposed by Forster & Church.2 The model comprises several
metabolic modules encapsulated by a lipid bilayer. Interactions, indicated by arrows, are colored according to
different modules (blue: DNA replication, red: RNA transcription, grey: RNA maturation, black: protein
translation, green: post-translational modification). ................................................................................................ 9
Figure 3: General principle of transcription-translation-coupled DNA-replication (TTcDR). a) The template
DNA encoding a DNA-polymerase (DNAP) gene is transcribed to produce mRNA molecules. b) The mRNA is
translated to synthesize the encoded DNAP. c) The expressed DNAP replicates its own template (self-
replication). ........................................................................................................................................................... 10
Figure 4: The RCA-based TTcDR reaction. a) A circular plasmid bears the gene for DNA-polymerase (DNAP)
which is transcribed and translated in a cell-free protein synthesis system. b) The DNAP binds to the plasmid
template and initiates rolling circle amplification (RCA). c) The resulting concatemer can serve itself as a
template for either DNA polymerization or transcription-translation. .................................................................. 15
Figure 5: TTcDR of the pREP plasmid in the cell-free PURErep system. a) Plasmid map of pREP encoding the
phi29-DNAP promoted by a T7-promoter (T7p) and terminated using a bidirectional T7 terminator (T7t). Gene
expression is increased by the implementation of a g10 leader sequence between promoter and open-reading
frame (ORF). The pUC origin and Zeocin selection marker enable in vivo propagation. b) Replication of pREP
in the commercial PURExpress or PURErep after 16 h at 30 °C (n = 3). Fold changes were measured as a
multiple of plasmid starting concentration (4 nM) using qPCR. The bars show the standard deviations from
independent triplicates. c) Incubation start and end point visualization using agarose gel electrophoresis of pREP
TTcDR samples in PURExpress and PURErep. d) Comparison of differing components between PURExpress
and PURErep. Generally, reducing agents and proteins were increased at the expense of NTPs and RNAs.
Relative concentration changes are given in log2 fold-change. e) Time series of pREP TTcDR at different
starting concentrations. Fold-changes relative to the input were estimated using qPCR and independent
triplicates (n = 3). f) Serial transfer of TTcDR reactions (generations) in fresh PURErep mixes. Fold-change of
replication was estimated via qPCR and converted to molar amounts using the starting concentrations. This
figure was adopted from Libicher et al. (2020).97
................................................................................................. 17
Figure 6: PURErep protein yield & TTcDR time series. a) Comparison of transcription-translation yields
between PURExpress and PURErep which were estimated using a pIVEX-sfGFP construct and fluorescence
analysis. b) SDS-PAGE of de novo synthesized sfGFP in independent PURExpress and PURErep reactions (n =
3). Band intensities were integrated using ImageQuant TL (GE Healthcare). c) Tracking TTcDR over time using
agarose gel electrophoresis. Three products with different mobility could be identified. P1 consisted of
apparently insoluble particles which could be stained by the DNA-intercalating SYBR dye. The peculiar nature
of P1 will be further explored in the following chapters. P2 appears to be a concatemer roughly four-times the
size of the pREP monomer. P3 corresponds to be the pREP monomer. This figure was adopted from Libicher et
al. (2020).97
........................................................................................................................................................... 19
103
Figure 7: pREP in vivo shuttling. a) Observed colonies on Zeocin-LB agar plates following transformation of
TTcDR products. b) The transformed plasmids could be retrieved from bacterial colonies. Agarose gel
electrophoresis revealed them to be clones of pREP. c) The plasmid pLD3 was co-replicated alongside pREP, as
indicated by submitting transformants to an antibiotic medium selective for pLD3 (Kanamycin). d) Restriction
digest analysis using Mlu1 revealed that the cloned plasmids from the respective plates in c) were indeed pREP
and pLD3. This figure was adopted from Libicher et al. (2020).97
....................................................................... 21
Figure 8: Co-replication in PURErep. Agarose gel electrophoresis of gel purified co-replication products before
and after TTcDR. Mlu1 restriction digest revealed band finger prints specific for each plasmid. b) Agarose gel
electrophoresis for Mlu1-digested products of the simultaneous co-replication of pLD1, pLD2 and pLD3. In
order to optimize the visualization of low-molecular-weight bands, the lower part of the gel is represented with
different image settings c) Fold-changes of individual plasmids following overnight TTcDR co-replication as
measured via qPCR. Fold-changes were determined as ratios to the respective input concentration. Bars indicate
standard deviations of independent triplicate measurements. d) In vivo propagation of co-replication products
following transformation. The effect was confirmed using a non-dNTP control. e) Identity of individual clones
from d) picked and analyzed using restriction digestion. This figure was adopted from Libicher et al. (2020).20
23
Figure 9: Co-replication of a 116 kb genome. a) Stacked bar representation of the minimal 116 kbp genome
distributed on 11 different plasmids. b) In vivo propagation of co-replication products following transformation.
The effect was confirmed using a non-dNTP control. c) Identity of individual clones from b) picked and
analyzed using restriction digestion. This figure was adopted from Libicher et al. (2020).97
............................... 24
Figure 10: Co-expression analysis of pLD genes using SDS-PAGE. De novo synthesized proteins were
fluorescently labelled by the incorporation of BODIPY-Lys-tRNALys (GreenLys) during translation. Individual
protein products were identified according to their mass in kDa. This figure was adopted from Libicher et al.
(2020). 97
............................................................................................................................................................... 40
Figure 11: Co-expression analysis of multiple pLD plasmids using SDS-PAGE. De novo synthesized proteins
were fluorescently labelled by the incorporation of BODIPY-Lys-tRNALys (GreenLys) during translation.
Exclusively identifying bands are marked for pLD1 (1), pLD2 (2) and pLD3 (3). The unspecific side products of
phi29-DNAP gene (pREP) would have to be elucidated in future studies. ........................................................... 41
Figure 12: Stable-isotope-labeling of co-expressed proteins. a) Heavy-to-light (H/L) ratios of plasmid-encoded
translation factors after overnight in vitro expression of either pLD1 (green), pLD2 (red) or pLD3 (purple) in
PURErep. Heavy isotopes were measured by the incorporation of 15
N213
C6-lysine and 15
N413
C6-arginine in the
energy mix. b) H/L ratios of the same translation factors after overnight in vitro expression of pLD1 (green),
pLD2 (red) and pLD3 (purple) in PURErep. The line H/L = 1 marks the point of full protein regeneration. H/L
ratios are depicted as mean values with standard deviations from independent replicates (n = 3). This figure was
adopted from Libicher et al. (2020).97
................................................................................................................... 42
Figure 13: Experimental setup for the serial dilution and sfGFP assay to measure the self-regeneration of a
protein-of-interest (POI). A PURE reaction containing de novo synthesized POI (gen1) is diluted with a fresh
PURE∆POI mix and inoculated with a plasmid encoding either the POI (gen2) or another PURE protein as
control (gen2c). This step was reiterated (gen3, gen3c). Aliquots of all generations were then individually
assessed using a sfGFP expression template in PURE∆POI. This figure was adopted from Libicher et al..128
.... 43
Figure 14: Self-regeneration levels of individual proteins-of-interest (POI) over the course of serial dilution in
PURE∆POI as analyzed via SDS-PAGE using GreenLys incorporation. The band intensity decreases according
to the drop in expression yield observed in the GFP assay. This figure was adopted from Libicher et al..128
...... 44
104
Figure 15: Self-regeneration levels of different proteins-of-interest (POI) over the course of serial dilution in
PURE∆POI, as estimated via GFP assay. The generation number (gen) depicts the number of previous PURE
reactions. Fluorescence values were normalized against the sum of all respective values (s. Methods).
Measurements were taken as independent replicates (n = 3). This figure was adopted from Libicher et al..128
... 46
Figure 16: Self-regeneration of pLD1 proteins over the course of serial dilution in PURE∆pLD1. a) Self-
regeneration levels as estimated via SDS-PAGE using GreenLys incorporation. The band intensity decreased
according to the drop in expression yield observed in the GFP assay. Individual protein products were identified
according to their mass in kDa. b) Self-regeneration levels as estimated via GFP assay. The generation number
(gen) depicts the number of previous PURE reactions. Fluorescence values were normalized against the sum of
all respective values (s. Methods). Measurements were taken as independent replicates (n = 5). ........................ 47
Figure 17: Overview of iSAT, the synthesis and assembly of ribosomes from in vitro-transcribed rRNA
followed by the transcription-translation of a reporter gene (sfGFP). a) Both rRNA and reporter mRNA are
transcribed from plasmids by a T7 RNA polymerase (T7RNAP). b) The rRNA assembles with purified
ribosomal proteins (TP70) into ribosomal subunits (the small 30S and the large 50S). c) The reporter mRNA is
translated using de novo assembled ribosomes. Functional sfGFP synthesis yield is measured by fluorescence
detection. This way, the efficiency of the iSAT reaction can be indirectly quantified. ......................................... 59
Figure 18: Testing orthogonal Shine Dalgarno (SD) sequences. a) Testing a SD sequence in a sfGFP gene
published by Murase et al.150
for orthogonality using an orthogonal anti-SD 16S rRNA template with the point
mutation U1495C. The WT reaction employed a natural SD/anti-SD pair whereas the ctrl reaction featured WT
ribosomes and the supposedly orthogonal sfGFP gene. b) The same setup as in a) using another orthogonal SD
published by Rackham et al..151
............................................................................................................................ 60
Figure 19: Protein synthesis yields and iSAT. a) Comparing the protein synthesis activity of S150 with the
commercial PURExpress system by calculating de novo synthesized GFP concentrations after 10 h incubation (n
= 3). b) Testing iSAT in S150 extract with three different batches of extract (n = 3) by estimating de novo
synthesized GFP concentration after 4 h incubation. Positive control (pc) included purified ribosomes instead of
ribosomal protein and rRNA templates. Negative control (nc) included neither ribosomes nor their building
blocks. GFP calibration curves measured in situ were used to compute concentrations from fluorescence values
for the PURE comparison (c) and iSAT (d). ......................................................................................................... 62
Figure 20: Comparison of pREP-based TTcDR in PURErep and GamS-supplemented S150 extract at different
time points after incubation at 30 °C. In contrast to the PURE system, extracts are incompatible with the RCA
mechanism as the control reaction (+ purified DNAP) shows. ............................................................................. 63
Figure 21: Macroscopic DNA hydrogel. a) After overnight incubation, a highly concentrated phi29-DNAP RCA
reaction led to the formation of a turbid, sticky gel. b) The same reaction mixture prior to incubation. .............. 78
Figure 22: Detection of inorganic pyrophosphate after TTcDR. a) Following overnight TTcDR, distinct particles
could be stained using a pyrophosphate sensor. b) The same PURErep reaction prior to incubation. No particles
were stained by the sensor. .................................................................................................................................... 79
Figure 23: DNA-Nanoflowers (DNF). a) Small DNF were revealed by the incorporation of fluorescent FAM-
dUTP during TTcDR using structured illumination microscopy (SIM). (scale bar = 5 µm) b), c) Fluorescently
labelling newly expressed DNAP with GreenLys (green) and de novo synthesized DNA with Cy3-dUTP (red)
shows that DNF encapsulate both DNA and protein. (scale bar b = 10 µm, c = 20 µm) d), e) A TTcDR reaction
containing FAM-dUTP (green) was transferred to a fresh PURErep mix containing Cy3-dUTP (red). The
resulting DNF show both green and red fluorescence indicating that DNF may serve as nuclei for secondary
DNF formation via TTcDR. (scale bars = 10 µm) ................................................................................................ 80
105
IX List of tables
Table 1: Final concentrations of reagents present in the PURErep 10x energy mix. ........................................... 33
Table 2: Approximated final protein concentrations in PURErep. Based on the protein concentrations of the
original PURE system reported by Kuruma and Ueda123
, which were shown to provide a good estimate for the
protein concentrations in the commercial PURExpress system.124
The table also lists the coding plasmids of each
gene used in the TTcDR experiments. .................................................................................................................. 34
Table 3: Primers used in this study. ..................................................................................................................... 35
Table 4: Plasmids used in this study. ................................................................................................................... 36
Table 5: 4x EM – Energy Mix Concentrate ......................................................................................................... 56
Table 6: 6x ZM – Enzyme Mix Concentrate ........................................................................................................ 56
Table 7 POI plasmids and their respective controls ............................................................................................. 56
Table 8: S150 buffer ............................................................................................................................................. 72
Table 9: Buffer A ................................................................................................................................................. 72
Table 10: Buffer B ............................................................................................................................................... 72
Table 11: Buffer C ............................................................................................................................................... 74
Table 12: TP70 Buffer.......................................................................................................................................... 74
Table 13: TP70 Buffer + Urea .............................................................................................................................. 74
106
X List of publications
Some of this work’s ideas and figures were also featured in the following publications:
Academic journals:
1. Weise, L. I., Libicher, K. & Mutschler, H. Copy, paste, repeat — über die Synthese
von Minimalzellen. BioSpektrum (2018).
2. Le Vay, K., Weise, L. I., Libicher, K., Mascarenhas, J. & Mutschler, H. Templated
Self-Replication in Biomimetic Systems. Adv. Biosyst. (2019).
3. Libicher, K., Hornberger, R., Heymann, M. & Mutschler, H. In vitro self-replication
and multicistronic expression of large synthetic genomes. Nat. Commun. (2020).
4. Libicher, K. & Mutschler, H. Probing self-regeneration of essential protein factors
required for in vitro translation activity by serial transfer . Chem. Commun. (2020).
Blog articles:
1. Libicher, K. DNA, RNA, Protein: An eternal braid. Nature Bioengineering
Community. (2020) https://bioengineeringcommunity.nature.com/posts/59933-dna-
rna-protein-an-eternal-braid
2. Libicher, K. The inanimate building-blocks for a living cell. The Science Breaker.
(2020) https://www.thesciencebreaker.org/breaks/microbiology/the-inanimate-
building-blocks-for-a-living-synthetic-cell
107
XI Notable acronyms
(r/d)NTP (ribo/deoxyribo) nucleotide triphosphate
(ss/ds)DNA (single-stranded/doublestranded) deoxyribonucleic acid
(t/m/r)RNA (transfer/messenger/ribosomal) ribocnucleic acid
AK adenylate kinase
CKM creatine kinase m-type
DNAP / RNAP DNA-polymerase / RNA-polymerase
DNF DNA-nanoflowers
EF elongation factor
IF initiation factor
iSAT in-vitro integration of synthesis, assembly and translation of ribosomes
NDK nucleoside-diphosphate kinase
ORF open reading frame
POI protein of interest
PURE protein synthesis using recombinant elements
RCA rolling-circle amplification
RF release factor
SD Shine-Dalgarno
sfGFP superfolder green-fluorescent-protein
TTcDR transcription-translation-coupled DNA-replication
TTcDRR TTcDR from endogenous ribosomes
UTR untranslated region
108
XII Acknowledgments
Thank you, Hannes Mutschler, for accepting me into your wet lab despite my mainly
theoretical background. This work could not have been accomplished without your
mentorship. Your ideals and eternal curiosity have always been guiding my decisions and will
continue to do so in the future.
Thank you, Dieter Braun, for being my Doktorvater and for giving me the opportunity to
become a PhD student at your faculty. Your insights during the TAC meetings were always
very much appreciated.
Thank you, Petra Schwille, for your incredible energy and the many contributions to the TAC
meeting. I further thank your generous and kind-hearted lab for all that support in the early
days when the Mutschler group was just starting out.
Ralf Jungmann, thank you for the nice conversations in our lounge and for becoming a part of
the audit committee.
Further thanks go to you, Harald Lesch and Joachim Rädler, for also becoming a part of the
audit committee. Harald, even though you don’t know me personally (yet), I love your TV
shows. They have inspired me to become a scientist when I was younger.
Thank you, Michael Heymann, for teaching me microfluidics, for your enthusiasm and for the
many helpful ideas and comments during our meetings. I always enjoyed working with you or
taking a walk around the campus.
Lei Kai, thank you for your help in preparing the S150 extract and ribosomes. Without you, a
large part of this work would not have been possible.
Special thanks go to the Forster lab that has generously provided us with the pLD plasmids.
Thank you, Martin Spitaler, for your help and expertise with imaging the DNA nanoflowers.
Naga Nagaraj & the TAs of the MPI core facility, thank you for your help and continuous
support during LC-MS workflows and MaxQuant analysis.
Thank you, Renate Hornberger, for being the cool TA that you are. You were always there to
help and I genuinely enjoyed working with you. Your pragmatism was very much
appreciated.

109
Viktoria Mayr, thank you for basically introducing me to the wet lab experience. I still have
so many funny memories of the early days!
And of course I want to thank all the other members of the Mu-lab. You are amazing! Thank
you for all the companionship, the support and the incredible game nights! I will never forget
(nor regret) those epic betrayals. I wish you all the best!
Special thanks go to my whole family for their continuous support, and to my любимая, Anna
Branz. Thank you for giving me your love and our child.

110