An E. coli cell-free transcription- translation system - CORE
138
An E. coli cell-free transcription- translation system: modeling gene expression and characterizing CRISPR elements and gene circuits A Dissertation Submitted to the Faculty of the Graduate School of the University of Minnesota By Ryan Marshall In Partial Fulfillment for the Requirements For the Degree of: Doctor of Philosophy September 2019
-
Upload
khangminh22 -
Category
Documents
-
view
0 -
download
0
Transcript of An E. coli cell-free transcription- translation system - CORE
An E. coli cell-free transcription-translation system: modeling
gene expression and characterizing CRISPR elements
and gene circuits
A Dissertation Submitted to the Faculty of the Graduate School
of the University of Minnesota By
Ryan Marshall
In Partial Fulfillment for the Requirements For the Degree of:
Doctor of Philosophy
September 2019

© Ryan Marshall
2019
i
Abstract Cell-free transcription-translation systems are versatile tools for rapid prototyping and
characterization of biological systems and processes. Proteins can be expressed and
measured in a matter of hours, whereas in vivo experiments often take days to weeks
because they require protein purification or live cell transformations and cultures. TXTL
systems, however, are still lacking in simple models that quantitatively describe the
behavior of reactions. Here, we present an model of the all E. coli TXTL system using
ordinary differential equations, encompassing the limited concentrations of transcription
and translation machineries, capturing the linear and saturated regime of gene expression.
Many biochemical constants are determined through experimental assays. We then show
how this TXTL system was used to characterize CRISPR technologies. CRISPR-Cas
systems have huge potential to be used as tools for genome engineering, as well as gene
silencing and regulation. We characterize a set of sgRNAs, CRISPR nucleases, anti-
CRISPR proteins, and determine protospacer-adjacent motifs. Finally, we use the TXTL
system to execute gene circuits, including an IFFL and an integral controller.

ii
Table of Contents Abstract i
Table of Contents ii
List of Publications iv
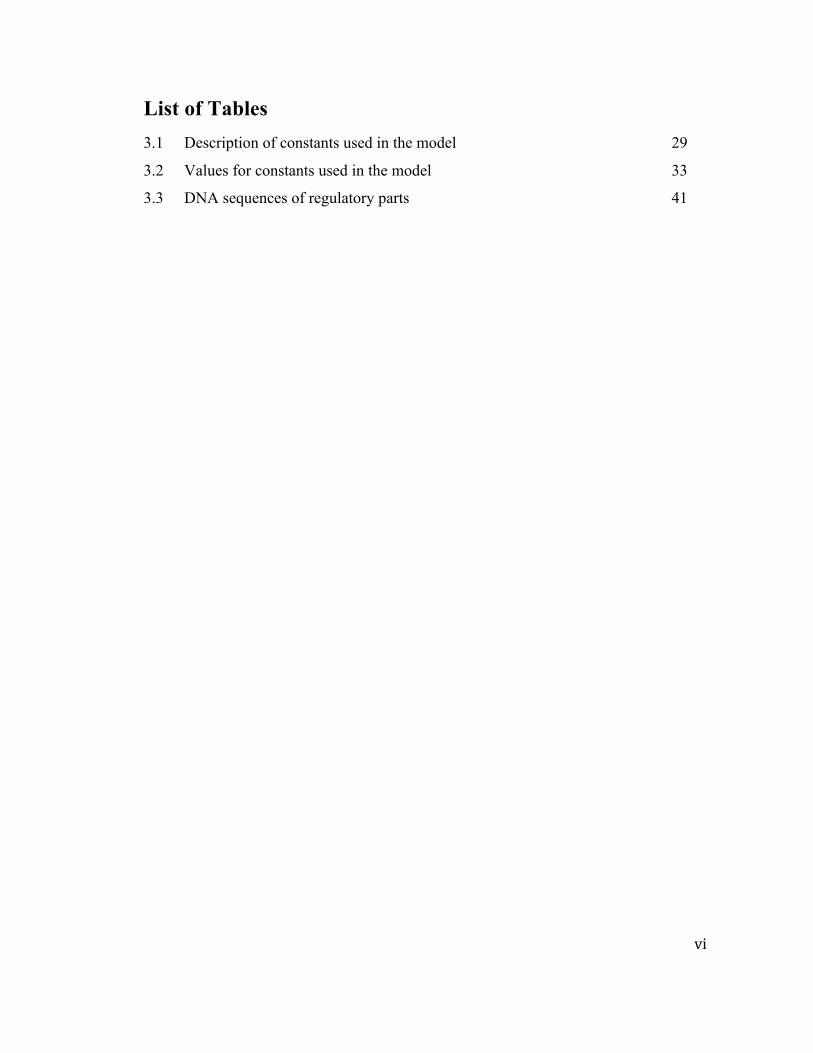
List of Tables vi
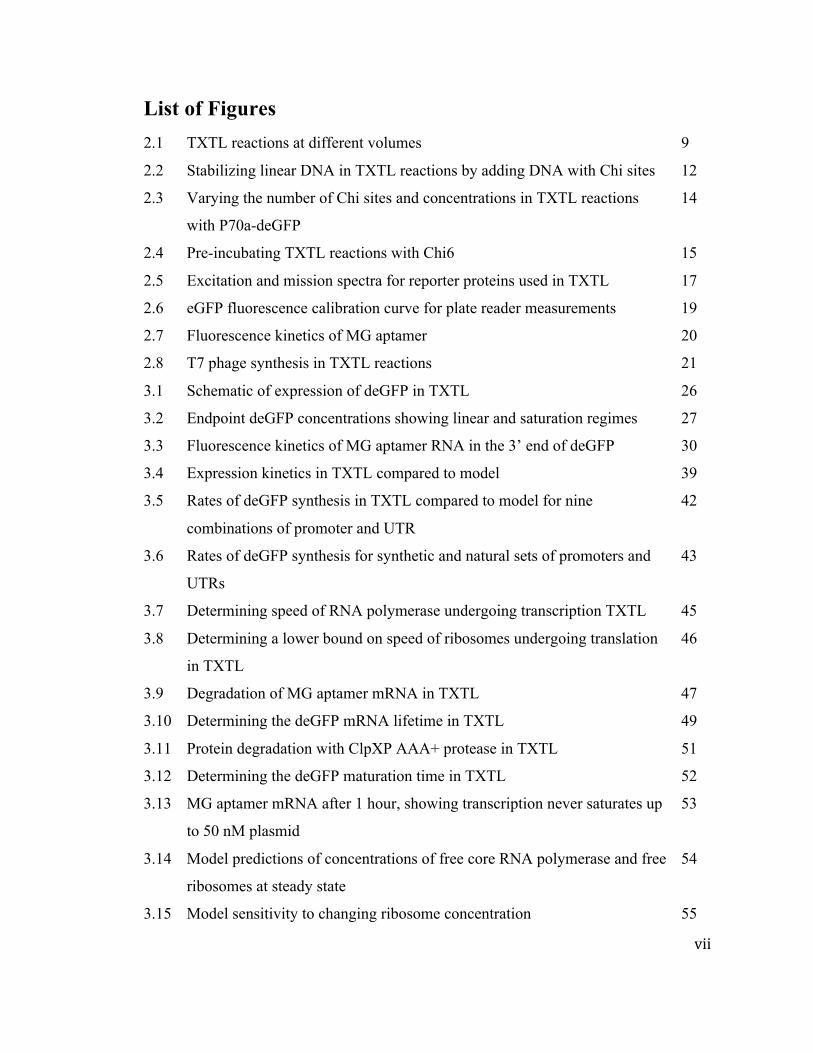
List of Figures vii
List of Abbreviations x
1. Introduction 1
1.1 Synthetic Biology and Cell-Free Systems 1
2. The All E. coli Transcription-Translation System 5
2.1 Cell-Free Extract 5
2.2 Cell-Free Reaction 6
2.2.1 Components 6
2.2.2 Plasmids 9
2.2.3 Linear DNA 11
2.2.4 Miniaturization 15
2.2.5 Fluorescence Readouts 16
2.2.6 Bacteriophage Synthesis 21
3. Expression and Modeling of a Single Gene 23
3.1 Development of the Model 23
3.2 Promoter and RBS Strength 40
3.3 Speed of RNAP and ribosomes 44
3.4 mRNA Inactivation 46
3.5 Protein Degradation 50
3.6 deGFP Folding and Maturation 51
3.7 Model Sensitivity 53
3.8 TXTL Load Calculator 58
4. TXTL Characterization of CRISPR Technologies 61
4.1 CRISPR Introduction 61
4.2 CRISPR in TXTL and CRISPR E. coli Lysates 63
iii
4.3 S. pyogenes Cas9 in TXTL 65
4.3.1 Targeting P70a-deGFP 65
4.3.2 Targeting other promoters 68
4.4 Assessing sgRNA activity in TXTL 70
4.4.1 Factors affecting repression 70
4.4.2 E. coli vs. TXTL 75
4.4.3 Targeting other genes 77
4.5 Other Cas Proteins 80
4.5.1 FnCpf1 80
4.5.2 E. coli Cascade 83
4.6 Repression Timescales 87
4.7 Anti-CRISPR Proteins 90
4.8 PAM determination 96
5. Gene Circuits 99
5.1 Circuit Parts 99
5.2 IFFL 102
5.3 PID Controller 106
6. Conclusion 110
References 113
iv
List of Publications Marshall, R., Noireaux, V,. “Quantitative modeling of transcription and translation of an all-E. coli cell-free system,” Scientific Reports (2019) Accepted
Agrawal, D.K.*, Marshall, R.*, “In vitro implementation of robust gene regulation in a synthetic biomolecular integral controller,” Nature Communications (2019) *Multiple first authors. IN REVIEW
Collias, D.*, Marshall, R.*, Collins, S.P., Beisel, C.L., Noireaux, V., “An educational module to explore CRISPR technologies with a cell-free transcription-translation system,” Synthetic Biology (2019) *Multiple first authors
Wandera, K.G., Collins, S.P., Wimmer, F., Marshall, R., Noireaux, V., Beisel, C.L., “An enhanced assay to characterize anti-CRISPR proteins using a cell-free transcription-translation system,” Methods (2019)
Westbrook, A., Tang, X., Marshall, R., Maxwell, C.S., Chappell, J., Agrawal, D.K., Dunlop, M.J., Noireaux, V., Beisel, C.L., Lucks, J., Franco, E., “Distinct timescales of RNA regulators enable the construction of a genetic pulse generator,” Biotechnology and Bioengineering (2019)
Marshall, R.*, Maxwell, C.S.*, Collins, S.P., Jacobsen, T., Luo, M.L., Begemann, M.B., Gray, B.N., January, E., Singer, A., He, Y., Beisel, C.L., Noireaux, V., “Rapid and Scalable Characterization of CRISPR Technologies Using an E. coli Cell-Free Transcription-Translation System,” Molecular Cell (2018) * Multiple first authors Marshall, R., Garamella, J., Noireaux, V., Pierson, A., “High-throughput Microliter-Sized Cell-Free Transcription-Translation Reactions for Synthetic Biology Applications using the Echo® 550 Liquid Handler” Application Note for Labcyte APP-G124 (2018) Marshall, R., Noireaux, V., “Synthetic biology with an all E. coli TXTL system: quantitative characterization of regulatory elements and gene circuits,” Book Chapter: Methods in Molecular Biology; Synthetic Biology, Springer. (2018) Maxwell, C.S., Jacobsen, T., Marshall, R., Noireaux, V., Beisel, C.L., “A detailed cell-free transcription-translation-based assay to decipher CRISPR protospacer-adjacent motifs,” Methods (2018) Agrawal, D.K., Tang, X., Westbrook, A., Marshall, R., Maxwell, C.S., Lucks, J., Noireaux, V., Beisel, C.L., Dunlop, M.J., Franco, E., “Mathematical Modeling of RNA-Based Architectures for Closed Loop Control of Gene Expression,” ACS Synthetic Biology (2018) Marshall, R., Maxwell, C.L., Collins, S.P., Beisel, C.L, Noireaux, V. “Short DNA containing χ sites enhances DNA stability and gene expression in E. coli cell-free transcription-translation systems,” Biotechnology and Bioengineering. (2017)
v
Rustad, M., Eastlund, A., Marshall, R., Jardine, P., Noireaux, V., “Synthesis of Infectious Bacteriophages in an E. coli-based Cell-free Expression System,” J Vis Exp. (2017) Schlesinger, O., Chemla, Y., Heltberg, M., Ozer, E., Marshall, R., Noireaux, V., Jensen, M.H., Alfonta, L., “Tuning of Recombinant Protein Expression in Escherichia coli by Manipulating Transcription, Translation Initiation Rates, and Incorporation of Noncanonical Amino Acids,” ACS Synthetic Biology (2017) Garamella, J.*, Marshall, R.*, Rustad, M.*, Noireaux, V., “The All E. coli TX-TL Toolbox 2.0: a Platform for Cell-Free Synthetic Biology,” ACS Synthetic Biology (2016) * Multiple first authors
vi
List of Tables 3.1 Description of constants used in the model 29
3.2 Values for constants used in the model 33
3.3 DNA sequences of regulatory parts 41
vii
List of Figures 2.1 TXTL reactions at different volumes 9
2.2 Stabilizing linear DNA in TXTL reactions by adding DNA with Chi sites 12
2.3 Varying the number of Chi sites and concentrations in TXTL reactions
with P70a-deGFP
14
2.4 Pre-incubating TXTL reactions with Chi6 15
2.5 Excitation and mission spectra for reporter proteins used in TXTL 17
2.6 eGFP fluorescence calibration curve for plate reader measurements 19
2.7 Fluorescence kinetics of MG aptamer 20
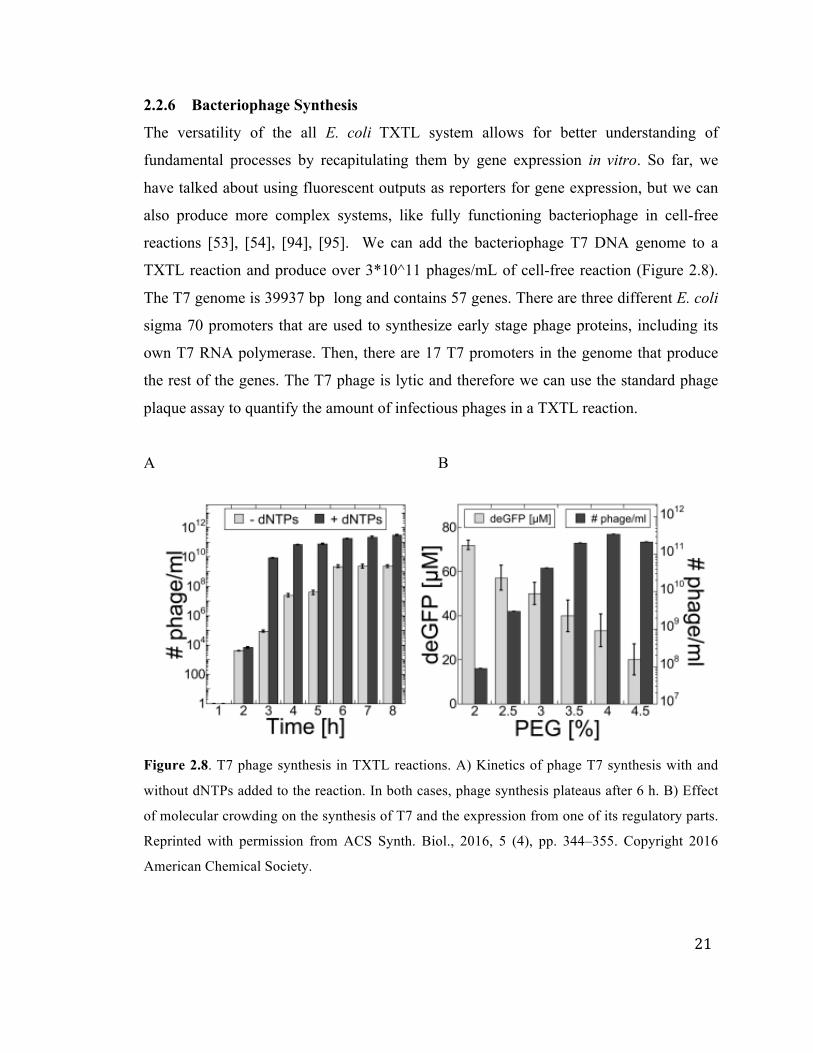
2.8 T7 phage synthesis in TXTL reactions 21
3.1 Schematic of expression of deGFP in TXTL 26
3.2 Endpoint deGFP concentrations showing linear and saturation regimes 27
3.3 Fluorescence kinetics of MG aptamer RNA in the 3’ end of deGFP 30
3.4 Expression kinetics in TXTL compared to model 39
3.5 Rates of deGFP synthesis in TXTL compared to model for nine
combinations of promoter and UTR
42
3.6 Rates of deGFP synthesis for synthetic and natural sets of promoters and
UTRs
43
3.7 Determining speed of RNA polymerase undergoing transcription TXTL 45
3.8 Determining a lower bound on speed of ribosomes undergoing translation
in TXTL
46
3.9 Degradation of MG aptamer mRNA in TXTL 47
3.10 Determining the deGFP mRNA lifetime in TXTL 49
3.11 Protein degradation with ClpXP AAA+ protease in TXTL 51
3.12 Determining the deGFP maturation time in TXTL 52
3.13 MG aptamer mRNA after 1 hour, showing transcription never saturates up
to 50 nM plasmid
53
3.14 Model predictions of concentrations of free core RNA polymerase and free
ribosomes at steady state
54
3.15 Model sensitivity to changing ribosome concentration 55
viii
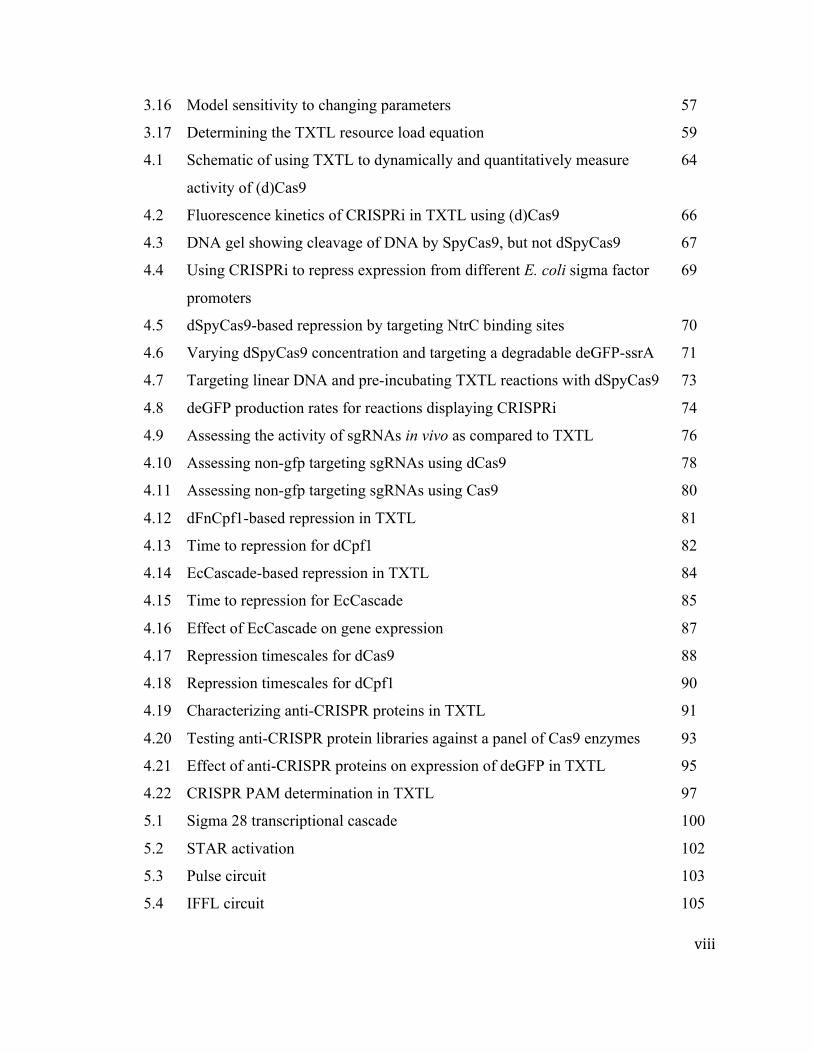
3.16 Model sensitivity to changing parameters 57
3.17 Determining the TXTL resource load equation 59
4.1 Schematic of using TXTL to dynamically and quantitatively measure
activity of (d)Cas9
64
4.2 Fluorescence kinetics of CRISPRi in TXTL using (d)Cas9 66
4.3 DNA gel showing cleavage of DNA by SpyCas9, but not dSpyCas9 67
4.4 Using CRISPRi to repress expression from different E. coli sigma factor
promoters
69
4.5 dSpyCas9-based repression by targeting NtrC binding sites 70
4.6 Varying dSpyCas9 concentration and targeting a degradable deGFP-ssrA 71
4.7 Targeting linear DNA and pre-incubating TXTL reactions with dSpyCas9 73
4.8 deGFP production rates for reactions displaying CRISPRi 74
4.9 Assessing the activity of sgRNAs in vivo as compared to TXTL 76
4.10 Assessing non-gfp targeting sgRNAs using dCas9 78
4.11 Assessing non-gfp targeting sgRNAs using Cas9 80
4.12 dFnCpf1-based repression in TXTL 81
4.13 Time to repression for dCpf1 82
4.14 EcCascade-based repression in TXTL 84
4.15 Time to repression for EcCascade 85
4.16 Effect of EcCascade on gene expression 87
4.17 Repression timescales for dCas9 88
4.18 Repression timescales for dCpf1 90
4.19 Characterizing anti-CRISPR proteins in TXTL 91
4.20 Testing anti-CRISPR protein libraries against a panel of Cas9 enzymes 93
4.21 Effect of anti-CRISPR proteins on expression of deGFP in TXTL 95
4.22 CRISPR PAM determination in TXTL 97
5.1 Sigma 28 transcriptional cascade 100
5.2 STAR activation 102
5.3 Pulse circuit 103
5.4 IFFL circuit 105
ix
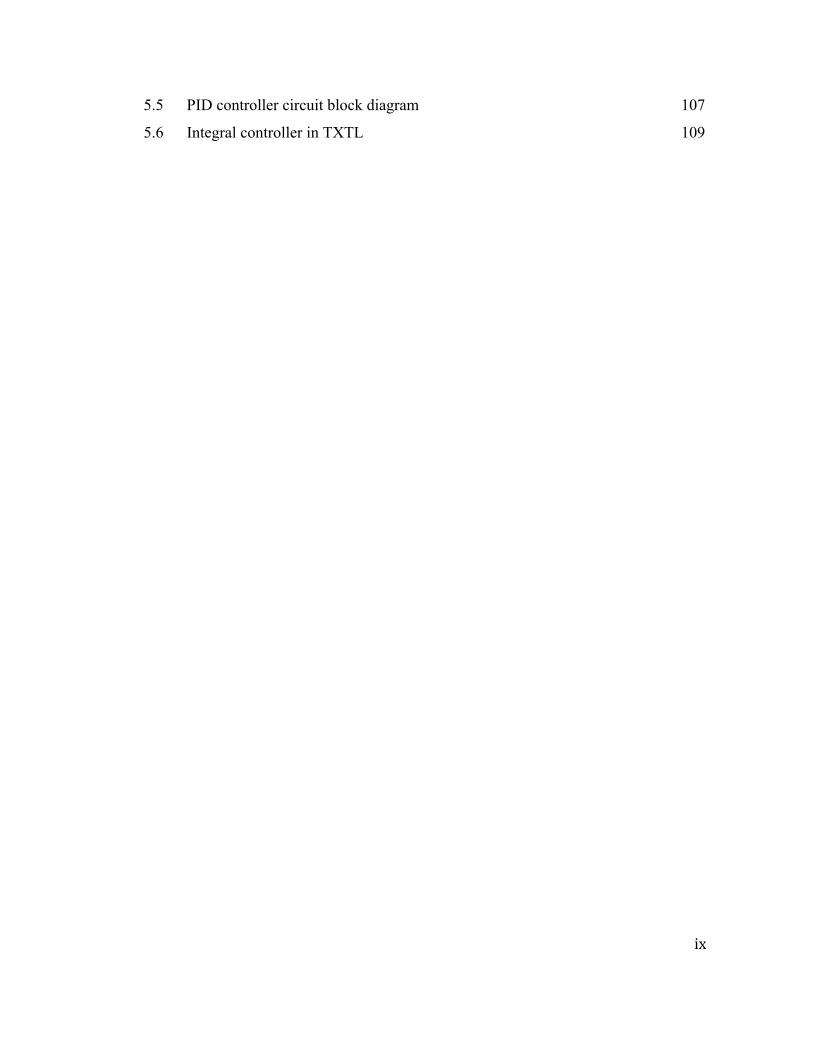
5.5 PID controller circuit block diagram 107
5.6 Integral controller in TXTL 109
x
List of Abbreviations
Cas: CRISPR associated
Cascade: CRISPR associated complex for antiviral defense
Chi6: DNA oligo containing six chi sites
Cpf1: Cas protein from F. novicida
CRISPR: Clustered Regularly Interspaced Short Palindromic Repeats
CRISPRi: CRISPR interference
crRNA: CRISPR RNA
dCas9: catalytically dead Cas9
dCpf1: catalytically dead Cpf1
deGFP: modified enhanced GFP
EcCascade: E. coli Cascade
GFP: Green Fluorescent Protein
gRNA: guide RNA
IFFL: Incoherent feed forward loop
MG: Malachite Green
PAM: Protospacer Adjacent Motif
PEG: Polyethylene Glycol
PID: Proportional-Integral-Derivative
PURE: Protein synthesis Using Recombinant Elements
RBS: Ribosome Binding Site
SEM: Standard Error of the Mean
sgRNA: single guide RNA
SpyCas9: Cas9 from S. pyogenes
STAR: Small Transcription Activating RNA
TL: Translation
xi
tracrRNA: transactivating CRISPR RNA
TX: Transcription
TXTL: Transcription-Translation cell-free system
UTR: Untranslated Region
1
Chapter 1
Introduction
1.1 Synthetic Biology and Cell-Free Systems
Synthetic biology is an emerging field with the goal of engineering new biological
systems, including designing, modeling, and constructing. It uses a quantitative and
rigorous approach to biology that has not always been present historically in biology labs.
One main way of doing synthetic biology is reprogramming a cell or cellular system to
perform novel tasks by altering its DNA or adding synthetic DNA. Synthetic biology
really took off recently with the first successful design and construction of synthetic
networks, including the toggle switch [1] and the repressilator [2]. These networks show
that we can engineer biology to obtain complicated yet predictable behaviors. This
quantitative approach is very similar to how physicists approach problems, and therefore,
many leaders in the field of synthetic biology are trained physicists. There are a wide
range of potential applications from synthetic biology, including biomanufacturing of
biofuels [3], [4], vaccines and antibodies [5], [6], phage therapies [7], optimization of
enzyme activities [8], [9], and biosensing [5], [10]–[13].
One area of synthetic biology is cell-free expression systems. Cell-free systems
are versatile tools that can be used for inexpensive and rapid characterization and
prototyping of protein synthesis and enzymatic activity. They make possible a bottom-up
approach towards studying and understanding many biological systems, as well as
possibilities to design new systems with synthetic biology. There are many different cell-
free systems available that each provide unique benefits for producing and studying gene
expression. Protein synthesis using cell-free systems typically takes only a few hours,
while synthesis in cells often requires days or weeks. Cell-free systems are also easy to
use, and require little experience or knowledge to get started. In this work, we developed
and optimized an all E. coli cell-free system and used it for the modeling and prototyping
of gene circuits, as well as the characterization of CRISPR elements. First, we look at a
2
brief history and introduction of cell-free systems.
Cell-free expression systems were first introduced in the 1950s to try to tackle the
question of how proteins are made from amino acids [14]–[22]. Nirenberg and Matthaei
used cell-free expression to help decipher the genetic code [23]. These original systems
only had translation; exogenous mRNAs were added to reactions with ribosomes and
other translational machinery from E. coli. They added synthetic mRNA to test tubes
with the E. coli translational machinery and only one of the twenty amino acids, then
measured to determine if a polypeptide had formed. Later, in 1969, an E. coli cell-free
extract was used by Chambers and Zubay to synthesize beta-galactosidase to study
enzyme synthesis and gene regulation [24], [25]. Beta-galactosidase is a major part of the
lac operon and whose expression is almost entirely repressed by the lac repressor in cells,
and they were able to repress up to 95% in the cell-free system, expressing from synthetic
DNA. This was the first instance of a coupled transcription-translation system, using
DNA as template instead of endogenous or exogenous mRNA [25], [26]. One main issue
with these early cell-free systems is that the protein yield was very low. In attempt to
increase protein production, RNA polymerase from phages T7 and SP6 were introduced,
with their respective promoters, to cell-free systems, keeping the native ribosomes [27]–
[29]. The phage promoters and polymerase are much stronger than in the native systems.
Today, many of the most common cell-free systems still employ phage transcription, like
the PURE system (Protein synthesis Using Recombinant Elements). Even though these
systems use phage transcription, transcription and translation are still coupled, meaning
that they both happen in the same reaction. The PURE system uses purified components,
including the minimal translation machinery proteins from E. coli, thus decreasing the
amount of inhibitory factors like nucleases and proteases in the cell-free reactions [30]–
[32]. The PURE system is one of the most widely used systems, in part because it is
commercially available. There is also a better understanding of exactly what is in each
reaction because only purified components are added, instead of using a cell lysate.
There have been many cell-free systems designed for specific purposes, or with
specific advantages, including systems from many different organisms. The PURE
system, for example, is a very modular, yet expensive. E. coli extract based systems are
3
lower cost while still achieving high protein synthesis yield, yet there is limited
possibility for post-translational modifications [33]. Wheat germ cell-free systems have
been shown be to useful in expressing many types of eukaryotic proteins and membrane
proteins [34], [35]. There have been cell-free systems designed to stabilize linear DNA
templates [36], [37], and activation of endogenous metabolic pathways to increase
protein expression [38], [39].
Cell-free systems themselves are tools and not necessarily a new branch of
science, and therefore they have a wide range of applications. One big goal of synthetic
biologists is to try to understand the origin of life, and create artificial cells. Cell-free
systems can be used for this purpose. They can be used for both top-down and bottom-up
approaches to determining the minimal set of genes to sustain life [40], [41], of which
current estimates are about 200 essential genes, most of which are related to protein
synthesis [42], [43]. The top-down approach starts with a living organism, and focuses on
reducing the size by eliminating non-essential genes, while the bottom up approach starts
from scratch and adds essential genes. Using the top-down approach, Venter and
colleagues created a living organism with 473 genes [44]. Although a huge result, many
of the genes have unknown functions and there is no claim that this is the minimal
amount of genes to sustain a living organism. Bottom-up approaches are perhaps more
difficult to create a living organism, but are very useful to study individual components
and mechanisms [45]–[51]. One such is the compartmentalization, or forming a
cytoskeleton structure. Towards this goal, cell-free systems can be encapsulated into cell-
sized containers, not just performed in batch mode. Reactions have been encapsulated in
liposomes and phospholipid vesicles [52]–[57] as well as water droplets in oil [46], [58],
[59].
Another application is to study unnatural amino acids. Cell-free systems can be
designed to support many unnatural amino acids, which can significantly increase the
genetic code and the proteome [60]–[62]. Also, cell-free systems can be used for protein
engineering and evolution, which is currently an incredibly hot topic with huge potential
applications. Directed evolution can increase enzymatic activity of specific proteins [9],
[63]. Directed evolution involves iterative cycles of mutations on some gene, followed by
4
selection of samples with the desired increase (or decrease) in enzymatic activity. New
technologies that allow for cheaper and higher throughput cell-free expression only
increases the value of such systems for directed evolution applications. One exciting new
use of cell-free systems is field diagnostics. Cell-free extract can be lyophilized onto
paper substrates and remains functional at room temperature for months [64]. This allows
for cheap storage due to not needing at -80°C freezer, and they can be brought out into
the field for diagnostics. Paper-based cell-free reactions have been shown to diagnose
samples containing the Zika virus [65].
One of the main applications of cell-free systems, and the one that this work
focuses on the most, is the prototyping of regulatory elements [53], [66]–[71], enzymes
[72], [73], and genetic circuits [45], [74]–[78]. Here, we first look at modeling the
expression of a single gene in a cell-free system, so that further prototyping using the
system can be predictable. Having an accurate model allows for better engineering of
more complicated systems. Then, we look at characterizing CRISPR enzymes and
prototyping a library of different guide RNAs, anti-CRISPR proteins, and other CRISPR
elements. CRISPR elements can also be used as regulatory mechanisms and incorporated
into genetic circuits [79], [80]. Finally, we use TXTL to execute gene circuits, including a
simple transcription cascade, IFFLs, and an integral feedback controller.
5
Chapter 2
The All E. coli Transcription-Translation System
2.1 Cell-Free Extract
Although cell-free systems with phage transcription have high protein yields, they lack
the versatility to study regulation by decreasing the repertoire of regulatory parts. For
example, in a system that uses the strong T7 polymerase, only the T7 promoter can be
used. In our lab, the all E. coli cell-free transcription-translation system (TXTL) has been
developed, which has increased protein yields [81], but keeps all of the native E. coli
promoters, transcription factors, and other regulatory elements [54]. This makes the E.
coli extract very powerful for studying gene regulation and gene circuits. In the all E. coli
extract, transcription is based on the endogenous housekeeping sigma factor 70 (the
names of E. coli sigma factors are based on their molecular weight in kD). Sigma factor
70 forms a holoenzyme with the E. coli RNA polymerase, and recruits the polymerase to
sigma 70 promoters, which contain specific recognition sequences at the -35 and -10
position relative to transcription start. The consensus sequences for -35 and -10 are
TTGACA and TATAAT respectively, and in general is the strongest sigma 70 promoter
sequence. Mutations on those sequences decreases the strength of the promoter.
To prepare Noireaux TXTL extract, E. coli cells of the Rosetta2 strain are grown
in a very nutrient rich medium, 2xYT, at 37°C. The Rosetta2 strain contains the pRARE2
plasmid, which encodes for several rare tRNAs [82]. Optimally, the cell cultures are
cascaded, starting with a small volume of a few mL, incubated until saturation of cell
density (8 hours), then diluted into a larger volume of about 60 mL and incubated again
until saturation of cell density (8 hours), and diluted once more into a volume of about
1.5 L and incubated until OD 600 2-2.5. Cells are collected by centrifugation, then
washed multiple times in an S30 buffer before being lysed by a cell press at 13000 psi. A
further incubation of the cell lysate and centrifugation rids the lysate of any endogenous
mRNAs and DNA, such that in the final extract, only proteins and mRNA from added
6
DNAs are synthesized. A dialysis step optimizes the concentrations of magnesium and
potassium ions and removes molecules under the 10 kDA pore size. After a final
centrifugation, the TXTL extract is frozen in liquid nitrogen, and can be stored at -80°C
for years.
Because the E. coli cells are grown in very good conditions, the cells remain very
healthy. This ensures that only the sigma factor 70 is expressed. The other six sigma
factors (19, 24, 28, 32, 38, 54) are expressed in stressful conditions. For example, sigma
28 is the sigma factor for motility and, when expressed, regulates the expression of
flagella such that the E. coli can move in response to chemical signals [83]. Each sigma
factor can form a holoenzyme with the E. coli RNA polymerase, which recognizes a
unique promoter sequence. Because these other six sigma factors are not expressed in the
cells when they are collected, DNA containing their cognate promoters in TXTL
reactions will not yield any expression. However, the sigma factors can be expressed
from a sigma 70 promoter, after which, they can compete for the RNA polymerase and
express from their cognate promoters. This opens up a library of possible regulatory parts
in TXTL.
2.2 Cell-Free Reaction
2.2.1 Components
Cell-free reactions are composed of many different components that either mimic cellular
functions or chemically alter the environment in order to maximize protein synthesis.
One third of the volume of a cell-free reaction is composed of the E. coli crude extract,
which contains the transcription and translation machineries: RNA polymerase and
ribosomes, respectively. The crude extract is 9-10 mg/ml in a TXTL reaction, compared
to about 250-300 mg/ml in E. coli, which gives a dilution factor of about 25-30. It is not
known why this is the optimum concentration of crude extract for cell-free protein
expression. The second third of the volume of a cell-free reaction is composed of an
amino acid mix, an energy buffer, salts, ions, and molecular crowders. The final third of
the volume can be completed with the information source (DNA, RNA) and any other
7
miscellaneous components, like dyes or enzymes. Typically, cell-free reactions are
assembled from all of the separate components and immediately incubated. However, a
pre-packaged system can also be used, where all components except for the information
source are mixed and then flash frozen in liquid nitrogen and stored at -80°C until use.
The pre-packaged system is especially useful if experiments always use the same
concentration of components aside from DNA, as well as for users with less experience
with micropipettes.
The energy buffer is composed of the following components, with concentrations
and functions listed (concentrations designated are final concentrations in a cell-free
reaction):
• 50 mM Hepes pH 8, maintains physiological pH
• 1.5 mM ATP and GTP, energy sources and mRNA units
• 0.9 mM CTP and UTP, mRNA units
• 0.2 mg/mL tRNA, connects mRNA codons to amino acids
• 0.26 mM coenzyme A, oxidator in ATP regeneration pathway
• 0.33 mM NAD, redox electron carrier
• 0.75 mM cAMP, signaling molecule for catabolite activator protein, a
transcriptional activator
• 0.068 mM folinic acid, aids in transcription
• 1 mM spermidine, aids in transcription, DNA binding, and pH control
• 30 mM 3-PGA, substrate in ATP regeneration pathway
All the components in the energy buffer are mixed, aliquoted, flash frozen with liquid
nitrogen, and stored at -80°C until use. The energy buffer is stable at -80°C for at least
three years without any significant loss of activity.
Amino acids are the building blocks of proteins. The amino acid mix contains equimolar
concentrations all 20 amino acids, such that they are at 3 mM in cell-free reactions. The
amino acids are dissolved in KOH, mixed, buffered to pH between 7-8 with glacial acetic
acid, aliquoted, flash frozen with liquid nitrogen, and stored at -80°C until use. The
amino acid mix is stable at -80°C for at least three years. When thawed for use, the amino

8
acid mix may precipitate, but it still works without any loss of activity if it is vortexed
thoroughly.
The other components in a reaction, with their optimum concentration for expression
of the reporter protein deGFP, are 60-100 mM potassium glutamate, 3-5 mM magnesium
glutamate, 20-40 mM maltodextrin, and 1.5-2% w/v PEG8000. PEG is a polymer that
facilitates molecular crowding, and can have big effects on reaction rate constants. TXTL
reactions are less sensitive to potassium glutamate and maltodextrin, and more sensitive
to magnesium glutamate and PEG8000.
Protein synthesis in a cell-free reaction is optimum under a specific set of conditions.
Expression is maximized when reactions are incubated at 29°C. We hypothesize that this
temperature is ideal due to the trade-off of synthesis and degradation of mRNA, as well
as translation rates. At higher or lower temperatures, the reactions still produce protein,
but less of it and at a slower synthesis rate. Also, the linear regime of protein synthesis is
much shorter. However, it is conceivable that there is some experiments that would best
run at temperatures other than 29°C, like the optimum of 37°C for E. coli cells, or at
lower temperatures for the expression of luciferase. It may also be of interest to study
how a gene circuit behaves at different temperatures.
Cell-free reactions are very sensitive to oxygenation. Without proper oxygenation,
endpoint protein synthesis can be dramatically reduced. Oxygen is especially needed for
GFP chromophore maturation [84]. Because of this reliance on oxygen, both the volume
and position of reaction droplets affect the protein synthesis rates. We tested different
volumes in a 96 well plate (Figure 2.1) and found that 2 µl is the optimum volume. 2 µl
reactions maintain the highest deGFP synthesis rate for the longest time. Spreading the
reaction along the surface of the well can also increase protein synthesis by increasing the
surface-area-to-volume ratio. However, this makes the well-to-well reproducibility of
detected fluorescence by a plate reader very poor (data not shown). Oxygenation is a
factor that seems to be forgotten in labs around the world that use TXTL. Many
experiments are done at suboptimal volumes, decreasing the protein yield and rate of
synthesis.
9
Figure 2.1. Fluorescence kinetics for TXTL reactions containing 5 nM of P70a-deGFP, at
different volumes in a 96-well v-bottom plate. Error bars are from the standard deviation of four
wells.
2.2.2 Plasmids
Plasmids are the main information source in TXTL reactions. For expression of a protein,
each plasmid construct must contain an E. coli sigma 70 promoter (unless other E. coli
sigma factors or other RNA polymerase are present in the reaction), a ribosome binding
site, and a gene with translational start and stop codons. There are varying strengths of
both promoters and untranslated regions (containing ribosome binding sites), which
affect the transcription and translation rates, and this is investigated further in chapter 3.1.
One of the most common things needed to be done for a certain gene circuit is
optimizing DNA concentrations for prototyping as well as maximizing protein expression.
Some circuit behavior may only be elucidated at certain plasmid stoichiometries.
Therefore, it may be essential to investigate a large parameter space of DNA
concentrations in order to not miss interesting behaviors. Sets of reactions must be done,
increasing the concentration of each DNA component independently, in order to observe
all possible responses of a circuit. Depending on the concentration and strength of the
0"
10"
20"
30"
40"
50"
60"
70"
80"
0" 5" 10" 15"
[deG
FP](µ
M(
Time((h)(
5"µl"3"µl"2"µl"1"µl"0.5"µl"
10
DNA parts, the polymerase or ribosomes may also become limiting in a reaction. This
effect is explored in more detail in section 3.4.
Standard cloning methods can be used to construct plasmids from which to express
proteins in TXTL. After a plasmid is successfully constructed and sequenced, most often
it needs to be amplified in order to have enough DNA to thoroughly test in TXTL.
Standard procedures can be used to transform plasmids into a chemically competent E.
coli strain. Standard cloning strains should all function; however, some proteins may be
toxic to E. coli. If a protein is toxic, there are a couple of ways to proceed. One is to
reduce the plasmid copy number by changing the origin of replication in the plasmid. For
most non-toxic genes, we use a high copy number origin of replication, ColE1. For more
toxic genes, we use a low copy origin of replication, p15A. A second way to proceed is to
use operator sites on the plasmid promoter and use an E. coli strain that overexpresses the
repressor that recognizes the respective operator. For example, the strain KL740
overexpresses the lambda repressor cI, which represses transcription from the common
P70a promoter. Other common strains that we use are JM109, which overexpresses the
lacI repressor, repressing the promoter PL-lacO1, and DH5aZ1, which overexpresses the
tetR repressor, repressing the promoter PL-tetO1. Sometimes, even when overexpressing
a repressor, there is still a leak and the toxicity of the desired gene kills the cells. Then,
the gene may have to be cloned under promoter for another E. coli sigma factor (other
than sigma 70), like sigma 28. There is a negligible amount of sigma 28 in the cell extract,
so plasmids with a sigma 28 promoter, like P28a, should be completely silent. These are a
few tools to use when trying to clone a potentially toxic gene.
Standard bacterial cultures can be made, using LB medium, and mini- or midi-preps
can be done to isolate the plasmid using any commercial kit, like Zymo or Sigma-Aldrich.
After plasmid amplification and isolation, depending on the quality of the prep-kit used,
it is often useful to do one last purification step using a PCR purification kit, like
PureLink from Invitrogen. After this final cleanup step, the plasmid can be quantified
using a Nanodrop, or other methods. For many plasmids, including reporters, it is useful
to have a DNA stock of at least 50 nM in order to test the full range of DNA
concentrations
11
2.2.3 Linear DNA
In the past, most cell-free TXTL systems have used plasmid DNA for gene expression.
However, plasmids are expensive or require time consuming cloning procedures; linear
DNA would provide a simpler and cheaper way to express proteins. Linear gene
fragments as long as a few kbp dsDNA can now be synthesized and purchased from a
number of companies for much cheaper than a plasmid. Sequences from plasmids or
genomes can be PCR amplified into linear DNA, offering another simple way to generate
linear DNA. Linear DNA has not been taken advantage of in TXTL in the past because in
the TXTL cell-free extract, there is the DNA exonuclease RecBCD that chews up linear
DNA [85]. The RecD subunit degrades linear DNA at the 3’ end at a rate of more than
500 bp/s [86]. Therefore, linear DNA is unstable in TXTL reactions. Consequently,
RecBCD must be deleted, or a RecBCD inhibitor must be added to the reaction to stall
the RecBCD and extend the lifetime of linear DNA pieces.
Previously, there have been TXTL extracts prepared with the recBCD genes deleted
[87]; however, these extracts have not been optimized for cell-free expression and they
are T7 hybrid systems, requiring transcription from the T7 promoter, which limits the
amount of available regulatory parts. A second solution is to add the Gam protein from
the lambda phage, which binds to RecBCD and inhibits its degradation of linear DNA
[85]. This method has proven effective [53], but it requires the expression and
purification of the protein, which can be a long and tedious process. Therefore, we
endeavored to find another possible approach to stabilize linear DNA that was simpler
and did not require protein purification steps.
In the E. coli genome, there is a short sequence of DNA, 5’ – GCTGGTGG – 3’,
called a Chi site, that helps regulate the RecBCD complex because the complex makes a
double stranded cut near this sequence. Before cutting, the RecBCD stalls at a Chi site as
part of homologous recombination [86]. Because the RecBCD stalls at a Chi site, we can
overload a TXTL reaction with DNA encoding many Chi sites, such that the RecBCD
will be inhibited for some time, and other linear DNA from which we want to express
proteins can be stabilized (Figure 2.2) [88]. This approach of adding DNA containing Chi
sites is useful because it is very easy and cheap to generate. Two oligonucleotides
12
encoding Chi sites, with a five nucleotide spacer between each site, are annealed. Then,
the dsDNA is added to a TXTL reaction.
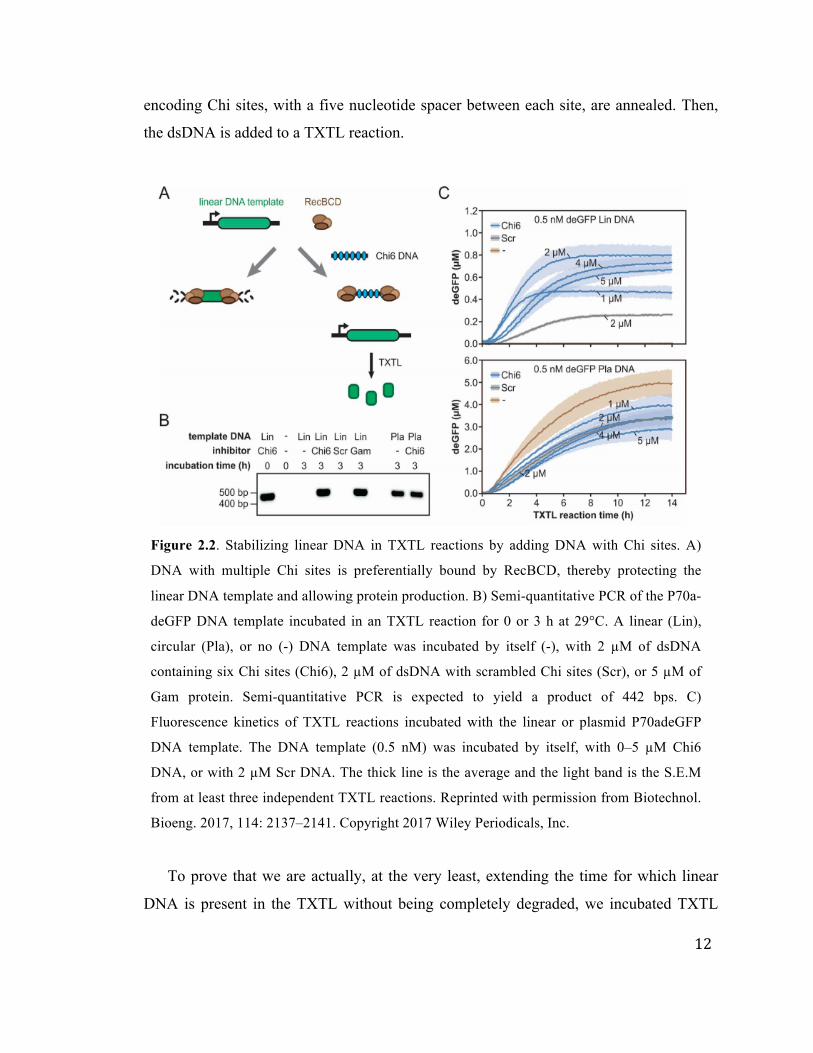
Figure 2.2. Stabilizing linear DNA in TXTL reactions by adding DNA with Chi sites. A)
DNA with multiple Chi sites is preferentially bound by RecBCD, thereby protecting the
linear DNA template and allowing protein production. B) Semi-quantitative PCR of the P70a-
deGFP DNA template incubated in an TXTL reaction for 0 or 3 h at 29°C. A linear (Lin),
circular (Pla), or no (-) DNA template was incubated by itself (-), with 2 µM of dsDNA
containing six Chi sites (Chi6), 2 µM of dsDNA with scrambled Chi sites (Scr), or 5 µM of
Gam protein. Semi-quantitative PCR is expected to yield a product of 442 bps. C)
Fluorescence kinetics of TXTL reactions incubated with the linear or plasmid P70adeGFP
DNA template. The DNA template (0.5 nM) was incubated by itself, with 0–5 µM Chi6
DNA, or with 2 µM Scr DNA. The thick line is the average and the light band is the S.E.M
from at least three independent TXTL reactions. Reprinted with permission from Biotechnol.
Bioeng. 2017, 114: 2137–2141. Copyright 2017 Wiley Periodicals, Inc.
To prove that we are actually, at the very least, extending the time for which linear
DNA is present in the TXTL without being completely degraded, we incubated TXTL

13
reactions containing either linear or plasmid DNA for either 0 or 3 hours. Reactions also
either included the Chi6 (oligonucleotide with six Chi sites), Gams, a scrambled
oligonucleotide, or water as a control. We then performed semi quantitative PCR on the
samples to amplify any linear DNA still present in the reactions. Figure 2.2B shows the
amplified sequences on gel, and we see that when we add the Chi6 dsDNA
oligonucleotide to the reactions with linear DNA template, we get a thick band at the
expected 442 bp, but when we do not have the Chi6 oligonucleotide, there is no amplicon
at all.
When adding DNA containing Chi sites, there is a trade-off between the negative
effect on gene expression and the positive effect on stabilization of linear DNA. Figure
2.2C shows the expression of GFP from both linear (top) and plasmid (bottom) DNA,
while varying the concentration of either the scrambled or the Chi6 dsDNA
oligonucleotide [88]. The addition of Chi6 DNA hinders the expression of GFP from
plasmids relatively linearly, but the expression is still somewhat strong compared to
without the Chi6 DNA, at about 60%. However, when expressing GFP from linear DNA,
we see no expression at all without Chi6 DNA, and when we add Chi6, we see up to 0.8
µM deGFP with 2 µM Chi6 DNA and 0.5 nM linear P70a-deGFP template. It is also
interesting to note that the rate of GFP synthesis is higher for 1 and 2 µM Chi6 relative to
4 and 5 µM; however, with 1 µM, we reach a plateau much earlier than with 4 or 5 µM,
such that the endpoint GFP expression is higher for 4 and 5 µM relative to 1 µM. 2 µM is
the optimum concentration, where we express at a higher rate, and extend the time for
which we maintain expression.
We also investigated the optimum number or Chi sites to include on a single dsDNA
oligonucleotide (Figure 2.3). For TXTL reactions with either 0.5 or 5 nM P70a-deGFP
linear or plasmid DNA, we tested a range of inhibitor concentrations for dsDNA
oligonucleotides containing 4, 6, or 9 Chi sites, as well as a ssDNA oligonucleotide with
six Chi sites, a dsDNA and ssDNA scrambled oligonucleotide, and the GamS protein.
The optimum for expression of GFP from linear DNA is with 1-2 µM of oligonucleotides
with nine Chi-sites. However, 2 µM oligonucleotides with six Chi-sites also yields good
expression from linear DNA, and it is considerably cheaper to purchase because the
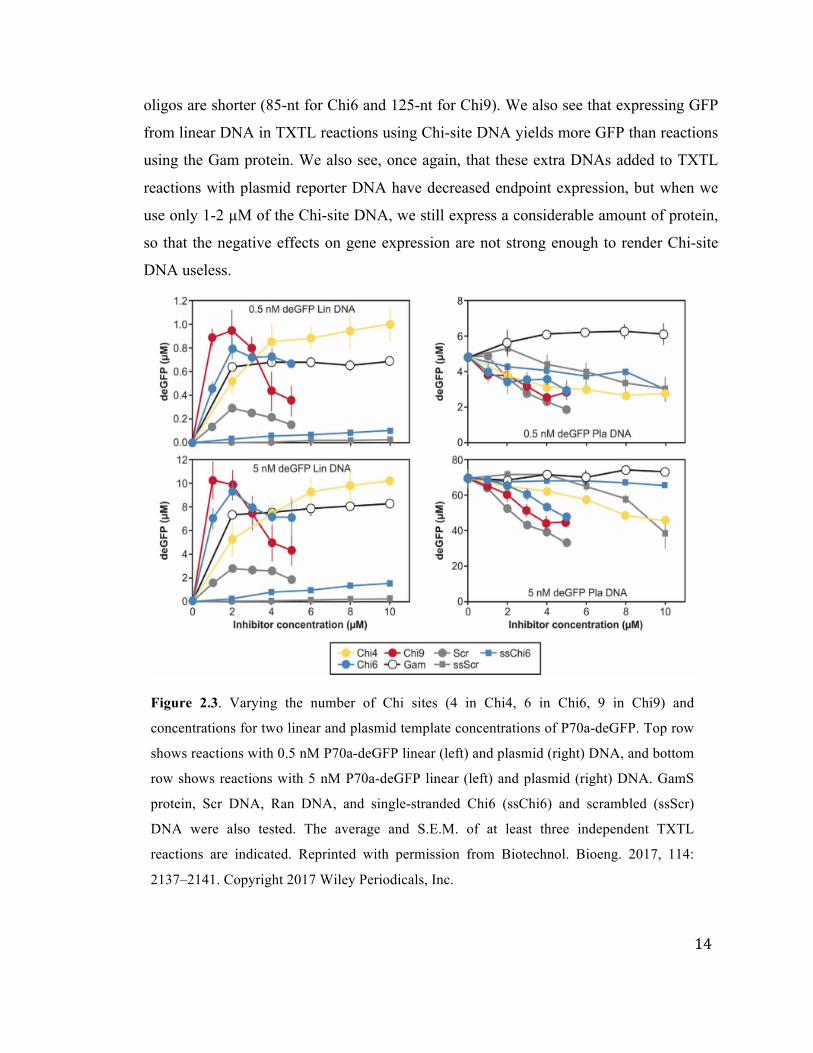
14
oligos are shorter (85-nt for Chi6 and 125-nt for Chi9). We also see that expressing GFP
from linear DNA in TXTL reactions using Chi-site DNA yields more GFP than reactions
using the Gam protein. We also see, once again, that these extra DNAs added to TXTL
reactions with plasmid reporter DNA have decreased endpoint expression, but when we
use only 1-2 µM of the Chi-site DNA, we still express a considerable amount of protein,
so that the negative effects on gene expression are not strong enough to render Chi-site
DNA useless.
Figure 2.3. Varying the number of Chi sites (4 in Chi4, 6 in Chi6, 9 in Chi9) and
concentrations for two linear and plasmid template concentrations of P70a-deGFP. Top row
shows reactions with 0.5 nM P70a-deGFP linear (left) and plasmid (right) DNA, and bottom
row shows reactions with 5 nM P70a-deGFP linear (left) and plasmid (right) DNA. GamS
protein, Scr DNA, Ran DNA, and single-stranded Chi6 (ssChi6) and scrambled (ssScr)
DNA were also tested. The average and S.E.M. of at least three independent TXTL
reactions are indicated. Reprinted with permission from Biotechnol. Bioeng. 2017, 114:
2137–2141. Copyright 2017 Wiley Periodicals, Inc.
15
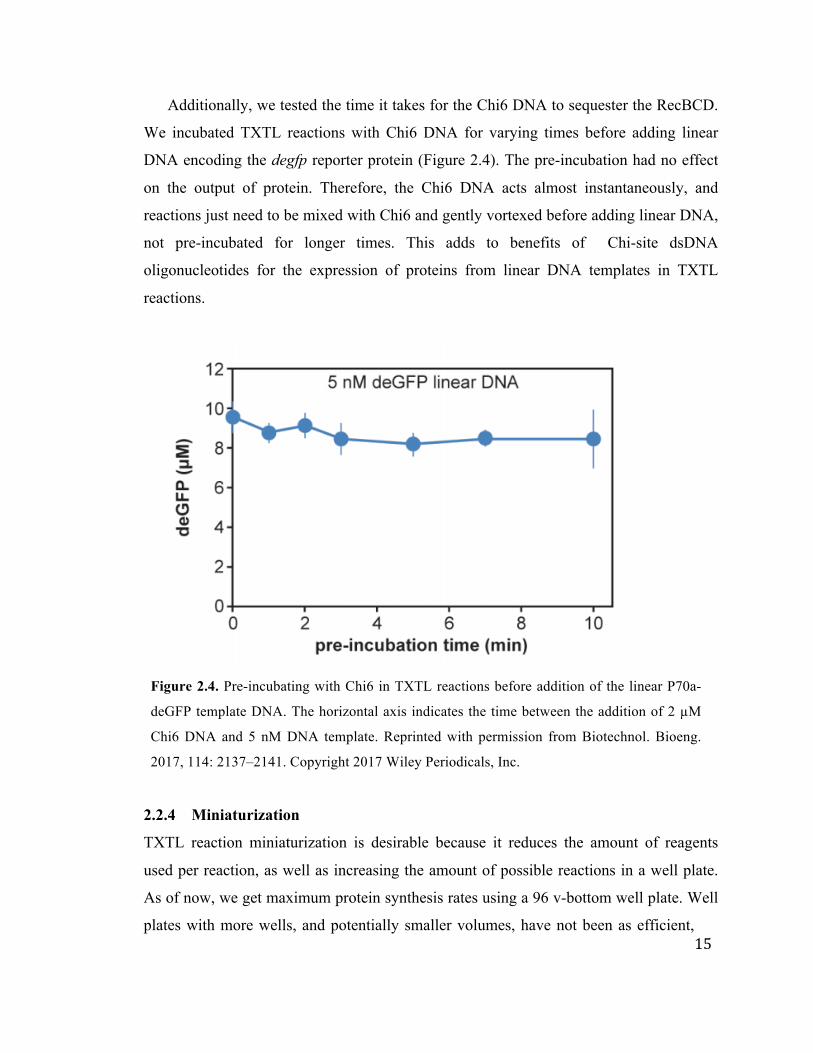
Additionally, we tested the time it takes for the Chi6 DNA to sequester the RecBCD.
We incubated TXTL reactions with Chi6 DNA for varying times before adding linear
DNA encoding the degfp reporter protein (Figure 2.4). The pre-incubation had no effect
on the output of protein. Therefore, the Chi6 DNA acts almost instantaneously, and
reactions just need to be mixed with Chi6 and gently vortexed before adding linear DNA,
not pre-incubated for longer times. This adds to benefits of Chi-site dsDNA
oligonucleotides for the expression of proteins from linear DNA templates in TXTL
reactions.
Figure 2.4. Pre-incubating with Chi6 in TXTL reactions before addition of the linear P70a-
deGFP template DNA. The horizontal axis indicates the time between the addition of 2 µM
Chi6 DNA and 5 nM DNA template. Reprinted with permission from Biotechnol. Bioeng.
2017, 114: 2137–2141. Copyright 2017 Wiley Periodicals, Inc.
2.2.4 Miniaturization
TXTL reaction miniaturization is desirable because it reduces the amount of reagents
used per reaction, as well as increasing the amount of possible reactions in a well plate.
As of now, we get maximum protein synthesis rates using a 96 v-bottom well plate. Well
plates with more wells, and potentially smaller volumes, have not been as efficient,
16
but further work could be done to improve this. Typically, we do 2 µl reactions in the
well plate, which is a factor of five smaller than what was used just a few years ago. Also,
many other labs around the world still use larger volumes for TXTL reactions (10 µl or
more), which is not as efficient as 2 µl for protein synthesis because of oxygenation
issues.
One incredibly useful tool that aided with TXTL reaction miniaturization is the
Labcyte Echo 550 Liquid Handler. The Echo Liquid Handler shoots 2.5 nl droplets from
the well of a source plate into the well of a destination plate. The Echo can dispense
hundreds of droplets per second, and a full 96 well plate with completed 2 µl TXTL
reactions can be dispensed in about 16 minutes. Not only does the Echo 550 Liquid
Handler increase the speed of reaction assembly and decrease reaction size, it relieves
some possible error sources and fatigue of assembling many reactions by micropipetting
by hand.
2.2.5 Fluorescence Readouts
Most of the data presented in this thesis is that of measuring fluorescence readouts on a
plate reader. TXTL reactions are pipetted or dispensed into well plates and incubated in
the plate reader. There are two different models of plate readers used in this thesis: the
BioTek Synergy H1 and the BioTek Neo2. Both of these reader models operate the same
way and use the same software, Gen5. The readers use monochrometers to measure
fluorescence, which allows the user so select excitation and emission wavelengths down
to the nanometer. In TXTL reactions, we want to quantitatively evaluate the performance
or behavior of gene expression from circuit. This can be accomplished by tracking the
concentration of a reaction component. In a reaction, we produce mRNA from
transcription and proteins from translation. We can track one or both of these two
products, mRNA and proteins, to asses a circuit. However, the mRNA or protein must be
fluorescent so that we can measure it easily. There are other ways to quantify the
concentration of protein or RNA, but they are much more time consuming than taking a
fluorescence measurement. Therefore, we take advantage of fluorescent reporter proteins
(like green fluorescent protein, GFP, from the jellyfish), and RNA fluorescent aptamers.
17
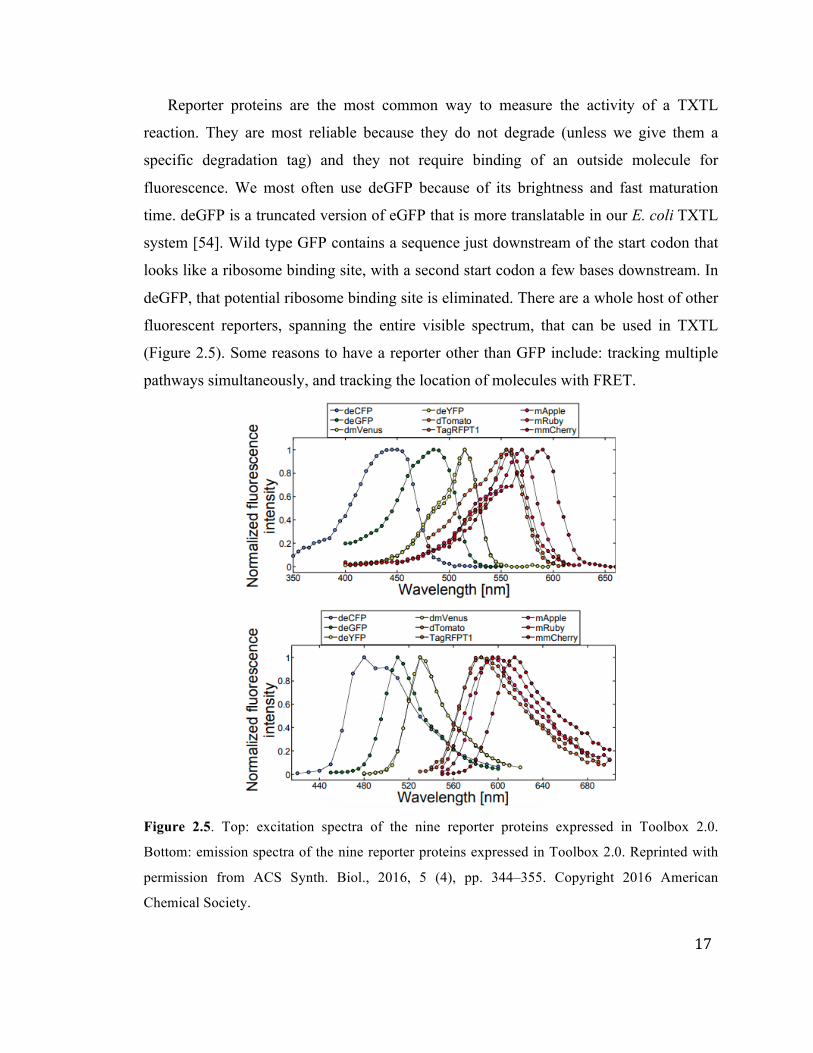
Reporter proteins are the most common way to measure the activity of a TXTL
reaction. They are most reliable because they do not degrade (unless we give them a
specific degradation tag) and they not require binding of an outside molecule for
fluorescence. We most often use deGFP because of its brightness and fast maturation
time. deGFP is a truncated version of eGFP that is more translatable in our E. coli TXTL
system [54]. Wild type GFP contains a sequence just downstream of the start codon that
looks like a ribosome binding site, with a second start codon a few bases downstream. In
deGFP, that potential ribosome binding site is eliminated. There are a whole host of other
fluorescent reporters, spanning the entire visible spectrum, that can be used in TXTL
(Figure 2.5). Some reasons to have a reporter other than GFP include: tracking multiple
pathways simultaneously, and tracking the location of molecules with FRET.
Figure 2.5. Top: excitation spectra of the nine reporter proteins expressed in Toolbox 2.0.
Bottom: emission spectra of the nine reporter proteins expressed in Toolbox 2.0. Reprinted with
permission from ACS Synth. Biol., 2016, 5 (4), pp. 344–355. Copyright 2016 American
Chemical Society.
18
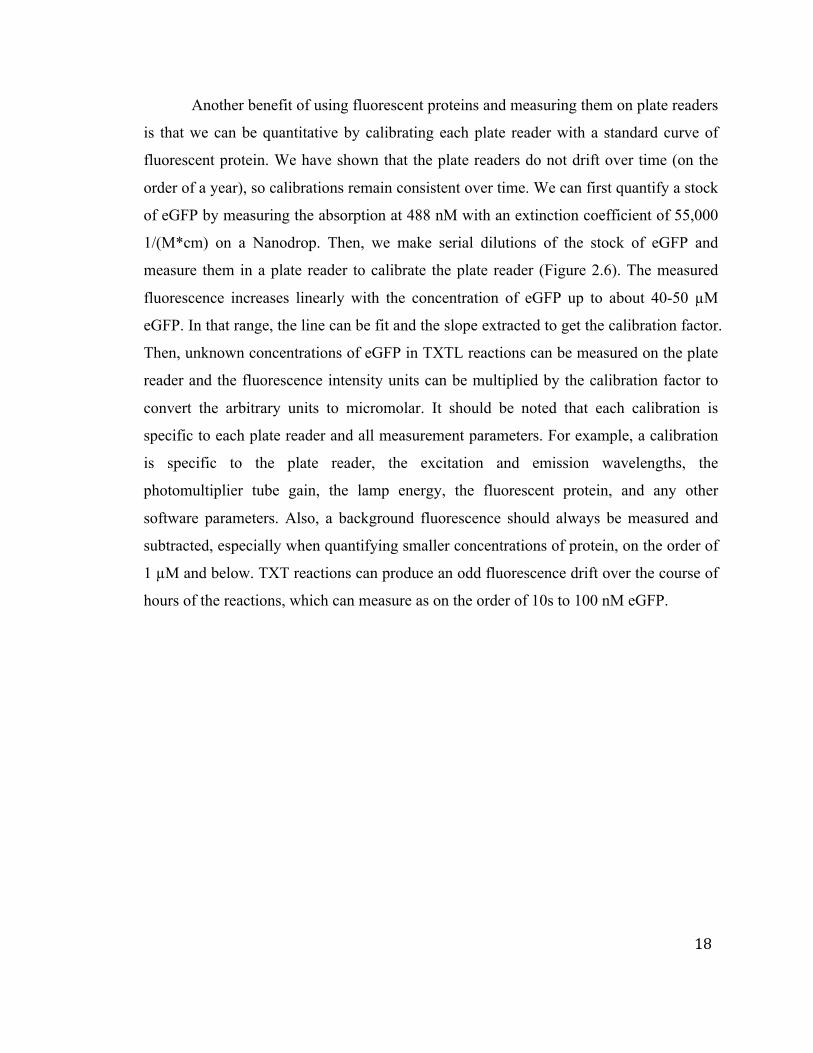
Another benefit of using fluorescent proteins and measuring them on plate readers
is that we can be quantitative by calibrating each plate reader with a standard curve of
fluorescent protein. We have shown that the plate readers do not drift over time (on the
order of a year), so calibrations remain consistent over time. We can first quantify a stock
of eGFP by measuring the absorption at 488 nM with an extinction coefficient of 55,000
1/(M*cm) on a Nanodrop. Then, we make serial dilutions of the stock of eGFP and
measure them in a plate reader to calibrate the plate reader (Figure 2.6). The measured
fluorescence increases linearly with the concentration of eGFP up to about 40-50 µM
eGFP. In that range, the line can be fit and the slope extracted to get the calibration factor.
Then, unknown concentrations of eGFP in TXTL reactions can be measured on the plate
reader and the fluorescence intensity units can be multiplied by the calibration factor to
convert the arbitrary units to micromolar. It should be noted that each calibration is
specific to each plate reader and all measurement parameters. For example, a calibration
is specific to the plate reader, the excitation and emission wavelengths, the
photomultiplier tube gain, the lamp energy, the fluorescent protein, and any other
software parameters. Also, a background fluorescence should always be measured and
subtracted, especially when quantifying smaller concentrations of protein, on the order of
1 µM and below. TXT reactions can produce an odd fluorescence drift over the course of
hours of the reactions, which can measure as on the order of 10s to 100 nM eGFP.
19
Figure 2.6. Fluorescence measurements for calibration of a plate reader with pure eGFP.
Concentration of the His-eGFP protein stock was first re-estimated by absorption at 488 nm with
an extinction coefficient of 55000 M-1cm-1 . The calibration was made in the concentration range
of 0-4 µM by diluting the pure His-eGFP into a cell-free reaction with no DNA. Reprinted with
permission from ACS Synth. Biol., 2016, 5 (4), pp. 344–355. Copyright 2016 American
Chemical Society.
Aside from fluorescent proteins, there is research into fluorescent RNA aptamers.
RNA aptamers are oligonucleotide RNA molecules that bind to target molecules with a
very high affinity and specificity. RNA aptamers are discovered using a technique called
Systematic Evolution of Ligands by Exponential enrichment, or SELEX, and they are
useful in vivo for therapeutics and diagnostics [89]. However, for the purposes of TXTL,
these aptamers are potentially useful because you can track real-time concentrations of
RNA species. Two aptamers used in TXTL are the Broccoli aptamer and the malachite
green aptamer (MGapt). The Broccoli aptamer fluoresces in the green and is relatively
short, at 49 nucleotides in length, and bright compared to other green fluorescent RNA
aptamers, like Spinach [90], [91]. When folded, the Broccoli aptamer contains a binding
pocket for the dye DFHB1-1T. The MGapt fluoresces in the red, and contains a binding
pocket for malachite green dye [92]. In TXTL, the use of RNA aptamers allows for
20
quantifying RNAs over a wide dynamic range, from as low as a few nanomolar to tens of
micromolar [93].
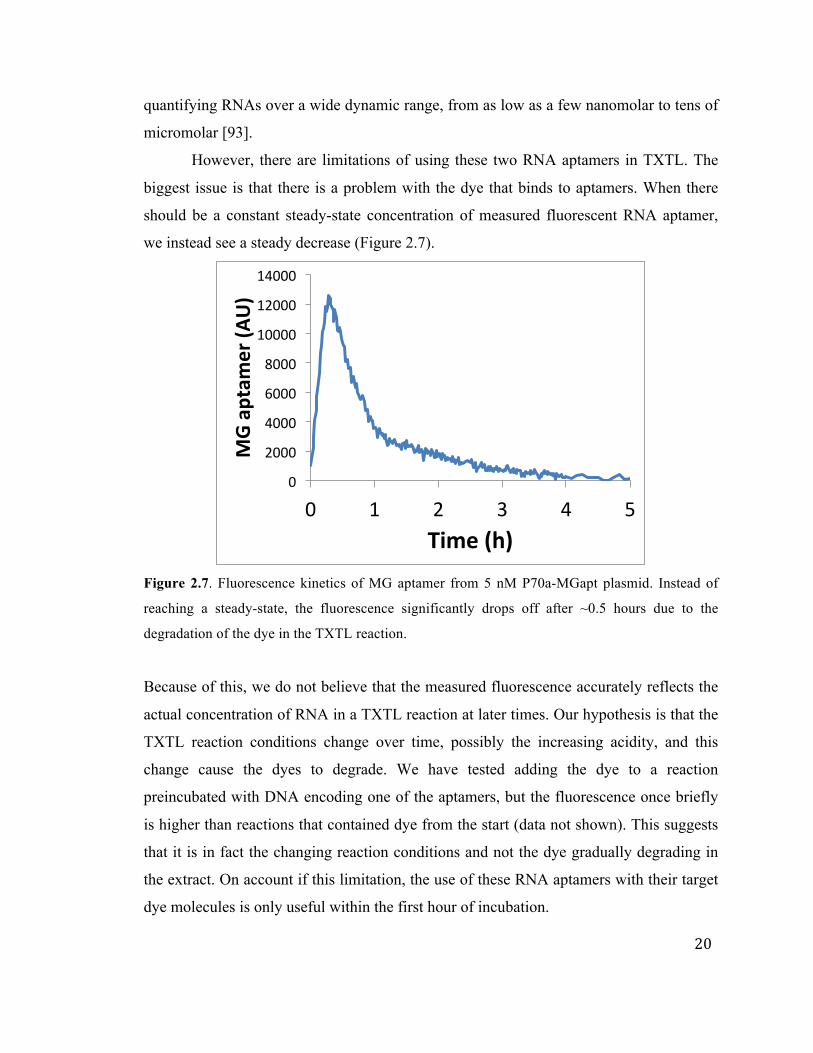
However, there are limitations of using these two RNA aptamers in TXTL. The
biggest issue is that there is a problem with the dye that binds to aptamers. When there
should be a constant steady-state concentration of measured fluorescent RNA aptamer,
we instead see a steady decrease (Figure 2.7).
Figure 2.7. Fluorescence kinetics of MG aptamer from 5 nM P70a-MGapt plasmid. Instead of
reaching a steady-state, the fluorescence significantly drops off after ~0.5 hours due to the
degradation of the dye in the TXTL reaction.
Because of this, we do not believe that the measured fluorescence accurately reflects the
actual concentration of RNA in a TXTL reaction at later times. Our hypothesis is that the
TXTL reaction conditions change over time, possibly the increasing acidity, and this
change cause the dyes to degrade. We have tested adding the dye to a reaction
preincubated with DNA encoding one of the aptamers, but the fluorescence once briefly
is higher than reactions that contained dye from the start (data not shown). This suggests
that it is in fact the changing reaction conditions and not the dye gradually degrading in
the extract. On account if this limitation, the use of these RNA aptamers with their target
dye molecules is only useful within the first hour of incubation.
0"
2000"
4000"
6000"
8000"
10000"
12000"
14000"
0" 1" 2" 3" 4" 5"
MG#ap
tamer#(A
U)#
Time#(h)#
21
2.2.6 Bacteriophage Synthesis
The versatility of the all E. coli TXTL system allows for better understanding of
fundamental processes by recapitulating them by gene expression in vitro. So far, we
have talked about using fluorescent outputs as reporters for gene expression, but we can
also produce more complex systems, like fully functioning bacteriophage in cell-free
reactions [53], [54], [94], [95]. We can add the bacteriophage T7 DNA genome to a
TXTL reaction and produce over 3*10^11 phages/mL of cell-free reaction (Figure 2.8).
The T7 genome is 39937 bp long and contains 57 genes. There are three different E. coli
sigma 70 promoters that are used to synthesize early stage phage proteins, including its
own T7 RNA polymerase. Then, there are 17 T7 promoters in the genome that produce
the rest of the genes. The T7 phage is lytic and therefore we can use the standard phage
plaque assay to quantify the amount of infectious phages in a TXTL reaction.
A B
Figure 2.8. T7 phage synthesis in TXTL reactions. A) Kinetics of phage T7 synthesis with and
without dNTPs added to the reaction. In both cases, phage synthesis plateaus after 6 h. B) Effect
of molecular crowding on the synthesis of T7 and the expression from one of its regulatory parts.
Reprinted with permission from ACS Synth. Biol., 2016, 5 (4), pp. 344–355. Copyright 2016
American Chemical Society.
22
We also prove that DNA replication is possible in TXTL; we produce more phages in a
reaction than DNA genomes added to the reaction. The T7 phage has its own DNA
replication protein. Each phage packages one DNA genome inside of the capsid.
Therefore, the DNA genome must be replicated in order to be packaged into the
additional phages. Figure 2.8A shows the effect of adding extra dNTPs to a TXTL
reaction. For the first hour, we do not produce any functional phages. At the three hour
point, the TXTL reactions with added dNTPs produce about five orders or magnitude
more phages than the reactions without added dNTPs. After eight hours, when we have
reached a plateau, reactions with added dNTPs produced about 100 times more phages
than reaction without added dNTPs. Aside from showing that we can produce over 10^11
phages/mL, we have shown that DNA replication is possible in TXTL reactions.
Molecular crowding can change many reaction rates in TXTL reactions. We used
PEG8000 as a molecular crowder to test its effect on the production of phages in TXTL
reactions (Figure 2.8B). Interestingly, the optimum PEG concentration for producing
deGFP from P70a-deGFP plasmid is different from the optimum PEG concentration for
producing infections T7 phages. There are a couple of different hypotheses to attempt to
explain this difference. First, the PEG concentration could affect the self assembly of the
phage proteins. Molecular crowding can accelerate self assembly of macro-molecular
complexes [96]–[98]. Higher concentrations of PEG could help accelerate the phage
proteins to find and assemble with each other. The second possibility is the PEG
concentration could affect the gene expression differently. There are many different
promoters and ribosome binding sites encoded in the T7 phage genome. For very strong
promoter UTR, like P70a and UTR1, then 1.5-2% PEG is the optimum for expression.
However, for weaker ribosome binding sites, higher concentrations of PEG increase the
total protein synthesized in a TXTL reaction (data not shown). The PEG concentration
and molecular crowding could be affecting either or both phage self assembly and gene
expression.
23
Chapter 3
Expression and Modeling of a Single Gene
3.1 Development of the Model
Cell-free TXTL systems are being used more and more for developing, engineering, and
interrogating biochemical systems [99]. With the increasing use of these versatile systems,
there is still a lack of simple coarse grained models that described the systems using a
single set of differential equations, including capturing the basic mechanisms, expression
regimes, and limitations of the systems. Phenomenological observations have been
reported, like the saturation of TXTL components [53], [54], [100], but the model
description is still unsatisfactory; there is a lack of an elementary biophysical model that
quantitatively describes the concentrations of key elements, including the DNA, mRNA,
protein, RNA polymerase, and ribosome concentrations. Also, in most published models,
the biochemical constants are fit or estimated, and rarely measured or based on data. The
absence of these measured constants and deterministic model hinder the progress of
quantitative developments with TXTL, including and especially gene circuit engineering.
While TXTL systems are becoming more and more robust, in vitro gene circuits can be
made more and more complex. Therefore, it is crucial to be able to characterize the basic
principles of the TXTL systems, such as the strengths of regulatory elements,
concentrations of transcription and translation machineries, and biochemical constants, so
that we can better guide the construction and prototyping of these complex circuits. A
satisfactory model would provide the necessary quantitative information to take
advantage of the TXTL systems and execute DNA programs and circuits in optimum
conditions.
There have been several non-stochastic, quantitative course-grained models of the
T7 hybrid TXTL system reported to date [101]–[104]. The commercial PURE system,
which is composed individually purified components, has been described by a more
sophisticated model using hundreds of biochemical reactions [78], [103]. For cell extract-
based systems, there have been models that describe metabolic networks for energy
24
regeneration and amino acid biosynthesis [105], although they still describe a T7 hybrid
system, which uses the T7 RNA polymerase and promoter for transcription instead of the
E. coli core RNA polymerase, to go with the translation machinery from E. coli. Using an
all E. coli system dramatically increases the amount of transcription elements, which
allows for prototyping DNA programs with various regulatory elements with different
strengths [53], [54], [106]. A quantitative description of this TXTL system has not been
sufficiently completed and is still needed. The first step is to describe the simplest level
of such a system, which is the expression of a single gene from a synthetic DNA
construct.
We developed a simple, non-stochastic, model composed of ordinary differential
equations to describe our all E. coli TXTL system. The course-grained dynamics have
been previously described [107], and here we expand on that, specifically to describe the
linear and saturation regimes of protein synthesis due to a limiting amount of
transcription and translation machineries. The model can be used to describe TXTL
reactions on the order of a few microliters, which is typical and optimal for most batch
mode TXTL reactions and applications. In development of the model, we used a set of
three different sigma 70 promoters and three different ribosome binding sites, all of
different strengths, spanning multiple orders of magnitude. We characterize the TXTL
reactions by their rate of deGFP protein synthesis in the steady state, with respect to the
DNA plasmid concentration. We experimentally determine several of the biochemical
constants, including the mRNA degradation rate, the deGFP maturation rate, the speed of
transcription and translation. We use the model to determine the sensitivity to many of
the biochemical constants experimentally determined, or fit using simulations. The model
is relatively simple and can be used to help determine and tune strengths and
concentrations of regulatory parts for constructing gene circuits.
The model presented here uses the all E. coli TXTL system, booting up
transcription for the primary sigma factor 70. The gene modeled is degfp, which is
translated by the E. coli ribosomes. The main promoter used is P70a, which is a strong
promoter from the lambda phage, which only differs by one nucleotide from the
consensus -35 and -10 in E. coli. Other promoters tested with the model, P70b and P70c,
25
have mutations in one or both of the -35 and -10 regions. The typical untranslated region
used, UTR1, is taken from downstream of the 14th promoter from the T7 phage [108].
UTR1 is the strongest UTR so far reported for E. coli. Other UTRS tested with the model
have mutations in the ribosome binding site. Translation is performed by the E. coli
ribosomes. The transcription terminator used is the synthetic terminator T500, which is
cloned downstream of the degfp gene. P70a-deGFP is the reference plasmid, due to it
having a very strong promoter and RBS, which minimizes the concentration of DNA
necessary to produce protein, but the model can be generalized and tweaked to model
different promoters, UTRs, and genes.
The fluorescence kinetics of deGFP synthesis from the plasmid P70a-deGFP in a
TXTL reaction can be described as having three different phases of expression (Figure
3.1a). The first phase, which usually takes the first 30 to 60 minutes, is a transient phase
when expression first is booting up and reaching a steady state. The second phase is the
steady state, where the concentration of mRNA is constant, which means that the
degradation rate of mRNA matches the synthesis rate. This phase usually occurs between
1-6 hours of the TXTL reaction. During this phase, while the absolute concentration of
deGFP protein is increasing, the rate of expression remains constant. The third phase,
which typically happens after 6-7 hours of expression, is the phase where the expression
reaches a plateau and the reaction rates steadily decline to zero. This phase is very
complex to interpret and model, due to there being a depletion of biochemicals, like
amino acids, ribonucleosides, and due to the change of the reaction conditions, like pH
[81]. The degradation products also accumulate, and therefore the energy charge of the
reaction changes with it [109]. Our model only focuses on the first two phases, and does
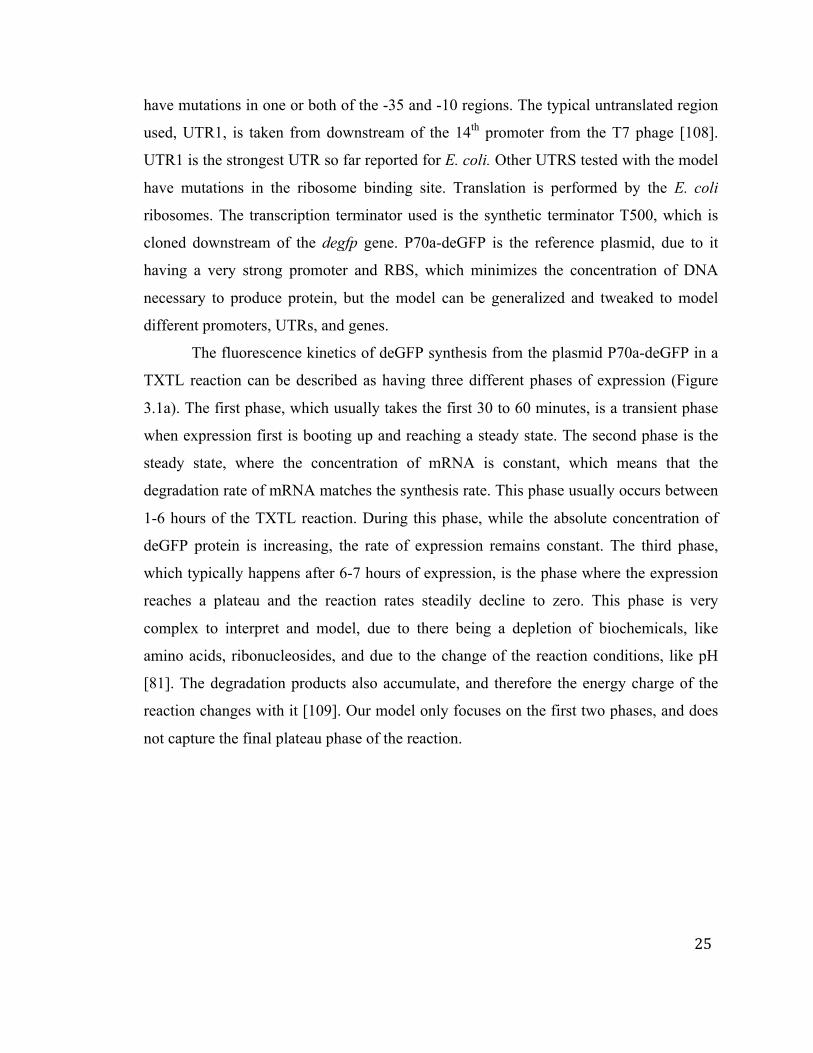
not capture the final plateau phase of the reaction.
26
Figure 3.1. Cell-free expression of the reporter protein deGFP in the all-E. coli TXTL system
using the plasmid P70a-deGFP. (a) Kinetics of deGFP synthesis at 5 nM plasmid. There three
expression phases: I) build up phase, II) linear phase, III) plateau phase (b) Maximum rate of
deGFP synthesis as a function of the plasmid concentration. Two regimes are observed: linear (L)
at low plasmid concentration, saturated (S) at high plasmid concentration. (c) Schematic of the
model showing most of the components included in the model.
For the most part, we will focus on the rates of deGFP synthesis, and when we
vary the concentration of the P70a-deGFP plasmid, the maximum rate of deGFP
synthesis in the steady state is linearly proportional to the plasmid concentration up to 5
nM plasmid (Figure 3.1b). Above 5 nM, there is a saturation of the deGFP synthesis rate,
which we hypothesize is due mostly to the depleted concentration of free ribosomes. The
transition to this saturated regime from the linear regime happens very quickly, and is
27
also seen when we look at the total protein yield of the TXTL reactions (Figure 3.2). This
is the main aspect of the system that we wish to model.
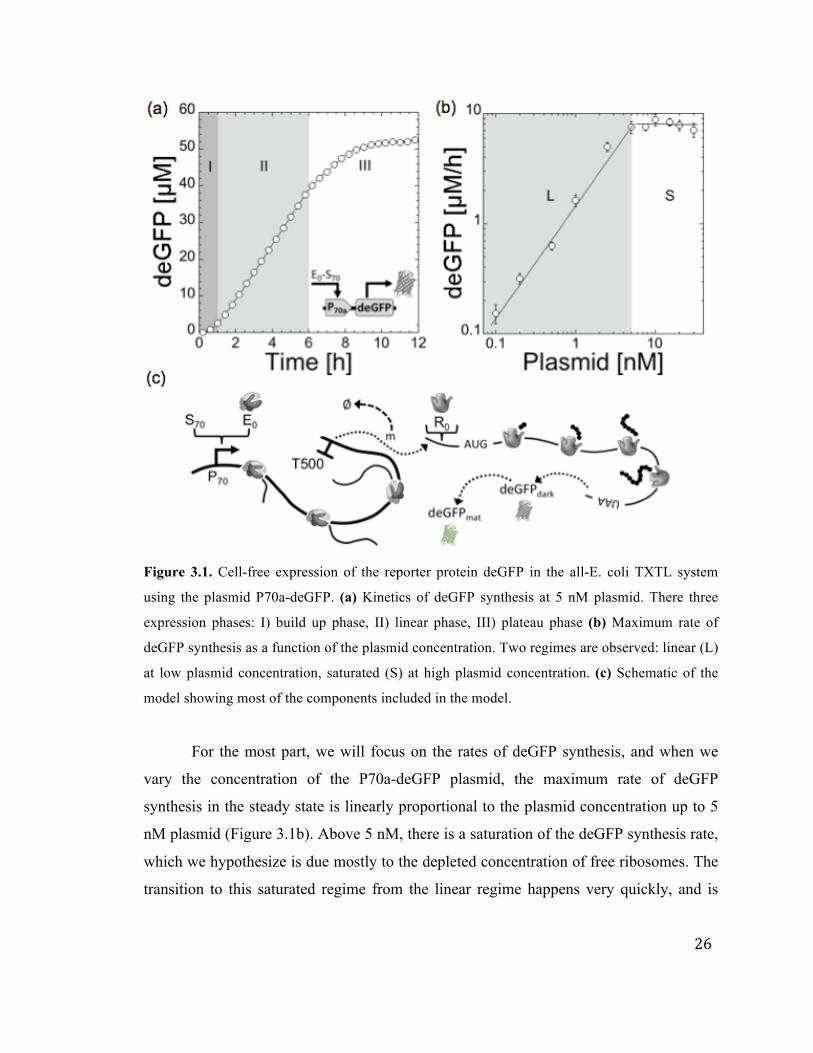
Figure 3.2. deGFP synthesis yield after 10 h of incubation as a function of the plasmid
concentration.
The model contains just three ordinary differential equations, one each for the rate
of change of mRNA, dark (non-fluorescent) deGFP protein, and mature (fluorescent)
deGFP protein, as well as two conservation equations, one each for RNA polymerase and
ribosomes. The total concentration of RNA polymerase and ribosomes always remains
constant, while the concentration of free RNA polymerase and ribosomes can change. A
schematic of TXTL of a reporter gene under the P70a promoter shows many of the
biochemicals that are included in the model (Figure 3.1c). Because this is still a course-
grained model, there are many assumptions being made:
• There is an infinite supply of nutrients necessary for expression during the steady
state phase of gene expression (tRNAs, amino acids, ribonucleosides)
• We use quasi-steady state approximation for Michaelis-Menten terms. This means
that the concentrations of the intermediate complex, for example the bound RNA
polymerase or ribosomes, is not changing on the time scale of mRNA or protein
synthesis, respectively. KM,70, KM,m, and KM,R are the Michaelis-Menten constants
28
for transcription, mRNA degradation and translation respectively.
• The concentration of RNA polymerase-sigma 70 is larger than the DNA promoter
concentration (total DNA template concentration). This makes the promoter act as
the enzyme and the RNA polymerase-sigma 70 holoenzyme act as the substrate in
the Michaelis-Menten reaction kinetics.
• Sigma 70 is not limiting for transcription (see Figure 3.16).
• The concentration of ribonucleases is smaller than the concentration of
synthesized mRNA. This makes the ribonucleases act as the enzyme and the
mRNA act as the substrate in the Michaelis-Menten reaction kinetics.
• The concentration of free ribosomes is larger than the concentration of
synthesized mRNA. This makes the ribosomes act as the substrate and the mRNA
act as the enzyme in the Michaelis-Menten reaction kinetics. This assumption is
good for most reactions; however, when the concentration of mRNA is
maximized, the assumption qualitatively can reach its limits.
• Translation initiation factors are not limiting. We do not include other translation
initiation factors in the model.
• The maturation of the dark deGFP to the mature deGFP is a first order kinetics,
where the rate of change is proportional to the concentration. This fits very well to
the presented data (see Figure 3.12).
• Transcription and translation machineries (like RNA polymerase and ribosomes)
are not degraded (until at least after the linear expression phase). This hypothesis
is supported by data from the TXTL system being used in a semi-continuous
mode, where gene expression is extended to 12-24 hours [53], [54]. A recent
publication by Stogbauer and coworkers [102] presents a model that shows
saturation of the protein synthesis rate due to degradation of transcription and
translation machineries. We, however, present an alternative view.
With the above assumptions, we present the model that describes deGFP synthesis from a
constitutive promoter in our TXTL system:
29
(1) ! !!"
= 𝑘!"#,! 𝑃!"!!"
!!,!"! !!"− 𝑘 𝑅!"#$
!!!,!! !
(2) ! !"#$%!"#$!"
= 𝑘!"#,! 𝑚!!
!!,!! !!− 𝑘!"# 𝑑𝑒𝐺𝐹𝑃!"#$
(3) ! !"#$%!"#!"
= 𝑘!"# 𝑑𝑒𝐺𝐹𝑃!"#$
where
Constant Description
𝑚 deGFP mRNA (nM)
𝑘!"#,! transcription rate constant (1/s)
𝑃!" promoter specific to sigma 70 (nM)
𝐸!" RNA polymerase – sigma 70 holoenzyme (nM)
𝐾!,!" Michaelis-Menten constant for transcription (nM)
𝑘 𝑅!"#$ mRNA degradation rate due to, dependent on 𝑅!"#$ concentration (1/s)
𝐾!,! Michaelis-Menten constant for mRNA degradation (nM)
𝑑𝑒𝐺𝐹𝑃!"#$ dark deGFP protein, non-mature, non-fluorescent (nM)
𝑘!"#,! translation rate constant (1/s)
𝑅! Free ribosomes (nM)
𝐾!,! Michaelis-Menten constant for translation (nM)
𝑘!"# deGFP protein maturation constant (1/s)
𝑑𝑒𝐺𝐹𝑃!"# mature deGFP protein, fluorescent
Table 3.1. Description of constants used in the model
Because the concentration of Rnase in the TXTL is constant, the factor 𝑘 𝑅!"#$ = 𝑘!,!
such that:
(4) 𝑘 𝑅!"#$!
!!,!! != 𝑘!,!
!!!,!! !
≈ 𝑘!"#,! 𝑚
30
Previously (6,21), we have shown that mRNA degradation in TXTL behaves as a first
order kinetic, where the rate of degradation is proportional to the concentration of mRNA.
This assumption gives 𝐾!,! ≫ 𝑚 , such that we are left with the first order kinetics,
where 𝑘!"#,! = 𝑘!,! 𝐾!,!. For modeling purposes, specifically using Matlab, to avoid
negative concentrations of mRNA, we keep the Michaelis-Menten kinetics instead of the
approximated first order kinetics, and just note that they should behave the same. The
constants 𝑘!,! (6.6 nM/s) and 𝐾!,! (8000 nM) were chosen to satisfy the assumption
and agree with an mRNA degradation assay described later. The assumption is
reasonable because the concentration of mRNA when ribosomes begin to become
limiting is on the order of 100 nM (Figure 3.3). With this in mind, equation 1 now
becomes:
(5) ! !!"
= 𝑘!"#,! 𝑃!"!!"
!!,!"! !!"− 𝑘!,!
!!!,!! !
A B
Figure 3.3. Fluorescence kinetics of deGFP mRNA with MG aptamer appended on the 3’ end
(measuring the MG aptamer). A) schematic of the construction. B) fluorescence signal of the
MGapt for plasmid concentrations ranging from 0.5 nM to 10 nM.
With our set of three ordinary differential equations established, we need to introduce
31
conservation equations for the core RNA polymerase and ribosomes. We will derive
those equations and start with transcription. First, the total concentration of sigma factor
70 (𝑆70!"!) in a TXTL reaction is constant, and sigma 70 can either be free (𝑆70!"##) or
complexed with the core RNA polymerase (𝐸!"):
(6) 𝑆70!"! = 𝑆70!"## + 𝐸!"
We then take an equilibrium approximation for the reaction of sigma 70 forming a
complex with the free core RNA polymerase (𝐸!). This means that the rate of this
reaction is very fast compared to the other reactions in the system:
(7) 𝑆70!"## + 𝐸! !!"𝐸!"
where 𝑘!" = 𝑘! 𝑘!. We assume the reaction is at chemical equilibrium. Then, we get:
(8) 𝐸!" = !! !!"!"##!!"
= !! !!"!"!!!"! !!
With an expression relating the RNA polymerase-sigma 70 holoenzyme to the
concentrations of free ribosomes and total sigma 70, we can now build the conservation
equation of RNA polymerase. The total concentration of RNA polymerase (𝐸!"!) is the
sum of the concentrations of RNA polymerase that are free, forming a holoenzyme with
sigma 70, and bound to the mRNA performing transcription (𝐸!).
(9) 𝐸!"! = 𝐸! + 𝐸!" + 𝐸!
We can describe then concentration of RNA polymerase bound to the mRNA using
Michaelis-Menten kinetics. Also, there are two possibilities for these RNA polymerase:
either they are bound to the promoter initiating transcription, or they are transcribing
along the gene synthesizing mRNA [110]. This gives us the following equation:
(10) 𝐸! = !!" !!"!!,!"! !!"
1 + 𝑘!"#,!!!!!
= !! !!"!"! !!"!!,!" !!"! !! ! !! !!"!"!
1 + 𝑘!"#,!!!!!
where 𝐾!,!" is the Michaelis-Menten constant for RNA polymerase-sigma 70
holoenzyme binding to the sigma 70 promoter site (nM), 𝐿! is the length of transcript
(nt), and 𝐶! is the speed of transcription of the RNA polymerase along the DNA (nt/s). If
we use this extended equation 10 and plug it into equation 9, our conservation equation
for the RNA polymerase becomes:
32
(11) 𝐸!"! = 𝐸! + !! !!"!"!!!"! !!
+ !! !!"!"! !!"!!,!" !!"! !! ! !! !!"!"!
1+ 𝑘!"#,!!!!!
In our final set of differential equations, we will make substitutions such that they
explicitly depend on the concentration of free RNA polymerase (and not explicitly any
other for of the polymerase), so this equation 11 will need to be solved for the
concentration of free RNA polymerase at each concentration of DNA promoter. Note
how this equation does not depend on time, only constants, so for any TXTL reaction, the
concentration of free RNA polymerase can be approximated at as a constant.
We proceed in a similar manner to build the conservation equation for the
concentration of ribosomes. We are assuming that translation initiation and termination
factors are not liming so we do not need to include those in the model. Therefore, we can
jump straight to the conservation equation instead of first dealing with other reactions
like for sigma 70 forming a holoenzyme with RNA polymerase. The total concentration
of ribosomes (𝑅!"!) is equal to the concentration of free ribosomes plus the concentration
of ribosomes bound to the mRNA (𝑅!):
(12) 𝑅!"! = 𝑅! + 𝑅!
Like the RNA polymerase bound to the DNA, there are two possible forms for the
ribosomes bound to the mRNA: either bound at the ribosome binding site engaging in
translation initiation, or engaging in translation elongation along the coding sequence. In
equation form, we get:
(13) 𝑅! = !! !!!,!! !!
1+ 𝑘!"#,!!!!!
where 𝐾!,! is the Michaelis-Menten constant (nM) for ribosomes binding to the
ribosome binding site on the mRNA, and 𝐶! is the translation speed of the ribosomes on
the mRNA (nt/s). We approximate the length of the gene, 𝐿!, to be the same as the
transcript, even though the untranslated region is not included here. Combining equations
12 and 13 yields the ribosome conservation equation:
(14) 𝑅!"! = 𝑅! + !! !!!,!! !!
1+ 𝑘!"#,!!!!!
Like for RNA polymerase, this equation will be solved for the free ribosomes, which is
then plugged into the set of differential equations. However, unlike the conservation
equation for the RNA polymerase, the free ribosome concentration depends on time
33
because it explicitly depends on the mRNA concentration, which is changing as mRNA is
being synthesized and degraded. Therefore, this equation must be solved at every time
point, for every concentration of DNA promoter.
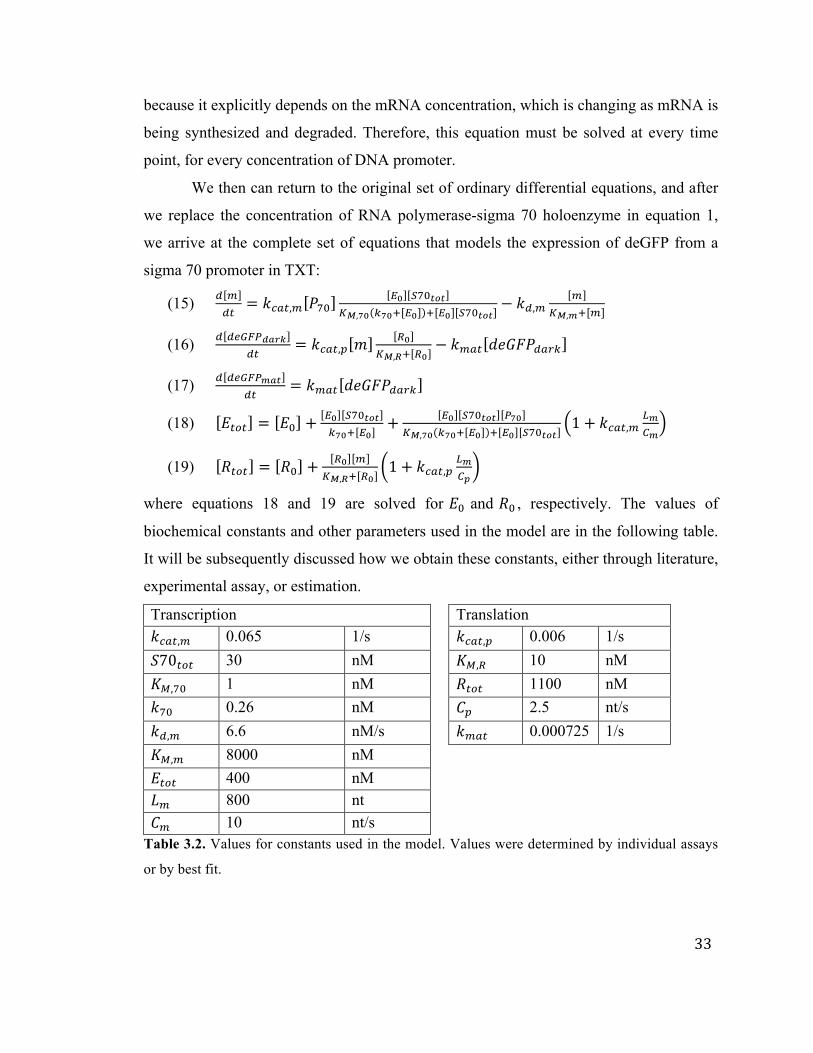
We then can return to the original set of ordinary differential equations, and after
we replace the concentration of RNA polymerase-sigma 70 holoenzyme in equation 1,
we arrive at the complete set of equations that models the expression of deGFP from a
sigma 70 promoter in TXT:
(15) ! !!"
= 𝑘!"#,! 𝑃!"!! !!"!"!
!!,!" !!"! !! ! !! !!"!"!− 𝑘!,!
!!!,!! !
(16) ! !"#$%!"#$!"
= 𝑘!"#,! 𝑚!!
!!,!! !!− 𝑘!"# 𝑑𝑒𝐺𝐹𝑃!"#$
(17) ! !"#$%!"#!"
= 𝑘!"# 𝑑𝑒𝐺𝐹𝑃!"#$
(18) 𝐸!"! = 𝐸! + !! !!"!"!!!"! !!
+ !! !!"!"! !!"!!,!" !!"! !! ! !! !!"!"!
1+ 𝑘!"#,!!!!!
(19) 𝑅!"! = 𝑅! + !! !!!,!! !!
1+ 𝑘!"#,!!!!!
where equations 18 and 19 are solved for 𝐸! and 𝑅! , respectively. The values of
biochemical constants and other parameters used in the model are in the following table.
It will be subsequently discussed how we obtain these constants, either through literature,
experimental assay, or estimation.
Transcription Translation 𝑘!"#,! 0.065 1/s 𝑘!"#,! 0.006 1/s 𝑆70!"! 30 nM 𝐾!,! 10 nM 𝐾!,!" 1 nM 𝑅!"! 1100 nM 𝑘!" 0.26 nM 𝐶! 2.5 nt/s 𝑘!,! 6.6 nM/s 𝑘!"# 0.000725 1/s 𝐾!,! 8000 nM 𝐸!"! 400 nM 𝐿! 800 nt 𝐶! 10 nt/s
Table 3.2. Values for constants used in the model. Values were determined by individual assays
or by best fit.
34
Note that we do not include protein degradation here. In TXTL proteins must be
degradation-tagged to be recognized by the degradation machineries. Protein degradation
in TXTL has been shown to follow zeroth order kinetics, which means that the rate of
degradation is constant and independent of the concentration of protein [53]. This would
only shift the absolute concentration of protein, and would not give us a steady-state
constant protein concentration. Also, the concentration of the protein degradation
complex ClpXP does not seem to remain constant in the reactions, and is likely unstable
[111]. This would complicate the model. Protein degradation is explored further in
section 3.5.
As a way to further simplify the model, transcription can be approximated such
that the rate of mRNA synthesis is constant. This assumption is good when the
concentration of sigma 70 is much greater than the Michaelis-Menten constant for
transcription, 𝐾!,!". Then, 𝐸!" ≫ 𝐾!,!". If we combine that with the assumption of the
first order mRNA degradation, we get the following equation for mRNA:
(20) ! !!"
= 𝑘!" 𝑃!" − 𝑘!"#,! 𝑚
where 𝑘!" ≈ 𝑘!"#,!. Here, the mRNA synthesis rate only depends on one constant, the
initiation frequency 𝑘!", instead of depending on 𝑘!"#,!, 𝐾!,!", and 𝐸!". This has been
modeled previously, and the constant 𝑘!" can vary over three orders of magnitude [112],
with a maximum as high as 0.5 initiations per second [113], [114]. We can use this to put
an upper bound on 𝑘!"#,! of 0.5 /s. In our system, the RNA polymerase concentration is
much greater than the concentration of sigma 70, and therefore 𝐸!" ≈ 𝑆70!"! . For E.
coli promoters, the rate constant 𝑘!"#,! has been estimated between 0.001 and 0.1 s-1
[112]. For our strongest promoter, P70a, we found that a value of 𝑘!"#,! = 0.065 s-1 best
fit the expression, which is on the higher end of the middle of our estimated range. The
Michaelis-Menten constant 𝐾!,!" is typically in the range 1-100 nM [112], [115].
Previously, in an earlier version of the TXTL system [54], we had estimated the 𝐾!,!"
constant to be around 10 nM [107] for P70a. However, in the current version of TXTL,
we estimate 𝐾!,!" to be around 1 nM.
To estimate the concentration of total RNA polymerase, 𝐸!"!, we use the dilution
35
factor of the TXTL. E. coli cells contain between 1500-11,400 RNA polymerase per cell,
depending on the growth conditions and general health of the cells [113]. Our TXTL is
prepared from cells in a very rich medium (2XYT) and collected in the exponential
growth phase; therefore, we expect the number of RNA polymerase in the cells to be on
the high end of the range stated above. The TXTL cell extract is diluted about 7-10 times
during preparation as compared to the cells. We achieve around 30 mg/ml protein,
whereas E. coli cytoplasm contains 200-320 mg/ml protein [116]. This gives us an upper
bound of about 1.5 µM for the maximum concentration of core RNA polymerase in our
TXTL lysate. The cell extract undergoes a further dilution by a factor of three when
assembling the TXTL reaction, which gives the maximum concentration of RNA
polymerase in a TXTL reaction to be 500 nM. The minimum concentration of free core
RNA polymerase in TXTL is found by only considering the polymerase not bound to
DNA [53], [117]. We estimate the total concentration of RNA polymerase to be
𝐸!"! = 400 nM.
In a similar fashion, we can estimate the total concentration of sigma 70, 𝑆70!"!.
For healthy cells in good growth conditions, the concentration of sigma 70 in the cells is
about 500-700 nM, which is about 500-700 molecules per cell [118], [119]. Taking into
account our dilution factor of about 20-30x from E. coli cells to TXTL reaction, that
gives us a concentration range of about 20-35 nM. Based on our data, we estimate the
concentration of sigma 70 to be about 𝑆70!"! = 30 nM. The dissociation constant for
sigma 70 and core RNA polymerase in E. coli has been previously determined to be
𝑘!" = 0.26 nM [119]. The deGFP mRNA degradation rate was experimentally
determined to be !!!"#,!
= 0.000825 s (20.2 minute mean lifetime. We recall that
𝑘!"#,! = 𝑘!,! 𝐾!,!, where 𝑘!,! = 6.6 nM/s and 𝐾!,! = 8000 nM. The deGFP mRNA
degradation will be examined further in a later section. The concentration of DNA
promoter, 𝑃!", is fixed experimentally. The speed of the core RNA polymerase on the
DNA, 𝐶!, is determined experimentally to be 𝐶! = 10 nt/s. This is about 4-8 times
slower than the speed in vivo [113].
The simplification of transcription to a constant synthesis rate and mRNA
degradation to a first order kinetic allows us to see that there will be a steady-state for
36
mRNA concentration. This assumption is especially good for low plasmid concentration,
where 𝐸!" ≫ 𝐾!,!". Then, 𝑑 𝑚 𝑑𝑡 0 and we get (using equation 20)
(21) 𝑚 !! =!!" !!"!!"#,!
≈ !!"#,! !!"!!"#,!
where 𝑚 !! is the concentration of mRNA at steady-state. We measure this steady-state
mRNA concentration using the malachite green aptamer (MGapt) as an RNA probe
(Figure 3.3), fixing it to the 3’ end of the deGFP. The steady-state measured
concentration was 𝑚 !! = 25 nM at 1 nM plasmid concentration. From this, we get a
lower bound on the value of 𝑘!" ≈ 𝑘!"#,! = 0.015 s-1. This is only a lower bound
because we do not necessarily measure all of the RNA aptamers that are synthesized;
some may not be fluorescent for one reason or another. As described earlier, we found
𝑘!"#,! = 0.065 s-1 to be the best fit when we apply it to deGFP protein synthesis.
Similar to our approximation of mRNA synthesis being a constant rate, we can
approximate translation, or protein synthesis, as being linearly proportional to the
concentration of mRNA. It is only non-constant because the concentration of mRNA is
changing in time, whereas the concentration of DNA is not. However, the idea is the
same: we have some template information, either DNA or mRNA, and the transcription
or translation machinery synthesizes the product at some rate proportional to the
concentration of the template. The equation for translation (equation 16) can then be
written as:
(22) ! !"#$%!"#$!"
= 𝑘!" 𝑚 − 𝑘!"# 𝑑𝑒𝐺𝐹𝑃!"#$
where 𝑘!" is the translation initiation frequency, and depends on the three constants
𝑘!"#,! , 𝐾!,! , and 𝑅! . This is a good approximation when the concentration of free
ribosomes is much greater than the Michaelis-Menten constant, 𝐾!,!, which is on the
order of 10 nM. Therefore, this approximation is good only when we have a relatively
small concentration of mRNA, or in turn, a low plasmid concentration when we are using
a strong promoter like P70a. In that limit, 𝑘!" ≈ 𝑘!"#,! . The translation initiation
frequency, 𝑘!" , has an upper limit of 0.5 per second [120]. The Michaelis-Menten
constant for translation, 𝐾!,!, has been previously measured in vitro and estimated to be
about 23 nM without tRNA, and about 10 nM with tRNA [121], so we use the value
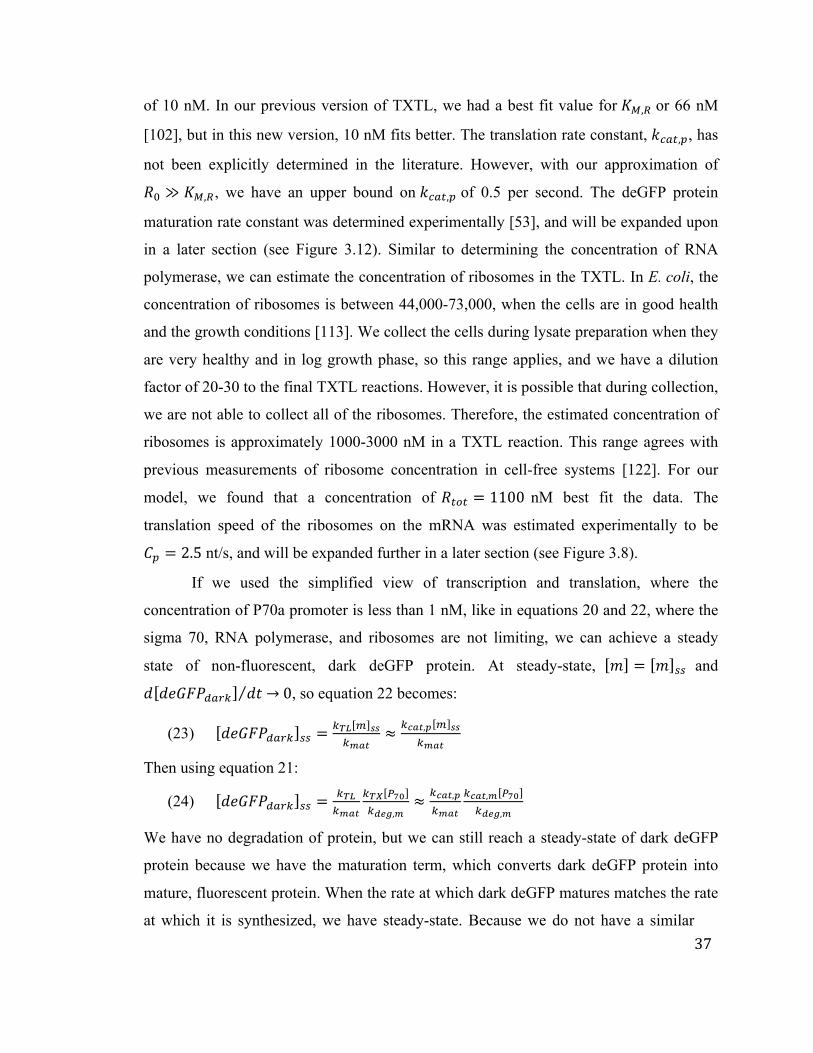
37
of 10 nM. In our previous version of TXTL, we had a best fit value for 𝐾!,! or 66 nM
[102], but in this new version, 10 nM fits better. The translation rate constant, 𝑘!"#,!, has
not been explicitly determined in the literature. However, with our approximation of
𝑅! ≫ 𝐾!,!, we have an upper bound on 𝑘!"#,! of 0.5 per second. The deGFP protein
maturation rate constant was determined experimentally [53], and will be expanded upon
in a later section (see Figure 3.12). Similar to determining the concentration of RNA
polymerase, we can estimate the concentration of ribosomes in the TXTL. In E. coli, the
concentration of ribosomes is between 44,000-73,000, when the cells are in good health
and the growth conditions [113]. We collect the cells during lysate preparation when they
are very healthy and in log growth phase, so this range applies, and we have a dilution
factor of 20-30 to the final TXTL reactions. However, it is possible that during collection,
we are not able to collect all of the ribosomes. Therefore, the estimated concentration of
ribosomes is approximately 1000-3000 nM in a TXTL reaction. This range agrees with
previous measurements of ribosome concentration in cell-free systems [122]. For our
model, we found that a concentration of 𝑅!"! = 1100 nM best fit the data. The
translation speed of the ribosomes on the mRNA was estimated experimentally to be
𝐶! = 2.5 nt/s, and will be expanded further in a later section (see Figure 3.8).
If we used the simplified view of transcription and translation, where the
concentration of P70a promoter is less than 1 nM, like in equations 20 and 22, where the
sigma 70, RNA polymerase, and ribosomes are not limiting, we can achieve a steady
state of non-fluorescent, dark deGFP protein. At steady-state, 𝑚 = 𝑚 !! and
𝑑 𝑑𝑒𝐺𝐹𝑃!"#$ 𝑑𝑡 0, so equation 22 becomes:
(23) 𝑑𝑒𝐺𝐹𝑃!"#$ !! =!!" ! !!!!"#
≈ !!"#,! ! !!
!!"#
Then using equation 21:
(24) 𝑑𝑒𝐺𝐹𝑃!"#$ !! =!!"!!"#
!!" !!"!!"#,!
≈ !!"#,!!!"#
!!"#,! !!"!!"#,!
We have no degradation of protein, but we can still reach a steady-state of dark deGFP
protein because we have the maturation term, which converts dark deGFP protein into
mature, fluorescent protein. When the rate at which dark deGFP matures matches the rate
at which it is synthesized, we have steady-state. Because we do not have a similar
38
maturation term for the fluorescent deGFP, in other words, there is no degradation or loss
of mature deGFP, we cannot achieve a steady-state. However, we can achieve a constant
rate of production. If we use the steady-state conditions for dark deGFP, and put it into
equation 17, we get:
(25) ! !"#$%!"#!"
= 𝑘!"# 𝑑𝑒𝐺𝐹𝑃!"#$ !! = 𝑘!"!!" !!"!!"#,!
≈ 𝑘!"#,!!!"#,! !!"!!"#,!
Because this is a constant rate, we can easily solve the differential equation, and
concentration of mature, fluorescent deGFP as a function of time becomes:
(26) 𝑑𝑒𝐺𝐹𝑃!"# 𝑡 = !!"#,! !!"#,! !!"!!"#,!
∗ 𝑡
The rate of fluorescent deGFP at low plasmid concentration depends only on three
biochemical rate constants and the concentration of DNA experimentally fixed in the
TXTL reaction. At 1 nM plasmid P70a-deGP, we see a maximum deGFP synthesis rate
of about 0.5 nM/s, which, when we take 𝑘!"#,! = 0.000825 per second, we get the
product 𝑘!"#,! 𝑘!"#,! = 0.0004 per second squared. If we take 𝑘!"#,! = 0.065 per
second, that leaves us with 𝑘!"#,! = 0.006 per second.
With the model and constants now established, we can look at how the model
compares to the measured fluorescence synthesis rates deGFP from the P70a-deGFP.
Figure 3.4A shows the maximum rate of deGFP synthesis in TXTL reactions and the
with the model. The model is able to capture the linear regime (up to 5 nM plasmid) and
the saturation regime (above 5 nM). We can also look at the fluorescence kinetics of
expression at various plasmid concentrations (Figure 3.4B,C,D), including one below,
one at, and one above the regime of limiting resources. We focus on the first three hours
of gene expression, due to the changing reaction conditions, especially at high plasmid
concentration.

39
A
B
C
D
Figure 3.4. Comparing expression in TXTL reactions to the model. A) Maximum rate of deGFP
synthesis expressed from varying concentrations of P70a-deGFP. B,C,D) Kinetics of deGFP
synthesis for the plasmid P70a-deGFP at three concentrations: one below, one at, and one above
saturation {A) 1 nM, B) 5 nM, C) 10 nM}, shown for the first 3 hours.
The main emphasis of the model, though, is looking at the rate of deGFP
synthesis (before the reaction conditions change and the reaction plateaus), and observing
the sharp change from the linear and saturated regime of transcription and translation
machineries. A model describing a similar TXTL system, although containing a different
ATP regeneration system, attributes this saturation seen at increasing plasmid

40
concentrations to the metabolic processes and energy efficiency [105]. We disagree with
this hypothesis when relating to our TXTL system. With P70a-deGFP in our TXTL
system, their hypothesis does not capture the linear regime nor the how sharp the
response curve is to changing plasmid concentration. It is likely that the behavior of cell-
free expression in the two systems is not the same. We expand on this, and show the
sensitivity to ribosomes and how they are limiting, in a subsequent section.
3.2 Promoter and RBS Strength
Two of the constants or parameters in the model that can be most easily tuned are related
to the promoter strength and the ribosome binding strength. By mutating bases within
either the -35 or -10 regions of the sigma 70 promoter we can alter the transcription
initiation frequency. Similarly, by mutating bases within the ribosome binding site in the
UTR, we can alter the translation initiation frequency. We designed two new E. coli
sigma 70 promoter, P70b and P70c to go along with P70a. The relative strengths of the
promoters are P70a > P70b > P70c. We also designed two new UTRs, UTR2 and UTR3
to go along with UTR1, with strengths UTR1 > UTR2 > UTR3. The relative strengths of
both the promoters and the UTRs span nearly two orders of magnitude in strength. We
cloned plasmids for every combination of each of the three promoters and UTRs, giving
us a set of nine plasmids. The sequences of the promoter through until the translation start
codon are seen in Table 3.3 below:
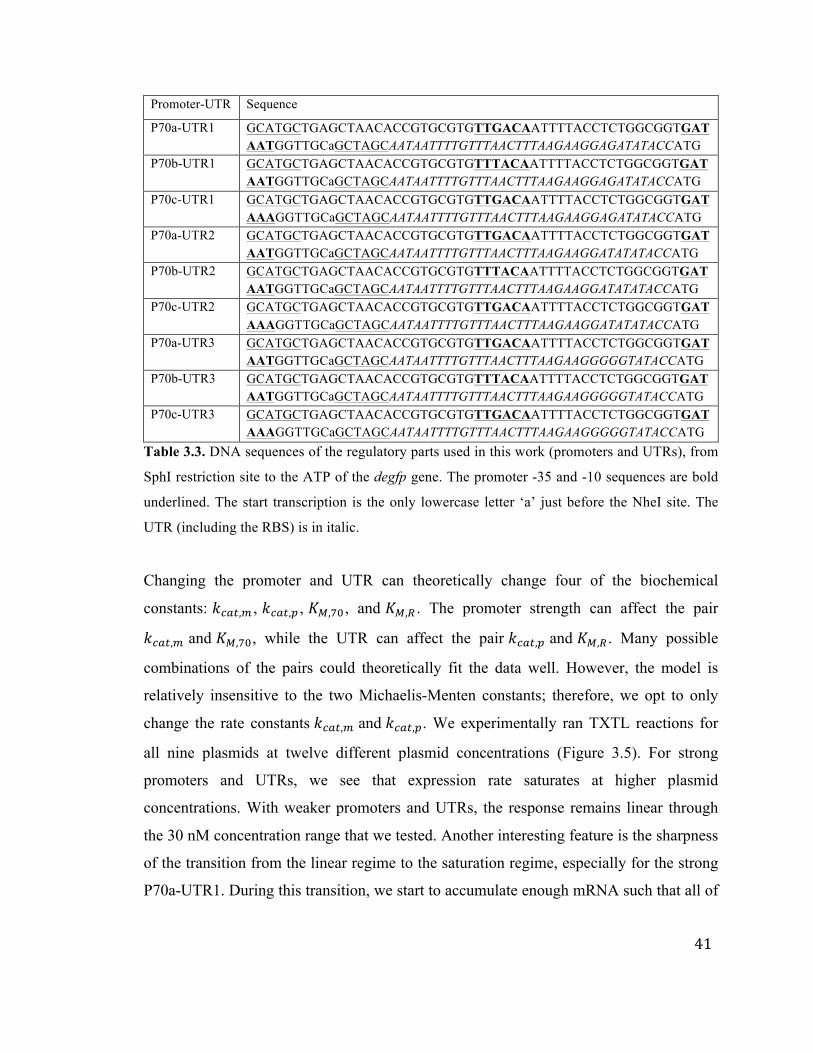
41
Promoter-UTR Sequence
P70a-UTR1 GCATGCTGAGCTAACACCGTGCGTGTTGACAATTTTACCTCTGGCGGTGATAATGGTTGCaGCTAGCAATAATTTTGTTTAACTTTAAGAAGGAGATATACCATG
P70b-UTR1 GCATGCTGAGCTAACACCGTGCGTGTTTACAATTTTACCTCTGGCGGTGATAATGGTTGCaGCTAGCAATAATTTTGTTTAACTTTAAGAAGGAGATATACCATG
P70c-UTR1 GCATGCTGAGCTAACACCGTGCGTGTTGACAATTTTACCTCTGGCGGTGATAAAGGTTGCaGCTAGCAATAATTTTGTTTAACTTTAAGAAGGAGATATACCATG
P70a-UTR2 GCATGCTGAGCTAACACCGTGCGTGTTGACAATTTTACCTCTGGCGGTGATAATGGTTGCaGCTAGCAATAATTTTGTTTAACTTTAAGAAGGATATATACCATG
P70b-UTR2 GCATGCTGAGCTAACACCGTGCGTGTTTACAATTTTACCTCTGGCGGTGATAATGGTTGCaGCTAGCAATAATTTTGTTTAACTTTAAGAAGGATATATACCATG
P70c-UTR2 GCATGCTGAGCTAACACCGTGCGTGTTGACAATTTTACCTCTGGCGGTGATAAAGGTTGCaGCTAGCAATAATTTTGTTTAACTTTAAGAAGGATATATACCATG
P70a-UTR3 GCATGCTGAGCTAACACCGTGCGTGTTGACAATTTTACCTCTGGCGGTGATAATGGTTGCaGCTAGCAATAATTTTGTTTAACTTTAAGAAGGGGGTATACCATG
P70b-UTR3 GCATGCTGAGCTAACACCGTGCGTGTTTACAATTTTACCTCTGGCGGTGATAATGGTTGCaGCTAGCAATAATTTTGTTTAACTTTAAGAAGGGGGTATACCATG
P70c-UTR3 GCATGCTGAGCTAACACCGTGCGTGTTGACAATTTTACCTCTGGCGGTGATAAAGGTTGCaGCTAGCAATAATTTTGTTTAACTTTAAGAAGGGGGTATACCATG
Table 3.3. DNA sequences of the regulatory parts used in this work (promoters and UTRs), from
SphI restriction site to the ATP of the degfp gene. The promoter -35 and -10 sequences are bold
underlined. The start transcription is the only lowercase letter ‘a’ just before the NheI site. The
UTR (including the RBS) is in italic.
Changing the promoter and UTR can theoretically change four of the biochemical
constants: 𝑘!"#,! , 𝑘!"#,! , 𝐾!,!" , and 𝐾!,! . The promoter strength can affect the pair
𝑘!"#,! and 𝐾!,!", while the UTR can affect the pair 𝑘!"#,! and 𝐾!,! . Many possible
combinations of the pairs could theoretically fit the data well. However, the model is
relatively insensitive to the two Michaelis-Menten constants; therefore, we opt to only
change the rate constants 𝑘!"#,! and 𝑘!"#,!. We experimentally ran TXTL reactions for
all nine plasmids at twelve different plasmid concentrations (Figure 3.5). For strong
promoters and UTRs, we see that expression rate saturates at higher plasmid
concentrations. With weaker promoters and UTRs, the response remains linear through
the 30 nM concentration range that we tested. Another interesting feature is the sharpness
of the transition from the linear regime to the saturation regime, especially for the strong
P70a-UTR1. During this transition, we start to accumulate enough mRNA such that all of
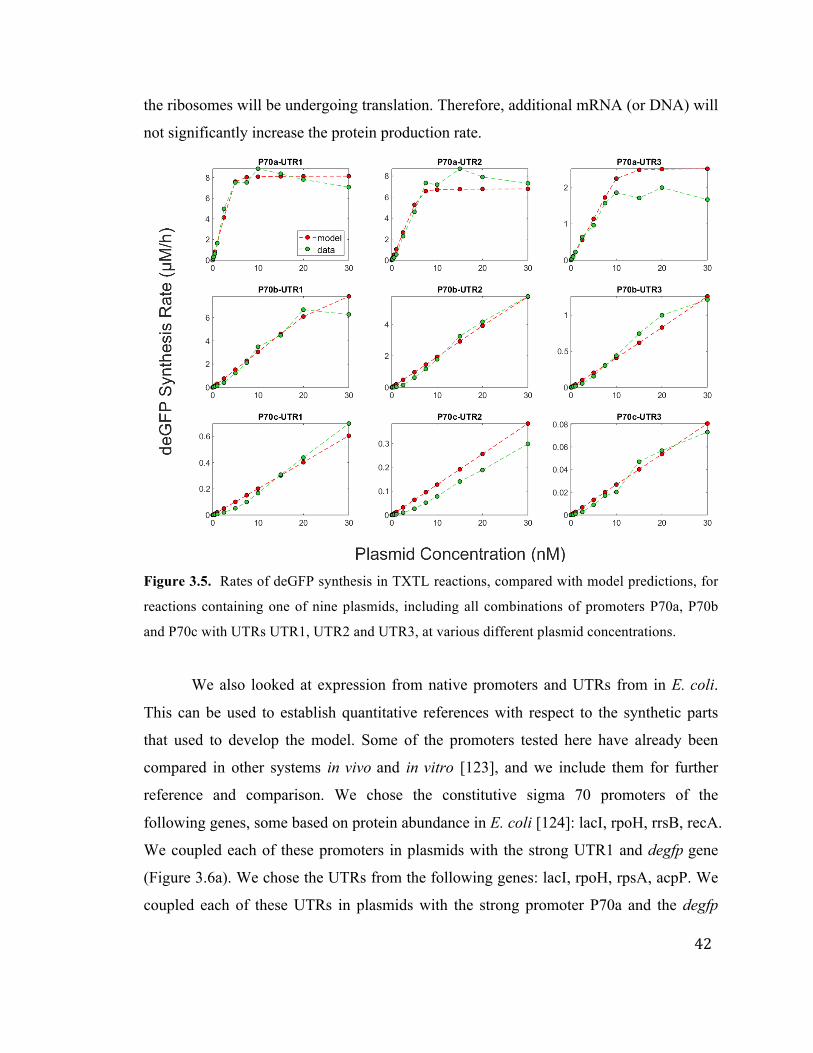
42
the ribosomes will be undergoing translation. Therefore, additional mRNA (or DNA) will
not significantly increase the protein production rate.
Figure 3.5. Rates of deGFP synthesis in TXTL reactions, compared with model predictions, for
reactions containing one of nine plasmids, including all combinations of promoters P70a, P70b
and P70c with UTRs UTR1, UTR2 and UTR3, at various different plasmid concentrations.
We also looked at expression from native promoters and UTRs from in E. coli.
This can be used to establish quantitative references with respect to the synthetic parts
that used to develop the model. Some of the promoters tested here have already been
compared in other systems in vivo and in vitro [123], and we include them for further
reference and comparison. We chose the constitutive sigma 70 promoters of the
following genes, some based on protein abundance in E. coli [124]: lacI, rpoH, rrsB, recA.
We coupled each of these promoters in plasmids with the strong UTR1 and degfp gene
(Figure 3.6a). We chose the UTRs from the following genes: lacI, rpoH, rpsA, acpP. We
coupled each of these UTRs in plasmids with the strong promoter P70a and the degfp
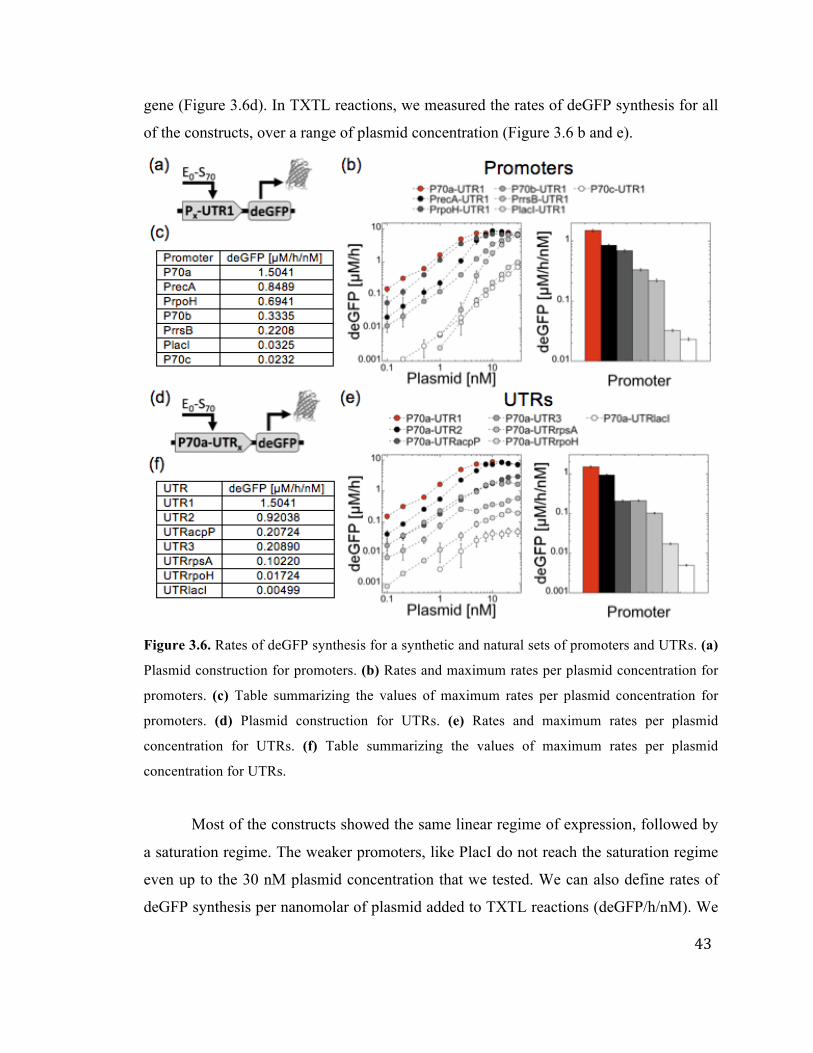
43
gene (Figure 3.6d). In TXTL reactions, we measured the rates of deGFP synthesis for all
of the constructs, over a range of plasmid concentration (Figure 3.6 b and e).
Figure 3.6. Rates of deGFP synthesis for a synthetic and natural sets of promoters and UTRs. (a)
Plasmid construction for promoters. (b) Rates and maximum rates per plasmid concentration for
promoters. (c) Table summarizing the values of maximum rates per plasmid concentration for
promoters. (d) Plasmid construction for UTRs. (e) Rates and maximum rates per plasmid
concentration for UTRs. (f) Table summarizing the values of maximum rates per plasmid
concentration for UTRs.
Most of the constructs showed the same linear regime of expression, followed by
a saturation regime. The weaker promoters, like PlacI do not reach the saturation regime
even up to the 30 nM plasmid concentration that we tested. We can also define rates of
deGFP synthesis per nanomolar of plasmid added to TXTL reactions (deGFP/h/nM). We
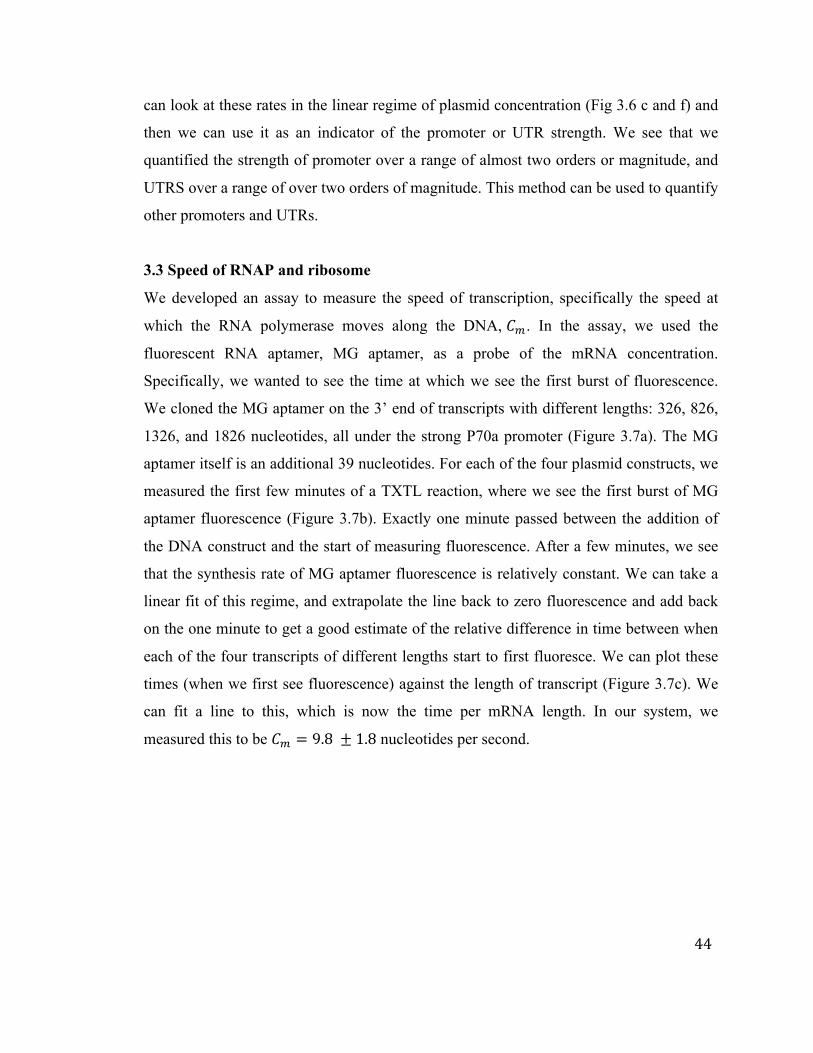
44
can look at these rates in the linear regime of plasmid concentration (Fig 3.6 c and f) and
then we can use it as an indicator of the promoter or UTR strength. We see that we
quantified the strength of promoter over a range of almost two orders or magnitude, and
UTRS over a range of over two orders of magnitude. This method can be used to quantify
other promoters and UTRs.
3.3 Speed of RNAP and ribosome
We developed an assay to measure the speed of transcription, specifically the speed at
which the RNA polymerase moves along the DNA, 𝐶!. In the assay, we used the
fluorescent RNA aptamer, MG aptamer, as a probe of the mRNA concentration.
Specifically, we wanted to see the time at which we see the first burst of fluorescence.
We cloned the MG aptamer on the 3’ end of transcripts with different lengths: 326, 826,
1326, and 1826 nucleotides, all under the strong P70a promoter (Figure 3.7a). The MG
aptamer itself is an additional 39 nucleotides. For each of the four plasmid constructs, we
measured the first few minutes of a TXTL reaction, where we see the first burst of MG
aptamer fluorescence (Figure 3.7b). Exactly one minute passed between the addition of
the DNA construct and the start of measuring fluorescence. After a few minutes, we see
that the synthesis rate of MG aptamer fluorescence is relatively constant. We can take a
linear fit of this regime, and extrapolate the line back to zero fluorescence and add back
on the one minute to get a good estimate of the relative difference in time between when
each of the four transcripts of different lengths start to first fluoresce. We can plot these
times (when we first see fluorescence) against the length of transcript (Figure 3.7c). We
can fit a line to this, which is now the time per mRNA length. In our system, we
measured this to be 𝐶! = 9.8 ± 1.8 nucleotides per second.
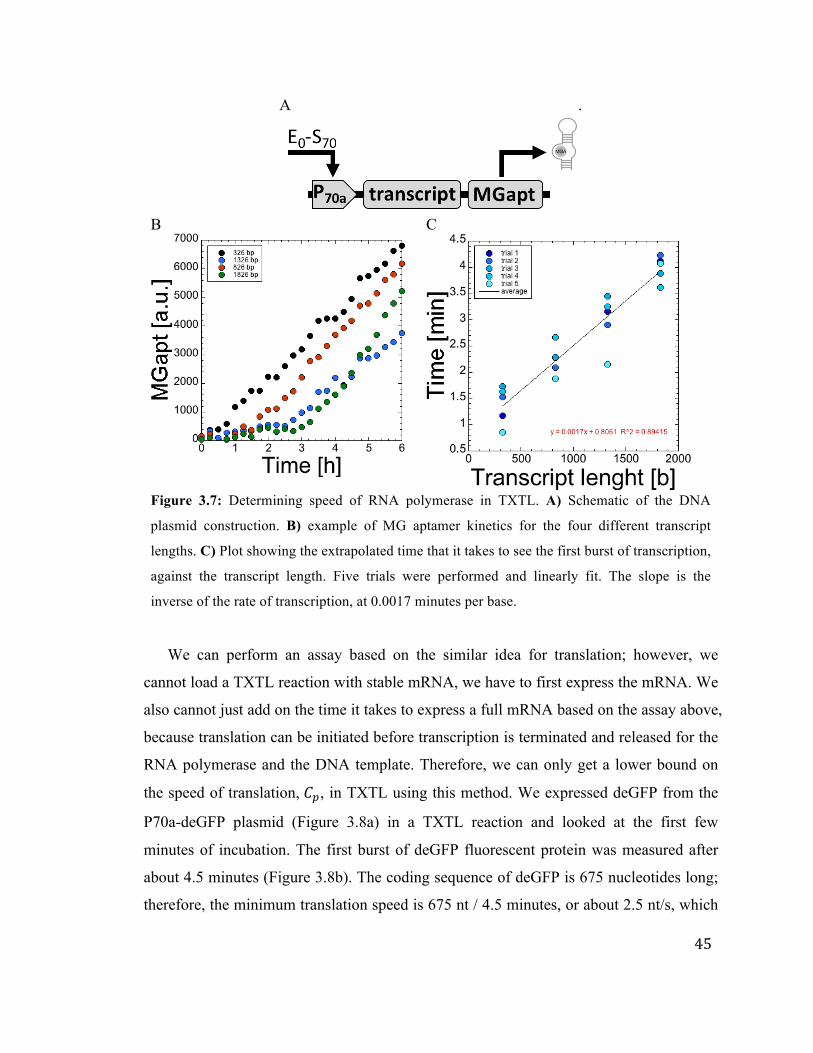
45
A .
B
C
Figure 3.7: Determining speed of RNA polymerase in TXTL. A) Schematic of the DNA
plasmid construction. B) example of MG aptamer kinetics for the four different transcript
lengths. C) Plot showing the extrapolated time that it takes to see the first burst of transcription,
against the transcript length. Five trials were performed and linearly fit. The slope is the
inverse of the rate of transcription, at 0.0017 minutes per base.
We can perform an assay based on the similar idea for translation; however, we
cannot load a TXTL reaction with stable mRNA, we have to first express the mRNA. We
also cannot just add on the time it takes to express a full mRNA based on the assay above,
because translation can be initiated before transcription is terminated and released for the
RNA polymerase and the DNA template. Therefore, we can only get a lower bound on
the speed of translation, 𝐶!, in TXTL using this method. We expressed deGFP from the
P70a-deGFP plasmid (Figure 3.8a) in a TXTL reaction and looked at the first few
minutes of incubation. The first burst of deGFP fluorescent protein was measured after
about 4.5 minutes (Figure 3.8b). The coding sequence of deGFP is 675 nucleotides long;
therefore, the minimum translation speed is 675 nt / 4.5 minutes, or about 2.5 nt/s, which
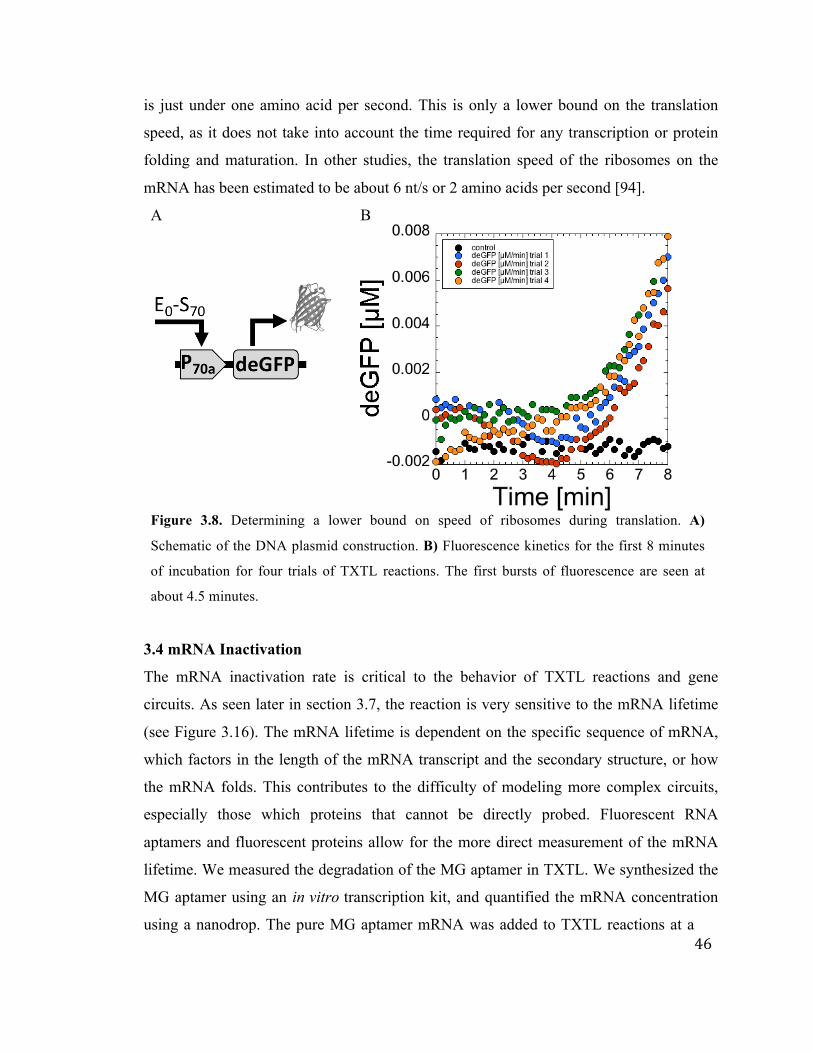
46
is just under one amino acid per second. This is only a lower bound on the translation
speed, as it does not take into account the time required for any transcription or protein
folding and maturation. In other studies, the translation speed of the ribosomes on the
mRNA has been estimated to be about 6 nt/s or 2 amino acids per second [94].
A
B
Figure 3.8. Determining a lower bound on speed of ribosomes during translation. A)
Schematic of the DNA plasmid construction. B) Fluorescence kinetics for the first 8 minutes
of incubation for four trials of TXTL reactions. The first bursts of fluorescence are seen at
about 4.5 minutes.
3.4 mRNA Inactivation
The mRNA inactivation rate is critical to the behavior of TXTL reactions and gene
circuits. As seen later in section 3.7, the reaction is very sensitive to the mRNA lifetime
(see Figure 3.16). The mRNA lifetime is dependent on the specific sequence of mRNA,
which factors in the length of the mRNA transcript and the secondary structure, or how
the mRNA folds. This contributes to the difficulty of modeling more complex circuits,
especially those which proteins that cannot be directly probed. Fluorescent RNA
aptamers and fluorescent proteins allow for the more direct measurement of the mRNA
lifetime. We measured the degradation of the MG aptamer in TXTL. We synthesized the
MG aptamer using an in vitro transcription kit, and quantified the mRNA concentration
using a nanodrop. The pure MG aptamer mRNA was added to TXTL reactions at a
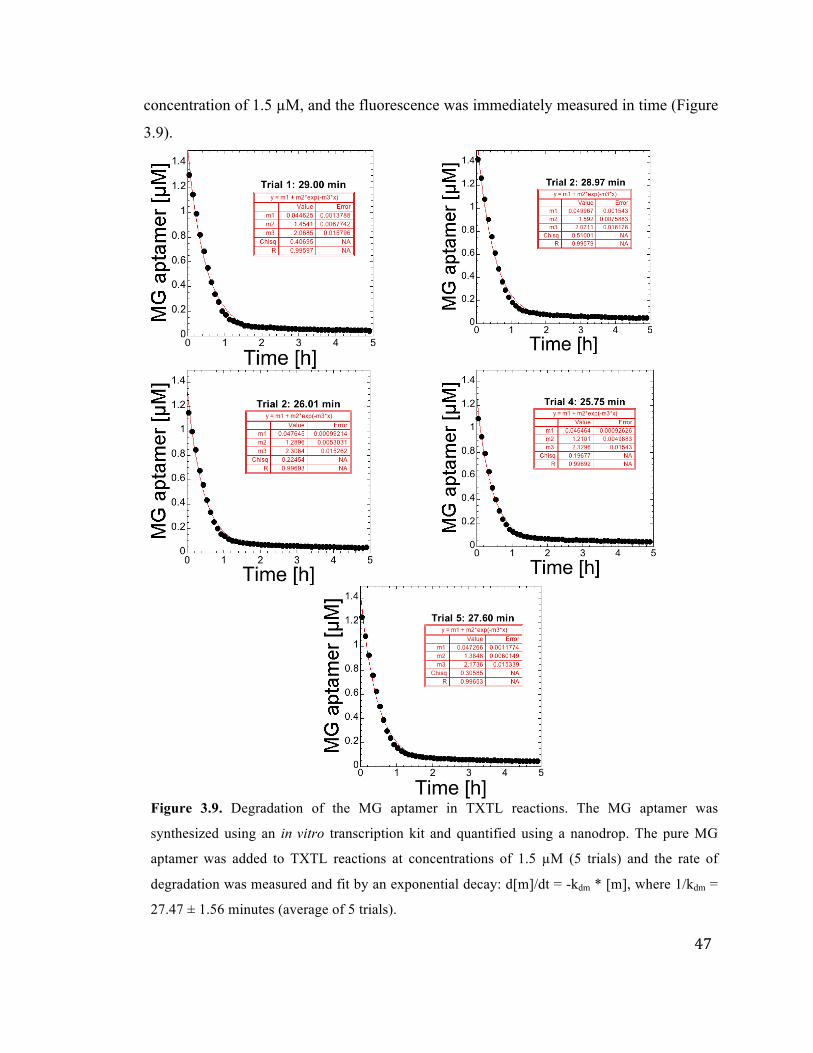
47
concentration of 1.5 µM, and the fluorescence was immediately measured in time (Figure
3.9).
Figure 3.9. Degradation of the MG aptamer in TXTL reactions. The MG aptamer was
synthesized using an in vitro transcription kit and quantified using a nanodrop. The pure MG
aptamer was added to TXTL reactions at concentrations of 1.5 µM (5 trials) and the rate of
degradation was measured and fit by an exponential decay: d[m]/dt = -kdm * [m], where 1/kdm =
27.47 ± 1.56 minutes (average of 5 trials).
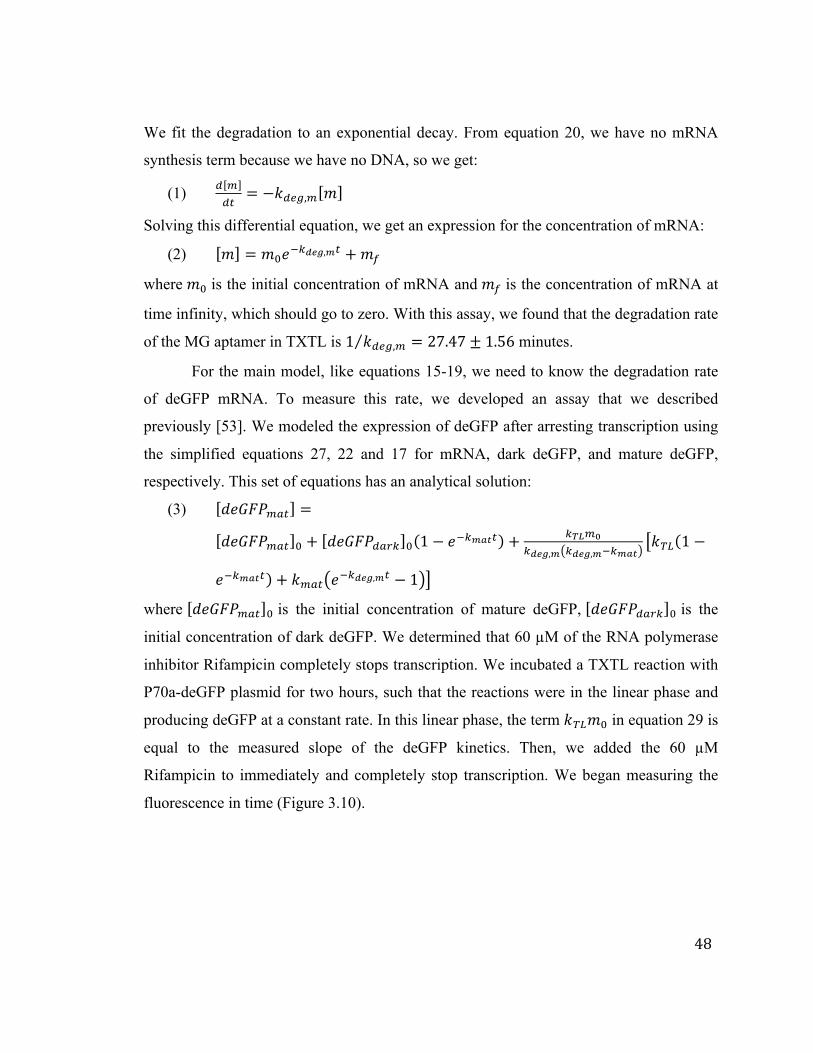
48
We fit the degradation to an exponential decay. From equation 20, we have no mRNA
synthesis term because we have no DNA, so we get:
(1) ! !!"
= −𝑘!"#,! 𝑚
Solving this differential equation, we get an expression for the concentration of mRNA:
(2) 𝑚 = 𝑚!𝑒!!!"#,!! +𝑚!
where 𝑚! is the initial concentration of mRNA and 𝑚! is the concentration of mRNA at
time infinity, which should go to zero. With this assay, we found that the degradation rate
of the MG aptamer in TXTL is 1 𝑘!"#,! = 27.47± 1.56 minutes.
For the main model, like equations 15-19, we need to know the degradation rate
of deGFP mRNA. To measure this rate, we developed an assay that we described
previously [53]. We modeled the expression of deGFP after arresting transcription using
the simplified equations 27, 22 and 17 for mRNA, dark deGFP, and mature deGFP,
respectively. This set of equations has an analytical solution:
(3) 𝑑𝑒𝐺𝐹𝑃!"# =
𝑑𝑒𝐺𝐹𝑃!"# ! + 𝑑𝑒𝐺𝐹𝑃!"!" ! 1− 𝑒!!!"#! + !!"!!!!"#,! !!"#,!!!!"#
𝑘!" 1−
𝑒!!!"#! + 𝑘!"# 𝑒!!!"#,!! − 1
where 𝑑𝑒𝐺𝐹𝑃!"# ! is the initial concentration of mature deGFP, 𝑑𝑒𝐺𝐹𝑃!"#$ ! is the
initial concentration of dark deGFP. We determined that 60 µM of the RNA polymerase
inhibitor Rifampicin completely stops transcription. We incubated a TXTL reaction with
P70a-deGFP plasmid for two hours, such that the reactions were in the linear phase and
producing deGFP at a constant rate. In this linear phase, the term 𝑘!"𝑚! in equation 29 is
equal to the measured slope of the deGFP kinetics. Then, we added the 60 µM
Rifampicin to immediately and completely stop transcription. We began measuring the
fluorescence in time (Figure 3.10).
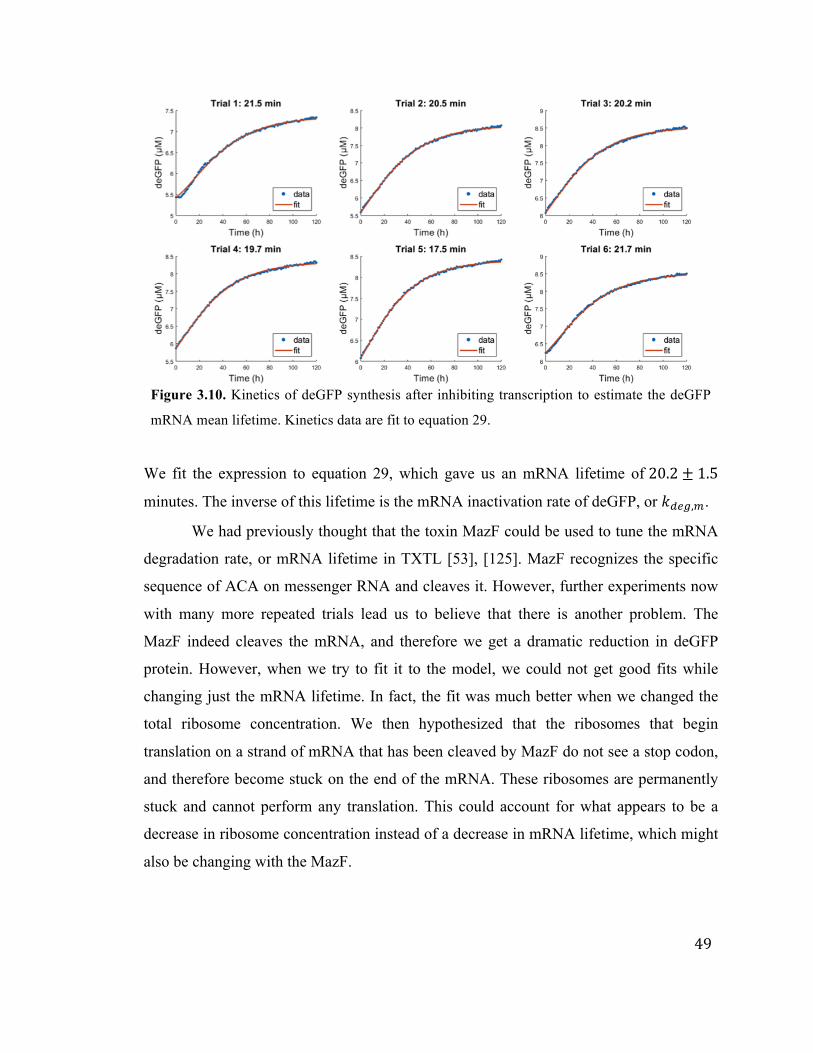
49
Figure 3.10. Kinetics of deGFP synthesis after inhibiting transcription to estimate the deGFP
mRNA mean lifetime. Kinetics data are fit to equation 29.
We fit the expression to equation 29, which gave us an mRNA lifetime of 20.2± 1.5
minutes. The inverse of this lifetime is the mRNA inactivation rate of deGFP, or 𝑘!"#,!.
We had previously thought that the toxin MazF could be used to tune the mRNA
degradation rate, or mRNA lifetime in TXTL [53], [125]. MazF recognizes the specific
sequence of ACA on messenger RNA and cleaves it. However, further experiments now
with many more repeated trials lead us to believe that there is another problem. The
MazF indeed cleaves the mRNA, and therefore we get a dramatic reduction in deGFP
protein. However, when we try to fit it to the model, we could not get good fits while
changing just the mRNA lifetime. In fact, the fit was much better when we changed the
total ribosome concentration. We then hypothesized that the ribosomes that begin
translation on a strand of mRNA that has been cleaved by MazF do not see a stop codon,
and therefore become stuck on the end of the mRNA. These ribosomes are permanently
stuck and cannot perform any translation. This could account for what appears to be a
decrease in ribosome concentration instead of a decrease in mRNA lifetime, which might
also be changing with the MazF.
50
3.5 Protein Degradation
Natural systems like E. coli have protein dynamics that include degradation and dilution
by division. In batch mode in vitro cell-free reactions, there is no division and therefore
no dilution of proteins or other reaction components. Because of this, it can be important
to have a tunable protein degradation mechanism. The degradation machinery are the
ClpXP AAA+ proteases from E. coli. In our TXTL system, proteins have to include a
degradation tag to be recognized by the degradation machinery, which is typically 10-12
amino acids long, and can be added to either N or C-terminus [126]. The strongest of
these tags that we use is the ssrA tag, which is a peptide 11 amino acids long that we add
the C-terminus of a protein. We have previously demonstrated that protein degradation
with ClpXP proteases follows a zeroth order kinetic: the degradation rate of protein is
independent of the protein concentration [53], [107].
To probe and tune the protein degradation rate in TXTL, we added pure eGFP-
ssrA protein to a TXTL reaction with varying concentrations of P70a-ClpXP plasmid,
which expressed the tandem ClpP-ClpX, which we call ClpXP protease (Figure 3.11A).
While the degradation rate is zeroth order and independent on the eGFP-ssrA
concentration, the degradation rate is dependent on the concentration of ClpXP, with the
rate being quicker for higher concentrations. TXTL reactions already contain a small
concentration of ClpXP from the cell lysate, so even with 0 nM added P70a-ClpXP, we
have a small protein degradation rate of about 7 nM/min. This is too small for to be
efficient for many cell-free TXTL applications [125]. When we add 6 nM P70a-ClpXP to
the reaction, we can achieve a protein degradation rate of over 250 nM/min. We also
tested the degradation rate where, instead of expressing ClpXP, we added pre-expressed
ClpXP to a reaction where we eliminated the P70a-deGFP. More specifically, we first
expressed ClpXP from the P70a-ClpXP plasmid overnight, then digested the P70a-ClpXP
and added the reaction now with ClpXP protein to a new TXTL reaction with eGFP-ssrA
protein (Figure 3.11B). This way is less efficient in protein degradation, although we
were not able to quantify the concentration of ClpXP added, and therefore assume we just
have lower concentrations of the protease. These methods allow for efficient degradation
of protein, and can be implemented into gene circuits, although due to the zeroth order
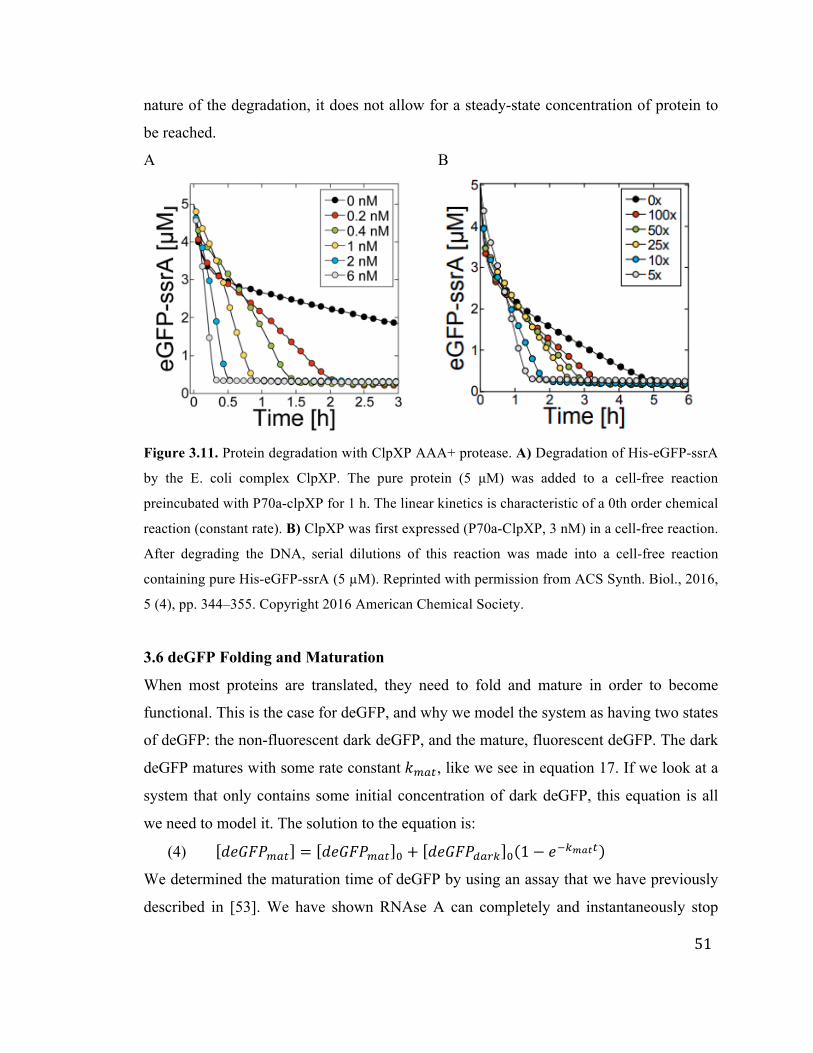
51
nature of the degradation, it does not allow for a steady-state concentration of protein to
be reached.
A
B
Figure 3.11. Protein degradation with ClpXP AAA+ protease. A) Degradation of His-eGFP-ssrA
by the E. coli complex ClpXP. The pure protein (5 µM) was added to a cell-free reaction
preincubated with P70a-clpXP for 1 h. The linear kinetics is characteristic of a 0th order chemical
reaction (constant rate). B) ClpXP was first expressed (P70a-ClpXP, 3 nM) in a cell-free reaction.
After degrading the DNA, serial dilutions of this reaction was made into a cell-free reaction
containing pure His-eGFP-ssrA (5 µM). Reprinted with permission from ACS Synth. Biol., 2016,
5 (4), pp. 344–355. Copyright 2016 American Chemical Society.
3.6 deGFP Folding and Maturation
When most proteins are translated, they need to fold and mature in order to become
functional. This is the case for deGFP, and why we model the system as having two states
of deGFP: the non-fluorescent dark deGFP, and the mature, fluorescent deGFP. The dark
deGFP matures with some rate constant 𝑘!"#, like we see in equation 17. If we look at a
system that only contains some initial concentration of dark deGFP, this equation is all
we need to model it. The solution to the equation is:
(4) 𝑑𝑒𝐺𝐹𝑃!"# = 𝑑𝑒𝐺𝐹𝑃!"# ! + 𝑑𝑒𝐺𝐹𝑃!"#$ ! 1− 𝑒!!!"#!
We determined the maturation time of deGFP by using an assay that we have previously
described in [53]. We have shown RNAse A can completely and instantaneously stop
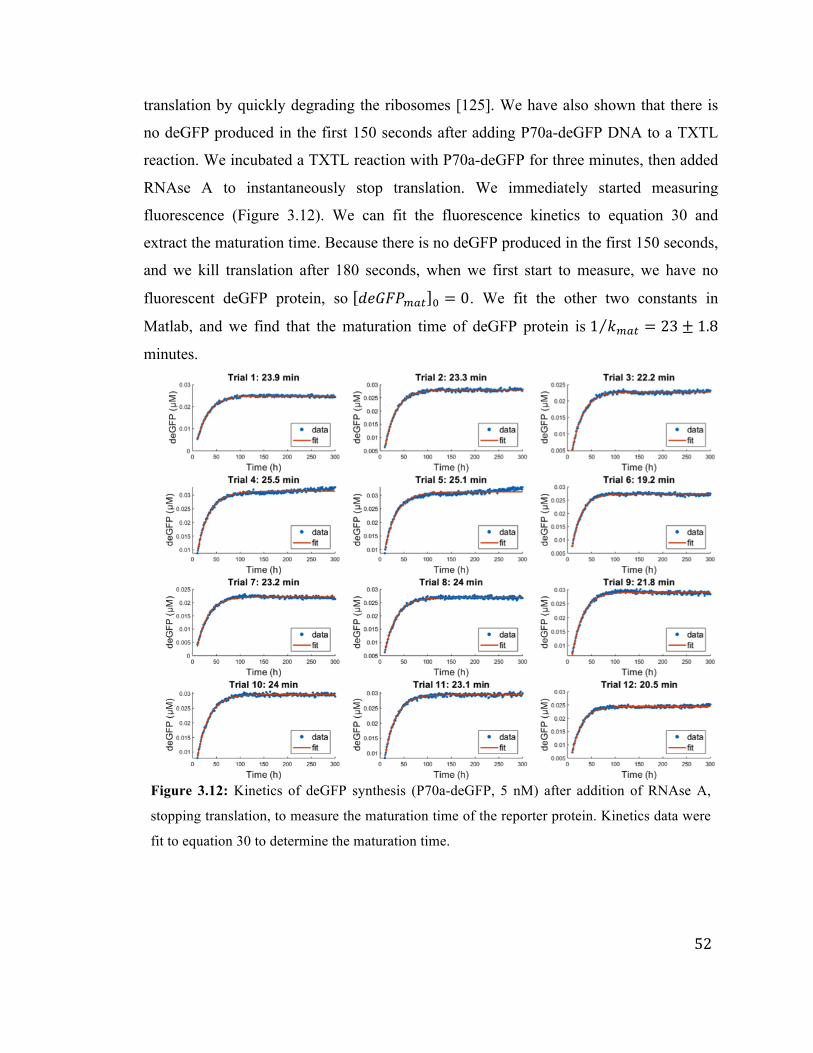
52
translation by quickly degrading the ribosomes [125]. We have also shown that there is
no deGFP produced in the first 150 seconds after adding P70a-deGFP DNA to a TXTL
reaction. We incubated a TXTL reaction with P70a-deGFP for three minutes, then added
RNAse A to instantaneously stop translation. We immediately started measuring
fluorescence (Figure 3.12). We can fit the fluorescence kinetics to equation 30 and
extract the maturation time. Because there is no deGFP produced in the first 150 seconds,
and we kill translation after 180 seconds, when we first start to measure, we have no
fluorescent deGFP protein, so 𝑑𝑒𝐺𝐹𝑃!"# ! = 0. We fit the other two constants in
Matlab, and we find that the maturation time of deGFP protein is 1 𝑘!"# = 23± 1.8
minutes.
Figure 3.12: Kinetics of deGFP synthesis (P70a-deGFP, 5 nM) after addition of RNAse A,
stopping translation, to measure the maturation time of the reporter protein. Kinetics data were
fit to equation 30 to determine the maturation time.
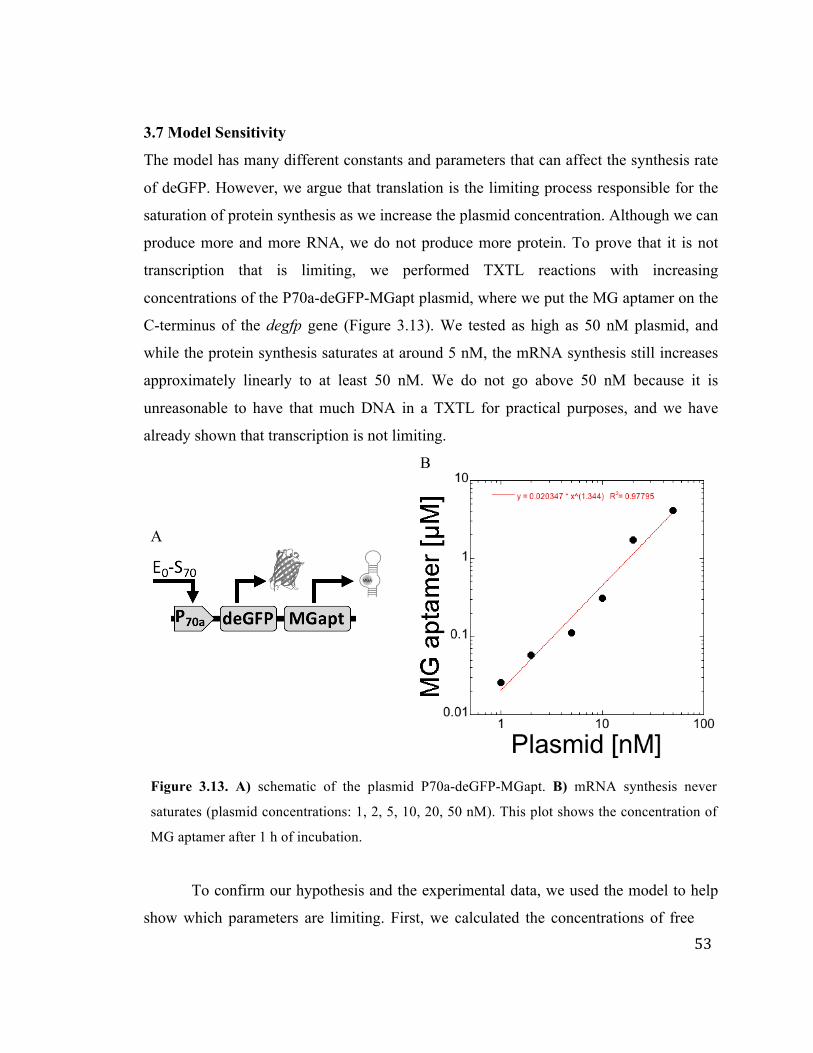
53
3.7 Model Sensitivity
The model has many different constants and parameters that can affect the synthesis rate
of deGFP. However, we argue that translation is the limiting process responsible for the
saturation of protein synthesis as we increase the plasmid concentration. Although we can
produce more and more RNA, we do not produce more protein. To prove that it is not
transcription that is limiting, we performed TXTL reactions with increasing
concentrations of the P70a-deGFP-MGapt plasmid, where we put the MG aptamer on the
C-terminus of the degfp gene (Figure 3.13). We tested as high as 50 nM plasmid, and
while the protein synthesis saturates at around 5 nM, the mRNA synthesis still increases
approximately linearly to at least 50 nM. We do not go above 50 nM because it is
unreasonable to have that much DNA in a TXTL for practical purposes, and we have
already shown that transcription is not limiting.
A
B
Figure 3.13. A) schematic of the plasmid P70a-deGFP-MGapt. B) mRNA synthesis never
saturates (plasmid concentrations: 1, 2, 5, 10, 20, 50 nM). This plot shows the concentration of
MG aptamer after 1 h of incubation.
To confirm our hypothesis and the experimental data, we used the model to help
show which parameters are limiting. First, we calculated the concentrations of free
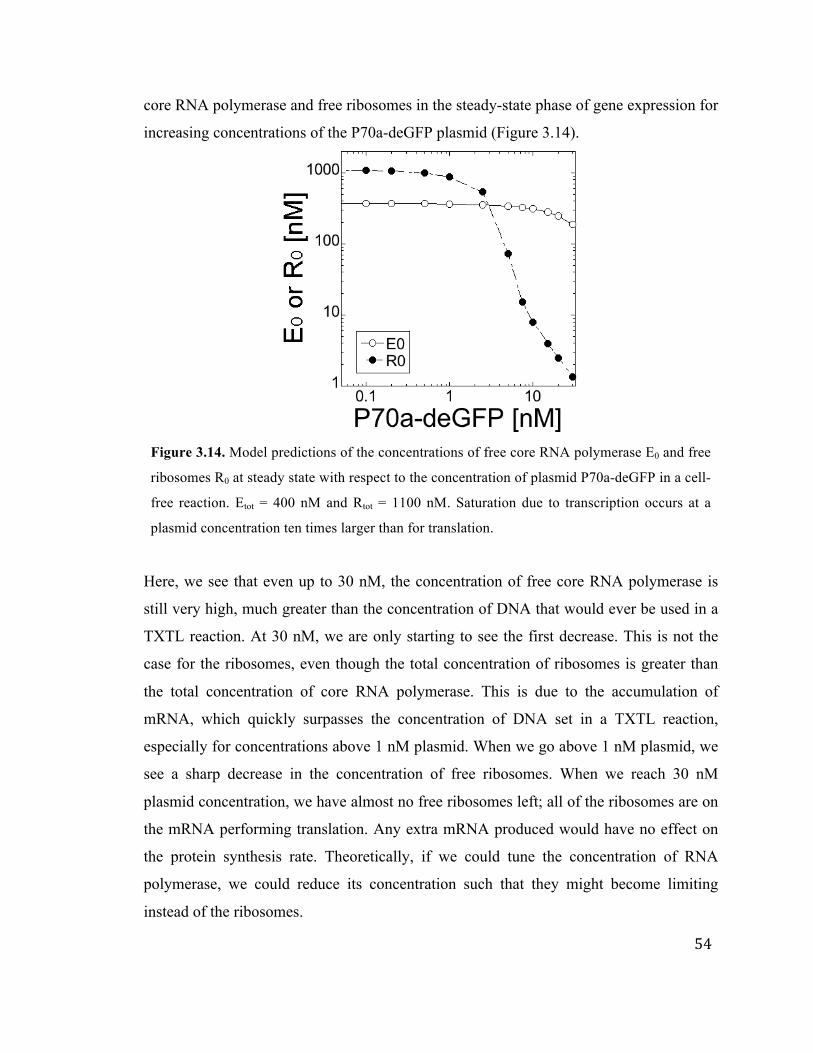
54
core RNA polymerase and free ribosomes in the steady-state phase of gene expression for
increasing concentrations of the P70a-deGFP plasmid (Figure 3.14).
Figure 3.14. Model predictions of the concentrations of free core RNA polymerase E0 and free
ribosomes R0 at steady state with respect to the concentration of plasmid P70a-deGFP in a cell-
free reaction. Etot = 400 nM and Rtot = 1100 nM. Saturation due to transcription occurs at a
plasmid concentration ten times larger than for translation.
Here, we see that even up to 30 nM, the concentration of free core RNA polymerase is
still very high, much greater than the concentration of DNA that would ever be used in a
TXTL reaction. At 30 nM, we are only starting to see the first decrease. This is not the
case for the ribosomes, even though the total concentration of ribosomes is greater than
the total concentration of core RNA polymerase. This is due to the accumulation of
mRNA, which quickly surpasses the concentration of DNA set in a TXTL reaction,
especially for concentrations above 1 nM plasmid. When we go above 1 nM plasmid, we
see a sharp decrease in the concentration of free ribosomes. When we reach 30 nM
plasmid concentration, we have almost no free ribosomes left; all of the ribosomes are on
the mRNA performing translation. Any extra mRNA produced would have no effect on
the protein synthesis rate. Theoretically, if we could tune the concentration of RNA
polymerase, we could reduce its concentration such that they might become limiting
instead of the ribosomes.
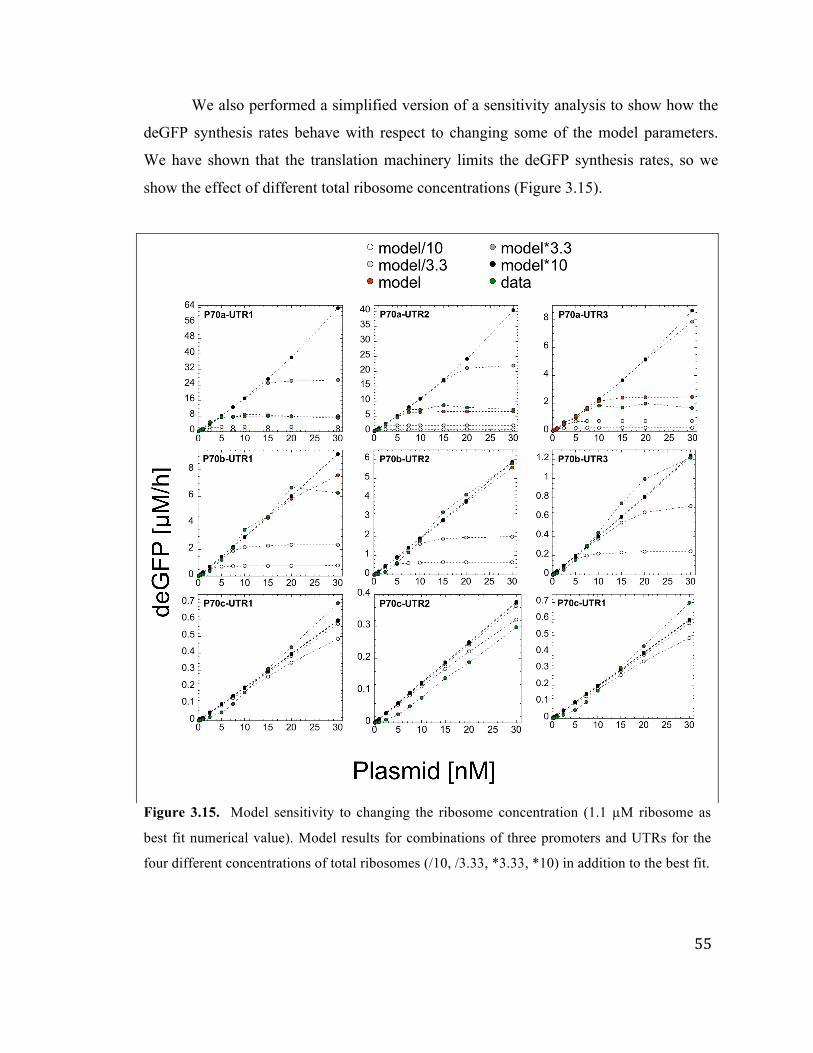
55
We also performed a simplified version of a sensitivity analysis to show how the
deGFP synthesis rates behave with respect to changing some of the model parameters.
We have shown that the translation machinery limits the deGFP synthesis rates, so we
show the effect of different total ribosome concentrations (Figure 3.15).
Figure 3.15. Model sensitivity to changing the ribosome concentration (1.1 µM ribosome as
best fit numerical value). Model results for combinations of three promoters and UTRs for the
four different concentrations of total ribosomes (/10, /3.33, *3.33, *10) in addition to the best fit.
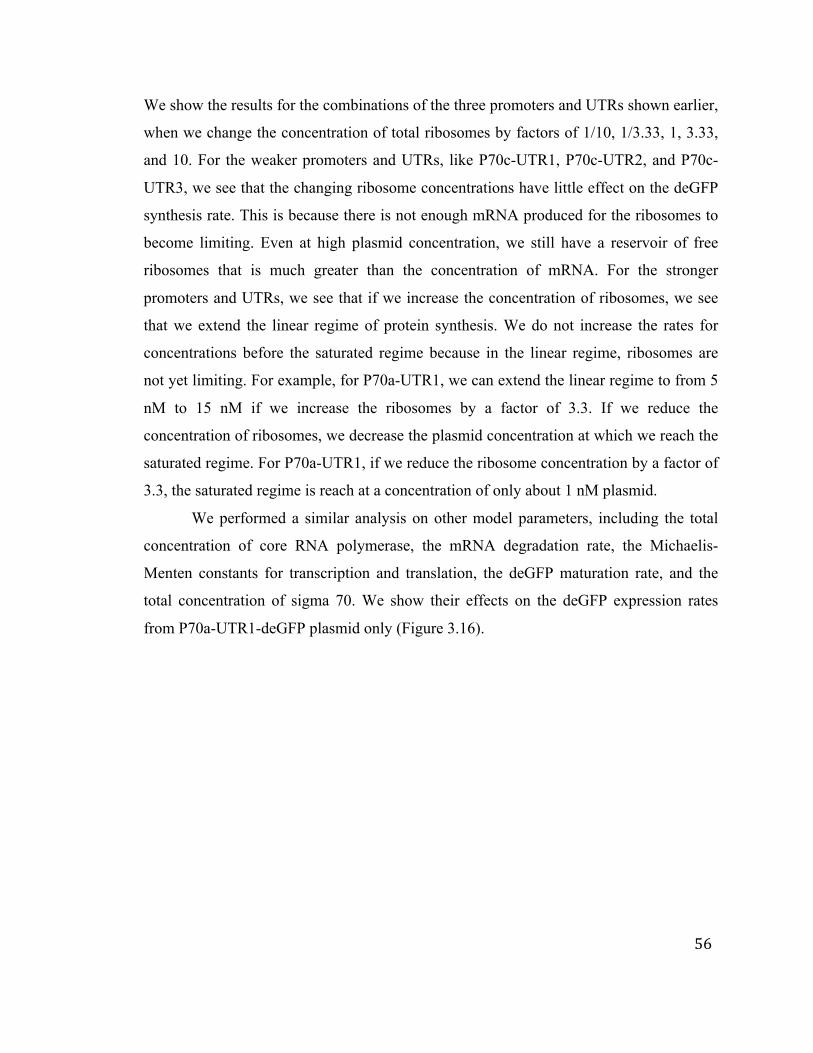
56
We show the results for the combinations of the three promoters and UTRs shown earlier,
when we change the concentration of total ribosomes by factors of 1/10, 1/3.33, 1, 3.33,
and 10. For the weaker promoters and UTRs, like P70c-UTR1, P70c-UTR2, and P70c-
UTR3, we see that the changing ribosome concentrations have little effect on the deGFP
synthesis rate. This is because there is not enough mRNA produced for the ribosomes to
become limiting. Even at high plasmid concentration, we still have a reservoir of free
ribosomes that is much greater than the concentration of mRNA. For the stronger
promoters and UTRs, we see that if we increase the concentration of ribosomes, we see
that we extend the linear regime of protein synthesis. We do not increase the rates for
concentrations before the saturated regime because in the linear regime, ribosomes are
not yet limiting. For example, for P70a-UTR1, we can extend the linear regime to from 5
nM to 15 nM if we increase the ribosomes by a factor of 3.3. If we reduce the
concentration of ribosomes, we decrease the plasmid concentration at which we reach the
saturated regime. For P70a-UTR1, if we reduce the ribosome concentration by a factor of
3.3, the saturated regime is reach at a concentration of only about 1 nM plasmid.
We performed a similar analysis on other model parameters, including the total
concentration of core RNA polymerase, the mRNA degradation rate, the Michaelis-
Menten constants for transcription and translation, the deGFP maturation rate, and the
total concentration of sigma 70. We show their effects on the deGFP expression rates
from P70a-UTR1-deGFP plasmid only (Figure 3.16).
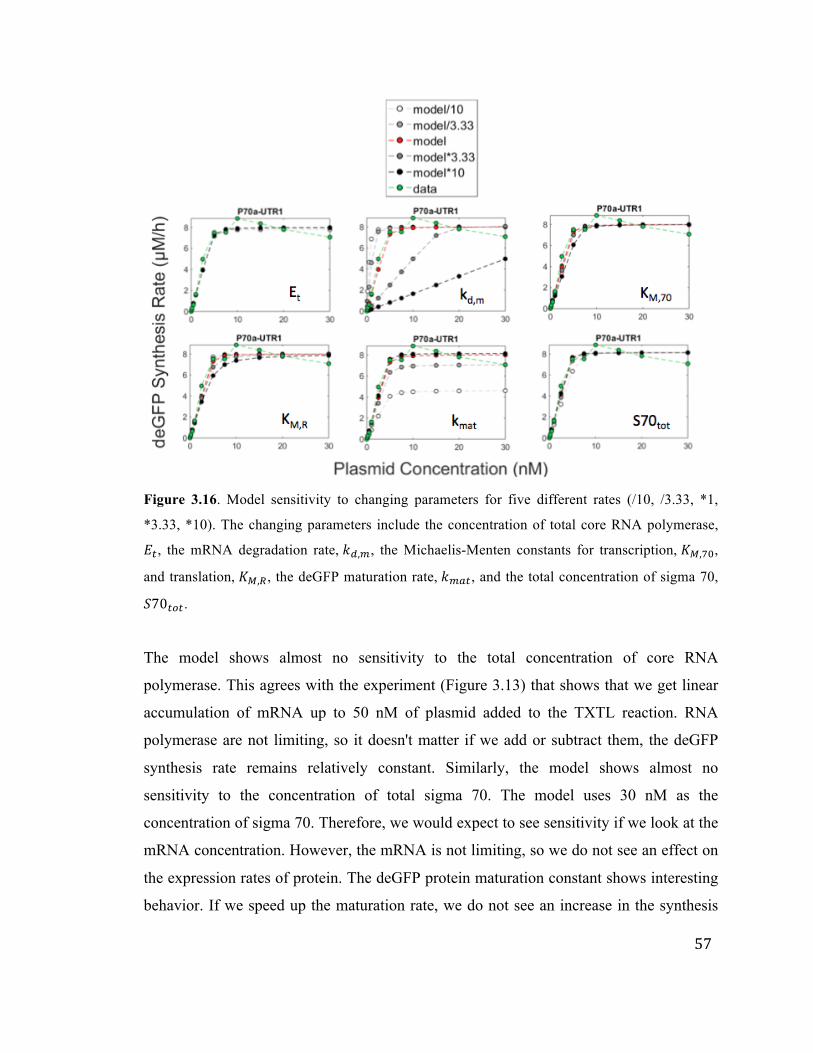
57
Figure 3.16. Model sensitivity to changing parameters for five different rates (/10, /3.33, *1,
*3.33, *10). The changing parameters include the concentration of total core RNA polymerase,
𝐸!, the mRNA degradation rate, 𝑘!,!, the Michaelis-Menten constants for transcription, 𝐾!,!",
and translation, 𝐾!,!, the deGFP maturation rate, 𝑘!"#, and the total concentration of sigma 70,
𝑆70!"!.
The model shows almost no sensitivity to the total concentration of core RNA
polymerase. This agrees with the experiment (Figure 3.13) that shows that we get linear
accumulation of mRNA up to 50 nM of plasmid added to the TXTL reaction. RNA
polymerase are not limiting, so it doesn't matter if we add or subtract them, the deGFP
synthesis rate remains relatively constant. Similarly, the model shows almost no
sensitivity to the concentration of total sigma 70. The model uses 30 nM as the
concentration of sigma 70. Therefore, we would expect to see sensitivity if we look at the
mRNA concentration. However, the mRNA is not limiting, so we do not see an effect on
the expression rates of protein. The deGFP protein maturation constant shows interesting
behavior. If we speed up the maturation rate, we do not see an increase in the synthesis
58
rate of fluorescent deGFP. However, if we decrease the maturation rate, the synthesis rate
of fluorescent deGFP decreases. The Michaelis-Menten constants for both transcription
and translation showed only slight sensitivity. This suggests that the simplified version of
this model, like in equations 20 and 22, while not as accurate, is still a good model for the
system. Finally, the mRNA degradation rate showed a high sensitivity to change.
3.8 TXTL Load Calculator
It may often be useful to know whether or not the transcriptional and translational load in
a TXTL reaction will be such that the reaction is in the linear regime or protein synthesis
or the saturated regime of protein synthesis. For example, gene circuits are more
predictable if it is known that the free ribosome concentration is not approaching zero.
Also, for biomanufacturing, or maximizing protein production without wasting DNA, one
may want to know the concentration of DNA at which the ribosomes are limiting. We
developed a simple formula to determine the burden on the TXTL components based on
the strengths of the promoter and UTR, and the concentration of the plasmids used. The
formula requires that the strengths of the promoter and UTR be known with respect to
P70a and UTR1. As inputs, the formula takes the promoter strength, the UTR strength,
and the length of the gene, and the output is the approximate concentration of DNA at
which the translation machinery will become limiting. The equation was constructed by
fitting power functions to each of the variables in the equation individually against the
concentration of DNA for which the ribosomes became limiting based on the model
(Figure 3.17). The three fit equations were then combined together to form the following
equation, which accounts for variations in each of the variables:
(5) 𝐷𝑁𝐴 = 250 ∗ 𝑃!!.!"# ∗ 𝑈!!.!"# ∗ 𝐿!!!.!"#
where 𝑃 is the strength of the promoter relative to P70a, where P70a is given as a
strength of 1, 𝑈 is the strength of the UTR relative to UTR1, where UTR1 is given as a
strength of 1, and 𝐿! is the length of the gene in nucleotides.
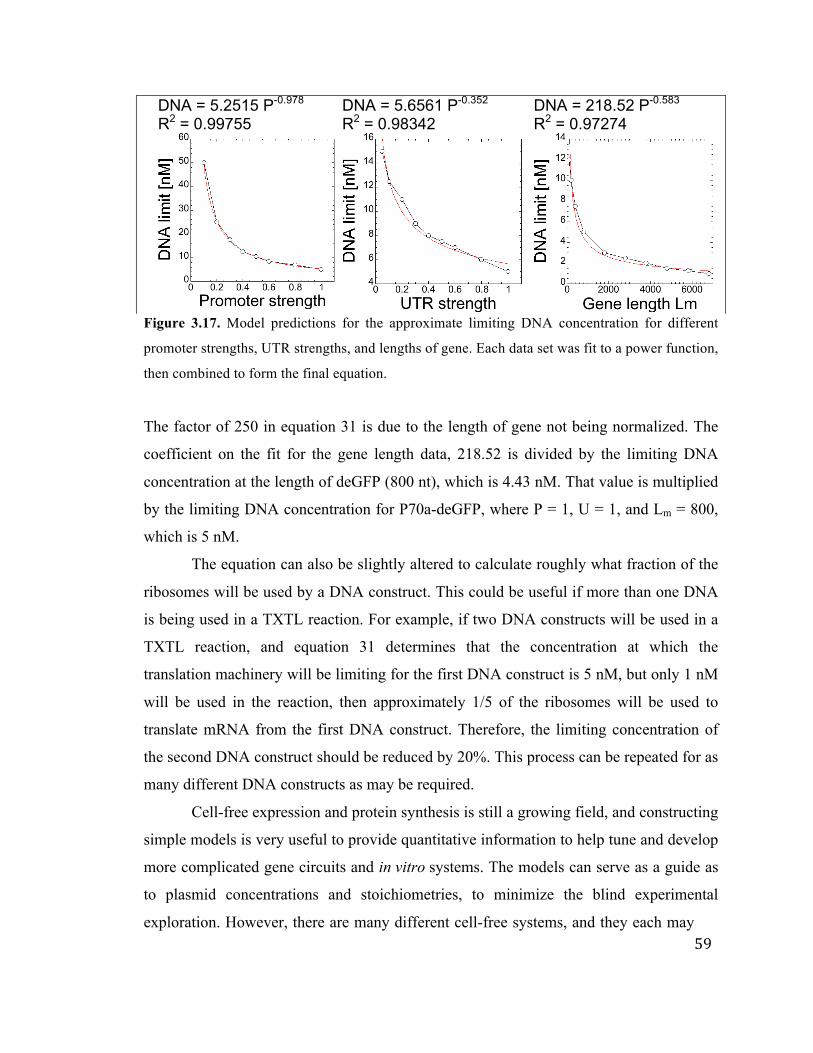
59
DNA = 5.2515 P-0.978
R2 = 0.99755 DNA = 5.6561 P-0.352
R2 = 0.98342
DNA = 218.52 P-0.583
R2 = 0.97274
Figure 3.17. Model predictions for the approximate limiting DNA concentration for different
promoter strengths, UTR strengths, and lengths of gene. Each data set was fit to a power function,
then combined to form the final equation.
The factor of 250 in equation 31 is due to the length of gene not being normalized. The
coefficient on the fit for the gene length data, 218.52 is divided by the limiting DNA
concentration at the length of deGFP (800 nt), which is 4.43 nM. That value is multiplied
by the limiting DNA concentration for P70a-deGFP, where P = 1, U = 1, and Lm = 800,
which is 5 nM.
The equation can also be slightly altered to calculate roughly what fraction of the
ribosomes will be used by a DNA construct. This could be useful if more than one DNA
is being used in a TXTL reaction. For example, if two DNA constructs will be used in a
TXTL reaction, and equation 31 determines that the concentration at which the
translation machinery will be limiting for the first DNA construct is 5 nM, but only 1 nM
will be used in the reaction, then approximately 1/5 of the ribosomes will be used to
translate mRNA from the first DNA construct. Therefore, the limiting concentration of
the second DNA construct should be reduced by 20%. This process can be repeated for as
many different DNA constructs as may be required.
Cell-free expression and protein synthesis is still a growing field, and constructing
simple models is very useful to provide quantitative information to help tune and develop
more complicated gene circuits and in vitro systems. The models can serve as a guide as
to plasmid concentrations and stoichiometries, to minimize the blind experimental
exploration. However, there are many different cell-free systems, and they each may

60
have unique features, and therefore each system should have a specific model to
accompany it, and each model may not capture all the characteristics of other cell-free
systems. We have developed an all E. coli cell-free system and accompanying model that
captures very well the linear and saturated regimes of protein synthesis, as well as the
very sharp transition between the two regimes.
61
Chapter 4
TXTL Characterization of CRISPR Technologies
4.1 CRISPR Introduction
Over time, bacteria and archaea have evolved adaptive immune systems that recognize
and defend against foreign invaders carrying genetic information, like bacteriophages and
plasmids [127]–[130]. These immune systems are called clustered regularly interspace
short palindromic repeats (CRISPR) – CRISPR associated (Cas) systems [131].
Specifically, CRISPR is a section of DNA within the prokaryote genome that contains
repeated sections separated by spacers. The spacers are incorporated from foreign
invaders, such that the prokaryote can recognize a subsequent invasion from the same
invader [132], [133]. This is what makes the immune system adaptive, or specific to the
cell line that has been previously invaded. CRISPR-Cas systems rely on an RNA-guided
nuclease that targets and cleaves a specific DNA or RNA template.
CRISPR-Cas systems are made up of two main pieces: the Cas protein (or
proteins) and an RNA that guides the Cas protein to a target DNA. This RNA is called
the guide RNA (gRNA) and, in S. pyogenes is made up of a CRISPR RNA (crRNA) and
a transactivating crRNA (tracrRNA). The tracrRNA helps in the maturation of the crRNA,
and the crRNA contains the spacer sequence that base pair matches a foreign target [134].
Together, they guide the Cas protein, Cas9 in the case of S. pyogenes, to the foreign
target. The tracrRNA and the crRNA can be fused together synthetically and transcribed
as a single chimeric RNA, called a single guide RNA (sgRNA), thereby simplifying its
accessibility and applicability for practical uses [135].
Physiologically, acquiring immunity to a foreign invader first requires the
acquisition of spacers from the invader. Certain Cas proteins cleave the invading DNA
and incorporate it back into the CRISPR region of the prokaryotic genome. Next, these
new spacer sequences in the CRISPR array are expressed, and Cas proteins process the
transcribed RNA into crRNAs. The last step in the cycle is targeting and cleavage, where
62
Cas proteins bind to the crRNA, forming a ribonucleoprotein complex, and the crRNA
guides the complex to the invading DNA by base pair matching the spacer sequence.
Once bound, the Cas protein cleaves the targeted DNA, and the cycle can repeat.
CRISPR-Cas systems are separated into two classes, six types, and 33 subtypes,
based on their structural and functional differences [130], [136], [137]. Different
CRISPR-Cas systems employ genetically and functionally diverse Cas proteins to acquire
spacers and defend against invasion. Differing properties include Cas protein size, DNA
recognition motifs, DNA degradation, RNA vs. DNA targeting, off target effects, and
ability to multiplex [138]–[142]. One constant, however, is that they all rely on an RNA
motif to guide the Cas proteins to the invader. Type I and Type II CIRSPR-Cas systems
require a short DNA motif next to the target sequence in the invader. This motif is called
the protospacer adjacent motif (PAM), and is typically 2-5 nucleotides [143]. The PAM
ensures that the prokaryote does not target itself, because, in its genome, it won’t have a
PAM site flanking the spacer sequence, and thus will not recognize the sequence. In this
work, only CRISPR-Cas systems from Types 1 and II are characterized.
While the entire prokaryotic adaptive immune system requires many CRISPR
proteins for full function, laboratory uses can take advantage of the system using only a
single protein, at least in the case of S. pyogenes Cas9 [135], [144]. Cas9 can bind to a
guide RNA, and the complex can target and cleave another DNA. The other Cas proteins
function for spacer acquisition, which is not necessary for many practical applications.
Thus, with a very simple CRISPR-Cas system, applications range from genome
engineering, medicine, biomolecular research, biotechnology, to human health and
agriculture [145], [146]. Cas proteins have also been modified in the laboratory to
deactivate their ability to cleave target DNA, allowing them to be used for programmable
DNA binding and gene regulations [147], [148]. It has been shown that these “dead”
Cas9 proteins can bind DNA and block transcription initiation or elongation of RNA
polymerase in bacteria [148], [149].
This chapter will discuss how TXTL is a valuable tool for CRISPR biology
because it can be used for the rapid and scalable characterization of CRISPR technologies,
including the characterization of different CRISPR nucleases, guide RNAs, anti-CRISPR
63
proteins, and PAM determination. TXTL fluorescence results can be obtained for most
experiments in one day or less because they do not require any protein purification of cell
culturing and transformation, like many other in vitro biochemical assays or in vivo
assays. Another advantage of TXTL is that it is relatively simple to characterize multi-
subunit effector complexes because each subunit can be expressed from a separate linear,
chemically synthesized DNA, and they can all be added together to a single TXTL
reaction. While TXTL is very useful tool to characterize CRISPR-Cas systems, it does
have its limitations which should be noted. TXTL reactions are optimized for expression
of deGFP at 29°C, and limited to the range between 25°C-42°C [108]. This could
potentially limit the systems that it is able to characterize. For example, it may not be
possible to characterize systems native to thermophilic organisms. Also, the finite amount
of energy and build up of degradation products without a means to wash them out is
another possible limitation. If a Cas proteins is poorly expressed, it may take a lot of time
for enough protein to accumulate in the reaction, but there is a finite amount of time that
the reaction can run before the energy becomes limiting and the reaction environment
changes. Another limitation is that TXTL is an E. coli cell-free extract, so it lacks many
components of eukaryotic cells that may impact how CRISPR systems would work in
eukaryotes, like long and diverse DNA sequences that impact dynamics of target search,
which also could result in undesirable off-target effects, chromatin and other nucleoid
proteins that impact the structure and availability of DNA, and proteins responsible for
repair of DNA genome in eukaryotes. Therefore, TXTL may only be useful for
characterizing CRISPR-Cas systems for bacterial systems, or at the very least there may
be unknown effects when moving to eukaryotes.
4.2 CRISPR in TXTL and CRISPR E. coli Lysates
To express CRISPR-Cas systems in TXTL, plasmid DNA encoding the desired Cas
genes and gRNAs are added to a TXTL reaction, generating active nucleoprotein
complexes. These complexes then target template DNA based on the spacer sequence in
the gRNA. To measure the activity of the CRISPR-Cas systems in TXTL, we use the
standard reporter, deGFP. The simplest way to do this is to add the plasmid P70a-deGFP
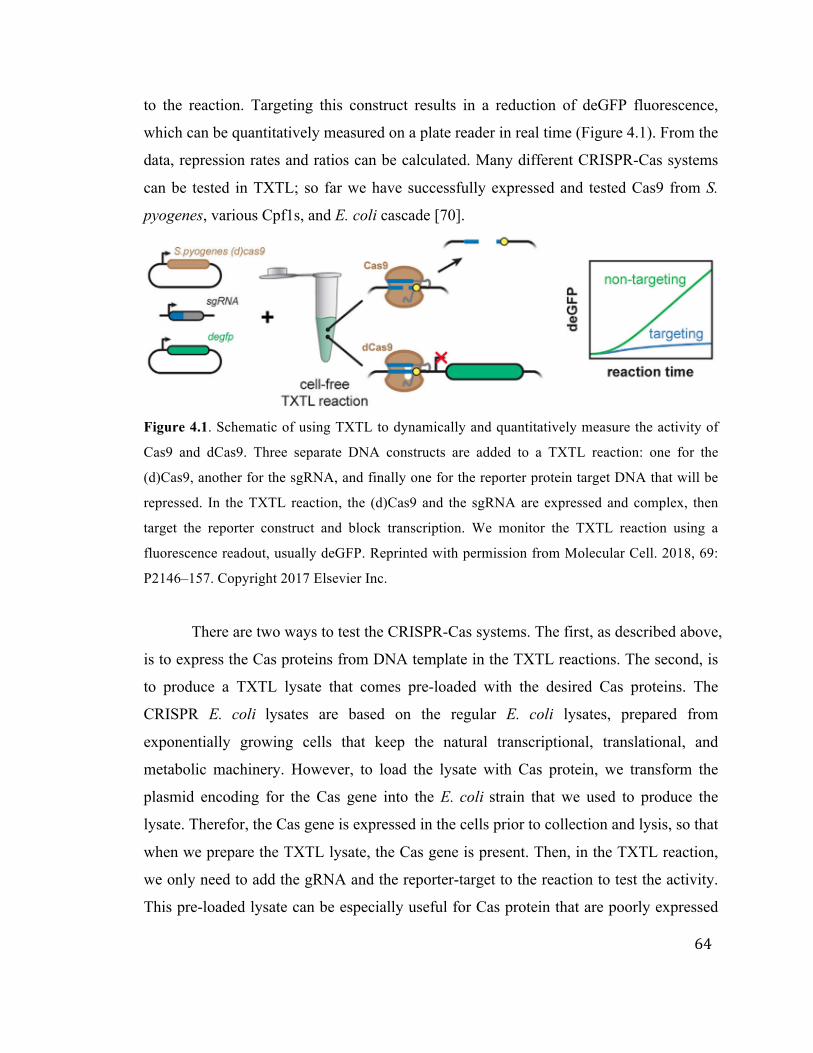
64
to the reaction. Targeting this construct results in a reduction of deGFP fluorescence,
which can be quantitatively measured on a plate reader in real time (Figure 4.1). From the
data, repression rates and ratios can be calculated. Many different CRISPR-Cas systems
can be tested in TXTL; so far we have successfully expressed and tested Cas9 from S.
pyogenes, various Cpf1s, and E. coli cascade [70].
Figure 4.1. Schematic of using TXTL to dynamically and quantitatively measure the activity of
Cas9 and dCas9. Three separate DNA constructs are added to a TXTL reaction: one for the
(d)Cas9, another for the sgRNA, and finally one for the reporter protein target DNA that will be
repressed. In the TXTL reaction, the (d)Cas9 and the sgRNA are expressed and complex, then
target the reporter construct and block transcription. We monitor the TXTL reaction using a
fluorescence readout, usually deGFP. Reprinted with permission from Molecular Cell. 2018, 69:
P2146–157. Copyright 2017 Elsevier Inc.
There are two ways to test the CRISPR-Cas systems. The first, as described above,
is to express the Cas proteins from DNA template in the TXTL reactions. The second, is
to produce a TXTL lysate that comes pre-loaded with the desired Cas proteins. The
CRISPR E. coli lysates are based on the regular E. coli lysates, prepared from
exponentially growing cells that keep the natural transcriptional, translational, and
metabolic machinery. However, to load the lysate with Cas protein, we transform the
plasmid encoding for the Cas gene into the E. coli strain that we used to produce the
lysate. Therefor, the Cas gene is expressed in the cells prior to collection and lysis, so that
when we prepare the TXTL lysate, the Cas gene is present. Then, in the TXTL reaction,
we only need to add the gRNA and the reporter-target to the reaction to test the activity.
This pre-loaded lysate can be especially useful for Cas protein that are poorly expressed
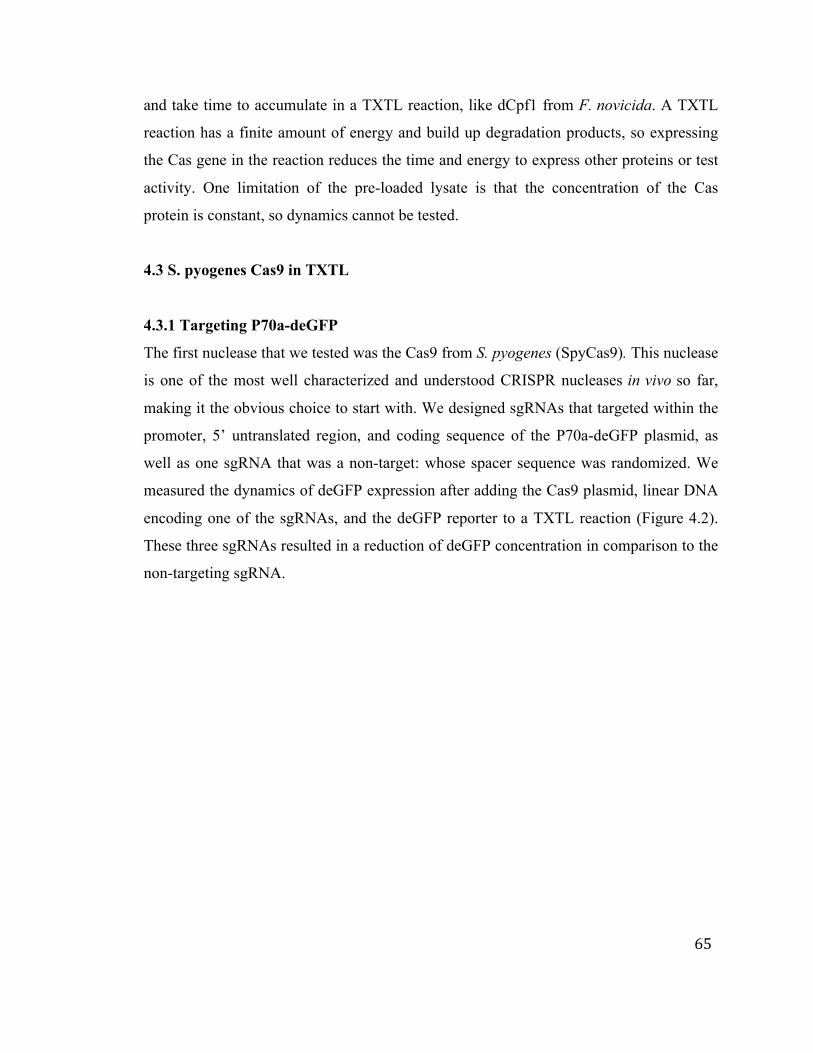
65
and take time to accumulate in a TXTL reaction, like dCpf1 from F. novicida. A TXTL
reaction has a finite amount of energy and build up degradation products, so expressing
the Cas gene in the reaction reduces the time and energy to express other proteins or test
activity. One limitation of the pre-loaded lysate is that the concentration of the Cas
protein is constant, so dynamics cannot be tested.
4.3 S. pyogenes Cas9 in TXTL
4.3.1 Targeting P70a-deGFP
The first nuclease that we tested was the Cas9 from S. pyogenes (SpyCas9). This nuclease
is one of the most well characterized and understood CRISPR nucleases in vivo so far,
making it the obvious choice to start with. We designed sgRNAs that targeted within the
promoter, 5’ untranslated region, and coding sequence of the P70a-deGFP plasmid, as
well as one sgRNA that was a non-target: whose spacer sequence was randomized. We
measured the dynamics of deGFP expression after adding the Cas9 plasmid, linear DNA
encoding one of the sgRNAs, and the deGFP reporter to a TXTL reaction (Figure 4.2).
These three sgRNAs resulted in a reduction of deGFP concentration in comparison to the
non-targeting sgRNA.
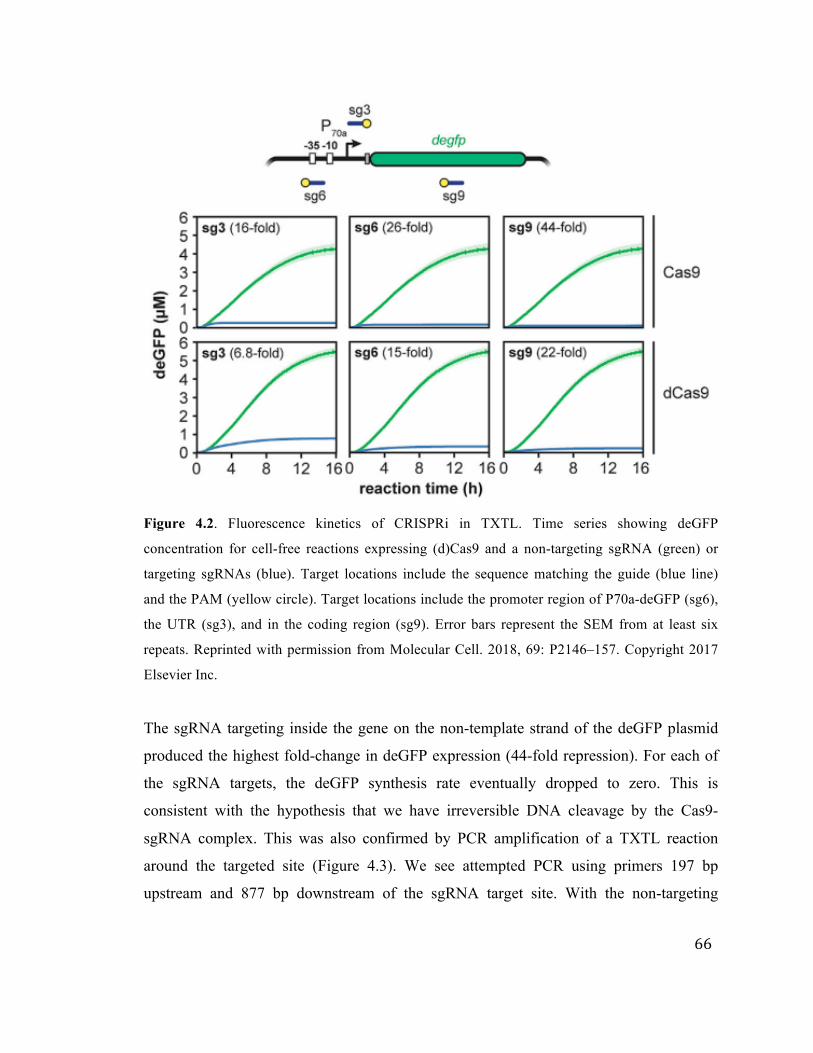
66
Figure 4.2. Fluorescence kinetics of CRISPRi in TXTL. Time series showing deGFP
concentration for cell-free reactions expressing (d)Cas9 and a non-targeting sgRNA (green) or
targeting sgRNAs (blue). Target locations include the sequence matching the guide (blue line)
and the PAM (yellow circle). Target locations include the promoter region of P70a-deGFP (sg6),
the UTR (sg3), and in the coding region (sg9). Error bars represent the SEM from at least six
repeats. Reprinted with permission from Molecular Cell. 2018, 69: P2146–157. Copyright 2017
Elsevier Inc.
The sgRNA targeting inside the gene on the non-template strand of the deGFP plasmid
produced the highest fold-change in deGFP expression (44-fold repression). For each of
the sgRNA targets, the deGFP synthesis rate eventually dropped to zero. This is
consistent with the hypothesis that we have irreversible DNA cleavage by the Cas9-
sgRNA complex. This was also confirmed by PCR amplification of a TXTL reaction
around the targeted site (Figure 4.3). We see attempted PCR using primers 197 bp
upstream and 877 bp downstream of the sgRNA target site. With the non-targeting
67
sgRNA, we see the 1074 bp amplicon, but using the targeting sgRNA, we do not see any
amplicon because the template DNA was cleaved.
Figure 4.3. SpyCas9 cleaves DNA while dSpyCas9 does not cleave DNA. 0.8% agarose gel
showing cleavage of P70a-deGFP by SpyCas9, but not dSpyCas9. A PCR of P70a-deGFP was
performed after three hours of expression in a TXTL reaction, with primers flanking the sg3 site
in P70a-deGFP upstream by 197 bp and downstream by 877 bp. The full PCR product is 1074 bp.
A control with no Cas protein was also performed, showing no cleavage of P70a-deGFP.
Reprinted with permission from Molecular Cell. 2018, 69: P2146–157. Copyright 2017 Elsevier
Inc.
We also tested the catalytically dead version of SpyCas9 (Spy-dCas9). We used
similar methods to test the repression ability of the dCas9-sgRNA complex. We
measured the concentration of deGFP over time in TXTL reactions containing Spy-dCas9
plasmid and the three targeting sgRNA templates and the non-targeting sgRNA template.
We observed consistent deGFP repression, and the strength of the sgRNAs were
consistent using dCas9 relative to using Cas9 (Figure 4.2). The overall endpoint
repression using dCas9 was around two times weaker than using the catalytically active
Cas9. This is at least in part due to there being an expression leak when using dCas9.
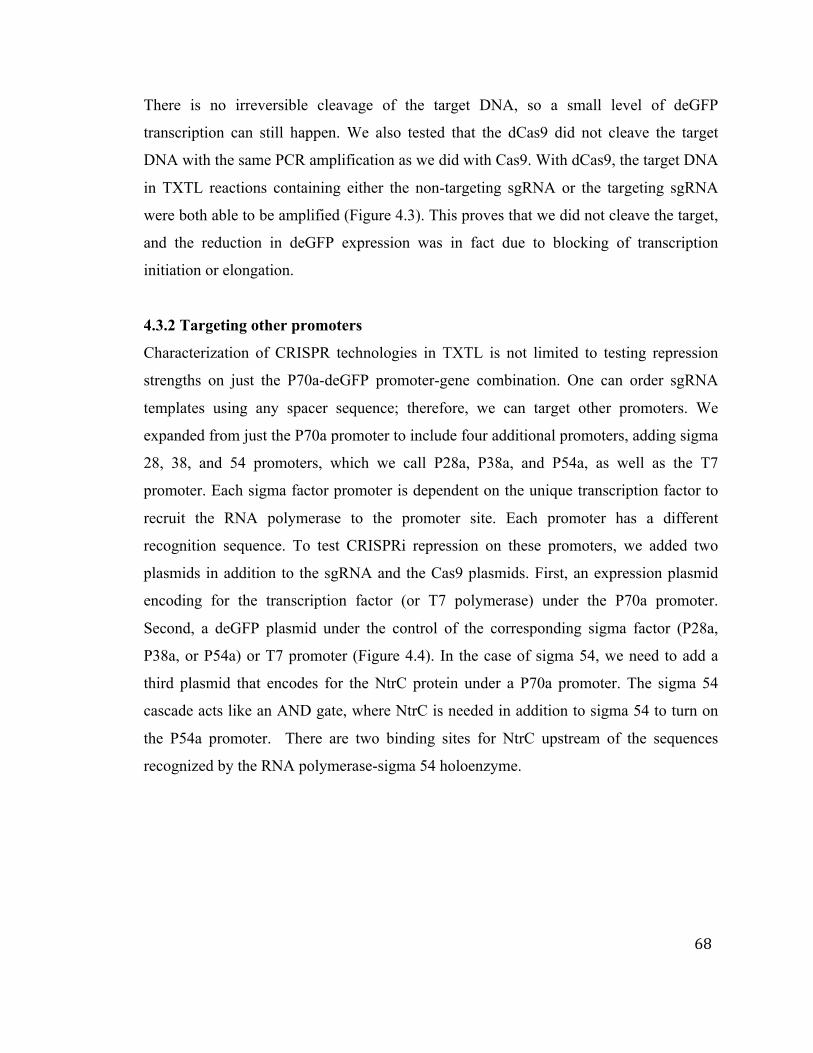
68
There is no irreversible cleavage of the target DNA, so a small level of deGFP
transcription can still happen. We also tested that the dCas9 did not cleave the target
DNA with the same PCR amplification as we did with Cas9. With dCas9, the target DNA
in TXTL reactions containing either the non-targeting sgRNA or the targeting sgRNA
were both able to be amplified (Figure 4.3). This proves that we did not cleave the target,
and the reduction in deGFP expression was in fact due to blocking of transcription
initiation or elongation.
4.3.2 Targeting other promoters
Characterization of CRISPR technologies in TXTL is not limited to testing repression
strengths on just the P70a-deGFP promoter-gene combination. One can order sgRNA
templates using any spacer sequence; therefore, we can target other promoters. We
expanded from just the P70a promoter to include four additional promoters, adding sigma
28, 38, and 54 promoters, which we call P28a, P38a, and P54a, as well as the T7
promoter. Each sigma factor promoter is dependent on the unique transcription factor to
recruit the RNA polymerase to the promoter site. Each promoter has a different
recognition sequence. To test CRISPRi repression on these promoters, we added two
plasmids in addition to the sgRNA and the Cas9 plasmids. First, an expression plasmid
encoding for the transcription factor (or T7 polymerase) under the P70a promoter.
Second, a deGFP plasmid under the control of the corresponding sigma factor (P28a,
P38a, or P54a) or T7 promoter (Figure 4.4). In the case of sigma 54, we need to add a
third plasmid that encodes for the NtrC protein under a P70a promoter. The sigma 54
cascade acts like an AND gate, where NtrC is needed in addition to sigma 54 to turn on
the P54a promoter. There are two binding sites for NtrC upstream of the sequences
recognized by the RNA polymerase-sigma 54 holoenzyme.
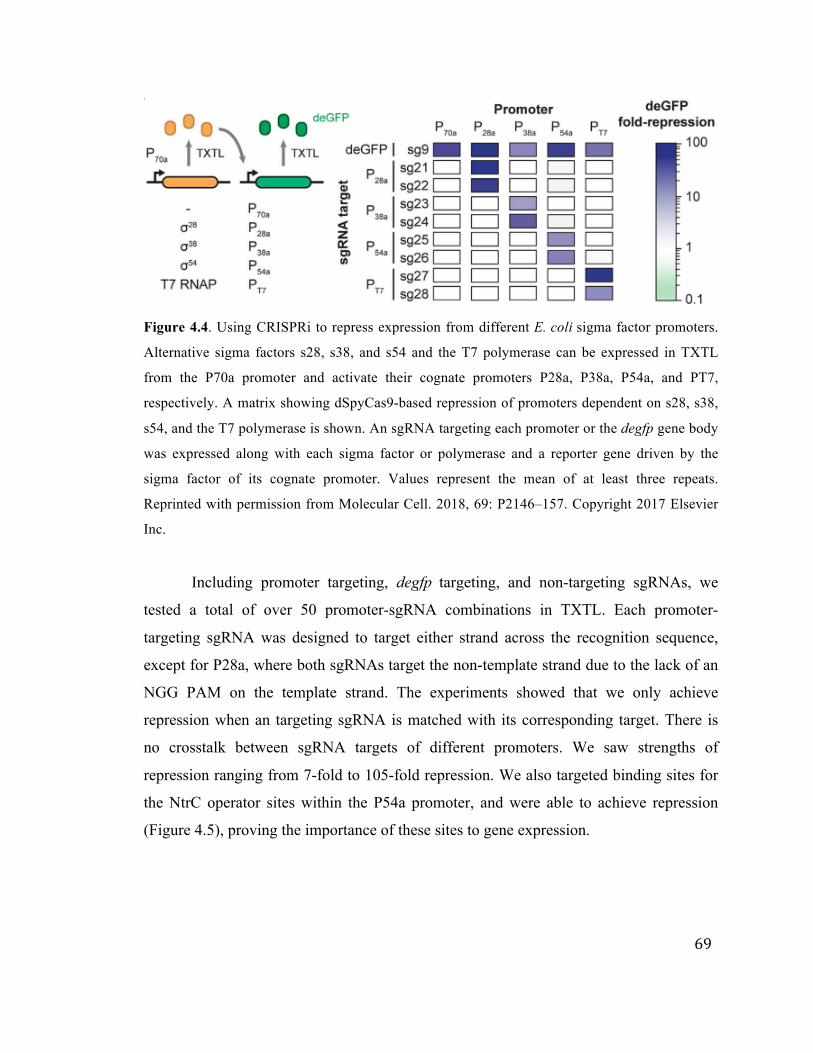
69
Figure 4.4. Using CRISPRi to repress expression from different E. coli sigma factor promoters.
Alternative sigma factors s28, s38, and s54 and the T7 polymerase can be expressed in TXTL
from the P70a promoter and activate their cognate promoters P28a, P38a, P54a, and PT7,
respectively. A matrix showing dSpyCas9-based repression of promoters dependent on s28, s38,
s54, and the T7 polymerase is shown. An sgRNA targeting each promoter or the degfp gene body
was expressed along with each sigma factor or polymerase and a reporter gene driven by the
sigma factor of its cognate promoter. Values represent the mean of at least three repeats.
Reprinted with permission from Molecular Cell. 2018, 69: P2146–157. Copyright 2017 Elsevier
Inc.
Including promoter targeting, degfp targeting, and non-targeting sgRNAs, we
tested a total of over 50 promoter-sgRNA combinations in TXTL. Each promoter-
targeting sgRNA was designed to target either strand across the recognition sequence,
except for P28a, where both sgRNAs target the non-template strand due to the lack of an
NGG PAM on the template strand. The experiments showed that we only achieve
repression when an targeting sgRNA is matched with its corresponding target. There is
no crosstalk between sgRNA targets of different promoters. We saw strengths of
repression ranging from 7-fold to 105-fold repression. We also targeted binding sites for
the NtrC operator sites within the P54a promoter, and were able to achieve repression
(Figure 4.5), proving the importance of these sites to gene expression.
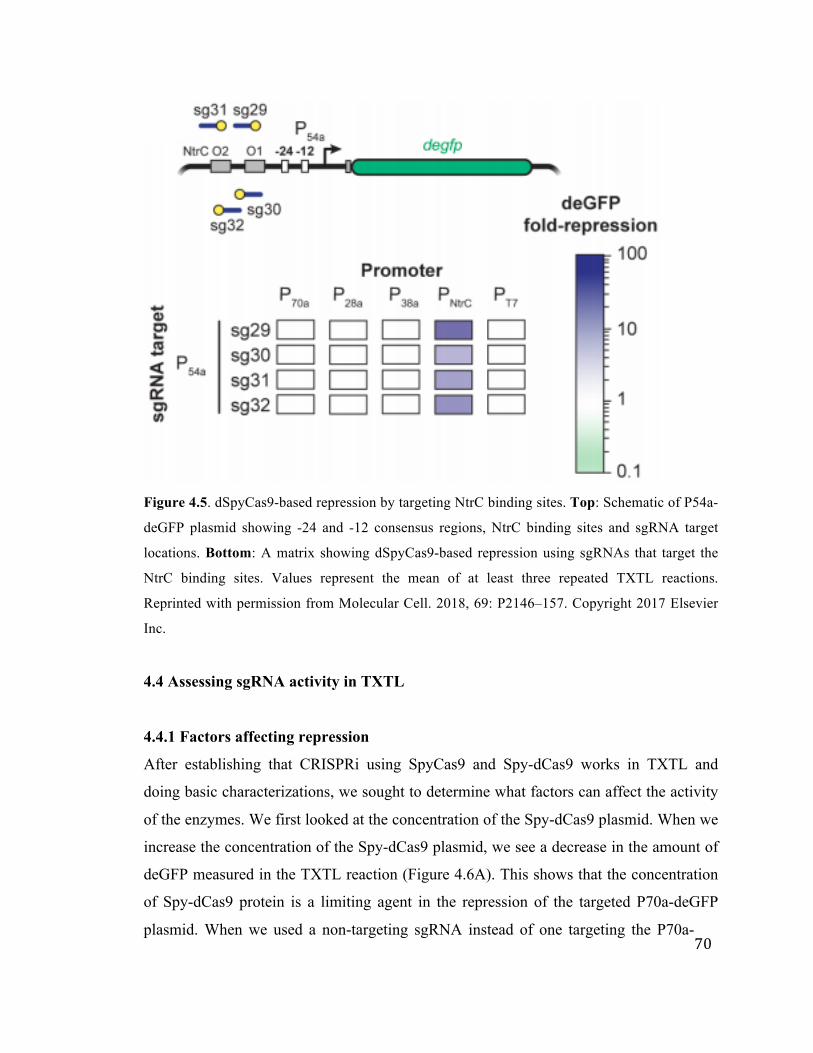
70
Figure 4.5. dSpyCas9-based repression by targeting NtrC binding sites. Top: Schematic of P54a-
deGFP plasmid showing -24 and -12 consensus regions, NtrC binding sites and sgRNA target
locations. Bottom: A matrix showing dSpyCas9-based repression using sgRNAs that target the
NtrC binding sites. Values represent the mean of at least three repeated TXTL reactions.
Reprinted with permission from Molecular Cell. 2018, 69: P2146–157. Copyright 2017 Elsevier
Inc.
4.4 Assessing sgRNA activity in TXTL
4.4.1 Factors affecting repression
After establishing that CRISPRi using SpyCas9 and Spy-dCas9 works in TXTL and
doing basic characterizations, we sought to determine what factors can affect the activity
of the enzymes. We first looked at the concentration of the Spy-dCas9 plasmid. When we
increase the concentration of the Spy-dCas9 plasmid, we see a decrease in the amount of
deGFP measured in the TXTL reaction (Figure 4.6A). This shows that the concentration
of Spy-dCas9 protein is a limiting agent in the repression of the targeted P70a-deGFP
plasmid. When we used a non-targeting sgRNA instead of one targeting the P70a-
71
deGFP plasmid, we saw a slight increase in the production of deGFP. This highlights the
importance of controlling for the total concentration of DNA encoding for sgRNAs when
comparing the activity of multiple sgRNAs.
Figure 4.6. Multiple factors affect dSpyCas9-based repression of reporter production in TXTL.
A. Endpoint deGFP concentrations for TXTL reactions expressing the reporter plasmid, either a
targeting (g6) sgRNA or a non-targeting (g-nt) sgRNA, and varying concentrations of the dCas9
plasmid. Values and error bars represent the average and S.E.M. of at least three replicates. B.
Time course of deGFP-ssrA expression, where the reporter plasmid was targeted by a targeting
sgRNA (blue) or a non-targeting sgRNA (green). The ssrA degron tag is recognized by the
ClpXP protease that results in rapid turnover of the fusion protein. The dark lines and light 4
regions represent the average and S.E.M. of at least three runs. C. Fold-repression for reporter
constructs encoding deGFP or deGFP-ssrA. Fold-repression is the ratio of deGFP concentrations
after 16 hours of reaction for the non-targeting (green) over the targeting (blue) sgRNA. Error
bars represent the S.E.M. from at least three repeated TXTL reactions. Reprinted with permission
from Molecular Cell. 2018, 69: P2146–157. Copyright 2017 Elsevier Inc.
Next, we looked into the impact of using a degradation-tagged version of deGFP
to mirror the effect of dilution in vivo and to potentially increase the endpoint repression
ratios. We added the ssrA tag to the C-terminus of the degfp gene (Figure 4.6B). TXTL
reactions containing the degradation-tagged P70a-deGFP-ssrA plasmid showed an
increase in total Spy-dCas9-based repression due to the reporter turnover (Figure 4.6C).
Because of the zeroth-order of deGFP-ssrA degradation, if the transcription leak is small
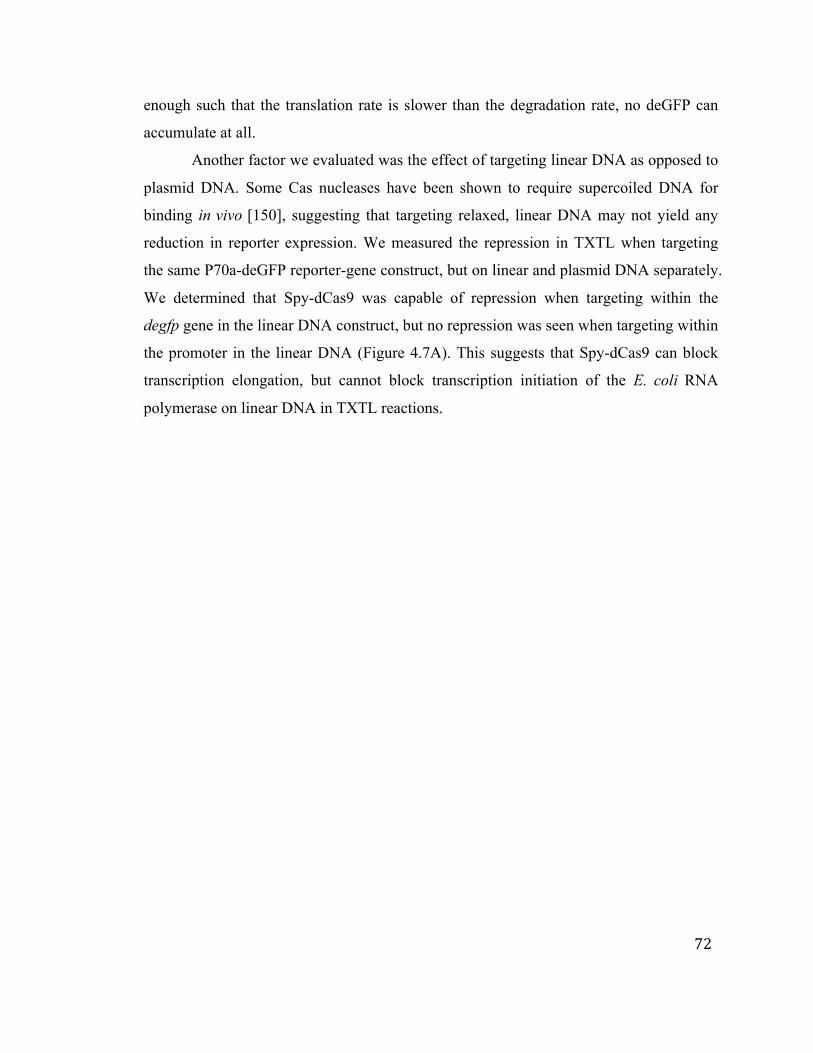
72
enough such that the translation rate is slower than the degradation rate, no deGFP can
accumulate at all.
Another factor we evaluated was the effect of targeting linear DNA as opposed to
plasmid DNA. Some Cas nucleases have been shown to require supercoiled DNA for
binding in vivo [150], suggesting that targeting relaxed, linear DNA may not yield any
reduction in reporter expression. We measured the repression in TXTL when targeting
the same P70a-deGFP reporter-gene construct, but on linear and plasmid DNA separately.
We determined that Spy-dCas9 was capable of repression when targeting within the
degfp gene in the linear DNA construct, but no repression was seen when targeting within
the promoter in the linear DNA (Figure 4.7A). This suggests that Spy-dCas9 can block
transcription elongation, but cannot block transcription initiation of the E. coli RNA
polymerase on linear DNA in TXTL reactions.
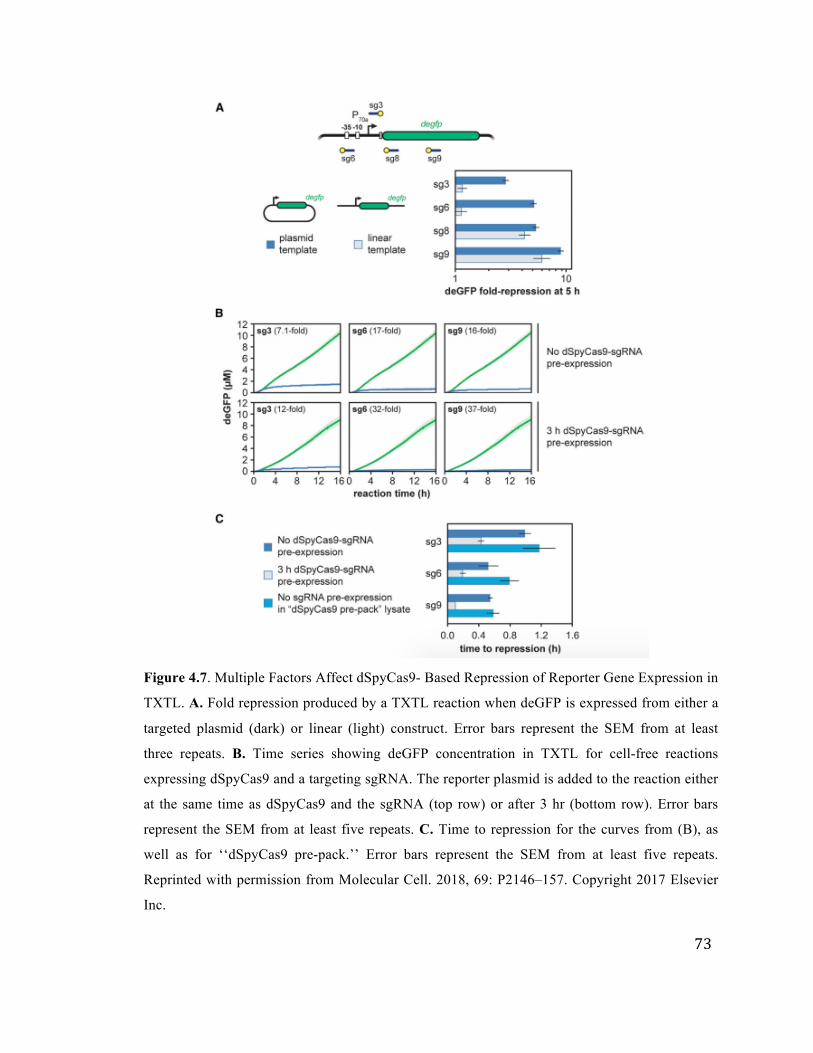
73
Figure 4.7. Multiple Factors Affect dSpyCas9- Based Repression of Reporter Gene Expression in
TXTL. A. Fold repression produced by a TXTL reaction when deGFP is expressed from either a
targeted plasmid (dark) or linear (light) construct. Error bars represent the SEM from at least
three repeats. B. Time series showing deGFP concentration in TXTL for cell-free reactions
expressing dSpyCas9 and a targeting sgRNA. The reporter plasmid is added to the reaction either
at the same time as dSpyCas9 and the sgRNA (top row) or after 3 hr (bottom row). Error bars
represent the SEM from at least five repeats. C. Time to repression for the curves from (B), as
well as for ‘‘dSpyCas9 pre-pack.’’ Error bars represent the SEM from at least five repeats.
Reprinted with permission from Molecular Cell. 2018, 69: P2146–157. Copyright 2017 Elsevier
Inc.
74
One thing we noticed about kinetics of deGFP expression in reactions with Spy-
dCas9 and a targeting sgRNA is that there is a burst of deGFP expression at the
beginning of the TXTL reaction, before we achieve our steady-state repression (Figure
4.7B). This burst of transient deGFP expression is due to the transcription of deGFP
mRNA before the expression and assembly of the Spy-dCas9-sgRNA ribonucleoprotein
complex. To see if we can reduce this transient deGFP mRNA expression, we ran TXTL
reactions where we pre-expressed the Spy-dCas9 and sgRNA for three hours before we
added the P70a-deGFP reporter target plasmid. Three hours should be more than enough
for the expression and assembly of the Spy-dCas9 ribonucleoprotein complex. In these
TXTL reactions, we observed a reduction in the time before the deGFP reporter gene was
repressed (Figure 4.7C). Therefore, we see higher endpoint repression ratios. Measurable
repression was seen as fast as 6 minutes with the pre-expressed Cas9 and sgRNA (Figure
4.7C and 4.8).
Figure 4.8. deGFP production rates from the time series curves from Figure 4.7B, as well as for
TXTL reactions where dSpyCas9 was expressed in cells prior to generating the lysate. Rates are
calculated by two-point numerical differentiation and smoothed with five-point quadratic
polynomial. The dark lines and light regions represent the average and S.E.M. of at least five
runs. Reprinted with permission from Molecular Cell. 2018, 69: P2146–157. Copyright 2017
Elsevier Inc.
75
In addition to expressing dCas9 from a plasmid in TXTL, we can test the Spy-
dCas9 loaded extract, where we expressed the plasmid in the cells prior to generating the
lysate. In this extract, when we do not pre-express the sgRNA, we see similar repression
times as when we do not pre-express the Spy-dCas9 in normal extract. When we pre-
express the sgRNA in the dCas9-loaded extract, the onset of repression happens very
quickly. These results together suggest that the major contributor to the time to repression
is the complex assembly, and not the expression of Spy-dCas9 and the sgRNA or DNA
binding. The data suggests that complex assembly is slow, on the order of 30+ minutes,
and DNA binding is fast, on the order of 5 minutes. This agrees with the timescales of
complex formation and DNA binding in vitro in the presence of non-specific RNA
competition [151], and will be explored further in section 4.6.
4.4.2 E. coli vs. TXTL
The impact of characterizing and prototyping biological technologies in TXTL increases
significantly when it is shown that results strongly correlate between E. coli cells and the
TXTL cell-free system [152]. Therefore, we were determined to characterize the
repression strength of a set of Spy-dCas9 sgRNAs and compare results in vivo versus
results in vitro TXTL. We tested a library of 19 different sgRNAs, targeting different
locations within the deGFP reporter plasmid (Figure 4.9). We chose the specific target
locations to evaluate the strength of targeting the promoter region, the untranslated region,
and within the gene; the impact of a strong PAM, NGG, and a weak PAMS, NAG; and
finally targeting the template strand and the non-template strand of the plasmid.
Literature shows that, in cells, Cas9 recognizes NAG PAMs much more weakly than the
strong NGG PAM [153], [154], and exhibits reduced repression in cells when targeting
the template strand within the gene versus the non-template strand [148], [149]. The
targeting strand has no effect within the promoter region.
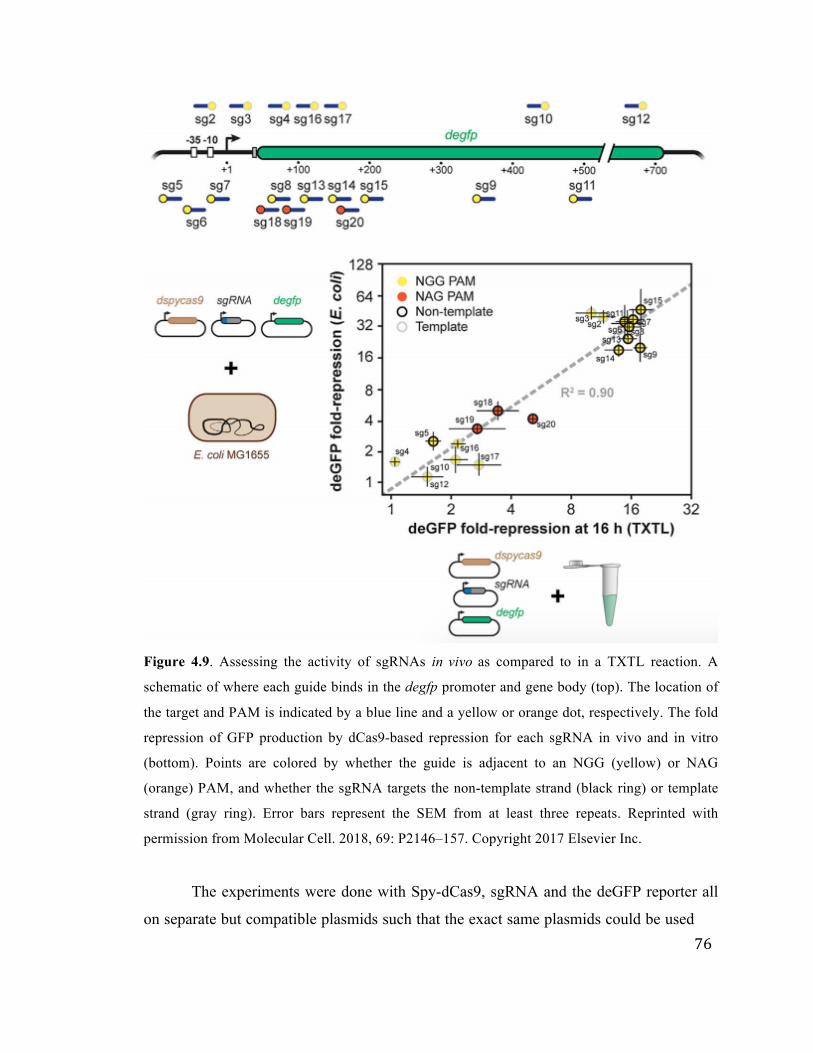
76
Figure 4.9. Assessing the activity of sgRNAs in vivo as compared to in a TXTL reaction. A
schematic of where each guide binds in the degfp promoter and gene body (top). The location of
the target and PAM is indicated by a blue line and a yellow or orange dot, respectively. The fold
repression of GFP production by dCas9-based repression for each sgRNA in vivo and in vitro
(bottom). Points are colored by whether the guide is adjacent to an NGG (yellow) or NAG
(orange) PAM, and whether the sgRNA targets the non-template strand (black ring) or template
strand (gray ring). Error bars represent the SEM from at least three repeats. Reprinted with
permission from Molecular Cell. 2018, 69: P2146–157. Copyright 2017 Elsevier Inc.
The experiments were done with Spy-dCas9, sgRNA and the deGFP reporter all
on separate but compatible plasmids such that the exact same plasmids could be used

77
for parallel testing in E. coli cells and TXTL reactions. Measurements in E. coli were
taken by growing cells for 16 hours at 37°C, shaking at 250 rpm and diluting 1:10,000,
before being added to a 96-well plate and incubated for 20 hours until stationary phase.
Single-point fluorescence and OD600 were then measured. Endpoint fluorescence (at 16
hours of incubation) measurements in TXTL were taken to calculate sgRNA repression
ratios in TXTL. The experiments revealed a strong correlation between TXTL and E. coli
cells (Figure 4.9), with an R^2 value of 0.90. Though the correlation is strong, meaning
relative repression ratios are related, the absolute repression ratios are not identical due to
the differences between continuous cellular processes and batch mode TXTL processes.
In agreement with literature for experiments in cells, we saw greatly reduce repression
rates for targets with the weak NAG PAMs versus the targets with the strong NGG PAMs.
Another trend observed was that repression was weaker when targeting the template
strand within the gene, while targeting either the promoter region, or the non-template
strand within the gene yielded strong repression. The results suggest that TXTL can be
used to accurately predict the strength of an Spy-dCas9 sgRNA in vivo.
4.4.3 Targeting Other Genes
So far, it has only been described here how to measure the activity of sgRNAs targeting
within the region of transcription, either initiation or elongation. However, we have
devised schemes to target virtually any sequence or gene in a plasmid. We can link the
efficiency of dCas9 DNA binding or Cas9 DNA cleavage to the expression of our
reporter, deGFP. For dCas9, we clone a gene of interest that we want to target as either a
transcriptional or translational fusion with degfp. If we put the gene of interest at the 5’
end of the degfp gene, then the RNA polymerase will be blocked during elongation, and
deGFP will not be transcribed. To demonstrate that this scheme works as intended, we
tested one transcriptional fusion, cloning the E. coli mechanosensory channel gene mscl
upstream of degfp, and two translational fusions, cloning mscl and hla (alpha hemolysin
from Staphylococcus aureus) upstream of degfp. The transcriptional fusions have are
cloned like an operon, where they have separate ribosome binding sites, and therefore are
transcribed in together, but translated separately. The translational fusions only have a

78
short linker between them, and are translated together, separated then by a short peptide.
For each fusion, four different targeting sgRNAs were designed to target the non-
template strand of each gene of interest.
We then measured deGFP fluorescence in TXTL reactions containing the dCas9
plasmid, sgRNA DNA template (either targeting or the non-target control), and the
fusion-reporter construct (Figure 4.10). Comparing to the non-target control, we saw a
range of deGFP fold-repression at 16 hours of incubation, with up to almost 10-fold
repression for the mscl transcriptional fusion. We saw efficient repression for each of the
fusion constructs, which demonstrates that this method of measuring sgRNA activity is
functional. We also saw consistency between the transcriptional and translational fusions
of mscl. We used the same set of four targeting sgRNAs to target mscl in each construct.
While, in the transcriptional fusion, we saw slightly increased repression rates compared
to the translational fusion, the relative repression rates between each sgRNA were very
similar. This scheme of measuring sgRNA activity can be generalized to any gene, which
can be cloned at the 5’ end of degfp.
Figure 4.10. Assessing non-gfp targeting sgRNAs used by dCas9. The sequence or gene of
interest is transcriptionally or translationally fused upstream of degfp. Fold repression was
measured in TXTL for four targeting sgRNAs when degfp is fused to mscL or hla. Error bars
represent the SEM from at least three repeats. Reprinted with permission from Molecular Cell.
2018, 69: P2146–157. Copyright 2017 Elsevier Inc.
Our second scheme was devised to measure the activity of Cas9 cleavage on any
DNA target sequence. The desired target sequence is cloned upstream of the degfp
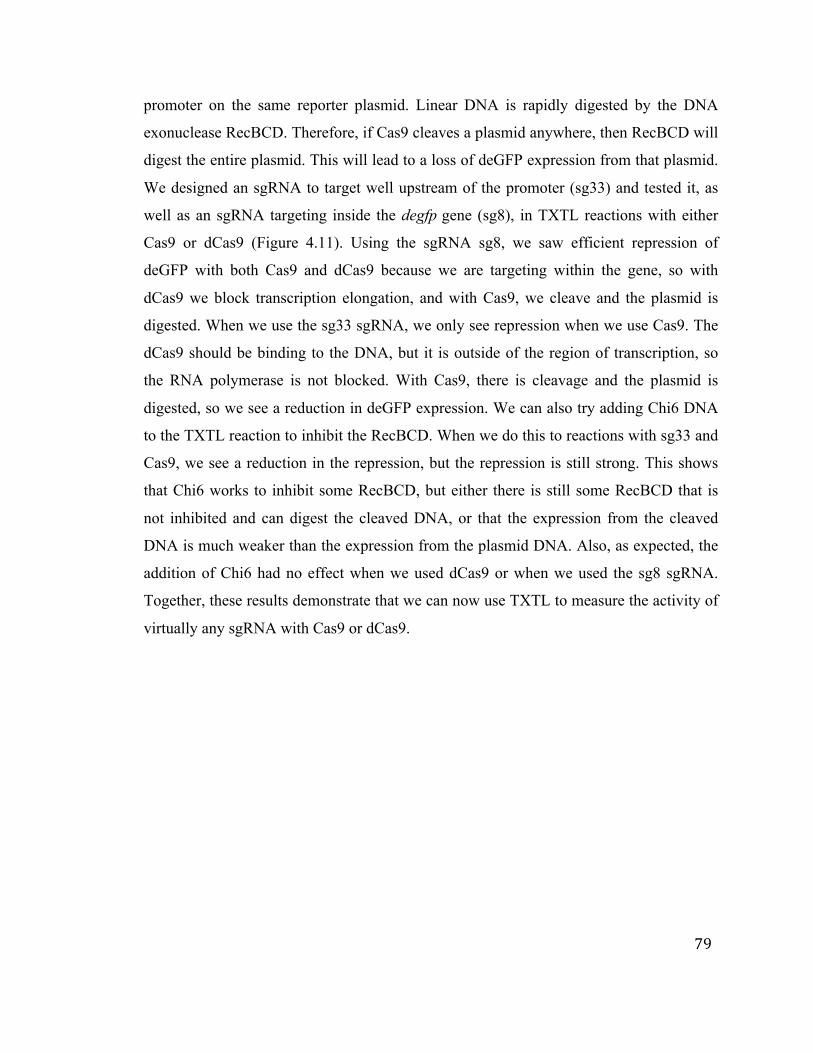
79
promoter on the same reporter plasmid. Linear DNA is rapidly digested by the DNA
exonuclease RecBCD. Therefore, if Cas9 cleaves a plasmid anywhere, then RecBCD will
digest the entire plasmid. This will lead to a loss of deGFP expression from that plasmid.
We designed an sgRNA to target well upstream of the promoter (sg33) and tested it, as
well as an sgRNA targeting inside the degfp gene (sg8), in TXTL reactions with either
Cas9 or dCas9 (Figure 4.11). Using the sgRNA sg8, we saw efficient repression of
deGFP with both Cas9 and dCas9 because we are targeting within the gene, so with
dCas9 we block transcription elongation, and with Cas9, we cleave and the plasmid is
digested. When we use the sg33 sgRNA, we only see repression when we use Cas9. The
dCas9 should be binding to the DNA, but it is outside of the region of transcription, so
the RNA polymerase is not blocked. With Cas9, there is cleavage and the plasmid is
digested, so we see a reduction in deGFP expression. We can also try adding Chi6 DNA
to the TXTL reaction to inhibit the RecBCD. When we do this to reactions with sg33 and
Cas9, we see a reduction in the repression, but the repression is still strong. This shows
that Chi6 works to inhibit some RecBCD, but either there is still some RecBCD that is
not inhibited and can digest the cleaved DNA, or that the expression from the cleaved
DNA is much weaker than the expression from the plasmid DNA. Also, as expected, the
addition of Chi6 had no effect when we used dCas9 or when we used the sg8 sgRNA.
Together, these results demonstrate that we can now use TXTL to measure the activity of
virtually any sgRNA with Cas9 or dCas9.
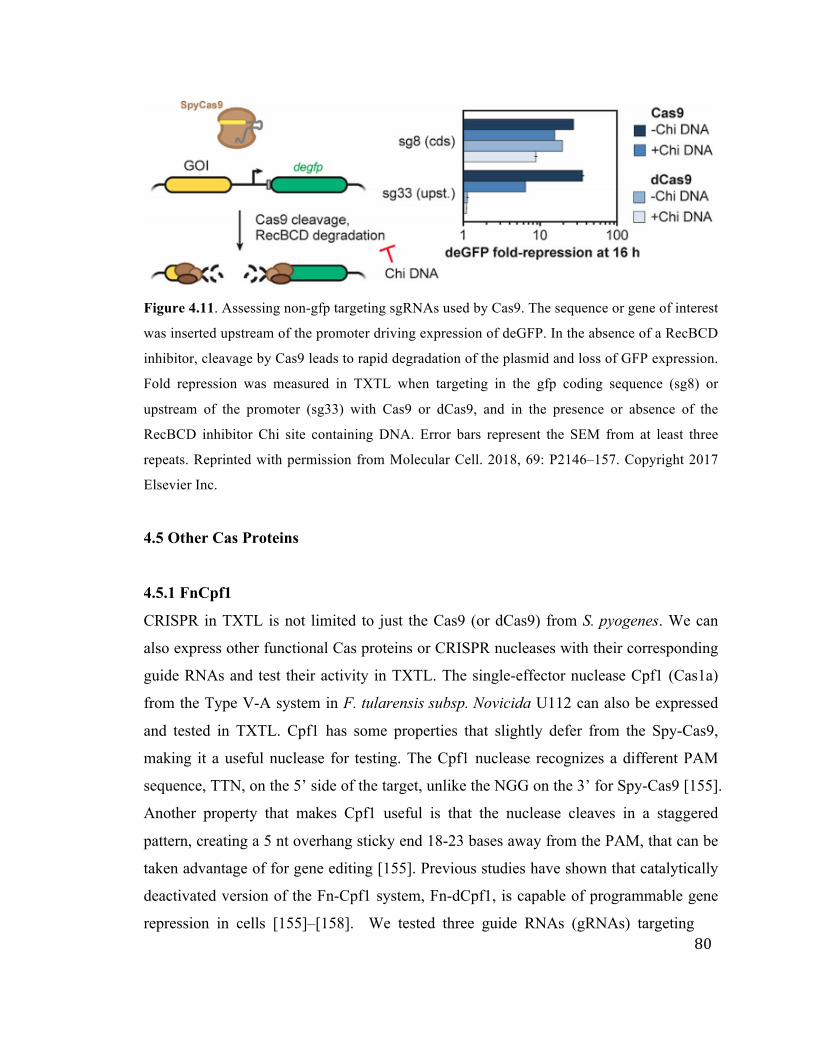
80
Figure 4.11. Assessing non-gfp targeting sgRNAs used by Cas9. The sequence or gene of interest
was inserted upstream of the promoter driving expression of deGFP. In the absence of a RecBCD
inhibitor, cleavage by Cas9 leads to rapid degradation of the plasmid and loss of GFP expression.
Fold repression was measured in TXTL when targeting in the gfp coding sequence (sg8) or
upstream of the promoter (sg33) with Cas9 or dCas9, and in the presence or absence of the
RecBCD inhibitor Chi site containing DNA. Error bars represent the SEM from at least three
repeats. Reprinted with permission from Molecular Cell. 2018, 69: P2146–157. Copyright 2017
Elsevier Inc.
4.5 Other Cas Proteins
4.5.1 FnCpf1
CRISPR in TXTL is not limited to just the Cas9 (or dCas9) from S. pyogenes. We can
also express other functional Cas proteins or CRISPR nucleases with their corresponding
guide RNAs and test their activity in TXTL. The single-effector nuclease Cpf1 (Cas1a)
from the Type V-A system in F. tularensis subsp. Novicida U112 can also be expressed
and tested in TXTL. Cpf1 has some properties that slightly defer from the Spy-Cas9,
making it a useful nuclease for testing. The Cpf1 nuclease recognizes a different PAM
sequence, TTN, on the 5’ side of the target, unlike the NGG on the 3’ for Spy-Cas9 [155].
Another property that makes Cpf1 useful is that the nuclease cleaves in a staggered
pattern, creating a 5 nt overhang sticky end 18-23 bases away from the PAM, that can be
taken advantage of for gene editing [155]. Previous studies have shown that catalytically
deactivated version of the Fn-Cpf1 system, Fn-dCpf1, is capable of programmable gene
repression in cells [155]–[158]. We tested three guide RNAs (gRNAs) targeting

81
different sites in the P70a promoter flanked with the required TTN PAM site (Figure
4.12A).
Figure 4.12. Single Effector Cas Proteins Function Efficiently in TXTL A. Schematic of
dFnCpf1-based repression in TXTL. B. Time series of reporter gene expression in TXTL for cell-
free reactions expressing a catalytically inactive version of the Type V-A Cpf1 nuclease from
Francisella novicida. The protein was expressed along with a non-targeting gRNA (green) or one
of three gRNAs (blue) designed to target the promoter of the deGFP reporter construct. The
reporter plasmid is added to the reaction either at the same time as the construct expressing the
dCpf1 protein and the gRNA (top row) or after 3 hr (bottom row). Error bars represent the SEM
from six repeats. C. deGFP production rates from the time series curves from B for a targeting
guide RNA (blue) or a non-targeting guide RNA (green). Rates are calculated by two-point
numerical differentiation and smoothed with five-point quadratic polynomial. The dark lines and
light regions represent the average and S.E.M. of at least five runs. Reprinted with permission
from Molecular Cell. 2018, 69: P2146–157. Copyright 2017 Elsevier Inc.
C"
B"
A"
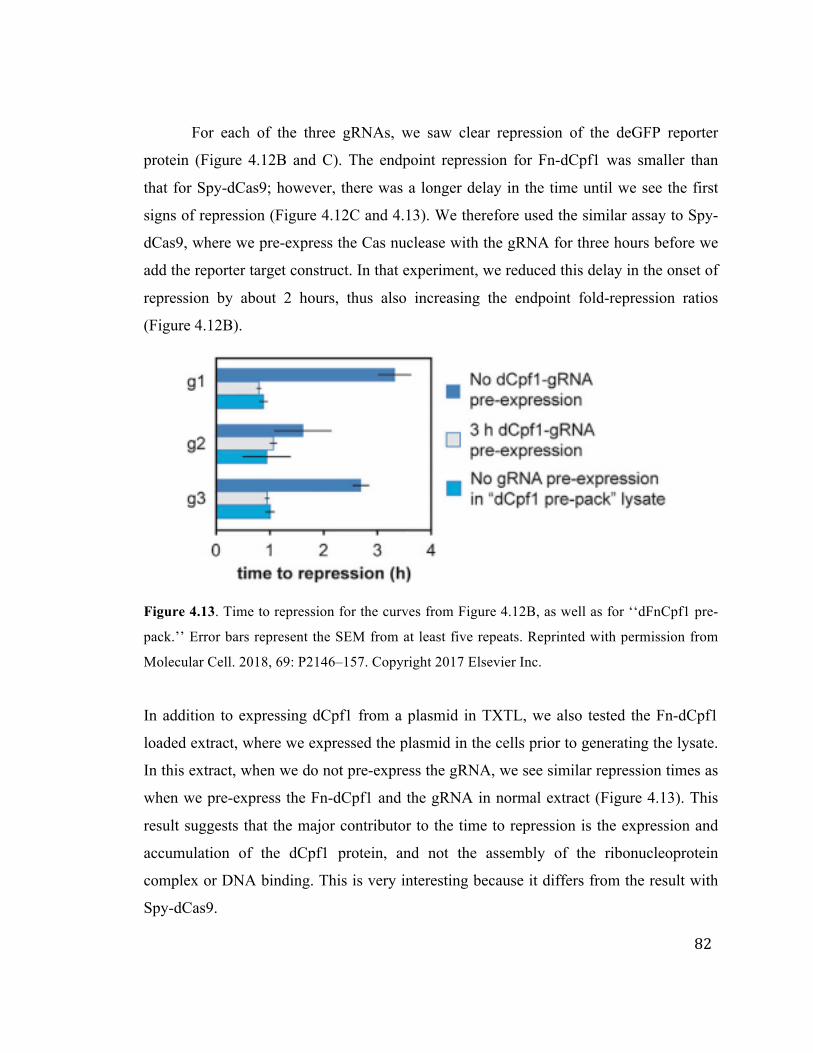
82
For each of the three gRNAs, we saw clear repression of the deGFP reporter
protein (Figure 4.12B and C). The endpoint repression for Fn-dCpf1 was smaller than
that for Spy-dCas9; however, there was a longer delay in the time until we see the first
signs of repression (Figure 4.12C and 4.13). We therefore used the similar assay to Spy-
dCas9, where we pre-express the Cas nuclease with the gRNA for three hours before we
add the reporter target construct. In that experiment, we reduced this delay in the onset of
repression by about 2 hours, thus also increasing the endpoint fold-repression ratios
(Figure 4.12B).
Figure 4.13. Time to repression for the curves from Figure 4.12B, as well as for ‘‘dFnCpf1 pre-
pack.’’ Error bars represent the SEM from at least five repeats. Reprinted with permission from
Molecular Cell. 2018, 69: P2146–157. Copyright 2017 Elsevier Inc.
In addition to expressing dCpf1 from a plasmid in TXTL, we also tested the Fn-dCpf1
loaded extract, where we expressed the plasmid in the cells prior to generating the lysate.
In this extract, when we do not pre-express the gRNA, we see similar repression times as
when we pre-express the Fn-dCpf1 and the gRNA in normal extract (Figure 4.13). This
result suggests that the major contributor to the time to repression is the expression and
accumulation of the dCpf1 protein, and not the assembly of the ribonucleoprotein
complex or DNA binding. This is very interesting because it differs from the result with
Spy-dCas9.
83
4.5.2 E. coli Cascade
Like the Fn-Cpf1, previous studies have shown that Cascade, the Type I-E CRISPR
system from E. coli (EcCascade), is capable of programmable gene repression in bacteria
in the absence of the Cas3 endonuclease, which removes the ability of EcCascade to
cleave the DNA target [155]–[158]. EcCascade is a multi-subunit complex: five Cas
proteins form the effector complex and bind to a single crRNA, making it more difficult
to characterize [136], [155]. It is also the most abundant system type in nature. We
designed and tested a set of three repeat-spacer-repeat arrays to target distinct sites within
the P70a promoter, each site flanked by the required PAM. A repeat-spacer-repeat is
effectively the EcCascade version of the gRNA. To TXTL reactions, we added the
EcCascade DNA, a repeat-spacer-repeat CRISPR array DNA, and the target reporter
plasmid (Figure 4.14A).
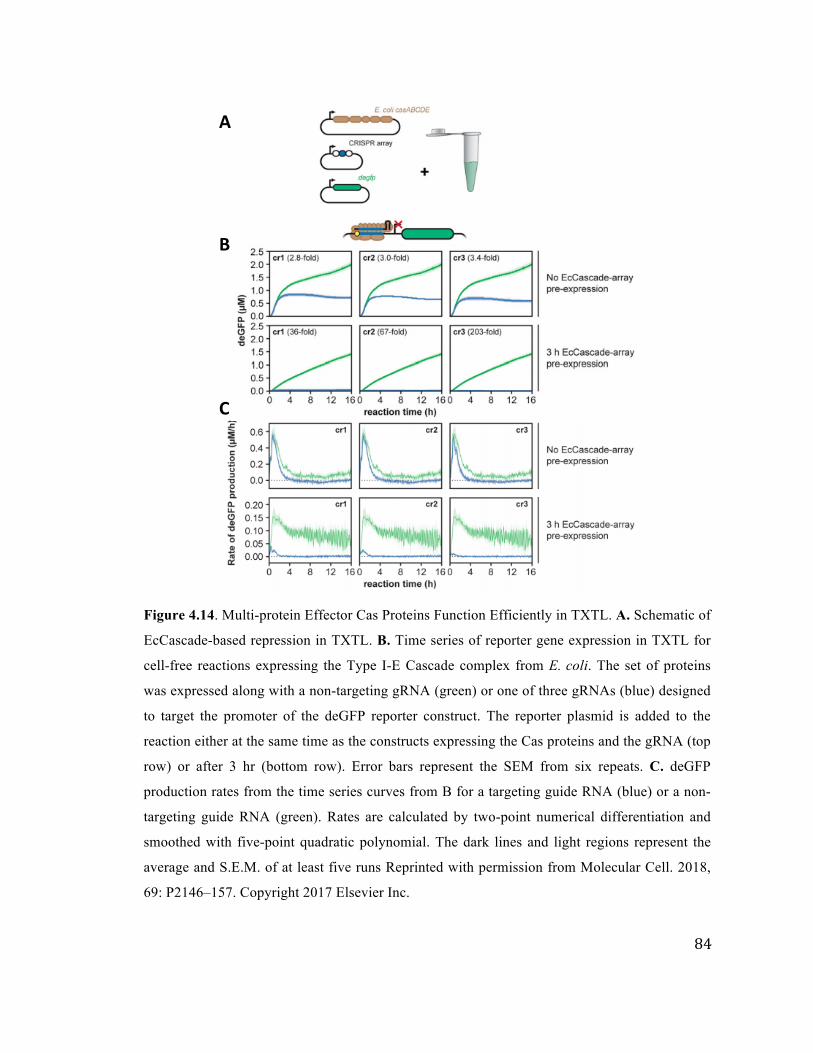
84
Figure 4.14. Multi-protein Effector Cas Proteins Function Efficiently in TXTL. A. Schematic of
EcCascade-based repression in TXTL. B. Time series of reporter gene expression in TXTL for
cell-free reactions expressing the Type I-E Cascade complex from E. coli. The set of proteins
was expressed along with a non-targeting gRNA (green) or one of three gRNAs (blue) designed
to target the promoter of the deGFP reporter construct. The reporter plasmid is added to the
reaction either at the same time as the constructs expressing the Cas proteins and the gRNA (top
row) or after 3 hr (bottom row). Error bars represent the SEM from six repeats. C. deGFP
production rates from the time series curves from B for a targeting guide RNA (blue) or a non-
targeting guide RNA (green). Rates are calculated by two-point numerical differentiation and
smoothed with five-point quadratic polynomial. The dark lines and light regions represent the
average and S.E.M. of at least five runs Reprinted with permission from Molecular Cell. 2018,
69: P2146–157. Copyright 2017 Elsevier Inc.
A"
C"
B"
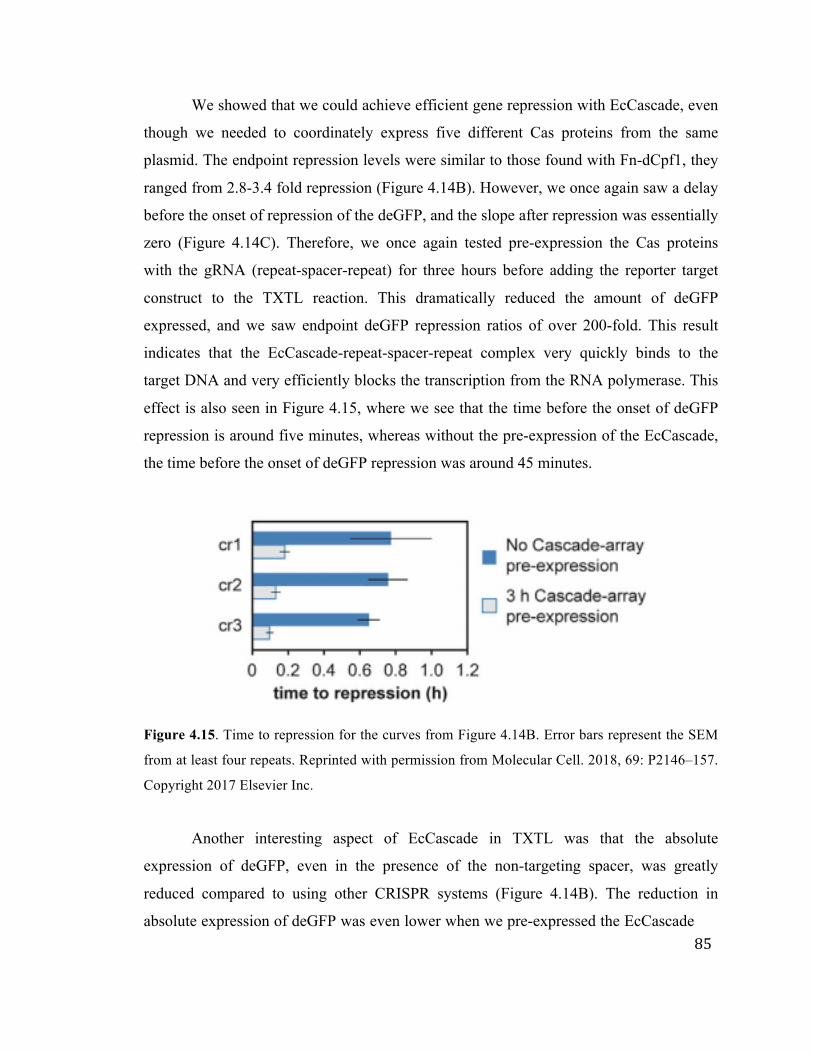
85
We showed that we could achieve efficient gene repression with EcCascade, even
though we needed to coordinately express five different Cas proteins from the same
plasmid. The endpoint repression levels were similar to those found with Fn-dCpf1, they
ranged from 2.8-3.4 fold repression (Figure 4.14B). However, we once again saw a delay
before the onset of repression of the deGFP, and the slope after repression was essentially
zero (Figure 4.14C). Therefore, we once again tested pre-expression the Cas proteins
with the gRNA (repeat-spacer-repeat) for three hours before adding the reporter target
construct to the TXTL reaction. This dramatically reduced the amount of deGFP
expressed, and we saw endpoint deGFP repression ratios of over 200-fold. This result
indicates that the EcCascade-repeat-spacer-repeat complex very quickly binds to the
target DNA and very efficiently blocks the transcription from the RNA polymerase. This
effect is also seen in Figure 4.15, where we see that the time before the onset of deGFP
repression is around five minutes, whereas without the pre-expression of the EcCascade,
the time before the onset of deGFP repression was around 45 minutes.
Figure 4.15. Time to repression for the curves from Figure 4.14B. Error bars represent the SEM
from at least four repeats. Reprinted with permission from Molecular Cell. 2018, 69: P2146–157.
Copyright 2017 Elsevier Inc.
Another interesting aspect of EcCascade in TXTL was that the absolute
expression of deGFP, even in the presence of the non-targeting spacer, was greatly
reduced compared to using other CRISPR systems (Figure 4.14B). The reduction in
absolute expression of deGFP was even lower when we pre-expressed the EcCascade
86
for three hours. We tested adding pure recombinant eGFP to TXTL reaction expressing
EcCascade and two controls, one expressing Spy-Cas9 and the other expressing a no-
nuclease control (Figure 4.16). The reactions with EcCascade resulted in only a slight
reduction in the fluorescence of the recombinant eGFP as compared to the two controls.
We also tested the three conditions expressing deGFP from a plasmid instead of adding
the reGFP. In these cases, the reactions with EcCascade (and no gRNA) had greatly
reduced fluorescence of deGFP. Together, these results show that EcCascade does not
just impact the stability or fluorescence of GFP, but it inhibits the expression of deGFP.
When testing CRISPR systems in TXTL, it is therefore beneficial to explore the effect of
adding just the Cas proteins without a gRNA in order to be able to see the general effect
on gene expression, and to be able to quantify the effective repression.
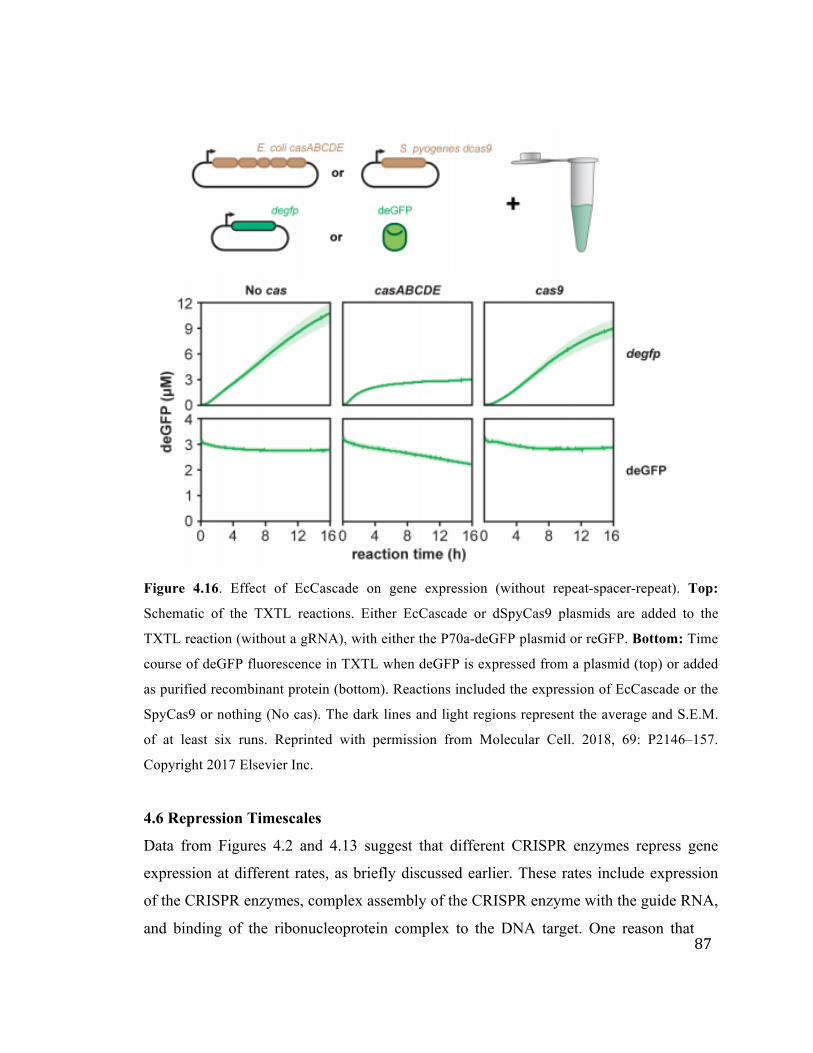
87
Figure 4.16. Effect of EcCascade on gene expression (without repeat-spacer-repeat). Top:
Schematic of the TXTL reactions. Either EcCascade or dSpyCas9 plasmids are added to the
TXTL reaction (without a gRNA), with either the P70a-deGFP plasmid or reGFP. Bottom: Time
course of deGFP fluorescence in TXTL when deGFP is expressed from a plasmid (top) or added
as purified recombinant protein (bottom). Reactions included the expression of EcCascade or the
SpyCas9 or nothing (No cas). The dark lines and light regions represent the average and S.E.M.
of at least six runs. Reprinted with permission from Molecular Cell. 2018, 69: P2146–157.
Copyright 2017 Elsevier Inc.
4.6 Repression Timescales
Data from Figures 4.2 and 4.13 suggest that different CRISPR enzymes repress gene
expression at different rates, as briefly discussed earlier. These rates include expression
of the CRISPR enzymes, complex assembly of the CRISPR enzyme with the guide RNA,
and binding of the ribonucleoprotein complex to the DNA target. One reason that

88
TXTL is suitable to test these different rates is that we can spike any DNA into a reaction
at any time. This allows us to preincubate reactions with certain DNAs to accumulate a
certain RNA or protein before a different construct is added and accumulates. Another
rate relating to Spy-dCas9 ribonucleoprotein complex is the assembly with a tracrRNA
and a crRNA versus just an sgRNA. In TXTL reactions, we tested four different
conditions. To TXTL reactions with dCas9 loaded lysate and P70a-deGFP plasmid, we
either added tracrRNA and crRNA (tr+cr) or sgRNA (sg) targeting the same location
(pos6) on the P70a promoter, and then also varied the preincubation time from either no
preincubation or two hour preincubation (pre) (Figure 4.17A). For reactions with the two
hour preincubation, the guide RNA templates were added for two hours before the
addition of the reporter target construct.
A
B
Figure 4.17. Repression timescale for dCas9. A) Fluorescence kinetics for TXTL reactions in
dCas9 loaded extract, adding sgRNA (sg) or tracrRNA + crRNA (tr+cr) for either 0 or 2 hours
(pre) before adding the P70a-deGFP reporter target plasmid. B) deGFP synthesis rates for the
reactions from A. This shows the slopes of the kinetics.
We can look at the different steady-state slopes of deGFP expression, and also at
the time at which we reach the steady-state slope (Figure 4.17B). The data shows that
when we use the natural tracrRNA and the crRNA, we reach a steady-state slope of about
0.015 µM/h deGFP synthesis rate, whereas if we use the synthetic sgRNA, we reach a
steady-state slope of about 0.004 µM/h deGFP synthesis rate. Therefore, there is a
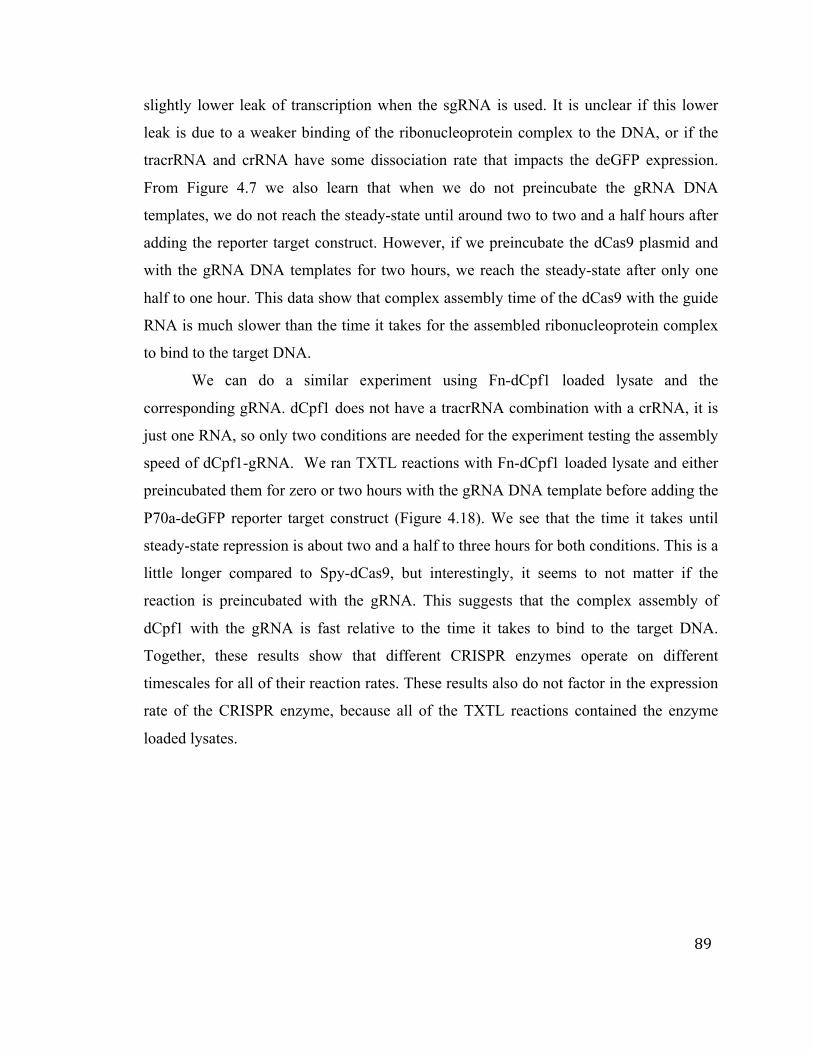
89
slightly lower leak of transcription when the sgRNA is used. It is unclear if this lower
leak is due to a weaker binding of the ribonucleoprotein complex to the DNA, or if the
tracrRNA and crRNA have some dissociation rate that impacts the deGFP expression.
From Figure 4.7 we also learn that when we do not preincubate the gRNA DNA
templates, we do not reach the steady-state until around two to two and a half hours after
adding the reporter target construct. However, if we preincubate the dCas9 plasmid and
with the gRNA DNA templates for two hours, we reach the steady-state after only one
half to one hour. This data show that complex assembly time of the dCas9 with the guide
RNA is much slower than the time it takes for the assembled ribonucleoprotein complex
to bind to the target DNA.
We can do a similar experiment using Fn-dCpf1 loaded lysate and the
corresponding gRNA. dCpf1 does not have a tracrRNA combination with a crRNA, it is
just one RNA, so only two conditions are needed for the experiment testing the assembly
speed of dCpf1-gRNA. We ran TXTL reactions with Fn-dCpf1 loaded lysate and either
preincubated them for zero or two hours with the gRNA DNA template before adding the
P70a-deGFP reporter target construct (Figure 4.18). We see that the time it takes until
steady-state repression is about two and a half to three hours for both conditions. This is a
little longer compared to Spy-dCas9, but interestingly, it seems to not matter if the
reaction is preincubated with the gRNA. This suggests that the complex assembly of
dCpf1 with the gRNA is fast relative to the time it takes to bind to the target DNA.
Together, these results show that different CRISPR enzymes operate on different
timescales for all of their reaction rates. These results also do not factor in the expression
rate of the CRISPR enzyme, because all of the TXTL reactions contained the enzyme
loaded lysates.
90
A
B
Figure 4.18. Repression timescale for dCpf1. A) Fluorescence kinetics for TXTL reactions in
dCpf1 loaded extract, adding gRNA either 0 or 2 hours before adding the P70a-deGFP reporter
target plasmid. B) deGFP synthesis rates for the reactions from A. This shows the slopes of the
kinetics.
4.7 Anti-CRISPR Proteins
Anti-CRISPR proteins are the phages way to fight back against bacterial and archaea
CRISPR systems. Recent discoveries have show anti-CRISPR proteins that bind and
inhibit EcCascade and Cas3 from Type I-E and Type I-F CRISPR-Cas systems and Cas9
from Type II-A and II-C systems, thus raising the potential for their use to tightly control
genome editing and gene regulation [159]–[162]. Different anti-CRISPR proteins inhibit
different parts of CRISPR systems. For example, some anti-CRISPR proteins bind to a
Cas protein, blocking its ability to target and bind to DNA, some inhibit Cas proteins that
gather potential new spacer sequences, and some bind to Cas proteins and inhibit their
ability to cleave a bound target DNA [160], [163].
The discovery of new CRISPR systems means that there is likely more and more
sets of anti-CRISPR protein that battle against these CRISPR systems. However, the anti-
CRISPR proteins discovered so far do not have many explicit features in common with
each other, which makes their discovery and identification much more difficult. TXTL
offers a platform for the rapid and scalable characterization of potential new anti-CRISPR
proteins. Testing a library of anti-CRISPR proteins in vivo is very taxing, requiring
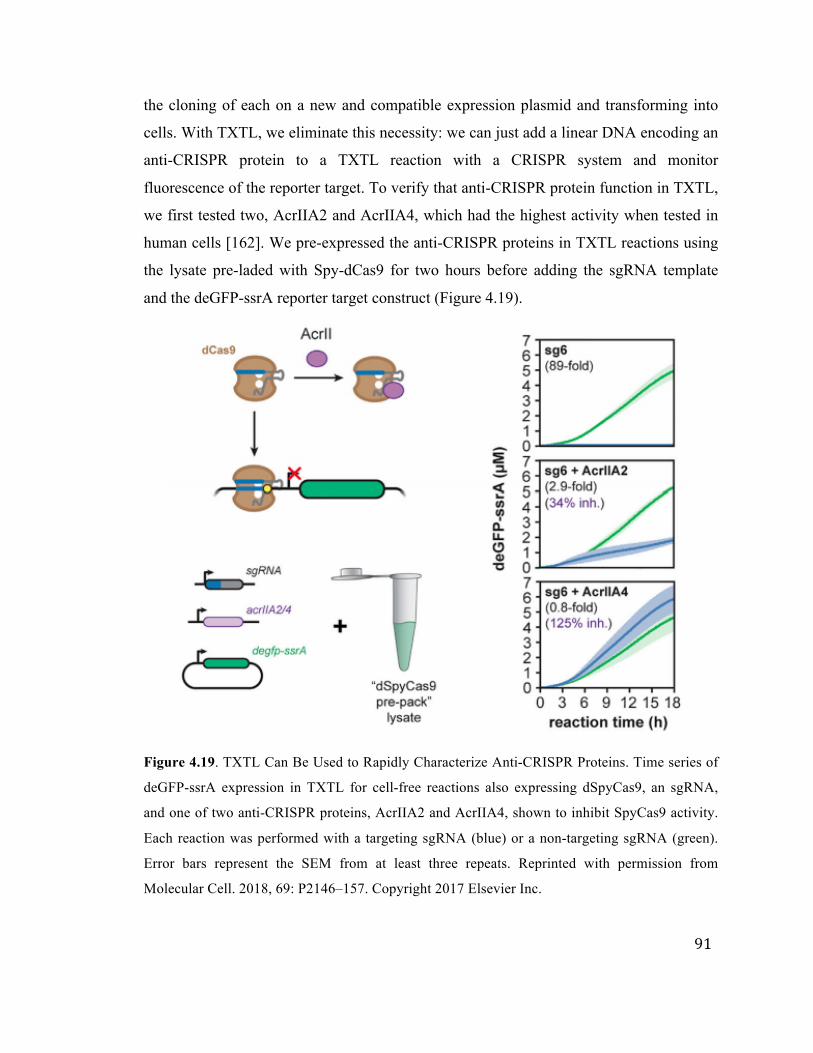
91
the cloning of each on a new and compatible expression plasmid and transforming into
cells. With TXTL, we eliminate this necessity: we can just add a linear DNA encoding an
anti-CRISPR protein to a TXTL reaction with a CRISPR system and monitor
fluorescence of the reporter target. To verify that anti-CRISPR protein function in TXTL,
we first tested two, AcrIIA2 and AcrIIA4, which had the highest activity when tested in
human cells [162]. We pre-expressed the anti-CRISPR proteins in TXTL reactions using
the lysate pre-laded with Spy-dCas9 for two hours before adding the sgRNA template
and the deGFP-ssrA reporter target construct (Figure 4.19).
Figure 4.19. TXTL Can Be Used to Rapidly Characterize Anti-CRISPR Proteins. Time series of
deGFP-ssrA expression in TXTL for cell-free reactions also expressing dSpyCas9, an sgRNA,
and one of two anti-CRISPR proteins, AcrIIA2 and AcrIIA4, shown to inhibit SpyCas9 activity.
Each reaction was performed with a targeting sgRNA (blue) or a non-targeting sgRNA (green).
Error bars represent the SEM from at least three repeats. Reprinted with permission from
Molecular Cell. 2018, 69: P2146–157. Copyright 2017 Elsevier Inc.

92
Both of the tested anti-CRISPR proteins inhibited the ability of the Spy-dCas9-
sgRNA complex to repress the expression of the deGFP-ssrA. The sgRNA used (sg6)
targets within the P70a promoter. The fluorescence kinetics of expression are shown,
where there is almost no expression when only the CRISPR system is present and
repression is strong. When AcrIIA2 is added, there is some expression of the deGFP-ssrA
and it is able to accumulate. With AcrIIA2, we see a 34% inhibition of the repression (the
endpoint at 18h is 34% of that when using a non-targeting sgRNA). When we add
AcrIIA4 to the reactions, we see the highest inhibition of the Spy-dCas9 system. Here,
we see inhibition of 125% at 18 h of incubation, although it is still within error bars of the
non-targeting trial. These results agree with prior measurements done in E. coli [162].
Having shown that anti-CRISPR proteins are functional in TXTL, we were able to
expand the library of anti-CRISPR proteins to test, demonstrating the scalability of using
TXTL for rapid characterization of anti-CRISPR proteins.
We tested a full panel of 24 anti-CRISPR proteins. The panel included seven anti-
CRISPR proteins that have been reported in literature from defined classes, like AcrIIA2
and AcrIIC1 [160], [164]. The panel also included up to four homologs for each of the
reported anti-CRISPR proteins. The panel of anti-CRISPR proteins was tested against
five different catalytically active versions of Cas9 nucleases: the Type II_A Spy-Cas9;
the VQR variant of the Spy-Cas9, which recognized the alternative PAM sequence NGA
[165]; the Type II-A CRISPR1 Cas9 from Streptococcus thermophilus, labeled Sth1-
Cas9; the Type II-C Cas9 from Neisseria meningitidis, labeled Nme-Cas9; and finally the
Type II-C Cas9 from Campylobacter jejuni, labeled Cje-Cas9. With all of the different
anti-CRISPR proteins and Cas nucleases, we tested a total of 120 different combinations
(Figure 4.20).
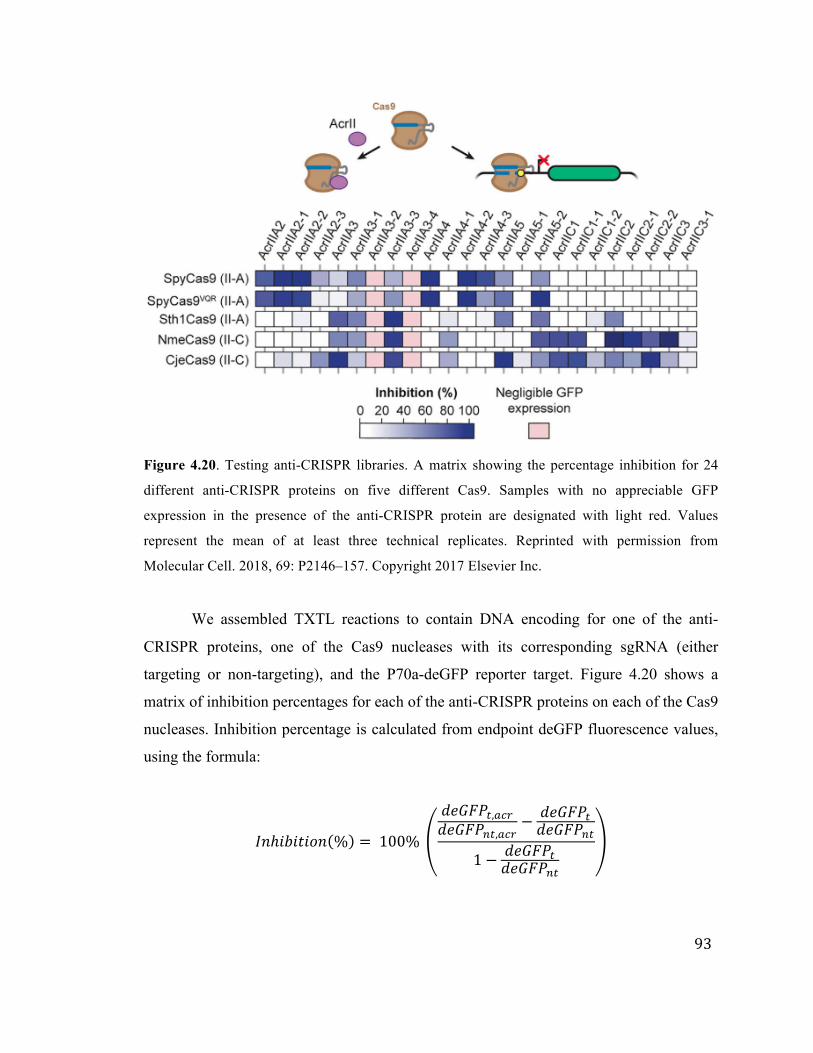
93
Figure 4.20. Testing anti-CRISPR libraries. A matrix showing the percentage inhibition for 24
different anti-CRISPR proteins on five different Cas9. Samples with no appreciable GFP
expression in the presence of the anti-CRISPR protein are designated with light red. Values
represent the mean of at least three technical replicates. Reprinted with permission from
Molecular Cell. 2018, 69: P2146–157. Copyright 2017 Elsevier Inc.
We assembled TXTL reactions to contain DNA encoding for one of the anti-
CRISPR proteins, one of the Cas9 nucleases with its corresponding sgRNA (either
targeting or non-targeting), and the P70a-deGFP reporter target. Figure 4.20 shows a
matrix of inhibition percentages for each of the anti-CRISPR proteins on each of the Cas9
nucleases. Inhibition percentage is calculated from endpoint deGFP fluorescence values,
using the formula:
𝐼𝑛ℎ𝑖𝑏𝑖𝑡𝑖𝑜𝑛 % = 100%
𝑑𝑒𝐺𝐹𝑃!,!"#𝑑𝑒𝐺𝐹𝑃!",!"#
− 𝑑𝑒𝐺𝐹𝑃!𝑑𝑒𝐺𝐹𝑃!"
1− 𝑑𝑒𝐺𝐹𝑃!𝑑𝑒𝐺𝐹𝑃!"
94
where the subscript “t” is for targeting sgRNA, “nt” is for non-targeting sgRNA, and “acr”
is including the anti-CRISPR proteins, and the lack of “acr” means that the reaction was
without the anti-CRISPR protein.
We were able to discern a variety of different activities and specificities for the
anti-CRISPR proteins. Most of the anti-CRISPR proteins inhibited a single nuclease or
subtype of nucleases, such as AcriIIA2 and two of its homologs inhibited only the Spy-
Cas9 and the VQR variant, and AcrIIC1 and one of its homologs inhibited both of the
Type II-C Cas9 nucleases. This results agrees with recent the published results of
AcrIIC1 [166]. Some anti-CRISPR proteins seemed to possibly differentiate between the
two variants of the Spy-Cas9. AcrIIA2-3 and AcrIIA4-3 showed stronger inhibition of
Spy-Cas9 than the VQR variant, while AcrIIA5-2 showed stronger inhibition of the VQR
variant.
One unexpected result was that some anti-CRISPR proteins could inhibit beyond
their CRISPR subtype. For example, AcrIIA3 and AcrIIC2 both inhibited the activity of
the Type II-A Sth1-Cas9 and the two Type II-C Cas9 nucleases. Also, AcrIIA5 was able
to inhibit each of the Type II-A nucleases, as well as the Type II-C Cje-Cas9. AcrIIA3,
and two of its homologs, as well as the AcrIIA5-2 homolog inhibited all of the tested
nucleases to some extent. However, these nucleases decreased the expression of deGFP
even in the presence of the non-targeting sgRNA, so their effect an anti-CRISPR proteins
is non conclusive because they also may reduce the expression of the Cas9 nucleases and
the sgRNA. More experiments could be done with these anti-CRISPR proteins and Cas9
nucleases to verify the extent of their inhibition against CRISPR nucleases. Further,
AcrIIC2 and AcrIIC3 demonstrated much stronger inhibitions of Nme-Cas9 than Cje-
Cas9 of the Type II-C nucleases, which agrees with recent in vitro cleavage experiments
[166].
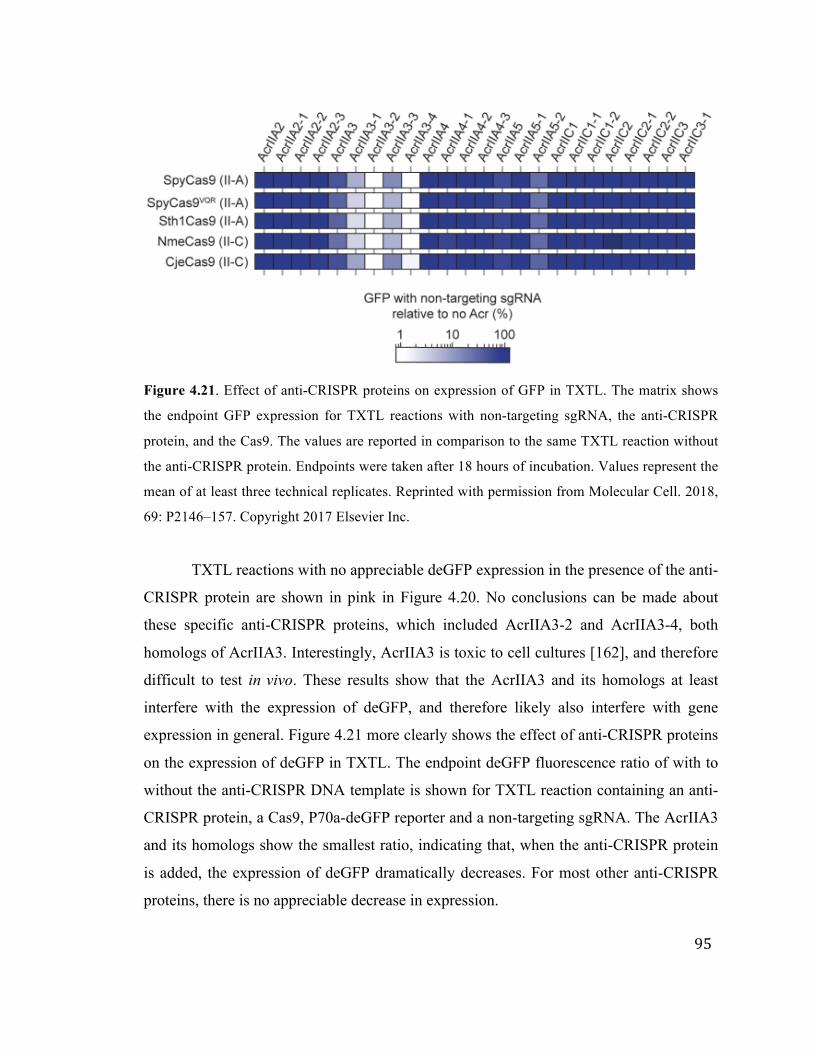
95
Figure 4.21. Effect of anti-CRISPR proteins on expression of GFP in TXTL. The matrix shows
the endpoint GFP expression for TXTL reactions with non-targeting sgRNA, the anti-CRISPR
protein, and the Cas9. The values are reported in comparison to the same TXTL reaction without
the anti-CRISPR protein. Endpoints were taken after 18 hours of incubation. Values represent the
mean of at least three technical replicates. Reprinted with permission from Molecular Cell. 2018,
69: P2146–157. Copyright 2017 Elsevier Inc.
TXTL reactions with no appreciable deGFP expression in the presence of the anti-
CRISPR protein are shown in pink in Figure 4.20. No conclusions can be made about
these specific anti-CRISPR proteins, which included AcrIIA3-2 and AcrIIA3-4, both
homologs of AcrIIA3. Interestingly, AcrIIA3 is toxic to cell cultures [162], and therefore
difficult to test in vivo. These results show that the AcrIIA3 and its homologs at least
interfere with the expression of deGFP, and therefore likely also interfere with gene
expression in general. Figure 4.21 more clearly shows the effect of anti-CRISPR proteins
on the expression of deGFP in TXTL. The endpoint deGFP fluorescence ratio of with to
without the anti-CRISPR DNA template is shown for TXTL reaction containing an anti-
CRISPR protein, a Cas9, P70a-deGFP reporter and a non-targeting sgRNA. The AcrIIA3
and its homologs show the smallest ratio, indicating that, when the anti-CRISPR protein
is added, the expression of deGFP dramatically decreases. For most other anti-CRISPR
proteins, there is no appreciable decrease in expression.
96
4.8 PAM determination
Protospacer adjacent motifs are crucial to the functionality of Type I and Type II
CIRSPR-Cas systems. Without these motifs, the host CRISPR systems would not be able
to differentiate between its own genome and the invading DNAs. Therefore, the
determination of PAM sequences is very important for the characterization of a CRISPR
nuclease. There are many experimental methods that have been developed to determine
PAM sequences; however, they always rely on assays done in cells that require culturing
and transforming, or in vitro assays that require protein purification steps [167], [168].
These assays can take up days to weeks to perform, due to working with live cells. TXTL
offers a means to determine PAM sequences much more quickly. By using a similar
assay to prior published in vitro and in vivo DNA cleavage assays [154], [155], we can
dramatically decrease the time it takes to determine PAM sequences.
For PAM determination in TXTL, the assay uses a library of potential PAM
sequences flanking a site targeted by an expressed guide RNA and Cas nuclease. (Figure
4.22A). The PAM library is incubated in a TXTL with DNA encoding the gRNA and the
Cas nuclease, then after expression, the ribonucleoprotein complex cleaves the target
DNA with functional PAM sites flanking the target sequence. The pool of uncleaved
target sequences is then amplified by PCR and sequenced by next-generation sequencing
techniques. We also sequence the same PAM library without the addition of the guide
RNA and Cas nuclease DNA, so we have a control group that was not cleaved. We can
then compare the relative frequency of each individual potential PAM sequence in the
library from the sample that were cleaved and those that were not, and can determine the
how well the nuclease recognizes each potential PAM sequence. This assay takes about
10-20 hours from when the DNA constructs are in hand, to when the amplified target
sequences are submitted for sequencing. This assay is described in much more detail in
[71].
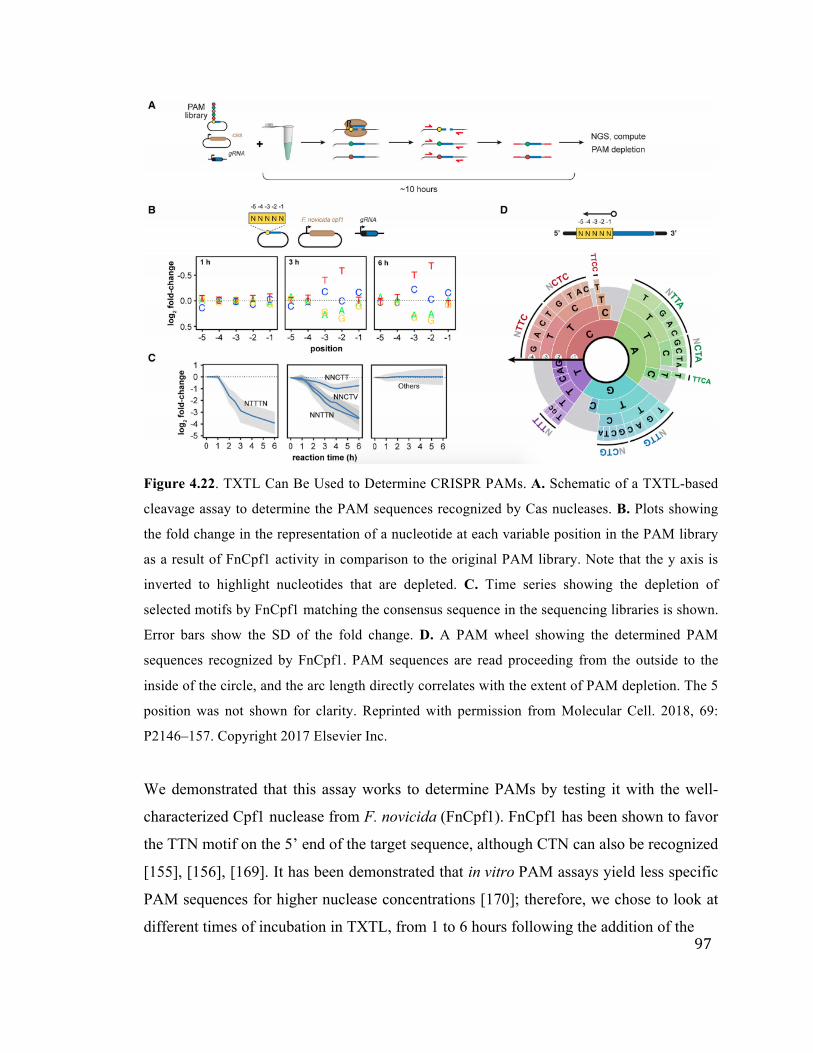
97
Figure 4.22. TXTL Can Be Used to Determine CRISPR PAMs. A. Schematic of a TXTL-based
cleavage assay to determine the PAM sequences recognized by Cas nucleases. B. Plots showing
the fold change in the representation of a nucleotide at each variable position in the PAM library
as a result of FnCpf1 activity in comparison to the original PAM library. Note that the y axis is
inverted to highlight nucleotides that are depleted. C. Time series showing the depletion of
selected motifs by FnCpf1 matching the consensus sequence in the sequencing libraries is shown.
Error bars show the SD of the fold change. D. A PAM wheel showing the determined PAM
sequences recognized by FnCpf1. PAM sequences are read proceeding from the outside to the
inside of the circle, and the arc length directly correlates with the extent of PAM depletion. The 5
position was not shown for clarity. Reprinted with permission from Molecular Cell. 2018, 69:
P2146–157. Copyright 2017 Elsevier Inc.
We demonstrated that this assay works to determine PAMs by testing it with the well-
characterized Cpf1 nuclease from F. novicida (FnCpf1). FnCpf1 has been shown to favor
the TTN motif on the 5’ end of the target sequence, although CTN can also be recognized
[155], [156], [169]. It has been demonstrated that in vitro PAM assays yield less specific
PAM sequences for higher nuclease concentrations [170]; therefore, we chose to look at
different times of incubation in TXTL, from 1 to 6 hours following the addition of the
98
Cas nuclease and gRNA DNA templates. Our PAM library included potential PAM
sequences up to 5 nucleotides long on the 5’ end of the target. Our assay was able to
recapitulate the canonical TTN PAM sequence on the 5’ side of the target. The results
can be visualized in a variety of ways. We can look at the depletion based on each
individual nucleotide position in the 5 nucleotide library (Figure 4.22B), we can look at
the depletion of specific DNA motifs (Figure 4.22C), or we can look at the depletion as a
PAM wheel (Figure 4.22D) that shows each possible sequence across the library [156].
Looking at the individual motifs, we see that the most active PAM was NTTTN, with
ATTTA the most depleted by about a factor of three, although others are still functional.
We also saw that NNCTN works relatively well, in agreement with literature [155], [169],
as well as a T at the -1 position being detrimental to cleavage.
99
Chapter 5
Gene Circuits
5.1 Circuit Parts
One big goal of synthetic biologists is to construct genetic networks with predictable
behaviors. Robust gene circuits, if implemented in cells, could have wide ranging
applications. Biomanufacturing could be fine tuned by circuits to only express genes in
specific conditions or stages of cell fermentation [171]–[173]. Synthetic gene circuits can
aid in the development of new chemicals, pharmaceuticals, and insecticides [174], [175].
Aside from biomanufactoring, there are many possible medical applications for gene
circuits, like therapies and correcting genetic diseases [176]–[180]. However, building
programmable gene circuits has proved to be very challenging. Functional circuits often
require precise regulation for proper response [1]. Genetic circuits can be dynamic, which
makes screening much more difficult [181]. In order to accomplish this goal of
constructing predictable biological circuits, there must be a catalog of circuit parts that
can be combined to create desired functions. Recently, genetic parts libraries have been
published, as well as software for circuit design [182]–[184]. However, characterizing
and implementing parts experimentally remains challenging. TXTL is a useful tool for
prototyping of circuit parts for multiple reasons, including being able to control the
concentrations of DNA components, the ability to get results rapidly, and the scalability,
which enables high throughput capabilities.
Two simple circuit concepts are activation and repression. There are a number of
ways to achieve regulated activation in TXTL. One way is using the natural E. coli sigma
factors. The sigma factor binds to the E. coli RNA polymerase and guides it to a specific
promoter recognition sequence on the DNA. Without the presence of the specific sigma
factor, the RNA polymerase cannot bind to the DNA and initiate transcription. We have
characterized all of the E. coli sigma factors in TXTL [53]. Figure 5.1 shows the
activation circuit using sigma 28. Without the sigma factor, there is no expression, and
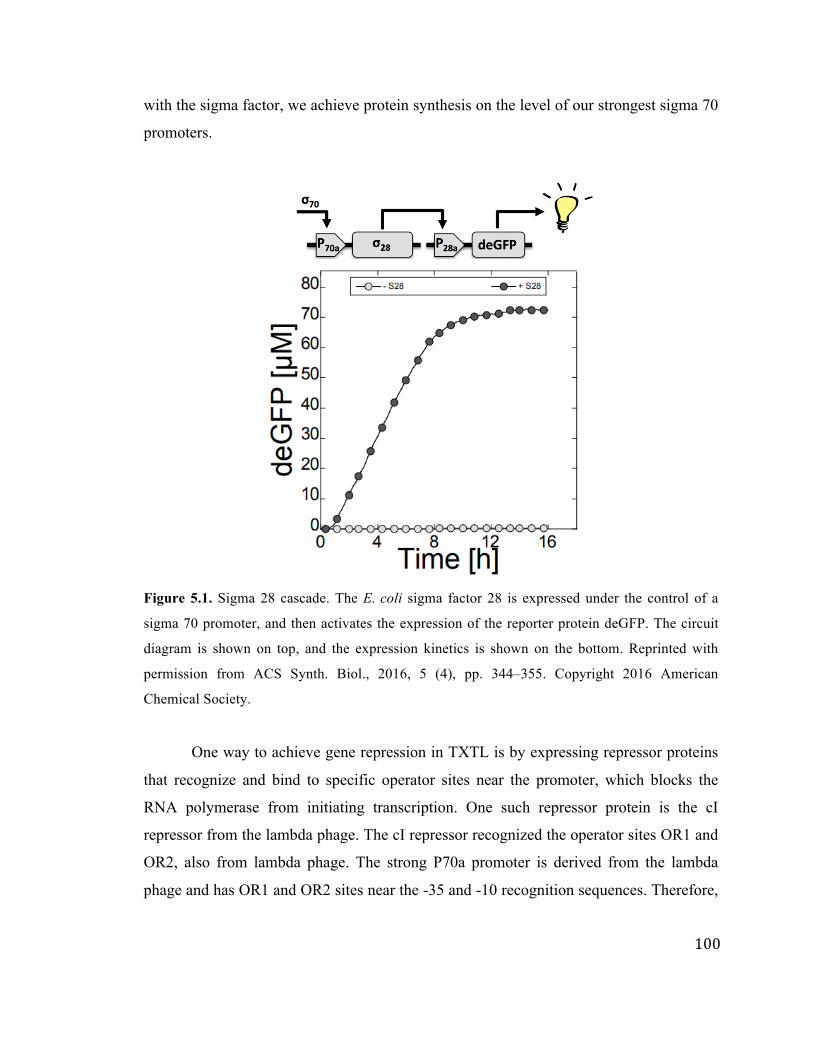
100
with the sigma factor, we achieve protein synthesis on the level of our strongest sigma 70
promoters.
Figure 5.1. Sigma 28 cascade. The E. coli sigma factor 28 is expressed under the control of a
sigma 70 promoter, and then activates the expression of the reporter protein deGFP. The circuit
diagram is shown on top, and the expression kinetics is shown on the bottom. Reprinted with
permission from ACS Synth. Biol., 2016, 5 (4), pp. 344–355. Copyright 2016 American
Chemical Society.
One way to achieve gene repression in TXTL is by expressing repressor proteins
that recognize and bind to specific operator sites near the promoter, which blocks the
RNA polymerase from initiating transcription. One such repressor protein is the cI
repressor from the lambda phage. The cI repressor recognized the operator sites OR1 and
OR2, also from lambda phage. The strong P70a promoter is derived from the lambda
phage and has OR1 and OR2 sites near the -35 and -10 recognition sequences. Therefore,
101
the cI repression can functionally repress transcription initiation from the P70a promoter.
Repressors can be used to turn off expression and create pulses.
Aside from using proteins to drive the activation of other genes, RNAs can also
be used. RNAs are very versatile as circuit elements because there are many possible
orthogonal activator and repressors, because the mechanisms of activation and repression
are based on hybridization of two RNAs, either blocking or unblocking regulatory
elements, like ribosome binding sites or terminators. One way of using RNAs for
activation is small transcription activating RNAs (STARs) [185]. STARs bind to a target
DNA which is placed upstream of a gene of interest. On this target DNA, there is a
terminator just before the gene. In the absence of a STAR, the terminator forms a hairpin
and the polymerase falls off of the DNA without transcribing the gene (Figure 5.2A). In
the presence of a STAR, the STAR binds to the target which blocks the folding and
formation of the terminator hairpin. Then, the RNA polymerase continues transcribing
the gene. In order for the transcription of the gene to happen, a STAR must bind during
the small fraction of time before the terminator hairpin can form, therefore the
concentration of STARs must be very high in a TXTL reaction relative to a protein
activator for the activation of a gene. Figure 5.2B shows the response of GFP expression
in a TXTL reaction to changing concentrations of the STAR plasmid.

102
A
B
Figure 5.2. STAR activation. A) Schematic showing the mechanism of a STAR [79]. B)
Expression kinetics of GFP in TXTL reactions with increasing concentrations of STAR plasmid,
while the target plasmid concentration is held constant at 2 nM. Figure 5.3A reprinted with
permission from Biotechnol. Bioeng. 2019, 116: 1139–1151. Copyright 2017 Wiley Periodicals,
Inc.
5.2 IFFL
The incoherent type-1 feed forward loop (I1-FFL, or IFFL) is a well studied circuit motif
due to it capability of producing a pulse of gene expression as well as its presence in
natural systems [186]–[189]. IFFLs have been used for many applications, including
band-pass filters [190], [191], biosensing [192], and noise buffering [193]. The IFFL
works by activating the expression of a gene through one path (species X activates
species Z), and repressing the expression of that same gene through a second path
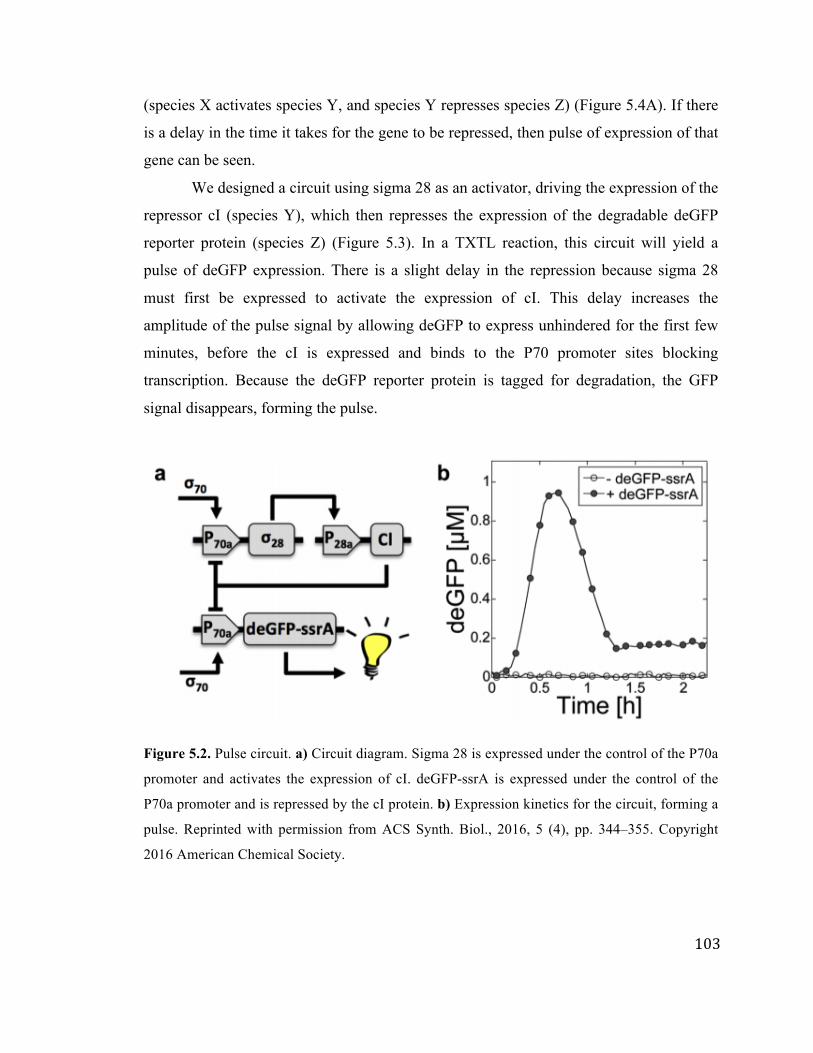
103
(species X activates species Y, and species Y represses species Z) (Figure 5.4A). If there
is a delay in the time it takes for the gene to be repressed, then pulse of expression of that
gene can be seen.
We designed a circuit using sigma 28 as an activator, driving the expression of the
repressor cI (species Y), which then represses the expression of the degradable deGFP
reporter protein (species Z) (Figure 5.3). In a TXTL reaction, this circuit will yield a
pulse of deGFP expression. There is a slight delay in the repression because sigma 28
must first be expressed to activate the expression of cI. This delay increases the
amplitude of the pulse signal by allowing deGFP to express unhindered for the first few
minutes, before the cI is expressed and binds to the P70 promoter sites blocking
transcription. Because the deGFP reporter protein is tagged for degradation, the GFP
signal disappears, forming the pulse.
Figure 5.2. Pulse circuit. a) Circuit diagram. Sigma 28 is expressed under the control of the P70a
promoter and activates the expression of cI. deGFP-ssrA is expressed under the control of the
P70a promoter and is repressed by the cI protein. b) Expression kinetics for the circuit, forming a
pulse. Reprinted with permission from ACS Synth. Biol., 2016, 5 (4), pp. 344–355. Copyright
2016 American Chemical Society.
104
While the previous circuit is an explicit representation of an IFFL, we can also
take advantage of the different timescales of reaction processes to create a circuit that
behaves like an IFFL. We can use STAR activation to rapidly activate the expression of a
gene, and CRISPRi to more slowly repress its expression (Figure 5.4A, B). On first look,
it is apparent that, by the strict definition, this circuit may not be an I1-FFL. Some
regulatory element X, does not both activate and repress the expression of some gene Z,
because in this circuit, we have two separate elements: the STAR activates and the
crRNA represses. However, can still achieve a pulse of GFP expression in TXTL
reactions (Figure 5.4C). Also, one could argue that if we take a further step back, sigma
70 could be our species X. Then, sigma 70 actives GFP through the expression of the
STAR, and represses GFP through the expression of the crRNA and tracrRNA.
This circuit still works to produce a pulse of GFP because of time it takes for
complex formation and DNA targeting of the CRISPR ribonucleoprotein complex. As
seen in Figure 4.17, efficient repression can take on the order of one hour. Though not
immediate, activation of expression using STARs is quicker than this timescale (Figure
5.2B), allowing for a buildup of GFP mRNA before the CRISPR complex can repress its
expression. In this circuit, we show the rate of GFP expression because we are not using
a GFP tagged for degradation. Therefore, the pulse we are seeing is of the GFP mRNA,
while the GFP protein increases to a plateau when it is finally repressed.
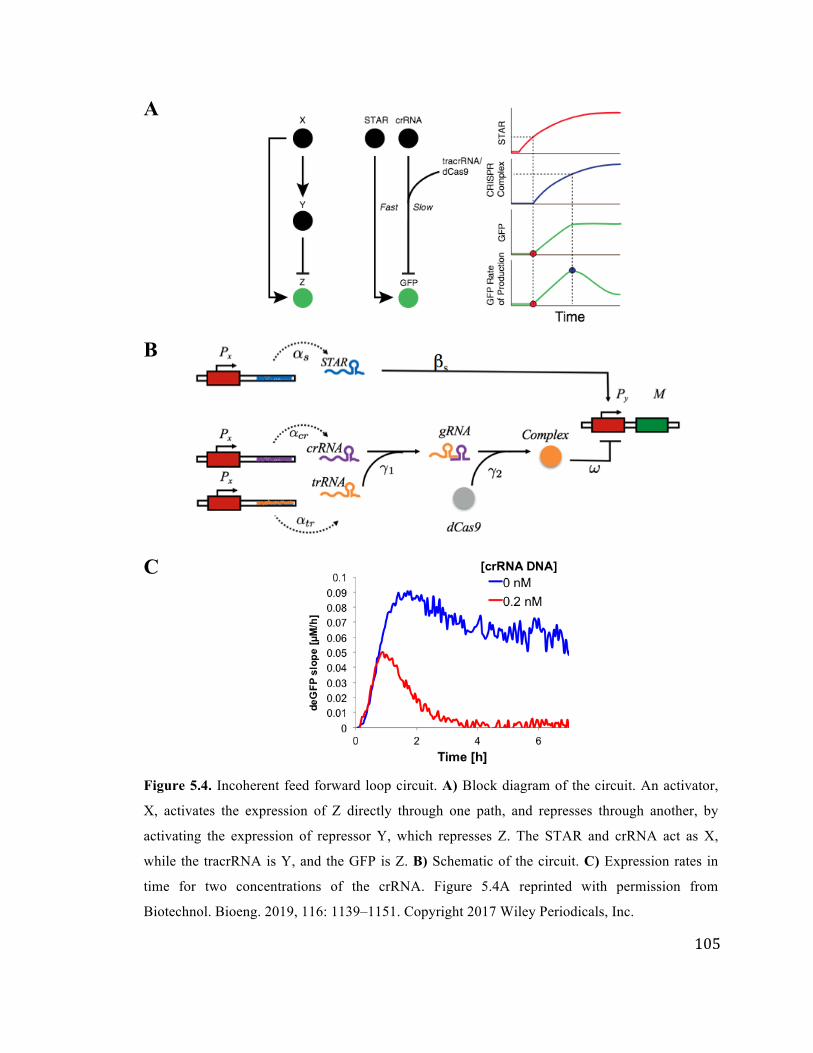
105
A
B
C
Figure 5.4. Incoherent feed forward loop circuit. A) Block diagram of the circuit. An activator,
X, activates the expression of Z directly through one path, and represses through another, by
activating the expression of repressor Y, which represses Z. The STAR and crRNA act as X,
while the tracrRNA is Y, and the GFP is Z. B) Schematic of the circuit. C) Expression rates in
time for two concentrations of the crRNA. Figure 5.4A reprinted with permission from
Biotechnol. Bioeng. 2019, 116: 1139–1151. Copyright 2017 Wiley Periodicals, Inc.
106
5.3 PID Controller
Proportional-integral-derivative (PID) controllers are circuits that use error calculation
and feedback to control an output signal. PID controllers continuously monitor the error,
which is the difference between some set point, and the output process value (Figure
5.5A). The controller attempts to minimize the error by making corrections dependent on
the proportional, integral, and derivative terms of the error. Controllers were invented by
physicists seeking solutions for industrial opportunities. In 1788, James Watt
implemented the first device with proportional control to the steam engine with a flyball
governor [194]. The concept relied on spinning massive balls that closed a valve as they
spun faster. This helped control the speed of the steam engine. It was not until 80 years
later that governors was first described theoretically by James Maxwell [195]. He
explained several of the problems with current governors, including showing that systems
become unstable if the gain is too high, and steady-state error offset can be eliminated
with integral control [194]. The exposure from Maxwell also enticed many other leading
mathematicians to study controllers, including Edward Routh, Adolf Hurwitz, and
Charles Sturm [196]. Elmer Sperry introduced the first full PID controller in 1911, which
automated the steering of ships [194]. Today, controllers are used in many different
industrial products.
One simple example often used to explain controllers is the cruise control in a car.
The controller attempts to match the output of the speedometer to the set point
determined by the user. The car adjusts the throttle to minimize the error between the set
point and the actual speed. This control is very robust and immune to disturbances like
the slope of the road or the strength of the wind because the machinery is precise and the
degree to which the throttle is on only depends on the difference between the set point
and the actual speed. Implementing controllers using biology is much more difficult
because biology is naturally very leaky [197]. Although challenging to implement, there
are many potential applications for biological controllers: they could improve the
efficiency of microbes converting biomass into biofuels [198], and they could optimize
microbial hosts to increase production [199]. Biological controllers have been proposed
to sense and signal harmful heavy metals [200], as well as serve therapeutic applications
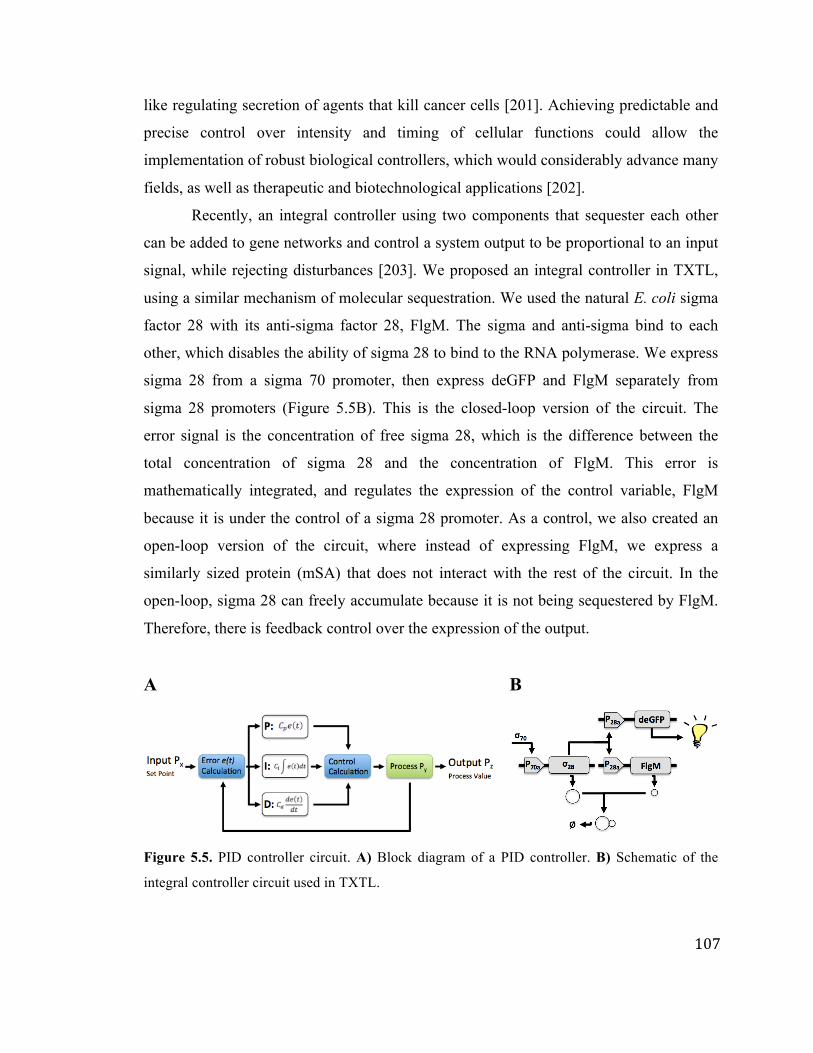
107
like regulating secretion of agents that kill cancer cells [201]. Achieving predictable and
precise control over intensity and timing of cellular functions could allow the
implementation of robust biological controllers, which would considerably advance many
fields, as well as therapeutic and biotechnological applications [202].
Recently, an integral controller using two components that sequester each other
can be added to gene networks and control a system output to be proportional to an input
signal, while rejecting disturbances [203]. We proposed an integral controller in TXTL,
using a similar mechanism of molecular sequestration. We used the natural E. coli sigma
factor 28 with its anti-sigma factor 28, FlgM. The sigma and anti-sigma bind to each
other, which disables the ability of sigma 28 to bind to the RNA polymerase. We express
sigma 28 from a sigma 70 promoter, then express deGFP and FlgM separately from
sigma 28 promoters (Figure 5.5B). This is the closed-loop version of the circuit. The
error signal is the concentration of free sigma 28, which is the difference between the
total concentration of sigma 28 and the concentration of FlgM. This error is
mathematically integrated, and regulates the expression of the control variable, FlgM
because it is under the control of a sigma 28 promoter. As a control, we also created an
open-loop version of the circuit, where instead of expressing FlgM, we express a
similarly sized protein (mSA) that does not interact with the rest of the circuit. In the
open-loop, sigma 28 can freely accumulate because it is not being sequestered by FlgM.
Therefore, there is feedback control over the expression of the output.
A B
Figure 5.5. PID controller circuit. A) Block diagram of a PID controller. B) Schematic of the
integral controller circuit used in TXTL.
108
In TXTL reactions, we show that the closed-loop circuit output (deGFP slope) is
linearly proportional to the input (concentration of P70a-σ28), over a relatively large
dynamic range of the input. Figure 5.6 a-d shows expression kinetics as well as the
corresponding slopes for both the open and closed loop circuits for increasing
concentrations of the input plasmid concentration, Px. If we look at the slopes, or rates of
deGFP synthesis, at 8 hours, which we approximate as a steady state, we see that only in
the closed-loop configuration do we see that the output is linearly proportional to the
input. Similarly, we can disturb the system by adding a step-change increase of the input,
and the results still show that only the closed-loop configuration has output linearly
proportional to the input.
We demonstrated robust reference (input) tracking over a large dynamic range.
We also showed simple rejection to disturbances only with the closed loop controller.
These results show that we are capable of robust gene regulation in TXTL. This approach
could be expanded for applications across synthetic biology, and especially for the
construction of dynamical systems in vitro.
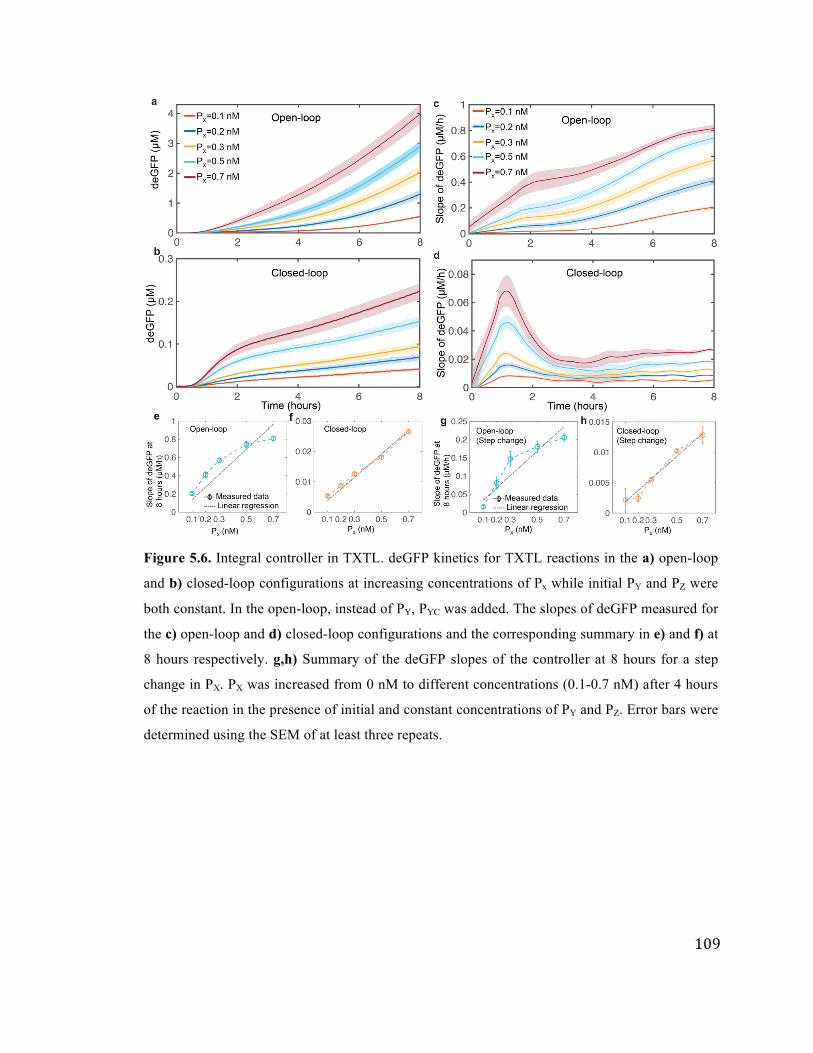
109
Figure 5.6. Integral controller in TXTL. deGFP kinetics for TXTL reactions in the a) open-loop
and b) closed-loop configurations at increasing concentrations of Px while initial PY and PZ were
both constant. In the open-loop, instead of PY, PYC was added. The slopes of deGFP measured for
the c) open-loop and d) closed-loop configurations and the corresponding summary in e) and f) at
8 hours respectively. g,h) Summary of the deGFP slopes of the controller at 8 hours for a step
change in PX. PX was increased from 0 nM to different concentrations (0.1-0.7 nM) after 4 hours
of the reaction in the presence of initial and constant concentrations of PY and PZ. Error bars were
determined using the SEM of at least three repeats.
110
Chapter 6
Conclusion
Cell-free transcription-translation protein expression systems are a relatively cheap and
fast way to characterize many different elements of living systems. Due to the ease and
versatility of these systems, more and more research groups and commercial companies
are taking advantage of cell-free systems. We have expanded and optimized an all E. coli
TXTL system specifically for synthetic biology and biophysical purposes, such that it is
compatible with many different experimental setups. Reactions can be run in large
volume batch mode, on the order of tens of microliters, in microfluidics, or in liposomes,
down to the femtoliter scale. We are capable of synthesizing over 2.0 mg/ml of protein in
batch mode cell-free reactions, which is comparable to the leading systems in the world.
Even though we are so far limited to using E. coli transcription and translation
machineries, most proteins not native to E. coli can still be synthesized, expanding the
utility of the system for research and biomanufacturing purposes. New liquid handling
systems and high throughput technology further enhances the functionality of TXTL.
These technological advances open up the possibility for TXTL to be used activity assays
on large libraries of samples, like for directed evolution and protein design.
While cell-free systems keep growing in use, we need to continue to develop
accurate and quantitative models to describe these systems. Here, we presented a model
that includes quantitative parameters determined by experimental assays. We quantify
different regimes of biochemical synthesis, including the linear regime where
transcription and translation machineries are not limiting, as well as the saturated regime,
where the translational machineries become limiting. This model provides information
that can be used to select the strengths of regulatory parts used to design DNA constructs,
as well as the stoichiometries of different DNA constructs in TXTL reactions. However,
different cell-free systems can have different behaviors, and therefore models need to be
adjusted to serve each cell-free system individually. The basic design of our model can be
111
used for other systems, to include conservation equations for the total amount of
transcription and translation machinery. The model can also be expanded to fit more
complicated circuits, including activation, repression, and other forms of gene regulation.
The increasing power of computers especially helps this purpose, where more
complicated circuits might include sets of ten or more differential equations. Further
down the road, models of cell-free systems can help guide the design of genetic circuits
to be used for real-world applications like gene therapies, where specific expression of
certain enzymes is necessary, or biological controllers.
CRISPR-cas systems allow for relatively simple genetic editing, which has far
ranging applications in synthetic biology. These systems are found in about have of all
bacteria and around 90% of archaea, therefore there are many systems that have yet to be
characterized or discovered. TXTL is well suited for characterizing CRISPR-cas systems
because it does not require protein purification or cell culturing and transformation. This
dramatically reduces the time required to test CRISPR elements. TXTL also gives great
control of reaction conditions; users can tweak designs and manage template
concentrations and timings to learn things that may not be possible in vivo. TXTL can
therefore be used to quickly prototype different systems and test viability for applications.
In this work, we characterized many different sgRNAs for Cas9 from S. pyogenes as well
as Cpf1 from F. novicida. We measured dynamics of DNA cleavage as well as gene
repression with the catalytically dead Cas9. In addition, we showed that TXTL can be
used to characterize the activities of a diverse set of anti-CRISPR proteins, and we
developed a fast test for PAM site. TXTL also makes it much easier to test multi-effector
CRISPR complexes, which require the purification of many different proteins to test in
vivo. The CRISPR-TXTL toolbox could be expanded to test for spacer acquisition, as
well as binding and cleavage efficiencies.
Gene circuits with predictable behaviors can have many applications in
biotechnology, including biomanufacturing, and therapeutics, and synthetic cells. We
showed that TXTL can be used to create programmable gene circuits. We use modular
components, like transcription activators, repressors, small RNAs, and CRISPR elements,
and combine them to create robust gene circuits. We demonstrated two different designs
112
for IFFLs that produce a pulse of gene expression, using different molecular mechanisms.
We also used protein sequestration to create an integral feedback controller that can
regulate gene expression.
Although TXTL can have a widespread impact on characterization of CRISPR
technologies, gene circuits, and other areas, there are still limitations. So far in the all E.
coli TXTL system, there is no capability for post-translational modifications. Expression
in TXTL is also optimized for 29°C, and while it is still functional in the range of 20-
40°C, reaction rates and protein production slows down considerably, and there is less
knowledge about what is happening in the reaction. Certain cellular components for some
organisms may optimally run in vivo at 37°C or even higher temperatures for
thermophiles. It is not clear if TXTL would be useful to characterize systems from these
organisms. A final limitation to TXTL is that the reaction in batch mode has a finite
supply of reaction biochemicals and accrues degradation products over time. This means,
like we have seen, that there is only a linear phase of gene expression for up to six or
eight hours, after which we plateau. For poorly expressed proteins, this time may be even
less. Continuous exchange systems allow for feeding biomolecules to the reaction and
diffuse away degradation products; however, continuous systems are often very difficult
to implement to many experimental setups. Still, cell-free TXTL is a versatile tool that
can be used to rapidly prototype and characterize genetic networks, CRISPR technologies,
and many other prokaryotic systems.
113
References [1] T. S. Gardner, C. R. Cantor, and J. J. Collins, “Construction of a genetic toggle
switch in Escherichia coli,” Nature, vol. 403, no. 6767, pp. 339–342, Jan. 2000. [2] M. B. Elowitz and S. Leibler, “A synthetic oscillatory network of transcriptional
regulators,” Nature, vol. 403, no. 6767, pp. 335–338, Jan. 2000. [3] J. L. Fortman et al., “Biofuel alternatives to ethanol: pumping the microbial well,”
Trends Biotechnol., vol. 26, no. 7, pp. 375–381, Jul. 2008. [4] H. Alper and G. Stephanopoulos, “Engineering for biofuels: exploiting innate
microbial capacity or importing biosynthetic potential?,” Nat. Rev. Microbiol., vol. 7, no. 10, pp. 715–723, Oct. 2009.
[5] W. Weber et al., “A synthetic mammalian electro-genetic transcription circuit,” Nucleic Acids Res., vol. 37, no. 4, pp. e33–e33, Dec. 2008.
[6] M. M. Becker et al., “Synthetic recombinant bat SARS-like coronavirus is infectious in cultured cells and in mice,” Proc. Natl. Acad. Sci., vol. 105, no. 50, pp. 19944–19949, Dec. 2008.
[7] T. K. Lu and J. J. Collins, “Engineered bacteriophage targeting gene networks as adjuvants for antibiotic therapy,” Proc. Natl. Acad. Sci., vol. 106, no. 12, pp. 4629–4634, Mar. 2009.
[8] K. Chen and F. H. Arnold, “Tuning the activity of an enzyme for unusual environments: sequential random mutagenesis of subtilisin E for catalysis in dimethylformamide.,” Proc. Natl. Acad. Sci., vol. 90, no. 12, pp. 5618–5622, Jun. 1993.
[9] M. J. Dougherty and F. H. Arnold, “Directed evolution: new parts and optimized function,” Curr. Opin. Biotechnol., vol. 20, no. 4, pp. 486–491, Aug. 2009.
[10] M. Fussenegger et al., “Streptogramin-based gene regulation systems for mammalian cells,” Nat. Biotechnol., vol. 18, no. 11, pp. 1203–1208, Nov. 2000.
[11] P. Neddermann et al., “A novel, inducible, eukaryotic gene expression system based on the quorum-sensing transcription factor TraR,” EMBO Rep., vol. 4, no. 2, pp. 159–165, Feb. 2003.
[12] L. Malphettes et al., “A novel mammalian expression system derived from components coordinating nicotine degradation in arthrobacter nicotinovorans pAO1,” Nucleic Acids Res., vol. 33, no. 12, pp. e107–e107, Jul. 2005.
[13] M. Boorsma, L. Nieba, D. Koller, M. F. Bachmann, J. E. Bailey, and W. A. Renner, “A temperature-regulated replicon-based DNA expression system,” Nat. Biotechnol., vol. 18, no. 4, pp. 429–432, Apr. 2000.
[14] P. C. ZAMECNIK and I. D. FRANTZ, “Incorporation in vitro of radioactive carbon from carboxyl-labeled dl-alanine and glycine into proteins of normal and malignant rat livers.,” J. Biol. Chem., vol. 175, no. 1, pp. 299–314, Aug. 1948.
[15] E. F. GALE and J. P. FOLKES, “Effect of nucleic acids on protein synthesis and amino-acid incorporation in disrupted staphylococcal cells.,” Nature, vol. 173, no. 4417, pp. 1223–7, Jun. 1954.
[16] M. R. LAMBORG and P. C. ZAMECNIK, “Amino acid incorporation into protein by extracts of E. coli.,” Biochim. Biophys. Acta, vol. 42, pp. 206–11, Aug. 1960.
[17] A. Bank and P. A. Marks, “Protein synthesis in a cell free human reticulocyte system: ribosome function in thalassemia.,” J. Clin. Invest., vol. 45, no. 3, pp.
114
330–336, Mar. 1966. [18] R. Schweet, H. Lamfrom, and E. Allen, “THE SYNTHESIS OF HEMOGLOBIN
IN A CELL-FREE SYSTEM.,” Proc. Natl. Acad. Sci. U. S. A., vol. 44, no. 10, pp. 1029–35, Oct. 1958.
[19] E. B. KELLER and J. W. LITTLEFIELD, “Incorporation of C14-amino acids into ribonucleoprotein particles from the Ehrlich mouse ascites tumor.,” J. Biol. Chem., vol. 224, no. 1, pp. 13–30, Jan. 1957.
[20] A. Marcus and J. Feeley, “RIBOSOME ACTIVATION AND POLYSOME FORMATION IN VITRO: REQUIREMENT FOR ATP,” Proc. Natl. Acad. Sci., vol. 56, no. 6, pp. 1770–1777, Dec. 1966.
[21] M. B. Hoagland, E. B. Keller, and P. C. Zamecnik, “The mechanism of amino acid activation: the work of Mahlon Hoagland. 1956.,” J. Biol. Chem., vol. 284, no. 25, pp. e7-8, Jun. 2009.
[22] J. W. LITTLEFIELD, E. B. KELLER, J. GROSS, and P. C. ZAMECNIK, “Studies on cytoplasmic ribonucleoprotein particles from the liver of the rat.,” J. Biol. Chem., vol. 217, no. 1, pp. 111–23, Nov. 1955.
[23] M. W. NIRENBERG and J. H. MATTHAEI, “The dependence of cell-free protein synthesis in E. coli upon naturally occurring or synthetic polyribonucleotides.,” Proc. Natl. Acad. Sci. U. S. A., vol. 47, pp. 1588–602, Oct. 1961.
[24] D. A. Chambers and G. Zubay, “THE STIMULATORY EFFECT OF CYCLIC ADENOSINE 3’5’-MONOPHOSPHATE ON DNA-DIRECTED SYNTHESIS OF -GALACTOSIDASE IN A CELL-FREE SYSTEM,” Proc. Natl. Acad. Sci., vol. 63, no. 1, pp. 118–122, May 1969.
[25] G. Zubay, “In Vitro Synthesis of Protein in Microbial Systems,” Annu. Rev. Genet., vol. 7, no. 1, pp. 267–287, Dec. 1973.
[26] H. Z. Chen and G. Zubay, “Prokaryotic coupled transcription-translation.,” Methods Enzymol., vol. 101, pp. 674–90, 1983.
[27] D. Craig, M. T. Howell, C. L. Gibbs, T. Hunt, and R. J. Jackson, “Plasmid cDNA-directed protein synthesis in a coupled eukaryotic in vitro transcription-translation system.,” Nucleic Acids Res., vol. 20, no. 19, pp. 4987–95, Oct. 1992.
[28] P. A. Krieg and D. A. Melton, “In vitro RNA synthesis with SP6 RNA polymerase.,” Methods Enzymol., vol. 155, pp. 397–415, 1987.
[29] D. E. Nevin and J. M. Pratt, “A coupled in vitro transcription-translation system for the exclusive synthesis of polypeptides expressed from the T7 promoter,” FEBS Lett., vol. 291, no. 2, pp. 259–263, Oct. 1991.
[30] Y. Shimizu et al., “Cell-free translation reconstituted with purified components,” Nat. Biotechnol., vol. 19, no. 8, pp. 751–755, Aug. 2001.
[31] Y. Shimizu, T. Kanamori, and T. Ueda, “Protein synthesis by pure translation systems,” Methods, vol. 36, no. 3, pp. 299–304, Jul. 2005.
[32] Y. Shimizu and T. Ueda, “PURE technology.,” Methods Mol. Biol., vol. 607, pp. 11–21, 2010.
[33] J. G. Perez, J. C. Stark, and M. C. Jewett, “Cell-Free Synthetic Biology: Engineering Beyond the Cell.,” Cold Spring Harb. Perspect. Biol., vol. 8, no. 12, p. a023853, Dec. 2016.
[34] A. Nozawa and Y. Tozawa, “Modifications of Wheat Germ Cell-Free System for Functional Proteomics of Plant Membrane Proteins,” in Methods in molecular
115
biology (Clifton, N.J.), vol. 1072, 2014, pp. 259–272. [35] F. Bernhard and Y. Tozawa, “Cell-free expression--making a mark.,” Curr. Opin.
Struct. Biol., vol. 23, no. 3, pp. 374–80, Jun. 2013. [36] R. F. Gesteland, “Isolation and characterization of ribonuclease I mutants of
Escherichia coli,” J. Mol. Biol., vol. 16, no. 1, pp. 67–84, Mar. 1966. [37] H. L. Yang, L. Ivashkiv, H. Z. Chen, G. Zubay, and M. Cashel, “Cell-free coupled
transcription-translation system for investigation of linear DNA segments.,” Proc. Natl. Acad. Sci. U. S. A., vol. 77, no. 12, pp. 7029–33, Dec. 1980.
[38] M. C. Jewett, K. A. Calhoun, A. Voloshin, J. J. Wuu, and J. R. Swartz, “An integrated cell-free metabolic platform for protein production and synthetic biology.,” Mol. Syst. Biol., vol. 4, p. 220, Oct. 2008.
[39] M. C. Jewett and J. R. Swartz, “Mimicking the Escherichia coli cytoplasmic environment activates long-lived and efficient cell-free protein synthesis.,” Biotechnol. Bioeng., vol. 86, no. 1, pp. 19–26, Apr. 2004.
[40] A. C. Forster and G. M. Church, “Towards synthesis of a minimal cell.,” Mol. Syst. Biol., vol. 2, p. 45, Aug. 2006.
[41] M. C. Jewett and A. C. Forster, “Update on designing and building minimal cells.,” Curr. Opin. Biotechnol., vol. 21, no. 5, pp. 697–703, Oct. 2010.
[42] R. Gil, F. J. Silva, J. Peretó, and A. Moya, “Determination of the core of a minimal bacterial gene set.,” Microbiol. Mol. Biol. Rev., vol. 68, no. 3, p. 518–37, table of contents, Sep. 2004.
[43] E. V Koonin, A. R. Mushegian, and K. E. Rudd, “Sequencing and analysis of bacterial genomes.,” Curr. Biol., vol. 6, no. 4, pp. 404–16, Apr. 1996.
[44] C. A. Hutchison et al., “Design and synthesis of a minimal bacterial genome,” Science (80-. )., vol. 351, no. 6280, pp. aad6253-aad6253, Mar. 2016.
[45] H. Niederholtmeyer et al., “Rapid cell-free forward engineering of novel genetic ring oscillators.,” Elife, vol. 4, p. e09771, Oct. 2015.
[46] A. Fallah-Araghi, J.-C. Baret, M. Ryckelynck, and A. D. Griffiths, “A completely in vitro ultrahigh-throughput droplet-based microfluidic screening system for protein engineering and directed evolution.,” Lab Chip, vol. 12, no. 5, pp. 882–91, Mar. 2012.
[47] S. Majumder, J. Garamella, Y.-L. Wang, M. DeNies, V. Noireaux, and A. P. Liu, “Cell-sized mechanosensitive and biosensing compartment programmed with DNA,” Chem. Commun., vol. 53, no. 53, pp. 7349–7352, 2017.
[48] S. Fujii, T. Matsuura, T. Sunami, T. Nishikawa, Y. Kazuta, and T. Yomo, “Liposome display for in vitro selection and evolution of membrane proteins,” Nat. Protoc., vol. 9, no. 7, pp. 1578–1591, Jul. 2014.
[49] Y. T. Maeda, T. Nakadai, J. Shin, K. Uryu, V. Noireaux, and A. Libchaber, “Assembly of MreB filaments on liposome membranes: a synthetic biology approach.,” ACS Synth. Biol., vol. 1, no. 2, pp. 53–9, Feb. 2012.
[50] T. Furusato, F. Horie, H. T. Matsubayashi, K. Amikura, Y. Kuruma, and T. Ueda, “De Novo Synthesis of Basal Bacterial Cell Division Proteins FtsZ, FtsA, and ZipA Inside Giant Vesicles.,” ACS Synth. Biol., vol. 7, no. 4, pp. 953–961, Apr. 2018.
[51] F. Caschera and V. Noireaux, “Integration of biological parts toward the synthesis of a minimal cell,” Curr. Opin. Chem. Biol., vol. 22, pp. 85–91, Oct. 2014.
116
[52] T. Pereira de Souza, P. Stano, and P. L. Luisi, “The minimal size of liposome-based model cells brings about a remarkably enhanced entrapment and protein synthesis.,” Chembiochem, vol. 10, no. 6, pp. 1056–63, Apr. 2009.
[53] J. Garamella, R. Marshall, M. Rustad, and V. Noireaux, “The All E. coli TX-TL Toolbox 2.0: A Platform for Cell-Free Synthetic Biology,” ACS Synth. Biol., vol. 5, no. 4, pp. 344–355, Apr. 2016.
[54] J. Shin and V. Noireaux, “An E. coli Cell-Free Expression Toolbox: Application to Synthetic Gene Circuits and Artificial Cells,” ACS Synth. Biol., vol. 1, no. 1, pp. 29–41, Jan. 2012.
[55] V. Noireaux, Y. T. Maeda, and A. Libchaber, “Development of an artificial cell, from self-organization to computation and self-reproduction.,” Proc. Natl. Acad. Sci. U. S. A., vol. 108, no. 9, pp. 3473–80, Mar. 2011.
[56] V. Noireaux and A. Libchaber, “A vesicle bioreactor as a step toward an artificial cell assembly,” Proc. Natl. Acad. Sci., vol. 101, no. 51, pp. 17669–17674, Dec. 2004.
[57] V. Noireaux, R. Bar-Ziv, J. Godefroy, H. Salman, and A. Libchaber, “Toward an artificial cell based on gene expression in vesicles,” Phys. Biol., vol. 2, no. 3, pp. P1–P8, Sep. 2005.
[58] F. Courtois et al., “An integrated device for monitoring time-dependent in vitro expression from single genes in picolitre droplets.,” Chembiochem, vol. 9, no. 3, pp. 439–46, Feb. 2008.
[59] P. S. Dittrich, M. Jahnz, and P. Schwille, “A new embedded process for compartmentalized cell-free protein expression and on-line detection in microfluidic devices.,” Chembiochem, vol. 6, no. 5, pp. 811–4, May 2005.
[60] A. C. Forster et al., “Programming peptidomimetic syntheses by translating genetic codes designed de novo.,” Proc. Natl. Acad. Sci. U. S. A., vol. 100, no. 11, pp. 6353–7, May 2003.
[61] M. C. T. Hartman, K. Josephson, and J. W. Szostak, “Enzymatic aminoacylation of tRNA with unnatural amino acids,” Proc. Natl. Acad. Sci., vol. 103, no. 12, pp. 4356–4361, Mar. 2006.
[62] K. Josephson, M. C. T. Hartman, and J. W. Szostak, “Ribosomal Synthesis of Unnatural Peptides,” J. Am. Chem. Soc., vol. 127, no. 33, pp. 11727–11735, Aug. 2005.
[63] P. A. Romero and F. H. Arnold, “Exploring protein fitness landscapes by directed evolution.,” Nat. Rev. Mol. Cell Biol., vol. 10, no. 12, pp. 866–76, Dec. 2009.
[64] K. Pardee et al., “Paper-Based Synthetic Gene Networks,” Cell, vol. 159, no. 4, pp. 940–954, Nov. 2014.
[65] K. Pardee et al., “Rapid, Low-Cost Detection of Zika Virus Using Programmable Biomolecular Components,” Cell, vol. 165, no. 5, pp. 1255–1266, May 2016.
[66] S. J. Moore et al., “Rapid acquisition and model-based analysis of cell-free transcription-translation reactions from nonmodel bacteria.,” Proc. Natl. Acad. Sci. U. S. A., vol. 115, no. 19, pp. E4340–E4349, May 2018.
[67] J. Chappell, K. E. Watters, M. K. Takahashi, and J. B. Lucks, “A renaissance in RNA synthetic biology: new mechanisms, applications and tools for the future,” Curr. Opin. Chem. Biol., vol. 28, pp. 47–56, Oct. 2015.
[68] S. Sen, D. Apurva, R. Satija, D. Siegal, and R. M. Murray, “Design of a
117
Toolbox of RNA Thermometers.,” ACS Synth. Biol., vol. 6, no. 8, pp. 1461–1470, Aug. 2017.
[69] M. K. Takahashi et al., “Rapidly Characterizing the Fast Dynamics of RNA Genetic Circuitry with Cell-Free Transcription–Translation (TX-TL) Systems,” ACS Synth. Biol., vol. 4, no. 5, pp. 503–515, May 2015.
[70] R. Marshall et al., “Rapid and Scalable Characterization of CRISPR Technologies Using an E. coli Cell-Free Transcription-Translation System,” Mol. Cell, vol. 69, no. 1, p. 146–157.e3, Jan. 2018.
[71] C. S. Maxwell, T. Jacobsen, R. Marshall, V. Noireaux, and C. L. Beisel, “A detailed cell-free transcription-translation-based assay to decipher CRISPR protospacer-adjacent motifs,” Methods, vol. 143, pp. 48–57, Jul. 2018.
[72] Y. Chemla, E. Ozer, O. Schlesinger, V. Noireaux, and L. Alfonta, “Genetically expanded cell-free protein synthesis using endogenous pyrrolysyl orthogonal translation system,” Biotechnol. Bioeng., vol. 112, no. 8, pp. 1663–1672, Aug. 2015.
[73] R.-B. Rues, A. Gräwe, E. Henrich, and F. Bernhard, “Membrane Protein Production in E. coli Lysates in Presence of Preassembled Nanodiscs.,” Methods Mol. Biol., vol. 1586, pp. 291–312, 2017.
[74] E. Karzbrun, A. M. Tayar, V. Noireaux, and R. H. Bar-Ziv, “Programmable on-chip DNA compartments as artificial cells,” Science (80-. )., vol. 345, no. 6198, pp. 829–832, Aug. 2014.
[75] A. M. Tayar, E. Karzbrun, V. Noireaux, and R. H. Bar-Ziv, “Synchrony and pattern formation of coupled genetic oscillators on a chip of artificial cells,” Proc. Natl. Acad. Sci., vol. 114, no. 44, pp. 11609–11614, Oct. 2017.
[76] P. van Nies, I. Westerlaken, D. Blanken, M. Salas, M. Mencía, and C. Danelon, “Self-replication of DNA by its encoded proteins in liposome-based synthetic cells,” Nat. Commun., vol. 9, no. 1, p. 1583, Dec. 2018.
[77] A. S. Karim and M. C. Jewett, “A cell-free framework for rapid biosynthetic pathway prototyping and enzyme discovery,” Metab. Eng., vol. 36, pp. 116–126, Jul. 2016.
[78] T. Matsuura, K. Hosoda, and Y. Shimizu, “Robustness of a Reconstituted Escherichia coli Protein Translation System Analyzed by Computational Modeling.,” ACS Synth. Biol., vol. 7, no. 8, pp. 1964–1972, Aug. 2018.
[79] A. Westbrook et al., “Distinct timescales of RNA regulators enable the construction of a genetic pulse generator,” Biotechnol. Bioeng., p. bit.26918, Feb. 2019.
[80] D. K. Agrawal et al., “Mathematical Modeling of RNA-Based Architectures for Closed Loop Control of Gene Expression,” ACS Synth. Biol., vol. 7, no. 5, pp. 1219–1228, May 2018.
[81] F. Caschera and V. Noireaux, “Synthesis of 2.3 mg/ml of protein with an all Escherichia coli cell-free transcription–translation system,” Biochimie, vol. 99, pp. 162–168, Apr. 2014.
[82] Z. Z. Sun, C. A. Hayes, J. Shin, F. Caschera, R. M. Murray, and V. Noireaux, “Protocols for Implementing an Escherichia coli Based TX-TL Cell-Free Expression System for Synthetic Biology,” J. Vis. Exp., no. 79, p. e50762, Sep. 2013.
118
[83] T. M. Gruber and C. A. Gross, “Multiple Sigma Subunits and the Partitioning of Bacterial Transcription Space,” Annu. Rev. Microbiol., vol. 57, no. 1, pp. 441–466, Oct. 2003.
[84] T. D. Craggs, “Green fluorescent protein: structure, folding and chromophore maturation,” Chem. Soc. Rev., vol. 38, no. 10, p. 2865, Oct. 2009.
[85] K. Sitaraman, D. Esposito, G. Klarmann, S. F. Le Grice, J. L. Hartley, and D. K. Chatterjee, “A novel cell-free protein synthesis system.,” J. Biotechnol., vol. 110, no. 3, pp. 257–63, Jun. 2004.
[86] M. Spies, I. Amitani, R. J. Baskin, and S. C. Kowalczykowski, “RecBCD enzyme switches lead motor subunits in response to chi recognition.,” Cell, vol. 131, no. 4, pp. 694–705, Nov. 2007.
[87] N. Michel-Reydellet, K. Woodrow, and J. Swartz, “Increasing PCR fragment stability and protein yields in a cell-free system with genetically modified Escherichia coli extracts.,” J. Mol. Microbiol. Biotechnol., vol. 9, no. 1, pp. 26–34, 2005.
[88] R. Marshall, C. S. Maxwell, S. P. Collins, C. L. Beisel, and V. Noireaux, “Short DNA containing χ sites enhances DNA stability and gene expression in E. coli cell-free transcription-translation systems,” Biotechnol. Bioeng., vol. 114, no. 9, pp. 2137–2141, Sep. 2017.
[89] K. Germer, M. Leonard, and X. Zhang, “RNA aptamers and their therapeutic and diagnostic applications.,” Int. J. Biochem. Mol. Biol., vol. 4, no. 1, pp. 27–40, 2013.
[90] G. S. Filonov, J. D. Moon, N. Svensen, and S. R. Jaffrey, “Broccoli: Rapid Selection of an RNA Mimic of Green Fluorescent Protein by Fluorescence-Based Selection and Directed Evolution,” J. Am. Chem. Soc., vol. 136, no. 46, pp. 16299–16308, Nov. 2014.
[91] G. S. Filonov, C. W. Kam, W. Song, and S. R. Jaffrey, “In-Gel Imaging of RNA Processing Using Broccoli Reveals Optimal Aptamer Expression Strategies,” Chem. Biol., vol. 22, no. 5, pp. 649–660, May 2015.
[92] D. Grate and C. Wilson, “Laser-mediated, site-specific inactivation of RNA transcripts.,” Proc. Natl. Acad. Sci. U. S. A., vol. 96, no. 11, pp. 6131–6, May 1999.
[93] D. Siegal-Gaskins, Z. A. Tuza, J. Kim, V. Noireaux, and R. M. Murray, “Gene Circuit Performance Characterization and Resource Usage in a Cell-Free ‘Breadboard,’” ACS Synth. Biol., vol. 3, no. 6, pp. 416–425, Jun. 2014.
[94] M. Rustad, A. Eastlund, R. Marshall, P. Jardine, and V. Noireaux, “Synthesis of Infectious Bacteriophages in an <em>E. coli-</em>based Cell-free Expression System,” J. Vis. Exp., no. 126, Aug. 2017.
[95] M. Rustad, A. Eastlund, P. Jardine, and V. Noireaux, “Cell-free TXTL synthesis of infectious bacteriophage T4 in a single test tube reaction,” Synth. Biol., vol. 3, no. 1, Jan. 2018.
[96] S. B. Zimmerman and A. P. Minton, “Macromolecular Crowding: Biochemical, Biophysical, and Physiological Consequences,” Annu. Rev. Biophys. Biomol. Struct., vol. 22, no. 1, pp. 27–65, Jun. 1993.
[97] A. P. Minton, “Implications of macromolecular crowding for protein assembly.,” Curr. Opin. Struct. Biol., vol. 10, no. 1, pp. 34–9, Feb. 2000.
[98] A. P. Minton, “How can biochemical reactions within cells differ from those in test tubes?,” J. Cell Sci., vol. 119, no. 14, pp. 2863–2869, Jul. 2006.
119
[99] C. E. Hodgman and M. C. Jewett, “Cell-free synthetic biology: thinking outside the cell.,” Metab. Eng., vol. 14, no. 3, pp. 261–9, May 2012.
[100] V. Noireaux, R. Bar-Ziv, and A. Libchaber, “Principles of cell-free genetic circuit assembly,” Proc. Natl. Acad. Sci., vol. 100, no. 22, pp. 12672–12677, Oct. 2003.
[101] F. Mavelli, R. Marangoni, and P. Stano, “A Simple Protein Synthesis Model for the PURE System Operation,” Bull. Math. Biol., vol. 77, no. 6, pp. 1185–1212, Jun. 2015.
[102] T. Stögbauer, L. Windhager, R. Zimmer, and J. O. Rädler, “Experiment and mathematical modeling of gene expression dynamics in a cell-free system.,” Integr. Biol. (Camb)., vol. 4, no. 5, pp. 494–501, May 2012.
[103] T. Matsuura, N. Tanimura, K. Hosoda, T. Yomo, and Y. Shimizu, “Reaction dynamics analysis of a reconstituted Escherichia coli protein translation system by computational modeling.,” Proc. Natl. Acad. Sci. U. S. A., vol. 114, no. 8, pp. E1336–E1344, Feb. 2017.
[104] A. Doerr et al., “Modelling cell-free RNA and protein synthesis with minimal systems,” Phys. Biol., vol. 16, no. 2, p. 025001, Jan. 2019.
[105] M. Vilkhovoy et al., “Sequence Specific Modeling of E. coli Cell-Free Protein Synthesis.,” ACS Synth. Biol., vol. 7, no. 8, pp. 1844–1857, Aug. 2018.
[106] J. Chappell, K. Jensen, and P. S. Freemont, “Validation of an entirely in vitro approach for rapid prototyping of DNA regulatory elements for synthetic biology.,” Nucleic Acids Res., vol. 41, no. 5, pp. 3471–81, Mar. 2013.
[107] E. Karzbrun, J. Shin, R. H. Bar-Ziv, and V. Noireaux, “Coarse-Grained Dynamics of Protein Synthesis in a Cell-Free System,” Phys. Rev. Lett., vol. 106, no. 4, p. 048104, Jan. 2011.
[108] J. Shin and V. Noireaux, “Efficient cell-free expression with the endogenous E. Coli RNA polymerase and sigma factor 70,” J. Biol. Eng., vol. 4, no. 1, p. 8, 2010.
[109] D. E. Atkinson, “Energy charge of the adenylate pool as a regulatory parameter. Interaction with feedback modifiers,” Biochemistry, vol. 7, no. 11, pp. 4030–4034, Nov. 1968.
[110] H. Bremer, P. Dennis, and M. Ehrenberg, “Free RNA polymerase and modeling global transcription in Escherichia coli.,” Biochimie, vol. 85, no. 6, pp. 597–609, Jun. 2003.
[111] D. Wojtkowiak, C. Georgopoulos, and M. Zylicz, “Isolation and characterization of ClpX, a new ATP-dependent specificity component of the Clp protease of Escherichia coli.,” J. Biol. Chem., vol. 268, no. 30, pp. 22609–17, Oct. 1993.
[112] W. R. McClure, “A biochemical analysis of the effect of RNA polymerase concentration on the in vivo control of RNA chain initiation frequency.,” in Biochemistry of Metabolic Processes, R. N. Lennon, D. L. F., Stratman, F. W. & Zahlten, Ed. Elsevier, 1983, pp. 207–217.
[113] P. P. Dennis and H. Bremer, “Modulation of Chemical Composition and Other Parameters of the Cell at Different Exponential Growth Rates,” EcoSal Plus, vol. 3, no. 1, Sep. 2008.
[114] P. P. Dennis, M. Ehrenberg, and H. Bremer, “Control of rRNA Synthesis in Escherichia coli: a Systems Biology Approach,” Microbiol. Mol. Biol. Rev., vol. 68, no. 4, pp. 639–668, Dec. 2004.
[115] E. M. Owens and G. N. Gussin, “Differential binding of RNA polymerase to
120
the pRM and pR promoters of bacteriophage lambda.,” Gene, vol. 23, no. 2, pp. 157–66, Aug. 1983.
[116] S. Cayley, B. A. Lewis, H. J. Guttman, and M. T. Record, “Characterization of the cytoplasm of Escherichia coli K-12 as a function of external osmolarity. Implications for protein-DNA interactions in vivo.,” J. Mol. Biol., vol. 222, no. 2, pp. 281–300, Nov. 1991.
[117] N. Shepherd, P. Dennis, and H. Bremer, “Cytoplasmic RNA Polymerase in Escherichia coli.,” J. Bacteriol., vol. 183, no. 8, pp. 2527–34, Apr. 2001.
[118] M. Jishage, A. Iwata, S. Ueda, and A. Ishihama, “Regulation of RNA polymerase sigma subunit synthesis in Escherichia coli: intracellular levels of four species of sigma subunit under various growth conditions.,” J. Bacteriol., vol. 178, no. 18, pp. 5447–5451, Sep. 1996.
[119] H. Maeda, N. Fujita, and A. Ishihama, “Competition among seven Escherichia coli sigma subunits: relative binding affinities to the core RNA polymerase.,” Nucleic Acids Res., vol. 28, no. 18, pp. 3497–503, Sep. 2000.
[120] D. Kennell and H. Riezman, “Transcription and translation initiation frequencies of the Escherichia coli lac operon.,” J. Mol. Biol., vol. 114, no. 1, pp. 1–21, Jul. 1977.
[121] S. Takahashi et al., “70 S ribosomes bind to Shine-Dalgarno sequences without required dissociations.,” Chembiochem, vol. 9, no. 6, pp. 870–3, Apr. 2008.
[122] K. A. Underwood, J. R. Swartz, and J. D. Puglisi, “Quantitative polysome analysis identifies limitations in bacterial cell-free protein synthesis.,” Biotechnol. Bioeng., vol. 91, no. 4, pp. 425–35, Aug. 2005.
[123] Z. Z. Sun, E. Yeung, C. A. Hayes, V. Noireaux, and R. M. Murray, “Linear DNA for rapid prototyping of synthetic biological circuits in an Escherichia coli based TX-TL cell-free system.,” ACS Synth. Biol., vol. 3, no. 6, pp. 387–97, Jun. 2014.
[124] W. Liebermeister, E. Noor, A. Flamholz, D. Davidi, J. Bernhardt, and R. Milo, “Visual account of protein investment in cellular functions.,” Proc. Natl. Acad. Sci. U. S. A., vol. 111, no. 23, pp. 8488–93, Jun. 2014.
[125] J. Shin and V. Noireaux, “Study of messenger RNA inactivation and protein degradation in an Escherichia coli cell-free expression system,” J. Biol. Eng., vol. 4, no. 1, p. 9, Jul. 2010.
[126] J. M. Flynn, S. B. Neher, Y. I. Kim, R. T. Sauer, and T. A. Baker, “Proteomic discovery of cellular substrates of the ClpXP protease reveals five classes of ClpX-recognition signals.,” Mol. Cell, vol. 11, no. 3, pp. 671–83, Mar. 2003.
[127] M. M. Jore et al., “Structural basis for CRISPR RNA-guided DNA recognition by Cascade,” Nat. Struct. Mol. Biol., vol. 18, no. 5, pp. 529–536, May 2011.
[128] K. S. Makarova, F. Zhang, and E. V. Koonin, “SnapShot: Class 1 CRISPR-Cas Systems,” Cell, vol. 168, no. 5, p. 946–946.e1, Feb. 2017.
[129] K. S. Makarova, F. Zhang, and E. V. Koonin, “SnapShot: Class 2 CRISPR-Cas Systems,” Cell, vol. 168, no. 1–2, p. 328–328.e1, Jan. 2017.
[130] E. V. Koonin, “Evolution of RNA- and DNA-guided antivirus defense systems in prokaryotes and eukaryotes: common ancestry vs convergence,” Biol. Direct, vol. 12, no. 1, p. 5, Dec. 2017.
[131] R. Jansen, J. D. A. van Embden, W. Gaastra, and L. M. Schouls, “Identification of genes that are associated with DNA repeats in prokaryotes.,” Mol. Microbiol.,
121
vol. 43, no. 6, pp. 1565–75, Mar. 2002. [132] A. Bolotin, B. Quinquis, A. Sorokin, and S. D. Ehrlich, “Clustered regularly
interspaced short palindrome repeats (CRISPRs) have spacers of extrachromosomal origin.,” Microbiology, vol. 151, no. Pt 8, pp. 2551–61, Aug. 2005.
[133] F. J. M. Mojica, C. Díez-Villaseñor, J. García-Martínez, and E. Soria, “Intervening sequences of regularly spaced prokaryotic repeats derive from foreign genetic elements.,” J. Mol. Evol., vol. 60, no. 2, pp. 174–82, Feb. 2005.
[134] E. Deltcheva et al., “CRISPR RNA maturation by trans-encoded small RNA and host factor RNase III.,” Nature, vol. 471, no. 7340, pp. 602–7, Mar. 2011.
[135] M. Jinek, K. Chylinski, I. Fonfara, M. Hauer, J. A. Doudna, and E. Charpentier, “A Programmable Dual-RNA-Guided DNA Endonuclease in Adaptive Bacterial Immunity,” Science (80-. )., vol. 337, no. 6096, pp. 816–821, Aug. 2012.
[136] K. S. Makarova et al., “An updated evolutionary classification of CRISPR–Cas systems,” Nat. Rev. Microbiol., vol. 13, no. 11, pp. 722–736, Nov. 2015.
[137] S. Shmakov et al., “Discovery and Functional Characterization of Diverse Class 2 CRISPR-Cas Systems,” Mol. Cell, vol. 60, no. 3, pp. 385–397, Nov. 2015.
[138] O. O. Abudayyeh et al., “C2c2 is a single-component programmable RNA-guided RNA-targeting CRISPR effector,” Science (80-. )., vol. 353, no. 6299, p. aaf5573, Aug. 2016.
[139] E. Kim et al., “In vivo genome editing with a small Cas9 orthologue derived from Campylobacter jejuni,” Nat. Commun., vol. 8, p. 14500, Feb. 2017.
[140] B. P. Kleinstiver et al., “Genome-wide specificities of CRISPR-Cas Cpf1 nucleases in human cells,” Nat. Biotechnol., vol. 34, no. 8, pp. 869–874, Aug. 2016.
[141] S. Mulepati and S. Bailey, “In Vitro Reconstitution of an Escherichia coli RNA-guided Immune System Reveals Unidirectional, ATP-dependent Degradation of DNA Target,” J. Biol. Chem., vol. 288, no. 31, pp. 22184–22192, Aug. 2013.
[142] B. Zetsche et al., “Multiplex gene editing by CRISPR–Cpf1 using a single crRNA array,” Nat. Biotechnol., vol. 35, no. 1, pp. 31–34, Dec. 2016.
[143] F. J. M. Mojica, C. Díez-Villaseñor, J. García-Martínez, and C. Almendros, “Short motif sequences determine the targets of the prokaryotic CRISPR defence system.,” Microbiology, vol. 155, no. Pt 3, pp. 733–40, Mar. 2009.
[144] G. Gasiunas, R. Barrangou, P. Horvath, and V. Siksnys, “Cas9-crRNA ribonucleoprotein complex mediates specific DNA cleavage for adaptive immunity in bacteria,” Proc. Natl. Acad. Sci., vol. 109, no. 39, pp. E2579–E2586, Sep. 2012.
[145] P. D. Hsu, E. S. Lander, and F. Zhang, “Development and Applications of CRISPR-Cas9 for Genome Engineering,” Cell, vol. 157, no. 6, pp. 1262–1278, Jun. 2014.
[146] R. Barrangou and J. A. Doudna, “Applications of CRISPR technologies in research and beyond.,” Nat. Biotechnol., vol. 34, no. 9, pp. 933–941, Sep. 2016.
[147] L. A. Gilbert et al., “Genome-Scale CRISPR-Mediated Control of Gene Repression and Activation,” Cell, vol. 159, no. 3, pp. 647–661, Oct. 2014.
[148] L. S. Qi et al., “Repurposing CRISPR as an RNA-Guided Platform for Sequence-Specific Control of Gene Expression,” Cell, vol. 152, no. 5, pp. 1173–1183, Feb. 2013.
122
[149] D. Bikard, W. Jiang, P. Samai, A. Hochschild, F. Zhang, and L. A. Marraffini, “Programmable repression and activation of bacterial gene expression using an engineered CRISPR-Cas system,” Nucleic Acids Res., vol. 41, no. 15, pp. 7429–7437, Aug. 2013.
[150] E. R. Westra et al., “CRISPR Immunity Relies on the Consecutive Binding and Degradation of Negatively Supercoiled Invader DNA by Cascade and Cas3,” Mol. Cell, vol. 46, no. 5, pp. 595–605, Jun. 2012.
[151] V. Mekler, L. Minakhin, E. Semenova, K. Kuznedelov, and K. Severinov, “Kinetics of the CRISPR-Cas9 effector complex assembly and the role of 3′-terminal segment of guide RNA,” Nucleic Acids Res., vol. 44, no. 6, pp. 2837–2845, Apr. 2016.
[152] J. Chappell, M. K. Takahashi, S. Meyer, D. Loughrey, K. E. Watters, and J. Lucks, “The centrality of RNA for engineering gene expression.,” Biotechnol. J., vol. 8, no. 12, pp. 1379–95, Dec. 2013.
[153] E. A. Boyle et al., “High-throughput biochemical profiling reveals sequence determinants of dCas9 off-target binding and unbinding,” Proc. Natl. Acad. Sci., vol. 114, no. 21, pp. 5461–5466, May 2017.
[154] W. Jiang, D. Bikard, D. Cox, F. Zhang, and L. A. Marraffini, “RNA-guided editing of bacterial genomes using CRISPR-Cas systems,” Nat. Biotechnol., vol. 31, no. 3, pp. 233–239, Mar. 2013.
[155] B. Zetsche et al., “Cpf1 Is a Single RNA-Guided Endonuclease of a Class 2 CRISPR-Cas System,” Cell, vol. 163, no. 3, pp. 759–771, Oct. 2015.
[156] R. T. Leenay et al., “Identifying and Visualizing Functional PAM Diversity across CRISPR-Cas Systems,” Mol. Cell, vol. 62, no. 1, pp. 137–147, Apr. 2016.
[157] M. L. Luo, A. S. Mullis, R. T. Leenay, and C. L. Beisel, “Repurposing endogenous type I CRISPR-Cas systems for programmable gene repression,” Nucleic Acids Res., vol. 43, no. 1, pp. 674–681, Jan. 2015.
[158] D. Rath, L. Amlinger, M. Hoekzema, P. R. Devulapally, and M. Lundgren, “Efficient programmable gene silencing by Cascade,” Nucleic Acids Res., vol. 43, no. 1, pp. 237–246, Jan. 2015.
[159] J. Bondy-Denomy et al., “Multiple mechanisms for CRISPR–Cas inhibition by anti-CRISPR proteins,” Nature, vol. 526, no. 7571, pp. 136–139, Oct. 2015.
[160] A. Pawluk et al., “Inactivation of CRISPR-Cas systems by anti-CRISPR proteins in diverse bacterial species,” Nat. Microbiol., vol. 1, no. 8, p. 16085, Aug. 2016.
[161] A. Pawluk et al., “Naturally Occurring Off-Switches for CRISPR-Cas9,” Cell, vol. 167, no. 7, p. 1829–1838.e9, Dec. 2016.
[162] B. J. Rauch et al., “Inhibition of CRISPR-Cas9 with Bacteriophage Proteins,” Cell, vol. 168, no. 1–2, p. 150–158.e10, Jan. 2017.
[163] A. Pawluk, A. R. Davidson, and K. L. Maxwell, “Anti-CRISPR: discovery, mechanism and function,” Nat. Rev. Microbiol., vol. 16, no. 1, pp. 12–17, Jan. 2018.
[164] A. P. Hynes et al., “An anti-CRISPR from a virulent streptococcal phage inhibits Streptococcus pyogenes Cas9,” Nat. Microbiol., vol. 2, no. 10, pp. 1374–1380, Oct. 2017.
[165] B. P. Kleinstiver et al., “Engineered CRISPR-Cas9 nucleases with altered PAM specificities,” Nature, vol. 523, no. 7561, pp. 481–485, Jun. 2015.
123
[166] L. B. Harrington et al., “A Broad-Spectrum Inhibitor of CRISPR-Cas9,” Cell, vol. 170, no. 6, p. 1224–1233.e15, Sep. 2017.
[167] T. Karvelis, G. Gasiunas, and V. Siksnys, “Methods for decoding Cas9 protospacer adjacent motif (PAM) sequences: A brief overview,” Methods, vol. 121–122, pp. 3–8, May 2017.
[168] R. T. Leenay and C. L. Beisel, “Deciphering, Communicating, and Engineering the CRISPR PAM,” J. Mol. Biol., vol. 429, no. 2, pp. 177–191, Jan. 2017.
[169] I. Fonfara, H. Richter, M. Bratovič, A. Le Rhun, and E. Charpentier, “The CRISPR-associated DNA-cleaving enzyme Cpf1 also processes precursor CRISPR RNA,” Nature, vol. 532, no. 7600, pp. 517–521, Apr. 2016.
[170] T. Karvelis et al., “Rapid characterization of CRISPR-Cas9 protospacer adjacent motif sequence elements,” Genome Biol., vol. 16, no. 1, p. 253, Dec. 2015.
[171] R. H. Dahl et al., “Engineering dynamic pathway regulation using stress-response promoters.,” Nat. Biotechnol., vol. 31, no. 11, pp. 1039–46, Nov. 2013.
[172] F. Moser et al., “Genetic circuit performance under conditions relevant for industrial bioreactors.,” ACS Synth. Biol., vol. 1, no. 11, pp. 555–64, Nov. 2012.
[173] W. J. Holtz and J. D. Keasling, “Engineering Static and Dynamic Control of Synthetic Pathways,” Cell, vol. 140, no. 1, pp. 19–23, Jan. 2010.
[174] M. H. Medema, R. Breitling, R. Bovenberg, and E. Takano, “Exploiting plug-and-play synthetic biology for drug discovery and production in microorganisms.,” Nat. Rev. Microbiol., vol. 9, no. 2, pp. 131–7, Feb. 2011.
[175] C. Osswald et al., “Modular construction of a functional artificial epothilone polyketide pathway.,” ACS Synth. Biol., vol. 3, no. 10, pp. 759–72, Oct. 2014.
[176] L. Steidler et al., “Treatment of Murine Colitis by Lactococcus lactis Secreting Interleukin-10,” Science (80-. )., vol. 289, no. 5483, pp. 1352–1355, Aug. 2000.
[177] J. C. Anderson, E. J. Clarke, A. P. Arkin, and C. A. Voigt, “Environmentally controlled invasion of cancer cells by engineered bacteria.,” J. Mol. Biol., vol. 355, no. 4, pp. 619–27, Jan. 2006.
[178] W. C. Ruder, T. Lu, and J. J. Collins, “Synthetic Biology Moving into the Clinic,” Science (80-. )., vol. 333, no. 6047, pp. 1248–1252, Sep. 2011.
[179] J.-P. Motta et al., “Food-grade bacteria expressing elafin protect against inflammation and restore colon homeostasis.,” Sci. Transl. Med., vol. 4, no. 158, p. 158ra144, Oct. 2012.
[180] S. Gupta, E. E. Bram, and R. Weiss, “Genetically programmable pathogen sense and destroy.,” ACS Synth. Biol., vol. 2, no. 12, pp. 715–23, Dec. 2013.
[181] F. K. Balagaddé, L. You, C. L. Hansen, F. H. Arnold, and S. R. Quake, “Long-term monitoring of bacteria undergoing programmed population control in a microchemostat.,” Science, vol. 309, no. 5731, pp. 137–40, Jul. 2005.
[182] H. M. Salis, E. A. Mirsky, and C. A. Voigt, “Automated design of synthetic ribosome binding sites to control protein expression.,” Nat. Biotechnol., vol. 27, no. 10, pp. 946–50, Oct. 2009.
[183] V. K. Mutalik et al., “Precise and reliable gene expression via standard transcription and translation initiation elements.,” Nat. Methods, vol. 10, no. 4, pp. 354–60, Apr. 2013.
[184] G. Rodrigo and A. Jaramillo, “AutoBioCAD: full biodesign automation of genetic circuits.,” ACS Synth. Biol., vol. 2, no. 5, pp. 230–6, May 2013.
124
[185] J. Chappell, M. K. Takahashi, and J. B. Lucks, “Creating small transcription activating RNAs,” Nat. Chem. Biol., vol. 11, no. 3, pp. 214–220, Mar. 2015.
[186] S. Basu, R. Mehreja, S. Thiberge, M.-T. Chen, and R. Weiss, “Spatiotemporal control of gene expression with pulse-generating networks.,” Proc. Natl. Acad. Sci. U. S. A., vol. 101, no. 17, pp. 6355–60, Apr. 2004.
[187] U. Alon, An Introduction to Systems Biology: Design Principles of Biological Circuits. Chapman and Hall/CRC, 2013.
[188] R. Milo, S. Shen-Orr, S. Itzkovitz, N. Kashtan, D. Chklovskii, and U. Alon, “Network Motifs: Simple Building Blocks of Complex Networks,” Science (80-. )., vol. 298, no. 5594, pp. 824–827, Oct. 2002.
[189] S. S. Shen-Orr, R. Milo, S. Mangan, and U. Alon, “Network motifs in the transcriptional regulation network of Escherichia coli,” Nat. Genet., vol. 31, no. 1, pp. 64–68, May 2002.
[190] R. Entus, B. Aufderheide, and H. M. Sauro, “Design and implementation of three incoherent feed-forward motif based biological concentration sensors.,” Syst. Synth. Biol., vol. 1, no. 3, pp. 119–28, Aug. 2007.
[191] S. Kaplan, A. Bren, E. Dekel, and U. Alon, “The incoherent feed-forward loop can generate non-monotonic input functions for genes.,” Mol. Syst. Biol., vol. 4, p. 203, Jul. 2008.
[192] F. Barone et al., “Design and evaluation of an incoherent feed-forward loop for an arsenic biosensor based on standard iGEM parts,” Synth. Biol., vol. 2, no. 1, Jan. 2017.
[193] M. Osella, C. Bosia, D. Corá, and M. Caselle, “The role of incoherent microRNA-mediated feedforward loops in noise buffering.,” PLoS Comput. Biol., vol. 7, no. 3, p. e1001101, Mar. 2011.
[194] A. O’Dwyer, “PID control: the early years,” in Control in the IT Sector Seminar, 2005.
[195] “I. On governors,” Proc. R. Soc. London, vol. 16, pp. 270–283, Dec. 1868. [196] S. Bennet, “A brief history of automatic control,” IEEE Control Syst., vol. 16, no.
3, pp. 17–25, Jun. 1996. [197] D. Del Vecchio, A. J. Dy, and Y. Qian, “Control theory meets synthetic biology.,”
J. R. Soc. Interface, vol. 13, no. 120, 2016. [198] D. F. Savage, J. Way, and P. A. Silver, “Defossiling fuel: how synthetic biology
can transform biofuel production.,” ACS Chem. Biol., vol. 3, no. 1, pp. 13–6, Jan. 2008.
[199] P. P. Peralta-Yahya, F. Zhang, S. B. del Cardayre, and J. D. Keasling, “Microbial engineering for the production of advanced biofuels,” Nature, vol. 488, no. 7411, pp. 320–328, Aug. 2012.
[200] L. T. Bereza-Malcolm, G. Mann, and A. E. Franks, “Environmental Sensing of Heavy Metals Through Whole Cell Microbial Biosensors: A Synthetic Biology Approach,” ACS Synth. Biol., vol. 4, no. 5, pp. 535–546, May 2015.
[201] D. Chakravarti and W. W. Wong, “Synthetic biology in cell-based cancer immunotherapy,” Trends Biotechnol., vol. 33, no. 8, pp. 449–461, Aug. 2015.
[202] M. Chevalier, M. Gómez-Schiavon, A. Ng, and H. El-Samad, “Design and analysis of a Proportional-Integral-Derivative controller with biological molecules,” bioRxiv, p. 303545, Apr. 2018.
125
[203] S. K. Aoki, G. Lillacci, A. Gupta, A. Baumschlager, D. Schweingruber, and M. Khammash, “A universal biomolecular integral feedback controller for robust perfect adaptation,” Nature, vol. 570, no. 7762, pp. 533–537, Jun. 2019.


![Characterization of the [2Fe-2S] Cluster of Escherichia coli Transcription Factor IscR](https://static.fdokumen.com/doc/165x107/6339a597921908e04f0f8b95/characterization-of-the-2fe-2s-cluster-of-escherichia-coli-transcription-factor.jpg)