Shear Strength Model for Reinforced Concrete Columns with Low Transverse Reinforcement Ratios
Upload
khangminh22Category
view
1download
0
Delivered by ICEVirtualLibrary.com to:
IP: 194.143.169.130
On: Thu, 09 Jun 2011 09:26:49
Design of normal- and high-strengthconcrete columnsA. N. Beal, BSc, CEng, MICE, MIStructE, and N. Khalil, BSc, PhD, MACI, MASCE
& Research by Khalil to verify and develop
Beal's graphical method of buckling
analysis con®rms that Beal's method is
accurate and e�ective, giving results
which agree well with experimental data.
The method provides a powerful analytical
tool, allowing fast determination of the
column capacity for a wide range of
slenderness and loading conditions. It is
used here to investigate the behaviour of
normal- and high-strength concrete
columns under both axial and eccentric
loads and with a variety of slenderness
ratios and reinforcement proportions. The
results of this accurate analysis are used
as a benchmark for the assessment of code
of practice design rules. Existing BS 8110
design rules are found to give poor agree-
ment with both the theoretical analysis
and experimental results. New design
rules which give more consistent and
accurate results are proposed.
Keywords: buildings, structure & design;
columns; concrete structures
IntroductionThe analysis of slender reinforced concrete
columns is complicated because the buckling
analysis must take account of the non-linear
properties of the materials and also construction
imperfections. Exact analysis methods are gen-
erally complicated and unsuitable for everyday
design. Codes of practice recommend various
design methods for slender columns based on
capacity reduction factors, additional design
moments, or moment magni®cation, to account
for the e�ects of buckling. These methods are
approximate and largely empirical in nature.
There is now considerable interest in the use of
high-strength concrete in columns, which can
allow columns that are more slender to be used
to sustain high loads. Therefore one of the
objectives of the present study is to investigate
the theoretical behaviour of such columns, in
order to establish suitable rules for their design.
2. A simple graphical technique has been
proposed by Beal for rigorous analysis of pin-
ended slender reinforced concrete columns.1
Firstly, graphs of load eccentricity against
section curvature are prepared for various
values of applied axial load. Then a second set
of graphs is prepared which plot the de¯ected
shape of the column as it buckles, relating its
mid-height de¯ection to the maximum section
curvature. The de¯ection is calculated assum-
ing a sine curve for the de¯ected shape of the
column
Dh� 1
p2Lh
� �2 hR
�1�
where D is the de¯ection, L is the column
e�ective length, h is the column width in the
direction of buckling and R is the radius of
curvature. By overlaying the two graphs, the
section capacity can be established (see Fig. 1).
Once section moment±curvature relationships
are established, this technique allows rapid
determination of column capacity under any
combination of slenderness ratio and initial
eccentricity.
3. Beal's original paper set out the theoreti-
cal basis of the graphical analysis method.
Design recommendations were presented for
columns made from normal-strength concrete
(up to 50 N/mm2 cube strength) and it was
shown that these gave better agreement with
test results than existing UK codes of practice.
Compared with Cranston's long-term test
results,2 Beal's analysis gave ratios
(Ptest=Ptheory� of 0´97±1´97, with a mean of 1´28
and a coe�cient of variation of 0´16, a con-
siderable improvement over existing design
methods (see later). In the discussion of Beal's
paper,3 Drs Maisel and Beeby showed that a
computer program devised by Cranston for non-
linear buckling analysis gave very similar
results to the graphical analysis, for both peak
load and column de¯ection (see Figs 12 and 13
in Reference 3). In the same discussion, Dr
Wong described an alternative graphical analy-
sis method which he and Professor Kong have
developed; he con®rmed that in his opinion this
should also give similar results.
4. At Leeds University, Dinku4 investigated
the proposed analytical method in the light of
existing experimental data reviewed by Cran-
ston. Dinku developed computer programs to
generate load eccentricity±curvature graphs in
terms of capacity ratio (P=Po), based on stress±
strain relationships for concrete and steel. His
research veri®ed that the graphical analysis
method predicts the capacity of concentrically
or eccentrically loaded pin-ended slender
columns quickly and accurately.
5. The work of Beal and Dinku encouraged
further research by Khalil, which is summar-
ized here. Following her veri®cation of the
accuracy of the graphical analysis method,
A. N. Beal,
Associate, Thomason
Partnership,
Leeds
N. Khalil,
Assistant Professor,
Department of Civil
Engineering,
University of
Balamand, Tripoli,
Lebanon
345
Proc. Instn Civ.
Engrs Structs &
Bldgs, 1999, 134,
Nov., 345 ± 357
Paper 11847
Written discussion
closes 31 May
2000

Delivered by ICEVirtualLibrary.com to:
IP: 194.143.169.130
On: Thu, 09 Jun 2011 09:26:49
it was used to carry out a comprehensive
theoretical investigation of the behaviour of
reinforced concrete columns made from both
normal- and high-strength concrete. The e�ects
of creep, cracking, initial imperfections and
non-linear stress±strain curves were all taken
into account in the analysis, which covered a
wide range of load eccentricities and also the
full practical range of column slenderness. The
results from existing (BS 8110) design rules
were compared with the answers from the
accurate analysis. The results from the accurate
analysis were then used as a benchmark for
developing new design recommendations for
both normal- and high-strength concrete
columns. These new design recommendations
give more consistent and reliable results.
Research by Khalil6. The computer programs developed by
Dinku to generate graphs for eccentricity
against curvature for di�erent capacity ratios
(P=P0) were limited in their application and
were based on CP 1105 stress±strain relation-
ships for concrete and steel. Therefore it was
necessary to generalize these programs to deal
with di�erent locations of reinforcement and to
take account of long-term e�ects and also to
update them using the BS 8110 stress±strain
diagrams for concrete and steel.
7. In the test programme, eleven reinforced
concrete columns with slenderness ratios
between 18 and 63 were tested under short-term
load and eight similar columns tested under
sustained load. Details of the experimental
investigation including descriptions of test
columns, concrete properties, test procedures
and discussion of the observations made are
fully covered elsewhere.6,7 In these tests, the
experimental buckling load and mid-height
eccentricity at the point of instability were
measured and compared with theoretical pre-
dictions (Table 1).
8. In the long-term tests, a load of 60% of
short-term failure load was applied to 28-day-
old columns and maintained for a period of 90
days. If at the end of this period the column had
not failed, it was then subjected to an increas-
ing short-term load until failure. Applying this
short-term load at the end of the loading period
will tend to produce a rather higher apparent
strength than if the entire load were long term,
so the tests indicate a good agreement between
the theoretical predictions and experimental
results. Close agreement was also obtained
between theoretical and actual column de¯ec-
tions at failure.
9. To provide a general indication of the
validity and accuracy of the proposed theory,
comparisons with other published tests were
carried out. These are shown in Table 2.
The BS 8110 method10. It should be noted that the `additional
moment' theory used for slender column design
in BS 811012 is open to serious theoretical
objections (see }79±82 of Reference 3).
11. BS 8110 estimates the buckling de¯ec-
tion of a column at failure on the basis that
(a) the maximum concrete compressive strain
is 0´0035
(b) the maximum steel tensile strain is 0´002
(c) initial imperfections are allowed for by an
initial eccentricity of 0´05h unless the
applied moment exceeds this, in which case
the allowance for imperfections is zero
(d ) at higher compressive stresses, the
assumed buckling de¯ection is reduced
using an interaction formula by a factor K ,
on the assumption that the steel tensile
strain at failure will not exceed 0´002.
12. Based on this estimate of column buck-
ling de¯ection, an additional moment is calcu-
lated which is added to the applied design
moment and the column section is then
Table 1. Comparison between theoretical predictions and Khalil's test results
Short-term tests Long-term tests
Description Ptest/Ptheory etest/etheory Ptest/Ptheory etest/etheory
Mean 0´99 1´17 1´26 1´15
Range 0´86±1´22 1´01±1´38 1´05±1´53 0´97±1´33
Coe�cient of variation 0´13 0´10 0´14 0´09
Number of tests 11 8
Table 2. Comparison with published test results (Ptest/Ptheory)
Short-term tests Long-term tests
Statistical parameter Pancholi8 Dracos9 Ramu10 Goyal11
Minimum 0´72 0´83 0´91 1´00
Maximum 1´20 1´14 1´46 1´32
Mean 0´89 0´98 1´17 1´15
Standard deviation 0´13 0´09 0´14 0´07
Coe�cient of variation 0´15 0´09 0´12 0´06
Number of tests 29 36 29 20
346
Fig. 1. Overlay of
graphs to establish
slender column and
capacity
BEAL AND KHALIL

Delivered by ICEVirtualLibrary.com to:
IP: 194.143.169.130
On: Thu, 09 Jun 2011 09:26:49
designed to resist the total combined moment.
The section strength is calculated on the basis
of full plasticity, with a maximum concrete
strain of 0´0035 and allowable steel strains in
excess of yield.
13. However, the following points should be
noted.
(a) Buckling failure in a slender column
typically occurs at stresses and strains
well below the values associated with
fully plastic material failure.
(b) As noted earlier, the assumed concrete
strain limit of 0´0035 is for short-term
loads; under long-term loading (which is
more relevant to real structures), creep
increases the maximum strain to two to
three times this value.
(c) For 460 N/mm2 steel reinforcement, the
tensile strain at yield is 0´0023Ðnot 0´002
as assumedÐand in any case the reinforce-
ment can be stressed past its yield point,
developing strains far in excess of 0´002.
(d ) The `¯at rate' allowance of 0´05h to cover
initial imperfections in an axially loaded
column is too crude and it is a mistake to
ignore the e�ects of initial imperfections on
the strength of an eccentrically-loaded
column.
14. It is strange that the BS 8110 additional
moments are calculated on the assumption that
the steel tensile strain is always less than its
elastic limit (0´002) whereas the concrete com-
pressive strain is taken up to its plastic limit
(0´0035). To compound the problem, these
moments are then applied to a section whose
strength is calculated on the assumption that
both the steel and the concrete can be stressed
right up to their plastic limits. Then the
calculation is done on the basis of short-term
material properties, despite the fact that real
columns carry long-term loads. Thus the BS
8110 analysis is not based on a consistent,
logical assessment of column behaviour in
either elastic or plastic conditions. The failure
to allow properly for the e�ects of creep is a
serious omission.
15. Some of the assumptions underlying the
BS 8110 method are very conservative but
others are over optimistic. Therefore when com-
pared with an accurate rigorous analysis, the
results are likely to vary unpredictably, being
overconservative in some cases and possibly
unsafe in others. Most published comparisons
between the BS 8110 method and test results
consider only short-term tests and these often
show reasonable correlations, albeit with high
coe�cients of variation. However, comparisons
with long-term test results (which are more
relevant to real design) show that, in tests, a
disturbing number of failures have occurred at
loads well below those predicted by the code.
Cranston's original report on the development
of the code design method2 included a table of
experimental results from long-term load tests
and in Reference 1 these were compared with
the results from CP 110 (which is very similar
to BS 8110) and Beal's analysis. The results are
summarized in Table 3. As can be seen, the CP
110 method gave poor prediction of experi-
mental results, with a high coe�cient of varia-
tion and test columns failing at as little as 56%
of the predicted load. Beal's analysis gave much
better results, with a reduced coe�cient of
variation and test `failures' almost eliminated.
16. It should be noted that the draft Euro-
code EC2 for concrete design adopts a di�erent
formulation of the `additional moment' method
from BS 8110. The EC2 treatment is more
logical in some respects, particularly its treat-
ment of initial imperfections (where the initial
imperfection is taken as L/400), and when
compared with an accurate theoretical analysis
it gives more consistent and reasonable results
than BS 8110.13 However, it still lacks the ®rm
logical basis that is an essential requirement
for any important structural calculation.
17. In principle, the problems identi®ed in
the BS 8110 method could be dealt with by
recalculating the additional moments to take
proper account of steel post-yield behaviour
and concrete creep to give appropriate values
for use with plastic ultimate section strength
but the results would be extremely conservative
and unlikely to be acceptable. The problem is
that by the time that a column develops its full
plastic moment resistance at mid-height, it has
usually buckled so badly that it can carry very
little load.
18. As an alternative, both the buckling
de¯ection and the section strength could be
calculated on the basis of elastic theory. This
would be more logical and appropriate, as
buckling usually occurs at stresses which are in
the elastic range, so an elastic analysis would
probably give better results than plastic theory.
However, the results would still be conservative
and concrete designers would need to relearn
elastic theory, which is distinctly unfashionable
among present-day engineers.
19. The problem is that the buckling be-
haviour of a reinforced concrete column is too
complex to be accurately modelled by a simple
theoretical analysis. To achieve better results
than present-day codes, a semi-empirical
approach is the most realistic way forward. It
Table 3. Ratio (test/theory) for CP110/BS 8110 and
Beal's analysis compared with Cranston's published
long-term test results1
Method Mean Range
Coe�cient of
variation
CP 110/BS 8110 0´94 0´56±1´42 0´22
Beal's analysis 1´28 0´97±1´97 0´16
347
DESIGN OF NORMAL-
AND HIGH-STRENGTH
CONCRETE COLUMNS
Delivered by ICEVirtualLibrary.com to:
IP: 194.143.169.130
On: Thu, 09 Jun 2011 09:26:49
would be di�cult and costly to test all possible
types of column and loading in the laboratory.
However, if a practical, accurate method of
theoretical analysis is established and proved
to give satisfactory results, it is then possible
to carry out a comprehensive investigation of
column behaviour and the e�ects all the various
factors can have on column strength can be
analysed and quanti®ed. The results of the
accurate theoretical analysis will then provide a
benchmark against which the results from
various design rules can be assessed and the
design methods can be optimized by adjusting
the values of key parameters in order to give
the best results.
Safety factors20. Before proceeding further, it should also
be noted that there are problems in applying
the partial factor system favoured by current
limit state codes to the analysis and design of
slender concrete columns. Codes such as BS
8110 and EC2 divide the structure's safety
factor into two parts: a load factor gL applied to
loads; and a materials factor gm applied to the
material strength (e.g. concrete cube strength or
steel yield stress). However, Young's modulus
for concrete is proportional only to the square
root of the cube strength and for steel it does
not vary with yield stress at all. Thus in these
codes there is e�ectively only a reduced partial
safety factor applied to concrete sti�ness and
no factor at all on the sti�ness of reinforcing
steel. As the strength of a slender column
depends primarily on its sti�ness, BS 8110's
partial factor theory would lead to the conclu-
sion that a slender column should have a lower
safety factor than a stocky column, which is
surely wrong.
21. Buckling failure can occur suddenly,
with little warning and minimal scope for
bene®cial redistribution of load and there is a
strong case for saying that the safety factor
against this type of failure should be at least as
high as that for other more ductile failure
modes such as ¯exural bending. To achieve a
consistent safety factor, it is necessary to adopt
either a global overall safety factor on the
column strength (as used in permissible stress
codes), or, if partial factors are to be used, the
`materials' factor should be applied to the
member strength (as in the American `resistance
factor') rather than to the material strength
(as in the BS 8110 and EC2 `materials
factors').
22. (It should be noted that only part of BS
8110's `material factor' for 1´5 on concrete
should be considered as a safety factor. Because
of inferior placing and curing conditions, con-
crete in real structures has typically only about
75% of the strength of laboratory test cubes.14
The e�ective safety factor on concrete in a real
BS 8110 design is thus about 1´56 0´75= 1´12,
which compares with the steel partial factor of
1´15 (reduced to 1´05 in the most recent revision
of BS 8110).)
Analysis of normal- and high-strengthconcrete columns23. Following the research work by Khalil
outlined earlier, the graphical analysis method
was used to investigate slender column beha-
viour over the full realistic range of concrete
strengths, including high-strength concrete.
The theoretical column load capacity was
calculated for a wide range of slenderness
ratios and load eccentricities, taking into
account the e�ects of initial imperfections and
concrete creep.
24. The analysis covered concrete cube
strengths from 20 N/mm2 to 100 N/mm2. The
BS 811012 stress±strain curve (Fig. 2) was used
to de®ne concrete short-term behaviour, but for
concrete with cube strengths over 60 N/mm2 the
peak compressive strain was limited to
e=0´00357 (( fcu7 60)/50 000). As columns in
real structures generally support predominantly
long-term loads, this was the condition con-
sidered in the analysis. The concrete short-term
stress±strain curve was modi®ed for long-term
loading by the creep factor f, with a value of
2´0 for cube strengths up to 30 N/mm2. For
higher concrete strengths this was reduced to
fhsc = fp(40/( fcu + 10)), giving creep factors
ranging from 2´00 for 20 N/mm2 concrete to 1´21
for 100 N/mm2 concrete. Combining the various
factors, the concrete ultimate long-term com-
pressive failure strain ranged from 0´0105 for
20 N/mm2 concrete to 0´00595 for 100 N/mm2
concrete.
Parabolic curve
5·5√fcu/γm kN/mm2
2·4 × 10–4√fcu/γm
0·67 fcu/γm
Str
ess
Strain 0·0035
fy/γm N/mm2
fy/γm N/mm2
200 kN/mm2
Strain
Tension
Compression
Str
ess
348
Fig. 2. Short-term
design stress±strain
curve for normal-
weight concrete
according to BS 8110:
Part 1 (fCu is in
N/mm2)
Fig. 3. Short-term
design stress±strain
curve for
reinforcement
according to BS 8110:
Part 1 ( fy is in
N/mm2)
BEAL AND KHALIL

Delivered by ICEVirtualLibrary.com to:
IP: 194.143.169.130
On: Thu, 09 Jun 2011 09:26:49
25. Steel behaviour was assumed to follow
the BS 8110 stress±strain curve (see Fig. 3) and
allowance was made in the analysis for dis-
placement of concrete by the steel. The section
calculations were based on a 4 bar reinforce-
ment arrangement with d � 0�8h, which should
reasonably cover most real columns without
being unduly conservative.
26. Calculations were run using a spread-
sheet which was developed to run on Lotus 123
or Microsoft Works to calculate the moment±
curvature relationship for each section at
various values of axial load. This spreadsheet
is designed to allow any value of concrete
strength, creep factor or concrete peak strain
to be inserted, reinforcement e�ective depth to
be varied and either 4 bar or 6 bar reinforce-
ment arrangements considered. To use the
spreadsheet, material properties and a value
of peak concrete strain are ®rst selected and
then the neutral axis position is varied (by trial
and error) until the load eccentricity and
curvature are shown which correspond to the
required value of axial load (P � 0�1Po, 0�2Po,
etc., where Po is the section ultimate
compressive strength). By repeating the
calculations for a range of neutral axis
positions and peak strain values, families of
curves can be generated which de®ne the
section ¯exural behaviour under di�erent axial
loads.
27. The allowance for column initial imper-
fections was taken as an initial bow of 0´002L,
which in the absence of better information
was felt to be a reasonable value for use in
practical design. This is equivalent to an initial
bow of 6 mm on a braced 3 m high column, or
12 mm out of plumb on a 3 m high unbraced
column.
28. As previously described, graphs were
prepared, plotting the results of the section
behaviour calculations as load eccentricity (e/h)
against section curvature (h/R) for various
values of axial load P (expressed as a propor-
Table 4(a). Ratio of slender column capacity to short column `squash' capacity (P=Po) for 20 N/mm2 and
r= 0´8% (see Fig. 4(a))
20 N/mm2 r=0´8% d=0´8h
L/h e=0 e=0´1 e=0´2 e=0´3 e=0´4 e=0´5
0 1´00 1´00 1´00 1´00 1´00 1´00
5 0´93 0´89 0´91 0´95 0´95 0´91
10 0´84 0´80 0´75 0´78 0´77 0´75
15 0´73 0´64 0´59 0´61 0´61 0´58
20 0´58 0´47 0´44 0´44 0´46 0´45
25 0´41 0´33 0´31 0´35 0´34 0´37
30 0´30 0´23 0´23 0´25 0´28 0´29
40 0´16 0´13 0´13 0´16 0´18 0´21
50 0´1 0´085 0´09 0´11 0´12 0´15
60 0´055 0´055 0´065 0´065 0´08 0´095
Table 4(b). Ratio of slender column capacity to short column `squash' capacity (P=Po) for 20 N/mm2 and r= 4%
(see Fig. 4(b))
20 N/mm2 r=4% d=0´8h
L/h e=0 e=0´1 e=0´2 e=0´3 e=0´4 e=0´5
0 1´00 1´00 1´00 1´00 1´00 1´00
5 0´93 0´93 0´93 0´93 0´98 1´00
10 0´85 0´83 0´81 0´83 0´86 0´90
15 0´75 0´71 0´70 0´71 0´74 0´79
20 0´61 0´56 0´57 0´60 0´62 0´65
25 0´44 0´43 0´46 0´48 0´53 0´56
30 0´32 0´34 0´36 0´40 0´43 0´48
40 0´18 0´20 0´24 0´26 0´30 0´34
50 0´11 0´14 0´17 0´20 0´20 0´23
60 0´08 0´09 0´11 0´14 0´14 0´17
1·0
0·8
0·6
0·4
0·2
0
P/P
0
0 10 20 30 40 50 60L/h(a)
0 10 20 30 40 50 60L/h(b)
20 N/mm2, 0·8% 20 N/mm2, 4%
00·10·30·5
e/h 00·10·30·5
e/h
349
Fig. 4. Relationship
between slender
column capacity
L/h and short
column `squash'
capacity P=Po for:
(a) 20 N/mm2,
r = 0´8%; and
(b) 20 N/mm2 and
r= 4%
DESIGN OF NORMAL-
AND HIGH-STRENGTH
CONCRETE COLUMNS

Delivered by ICEVirtualLibrary.com to:
IP: 194.143.169.130
On: Thu, 09 Jun 2011 09:26:49
tion of the section strength in pure compres-
sion, Po). Another graph was then prepared (on
tracing paper) showing the relationship
between buckling de¯ection and section curva-
ture for various slenderness ratios, assuming
that the buckled shape of the column follows a
sine curve: D=h � �L=h�2�h=R�=p2 (see equation
(1)). By overlaying this buckling de¯ection
graph on the section behaviour graphs, the
column capacities for various slenderness ratios
could be read o� directly.
29. As noted earlier, where applied
moments are signi®cant, for an exact solution
an iterative approach is required which takes
into account the di�erence between the circular
curvature induced by the applied end moments
and the sinusoidal curvature induced by buck-
ling. The de¯ection induced by circular curva-
ture is
Dh� 1
8Lh
� �2 hR
�2�
The results presented in this paper have all
been calculated by the exact iterative method.
30. The results of the theoretical analysis
are summarized in Tables 4±8 (Figs 4±8 refer).
These are expressed as the ratio of slender
column capacity to short column `squash'
capacity (P=Po). These results show the e�ect
that buckling and initial imperfections have on
the load capacity (with no safety factors
applied) for each column analysed. They give a
precise analytical benchmark against which
proposed design methods for slender columns
can be assessed.
31. In carrying out the analysis, one inter-
esting point was apparent at the outset: when
high strength concrete is used, an eccentrically
loaded section may be able to carry a greater
long-term load than its short-term capacity,
because the concrete's limited short-term strain
capacity restricts the steel stress which can be
developed. As it is usual to calculate the
Table 5(a). Ratio of slender column capacity to short column `squash' capacity (P=Po) for 40 N/mm2 and
r= 0´8% (see Fig. 5(a))
40 N/mm2 r=0´8% d=0´8h
L/h e=0 e=0´1 e=0´2 e=0´3 e=0´4 e=0´5
0 1´00 1´00 1´00 1´00 1´00 1´00
5 0´92 0´91 0´88 0´91 0´84 0´86
10 0´80 0´74 0´71 0´69 0´64 0´66
15 0´66 0´58 0´50 0´49 0´46 0´49
20 0´50 0´38 0´35 0´33 0´35 0´37
25 0´35 0´24 0´23 0´25 0´26 0´31
30 0´25 0´18 0´18 0´18 0´20 0´27
40 0´12 0´10 0´10 0´11 0´13 0´16
50 0´06 0´06 0´06 0´065 0´085 0´08
60 0´04 0´04 0´04 0´045 0´06 0´08
Table 5(b). Ratio of slender column capacity to short column `squash' capacity (P=Po) for 40 N/mm2 and r= 4%
(see Fig. 5(b))
40 N/mm2 r=4% d=0´8h
L/h e=0 e=0´1 e=0´2 e=0´3 e=0´4 e=0´5
0 1´00 1´00 1´00 1´00 1´00 1´00
5 0´92 0´91 0´92 0´96 0´98 1´00
10 0´83 0´78 0´77 0´80 0´86 0´87
15 0´70 0´65 0´62 0´67 0´71 0´75
20 0´56 0´51 0´51 0´55 0´58 0´63
25 0´39 0´36 0´39 0´43 0´45 0´51
30 0´29 0´27 0´30 0´34 0´37 0´39
40 0´15 0´17 0´20 0´23 0´25 0´27
50 0´09 0´10 0´12 0´14 0´18 0´18
60 0´06 0´08 0´09 0´11 0´13 0´13
1·0
0·8
0·6
0·4
0·2
0
P/P
0
0 10 20 30 40 50 60L/h(a)
0 10 20 30 40 50 60L/h(b)
40 N/mm2, 4%
00·10·30·5
e/h 00·10·30·5
e/h
40 N/mm2, 0·8%
350
Fig. 5. Relationship
between slender
column capacity
L/h and short
column `squash'
capacity P=Po for:
(a) 40 N/mm2,
r = 0´8%; and
(b) 40 N/mm2,
r = 4%
BEAL AND KHALIL
Delivered by ICEVirtualLibrary.com to:
IP: 194.143.169.130
On: Thu, 09 Jun 2011 09:26:49
strength of a reinforced concrete section on the
basis of short-term loading, short-term section
strengths have been used for the comparisons
in Tables 4±8.
Revising BS 811032. A comparison between the results of the
accurate analysis and designs in accordance
with the BS 8110 rules is presented in Table
9(a) and Fig. 9(a) and Table 9(b) and Fig. 9(b).
(The ratios give the strength of the slender
column relative to that of a column with
L/h=0.) This is done for an axially loaded
column made from 80 N/mm2 concrete, with
r=0´8% and 4%, taking into account the
additional moment for buckling in the BS 8110
calculation and also the factor K which reduces
this at high axial loads. The optimum value of
K has been calculated iteratively in accordance
with BS 8110. A K=1 line is also shown added
in Tables 9(a) and (b) to show the e�ect of
setting the factor K as a constant 1´0, instead of
being reduced by iteration.
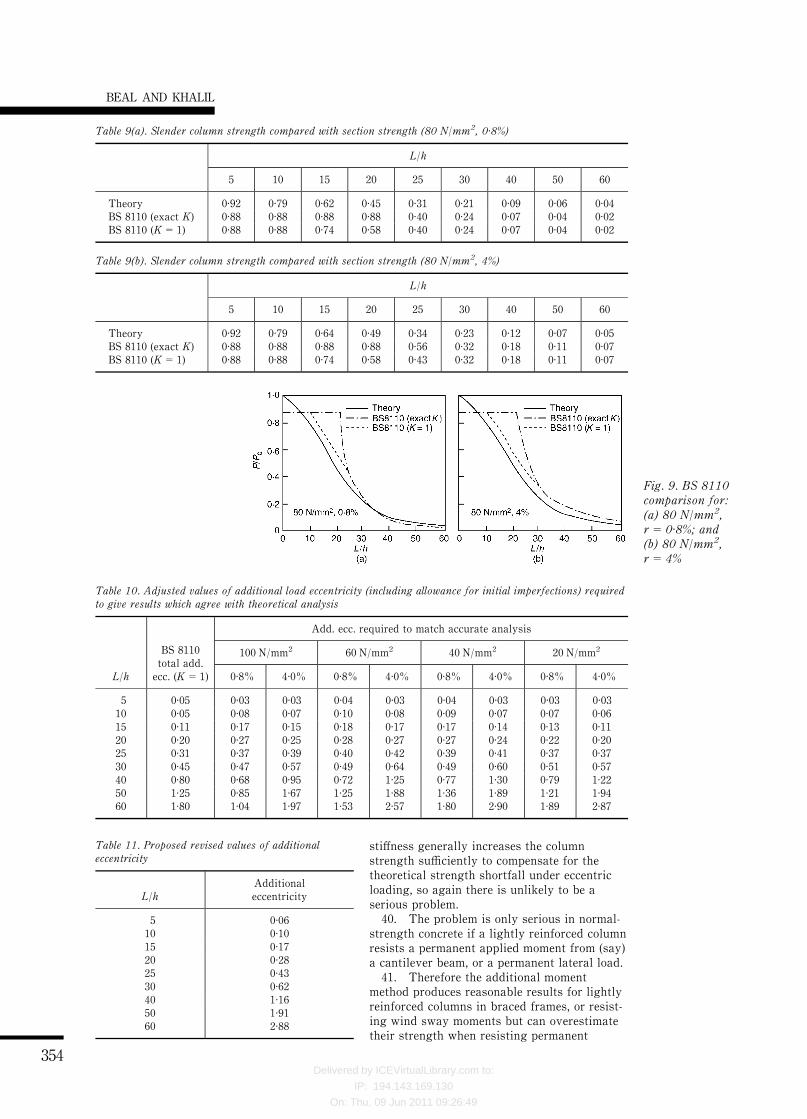
33. As can be seen, the BS 8110 `exact'
analysis overestimates the strength of a column
with 0´8% steel by up to 95% and for 4% steel
it overestimates the strength by up to 80%. The
worst problems are with slenderness ratios
around L/h=20, where the BS 8110 factor K
acts to eliminate buckling e�ects from the
calculation, leading to a calculated column
strength which is far in excess of the true
value. If setting K=1 in all cases, the results
from the BS 8110 become more realistic but still
the column strength is overestimated by 10±
30% for slenderness ratios of 10 and above.
34. Table 10 shows the adjusted values of
additional load eccentricity (including allow-
ance for initial imperfections) which would be
required to give results which agree with the
rigorous theoretical analysis. As can be seen,
the additional eccentricities which are required
to match the results of the accurate analysis are
generally higher than the present values
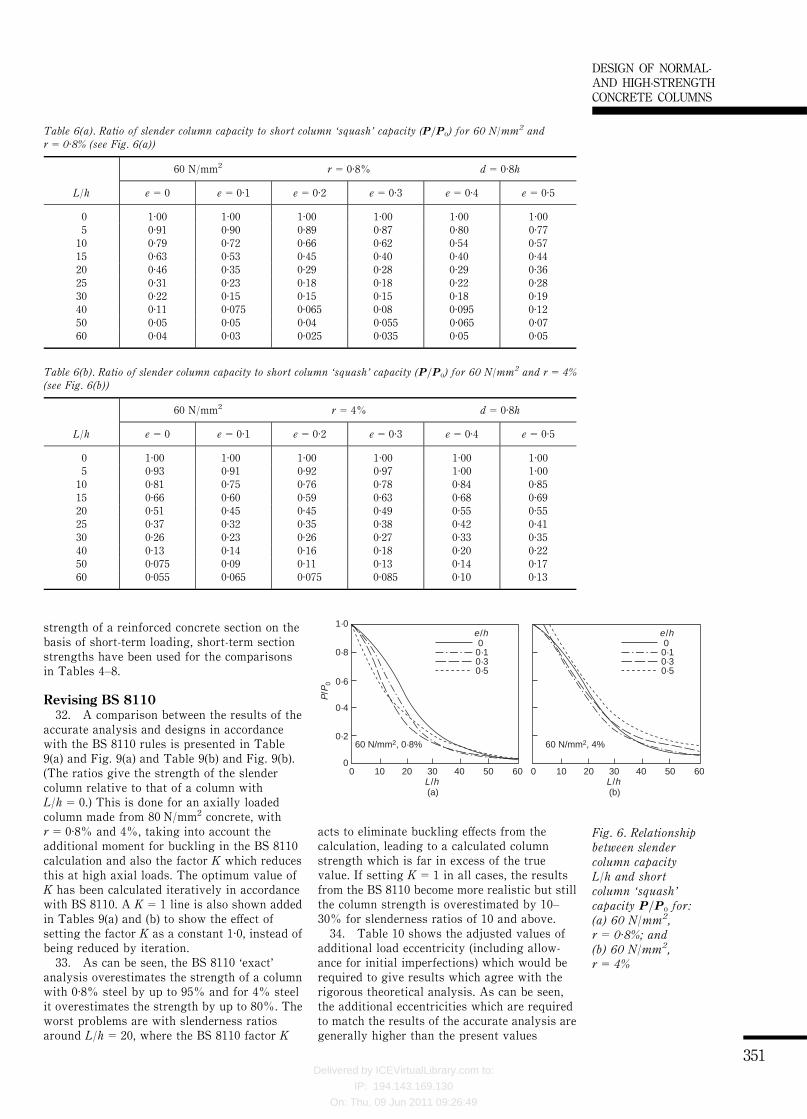
Table 6(a). Ratio of slender column capacity to short column `squash' capacity (P=Po) for 60 N/mm2 and
r= 0´8% (see Fig. 6(a))
60 N/mm2 r=0´8% d=0´8h
L/h e=0 e=0´1 e=0´2 e=0´3 e=0´4 e=0´5
0 1´00 1´00 1´00 1´00 1´00 1´00
5 0´91 0´90 0´89 0´87 0´80 0´77
10 0´79 0´72 0´66 0´62 0´54 0´57
15 0´63 0´53 0´45 0´40 0´40 0´44
20 0´46 0´35 0´29 0´28 0´29 0´36
25 0´31 0´23 0´18 0´18 0´22 0´28
30 0´22 0´15 0´15 0´15 0´18 0´19
40 0´11 0´075 0´065 0´08 0´095 0´12
50 0´05 0´05 0´04 0´055 0´065 0´07
60 0´04 0´03 0´025 0´035 0´05 0´05
Table 6(b). Ratio of slender column capacity to short column `squash' capacity (P=Po) for 60 N/mm2 and r= 4%
(see Fig. 6(b))
60 N/mm2 r=4% d=0´8h
L/h e=0 e=0´1 e=0´2 e=0´3 e=0´4 e=0´5
0 1´00 1´00 1´00 1´00 1´00 1´00
5 0´93 0´91 0´92 0´97 1´00 1´00
10 0´81 0´75 0´76 0´78 0´84 0´85
15 0´66 0´60 0´59 0´63 0´68 0´69
20 0´51 0´45 0´45 0´49 0´55 0´55
25 0´37 0´32 0´35 0´38 0´42 0´41
30 0´26 0´23 0´26 0´27 0´33 0´35
40 0´13 0´14 0´16 0´18 0´20 0´22
50 0´075 0´09 0´11 0´13 0´14 0´17
60 0´055 0´065 0´075 0´085 0´10 0´13
1·0
0·8
0·6
0·4
0·2
0
P/P
0
0 10 20 30 40 50 60L/h(a)
0 10 20 30 40 50 60L/h(b)
60 N/mm2, 0·8% 60 N/mm2, 4%
00·10·30·5
e/h 00·10·30·5
e/h
351
Fig. 6. Relationship
between slender
column capacity
L/h and short
column `squash'
capacity P=Po for:
(a) 60 N/mm2,
r = 0´8%; and
(b) 60 N/mm2,
r = 4%
DESIGN OF NORMAL-
AND HIGH-STRENGTH
CONCRETE COLUMNS

Delivered by ICEVirtualLibrary.com to:
IP: 194.143.169.130
On: Thu, 09 Jun 2011 09:26:49
recommended in BS 8110. However, it is inter-
esting that for axially loaded columns with
slenderness up to L/h=25, the required value
of additional load eccentricity is fairly constant
for all values of concrete strength and
reinforcement percentage. Above L/h=25, the
results diverge, with more heavily reinforced
columns requiring higher additional moments
than lightly reinforced columns for satisfactory
results. However, if a degree of conservatism
can be accepted in the design of lightly
reinforced slender columns, a single set of
additional moments could be speci®ed which
would give satisfactory and safe results for
columns of all concrete strengths and reinforce-
ment percentages. The proposed values of
eccentricity (Table 11) can be calculated from
the formula
eaddh� 0�05� 0�00023 L
h
� �2�3�3�
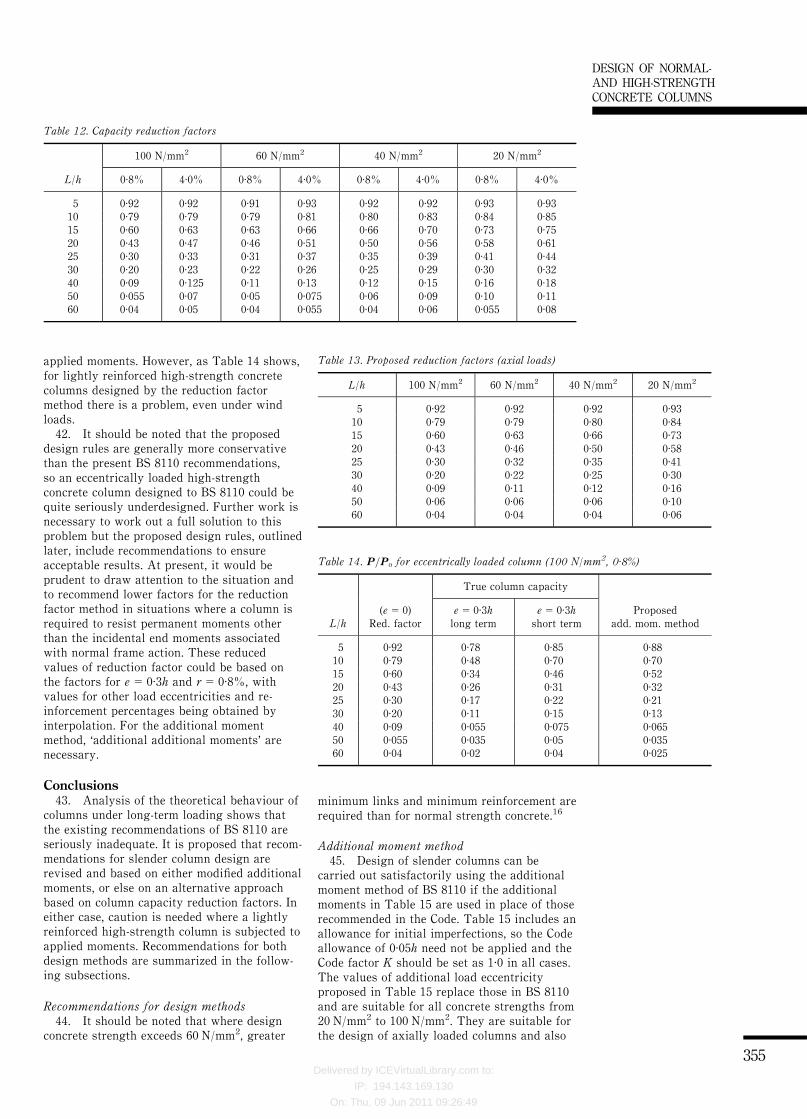
Reduction factor method35. An alternative approach for slender
column design is to use simple capacity reduc-
tion factors to cover the e�ects of buckling. As
can be seen from Tables 12 and 13, a single set
of load reduction factors can be speci®ed for
each concrete strength and this gives a simple
design method which gives rather more eco-
nomical and consistent results for axially
loaded columns than the additional moment
approach. (Note: the values quoted would need
to be adjusted to re¯ect the di�erence between
site concrete strength and laboratory test
cubesÐthey equate to `speci®ed cube strength'
values of 130 N/mm2, 80 N/mm2, 50 N/mm2 and
25 N/mm2 respectively.)
Eccentric loading36. There remains the problem of design for
eccentric loading. As can be seen from the
tables and graphs which show the results of
the accurate analysis, heavily reinforced
Table 7(a). Ratio of slender column capacity to short column `squash' capacity (P=Po) for 80 N/mm2 and
r= 0´8% (see Fig. 7(a))
80 N/mm2 r=0´8% d=0´8h
L/h e=0 e=0´1 e=0´2 e=0´3 e=0´4 e=0´5
0 1´00 1´00 1´00 1´00 1´00 1´00
5 0´92 0´90 0´89 0´87 0´79 0´83
10 0´79 0´73 0´64 0´58 0´50 0´56
15 0´62 0´50 0´42 0´38 0´36 0´45
20 0´45 0´34 0´26 0´25 0´28 0´36
25 0´31 0´22 0´16 0´18 0´21 0´27
30 0´21 0´15 0´12 0´13 0´14 0´18
40 0´09 0´08 0´07 0´065 0´085 0´12
50 0´06 0´06 0´035 0´05 0´05 0´09
60 0´04 0´025 0´025 0´035 0´035 0´06
Table 7(b). Ratio of slender column capacity to short column `squash' capacity (P=Po) for 80 N/mm2 and r= 4%
(see Fig. 7(b))
80 N/mm2 r=4% d=0´8h
L/h e=0 e=0´1 e=0´2 e=0´3 e=0´4 e=0´5
0 1´00 1´00 1´00 1´00 1´00 1´00
5 0´92 0´91 0´93 0´97 1´00 1´00
10 0´79 0´75 0´76 0´81 0´85 0´86
15 0´64 0´58 0´59 0´62 0´65 0´66
20 0´49 0´42 0´45 0´50 0´51 0´52
25 0´34 0´30 0´33 0´36 0´37 0´42
30 0´23 0´22 0´24 0´28 0´31 0´31
40 0´12 0´13 0´15 0´17 0´20 0´24
50 0´07 0´08 0´095 0´12 0´14 0´16
60 0´05 0´055 0´07 0´09 0´085 0´10
1·0
0·8
0·6
0·4
0·2
0
P/P
0
0 10 20 30 40 50 60L/h(a)
0 10 20 30 40 50 60L/h(b)
80 N/mm2, 0·8% 80 N/mm2, 4%
00·10·30·5
e/h 00·10·30·5
e/h
352
Fig. 7. Relationship
between slender
column capacity
L/h and short
column `squash'
capacity P=Po for:
(a) 80 N/mm2,
r = 0´8%; and
(b) 80 N/mm2,
r = 4%
BEAL AND KHALIL
Delivered by ICEVirtualLibrary.com to:
IP: 194.143.169.130
On: Thu, 09 Jun 2011 09:26:49
slender columns (r=4%) behave reasonably
consistently as the applied load eccentricity
varies (although the reduction factor does not
fall with increasing load eccentricity, as normal
interaction formulae would predict). Therefore
for these columns the same reduction factors or
additional moments already determined for the
design of axially loaded columns would also be
suitable for eccentric loading. However, for
lightly reinforced columns the load capacities
under eccentric loading are more seriously
reduced by the e�ects of slenderness. This issue
is not addressed by existing codes (except the
IStructE Recommendations for the Permissible
Stress Design of Reinforced Concrete Building
Structures15).
37. Table 14 compares the P=Po values
for the proposed `additional moment' and
`reduction factor' methods with the results
of the accurate analysis for an eccentrically
loaded 100 N/mm2 column with r=0´8%
under both short-term and long-term loading.
38. As can be seen, both the reduction factor
method and the additional moment method
considerably overestimate the strength of the
column. In principle, this could be a serious
problem: lightly reinforced columns are often
subjected to some bending. However, it is worth
thinking about the circumstances which lead to
the development of moments in concrete
columns.
39. In a braced frame, column moments
generated by beams and slabs occur primarily
at the column ends, away from the maximum
buckling de¯ection. Furthermore, if any buck-
ling deformation does occur in the column, this
will act to reduce the end moments. Therefore it
is reasonable to assume that for columns in
braced frames the problem is unlikely to have
serious consequences. In sway frames, the main
source of column moments is commonly wind
load, which is a short-term loading, so the
e�ects of creep will be less relevant. In normal
strength concrete, the higher short-term
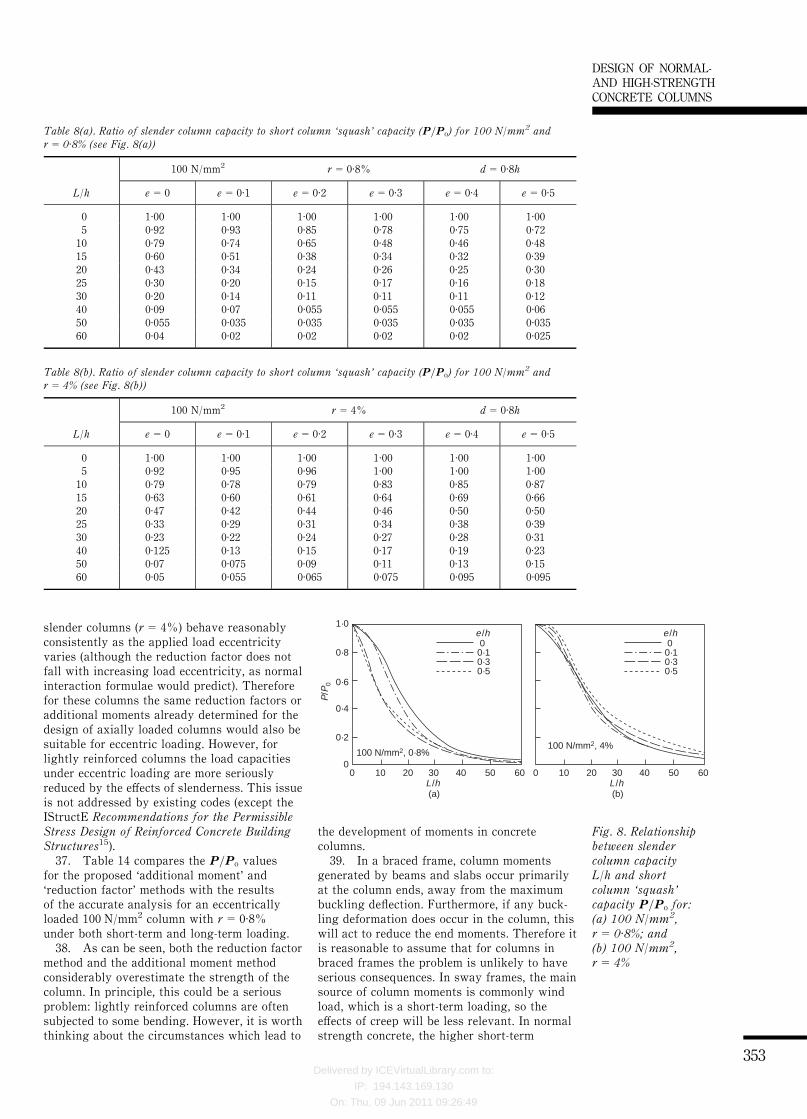
Table 8(a). Ratio of slender column capacity to short column `squash' capacity (P=Po) for 100 N/mm2 and
r= 0´8% (see Fig. 8(a))
100 N/mm2 r=0´8% d=0´8h
L/h e=0 e=0´1 e=0´2 e=0´3 e=0´4 e=0´5
0 1´00 1´00 1´00 1´00 1´00 1´00
5 0´92 0´93 0´85 0´78 0´75 0´72
10 0´79 0´74 0´65 0´48 0´46 0´48
15 0´60 0´51 0´38 0´34 0´32 0´39
20 0´43 0´34 0´24 0´26 0´25 0´30
25 0´30 0´20 0´15 0´17 0´16 0´18
30 0´20 0´14 0´11 0´11 0´11 0´12
40 0´09 0´07 0´055 0´055 0´055 0´06
50 0´055 0´035 0´035 0´035 0´035 0´035
60 0´04 0´02 0´02 0´02 0´02 0´025
Table 8(b). Ratio of slender column capacity to short column `squash' capacity (P=Po) for 100 N/mm2 and
r= 4% (see Fig. 8(b))
100 N/mm2 r=4% d=0´8h
L/h e=0 e=0´1 e=0´2 e=0´3 e=0´4 e=0´5
0 1´00 1´00 1´00 1´00 1´00 1´00
5 0´92 0´95 0´96 1´00 1´00 1´00
10 0´79 0´78 0´79 0´83 0´85 0´87
15 0´63 0´60 0´61 0´64 0´69 0´66
20 0´47 0´42 0´44 0´46 0´50 0´50
25 0´33 0´29 0´31 0´34 0´38 0´39
30 0´23 0´22 0´24 0´27 0´28 0´31
40 0´125 0´13 0´15 0´17 0´19 0´23
50 0´07 0´075 0´09 0´11 0´13 0´15
60 0´05 0´055 0´065 0´075 0´095 0´095
1·0
0·8
0·6
0·4
0·2
0
P/P
0
0 10 20 30 40 50 60L/h(a)
0 10 20 30 40 50 60L/h(b)
100 N/mm2, 0·8%100 N/mm2, 4%
00·10·30·5
e/h 00·10·30·5
e/h
353
Fig. 8. Relationship
between slender
column capacity
L/h and short
column `squash'
capacity P=Po for:
(a) 100 N/mm2,
r = 0´8%; and
(b) 100 N/mm2,
r = 4%
DESIGN OF NORMAL-
AND HIGH-STRENGTH
CONCRETE COLUMNS
Delivered by ICEVirtualLibrary.com to:
IP: 194.143.169.130
On: Thu, 09 Jun 2011 09:26:49
sti�ness generally increases the column
strength su�ciently to compensate for the
theoretical strength shortfall under eccentric
loading, so again there is unlikely to be a
serious problem.
40. The problem is only serious in normal-
strength concrete if a lightly reinforced column
resists a permanent applied moment from (say)
a cantilever beam, or a permanent lateral load.
41. Therefore the additional moment
method produces reasonable results for lightly
reinforced columns in braced frames, or resist-
ing wind sway moments but can overestimate
their strength when resisting permanent
Table 9(a). Slender column strength compared with section strength (80 N/mm2, 0´8%)
L/h
5 10 15 20 25 30 40 50 60
Theory 0´92 0´79 0´62 0´45 0´31 0´21 0´09 0´06 0´04
BS 8110 (exact K) 0´88 0´88 0´88 0´88 0´40 0´24 0´07 0´04 0´02
BS 8110 (K=1) 0´88 0´88 0´74 0´58 0´40 0´24 0´07 0´04 0´02
Table 9(b). Slender column strength compared with section strength (80 N/mm2, 4%)
L/h
5 10 15 20 25 30 40 50 60
Theory 0´92 0´79 0´64 0´49 0´34 0´23 0´12 0´07 0´05
BS 8110 (exact K) 0´88 0´88 0´88 0´88 0´56 0´32 0´18 0´11 0´07
BS 8110 (K=1) 0´88 0´88 0´74 0´58 0´43 0´32 0´18 0´11 0´07
Table 10. Adjusted values of additional load eccentricity (including allowance for initial imperfections) required
to give results which agree with theoretical analysis
BS 8110
Add. ecc. required to match accurate analysis
total add.100 N/mm2 60 N/mm2 40 N/mm2 20 N/mm2
L/h ecc. (K=1) 0´8% 4´0% 0´8% 4´0% 0´8% 4´0% 0´8% 4´0%
5 0´05 0´03 0´03 0´04 0´03 0´04 0´03 0´03 0´03
10 0´05 0´08 0´07 0´10 0´08 0´09 0´07 0´07 0´06
15 0´11 0´17 0´15 0´18 0´17 0´17 0´14 0´13 0´11
20 0´20 0´27 0´25 0´28 0´27 0´27 0´24 0´22 0´20
25 0´31 0´37 0´39 0´40 0´42 0´39 0´41 0´37 0´37
30 0´45 0´47 0´57 0´49 0´64 0´49 0´60 0´51 0´57
40 0´80 0´68 0´95 0´72 1´25 0´77 1´30 0´79 1´22
50 1´25 0´85 1´67 1´25 1´88 1´36 1´89 1´21 1´94
60 1´80 1´04 1´97 1´53 2´57 1´80 2´90 1´89 2´87
Table 11. Proposed revised values of additional
eccentricity
L/h
Additional
eccentricity
5 0´06
10 0´10
15 0´17
20 0´28
25 0´43
30 0´62
40 1´16
50 1´91
60 2´88
354
Fig. 9. BS 8110
comparison for:
(a) 80 N/mm2,
r = 0´8%; and
(b) 80 N/mm2,
r = 4%
BEAL AND KHALIL
Delivered by ICEVirtualLibrary.com to:
IP: 194.143.169.130
On: Thu, 09 Jun 2011 09:26:49
applied moments. However, as Table 14 shows,
for lightly reinforced high-strength concrete
columns designed by the reduction factor
method there is a problem, even under wind
loads.
42. It should be noted that the proposed
design rules are generally more conservative
than the present BS 8110 recommendations,
so an eccentrically loaded high-strength
concrete column designed to BS 8110 could be
quite seriously underdesigned. Further work is
necessary to work out a full solution to this
problem but the proposed design rules, outlined
later, include recommendations to ensure
acceptable results. At present, it would be
prudent to draw attention to the situation and
to recommend lower factors for the reduction
factor method in situations where a column is
required to resist permanent moments other
than the incidental end moments associated
with normal frame action. These reduced
values of reduction factor could be based on
the factors for e=0´3h and r=0´8%, with
values for other load eccentricities and re-
inforcement percentages being obtained by
interpolation. For the additional moment
method, `additional additional moments' are
necessary.
Conclusions43. Analysis of the theoretical behaviour of
columns under long-term loading shows that
the existing recommendations of BS 8110 are
seriously inadequate. It is proposed that recom-
mendations for slender column design are
revised and based on either modi®ed additional
moments, or else on an alternative approach
based on column capacity reduction factors. In
either case, caution is needed where a lightly
reinforced high-strength column is subjected to
applied moments. Recommendations for both
design methods are summarized in the follow-
ing subsections.
Recommendations for design methods
44. It should be noted that where design
concrete strength exceeds 60 N/mm2, greater
minimum links and minimum reinforcement are
required than for normal strength concrete.16
Additional moment method
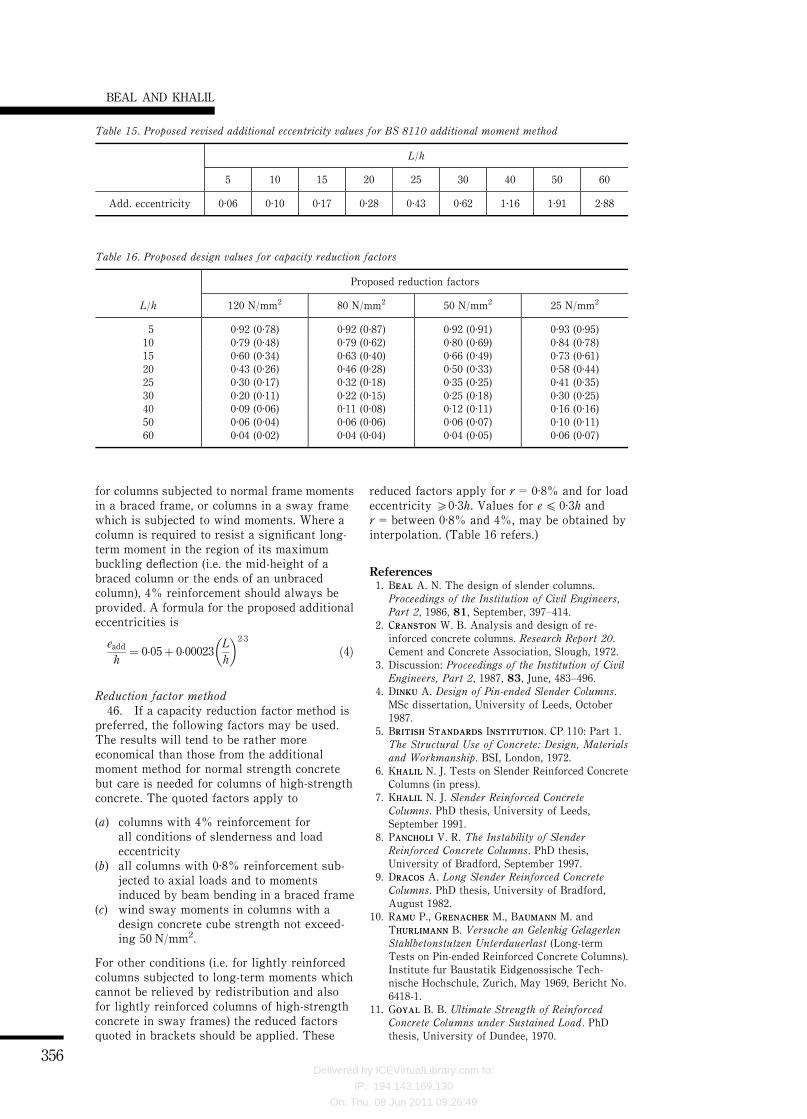
45. Design of slender columns can be
carried out satisfactorily using the additional
moment method of BS 8110 if the additional
moments in Table 15 are used in place of those
recommended in the Code. Table 15 includes an
allowance for initial imperfections, so the Code
allowance of 0´05h need not be applied and the
Code factor K should be set as 1´0 in all cases.
The values of additional load eccentricity
proposed in Table 15 replace those in BS 8110
and are suitable for all concrete strengths from
20 N/mm2 to 100 N/mm2. They are suitable for
the design of axially loaded columns and also
Table 12. Capacity reduction factors
100 N/mm2 60 N/mm2 40 N/mm2 20 N/mm2
L/h 0´8% 4´0% 0´8% 4´0% 0´8% 4´0% 0´8% 4´0%
5 0´92 0´92 0´91 0´93 0´92 0´92 0´93 0´93
10 0´79 0´79 0´79 0´81 0´80 0´83 0´84 0´85
15 0´60 0´63 0´63 0´66 0´66 0´70 0´73 0´75
20 0´43 0´47 0´46 0´51 0´50 0´56 0´58 0´61
25 0´30 0´33 0´31 0´37 0´35 0´39 0´41 0´44
30 0´20 0´23 0´22 0´26 0´25 0´29 0´30 0´32
40 0´09 0´125 0´11 0´13 0´12 0´15 0´16 0´18
50 0´055 0´07 0´05 0´075 0´06 0´09 0´10 0´11
60 0´04 0´05 0´04 0´055 0´04 0´06 0´055 0´08
Table 13. Proposed reduction factors (axial loads)
L/h 100 N/mm2 60 N/mm2 40 N/mm2 20 N/mm2
5 0´92 0´92 0´92 0´93
10 0´79 0´79 0´80 0´84
15 0´60 0´63 0´66 0´73
20 0´43 0´46 0´50 0´58
25 0´30 0´32 0´35 0´41
30 0´20 0´22 0´25 0´30
40 0´09 0´11 0´12 0´16
50 0´06 0´06 0´06 0´10
60 0´04 0´04 0´04 0´06
Table 14. P=Po for eccentrically loaded column (100 N/mm2, 0´8%)
True column capacity
L/h
(e=0)
Red. factor
e=0´3h
long term
e=0´3h
short term
Proposed
add. mom. method
5 0´92 0´78 0´85 0´88
10 0´79 0´48 0´70 0´70
15 0´60 0´34 0´46 0´52
20 0´43 0´26 0´31 0´32
25 0´30 0´17 0´22 0´21
30 0´20 0´11 0´15 0´13
40 0´09 0´055 0´075 0´065
50 0´055 0´035 0´05 0´035
60 0´04 0´02 0´04 0´025
355
DESIGN OF NORMAL-
AND HIGH-STRENGTH
CONCRETE COLUMNS
Delivered by ICEVirtualLibrary.com to:
IP: 194.143.169.130
On: Thu, 09 Jun 2011 09:26:49
for columns subjected to normal frame moments
in a braced frame, or columns in a sway frame
which is subjected to wind moments. Where a
column is required to resist a signi®cant long-
term moment in the region of its maximum
buckling de¯ection (i.e. the mid-height of a
braced column or the ends of an unbraced
column), 4% reinforcement should always be
provided. A formula for the proposed additional
eccentricities is
eaddh� 0�05� 0�00023 L
h
� �2�3�4�
Reduction factor method
46. If a capacity reduction factor method is
preferred, the following factors may be used.
The results will tend to be rather more
economical than those from the additional
moment method for normal strength concrete
but care is needed for columns of high-strength
concrete. The quoted factors apply to
(a) columns with 4% reinforcement for
all conditions of slenderness and load
eccentricity
(b) all columns with 0´8% reinforcement sub-
jected to axial loads and to moments
induced by beam bending in a braced frame
(c) wind sway moments in columns with a
design concrete cube strength not exceed-
ing 50 N/mm2.
For other conditions (i.e. for lightly reinforced
columns subjected to long-term moments which
cannot be relieved by redistribution and also
for lightly reinforced columns of high-strength
concrete in sway frames) the reduced factors
quoted in brackets should be applied. These
reduced factors apply for r=0´8% and for load
eccentricity 50´3h. Values for e4 0´3h and
r=between 0´8% and 4%, may be obtained by
interpolation. (Table 16 refers.)
References1. BEALEAL A. N. The design of slender columns.
Proceedings of the Institution of Civil Engineers,
Part 2, 1986, 81, September, 397±414.
2. CRANSTONRANSTON W. B. Analysis and design of re-
inforced concrete columns. Research Report 20.
Cement and Concrete Association, Slough, 1972.
3. Discussion: Proceedings of the Institution of Civil
Engineers, Part 2, 1987, 83, June, 483±496.
4. DINKUINKU A. Design of Pin-ended Slender Columns.
MSc dissertation, University of Leeds, October
1987.
5. BRITISHRITISH STANDARDSTANDARDS INSTITUTIONNSTITUTION. CP 110: Part 1.
The Structural Use of Concrete: Design, Materials
and Workmanship. BSI, London, 1972.
6. KHALILHALIL N. J. Tests on Slender Reinforced Concrete
Columns (in press).
7. KHALILHALIL N. J. Slender Reinforced Concrete
Columns. PhD thesis, University of Leeds,
September 1991.
8. PANCHOLIANCHOLI V. R. The Instability of Slender
Reinforced Concrete Columns. PhD thesis,
University of Bradford, September 1997.
9. DRACOSRACOS A. Long Slender Reinforced Concrete
Columns. PhD thesis, University of Bradford,
August 1982.
10. RAMUAMU P., GRENACHERRENACHER M., BAUMANNAUMANN M. and
THURLIMANNHURLIMANN B. Versuche an Gelenkig Gelagerlen
Stahlbetonstutzen Unterdauerlast (Long-term
Tests on Pin-ended Reinforced Concrete Columns).
Institute fur Baustatik Eidgenossische Tech-
nische Hochschule, Zurich, May 1969, Bericht No.
6418-1.
11. GOYALOYAL B. B. Ultimate Strength of Reinforced
Concrete Columns under Sustained Load . PhD
thesis, University of Dundee, 1970.
Table 15. Proposed revised additional eccentricity values for BS 8110 additional moment method
L/h
5 10 15 20 25 30 40 50 60
Add. eccentricity 0´06 0´10 0´17 0´28 0´43 0´62 1´16 1´91 2´88
Table 16. Proposed design values for capacity reduction factors
Proposed reduction factors
L/h 120 N/mm2 80 N/mm2 50 N/mm2 25 N/mm2
5 0´92 (0´78) 0´92 (0´87) 0´92 (0´91) 0´93 (0´95)
10 0´79 (0´48) 0´79 (0´62) 0´80 (0´69) 0´84 (0´78)
15 0´60 (0´34) 0´63 (0´40) 0´66 (0´49) 0´73 (0´61)
20 0´43 (0´26) 0´46 (0´28) 0´50 (0´33) 0´58 (0´44)
25 0´30 (0´17) 0´32 (0´18) 0´35 (0´25) 0´41 (0´35)
30 0´20 (0´11) 0´22 (0´15) 0´25 (0´18) 0´30 (0´25)
40 0´09 (0´06) 0´11 (0´08) 0´12 (0´11) 0´16 (0´16)
50 0´06 (0´04) 0´06 (0´06) 0´06 (0´07) 0´10 (0´11)
60 0´04 (0´02) 0´04 (0´04) 0´04 (0´05) 0´06 (0´07)
356
BEAL AND KHALIL

Delivered by ICEVirtualLibrary.com to:
IP: 194.143.169.130
On: Thu, 09 Jun 2011 09:26:49
12. BRITISHRITISH STANDARDSTANDARDS INSTITUTIONNSTITUTION. BS 8110: Part 1.
Structural Use of Concrete: Code of Practice
for Design and Construction. BSI, London,
1985.
13. BEALEAL A. N. Draft Eurocode 2: Is this the future of
concrete design?. Proceedings of the Institution of
Civil Engineers, Structures and Buildings, 1993,
99, Nov., 337±385.
14. PLOWMANLOWMAN et al. Cores, cubes and the speci®ed
strength of concrete. The Structural Engineer,
1974, 52, No. 11.
15. INSTITUTIONNSTITUTION OFOF STRUCTURALTRUCTURAL ENGINEERSNGINEERS. Recom-
mendations for the Permissible Stress Design of
Reinforced Concrete Building Structures. IStructE,
London, 1985.
16. CONCRETEONCRETE SOCIETYOCIETY. Design Guidance for High
Strength Concrete. Concrete Society, London,
1998, Technical Report 49.
Please email, fax or post your discussion contributions to The Publisher: email:
[email protected]; fax: 0171 799 1325; or post to Lesley Wilson, Journals
Department, Institution of Civil Engineers, 1±7 Great George Street, London
SW1P 3AA.
357
DESIGN OF NORMAL-
AND HIGH-STRENGTH
CONCRETE COLUMNS
Copyright © 2022 FDOKUMEN