Design methodologies for sizing a battery bank devoted to a ...
13
HAL Id: hal-01290385 https://hal.archives-ouvertes.fr/hal-01290385 Submitted on 18 Mar 2016 HAL is a multi-disciplinary open access archive for the deposit and dissemination of sci- entific research documents, whether they are pub- lished or not. The documents may come from teaching and research institutions in France or abroad, or from public or private research centers. L’archive ouverte pluridisciplinaire HAL, est destinée au dépôt et à la diffusion de documents scientifiques de niveau recherche, publiés ou non, émanant des établissements d’enseignement et de recherche français ou étrangers, des laboratoires publics ou privés. Design methodologies for sizing a battery bank devoted to a stand-alone and electronically passive wind turbine system Malek Belouda, Amine Jaafar, Bruno Sareni, Xavier Roboam, Jamel Belhadj To cite this version: Malek Belouda, Amine Jaafar, Bruno Sareni, Xavier Roboam, Jamel Belhadj. Design method- ologies for sizing a battery bank devoted to a stand-alone and electronically passive wind tur- bine system. Renewable and Sustainable Energy Reviews, Elsevier, 2016, vol. 60, pp. 144-154. 10.1016/j.rser.2016.01.111. hal-01290385
-
Upload
khangminh22 -
Category
Documents
-
view
1 -
download
0
Transcript of Design methodologies for sizing a battery bank devoted to a ...

HAL Id: hal-01290385https://hal.archives-ouvertes.fr/hal-01290385
Submitted on 18 Mar 2016
HAL is a multi-disciplinary open accessarchive for the deposit and dissemination of sci-entific research documents, whether they are pub-lished or not. The documents may come fromteaching and research institutions in France orabroad, or from public or private research centers.
L’archive ouverte pluridisciplinaire HAL, estdestinée au dépôt et à la diffusion de documentsscientifiques de niveau recherche, publiés ou non,émanant des établissements d’enseignement et derecherche français ou étrangers, des laboratoirespublics ou privés.
Design methodologies for sizing a battery bank devotedto a stand-alone and electronically passive wind turbine
systemMalek Belouda, Amine Jaafar, Bruno Sareni, Xavier Roboam, Jamel Belhadj
To cite this version:Malek Belouda, Amine Jaafar, Bruno Sareni, Xavier Roboam, Jamel Belhadj. Design method-ologies for sizing a battery bank devoted to a stand-alone and electronically passive wind tur-bine system. Renewable and Sustainable Energy Reviews, Elsevier, 2016, vol. 60, pp. 144-154.�10.1016/j.rser.2016.01.111�. �hal-01290385�

Open Archive TOULOUSE Archive Ouverte (OATAO) OATAO is an open access repository that collects the work of Toulouse researchers and makes it freely available over the web where possible.
This is an author-deposited version published in : http://oatao.univ-toulouse.fr/ Eprints ID : 15591
To link to this article : DOI:10.1016/j.rser.2016.01.111 URL : http://dx.doi.org/10.1016/j.rser.2016.01.111
To cite this version : Belouda, Malek and Jaafar, Amine and Sareni, Bruno and Roboam, Xavier and Belhadj, Jamel Design methodologies for sizing a battery bank devoted to a stand-alone and electronically passive wind turbine system. (2016) Renewable and Sustainable Energy Reviews, vol. 60. pp. 144-154. ISSN 1364-0321
Any correspondence concerning this service should be sent to the repository
administrator: [email protected]

Design methodologies for sizing a battery bank devotedto a stand-alone and electronically passive wind turbine system
Malek Belouda a,n, Amine Jaafar b, Bruno Sareni b, Xavier Roboam b, Jamel Belhadj a
a Université de Tunis, E1 Manar, ENIT – LSE, BP 37, 1002 Tunis le Belvédère, Tunisieb Université de Toulouse, LAPLACE, UMR CNRS INP-UPS, ENSEEIHT, 2 rue Camichel, BP 71 22, 31071 Toulouse Cedex 07, France
Keywords:
Passive wind turbine
Storage
Batteries
Inverse problem
Evolutionary algorithms
Hybrid system
a b s t r a c t
In this paper, the authors investigate four original methodologies for sizing a battery bank inside a
passive wind turbine system. This device interacts with wind and load cycles, especially for a stand-alone
application. Generally, actual wind speed measurements are of long duration which leads to extensive
processing time in a global optimization context requiring a wide number of system simulations. The first
part of this article outlines two sizing methodologies based on a statistical approach for the sizing of the
electrochemical storage device of a stand-alone passive wind turbine system. Two other efficient
methodologies based on the synthesis of compact wind speed profiles by means of evolutionary algo-
rithms are described in the second part of this paper. The results are finally discussed with regard to the
relevance of the battery bank sizing and in terms of computation cost, this later issue being crucial to an
Integrated Optimal Design (IOD) process.
Contents
1. Introduction . . . . . . . . . . . . . . . . . . . . . . . . . . . . . . . . . . . . . . . . . . . . . . . . . . . . . . . . . . . . . . . . . . . . . . . . . . . . . . . . . . . . . . . . . . . . . . . . . . . . . . . . 144
2. Description of the hybrid system . . . . . . . . . . . . . . . . . . . . . . . . . . . . . . . . . . . . . . . . . . . . . . . . . . . . . . . . . . . . . . . . . . . . . . . . . . . . . . . . . . . . . . . 145
2.1. Similitude sizing model. . . . . . . . . . . . . . . . . . . . . . . . . . . . . . . . . . . . . . . . . . . . . . . . . . . . . . . . . . . . . . . . . . . . . . . . . . . . . . . . . . . . . . . . . 146
2.2. Passive WT. . . . . . . . . . . . . . . . . . . . . . . . . . . . . . . . . . . . . . . . . . . . . . . . . . . . . . . . . . . . . . . . . . . . . . . . . . . . . . . . . . . . . . . . . . . . . . . . . . . 146
2.3. Battery features . . . . . . . . . . . . . . . . . . . . . . . . . . . . . . . . . . . . . . . . . . . . . . . . . . . . . . . . . . . . . . . . . . . . . . . . . . . . . . . . . . . . . . . . . . . . . . . 146
2.4. The battery sizing algorithm . . . . . . . . . . . . . . . . . . . . . . . . . . . . . . . . . . . . . . . . . . . . . . . . . . . . . . . . . . . . . . . . . . . . . . . . . . . . . . . . . . . . . 147
3. Statistical battery bank sizing methodologies based on Monte Carlo simulations . . . . . . . . . . . . . . . . . . . . . . . . . . . . . . . . . . . . . . . . . . . . . . . . . 148
3.1. A statistical approach based on the wind speed profile distribution . . . . . . . . . . . . . . . . . . . . . . . . . . . . . . . . . . . . . . . . . . . . . . . . . . . . . 148
3.2. A statistical approach based on the extracted wind power distribution. . . . . . . . . . . . . . . . . . . . . . . . . . . . . . . . . . . . . . . . . . . . . . . . . . . 148
3.3. Results . . . . . . . . . . . . . . . . . . . . . . . . . . . . . . . . . . . . . . . . . . . . . . . . . . . . . . . . . . . . . . . . . . . . . . . . . . . . . . . . . . . . . . . . . . . . . . . . . . . . . . 148
4. Battery sizing based on a compact synthesis approach. . . . . . . . . . . . . . . . . . . . . . . . . . . . . . . . . . . . . . . . . . . . . . . . . . . . . . . . . . . . . . . . . . . . . . 149
4.1. Synthesis process of representative and compact wind speed profiles. . . . . . . . . . . . . . . . . . . . . . . . . . . . . . . . . . . . . . . . . . . . . . . . . . . . 149
4.2. Compact synthesis approach using system-based targets . . . . . . . . . . . . . . . . . . . . . . . . . . . . . . . . . . . . . . . . . . . . . . . . . . . . . . . . . . . . . . 150
4.3. Compact synthesis approach using wind-based targets . . . . . . . . . . . . . . . . . . . . . . . . . . . . . . . . . . . . . . . . . . . . . . . . . . . . . . . . . . . . . . . 151
4.4. Validation of the previous results for various WT sizes . . . . . . . . . . . . . . . . . . . . . . . . . . . . . . . . . . . . . . . . . . . . . . . . . . . . . . . . . . . . . . . 151
5. Synthesis and discussion. . . . . . . . . . . . . . . . . . . . . . . . . . . . . . . . . . . . . . . . . . . . . . . . . . . . . . . . . . . . . . . . . . . . . . . . . . . . . . . . . . . . . . . . . . . . . . 152
6. Conclusion . . . . . . . . . . . . . . . . . . . . . . . . . . . . . . . . . . . . . . . . . . . . . . . . . . . . . . . . . . . . . . . . . . . . . . . . . . . . . . . . . . . . . . . . . . . . . . . . . . . . . . . . . 153
Acknowledgements . . . . . . . . . . . . . . . . . . . . . . . . . . . . . . . . . . . . . . . . . . . . . . . . . . . . . . . . . . . . . . . . . . . . . . . . . . . . . . . . . . . . . . . . . . . . . . . . . . . . . . 153
References . . . . . . . . . . . . . . . . . . . . . . . . . . . . . . . . . . . . . . . . . . . . . . . . . . . . . . . . . . . . . . . . . . . . . . . . . . . . . . . . . . . . . . . . . . . . . . . . . . . . . . . . . . . . . 153
http://dx.doi.org/10.1016/j.rser.2016.01.111
Abbreviations: WT, Wind Turbine; IOD, Integrated Optimal Design; SOC, State Of Charge; DOD, Depth Of Discharge; PMSG, Permanent Magnet Synchronous Generatorn Corresponding author. Tel.: þ216 71 874 700; fax: þ216 71 872 729.
E-mail addresses: [email protected] (M. Belouda), [email protected] (A. Jaafar), [email protected] (B. Sareni),
[email protected] (X. Roboam), [email protected] (J. Belhadj).

1. Introduction
Continuity and reliability of electricity supply from wind
energy are the two basic criteria for feeding isolated sites. These
two criteria can be satisfied by including several types of storage
(accumulators, H2 storage, etc.), but this solution is hampered by
high ownership costs [1–5]. Thus, providing consumers in remote
areas with reliable and cheap electricity depends upon optimal
combination and sizing design of the wind generation system
coupled with the storage bank. Recently, most optimal configura-
tions are obtained by performing a global optimization process,
where a high number of simulations is required [6–14]. However,
the unpredictable character of the wind speed presents a sig-
nificant drawback since the system simulations are carried out
over a long period of time. In numerous publications, Bagul,
Borowy and Salameh [15–17] have developed several methodol-
ogies for optimally sizing a Wind/PV system associated with a
battery bank for a given load. These methods are based on the use
of long term data for both irradiance and wind speed. Several
studies have used the average hourly wind speed data over a few
years simulation period. Other researchers [18–20] have devel-
oped probabilistic methods to determine the annual energy output
of a wind system. In particular in [21], a probabilistic approach was
developed to calculate a long term system performance with
respect to the average monthly fraction of a load fed by generation
systems. In this context, the present study deals with the optimal
design of a battery bank for a passive Wind Turbine (WT) system
ensuring the continuous supply of an isolated typical farm (see
Fig. 1). The design of this system requires taking account of the
wind potential and the load demand.
However, the "time phasing" of wind data, generating WT
energy/power with the load profile (here a cycle time of 24 h), sets
a specific problem when sizing the storage device: indeed, the
difference between power production and power consumption
profiles is not sufficient to characterize the battery sizing. Finding
the most critical phasing between WT production and load con-
sumption must be considered. This worst case for the battery
sizing will be identified by varying the phase shift between pro-
duction and consumption profiles. This will be specifically shown
in Section 4.3.
In this study, four battery sizing methodologies for a 8 kW
stand-alone passive WT system are investigated. The first two
methodologies are based on statistical approaches and consist in
determining the constraints (in terms of power and energy needs)
associated with the storage system from temporal Monte-Carlo-
based simulations including wind and load profile variations. The
evolution of the wind speed was considered as stochastic while
the load profile was deterministically repeated from day to day
(Fig. 2). In order to take account of the wind potential features,
only slow dynamics related to seasonality have been integrated in
the wind profile, i.e. fast dynamics related to turbulence are
neglected. Wind features are then represented with a Weibull
statistic distribution. Finding the most critical constraints in the
storage system requires simulating the system over a long period
of time in order to include all correlations between power pro-
duction and consumption (e.g. time windows with low wind
power and high load power and inversely). Such a process is rather
expensive in terms of computation cost. It can locally be used to
size the battery when the other components of the system (i.e. the
passive WT) are known. However, if a global integrated design
process is concerned, where all components have to be simulta-
neously optimized the computation cost of these latter approaches
may be problematic. In order to solve this issue, we have investi-
gated two other methodologies for reducing wind profile duration
while keeping a trace of wind features in terms of intensity,
variability and statistics. This original approach suggested in [22] is
adapted for compacting wind speed profiles: it consists in gen-
erating compact wind profiles by aggregating elementary para-
meterized segments in order to fulfill target indicators repre-
senting the features of a reference wind profile of longer duration
[23]. This inverse problem involving the determination of the
segment parameters is solved using an evolutionary algorithm.
The remaining of the paper is organized as follows. The passive
wind system and the battery characteristics are described in
Section 2. In Section 3, statistical battery bank sizing methodolo-
gies are presented. Section 4 is dedicated to the sizing process
based on the synthesis approach of a representative and compact
wind speed profile. The results obtained from these sizing
approaches are summarized and compared in Section 5 in terms of
performance (sizing accuracy) and computation cost.
2. Description of the hybrid system
The considered system is a 8 kW full passive WT battery
charger without active control and with a minimum number of
sensors as studied in [8,9]. The deterministic load profile is set for
24 h and repeated from day to day as indicated in Fig. 2.
Wind turbine
Ba
tte
ryb
an
k
PMSG
Load
Profile
Wind
cycle
Fig. 1. WT system with battery for stand-alone application (rural site electrification).
6
0
Time (h)
3 6 9 12 15 18 21 240
1
2
3
4
5
Pow
er
(kW
)
Fig. 2. Typical farm load profile for one day.

2.1. Similitude sizing model
In [9], an integrated optimal design method based on multi-
objective optimization has been developed for sizing the elements
of a 1.7 kW passive wind turbine system. In our case, a simplified
approach has been preferred based on the exploitation of simili-
tude effects. The new generator dimensions are related to the
‘reference’ bore radius rsref and the machine length lrref of the
optimized generator. The reduced parameters αr and αl are intro-
duced:
αr ¼rs
rs ref
αl ¼lr
lr refð1Þ
where αl ¼ αr ¼ffiffiffiffiffiffiffi
Pnew
Pref
q
¼ 2:136 (Pnew¼8 kW and Pref¼1.7 kW) and
where the index ref is associated with the parameters of the
reference “optimal” system (i.e. the 1.7 kW wind turbine system of
[9]). Finally, using a similitude-based approach, the PMSG as well
as the wind turbine features can be deduced for a 8 kW passive
wind turbine system. Results obtained with this approach will be
presented in the following.
2.2. Passive WT
The 8 kW passive WT parameters have been obtained by
applying the similitude relations. In Tables 1 and 2, the two con-
figuration parameters are summarized.
The WT model is based on a “mixed reduced model” described
in [8]: this model neglects the electrical mode effect but simulates
the mechanical, especially due to the turbine inertia. In order to
simplify the modeling approach and to limit the computation cost,
the DC bus voltage is supposed to be constant, whatever the bat-
tery state of charge: it has been proved in other studies [8] that
this assumption is acceptable and does not question the battery
sizing accuracy. This simplified model has been chosen due to its
computation efficiency which authorizes analyzing system cou-
plings (WT – battery – load) with environmental (wind cycle)
influence.
Fig. 3 shows the extracted power of the new passive WT system
obtained by similitude from the reference structure, i.e. a 1.7 kW
optimized passive WT. It can be seen that the quality of wind
power extraction of this passive configuration (blue curve) very
closely matches the behavior of active WT systems (e.g. [24])
operating at optimal wind powers by using an MPPT control
device (i.e. the red cubic curve in Fig. 3). An IXYS VUO190 is
considered for the diode bridge rectifier.
2.3. Battery features
In this study, a lead acid Yuasa NP 38-12I [26] is considered as
battery element. These batteries can be used over a broad tem-
perature range permitting considerable flexibility in system design
and location:
% Charge: &15 °C to 50 °C% Discharge: &20 °C to 60 °C% Storage: &20 °C to 50 °C (fully charged battery)
Table 1
Wind turbine parameters.
Reference turbine New turbine
Radius R (m) 1.25 2.67
Friction coefficient fWT (N m s/rd) 0.025 0.52
Inertia JWT 1.5 31.22
Power coefficient Cp at MPPT Cp opt 0.441 0.441
Tip speed ratio λ at MPPT λopt 6.9 6.9
Table 2
PMSG parameters.
Reference generator New generator
Teeth width wt (mm) 5.465 11.672
Yoke thickness dy (mm) 14.096 30.098
Number of pole pairs p 3 3
Number of slots per phase per pole Nspp 3 3
Leakage inductance Lf (mH) 0.224 0.118
Main inductance Lm (mH) 0.763 0.731
Stator inductance Ls (mH) 1.369 1.2
Stator flux Φs (Wb) 0.211 0.4708
Stator resistance Rs (Ω) 0.128 0.0148
Nomenclature
Symbols
t time step
Ncycle number of battery cycles
oNcycle4 average number of battery cycles
DOD battery depth of discharge
DODmax battery maximum depth of discharge
SOC battery state of charge
ωcycle battery cycle weight
cF number of battery cycles to failure
Nrep number of battery replacement
PBAT battery power
PBAT MAX battery maximum (charge) power
PBAT MIN battery minimum (i.e. maximum discharge) power
E battery energy (i.e. actual energy in the battery)
ES battery useful energy (i.e. total energy of the battery)
Ta battery autonomy (number of hours of autonomy)
PWT wind turbine power
Pload load power
Nd number of days (in the Monte Carlo simulations)
NBT number of battery cells
oNBT 4 average number of battery cells
TCPU CPU time
Δt time duration
ref index for reference values of powers, energy,
wind speed
compact index for the corresponding values of the compact
profile
PDF probability distribution function
CDF cumulative distribution function
ε global error function in the compact synthesis process
εstat global error between two cumulative distribution
functions
V wind speed
oV4 average wind speed
oV34 average cubic wind speed
Vmax maximum wind speed value
Vmin minimum wind speed value
EV intermittent wind pseudo energy

The basic characteristics at 20 °C are summarized in the Table 3.
The estimation of the battery lifetime constitutes a difficult
topic which is still a topical issue in the scientific area. The battery
lifetime depends on multiple factors such as SOC variations, dis-
charge and charge current rates, ambient conditions (temperature,
humidity). In this paper, we use as battery lifetime indicator a
simple model based on the cycles to failure curve versus Depth of
Discharge (DOD) displayed in Fig. 4. Other factors affecting the
battery lifetime are neglected. It should be noted that such
approach based on the battery cycling has been used in earlier
studies [27–29]. In practice, typical battery state of charge (SOC)
evolutions during the system operation are considered. The cycle
counting method known as “rainflow” based on Downing's algo-
rithm [30] is then applied for determining the number of cycles
Ncycle corresponding to different intervals of DOD (typically the
whole DOD range is divided into 10 equally spaced intervals).
Finally, the “equivalent” number of full cycles oNcycle4 is calcu-
lated as follows:
oNcycle4 ¼X
DODωcycleðDODÞ ' NcycleðDODÞ ð2Þ
where the weight ωcycle evaluates the effect of a cycle at a given
DOD with regard to a cycle at full DOD, i.e.:
ωcycleðDODÞ ¼cF ð100%Þ
cF ðDODÞð3Þ
The number of expected battery replacement Nrep in the system
over a given period can be deduced from the corresponding
equivalent number of full cycles:
Nrep ¼oNcycle4
cF ð100%Þ
$ %
ð4Þ
where bc denotes the integer part function
2.4. The battery sizing algorithm
The determination of the battery cell number is based on the
energy sizing algorithm explained in detail in [30]. This algorithm
computes the active storage energy required for the battery from
the corresponding power evolution PBAT(t) while satisfying a
maximum depth of discharge (DODmax). It is based on an upper
saturated integration of the power in the battery bank due to the
fact that the charge power is no longer integrated if the battery
state of charge is maximal. In such a case, we consider that charge
power is wasted in order to avoid the battery bank oversizing. This
method is preferred to a simple integration method which gen-
erally leads to a battery bank oversizing during wide charge phase
(high winds with reduced load). Two operating conditions can be
considered for the battery bank sizing: standard operations with
wind production. In this case, the battery power can be expressed
as the difference between the extracted wind power and the load
power (i.e. PBAT¼PWT&Pload). The mechanical wind turbine outputpower, PWT(t) (W), generated by the wind turbine is PWT ¼
12CpρSv3,
where ρ is the air density (kg m &3), S denotes the swept rotor area
(m2), v represents the wind speed (m/s) and Cp is the power
coefficient from manufacturer data corresponding to the turbine
studied in [5] and that can be interpolated with: CpðλÞ ¼ &
3:98:10&8λ7&4:21:10&6
λ6þ2:1:10&4λ5&3:1:10&3
λ4þ1:64:10&2λ3
&0:0176λ2þ0:0174λ&1:93:10&3
where λ is the tip speed ratio which depends on the turbine
rotational speed Ω (rad/s), on the wind turbine radius R and on the
wind speed v: λ¼ RΩv
– The resulting power profile in the battery should represent the
system behavior over a long period of time and include the
stochastic wind features in a particular location (variability and
intensity)
– faulty operations without wind production. In this case, the
battery power is only related to the load power (i.e.
PBAT¼&Pload) on a desired duration Ta representing the number
of hours (or the number of days) of autonomy.
It should be noted that the whole system sizing (including the
battery sizing) results in an optimization problem with several
objectives (cost, autonomy, efficiency, battery lifetime). The
investigation of different tradeoffs with regard to some suitable
design variables (e.g. WT size, PMSG features, battery DODmax)
constitutes a specific problem that can be solved using traditional
multiobjective optimization methods. Such methods require the
iteration of the system sizing and simulation with respect to
design variable variations. Nevertheless, they can be applied only if
the computational time of the sizing models is acceptable.
Turbine rotational speed (rad/s)
0 10 20 30 40 50 60 700
5
10
15
20
25
Pow
er
(kW
)
Extracted wind powerOptimal
wind power
V = 9 m/s
Fig. 3. Extracted power of a 8 kW passive WT system. (For interpretation of the
reference to color in this figure, the reader is reffered to the web version of this
article.)
Table 3
Basic characteristics of a Yuasa NP 38-12I lead acid battery
element.
Property Value
Nominal capacity C3 30.3 A h
Nominal voltage V0 12 V
Nominal discharge Current I3 10.1 A
Maximum discharge power Pdis_max 144 W
Maximum charge power Pch_max 288 W
0.1 0.2 0.3 0.4 0.5 0.6 0.7 0.8 0.9 1100
200
500
1000
2000
5000
Depth of Discharge
Cycle
s t
o F
ailu
re
Fig. 4. Cycles to failure curve of the Yuasa accumulator cell.

Therefore, the reduction of the complexity and computational
time of the battery sizing in standard operations is of prime
importance. The remaining of this paper is only focused on this
issue. Consequently, in the following sections, the system auton-
omy and the battery lifetime will result of the battery sizing in
standard operations and will not be optimized. The optimization
of these criteria with regard to relevant design variables and the
investigation of system tradeoffs will be the subject of a com-
plementary ongoing study.
3. Statistical battery bank sizing methodologies based on
Monte Carlo simulations
3.1. A statistical approach based on the wind speed profile
distribution
Wind speed data can be predicted by several statistical dis-
tributions models from the wind energy potential at a particular
location. In this first approach, the sizing process is based on the
generation of a wind cycle from its statistical distribution [32]. The
continuous temporal wind speed profiles are generated from a
statistical distribution. A certain number of samples are generated
with a random number generator according to the established
statistical distribution. The continuous temporal profiles are then
obtained by interpolating the generated samples. The synoptic of
the random process generation of the wind speed cycles is illu-
strated in Fig. 5.
As previously mentioned, the battery bank sizing is related to
the level of power and energy which depend on the magnitude
and phase of wind potential and of the load demand. In order to
determine the relevant battery bank sizing, i.e. when the system is
under the “worst” case conditions (maximum power and energy),
several wind speed profiles with increasing duration have to be
generated until the battery sizing is stabilized. This sizing is then
obtained when the number of battery cells required to supply the
load becomes quasi-constant.
The synoptic of this battery bank sizing process is shown in
Fig. 6. The issue consists in producing 11 wind cycles with a pro-
gressive duration from 1 to 200 days. These cycles are synthesized
from a given wind statistic (i.e. a particular Weibull distribution)
during Nd days (Nd¼{1, 2, 3, 10, 20, 30, 50, 70, 100, 150, 200 days}).
Subsequently, after having simulated the WT system by means of
the “mixed-reduced model”, 11 extracted wind powers (PWT) are
generated. The load power (Pload) is daily repeated during the
Nd days.
The number of battery elements and the computational time
(TCPU) under different wind speed profiles are given in Table 2. The
computational time is the time needed by the processor to
simulate the system model and to perform the battery sizing
process. The corresponding system autonomy and the battery
lifetime indicator, consisting in the equivalent number of full
cycles extrapolated over 20 years, are given in Table 3.
3.2. A statistical approach based on the extracted wind power
distribution
With the aim of reducing the computational time, an essential
factor in an IOD context, this approach consists in directly gen-
erating the extracted power (PWT) histogram instead of the wind
histogram as previously proposed. For each interval of wind speed,
the corresponding extracted power is estimated by simulating the
passive wind system (the extracted power is synthesized on the
same timescales as with the first approach).
From wind statistics, the histogram of PWT is built. Therefore,
the WT power profile is directly obtained from its distribution by
means of random number generation and interpolation techniques
exactly as previously for the wind time cycle generation. Following
this step, from histogram of powers, the output WT power can be
directly generated before obtaining the battery power used for the
storage bank sizing process (Fig. 7). The storage bank sizing pro-
cess is quite similar to the first approach, i.e. producing 11 W
power cycles with a progressive duration from 1 to 200 days and
waiting until the number of battery cells becomes quasi-constant.
3.3. Results
The results obtained from both statistical approaches are
compared in Table 4 and in Table 5 with regard to the battery
sizing, the CPU time, the system autonomy and the lifetime indi-
cator. A first analysis of these results shows that oNBT4 becomes
quasi-constant and does not exceed 132 battery elements for a
number Nd470 days in both approaches (see Fig. 8). This “optimal
duration threshold” is sufficient for taking wind variability into
account (i.e. stochastic features of wind) and to obtain a suitable
and robust sizing for the battery bank. It can be observed from
Table 3 that it also leads in both approaches to the same number of
battery cycles which approximately equals 380 and represents
2 battery replacements in the system over 20 years. Finally, the
second approach offers a notable reduction of computational time,
Weibull probability
density functionSampling Interpolation
Wind speed
sequenceDiscrete
signal
Wind speed
profile
Fig. 5. Wind speed cycle generation.
Fig. 6. Battery bank sizing process based on a wind profile generation from its
statistical distribution.

e.g. for 70 days results showed a decreased rate of 5.5 on the CPU
time during the system simulation: simulations are performed
with a standard computer (Core Duo 1.7 GHz).
4. Battery sizing based on a compact synthesis approach
In this section, a “compact synthesis process” is applied on an
actual wind speed profile of 200-day duration considered as
reference data, with the aim of generating a compact profile of
reduced duration Δtcompact. Two different approaches are investi-
gated depending on the choice of the target indicators used for
generating the fictitious compact wind speed profile in order to
establish its correspondence with reference data.
4.1. Synthesis process of representative and compact wind speed
profiles
The synthesis process of compact wind profiles is based on the
approach developed in [22]. It consists in generating a fictitious
profile of any environmental variable (e.g. temperature, wind
speed, solar irradiation, driving cycle profile) by fulfilling some
constraints related to “target indicators” (typically minimum,
maximum and average value, probability distribution). These
indicators can be evaluated from a set of reference cycles usually of
long duration: here we have considered a 200-day wind profile.
This fictitious profile is obtained by aggregating elementary seg-
ments as shown in Fig. 9. Each segment is characterized by its
amplitude ΔSn (ΔSminrefrΔSnrΔSmaxref) and its duration Δtn(0rΔtnrΔtcompact). A time scaling step is performed after this
profile generation in order to fulfill the constraint related to the
time duration, i.e. ΣΔtn¼Δtcompact. Finding a compact fictitious
profile of an environmental variable consists in finding all segment
parameters so that the generated profile fulfills all target
Fig. 7. Battery bank sizing process based on an extracted power generation profile from its statistical distribution.
Table 4
Results obtained from statistical approaches with Monte Carlo simulations – CPU
time and average number of battery cells.
Number of
days
CPU Time (s) Average number of battery cells
oNBT4
Wind speed-
based
approach
Output WT
power-based
approach
Wind speed-
based
approach
Output WT
power-based
approach
1 0.10 0.06 46 45
2 0.19 0.17 54 57
3 0.29 0.26 61 61
10 0.56 0.31 88 88
20 0.78 0.32 97 98
30 1.21 0.41 109 114
50 3.06 0.58 117 118
70 4.57 0.83 130 129
100 7.06 1.32 126 127
150 12.80 2.47 126 124
200 19.23 4.00 132 131
Table 5
Results obtained from statistical approaches with Monte Carlo simulations – life-
time indicator and system autonomy.
Number of
days
System autonomy (h) Number of cycles (over 20
years)
Wind speed-
based
approach
Output WT
power-based
approach
Wind speed-
based
approach
Output WT
power-based
approach
1 4.8 4.7 648 653
2 6 6 477 463
3 6.3 6.3 469 469
10 9.1 9.1 408 408
20 10 10.2 411 411
30 11.3 11.8 410 414
50 12.2 12.2 391 391
70 13.3 13.3 375 376
100 13 13.1 386 384
150 13.1 12.8 374 374
200 13.4 13.2 372 373
0 20 40 60 80 100 120 140 160 18040
50
60
70
80
90
100
110
120
130
Number of days Nd
Ave
rag
eN
b.
of b
att
ery
ce
lls<
NB
T>
Wind speed-based approach
Output WT power-based approach
threshold of 70 days
200
Fig. 8. Battery sizing versus the number of days of simulations.

indicators (with respect to the reference data) on the reduced
duration Δtcompact. This results in solving an inverse problem with
2N parameters where N denotes the number of segments in the
compact profile. This has been achieved using evolutionary algo-
rithms and more especially with the clearing method [33] well
suited to deal with this kind of problem with high dimensionality
and high multimodality. It should also be noted that the number N
of segments can itself be optimized through a self-adaptive pro-
cedure [22]. The target indicators are defined to characterize the
signal (minimum, maximum, average values, probability density
function) but they can also be related to the design context (here,
the WT system has to charge a battery bank for which maximum
power and energy range are relevant).
4.2. Compact synthesis approach using system-based targets
The first compact synthesis approach is based on the use of
target indicators related to the storage system features. In this
approach, the global sizing of the storage system is related to the
three following variables: PBATMAX, PBATMIN and ES which respec-
tively denote the maximum and the minimum storage powers in
the battery PBAT(t) and the maximum energy quantity imposed on
this storage. These variables are extracted from the simulation of a
8 kW passive WT system over the reference profile of Δtref¼200
days and used as target indicators in the synthesis process. Note
that the reference value of the storage useful energy ESref is defined
as follows:
ESref ¼ max EðtÞ& min EðtÞ ð5Þ
with EðtÞ ¼R t0 PBAT ðτÞdτ tA ½0;Δtref + where E(t) is a saturated
integral, with 0 as upper limit so that the battery storage is only
sized in discharge mode to avoid oversizing during a long charging
period (high winds with reduced load). An additional target
indicator is considered to take account of statistic features of the
reference wind cycle. We use the Cumulative Distribution Function
CDF(Vref) [23] computed from the corresponding probability den-
sity function (PDFref) related to the reference wind speed beha-
viour. PDFref is evaluated on 20 equally spaced intervals between
0 and the maximum wind speed value Vrefmax. Finally, the global
error ε to be minimized in the synthesis profile process can be
expressed as:
ϵ¼PBATMAX&PBATMAX ref
PBATMAX ref
' (2
þPBATMIN&PBATMIN ref
PBATMIN ref
' (2
þES&ESrefESref
' (2
þϵstat
ð6Þ
where the statistic error εstat denotes the mean squared error
between both CDFs relative to reference and generated wind speed
profiles:
εstat ¼1
20'X
20
k ¼ 1
CDFðkÞ&CDFref ðkÞ
CDFref ðkÞ
' (2
ð7Þ
All ‘ref’ indexed variables are based on the reference wind
profile of Fig. 10. The inverse problem is solved with the clearing
algorithm [33] using a population size of 100 individuals and a
number of generations of 500,000. Multiple optimization runs are
performed with different compaction times Δtcompact. In particular,
the minimum compaction time (i.e. min Δtcompact) was determined
using a dichotomous search in order to ensure a global error ε less
than 10&2. Table 6 shows the values of the global error ε versus the
compaction time. It can be seen that the lowest value for Δtcompact
ensuring the fulfillment of the target indicators with sufficient
accuracy is about 10 days. Fig. 11 displays the characteristics of the
generated wind profile obtained from the aggregation of 109 ele-
mentary segments fulfilling all target indicators. It can be seen
from this figure that the CDF of this compact wind profile closely
coincides with that of the reference wind profile.
Table 7 compares the values of the target indicators related to
the battery sizing for the reference profile and the fictitious profile
generated with the clearing algorithm. A good agreement between
those values indicates that the compact wind profile would cer-
tainly lead to the same battery sizing as with the reference wind
profile over a longer period. This will be verified in Section 5.
Finally, it should be noted that the equivalent number of full cycles
resulting from the fictitious wind profile and extrapolated over 20
t
Sn
tn
Sn
V
S1 S2
S3
S4
S5
S6
S7
V
t
Fig. 9. Principle of the wind profile synthesis (a) wind profile generated by elementary segments (b) segment parameters.
0 50 100 150 2000
10
20
V(m
/s)
40P
BATMIN = -5.88 PBATMAX = 30
0 50 100 150 200-10
0
10
20
30
PB
AT
(kW
)
Time (days)
0
0 50 100 150 200
-30
-20
-10
E (
kW
h)
ES
= 32.36
Fig. 10. Actual “reference” wind speed profile, corresponding storage power and
energy.

years is 385. This number is coherent with the reference values
obtained in Table 5 with wind profiles of longer duration.
4.3. Compact synthesis approach using wind-based targets
In this second approach, the selected target indicators are only
related to the wind features: this approach can be considered as
generic in the case of any WT systemwhatever its sizing. We firstly
consider three indicators Vmax, Vmin and oV34 representing the
maximum and minimum speed values and the average cubic wind
speed value. Note that oV34 is used instead of the average wind
speed value oV4 because the WT power is directly proportional
to the cubic wind speed value. Similarly to the previous approach,
we also add the CDF as a target indicator associated with the wind
profile in order to take the wind statistic into account. Finally, we
consider as the last indicator related to “wind energy” the variable
EV defined as:
EV ¼ maxtA ½0;Δt+
EðtÞ& mintA ½0;Δt+
EðtÞ ð8Þ
with EðtÞ ¼R t0ðV
3ðτÞ&oV34 Þdτ tA ½0;Δt+
EV represents an “intermittent wind pseudo energy”. In fact, EVplays a similar role with ES in the previous approach for the sto-
rage system. Note that the wind power being proportional to V3, EVis not actually energy (in Joules or kWh) but can be seen as a
“pseudo energy” which is qualitatively related to the wind energy.
The global error ε to be minimized with this second approach can
be expressed as:
ε¼Vmax&Vmax ref
Vmax ref
' (2
þVmin&Vmin ref
Vmin ref
' (2
þoV3
4&oV34 ref
oV34 ref
!2
þEV &EV ref
EV ref
' (2
þεstat ð9Þ
where εstat is computed according to Eq. (7) and where the refer-
ence intermittent wind energy EVref is scaled according to the
compact profile duration:
EV ref ¼Δtcompact
Δtref' EVref ðΔtref Þ ð10Þ
The inverse problem is solved with the clearing algorithm with
the same control parameters as in the previous subsection. Mul-
tiple optimization runs were performed with different compaction
time Δtcompact. The minimum value for this variable ensuring a
global error of less than 10&2 was identical to that found with the
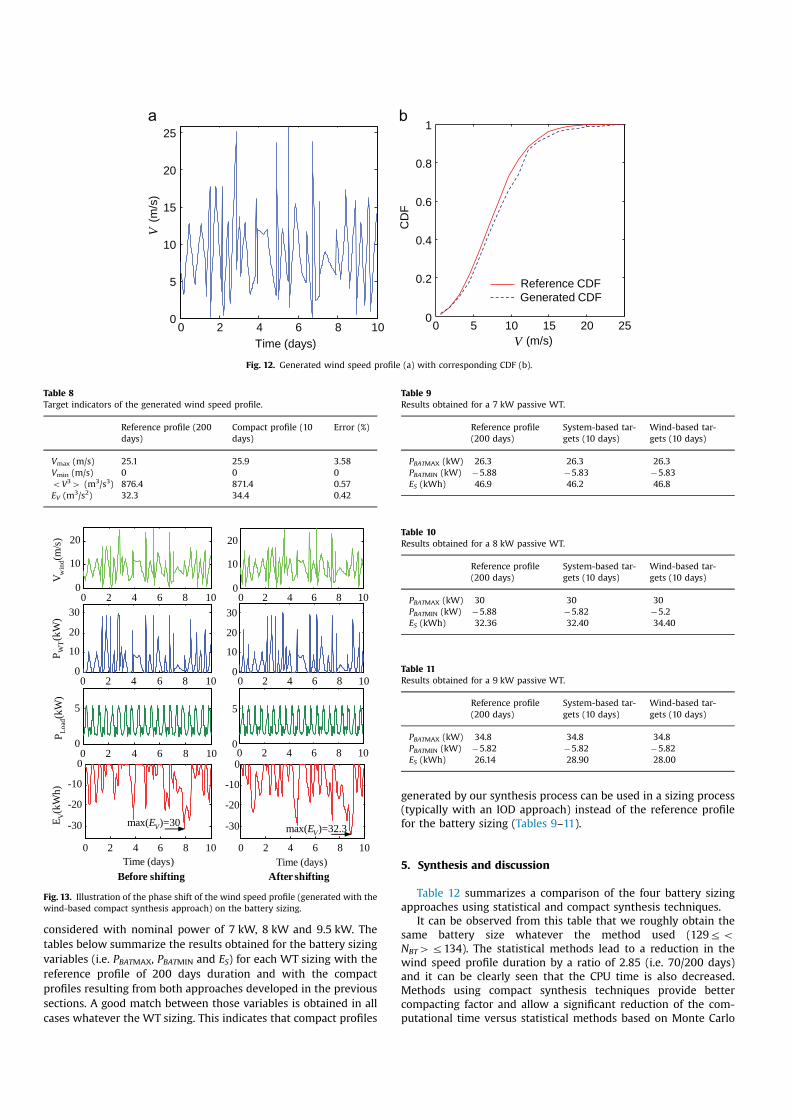
previous approach (i.e. 10 days). Fig. 12 shows the characteristics of
the generated wind profile obtained for Δtcompact¼10 days, from
the aggregation of 130 elementary segments fulfilling all target
indicators. The good match between the compact generated pro-
file and the reference profile can also be observed in this figure in
terms of CDF. Finally, Table 8 shows that the values of the target
indicators are very close in both cases. For comparison with the
previous approach, we also give the sizing of the battery obtained
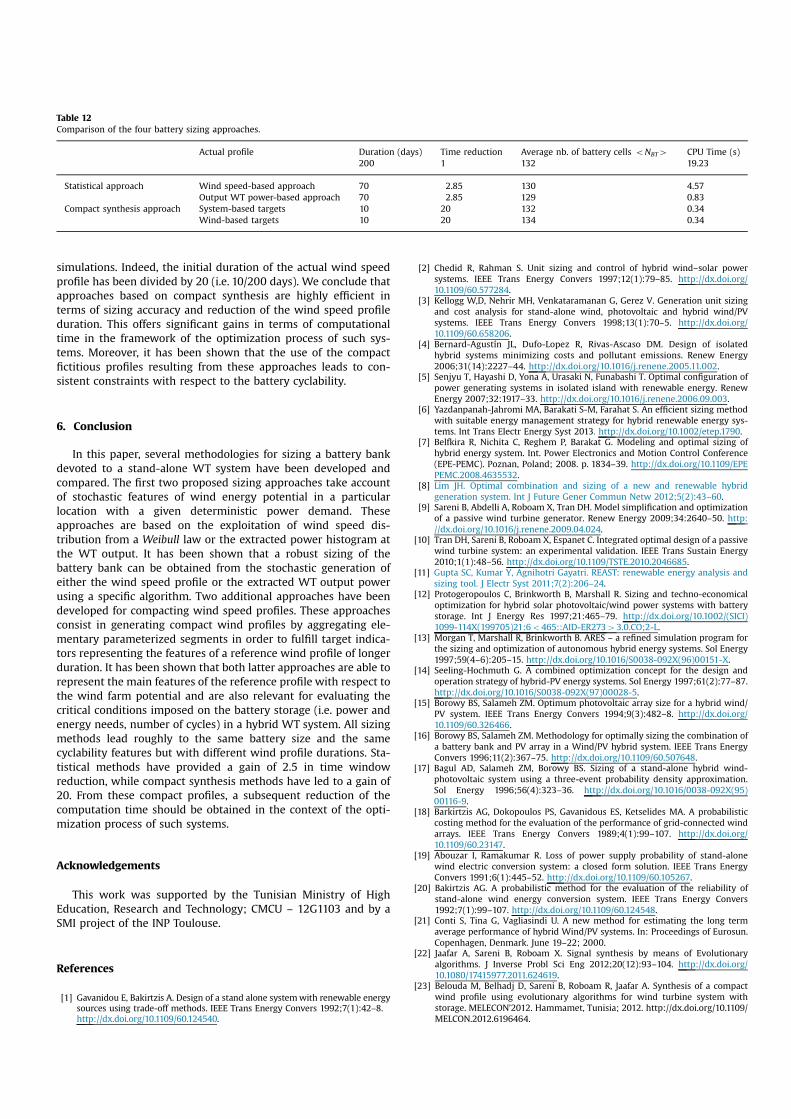
from the simulation of the compact profile. It should be noted that
contrary to the first approach, the second does not include phase
correlations between wind and load profiles because it only con-
siders wind speed variations to generate the compact wind speed
profile. Consequently, the second approach does not ensure find-
ing the most critical constraints on the storage device in terms of
production – load phase shift. This can be a posteriori done by
sequentially shifting the obtained wind profile to its 10 day time
window in compliance with the deterministic load profile repe-
ated from day to day. The maximum storage energy quantity ES is
computed for each phase shift and the highest (most critical) value
is returned (see Fig. 13). In this way, a value of 34.4 kWh is
obtained for ES which is very close to that resulting from the
reference profile simulation (i.e. 32.3 kWh).
Finally, we mention that the equivalent number of full cycles
resulting from the fictitious wind profile and extrapolated over 20
years is 398, close to the previous values obtained with the other
approaches.
4.4. Validation of the previous results for various WT sizes
In order to validate the effectiveness of the previous approa-
ches, the compact wind profiles obtained in both methods are
used to estimate the battery sizing for various WTs. Three WTs are
Table 6
Influence of Δtcompact on the global error ε.
Δtcompact (days) 40 20 10 5
Global error ε E8.10&3E9.10&3
E9.10&3E7.10&2
0 2 4 6 8 100
5
10
15
20
25
30
Time (days)
V(m
/s)
0 5 10 15 20 250
0.2
0.4
0.6
0.8
1
V (m/s)
CD
F
Reference CDFGenerated CDF
Fig. 11. Generated wind speed profile (a) with corresponding CDF (b).
Table 7
Target indicators of the generated wind speed profile.
Reference profile (200
days)
Compact profile (10
days)
Error (%)
PBATMAX (kW) 30 30 0
PBATMIN (kW) &5.88 &5.82 0.1
ES (kWh) 32.36 32.4 0.12
considered with nominal power of 7 kW, 8 kW and 9.5 kW. The
tables below summarize the results obtained for the battery sizing
variables (i.e. PBATMAX, PBATMIN and ES) for each WT sizing with the
reference profile of 200 days duration and with the compact
profiles resulting from both approaches developed in the previous
sections. A good match between those variables is obtained in all
cases whatever the WT sizing. This indicates that compact profiles
generated by our synthesis process can be used in a sizing process
(typically with an IOD approach) instead of the reference profile
for the battery sizing (Tables 9–11).
5. Synthesis and discussion
Table 12 summarizes a comparison of the four battery sizing
approaches using statistical and compact synthesis techniques.
It can be observed from this table that we roughly obtain the
same battery size whatever the method used (129ro
NBT4r134). The statistical methods lead to a reduction in the
wind speed profile duration by a ratio of 2.85 (i.e. 70/200 days)
and it can be clearly seen that the CPU time is also decreased.
Methods using compact synthesis techniques provide better
compacting factor and allow a significant reduction of the com-
putational time versus statistical methods based on Monte Carlo
1
0 5 10 15 20 250
0.2
0.4
0.6
0.8
V (m/s)
CD
F
Reference CDF
Generated CDF
0
5
10
15
20
25
0 2 4 6 8 10
Time (days)
V(m
/s)
Fig. 12. Generated wind speed profile (a) with corresponding CDF (b).
Table 8
Target indicators of the generated wind speed profile.
Reference profile (200
days)
Compact profile (10
days)
Error (%)
Vmax (m/s) 25.1 25.9 3.58
Vmin (m/s) 0 0 0
oV34 (m3/s3) 876.4 871.4 0.57
EV (m3/s2) 32.3 34.4 0.42
0 2 4 6 8 100
10
20
0 2 4 6 8 100
10
20
30
0 2 4 6 8 100
5
0 2 4 6 8 10
-30
-20
-10
0
Time (days)
Vw
i nd(m
/s)
PW
T(k
W)
PL
oad
(kW
)E
V(k
Wh
)
0 2 4 6 8 10
0 2 4 6 8 10
0 2 4 6 8 10
0 2 4 6 8 10
Time (days)
max(EV)=32.3
max(EV)=30
After shiftingBefore shifting
0
10
20
0
10
20
30
0
5
-30
-20
-10
0
Fig. 13. Illustration of the phase shift of the wind speed profile (generated with the
wind-based compact synthesis approach) on the battery sizing.
Table 9
Results obtained for a 7 kW passive WT.
Reference profile
(200 days)
System-based tar-
gets (10 days)
Wind-based tar-
gets (10 days)
PBATMAX (kW) 26.3 26.3 26.3
PBATMIN (kW) &5.88 &5.83 &5.83
ES (kWh) 46.9 46.2 46.8
Table 10
Results obtained for a 8 kW passive WT.
Reference profile
(200 days)
System-based tar-
gets (10 days)
Wind-based tar-
gets (10 days)
PBATMAX (kW) 30 30 30
PBATMIN (kW) &5.88 &5.82 &5.2
ES (kWh) 32.36 32.40 34.40
Table 11
Results obtained for a 9 kW passive WT.
Reference profile
(200 days)
System-based tar-
gets (10 days)
Wind-based tar-
gets (10 days)
PBATMAX (kW) 34.8 34.8 34.8
PBATMIN (kW) &5.82 &5.82 &5.82
ES (kWh) 26.14 28.90 28.00
simulations. Indeed, the initial duration of the actual wind speed
profile has been divided by 20 (i.e. 10/200 days). We conclude that
approaches based on compact synthesis are highly efficient in
terms of sizing accuracy and reduction of the wind speed profile
duration. This offers significant gains in terms of computational
time in the framework of the optimization process of such sys-
tems. Moreover, it has been shown that the use of the compact
fictitious profiles resulting from these approaches leads to con-
sistent constraints with respect to the battery cyclability.
6. Conclusion
In this paper, several methodologies for sizing a battery bank
devoted to a stand-alone WT system have been developed and
compared. The first two proposed sizing approaches take account
of stochastic features of wind energy potential in a particular
location with a given deterministic power demand. These
approaches are based on the exploitation of wind speed dis-
tribution from a Weibull law or the extracted power histogram at
the WT output. It has been shown that a robust sizing of the
battery bank can be obtained from the stochastic generation of
either the wind speed profile or the extracted WT output power
using a specific algorithm. Two additional approaches have been
developed for compacting wind speed profiles. These approaches
consist in generating compact wind profiles by aggregating ele-
mentary parameterized segments in order to fulfill target indica-
tors representing the features of a reference wind profile of longer
duration. It has been shown that both latter approaches are able to
represent the main features of the reference profile with respect to
the wind farm potential and are also relevant for evaluating the
critical conditions imposed on the battery storage (i.e. power and
energy needs, number of cycles) in a hybrid WT system. All sizing
methods lead roughly to the same battery size and the same
cyclability features but with different wind profile durations. Sta-
tistical methods have provided a gain of 2.5 in time window
reduction, while compact synthesis methods have led to a gain of
20. From these compact profiles, a subsequent reduction of the
computation time should be obtained in the context of the opti-
mization process of such systems.
Acknowledgements
This work was supported by the Tunisian Ministry of High
Education, Research and Technology; CMCU – 12G1103 and by a
SMI project of the INP Toulouse.
References
[1] Gavanidou E, Bakirtzis A. Design of a stand alone systemwith renewable energysources using trade-off methods. IEEE Trans Energy Convers 1992;7(1):42–8.http://dx.doi.org/10.1109/60.124540.
[2] Chedid R, Rahman S. Unit sizing and control of hybrid wind–solar power
systems. IEEE Trans Energy Convers 1997;12(1):79–85. http://dx.doi.org/
10.1109/60.577284.[3] Kellogg W,D, Nehrir MH, Venkataramanan G, Gerez V. Generation unit sizing
and cost analysis for stand-alone wind, photovoltaic and hybrid wind/PV
systems. IEEE Trans Energy Convers 1998;13(1):70–5. http://dx.doi.org/
10.1109/60.658206.[4] Bernard-Agustín JL, Dufo-Lopez R, Rivas-Ascaso DM. Design of isolated
hybrid systems minimizing costs and pollutant emissions. Renew Energy
2006;31(14):2227–44. http://dx.doi.org/10.1016/j.renene.2005.11.002.[5] Senjyu T, Hayashi D, Yona A, Urasaki N, Funabashi T. Optimal configuration of
power generating systems in isolated island with renewable energy. Renew
Energy 2007;32:1917–33. http://dx.doi.org/10.1016/j.renene.2006.09.003.[6] Yazdanpanah-Jahromi MA, Barakati S-M, Farahat S. An efficient sizing method
with suitable energy management strategy for hybrid renewable energy sys-
tems. Int Trans Electr Energy Syst 2013. http://dx.doi.org/10.1002/etep.1790.[7] Belfkira R, Nichita C, Reghem P, Barakat G. Modeling and optimal sizing of
hybrid energy system. Int. Power Electronics and Motion Control Conference
(EPE-PEMC). Poznan, Poland; 2008. p. 1834–39. http://dx.doi.org/10.1109/EPE
PEMC.2008.4635532.[8] Lim JH. Optimal combination and sizing of a new and renewable hybrid
generation system. Int J Future Gener Commun Netw 2012;5(2):43–60.[9] Sareni B, Abdelli A, Roboam X, Tran DH. Model simplification and optimization
of a passive wind turbine generator. Renew Energy 2009;34:2640–50. http:
//dx.doi.org/10.1016/j.renene.2009.04.024.[10] Tran DH, Sareni B, Roboam X, Espanet C. Integrated optimal design of a passive
wind turbine system: an experimental validation. IEEE Trans Sustain Energy
2010;1(1):48–56. http://dx.doi.org/10.1109/TSTE.2010.2046685.[11] Gupta SC, Kumar Y, Agnihotri Gayatri. REAST: renewable energy analysis and
sizing tool. J Electr Syst 2011;7(2):206–24.[12] Protogeropoulos C, Brinkworth B, Marshall R. Sizing and techno-economical
optimization for hybrid solar photovoltaic/wind power systems with battery
storage. Int J Energy Res 1997;21:465–79. http://dx.doi.org/10.1002/(SICI)
1099-114X(199705)21:6o465::AID-ER27343.0.CO;2-L.[13] Morgan T, Marshall R, Brinkworth B. ARES – a refined simulation program for
the sizing and optimization of autonomous hybrid energy systems. Sol Energy
1997;59(4–6):205–15. http://dx.doi.org/10.1016/S0038-092X(96)00151-X.[14] Seeling-Hochmuth G. A combined optimization concept for the design and
operation strategy of hybrid-PV energy systems. Sol Energy 1997;61(2):77–87.
http://dx.doi.org/10.1016/S0038-092X(97)00028-5.[15] Borowy BS, Salameh ZM. Optimum photovoltaic array size for a hybrid wind/
PV system. IEEE Trans Energy Convers 1994;9(3):482–8. http://dx.doi.org/
10.1109/60.326466.[16] Borowy BS, Salameh ZM. Methodology for optimally sizing the combination of
a battery bank and PV array in a Wind/PV hybrid system. IEEE Trans Energy
Convers 1996;11(2):367–75. http://dx.doi.org/10.1109/60.507648.[17] Bagul AD, Salameh ZM, Borowy BS. Sizing of a stand-alone hybrid wind-
photovoltaic system using a three-event probability density approximation.
Sol Energy 1996;56(4):323–36. http://dx.doi.org/10.1016/0038-092X(95)
00116-9.[18] Barkirtzis AG, Dokopoulos PS, Gavanidous ES, Ketselides MA. A probabilistic
costing method for the evaluation of the performance of grid-connected wind
arrays. IEEE Trans Energy Convers 1989;4(1):99–107. http://dx.doi.org/
10.1109/60.23147.[19] Abouzar I, Ramakumar R. Loss of power supply probability of stand-alone
wind electric conversion system: a closed form solution. IEEE Trans Energy
Convers 1991;6(1):445–52. http://dx.doi.org/10.1109/60.105267.[20] Bakirtzis AG. A probabilistic method for the evaluation of the reliability of
stand-alone wind energy conversion system. IEEE Trans Energy Convers
1992;7(1):99–107. http://dx.doi.org/10.1109/60.124548.[21] Conti S, Tina G, Vagliasindi U. A new method for estimating the long term
average performance of hybrid Wind/PV systems. In: Proceedings of Eurosun.
Copenhagen, Denmark. June 19–22; 2000.[22] Jaafar A, Sareni B, Roboam X. Signal synthesis by means of Evolutionary
algorithms. J Inverse Probl Sci Eng 2012;20(12):93–104. http://dx.doi.org/
10.1080/17415977.2011.624619.[23] Belouda M, Belhadj D, Sareni B, Roboam R, Jaafar A. Synthesis of a compact
wind profile using evolutionary algorithms for wind turbine system with
storage. MELECON’2012. Hammamet, Tunisia; 2012. http://dx.doi.org/10.1109/
MELCON.2012.6196464.
Table 12
Comparison of the four battery sizing approaches.
Actual profile Duration (days) Time reduction Average nb. of battery cells oNBT4 CPU Time (s)
200 1 132 19.23
Statistical approach Wind speed-based approach 70 2.85 130 4.57
Output WT power-based approach 70 2.85 129 0.83
Compact synthesis approach System-based targets 10 20 132 0.34
Wind-based targets 10 20 134 0.34

[24] Fefermann Y, Randi SA, Astier S, Roboam X. Synthesis models of PM Brushless
Motors for the design of complex and heterogeneous system. EPE’01. Graz,
Austria. September; 2001.[26] ⟨http://www.houseofbatteries.com/⟩.[27] Drouilhet S, Johnson BL. A battery life prediction method for hybrid power
applications. In: Proceedings of the 35th AIAA Aerospace Sciences Meeting
and Exhibit. Reno, USA; 1997.[28] Dufo-Lopez R, Bernal-Agustin JL. Multi-objective design of PV-wind-diesel-
hydrogen-battery systems. Renew Energy 2008;33:2559–72. http://dx.doi.
org/10.1016/j.renene.2008.02.027.[29] Jaafar A, Akli CR, Sareni B, Roboam X, Jeunesse A. Sizing and energy man-
agement of a hybrid locomotive based on flywheel and accumulators. IEEE
Trans Veh Technol 2009;58(8):3947–58. http://dx.doi.org/10.1109/TVT.2009.2027328.
[30] Downing SD, Socie DF. Simple rainflow counting algorithms. Int J Fatigue1982;4(1):31–40. http://dx.doi.org/10.1016/0142-1123(82)90018-4.
[32] Roboam X, Abdelli A, Sareni B. Optimization of a passive small wind turbinebased on mixed Weibull-turbulence statistics of wind. Electrimacs. Québec,Canada; 2008.
[33] Petrowski A. A clearing procedure as a niching method for genetic algorithms.In: Proceedings of the IEEE international conference on evolutionary com-putation. Nagoya, Japan; 1996. p. 798–803. http://dx.doi.org/10.1109/ICEC.1996.542703.