Design and verification of a pan-genome microarray oligonucleotide probe set for Dehalococcoides...
10
Published Ahead of Print 10 June 2011. 10.1128/AEM.00063-11. 2011, 77(15):5361. DOI: Appl. Environ. Microbiol. Tillier and Elizabeth A. Edwards Laura A. Hug, Maryam Salehi, Paulo Nuin, Elisabeth R. Dehalococcoides spp. Microarray Oligonucleotide Probe Set for Design and Verification of a Pangenome http://aem.asm.org/content/77/15/5361 Updated information and services can be found at: These include: SUPPLEMENTAL MATERIAL Supplemental material REFERENCES http://aem.asm.org/content/77/15/5361#ref-list-1 at: This article cites 60 articles, 30 of which can be accessed free CONTENT ALERTS more» articles cite this article), Receive: RSS Feeds, eTOCs, free email alerts (when new http://journals.asm.org/site/misc/reprints.xhtml Information about commercial reprint orders: http://journals.asm.org/site/subscriptions/ To subscribe to to another ASM Journal go to: on December 2, 2013 by Univ of California-Berkeley Biosci & Natural Res Lib http://aem.asm.org/ Downloaded from on December 2, 2013 by Univ of California-Berkeley Biosci & Natural Res Lib http://aem.asm.org/ Downloaded from
-
Upload
majapasovic -
Category
Documents
-
view
0 -
download
0
Transcript of Design and verification of a pan-genome microarray oligonucleotide probe set for Dehalococcoides...
Published Ahead of Print 10 June 2011. 10.1128/AEM.00063-11.
2011, 77(15):5361. DOI:Appl. Environ. Microbiol. Tillier and Elizabeth A. EdwardsLaura A. Hug, Maryam Salehi, Paulo Nuin, Elisabeth R. Dehalococcoides spp. Microarray Oligonucleotide Probe Set for Design and Verification of a Pangenome
http://aem.asm.org/content/77/15/5361Updated information and services can be found at:
These include:
SUPPLEMENTAL MATERIAL Supplemental material
REFERENCEShttp://aem.asm.org/content/77/15/5361#ref-list-1at:
This article cites 60 articles, 30 of which can be accessed free
CONTENT ALERTS more»articles cite this article),
Receive: RSS Feeds, eTOCs, free email alerts (when new
http://journals.asm.org/site/misc/reprints.xhtmlInformation about commercial reprint orders: http://journals.asm.org/site/subscriptions/To subscribe to to another ASM Journal go to:
on Decem
ber 2, 2013 by Univ of C
alifornia-Berkeley B
iosci & N
atural Res Lib
http://aem.asm
.org/D
ownloaded from
on D
ecember 2, 2013 by U
niv of California-B
erkeley Biosci &
Natural R
es Libhttp://aem
.asm.org/
Dow
nloaded from
APPLIED AND ENVIRONMENTAL MICROBIOLOGY, Aug. 2011, p. 5361–5369 Vol. 77, No. 150099-2240/11/$12.00 doi:10.1128/AEM.00063-11Copyright © 2011, American Society for Microbiology. All Rights Reserved.
Design and Verification of a Pangenome Microarray OligonucleotideProbe Set for Dehalococcoides spp.�†
Laura A. Hug,1 Maryam Salehi,2 Paulo Nuin,2‡ Elisabeth R. Tillier,2 and Elizabeth A. Edwards1,3*Department of Cell and Systems Biology, University of Toronto, Toronto, ON, Canada1; Department of Medical Biophysics,University of Toronto and Campbell Family Institute for Cancer Research, Ontario Cancer Institute, University Health Network,
Toronto, ON, Canada2; and Department of Chemical Engineering and Applied Chemistry,University of Toronto, Toronto, ON, Canada3
Received 12 January 2011/Accepted 6 June 2011
Dehalococcoides spp. are an industrially relevant group of Chloroflexi bacteria capable of reductively dechlo-rinating contaminants in groundwater environments. Existing Dehalococcoides genomes revealed a high level ofsequence identity within this group, including 98 to 100% 16S rRNA sequence identity between strains withdiverse substrate specificities. Common molecular techniques for identification of microbial populations areoften not applicable for distinguishing Dehalococcoides strains. Here we describe an oligonucleotide microarrayprobe set designed based on clustered Dehalococcoides genes from five different sources (strain DET195,CBDB1, BAV1, and VS genomes and the KB-1 metagenome). This “pangenome” probe set provides coverageof core Dehalococcoides genes as well as strain-specific genes while optimizing the potential for hybridizationto closely related, previously unknown Dehalococcoides strains. The pangenome probe set was compared toprobe sets designed independently for each of the five Dehalococcoides strains. The pangenome probe setdemonstrated better predictability and higher detection of Dehalococcoides genes than strain-specificprobe sets on nontarget strains with <99% average nucleotide identity. An in silico analysis of the expectedprobe hybridization against the recently released Dehalococcoides strain GT genome and additional KB-1metagenome sequence data indicated that the pangenome probe set performs more robustly than the combinedstrain-specific probe sets in the detection of genes not included in the original design. The pangenome probeset represents a highly specific, universal tool for the detection and characterization of Dehalococcoides fromcontaminated sites. It has the potential to become a common platform for Dehalococcoides-focused research,allowing meaningful comparisons between microarray experiments regardless of the strain examined.
The genus Dehalococcoides contains obligate anaerobes ca-pable of reductively dechlorinating a variety of commongroundwater contaminants (1, 12, 18, 31). The utility of Deha-lococcoides in bioremediation of chlorinated-solvent-contami-nated sites has lead to the development of Dehalococcoides-containing cultures utilized as industrial tools (12, 29),methods for identifying and tracking Dehalococcoides growthand dechlorination (26, 45, 54), and methods for identifyingthe novel metabolism associated with the dechlorination reac-tion (2, 27, 30, 40). The Dehalococcoides appear to be globallydistributed; they have been isolated from sites in North Amer-ica (e.g., strains DET195 [37], MB [7], and FL2 [19]) andEurope (e.g., strain CBDB1 [3]) and identified at many con-taminated sites and more remote environments (1, 15, 22).Genome sequences currently exist for five strains of Dehalo-coccoides, strain DET195 (48), strain CBDB1 (31), strainBAV1 (38), strain VS (38), and strain GT (http://genome.jgi-psf.org/deh_g/deh_g.home.html). Several more genome se-
quences are in progress from mixed-culture metagenomes, in-cluding from the KB-1 enrichment consortium, which containsat least two Dehalococcoides strains (12). Comparative genom-ics has revealed that the Dehalococcoides spp. share a coregenome having high synteny and conservation of nucleotideidentity, with two regions of high plasticity (HPRs) where largegenomic rearrangements and gene variation occur (38).
The Dehalococcoides spp. exhibit a wide range of substratespecificities on halogenated compounds (12, 24, 37, 52). Thereductive dehalogenases are the enzyme family capable of cat-alyzing the removal of chlorine ions from a substrate (23, 47).From sequenced genomes, it is clear that each strain containsa unique subset of reductive dehalogenases, explaining theirdifferent substrate specificities (38).
The close conservation of the Dehalococcoides genomes out-side the HPRs is highlighted by their 16S rRNA identities,which range from 98 to 100% identical for all known strains(Fig. 1), a lack of variation discordant with the diverse sub-strate specificities exhibited by the different strains. Quantita-tive PCR of Dehalococcoides 16S is a common tool used withinconsulting companies for identification of Dehalococcoides atsites (41, 46), but it is not useful for strain examinations orseparate tracking of native and augmented organisms. Quan-titative PCR assays for several of the reductive dehalogenaseswith known functions have been developed for assessing asite’s potential for dechlorination (8, 45), but these generateinformation for, at best, a few genes.
There is an identified need for common tools and techniques
* Corresponding author. Mailing address: Department of ChemicalEngineering and Applied Chemistry, University of Toronto, 200 Col-lege Street, Toronto, ON M5S 3E5, Canada. Phone: (416) 946-3506.Fax: (416) 978-8605. E-mail: [email protected].
‡ Present address: Department of Pathology and Molecular Medi-cine and Ontario Cancer Biomarker Network, Queens University,Kingston, ON, Canada.
† Supplemental material for this article may be found at http://aem.asm.org/.
� Published ahead of print on 10 June 2011.
5361
on Decem
ber 2, 2013 by Univ of C
alifornia-Berkeley B
iosci & N
atural Res Lib
http://aem.asm
.org/D
ownloaded from

to allow better comparisons across Dehalococcoides strains aswell as for tools robust for use with pure strains, mixed bacte-rial enrichment cultures, and environmental samples. In par-ticular, the ability to detect and identify native Dehalococcoidesat a contaminated site and to track specific strains of bioaug-mented Dehalococcoides during the course of a biodegradationtreatment is a recognized need.
Oligonucleotide arrays have been used to examine intras-pecies genomic variation for a number of well-characterizedgenera, including Saccharomyces (17, 60), and for Esche-richia coli (57, 58). There are several currently availablearrays for examining Dehalococcoides. PhyloChip, a 16SrRNA-based microbial diagnostic microarray (6, 10, 63),allows distinguishing of Dehalococcoides from other generabut does not allow strain differentiation (10). The GeoChip,a functional gene array focused on biogeochemical functions(20, 21, 53), allows identification of key functional genes indifferent Dehalococcoides strains, along with other geo-chemically important bacterial processes (20, 21, 44). Morespecifically for the Dehalococcoides, a whole-genome-tiledmicroarray exists for strain 195 (25), which has been used toextensively examine that strain’s metabolic profile underdifferent treatments (28) and to examine a mixed commu-nity containing two different Dehalococcoides strains (56).Recently, an oligonucleotide array was developed coveringall genes from four sequenced Dehalococcoides genomes,with cross-hybridization of probes stringently prevented(32). This pangenus array design works well for the fourDehalococcoides genomes it represents but will only provideuseful data for unsequenced Dehalococcoides genomes ex-hibiting a high sequence similarity to the design genomes.
Here we describe and validate an option for Dehalococcoidesarray probe design that increases the utility of the array fordiverging strains. Oligonucleotide probes are designed forgroups of orthologous genes, such that the probe hybridizes toconserved regions within the genes and, hence, has a higherlikelihood of matching an as-yet-unsequenced ortholog from anovel strain. The program ProDesign (14) implements thisapproach using gene clusters defined by sequence similarity,
generating the best probe set for a given set of clusters whileoptimizing probe melting temperatures and minimizing cross-hybridization of probes to nontarget genes.
Probes were designed by ProDesign for clusters of conservedgenes from the Dehalococcoides spp. for which genomic se-quence information was available (strains 195, VS, CBDB1,BAV1, and KB-1). The clusters of orthologous genes weredefined such that some probes allow universal detection ofDehalococcoides, while others provide strain-specific differen-tiation. The functionality of this pangenome probe set wascompared to oligonucleotide probe sets designed for the fiveDehalococcoides strains individually by the Agilent eArrayplatform in comparative genomic hybridizations. The compar-ison between the pangenome probe set (designed by Pro-Design) and the strain-specific probe sets (designed by Agi-lent’s eArray) was extended to an in silico examination of thecoverage of the genes of Dehalococcoides strain GT, whosegenome was not available at the time of probe design. Thepangenome probe set provided a higher expected coverage ofstrain GT’s genes than a combined data set of all of the singlegenome probes, highlighting the advantage of designing probesfor clustered homologs.
MATERIALS AND METHODS
KB-1 metagenome sequence. DNA was extracted from the KB-1 enrichmentculture using a cetyltrimethylammonium bromide (CTAB) protocol (59), withvolumes scaled up for higher yield as described in the alternate protocol, omit-ting subsequent cesium chloride gradient centrifugation steps. Clone librarieswith 8-kb and 3-kb inserts were created by the Joint Genome Institute (JGI)using their in-house protocols (http://www.jgi.doe.gov/sequencing/protocols),and end sequencing was conducted using an AB13730xl Sanger sequencingmachine. The metagenome was sequenced in two stages: an initial 10 Mb ofsequence, which was available at the time of the pangenome probe design, anda subsequent final 95-Mb sequence, which is publically available (http://genome.jgi-psf.org/aqukb/aqukb.home.html).
Identification and clustering of the Dehalococcoides genes. All coding genesfrom the four available Dehalococcoides genomes (strains 195, VS, CBDB1, andBAV1 [RefSeq accession no. NC_002936.3, NC_013552.1, NC_007356.1,NC_009455.1, respectively]) were combined into a database. Dehalococcoidesgenes from the KB-1 metagenome were identified by a BLAST search (5) of theinitial 10 Mb of the KB-1 metagenome sequence against this database of Deha-lococcoides genes. Metagenome sequences whose BLAST hits had E values of�1 � 10�5 and percent identities of �90% were aligned with the EMBOSSWater program (49) to generate full-length gene alignments within the longercontig sequences. The 1,146 sequences identified were then translated, andsequences truncated by stop codons were removed, leaving a final set of 933KB-1 gene sequences. These sequences represent high-confidence Dehalococ-coides genes and were included in the panarray probe design to ensure that theprobe design was based on the full breadth of available nucleotide diversitywithin the Dehalococcoides genus.
The final gene set comprised 6,812 sequences. These genes were clustered atthe nucleotide level using cd-hit-est (33–35) at sequence identity thresholds of 80to 95% identity (ID) at 1% intervals, with an alignment coverage control (cd-hit-est with flag-aL) of 80%.
Pangenome probe design. The program ProDesign/OpSelector (14) was usedto generate probes for the clustered Dehalococcoides genes. Clusters were re-verse complemented, and the full duplicated set of clusters was used in a separateround of ProDesign to allow multiple probes to be designed to the same cluster.Several parameter conditions were tested, with the final set as follows: seedweight of 12, seed span of 24, probe length of 50 to 60 nucleotides (nt), and afinal melting temperature (Tm) of 89.5°C. To prevent nonspecific hybridization,probes were tested against a set of available genomes from soil bacteria and closerelatives to organisms present in dechlorinating enrichment cultures, and cross-hybridizing probes were redesigned.
For probe design based on the prediction of hybridization, clustering ho-mologs based on a threshold of sequence identity is preferable to best-reciprocalBLAST match approaches meant to identify and cluster orthologs (as has been
FIG. 1. Maximum likelihood phylogenetic tree from a 16S rRNAgene alignment, including the 5 Dehalococcoides strains involved inprobe design experiments, the in silico tester strain, Dehalococcoidesstrain GT, and the nearest sequenced relative to the Dehalococcoidesgroup, Dehalogenimonas lykanthroporepellens strain BL-DC-9. Num-bers on nodes refer to bipartition support from 100 bootstrap repli-cates. The 16S sequence alignment was generated using the Geneiousmuscle global alignment plug-in (11, 13), with the phylogeny and boot-strap replicates generated using RAxML version 7.0.3 under the GTR-GAMMA model of sequence evolution (50).
5362 HUG ET AL. APPL. ENVIRON. MICROBIOL.
on Decem
ber 2, 2013 by Univ of C
alifornia-Berkeley B
iosci & N
atural Res Lib
http://aem.asm
.org/D
ownloaded from

used for other Dehalococcoides comparisons [4, 38]). A sequence identity of 95%was chosen as the optimal clustering threshold which maximized the ProDesignprobe coverage of the clusters. This resulted in 4,232 clusters, of which 3,857 hadat least one probe designed (91.1%). The clustering at 95% gave high relativenumbers of core gene clusters (defined here as a cluster containing a sequencefrom all five genomes, in which the KB-1 data are considered a “genome”) andclusters containing genes from subsets of the five genomes, compared to clusterscontaining a sequence from a single genome. The use of reverse-complementedsequences in a second round of ProDesign probe design provided additionalcoverage (i.e., coverage of a cluster not previously having a sense-strand probedesigned to it) of 405 clusters, representing 418 genes (6.1% of total genes). Anyprobe to a reverse-complemented cluster was subsequently returned to an anti-sense sequence for array printing. The final pangenome probe set coveragestatistics are presented in Table 1. The distribution of the five genomes withinclusters is depicted as a Venn diagram in Fig. S1 in the supplemental material.The probe sequences are presented in Table S1 in the supplemental material.
Dehalococcoides strain-specific probe design. The Agilent eArray system (withall default parameters for bacterial genomes) was used to design probes for thecomplete gene complement of each individual genome sequence (or partialgenome sequence, in the case of KB-1). The statistical properties of these probesets are presented in Table 1, and their sequences are listed in Table S1 in thesupplemental material.
The final array design was built on a 4 � 44K Agilent oligonucleotide array. Itcontains triplicate copies of the 5 strain-specific probe sets and the pangenomeprobe set generated by ProDesign/OpSelector, with any remaining spot filled byrandom selection of pangenome probes.
DNA microarray template preparation, hybridization, and signal processing.Pure strain DNA for Dehalococcoides strains VS, CBDB1, and BAV1 was gen-erously provided by Alfred Spormann (Stanford University), Lorenz Adrian(Helmholtz Centre for Environmental Research [UFZ]), and Frank Loffler(Georgia Institute of Technology), respectively. Mixed-culture DNA from theD2 batch reactor (43) containing Dehalococcoides strain DET195 was generouslyprovided by Ruth Richardson (Cornell University). KB-1 DNA was extractedin-house from 50 ml of the KB-1 enrichment culture using the MoBio UltraCleansoil DNA isolation kit, according to the manufacturer’s directions.
Two 4 � 44K oligonucleotide array slides were ordered from Agilent, provid-ing a total of 8 arrays and a total of 16 possible DNA samples using a 2-dyesystem. The design of the test array DNA hybridizations is depicted in Table S2in the supplemental material.
Amplification and labeling of DNA, as well as hybridization, washing, scan-ning, and quantification of arrays, were done by the University Health NetworksMicroarray Center (UHN). For array hybridization, 50 ng of each Dehalococ-coides DNA sample was amplified and chemically labeled according to theAgilent WGA�ULS (version 3) protocol for comparative genome hybridizations(CGHs). Equal quantities (200 ng) of amplified and labeled DNA were spottedon each array. Hybridization was conducted at 65°C with shaking at 20 rpm for20 h. Quantification of array intensities was done with a G2565C DNAscanner, and intensities were analyzed using the Agilent Feature Extractionsoftware version 10.5. Raw intensity values and background-subtracted spotintensities were generated following all Agilent Feature Extraction steps inthe CGH_105_Dec08 Agilent protocol. For all subsequent analyses, the back-ground-subtracted spot intensities are used as the prenormalization values.
Array normalization. The intensities of the red channel duplicate sampleswere compared to determine if there was significant between-array error. For theDehalococcoides strain CBDB1 DNA samples, one array replicate showed sig-nificant noise within its signal intensities. Upon examination of the KB-1 (green)
intensities of the same array, a similar trend was observed, indicating that thisarray had not hybridized comparably to the other arrays. Subsequently, thesearray data were excluded from the test set.
For the remaining 7 arrays, total array signal intensities were calculated for theKB-1 replicate samples (green channel), and the average total intensity wasdetermined. For each array, both the red and green channel intensities werescaled by the factor normalizing the total green channel intensity to the averagetotal intensity. For the 7 KB-1 replicate arrays, probe intensity values were takenas the trimmed mean of the 7 scaled values (average of the values lying within theinterval of the mean � 3 times the standard deviation of all seven values). For theduplicate red channel samples (VS, DET195, and BAV1), the average intensityof the duplicates was taken. Probes with absolute duplicate pairwise differencesoutside the mean plus 3 times the standard deviation were flagged as poorlyperforming duplicates. For the single array with a Dehalococcoides strain CBDB1DNA sample, probe values were kept as the scaled values from total intensitynormalization.
Individual probes were spotted on the array with a minimum of 3 replicates.Following array duplicate merging, as described above, single-probe intensityvalues were determined by taking the average of the probe replicates within anarray. Previously flagged probes from the duplicate averaging were excluded.Replicate probe pairs whose pairwise difference fell outside the mean � 3 timesthe standard deviation were also excluded, and the final averaged probe valuewas taken from all remaining, reliable probe values.
Expected hybridization patterns. In order to determine the fraction of probeshybridizing correctly, the expected behavior of each probe was determined bioin-formatically.
For the pangenome probes, probes were expected to hybridize to DNA fromDehalococcoides strains if a gene from that strain was present within the clusterto which the probe was designed. For the eArray-designed strain-specific probes,probes designed for a specific genome were universally expected to hybridize tothat strain’s DNA sample.
To determine the expected nontarget strain cross-hybridization, each probewas blasted against the five Dehalococcoides genomes using BLASTn, with adrop-off value for gapped alignments of 150, a nucleotide mismatch penalty of�1, a word size of 7, and filtering for repeated sequences implemented (condi-tions for short query sequences adapted from reference 34) (5, 42). For eacheArray-designed 60-mer, this yielded a BLAST score of nucleotide identitybetween 0 and 60. A BLAST score ratio (BSR) was calculated for each probeusing the BLAST score of that probe against a nonspecific genome, divided bythe BLAST score of the probe against its specific genome (score � 60). Theexpected cross-hybridization patterns for BSR thresholds between 83% and95%, at 1% intervals, were determined for the strain-specific probes as well as forthe pangenome probe set.
Signal threshold determination. The effects of signal threshold for determin-ing positive hybridization on probe performance were examined for each set ofexpected hybridization patterns.
Probe sensitivity, specificity, accuracy, and F� score were calculated for eachdata set as follows: sensitivity was defined as the observed true positives (TP)divided by the expected positives (TP � false negatives [FN]), specificity wascalculated as the observed true negatives (TN) divided by the total number ofexpected negatives (TN � false positives [FP]), accuracy was defined as theobserved true positives divided by the total observed positives [TP/(TP � FP)],and the F� score was defined as [(1 � �2) � accuracy � sensitivity]/(�2 �accuracy � sensitivity), where � is equal to 0.1 (chosen to weight toward a lowerfalse-positive rate) (55). These parameters of probe performance were examinedfor intensity values of 1,000 to 1 � 106 over intervals of 1,000. From these
TABLE 1. Summary of probe sets included in the array design
Probe set name/genome covered Design program
No. oftargetgenes
No. oftarget
clustersaNo. of probes Coverage
(%)No. of
probes/targets
Mean probelength
(no. of nt)
Mean probeTm (°C)
No. of probeswith x-hybpotentialb
PanDhc (all 5) ProDesign withclustering
6,812 4,232 5,514 (to 5,410 genes) 79.4 1 or 2 49 89.5 0
BAV1 Agilent eArray 1,371 N/A 1,356 98.9 1 60 80 2CBDB1 Agilent eArray 1,458 N/A 1,456 99.9 1 60 80 3DET195 Agilent eArray 1,580 N/A 1,510 95.6 1 60 80 3KB-1 Agilent eArray 933 N/A 931 99.8 1 60 80 4VS Agilent eArray 1,470 N/A 1,459 99.3 1 60 80 20
a N/A, not applicable.b x-hyb, cross-hybridization.
VOL. 77, 2011 PANGENOME MICROARRAY FOR DEHALOCOCCOIDES SPP. 5363
on Decem
ber 2, 2013 by Univ of C
alifornia-Berkeley B
iosci & N
atural Res Lib
http://aem.asm
.org/D
ownloaded from
calculations, it was determined that a threshold fluorescence value between 1 �
104 and 3 � 104 would yield consistently high probe performance statistics acrossall examined data sets.
A second method for determining threshold intensity values was adapted fromOh et al. (42). Here, instead of using a single reference genome with designedprobes and several tester strain DNA samples, any pair of Dehalococcoidesgenomes with lower than 90% average nucleotide identity (ANI) was utilized asa reference-tester pair (and vice versa). The ANI for the five strains was deter-mined by taking the average of the nucleotide identity across full gene alignmentsfor all reciprocal best BLAST matches for genes between two genomes (seeTable S3 in the supplemental material).
For each combination of tester genome and reference genome, the BLASTscore of the reference genome probes against the tester genome and the BLASTscore ratio (BLAST score of the probe against the tester genome/BLAST scoreof the probe against the reference genome) were determined. The average signalintensity for each BLAST score was calculated, as well as the log of the averagesignal intensity ratio between the tester and reference genomes.
Plots of the average signal intensity versus the BLAST score for the testergenome and the log(average hybridization intensity ratio) versus the BLASTscore ratio for the tester/reference genome were made for each permutation ofthe tester and reference genomes (12 permutations in total) (see Fig. S2 in thesupplemental material). The calculations for each pair were merged into onedata set, and plots were generated for the entire data set as a whole (see Fig. S3in the supplemental material). The point of inflection on Fig. S3B occurs at aBLAST score ratio of 81 to 85%, corresponding to an optimal threshold of1.17 � 104 to 1.78 � 104, which agrees with the observed optimal thresholds seenusing the more conventional sensitivity and accuracy measures described above.
From these threshold determination trials, a threshold of 1.46 � 104 normal-ized fluorescence intensity was chosen, whereby a probe with fluorescence abovethis was considered ON (positive) and below this was considered OFF (negative).This threshold value represents the best agreement between the different thresh-old determinations utilized.
RESULTS AND DISCUSSION
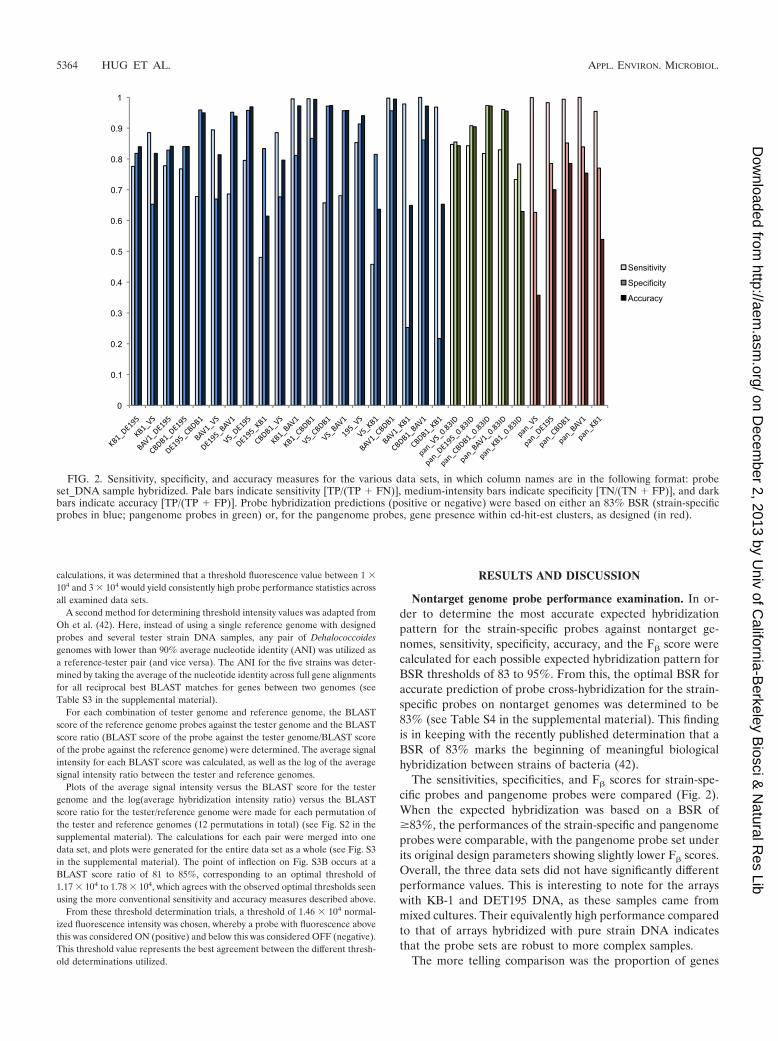
Nontarget genome probe performance examination. In or-der to determine the most accurate expected hybridizationpattern for the strain-specific probes against nontarget ge-nomes, sensitivity, specificity, accuracy, and the F� score werecalculated for each possible expected hybridization pattern forBSR thresholds of 83 to 95%. From this, the optimal BSR foraccurate prediction of probe cross-hybridization for the strain-specific probes on nontarget genomes was determined to be83% (see Table S4 in the supplemental material). This findingis in keeping with the recently published determination that aBSR of 83% marks the beginning of meaningful biologicalhybridization between strains of bacteria (42).
The sensitivities, specificities, and F� scores for strain-spe-cific probes and pangenome probes were compared (Fig. 2).When the expected hybridization was based on a BSR of�83%, the performances of the strain-specific and pangenomeprobes were comparable, with the pangenome probe set underits original design parameters showing slightly lower F� scores.Overall, the three data sets did not have significantly differentperformance values. This is interesting to note for the arrayswith KB-1 and DET195 DNA, as these samples came frommixed cultures. Their equivalently high performance comparedto that of arrays hybridized with pure strain DNA indicatesthat the probe sets are robust to more complex samples.
The more telling comparison was the proportion of genes
FIG. 2. Sensitivity, specificity, and accuracy measures for the various data sets, in which column names are in the following format: probeset_DNA sample hybridized. Pale bars indicate sensitivity [TP/(TP � FN)], medium-intensity bars indicate specificity [TN/(TN � FP)], and darkbars indicate accuracy [TP/(TP � FP)]. Probe hybridization predictions (positive or negative) were based on either an 83% BSR (strain-specificprobes in blue; pangenome probes in green) or, for the pangenome probes, gene presence within cd-hit-est clusters, as designed (in red).
5364 HUG ET AL. APPL. ENVIRON. MICROBIOL.
on Decem
ber 2, 2013 by Univ of C
alifornia-Berkeley B
iosci & N
atural Res Lib
http://aem.asm
.org/D
ownloaded from
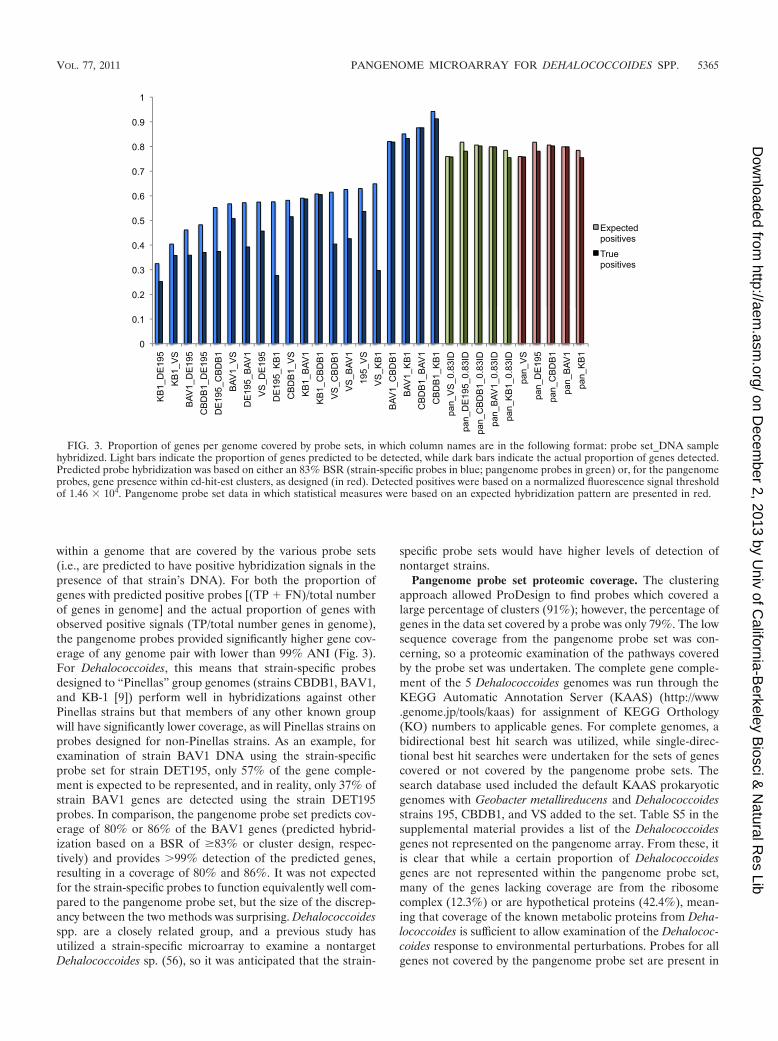
within a genome that are covered by the various probe sets(i.e., are predicted to have positive hybridization signals in thepresence of that strain’s DNA). For both the proportion ofgenes with predicted positive probes [(TP � FN)/total numberof genes in genome] and the actual proportion of genes withobserved positive signals (TP/total number genes in genome),the pangenome probes provided significantly higher gene cov-erage of any genome pair with lower than 99% ANI (Fig. 3).For Dehalococcoides, this means that strain-specific probesdesigned to “Pinellas” group genomes (strains CBDB1, BAV1,and KB-1 [9]) perform well in hybridizations against otherPinellas strains but that members of any other known groupwill have significantly lower coverage, as will Pinellas strains onprobes designed for non-Pinellas strains. As an example, forexamination of strain BAV1 DNA using the strain-specificprobe set for strain DET195, only 57% of the gene comple-ment is expected to be represented, and in reality, only 37% ofstrain BAV1 genes are detected using the strain DET195probes. In comparison, the pangenome probe set predicts cov-erage of 80% or 86% of the BAV1 genes (predicted hybrid-ization based on a BSR of �83% or cluster design, respec-tively) and provides �99% detection of the predicted genes,resulting in a coverage of 80% and 86%. It was not expectedfor the strain-specific probes to function equivalently well com-pared to the pangenome probe set, but the size of the discrep-ancy between the two methods was surprising. Dehalococcoidesspp. are a closely related group, and a previous study hasutilized a strain-specific microarray to examine a nontargetDehalococcoides sp. (56), so it was anticipated that the strain-
specific probe sets would have higher levels of detection ofnontarget strains.
Pangenome probe set proteomic coverage. The clusteringapproach allowed ProDesign to find probes which covered alarge percentage of clusters (91%); however, the percentage ofgenes in the data set covered by a probe was only 79%. The lowsequence coverage from the pangenome probe set was con-cerning, so a proteomic examination of the pathways coveredby the probe set was undertaken. The complete gene comple-ment of the 5 Dehalococcoides genomes was run through theKEGG Automatic Annotation Server (KAAS) (http://www.genome.jp/tools/kaas) for assignment of KEGG Orthology(KO) numbers to applicable genes. For complete genomes, abidirectional best hit search was utilized, while single-direc-tional best hit searches were undertaken for the sets of genescovered or not covered by the pangenome probe sets. Thesearch database used included the default KAAS prokaryoticgenomes with Geobacter metallireducens and Dehalococcoidesstrains 195, CBDB1, and VS added to the set. Table S5 in thesupplemental material provides a list of the Dehalococcoidesgenes not represented on the pangenome array. From these, itis clear that while a certain proportion of Dehalococcoidesgenes are not represented within the pangenome probe set,many of the genes lacking coverage are from the ribosomecomplex (12.3%) or are hypothetical proteins (42.4%), mean-ing that coverage of the known metabolic proteins from Deha-lococcoides is sufficient to allow examination of the Dehalococ-coides response to environmental perturbations. Probes for allgenes not covered by the pangenome probe set are present in
FIG. 3. Proportion of genes per genome covered by probe sets, in which column names are in the following format: probe set_DNA samplehybridized. Light bars indicate the proportion of genes predicted to be detected, while dark bars indicate the actual proportion of genes detected.Predicted probe hybridization was based on either an 83% BSR (strain-specific probes in blue; pangenome probes in green) or, for the pangenomeprobes, gene presence within cd-hit-est clusters, as designed (in red). Detected positives were based on a normalized fluorescence signal thresholdof 1.46 � 104. Pangenome probe set data in which statistical measures were based on an expected hybridization pattern are presented in red.
VOL. 77, 2011 PANGENOME MICROARRAY FOR DEHALOCOCCOIDES SPP. 5365
on Decem
ber 2, 2013 by Univ of C
alifornia-Berkeley B
iosci & N
atural Res Lib
http://aem.asm
.org/D
ownloaded from
the strain-specific probe sets. A combination of the pangenomeprobe set and the subset of strain-specific probes for genes nototherwise covered represents a functional array design for100% detection of known Dehalococcoides genes.
Reductive dehalogenase homologous gene coverage. Thefunctional genes for reductive dechlorination of contaminantsubstrates are the reductive dehalogenases. The five-genomedata set contained 105 reductive dehalogenase (RDH) homol-ogous sequences annotated and available at the time of thearray design: 17 from strain 195, 32 from strain CBDB1, 10from strain BAV1 (draft genome), 36 from strain VS (draftgenome), and 10 from the KB-1 metagenome.
The detection profile of the RDH genes further illustratesthe utility of a pangenome approach. The combined 5-strain-specific probe sets provide 100% detection of the 105 RDHgenes. The pangenome probe set provides detection of 98% ofthe reductive dehalogenases in the 105-gene data set (see Ta-ble S6 in the supplemental material for cluster descriptions).There are no core RDH genes, defined here as a cluster con-taining a gene from each representative genome under the95% ID clustering conditions. However, there are several clus-ters containing genes from more than one genome, indicatingthat these RDHs are conserved across different strains to adegree that allows effective design of non-strain-specificprobes. The single-genome strain-specific probe sets providesignificantly lower coverage when treated separately, rangingfrom 20 to 61% observed coverage under an 83% BSR thresh-old of hybridization (Table 2). This is as expected but high-lights the advantage of a pangenome approach for detection ofthis diverse and highly distributed gene family.
Of the 105 RDH sequences, 4 represent genes of knownfunction on specific substrates, as follows: tceA in strainDET195 (36), bvcA in strain BAV1 (30), vcrA in strain VS (40),and cbrA in strain CBDB1 (2). Both the pangenome probesand the strain-specific probes perform accurately for thesegenes, detecting them in the genomes where they are present.Interestingly, both the strain VS probe specific for vcrA and the
pangenome probe designed to this single-gene cluster show“false-positive” hybridization for the KB-1 DNA sample. TheKB-1 “genome” used to generate these probe sets did notcontain a vcrA homolog, as the KB-1 genes were determinedfrom a partial metagenome sequence. However, further met-agenomic sequencing of the KB-1 culture has shown the pres-ence of a vcrA homologous gene with extremely high sequenceconservation to the VS vcrA used here for probe design. Boththe pangenome probe designed to the vcrA-containing clusterand the strain-specific probe designed to the VS vcrA gene area perfect match to the KB-1 vcrA gene sequence, confirmingthat the “false-positive” hybridization of these VS-specificprobes to the KB-1 mixed-culture genomic DNA represents atrue detection of a gene not encompassed in the array design.This is an interesting example whereby a researcher utilizingthe strain-specific probe sets designed for strain 195, BAV1, orCBDB1 would not have detected this gene within KB-1, whileutilization of a pangenome probe set (either combined strainspecific or pangenome) does allow identification of the indus-trially relevant vcrA gene in the KB-1 consortium.
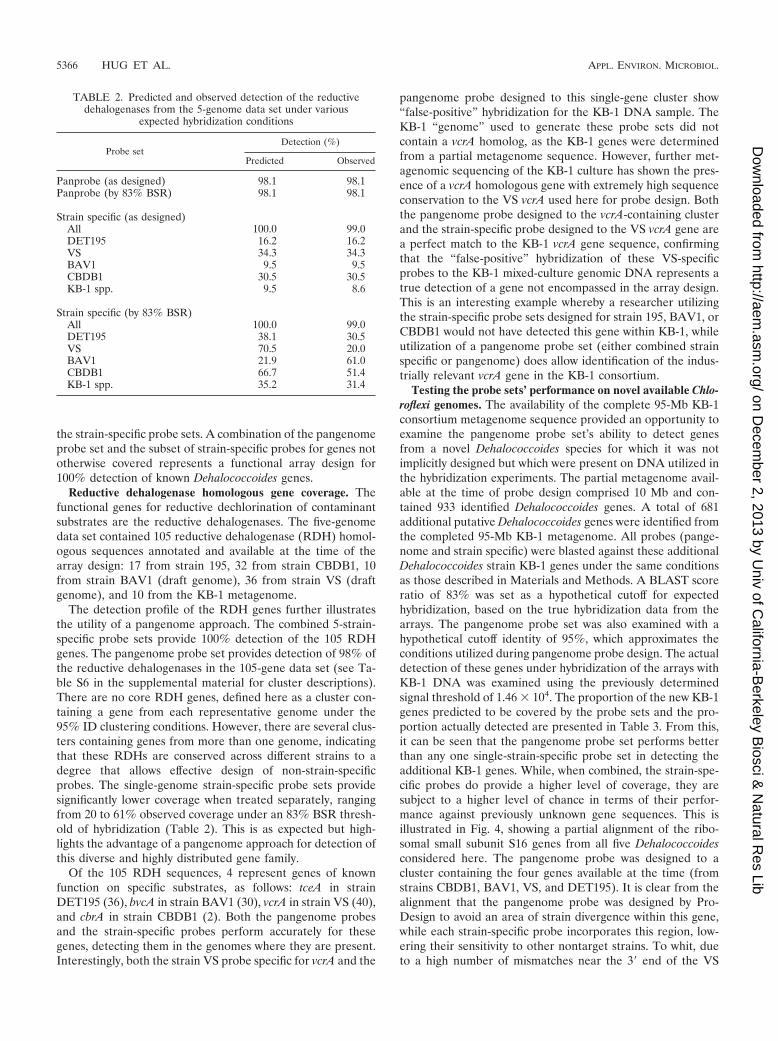
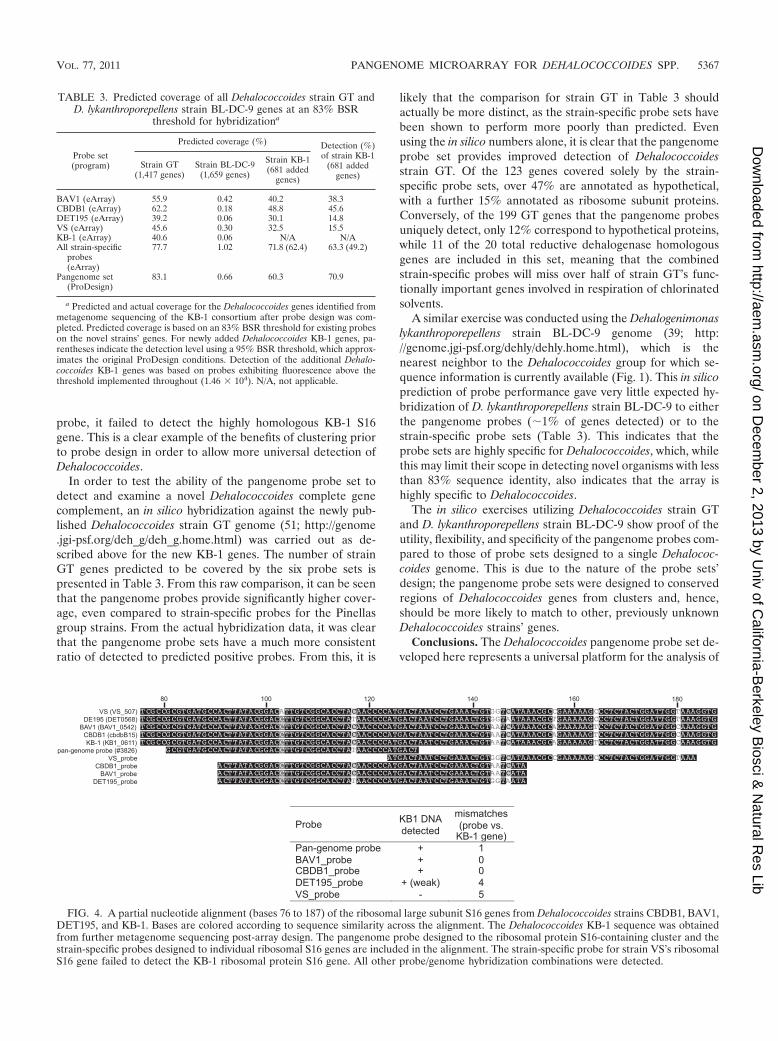
Testing the probe sets’ performance on novel available Chlo-roflexi genomes. The availability of the complete 95-Mb KB-1consortium metagenome sequence provided an opportunity toexamine the pangenome probe set’s ability to detect genesfrom a novel Dehalococcoides species for which it was notimplicitly designed but which were present on DNA utilized inthe hybridization experiments. The partial metagenome avail-able at the time of probe design comprised 10 Mb and con-tained 933 identified Dehalococcoides genes. A total of 681additional putative Dehalococcoides genes were identified fromthe completed 95-Mb KB-1 metagenome. All probes (pange-nome and strain specific) were blasted against these additionalDehalococcoides strain KB-1 genes under the same conditionsas those described in Materials and Methods. A BLAST scoreratio of 83% was set as a hypothetical cutoff for expectedhybridization, based on the true hybridization data from thearrays. The pangenome probe set was also examined with ahypothetical cutoff identity of 95%, which approximates theconditions utilized during pangenome probe design. The actualdetection of these genes under hybridization of the arrays withKB-1 DNA was examined using the previously determinedsignal threshold of 1.46 � 104. The proportion of the new KB-1genes predicted to be covered by the probe sets and the pro-portion actually detected are presented in Table 3. From this,it can be seen that the pangenome probe set performs betterthan any one single-strain-specific probe set in detecting theadditional KB-1 genes. While, when combined, the strain-spe-cific probes do provide a higher level of coverage, they aresubject to a higher level of chance in terms of their perfor-mance against previously unknown gene sequences. This isillustrated in Fig. 4, showing a partial alignment of the ribo-somal small subunit S16 genes from all five Dehalococcoidesconsidered here. The pangenome probe was designed to acluster containing the four genes available at the time (fromstrains CBDB1, BAV1, VS, and DET195). It is clear from thealignment that the pangenome probe was designed by Pro-Design to avoid an area of strain divergence within this gene,while each strain-specific probe incorporates this region, low-ering their sensitivity to other nontarget strains. To whit, dueto a high number of mismatches near the 3� end of the VS
TABLE 2. Predicted and observed detection of the reductivedehalogenases from the 5-genome data set under various
expected hybridization conditions
Probe setDetection (%)
Predicted Observed
Panprobe (as designed) 98.1 98.1Panprobe (by 83% BSR) 98.1 98.1
Strain specific (as designed)All 100.0 99.0DET195 16.2 16.2VS 34.3 34.3BAV1 9.5 9.5CBDB1 30.5 30.5KB-1 spp. 9.5 8.6
Strain specific (by 83% BSR)All 100.0 99.0DET195 38.1 30.5VS 70.5 20.0BAV1 21.9 61.0CBDB1 66.7 51.4KB-1 spp. 35.2 31.4
5366 HUG ET AL. APPL. ENVIRON. MICROBIOL.
on Decem
ber 2, 2013 by Univ of C
alifornia-Berkeley B
iosci & N
atural Res Lib
http://aem.asm
.org/D
ownloaded from
probe, it failed to detect the highly homologous KB-1 S16gene. This is a clear example of the benefits of clustering priorto probe design in order to allow more universal detection ofDehalococcoides.
In order to test the ability of the pangenome probe set todetect and examine a novel Dehalococcoides complete genecomplement, an in silico hybridization against the newly pub-lished Dehalococcoides strain GT genome (51; http://genome.jgi-psf.org/deh_g/deh_g.home.html) was carried out as de-scribed above for the new KB-1 genes. The number of strainGT genes predicted to be covered by the six probe sets ispresented in Table 3. From this raw comparison, it can be seenthat the pangenome probes provide significantly higher cover-age, even compared to strain-specific probes for the Pinellasgroup strains. From the actual hybridization data, it was clearthat the pangenome probe sets have a much more consistentratio of detected to predicted positive probes. From this, it is
likely that the comparison for strain GT in Table 3 shouldactually be more distinct, as the strain-specific probe sets havebeen shown to perform more poorly than predicted. Evenusing the in silico numbers alone, it is clear that the pangenomeprobe set provides improved detection of Dehalococcoidesstrain GT. Of the 123 genes covered solely by the strain-specific probe sets, over 47% are annotated as hypothetical,with a further 15% annotated as ribosome subunit proteins.Conversely, of the 199 GT genes that the pangenome probesuniquely detect, only 12% correspond to hypothetical proteins,while 11 of the 20 total reductive dehalogenase homologousgenes are included in this set, meaning that the combinedstrain-specific probes will miss over half of strain GT’s func-tionally important genes involved in respiration of chlorinatedsolvents.
A similar exercise was conducted using the Dehalogenimonaslykanthroporepellens strain BL-DC-9 genome (39; http://genome.jgi-psf.org/dehly/dehly.home.html), which is thenearest neighbor to the Dehalococcoides group for which se-quence information is currently available (Fig. 1). This in silicoprediction of probe performance gave very little expected hy-bridization of D. lykanthroporepellens strain BL-DC-9 to eitherthe pangenome probes (1% of genes detected) or to thestrain-specific probe sets (Table 3). This indicates that theprobe sets are highly specific for Dehalococcoides, which, whilethis may limit their scope in detecting novel organisms with lessthan 83% sequence identity, also indicates that the array ishighly specific to Dehalococcoides.
The in silico exercises utilizing Dehalococcoides strain GTand D. lykanthroporepellens strain BL-DC-9 show proof of theutility, flexibility, and specificity of the pangenome probes com-pared to those of probe sets designed to a single Dehalococ-coides genome. This is due to the nature of the probe sets’design; the pangenome probe sets were designed to conservedregions of Dehalococcoides genes from clusters and, hence,should be more likely to match to other, previously unknownDehalococcoides strains’ genes.
Conclusions. The Dehalococcoides pangenome probe set de-veloped here represents a universal platform for the analysis of
TABLE 3. Predicted coverage of all Dehalococcoides strain GT andD. lykanthroporepellens strain BL-DC-9 genes at an 83% BSR
threshold for hybridizationa
Probe set(program)
Predicted coverage (%) Detection (%)of strain KB-1
(681 addedgenes)
Strain GT(1,417 genes)
Strain BL-DC-9(1,659 genes)
Strain KB-1(681 added
genes)
BAV1 (eArray) 55.9 0.42 40.2 38.3CBDB1 (eArray) 62.2 0.18 48.8 45.6DET195 (eArray) 39.2 0.06 30.1 14.8VS (eArray) 45.6 0.30 32.5 15.5KB-1 (eArray) 40.6 0.06 N/A N/AAll strain-specific
probes(eArray)
77.7 1.02 71.8 (62.4) 63.3 (49.2)
Pangenome set(ProDesign)
83.1 0.66 60.3 70.9
a Predicted and actual coverage for the Dehalococcoides genes identified frommetagenome sequencing of the KB-1 consortium after probe design was com-pleted. Predicted coverage is based on an 83% BSR threshold for existing probeson the novel strains’ genes. For newly added Dehalococcoides KB-1 genes, pa-rentheses indicate the detection level using a 95% BSR threshold, which approx-imates the original ProDesign conditions. Detection of the additional Dehalo-coccoides KB-1 genes was based on probes exhibiting fluorescence above thethreshold implemented throughout (1.46 � 104). N/A, not applicable.
FIG. 4. A partial nucleotide alignment (bases 76 to 187) of the ribosomal large subunit S16 genes from Dehalococcoides strains CBDB1, BAV1,DET195, and KB-1. Bases are colored according to sequence similarity across the alignment. The Dehalococcoides KB-1 sequence was obtainedfrom further metagenome sequencing post-array design. The pangenome probe designed to the ribosomal protein S16-containing cluster and thestrain-specific probes designed to individual ribosomal S16 genes are included in the alignment. The strain-specific probe for strain VS’s ribosomalS16 gene failed to detect the KB-1 ribosomal protein S16 gene. All other probe/genome hybridization combinations were detected.
VOL. 77, 2011 PANGENOME MICROARRAY FOR DEHALOCOCCOIDES SPP. 5367
on Decem
ber 2, 2013 by Univ of C
alifornia-Berkeley B
iosci & N
atural Res Lib
http://aem.asm
.org/D
ownloaded from
this industrially relevant genus. The probe set is highly specificto Dehalococcoides: it is robust to cross-hybridization fromenvironmental bacteria, including the closest known relative toDehalococcoides spp., the Dehalogenimonas spp. In addition, insilico comparisons utilizing the Dehalococcoides strain GT ge-nome indicate that the pangenome probe set detects a largerproportion of a novel Dehalococcoides strain’s genes than theset of combined strain-specific probes. Newly available Deha-lococcoides genes from the KB-1 consortium allowed confir-mation that probe design to clusters of highly similar genesincreases the likelihood that a probe is designed to a conservedregion of a gene, strengthening the universal detection of De-halococcoides by this probe set.
A known weakness of this probe set is the lowered coverageof Dehalococcoides protein genes (80% represented in clus-ters with probes). Future work with this platform will be gearedtoward optimizing coverage of Dehalococcoides genomes whilestill maintaining the clustering advantages of this design. Animmediately available alternative is the use of a subset of thestrain-specific probes to complement the pangenome probe setto fill in the remaining 20% of missing genes. This would allow100% coverage of known Dehalococcoides genes and would beacceptable for use with any of the currently sequenced strains.Additionally, this probe design method is flexible and can beapplied to larger Dehalococcoides genomic data sets as se-quencing information comes available, allowing this probe setto evolve with the growing knowledge base. An additional noteis that here we examined probe performance with a constantamount of DNA utilized across all samples, chosen to avoidany expected detection limits (62). For RNA expression stud-ies or environmental sample testing, a thorough determinationof DNA concentration and signal intensity relationships will berequired to assess the limits of detection for this probe set(16, 61).
Several different array-based methods for bacterial identifi-cation and genomic comparisons exist. Current general micro-bial detection microarrays do not provide strain differentiationof Dehalococcoides (PhyloChip and others [10, 63]) or do notprovide complete coverage of the Dehalococcoides gene com-plement (e.g., GeoChip [20, 53]). As described here and else-where (25), Dehalococcoides strain-specific probe sets providecomplete coverage of a strain of interest’s gene complementbut can only be used for partial examinations of nontargetstrains (results above; see also reference 56). A pangenome orpangenus array approach provides the ability to compare novelstrains to the known genomes in a more complete fashion andallows examination of hypothetical genes outside the knownfunctional cannon. The existing Dehalococcoides pangenusAffymetrix array (32) and the combined strain-specific eArray-designed probe sets described here represent a straightforwarddesign targeting each individual gene in the combined set. Incontrast, the pangenome probe set designed with ProDesign isbased on clustered genes such that probes are designed tohighly conserved regions of similar genes. The pangenomeprobe set thus represents a flexible tool that can be applied tolaboratory research, allowing multiple labs to work with a com-mon platform regardless of which specific Dehalococcoidesstrain (sequenced or unsequenced) they are cultivating. Theuse of a common platform will facilitate collaboration betweenresearch groups, and it is possible that the use of identical
probe sequences to examine different Dehalococcoides strainswill provide higher consistency across different laboratories’experimental data. The pangenome probe set can also be uti-lized for the detection and identification of Dehalococcoides atcontaminated sites or, as has become increasingly of interest,at pristine sites where dechlorinating organisms have not yetbeen exposed to human pollution. The sensitivity and specific-ity of a microarray paired with the universality of Dehalococ-coides detection demonstrated by the ProDesign pangenomeprobe set provide a powerful tool for examining the globaldistribution and metabolic capacity of Dehalococcoides.
ACKNOWLEDGMENTS
We thank the Joint Genome Institute for sequencing the KB-1metagenome and other Dehalococcoides genomes. We also acknowl-edge the University Health Network microarray center (Toronto, On-tario, Canada) for helping with labeling and hybridization.
ProDesign development was funded in part by the Ontario Ministryof Health and Long-Term Care. This project was funded by the Gov-ernment of Canada through Genome Canada and the Ontario Genom-ics Institute (grant 2009-OGI-ABC-1405), the Natural Sciences andEngineering Research Council of Canada (NSERC), and the U.S.Department of Defense Strategic Environmental Research DefenseProgram (SERDP). E.R.T. holds a Canada Research Chair in Analyt-ical Genomics. L.A.H. was supported by an NSERC CGS-D scholar-ship.
REFERENCES
1. Adrian, L. 2009. ERC-group microflex: microbiology of Dehalococcoides-like Chloroflexi. Rev. Environ. Sci. Biotechnol. 8:1569–1705.
2. Adrian, L., J. Rahnenfuhrer, J. Gobom, and T. Holscher. 2007. Identificationof a chlorobenzene reductive dehalogenase in Dehalococcoides sp. strainCBDB1. Appl. Environ. Microbiol. 73:7717–7724.
3. Adrian, L., U. Szewzyk, J. Wecke, and H. Gorisch. 2000. Bacterial dehalo-respiration with chlorinated benzenes. Nature 408:580–583.
4. Ahsanul Islam, M., E. A. Edwards, and R. Mahadevan. 2010. Characterizingthe metabolism of Dehalococcoides with a constraint-based model. PLoSComput. Biol. 6:e1000887.
5. Altschul, S. F., W. Gish, W. Miller, E. W. Myers, and D. J. Lipman. 1990.Basic local alignment search tool. J. Mol. Biol. 215:403–410.
6. Bodrossy, L., and A. Sessitsch. 2004. Oligonucleotide microarrays in micro-bial diagnostics. Curr. Opin. Microbiol. 7:245–254.
7. Cheng, D., and J. He. 2009. Isolation and characterization of “Dehalococ-coides” sp. strain MB, which dechlorinates tetrachloroethene to trans-1,2-dichloroethene. Appl. Environ. Microbiol. 75:5910–5918.
8. Cupples, A. M. 2008. Real-time PCR quantification of Dehalococcoidespopulations: methods and applications. J. Microbiol. Methods 72:1–11.
9. Cupples, A. M., A. M. Spormann, and P. L. McCarty. 2004. Comparativeevaluation of chloroethene dechlorination to ethene by Dehalococcoides-like microorganisms. Environ. Sci. Technol. 38:4768–4774.
10. DeSantis, T. Z., et al. 2007. High-density universal 16S rRNA microarrayanalysis reveals broader diversity than typical clone library when samplingthe environment. Microb. Ecol. 53:371–383.
11. Drummond, A. J., et al. 2010. Geneious version 5.0. Geneious, Auckland,New Zealand.
12. Duhamel, M., K. Mo, and E. A. Edwards. 2004. Characterization of a highlyenriched dehalococcoides-containing culture that grows on vinyl chlorideand trichloroethene. Appl. Environ. Microbiol. 70:5538–5545.
13. Edgar, R. C. 2004. MUSCLE: multiple sequence alignment with high accu-racy and high throughput. Nucleic Acids Res. 32:1792–1797.
14. Feng, S., and E. R. Tillier. 2007. A fast and flexible approach to oligonucle-otide probe design for genomes and gene families. Bioinformatics 23:1195–1202.
15. Fennell, D. E., A. B. Carroll, J. M. Gossett, and S. H. Zinder. 2001. Assess-ment of indigenous reductive dechlorinating potential at a TCE-contami-nated site using microcosms, PCR analysis, and site data. Environ. Sci.Technol. 35:1830–1839.
16. Gao, H., et al. 2007. Microarray-based analysis of microbial communityRNAs by whole-community RNA amplification. Appl. Environ. Microbiol.73:563–571.
17. Gresham, D., et al. 2006. Genome-wide detection of polymorphisms atnucleotide resolution with a single DNA microarray. Science 311:1932–1936.
18. Grostern, A., and E. A. Edwards. 2006. Growth of Dehalobacter and Deha-lococcoides spp. during degradation of chlorinated ethanes. Appl. Environ.Microbiol. 72:428–436.
5368 HUG ET AL. APPL. ENVIRON. MICROBIOL.
on Decem
ber 2, 2013 by Univ of C
alifornia-Berkeley B
iosci & N
atural Res Lib
http://aem.asm
.org/D
ownloaded from

19. He, J., Y. Sung, R. Krajmalnik-Brown, K. M. Ritalahti, and F. E. Loffler.2005. Isolation and characterization of Dehalococcoides sp. strain FL2, atrichloroethene (TCE)- and 1,2-dichloroethene-respiring anaerobe. Environ.Microbiol. 7:1442–1450.
20. He, Z., et al. 2010. GeoChip 3.0 as a high-throughput tool for analyzingmicrobial community composition, structure and functional activity. ISME J.4:1167–1179.
21. He, Z., et al. 2007. GeoChip: a comprehensive microarray for investigatingbiogeochemical, ecological and environmental processes. ISME J. 1:67–77.
22. Hendrickson, E. R., et al. 2002. Molecular analysis of Dehalococcoides 16Sribosomal DNA from chloroethene-contaminated sites throughout NorthAmerica and Europe. Appl. Environ. Microbiol. 68:485–495.
23. Holliger, C., G. Wohlfarth, and G. Diekert. 1998. Reductive dechlorinationin the energy metabolism of anaerobic bacteria. FEMS Microbiol. Rev.22:383–398.
24. Jayachandran, G., H. Gorisch, and L. Adrian. 2003. Dehalorespiration withhexachlorobenzene and pentachlorobenzene by Dehalococcoides sp. strainCBDB1. Arch. Microbiol. 180:411–416.
25. Johnson, D. R., et al. 2008. Temporal transcriptomic microarray analysis of“Dehalococcoides ethenogenes” strain 195 during the transition into station-ary phase. Appl. Environ. Microbiol. 74:2864–2872.
26. Johnson, D. R., P. K. Lee, V. F. Holmes, and L. Alvarez-Cohen. 2005. Aninternal reference technique for accurately quantifying specific mRNAs byreal-time PCR with application to the tceA reductive dehalogenase gene.Appl. Environ. Microbiol. 71:3866–3871.
27. Johnson, D. R., P. K. Lee, V. F. Holmes, A. C. Fortin, and L. Alvarez-Cohen.2005. Transcriptional expression of the tceA gene in a Dehalococcoides-containing microbial enrichment. Appl. Environ. Microbiol. 71:7145–7151.
28. Johnson, D. R., A. Nemir, G. L. Andersen, S. H. Zinder, and L. Alvarez-Cohen. 2009. Transcriptomic microarray analysis of corrinoid responsivegenes in Dehalococcoides ethenogenes strain 195. FEMS Microbiol. Lett.294:198–206.
29. Jones, E. J. P., M. A. Voytek, M. M. Lorah, and J. D. Kirshtein. 2006.Characterization of a microbial consortium capable of rapid and simultane-ous dechlorination of 1,1,2,2-tetrachloroethane and chlorinated ethane andethene intermediates. Bioremediat. J. 10:153–168.
30. Krajmalnik-Brown, R., et al. 2004. Genetic identification of a putative vinylchloride reductase in Dehalococcoides sp. strain BAV1. Appl. Environ.Microbiol. 70:6347–6351.
31. Kube, M., et al. 2005. Genome sequence of the chlorinated compound-respiring bacterium Dehalococcoides species strain CBDB1. Nat. Biotech-nol. 23:1269–1273.
32. Lee, P. K., et al. 2011. Comparative genomics of two newly isolated Deha-lococcoides strains and an enrichment using a genus microarray. ISME J.5:1014–1024.
33. Li, W., and A. Godzik. 2006. Cd-hit: a fast program for clustering andcomparing large sets of protein or nucleotide sequences. Bioinformatics22:1658–1659.
34. Li, W., L. Jaroszewski, and A. Godzik. 2001. Clustering of highly homologoussequences to reduce the size of large protein databases. Bioinformatics17:282–283.
35. Li, W., L. Jaroszewski, and A. Godzik. 2002. Tolerating some redundancysignificantly speeds up clustering of large protein databases. Bioinformatics18:77–82.
36. Magnuson, J. K., M. F. Romine, D. R. Burris, and M. T. Kingsley. 2000.Trichloroethene reductive dehalogenase from Dehalococcoides etheno-genes: sequence of tceA and substrate range characterization. Appl. Envi-ron. Microbiol. 66:5141–5147.
37. Maymo-Gatell, X., Y. Chien, J. M. Gossett, and S. H. Zinder. 1997. Isolationof a bacterium that reductively dechlorinates tetrachloroethene to ethene.Science 276:1568–1571.
38. McMurdie, P. J., et al. 2009. Localized plasticity in the streamlined genomesof vinyl chloride respiring Dehalococcoides. PLoS Genet. 5:e1000714.
39. Moe, W. M., J. Yan, M. F. Nobre, M. S. da Costa, and F. A. Rainey. 2009.Dehalogenimonas lykanthroporepellens gen. nov., sp. nov., a reductivelydehalogenating bacterium isolated from chlorinated solvent-contaminatedgroundwater. Int. J. Syst. Evol. Microbiol. 59:2692–2697.
40. Muller, J. A., et al. 2004. Molecular identification of the catabolic vinyl
chloride reductase from Dehalococcoides sp. strain VS and its environmen-tal distribution. Appl. Environ. Microbiol. 70:4880–4888.
41. Nishimura, M., et al. 2008. Detection and identification of Dehalococcoidesspecies responsible for in situ dechlorination of trichloroethene to etheneenhanced by hydrogen-releasing compounds. Biotechnol. Appl. Biochem.51:1–7.
42. Oh, S., D. R. Yoder-Himes, J. Tiedje, J. Park, and K. T. Konstantinidis.2010. Evaluating the performance of oligonucleotide microarrays for bacte-rial strains with increasing genetic divergence from the reference strain.Appl. Environ. Microbiol. 76:2980–2988.
43. Rahm, B. G., and R. E. Richardson. 2008. Correlation of respiratory geneexpression levels and pseudo-steady-state PCE respiration rates in Dehalo-coccoides ethenogenes. Environ. Sci. Technol. 42:416–421.
44. Rhee, S. K., et al. 2004. Detection of genes involved in biodegradation andbiotransformation in microbial communities by using 50-mer oligonucleotidemicroarrays. Appl. Environ. Microbiol. 70:4303–4317.
45. Ritalahti, K. M., et al. 2006. Quantitative PCR targeting 16S rRNA andreductive dehalogenase genes simultaneously monitors multiple Dehalococ-coides strains. Appl. Environ. Microbiol. 72:2765–2774.
46. Schmidt, K. R., C. Stoll, and A. Tiehm. 2006. Evaluation of 16S-PCR de-tection of Dehalococcoides at two chloroethene-contaminated sites. WaterSci. Technol. 6:129–136.
47. Schumacher, W., C. Holliger, A. J. Zehnder, and W. R. Hagen. 1997. Redoxchemistry of cobalamin and iron-sulfur cofactors in the tetrachloroethenereductase of Dehalobacter restrictus. FEBS Lett. 409:421–425.
48. Seshadri, R., et al. 2005. Genome sequence of the PCE-dechlorinatingbacterium Dehalococcoides ethenogenes. Science 307:105–108.
49. Smith, T. F., and M. S. Waterman. 1981. Identification of common molec-ular subsequences. J. Mol. Biol. 147:195–197.
50. Stamatakis, A. 2006. RAxML-VI-HPC: maximum likelihood-based phylo-genetic analyses with thousands of taxa and mixed models. Bioinformatics22:2688–2690.
51. Sung, Y., K. M. Ritalahti, R. P. Apkarian, and F. E. Loffler. 2006. Quanti-tative PCR confirms purity of strain GT, a novel trichloroethene-to-ethene-respiring Dehalococcoides isolate. Appl. Environ. Microbiol. 72:1980–1987.
52. Tas, N., M. H. A. Van Eekert, W. M. De Vos, and H. Smidt. 2010. The littlebacteria that can—diversity, genomics and ecophysiology of ‘Dehalococ-coides’ spp. in contaminated environments. Microb. Biotechnol. 3:389–402.
53. Tiquia, S. M., et al. 2004. Evaluation of 50-mer oligonucleotide arrays fordetecting microbial populations in environmental samples. Biotechniques36:664–670.
54. Van Raemdonck, H., A. Maes, W. Ossieur, K. Verthe, and N. Boon. 2006.Real time PCR quantification in groundwater of the dehalorespiring Desul-fitobacterium dichloroeliminans strain DCA1. J. Microbiol. Methods 67:294–303.
55. van Rijsbergen, C. V. 1979. Information retrieval, 2nd ed. Butterworth,London, England.
56. West, K. A., et al. 2008. Comparative genomics of “Dehalococcoides ethe-nogenes” 195 and an enrichment culture containing unsequenced “Dehalo-coccoides” strains. Appl. Environ. Microbiol. 74:3533–3540.
57. Willenbrock, H., P. F. Hallin, T. M. Wassenaar, and D. W. Ussery. 2007.Characterization of probiotic Escherichia coli isolates with a novel pan-genome microarray. Genome Biol. 8:267.
58. Willenbrock, H., et al. 2006. Design of a seven-genome Escherichia colimicroarray for comparative genomic profiling. J. Bacteriol. 188:7713–7721.
59. Wilson, K. 2001. Preparation of genomic DNA from bacteria. Curr. Protoc.Mol. Biol. Chapter 2:Unit 2.4.
60. Winzeler, E. A., et al. 2003. Genetic diversity in yeast assessed with whole-genome oligonucleotide arrays. Genetics 163:79–89.
61. Wu, L., X. Liu, C. W. Schadt, and J. Zhou. 2006. Microarray-based analysisof subnanogram quantities of microbial community DNAs by using whole-community genome amplification. Appl. Environ. Microbiol. 72:4931–4941.
62. Wu, L., et al. 2001. Development and evaluation of functional gene arrays fordetection of selected genes in the environment. Appl. Environ. Microbiol.67:5780–5790.
63. Zhou, J. 2003. Microarrays for bacterial detection and microbial communityanalysis. Curr. Opin. Microbiol. 6:288–294.
VOL. 77, 2011 PANGENOME MICROARRAY FOR DEHALOCOCCOIDES SPP. 5369
on Decem
ber 2, 2013 by Univ of C
alifornia-Berkeley B
iosci & N
atural Res Lib
http://aem.asm
.org/D
ownloaded from