Design And Evaluation Of Solar Maize Grain Dryer With A ...
129
UNIVERSITY OF NAIROBI SCHOOL OF ENGINEERING DESIGN AND EVALUATION OF SOLAR MAIZE GRAIN DRYER WITH A BACK-UP HEATER BY Tonui K. Stephen Reg No. : F56/76636/2009 (Bsc. Mechanical Engineering, JKUAT) A thesis submitted to Department of Environmental and Biosystems Engineering, School of Engineering, University of Nairobi in partial fulfilment of the requirements for the award of the degree of Master of Science in Environmental and Biosystems Engineering. 2014
-
Upload
khangminh22 -
Category
Documents
-
view
1 -
download
0
Transcript of Design And Evaluation Of Solar Maize Grain Dryer With A ...

UNIVERSITY OF NAIROBI
SCHOOL OF ENGINEERING
DESIGN AND EVALUATION OF SOLAR MAIZE GRAIN DRYER WI TH A
BACK-UP HEATER
BY
Tonui K. Stephen
Reg No. : F56/76636/2009
(Bsc. Mechanical Engineering, JKUAT)
A thesis submitted to Department of Environmental and Biosystems Engineering,
School of Engineering, University of Nairobi in partial fulfilment of the requirements
for the award of the degree of Master of Science in Environmental and Biosystems
Engineering.
2014

I
DECLARATION
I hereby declare that this thesis is my original work. To the best of my knowledge,
the work proposed here has not been submitted for a degree programme in any
university.
………………………………………… …………………
Tonui K. Stephen Date
This thesis has been submitted for examination with our approval as university
supervisors for the award of the Degree of Master of Science in the Department of
Environmental and Biosystems Engineering, School of Engineering of the University
of Nairobi.
.................................................................
...........................................
Mr. Emmanuel Mutai
Department of Environmental &Biosystems Engineering
University of Nairobi
Date
………………………………………..
…………………..................
Eng.Daniel A. Mutuli
Department of Environmental & Biosystems Engineering
University of Nairobi
Date

II
DECLARATION OF ORIGINALITY
Name of student: Mr. Stephen K. Tonui
Registration: F56 / 76636 / 2009
College: College of Architecture and Engineering
Faculty/School/Institute: School of Engineering
Department: Environmental and Biosystems Engineering
1. I understand what plagiarism is and I am aware of the university policy in this
regard
2. I declare that this thesis is my original work and has not been submitted
elsewhere for examination, award of a degree or publication. Where other works
or my own work has been used, this has properly been acknowledged and
referenced in accordance with the University of Nairobi’s requirements.
3. I have not sought or used the services of any professional agencies to produce
this work
4. I have not allowed , and shall not allow anyone to copy my work with the intention
of passing it off as his/her work
5. I understand that any false claim in respect of this work shall result in disciplinary
action in accordance with University of Nairobi anti-plagiarism policy
Signature:
Date:

III
DESIGN AND EVALUATION OF SOLAR MAIZE GRAIN DRYER WI TH A BACK-
UP HEATER
ABSTRACT
A solar dryer integrated with a simple biomass burner was designed and constructed
with locally available materials to dry maize. The dryer was composed of solar
collector, drying chamber, back-up heater and airflow system all integrated together.
The back-up heater provided alternative heating during cloudy weather conditions or
at night when solar radiations were low. The dryer was designed based on climatic
conditions of Mau summit located in Nakuru County, Kenya. The average ambient
conditions were 26ºC air temperature and 72% relative humidity with daily global
solar radiation incident on horizontal surface of about 21.60MJ/m2/day. This study
describes the design considerations and results of calculations of design
parameters. A minimum of 3.77m2 solar collector area was required to dry a batch of
100kg maize grain in 6 hours under natural convection from the initial moisture
content of 21% to final moisture content of 13% wet basis. Using similarity laws a
dryer with collector area of 0.6m2 was fabricated and used in experimental drying
tests under varied heat source conditions namely; solar, biomass and a combination
of solar and biomass. Solar assisted dryer system efficiency was estimated at 57.7%
with average drying rate of 0.077kg/hr with back-up heating operation increasing
solar dryer efficiency by 17.8%.
Keywords ; Design, Solar collector, Biomass heater, Solar drying, Maize, Evaluation

IV
DEDICATION
I dedicate this project in a special way to my late father Mr. Solomon Busienei for
the encouragement and his financial support he gave me throughout my pursue of
academics to this extend.
To my great friends, my brothers and sisters for their persistent support and
encouragement throughout my academic life
To my wife, Joyce Chelangat, who has been the source of my hard work and for her
supportive sacrifices she has made.

V
ACKNOWLEDGEMENT
Firstly, I thank the Almighty God for granting me good health and knowledge
throughout the entire period of my study. Secondly, I greatly appreciate the closest
assistance and encouragement from my two able supervisors, Mr. E. B. K Mutai and
Eng. D. N Mutuli, lecturers University of Nairobi, for their persistent guidance and
advices within and without the research period. I am really indebted for their
willingness to provide overwhelming support and direction in every step towards the
accomplishment of this research. Besides, I also appreciate Dr. Gitau Ayub,
Chairman Department of Environmental and Biosystems Engineering, for his
consistent push and understanding at any slightest opportunity I needed his support.
To my great friends, Bernard Rono, Vitalis Too, Meshack Langat and Weldone Mutai
among others, I salute them for their wonderful encouragement and advices during
the pursue of this work which at every time rejuvenated my strength and kept me
going to this end. I further would like to appreciate in a special way the expertise of
Mr. Mathu Muriithi for the fabrication of the prototype without which this research
would not have been possible.
I would also like A great honour also goes to my wife, Mrs. Joyce Chelangat, for her
moral support, sacrifices and encouragement during the entire period of masters’
studies.
To my former employer, National Oil Corporation of Kenya, and the current employer
Gulf Energy limited Company, I sincerely give gratitude to them for allowing me an
opportunity to do my studies besides their assignments. Indeed it is an opportunity
worth noting. However, there are numerous other people who have contributed in
diverse ways for the success of this work whom I acknowledge, only space limits
specific mention of their names.

VI
TABLE OF CONTENTS
DECLARATION ....................................... ................................................................... I
DECLARATION OF ORIGINALITY ........................ ................................................... II
ABSTRACT .......................................... .................................................................... III
DEDICATION ............................................................................................................ IV
ACKNOWLEDGEMENT ................................... ......................................................... V
TABLE OF CONTENTS ................................. ........................................................... VI
LIST OF TABLES .................................... .................................................................. X
LIST OF FIGURES.................................................................................................... XI
LIST OF PLATES .................................... ................................................................ XII
LIST OF ABBREVIATIONS ............................. ....................................................... XIII
CHAPTER ONE ....................................................................................................... 14
1.0 INTRODUCTION ................................................................................................ 14
1.1 Background ..................................................................................................... 14
1.2 Problem Statement ......................................................................................... 16
1.3 Justification ..................................................................................................... 17
1.4 Hypothesis ...................................................................................................... 17
1.5 Objective ......................................................................................................... 18
1.6 Scope of study ................................................................................................ 18
CHAPTER TWO....................................................................................................... 19
2.0 LITERATURE REVIEW ............................. ........................................................ 19
2.1 Maize drying .................................................................................................... 19
2.1.2 Maize Storage ........................................................................................... 19
2.2 Traditional methods of Drying ......................................................................... 19
2.2.1 Open-Air Drying and sun-drying. .............................................................. 20
2.3 Mechanized dryers .......................................................................................... 20
2.4 Solar dryers ..................................................................................................... 20

VII
2.4.1 Source of solar energy .............................................................................. 22
2.5. Existing designs for different types of solar dryers ......................................... 22
2.5.1. PGCP Solar Coconut Drier ...................................................................... 23
2.5.2 Kenya Black Box Solar Drier ..................................................................... 24
2.5.3. An intermittent solar dryer for cocoa beans ............................................. 25
2.5.4 Simple Solar Maize Dryer ......................................................................... 26
2.5.5 Performance evaluation of a v-groove solar air collector for drying maize 26
2.6. Components of most common solar grain dryer ............................................ 28
2.6.1. Solar collector. ......................................................................................... 28
2.6.2 Drying chamber/ Compartment ................................................................. 29
2.6.3 Air flow system .......................................................................................... 30
2.6.4 Chimney.................................................................................................... 31
2.6.5 Biomass back up heater ........................................................................... 31
2.7 Recent work on maize dryers using a pre-heater ............................................ 31
2.8 Proposed maize solar dryer design distinguishing features ............................ 32
2.9 Overview of Solar Dryer designs ..................................................................... 33
2.10 Similtude Criteria ..................................................................................... 33
2.10.1 Similitude parameters ......................................................................... 34
2.10.2 Scaling Model ...................................................................................... 37
CHAPTER THREE ................................................................................................... 38
3.0 THEORETICAL FRAMEWORK ........................ ................................................ 38
3.1 Total solar radiation and useful heat gained by dry air leaving the collector ... 38
3.1.1 The energy balance on the solar collector ................................................ 39
3.1.2 Energy Balance Equation for the Drying Process ............................... 41
3.2 Solar dryer pertinent parts design ................................................................... 45
CHAPTER FOUR ..................................................................................................... 50
4.0 MATERIALS AND METHODS ............................. .......................................... 50

VIII
4.1 Study Area ...................................................................................................... 50
4.2 Solar maize grain dryer fundamental design considerations ........................... 50
4.3 Solar dryer Additional design constraints ........................................................ 52
4.4 Design procedure ................................................................................... 53
4.5 Design Procedure Flow chart .................................................................. 53
4.6 Thermal performance evaluation for the fabricated dryer................................ 54
4.6.1 Parametric Measuring instruments ........................................................... 54
4.6.2 Experimental tests procedure ................................................................... 55
4.6.3 Performance evaluation for the dryer ........................................................ 56
CHAPTER FIVE ....................................................................................................... 58
5.0 RESULTS AND DISCUSSION ............................ ........................................... 58
5.1 Solar Dryer Pertinent Parts Design. ........................................................ 58
5.2 Computed Design parameters ................................................................ 61
5.3 Fan System Design and Selection .......................................................... 62
5.4 Dimensioning and Assembling of the solar maize grain dryer ................. 62
5.4.1 Dimensions of the dryer ...................................................................... 62
5.4.2 Materials selection and fabrications of the solar collector .................. 63
5.4.3 Drying chamber .................................................................................. 64
5.4.4 Drying trays ........................................................................................ 65
5.4.5 Biomass back up heater ...................................................................... 65
5.4.6 Assembling of the prototype ................................................................ 66
5.5 Experimental Results .............................................................................. 68
5.5.1 Solar Irradiance distribution................................................................. 68
5.6 Open sun drying ...................................................................................... 69
5.7 Solar dryer performance ................................................................................. 71
5.7.1 No load ................................................................................................ 71
5.7.2 Loaded solar drier ............................................................................... 73

IX
5.8 Biomass Heater as source of heat in the dryer ........................................ 74
5.9 Solar drier assisted by biomass heater ................................................... 75
5.10 Efficiencies .............................................................................................. 78
5.10.1 Solar as the only source of heat .......................................................... 78
5.10.2 Biomass Heater as only source of heat ............................................... 79
5.10.3 Solar and back-up heater as a combined source of heat .................... 79
5.11 Average drying rate ................................................................................ 80
5.11.1 Solar as only source of heat ................................................................ 80
5.11.2 Biomass heater as only source of heat ............................................... 80
5.11.3 Solar and Biomass heater as combined source of heat ...................... 80
5.12 Summary of dryer system performance................................................... 81
CHAPER SIX ........................................................................................................... 82
6.0 CONCLUSION AND RECOMMENDATION ................. ..................................... 82
6.1 CONCLUSION ........................................................................................ 82
6.2 RECOMMENDATION.............................................................................. 82
7.0 REFERENCES ................................................................................................... 83
8.0 PUBLICATIONS .................................. .............................................................. 87
9.0 APPENDICES .................................................................................................... 88

X
LIST OF TABLES
Table 2.1 Advantages and disadvantages of the four types of solar food driers ...... 21
Table 4-1. Design Specification and Assumption ..................................................... 51
Table 5.1: Pertinent Design Parameters .................................................................. 61
Table 5.2. Dryer pertinent parts dimensions ............................................................. 63
Table 5.3: Average Values of Solar Irradiances and ambient temperatures ............ 68
Table 5.4: Sun drying experiment results ................................................................. 70
Table 5.5: Solar Collector Inlet and Outlet Temperatures ........................................ 71
Table 5.6: Solar drying experiment results ............................................................... 73
Table 5.7: back up heater experiment results .......................................................... 75
Table 5.8: Solar drier assisted by biomass heater experiment results ..................... 76
Table 5.9. Drying models given by various authors for drying curves ...................... 78
Table 5.10: Comparative study of solar dryers by various authors ........................... 79
Table 5.11. Dryer system performance .................................................................... 81

XI
LIST OF FIGURES
Figure 2.1: PGCP Coconut Drier. ............................................................................. 23
Figure 2.2: Kenya black box solar drier .................................................................... 24
Figure 2.3: Picture of the design solar dryer: A, drying chamber; B, solar collector; C,
fan housing ............................................................................................................... 26
Figure 2.4: Representation of the Solar Maize Dryer. .............................................. 26
Figure 2.5: Isometric view and V-groove of the air solar collector ............................ 27
Figure 3.1: Drying Process on Psychometric Chart. ................................................. 44
Figure 4.1: Google map of Kenya and the study site, Mau Summit region............... 50
Figure 4.2: flow diagram for hybrid drying process ................................................... 55
Figure 5.1 Schematic representation of solar energy collector component .............. 64
Figure 5.2: Schematic view of the Solar assisted maize dryer ................................. 67
Figure 5.3: Variation of Solar irradiance (W/m2) with time of day (Hrs) .................... 69
Figure 5.4: Drying Curve in the Sun drying Mode. ................................................... 70
Figure 5.5: Temperatures at Inlet and Outlet of solar collector chamber .................. 72
Figure 5.6: Drying Curve in the Solar drying Mode. ................................................. 74
Figure 5.7: Drying curve in the assisted solar drying mode ...................................... 77

XII
LIST OF PLATES
Plate 1: Sample of spoiled (rotten) maize affected by Aflatoxin ............................. 123
Plate 2: Solar irradiation measurement during the performance of the experiment
and the gadget used (Daystar DS-05A Solar Digital Meter) ................................... 123
Plate 3: Maize sample preparations; measuring the mass of the grains using
weighing balance ................................................................................................... 124
Plate 4: Woodfuel burning in the back-up heater to supplement the solar collector
heat during the performance of the experiment ...................................................... 124
Plate 5. Illustration of plan view of solar assisted maize dryer ............................... 127

XIII
LIST OF ABBREVIATIONS
ASHRAE American Society of Heating, Refrigerating and Air-conditioning Engineers
CFC Chlorofluorocarbon
GDP Gross Domestic Product
GPS Geo-positioning System
GSI Grain System International
GTZ GesellschaftfürTechnischeZusammenarbeit
IFPRI International Food Policy Research Institute;
Kg Kilogram
KWh Kilowatts-hour
MJ Mega joules
NASA
NCPB
National Aeronautics and Space Administration
National Cereals and Produce Board
PGCP Philippine German Coconut Project
PUF Polyurethane foam
UV Ultra Violet

14
CHAPTER ONE
1.0 INTRODUCTION
1.1 Background
In many parts of the world there is a growing awareness that renewable energy has an
important role to play in extending technology to the farmers in developing countries to
increase their productivity (Waewsak et al., 2006). Solar thermal technology is rapidly
gaining acceptance as an energy saving measure in agricultural applications. It is
preferred to other alternative sources of energy such as wind and shale, because it is
abundant, inexhaustible and non-polluting. (Akinola et al., 2006).
Drying is the oldest and widespread method of preserving food stuffs that utilizes this
abundant source of energy and plays great economic importance all over the world.
There are two types of water present in food items; the chemically bound water and the
physically held water, in drying it is only the physically held water that is removed. The
most important reasons for the popularity of dried products are longer shelf-life, product
diversity as well as substantial volume reduction. This could be expanded further with
improvements in product quality and process applications.
Maize being the most important staple food in sub-Saharan Africa has over time been
preserved through this method. In 2005, the top exporters of maize in sub-Saharan Africa
were South Africa, Tanzania, Uganda, Zambia and Swaziland, with the top importers of
maize Zimbabwe (a maize exporter until the late 1990s), Angola, Ghana, Kenya and
Mozambique (Meridian institute, 2009). According to Kenya Maize Development
Programme (KMDP) maize is the primary staple food crop in the Kenyan diet with an
annual per capita consumption rate of 98 kilograms -contributing about 35% -of the daily
dietary energy consumption. Indeed, 90% of the rural households grow maize and
production is dominated by small scale farmers who produce 75% of the overall
production. The other 25% is grown by large scale farmers (Erastus, 2011).
Facing a growing population, several studies (World Bank, 2003) note that it is critical for
Kenya and other African countries to increase maize production in order to feed their
people. The national maize production ranges between 24 and 33 million bags per
annum which does not keep pace with the domestic consumption levels (estimated over
36 million bags in 2008) due to high rate of population growth estimated to be 2.9% per
annum. (Kangethe, 2011). .

15
In Kenya, the major food safety hazard associated with maize is mycotoxins
contamination that are produced by many species of fungi which contaminate maize
during pre and post harvest periods. This indeed has contributed to loss of part of the
maize harvests due to fungal and microbial attacks causing high post-harvest losses.
These wastage and damage could easily be prevented by proper drying through the
utilization of the plentiful renewable solar energy given that Kenya lies within the equator
and is blessed with abundant solar energy all the year round with an annual average
insolation levels of 5.62kWh/m2/day (NASA) . Drying process of the maize involves
progressive loss of moisture content in the grains, it involve moisture removal due to
simultaneous heat and mass transfer. Maize is often not fully dried at the farm; it is
therefore harvested, threshed and dried to moisture content of about (11.8%-13%) for
safe storage or sales.
Therefore, the application of solar dryers in Kenya can easily reduce post harvest losses
and significantly contribute to the availability of food in the country. Further, it can help
reduce Case-fatality rate (CFR) caused by aflatoxin poisoning witnessed in some parts
of the country for quite some time due to poor drying of the grains (Refer; Appendix
A5.2), Aflatoxin poisioning has killed a number of people and livestock all over the
country, for instance in Eastern province where as of 20th July 2004 alone during its
outbreak 317 cases and 125 deaths had occurred (Korir et al., 2012).
Estimations of post harvest losses are generally cited to be of the order of 40% but they
can, under very adverse conditions, be nearly as high as 80%. A significant percentage
of these losses are related to improper and/or untimely drying of foodstuffs such as
cereal grains, pulses, tubers, meat and fish among others (Togrul et al., 2004).
Mechanized dryers though faster and give a better quality product, are expensive and
requires substantial quantities of fuel or electricity to operate, leading to high cost of
drying (Ajay, 2009). Therefore solar energy can easily be harnessed by a proper design
of solar dryers for drying crops and achieve controlled grain drying at lower costs.
In Kenya, drying of agricultural produce is accomplished majorly through open-air
drying/Sun-drying and mechanized dryers, with limited application of solar dryers. Open-
air drying is the oldest, most inexpensive and extensively used option since early times
and is practiced in many parts of the world including Kenya’s rural areas. This method
though entirely depends on weather conditions,is labour intensive, unhygienic, unreliable,

16
time consuming, result in non-uniform drying, and requires a large area for spreading the
produce to dry and in some places have failed to produce expected results.
Mechanized drying, majorly employed in industrialized regions and sectors, utilize dryers
with boilers to heat incoming air, and fans to force air through at a high rate. Mechanized
drying is faster than open-air drying, uses much less land and usually gives a better
quality product. But the equipment is expensive and requires substantial quantities of fuel
or electricity to operate, hence high cost of drying (Ajay, 2009). Therefore, the
intermediate drying technology that take care of sun-drying disadvantages, ecofriendly
and economically feasible to small scale is the application of solar dryers. Currently, in
Mau summit, farmers use sun drying where maize grains are spread on the ground using
polythene sheets and canny bags, this method is inadequate to solve the problems
hence need to design a better drying system. This prompted the study towards the
design and evaluation of solar dyer for maize grains in Mau-summit region in Kenya.
1.2 Problem Statement
Maize crop is usually harvested with moisture content of between 19% and 25% which is
a favourable environment for the growth of moulds (fungi) that causes grain spoilage and
mycotoxin contamination resulting to losses. Further, short-rains and less sun hours
experienced in Mau-summit during harvesting season makes sun drying process very
unreliable and is often associated with problems such as poor quality grains due to
exposure of grains to rain and dust, untimely drying and contamination resulting from
poor handling facilities.
According to research by IFPRI, (2010) grains dried in direct contact with bare ground
are more susceptible to contamination by fungi that produce aflatoxins which is popular
to many households using this traditional method. Poor drying due to overreliance on
heat from the sun has been cited as a major cause of aflatoxin contamination in the
country, which is estimated to claim up to 30 per cent of harvests every season
(Appendix A5.5).
The scarce mechanized dryers though appropriate for use to address the above
problems; are inaccessible to small scale farmers. On the other hand, farmers lack
financial capacity to procure and operate mechanized dryer which requires substantial
quantities of conventional fuel or electricity to operate.

17
These scenario leaves farmers without proper dried grains which is a threat to human
health, propagate post harvest losses and render production of maize uneconomical.
1.3 Justification
Currently there is growing demand for modern technology by farmers as they race to
tame heavy losses occasioned by grain contamination. Government and donor partners
are nowdays advocating adoption of modern drying techniques to replace roadside sun
drying and mitigate against rising cases of grain contamination. This has seen the set up
of budget allocation towards buying of fixed and mobile maize mechanical driers
respectively to reduce post-harvest losses (Appendix A5.5) which again might not offer
immediate solution due to cost, availability locally amd proximity to farmers as the project
is at pilot stage.
The proposed solar maize grain dryer will provide a solution to problems facing farmers
since it enables drying of grains in an enclosed unit; this keeps the grains safe from
damage by adverse weather conditions and animals. The grains are also dried using
solar thermal energy indirectly in a cleaner and safe way, incorporating back up heater in
the design enables night or all weather drying hence ultimately shortening the drying
time. Besides, it enables farmers to store the grains at right moisture content to fetch
better market price, an adequate consideration for their cost of production and profit
margin since better and efficient dried grains is achieved.
Furthermore, the dryer is not expensive to construct and operate as it uses locally
available material and skills to run compared to other alternative drying methods.
Besides, in Mau-Summit rural areas conventional sources of energy like petrol and
electricity are at times inaccessible or expensive to consider operating mechanized
dryers often associated with higher rate of performance. Thus, this dryer will counteract
the above underlying problems.
1.4 Hypothesis
The solar dryer with a back-up heater will enable all-weather and faster drying process
reducing the grain drying time, grain loss and improve quality of dried grains.

18
1.5 Objective
The overall objective of the study was to design, construct and characterize a solar
maize grain dryer with biomass back up heater to reduce grain drying time and improve
drying efficiency.
Specific Objectives
1. To design and fabricate a collector to harness solar thermal energy.
2. To design fabricate and assemble solar dryer pertinent parts which include drying
chamber, back-up heater, and airflow system.
3. To test and evaluate the thermal performance characteristics of the fabricated
solar dryer.
1.6 Scope of study
The study focused on the design and fabrication of a solar maize grain dryer, appropriate
for small scale farmers in Mau-summit location with the following components: solar
collector made of a glass cover plate and heat absorber made of corrugated iron sheet,
drying chamber trays made of mild steel sheet, air flow system and a biomass operated
back-up heater. The study entailed testing and evaluating thermal performance of the
dryer in terms of system efficiency and drying rate.

19
CHAPTER TWO
2.0 LITERATURE REVIEW
2.1 Maize drying
Drying Involves implies moisture removal, which is an adiabatic process. After growth
ceases and maize crop has reached maturity, a considerable amount of moisture must
still be removed from the grain before it can be safely stored. The lower the moisture
content and temperature, the longer the maize can be stored safely. High moisture grain
will deteriorate rapidly at high storage temperatures. In addition, wet grain will undergo
chemical changes. There are more severe problems encountered in storing high
moisture grain, as these are usually associated with the growth of various storage fungi
and resulting mycotoxin production.
Quality for commercial maize is defined by government National Cereals and Produce
Board grading standards. Depending on the type of grain, quality may include such
factors as germination levels, stress crack occurrence, breakage susceptibility, heat
damage, and milling or processing indices. These factors can be affected by the dryer
design, operational procedures, initial and final grain moisture contents, drying air
temperatures, airflow rates and grain cooling procedures after drying.
2.1.2 Maize Storage
With the evolution of a more planned agricultural system in the Middle Ages, maize was
stored on loam threshing floors or in grain lofts. Storage on the floor was used for the last
150 years or so. The grain lofts were semi-automated in the 19th century with the
introduction of drop tube systems, or were further improved as self-emptying silos
(Boumans, 1985). The old building system of the grain cells, laid out in natural or man-
made bricks, can be regarded as the predecessor of modern silo building. Only the
application of reinforced concrete at the beginning of the 20th century made it possible to
erect larger units by G. Boumans, (1985).
2.2 Traditional methods of Drying
Traditional drying of agricultural produce can be achieved through the following methods:

20
• Open-air drying
• Sun-drying
• Fossil drying e.t.c
2.2.1 Open-Air Drying and sun-drying.
These are the oldest, most inexpensive and extensively used option since early times; it
practiced in many parts r regions of the world including Kenya’s rural areas. The major
disadvantage of this method is contamination of the products by dust, birds, animals and
insects, spoiled products due to rain, wind and moisture, and the method totally depends
on prevailing weather conditions. Further, the process is labour intensive, unhygienic,
unreliable, time consuming, non-uniform drying, and requires a large area for spreading
the produce to dry. Besides, this method also prolongs drying and may result in the
deterioration of the quality of the crops or grains.
2.3 Mechanized dryers
In industrialized regions and sectors, open air-drying has now been largely replaced by
mechanized dryers.Mechanized dryers has boilers to heat incoming air, and fans to force
it through the maize at a high rate. Mechanized drying is faster than open-air drying, uses
much less area and usually gives a better quality product. But the equipment is
expensive and requires substantial quantities of fuel or electricity to operate, hence high
cost of drying (Ajay, 2009). Highly mechanized dryers can be of the following type: either
high temperature batch dryer; high temperature continuous-flow dryer or high
temperature re-circulating Type Dryer, ( El Fidal, 2004)
2.4 Solar dryers
Solar dryer transforms solar energy into heat that helps remove the moisture of grains
and crops. Most of the solar dryers have three major drier components:
• A drying/ food chamber in which food is dried,
• A solar collector that heats the air, and
• Some type of airflow system (Forced or natural)
Air is circulated by fans, which uses 20-40W of power from a photovoltaic panel, a
generator, or a central utility. Air is forced into the solar collector by the fans where it is
heated by the solar energy, and then flows on to the food drying section. An advantage

21
of the PV powered system is that, depending on the solar radiation, the air throughput is
automatically adjusted by the speed of the fans (Mathew et al., 2001).
Solar drying may be classified into direct, indirect, mixed-modes and hybrid. In direct
solar dryers, the air heater contains the grains and solar energy passes through a
transparent cover and is absorbed by the grains. Essentially, the heat required for drying
is provided by radiation to the upper layers and subsequent conduction into the grain
bed. In indirect dryers, solar energy is collected in a separate solar collector (air heater)
and the heated air then passes through the grain bed, while in the mixed-mode type of
dryer, the heated air from a separate solar collector is passed through a grain bed and at
the same time, the drying cabinet absorbs solar energy directly through the transparent
walls or roof. A hybrid system is one where additional heat is provided through the
burning of fuel or biomass. This enable night drying since the dryer does not only depend
on solar energy, hence drying is accelerated ultimately reducing drying time. Table 2.1
highlights advantages and disadvantages of the above classes of solar dryers.
Table 2.1 Advantages and disadvantages of the four types of solar food driers
Classification Advantages Disadvantages
Direct • least expensive • simple
• UV radiation can damage food
Indirect • products protected from UV • less damage from temperature
extremes
• more complex and expensive than direct sun
Mixed-mode • less damage from temperature extremes
• UV radiation can damage food
• more complex and expensive than direct sun
Hybrid • ability to operate without sun reduces
• chance of food loss is minimised
• allows better control of drying • fuel mode may be up to 40x
faster than solar
• expensive • may cause fuel dependence

22
2.4.1 Source of solar energy
Solar energy is energy comes from the sun. Every day the sun radiates an enormous
amount of energy. The sun radiates more energy in one second than people have used
since the beginning of time. All this energy comes from within the sun itself. Like other
stars, the sun is a big gas ball made up mostly of hydrogen and helium. The sun
generates energy in its core in a process called nuclear fusion.
During nuclear fusion, the sun’s extremely high pressure and high temperature cause
hydrogen atoms to break apart and their nuclei to fuse or combine. Some matter is lost
during nuclear fusion. The lost matter is emitted into space as radiant energy.
It takes millions of years for the energy in the sun’s core to make its way to the solar
surface, and then approximately eight minutes to travel the 93 million miles to earth. The
solar energy travels to the earth at a speed of 186,000 miles per second, equivalent to
the speed of light. Only a small portion of the energy radiated by the sun into space
strikes the earth i.e. one part in two billion. This energy has been utilized by man in
various diverse ways since time in memorial. This uses as regards Mau-summit area
includes electrical energy stored in batteries to power electrical appliances, solar heaters
to heat water systems e.t.c. Attempts have been made to collect and use this energy
adequately and efficiently since it is less free, inexhaustible, and renewable. (Meridian
institute, 2009)
2.5. Existing designs for different types of solar dryers
When drying foods, the key is to remove moisture as quickly as possible at a
temperature that does not seriously affect the quality i.e. flavor, texture and color of the
food. If the temperature is too low in the beginning, micro organisms may grow before the
food is adequately dried, if the temperature is too high and the humidity too low, the food
may harden on the surface. This makes it more difficult for moisture to escape and the
food does not dry properly ( Adu et al., 2012)
Successful drying depends on:
• Enough heat to draw out moisture, without cooking the food
• Dry air to absorb the released moisture; and
• Adequate air circulation to carry off the moisture.

23
Examples of already developed dryers in various part of the world are briefly discussed
below:
2.5.1. PGCP Solar Coconut Drier
A small, portable, and inexpensive coconut drier was developed and tested as part of the
GTZ Philippine German Coconut Project (PGCP). The drier is an improvement of
traditional open-air sun drying by reducing drying time and increasing the quality of the
dried coconut, as demonstrated in tests from 1994-95.
The PGCP drier required 4-5 days of drying time, whereas open-air drying required 5-7
days. With the PGCP solar drier, approximately 50% of the coconuts maintained their
white color, but with open air drying less than 20% stayed white. As shown in Figure 2.1,
the drier consists of a frame of bamboo (or rattan) supporting a clear plastic sheet in a
dome shape. The coconut halves are spread on the ground and then the drier is placed
over them.
The first day of drying should be sunny to produce a quality dried product. This drier is
most suitable for farms of one hectare or less, and requires an elevated site where rain
water will run off. It is possible the drier may be adapted to products other than coconuts,
provided the required temperature is less than 60°C .
Figure 2.1: PGCP Coconut Drier. (Villaruel, 1996)
The cost of one drier is estimated as 15 US$, and replacement plastic will cost
approximately 3US$ every two to three years. The frame can be constructed with local

24
skills and materials. This PGCP solar drier was not actually adopted by farmers; they
favored the indirect type coconut husk-fired natural draught PGCP copra dryer with a
processing capacity of 2000 nuts per two days of operation.
2.5.2 Kenya Black Box Solar Drier
More than 90 “black box” solar driers were tested in Kenya from 1996-97 as part of a
GTZ project. Although various factors hindered the success of the project, the driers
were pronounced technically reliable and economically viable. Without any special
promotion, individuals in other areas who knew of the black box drier project began their
own drying activities. In addition to over 1 ton of mangoes; smaller amounts of guavas,
papaws, bananas, vegetables, greens, and tomatoes were also successfully dried.
Figure 2.2: Kenya black box solar drier (Eckert, 19 98)
The black box solar drier consisted of a heating chamber and a drying chamber, each
with a glass cover to allow sunlight to enter. The glass traps the solar heat inside so that
the drier temperature reaches up to 40°C above ambi ent. The two glass tops together
measure approximately 2m x 0.8m, for an effective collector area of 1.7m2. Fresh air
enters the heating chamber through a vent near the bottom of the drier. The heated air
rises into the drier chamber and flows around the trays, absorbing moisture from the
produce. Air exits near the top of the drying chamber through a wire-gauze covered vent.
The drying chamber holds food trays with wire gauze bottoms, each 1m2. This is enough
area to dry 15-20kg of fresh mangos per day in the Kenyan climate, resulting in
approximately 0.5kg/day of dried product. Kenyan carpenters manufactured these driers
in 1996 for 340 US$ each.

25
In the 1996-97 projects, mangos were sliced 1mm thick so that drying could be
completed in one day. Drying was started early in the morning and trays were rotated
every two hours for even drying. The slices were dry in late afternoon, and immediately
stored in airtight containers.
Successful drying requires the drier to be exposed to bright sunlight and re-oriented
throughout the day to keep the glass facing the sun. The black box solar drier can be
appropriate for small-scale drying in areas with a climate conducive to solar drying with
convection what (Mathew et al., 2001).
2.5.3. An intermittent solar dryer for cocoa beans
The experimental dryer was made mainly of wood and consisted of the following major
components: the solar collector; the drying chamber and the heat storage chamber. An
air duct connects the upper end of the solar collector to one end of the drying chamber;
while, the other three sides were partitioned internally, 125mm wide, to form the heat
storage chambers. The surfaces of the collector, the drying chamber and heat storage
chambers were covered separately with glass doors. A five- speed axial flow fan is
located inside the air duct to blow hot air during the period of insolation, drawing hot air
from the solar collector and discharging onto the beans in the drying chamber.
Consequently, the beans are dried by a combination of convective heating of the hot air
and the direct radiation through the glass cover. The dryer was mounted on a wheeled
frame made of 50×50×3 mm angle iron. The prototype was designed to hold a batch of
50kg of wet cocoa beans. The set up of the design is as in figure 2.3 below (Fagunwa et
al., 2009).
A
C
B

26
Figure 2.3: Picture of the design solar dryer: A, d rying chamber; B, solar collector; C, fan housing (Fagunwa et al., 2009).
2.5.4 Simple Solar Maize Dryer
This typical Distributed Passive Solar Energy Dryer is made up of the following basic
units:
• A drying chamber
• An air-heating solar energy collector, which consists of cover plate, absorber
plate and insulator
It is designed in such a way that solar radiation is not incident directly on the maize, but
preheated air warmed during its flow through a low pressure thermos phonic solar energy
air heater or collector made up of an insulating material (polystyrene), absorber plate
(aluminium) sheet painted black and a cover glass (5mm thickness) measuring 100mm x
50mm all arranged in this order contributed to the heating. The test results gave
temperature above 45OC in the drying chamber, and the moisture content of 50kg of
maize reduced from 20% to about 12.5% moisture content wet basis in three days of 9
hours each day of drying (27hours drying time)
Figure 2.4: Representation of the Solar Maize Dryer (Joshua, 2008).
2.5.5 Performance evaluation of a v-groove solar ai r collector for drying maize
(Zea mays) in lraq (Abdullah and Gatea, 2011)
A solar drying system was constructed, consisting of three parts (solar collector, drying
chamber, and air blower). Solar collector having V-corrugated absorption plate of two air
passes, a single glass cover was used. The total area of the collectors measeured 2.04

27
m². The dimension of the drying chamber were 1.06m, 0.66m and 0.56 m for width,
depth, and height, respectively. 38 kg of corn were dried. The moisture content was
reduced from 21% to 13% within four hours of drying. The drying air temperatures at the
inlet of the dryer were found in the range of 30 to 45ºC when the range of ambient air
temperature was from 8.5 to 20ºC and total solar radiation intensity was from 270 to 560
W/m2. Increasing volumetric air flow rate from 0.025 to 0.030 m3/s raises the daily solar
collector efficiency by 3.25%, while increasing volumetric air flow rate from 0.030 to
0.035 m3/s raises the solar daily collector efficiency by 11.11%. The drying rate is
reduced with the decrease of moisture content. Efficiency of the collector is very much
dependent on air flow rate.
Figure 2.5: Isometric view and V-groove of the air solar collector
(Abdullah and Gatea, 2011).

28
2.6. Components of most common solar grain dryer
2.6.1. Solar collector.
Energy from the sun can be converted into solar power for thermal applications, such as
to provide direct heat to air or liquid. Solar energy can be trapped more efficiently
depending on the type of solar collectors used. Each type of solar collector is designed to
absorb the shorter wavelengths of light which are received from the sun (0.3-2mm in
length) but prevent heat wavelengths (2-10mm in length) from escaping by utilizing the
greenhouse effect then delivers radiant energy either directly or indirectly to a working
fluid. There are various types of solar thermal collectors that are normally used
depending upon performance requirements: these include; Flat plate, evacuated tubes,
and heat pipe tube.
Flat plate collectors have been extensively used than others. They are either corrugated,
bond duct or tube-in-plate type with different clamping arrangements. The performance
of the flat plate collector depends upon various design parameters, such as the number
of covers, type and thickness of glazing, anti-reflecting coating on cover glass, heat
mirror coating on the inner glass, the type of coating on the collector plate, spacing
between the collector and the inner glass, an evacuated space between the collector and
the inner glass, the arresting of convective movement between the collector plate and the
inner glass by using transparent insulation material, and the type of insulation used. All
these are responsible for the performance of a flat plate collector. There are several
other operational parameters, such as the mass flow rate of fluid, solar radiation, inlet
temperature, ambient temperature, wind speed, sky conditions, and dust deposition on
glass cover which also affect the collector performance (Alghoul et al., 2005).
The most simple flat plate solar collector(or absorber) commonly used is often a dark
colored box with a transparent cover. It raises the air temperature between 10 and 30°C
above ambient. This may be separate from the drier chamber, or combined (as with
direct driers). Often the bottom surface of the absorber is dark top remote solar
absorption. Glass is recommended for the absorber cover, although it is expensive and
difficult to use. Plastic is acceptable if it is firm or supported by a rib such that it does not
sag and collect water (Mathew et al., 2001).

29
Desirable features of solar thermal collector mater ials
• Transparent cover
This is used to cover the absorber. It protects the absorber together with the structure
frame from adverse weather conditions like dust and rain from coming in contact with the
absorber. It also retards the heat from escaping by acting as a heat trap for infrared
(thermal) radiation (i.e. forming a confinement for heated air). Therefore, it reduces
radiation losses and convection to the atmosphere.
The most common materials used for cover plates are glass, flexi glass, fibreglass,
reinforced polyester, thin plastic films and plastics (Joshua, 2008). The cover properties
includes ability to transmit incoming shortwave solar irradiation while transmitting none of
the longwave radiation emitted by the absorber
• Absorber
This can be made of metallic or other materials but painted black to absorb the incident
solar radiation transmitted by the cover thereby heating the air between it and the cover.
In most cases the corrugated or v-grooved absorbers are used to improve the heat
transfer coefficient between the absorber plate and the air as well as increasing the
absorption of solar radiation.
• Insulation
This prevent the loss of thermal energy at the bottom and on the sides of the collector
hence minimize overall heat loss from the system. It is placed under the absorber plate.
The insulator must be able to withstand stagnation temperature, fire resistant and not
subject to out-going gassing and should not be damaged by moisture or insect.
Insulating materials are usually fibreglass, mineral wool, Styrofoam and urethanes, but
selective grade of CFC free polyurethane foam (PUF) as insulation material ensures
superior performance with minimum heat loss (Joshua, 2008).
2.6.2 Drying chamber/ Compartment
Products are located on trays or shelves, normally it is made of opaque materials in the
case of indirect or hybrid system of dryer. Solar radiation is thus not incident directly on
the crop. Preheated air is warmed during its flow through the solar thermal collector; it is

30
ducted to this chamber to dry the products. Because the products are not subjected to
direct sunshine, localized heat damage, do not occur.This chamber sometimes is made
of highly polished wood materials because of its poor conductor of heat characteristics
and smooth surface finish, thus heat loss by radiation is minimized.
2.6.3 Air flow system
There are two types of airflow that take place in most of the solar dryers that utilizes the
aspect of solar collector, namely: Natural and forced convention.
a) Natural convection
This utilizes the natural principle that hot air rises. The effects of natural convection may
be enhanced by the addition of a chimney in which exiting air is heated even more.
Natural convection driers require careful use; stacking the product too high or lack of sun
can cause air to stagnate in the drier and halt the drying process
b) Forced convection
In forced convection air is forced through the drying chamber with artificial means like
fans or turbo-ventilator. The use of forced convection can reduce drying time by three
times and decrease the required collector area by 50%. Consequently, a drier using fan
may achieve the same throughput as a natural convection drier with a collector six times
as large (Matthew et al., 2001).
It is necessary to have a fan in the drying system in order to maximize the drying quality
and to minimize drying time. The airflow should be variable, so that an optimal drying
temperature may be reached. This fan should be of low power consumption which may
be driven by a solar cell panel or a small generator driven by a motor.
• Fan system
Fan or blower can be installed before the collector or after the collector. In the systems,
where it is connected between the collectors and the drying chamber, the collector works
under slight negative pressure hence minimizing the effect of minor leaks if any
developed with time. Positive pressure is maintained inside the dryer to avoid entry of
dust and cold air into the dryer. Normally, fans may be powered with utility electricity if it
is available, or with a solar photovoltaic cell.

31
• Turbo-ventilator
This create a draught that enables heated air to flow upward in the solar collector, pass
through the food stuffs arranged in trays taking out the moisture from the food.
Wind driven turbo ventilators are used all over the world because of their low capital and
installed cost, adaptability, high capacity per vent, and overall reliability. Operation is
simplicity in itself. As the vent hood is rotated by the wind, the saturated inside air is
exhausted through the vanes and the natural inward flow of heated air from the collector
is boosted.
2.6.4 Chimney
This provides a means through which the dry heated air that has passed through
materials being dried and exits the dryer are recirculated and heated further. Chimney
has to have overhung in order to prevent rains or any insects from interfering with drying
materials. Besides, turbo-ventilator can be fixed on top of it to aid draught built up.
2.6.5 Biomass back up heater
In case of low solar irradiation during the day or if there is intention of reducing drying
time or ensuring night drying process, the drying process can be backed up by a biomass
heater.
Biomass (especially fuelwood) is a dominant source of energy, and commonly burned
using inefficient technologies in most developing countries.As long as this resource is
harvested sustainably; it can provide the required backup thermal energy for solar drying
in developing countries (Madhlopa et al., 2007).
If biomass heater is used as backup fuel for cloudy days and night operations then the
payback period of the dryer is reduced.
This heater is necessary to have a flue gas chimney to be discharging the flue gas
behind the drying chamber to prevent filtration of smoke into the drying chamber.
Consequently, the height of the flue gas chimney should be set to an appropriate height.
2.7 Recent work on maize dryers using a pre-heater
Onigbogi et al, (2012) presented the design and construction of a domestic passive solar
dryer.The dryer is composed of solar collector (air heater) and a solar drying chamber

32
constraining rack of three cloth (net) trays both being integrated together. The air allowed
in through air inlet is heated up in the solar collector and channeled through the drying
chamber where it is utilized in drying the maize. The design was based on the
geographical location of Abeokuta (7.15°N and 3.35° E) and meteorological data was
obtained for proper design specification.
The dimensions of the dryer so designed are 94cm x 45cm x 101cm (length x width x
height). Locally available material were used for the construction, chiefly comprising of
wood (gmelina), glass, aluminum metal sheet, copper and net cloth for the trays. The
optimum temperature of the dryer was 50.50°C with a corresponding ambient
temperature of 34.50° C. The moisture content removal of 43.2% and 40.6% in maize
and plantain respectively using the solar dryer was achieved against 28.2% and 27.89%
in maize and plantain respectively. using the sun drying method and indication 15.0%
and 12.71% difference respectively, The rapid rate of drying in the dryer reveals its ability
to dry food items reasonable rapidly to a safe moisture.
2.8 Proposed maize solar dryer design distinguishin g features
Previous research efforts has been focused on designing and constructing simple natural
and convection solar dryer to serve the remote areas of most African countries not
connected to the national electric grid and with no capacity to access alternative sources
of energy which are far much too expensive. The use of solar technology has often been
preferred for the drying to reduce energy costs and economically speed up drying which
would be beneficial to final quality of product. In Africa, Nigeria and Ghana have shown a
lot of activity in the field of solar dryers compared to Kenya.
The recent solar dryer design by Onigbogi et al, (2012) is a mixed mode type which
entirely depends on the solar energy unlike the proposed design which is integrated to a
biomass heater to allow for night and all weather drying. This makes the current design
more efficient and a reliable drying method.
Our designed maize dryer used used the same principles of design followed by the
recent solar dryer designs done world over. The design is aimed at addressing food crop
drying challenges within Kenya and its environs with similar meteorological conditions as
Mau summit region.

33
2.9 Overview of Solar Dryer designs
The following points are considered generally in design of direct natural / forced
convection solar dryer system:
a) The amount of moisture to be removed from a given quantity of maize grain.
b) Harvesting period during which the drying is needed.
c) The daily sunshine hours for the selection of the total drying time.
d) The quantity of air needed for drying.
e) Daily solar radiation to determine energy received by the dryer per day.
f) Wind speed for the calculation of air vent dimensions.
2.10 Similtude Criteria
The characteristics of an enclosed air-jet have been studied by using prototype system,
scale-models, and numerical simulation. However, a precise mathematical model is
impossible for the extremely complex microstructure of room airflow. Model tests will
always be required if the prototype is not available and no precise mathematical–physical
prediction model is established. Model studies are practical for simulating the behavior of
a prototype and can be used to validate a numerical simulation. Similitude, or the relation
between a model and prototype, is an important issue when using model studies. The
similitude criterion between a model and prototype is important to guarantee that the
experimental results of the model can be used to predict the behavior of the prototype.
(Yu et al, 1999, 2006).
Complete similitude of the Isothermal airflow field between the model and prototype must
satisfy the geometric similitude, kinematic similitude, dynamic similitude, and all
boundary conditions.
Only partial similarity between the model and prototype could be satisfied because most
of the dimensionless parameters affecting airflow performance have equal importance in
most of the realistic problems.
The traditional method for investigating similitude requirements uses dimensional
analysis and the Buckingham Pi theorem. Only knowledge of variables related to the
problem of interest are required. The risk with this method, however, is that if one or
more important variable is neglected, serious mistakes of model design could result (Yu
and Hoff, 1999).

34
A more sophisticated method of similitude analysis is derived from governing differential
equations and the associated initial and boundary conditions. This method gives
necessary Pi terms directly and is a more rigorous statement of similitude.
Reynolds number (Re), has been widely used as the similitude criterion for an isothermal
airflow in an enclosure, but experimental results do not always show that the Reynolds
number is the appropriate similitude criterion. Jet momentum ratio (Rm), which is defined
as the ratio of inertia force and total drag due to viscous shear at the walls of the
enclosure has been validated as an appropriate similitude criterion through recent
experiments, but Rm in m2/s2 is a dimensional parameter and is not a valid criterion since
a similitude parameter must be dimensionless (YU et al, 2006).
2.10.1 Similitude parameters
The dimensionless similitude parameters derived from the governing differential equation
approach for isothermal conditions follow:
Froude number:
.r
VF
g L=
(2.1)
Where, Fr, is the ratio of inertial to gravitational forces.
V, is the characteristic velocity of flow
g is gravitational acceleration
L is characteristic length of flow
Similarity requires:
m
m m
V V
g l gl=
(2.2)
gm = g results in a relation between diffuser air speed as:-
= = λ-1 (2.3)
Where, λ is the geometric scaling between the model and prototype.
• Euler number:

35
(2.4)
Euler number represents the ratio of pressure to momentum forces, similarity requires
that:-
m = (2.5)
If the same working fluid between the model and prototype is used, then = and
the relations simplifies to:
m = (2.6)
Where, is the density of the fluid.
Po is the upstream pressure.
Pd is the downstream pressure.
is a characteristic velocity of the flow.
If pressure difference between inlet and outlet are the same between model and
prototype, the relation further simplifies to:
(2.7)
• Reynolds number:
(2.8)
Re represents the ratio of inertia to viscous forces, Similarity between model and
prototype requires:

36
(2.9)
Where,
V is the mean velocity of the fluid
is the dynamic viscodity of the fluid.
is the density of the fluid
L, is characteristic length
If the same working fluid between model and prototype is used, then
= and , resulting in the following requirements between diffuser air
speeds:
= = λ (2.10)
Where, λ is the geometric scale between prototype and model.
• Jet Momentum Ratio, Rm:
Using Rm as the similitude criterion results in the design condition of scaling law between
the model and prototype (denoted by subscripts m and p) as
(2.11)
Where H is the enclosure height in m
L is the enclosure length in m
ud is the air jet velocity at the diffuser in m/s
As ) = ( ) (2.12)
then:
) = ) (2.13)

37
or
) = ) (2.14)
Using Eu as the similitude criterion will result in the same design condition
2.10.2 Scaling Model
Similarity analysis indicates that similarity parameters for isothermal airflow were
geometry, Froude number, Euler number, jet momentum ratio and Reynolds number
between model and prototype. Froude is important for compressible flow and for motions
with free liquid-vapor surfaces in the flow. The isothermal airflow in a slot-ventilated
enclosure is considered as a homogeneous fluid without free liquid-vapour surfaces, thus
the froude number was not considered.
The remaining similarity parameters require higher inlet airspeed in the model based on
Reynolds number but the same inlet airspeed between the model and prototype based
on both Euler number and jet momentum ratio. (YU et al, 2006).
Therefore, the Euler number and jet momentum ratio were used to relate the prototype
and the model in order to achieve kinematic and dynamic similarities. Geometric
similarity were obtained by scaling the linear dimensions by a constant ratio between the
model and prototype

38
CHAPTER THREE
3.0 THEORETICAL FRAMEWORK
3.1 Total solar radiation and useful heat gained by dry air leaving the collector
Due to the elliptical orbiting of the earth around the sun, the distance between the earth
and the sun fluctuates annually and this makes the amount of energy received on the
earth’s surface (I‘sc) to vary in a manner given by Equation. 3.1
(3.1)
Where Isc is the solar constant which is valued at 1367 W/m2 and n is the day of the year
which varies from n = 1 to n = 365.
The direct solar radiation, Ib, reaching a unit area of a horizontal surface in the absence
of atmosphere can be expressed as in Equation. 3.2.
(3.2)
where φ is latitude (degrees), β is angle of inclination of surface from horizontal
(degrees), δ is angle of declination (degrees) and ω is hour angle (degrees).
The angle δ; (angle between the sun’s direction and the equatorial plane) is evaluated
from the Equation (3. 3).
(3.3)
On the other hand, ω is computed by Equation (3.4a),
(3.4a)
where Hr is the hour of the day in 24 hour time.
• Length of the day, N :
The length of the day, N (hours) is given by:
. (3.4b)

39
Where; φ is latitude (degrees) and δ is angle of declination (degrees)
• The diffuse radiation, I d.
This is that portion of solar radiation that is scattered downwards by the molecules in the
atmosphere. During clear days, the magnitude of Id is about 10 to 14% of the solar
radiation received at the earth’s surface. Id can be estimated as direct radiation incident
at 60o on the collector surface by Equation (3.5),
(3.5)
where C is the diffuse radiation factor.
• The total solar radiation, I T,
IT incident on the horizontal surface is therefore given by adding the direct and diffused
components of solar radiation as shown in Equation (3.6). The total solar radiation is of
great importance for solar dryers since it captures the required components of solar
energy that is harnessed in the dryer ((Ezekoye et al., 2006).
. (3.6)
3.1.1 The energy balance on the solar collector
The energy balance on the absorber is obtained by equating the total heat gained to the
total heat lost by the heat of the solar collector. Therefore, absorber
(3.7)
Where:
IT= rate of total radiation incident on the absorber’s surface (Wm–2);
Ac = collector area (m2);
Qu= rate of useful energy collected by the air (W);
Qcond= rate of conduction losses from the absorber (W);
Qconv= rate of convective losses from the absorber (W);
QR = rate of long wave re-radiation from the absorber (W);
Qρ= rate of reflection losses from the absorber (W).

40
The three heat loss terms Qcond, Qconvand QR are usually combined into one-term (QL),
i.e.,
(3.8)
If τ is the transmittance of the top glazing and IT is the total solar radiation incident on the
top surface, therefore,
IAc= τ ITAc (3.9)
The reflected energy from the absorber is given by the expression:
Qρ= ρτITAc (3.10)
Where; ρ is the reflection coefficient of the absorber. Substituting Equations (3.8), (3.9)
and (3.10) into Equation (3.7) yields:
τITAc= Qu+ QL + ρτITAc, or
Qu= τ ITAc (1 – ρ) – QL.
For an absorber (1 – ρ) = α and hence,
Qu= (ατ)ITAc– QL .(3.11)
Where
α is solar absorptance.
QL composed of different convection and radiation parts. It is presented in the
following form (Bansal et al., 1990):
QL = ULAc (Tc– Ta) (3.12)
Where:
UL = overall heat transfer coefficient of the absorber (Wm–2K–1);
Tc= temperature of the collector’s absorber (K)
Ta = ambient air temperature (K).
From Equations (3.11) and (3.12) the useful energy gained by the collector is expressed
as:
Qu= (ατ)ITAc– ULAc(Tc– Ta) .(3.13)

41
Therefore, the energy per unit area (qu) of the collector is
qu= (ατ)IT – UL(Tc– Ta) .(3.14)
If the heated air leaving the collector is at collector temperature experimentally, the heat
gained by the air, Qg is:
(3.15)
Where:
= mass of air leaving the dryer per unit time (kgs– 1);
Cpa= specific heat capacity of air (kJkg– 1K– 1).
The collector heat removal factor, FR, is the quantity that relates the actual useful energy
gained of a collector, Qu Equation. (3.13), to the useful gained by the air, Qg Equation
(3.15). Therefore,
. (3.16)
Therefore, Qg= AcFR[(ατ)IT – ULAc(Tc– Ta)]. (3.17)
The steady state thermal efficiency of the solar air collector,ƞc is given by Hottel–
Whillier–Bliss equation 3.18 (Forson et al, 2007) defined as the ratio of useful energy
gained by the air in the collector to solar radiation incoming to the collector (Itodo et al.,
2002):
(3.18)
Where; Qg= heat gained by air in the collector.
Ac = Area of the collector (m2 );
IT = Average solar insolations (KJ/s),
3.1.2 Energy Balance Equation for the Drying Proce ss
The total energy required for drying a given quantity of grains can be estimated using the
basic energy balance equation for the evaporation of water;
(3.19)

42
Where:
mw= mass of water evaporated from the food item (kg);
ma= mass of drying air (kg);
T1 and T2 = initial and final temperatures of the drying air respectively (K);
Cp= Specific heat capacity of air at constant pressure (kJkg–1K–1).
Lv= Latent heat of Vaporization of Water (kJkg–1K–1).
• Moisture Content (M.C.):
The moisture content is given as:
; wet basis (3.20)
Where;
Mi= mass of sample before drying and
Mf= mass of sample after drying.
• The mass of water evaporated or moisture loss
This can be obtained using Equation. 3.21 or 3.22:
(3.21)
Where:
mi= initial mass of the food item (kg);
Me = equilibrium moisture content (% dry basis);
Mi= initial moisture content (% dry basis).
Also this can still be obtained by using equation 3.22
mw = (mi– mf) (3.22)
Where;
mi is the mass of the sample before drying and
mf is the mass of the sample after.
During drying, water at the surface of the substance evaporates and water in the inner
part migrates to the surface to get evaporated. The ease of this migration depends on the

43
porosity of the substance and the surface area available. Other factors that may enhance
quick drying of food items are: high temperature, high wind speed and low relative
humidity.
• Average drying rate
Average drying rate, Mdr, is determined from the mass of moisture to be removed by
solar heat and drying time by the following equation (3.23):
. (3.23)
Where:
mdr = average drying rate, kg/hour; mw = mass of water evaporated and td =
overall drying time
• The mass of air needed for drying is calculated using equation given as follows:
(3.24)
3.1.3 Drying process mechanisms
Producing safe, high quality dried produce requires careful procedures throughout the
entire preservation process. incorrect drying can dramatically degrade food and brings
the risk of food poisoning. Therefore all adjustments must be constantly controlled to
achieve appropriate drying.
The whole drying process is illustrated as shown on the psychometric chart and a flow
diagram.

44
Figure 3.1: Drying Process on Psychometric Chart (K udal et al., 2009).
3.1.4 Dryer or drying process efficiency therefore is given as;
(3.25)
Where;
Qa =MaCpa (Tinto drying chamber – Tambient temperature),
Mw = mass of evaporated water,
LV= latent heat of vaporization,
Mg = mass of the grains dried,
Cpg = specific heat capacity of the grains and
∆T = change in temperature of the chamber.
(Ezekoye et al., 2006),
3.1.5 Biomass heater efficiency
The overall thermal efficiency of the heater can be defined as the ratio of useful heat
transferred to the drying air to the energy potential of fuel (Bena& Fuller, 2002). This
efficiency is a product of the combustion efficiency and the efficiency of heat transfer to
the air. In this project an overall efficiency of the heater, was calculated as:

45
3.26
3.2 Solar dryer pertinent parts design
a) Solar collector area
From the total useful heat energy required to evaporate moisture and the net radiation
received by the collector, the solar drying system collector area Ac, in m2 can be
calculated from the following equation:
AcITη = E = ma(hf -hi)td (3.27)
Therefore, area of the solar collector is:
Ac = E/ITη .(3.28)
Where
E is the total useful energy received by the drying air, kJ;
IT is the total global radiation on the horizontal surface during the drying period, in kJ/m2
ηc is the collector efficiency, which is assumed to be in the range of 30 to 50% (Sodha et
al., 1987).
b) Collector Air duct depth:-
The determination of the air duct depth is to some extent an iterative procedure.The
overall depth of the collector air duct channel “s” is calculated and if this proves suitable
for the desired mass flow rate and the average value of the velocity of air inside the
collector, the value is acceptable. Otherwise, some or all the estimated / assumed values
are altered and/or the space configurations of the solar collector are altered to achieve
the desired value of “s” subject to all the constraints imposed on the design.
Following from the continuity equation, for one-dimensional steady flow the weighted
average velocity at the exit of the solar collector is related to the channel overall cross-
section by the relation
. (3.29)
Where;

46
Vc is the maximum collector outlet velocity under natural air circulation conditions,
in m/s
Va is the volumetric flow in m3/s
W is the width of the collector in m
c) Absorber Surface Area
The surface area of the absorber Aab is approximately equal to the area of the collector
surface area, Ac; this is related to the length, Lc and width, W of the solar collector as
follows:
Aab = Ac = Lc x W. (3.30)
d) The amount of moisture to be removed from the pr oduct, mw [kg] is calculated
using the following equation:
(3.31)
Where;
mp[kg] is the initial mass of product to be dried;
Mi [%] and Mf [%] wet basis are the initial moisture content and the final
moisture content, respectively.
e) Final relative humidity or equilibrium relative humidity, ERH [%] of moist air at
the exit of drying process can be calculated using sorption isotherms equation given
as follows
(3.32a)
(3.32b)
(3.32c)
Where aw is the water activity; M [kgw/kgs] dry basis.
f) The mass of air needed for drying is calculated using equation given as follows:

47
(3.33)
Where:
mw = amount of moisture to be removed, kg
wf and wi = final and initial humidity ratio, respectively, kg H2O/kg dry air
td = total drying time, hrs
g) The quantity of heat required to evaporate the w ater would be:
(3.34)
Where:
E = total heat energy, kJ
ma = mass flow rate of air, kg/hr
hf and hi = final and initial enthalpy of drying and ambient air, respectively, kJ/kgda
read using psychometric charts
td= drying time, hrs
h) Average drying rate
Average drying rate, mdr, would be determined from the mass of moisture to be removed
by solar heater and drying time by the following equation:
(3.35)
i) Sizing of the dryer chamber
The breadth of the drying chamber, B, is made equal to the width (W) of the air-heater.
Thus, the length of the drying chamber, Ldc, is determined from the relation
(3.36)
j) Area of Drying bed
The effective drying bed area Adb is obtained from first principles by relating the solid
density of the wet material to its mass and the corresponding volume as

48
(3.37)
Where;
WW is the mass of the crop to be dried,
ρgr the bulk density of the crop on wet basis,
hL the layer drying bed thickness,
ξ, the crop porosity,
εv the loading bed void fraction.
k) Air vent dimensions:
The air vent is calculated by dividing the volumetric airflow rate by wind speed:
(3.38)
Where;
Av, is the area of the air vent, m2,
Vw, wind speed, m/s.
The length of air vent, Lv will be equal to the length of the dryer. The width of the air vent
can be given by:
(3.39)
Where;
Bv is the width of air vent, m
l) Pressure drop through the drying bed
The resistance to the flow of air through a packed bed of agricultural produce is
expressed in the form.(Jindal et al. 1978; Forson 2007).
u = a ( ) (3.40)
where;
u is the superficial air velocity,
hL the drying bed thickness and
a is a constant whose value is determined experimentally.

49
For natural circulation of air through a thin layer of crop (hL≤0.20 m), the value of the
constant is 0.465m3s/kg.
The total pressure drop across the solar collector and the air vent is comparable to that
across the drying bed, and hence the total pressure drop of the system is approximately
twice the pressure drop of the drying bed. Hence, (∆PT = 2(∆PB). When all pressure
drops are accounted for, experience has shown that, the gross pressure drop is about six
times the value of ∆PT (Forson et al 2007). and given by relation:
∆PT =6 x {2∆PB} (3.41)
m) Height of the hot air column
The height of the hot air column is the minimum height of the exit vents above the
collector inlet for moist air escape to the ambient under air circulation by natural
convection. In arriving at the height of the air column, it is assumed that the dryer
functions under steady state conditions. It is further assumed that:
• The depth of the drying bed, hL, is small compared to height, H, of the hot air column
• The whole structure is air tight and ambient air enters through the inlet and the moist
warm air escapes through the exit vent(s).
• The steady state average values of the temperature and density of the hot air inside
the dryer are Tdryerand ρ*, respectively.
Applying Bernoulli’s equation between the relevant sections of the dryer and
simplifying
the resulting expressions leads to the relation
(3.42)
Where;
∆PT is the total pressure drop in the dryer in Pa
R is the gas constant = 0.291kPa m3/kgK
Tdryer is the temperature of air in the dryer in Kelvin
Tambient is the temperature of ambient air in Kelvin
g is the gravitational acceleration in M/s2
Pa is the atmospheric pressure = 101.3kPa
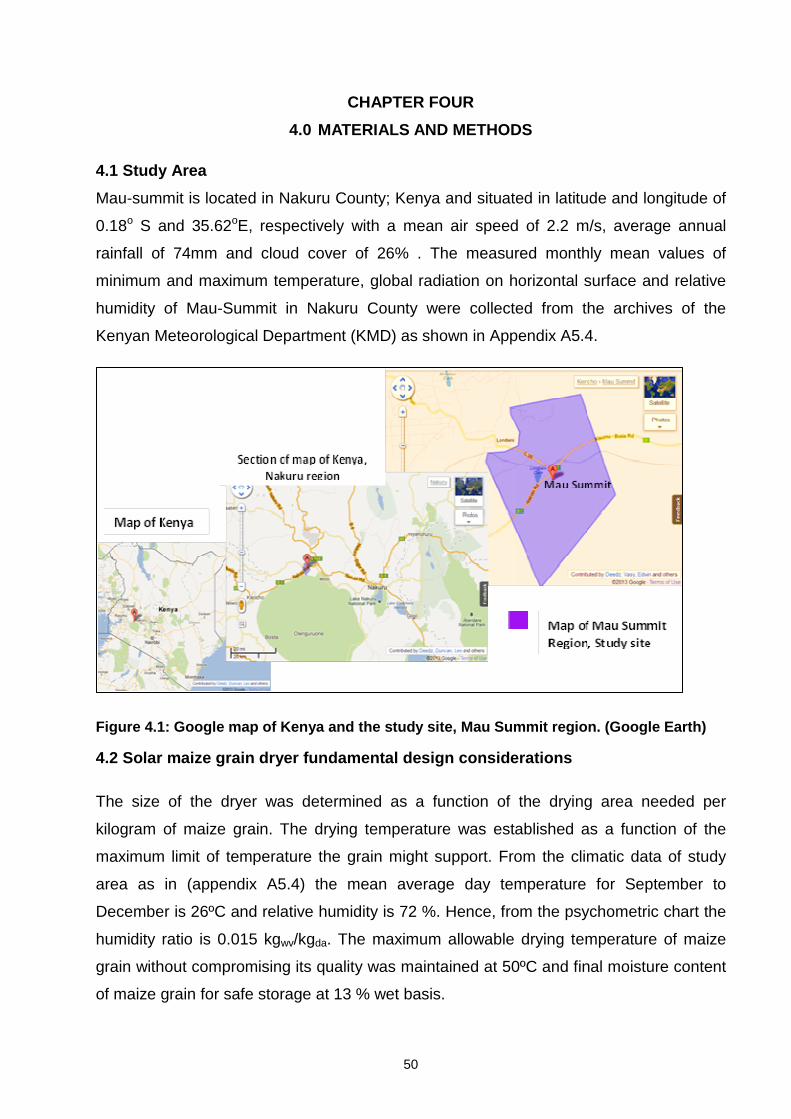
50
CHAPTER FOUR
4.0 MATERIALS AND METHODS
4.1 Study Area
Mau-summit is located in Nakuru County; Kenya and situated in latitude and longitude of
0.18o S and 35.62oE, respectively with a mean air speed of 2.2 m/s, average annual
rainfall of 74mm and cloud cover of 26% . The measured monthly mean values of
minimum and maximum temperature, global radiation on horizontal surface and relative
humidity of Mau-Summit in Nakuru County were collected from the archives of the
Kenyan Meteorological Department (KMD) as shown in Appendix A5.4.
Figure 4.1: Google map of Kenya and the study site, Mau Summit region. (Google Earth)
4.2 Solar maize grain dryer fundamental design cons iderations
The size of the dryer was determined as a function of the drying area needed per
kilogram of maize grain. The drying temperature was established as a function of the
maximum limit of temperature the grain might support. From the climatic data of study
area as in (appendix A5.4) the mean average day temperature for September to
December is 26ºC and relative humidity is 72 %. Hence, from the psychometric chart the
humidity ratio is 0.015 kgwv/kgda. The maximum allowable drying temperature of maize
grain without compromising its quality was maintained at 50ºC and final moisture content
of maize grain for safe storage at 13 % wet basis.

51
To carry out design calculations and size of the dryer, the design conditions applicable to
mau-summit were considered. Information regarding the type of crop to be dried, loading
densities acceptable, the crop characteristics and the quantity per batch were needed
with data concerning the geographical location of the dryer and climatic conditions during
the harvest period. The conditions, assumptions and relationships summarized in Table
4.1 were used to calculate the design parameters of the solar maize grain dryer.
Table 4.1. Design Specification and Assumption
No. Items Condition and assumption
1 Location Mau-summit (latitude 0.18oS and
longitude 35.62oE)
2 Crop Maize Grain
3 Crop Porosity, ξ 0.42
4 Bulk Density, ρgr [kg/m3] 721
5 Loading bed void fraction, εv 0.70
6 Drying period September to December
7 Drying per Batch; Loading rate, mg
[kg/batch] 100
8 Initial moisture content, Mi [%] w.b 21
9 Final moisture content, Mf [%] w.b 13
10 Ambient air temperature, tam [oC] 26
11 Ambient relative humidity, RHam [-], 0.72
12 Maximum allowable temperature, tmax [oC] 50
13 Drying time (sunshine hours) td [hrs] 6
14 Incident solar radiation, IT [MJ/m2/day] 21.60
15 Wind speed, ws [m/s] 2.2
16 Collector efficiency, ηc [%] 50
17 Average thickness of grain, thm[mm] 9.13
18 Vertical distance between two adjacent
trays, d [cm] 15
19 Collector tilt angle, [o] 0°
Sources of figures: Measurements and assumptions

52
4.3 Solar dryer Additional design constraints
According to Forson et al., (2007), the design constraints which applies to natural and
forced convection dryer includes the following:
1. For airflow by natural convection, the average velocity of the drying air, vc, at the
exit(or outlet) of the collector is expected to be between 0.20 and 0.40 m/s.
2. The collector tilt (β) for maximum collection of incident solar radiation for all year
round operation of a collector is to be taken as the latitude of the site where it is
located in practice.
3. The aggregate drying bed thickness, hL, is not to exceed 200 mm, the maximum
value expected for thin layer drying.
4. The maximum height of the hot air column, H, is recommended to be between 2
and 6m for corresponding total pressure across the dryer between 0.8 and 2.5 Pa.
5. Simulation studies conducted in previous research showed that as the ratio of
drying chamber area to the collector surface area is increased the overall drying
efficiency increases. However, it was observed that for the ratio in the range of 1–
2, there was no observable difference in the performance of the dryer. A value of
1.0 is therefore recommended as the ratio of the drying floor area to the collector
surface area.
6. From previous research, it was noted that with an average solar irradiance in the
range 300–500W/m2, an effective drying time of 30–36 h (3–5 days depending on
the sunshine duration) can be assumed for a loading density in the range 5–18
kg/m2.
7. The length-to-width ratio of solar collector (L/W) for optimum performance is in the
range 1– 2.
8. The mass flow rate, ma , through a mixed-mode natural convection solar crop
dryer has been found to lie in the range 0.02–0.9 kg/s.
9. For collectors with tilt angle up to 60°, it has been recommended that the ratio of
the collector overall length-to-depth ratio (aspect ration) should be greater than 20
but less than 200 for variable flow conditions.

53
4.4 Design procedure
1. Establish Design conditions and Assumptions i.e. Crop characteristic, Climatic
data, Dryer capacity, Initial and Final moisture content, drying time and collector
efficiency.
2. Determine moisture loss required for the dryer batch.
3. Calculate the ERH and determine moist air properties at ERH.
4. From gas laws equation determine amount of air to effect moisture loss
5. From psychometric chart determine amount of energy required to effect moisture
loss
6. Calculate the collector area, dimensions and select materials
7. Calculate the dryer chamber area, dimensions and select materials
8. Calculate the biomass heater capacity, dimensions and select materials
9. Calculate the air vent dimensions and vent locations
10. Design a fan with capacity to deliver the required airflow and static pressure.
11. Fabrication of the dryer for experimental drying tests.
4.5 Design Procedure Flow chart

54
4.6 Thermal performance evaluation for the fabricat ed dryer.
After the design and fabrication of the dryer, several drying experiments were performed
using the fabricated dryer in view of establishing the thermal performance of the dryer
and ultimately determining its economic viability. This was achieved through execution of
drying experiment differently at the following conditions:
• Performances of the drying experiment when the source of energy for heating air
was solar collector only.
• Performances of the experiment when the source of energy for heating air was
biomass back up heater only
• Performances of the drying experiment when the solar collector and the heater were
both engaged.
4.6.1 Parametric Measuring instruments
Dole grain moisture meter
This was used for moisture determination on the grains at time intervals.
Digital Point thermocouple
This was used in measuring ambient temperature, system temperatures at various points
i.e. inlet to Solar Collector, Outlet to Solar Collector, Inlet / Outlet of Back up heater and
Outlet temperature of the drying chamber.
Weighing Scale
This was used for determining the weight of samples and determination of moisture loss
in grains
Anemometer
The ANEMOMETER VANE PROBE MODEL: AM-4201 with accuracy of +/-0.1m/s was
used in determining the velocity of air flow.
Timer clock
This was used in determining the drying rate of maize grain.
Solar Meter
A Daystar DS-05A Solar Digital Meter with accuracy of +/- 0.03 within the range of (0 to
1200w/m²) was used to measure the solar irradiance values.

55
Hygrometer
The Testo 625 thermo hygrometer measures humidity from 0 to 100% RH with an
accuracy of ±2.5% and a resolution of 0.1%. Temperature readings from -10 to 60°C are
accurate to ±0.5°C with a resolution of 0.1°C.
4.6.2 Experimental tests procedure
Therefore, basing on the components of this solar maize grain dryer prototype and the
required parameters for its performance characteristics descriptions, the measurement
system was installed in and around the dryer as illustrated in the in drying process flow
diagram on figure 4.8 hence defined the tests procedure for the above three varied
conditions.
Figure 4.2: flow diagram for hybrid drying process (forced convection airflow)
From the figure 4.2, three other optional process than the hybrid system above were
adopted for experimentation and validation, parametric measurements taken at
appropriate positions as indicated in fig. 4.8. These processes includes:
i. Forced convection airflow and hybrid system process
Fresh air ------ Solar Collector ------ Biomass heater ----- Drying Chamber
ii. Forced convection and back up heat source system.
Fresh air ------ Biomass heater ----- Drying Chamber
Back-up Heater

56
iii. Forced convection and solar collector heat source system
Fresh air ------ Solar collector ----- Drying Chamber
iv. Natural convection and solar collector heat source system
Fresh air ------ Solar collector ----- Drying Chamber
The above simulated experimental test for the study were therefore undertaken generally
with the following consideration:
Before drying
• Determination of moisture content (Using moisture meter)
• Weight of each maize sample
• Filling up of trays
During drying
• Registration of temperatures:- Taken at the;
� Inlet to solar collector/ ambient air temperature
� Outlet of solar collector
� Inlet to biomass heater
� Outlet of biomass heater
� Above the drying grains/ saturated air temperature
• Emptying of trays after some time intervals
• Weighing of each maize sample to determine weight loss
• Air velocity
4.6.3 Performance evaluation for the dryer
The dryer performance was evaluated using the drying rate and system efficiency. The
collector and heater efficiency was computed. Also, the drying rate which is the quantity
of moisture removed from the grains in a given time was computed.

57
4.6.3.1 Procedure
The dryer performance was evaluated using the drying rate and system efficiency. The
collector and heater efficiency was computed. Also, the drying rate (the quantity of
moisture removed from the grains in a given time) was computed.
Drying rate
Average drying rate, Mdr, was determined from the mass of moisture removed by dryer
and drying time as given by equation (3.23):
Where:
mdr = average drying rate, kg/hour and td = overall drying time
Dryer system efficiency
The system efficiency was determined as detailed below.
• Solar collector: The solar collector efficiency was calculated using equation (3.18).
• Biomass heater: The heater system efficiency was calculated using equation
(3.26).
• System efficiency: The system efficiency of the solar dryer and solar assisted
dryer was calculated from equation (3.25).

58
CHAPTER FIVE
5.0 RESULTS AND DISCUSSION
5.1 Solar Dryer Pertinent Parts Design.
a) Solar collector area
The Solar Collector area was calculated from equation (3.28) which yields Ac =3.77m2,
The collector length to width ratio is taken to be, Lc/W = 1.5 which falls between
recommended range for optimum performance of collector. The collector dimensions are
hence Lc = 2.51m; W = 1.5m
b) Collector Air duct depth:-
The overall depth of the collector air duct channel “s” is calculated using equation (3.29)
and yields s = 0.1m satisfying the constraint imposed on the value of s, since 20<L/s =
25.1<400, satisfying the design constraint regarding the aspect ratio.
c) Absorber Surface Area
The surface area of the absorber Aab was calculated from equation (3.30) and equal to
the area of the collector surface area, Ac this is Aab = 3.77 m2
d) The amount of moisture to be removed from the pr oduct, mw [kg] was calculated
using equation (3.31) and yields mw = 9.2kg
e) Final relative humidity or equilibrium relative humidity, ERH [%] of moist air at
the exit of drying process was calculated from equations (3.32a) (3.32b) and (3.32c)
and determined as 57%
f) The quantity of air needed for drying
Using a psychometric chart and taking input air temperature of 26°C (dry bulb) and a
relative humidity of 72%, the psychometric chart gives a humidity ratio of 0.015 kg
water/kg dry air. When the solar collector heats air to optimum drying temperature of
50°C (dry bulb), the humidity ratio remains constan t. If on passing through the grain, the
air absorbs moisture until its relative humidity is equal to ERH (calculated), 57%. The
psychometric chart shows the humidity ratio to be 0.021 kg water/kg dry air. The change
59
in humidity ratio is therefore: 0.021 - 0.015 = 0.006 and the corresponding dry bulb
temperature is 35.5°C.
From the gas laws equation PV=MART (5.1)
Where;
P = is the atmospheric pressure = 101.3 KPa,
V =the volume of air in m³.
MA = the mass of the air in kg,
T =the absolute temperature in Kelvin, and
R = the gas constant = 0.291 kPa m³/kg K.
For a humidity ratio increase of 0.006 kg water/ kg dry air, each kg of water will require
1/0.006 = 166.67 kg dry air. For this calculation, the absolute temperature is 35.5+ 273 =
308.5 K and the volume of air needed to remove 1 kg of water is 147.71m3.Hence 9.2kg
will require 1358.89m3 volume of air to effect drying.
i. The volume flow rate of air Va (m3/hr) is calculated as shown below:
Va = Wa / td (5.2)
Wa = quantity of air required in m3 = 1358.89m3
td = Total drying time=6 hrs (a batch daily)
Va= 1358.89/6 =226.48m3/hr
For a drying time of 6 hrs operating time per day, the volumetric air flow rate is 0.06m3/s
ii. Mass flow rate of air, ma, kg/hr was calculated as below:
ma = ρa x Va .(5.3)
ρa = density of drying air (Kg/m3 )=1.2kg/m3
Va = volumetric air flow rate
This calculation yields 271.78kg/hr. (0.08kg/s).
g) The quantity of heat required to evaporate the w ater was calculated from equation
(3.34) and yields, E = 40.77MJ
h) Average drying rate
Average drying rate, mdr, was determined from equation (3.35) and yields

60
mdr = 1.53kg/hr
i) Drying chamber Floor Area
The ratio of Drying chamber floor area Adc to Collector Area Ac is equal to 1 within
recommended range of 1 – 2 in the constraints. Since two trays are considered in our
design. The floor area of each drying chamber Adc = 1.89m2
j) Sizing of the dryer chamber
The breadth of the drying chamber, B, is made equal to the width (W) of the solar
collector i.e. B = 1.5m; hence the length of the drying chamber is determined from
equation (3.36) and is equal to Ldc = 1.26m.
k) Effective Drying bed Area
The effective drying bed area Adb was calculated from equation (3.37) and is equal to Adb
=2.78m2. The corresponding loading density is 18 kg/m2 ; the value of which falls within
the acceptable range of 5–18 kg/m2 in the design constraints.
l) Air vent dimensions:
The air vent area is calculated from equation (3.38) and yields Av = 0.03m; The length of
of air vent, Lv will be equal to the length of the dryer, Ldc = 1.26m, while the width of the
air vent is given by equation (3.39) and equal to Bv = 0.02m.
m) Pressure drop through the drying bed
The pressure drop through the drying bed is given by the equation (3.40) and equal to
∆PB = 0.17Pa. While the total pressure drop across the solar collector and the air ducts is
comparable to that across the drying bed, and hence the total pressure drop of the
system is approximately twice the pressure drop of the drying bed. i.e. ∆P = 0.34Pa.
When all pressure drops are accounted for, experience has shown that, the gross
pressure drop is about six times the value of ∆P (Forson et al 2007). and given by
equation (3.41) and is equal ∆PT = 2.04Pa.
n) Height of the hot air column
The height of the hot air column is calculated from equation (3.42) and is equal to H =
2.4m. In the construction of the dryer, an allowance is made for the height of the solar

61
collector inlet above the ground level. The height of the solar collector inlet vent above
the ground level, y, should be at least 0.40m to allow air to flow naturally through it.
5.2 Computed Design parameters
Table 5.1 shows the computed results of the pertinent design parameters of the solar
dryer design.
Table 5.1: Pertinent Design Parameters
No. Parameter Units Data or Equation
used
Value Source
1 Initial humidity ratio, ωi kgwv/kgda tam, RH am 0.015 Psychometric chart
2 Initial enthalpy, hi kJ/kgda tam, RH am 65.00 Psychometric chart
3 Equilibrium relative humidity,
RHf
% Mf, and Isotherms
Eq. (3.32c)
57.00
4 Final enthalpy, hf kJ/kgda ωi, tf 90.00 Psychometric chart
5 Final humidity ratio, ωf kgwv/kgda RHf, hf 0.021 Psychometric chart
6 mass of water to be
evaporated, mw
kg Eq. (3.31) 9.20
7 average drying rate, dr kgwv/hr Eq (3.35) 1.53
8 air flow rate, ma kg/hr Eq. (5.3) 271.78
9 volumetric airflow rate, Va m3/hr Eq. (5.2) 226.48
10 Total useful energy, E MJ Eq. (3.34) 40.77
11 Solar collector area ,Ac m2 Eq. (3.28) 3.77
13 vent area, Av m2 Eq.(3.38) 0.03
14 Air Pressure Drop, P Pa Eq. (3.41) 2.04 Entire system
15 vent length, Lv m Spec. 1.26
16 vent width, Bv m Eq. (3.39) 0.02
17 Absorber Area m2 Eq. (3.30) 3.77

62
5.3 Fan System Design and Selection
To achieve the desired drying or aeration conditions, the air flow rate is selected from the
suggested air flow rates of between 13.3L/sm3 to 26.7 3L/sm3 for high temperature drying
of up to 45 – 70°c plenum temperatures. High air fl ow rates, batch or layers in a bin is
recommended. (GSI group, 1998).
• Average grain depth for a stack considered hL, is 0.2m, the maximum value expected
for thin layer stacking of grain in a bin.
• From the STATIC PRESSURE TABLES for CORN between 0 – 600mm. (next higher
value after 200mm) and 26.7 3L/sm3 in the range of suggested air flow rates. The
Static pressure for selected grain is 13.7mm water column. (Appendix A5.1).
• From earlier design calculation of the dryer, the total air flow required to effect drying
is 0.06m3/s
• From the FAN PERFORMANCE TABLE for vane axial fans at 13.7mm static pressure
(25.4mm on table) and 0.06m3/s (0.5m3/s on the table), the appropriate fan would be
a 0.56KW – 300mm Vane Axial Fan. (Appendix A5.2).
Fan selected will provide 0.5m3/s air flow @ 25.4mm W.G static pressure
5.4 Dimensioning and Assembling of the solar maize grain dryer
5.4.1 Dimensions of the dryer
For the purpose of the experiment and because of time and resource limitations, a scale
of 1 to 2.5 was used to determine the dimensions of the fabricated dryer pertinent parts.
However, other dimensions were adjusted during fabrication of the dryer to address
proportionality concerns. The value of scale ratio λ is made small to minimize scale
effects resulting from omission of some non-dorminant forces during the design (Heller,
2012).

63
Key dimensions are summarized in the table 5.2 :-
Table 5.2. Dryer pertinent parts dimensions
Dimensions
No Parameter Units Actual Dryer
Fabricated Dryer
1 Solar Collector
Length, Lc m 2.51 1.00 Width, Wc m 1.5 0.60
Collector Area, Ac m2 3.77 0.60 2 Solar Dryer
Length, Ld m 1.26 0.50
Width, Bd m 1.5 0.60 3 Air Vent
Length, Lv m 1.26 0.50
Width, Bv m 0.02 0.01 4 Back up heater
Length, Lb m 1.75 0.70 Width, Wb m 1.5 0.60 Depth, Db m 1.5 0.60
5 Height of Air Column, H m 2.4 0.96
6
Height of Collector Inlet above ground level, y m 0.4 0.40
5.4.2 Materials selection and fabrications of the solar collector
As discussed in literature review section the materials suitable for the collector parts
were proposed. Solar collector was separated from the drying chamber but connected
with a duct to allow heated air passage through to the plenum part of the drying chamber.
It has a collector area of 0.6m2 and mounted on a horizontal square tube frame. The
collector was made of block board (0.6m x 1.1m ) on the sides and blockboard (1.1m x
0.7m) at the bottom, the entire structure was enclosed by a 1.5mm mild steel sheet to
prevent the wooden structure from harsh weather (on the sides and the bottom) The
other components included: Transparent cover plate of fibre glass material, an absorber
made of Corrugated Galvanized iron sheet and an wool lining insulator inserted between
the iron sheet and the wooden structure.

64
a) Cover Plate
This is a transparent fibre glass cover of 2.5 mm thickness placed about 0.42m above
the absorber and fixed firmly to wooden frame structure. Its dimensions are 1.1m by
0.7m to prevent it from falling inside the collector.
b) Absorber Plate
This was made of galvanized corrugated iron sheet covering the entire inner lining of the
solar collector coated with a black paint. The black paint contains (5%) black chromium
powder to increase the iron sheet absorption capability.
c) Insulator
The insulator is mainly to minimize heat loss from the system. It was placed 25.4 mm
below the absorber plate. The material used was wool of size 1m by 0.6m because of its
superior performance in minimizing heat loss. Figure 5.1 show a cross section sketch of
the solar collector.
Figure 5.1 Schematic representation of solar energy collector component
5.4.3 Drying chamber
The drying chamber was made of highly polished wood held in place by wooden frame
structure supported at the bottom by angle iron framework. Its bottom side of the plenum
was made of mild steel sheet to allow transfer of heated air in to the dryer chambers. To
further reduce heat loss by radiation and to avoid moisture absorption by the wood, the
structure was painted with Aluminum paint. The dimensions of the drying chamber are
0.7mx0.6m x0.5m. Besides, the top part of the chamber is triangular cone shape with
base dimensions of 0.245m by 0.245m with a height of 0.124m.

65
5.4.4 Drying trays
These are the triangular prism shaped trays that holds the grains during drying. There
are two trays only in this chamber. Each tray is served by a dedicated ducting to convey
hot air and located 0.15m apart from each other and made of 1.5mm perforated mild
steel sheet with a 45° angle to increase surface ar ea of grain in contact with heated air.
Plate 5.1: Pictorial representations of the drying chamber and trays for the dryer.
5.4.5 Biomass back up heater
Based on the need to have small size burner, and having established the width of the
drying chamber which was to be mounted on a common framework with the burner, the
dimension of the burner was estimated as (0.7m x 0.6m x 0.6m). This biomass burner
was made of a brick-wall kiln enclosed with 1.5mm thick mild steel sheet.
The heater has a flue gas chimney of diameter 0.23m and a height 1.19m cold rolled
from mild steel sheet of 1.5mm thickness and located on the top side.

66
Plate 5.2: Pictorial view of the back-up heater str ucture of the dryer
5.4.6 Assembling of the fabricated dryer
The above various parts designed, dimensioned and fabricated were assembled together
to form a complete prototype dryer as shown in figure 5.2 and plate 5.3

67
Figure 5.2: Schematic view of the Solar assisted m aize dryer

68
Plate 5.3: Pictorial view of the assembled maize gr ains dryer .
5.5 Experimental Results
5.5.1 Solar Irradiance distribution
The table below shows the daily solar irradiance and ambient temperature averages
measured during the months of August, September and October during which time solar
dryer tests were being carried out. (Refer to appendix A1) for actual days solar irradiance
and corresponding ambient temperature values.
Table 5.3: Average Values of Solar Irradiances and ambient temperatures
Time (24Hrs) Solar Irradiance in W/m 2
Amb. Temperature 0C 0800 360 19.8
0900 570 22.6
1000 820 24.5
1100 1023 27.3
1205 1030 27.4
1305 1020 27.4
1405 980 27.2
1545 820 26.8
1640 700 25.0
1740 550 24.1

69
Figure 5.3: Variation of Solar irradiance (W/m 2) with time of day (Hrs)
Figure 5.3 shows the average solar irradiations and ambient temperatures during the
experiment duration
The solar irradiance increases from 360W/m2 to a maximum value of 1030W/m2 at
1205hrs and remains almost constant at average values of 1000W/m2 between 1100hrs
and 1500hrs during active solar irradiance hours. A significant drop of irradiance from
1000W/m2 to 550W/m2 is noted between1500hrs and 1740hrs.
The ambient temperatures also varied greatly with solar irradiations. The average
ambient temperatures as from 11.00am to 4.00pm ranged between 26.8oC and 28.0oC
5.6 Open sun drying
During the performance of the dryer tests, sun drying was also performed by spreading
the same amount of maize grain sample in the sun. The result of the experiments was
tabulated and the performance of the method analyzed using the drying rate and drying
curves. (Refer to Appendix A0) for detailed results of sampled days for each month

70
Table 5.4: Sun drying experiment results
Date Time Moisture
Content, % Day 1 11:00 19.30
15:00 16.37 Day 2 11:00 16.62
15:00 15.40 Day 3 11:00 15.40
15:00 14.67 Day 4 11:00 14.91
15:00 13.93 Day 5 11:00 13.93
15:00 13.45 Day 6 11:00 13.69
15:00 13.20
Figure 5.4: Drying Curve in the Sun drying Mode.
Maize grains sample having initial moisture content of 19.3% was dried by sun drying to
a final moisture content of 13.2% in 6 days of 4 hours each during sampled days in the
months of August, September and October at prevailing ambient temperatures range
between 25°C and 28°C.

71
Constant drying rate occurred in the first 3 days of drying of 4 hours each where up to
4.8% MC was lost. The critical moisture content occurred at 14.5% MC w.b. The falling
rate occurred for next 3 days of drying of 4 hours each where only 1.2% MC was lost.
This signifies tightly bound water requiring a lot of energy to remove.
Given that; Mass of moisture removed, Mw (0.25kg) over drying period of , td (24 hours).
From equation (3.23) the average drying rate calculated is 0.0104 kg/hours
5.7 Solar dryer performance
5.7.1 No load
The temperatures of the system were measured when the solar dryer was operated with
no load in it. The inlet and outlet temperatures were measured for four (4) hours before
loading the dryer with maize samples on the sampled days in the month of August,
September and October. The average values of Tin and Tout for each month were
tabulated in table 5.5
Table 5.5: Solar Collector Inlet and Outlet Tempera tures
Time, Hrs Tin Avg. August September October Tin Tout Aug Tin Tout Sep Tin Tout Oct
11:00 27.33 27.00 28.50 27.43 30.67 27.57 30.70
11:10 27.50 27.17 28.50 27.60 31.60 27.73 30.50 11:20 27.57 27.07 30.10 27.87 31.70 27.77 31.83 11:30 27.57 27.00 30.10 27.90 32.00 27.80 32.10 11:40 27.53 26.93 30.40 27.93 32.30 27.73 32.13 11:50 27.53 26.97 30.30 27.87 32.67 27.77 31.87 12:00 27.53 27.07 30.20 27.77 32.40 27.77 32.10 12:10 27.47 27.20 30.10 27.57 32.53 27.63 32.00 12:20 27.43 26.97 28.30 27.67 31.73 27.67 31.57 12:40 27.43 26.87 28.00 27.77 31.63 27.67 31.53 13:00 27.43 26.87 28.20 27.73 31.63 27.70 31.33 13:20 27.37 26.87 28.10 27.70 31.07 27.53 30.83 13:40 27.13 26.63 28.20 27.43 29.05 27.33 30.53 14:00 27.10 26.63 27.20 27.30 29.00 27.37 30.00 14:20 26.90 26.27 27.10 27.23 28.40 27.20 29.40 14:40 26.60 25.83 26.70 27.03 28.20 26.93 29.00 15:00 26.20 25.50 26.50 26.60 28.00 26.50 28.20

72
Figure 5.5: Temperatures at Inlet and Outlet of sol ar collector chamber
Figure 5.5 above shows the relationship between temperatures (Tin & Tout) of the system
within solar collector chamber. The performance of the solar collector during this period
had significant variances as highlighted below.
The average temperature increase in the month of August was 1.85 °C., September
3.11°C and October 3.41°C. The perfomance of the co llector is low in the month of
August and almost double in the subsequent months. This can be explained by short
rains experienced in August. In view of the above it is recommended that the harvesting
season of maize in Mau summit be delayed to begin in September and take advantage
of improved efficiency of our solar dryer.
The outlet air temperatures are higher than the inlet temparatures by an average value of
2.78°C for the three months with a one time highest temperature increase of 4.8°C in
September. As noted, the low rise in temperature could be attributed to high altitude and
high relative humidity of the study area which affects collector performance.
Therefore, the steady state efficiency of the solar air collector can be estimated using
Hottel–Whillier–Bliss equation (3.18)
In determining mass flow rate, ma =ρa A V in kg/s
Where; A= cross sectional area of fan duct (measured) in m2 = 0.014375m2
V = velocity of air flow in to the system (measured) in m/s =7.1m/s
ρa = density of air in kg/m3 (literature) = 1.2kg/m3

73
Therefore, Qg = mass flow rate (0.12 kg/s) × specific heat capacity of dry air (1.006
KJ/kg.K) × Average change in temperature (2.78 K);
Ac = Area of the collector (0.6 m2 );
IT = Average solar insolations (0.958 KJ/s),
the thermal efficiency of the collector was calculated as 59%.which is found to be
slightly higher than that reported to by Sodha et al 1987. The reason is that our dryer
system used forced convection which increased its efficiency than the natural convection
used by the latter.
5.7.2 Loaded solar drier
The solar drier was loaded with maize grains during active solar radiations, which was
from 11am until 3pm during the months of August, September and October.
The table 5.6 below shows the average weight of the sample of maize grains at the start
and the end of the each days experiment. (Refer to Appendix A2) for sampled days for
each month
The change in weight was attributed to loss of moisture contents.
Table 5.6: Solar drying experiment results Date Time Moisture Content, %
Day 1 11:00 19.3
15:00 14.9
Day 2 11:00 14.9
15:00 13.7
Day 3 11:00 13.7
15:00 13.2

74
Figure 5.6: Drying Curve in the Solar drying Mode.
The Sample having initial moisture content of 19.3% was dried by solar drying to a final
moisture content of 13.2% in 3 days of 4 hours each during the months of August,
September and October.at prevailing drying chamber temperatures of between
27.3ºCand 32.0 ºC.
High moisture removal rate of MC (4.8%) was achieved in day 1 while the remaining MC
of (1.3%) was achieved in 2 days again depicting the same behavior noted when using
sun drying where constant drying rate phase occurred faster than the falling rate.
5.8 Biomass Heater as source of heat in the dryer
The solar drier was loaded with maize grains and the solar collector covered to allow only
the biomass heater to provide required heating of air to be used for drying. The dryer test
experiments was done from 11am until 3.40pm during the months of August, September
and October.
The Average system temperatures, weight and moisture content of the sample for the
months were tabulated in table below. (Refer to Appendix A3) for sampled days for each
month)

75
Table 5.7: Back up heater experiment results Heating chamber Drying chamber Time (hrs)
Tin 0C
Tout 0C
∆T 0C
Tout 0C
Wt. of Maize, kg
Moisture Content, %
11:00:00 27.4 40.3 12.9 35.4 4.1 19.3%
11:10:00 27.7 43.8 16.1 36.8
11:20:00 27.4 42.7 15.3 35.3
11:30:00 27.4 41.5 14.1 34.3 17.6%
11:40:00 27.4 40.0 12.6 37.0
11:50:00 27.4 40.0 12.6 37.3
12:00:00 27.4 44.5 17.1 40.3 16.1%
12:10:00 27.2 45.7 18.5 41.0
12:20:00 28.1 45.9 17.8 41.4 14.6%
12:40:00 27.1 42.2 15.1 40.5
13:00:00 27.1 42.9 15.8 41.2 14.1%
13:20:00 27.0 41.8 14.8 40.6
13:40:00 26.8 41.7 14.9 40.7
14:00:00 26.9 41.8 14.9 40.8 13.7%
14:20:00 26.5 42.4 15.9 41.2
14:40:00 26.5 43.0 16.7 42.7 13.6%
15:00:00 26.3 42.7 16.4 42.4
15:20:00 26.1 42.6 16.5 42.6
15:40:00 26.0 41.7 15.7 41.6 3.85 13.3%
The Sample having initial moisture content of 19.3% was dried by biomas heater to a
final moisture content of 13.3% in 4 hours and 40 minutes during the months of August,
September and October at prevailing drying chamber temperatures of between 40ºC and
45.9 ºC.
5.9 Solar drier assisted by biomass heater
The experiment was performed by combining the solar and biomass heater to dry the
maize sample. The dryer test experiments was done from 11am until 3pm during the
months of August, September and October.

76
The Average system temperatures, weight and moisture content of the sample days in
the months were tabulated in table below. (Refer to Appendix A4) for sampled days for
each month)
Table 5.8: Solar drier assisted by biomass heater e xperiment results
Solar chamber Heater chamber Drying chamber
Time (Mins)
Tin 0C
Tout 0C
∆T 0C
Tin 0C
Tout 0C
∆T 0C
Tout 0C
Wt. of Maize, kg
MC (% )
0 27.4 31.7 4.3 31.7 43.6 11.9 36.4 4.1 19.3
10 27.7 30.7 3.0 30.7 46.8 16.1 34.8
20 27.4 31.1 3.7 31.1 46.7 15.6 35.3
30 27.4 31.3 3.9 31.3 46.5 15.2 36.3 16.3
40 27.4 32.7 5.3 32.7 48.0 15.3 40.0
50 27.4 33.0 5.6 33.0 48.0 15.0 42.3
60 27.4 31.2 3.8 31.2 48.5 17.3 45.3 14.8
70 27.2 31.4 4.2 31.4 49.7 18.3 46.0
80 28.1 29.3 1.2 29.3 46.9 17.6 45.4 14.2
100 27.1 29.0 1.9 29.0 44.2 15.2 43.5
120 27.1 29.2 2.1 29.2 44.9 15.7 44.2 13.9
140 27.0 28.0 1.0 28.0 44.8 16.8 44.6 13.8
160 26.8 27.8 1.0 27.8 44.7 16.9 44.7
180 26.9 27.9 1.0 27.9 44.8 16.9 44.7 3.87 13.7

77
The performance of the system was analyzed using the drying rate as shown in the
graph below.
Figure 5.7: Drying curve in the assisted solar dryi ng mode
The maize moisture content decreased exponentially with change in time from 19.3% to
13.7% within 3hrs at prevailing drying chamber temperatures between 43.6 ºC and 49.7
ºC.
As shown in figure 5.7 above, the moisture removal rate of 4.8% MC is high in the first
one hour and occurs at constant drying rate up to the critical moisture content of 14.5%
MC w.b. The remaining 1.2% MC was removed at falling rate phase in 2 hours. This
occurred at a much lower rate due to tightly held water in the grain requiring more
energy.
The drying rate equation, (Tonui et al, 2014) was found to be exponential with R2 = 0.85
and conforms to other drying models by various authors.

78
The table below highlights existing tested models
Table 5.9. Drying models given by various authors f or drying curves Model name
Equation Description
References
Newton thin-layer
drying
Ayensu, (1997); Togrul & Pehlivan,
(2004); Upadhyay et al., 2008
Page thin-layer
drying
Kaleemullah & Kailappan,(2006);
Saeed et al., (2006); Senadeera et
al., (2003)
Tonui Maize
drying
Tonui et al, 2014
Henderson
& Pabis
thin-layer
drying
Kashaninejad et al., (2007); Saeed
et al., (2006); Ozdemir & Devres,
(1999)
The drying rate equation obtained conforms to a drying model reported by Henderson
and Pabis.
5.10 Efficiencies
5.10.1 Solar as the only source of heat
The thermal performance of the system, ƞsyst is given by equation (3.25).
Where Qg =maCpa (Tinto drying chamber – Tambient temperature), [ma= 0.27 kg/s; Cpa = 1.006
KJ/kg.k, Tin-Tamb = 3.7K; mw = mass of evaporated water (0.27kg), LV= latent heat of
vaporization (2270 KJ/Kg), Mg = mass of the grains dried (4.1kg), CPg = specific heat
capacity of the grains ( 1676.58 KJ/Kg.k), and ∆T = change in temperature (2.43K).
Therefore the system efficiency calculated is 39.9%.
The table 5.10 shows results of comparative study of solar maize dryers by various
authors

79
Table 5.10: Comparative study of solar dryers by va rious authors
Type of Dryer Moisture Content Drying
time Temp (°C) Full load
capacity
System efficiency
(%) Reference
Initial Final Amb. Ave. Simple Maize dryer 22.5% 13% 27hrs 20 65 50kg 22%
Joshua 2008
Flat plate Absorber Collector 35% 12% 10hrs 33.5 64 450kg 21%
Bolalji BO 2005
V-groove Solar Dryer 21.1% 13% 4hrs 20 45 38kg 45%
Gatea et al 2011
Natural Convection solar dryer with fin type absorber collector 35% 12%
10hrs 33.5 64 450kg 36%
Bolalji BO 2005
The system efficiency obtained is comparable to that reported by Gatea et al (2011) in
his solar dryer tests. The difference in drying tests location may have led to the difference
in efficiency noted.
5.10.2 Biomass Heater as only source of heat
The thermal performance of the system, ƞsyst is calculated from equation (3.26).
Using temperature data recorded 4hours 40minutes of back-up heating operation, with
approximately 10kg woodfuel used with calorific value as 13.1 MJ/kg, where heat
transferred to the air given as maCpa (Tout – Tin) where ma = 0.27kg/s, Cpa=1.006 kJ/kgK
and (Tout – Tin) =15.5K, an thermal efficiency of the back-up heater was found to be 54%.
From the active solar irradiance data obtained earlier back up heater should be engaged
when the solar irradiation is low i.e. in the morning hours (0800hrs to 1000hrs) and in the
evening hours (1500hrs to 1800hrs) and supplement the solar energy with back up
heating system and speed up the drying process.
5.10.3 Solar and back-up heater as a combined sourc e of heat
The thermal performance of the system, ƞsyst is calculated from equation (3.25).
Where Qa =maCpa (Tinto drying chamber – Tambient temperature), [ma= 0.27 kg/s; Cpa = 1.006
KJ/kg.k, Tin=319.29K Tamb =300.31K); mw = mass of evaporated water (0.23kg), LV=
latent heat of vaporization (2270 KJ/Kg), mg = mass of the grains dried (4.1kg), CPg =
specific heat capacity of the grains ( 1676.58 KJ/Kg.k), and ∆T = change in temperature

80
of grain (4.6K). Therefore the system efficiency in this set up when both sources of heat
are engaged was calculated as 57.7%.
The back up heater improved efficiency of solar dryer by 17.8% when the dryer chamber
is operated at average temperature of 45 ºC (Refer to Apendix A4 fig. 8.2) for
temperature profile within the dryer chambers during drying period by solar assisted
dryer. The system efficiency obtained is comparable to a mixed mode natural solar dryer
with a biomass heater by Tarigan and Tekasul (2005) which yielded 63% during drying
tests with ground nuts.
5.11 Average drying rate
Average drying rate, Mdr, is determined from the mass of moisture removed by dryer and
drying time as given by equation (3.23):
5.11.1 Solar as only source of heat
Given that; Mass of moisture removed, Mw = 0.27kg
Overall drying time, td = 12 hours
Average drying rate = 0.023 kg/hours
5.11.2 Biomass heater as only source of heat
Given that; Mass of moisture removed, Mw = 0.28kg
Overall drying time, td = 4.67 hours
Average drying rate = 0.060kg/hours
5.11.3 Solar and Biomass heater as combined source of heat
Given that; Mass of moisture removed, Mw = 0.23kg
Overall drying time, td = 3 hours
Average drying rate = 0.077kg/hour

81
5.12 Summary of dryer system performance
The dryer efficiencies and drying rates of maize samples using various sources of heat is
summarized in the table below.
Table 5.11. Dryer system performance Source of heat Drying rate
(moisture removal rate) , kg/hr Dryer efficiency
(%) Open sun drying 0.010 N/A
Solar collector 0.023 39.9
Solar collector and Biomass heater
0.077 57.7
The back-up heating system improved the efficiency of the dryer by 17.8% and improved
drying rate by 0.054kg/hr

82
CHAPTER SIX
6.0 CONCLUSION AND RECOMMENDATION
6.1 CONCLUSION
Solar assisted dryer with collector area of 3.77m2 and drying capacity of 100kg was
designed to dry maize grains from 21% to 13% moisture content wet bulb in 6 hours per
batch under mau-summit weather conditions prevailing during the months of August to
November.
A solar dryer with collector area of 0.6m2 was fabricated and used for experimental
drying tests. A vane axial fan with capacity to deliver 0.5m3/s @ 25.4mm water gauge
static pressure; Power rating of 0.56KW and Size 300mm was designed and used to
deliver required airflow when natural circulation was low.
Solar assisted dryer system efficiency was estimated at 57.7% with average drying rate
of 0.077kg/hr with back-up heating operation increasing solar dryer efficiency by 17.8%.
In these circumstances it is evident that modern solar drying technology is faster than
the open sun drying method. The solar dryer designed for the purpose has the
advantages of reducing the damages caused to the product by insect, birds, rodents,
mirco-organisms and the adverse climatic conditions. The drying time is also reduced
considerably.
6.2 RECOMMENDATION
1) Improvements of the dryer performance can be achieved through further
modifications, which include: Re-circulation of pre-heated air exiting dryer
chamber to collector inlet
2) Further performance tests should be done on the dryer system at the current
study area as well as in different ecological zones

83
7.0 REFERENCES
ABDULLAH, M. K. and GATEA, A. A. (2011). Performance evaluation of a v-groove
solar air collector for drying maize (Zea mays) in lraq. African Journal of
Agricultural Research Vol. 6(4), pp. 817-824, 18. Available [online]
http://www.academicjournals.org/AJAR, ISSN 1991-637X.
ADU, E. A., BODUNDE, A. A., AWAGU, E. F. and OLAYEMI, F. F. (2012). Design,
Construction And Performance Evaluation Of A Solar Agricultural Drying
Tent. International Journal of Engineering Research & Technology (IJERT) Vol. 1
Issue 10, December- 2012 ISSN: 2278-0181. Ilorin, Nigeria.
AJAY, C., SUNIL, K. S. and DEEPAK, D. (2009).Design of Solar Dryer with
Turboventilator and fireplace .International Solar Food Processing Conference
2009, Suman Foundation, Shamgiri, Agra Road, Deopur, DHULE: 424005, INDIA
AKINOLA, A.O. and FAPETU, O.P. (2006). Exergetic Analysis of a Mixed-Mode Solar
Dryer . J. Engin. Appl. Sci. 1: 205-10.
ALGHOUL, M.A., SULAIMAN, M.Y., AZMI, B.Z. and WAHAB, M.A. (2005). Review of
materials for solar thermal collectors . Physics Department, University Putra
Malaysia,Serdang, MalaysiaVolume 52 · Number 4, Page 199–206.
BENA B., AND FULLER R. J. (2002), Natural convection solar dyer with biomass
back-up heater, Solar Energy, 72, 75–83.
BOUMANS G., (1985). Grain Handling and storage; Developments in Agricultural
Engineering 4, ELSEVIER Science Publishing Company INC.
ECKERT and MANFRED VAN, (1998): Mango Drying: A Tree Product Value and
Income Generating Enterprise in Rural Areas . ITFSP internal paper #19.
Nairobi, Kenya.
EL FADIL, A. (2004). Drying of Fruits and Vegetables with Solar Energ y and its Role
in Developing Countries, Renewable Energy for Sustainable
Development.Summer School 2004 – Postgraduate Programme Renewable
Energy,University of Oldenburg,Oldenburg, 27.05.200

84
EZEKOYE, B.A., AND ENEBE, O.M. (2006).Development and Performance
Evaluation of Modified Integrated Passive Solar Gra in Dryer. The Pacific
Journal of Science and Technology, Available
[Online]http://www.akamaiuniversity.us/PJST.htm, Volume 7.Number 2. Page 185-
190, Department of Physics and Astronomy, University of Nigeria, Nsukka,
Nigeria.
FAGUNWA, A. O., KOYA, O. A. and FABORODE, M.O. (2009). Development of an
Intermittent Solar Dryer for Cocoa Beans .Agricultural Engineering International:
the CIGR E-journal. Manuscript number 1292. Volume XI, Ile-Ife Nigeria
FORSON, F.K., NAZHA, M.A.A., AKUFFO, F.O. AND RAJAKARUNA H. (2007):
Design of mixed-mode natural convection solar crop dryers: Application of
principles and rules of thumb : Renewable energy journal (32). Pages 1-14.
Available [Online] www. Sciencedirect.com. Elsevier Ltd.
GRAIN SYSTEM INTERNATIONAL GROUP (GSI), (1998): Division of the Gsi group
1004 E. Illinois st. Assumptions, IL 62510. Pg 13.
HELLER V. 2012: Fluid Mechanics Section, Department of Civil and En vironmental
Engineering ; 4th CoastLab Teaching School, Wave and Tidal Energy, Porto, 17-
20th January 2012.pg 1 -29.
YU, H. LI-JOHN J., HUEI T.O, HUANG-MIN L., CHUNG-MIN L., (2006): Similitude
criteria for two-dimensional wall jet in an isother mal mechanically ventilated
enclosure : Biosystems engineering journal 93 (4). Pages 1-11. Available [Online]
www. Sciencedirect.com. Elsevier Ltd.
YU, H. S.J. HOLF (1999): Air flow pattern similarity criteria for ceiling sl ot-
ventilated agricultural enclosures under isothermal conditions :
American society of agricultural engineers journal paper. No. J-16997. pages 1-
10. Vol. 42(2): Iowa University
IFPRI. (2010). Aflatoxins in kenya: an overview. Afla control project note 1, july 2010.
Available online on: http://programs.ifpri.org/afla/afla.asp
ITODO, I.N, OBETTA, S.E, AND SATIMEHIN, A.A. (2002). Evaluation of a solar crop
dryer for rural applications in Nigeria. Botswana J ournal of Technology .
11(2): 58-62

85
JINDAL, V. K. AND GUNASEKARAN, S. (1982). Estimating air flow and drying rate
due to natural convection in solar rice dryers. Renewable energy review, 4(2):
1-9.
JOSHUA, F. (2008). Design, Construction and Testing of Simple Solar Ma ize
Dryer .Federal University of Technology, Leonardo Electronic Journal of Practices
and Technologies ISSN 1583-1078 Issue 13, July-December 2008 p. 122-
130.Minna, Niger State, Nigeria
KANG'ETHE E. (2011). Situation analysis: improving food safety in the ma ize value
chain in kenya. Report prepared for FAO; College of Agriculture and Veterinary
Science University of Nairobi
KORIR, K. AND BII, C. C (2012). Mycological Quality of Maize Flour from Aflatoxins “Hot”
Zone Eastern Province – Kenya. African Journal of Health Sciences, Volume 21,
Number 3-4 April-June 2012.Page 143-146. Available [Online];
http://www.ajhsjournal.or.ke/admin/current/article6.pdf. KEMRI, Nairobi, Kenya
KUDAL, H. N., PANGAVHANE, D. R. and PARISHWAD, G. V. (2009). Study of
Photovoltaic Powered Forced Circulation Solar Tunne l Bagasse Dryer.
International Journal of Engineering Studies ISSN 0975- 6469 Volume 1, Number
4, Pages. 279–293.Available [online] http://www.ripublication.com/ijes.htm.Pune,
India.
LEON A.M., KUMAR S. AND BHATTACHARYA S.C. (2002). A comprehensive
procedure for performance evaluation of solar food dryers, Renewable and
Sustainable Energy Reviews, 6, 367–393.
MADHLOPA, A. and NGWALO, G. (2007). Solar dryer with thermal storage and
biomass backup heater. Solar Energy , ,Volume, 81 (4). Page 449-462. ISSN
0038-092X. Malawi Polytechnic, Private bag 303, Blantyre 3, Malawi
MATTHEW, G. G. and DISHNA, S. (2001). Solar Drying Equipment, Notes on Three
Drier .GATE Technical Information E14, GTZ-GATE.Eschborn, Germany.
Available [online] on http://www.gtz.de/gate/.
MERIDIAN INSTITUTE, (2009): Science and innovation for African agricultural value
chains.

86
ONIGBOGI I.O, SOBOWALE S.S and EZEKOMA O.S (2012). Design, Construction
And Evaluation Of A Small Scale Solar Dryer. Journal of Engineering and
Applied Science Vol. 4, June- 2012 Moshood Abiola Polytechnic Abeokuta, Ogun
State, Nigeria.
SODHA, M. S., BANSAL, N. K., KUMAR, A., BANSAL, P. K. AND MALIK, M. A. (1987).
Solar crop drying. Vol. I and II. CPR press, Boca Raton, Florida, USA.
TARIGAN, E. AND TEKASAKUL, P. (2005). A Mixed-Mode Natural Convection Solar
Dryer with Biomass Burner and Heat Storage Back-up Heater. ANZSES 2005.
Thailand.
TOGRUL, T., and PEHLIVAN, D. (2004). Modeling of thin layer drying kinetics of
some fruits under open-air sun drying process . J. Food Engineering 65: Pages
413-425
VILLARUEL, ROSE. 1996: A Solar Dryer for Coconuts Costs Less Than Fifteen
Dollars . GATE #2/1996. Pg. 30.
WAEWSAK, J. CHINDARUKSA, S. AND PUNLEK, C. (2006). A mathematical
modeling study of hot air drying for some agricultu ral products . Thammasat
International Journal of Science and Technology, 11(1): 14-20
WORLD BANK (2003): Sustainable development in a dynamic world, World
Development Report, Washington, D.C.: World Bank

87
8.0 PUBLICATIONS
1. Tonui K.S, Mutai E.B.K and Mutuli D.A (2014). Performance Evaluation of Solar Grain Dryer with a Back-Up Heater. 21st IEK international conference held at the Leisure Lodge, Diani, South Coast, Kwale County from 7th to 9th May 2014.
2. Tonui K. S., E.B.K.Mutai, D.A.Mutuli, D.O. Mbuge an d K.V.Too(2014). Design and Evaluation of Solar Grain Dryer with a Back-upHeater. Research Journal of AppliedSciences, Engineering and Technology7(15):3036-3043, 2014ISSN:2040-7459; e-ISSN: 2040-7467

88
9.0 APPENDICES

89
Appendix A0: Sun drying experiment results for the month August, September and October, 2012
The formula for calculating moisture content on the basis weight loss measurements during the sun drying is:-
W=( )*100
W - Moisture content in %
m1 - mass of test sample before drying
m2 - mass of test sample after drying

90
Month of August 2012
Date Time Wt. of Maize, kg
Total Weight Loss, Kg
Moisture Content, %
Ambient Air
Temperature, ºc Avg. Relative Humidity, %
18-Aug-12
11:00 4.1 19.30 27.30 68
15:00 3.98 0.97 2.93 0.12 16.37 26.50 72
19-Aug-12
11:00 3.99 0.97 2.68 0.11 16.62 28.00 67
15:00 3.94 0.96 3.90 0.16 15.40 27.00 67.5
20-Aug-12
11:00 3.94 0.96 3.90 0.16 15.40 27.50 68
15:00 3.91 0.95 4.63 0.19 14.67 26.20 70
21-Aug-12
9:00 3.92 0.96 4.39 0.18 14.91 25.00 73
15:00 3.88 0.95 5.37 0.22 13.93 26.00 72
22-Aug-12
11:00 3.88 0.95 5.37 0.22 13.93 27.10 68
15:00 3.86 0.94 5.85 0.24 13.45 26.70 71.5
23-Aug-12
10:00 3.87 0.94 5.61 0.23 13.69 27.20 68.1
15:00 3.85 0.94 6.10 0.25 13.20 26.80 71.5

91
Month of September 2012
Date Time Wt. of Maize, kg
Total Weight Loss, Kg
Moisture Content, %
Ambient Air
Temperature, ºc Avg. Relative Humidity, %
19-Sep-12
11:00 4.1 19.30 27.00 68.00
15:00 3.97 0.97 3.17 0.13 16.13 26.80 72.00
20-Sep-12
11:00 3.98 0.97 2.93 0.12 16.37 27.80 67.00
15:00 3.95 0.96 3.66 0.15 15.64 26.90 71.00
21-Sep-12
11:00 3.95 0.96 3.66 0.15 15.64 27.40 72.60
15:00 3.91 0.95 4.63 0.19 14.67 26.10 71.00
22-Sep-12
11:00 3.91 0.95 4.63 0.19 14.67 26.50 65.00
15:00 3.87 0.94 5.61 0.23 13.69 27.10 68.00
23-Sep-12
11:00 3.88 0.95 5.37 0.22 13.93 26.20 70.00
15:00 3.86 0.94 5.85 0.24 13.45 26.70 71.50

92
Month of October 2012
Date Time Wt. of
Maize, kg
Total Weight Loss, Kg
Moisture Content, %
Ambient Air
Temperature, ºc Avg. Relative Humidity, % 8-Oct-12
11:00 4.1 19.30 27.10 69.00
15:00 3.97 0.97 3.17 0.13 16.13 26.80 71.00
9-Oct-12 11:00 3.97 0.97 3.17 0.13 16.13 27.80
67.00
15:00 3.95 0.96 3.66 0.15 15.64 26.50 72.00
10-Oct-12 11:00 3.96 0.97 3.41 0.14 15.89 27.20
68.00
15:00 3.93 0.96 4.15 0.17 15.15 26.20 73.00
11-Oct-12 11:00 3.93 0.96 4.15 0.17 15.15 26.80
71.00
15:00 3.91 0.95 4.63 0.19 14.67 26.00 73.00
12-Oct-12 11:00 3.91 0.95 4.63 0.19 14.67 27.10
68.50
15:00 3.88 0.95 5.37 0.22 13.93 26.50 72.00
13-Oct-12 11:00 3.89 0.95 5.12 0.21 14.18 26.90
71.20
15:00 3.87 0.94 5.61 0.23 13.69 26.60 71.80
14-Oct-12 11:00 3.87 0.94 5.61 0.23 13.69 27.20
70.00
4.1kg of maize grains sample having initial moisture content of 19.3% was dried by sun drying to a final moisture content of 13.4% in 6
days of 4 hours each during sampled days in the months of August, September and October.

93
Appendix A1: Solar irradiance and ambient temperatu res
Date: 18/8/2012
Time (24Hrs)
solar Irradiance in W/M 2 (watts per sq.m) Ambient temperature
0C
1105 1025 27.3
1205 1035 27.6
1305 1015 27.4
1418 975 27.0
1538 718 26.5
Date: 19/9/2012
Time (24Hrs)
solar Irradiance in W/M 2(watts per sq.m) Ambient temperature
0C
1100 1020 27.3
1207 1028 27.4
1308 1035 27.4
1456 1004 27.2
1547 890 26.8
Date: 08/10/2012
Time (24Hrs)
solar Irradiance in W/M 2 (watts per sq.m) Ambient temperature
0C
1000 975 26.0
1100 1005 26.6
1200 1015 27.2
1300 1035 27.6
1400 1020 27.5

94
Date: 10/10/2012
Time (24Hrs)
solar Irradiance in W/M 2(watts per sq.m) Ambient temperature
0C
1100 1020 27.0
1205 1025 27.3
1305 1030 27.4
1405 1004 27.2
1545 855 26.5

95
Appendix A1.1: Average Values of Solar Irradiances and ambient temperatures
Time (24Hrs) solar Irradiance in W/M 2(watts per
sq.m)
Ambient temperature
0C
1100 1023 27.3
1205 1030 27.4
1305 1020 27.4
1405 980 27.2
1545 780 26.8
Figure 8.1 Agraph showing variation of average solar radiation with time of the day during the experiment
period.

96
Appendix A2: Solar Drier
Drying the maize grains using solar dryer
DAY ONE Avg. Amb. Temp. 27.4° C Air Flow Vel. 15.5m/s
Solar chamber Drying chamber Tin Tout ∆T T
Time, Hrs
0C 0C 0C 0C Wt. of Maize,kg
Moisture Content, %
11:00 27.4 31.7 4.3 30.4 4.100 19.3% 11:10 27.7 30.7 3 29.8 11:20 27.4 31.1 3.7 29.3 11:30 27.4 31.3 3.9 30.3 11:40 27.4 31.7 4.3 30.3 11:50 27.4 31.3 3.9 30.8 12:00 27.4 31.2 3.8 30.7 12:10 27.2 31.4 4.2 30.4 12:20 27.1 29.3 2.2 28.8 12:40 27.1 29 1.9 28.4 13:00 27.1 29.2 2.1 28.1 13:20 27.1 29.1 2 28.5 13:40 27 29.2 2.2 28.8 14:00 26.9 28.7 1.8 28.5 14:20 26.9 28.1 1.1 28 14:40 26.7 28 1.3 27.8 15:00 26.5 28 1.5 28 3.92 14.9%
Initial moisture content = 19.3%; Final Moisture Content =14.9%
Initial weight of grains = 4.1kg; Final Weight of grains = 3.92kg

97
DAY TWO
Avg. Amb. Temp. 28.1° C
Air Flow Vel. 15.5m/s
Solar chamber Drying
chamber
Time, Hrs Tin Tout ∆T T
0C 0C 0C 0C
Wt. of
Maize,kg
Moisture
Content,
%
11:00:00 28 32.7 4.7 30.4 3.92 14.9%
11:10:00 27.9 32.8 4.9 29.8
11:20:00 28.3 32.8 4.5 31.3
11:30:00 28.2 33.1 4.9 31.7
11:40:00 28.2 33 4.8 31.8
11:50:00 28.2 33.1 4.9 31.7
12:00:00 28.2 33.2 5 31.7
12:10:00 28.2 33 4.8 31.4
12:20:00 28.1 33.1 5 31.7
12:40:00 28.1 33 4.9 31.9
13:00:00 28.1 32.8 4.7 31.1
13:20:00 28 31.2 3.2 30
13:40:00 27.8 30.8 3 29.5
14:00:00 27.8 30.3 2.5 29.4
14:20:00 27.3 29.3 2 28.7
14:40:00 26.8 28.1 1.3 28
15:00:00 26.1 27.4 1.3 27.3 3.87 13.7%
Initial moisture content = 14.9%; Final Moisture Content =13.7%
Initial weight of grains = 3.92kg; Final Weight of grains = 3.87kg

98
DAY
THREE
Avg. Amb. Temp. 28.0° C
Air Flow Vel. 15.5m/s
Solar chamber Drying
chamber
Time, Hrs Tin Tout ∆T T
0C 0C 0C 0C
Wt. of
Maize,kg
Moisture
Content,
%
11:00:00 27.6 31.3 3.7 30.2 3.87 13.7%
11:10:00 27.9 31.7 3.8 30.6
11:20:00 28 32.4 4.4 31.3
11:30:00 28.1 32.6 4.5 31.2
11:40:00 28 32.6 4.6 31.4
11:50:00 28 32.4 4.4 31.2
12:00:00 28 32.5 4.5 31.7
12:10:00 28 32.6 4.6 31.4
12:20:00 28.1 32.8 4.7 31.8
12:40:00 28.1 32.9 4.8 31.9
13:00:00 28.1 32.8 4.7 32.1
13:20:00 28 32.7 4.7 32
13:40:00 27.6 32 4.4 31.2
14:00:00 27.6 31.7 4.1 31
14:20:00 27.5 31.6 4.1 31
14:40:00 27.3 31 3.7 30.5
15:00:00 27 30.7 3.7 30.1 3.83 13.2%
Initial moisture content = 13.7%; Final Moisture Content =13.2%
Initial weight of grains = 3.87kg; Final Weight of grains = 3.83kg

99
Drying the maize grains using solar dryer in the mo nth of August 2012
DAY ONE
DATE 18-Aug-12
Avg. Ambient Temp. 26.9° C
Air Flow Velocity 15.5m/s
Solar chamber Drying
chamber
Time, hrs Tin (0C) Tout
(0C) ∆T (0C) T (0C) Wt. of
Maize,kg
Moisture
Content, %
11:00 27.8 32.1 4.3 30.8 4.10 19.3%
11:10 28.1 30.9 2.8 30
11:20 27.6 32 4.4 30.2
11:30 27.5 31.4 3.9 30.4
11:40 27.5 32 4.5 30.6
11:50 27.4 31.3 3.9 30.8
12:00 27.5 31.4 3.9 30.9
12:10 27.7 31.2 3.5 30
12:20 27.4 29.5 2.1 29
12:40 27.3 29.2 1.9 28.6
13:00 27.4 29.5 2.1 28
13:20 27.3 29.3 2 28.7
13:40 27.2 29.6 2.4 29.2
14:00 27.1 28.9 1.8 28.6
14:20 27 28.2 1.2 27.8
14:40 26.6 28 1.4 27.8
15:00 26.3 28.1 1.8 27.4 3.93 15.0%
Initial moisture content = 19.3%; Final Moisture Content =15.0%
Initial weight of grains = 4.1kg; Final Weight of grains = 3.93kg

100
DAY TWO
DATE 19-Aug-12
Avg. Ambient Temp. 27.0° C
Air Flow Velocity 15.5m/s
Solar chamber Drying
chamber
Time, hrs
Tin (0C)
Tout (0C)
∆T (0C)
T (0C)
Wt. of
Maize,
kg
Moisture
Content,
%
11:00:00 28.4 33.5 5.1 30.5 3.93 15.0%
11:10:00 28.3 33.5 5.2 29.9
11:20:00 28.6 33.2 4.6 31.4
11:30:00 28.3 33.3 5 31.9
11:40:00 28.4 33.8 5.4 32
11:50:00 28.5 34.1 5.6 31.7
12:00:00 28.6 33.9 5.3 31.7
12:10:00 28.7 32.8 4.1 31.5
12:20:00 28.2 33 4.8 31.9
12:40:00 28.2 33.1 4.9 32.2
13:00:00 28.3 32.9 4.6 31.1
13:20:00 28.1 31.3 3.2 29.5
13:40:00 27.9 30.9 3 29.4
14:00:00 28 30.4 2.4 29.4
14:20:00 27.3 29.1 1.8 28.8
14:40:00 26.8 28 1.2 28
15:00:00 25.8 27.1 1.3 27.4 3.86 13.6%
Initial moisture content = 15.0%; Final Moisture Content =13.6%
Initial weight of grains = 3.93kg; Final Weight of grains = 3.86kg

101
DAY THREE
DATE 20-Aug-12
Avg. Ambient Temp. 27.3° C
Air Flow Velocity 15.5m/s
Solar chamber Drying
chamber
Time, hrs
Tin (0C)
Tout (0C)
∆T (0C)
T (0C)
Wt. of
Maize,
kg
Moisture
Content,
%
11:00:00 27.8 31.5 3.7 30.4 3.86 13.6%
11:10:00 28.1 32 3.9 31.1
11:20:00 28 32.5 4.5 31.5
11:30:00 28.2 33.9 5.7 31.4
11:40:00 27.9 32.8 4.9 32
11:50:00 28 31.4 3.4 31.5
12:00:00 28.1 31.9 3.8 32.1
12:10:00 28.2 32.8 4.6 31.6
12:20:00 28.3 33.2 4.9 32.2
12:40:00 28.1 32.9 4.8 32.3
13:00:00 27.9 33.1 5.2 32.3
13:20:00 28.2 32.7 4.5 32
13:40:00 27.8 31.8 4 31.4
14:00:00 27.8 31.9 4.1 31.1
14:20:00 27.5 31.9 4.4 31.1
14:40:00 27.1 31 3.9 30.4
15:00:00 27.4 31 3.6 30.6 3.83 12.9%
Initial moisture content = 13.6%; Final Moisture Content =12.9%
Initial weight of grains = 3.93kg; Final Weight of grains = 3.83kg

102
Drying the maize grains using solar dryer in the mo nth of September 2012
DAY ONE
DATE 19-Sep-12
Avg. Ambient Temp. 26.7° C
Air Flow Velocity 15.5m/s
Solar chamber Drying
chamber
Time, hrs
Tin (0C)
Tout (0C)
∆T (0C)
T (0C)
Wt. of
Maize, kg
Moisture
Content,
%
11:00 27.1 31.4 4.3 30.1 4.100 19.3%
11:10 27.4 30.6 3.2 29.7
11:20 27.3 30.8 3.5 29
11:30 27.4 31.4 4 30.4
11:40 27.4 31.6 4.2 30.2
11:50 27.4 31.4 4 30.9
12:00 27.3 31 3.7 30.5
12:10 26.9 31.8 4.9 30.8
12:20 27 29.4 2.4 28.9
12:40 27.1 29 1.9 28.4
13:00 27 29.3 2.3 28.2
13:20 27.1 29.2 2.1 28.6
13:40 27 29.2 2.2 28.8
14:00 26.8 28.6 1.8 28
14:20 26.9 28.2 1.3 27.8
14:40 26.8 28.1 1.3 26.5
15:00 26.7 28 1.3 26.3 3.910 14.7%

103
DAY TWO
DATE 20-Sep-12
Avg. Amb. Temp. 27.4° C
Air Flow Velocity 15.5m/s
Solar chamber Drying
chamber
Time, hrs
Tin (0C)
Tout (0C)
∆T (0C)
T (0C)
Wt. of
Maize,kg
Moisture
Content,
%
11:00:00 27.7 32.4 4.7 30.3 3.91 14.7%
11:10:00 27.6 32.7 5.1 29.7
11:20:00 28.2 32.5 4.3 31.2
11:30:00 28.2 33.2 5 31.5
11:40:00 28.2 32.9 4.7 31.6
11:50:00 28.2 33.2 5 31.7
12:00:00 28.1 33 4.9 31.7
12:10:00 27.9 33.4 5.5 31.3
12:20:00 28 33.2 5.2 31.5
12:40:00 28.1 33 4.9 31.6
13:00:00 28 32.9 4.9 31.1
13:20:00 28 31.3 3.3 30.5
13:40:00 27.8 30.8 3 29.6
14:00:00 27.7 30.2 2.5 29.4
14:20:00 27.3 29.4 2.1 28.6
14:40:00 26.9 28.2 1.3 28
15:00:00 26.3 27.4 1.1 27.2 3.87 13.8%

104
DAY THREE
DATE 21-Sep-12
Avg. Amb. Temp. 26.8° C
Air Flow Velocity 15.5m/s
Solar chamber
Drying
chamber
Time, hrs
Tin (0C)
Tout (0C)
∆T (0C)
T (0C)
Wt. of
Maize,kg
Moisture
Content,
%
11:00:00 27.5 31.2 3.7 30.1 3.87 13.8%
11:10:00 27.8 31.5 3.7 30.2
11:20:00 28.1 32.4 4.3 31.2
11:30:00 28.1 31.5 3.4 31
11:40:00 28.2 32.4 4.2 31.2
11:50:00 28 33.4 5.4 30.9
12:00:00 27.9 33.2 5.3 31.5
12:10:00 27.9 32.4 4.5 31.2
12:20:00 28 32.6 4.6 31.6
12:40:00 28.1 32.9 4.8 31.5
13:00:00 28.2 32.7 4.5 32
13:20:00 28 32.7 4.7 32
13:40:00 27.5 32.1 4.6 31
14:00:00 27.4 31.5 4.1 30.8
14:20:00 27.5 31.4 3.9 30.8
14:40:00 27.4 31 3.6 30.6
15:00:00 26.8 30.5 3.7 29.9 3.840 13.1%

105
Drying the maize grains using solar dryer in the mo nth of October 2012
DAY ONE
DATE 8-Oct-12
Avg. Ambient Temp. 27.0 0C
Air Flow Velocity 15.5m/s
Solar chamber Drying
chamber
Time, hrs
Tin (0C)
Tout (0C)
∆T (0C)
T (0C)
Wt. of
Maize,kg
Moisture
Content,
%
11:00 27.3 31.6 4.3 30.3 4.100 19.3%
11:10 27.6 30.6 3.0 29.7
11:20 27.3 30.5 3.2 28.7
11:30 27.3 31.1 3.8 30.1
11:40 27.3 31.5 4.2 30.1
11:50 27.4 31.2 3.8 30.7
12:00 27.4 31.2 3.8 30.7
12:10 27 31.2 4.2 30.4
12:20 26.9 29.0 2.1 28.5
12:40 26.9 28.8 1.9 28.2
13:00 26.9 28.8 1.9 28.1
13:20 26.9 28.8 1.9 28.2
13:40 26.8 28.8 2.0 28.4
14:00 26.8 28.6 1.8 28.2
14:20 26.8 27.9 1.1 27.3
14:40 26.7 27.9 1.2 27.4
15:00 26.5 27.9 1.4 27.4 3.928 15.10%

106
DAY TWO
DATE 9-Oct-12
Avg. Amb. Temperature 27.2 0C
Air Flow Velocity 15.5m/s
Solar chamber Drying
chamber
Time, hrs
Tin (0C)
Tout (0C)
∆T (0C)
T (0C)
Wt. of
Maize,kg
Moisture
Content,
%
11:00:00 27.9 32.2 4.3 30.4 3.928 15.1%
11:10:00 27.8 32.2 4.4 29.8
11:20:00 28.1 32.7 4.6 31.3
11:30:00 28.1 32.8 4.7 31.7
11:40:00 28.0 32.3 4.3 31.8
11:50:00 27.9 32.0 4.1 31.7
12:00:00 27.9 32.7 4.8 31.7
12:10:00 28.0 32.8 4.8 31.4
12:20:00 28.1 33.1 5.0 31.7
12:40:00 28.0 32.9 4.9 31.9
13:00:00 28.0 32.6 4.6 31.1
13:20:00 27.9 31.0 3.1 30.0
13:40:00 27.7 30.7 3.0 29.5
14:00:00 27.7 30.3 2.6 29.4
14:20:00 27.3 29.4 2.1 28.7
14:40:00 26.7 28.1 1.4 28.0
15:00:00 26.2 27.7 1.5 27.3 3.870 13.70%

107
DAY THREE
DATE 10-Oct-12
Avg. Ambient Temp. 26.7 0C
Air Flow Velocity 15.5m/s
Solar chamber Drying
chamber
Time, hrs
Tin (0C)
Tout (0C)
∆T (0C)
T (0C)
Wt. of
Maize,kg
Moisture
Content,
%
11:00:00 27.5 31.2 3.7 30.1 3.870 13.7%
11:10:00 27.8 31.6 3.8 30.5
11:20:00 27.9 32.3 4.4 31.2
11:30:00 28.0 32.4 4.4 31.2
11:40:00 27.9 32.6 4.7 31.0
11:50:00 28.0 32.4 4.4 31.2
12:00:00 28.0 32.4 4.4 31.5
12:10:00 27.9 32.6 4.7 31.4
12:20:00 28.0 32.6 4.6 31.6
12:40:00 28.1 32.9 4.8 31.9
13:00:00 28.2 32.6 4.4 32.0
13:20:00 27.8 32.7 4.9 32.0
13:40:00 27.5 32.1 4.6 31.2
14:00:00 27.6 31.7 4.1 31.1
14:20:00 27.5 31.5 4.0 31.1
14:40:00 27.4 31.0 3.6 30.5
15:00:00 26.8 30.6 3.8 29.8 3.835 12.8%

108
Appendix A3: Biomass Heater as source of heat in th e dryer
DATE 21-Aug-12
Avg. Ambient Temp. 25.5° C
Air Flow Velocity 15.5m/s
Heater Chamber Drying
chamber
Time, Hrs Tin Tout ∆T T 0C 0C 0C 0C
Wt. of Maize, kg
Moisture Content, %
11:00:00 26.0 40.2 14.2 35.2 4.1 19.3%
11:10:00 27.3 43.5 16.2 36.4
11:20:00 27.4 42.7 15.3 35.2
11:30:00 27.5 41.0 13.5 34.3
11:40:00 27.4 39.5 12.1 36.8
11:50:00 27.4 40.4 13.0 37.3
12:00:00 27.1 44.3 17.2 40.1
12:10:00 27.2 45.5 18.3 41.0
12:20:00 28.2 46.0 17.8 41.3
12:40:00 27.0 42.4 15.4 40.5
13:00:00 27.1 45.0 17.9 41.6
13:20:00 27.1 43.0 15.9 40.6
13:40:00 26.8 41.8 15.0 40.7
14:00:00 26.5 41.8 15.3 40.8
14:20:00 26.5 42.3 15.8 41.2
14:40:00 26.3 42.9 16.6 42.7
15:00:00 26.3 42.6 16.3 42.4
15:20:00 26.1 42.6 16.5 42.4
15:40:00 26.0 41.6 15.6 41.5 3.86 13.5%

109
Appendix A3: Biomass Heater as source of heat in th e dryer
DATE 22-Sep-12
Avg. Ambient Temp. 26.8° C
Air Flow Velocity 15.5m/s
Heater Chamber Drying
chamber
Time, Hrs Tin Tout ∆T T
0C 0C 0C 0C Wt. of Maize, kg
Moisture Content, %
11:00:00 27.3 40.1 12.8 35.3 4.1 19.3%
11:10:00 27.6 43.5 15.9 36.7
11:20:00 27.3 42.6 15.3 35.3
11:30:00 27.2 41.4 14.2 34.3
11:40:00 27.4 40.0 12.6 37.0
11:50:00 27.4 40.0 12.6 37.2
12:00:00 27.3 44.2 16.9 40.3
12:10:00 27.2 45.6 18.4 41.1
12:20:00 28.0 45.8 17.8 41.4
12:40:00 27.1 42.2 15.1 40.4
13:00:00 27.0 42.8 15.8 41.2
13:20:00 26.9 41.8 14.9 40.6
13:40:00 26.7 41.6 14.9 40.7
14:00:00 26.9 41.8 14.9 40.7
14:20:00 26.4 42.3 15.9 41.1
14:40:00 26.5 43.0 16.5 42.7
15:00:00 26.2 42.7 16.5 42.4
15:20:00 26.1 42.5 16.4 42.4
15:40:00 25.9 41.7 15.8 41.6 3.84 13.0%

110
Appendix A3: Biomass Heater as source of heat in th e dryer
DATE 11-Oct-12
Avg. Ambient Temp. 26.5° C
Air Flow Velocity 15.5m/s
Heater Chamber Drying chamber
Time, Hrs Tin Tout ∆T T
0C 0C 0C 0C
Wt. of Maize, kg
Moisture Content, %
11:00:00 28.9 40.6 11.7 35.7 4.1 19.3%
11:10:00 28.2 44.4 16.2 37.3
11:20:00 27.5 42.8 15.3 35.4
11:30:00 27.5 42.1 14.6 34.3
11:40:00 27.4 40.5 13.1 37.2
11:50:00 27.4 39.6 12.2 37.4
12:00:00 27.8 45.0 17.2 40.5
12:10:00 27.2 46.0 18.8 40.9
12:20:00 28.1 45.9 17.8 41.5
12:40:00 27.2 42.0 14.8 40.6
13:00:00 27.2 40.9 13.7 40.8
13:20:00 27.0 40.6 13.6 40.6
13:40:00 26.9 41.7 14.8 40.7
14:00:00 27.3 41.8 14.5 40.9
14:20:00 26.6 42.6 16.0 41.3
14:40:00 26.7 43.1 16.4 42.7
15:00:00 26.4 42.8 16.4 42.4
15:20:00 26.1 42.7 16.6 43.0
15:40:00 26.1 41.8 15.7 41.7 3.85 13.2%

111
Appendix A4: Solar drier assisted by biomass heater (Both sources of heat engaged)
DATE 22-Aug-12
Avg. Amb. Temp. 27
Air Flow Vel. 15.5m/s ; Avg. RH 70%
Solar chamber Heater chamber Drying chamber
Time T in Tout ∆T Tin Tout ∆T Tout Wt. of Maize,kg
Moisture
(Mins) 0C 0C 0C 0C 0C 0C 0C (% )
12:00:00 27.00 28.50 1.50 28.5 48.4 19.9 33 4.1 19.3
12:10:00 27.17 28.50 1.33 28.5 47.1 18.6 34.2
12:20:00 27.07 30.10 3.03 30.1 46.2 16.1 36.5
12:30:00 27.00 30.10 3.10 30.1 47.1 17 45.3 16.3
12:40:00 26.93 30.40 3.47 30.4 47.7 17.3 44.8
12:50:00 26.97 30.30 3.33 30.3 49.2 18.9 47.5
13:00:00 27.07 30.20 3.13 30.2 48.0 17.8 46.6 14.7
13:10:00 27.20 30.10 2.90 30.1 45.0 14.9 44.4
13:20:00 26.97 28.30 1.33 28.3 42.0 13.7 39.4 14.1
13:40:00 26.87 28.00 1.13 28 44.6 16.6 43.9
14:00:00 26.87 28.20 1.33 28.2 44.5 16.3 44.3 13.8
14:20:00 26.87 28.10 1.23 28.1 44.6 16.5 44.2 13.7
14:40:00 26.63 28.20 1.57 28.2 44.6 16.4 44 13.6
15:00:00 26.63 27.20 0.57 27.9 44.3 16.4 43.5 3.87 13.3

112
Appendix A4: Solar drier assisted by biomass heater (Both sources of heat engaged)
DATE 25-Sep-12 Avg. Ambient Temp. 26.50C
Air Flow Velocity 15.5m/s
Avg. RH 69%
Solar chamber Heater chamber Drying chamber
Time, hrs Tin(0C) Tout (0C)
∆T (0C)
Tin (0C)
Tout 0C)
∆T (0C)
Tout (0C) Wt. of Maize, kg
Moisture (%)
12:00:00 27.2 31.5 4.3 31.5 43.4 11.9 36.2 4.1 19.3
12:10:00 27.5 30.5 3 30.5 46.6 16.1 34.7
12:20:00 27.2 31.3 4.1 31.3 46.6 15.3 35.3
12:30:00 27.4 31.4 4 31.4 46.5 15.1 36
12:40:00 27.4 32.7 5.3 32.7 46.8 14.1 41
12:50:00 27.5 33.2 5.7 33.2 48.5 15.3 42.1
13:00:00 27.4 31.2 3.8 31.2 49 17.8 45.2
13:10:00 27.1 31.5 4.4 31.5 49.6 18.1 46
13:20:00 27.8 29.3 1.5 29.3 47 17.7 45.2
13:40:00 27.1 29.1 2 29.1 44.2 15.1 42.5
14:00:00 27 29.2 2.2 29.2 44.7 15.5 44.2
14:20:00 27 28 1 28 44.8 16.8 44.5
14:40:00 26.7 27.9 1.2 27.9 44.7 16.8 44.6
15:00:00 26.7 28 1.3 28 44.7 16.7 44.6 3.88 13.8

113
Appendix A4: Solar drier assisted by biomass heater (Both sources of heat engaged)
DATE 14-Oct-12
Air Flow Vel. 1 5.5m/s
Avg. RH . …70%
Solar chamber Heater chamber Drying chamber
Time, hrs T in
(0C)
Tout
(0C)
∆T
(0C)
Tin
(0C)
Tout
(0C)
∆T
(0C)
Tout (0C) Wt. of
Maize,
kg
Moisture
(%)
12:00:00 27.6 31.9 4.3 31.9 43.8 11.9 36.6 4.1 19.3
12:10:00 27.9 30.9 3 30.9 47 16.1 34.9
12:20:00 27.6 30.9 3.3 30.9 46.8 15.9 35.3
12:30:00 27.4 31.2 3.8 31.2 46.5 15.3 36.6
12:40:00 27.4 32.7 5.3 32.7 49.2 16.5 39
12:50:00 27.3 32.8 5.5 32.8 47.5 14.7 42.5
13:00:00 27.4 31.2 3.8 31.2 48 16.8 45.4
13:10:00 27.3 31.3 4 31.3 49.8 18.5 46
13:20:00 28.4 29.3 0.9 29.3 46.8 17.5 45.6
13:40:00 27.1 28.9 1.8 28.9 44.2 15.3 44.5
14:00:00 27.2 29.2 2 29.2 45.1 15.9 44.2
14:20:00 27 28 1 28 44.8 16.8 44.7
14:40:00 26.9 27.7 0.8 27.7 44.7 17 44.8
15:00:00 27.1 27.8 0.7 27.9 44.9 17 44.8 3.87 13.6

114
Figure 8.2: A graph of variations in ambient temperature, Solar collector outlet temperature and biomass
heater outlet temperature with time in a day for a typical experimental run during solar assisted drying of
maize.

115
Appendix A5.1: The static pressure chart for maize grain

116
Appendix A5.2: Reported aflatoxin poisoning cases i n Kenya (1960-2010)
(Source: Erastus, 2011)

117
Appendix A5.3: Fan performance specifications

118
Appendix A5.4: Meteorological data

119
Station_ID: 9036261
Station_Name: NAKURU METEOROLOGICAL STATION - NEW
Element_Name Temperature, Maximum and Minimum, (Deg.C) Month >>>>
YEAR 1 2 3 4 5 6 7 8 9 10 11 12
2007 Max 25.8 26.6 27.6 25.9 25 23.4 23.1 23.6 24.7 24.7 24.6 26.1 min 12.1 12.2 11.1 12.7 13.2 13.3 12.4 12.1 11.8 10.4 11.3 10.5
2008 Max 27.1 28.4 27.8 25.5 25.7 25.4 24.4 24.7 25.5 24.5 25 26.5 min 11.2 11.8 12.5 13.2 13 11.7 12 12.7 12.4 13.4 12.3 12.8
2009 Max 27.5 29 30.1 27 25.7 26.3 26.1 26.9 28 25.8 25.8 25.7 min 11.2 11.8 12.5 13.2 13 11.7 12 12.7 12.4 13.4 12.3 12.8
2010 Max 26.3 27.3 25.8 25.5 24.8 24.4 24 24.2 24.9 25 24.8 26.9 min 12.2 13.6 13.4 13.8 13.8 12.9 12.7 12.8 12.1 12.8 11.5 11.2
Element_Name Relative humidity at 06Z and 12Z in (%) Month >>>>
YEAR 1 2 3 4 5 6 7 8 9 10 11 12
2007 06z 75 76 73 79 80 84 83 83 77 78 77 67 12z 44 41 35 54 54 59 57 54 50 51 49 36
2008 06z 66 62 68 74 76 75 77 76 79 81 75 64 12z 32 24 33 47 45 43 48 48 47 58 48 35
2009 06z 62 54 56 73 78 72 67 68 67 69 70 74 12z 30 22 23 47 50 38 35 37 36 47 44 44
2010 06z 71 77 81 84 83 81 80 80 76 79 77 69 12z 36 41 53 56 55 54 51 52 50 54 53 31

120
Element_Name Solar Irradiation in (MJ/M²/day)
Month >>>>
YEAR 1 2 3 4 5 6 7 8 9 10 11 12
2007 26.46 24.94 24.85 21 22.99 19.88 20.1 21.7 22.44 22.16 21.92 24.23
2008 24.38 26.92 23.46 21.5 22.61 22.17 20.46 22.11 22.82 21.38 24.06 26.42
2009 25.26 25.48 26.38 22.49 22.64 24.93 23.86 24 23.1 20.32 23.61 22.6
2010 25.09 24.14 23 23.53 22.51

121
Appendix A5.5: Kenya: Investors Target Harvest With Mobile Maize Dryers
Press Release : Kenya: Investors Target Harvest With Mobile Maize Dryers
BY ELIZABETH WANJIRU, 2 AUGUST 2011 { Business daily)
Entrepreneurs are positioning themselves for a piece of the grain drying business fuelled by
farmers' growing demand for modern technology as they race to tame heavy losses occasioned
by grain contamination . Lesiolo Grain Handlers Limited (LGHL), which exhibited its mobile drier at
the ninth edition of the annual agribusiness fair by the Eastern Africa Grain Council (EAGC), is the
latest to join other players eyeing this window.
Poor drying due to overreliance on heat from the sun has been cited as a major cause of
Aflatoxin contamination in the country , which is estimated to claim up to 30 per cent of harvests
every season. "This is a new technology which has been introduced to help farmers avoid issues
related to food poisoning as a result of improper moisture extraction from grains," said LGHL market
linkages team leader Michael Kimani.
He said that their machine, which uses a mortar, is three months old in the market. Close to 20,000
farmers attending the fair at Rift Valley Institute of Science and Technology flocked the LGHL stand
to see the machine.
This comes at a time when the government and donor partners are advocating ad option of
modern drying techniques to replace roadside drying and mitigate against rising cases of grain
contamination. Last year the government condemned maize from about 30 districts in Coast and
Eastern provinces after tests confirmed Aflatoxin contamination. Reports from the World Health
Organization (WHO) indicate that the country has suffered from contamination at least six times,
including in 1982, 2001, 2004, 2005, 2006 and 2009.
This saw Finance minister Uhuru Kenyatta, in last year's budget, allocate Sh 400 million and
Sh360 million towards buying of fixed and mobile ma ize driers respectively to reduce post-
harvest losses. The project, which is still in the pilot phase, is yet to be fully implemented after the
Agriculture ministry diverted the funds to other areas creating space for private entrepreneurs.
USAid has been testing a mobile dryer in Eastern Kenya as part of an initiative to support food
stability in the country. The two-day event, which ended Monday, attracted over 70 exhibitors drawn
from the dairy, agrochemical, fertiliser, farm machinery, maize production, banking and storage
industries. Running under the theme Enhancing Returns in Agribusiness Investments Opportunities
and Challenges, the fair came at a time when the country is facing starvation.

122
According to EAGC representatives, the fair aimed at creating a forum to address factors
contributing to famine and providing mitigation measures on challenges to sustainable food
production.
Ministry of Agriculture official Zakayo Magara, who was the chief guest, said the ministry would use
such exhibitions to educate more farmers.
Productivity
"With such exhibitions, both public and private sectors like financial institutions come together to
enable farmers enhance agricultural productivity which is why the ministry is supporting them," Mr
Magara said.
He said through such fairs, farmers are given opportunities to invest in tangible products that
penetrate the food market and enhance food insecurity.
EAGC was using the fair to expand commercial small holder agriculture, through building capacity of
producers in structured training that would offer access to market information. EAGC executive
director Gerald Masila said the fair provided farmers and other attendees' access to relevant and up
to date farming techniques. The techniques are expected to enhance grain trade and by extension
agricultural production, leading to a multiplier effect on allied industries

123
Appendix B1: Assorted Photos
Plate 1: Sample of spoiled (rotten) maize affected by Aflatoxin
Plate 2: Solar irradiation measurement during the performance of the experiment and the gadget used (Daystar DS-05A Solar Digital Meter)

124
Plate 3: Maize sample preparations; measuring the mass of the grains using weighing balance
Plate 4: Woodfuel burning in the back-up heater to supplement the solar collector heat during the performance of the experiment
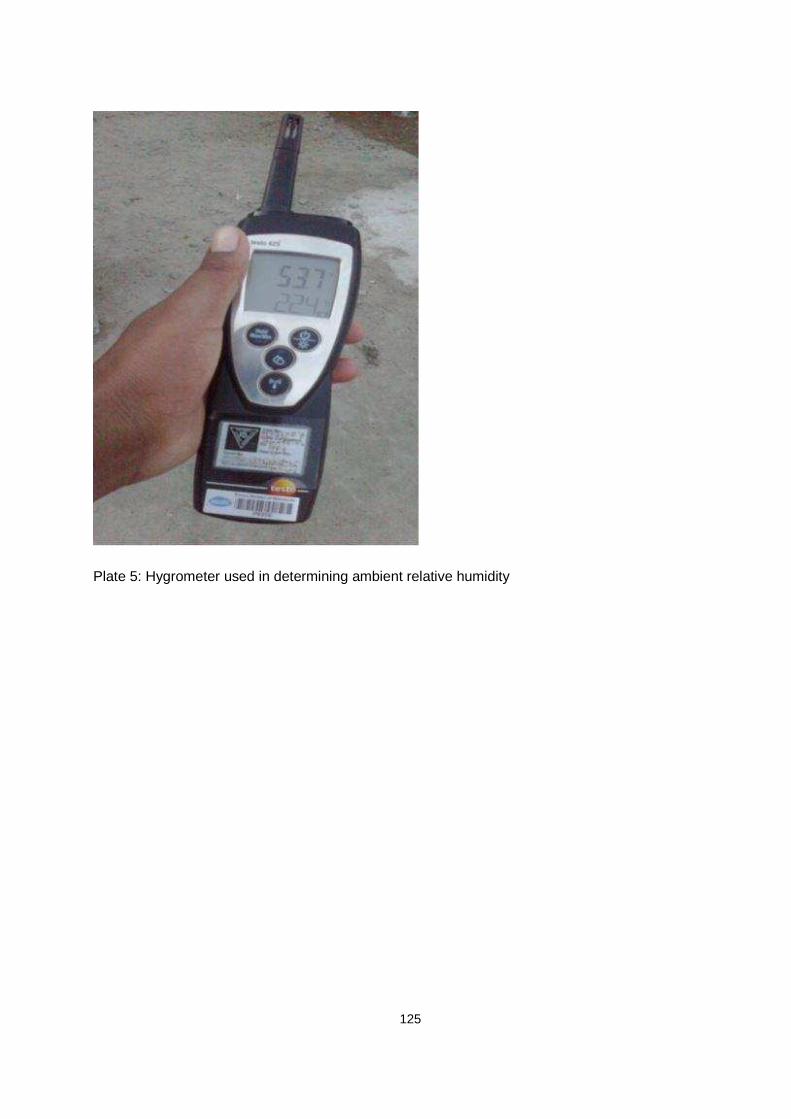
125
Plate 5: Hygrometer used in determining ambient relative humidity

126
Plate 6 :Illustration of (a) sliding doors in the drying chamber, (b) flange air regulator mechanism and (c) installed vane axial fan in the assembled maize dyer.

127
Plate 5. Illustration of plan view of solar assisted maize dryer

128
Drawing layouts