Practical guidelines for familial combined hyperlipidemia diagnosis: an up-date
Upload
nagajunauniversityCategory
view
2download
0
IAJPS, 2014, Volume1, Issue (5), 359-372 Abdullah et al ISSN 2349-7750
w w w . i a j p s . c o m
Page 359
ISSN 2349-7750
IINNDDOO AAMMEERRIICCAANN JJOOUURRNNAALL OOFF
PPHHAARRMMAACCEEUUTTIICCAALL SSCCIIEENNCCEESS
Available online at: http://www.iajps.com Research Article
DESIGN AND EVALUATION OF CONTROLLED RELEASE
FLUVASTATIN TABLETS OF LIPID LOWERING AGENT
FOR HYPERLIPIDEMIA
Md. Musharraf Ali*, Dr. Abdullah Khan, Roshan.S
Azad College of Pharmacy
Moinabad, Ranga Reddy Dist - 500075 , Telangana.
Abstract:
In the present research, an attempt has been made to formulate controlled release matrix tablets of Fluvastatin
(FS).Different formulations were prepared by wet granulation method by using different polymers like HPMC
K-4M, HPMC E-15, guar gum, eudragit S100, PVP etc. with different ratios were used in the development
of formulations. HPMC K-4M, HPMC E-15 and guargum are used as rate conyrolling polymer, PVP used as
binder eudragit S100 used as enteric polymer, lactose used as filler, and microcrystalline cellulose as
disintegrant. The prepared tablets were evaluated for pre compression and post compression parameters with
different ratios. The effect of polymer loading in in-vitro drug release and the mechanism of release was
studied by different mathematical models. It can be concluded that among all the formulations the
combiFStions of HPMC K-4M and Eudragit S100 was considered as the optimized formulations in the present
research work. The optimized formulations show non-fickian diffusion mechanism of release and other all
evaluation.
Key words: Fluvastatin, HPMC, Eudragit S100, guar gum, PVP
Address for Correspondence:
Dr. Abdullah Khan, M.Pharm.,Ph.D,
Azad College of Pharmacy
Moinabad, Ranga Reddy Dist,
Telangana- 500075.
Please cite this article in press as Abdullah et al. Design and Evaluation Of Controlled Release Fluvastatin Tablets Of
Lipid Lowering Agent For Hyperlipidemia. Indo American Journal of Pharm Sciences.2014:1(05).
IAJPS, 2014, Volume1, Issue (5), 359-372 Abdullah et al ISSN 2349-7750
w w w . i a j p s . c o m
Page 360
INTRODUCTION:
Fluvastatin is an antilipemic agent that competitively
inhibits hydroxymethylglutaryl-coenzyme A (HMG-
CoA) reductase. HMG-CoA reductase catalyzes the
conversion of HMG-CoA to mevalonic acid, the rate-
limiting step in cholesterol biosynthesis. Fluvastatin
belongs to a class of medications called statins and is
used to reduce plasma cholesterol levels and prevent
cardiovascular disease. It is also the first entirely
synthetic HMG-CoA reductase inhibitor and is
structurally distinct. Fluvastatin, a lipid lowering agent
used in the treatment of Hyperlipidemia was used as a
model drug to develop a controlled release
formulation. Fluvastatin has a short biological half life
of 1-2 hour and rapid first pass metabolism which
necessitates multiple daily dosing hence the present
study was aimed to develop a controlled release
formulation of fluvastatin. Rapidly and almost
completely absorbed (> 90%), but undergoes extensive
first pass metabolism. Bioavailability is 24% (range 9-
50%) when a 10 mg dose is given. The mean relative
bioavailability of the extended-release tablet is 29%
(range: 9% to 66%) compared to an immediate-release
capsule administered under fasting conditions. When
given orally, fluvastatin reaches peak concentrations
(Tmax) in less than one hour. Taking the extended
release tablet with a high-fat meal will delay
absorption (Tmax = 6 hours) and increase
bioavailability by approximately 50%. However, the
maximum concentration of fluvastatin sodium
extended-release tablets seen after a high fat meal is
less than the peak concentration. Long term treatment
with controlled-release fluvastatin once daily is
generally safe in patients and is well tolerated. The
present research project relates to a controlied release
oral formulation of anti hyperlipidemic drugs like
fluvastatin, the present research comprising FS useful
for the treatment of HPL; polymers like guar gums,
chitosan, and hydroxypropyl methylcellulose are used
for controlling the drug release, and the polymers are
mixed in a predetermined ratio. To develop suitable
no. analytical method for the estimation of the drug.
To evaluate the powder mix for pre compression
characteristic and tableting characteristics, to compress
the formulation according to compatibility study then
evaluate post compression parameters like density,
hardness, friability and content uniformity[1,2,3]
etc.Optimization of formulation parameters and drug-
carrier system using appropriate methods and study of
dissolution, percentage of drug content, and
degradation of active constituents.
MATERIALS AND METHOD
Fluvastatin was obtained from Spectrum pharma lab,
Hyderabad, HPMC K-4-M and HPMC E15 from
Strides arcolab, Bangalore. Eudragit S100 from KAPL
Bangalore and other chemicals from SD Fine
chemicals Ltd. Mumbai.
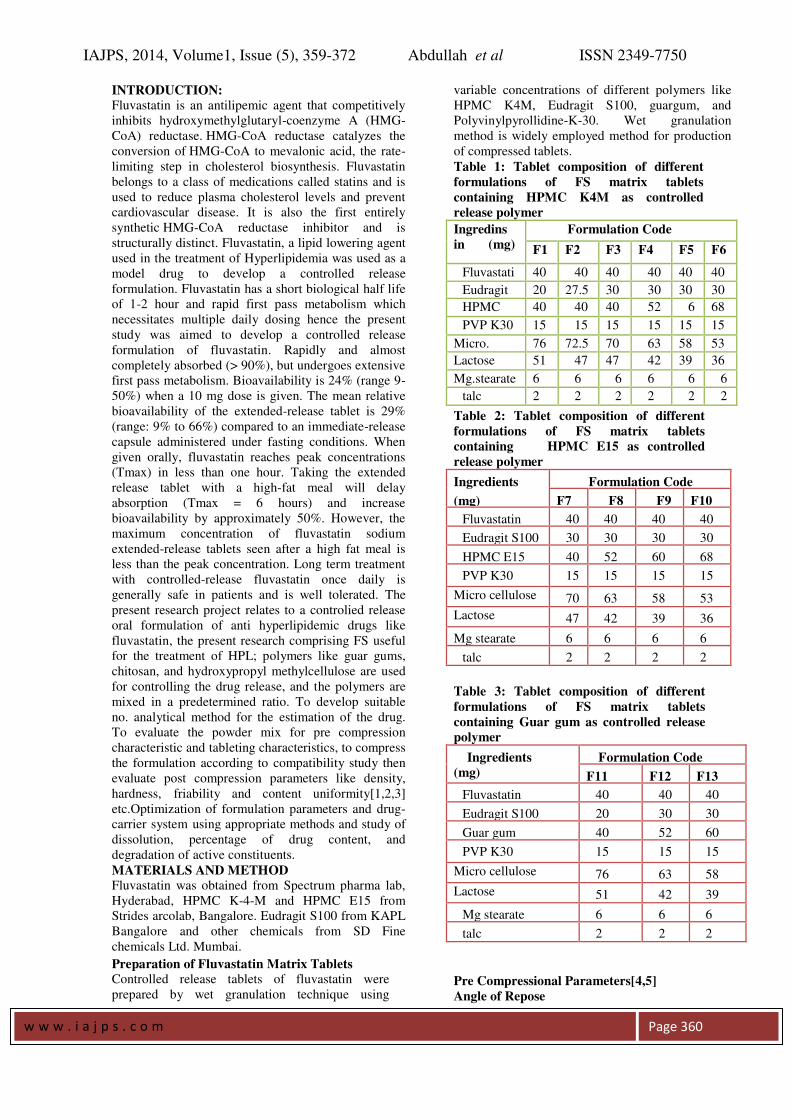
Preparation of Fluvastatin Matrix Tablets Controlled release tablets of fluvastatin were
prepared by wet granulation technique using
variable concentrations of different polymers like
HPMC K4M, Eudragit S100, guargum, and
Polyvinylpyrollidine-K-30. Wet granulation
method is widely employed method for production
of compressed tablets.
Table 1: Tablet composition of different
formulations of FS matrix tablets
containing HPMC K4M as controlled
release polymer
Ingredins
in (mg)
Formulation Code
F1 F2 F3 F4 F5 F6
Fluvastati
n
40 40 40 40 40 40
Eudragit
S100
20 27.5 30 30 30 30
HPMC
K4M
40 40 40 52 6
0
68
PVP K30 15 15 15 15 15 15
Micro.
cellulose
76 72.5 70 63 58 53
Lactose 51 47 47 42 39 36
Mg.stearate 6 6 6 6 6 6
talc 2 2 2 2 2 2
Table 2: Tablet composition of different
formulations of FS matrix tablets
containing HPMC E15 as controlled
release polymer
Ingredients
(mg)
Formulation Code
F7 F8 F9 F10
Fluvastatin 40 40 40 40
Eudragit S100 30 30 30 30
HPMC E15 40 52 60 68
PVP K30 15 15 15 15
Micro cellulose 70 63 58 53
Lactose 47 42 39 36
Mg stearate 6 6 6 6
talc 2 2 2 2
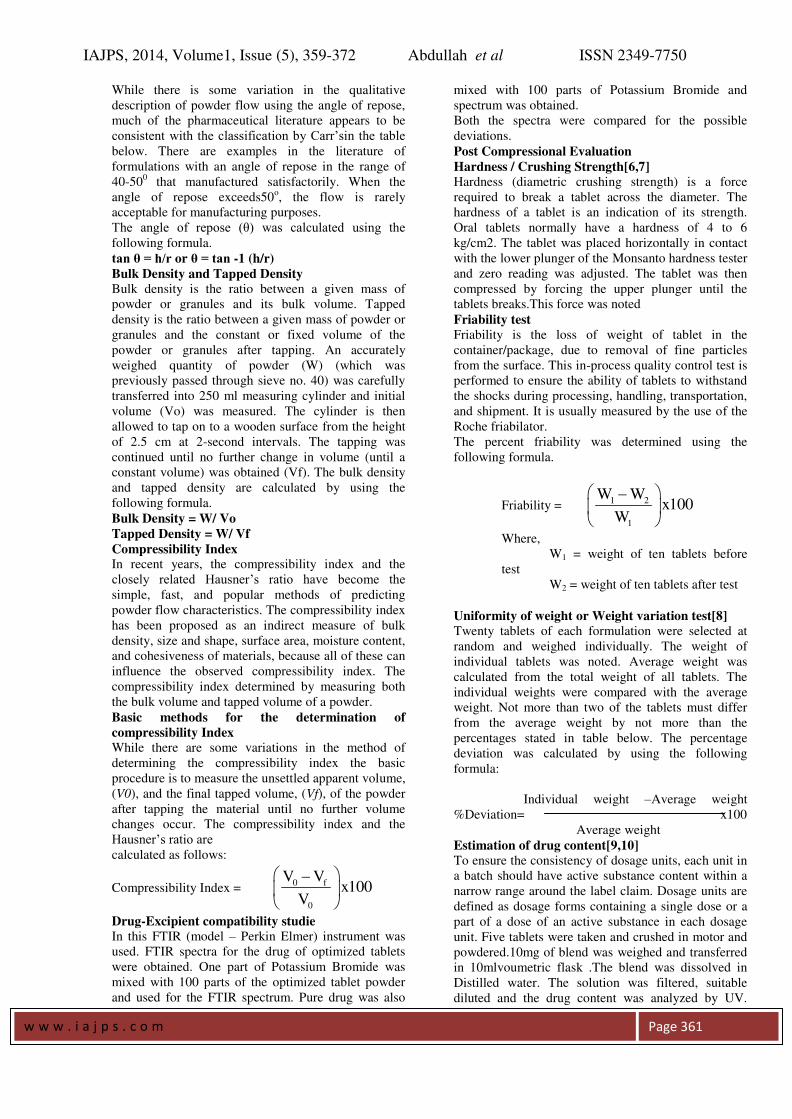
Table 3: Tablet composition of different
formulations of FS matrix tablets
containing Guar gum as controlled release
polymer
Ingredients
(mg)
Formulation Code
F11 F12 F13
Fluvastatin 40 40 40
Eudragit S100 20 30 30
Guar gum 40 52 60
PVP K30 15 15 15
Micro cellulose 76 63 58
Lactose 51 42 39
Mg stearate 6 6 6
talc 2 2 2
Pre Compressional Parameters[4,5]
Angle of Repose
IAJPS, 2014, Volume1, Issue (5), 359-372 Abdullah et al ISSN 2349-7750
w w w . i a j p s . c o m
Page 361
While there is some variation in the qualitative
description of powder flow using the angle of repose,
much of the pharmaceutical literature appears to be
consistent with the classification by Carr’sin the table below. There are examples in the literature of
formulations with an angle of repose in the range of
40-500 that manufactured satisfactorily. When the
angle of repose exceeds50o, the flow is rarely
acceptable for manufacturing purposes.
The angle of repose (θ) was calculated using the following formula.
tan θ = h/r or θ = tan -1 (h/r)
Bulk Density and Tapped Density
Bulk density is the ratio between a given mass of
powder or granules and its bulk volume. Tapped
density is the ratio between a given mass of powder or
granules and the constant or fixed volume of the
powder or granules after tapping. An accurately
weighed quantity of powder (W) (which was
previously passed through sieve no. 40) was carefully
transferred into 250 ml measuring cylinder and initial
volume (Vo) was measured. The cylinder is then
allowed to tap on to a wooden surface from the height
of 2.5 cm at 2-second intervals. The tapping was
continued until no further change in volume (until a
constant volume) was obtained (Vf). The bulk density
and tapped density are calculated by using the
following formula.
Bulk Density = W/ Vo
Tapped Density = W/ Vf
Compressibility Index In recent years, the compressibility index and the
closely related Hausner’s ratio have become the simple, fast, and popular methods of predicting
powder flow characteristics. The compressibility index
has been proposed as an indirect measure of bulk
density, size and shape, surface area, moisture content,
and cohesiveness of materials, because all of these can
influence the observed compressibility index. The
compressibility index determined by measuring both
the bulk volume and tapped volume of a powder.
Basic methods for the determination of
compressibility Index
While there are some variations in the method of
determining the compressibility index the basic
procedure is to measure the unsettled apparent volume,
(V0), and the final tapped volume, (Vf), of the powder
after tapping the material until no further volume
changes occur. The compressibility index and the
Hausner’s ratio are
calculated as follows:
Compressibility Index = 0 f
0
V Vx100
V
Drug-Excipient compatibility studie
In this FTIR (model – Perkin Elmer) instrument was
used. FTIR spectra for the drug of optimized tablets
were obtained. One part of Potassium Bromide was
mixed with 100 parts of the optimized tablet powder
and used for the FTIR spectrum. Pure drug was also
mixed with 100 parts of Potassium Bromide and
spectrum was obtained.
Both the spectra were compared for the possible
deviations.
Post Compressional Evaluation
Hardness / Crushing Strength[6,7]
Hardness (diametric crushing strength) is a force
required to break a tablet across the diameter. The
hardness of a tablet is an indication of its strength.
Oral tablets normally have a hardness of 4 to 6
kg/cm2. The tablet was placed horizontally in contact
with the lower plunger of the Monsanto hardness tester
and zero reading was adjusted. The tablet was then
compressed by forcing the upper plunger until the
tablets breaks.This force was noted
Friability test
Friability is the loss of weight of tablet in the
container/package, due to removal of fine particles
from the surface. This in-process quality control test is
performed to ensure the ability of tablets to withstand
the shocks during processing, handling, transportation,
and shipment. It is usually measured by the use of the
Roche friabilator.
The percent friability was determined using the
following formula.
Friability = 1 2
1
W Wx100
W
Where,
W1 = weight of ten tablets before
test
W2 = weight of ten tablets after test
Uniformity of weight or Weight variation test[8]
Twenty tablets of each formulation were selected at
random and weighed individually. The weight of
individual tablets was noted. Average weight was
calculated from the total weight of all tablets. The
individual weights were compared with the average
weight. Not more than two of the tablets must differ
from the average weight by not more than the
percentages stated in table below. The percentage
deviation was calculated by using the following
formula:
Individual weight –Average weight
%Deviation= x100
Average weight
Estimation of drug content[9,10]
To ensure the consistency of dosage units, each unit in
a batch should have active substance content within a
narrow range around the label claim. Dosage units are
defined as dosage forms containing a single dose or a
part of a dose of an active substance in each dosage
unit. Five tablets were taken and crushed in motor and
powdered.10mg of blend was weighed and transferred
in 10mlvoumetric flask .The blend was dissolved in
Distilled water. The solution was filtered, suitable
diluted and the drug content was analyzed by UV.
IAJPS, 2014, Volume1, Issue (5), 359-372 Abdullah et al ISSN 2349-7750
w w w . i a j p s . c o m
Page 362
Each sample was analyzed in triplicate. Generally, the
drug content in any formulation should fall within the
limit of 92 – 102%.
Dissolution rate studies
In vitro drug release
The release rate of FS from tablets was determined
using The United States Pharmacopoeia (USP) XXIV
dissolution testing apparatus II (paddle type). The
dissolution test was performed using 900 ml of pH 1.2,
for first 2 hours then in phosphate buffer pH 7.2 for rest
of the hours at 37 0.5 C and 50 rpm. A sample (5
ml) of the solution was withdrawn from the dissolution
apparatus hourly for 12 hours, and the samples were
replaced with fresh dissolution medium. The samples
diluted to a suitable concentration with respected
dissolution medium. Absorbance of these solutions
was measured using a UV-Visible Spectrophotometer
(UV-1800). Cumulative percentage of drug release was
calculated.
Kinetics and Mechanism of drug release:
First order constant:
First order rate constant obtained by plotting log
%Dissolved versus Time, the plot will be straight line
and slope of the line (m) will be –K / 2.303.
The slope of the line and the corresponding value of k
can be calculated which is indicative of the release rate
profile.
In Q-InQo = Kt
Where Q is the amount of drug release at time t. Qo is
quantity of drug present initially in the dosage form,
and K is the first order release constant.
Higuchi constant:
To investigate the mechanism of drug release the in
vitro data were plotted as cumulative drug release
versus square root of time as described by Higuchi,
when the linearity was observed in the graph that
indicates the diffusion controlled release.
Q = KHt1/2
Where Q is amount of drug release at time t, KH is
Higuchi square root of time release rate constant.
Korsemeyer ─ Peppas constant: To under stand the mechanism of drug release and to
compare the differences among release profile of these
matrix formulations, the percent drug release versus
time profiles were fitted into the equation proposed by
Peppas.
Mt / Mœ = Ktn
Where Mt is drug release at time t, Mœ is the total amount of drug in the dosage form, Mt / Mœ is the fraction of drug release up to time t, K is the
kinetic constant and n is the release exponent
indicative of the release mechanism. Where n = 0.45
indicates Fickian diffusion, when between 0.45 - 0.89
indicates anomalous Non Fickian transport and 0.89
indicates Case- II transport, n=1 for zero-order release.
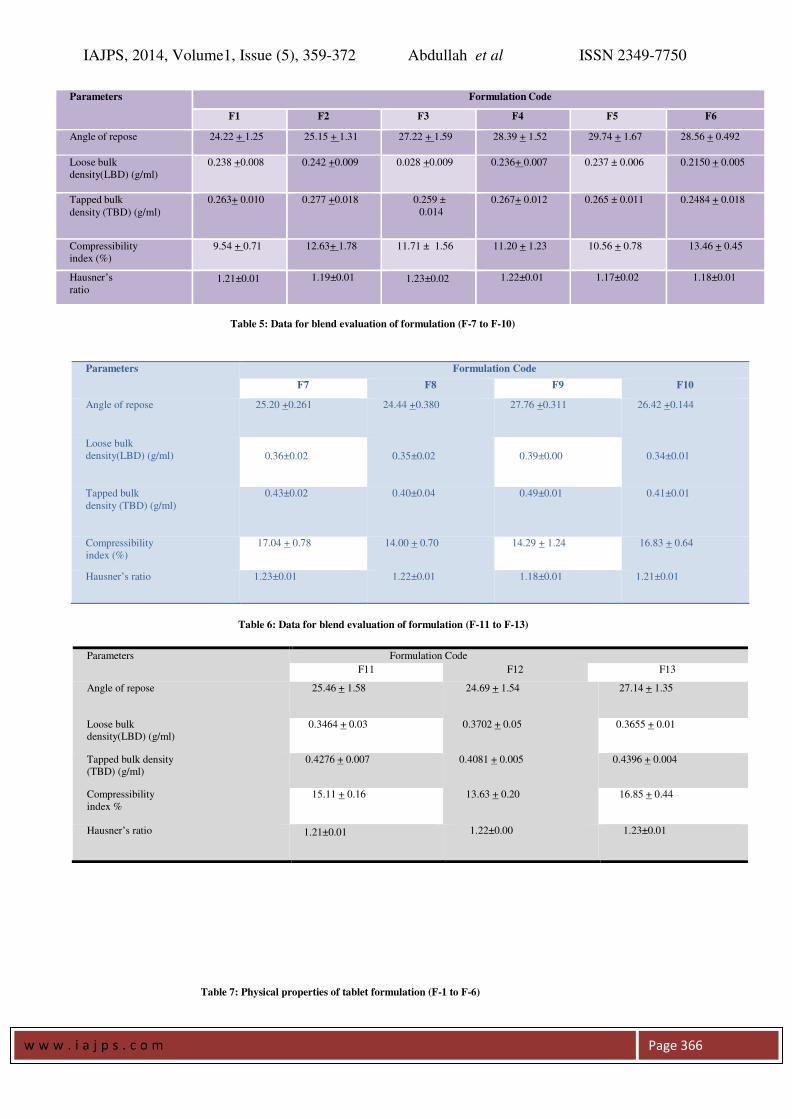
RESULTS AND DISCUSSIONS
Pre-compressional Parameters: A flow property
plays an important role in pharmaceuticals
especially in tablet formulation because improper
flow may cause more weight variation. The
Carr’s Index (Compressibility) of the powders was
in the range of 8.0 to 18.0. The angles of repose of
the powders were in the range of 230
to 280
, which
indicate a good flow property of the powders. Here
the angle of repose was found to be below40o
this
shows that the reasonable flow property of powders.
The results are given in the Table No.4,5 and 6.
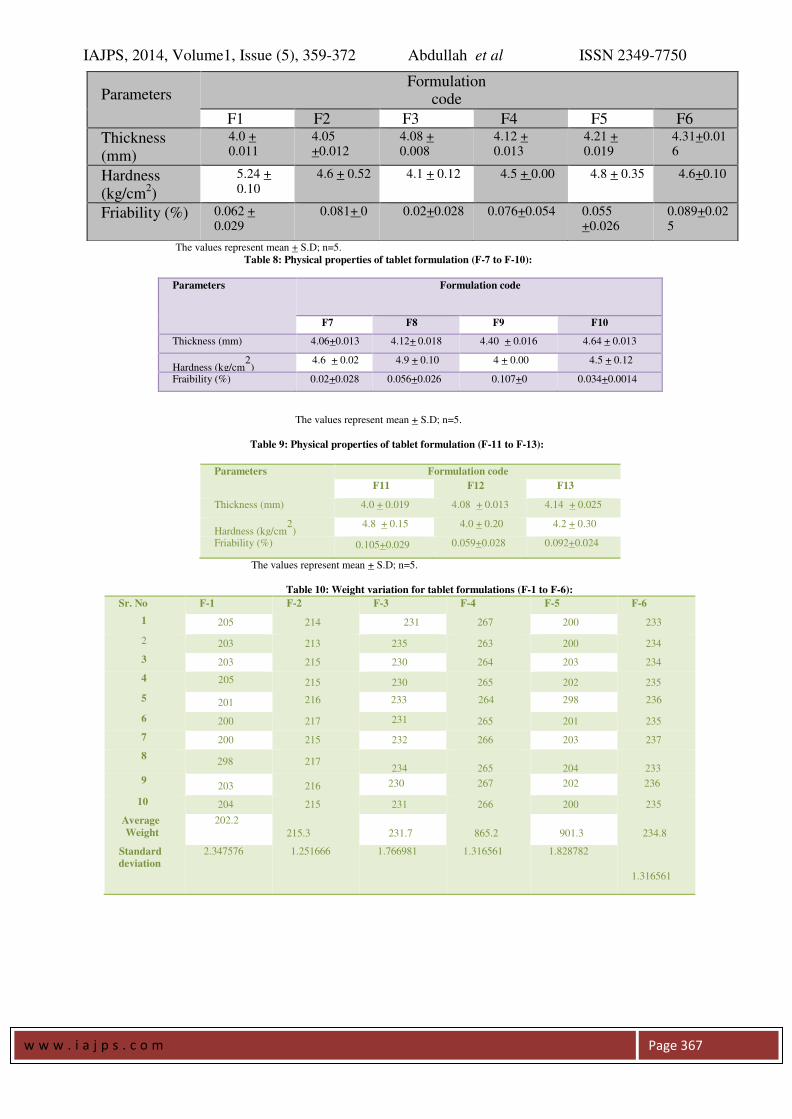
Post Compressional Parameters (Shape,Hardness
& Friability):
The punches used to compress the tablets were 9mm,
spherical shaped. The shape and size of the tablets
were found to be within the limit. The hardness of
the tablets was found to be in the range of 5.24 +
0.08 to 4.82 + 0.03 Kg/cm2
. It was within the
range of monograph specification.Thicknesses of the
tablets were found to be in the range of 4.58 +
0.035 to 4.06 + 0.030 mm. The friability of the
tablets was found to be less than 1% and it was
within the range of standard specification. The
results are given in the Table No.7, 8 and 9.
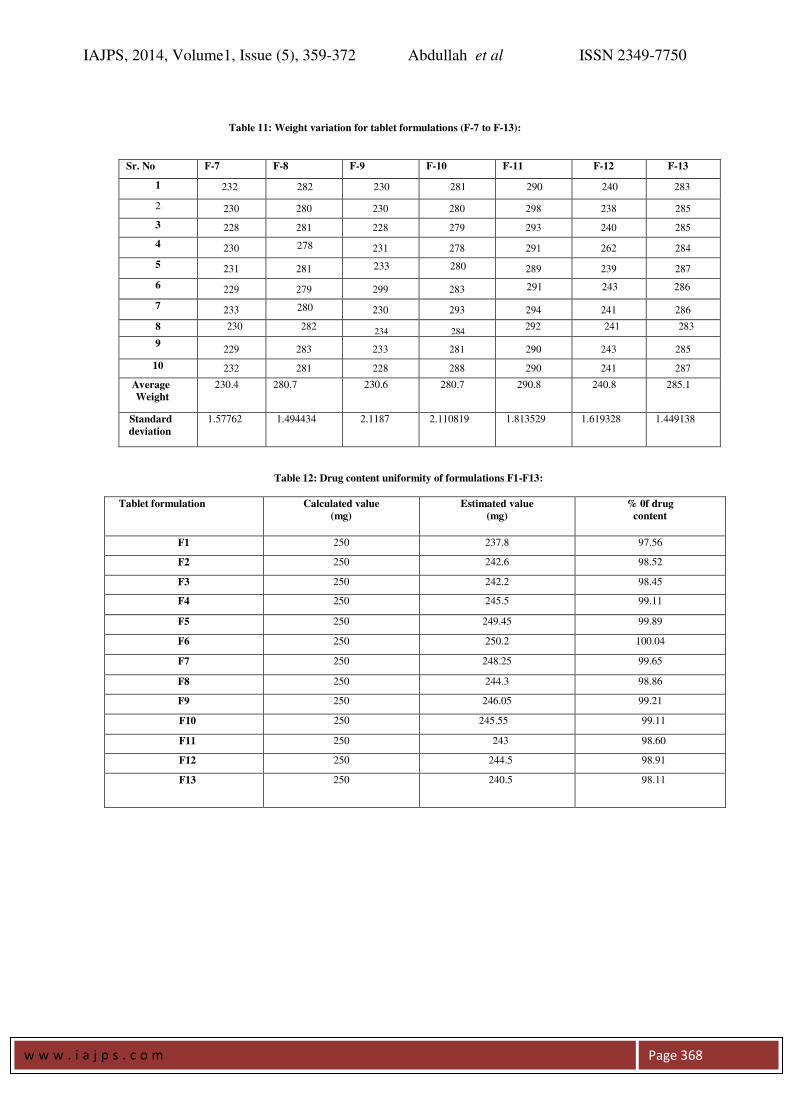
Weight Variation and Drug Content: Weight variation test helps to check whether the
tablet contain proper quantity of the drug. From
each of the formulations ten tablets were randomly
selected and weighed. The results are given in table
10 and 11. The average weights of the tablets were
found to be within the prescribed official limits (IP).
Drug content for each of the formulations were
estimated. The drug content for all the batches were
found to be in the range of 97.56 to 100.04%. The
results are given in table 12.
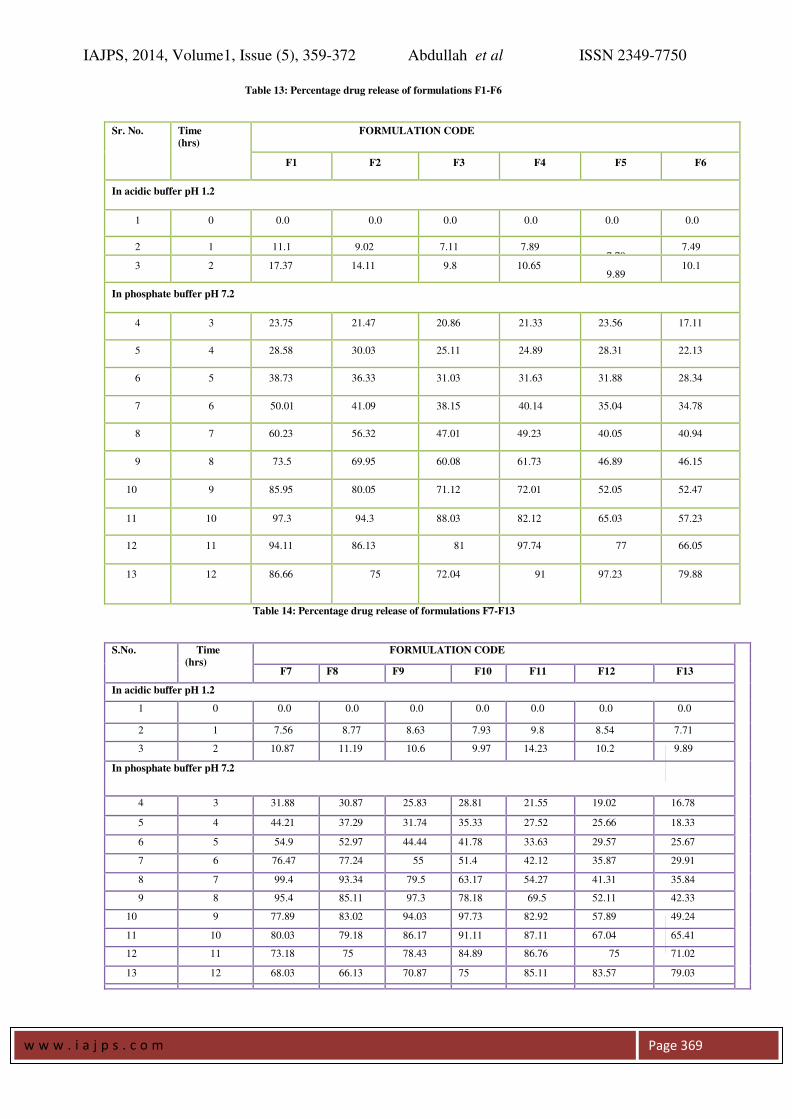
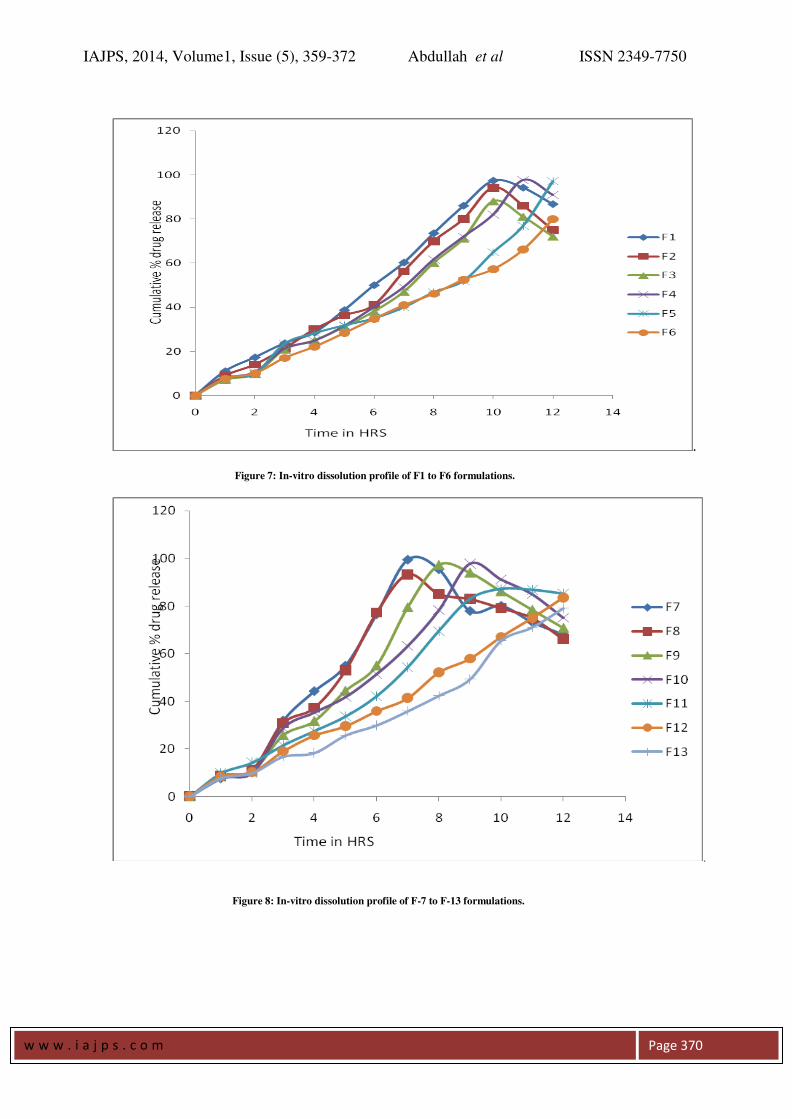
In-Vitro Release Study:
All the 13 formulation of prepared tablets of FS were
subjected to in vitro release studies, these studies
were carried out using dissolution medium, (pH 1.2
and Phosphate buffer pH 7.2). by using USP-2
(paddle type) dissolution apparatus. The results
were evaluated for 12 hours. As per the results
of dissolution study formulations F-1, F-2, F-3, F-4,
F-5, F-6, F-7, F-8, F-9, F-10, F-11, F-12, and F-13,
showed 86.66%, 75%, 72.04%, 91%, 97.23%,
79.88%, 68.03%, 66.13%,70.87%, 75% , 85.11%,
83.57%, 79.03%, release respectively over a period
of 12 hours. Formulations except F-4, and F-5, all
the formulations failed to sustain release beyond 10
hours. . Among all the formulation, F-4, and F-
5, showed 91%, and 97.23%, release respectively
at the end of 12 hours. The formulation F5 its release
at the end of 12th
hr is 97.23% also all other
parameters like hardness, thickness, friability, and
drug content and weight variation for this
formulations were within the range. So, a
formulation F-5 was selected as the optimized
IAJPS, 2014, Volume1, Issue (5), 359-372 Abdullah et al ISSN 2349-7750
w w w . i a j p s . c o m
Page 363
formulation results were shown in tables13&14 and
figures 7&8..
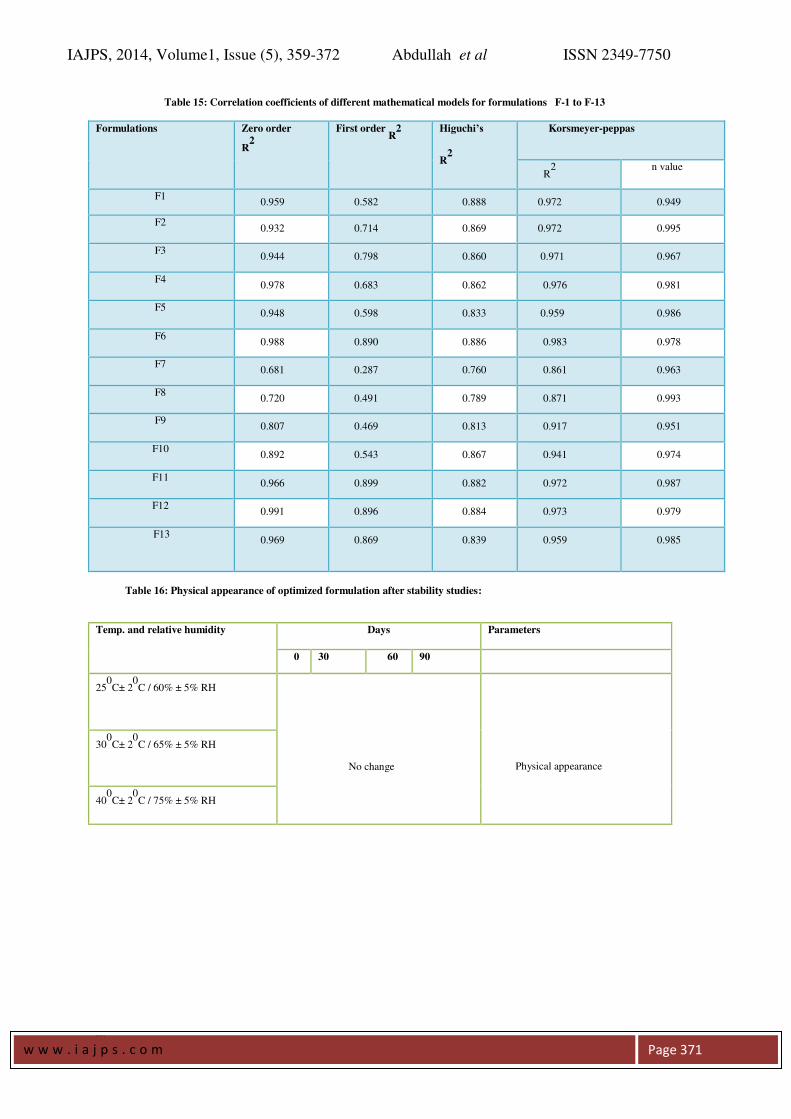
Release Kinetics: Different models like Zero order,
First order, Higuchi’s, and Korsmeyer-peppas plots
were drawn. The regression coefficient ( R2
) value
for Zero order, First order, Higuchi’s, and
Korsmeyer-peppas plots (figure 7.9a-7.9d and table
7.9a-7.9b) for formulation F-4 were found to be
0.978, 0.683, 0.862, 0.976, 0.981(n value) for
formulation F-5 were found to be 0.948, 0.598,
0.833, 0.959, 0.986(n value) . The optimized
formulations F-5 follow Zero order and Korsmeyer-
peppas. The regression coefficient (R2
) of Higuchi
plot of optimized formula F-5 is 0.833 that shows
the drug releases through the matrix was diffusion
and slope (n) value of peppas plot is 0.986 this
confirms that non-Fickian diffusion (anomalous
transport) was the main mechanism. The regression
coefficient (R2
) value of zero order is 0.948 in.
Thus, the drug release follows zero order release
kinetics results were shown in table 15.
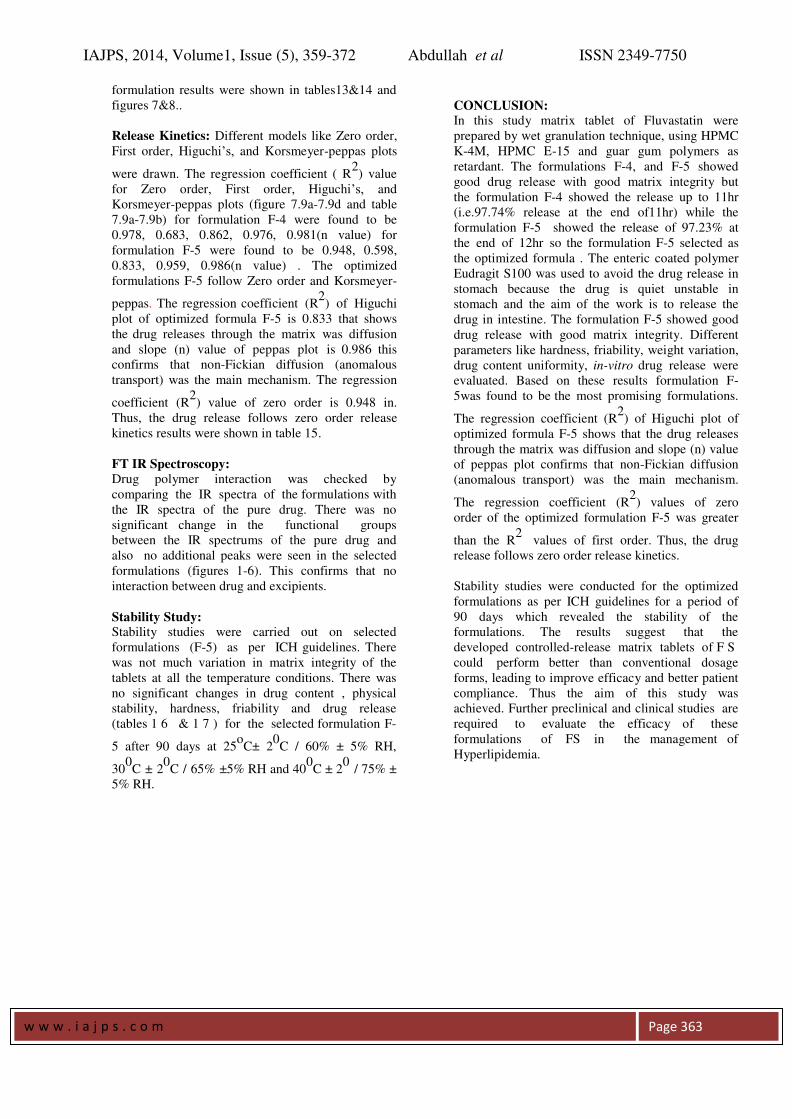
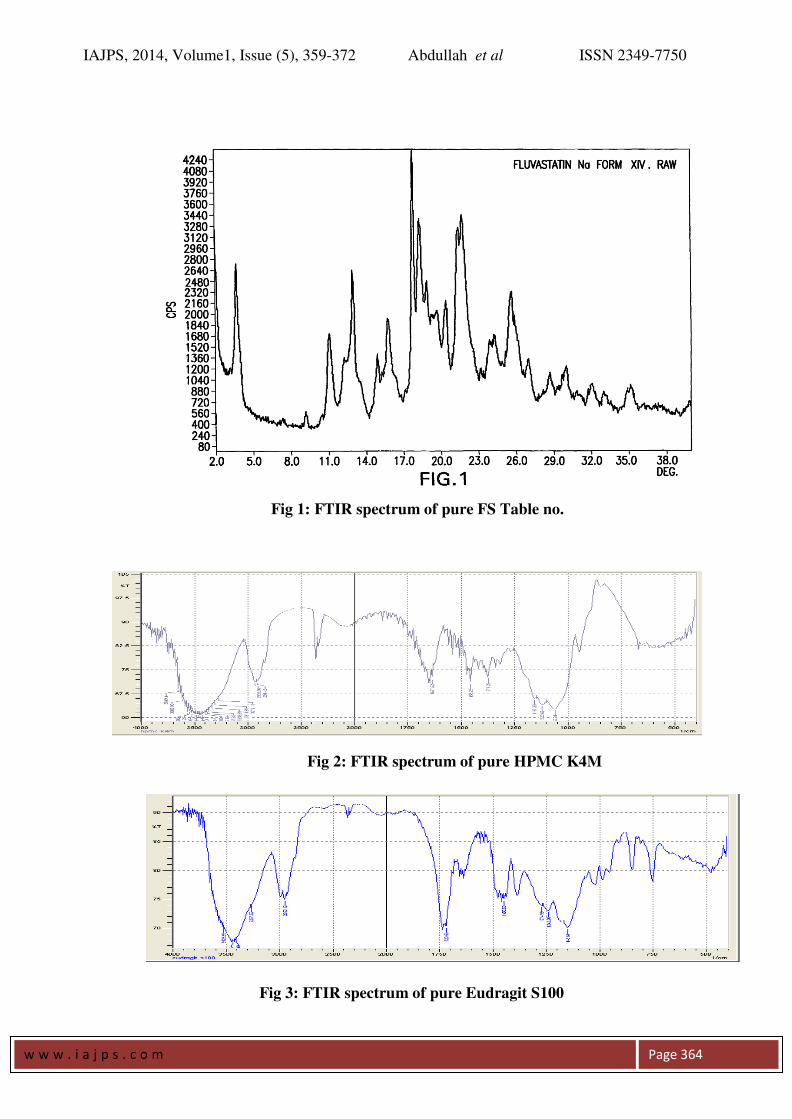
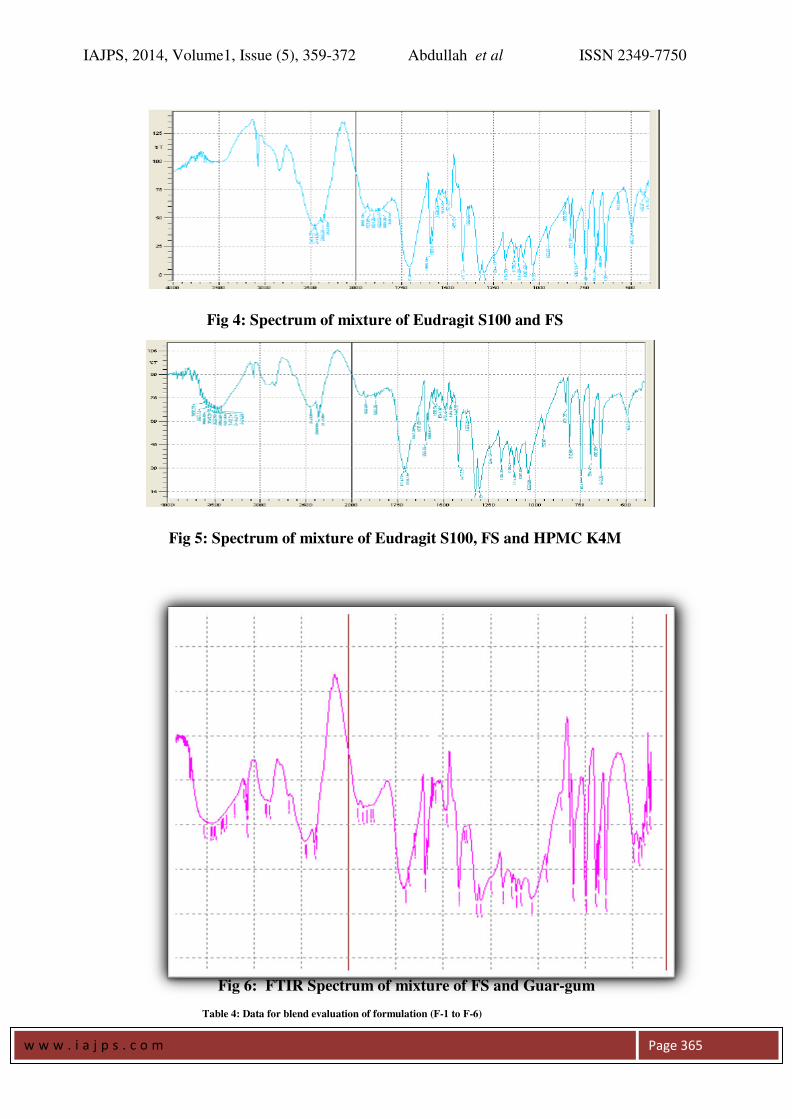
FT IR Spectroscopy: Drug polymer interaction was checked by
comparing the IR spectra of the formulations with
the IR spectra of the pure drug. There was no
significant change in the functional groups
between the IR spectrums of the pure drug and
also no additional peaks were seen in the selected
formulations (figures 1-6). This confirms that no
interaction between drug and excipients.
Stability Study: Stability studies were carried out on selected
formulations (F-5) as per ICH guidelines. There
was not much variation in matrix integrity of the
tablets at all the temperature conditions. There was
no significant changes in drug content , physical
stability, hardness, friability and drug release
(tables 1 6 & 1 7 ) for the selected formulation F-
5 after 90 days at 25o
C± 20
C / 60% ± 5% RH,
300
C ± 20
C / 65% ±5% RH and 400
C ± 20
/ 75% ±
5% RH.
CONCLUSION: In this study matrix tablet of Fluvastatin were
prepared by wet granulation technique, using HPMC
K-4M, HPMC E-15 and guar gum polymers as
retardant. The formulations F-4, and F-5 showed
good drug release with good matrix integrity but
the formulation F-4 showed the release up to 11hr
(i.e.97.74% release at the end of11hr) while the
formulation F-5 showed the release of 97.23% at
the end of 12hr so the formulation F-5 selected as
the optimized formula . The enteric coated polymer
Eudragit S100 was used to avoid the drug release in
stomach because the drug is quiet unstable in
stomach and the aim of the work is to release the
drug in intestine. The formulation F-5 showed good
drug release with good matrix integrity. Different
parameters like hardness, friability, weight variation,
drug content uniformity, in-vitro drug release were
evaluated. Based on these results formulation F-
5was found to be the most promising formulations.
The regression coefficient (R2
) of Higuchi plot of
optimized formula F-5 shows that the drug releases
through the matrix was diffusion and slope (n) value
of peppas plot confirms that non-Fickian diffusion
(anomalous transport) was the main mechanism.
The regression coefficient (R2
) values of zero
order of the optimized formulation F-5 was greater
than the R2
values of first order. Thus, the drug
release follows zero order release kinetics.
Stability studies were conducted for the optimized
formulations as per ICH guidelines for a period of
90 days which revealed the stability of the
formulations. The results suggest that the
developed controlled-release matrix tablets of F S
could perform better than conventional dosage
forms, leading to improve efficacy and better patient
compliance. Thus the aim of this study was
achieved. Further preclinical and clinical studies are
required to evaluate the efficacy of these
formulations of FS in the management of
Hyperlipidemia.
IAJPS, 2014, Volume1, Issue (5), 359-372 Abdullah et al ISSN 2349-7750
w w w . i a j p s . c o m
Page 364
Fig 1: FTIR spectrum of pure FS Table no.
Fig 2: FTIR spectrum of pure HPMC K4M
Fig 3: FTIR spectrum of pure Eudragit S100
IAJPS, 2014, Volume1, Issue (5), 359-372 Abdullah et al ISSN 2349-7750
w w w . i a j p s . c o m
Page 365
Fig 4: Spectrum of mixture of Eudragit S100 and FS
Fig 5: Spectrum of mixture of Eudragit S100, FS and HPMC K4M
Fig 6: FTIR Spectrum of mixture of FS and Guar-gum
Table 4: Data for blend evaluation of formulation (F-1 to F-6)
IAJPS, 2014, Volume1, Issue (5), 359-372 Abdullah et al ISSN 2349-7750
w w w . i a j p s . c o m
Page 366
Table 5: Data for blend evaluation of formulation (F-7 to F-10)
Table 6: Data for blend evaluation of formulation (F-11 to F-13)
Table 7: Physical properties of tablet formulation (F-1 to F-6)
Parameters Formulation Code
F1 F2 F3 F4 F5 F6
Angle of repose 24.22 + 1.25 25.15 + 1.31 27.22 + 1.59 28.39 + 1.52 29.74 + 1.67 28.56 + 0.492
Loose bulk
density(LBD) (g/ml)
0.238 +0.008 0.242 +0.009 0.028 +0.009 0.236+ 0.007 0.237 ± 0.006 0.2150 + 0.005
Tapped bulk
density (TBD) (g/ml)
0.263+ 0.010 0.277 +0.018 0.259 ±
0.014
0.267+ 0.012 0.265 ± 0.011 0.2484 + 0.018
Compressibility
index (%)
9.54 + 0.71 12.63+ 1.78 11.71 ± 1.56 11.20 + 1.23 10.56 + 0.78 13.46 + 0.45
Hausner’s
ratio 1.21±0.01 1.19±0.01 1.23±0.02 1.22±0.01 1.17±0.02 1.18±0.01
Parameters Formulation Code
F7 F8 F9 F10
Angle of repose 25.20 +0.261 24.44 +0.380 27.76 +0.311 26.42 +0.144
Loose bulk
density(LBD) (g/ml)
0.36±0.02
0.35±0.02
0.39±0.00
0.34±0.01
Tapped bulk
density (TBD) (g/ml)
0.43±0.02 0.40±0.04 0.49±0.01 0.41±0.01
Compressibility
index (%)
17.04 + 0.78 14.00 + 0.70 14.29 + 1.24 16.83 + 0.64
Hausner’s ratio 1.23±0.01 1.22±0.01 1.18±0.01 1.21±0.01
Parameters Formulation Code
F11 F12 F13
Angle of repose 25.46 + 1.58 24.69 + 1.54 27.14 + 1.35
Loose bulk
density(LBD) (g/ml)
0.3464 + 0.03 0.3702 + 0.05 0.3655 + 0.01
Tapped bulk density
(TBD) (g/ml)
0.4276 + 0.007 0.4081 + 0.005 0.4396 + 0.004
Compressibility
index %
15.11 + 0.16 13.63 + 0.20 16.85 + 0.44
Hausner’s ratio 1.21±0.01 1.22±0.00 1.23±0.01
IAJPS, 2014, Volume1, Issue (5), 359-372 Abdullah et al ISSN 2349-7750
w w w . i a j p s . c o m
Page 367
Parameters Formulation
code
F1 F2 F3 F4 F5 F6
Thickness (mm)
4.0 + 0.011
4.05 +0.012
4.08 + 0.008
4.12 + 0.013
4.21 + 0.019
4.31+0.016
Hardness
(kg/cm2)
5.24 + 0.10
4.6 + 0.52 4.1 + 0.12 4.5 + 0.00 4.8 + 0.35 4.6+0.10
Friability (%) 0.062 + 0.029
0.081+ 0 0.02+0.028 0.076+0.054 0.055 +0.026
0.089+0.025
The values represent mean + S.D; n=5.
Table 8: Physical properties of tablet formulation (F-7 to F-10):
The values represent mean + S.D; n=5.
Table 9: Physical properties of tablet formulation (F-11 to F-13):
Parameters Formulation code
F11 F12 F13
Thickness (mm) 4.0 + 0.019 4.08 + 0.013 4.14 + 0.025
Hardness (kg/cm2
) 4.8 + 0.15 4.0 + 0.20 4.2 + 0.30
Friability (%) 0.105+0.029 0.059+0.028 0.092+0.024
The values represent mean + S.D; n=5.
Table 10: Weight variation for tablet formulations (F-1 to F-6):
Sr. No F-1 F-2 F-3 F-4 F-5 F-6
1 205 214 231 267 200 233
2 203 213 235 263 200 234
3 203 215 230 264 203 234
4 205 215 230 265 202 235
5 201 216 233 264 298 236
6 200 217 231 265 201 235
7 200 215 232 266 203 237
8 298 217
234
265
204
233 9
203 216 230 267 202 236
10 204 215 231 266 200 235
Average
Weight
202.2
215.3
231.7
865.2
901.3
234.8
Standard
deviation
2.347576 1.251666 1.766981 1.316561 1.828782
1.316561
Parameters Formulation code
F7 F8 F9 F10
Thickness (mm) 4.06+0.013 4.12+ 0.018 4.40 + 0.016 4.64 + 0.013
Hardness (kg/cm2
) 4.6 + 0.02 4.9 + 0.10 4 + 0.00 4.5 + 0.12
Fraibility (%) 0.02+0.028 0.056+0.026 0.107+0 0.034+0.0014
IAJPS, 2014, Volume1, Issue (5), 359-372 Abdullah et al ISSN 2349-7750
w w w . i a j p s . c o m
Page 368
Table 11: Weight variation for tablet formulations (F-7 to F-13):
Sr. No F-7 F-8 F-9 F-10 F-11 F-12 F-13
1 232 282 230 281 290 240 283
2 230 280 230 280 298 238 285
3 228 281 228 279 293 240 285
4 230 278 231 278 291 262 284
5 231 281 233 280 289 239 287
6 229 279 299 283 291 243 286
7 233 280 230 293 294 241 286
8 230 282 234 284
292 241 283
9 229 283 233 281 290 243 285
10 232 281 228 288 290 241 287
Average
Weight
230.4 280.7 230.6 280.7 290.8 240.8 285.1
Standard
deviation
1.57762 1.494434 2.1187 2.110819 1.813529 1.619328 1.449138
Table 12: Drug content uniformity of formulations F1-F13:
Tablet formulation Calculated value
(mg)
Estimated value
(mg)
% 0f drug
content
F1 250 237.8 97.56
F2 250 242.6 98.52
F3 250 242.2 98.45
F4 250 245.5 99.11
F5 250 249.45 99.89
F6 250 250.2 100.04
F7 250 248.25 99.65
F8 250 244.3 98.86
F9 250 246.05 99.21
F10 250 245.55 99.11
F11 250 243 98.60
F12 250 244.5 98.91
F13 250 240.5 98.11
IAJPS, 2014, Volume1, Issue (5), 359-372 Abdullah et al ISSN 2349-7750
w w w . i a j p s . c o m
Page 369
Table 13: Percentage drug release of formulations F1-F6
Sr. No. Time
(hrs)
FORMULATION CODE
F1 F2 F3 F4 F5 F6
In acidic buffer pH 1.2
1 0 0.0 0.0 0.0 0.0 0.0 0.0
2 1 11.1 9.02 7.11 7.89
7.78 7.49
3 2 17.37 14.11 9.8 10.65
9.89 10.1
In phosphate buffer pH 7.2
4 3 23.75 21.47 20.86 21.33 23.56 17.11
5 4 28.58 30.03 25.11 24.89 28.31 22.13
6 5 38.73 36.33 31.03 31.63 31.88 28.34
7 6 50.01 41.09 38.15 40.14 35.04 34.78
8 7 60.23 56.32 47.01 49.23 40.05 40.94
9 8 73.5 69.95 60.08 61.73 46.89 46.15
10 9 85.95 80.05 71.12 72.01 52.05 52.47
11 10 97.3 94.3 88.03 82.12 65.03 57.23
12 11 94.11 86.13 81 97.74 77 66.05
13 12 86.66 75 72.04 91 97.23 79.88
Table 14: Percentage drug release of formulations F7-F13
S.No. Time
(hrs)
FORMULATION CODE
F7 F8 F9 F10 F11 F12 F13
In acidic buffer pH 1.2
1 0 0.0 0.0 0.0 0.0 0.0 0.0 0.0
2 1 7.56 8.77 8.63 7.93 9.8 8.54 7.71
3 2 10.87 11.19 10.6 9.97 14.23 10.2 9.89
In phosphate buffer pH 7.2
4 3 31.88 30.87 25.83 28.81 21.55 19.02 16.78
5 4 44.21 37.29 31.74 35.33 27.52 25.66 18.33
6 5 54.9 52.97 44.44 41.78 33.63 29.57 25.67
7 6 76.47 77.24 55 51.4 42.12 35.87 29.91
8 7 99.4 93.34 79.5 63.17 54.27 41.31 35.84
9 8 95.4 85.11 97.3 78.18 69.5 52.11 42.33
10 9 77.89 83.02 94.03 97.73 82.92 57.89 49.24
11 10 80.03 79.18 86.17 91.11 87.11 67.04 65.41
12 11 73.18 75 78.43 84.89 86.76 75 71.02
13 12 68.03 66.13 70.87 75 85.11 83.57 79.03
IAJPS, 2014, Volume1, Issue (5), 359-372 Abdullah et al ISSN 2349-7750
w w w . i a j p s . c o m
Page 370
.
Figure 7: In-vitro dissolution profile of F1 to F6 formulations.
.
Figure 8: In-vitro dissolution profile of F-7 to F-13 formulations.
IAJPS, 2014, Volume1, Issue (5), 359-372 Abdullah et al ISSN 2349-7750
w w w w . i a j p s . c o m
Page 371
Table 15: Correlation coefficients of different mathematical models for formulations F-1 to F-13
Formulations Zero order
R2
First order R
2 Higuchi’s
R2
Korsmeyer-peppas
R2
n value
F1 0.959 0.582 0.888 0.972 0.949
F2 0.932 0.714 0.869 0.972 0.995
F3 0.944 0.798 0.860 0.971 0.967
F4 0.978 0.683 0.862 0.976 0.981
F5 0.948 0.598 0.833 0.959 0.986
F6 0.988 0.890 0.886 0.983 0.978
F7 0.681 0.287 0.760 0.861 0.963
F8 0.720 0.491 0.789 0.871 0.993
F9 0.807 0.469 0.813 0.917 0.951
F10 0.892 0.543 0.867 0.941 0.974
F11 0.966 0.899 0.882 0.972 0.987
F12 0.991 0.896 0.884 0.973 0.979
F13 0.969 0.869 0.839 0.959 0.985
Table 16: Physical appearance of optimized formulation after stability studies:
Temp. and relative humidity Days Parameters
0 30 60 90
250
C± 20
C / 60% ± 5% RH
No change
Physical appearance
300
C± 20
C / 65% ± 5% RH
400
C± 20
C / 75% ± 5% RH

IAJPS, 2014, Volume1, Issue (5), 359-372 Abdullah et al ISSN 2349-7750
w w w w . i a j p s . c o m
Page 372
Table 17: physical parameters of optimized formulation after stability studies:
No.of
days
Physical parameters
Hardness (Kg/cm2
) Friability (%) Drug content (%)
25±2°C
60±5%
RH
30±2°C
65±5%
RH
40±2°C
75±5%
RH
25±2°C
60±5%
RH
30±2°C
65±5%
RH
40±2°C
75±5%
RH
25±2°C
60±5%
RH
30±2°C
65±5%
RH
40±2°C
75±5%
RH
Initial 5.24+
0.08
4.94+
0.04
4.86 +
0.32
0.11 0.14 0.11 99.30 9
9
99.30
30 4.54 +
0.35
4.86 +
0.25
4.8 +
0.3
0.07 0.11 0.074 99.30 98.88 99.45
60 4.62 +
0.31
4.86 +
0.28
4.94 +
0.35
0.14 0.11 0.037 99.11 99.05 99.08
90 4.86 +
0.38
4.9+
03
4.82 +
0.03
0.074 0.074 0.037 99.18 98.91 99.21
REFERENCES:
1) Journal of clinical lipidology, volume1, issue3, july2007.
2) Goodman and Gilman’s the pharmacological basis of therapeutics, 10th
edition, 2001: 991-992 1758-
1760.
3) Modern pharmaceutics, revised and expanded, edited by Gilbert S. banker, Christopher T. Rhodes.
2002
4) Chein YW. Oral Drug delivery and delivery systems. In: Novel drug delivery systems. Marcel Dekker,
Inc., New York, 2002; 50; 3rd edition: 139-96.
5) Brahmankar DM, Jaiswal SB. “Biopharmaceutics and pharmacokinetics a treatise” 1st
ed.
Vallabh prakashan; New Delhi: 1995: 64-70.
6) Vyas SP, khar RK. “Controlled Drug Delivery. Concepts and Advances,” ed-2002: 155-195.
7) Sallsa T. Veiga F, Pina ME. oral controlled – release dosage forms Cellulose ether polymers in
hydrophilic – matrices. Drug Dev Ind Pharm. 1997; 23: 929– 938.
8) Alderman DA. A review of cellulose ethers in hydrophilic matrices for oral controlled – release dosage
forms. Int. S. Pharm. Tech,. Prod. Manuf. 1984;5:1-9.
9) Gohel MC, Patel TP, BarigyaSH. Studies in preparation and evaluation of pH independent sustained –
release matrix tablets of Verapamil Hcl using directly compressible Eudragits. Pharam Dev Technol,
2003; 8: 323 – 333. Pubmed Dol : 10. 1081 / PDT – 120024686.
10) Liv J, Zhang F, Mc GinityJw. Properties of lipophilic matrix tablets containing phenylpropanolamine
hydrochloride prepared by hot – met extrusion. Eur J pharm Biopharm, 2001l; 42: 181–190. Pubmed Dol:
10. 1016/ S0939 – 6411 (01) 00162-x.
Copyright © 2022 FDOKUMEN