
Design and Efficiency: Critical Drivers of Low-Carbon Growth
15
Design and Efficiency: Critical Drivers of Low-Carbon Growth STRATEGIC ENGAGEMENT AND ANALYSIS GROUP By: Rudy Kahsar Energy System Transformation for a 1.5°C Future
-
Upload
khangminh22 -
Category
Documents
-
view
0 -
download
0
Transcript of Design and Efficiency: Critical Drivers of Low-Carbon Growth
Design and Efficiency:Critical Drivers of Low-Carbon Growth
STRATEGIC ENGAGEMENT AND ANALYSIS GROUP
By: Rudy Kahsar
Energy System Transformation for a 1.5°C Future
Design and Efficiency: Critical Drivers of Low-Carbon Growth
2 | RMI.ORG
Businesses, governments, and other institutions are facing increasing pressure to mitigate the worst impacts of climate change by dramatically reducing emissions in line with the Paris Agreement. However, the strategists, analysts, and decision makers whose actions will shape the necessary market and policy transformations may be challenged to see past legacy modeling approaches and assumptions. These approaches and assumptions capture neither the massive economic opportunities for early movers nor the compounding risks of being left behind.
To strengthen this interface, RMI is releasing a series of insight briefs to help demystify the available tools for 1.5°C alignment, identify critical gaps that require complementary approaches, and highlight emerging opportunities to reinvent the future. These insights are bound by our assessment that a rapid transition to a low-carbon energy system is not only achievable, but also a source of growth, prosperity, and benefit for all.
The energy transition presents businesses with opportunities and risks. Efficient integrative design has been around a long time, but they still offer competitive advantages to companies that take them seriously. In this brief, we assess opportunities for achieving 1.5°C alignment through improved efficiency and design. We also diagnose why these opportunities are often undervalued in long-term climate and energy systems models, especially for newer technology spaces. We discuss the ways these models approach design and efficiency, paths for finding hidden opportunities in these areas, and recommendations for policymakers and businesses.
Sources
China 1971
Design and Efficiency: Critical Drivers of Low-Carbon Growth
3 | RMI.ORG
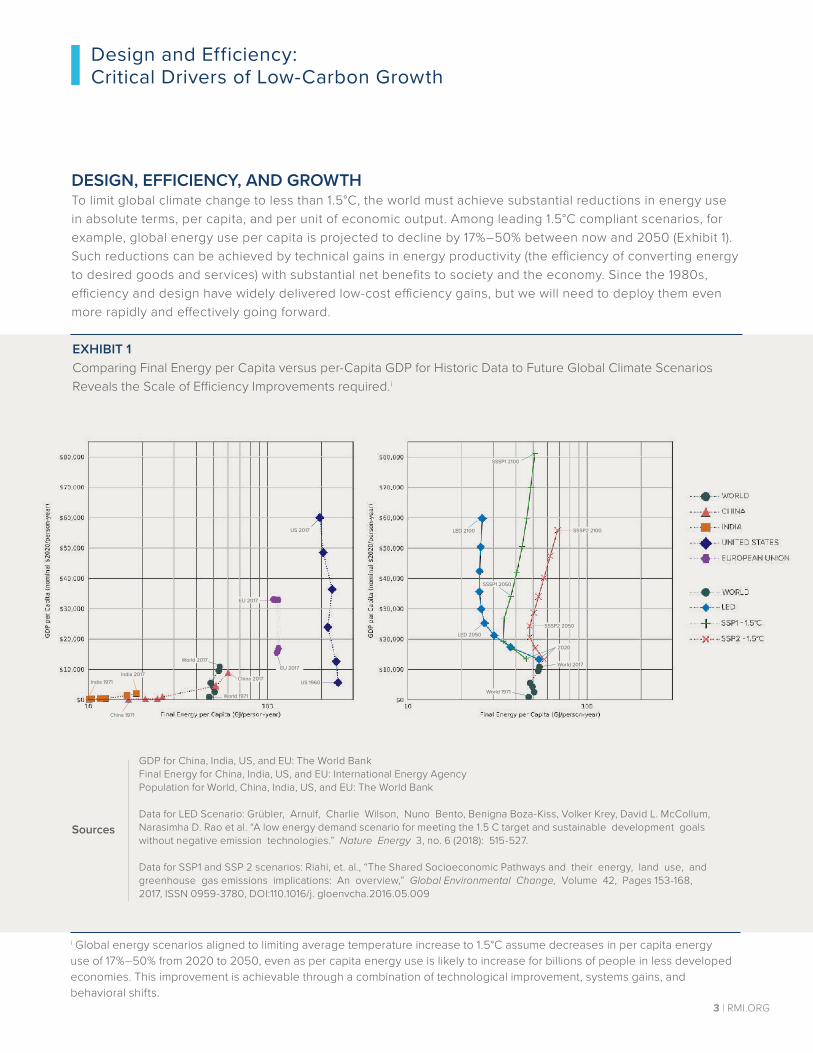
DESIGN, EFFICIENCY, AND GROWTHTo limit global climate change to less than 1.5°C, the world must achieve substantial reductions in energy use in absolute terms, per capita, and per unit of economic output. Among leading 1.5°C compliant scenarios, for example, global energy use per capita is projected to decline by 17%–50% between now and 2050 (Exhibit 1). Such reductions can be achieved by technical gains in energy productivity (the efficiency of converting energy to desired goods and services) with substantial net benefits to society and the economy. Since the 1980s, efficiency and design have widely delivered low-cost efficiency gains, but we will need to deploy them even more rapidly and effectively going forward.
EXHIBIT 1 Comparing Final Energy per Capita versus per-Capita GDP for Historic Data to Future Global Climate Scenarios Reveals the Scale of Efficiency Improvements required.i
i Global energy scenarios aligned to limiting average temperature increase to 1.5°C assume decreases in per capita energy use of 17%–50% from 2020 to 2050, even as per capita energy use is likely to increase for billions of people in less developed economies. This improvement is achievable through a combination of technological improvement, systems gains, and behavioral shifts.
GDP for China, India, US, and EU: The World Bank Final Energy for China, India, US, and EU: International Energy AgencyPopulation for World, China, India, US, and EU: The World Bank
Data for LED Scenario: Grübler, Arnulf, Charlie Wilson, Nuno Bento, Benigna Boza-Kiss, Volker Krey, David L. McCollum, Narasimha D. Rao et al. “A low energy demand scenario for meeting the 1.5 C target and sustainable development goals without negative emission technologies.” Nature Energy 3, no. 6 (2018): 515-527.
Data for SSP1 and SSP 2 scenarios: Riahi, et. al., “The Shared Socioeconomic Pathways and their energy, land use, and greenhouse gas emissions implications: An overview,” Global Environmental Change, Volume 42, Pages 153-168, 2017, ISSN 0959-3780, DOI:110.1016/j. gloenvcha.2016.05.009
EU 2017
LED 2050
India 1971
World 2017
World 1971
China 2017
EU 2017
US 2017
US 1960
LED 2100
SSSP1 2050
SSSP1 2100
2020
SSSP2 2050
SSSP2 2100
World 2017
World 1971
India 2017
Design and Efficiency: Critical Drivers of Low-Carbon Growth
4 | RMI.ORG
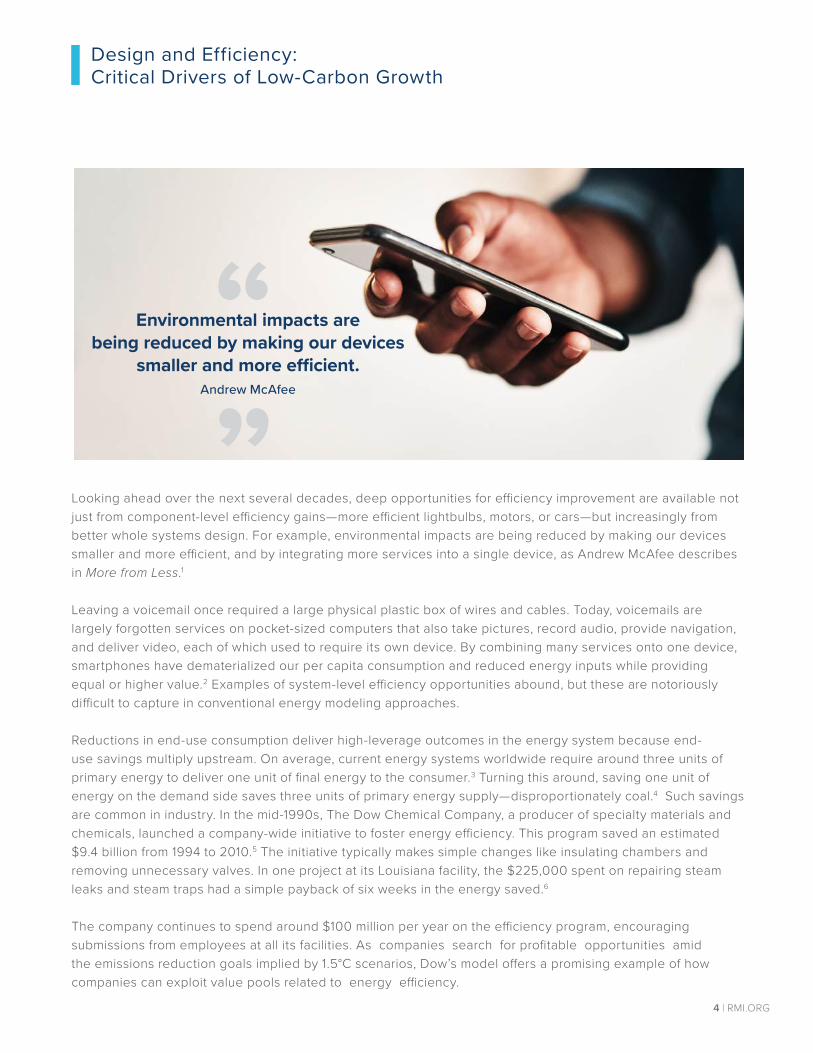
Looking ahead over the next several decades, deep opportunities for efficiency improvement are available not just from component-level efficiency gains—more efficient lightbulbs, motors, or cars—but increasingly from better whole systems design. For example, environmental impacts are being reduced by making our devices smaller and more efficient, and by integrating more services into a single device, as Andrew McAfee describes in More from Less.1
Leaving a voicemail once required a large physical plastic box of wires and cables. Today, voicemails are largely forgotten services on pocket-sized computers that also take pictures, record audio, provide navigation, and deliver video, each of which used to require its own device. By combining many services onto one device, smartphones have dematerialized our per capita consumption and reduced energy inputs while providing equal or higher value.2 Examples of system-level efficiency opportunities abound, but these are notoriously difficult to capture in conventional energy modeling approaches.
Reductions in end-use consumption deliver high-leverage outcomes in the energy system because end-use savings multiply upstream. On average, current energy systems worldwide require around three units of primary energy to deliver one unit of final energy to the consumer.3 Turning this around, saving one unit of energy on the demand side saves three units of primary energy supply—disproportionately coal.4 Such savings are common in industry. In the mid-1990s, The Dow Chemical Company, a producer of specialty materials and chemicals, launched a company-wide initiative to foster energy efficiency. This program saved an estimated $9.4 billion from 1994 to 2010.5 The initiative typically makes simple changes like insulating chambers and removing unnecessary valves. In one project at its Louisiana facility, the $225,000 spent on repairing steam leaks and steam traps had a simple payback of six weeks in the energy saved.6
The company continues to spend around $100 million per year on the efficiency program, encouraging submissions from employees at all its facilities. As companies search for profitable opportunities amid the emissions reduction goals implied by 1.5°C scenarios, Dow’s model offers a promising example of how companies can exploit value pools related to energy efficiency.
Environmental impacts are being reduced by making our devices
smaller and more efficient.Andrew McAfee
“”
Design and Efficiency: Critical Drivers of Low-Carbon Growth
5 | RMI.ORG
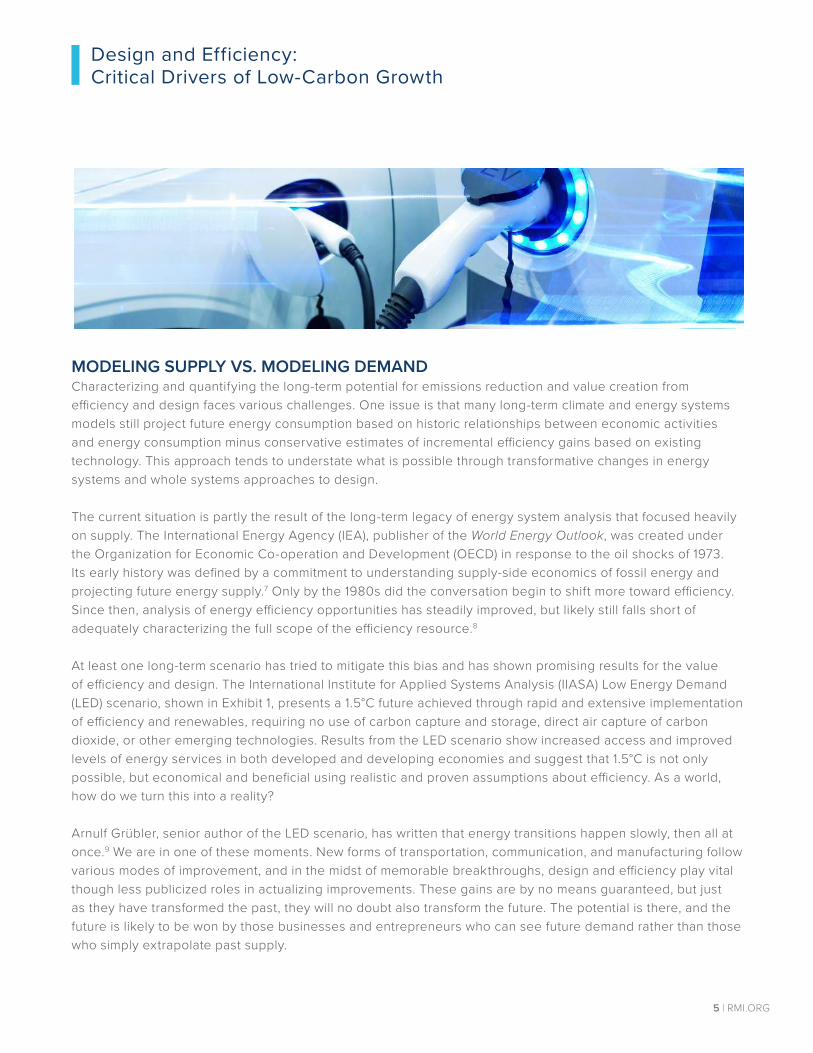
MODELING SUPPLY VS. MODELING DEMANDCharacterizing and quantifying the long-term potential for emissions reduction and value creation from efficiency and design faces various challenges. One issue is that many long-term climate and energy systems models still project future energy consumption based on historic relationships between economic activities and energy consumption minus conservative estimates of incremental efficiency gains based on existing technology. This approach tends to understate what is possible through transformative changes in energy systems and whole systems approaches to design.
The current situation is partly the result of the long-term legacy of energy system analysis that focused heavily on supply. The International Energy Agency (IEA), publisher of the World Energy Outlook, was created under the Organization for Economic Co-operation and Development (OECD) in response to the oil shocks of 1973. Its early history was defined by a commitment to understanding supply-side economics of fossil energy and projecting future energy supply.7 Only by the 1980s did the conversation begin to shift more toward efficiency. Since then, analysis of energy efficiency opportunities has steadily improved, but likely still falls short of adequately characterizing the full scope of the efficiency resource.8
At least one long-term scenario has tried to mitigate this bias and has shown promising results for the value of efficiency and design. The International Institute for Applied Systems Analysis (IIASA) Low Energy Demand (LED) scenario, shown in Exhibit 1, presents a 1.5°C future achieved through rapid and extensive implementation of efficiency and renewables, requiring no use of carbon capture and storage, direct air capture of carbon dioxide, or other emerging technologies. Results from the LED scenario show increased access and improved levels of energy services in both developed and developing economies and suggest that 1.5°C is not only possible, but economical and beneficial using realistic and proven assumptions about efficiency. As a world, how do we turn this into a reality?
Arnulf Grübler, senior author of the LED scenario, has written that energy transitions happen slowly, then all at once.9 We are in one of these moments. New forms of transportation, communication, and manufacturing follow various modes of improvement, and in the midst of memorable breakthroughs, design and efficiency play vital though less publicized roles in actualizing improvements. These gains are by no means guaranteed, but just as they have transformed the past, they will no doubt also transform the future. The potential is there, and the future is likely to be won by those businesses and entrepreneurs who can see future demand rather than those who simply extrapolate past supply.
Design and Efficiency: Critical Drivers of Low-Carbon Growth
6 | RMI.ORG
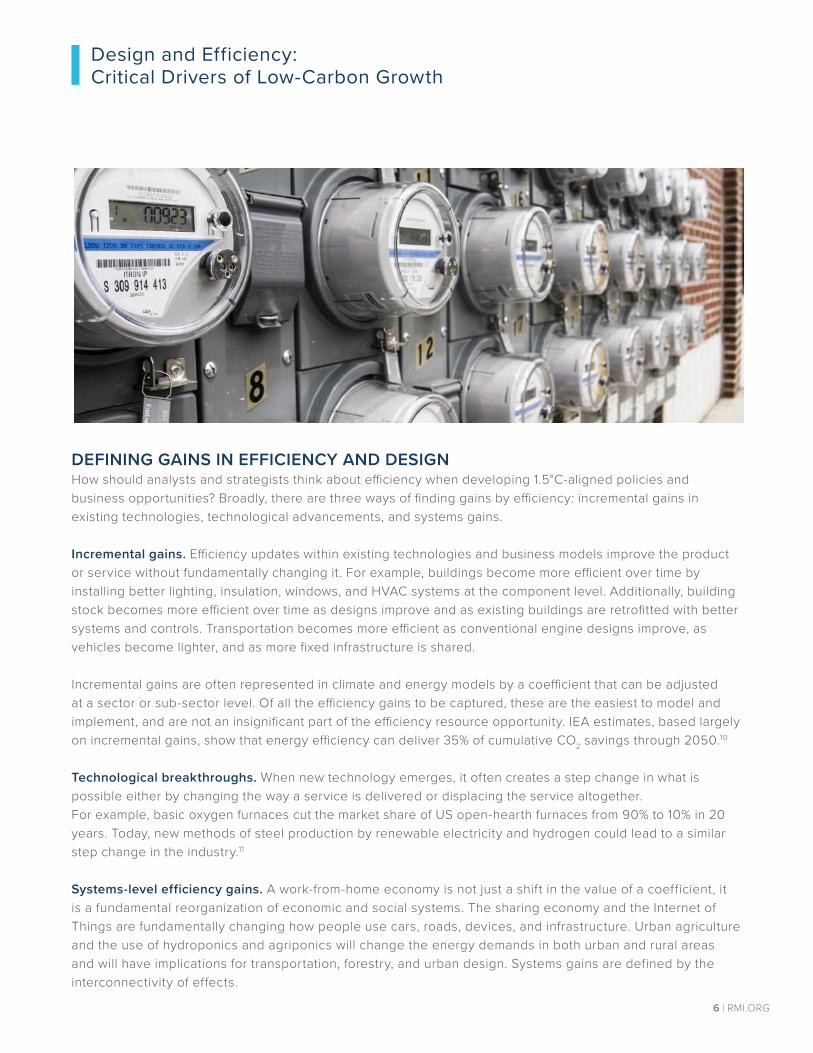
DEFINING GAINS IN EFFICIENCY AND DESIGNHow should analysts and strategists think about efficiency when developing 1.5°C-aligned policies and business opportunities? Broadly, there are three ways of finding gains by efficiency: incremental gains in existing technologies, technological advancements, and systems gains.
Incremental gains. Efficiency updates within existing technologies and business models improve the product or service without fundamentally changing it. For example, buildings become more efficient over time by installing better lighting, insulation, windows, and HVAC systems at the component level. Additionally, building stock becomes more efficient over time as designs improve and as existing buildings are retrofitted with better systems and controls. Transportation becomes more efficient as conventional engine designs improve, as vehicles become lighter, and as more fixed infrastructure is shared.
Incremental gains are often represented in climate and energy models by a coefficient that can be adjusted at a sector or sub-sector level. Of all the efficiency gains to be captured, these are the easiest to model and implement, and are not an insignificant part of the efficiency resource opportunity. IEA estimates, based largely on incremental gains, show that energy efficiency can deliver 35% of cumulative CO2 savings through 2050.10
Technological breakthroughs. When new technology emerges, it often creates a step change in what is possible either by changing the way a service is delivered or displacing the service altogether. For example, basic oxygen furnaces cut the market share of US open-hearth furnaces from 90% to 10% in 20 years. Today, new methods of steel production by renewable electricity and hydrogen could lead to a similar step change in the industry.11
Systems-level efficiency gains. A work-from-home economy is not just a shift in the value of a coefficient, it is a fundamental reorganization of economic and social systems. The sharing economy and the Internet of Things are fundamentally changing how people use cars, roads, devices, and infrastructure. Urban agriculture and the use of hydroponics and agriponics will change the energy demands in both urban and rural areas and will have implications for transportation, forestry, and urban design. Systems gains are defined by the interconnectivity of effects.
Design and Efficiency: Critical Drivers of Low-Carbon Growth
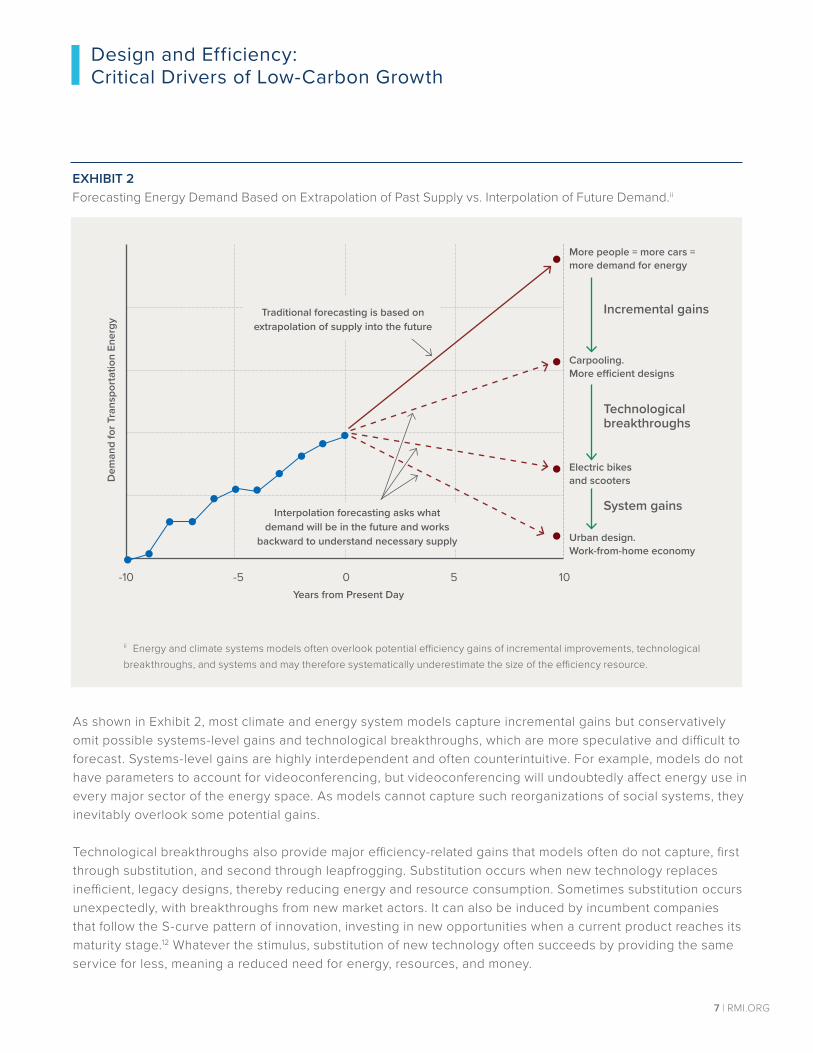
As shown in Exhibit 2, most climate and energy system models capture incremental gains but conservatively omit possible systems-level gains and technological breakthroughs, which are more speculative and difficult to forecast. Systems-level gains are highly interdependent and often counterintuitive. For example, models do not have parameters to account for videoconferencing, but videoconferencing will undoubtedly affect energy use in every major sector of the energy space. As models cannot capture such reorganizations of social systems, they inevitably overlook some potential gains.
Technological breakthroughs also provide major efficiency-related gains that models often do not capture, first through substitution, and second through leapfrogging. Substitution occurs when new technology replaces inefficient, legacy designs, thereby reducing energy and resource consumption. Sometimes substitution occurs unexpectedly, with breakthroughs from new market actors. It can also be induced by incumbent companies that follow the S-curve pattern of innovation, investing in new opportunities when a current product reaches its maturity stage.12 Whatever the stimulus, substitution of new technology often succeeds by providing the same service for less, meaning a reduced need for energy, resources, and money.
7 | RMI.ORG
ii Energy and climate systems models often overlook potential efficiency gains of incremental improvements, technological breakthroughs, and systems and may therefore systematically underestimate the size of the efficiency resource.
EXHIBIT 2Forecasting Energy Demand Based on Extrapolation of Past Supply vs. Interpolation of Future Demand.ii
Years from Present Day-10 -5 0 5 10
Dem
and
for T
rans
porta
tion
Ener
gy
More people = more cars =more demand for energy
Carpooling. More efficient designs
Electric bikes and scooters
Urban design. Work-from-home economy
Incremental gains
Technologicalbreakthroughs
System gains
Traditional forecasting is based onextrapolation of supply into the future
Interpolation forecasting asks whatdemand will be in the future and works
backward to understand necessary supply
Design and Efficiency: Critical Drivers of Low-Carbon Growth
Leapfrogging happens when technological breakthroughs supersede legacy technologies altogether. This is especially true in developing parts of the world where countries have the opportunity to skip over the highly inefficient technologies of the 20th century and move straight to electric vehicles, wireless mobile technology, and microgrids. This reduces the need for resources, raw materials, energy, and all the inefficient designs that were necessary to bring the world into the 21st century.
Even with incremental change, models sometimes overlook opportunities by failing to capture the speed of change. The IEA’s models, for example, have consistently underestimated the decreasing cost of solar, wind power, and storage as well as the shift to new forms of energy efficiency, including LED lights and better insulation. Given that climate and energy systems models miss on individual incremental gains, they must also miss on systems-level gains. The next section will discuss some of the opportunities that businesses can pursue to capture these gains.
DESIGN AND EFFICIENCY IN PRACTICEAlready, digital economies, demographic shifts, and the energy transition are reshaping societies. The businesses of the future will be subject to new energy and environmental pressures, exposing them to new opportunities, risks, and challenges. Just as efficiency was a business opportunity in the 1980s, it is also a business opportunity today. The IIASA LED scenario estimates that the world can achieve a total global final energy demand in 2050 that is 40% lower than 2018 despite worldwide per capita GDP nearly doubling.13
Some of today’s most successful businesses are already looking at the core principles of efficiency and design to achieve competition-beating gains. Vestas’ use of additive manufacturing reduced the fabrication time of blades from 27 to 20 weeks and eliminated the need for plugs and wires in the manufacturing process.14 Maersk has partnered with its customers to identify inefficiencies in global supply chains and reduce shipping distances, energy use, and emissions.15 Unilever has saved well over €1 billion since 2008 through efficiency improvements in energy, water, and materials in its manufacturing.16
Many of these savings are aligned with the principles of natural capitalism, which productively uses and reinvests in not only financial and physical capital but also natural and human capital.17 Reducing waste frequently presents a business opportunity. Sourcing environmentally benign materials reduces disposal costs. Designing closed loop manufacturing processes closes the loop on materials. Addressing climate emissions can be a path to sustainability and profit.18 In many cases, biology and ecology can serve as guides for implementation; the natural world is masterfully efficient.
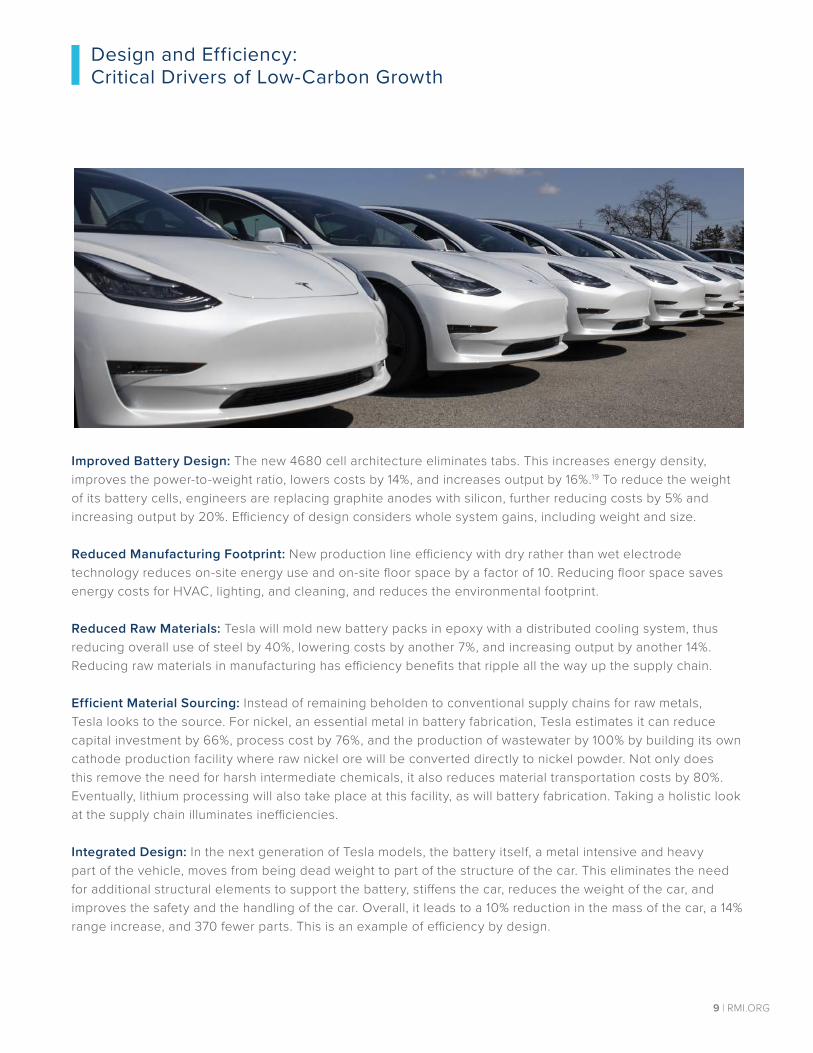
Tesla: A Case Study in Design and EfficiencyTesla’s September 2020 Battery Day announcement provided a case study of how a strategic commitment to efficiency and design can save energy, resources, and money while providing better value, better competitiveness, and in this case, better performance. By looking at its entire supply chain, start to finish, and applying the concepts of efficiency and design, Tesla presented a revised workstream that reduced costs by more than 50%. Here is how:
8 | RMI.ORG
Design and Efficiency: Critical Drivers of Low-Carbon Growth
9 | RMI.ORG
Improved Battery Design: The new 4680 cell architecture eliminates tabs. This increases energy density, improves the power-to-weight ratio, lowers costs by 14%, and increases output by 16%.19 To reduce the weight of its battery cells, engineers are replacing graphite anodes with silicon, further reducing costs by 5% and increasing output by 20%. Efficiency of design considers whole system gains, including weight and size.
Reduced Manufacturing Footprint: New production line efficiency with dry rather than wet electrode technology reduces on-site energy use and on-site floor space by a factor of 10. Reducing floor space saves energy costs for HVAC, lighting, and cleaning, and reduces the environmental footprint.
Reduced Raw Materials: Tesla will mold new battery packs in epoxy with a distributed cooling system, thus reducing overall use of steel by 40%, lowering costs by another 7%, and increasing output by another 14%. Reducing raw materials in manufacturing has efficiency benefits that ripple all the way up the supply chain.
Efficient Material Sourcing: Instead of remaining beholden to conventional supply chains for raw metals, Tesla looks to the source. For nickel, an essential metal in battery fabrication, Tesla estimates it can reduce capital investment by 66%, process cost by 76%, and the production of wastewater by 100% by building its own cathode production facility where raw nickel ore will be converted directly to nickel powder. Not only does this remove the need for harsh intermediate chemicals, it also reduces material transportation costs by 80%. Eventually, lithium processing will also take place at this facility, as will battery fabrication. Taking a holistic look at the supply chain illuminates inefficiencies.
Integrated Design: In the next generation of Tesla models, the battery itself, a metal intensive and heavy part of the vehicle, moves from being dead weight to part of the structure of the car. This eliminates the need for additional structural elements to support the battery, stiffens the car, reduces the weight of the car, and improves the safety and the handling of the car. Overall, it leads to a 10% reduction in the mass of the car, a 14% range increase, and 370 fewer parts. This is an example of efficiency by design.
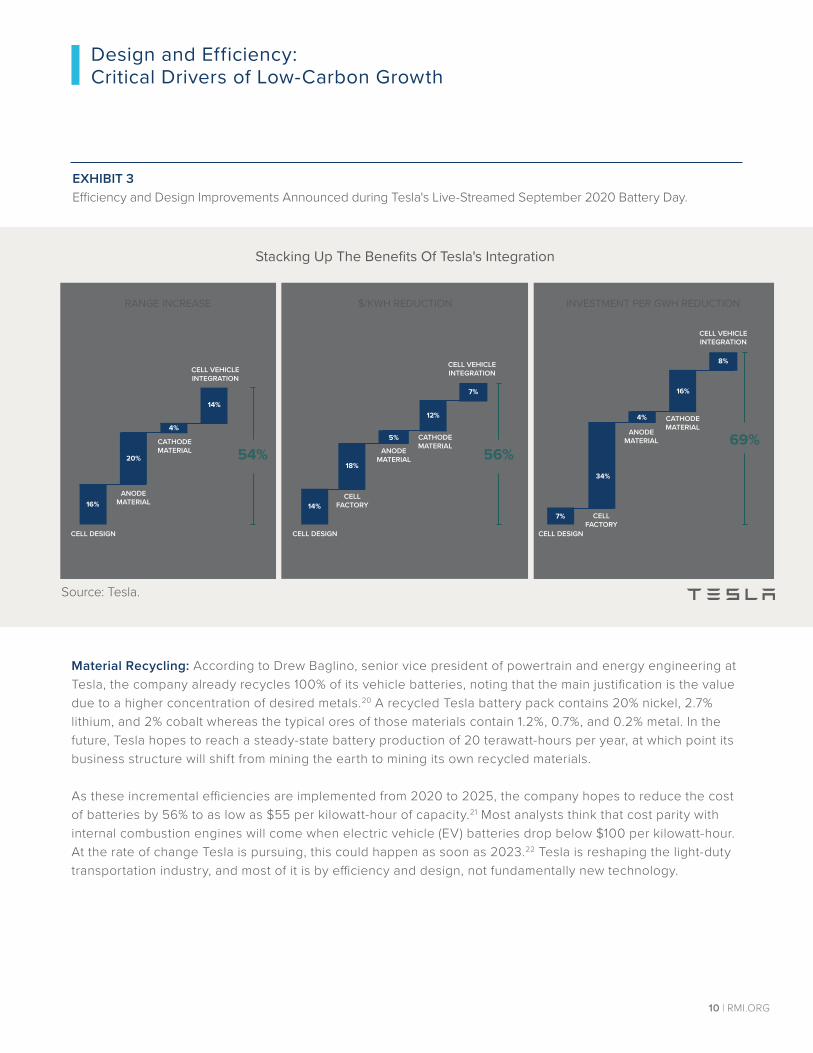
Source: Tesla.
Stacking Up The Benefits Of Tesla's Integration
CELL DESIGN
ANODE MATERIAL
CATHODE MATERIAL
CELL VEHICLE INTEGRATION
54%
16%
20%
4%
14%
CELL DESIGN
CELL FACTORY
CATHODE MATERIAL
CELL VEHICLE INTEGRATION
56%
14%
18%
5%
12%
ANODE MATERIAL
7%
CELL DESIGN
CELL FACTORY
CATHODE MATERIAL
CELL VEHICLE INTEGRATION
69%
7%
34%
4%
16%
ANODE MATERIAL
8%
RANGE INCREASE $/KWH REDUCTION INVESTMENT PER GWH REDUCTION
Design and Efficiency: Critical Drivers of Low-Carbon Growth
10 | RMI.ORG
Material Recycling: According to Drew Baglino, senior vice president of powertrain and energy engineering at Tesla, the company already recycles 100% of its vehicle batteries, noting that the main justification is the value due to a higher concentration of desired metals.20 A recycled Tesla battery pack contains 20% nickel, 2.7% lithium, and 2% cobalt whereas the typical ores of those materials contain 1.2%, 0.7%, and 0.2% metal. In the future, Tesla hopes to reach a steady-state battery production of 20 terawatt-hours per year, at which point its business structure will shift from mining the earth to mining its own recycled materials.
As these incremental efficiencies are implemented from 2020 to 2025, the company hopes to reduce the cost of batteries by 56% to as low as $55 per kilowatt-hour of capacity.21 Most analysts think that cost parity with internal combustion engines will come when electric vehicle (EV) batteries drop below $100 per kilowatt-hour. At the rate of change Tesla is pursuing, this could happen as soon as 2023.22 Tesla is reshaping the light-duty transportation industry, and most of it is by efficiency and design, not fundamentally new technology.
EXHIBIT 3Efficiency and Design Improvements Announced during Tesla's Live-Streamed September 2020 Battery Day.
Design and Efficiency: Critical Drivers of Low-Carbon Growth
11 | RMI.ORG
RECOMMENDATIONS Businesses and policymakers can usefully take advantage of long-term climate and energy systems models to better understand the size of the challenges in target sectors of geographies, but they should not be constrained by them in imagining solutions. As Mark Twain wrote, “you can’t trust your eyes when your imagination is out of focus.” Here are some recommendations to help expand the opportunity space, consider innovative approaches, and prepare for a fast-changing future.
Draw the box differently. Just because the future presents opportunities does not mean those opportunities are easily captured. Split incentives, system dependencies, and lack of data all put pressure on maintaining the status quo.
For example, efficiency savings in a rented residential or commercial space typically benefit the tenant (who pays the utility bills), but must be organized, approved, and paid for by the building owner. Policymakers should consider new incentives such as utility-managed on-bill financing that realign incentives and allow tenants, owners, and the utility to benefit.23 In the business space, lack of data and organizational modularity can result in similarly misaligned incentives such as siloed units failing to see synergistic opportunities. Senior management and consultants are best positioned to see these inefficiencies and should be vigilant in stamping them out.24
Innovate up and down supply chain. The journey into the future involves a commitment to creativity and innovation. As the Tesla case study illustrates, such gains can take many forms. Ask questions of your company. How will shrinking devices reduce the need for raw materials? How can materials and systems be designed to save materials and transportation costs? What can be done to close the loop on consumables such as plastics, electronics, and industrial materials? Companies should develop a data strategy to understand where inefficiencies lie in supply chains, production, and manufacturing; they should be creative, and they should consider working with suppliers and aligning incentives where possible.
Pursue service-oriented business models. Service-based business models focus on the flow of services rather than the sale of goods. For example, a company might provide the experience of a movie rather than selling a physical recording of that movie. Another company might provide illumination rather than light bulbs; another might provide transportation services instead of selling vehicles.
A service-oriented business allows for the sharing of material goods and an attendant decrease in the demand for raw materials and processing steps necessary to make those physical goods. For example, personal light-duty vehicles are estimated to be used only about 5% of the time. A ride-sharing program that doubled their use to 10% of the time could reduce the need for the raw materials and processing throughout the supply chain by half.25 A car company might balk at this change portending lower sales. However, given that the same number of people will still need transportation, a better reaction would be for the company to reinvent itself as a transportation service company. With this framing, costs just decreased by half while consumer demand remained steady.
Design and Efficiency: Critical Drivers of Low-Carbon Growth
12 | RMI.ORG
Look for step changes. Incremental gains in car engines sustained the auto industry for years, but the emergence of EVs jolted the passenger vehicle market into a whole new paradigm practically overnight. Now incumbents are rushing to catch up. Volvo has announced plans for 50% of sales to be electric by 2025.26 Volkswagen plans to produce 1.5 million EVs by 2025.27 GM claims to be on its way to an “all-electric future.”28 The car industry will never look the same as it did 10 years ago, and in 10 years, the most successful companies will be those that saw value beyond extrapolation of the status quo. Keep an eye out for technology that has the potential to reshape an industry.
Cover your assets. Energy, climate, and sustainability are changing quickly, and complacency could leave your business burdened with stranded assets and liabilities. The fast-decreasing costs of renewables and storage could mark an end to thermal power sooner than models suggest. According to CarbonTracker, fossil energy profits in a 1.5°C aligned future will be $100 trillion less to 2050 than they would have been in business-as-usual scenario.29 Other liabilities include commercial building space, traditional material supply chains, and public transit infrastructure in a work-from-home economy. Assuming a disruptive future, investors and businesses should consider what assets might present risk and consider new approaches to delivering products and services.
In 1999, Harvard Business Review ran an article on why good companies go bad.30 Author Donald Sull argued that companies can see the impending changes in business conditions and that they often do respond with a flurry of activity, but that despite their efforts, they still falter. The problem is not that companies fail to take action but that they fail to take appropriate action. They fail to adapt not because they lack effort, but because of active inertia: they are unable to escape established patterns of behavior.
Predicting the future is, of course, notoriously difficult, but predicting the future without any allowance for change is blind to the ways in which the future guarantees risks just as it is blind to the ways in which it offers opportunities. Efficiency and design were revolutionary in the past. They can still be revolutionary today.
13 | RMI.ORG
10. IEA (2018), “Economic value of energy efficiency can drive reductions in global CO2 emissions,” Accessed November 16, 2020, https://www.iea.org/news/economic-value-of-energy-efficiency-can-drive-reductions-in-global-co2-emissions.
11. Thomas Koch Blank. The Disruptive Potential of Green Steel, September 2019, Accessed December 5, 2020, https://rmi.org/insight/the-disruptive-potential-of-green-steel/
12. Tim Enalls, “The S-Curve Pattern of Innovation: A Full Analysis,” Analytics Explained, April 8, 2017, https://analyticsexplained.com/the-s-curve-pattern-of-innovation-a-full-analysis/.
13. Grübler, Arnulf, Charlie Wilson, Nuno Bento, Benigna Boza-Kiss, Volker Krey, David L. McCollum, Narasimha D. Rao et al. “A low energy demand scenario for meeting the 1.5 C target and sustainable development goals without negative emission technologies.” Nature Energy 3, no. 6 (2018): 515-527.
14. Brian K. Post, Additive Manufacturing in Wind Turbine Components and Tooling, Oak Ridge National Laboratory, https://www.energy.gov/sites/prod/files/2019/05/f62/ORNL-T13-Post%204_2_19.pdf.
15. Maersk, “Efficiency meets cost savings,” July 16, 2020, https://www.maersk.com/news/articles/2020/07/16/efficiency-meets-cost-savings.
16. Unilever, “Eco-efficiency in our operations,” Accessed November 16, 2020, https://www.unilever.com/sustainable-living/reducing-environmental-impact/eco-efficiency-in-our-operations/.
1. Andrew McAfee, More from Less: The Surprising Story of How We Learned to Prosper Using Fewer Resources—and What Happens Next, 2019, Scribner.
2. Andrew McAfee, “How the iPhone helped save the planet,” Wired, June 29, 2019, Accessed November 16, 2020, https://www.wired.com/story/iphone-environment-consumption/.
3. IEA Statistics (2019). World energy balances (Database).
4. Amory B. Lovins et al., “Recalibrating Climate Prospects,” Environmental Research Letters 14, no. 12 (2019): 120201.
5. Lora Kolodny. “Dow Chemical Spending $100 Million On Energy Efficiency, Emissions Reduction,” Tech Crunch, February 28, 2011, Accessed November 16, 2020, https://techcrunch.com/2011/02/28/dowchemical-incentivizing-energy-efficiency/.
6. “Dow Chemical Company: Assessment Leads to Steam System Energy Savings in a Petrochemical Plant,” EERE, November 2007, Acccessed November 16, 2020, https://www.energy.gov/sites/prod/files/2014/05/f16/dowassessmentsavings.pdf.
7. Schleich, J. (2007). “The economics of energy efficiency: barriers to profitable investments,” EIB papers, 12(2), 82-109. https://www.econstor.eu/bitstream/10419/44886/1/539674605.pdf.
8. Sathaye, J. (2011). Bottom-up representation of industrial energy efficiency technologies in integrated assessment models for the cement sector, Lawrence Berkeley National Laboratory, https://escholarship.org/uc/item/0xt5x113.
9. Arnulf Grubler (2012). “Energy transitions research: Insights and cautionary tales.” Energy Policy, 50, 8-16.
Endnotes
Design and Efficiency: Critical Drivers of Low-Carbon Growth
https://www.iea.org/news/economic-value-of-energy-efficiency-can-drive-reductions-in-global-co2-emis
https://www.iea.org/news/economic-value-of-energy-efficiency-can-drive-reductions-in-global-co2-emis
https://www.iea.org/news/economic-value-of-energy-efficiency-can-drive-reductions-in-global-co2-emis
https://www.unilever.com/sustainable-living/reducing-environmental-impact/eco-efficiency-in-our-oper
https://www.unilever.com/sustainable-living/reducing-environmental-impact/eco-efficiency-in-our-oper
https://www.unilever.com/sustainable-living/reducing-environmental-impact/eco-efficiency-in-our-oper
25. Shoup, Donald, The high cost of free parking: Updated edition, Routledge, 2017.
26. Volvo, “The Future is Electric,” Accessed November 16, 2020, https://group.volvocars.com/company/innovation/electrification.
27. Volkswagen, “Volkswagen significantly raises electric car production forecast for 2025,” December 27, 2019, https://www.volkswagen-newsroom.com/en/press-releases/volkswagen-significantly-raises-electric-car-production-forecast-for-2025-5696.
28. General Motors, “Our Path to an All-Electric Future,” Accessed November 16, 2020, https://www.gm.com/electric-vehicles.html.
29. Amy Cortese, “Mispriced risk: The fossil fuel industry’s $100 trillion blindspot,” Impact Alpha, June 4, 2020, https://impactalpha.com/the-fossil-fuel-industrys-100-trillion-blindspot/.
30. Sull, D. N. (2005). “Why good companies go bad and how great managers remake them,” Harvard Business Press, https://hbr.org/1999/07/why-good-companies-go-bad.
14 | RMI.ORG
17. Lovins, A. B., Lovins, L. H., & Hawken, P. (1999), “A road map for natural capitalism,” Harvard Business Review. https://hbr.org/2007/07/a-road-map-for-natural-capitalism.
18. Amory Lovins, Climate: Making Sense and Making Money, Rocky Mountain Institute, 1997, https://rmi.org/insight/climate-making-sense-and-making-money/.
19. Tesla 2020 Annual Shareholder Meeting and Battery Day (2020). https://www.youtube.com/watch?v=l6T9xIeZTds.
20. Tesla 2020 Annual Shareholder Meeting and Battery Day Live Stream, 2020. https://www.youtube.com/watch?v=l6T9xIeZTds.
21. Mark Irvine and Mats Rinaldo, “Tesla’s Battery Day And The Energy Transition,” DNV GL, October 2020, https://www.dnvgl.com/feature/tesla-battery-day-energy-transition.html.
22. Dan Gearino, “Inside Clean Energy: How Soon Will An EV Cost the Same as a Gasoline Vehicle? Sooner Than You Think,” July 30, 2020, https://insideclimatenews.org/news/29072020/inside-clean-energy-electric-vehicle-agriculture-truck-costs.
23. Bird, Stephen, and Diana Hernández. "Policy options for the split incentive: Increasing energy efficiency for low-income renters," Energy Policy 48 (2012): 506-514.
24. Lovins, A. B., Ürge-Vorsatz, D., Mundaca, L., Kammen, D. M., & Glassman, J. W. (2019), “Recalibrating climate prospects,” Environmental Research Letters, 14(12), 120201. https://iopscience.iop.org/article/10.1088/1748-9326/ab55ab.
Using Climate and Energy Scenarios to Inform Strategy and Policy
Endnotes
https://www.volkswagen-newsroom.com/en/press-releases/volkswagen-significantly-raises-electric-car-p
https://www.volkswagen-newsroom.com/en/press-releases/volkswagen-significantly-raises-electric-car-p
https://www.volkswagen-newsroom.com/en/press-releases/volkswagen-significantly-raises-electric-car-p
https://www.volkswagen-newsroom.com/en/press-releases/volkswagen-significantly-raises-electric-car-p
https://insideclimatenews.org/news/29072020/inside-clean-energy-electric-vehicle-agriculture-truck-c
https://insideclimatenews.org/news/29072020/inside-clean-energy-electric-vehicle-agriculture-truck-c
https://insideclimatenews.org/news/29072020/inside-clean-energy-electric-vehicle-agriculture-truck-c

22830 Two Rivers Road
Basalt, CO, 81621 USA
www.rmi.org
© February 2021 RMI. All rights reserved. Rocky Mountain Institute® and
RMI® are registered trademarks.