ANALYSIS OF INNOVATION DRIVERS AND BARRIERS - WIFO
285
ANALYSIS OF INNOVATION DRIVERS AND BARRIERS IN SUPPORT OF BETTER POLICIES Economic and Market Intelligence on Innovation Barriers to internationalisation and growth of EU's innovative companies Final Report Prepared for: European Commission Directorate-General Enterprise Unit D1 Innovation Policy Development Prepared by: Austrian Institute of Economic Research (WIFO), and Fraunhofer Institut für System- und Innovationsforschung (ISI) Vienna, November 15 th 2010 Project consortium Austrian Institute of Economic Research, WIFO, Vienna, (coordination). Fraunhofer Institut für System- und Innovationsforschung, ISI, Karlsruhe. Greenovate! Europe, Brussels. NIFU Step, Oslo. UNU-Merit, Maastricht. MCI Innsbruck, Innsbruck, (subcontractor).
-
Upload
khangminh22 -
Category
Documents
-
view
3 -
download
0
Transcript of ANALYSIS OF INNOVATION DRIVERS AND BARRIERS - WIFO

ANALYSIS OF INNOVATION DRIVERS AND BARRIERS
IN SUPPORT OF BETTER POLICIES Economic and Market Intelligence on Innovation
Barriers to internationalisation and growth of EU's innovative
companies
Final Report
Prepared for:
European Commission Directorate-General Enterprise Unit D1 Innovation Policy Development
Prepared by:
Austrian Institute of Economic Research (WIFO), and
Fraunhofer Institut für System- und Innovationsforschung (ISI)
Vienna, November 15th 2010
Project consortium
Austrian Institute of Economic Research, WIFO, Vienna, (coordination).
Fraunhofer Institut für System- und Innovationsforschung, ISI, Karlsruhe.
Greenovate! Europe, Brussels.
NIFU Step, Oslo.
UNU-Merit, Maastricht.
MCI Innsbruck, Innsbruck, (subcontractor).
ii
Authors (in alphabetical order by institute)
Werner Hölzl (WIFO, chapters 3 and 6),
Jürgen Janger (WIFO, chapters 3 and 6),
Andreas Reinstaller (WIFO, overall coordination, chapters 1, 2, 4, 5, 6, 7),
Isabel Stadler (WIFO, chapters 2, 3, 4)
Fabian Unterlass (WIFO, overall coordination, chapters 2 and 4),
Stephanie Daimer (Fraunhofer ISI, chapters 4 and 6),
Thomas Stehnken (Fraunhofer ISI, chapters 4 and 6).
Referees for this report
Bernd Ebersberger, MCI Innsbruck
Paul Cunningham, MIoIR Manchester University
Note: The referees have provided highly valuable comments that have led to a substantial improvement of this report. The authors are responsible for any remaining mistakes.
Acknowledgements
We are particularly indebted to Sergiu Parvan from Eurostat, who supported and very efficiently managed our stays at the Safe Centre at Eurostat in Luxembourg. We are also grateful to the referees of this report who made important suggestions for improvement, and Cesar Santos from the European Commission for his guidance. The participants of the INNO-Grips workshop held on September 28th 2010 in Brussels also provided very valuable comments that have led to a substantial improvement of this report.
Suggested citation
Reinstaller A. (coord.), Hölzl, W., Janger J., Stadler, I., Unterlass F., Daimer S., Stehnken, T. (2010). Barriers to internationalisation and growth of EU's innovative companies. PRO INNO Europe: INNO-Grips II report, Brussels: European Commission, DG Enterprise and Industry.
iii
Foreword
"INNO-Grips" (short for "Global Review of Innovation Policy Studies") is supporting policy makers in adopting appropriate policy responses to emerging innovation needs, trends and phenomena. It analyses framework conditions, barriers and drivers to innovation and innovation policy and offers intelligence on international developments in these fields.
Over a period of three years (2010-2012) INNO-Grips will conduct studies and organise workshops to exchange views, ideas and best practices with innovation stakeholders in order to optimise innovation policy Europe-wide. These key activities will be complemented by a news service about international innovation policy developments, covering about 40 countries worldwide, and further dissemination activities such as newsletters. Target audiences are invited to discuss the results of studies and related issues in an interactive online environment (the INNO-Grips blog). INNO-Grips is thus a platform for all stakeholders involved in the practice of innovation and in innovation policy, in particular innovation policy makers at the EU, national and regional levels; innovation intermediaries such as innovation agencies and knowledge transfer centres; innovation practitioners and academia conducting research on innovation dynamics.
Technically, INNO-Grips consists of two lots. The first one – "Innovation policy research and intelligence" – gathers evidence on innovation policy developments worldwide and analyses specific aspects and trends in detail. The second lot – "Economic and market intelligence on innovation" – analyses framework conditions (e.g. implications of socio-economic trends), barriers and drivers to innovation at firm level. This report is the first in a series of six studies in the context of the second lot which will investigate the following topics:i
1. Barriers to internationalisation and growth of EU's innovative companies
2. Socio-economic trends for innovation policy
3. Open innovation and other new forms of collaboration
4. Social attitudes to innovation and entrepreneurship
5. The role of multinational companies and supply chains in innovation
6. The new nature of innovation
These studies will be delivered in close coordination with the representatives of the European Commission and in close interaction with the service providers of the other PRO INNO Europe activities. All studies are of high relevance to the activities set in the context of the Flagship Initiative "Innovation Union" carried out as part of the new Strategy Europe 2020.
WIFO is the lead partner of the "Economic and market intelligence on innovation" studies and is also responsible for the coordination of activities with the European Commission. The partner institutions in this project are NIFU-Step based in Oslo, UNU-Merit based in Maastricht, the
i See http://www.proinno-europe.eu/inno-grips-ii/page/studies for more details.
iv
Fraunhofer Institute for Systems and Innovation Research (ISI) based in Karlsruhe, and the Management Center Innsbruck. Greenovate! Europe will support all dissemination activities. Each study will be presented and discussed at workshops organised by the Consortium in close cooperation with the European Commission. The workshops will serve to present the findings and conclusions as well as the derived policy recommendations to a qualified audience of stakeholders, representatives of the business community, policy makers, and leading academics for external validation.
The present report focuses on the "Barriers to internationalisation and growth of EU's innovative companies". The terms of reference established that this study should cover the following topics:
An analysis on how international trade barriers (non-EU markets) as well as language and other cultural barriers affect the ability of Europe's companies to innovate and internationalise;
An analysis of existing support services to internationalisation
An analysis of different barriers to innovation with focus on:
Access to finance
IPRs
Regulatory or market barriers & standards
Skill shortages
v
Executive summary
Innovation and internationalisation boost employment and productivity growth.
The aim of the present report is to examine the drivers and barriers to internationalisation of Europe’s innovative firms. It has studied the relationship between innovation and internationalisation, and reviewed the policies at the EU and national levels supporting firms in these activities.
This report shows that innovative companies are more likely to export. They are more productive and therefore internationally more competitive. Exporting in turn has a positive impact on innovation. Hence, exporting and innovation are complementary strategies that result in higher export shares, turnover and employment growth at the firm level. Innovation is an important driver for productivity growth, but there are differences across EU Member States and industries with respect to how innovation affects economic performance. In industries with medium to low innovation intensity productivity growth is mainly driven by process innovations. In industries with high innovation intensity especially in the member states that are technologically more advanced productivity growth in turn depends more heavily on product innovations. This reflects the fact that one of the important determinants of economic convergence in the EU is technological upgrading. Firms in the economically less advanced member states improve their competitiveness through technology transfer and by exploiting their cost advantages on export markets. In these countries firm start internationalising by importing technologies and knowledge from more advanced firms and countries first. However, as the potential of the technological upgrading strategy is exhausted continuous R&D and product innovation become gradually more relevant for competition and successful engagement in foreign markets. This process determines the drivers of innovation and internationalisation at each stage and also the perception of barriers constraining these activities by companies. This evidence leads to the following conclusions:
Policies supporting innovation and internationalisation should be linked up. It is also advisable to design policy support measures that stimulate innovation and internationalisation at the same time.
The observed pattern of technology upgrading calls for a differentiated policy approach to innovation and internationalisation across countries.
Remove barriers to innovation to spur internationalisation
Innovation is an important driver of internationalisation at the firm level. Barriers to innovation therefore act also as barriers to internationalisation. The report has confirmed the existence of substantial barriers to innovation with respect to knowledge on markets and technologies, access to finance and the shortage of skilled labour. The analysis of these barriers shows that there are differences across firm types and across country groups.
Small firms and firms that are not part of a larger corporate group are more likely to experience knowledge barriers.
vi
Financial barriers are particularly important for SMEs producing very novel products and technologies or relying on advanced knowledge in the technologically most advanced EU Member States. Firms in industries where external finance is important are more likely to report financial barriers in member states with less developed financial systems. Most importantly, firms that are engaged in both innovation and internationalisation are also more likely to report that their innovation activities are hampered by financial issues.
Small, young, innovative and growth oriented firms are more heavily affected by skill constraints, but innovative firms in the technologically most advanced EU Member States are more likely to consider them to seriously hamper their innovation activities. The perception of skill constraints depends also on institutional factors in the countries in which innovative firms are located. Firms are more likely to report problems with shortages of skilled employees in the economically most advanced EU Member States producing a comparatively low share of tertiary graduates. The same holds for firms located in countries with strong dual labour markets and rigid employment protection rules. R&D and skill intensive firms as well as fast growing SMEs in the technologically most advanced countries rate shortages of skilled labour to be particularly serious. The results in this report also show that firms that failed to innovate (barrier related non-innovators) perceive the same innovation barriers as innovative firms, but they rate them to be more stringent. These firms are the idle innovation potential in the EU that should be mobilised.
This evidence leads to the following conclusions:
In its Communication on the Flagship Initiative “Innovation Union” the European Commission has committed itself to make progress to remove innovation barriers further. Policies originating from this initiative should take into account the differences that exist across country groups in the EU and target different needs better.
Targeting barrier-related non-innovators is most likely a promising avenue to increase the number of innovating firms and hence the number of exporting firms.
The evidence points to systemic failures in the education systems in a number of EU Member States that lead to shortages of skilled labour affecting innovative firms most seriously. These member states should put more emphasis on general higher education and training policies.
Internationalised and innovative firms are more likely to report skill constraints. EU level initiatives such as the Enterprise Europe Network could provide coaching in areas such as skill planning and recruitment of highly qualified tertiary graduates, where SMEs are disadvantaged in comparison to larger firms.
Efforts should continue to overcome the fragmentation of national markets for risk capital and foster financial development in general (also for business angels and other forms of risk capital). There is room for a multilateral country surveillance exercise that could screen national regulations impeding the activity of venture capital funds or business angels such as restrictions on investment rules for institutional investors.
vii
Implement the European Patent and use standards and regulations circumspectly to foster innovation and internationalisation
Intellectual property right protection (IPR), standards and regulations are important institutional factors affecting innovation at the firm level. The current European IPR system has several characteristics that are unfavourable for innovation. There is strong evidence by now that the lack of a single European Patent affects firms’ incentives to innovate and raises financial barriers to innovation. Implementing the single European patent comes therefore with a double dividend.
Standards perform an important role for the diffusion of technology and as focussing device that guides future innovation activities. The evidence indicates that standards are of comparable importance as source for innovation as patents because they provide guidance to innovation activities and reduce the cost of innovation. The downside of standards is that they may obstruct promising avenues of research. In addition, they tend to favour large firms as participating in a standardisation process is costly and requires high levels of prior expertise.
There is a close relationship between standards and regulation as the latter imposes mandatory standards. The evidence shows that regulation is effective where there is a strong public interest and public pressure to change product characteristics. For this reason it may have a rather limited scope as an instrument for innovation policy.
To summarise:
The evidence reviewed in this report calls with renewed urgency for a fast implementation of the Single European Patent. A global patent standard (GPS) should be created to address three areas: free access to key information (transparency), convergence of work procedures and of human resource practices at the patent offices. With regard to the issue of software patents future efforts should focus on the definition of (non-) patentable software in Europe in order to define a flexible property right system. Instead of implementing software patents, the possibility of strengthening the copyright system or subsidizing established Open Source Software should be kept in mind.
The European Commission has attached high priority to standards and regulations in its Communication on the Flagship Initiative “Innovation Union”, where it maintains that smart and ambitious regulation can be a key driver for innovation, and in particular for eco-innovation. The evidence presented in this study suggests that while standards and regulations are important, they have also clear limits. The use of these instruments should be assessed on a case by case basis, and their costs and benefits should also be assessed on an industry by industry basis.
Firm specific barriers to export are closely related to firm specific barriers to innovate.
The analysis of barriers to export shows that firm specific barriers to export are closely related to firm specific barriers to innovate. Firms that face difficulties to innovate face also difficulties to export. This is related to the burden to access information and the lack of technical and marketing capabilities that affect small firms more heavily. Indeed, the propensity to export of innovative firms
viii
increases with firm size and access to financial resources. However, the participation of SMEs in European research networks seems to support their propensity to export. SMEs participating in such networks are more likely to export. On the other hand, “Born Globals” perceive barriers to internationalisation as being less stringent than other exporters. These are technology based or academic start-ups operating on a global scale from the date of their establishment. However, the likelihood that a new firm is a “Born Global” in Europe is very limited. Only about 0.5% of all firms surveyed in the Community Innovation Survey may be classified as such.
Trade barriers affect innovative firms more heavily than other firms.
Innovative firms export more, and for this reason they are also more heavily affected on average by trade barriers. Especially tariffs and non-tariff barriers influence exports of innovative firms to a number of countries. Obstacles to export are significant for trade with some NAFTA and BRIC countries. Next to tariffs and non-tariff barriers unstable political and economic conditions, the risk of shortfall in payment, missing colonial ties or language competences and a large distance to the potential destination act as market entry barriers. High tariffs, high transport costs, trade defence or IPR barriers and high corruption, in turn influence the expansion of exports negatively.
European firms continue to face obstacles in the Single Market.
Industry specific export shares show that across EU Member States firms export most intensely to other member states. This implies that the Single Market is the most important export market for innovative firms in Europe and for this reason the existing barriers – even if they are less stringent than the barriers encountered on extra-EU markets – have a significant impact on European firms. Costs for inland transport are high for exports to some member states. Paper work related to required technical standards or health certificates is also a burden for exporters. Next to these barriers related to administrative costs the high heterogeneity of preferences of customers across EU Member States puts European innovators at a disadvantage with respect to innovators operating in economic areas that are more homogeneous. Despite its size the Single Market remains fragmented. However, this may be viewed also as a chance as it increases the flexibility to adapt to changing markets and customer needs.
The evidence on export barriers leads to the following conclusions:
The EU should continue to support the participation of SMEs in European research networks and other kinds of partnering events and provide incentives to expand these activities in all research schemes (JTIs, ERA Nets, EUREKA, etc.). This could be done in a more systematic manner in order to give SMEs the opportunity to reap the commercial benefits of the research cooperation for example by giving them access to information about developments in foreign markets.
The evidence also indicates that firms from New Member States are underrepresented in these research networks so far. They may not have the necessary capabilities to access them yet. The EU should examine which firms face difficulties to join research networks and why. On the basis of this information it could establish specific support measures for this target group.
ix
Good framework conditions for research and entrepreneurship at the national level favour the creation of fast growing SMEs and “Born Globals”. Policy makers in the EU Member States should therefore consider that technology based start-ups tend to operate on a global basis. Better public support for the international activities of technology start ups might yield higher growth and survival rates.
The EU should continue to work towards the removal of trade barriers. Given the data limitations faced in this study DG Trade and DG Enterprise could work more closely together to assess more in depth whether and how innovative SMEs are affected by trade barriers, and which policies could support their way into international markets best. A similar exercise could be conducted by DG Internal Market and DG Enterprise for the Single Market.
The EC and the EU Member States can learn more about how to support innovation and internationalisation and coordinate their efforts better at all levels.
Looking at the link between innovation and internationalisation support at the level of the member states there is a considerable variety in terms of how member states deal with this issue. Some have well targeted instruments in place that combine both dimensions whereas others do not link up the two policy areas. Member states could learn from each other. At the EU level instead the importance of the link between innovation and internationalisation has not been recognised until recently. The Enterprise Europe Network (EEN) is one of the few instruments at the EU level linking up innovation and internationalisation policies.
At both the member state and the EU level there is a considerable dispersion of policy measures addressing either innovation or internationalisation or both. Firms on the other hand face considerable information problems when trying to overcome innovation and internationalisation barriers. As a consequence the dispersion of support measures may cause information problems especially for small firms. The dispersion of measures within and across different administrative levels might also be a source of redundancies, policy inconsistencies and contradictory incentives.
It would be advisable to conduct a systematic EU-wide review of national export promotion programs and innovation support measures. This review should analyse to what extent these policy areas are linked up across member states, assess their complementarities, and identify best practices. The aim of the exercise should be to assess how instruments in both fields can be designed in such a way that they mutually reinforce each other. This could be an important source for policy learning.
As the EC Flagship initiative “Innovation Union” commits to link EU and national research and innovation systems better up, this review should also consider the interactions and complementarities between national and EU level instruments.
It should be assessed to what extent the dispersion of measures supporting either innovation or internationalisation or both across all administrative levels is in itself a source of knowledge barriers for companies trying to innovate or export.
x
As part of such assessment it could be examined whether the EEN provides all the relevant information for specific firm types, whether the scope of its data base should be extended or whether other instruments are needed.
xi
Key Findings
Innovative companies are more likely to export.
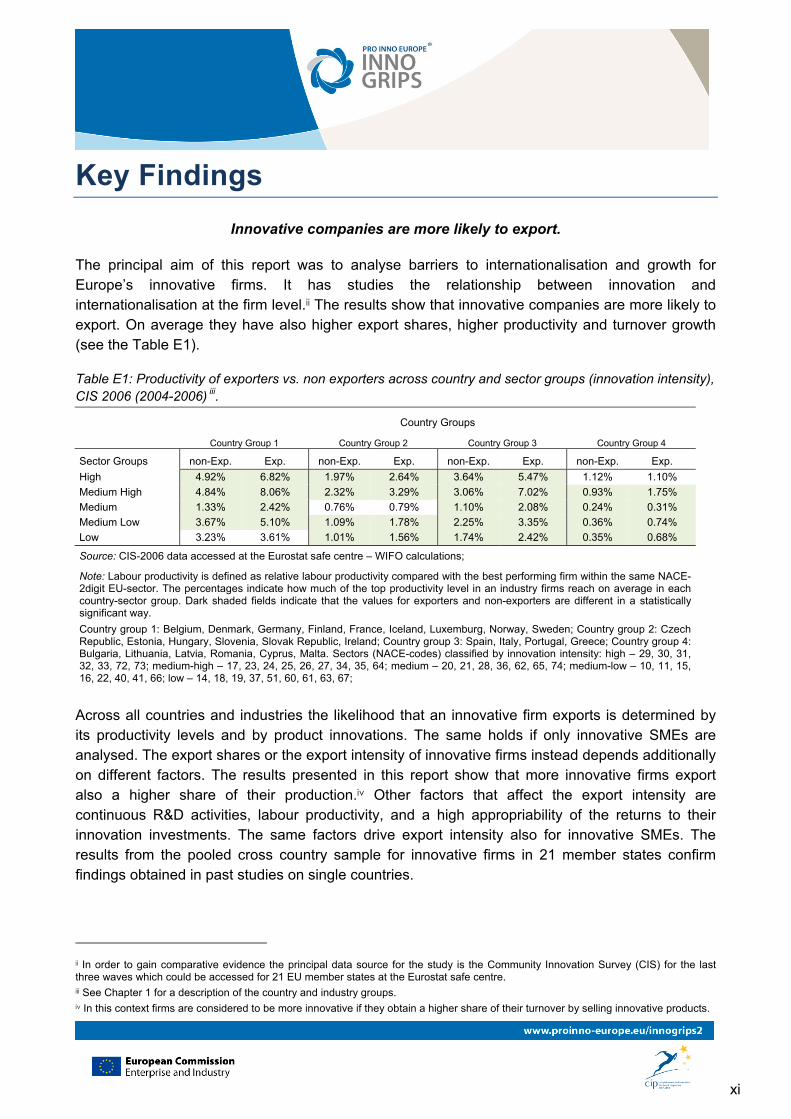
The principal aim of this report was to analyse barriers to internationalisation and growth for Europe’s innovative firms. It has studies the relationship between innovation and internationalisation at the firm level.ii The results show that innovative companies are more likely to export. On average they have also higher export shares, higher productivity and turnover growth (see the Table E1).
Table E1: Productivity of exporters vs. non exporters across country and sector groups (innovation intensity), CIS 2006 (2004-2006) iii.
Country Groups
Country Group 1 Country Group 2 Country Group 3 Country Group 4
Sector Groups non-Exp. Exp. non-Exp. Exp. non-Exp. Exp. non-Exp. Exp.
High 4.92% 6.82% 1.97% 2.64% 3.64% 5.47% 1.12% 1.10%
Medium High 4.84% 8.06% 2.32% 3.29% 3.06% 7.02% 0.93% 1.75%
Medium 1.33% 2.42% 0.76% 0.79% 1.10% 2.08% 0.24% 0.31%
Medium Low 3.67% 5.10% 1.09% 1.78% 2.25% 3.35% 0.36% 0.74%
Low 3.23% 3.61% 1.01% 1.56% 1.74% 2.42% 0.35% 0.68%
Source: CIS-2006 data accessed at the Eurostat safe centre – WIFO calculations;
Note: Labour productivity is defined as relative labour productivity compared with the best performing firm within the same NACE-2digit EU-sector. The percentages indicate how much of the top productivity level in an industry firms reach on average in each country-sector group. Dark shaded fields indicate that the values for exporters and non-exporters are different in a statistically significant way.
Country group 1: Belgium, Denmark, Germany, Finland, France, Iceland, Luxemburg, Norway, Sweden; Country group 2: Czech Republic, Estonia, Hungary, Slovenia, Slovak Republic, Ireland; Country group 3: Spain, Italy, Portugal, Greece; Country group 4: Bulgaria, Lithuania, Latvia, Romania, Cyprus, Malta. Sectors (NACE-codes) classified by innovation intensity: high – 29, 30, 31, 32, 33, 72, 73; medium-high – 17, 23, 24, 25, 26, 27, 34, 35, 64; medium – 20, 21, 28, 36, 62, 65, 74; medium-low – 10, 11, 15, 16, 22, 40, 41, 66; low – 14, 18, 19, 37, 51, 60, 61, 63, 67;
Across all countries and industries the likelihood that an innovative firm exports is determined by its productivity levels and by product innovations. The same holds if only innovative SMEs are analysed. The export shares or the export intensity of innovative firms instead depends additionally on different factors. The results presented in this report show that more innovative firms export also a higher share of their production.iv Other factors that affect the export intensity are continuous R&D activities, labour productivity, and a high appropriability of the returns to their innovation investments. The same factors drive export intensity also for innovative SMEs. The results from the pooled cross country sample for innovative firms in 21 member states confirm findings obtained in past studies on single countries.
ii In order to gain comparative evidence the principal data source for the study is the Community Innovation Survey (CIS) for the last three waves which could be accessed for 21 EU member states at the Eurostat safe centre. iii See Chapter 1 for a description of the country and industry groups. iv In this context firms are considered to be more innovative if they obtain a higher share of their turnover by selling innovative products.
xii
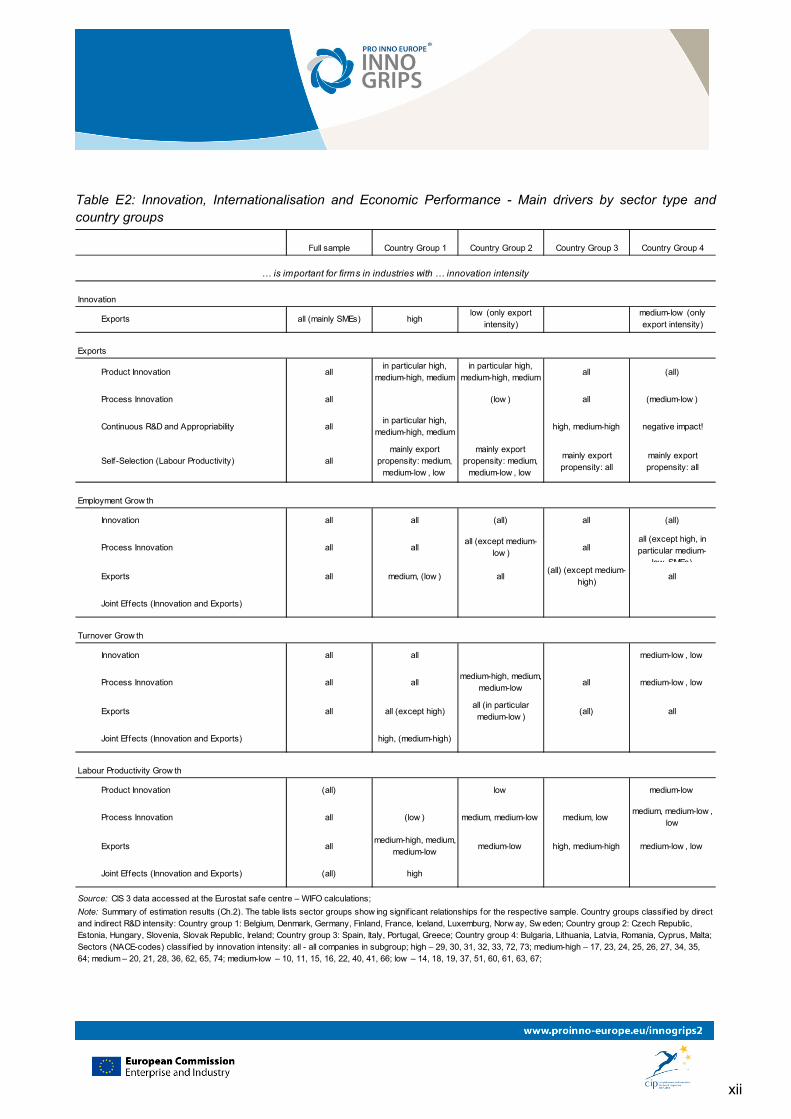
Table E2: Innovation, Internationalisation and Economic Performance - Main drivers by sector type and country groups
Full sample Country Group 1 Country Group 2 Country Group 3 Country Group 4
Innovation
Exports all (mainly SMEs) highlow (only export
intensity)medium-low (only export intensity)
Exports
Product Innovation allin particular high,
medium-high, mediumin particular high,
medium-high, mediumall (all)
Process Innovation all (low ) all (medium-low )
Continuous R&D and Appropriability allin particular high,
medium-high, mediumhigh, medium-high negative impact!
Self-Selection (Labour Productivity) allmainly export
propensity: medium, medium-low , low
mainly export propensity: medium,
medium-low , low
mainly export propensity: all
mainly export propensity: all
Employment Grow th
Innovation all all (all) all (all)
Process Innovation all allall (except medium-
low )all
all (except high, in particular medium-
low SMEs)
Exports all medium, (low ) all(all) (except medium-
high)all
Joint Effects (Innovation and Exports)
Turnover Grow th
Innovation all all medium-low , low
Process Innovation all allmedium-high, medium,
medium-lowall medium-low , low
Exports all all (except high)all (in particular medium-low )
(all) all
Joint Effects (Innovation and Exports) high, (medium-high)
Labour Productivity Grow th
Product Innovation (all) low medium-low
Process Innovation all (low ) medium, medium-low medium, lowmedium, medium-low ,
low
Exports allmedium-high, medium,
medium-lowmedium-low high, medium-high medium-low , low
Joint Effects (Innovation and Exports) (all) high
Source: CIS 3 data accessed at the Eurostat safe centre – WIFO calculations;
Note: Summary of estimation results (Ch.2). The table lists sector groups show ing signif icant relationships for the respective sample. Country groups classif ied by direct and indirect R&D intensity: Country group 1: Belgium, Denmark, Germany, Finland, France, Iceland, Luxemburg, Norw ay, Sw eden; Country group 2: Czech Republic, Estonia, Hungary, Slovenia, Slovak Republic, Ireland; Country group 3: Spain, Italy, Portugal, Greece; Country group 4: Bulgaria, Lithuania, Latvia, Romania, Cyprus, Malta; Sectors (NACE-codes) classif ied by innovation intensity: all - all companies in subgroup; high – 29, 30, 31, 32, 33, 72, 73; medium-high – 17, 23, 24, 25, 26, 27, 34, 35, 64; medium – 20, 21, 28, 36, 62, 65, 74; medium-low – 10, 11, 15, 16, 22, 40, 41, 66; low – 14, 18, 19, 37, 51, 60, 61, 63, 67;
… is important for firms in industries with … innovation intensity
xiii
The export propensity of innovative firms is determined by their technological capabilities.
However, if we break down our analysis to subsamples which differentiate innovative firms in terms of the average technological capability of the countries in which firms are located and by the dominant technological regimes in the industries in which they operate, then the results show that the aforementioned determinants of export propensity and export intensity are not equally important across subgroups. Product innovations largely determine the export propensity of innovative firms in the most innovation intensive industries across all country groups, whereas labour productivity plays only a subordinate role in these industries. However, as the innovation intensity of the industry in which a firm operates decreases, labour productivity becomes more important as a determinant of the export propensity. This suggests that firms in the most innovative industries draw their competitive advantage from establishing markets in which their products provide high value to users, whereas firms in less innovative industries are on average more likely to engage into cost based competition. The determinants of the export intensity instead vary less across industry types and more across country groups. The export intensity of innovators in the technologically more advanced countries is largely determined by continuous R&D, the degree of appropriability of returns to innovation (e.g. strong IPRs) and to a lesser extent by labour productivity, whereas in the countries that are predominantly technology importers no clear picture emerges as to the principal determinants. The overall picture is that continuous R&D and appropriability are important drivers of exports for innovative companies located in countries with advanced technological capability whereas R&D plays a more subordinate role for exports by innovative firms located in countries that are predominantly technology importers. Table E2 gives an overview on the results by country groups.
Innovation and exporting are the two side of the same coin.
Establishing the impact of exporting on innovation is more difficult due to the specifics of the CIS data. However, the exploratory econometric analysis in this report shows that exporting has positive effects on innovation for the pooled firm sample for 21 countries. If we break down the analysis to the country-sector subsamples the results are not consistent. This suggests that for the available data no clear cut impact of exports on innovation can be established (see Table E2). However, other research based on better suited data for single countries indicates that exporting has a positive impact on innovation such that this evidence supports our finding for the pooled sample. It triggers learning effects and access to larger markets increases the turnover of exporting firms such that larger amounts of the cash flow can be devoted to innovation and R&D investments. Overall, the available evidence suggests that innovation and export activities are closely related and that they may be considered to be two sides of the same coin. This emerges also from the analysis of the impact of innovation and exporting on different economic performance indicators.
xiv
Innovation and internationalisation boost employment and productivity growth.
Innovation activities and exporting affect the economic performance in terms of employment and productivity growth of firms positively. The results confirm the common wisdom that innovation is an important driver for productivity growth. However, the analytical approach pursued in this study allows us to draw a more differentiated picture. The findings suggest that in industries with medium to low innovation intensity productivity growth is mainly driven by process innovations, while in industries with high innovation intensity especially in the member states that are technologically more advanced productivity growth depends more heavily on product innovations.
For innovative firms in the New Member States technology imports are both a way of improving competitiveness and learning about international markets.
This indicates that the catching up process (or the process of economic convergence in the EU) is one of technological upgrading. If firms are technologically less advanced and the framework conditions in the countries in which they are located are not favourable to top level technological research and development, then they increase their competitiveness through technology transfer and exploit cost advantages on export markets. Technology transfer however implies that firms start internationalising by importing technologies and knowledge from more advanced firms and countries. This way of improving competitiveness however starts to lose importance as firms develop their technological capabilities and economic framework conditions improve such that factor costs rise. This erases the cost advantages on export markets, and firms have to start upgrading their products and technologies if their aim is to compete successfully on domestic and international markets. As a consequence the importance of continuous R&D activities and product innovation as a core source of competitive advantage on international markets rises relative to technology acquisition. This pattern of technology upgrading of course calls for a differentiated policy approach to innovation and internationalisation across country groups.
Barriers to innovation act as barriers to internationalisation
The evidence presented so far indicates that innovation is an important driver of internationalisation at the firm level. Barriers to innovation therefore act also as barriers to internationalisation. For this reason this report has examined both factors hampering innovation across EU member states, and factors hampering internationalisation efforts of innovative industries and firms. It distinguishes between barriers to innovation that are related to the capabilities and factors of production of companies, and barriers related to legal and institutional conditions. Under the former type we have subsumed knowledge barriers, financial barriers and skill shortages, whereas the latter refer to IPRs, standards and regulations. We present first the evidence gathered on barriers to innovation related to the factors of production of firms. Table E3 gives an overview on how different firm types perceive innovation barriers across country groups. Table E4 instead provides a summary of the results on barriers to innovation.
xv
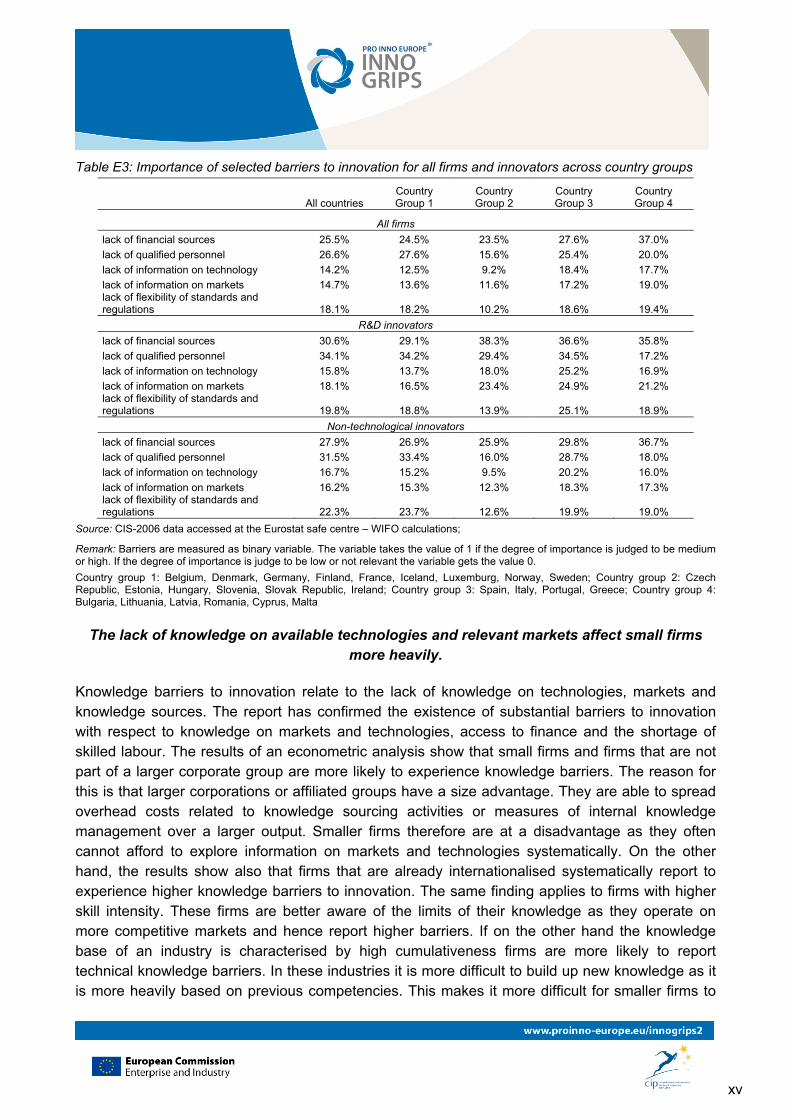
Table E3: Importance of selected barriers to innovation for all firms and innovators across country groups
All countries Country Group 1
Country Group 2
Country Group 3
Country Group 4
All firms
lack of financial sources 25.5% 24.5% 23.5% 27.6% 37.0%
lack of qualified personnel 26.6% 27.6% 15.6% 25.4% 20.0%
lack of information on technology 14.2% 12.5% 9.2% 18.4% 17.7%
lack of information on markets 14.7% 13.6% 11.6% 17.2% 19.0% lack of flexibility of standards and regulations 18.1% 18.2% 10.2% 18.6% 19.4%
R&D innovators
lack of financial sources 30.6% 29.1% 38.3% 36.6% 35.8%
lack of qualified personnel 34.1% 34.2% 29.4% 34.5% 17.2%
lack of information on technology 15.8% 13.7% 18.0% 25.2% 16.9%
lack of information on markets 18.1% 16.5% 23.4% 24.9% 21.2% lack of flexibility of standards and regulations 19.8% 18.8% 13.9% 25.1% 18.9%
Non-technological innovators
lack of financial sources 27.9% 26.9% 25.9% 29.8% 36.7%
lack of qualified personnel 31.5% 33.4% 16.0% 28.7% 18.0%
lack of information on technology 16.7% 15.2% 9.5% 20.2% 16.0%
lack of information on markets 16.2% 15.3% 12.3% 18.3% 17.3% lack of flexibility of standards and regulations 22.3% 23.7% 12.6% 19.9% 19.0%
Source: CIS-2006 data accessed at the Eurostat safe centre – WIFO calculations;
Remark: Barriers are measured as binary variable. The variable takes the value of 1 if the degree of importance is judged to be medium or high. If the degree of importance is judge to be low or not relevant the variable gets the value 0.
Country group 1: Belgium, Denmark, Germany, Finland, France, Iceland, Luxemburg, Norway, Sweden; Country group 2: Czech Republic, Estonia, Hungary, Slovenia, Slovak Republic, Ireland; Country group 3: Spain, Italy, Portugal, Greece; Country group 4: Bulgaria, Lithuania, Latvia, Romania, Cyprus, Malta
The lack of knowledge on available technologies and relevant markets affect small firms more heavily.
Knowledge barriers to innovation relate to the lack of knowledge on technologies, markets and knowledge sources. The report has confirmed the existence of substantial barriers to innovation with respect to knowledge on markets and technologies, access to finance and the shortage of skilled labour. The results of an econometric analysis show that small firms and firms that are not part of a larger corporate group are more likely to experience knowledge barriers. The reason for this is that larger corporations or affiliated groups have a size advantage. They are able to spread overhead costs related to knowledge sourcing activities or measures of internal knowledge management over a larger output. Smaller firms therefore are at a disadvantage as they often cannot afford to explore information on markets and technologies systematically. On the other hand, the results show also that firms that are already internationalised systematically report to experience higher knowledge barriers to innovation. The same finding applies to firms with higher skill intensity. These firms are better aware of the limits of their knowledge as they operate on more competitive markets and hence report higher barriers. If on the other hand the knowledge base of an industry is characterised by high cumulativeness firms are more likely to report technical knowledge barriers. In these industries it is more difficult to build up new knowledge as it is more heavily based on previous competencies. This makes it more difficult for smaller firms to
xvi
access critical knowledge. Overall the results indicate that the lack of technical knowledge is perceived as being important especially in industries with medium or low innovation intensity. Manufacturing firms are also more likely to report knowledge barriers than firms in service sectors. An analysis between innovative and non-innovative firms has not revealed any significant differences.
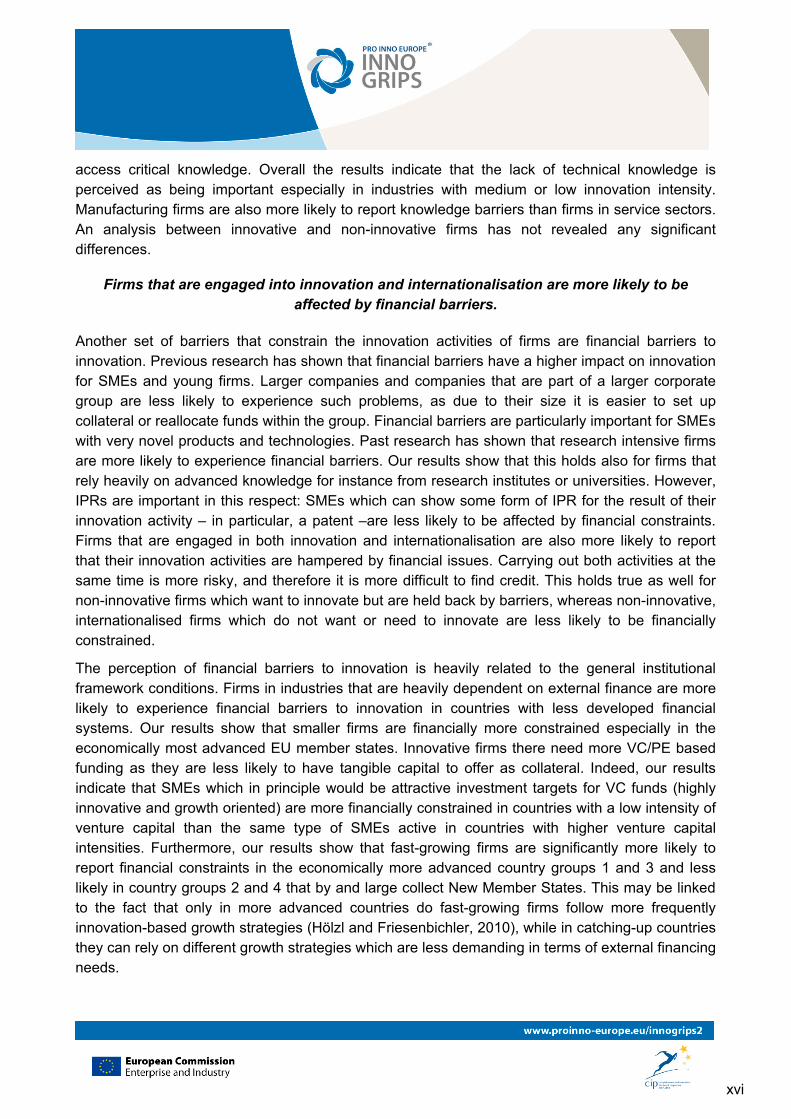
Firms that are engaged into innovation and internationalisation are more likely to be affected by financial barriers.
Another set of barriers that constrain the innovation activities of firms are financial barriers to innovation. Previous research has shown that financial barriers have a higher impact on innovation for SMEs and young firms. Larger companies and companies that are part of a larger corporate group are less likely to experience such problems, as due to their size it is easier to set up collateral or reallocate funds within the group. Financial barriers are particularly important for SMEs with very novel products and technologies. Past research has shown that research intensive firms are more likely to experience financial barriers. Our results show that this holds also for firms that rely heavily on advanced knowledge for instance from research institutes or universities. However, IPRs are important in this respect: SMEs which can show some form of IPR for the result of their innovation activity – in particular, a patent –are less likely to be affected by financial constraints. Firms that are engaged in both innovation and internationalisation are also more likely to report that their innovation activities are hampered by financial issues. Carrying out both activities at the same time is more risky, and therefore it is more difficult to find credit. This holds true as well for non-innovative firms which want to innovate but are held back by barriers, whereas non-innovative, internationalised firms which do not want or need to innovate are less likely to be financially constrained.
The perception of financial barriers to innovation is heavily related to the general institutional framework conditions. Firms in industries that are heavily dependent on external finance are more likely to experience financial barriers to innovation in countries with less developed financial systems. Our results show that smaller firms are financially more constrained especially in the economically most advanced EU member states. Innovative firms there need more VC/PE based funding as they are less likely to have tangible capital to offer as collateral. Indeed, our results indicate that SMEs which in principle would be attractive investment targets for VC funds (highly innovative and growth oriented) are more financially constrained in countries with a low intensity of venture capital than the same type of SMEs active in countries with higher venture capital intensities. Furthermore, our results show that fast-growing firms are significantly more likely to report financial constraints in the economically more advanced country groups 1 and 3 and less likely in country groups 2 and 4 that by and large collect New Member States. This may be linked to the fact that only in more advanced countries do fast-growing firms follow more frequently innovation-based growth strategies (Hölzl and Friesenbichler, 2010), while in catching-up countries they can rely on different growth strategies which are less demanding in terms of external financing needs.
xvii
Small, young, innovative and growth oriented firms are more heavily affected by skill constraints,..
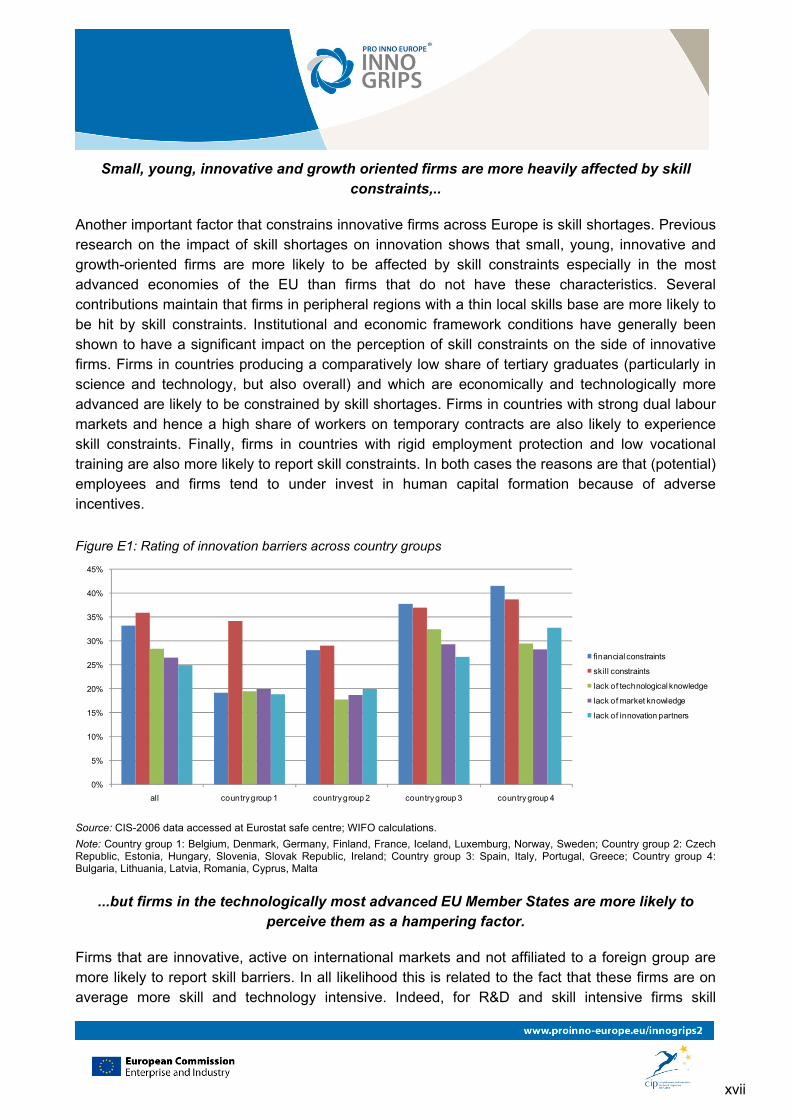
Another important factor that constrains innovative firms across Europe is skill shortages. Previous research on the impact of skill shortages on innovation shows that small, young, innovative and growth-oriented firms are more likely to be affected by skill constraints especially in the most advanced economies of the EU than firms that do not have these characteristics. Several contributions maintain that firms in peripheral regions with a thin local skills base are more likely to be hit by skill constraints. Institutional and economic framework conditions have generally been shown to have a significant impact on the perception of skill constraints on the side of innovative firms. Firms in countries producing a comparatively low share of tertiary graduates (particularly in science and technology, but also overall) and which are economically and technologically more advanced are likely to be constrained by skill shortages. Firms in countries with strong dual labour markets and hence a high share of workers on temporary contracts are also likely to experience skill constraints. Finally, firms in countries with rigid employment protection and low vocational training are also more likely to report skill constraints. In both cases the reasons are that (potential) employees and firms tend to under invest in human capital formation because of adverse incentives.
Figure E1: Rating of innovation barriers across country groups
0%
5%
10%
15%
20%
25%
30%
35%
40%
45%
all country group 1 country group 2 country group 3 country group 4
financial constraints
skill constraints
lack of technological knowledge
lack of market knowledge
lack of innovation partners
Source: CIS-2006 data accessed at Eurostat safe centre; WIFO calculations.
Note: Country group 1: Belgium, Denmark, Germany, Finland, France, Iceland, Luxemburg, Norway, Sweden; Country group 2: Czech Republic, Estonia, Hungary, Slovenia, Slovak Republic, Ireland; Country group 3: Spain, Italy, Portugal, Greece; Country group 4: Bulgaria, Lithuania, Latvia, Romania, Cyprus, Malta
...but firms in the technologically most advanced EU Member States are more likely to perceive them as a hampering factor.
Firms that are innovative, active on international markets and not affiliated to a foreign group are more likely to report skill barriers. In all likelihood this is related to the fact that these firms are on average more skill and technology intensive. Indeed, for R&D and skill intensive firms skill
xviii
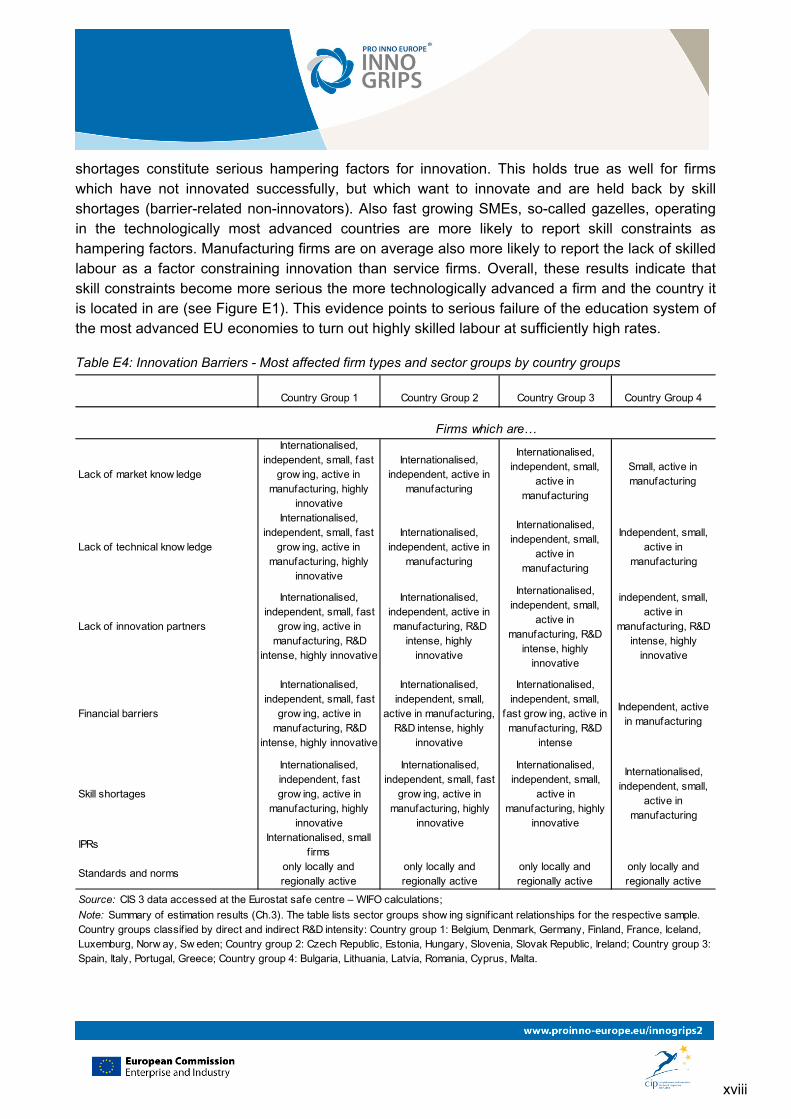
shortages constitute serious hampering factors for innovation. This holds true as well for firms which have not innovated successfully, but which want to innovate and are held back by skill shortages (barrier-related non-innovators). Also fast growing SMEs, so-called gazelles, operating in the technologically most advanced countries are more likely to report skill constraints as hampering factors. Manufacturing firms are on average also more likely to report the lack of skilled labour as a factor constraining innovation than service firms. Overall, these results indicate that skill constraints become more serious the more technologically advanced a firm and the country it is located in are (see Figure E1). This evidence points to serious failure of the education system of the most advanced EU economies to turn out highly skilled labour at sufficiently high rates.
Table E4: Innovation Barriers - Most affected firm types and sector groups by country groups
Country Group 1 Country Group 2 Country Group 3 Country Group 4
Lack of market know ledge
Internationalised, independent, small, fast
grow ing, active in manufacturing, highly
innovative
Internationalised, independent, active in
manufacturing
Internationalised, independent, small,
active in manufacturing
Small, active in manufacturing
Lack of technical know ledge
Internationalised, independent, small, fast
grow ing, active in manufacturing, highly
innovative
Internationalised, independent, active in
manufacturing
Internationalised, independent, small,
active in manufacturing
Independent, small, active in
manufacturing
Lack of innovation partners
Internationalised, independent, small, fast
grow ing, active in manufacturing, R&D
intense, highly innovative
Internationalised, independent, active in manufacturing, R&D
intense, highly innovative
Internationalised, independent, small,
active in manufacturing, R&D
intense, highly innovative
independent, small, active in
manufacturing, R&D intense, highly
innovative
Financial barriers
Internationalised, independent, small, fast
grow ing, active in manufacturing, R&D
intense, highly innovative
Internationalised, independent, small,
active in manufacturing, R&D intense, highly
innovative
Internationalised, independent, small,
fast grow ing, active in manufacturing, R&D
intense
Independent, active in manufacturing
Skill shortages
Internationalised, independent, fast grow ing, active in
manufacturing, highly innovative
Internationalised, independent, small, fast
grow ing, active in manufacturing, highly
innovative
Internationalised, independent, small,
active in manufacturing, highly
innovative
Internationalised, independent, small,
active in manufacturing
IPRsInternationalised, small
f irms
Standards and normsonly locally and regionally active
only locally and regionally active
only locally and regionally active
only locally and regionally active
Firms which are…
Note: Summary of estimation results (Ch.3). The table lists sector groups show ing signif icant relationships for the respective sample. Country groups classif ied by direct and indirect R&D intensity: Country group 1: Belgium, Denmark, Germany, Finland, France, Iceland, Luxemburg, Norw ay, Sw eden; Country group 2: Czech Republic, Estonia, Hungary, Slovenia, Slovak Republic, Ireland; Country group 3: Spain, Italy, Portugal, Greece; Country group 4: Bulgaria, Lithuania, Latvia, Romania, Cyprus, Malta.
Source: CIS 3 data accessed at the Eurostat safe centre – WIFO calculations;
xix
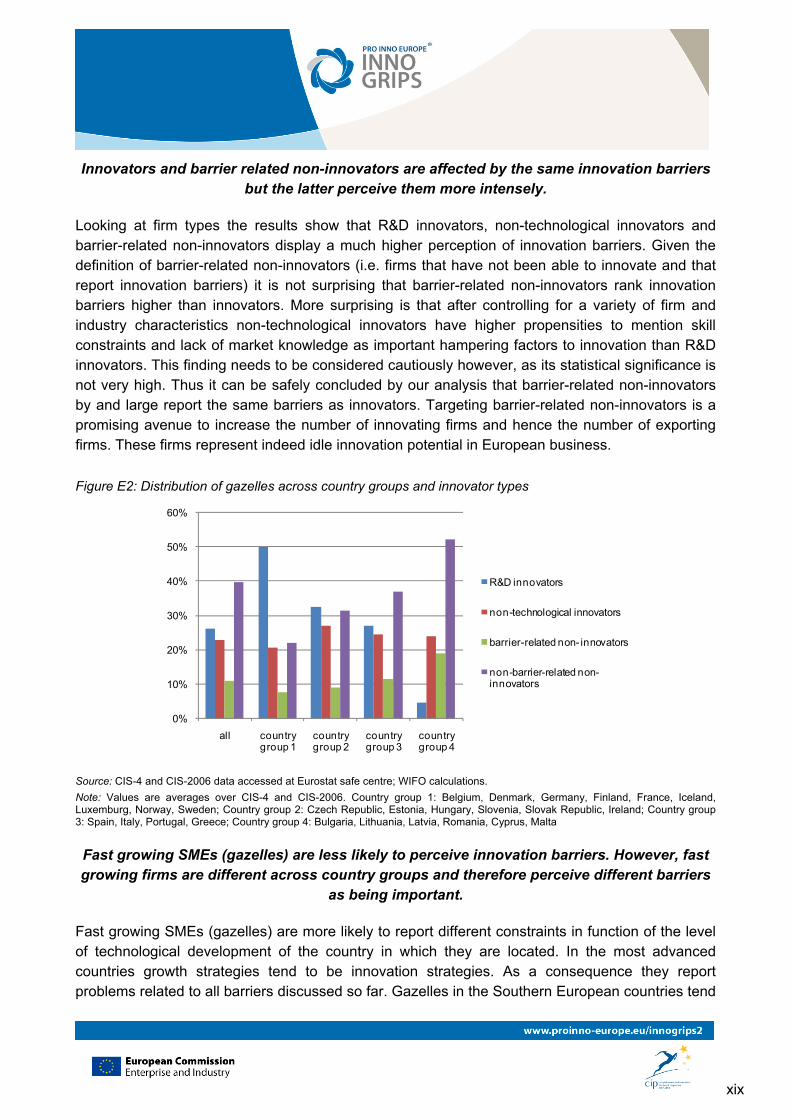
Innovators and barrier related non-innovators are affected by the same innovation barriers but the latter perceive them more intensely.
Looking at firm types the results show that R&D innovators, non-technological innovators and barrier-related non-innovators display a much higher perception of innovation barriers. Given the definition of barrier-related non-innovators (i.e. firms that have not been able to innovate and that report innovation barriers) it is not surprising that barrier-related non-innovators rank innovation barriers higher than innovators. More surprising is that after controlling for a variety of firm and industry characteristics non-technological innovators have higher propensities to mention skill constraints and lack of market knowledge as important hampering factors to innovation than R&D innovators. This finding needs to be considered cautiously however, as its statistical significance is not very high. Thus it can be safely concluded by our analysis that barrier-related non-innovators by and large report the same barriers as innovators. Targeting barrier-related non-innovators is a promising avenue to increase the number of innovating firms and hence the number of exporting firms. These firms represent indeed idle innovation potential in European business.
Figure E2: Distribution of gazelles across country groups and innovator types
0%
10%
20%
30%
40%
50%
60%
all country group 1
country group 2
country group 3
country group 4
R&D innovators
non-technological innovators
barrier-related non- innovators
non-barrier-related non-innovators
Source: CIS-4 and CIS-2006 data accessed at Eurostat safe centre; WIFO calculations.
Note: Values are averages over CIS-4 and CIS-2006. Country group 1: Belgium, Denmark, Germany, Finland, France, Iceland, Luxemburg, Norway, Sweden; Country group 2: Czech Republic, Estonia, Hungary, Slovenia, Slovak Republic, Ireland; Country group 3: Spain, Italy, Portugal, Greece; Country group 4: Bulgaria, Lithuania, Latvia, Romania, Cyprus, Malta
Fast growing SMEs (gazelles) are less likely to perceive innovation barriers. However, fast growing firms are different across country groups and therefore perceive different barriers
as being important.
Fast growing SMEs (gazelles) are more likely to report different constraints in function of the level of technological development of the country in which they are located. In the most advanced countries growth strategies tend to be innovation strategies. As a consequence they report problems related to all barriers discussed so far. Gazelles in the Southern European countries tend

xx
to indicate to be more financially constrained. Gazelles in the countries that heavily import technologies seem to face higher skill barriers. The intuition behind the differences across country groups is found in the distribution of gazelles across country groups. Approximately 50% of high growth firms that are located in the technologically most advanced countries are R&D innovators. In the group of technology importers and Southern European countries only around 30% of gazelles are R&D innovators and in the technologically least developed countries the figure goes down to around 5% (see Figure E2). The results are thus in line with the findings on barriers to innovation for R&D innovators who report higher barriers than other types of firms. Otherwise, gazelles are less likely to report barriers than other firms as probably they are among the more successful firms.
The lack of a single European Patent affects firms’ incentives to innovate and raises financial barriers to innovation.
Turning to institutional factors that affect innovation adversely we have first looked at issues related to the intellectual property rights regime (IPR). In this area there exists already a considerable body of evidence which we have reviewed in this study. The current European IPR system has several characteristics that are unfavourable for innovation. Most importantly, there is currently no single European patent, yet, and the costs an applicant has to incur after the grant of a patent by the European Patent Office (EPO) in terms of translation, validation and transaction costs is very high. The costs per claim per capita are about ten times higher than in the US. SMEs and other people or organisations without the resources to afford the high cost both in terms of time and money of filing a patent (e.g. universities or independent inventors) are put at a disadvantage by the current system. SMEs will also face more difficulties in protecting their IPR abroad. This affects not only incentives to innovate, but also financial constraints as it is easier to obtain VC financing when a patent application has been filed.
The importance of standards is at an equal footing with patents. However, they tend to favour large firms.
Standards are in general conducive to economic growth and an important element of the innovation infrastructure. Previous research shows that standards perform an important role for the diffusion of technology and as focussing device for innovative search. They act as focussing and structuring device that guides future innovation activities, but at the same time they also limit variety and thereby reduce the number of avenues open for innovative search. One the one hand, this reduces the cost of innovation activities but on the other hand it may also obstruct promising avenues of research. However, firms generally regard standards as important information sources for innovation activities. Thus, in general standards should be considered as important elements of the modern innovation process. The literature also shows that standards are conducive for international trade as they help defining important product characteristics in foreign markets more clearly. The evidence indicates that standards are of comparable importance as source for innovation as patents because they provide guidance to innovation activities. Early standardisation is also a central ingredient for the establishment of a lead market. However, guiding early
xxi
standardisation processes is difficult as it requires the identification of promising themes of standardisation. In addition new impulses from R&D need to be integrated into the ongoing process of standardisation.
Standards are seen as barrier to innovation primarily by firms that operate on local markets. In most of the areas of research, patenting, innovation and standardisation SMEs are at disadvantages compared to large companies. Therefore many SMEs see the process of standardisation as subject to regulatory capture by large firms. However, it is important to note that the participation of SMEs in the process of standardisation is akin to technology transfer: expert knowledge is provided for SMEs, communication about technological requirements for using specific techniques and a point of departure for the cooperation between enterprises, research institutions and the public sector. In this sense they are an important element of technology transfer. In order to increase the participation of SMEs in standardisation processes it is necessary to reduce information deficits regarding rules and products, and to reduce costs of participation (opportunity costs and lack of qualified personnel), and improve enterprise competencies.
Regulation is effective as innovation policy where there is a strong public interest and public pressure to change product characteristics. As an instrument for innovation policy
they have a rather limited scope.
The literature on the politics of regulation shows that there is a close relationship between standards and regulation. Often regulation uses standards to define acceptable behaviour and voluntary industry standards. Codes of conduct are frequently used in response to public and political pressure for regulation. Thus much of what has been said with regard to standards holds also for regulation. The difference is that regulation imposes mandatory standards while norms are voluntary. The evidence indicates that the general tenet in the economics literature claiming that regulation has negative effects on economic performance and innovation needs to be qualified. While regulation in general increases the costs of products and processes, the associated reduction in innovation incentives need to be compared with the non-innovation effects of the regulations. The costs and benefits of regulation can only be assessed by an industry by industry basis. In general competition-enhancing regulation or deregulation creates incentives to innovate for both incumbents and new entrants.
Our survey of the literature and findings from the analysis of available data on innovation at the firm level suggest that the use of regulation as innovation policy is relatively limited. The survey of regulation in several industries led to the impression that environmental regulations are more important than other regulations in providing focusing devices for innovation activities. This may be associated with the fact that environmental regulation creates substantial costs for the firms and the development of solution problems may provide substantial competitive advantage. The anticipation of regulation and societal pressure trigger firm innovation activities. Successful innovation allows governments then to put regulation in place afterwards that is required in order to force all firms to use the new production technique (environmental regulation). Our analysis of the CIS data revealed that larger firms and exporting firms report more often that their innovations improved the environmental, health and safety characteristics of their products or processes. The same firms state that their innovation activities helped to meet regulatory requirements. The survey
xxii
of the relevant literature and the evidence produced for this report suggest however, that regulation can be a successful instrument of innovation and internationalisation policies mainly in the area of environmental regulation and regulations that are established because of strong public pressure. In these cases regulations act as focusing devices for new innovations.
The first part of this report has shown the close relationship between innovation and internationalisation. Internationalisation by innovative firms is therefore constrained by both different types of barriers to innovation and by trade barriers. For this reason we have examined also barriers to internationalisation. In analogy to innovation barriers one can distinguish between barriers related to firm characteristics, and barriers related to institutional factors or policies such as tariffs or non-tariff trade barriers that cannot be influenced by the single company. Barriers to internationalisation that are related to firm characteristics can be analysed using CIS data. External barriers instead have to be analysed using industry specific data and an industry taxonomy that classifies them according to their innovation intensity.
Firm specific barriers to export are closely related to firm specific barriers to innovate. Large firms have a higher propensity to export.
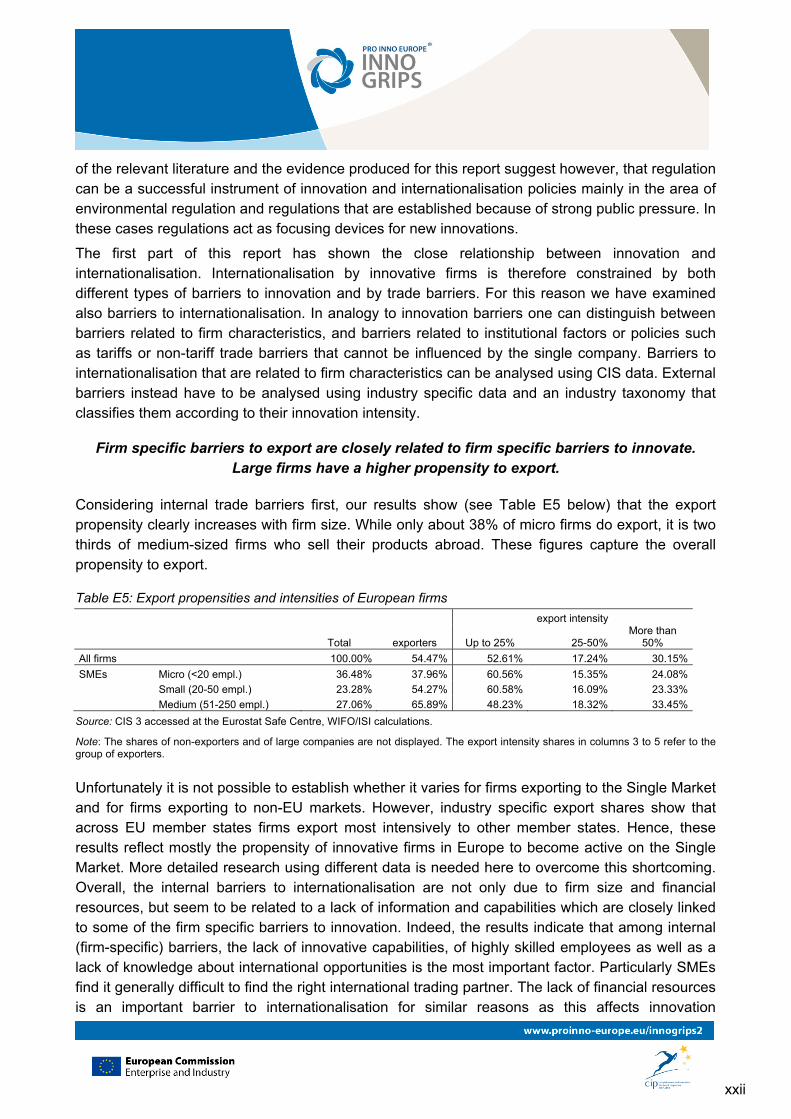
Considering internal trade barriers first, our results show (see Table E5 below) that the export propensity clearly increases with firm size. While only about 38% of micro firms do export, it is two thirds of medium-sized firms who sell their products abroad. These figures capture the overall propensity to export.
Table E5: Export propensities and intensities of European firms
export intensity
Total exporters Up to 25% 25-50% More than
50%
All firms 100.00% 54.47% 52.61% 17.24% 30.15%
SMEs Micro (<20 empl.) 36.48% 37.96% 60.56% 15.35% 24.08%
Small (20-50 empl.) 23.28% 54.27% 60.58% 16.09% 23.33%
Medium (51-250 empl.) 27.06% 65.89% 48.23% 18.32% 33.45%
Source: CIS 3 accessed at the Eurostat Safe Centre, WIFO/ISI calculations.
Note: The shares of non-exporters and of large companies are not displayed. The export intensity shares in columns 3 to 5 refer to the group of exporters.
Unfortunately it is not possible to establish whether it varies for firms exporting to the Single Market and for firms exporting to non-EU markets. However, industry specific export shares show that across EU member states firms export most intensively to other member states. Hence, these results reflect mostly the propensity of innovative firms in Europe to become active on the Single Market. More detailed research using different data is needed here to overcome this shortcoming. Overall, the internal barriers to internationalisation are not only due to firm size and financial resources, but seem to be related to a lack of information and capabilities which are closely linked to some of the firm specific barriers to innovation. Indeed, the results indicate that among internal (firm-specific) barriers, the lack of innovative capabilities, of highly skilled employees as well as a lack of knowledge about international opportunities is the most important factor. Particularly SMEs find it generally difficult to find the right international trading partner. The lack of financial resources is an important barrier to internationalisation for similar reasons as this affects innovation
xxiii
behaviour. However, the participation of SMEs in European research networks strongly correlates with a higher export propensity of SMEs. “Born Globals” on the other hand perceive barriers to internationalisation as being less stringent than other exporters. These are technology based or academic start-ups operating on a global scale. The likelihood that a new firm is a “Born Global” is closely related to favourable framework conditions with respect to entrepreneurship and research in a country.
Trade barriers affect innovative firms more heavily. Non-tariff barriers are significant obstacles to export to NAFTA and BRIC countries.
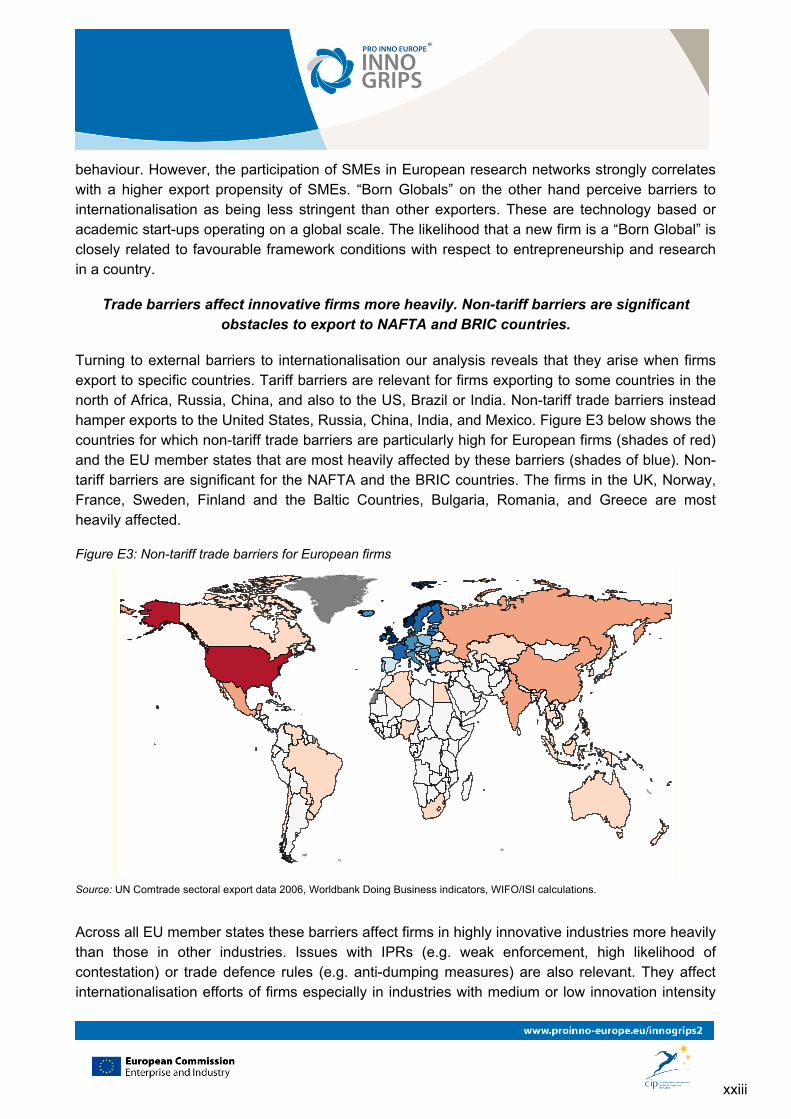
Turning to external barriers to internationalisation our analysis reveals that they arise when firms export to specific countries. Tariff barriers are relevant for firms exporting to some countries in the north of Africa, Russia, China, and also to the US, Brazil or India. Non-tariff trade barriers instead hamper exports to the United States, Russia, China, India, and Mexico. Figure E3 below shows the countries for which non-tariff trade barriers are particularly high for European firms (shades of red) and the EU member states that are most heavily affected by these barriers (shades of blue). Non-tariff barriers are significant for the NAFTA and the BRIC countries. The firms in the UK, Norway, France, Sweden, Finland and the Baltic Countries, Bulgaria, Romania, and Greece are most heavily affected.
Figure E3: Non-tariff trade barriers for European firms
Source: UN Comtrade sectoral export data 2006, Worldbank Doing Business indicators, WIFO/ISI calculations.
Across all EU member states these barriers affect firms in highly innovative industries more heavily than those in other industries. Issues with IPRs (e.g. weak enforcement, high likelihood of contestation) or trade defence rules (e.g. anti-dumping measures) are also relevant. They affect internationalisation efforts of firms especially in industries with medium or low innovation intensity
xxiv
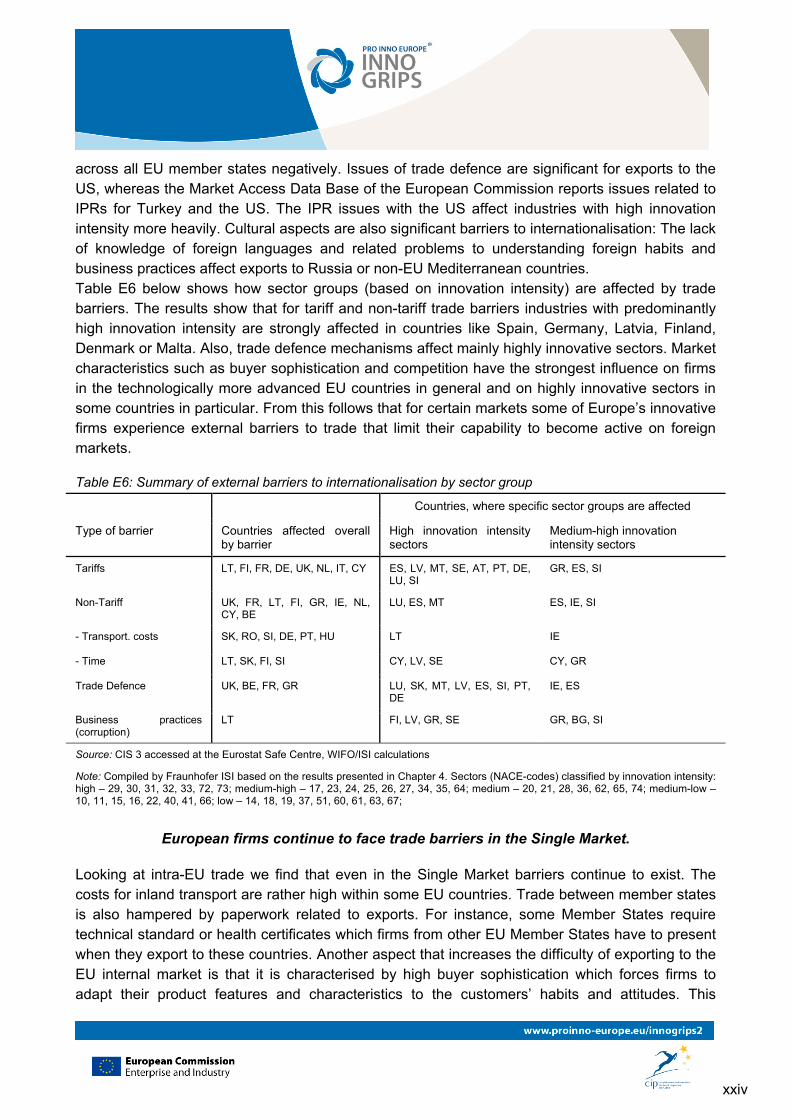
across all EU member states negatively. Issues of trade defence are significant for exports to the US, whereas the Market Access Data Base of the European Commission reports issues related to IPRs for Turkey and the US. The IPR issues with the US affect industries with high innovation intensity more heavily. Cultural aspects are also significant barriers to internationalisation: The lack of knowledge of foreign languages and related problems to understanding foreign habits and business practices affect exports to Russia or non-EU Mediterranean countries. Table E6 below shows how sector groups (based on innovation intensity) are affected by trade barriers. The results show that for tariff and non-tariff trade barriers industries with predominantly high innovation intensity are strongly affected in countries like Spain, Germany, Latvia, Finland, Denmark or Malta. Also, trade defence mechanisms affect mainly highly innovative sectors. Market characteristics such as buyer sophistication and competition have the strongest influence on firms in the technologically more advanced EU countries in general and on highly innovative sectors in some countries in particular. From this follows that for certain markets some of Europe’s innovative firms experience external barriers to trade that limit their capability to become active on foreign markets.
Table E6: Summary of external barriers to internationalisation by sector group
Countries, where specific sector groups are affected
Type of barrier Countries affected overall by barrier
High innovation intensity sectors
Medium-high innovation intensity sectors
Tariffs LT, FI, FR, DE, UK, NL, IT, CY ES, LV, MT, SE, AT, PT, DE, LU, SI
GR, ES, SI
Non-Tariff UK, FR, LT, FI, GR, IE, NL, CY, BE
LU, ES, MT ES, IE, SI
- Transport. costs SK, RO, SI, DE, PT, HU LT IE
- Time LT, SK, FI, SI CY, LV, SE CY, GR
Trade Defence UK, BE, FR, GR LU, SK, MT, LV, ES, SI, PT, DE
IE, ES
Business practices (corruption)
LT FI, LV, GR, SE GR, BG, SI
Source: CIS 3 accessed at the Eurostat Safe Centre, WIFO/ISI calculations
Note: Compiled by Fraunhofer ISI based on the results presented in Chapter 4. Sectors (NACE-codes) classified by innovation intensity: high – 29, 30, 31, 32, 33, 72, 73; medium-high – 17, 23, 24, 25, 26, 27, 34, 35, 64; medium – 20, 21, 28, 36, 62, 65, 74; medium-low – 10, 11, 15, 16, 22, 40, 41, 66; low – 14, 18, 19, 37, 51, 60, 61, 63, 67;
European firms continue to face trade barriers in the Single Market.
Looking at intra-EU trade we find that even in the Single Market barriers continue to exist. The costs for inland transport are rather high within some EU countries. Trade between member states is also hampered by paperwork related to exports. For instance, some Member States require technical standard or health certificates which firms from other EU Member States have to present when they export to these countries. Another aspect that increases the difficulty of exporting to the EU internal market is that it is characterised by high buyer sophistication which forces firms to adapt their product features and characteristics to the customers’ habits and attitudes. This
xxv
characteristic of the internal market may act as a hampering factor for firms that are constrained by internal barriers to internationalisation. This indicates that the relatively high heterogeneity of preferences of customers across EU member states is likely to put European innovators at a disadvantage with respect to innovators operating in economic areas that are more homogeneous. However, this may also be seen as a factor that increases the flexibility of European innovators to adapt to a heterogeneous business environment, which eventually may be beneficial for exporting to non-EU markets. A combined analysis of external and internal barriers shows that internal and external barriers to export seem to be equally important when firms consider to export. In particular, with respect to the relative importance of individual export barriers, we find that non-tariff barriers, unstable political and economic conditions, the risk of shortfall in payment, missing colonial ties or language competences and a large distance to the potential destination act as market entry barriers, i.e. they do prevent firms from exporting at all. Secondly, high tariffs, high transport costs, trade defence or IPR barriers and high corruption, affect the export intensity. This means that firms are affected every day by these barriers, and working on the removal of these barriers could perhaps help to increase export shares. The same holds for tarrifs. It could also have a positive effect on the export intensity of firms, if transport costs, trade defence or IPR barriers or corruption were lower in the export partner countries.
Innovation and internationalisation policies to foster both innovation and exports should be linked up more closely...
To conclude, the three analytical chapters of this report show that internationalisation and innovation are closely related. Barriers to innovation therefore act also as barriers to internationalisation, and trade barriers on the other hand have also a negative impact on innovation. The removal of barriers to innovation will positively affect the internationalisation efforts of innovative firms, whereas the elimination of barriers to internationalisation is likely to foster innovation activities of firms. Our study of the barriers to innovation and the barriers to internationalisation supports the view that innovation and internationalisation are two sides of the same coin. Indeed, firm specific barriers to innovation and firm specific barriers to internationalisation are largely congruent. The results show however also that the perception of barriers varies across countries. Firms in technologically more advanced countries are more likely to perceive both innovation and internationalisation barriers as more pressing because they are also more heavily engaged in these activities, and also because the principal drivers of innovation differ across these country groups. This calls for a differentiated policy approach. Another important qualification emerging from our analysis is that it is possible to identify in the CIS non-innovators that do not engage into innovation and internationalisation because they perceive certain barriers that force them to limit their engagement in these activities. They are distinct from non-innovators or firms that do not internationalise because they operate on local markets and have no intension to expand their activities beyond their regional or national reach. Hence, the former group represents an important target for policy that should be addressed in a more focused way.
xxvi
... as this has long been a neglected dimension in the design of policies supporting innovation and exports at the EU level.
The summary review of EU policies addressing the link between innovation and internationalisation of this report shows that until recently it has not been identified as an important aspect to support innovation and link up different EC policy areas. As a consequence this dimension has been missing in past policies. Recently this situation has changed. In 2008, for instance, the Enterprise Europe Network (EEN) has been set up that links up 570 business support organisations (contact points) in 45 countries. It offers support in finding international partners by maintaining a business cooperation database that allows for target-oriented match-making. Additionally the EEN offers support in questions regarding technology transfer, access to finance, research funding and even intellectual property and patents. Therefore, the EEN is close to a one-stop-shop for SMEs that whish to internationalise their business activities. Other programmes, such as the EUROSTARS-programme have also been launched recently. These are recent developments such that it is too soon to give an evidence-based appraisal. Despite this development, the review of policies in place reveals that the link between innovation and internationalisation could be combined more thoroughly across different policies.
Member states deal with the support of innovation and internationalisation in many different ways. They could learn from each other.
Looking at the link between innovation and internationalisation support at the level of the member states this report has explored how these are organized in a few member states. Even this very limited review shows that there is a considerable variety in terms of how member states deal with this issue. Some have well targeted instruments in place that combine both dimensions whereas others do not link up the two issues. Member states can learn from each other as to what concerns best practices in this policy field. While internationalisation policies for firms remain in the domain of the Member states the EU has an important role to play: The European Commission could initiate a policy learning exercise in this field.
It would be worth exploring whether different policies supporting innovation and internationalisation at the EU level could be coordinated better.
Turning finally to the barriers to innovation and internationalisation the review of related policies at the EU level shows that there is a large portfolio of measures addressing all the barriers discussed in this report. However, there is a large dispersion of responsibilities across different EU institutions and different administrative units of the European Commission. This report has shown that firms face considerable information problems when trying to overcome innovation and internationalisation barriers. As a consequence of this dispersion of measures, the availability of information to firms may be problematic. The EEN is an instrument to overcome such information deficits. However, it should be assessed whether this instrument provides all the relevant information or whether the scope of its data base should be extended. Furthermore, it should also be assessed whether all firms and firm types that report barriers to innovation, are equally well supported by the instruments that are currently in place. The dispersion of measures within and across different administrative levels might also be a source of redundancies, policy
xxvii
inconsistencies and contradictory incentives. As the communication on the Flagship Initiative “Innovation Union” commits to better link EU and national research and innovation systems with each other a systematic review should be carried out. It should assess whether all instruments in place are able to reach firms that face barriers, and whether the incentives these instruments provide are consistent.
xxviii
Table of Contents
Foreword ........................................................................................................................................... iii
Executive Summary .......................................................................................................................... v
Key Findings ..................................................................................................................................... xi
1 Introduction ................................................................................................................................ 2
1.1 Principal issues addressed in this report ............................................................................. 3
1.1.1 Innovation as a driver of internationalisation ................................................................. 3
1.1.2 Barriers to innovation as barriers to internationalisation ............................................... 3
1.1.3 Internal and external barriers to internationalisation ..................................................... 5
1.2 The general framework of analysis ...................................................................................... 6
1.2.1 Distance to frontier ........................................................................................................ 6
1.2.2 The innovative firm as unit of analysis .......................................................................... 8
1.2.3 Principal data sources and methodology ...................................................................... 9
1.3 Outline of the report ........................................................................................................... 10
2 The relationship between innovation and internationalisation ................................................. 11
2.1 Introduction ........................................................................................................................ 11
2.2 The impact of innovation on internationalisation ................................................................ 11
2.2.1 Costs of internationalisation, productivity and self-selection into export markets ....... 11
2.2.2 Product and process innovation and export performance ........................................... 12
2.2.3 Evidence on the impact of innovation on export performance .................................... 15
2.2.4 The role of innovation and exports for innovative SMEs ............................................. 16
2.3 The impact of internationalisation on innovation ................................................................ 19
2.3.1 The effects of exporting on innovation ........................................................................ 19
2.3.2 Evidence on the impact of internationalisation on innovation ..................................... 21
2.4 Innovation, internationalisation and economic performance .............................................. 22
2.4.1 Innovation, competitiveness and firm growth .............................................................. 22
2.4.2 The productivity gap between exporters and non-exporters ....................................... 23
2.5 Innovation and exporting – a virtuous circle? Summary .................................................... 25
2.6 The empirical analysis ....................................................................................................... 26
2.6.1 Descriptive evidence on the productivity of exporting firms ........................................ 26
2.6.2 Specification issues and methodology ........................................................................ 27
2.6.3 The impact of innovation on exports ........................................................................... 28
xxix
2.6.4 The impact of exports on innovation ........................................................................... 31
2.6.5 The impact of exports and innovation on economic performance ............................... 32
2.7 Conclusions ....................................................................................................................... 37
3 The barriers to innovation ........................................................................................................ 40
3.1 Introduction ........................................................................................................................ 40
3.2 Barriers to innovation ......................................................................................................... 43
3.2.1 What are barriers to innovation? External vs. internal barriers ................................... 43
3.2.2 Firm, country and industry characteristics are likely to influence the pattern of barriers observed ..................................................................................................................... 44
3.2.3 The set-up of the empirical studies on barriers to innovation ...................................... 50
3.3 Knowledge barriers to innovation ...................................................................................... 52
3.3.1 What are knowledge barriers to innovation? ............................................................... 52
3.3.2 Knowledge barriers and SMEs.................................................................................... 53
3.3.3 Knowledge barriers and internationalisation ............................................................... 54
3.3.4 Empirical results .......................................................................................................... 54
3.3.5 Discussion and messages .......................................................................................... 59
3.4 Financial barriers ............................................................................................................... 60
3.4.1 Why are there financial barriers to innovation? ........................................................... 60
3.4.2 Occurrence of financial constraints ............................................................................. 61
3.4.3 Impact of financial constraints on innovative activity at the firm level ......................... 65
3.4.4 Empirical analysis ....................................................................................................... 66
3.5 Skill shortages as barriers to innovation ............................................................................ 69
3.5.1 Why are there skill constraints? .................................................................................. 69
3.5.2 General aspects of the incidence of skill constraints .................................................. 71
3.5.3 Occurrence of skills constraints at the firm, industry and country level ....................... 74
3.5.4 Impact of skill constraints at the firm level ................................................................... 79
3.5.5 Empirical analysis ....................................................................................................... 79
3.6 Integrated assessment of knowledge, financial and skill barriers to innovation ................. 81
3.7 The role of IPR regimes for the innovative activities of firms ............................................. 85
3.7.1 What does IPR do? ..................................................................................................... 85
3.7.2 Affordability of patent protection and lacking IPR enforcement as potential barriers to innovation for SMEs .................................................................................................... 86
3.7.3 Main messages on IPRs ............................................................................................. 87
3.8 Standards and norms as drivers or barriers to innovation ................................................. 88
xxx
3.8.1 Introduction ................................................................................................................. 88
3.8.2 What do standards do? ............................................................................................... 88
3.8.3 Standards and innovation on the macroeconomic level.............................................. 91
3.8.4 Standards and innovation on the microeconomic level ............................................... 92
3.8.5 The internationalisation of standards .......................................................................... 93
3.8.6 Standardisation and SMEs.......................................................................................... 94
3.8.7 Summary ..................................................................................................................... 96
3.9 Regulation and innovation ................................................................................................. 97
3.9.1 Introduction ................................................................................................................. 97
3.9.2 What does regulation do? ........................................................................................... 97
3.9.3 Different kinds of regulations and their impact on innovation ...................................... 99
3.9.4 Regulation and innovation: evidence from specific industries ................................... 102
3.9.5 The importance of regulation for innovation: empirical results .................................. 106
3.9.6 Discussion and messages ........................................................................................ 109
3.10 Conclusions on the analysis of barriers of innovation ...................................................... 110
4 The barriers to internationalisation ........................................................................................ 113
4.1 Introduction ...................................................................................................................... 113
4.2 Barriers to internationalisation: their internal and external dimensions............................ 115
4.2.1 Internal barriers ......................................................................................................... 115
4.2.2 External barriers ........................................................................................................ 117
4.2.3 SME specific issues .................................................................................................. 122
4.2.4 Summing up the debate ............................................................................................ 124
4.3 Barriers to internationalisation: empirical findings from Europe ....................................... 125
4.3.1 Barriers internal to the firm ........................................................................................ 125
4.3.2 Barriers external to the firm ....................................................................................... 128
4.3.3 Combining internal and external barriers .................................................................. 143
4.4 Conclusions: The impact of internal and external barriers to internationalisation ............ 146
5 Summing up: Barriers to innovation and internationalisation for Europe's innovative companies .............................................................................................................................................. 150
6 Internationalisation and innovation: Issues for EU policy ...................................................... 158
6.1 Introduction ...................................................................................................................... 158
6.2 EU policy measures addressing barriers to innovation and internationalisation .............. 159
6.2.1 Policies targeted at knowledge barriers to innovation ............................................... 159
6.2.2 Policies targeted at financial barriers to innovation ................................................... 163
xxxi
6.2.3 Policies targeted at skill constraints .......................................................................... 167
6.2.4 Policies to improve the role of IPR for innovation and internationalisation ............... 172
6.2.5 Policies targeted at standardisation .......................................................................... 175
6.2.6 Policies targeted at barriers to internationalisation ................................................... 178
6.3 Spotlight on the support of internationalisation and innovation in some member states . 182
6.3.1 Introduction ............................................................................................................... 182
6.3.2 Germany ................................................................................................................... 184
6.3.3 Finland ...................................................................................................................... 187
6.3.4 UK ............................................................................................................................. 189
6.3.5 Conclusions and suggestions for further research .................................................... 191
6.4 General assessment of EU policy on innovation and internationalisation ....................... 193
7 Conclusions ........................................................................................................................... 195
7.1 Summary and policy recommendations ........................................................................... 195
7.2 Limits of current study and avenues for further research................................................. 201
References .................................................................................................................................... 204
Appendix A: Technical appendix ................................................................................................... 220
Regression tables for Chapter 2 ............................................................................................... 220
Regression tables for Chapter 4 ............................................................................................... 230
Methodology used for the descriptive analysis of external trade barriers in Chapter 4 ............. 232
Appendix B: Country groups (trade regions) and NACE industry classes .................................... 233
Groups of states (trade regions) ............................................................................................... 233
NACE Rev 1.1. two digit classification used in this report ......................................................... 234
Appendix D: Data tables for trade barriers .................................................................................... 236
xxxii
Tables
Table 1: Overview on contributions on productivity and self-selection ........................................... 13
Table 2: Overview on contributions on innovation and exports ...................................................... 17
Table 3: Productivity of exporters vs. non exporters across country and sector groups, CIS 2006 (2004-2006) . ................................................................................................................................... 26
Table 4: Regression results on the impact of innovation on exports, pooled sample ..................... 29
Table 5: Regression results on the impact of innovation on exports, subsamples by country and industry groups. .............................................................................................................................. 30
Table 6: Regression results on the impact of internationalisation on innovation, pooled sample. Source: CIS 3 data accessed at the Eurostat Safe Centre, WIFO calculations .............................. 31
Table 7: Regression results on the impact of internationalisation on innovation, subsamples by country and industry groups ............................................................................................................ 32
Table 8: Regression results on the impact of innovation and exports on employment growth, pooled sample ................................................................................................................................. 33
Table 9: Regression results on the impact of innovation and exports on employment growth, subsamples by country and industry groups ................................................................................... 33
Table 10: Regression results on the impact of innovation and exports on turnover growth, pooled sample ............................................................................................................................................ 34
Table 11: Regression results on the impact of innovation and exports on turnover growth, subsamples by country and industry groups ................................................................................... 35
Table 12: Regression results on the impact of innovation and exports on labour productivity growth, pooled sample .................................................................................................................... 36
Table 13: Regression results on the impact of innovation and exports on labour productivity growth ........................................................................................................................................................ 37
Table 14: Innovators across country groups ................................................................................... 41
Table 15: Share of exporters by innovative activity across country groups .................................... 41
Table 16: Importance of selected barriers to innovation for all firms and innovators across country groups ............................................................................................................................................. 46
Table 17: Lack of technical knowledge ........................................................................................... 55
Table 18: Lack of market knowledge .............................................................................................. 57
Table 19: Lack of innovation partners ............................................................................................. 58
Table 20: Summary presentation of empirical results on knowledge innovation barriers ............... 60
Table 21: Firm and country characteristics influencing the perception of financial barriers to innovation ........................................................................................................................................ 68
xxxiii
Table 22: Perception of financial barriers in services sectors ......................................................... 68
Table 23: Firm and country characteristics influencing the perception of skill barriers to innovation ........................................................................................................................................................ 81
Table 24: Firm and sector characteristics influencing the perception of barriers to innovation related to factors of production of companies ................................................................................. 82
Table 25: Firm and sector characteristics influencing the perception of barriers to innovation related to determinants, innovators vs. Non-barrier-related innovators .......................................... 84
Table 26: Effects of standards ........................................................................................................ 90
Table 27: Regulation and Innovation ............................................................................................ 100
Table 28: Innovation reduced the environmental impacts or improved health and safety ............ 109
Table 29: Export propensities and intensities of European firms .................................................. 125
Table 30: Internal (firm-Specific) barriers to internationalisation for European firms .................... 126
Table 31: Variables and data sources used for the analysis of external trade barriers. ............... 130
Table 32: Combined Analysis of Internal and External Barriers to Internationalisation ................ 144
Table 33: Summary of external barriers to internationalisation by sector group ........................... 148
Table 34: EU policy instruments to alleviate knowledge barriers .................................................. 162
Table 35: EU-level activities to lower financial constraints to innovation ...................................... 166
Table 36: EU-level instruments to address skill constraints .......................................................... 168
Table 37: Online tools for business about IPR .............................................................................. 172
Table 38: European policies and tools to remove trade barriers .................................................. 179
Table 39: Selected Indicators on the export performance and R&D expenditures ....................... 184
Table 40: Basic figures of SMEs in Germany 2008 ...................................................................... 185
Table 41: Selected Internationalisation indicators for Germany ................................................... 185
Table 42: Basic figures of SMEs in Finland 2008 ......................................................................... 187
Table 43: Selected Internationalisation indicators for Finland ...................................................... 188
Table 44: Basic figures of SMEs in the UK 2008 .......................................................................... 189
Table 45: Selected Internationalisation indicators for UK ............................................................. 190
Table 46: Technical appendix. Regression tables on the relation between innovation and internationalisation ........................................................................................................................ 220
Table 47: Technical appendix. Regression tables on the relation between exports and innovation ...................................................................................................................................................... 221
xxxiv
Table 48: Technical appendix. Regression tables on the relation between exports, innovation and economic performance ................................................................................................................. 222
Table 49: Technical appendix. Regression tables on market barriers .......................................... 223
Table 50: Technical appendix. Regression tables on technological barriers ................................ 224
Table 51: Technical appendix. Regression tables on technological barriers ................................ 225
Table 52: Technical appendix. Regression tables on financial barriers ........................................ 226
Table 53: Technical appendix. Regression tables on skill barriers ............................................... 227
Table 54: Technical appendix. Regression tables on the impact of regulation on environmental impact and health or safety requirements on innovation behaviour .............................................. 228
Table 55 Technical appendix. Regression tables on the impact of standards on innovation behaviour ...................................................................................................................................... 229
Table 56: Technical appendix. Regression tables on barriers to export ....................................... 230
Figures
Figure 1: Innovation and self-selection into export markets ........................................................ 15
Figure 2: The interplay between innovation, exports and economic performance ...................... 25
Figure 3: Constraints for innovation activities faced by SMEs in the last two years as a percentage of total replies, country groups in comparison, 2007 ................................. 48
Figure 4: Distribution of innovator types across country groups .................................................. 49
Figure 5: Financial market development (sum of stock market capitalisation, private credit and public bonds/GDP), 2004-2006 ............................................................................. 63
Figure 6: Venture capital intensity (Seed, early stage and expansion capital as a percentage of GDP), 2004-2006 ..................................................................................................... 65
Figure 7: Tertiary graduates in science and technology as well as in social sciences per 1.000 population aged 20-29, 2001-2007 .............................................................. 72
Figure 8: Share of high-skill industries in total value added, 1985-2005 ..................................... 72
Figure 9: Countries grouped by share of tertiary graduates in the population aged 25-64, 2004-2006 .................................................................................................................... 77
Figure 10: Countries grouped by share of science and technology graduates per 1.000 of population, 2004-2006 .................................................................................................. 77
Figure 11: Distribution of gazelles across country groups and innovator types ............................. 83
Figure 12: Equilibrium Participation in standardisation .................................................................. 95
Figure 13: Impact of innovation on issues of regulatory relevance .............................................. 107
xxxv
Figure 14: Classification of Export Barriers ................................................................................. 114
Figure 15: Countries and sectors in Europe affected by tariff barriers around the world ............. 132
Figure 16: Countries and sectors in Europe affected by non-tariff barriers around the world ..... 133
Figure 17: Countries and sectors in Europe affected by transport cost barriers around the world ..................................................................................................................... 135
Figure 18: Countries in Europe affected by transport costs (within EU internal market) ............. 136
Figure 19: Countries and sectors in Europe affected by the challenge of intensive market competition around the world ..................................................................................... 139
Figure 20: Countries and sectors in Europe affected by political-institutional barriers around the world (Rule of law) ................................................................................................ 140
Figure 21: Countries and sectors in Europe affected by socio-cultural barriers around the world (corruption) ....................................................................................................... 141
Figure 22: Countries in Europe affected by language barriers .................................................... 143
Figure 23: Summary on external trade barriers ........................................................................... 147
Figure 24: Categorisation of High-Growth Entrepreneurship Support Measures ........................ 184
Boxes
Box 1: Country classification and data availability ..................................................................... 7
Box 2: Industry classification based on appropriability, opportunity, cumulativeness and entrepreneurship (Peneder, 2010) used in this report .................................................... 9
Box 3: Explaining export performance - what has to be kept in mind ...................................... 17
Box 4: Why are exporting companies more productive than non-exporters? Evidence from the literature. ........................................................................................................ 24
Box 5: Innovation and internationalisation: The problem of evaluating causality .................... 27
Box 6: List of variables and description ................................................................................... 28
Box 7: Innovation, exports and economic performance – main conclusions from the econometric analysis in this chapter ............................................................................ 39
Box 8: Distinction between barrier-related and non-barrier-related non-innovators made in the analysis in this chapter ....................................................................................... 48
Box 9: Views of US SMEs on Barriers to Exporting and Strategies to Overcome those Barriers ............................................................................................................. 146
Box 10: Evidence from German Optical Technology SMEs .................................................... 147
Box 11: EU2020 guidelines on access to finance, venture capital and R&D funding .............. 166
xxxvi
Box 12: EU2020 guidelines relevant for skills for innovation ................................................... 171
Box 13: Recommendations related to the evidence on the relationship between innovation and internationalisation .............................................................................................. 196
Box 14: Recommendations related to barriers to innovation ................................................... 198
Box 15: Recommendations related to institutional framework conditions for innovation ......... 199
Box 16: Recommendations related to barriers to trade for the EU's innovative firms.............. 200
Box 17: Recommendations related to policies supporting innovation and internationalisation .............................................................................................. 201

1
Barriers to internationalisation and growth of EU's innovative companies
2
1 Introduction This study will examine factors that hamper Europe's innovative firms in their efforts to expand their activities both in their home countries and in international markets. Its principal aims are
to identify and analyse barriers to internationalisation and growth for innovative firms across EU Member States,
to assess whether the institutional support mechanisms of the EU are appropriate to overcome these barriers, and
to develop recommendations on how to strengthen the internationalisation of European innovative firms and especially SMEs further.
In the analyses that follow we restrict the notion of internationalisation to the relationship between innovation and exports. The report will not cover issues in international sourcing of knowledge, technology and skills or discuss the economic or social implications of offshoring and outsourcing. It will also not study the relevance of international collaborations for innovation. Most of these aspects will be covered in other focused studies in the INNO Grips Project.*
Innovative firms that try to expand into new markets face different obstacles and constraints subject to their own capabilities, the framework conditions of the country in which they are located and the framework conditions in the country to which they export. Unfavourable framework conditions and the lack of specific capabilities can have a negative impact on the internationali-sation efforts and innovation activities of companies. They will affect firm behaviour
by constraining the capability of firms to grow by limiting their access to national and international markets (e.g. trade barriers);
by influencing the expected returns to innovation and internationalisation activities (IPR costs, market regulations), or
by constraining the choice of resource allocation for innovative activities (e.g. through shortages of highly skilled human resources, lack of finance).
In order to identify relevant hampering factors and assess their influence on the behaviour of Europe's innovative companies across EU Member States several aspects have to be disentangled. On the one hand, it is important to recognise that there are considerable differences in economic development and in the industrial specialisation across EU Member States. As a consequence framework conditions at home and in international target markets will have a rather different impact on the export and innovation performance of firms across countries. The technological capabilities of firms in the same industry will also vary across EU member states and affect their internationalisation strategies.
On the other hand, it is very difficult to establish whether being an innovative company is conductive to a good export performance or whether a good export performance drives innovation activities. Past research has shown that more productive firms select themselves into foreign markets due to their superior performance. However, there is little evidence whether this is
* See http://www.proinno-europe.eu/inno-grips-ii/page/studies for more details.
3
generally true for innovative firms as well. It is important to understand this relationship adequately as depending on whether the causality runs from innovation to exports or the other way round the design of policies to support innovation and internationalisation should differ. We will examine this issue closely.
Finally, for European policy it is also important to establish whether trade barriers arise during transactions within or outside the boundaries of the Single Market. In the first case the evidence would point to issues related to the completion of the Single Market whereas trade barriers arising in transactions with countries outside the EU relate to EU trade policies. These are distinct policy arenas with specific policy approaches and instruments. The analyses in this report will help us to establish whether the different institutional support mechanisms of the EU in the areas of innovation policy, trade and Single Market policies are appropriate to foster the growth of innovative firms both inside and outside the Single Market. We will also examine to what extent these policies complement each other for this purpose.
1.1 Principal issues addressed in this report
1.1.1 Innovation as a driver of internationalisation There is robust evidence that R&D positively affects productivity (e.g. Griliches and Mairesse 1984, Crepon, Duguet and Mairesse 1998, Wakelin 2001), and higher productivity in turn favours export activities. Furthermore, international active firms are top performers in terms of value added, employment and productivity (see e.g. Mayer and Ottaviano 2007), and firms need to have a sufficient degree of internationalisation, i.e. be active in many markets, to capture successfully the fruits of innovation. However, it is difficult to show whether innovation spurs internationalisation or vice versa.
This question has implications for policy design. If European firms are innovative but cannot internationalise their activities because of unfavourable framework conditions, then policy should try to primarily address these framework conditions. However, the situation is different if European firms are generally weak innovators and as a consequence they are not able to engage on average successfully in internationalisation activities. In this case, firms need to be supported in their innovation efforts.
1.1.2 Barriers to innovation as barriers to internationalisation Innovation is one of the most important determinants of firm growth. For this reason we conceive barriers to (firm) growth as being largely factors that hamper innovation activities of firms. The study will distinguish between innovation barriers related to the availability of resources such as technological and market knowledge, financial resources and skilled labour, as well as innovation barriers related to legislation such as standardisation, regulation and intellectual property rights.
1.1.2.1 Factors constraining innovation related to the availability of resources
Reinstaller and Unterlass (2008) have presented evidence that the most urgent innovation challenges across all EU countries and sectors are the shortage of highly skilled human resources
4
and the lack of venture capital. Access to finance, the shortage of and skilled human capital have a very direct impact on innovation choices of firms.
Access to finance is crucial not only for the emergence of new companies, but also for R&D investments. Low levels of operating surplus increase the need for external finance for innovation activities (see Reinstaller and Unterlass 2008). Moreover, R&D-intensive firms at the technological frontier strongly rely on investment in intangible assets and less on physical investment making traditional bank loans insufficient as no collaterals can be offered. This results in increased need for venture capital (e.g. Peneder and Schwarz 2008). In many EU member states the legal and regulatory environment needs improvement in areas such as securities regulation, insolvency legislation, or prudential rules to meet the changing demand for finance as Europe more and more shifts towards a knowledge-based economy.
The shortage of skilled human resources has been identified as one of the most pressing problems for growth in the most advanced economies. The structural change towards education intensive industries in the EU-15 countries (Peneder 2007) increases the requirements for people with tertiary education, while catching-up countries mainly need skilled workers with vocational training. Besides a reform of European universities (e.g. Aghion et al. 2008), the mobility of researchers and engineers and also the overall level of training and education of the workforce are important issues. The fewer researchers or engineers are locally as well as globally available in a specific technological field, the more important is their willingness to accept those jobs they are primarily specialised in (regardless of the location of the job). Framework conditions (e.g. migration law, working permission, attractiveness of a location etc.) are therefore a very important issue for companies to be able to recruit needed researchers (cf. Huber et al. 2010). In order to develop well-targeted policies it is necessary to understand what type of skilled workers, researchers and engineers and how many are needed, as this depends on whether a company does R&D in-house or purchases external knowledge.
1.1.2.2 Factors constraining innovation activities related to legislation
Technological and market barriers have an impact on competition as they make market entry more expensive for firms and therefore affect the expected profits from innovation. Economic theory therefore suggests that changes in the degree of product market competition, i.e. putting pressure on firm profitability, leads to increased innovation. Reforms to remove regulatory or market barriers could at least go some way towards increasing innovation intensity within the EU (see e.g. Nicoletti and Scarpetta 2003, Griffith et al. 2006). At least the removal of barriers to entry for innovative firms is expected to be reasonable, as these firms are generally more innovative than large and old ones (Hölzl and Reinstaller 2008).
On the contrary, too fierce competition potentially impedes innovation. As Aghion et al. (2005) state, the relationship between innovation activities and competition follows an inverted U-shaped pattern. This finding was largely confirmed for specific industries, whereas this pattern changes with the distance to the technological frontier (see Crespi and Patel 2008). In less developed industries too much competition is detrimental to increase innovation efforts. The removal of
5
market barriers to foster competition may have positive effects on innovation activities only for the most developed industries.
On the other hand, Amable et al. (2010) shows a positive impact of regulation on innovation in any case and this positive effect increases as one moves closer to the frontier. The authors argue that especially market regulations may shift competition away from simple price competition towards quality competition. This is particularly true for technological standards. Standards and technical regulations, which also govern the admissibility of imported goods into an economy and hence raise costs of exporters entering new markets, yet have a positive side: they certify product quality and safety for the consumer, and as a consequence they shift competition towards product quality (e.g. Ganslandt and Markusen 2001). This is especially important for eco-innovators (Cleef et al. 2008).
Overall, this indicates that the wholesale argument that more competition is always good for innovation needs to be discussed in a more differentiated way. Standards as well as regulatory or market barriers under specific circumstances can have the effect to drive innovation.
The level of access to and the affordability of intellectual property become important factors for innovation and firm growth the closer the gap to the technological frontier. With increasing innovation intensity of an industry and with decreasing distance to the technological frontier intellectual property right protection becomes more significant for innovation. A sound IPR regime constricts imitation and hence has an impact on expected revenues from innovation acting as an incentive to engage into more innovation (Reinstaller and Unterlass 2010).
The system of intellectual property right protection in the EU faces essentially two problems that need to be addressed by policy. Firstly, IPR protection in emergent markets is weak and these countries have also developed policies to attract foreign investment by technologically advanced firms with the aim to benefit from technological spillovers. European firms are often reluctant to invest in these markets as domestic competitors may easily imitate their products and technologies. Secondly, and probably more severe is the incongruity of the European patent system. As has been shown (e.g. de Rassenfosse and van Pottelsberghe 2007) the European patent system is too expensive. Costs for filing a patent through the EPO increase exponentially in the number of filings at national patent offices. Companies then find it difficult to expand their activities into EU markets where their intellectual property is not covered constraining the firms' growth potential. Policy action is therefore required to increase recent efforts to develop a European Patent that would reduce the costs that are now associated with claiming patents in Europe.
1.1.3 Internal and external barriers to internationalisation Considering the export performance of firms it has been shown, that export barriers constitute trade costs. These are the higher, the lower the export experience of firms is (see e.g. Andersen and van Wincoop 2004, Kneller and Pisu 2007). A well designed institutional setting that minimises the costs of internationalisation for SMEs is of great importance for the export performance of domestic enterprises.
6
Given the heterogeneity of European countries regarding their position in relation to the technological frontier there are different idiosyncratic institutional needs among member states. Comparative research will yield insights as regards the specific institutional mechanisms of various countries to support domestic SMEs in their internationalisation activities. Overall however, a satisfactory treatment of the impact of trade barriers, institutional support mechanisms and language and cultural barriers depends on the outcome to the question of the causal link between innovation and internationalisation. Once this question has been successfully tackled it is possible to derive certain policy recommendations.
1.2 The general framework of analysis
1.2.1 Distance to frontier We have argued before that there are considerable differences in economic development and in the industrial specialisation across EU Member States, and that this will have a rather different impact on the export and innovation performance of firms across countries. It is today state of the art to view the process of growth and convergence across countries as being driven by different factors subject to the state of economic development of the country (Basu and Weil 1998, Aghion and Howitt 2006, Los and Timmer 2005). Differences in the national innovation system that have grown out of historical differences in up-front public investments in science, technology and the educational infrastructure affect the nature of innovation and growth processes across countries.
Countries with advanced scientific and technological capabilities and a highly productive economy are said to be close to the international technological frontier. In these countries growth is largely driven by innovation which is in turn fuelled by science based knowledge creation that leads to the creation of new industries or technologically advanced products. In countries farther off this technological frontier growth is instead driven by the diffusion of existing technologies as well as through the absorption of embodied and disembodied knowledge transfers. Firms in these countries innovate by imitating and refining products that have formerly been produced in the more advanced countries.
Acemoglu, Aghion, and Zilibotti (2006) have called for the development of appropriate institutions and policies subject to how far a country is from the international technological frontier: Far from this frontier a country will maximise growth by favouring institutions that facilitate the imitation and implementation of technologies invented and developed abroad; however as it catches up with the technological frontier in order to sustain a high growth rate the country, it will have to shift from implementation-enhancing institutions to innovation-enhancing institutions as the relative importance of the generation of new knowledge increases.
Following this general line of reasoning Reinstaller and Unterlass (2010) have shown using CIS micro-data for 17 EU countries that the determinants of successful product innovation of European innovative firms vary across countries depending on how far they are from the technological frontier. Farther away from the technological frontier technology transfer is more important than own R&D; close to the frontier the cooperation with universities, own research, highly skilled personnel and intellectual property rights are very important. This suggests that also the barriers to
7
internationalisation and growth will vary for innovative companies across country groups. Subject to the level of economic development of the countries in which they operate the crucial drivers of innovation will be different. For instance, a firm operating close to the technological frontier will be able to produce better value for money through its R&D activities and this will allow firms to be internationally competitive. However, a firm farther away from the technological frontier may be able to compensate differences in productivity or product quality with more favourable factor costs and export successfully thanks to this. If IPRs are now enforced only weakly in foreign markets this will constrain export activities of the former company more heavily than that of the latter, as its competitive advantage lies in specific factor endowments and not in technological capabilities that may be copied abroad. The examples show that innovation, internationalisation and the state of economic development are intrinsically related. For this reason this report will take these dimensions into account when analysing the barriers to internationalisation for innovative companies in the EU.
Box 1: Country classification and data availability
Country group 1 (high direct technology intensity):
Belgium (BE)+, Denmark (DK)+,++,+++, Germany (DE)+, Finland (FI)+,++,+++, France (FR)+,++, Iceland (IS)+,++, Luxemburg (LU)+,++,+++, Norway (NO)+,++,+++, Sweden (SE)+,++,+++, United Kingdom (UK)§, Netherlands (NL)§, Austria (AT)§
Country group 2 (high indirect technology intensity):
Czech Republic (CZ)+,++,+++, Estonia (EE)+,++,+++, Hungary (HU)+,++,+++, Slovenia (SI)+,++,+++, Slovak Republic (SK)+,++,+++, Ireland (IE)+++
Country group 3 (low direct and indirect technology intensity, with higher GDP per capita):
Spain (ES)+,++,+++, Italy (IT)+,++,+++, Portugal (PT)+,++,+++, Greece (GR)+,++,+++
Country group 4 (low overall technology intensity):
Bulgaria (BG)+,++,+++, Lithuania (LT)+,++,+++, Latvia (LV)+,++,+++, Poland (PL)§, Romania (RO)+,++,+++, Cyprus (CY)+++, Malta (MT)+++
Note: Availability of Community Innovation Survey (CIS) data at the Eurostat Safe Centre in Luxemburg: + CIS3, ++ CIS 4, +++ CIS2006; § access not allowed by national statistical institute.
Reinstaller and Unterlass (2010) have constructed a classification of EU countries using the direct and indirect R&D intensity of each country resulting from an input-output analysis. The direct R&D intensity is the direct investment of the business sector into research and development as shown by the share of R&D in GDP of the business sector in the common STI statistics. The indirect R&D intensity instead captures the R&D embodied in capital goods used in the industries of a country. This is a measure for the level of technology transfer. The relative share of the two indicators and their absolute values therefore capture the level of technical development of a country in terms of its capability to generate new technologies and its reliance on foreign technologies. This depends also on a country's industry structure.
Using a statistical cluster analysis on these data Reinstaller and Unterlass (2010) have identified four country groups. The first group of countries has high direct technology intensity and the relative share of indirect technology intensity decreases with respect to other country groups. The countries in the second group have high indirect technology intensity. Direct R&D intensity in these countries is low, but R&D embodied in imported equipment is high. The countries in the third group have relatively low levels of both direct and indirect technology intensity. The fourth group, finally, consists of countries with low overall technology intensity both in terms of direct and indirect R&D. Box 1 presents the classification of countries and indicates for which countries CIS data could be accessed at the Eurostat Safe Centre in Luxemburg.
8
1.2.2 The innovative firm as unit of analysis The remit for this study was to analyse the role of barriers to innovation, internationalisation and growth at the firm level. For this reason the unit of analysis of this report is – whenever possible – the innovative firm. This choice determines also our choice of the principal data set we work with in this study, which is the Community Innovation Survey (CIS).
Using a micro data set has some clear advantages especially if one studies the innovation and internationalisation behaviour of firms. The single units and their choices are directly observed and thereby can be better taken into account. On the other hand, however, using micro level data makes it also difficult to make clear inferences on the behaviour and the impact of phenomena on the entire population because of the high heterogeneity we observe at this level. This limits the value of micro-level studies for policy makers. To circumvent this issue it is necessary to classify firms in such a way that information can be condensed in a meaningful way. In order to take better into account differences in innovation and internationalisation activities across firms the study will analyse firm according to a number of different criteria:
innovators – non-innovators exporters – non-exporters sector groups
Based on the taxonomy by Peneder (2010) that captures the innovation intensity and the technological regimes of industries (see Box 2);
Services vs. Manufacturing vs. others Manufacturing (NACE 15-37) Services (NACE 51-74) Others (NACE 10-14, and 40-41)
The industry classification based in innovation intensities will be used in all analytical chapters of this report. Box 2 contains a detailed description of the criteria underlying its construction.* The benefit of using this classification is that it captures essential aspects of the innovation profile in an industry such that comparisons across industries and firms are more accurate, and that in those cases where no micro-data are available statements can be made about innovation intensive and less intensive industries.
* The statistical classification of economic activities (NACE) used in this report are listed in the appendix.
9
Box 2: Industry classification based on appropriability, opportunity, cumulativeness and entrepreneurship (Peneder 2010) used in this report
Peneder (2010) constructs an innovation classification based on Community Innovation Survey (CIS) micro data for 21 countries. He classifies firms on the basis of entrepreneurship types and technological regimes.
Entrepreneurship: The firm classification distinguishes between creative and adaptive entrepreneurship. Creative entrepreneurs are characterised by firm specific innovations and can be further separated into firms producing: (i) their own process innovations; (ii) their own, new-to-the-market product innovations; or (iii) both. All other firms are characterised as adaptive entrepreneurs. Among these Peneder distinguishes a fourth group of technology adopters, which create product innovations that are new to the firm, but not to the market, or produce process innovations mainly in cooperation with other enterprises or institutions. Finally, he identifies a fifth, residual group of adaptive entrepreneurs that pursue opportunities other than technological innovation.
'Technological regimes' are characterised in terms of opportunity, appropriability and cumulativeness conditions, whose combination defines the particular knowledge and learning environments within which the firm operates.
Opportunity conditions: The classification distinguishes four firm conditions according to the perceived technological opportunities demonstrated by the firm's innovation activity: (i) no opportunities - the firm neither performs intramural R&D nor purchases external innovations; (ii) acquisition - the firm innovates only by purchasing external R&D, machinery, or rights (patents, trademarks, etc.); (iii) intramural R&D - the firm undertakes its own R&D, but the ratio of innovation expenditure to total turnover is less than 5%; and (iv) high R&D - the firm performs intramural R&D and its share of innovation expenditures in total turnover is more than 5%.
Appropriability conditions: (i) strategic - for firms relying exclusively on secrecy, complexity of design, or lead-time advantages to protect their innovations; (ii) formal (other than patents) - firms that use the registration of design patterns, trademarks, or copyright; (iii) patenting (either as well as or without strategic or other formal methods of protection); (iv) full arsenal - firms make use of all of the above three means of protection; (v) none - firms employ none of these tools.
Degree of knowledge cumulativeness: CIS data do not provide direct measures of cumulativeness. Peneder (2010) combines two aspects of the CIS data. First he differentiates according to the relative importance of internal vs. external sources of information. Second, he applies contrasting identification rules depending on whether the firm seems to be a technology leader or a technology follower. Thus, firms within the 'creative response' classifications of entrepreneurship are characterised as operating within highly cumulative regimes if internal sources of knowledge are more or at least as important as external sources, and as operating in low cumulative regimes if the firm draws more on external than internal knowledge for its innovations. These identification rules are reversed for 'adaptive entrepreneurship' type firms.
Based on these criteria Peneder (2010) identifies five industry groups according to their innovation intensity and the underlying technological regime:
High innovation intensity: NACE 29, NACE 30, NACE 31, NACE 32, NACE 33, NACE 72, NACE 73
Medium-high innovation intensity: NACE 17, NACE 23, NACE 24, NACE 25, NACE 26, NACE 27, NACE 34, NACE 35, NACE 64
Medium innovation intensity: NACE 20, NACE 21, NACE 28, NACE 36, NACE 62, NACE 65, NACE 74
Medium-low innovation intensity: NACE 10, NACE 11, NACE 15*, NACE 16, NACE 22, NACE 40, NACE 41, NACE 66
Low innovation intensity: NACE 14, NACE 18, NACE 19, NACE 37, NACE 51, NACE 60, NACE 61, NACE 63, NACE 67.
1.2.3 Principal data sources and methodology This study will rely on extensive literature reviews, econometric analysis to study the nature and impact of hampering factors for growth and internationalisation on innovative firms, descriptive statistics and short case studies where a quantitative appraisal is difficult. The evidence we gain in this process will then be used to discuss policy implications for EU policy. Methodological aspects are discussed more in depth in each chapter.
The principal results were obtained using firm level data from the European Community Innovation Survey (CIS) for 21 countries for the years 1998-2000, 2002-2004, and 2004-2006. These data were accessed at the Eurostat Safe Centre in Luxemburg.* A shortcoming of this reliance on CIS data is that this survey has not been designed to provide information on the internationalisation of innovative firms in terms of their expansion on foreign markets. Only the CIS3 survey for the years 1998-2000 contains information on the export intensity of firms. All subsequent waves used in this study contain only information on whether an innovative firm actually exports or not. Other data sources that could provide information on both the innovation activities and aspects related to
* See Box 1 for the list of countries that were used for each wave of the CIS.
10
trade activities on the firm level are not available. The few data sets that exist cannot be used because they are proprietary and because they don't cover a reasonably large number of EU member states (e.g. Mayer and Ottaviano 2007, Cassiman and Golovko 2007, Damijan and Kostevc 2008). For this reason the analyses in this report will use the CIS data mostly to study the impact of firm specific characteristics and barriers perceived by firms on their export performance.
To appraise the trade barriers that may have an impact on the activities of innovative firms CIS data alone are not sufficient. For this reason we will construct indicators using sector specific trade data for all EU member states. More specifically we use trade shares of each sector with the World's countries. These are used to weight several indicators capturing important obstacles for trade and internationalisation at the national level. The trade shares have been calculated using the Prodcom data base, whereas indicators on obstacles and hampering factors are available from the World Bank, the OECD or the World Economic Forum. These weighted sector specific indicators on obstacles and hampering factors are then combined with the sectoral innovation classification used throughout this report (see Box 2). This permits to draw inferences on the effect of obstacles to trade and internationalisation on innovative firms. More details are given in Chapter 4 below.
Community innovation survey (CIS) for 21 countries (3 waves) – firm level data UN-Comtrade; Balance of Payments (BoP) by Eurostat for services (sectoral export
shares) World Bank "Doing Business", World Economic Forum (WEF) and OECD indicators on
institutional characteristics of countries Market Access Data Base (MADB) EC
1.3 Outline of the report The report is structured as follows: Chapter 2 will analyse the link between innovation – exports and economic performance on the one hand and exports – innovation and economic performance on the other hand. As we have discussed in this introduction this aspect is important to understand the linkage between innovation and internationalisation better and to be able to develop adequate policies. Based on an extensive literature review and an econometric analysis using CIS micro data this questions will be assessed. The Chapter 3 and 4 review the existing evidence on barriers to innovation, standards, regulation and IPRs (Chapter 3) and barriers to internationalisation and trade (Chapter 4). Chapter 5 gives a brief summary on the principal findings from the previous chapters. Chapter 6 then discusses and reflects our results with regards to existing EU policy measures, initiatives and documents. Chapter 7 will draw the main conclusions and present the main messages of this report.
11
2 The relationship between innovation and internationalisation
2.1 Introduction The European Union makes major efforts to improve the innovation performance of its companies with the aim to improve the global competitive position of the Union and create jobs and wealth. Firms that are involved in international activities through exports or foreign direct investment are typically top performers in terms of their capability to generate value added as well as employment and productivity (see e.g. Mayer and Ottaviano 2007). From the policy point of view this implies that more of Europe's innovative companies should compete and be competitive on global markets and create revenue and jobs at home. However, the relationship between innovation, exporting and economic performance is by no means unidirectional. It is difficult to show whether superior export performance is determined by a superior innovation performance, or whether internationalisation supports innovation. This is not a purely academic debate even though for policy in the end the issue of causality is of subordinate importance if the final goal is to get innovative companies to export. Nevertheless, policy measures could be designed better if we are able to understand these links adequately. For this reason we devote this first chapter to the exploration of the relationships between innovation, exports and economic performance.
2.2 The impact of innovation on internationalisation
2.2.1 Costs of internationalisation, productivity and self-selection into export markets
According to the so-called stage model of internationalisation, the first major step of a company's internationalisation is entering foreign markets by starting to export. Since this is the beginning of internationalisation activities, the company does not usually have any export experience. Nevertheless a company has to establish contacts to potential customers, set up logistic distribution channels, and modify its products to meet foreign tastes or country-specific regulations (López 2005). In principle, these activities are costly (concerning financial issues, human resources, etc.) and a company faces sunk-costs when overcoming the entry barriers of international markets.* Moreover, selling products abroad is also more costly than serving the domestic market after entrance. These costs mainly include transportation, but also distribution, marketing, and customer support that usually require additional skilled staff (Horvath and Janger 2008). Hence, a company has to have a comparative advantage (in particular compared to firms located in the target country) to be competitive. Greenaway and Kneller (2007) argue that heterogeneity in firm productivity explains why not all firms export. It is the combination of sunk-costs and firm productivity that determines which firms are able to start (or continue) exporting. As a result only the most productive firms select themselves into foreign markets. Furthermore, the
* These barriers are discussed in detail in Chapter 3.
12
exposure to international competition forces low-productivity firms to exit the export market and to serve the domestic market only and eventually exit the market altogether (Melitz 2003).
Wiersema and Bowen (2008) find that a firm's decision to start exporting is significantly influenced by the rate of foreign competition in its home market. The competitive pressure on the home market makes survivors more competitive and ready for the global market, which is indicated by a higher level of foreign sales and a greater geographical diffusion of sales. Furthermore, when comparing productivity levels across countries, firms in small countries tend to have higher export shares although they might have lower productivity than comparable companies in large countries (European Commission 2010b). Girma et al. (2008) find for instance for Irish firms higher export shares than for British ones and explain that by the fact that Ireland is a small and open economy. Irish firms may have to export earlier because there is less scope for them to supply the home market. Although the British exporters are ‚better' in terms of productivity, the Irish might have higher export shares on average. When comparing productivity levels of companies across countries, it has to be controlled for this ‚small country bias' to evaluate the self-selection patterns as well as the effects of innovation on exports accurately.*
Empirical evidence strongly supports the relationship between high productivity and exporting for many countries. A large number of studies has analysed whether firms that export or start exporting are more productive than firms that do not (see Table 1). These studies cover a wide range of countries and industries, and in general the evidence supports the self-selection view across countries. The state of economic development of the host country does not seem to influence this empirical regularity. One contribution does not find confirmation for the self-selection view outside the manufacturing industry in the UK (Harris and Li 2005). The research summarised in Table 1 has not explored the link between innovation and self-selection. Nevertheless, there is robust evidence that R&D positively affects productivity (e.g. Griliches and Mairesse 1984, Crepon, Duguet and Mairesse 1998, Wakelin 2001), and self-selection patterns strongly depend on productivity. A closer look at the relationship between innovation intensity, innovation modes and export performance should convey important insights.
2.2.2 Product and process innovation and export performance Figure 1 presents a stylised model on the relationship between innovation, productivity and export performance in which product and process innovations affect productivity directly. Both types of innovation – keeping all other things equal – affect the productivity of a firm positively. In the case of product innovations this typically happens through higher prices which firms can charge as their products provide some unique value in use to customers. Improved or renewed production and business processes instead allow firms to increase their speed of production and to reduce costs per unit of output. Both types of innovation allow a firm to increase its profit margin.
* In our empirical analysis we control for the small country bias using (i) country dummies, and (ii) country size measured by size of population in logs.
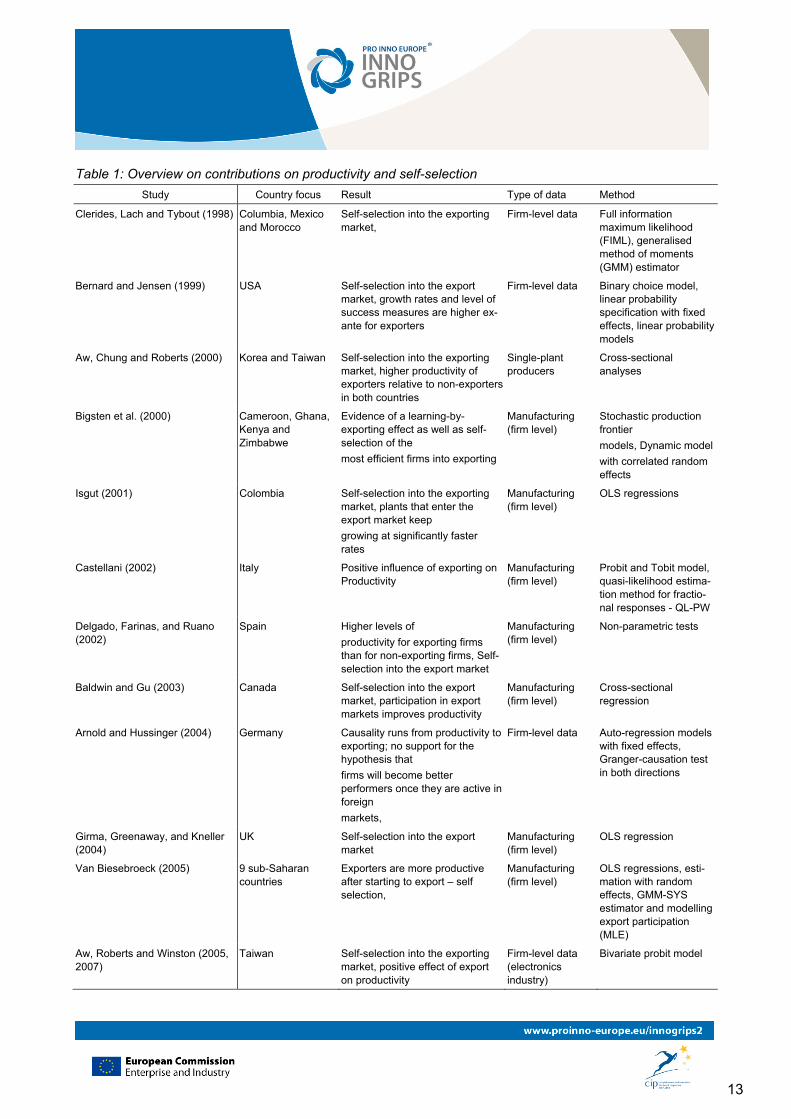
13
Table 1: Overview on contributions on productivity and self-selection
Study Country focus Result Type of data Method
Clerides, Lach and Tybout (1998) Columbia, Mexico and Morocco
Self-selection into the exporting market,
Firm-level data Full information maximum likelihood (FIML), generalised method of moments (GMM) estimator
Bernard and Jensen (1999) USA Self-selection into the export market, growth rates and level of success measures are higher ex-ante for exporters
Firm-level data Binary choice model, linear probability specification with fixed effects, linear probability models
Aw, Chung and Roberts (2000) Korea and Taiwan Self-selection into the exporting market, higher productivity of exporters relative to non-exporters in both countries
Single-plant producers
Cross-sectional analyses
Bigsten et al. (2000) Cameroon, Ghana, Kenya and Zimbabwe
Evidence of a learning-by-exporting effect as well as self-selection of the
most efficient firms into exporting
Manufacturing (firm level)
Stochastic production frontier
models, Dynamic model
with correlated random effects
Isgut (2001) Colombia Self-selection into the exporting market, plants that enter the export market keep
growing at significantly faster rates
Manufacturing (firm level)
OLS regressions
Castellani (2002) Italy Positive influence of exporting on Productivity
Manufacturing (firm level)
Probit and Tobit model, quasi-likelihood estima-tion method for fractio-nal responses - QL-PW
Delgado, Farinas, and Ruano (2002)
Spain Higher levels of
productivity for exporting firms than for non-exporting firms, Self-selection into the export market
Manufacturing (firm level)
Non-parametric tests
Baldwin and Gu (2003) Canada Self-selection into the export market, participation in export markets improves productivity
Manufacturing (firm level)
Cross-sectional regression
Arnold and Hussinger (2004) Germany Causality runs from productivity to exporting; no support for the hypothesis that
firms will become better performers once they are active in foreign
markets,
Firm-level data Auto-regression models with fixed effects, Granger-causation test in both directions
Girma, Greenaway, and Kneller (2004)
UK Self-selection into the export market
Manufacturing (firm level)
OLS regression
Van Biesebroeck (2005) 9 sub-Saharan countries
Exporters are more productive after starting to export – self selection,
Manufacturing (firm level)
OLS regressions, esti-mation with random effects, GMM-SYS estimator and modelling export participation (MLE)
Aw, Roberts and Winston (2005, 2007)
Taiwan Self-selection into the exporting market, positive effect of export on productivity
Firm-level data (electronics industry)
Bivariate probit model
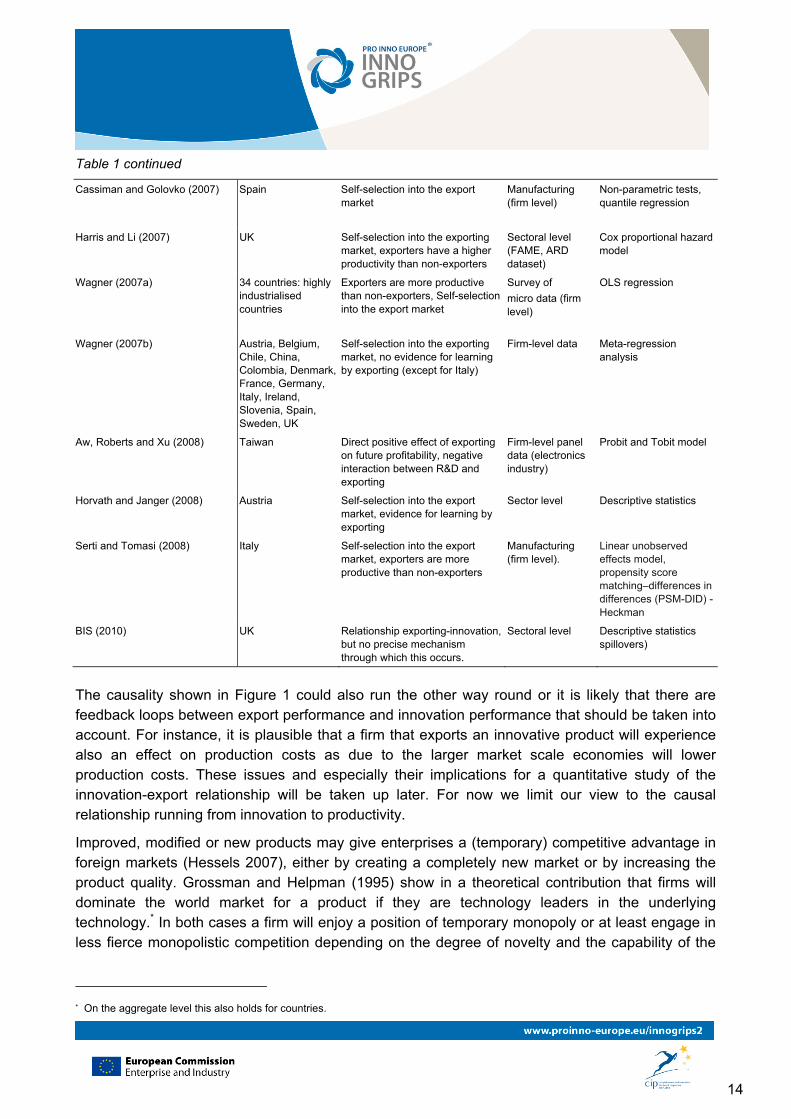
14
Table 1 continued
Cassiman and Golovko (2007) Spain Self-selection into the export market
Manufacturing (firm level)
Non-parametric tests, quantile regression
Harris and Li (2007) UK Self-selection into the exporting market, exporters have a higher productivity than non-exporters
Sectoral level (FAME, ARD dataset)
Cox proportional hazard model
Wagner (2007a) 34 countries: highly industrialised countries
Exporters are more productive than non-exporters, Self-selection into the export market
Survey of
micro data (firm level)
OLS regression
Wagner (2007b) Austria, Belgium, Chile, China, Colombia, Denmark, France, Germany, Italy, Ireland, Slovenia, Spain, Sweden, UK
Self-selection into the exporting market, no evidence for learning by exporting (except for Italy)
Firm-level data Meta-regression analysis
Aw, Roberts and Xu (2008) Taiwan Direct positive effect of exporting on future profitability, negative interaction between R&D and exporting
Firm-level panel data (electronics industry)
Probit and Tobit model
Horvath and Janger (2008) Austria Self-selection into the export market, evidence for learning by exporting
Sector level Descriptive statistics
Serti and Tomasi (2008) Italy Self-selection into the export market, exporters are more productive than non-exporters
Manufacturing (firm level).
Linear unobserved effects model, propensity score matching–differences in differences (PSM-DID) - Heckman
BIS (2010) UK Relationship exporting-innovation, but no precise mechanism through which this occurs.
Sectoral level Descriptive statistics spillovers)
The causality shown in Figure 1 could also run the other way round or it is likely that there are feedback loops between export performance and innovation performance that should be taken into account. For instance, it is plausible that a firm that exports an innovative product will experience also an effect on production costs as due to the larger market scale economies will lower production costs. These issues and especially their implications for a quantitative study of the innovation-export relationship will be taken up later. For now we limit our view to the causal relationship running from innovation to productivity.
Improved, modified or new products may give enterprises a (temporary) competitive advantage in foreign markets (Hessels 2007), either by creating a completely new market or by increasing the product quality. Grossman and Helpman (1995) show in a theoretical contribution that firms will dominate the world market for a product if they are technology leaders in the underlying technology.* In both cases a firm will enjoy a position of temporary monopoly or at least engage in less fierce monopolistic competition depending on the degree of novelty and the capability of the
* On the aggregate level this also holds for countries.
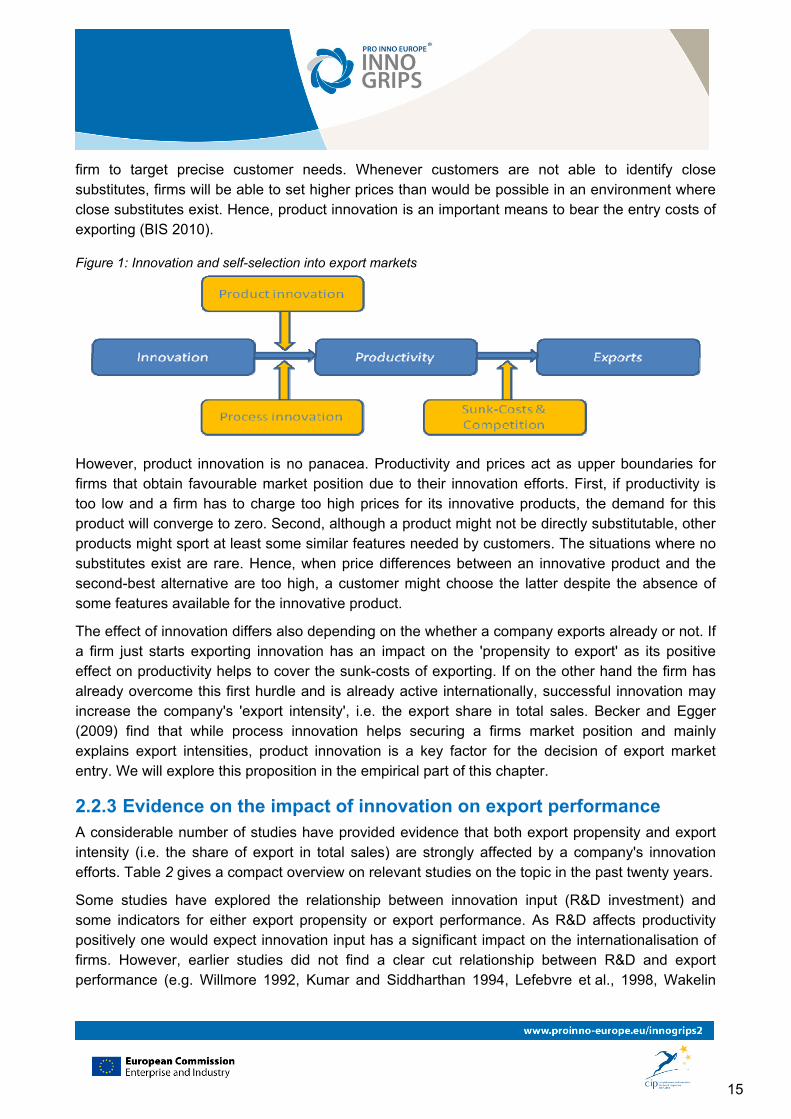
15
firm to target precise customer needs. Whenever customers are not able to identify close substitutes, firms will be able to set higher prices than would be possible in an environment where close substitutes exist. Hence, product innovation is an important means to bear the entry costs of exporting (BIS 2010).
Figure 1: Innovation and self-selection into export markets
However, product innovation is no panacea. Productivity and prices act as upper boundaries for firms that obtain favourable market position due to their innovation efforts. First, if productivity is too low and a firm has to charge too high prices for its innovative products, the demand for this product will converge to zero. Second, although a product might not be directly substitutable, other products might sport at least some similar features needed by customers. The situations where no substitutes exist are rare. Hence, when price differences between an innovative product and the second-best alternative are too high, a customer might choose the latter despite the absence of some features available for the innovative product.
The effect of innovation differs also depending on the whether a company exports already or not. If a firm just starts exporting innovation has an impact on the 'propensity to export' as its positive effect on productivity helps to cover the sunk-costs of exporting. If on the other hand the firm has already overcome this first hurdle and is already active internationally, successful innovation may increase the company's 'export intensity', i.e. the export share in total sales. Becker and Egger (2009) find that while process innovation helps securing a firms market position and mainly explains export intensities, product innovation is a key factor for the decision of export market entry. We will explore this proposition in the empirical part of this chapter.
2.2.3 Evidence on the impact of innovation on export performance A considerable number of studies have provided evidence that both export propensity and export intensity (i.e. the share of export in total sales) are strongly affected by a company's innovation efforts. Table 2 gives a compact overview on relevant studies on the topic in the past twenty years.
Some studies have explored the relationship between innovation input (R&D investment) and some indicators for either export propensity or export performance. As R&D affects productivity positively one would expect innovation input has a significant impact on the internationalisation of firms. However, earlier studies did not find a clear cut relationship between R&D and export performance (e.g. Willmore 1992, Kumar and Siddharthan 1994, Lefebvre et al., 1998, Wakelin
16
1998). Nevertheless, more recent work has predominantly found a positive effect of R&D on export indicators (e.g. Zhao and Li 1997, Ebling and Janz 1999, Smith et al. 2002, Hessels 2007).
Studies based on innovation input indicators are not able to establish how different types of innovation affect export performance as presented in the previous section. For this reason recent contributions have explored the effect of process and product innovations on exports explicitly. All studies find a positive relationship: product innovation is associated with better export performance of companies as compared to firm that have not introduced novel products on the market. For instance, Roper and Love (2002), conclude that in both Germany and the UK, being a product innovator is positively correlated with the export probability. Sterlacchini (2001) found for small Italian firms, that they achieve better export performance primarily through product rather than process innovation. Similar evidence is available for Spain (Cassiman und Golovko 2007; Cassiman and Martınez-Ros 2007), Germany (Becker and Egger 2009), and the Netherlands (Brouwer and Kleinknecht 1993, Hessels 2007).
Process innovation instead seems to be positively related to exporting as well, even though the evidence is less convincing. Becker and Egger (2009) find that process innovations increase a firm's probability to export only when combined with product innovations, while process innovations marginally raise a firm's export intensity. The overall conclusion of these studies is that innovative companies are more likely to be active in foreign markets. Despite the robust evidence on the positive relationship between innovation activities and exports it should be kept in mind that innovation is not the only driver of export performance (see Box 3).
2.2.4 The role of innovation and exports for innovative SMEs Exporting is an important issue for innovative SMEs. Niche markets may be too small on the national level such that it may be necessary for small companies to expand on foreign markets to be profitable and survive in the market (BIS 2010). Internationalisation is also an important channel to commercialise innovation output, in particular whenever imitation decreases the financial returns to innovation.* Companies have to be fast to recoup their investment for the development of a new product and earn high returns. They will be more successful if their market is large. Hence, they have an incentive to internationalise in order to reach the largest number of customers possible at the same time (Kafouros et al. 2008).
This behaviour has been labelled as the 'global exploitation of technology' (Kafouros et al. 2008; Archibugi und Michie 1995). In particular technology-based start-ups, tend to enter several foreign markets within a short time span. They are "Born Globals". The preferred entry mode of these companies is characterised by low resource commitment, and the main aim is commercialisation rather than foreign production (Burgel and Murray 2000). However, SMEs often do not have the resource to exploit their first mover advantage through internationalisation (BIS 2010, Burgel and
* Innovative products often have short product life cycles and investments in innovation are supposed to have high depreciation rates (Goto and Suzuki 1989; Pakes and Schankerman 1984), making an innovative product obsolete shortly after being introduced. Therefore, a company's innovation activities might affect its export performance in the year, the product has been introduced, but not necessarily in the following year (Lachenmaier and Wössmann 2006).
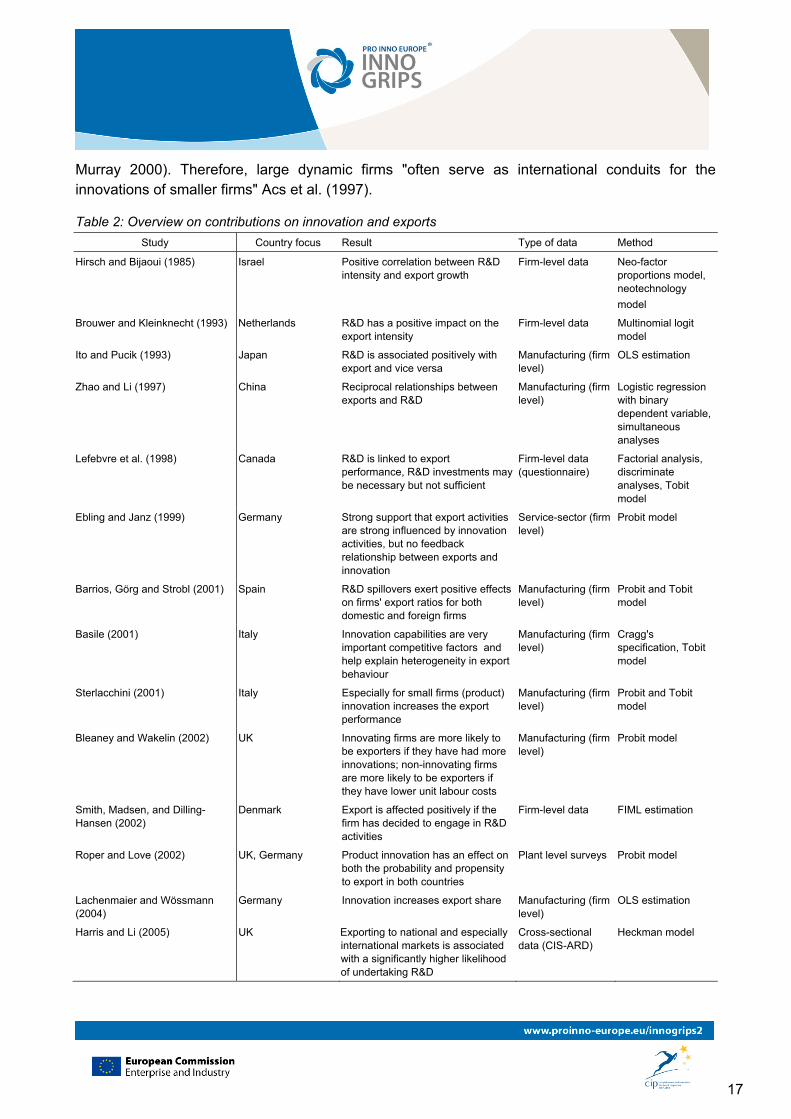
17
Murray 2000). Therefore, large dynamic firms "often serve as international conduits for the innovations of smaller firms" Acs et al. (1997).
Table 2: Overview on contributions on innovation and exports
Study Country focus Result Type of data Method
Hirsch and Bijaoui (1985) Israel Positive correlation between R&D intensity and export growth
Firm-level data Neo-factor proportions model, neotechnology
model
Brouwer and Kleinknecht (1993) Netherlands R&D has a positive impact on the export intensity
Firm-level data Multinomial logit model
Ito and Pucik (1993) Japan R&D is associated positively with export and vice versa
Manufacturing (firm level)
OLS estimation
Zhao and Li (1997) China Reciprocal relationships between exports and R&D
Manufacturing (firm level)
Logistic regression with binary dependent variable, simultaneous analyses
Lefebvre et al. (1998) Canada R&D is linked to export performance, R&D investments may be necessary but not sufficient
Firm-level data (questionnaire)
Factorial analysis, discriminate analyses, Tobit model
Ebling and Janz (1999) Germany Strong support that export activities are strong influenced by innovation activities, but no feedback relationship between exports and innovation
Service-sector (firm level)
Probit model
Barrios, Görg and Strobl (2001) Spain R&D spillovers exert positive effects on firms' export ratios for both domestic and foreign firms
Manufacturing (firm level)
Probit and Tobit model
Basile (2001) Italy Innovation capabilities are very important competitive factors and help explain heterogeneity in export behaviour
Manufacturing (firm level)
Cragg's specification, Tobit model
Sterlacchini (2001) Italy Especially for small firms (product) innovation increases the export performance
Manufacturing (firm level)
Probit and Tobit model
Bleaney and Wakelin (2002) UK Innovating firms are more likely to be exporters if they have had more innovations; non-innovating firms are more likely to be exporters if they have lower unit labour costs
Manufacturing (firm level)
Probit model
Smith, Madsen, and Dilling-Hansen (2002)
Denmark Export is affected positively if the firm has decided to engage in R&D activities
Firm-level data FIML estimation
Roper and Love (2002) UK, Germany Product innovation has an effect on both the probability and propensity to export in both countries
Plant level surveys Probit model
Lachenmaier and Wössmann (2004)
Germany Innovation increases export share Manufacturing (firm level)
OLS estimation
Harris and Li (2005) UK Exporting to national and especially international markets is associated with a significantly higher likelihood of undertaking R&D
Cross-sectional data (CIS-ARD)
Heckman model
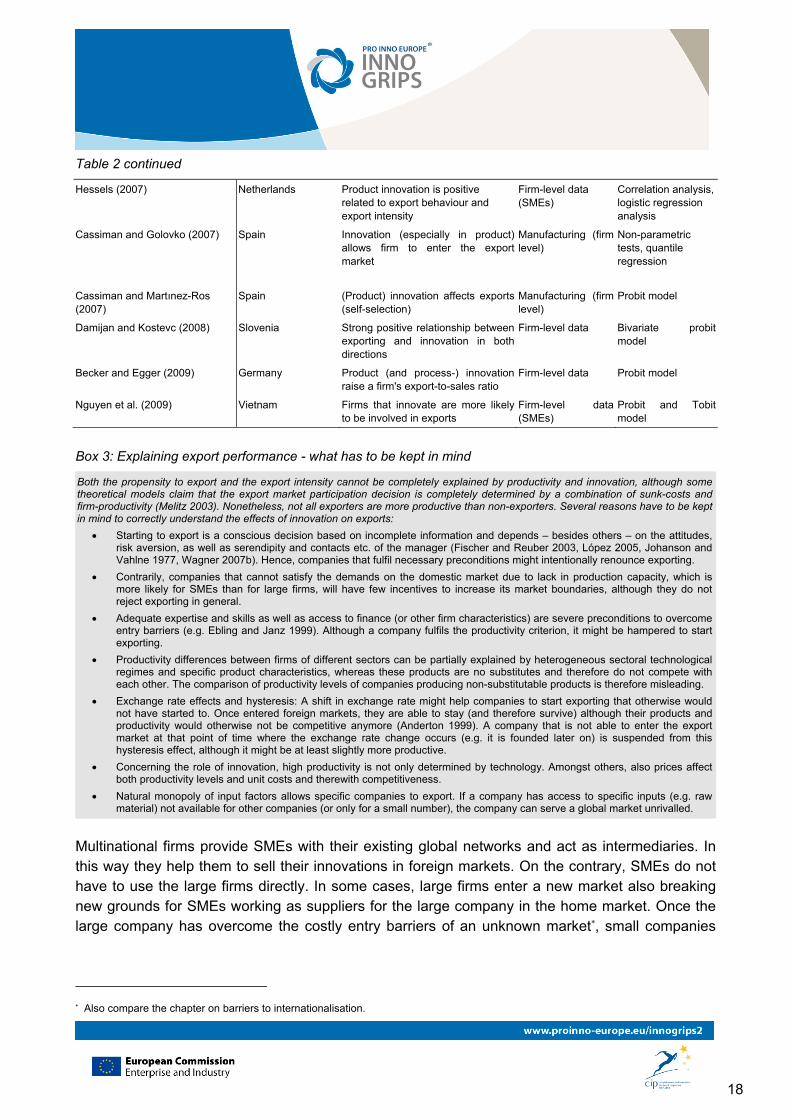
18
Table 2 continued
Hessels (2007) Netherlands Product innovation is positive related to export behaviour and export intensity
Firm-level data (SMEs)
Correlation analysis, logistic regression analysis
Cassiman and Golovko (2007) Spain Innovation (especially in product) allows firm to enter the export market
Manufacturing (firm level)
Non-parametric tests, quantile regression
Cassiman and Martınez-Ros (2007)
Spain (Product) innovation affects exports (self-selection)
Manufacturing (firm level)
Probit model
Damijan and Kostevc (2008) Slovenia Strong positive relationship between exporting and innovation in both directions
Firm-level data Bivariate probit model
Becker and Egger (2009) Germany Product (and process-) innovation raise a firm's export-to-sales ratio
Firm-level data Probit model
Nguyen et al. (2009) Vietnam Firms that innovate are more likely to be involved in exports
Firm-level data (SMEs)
Probit and Tobit model
Box 3: Explaining export performance - what has to be kept in mind
Both the propensity to export and the export intensity cannot be completely explained by productivity and innovation, although some theoretical models claim that the export market participation decision is completely determined by a combination of sunk-costs and firm-productivity (Melitz 2003). Nonetheless, not all exporters are more productive than non-exporters. Several reasons have to be kept in mind to correctly understand the effects of innovation on exports:
Starting to export is a conscious decision based on incomplete information and depends – besides others – on the attitudes, risk aversion, as well as serendipity and contacts etc. of the manager (Fischer and Reuber 2003, López 2005, Johanson and Vahlne 1977, Wagner 2007b). Hence, companies that fulfil necessary preconditions might intentionally renounce exporting.
Contrarily, companies that cannot satisfy the demands on the domestic market due to lack in production capacity, which is more likely for SMEs than for large firms, will have few incentives to increase its market boundaries, although they do not reject exporting in general.
Adequate expertise and skills as well as access to finance (or other firm characteristics) are severe preconditions to overcome entry barriers (e.g. Ebling and Janz 1999). Although a company fulfils the productivity criterion, it might be hampered to start exporting.
Productivity differences between firms of different sectors can be partially explained by heterogeneous sectoral technological regimes and specific product characteristics, whereas these products are no substitutes and therefore do not compete with each other. The comparison of productivity levels of companies producing non-substitutable products is therefore misleading.
Exchange rate effects and hysteresis: A shift in exchange rate might help companies to start exporting that otherwise would not have started to. Once entered foreign markets, they are able to stay (and therefore survive) although their products and productivity would otherwise not be competitive anymore (Anderton 1999). A company that is not able to enter the export market at that point of time where the exchange rate change occurs (e.g. it is founded later on) is suspended from this hysteresis effect, although it might be at least slightly more productive.
Concerning the role of innovation, high productivity is not only determined by technology. Amongst others, also prices affect both productivity levels and unit costs and therewith competitiveness.
Natural monopoly of input factors allows specific companies to export. If a company has access to specific inputs (e.g. raw material) not available for other companies (or only for a small number), the company can serve a global market unrivalled.
Multinational firms provide SMEs with their existing global networks and act as intermediaries. In this way they help them to sell their innovations in foreign markets. On the contrary, SMEs do not have to use the large firms directly. In some cases, large firms enter a new market also breaking new grounds for SMEs working as suppliers for the large company in the home market. Once the large company has overcome the costly entry barriers of an unknown market*, small companies
* Also compare the chapter on barriers to internationalisation.
19
can follow using the experience of the large firms. The precursor builds up a foreign infrastructure on the one hand and reduces investments to start exporting on the other hand (bandwagon effect).
The decision when to start exporting depends on the innovation process itself and is not restricted to the innovation outcome only. In the product life cycle, the development stage of new products often needs close interaction with customers to adequately adjust a new product to the clients' requirements. This interaction most often also needs geographical proximity and fast (face-to-face) communication to finalise an innovative product (Antràs 2005). After the innovation has been tested and the domestic market (as a field of experiment) has been exhausted, companies might decide to start exporting (Cassiman and Martınez-Ros 2007). This chronology corresponds to the stage model of internationalisation.
However, a company that starts exporting does not have to be market leader in its home country. Ito and Pucik (1993) found for Japan that many firms with high export visibility are not market leaders in the domestic market. While a potential explanation might be the large share of domestic sales in total sales whenever a firm is market leader in its home market, it may also be explained from product characteristics that better fit to customers' needs abroad. The businesses environment in Japan strongly differs from most of the industrialised countries in terms of language and also technical standards. Therefore, the advantage of having adjusted a new product for the Japanese market does not directly translate into an advantage in other countries. On the contrary, export volumes of products that are directly introduced into foreign markets without having been sold domestically are supposed to be larger, as Iacovone and Javorcik (2008) found for Mexican companies. This holds especially for experienced exporters, while export starters firstly test their products on the home market.
2.3 The impact of internationalisation on innovation
2.3.1 The effects of exporting on innovation Some authors argue that firms need to have a sufficient degree of internationalisation, i.e. be active in many markets, in order to be able to capture successfully the fruits of innovation.* From this one could draw the converse argument that exporting may also improve the innovation performance of companies (see e.g. Kafourous et al. 2008). The literature has indeed identified a number of potential channels through which exports may have an impact on the innovation activities of firms. These are:
The "learning effects" Adapting products and services to new markets New ideas and inputs for innovation New production processes / process innovation
The "financial and resource effect" Additional finance earned through exporting to be invested in innovation using a wider range of resources available globally
* 'Born globals' (Oviatt and McDougall 2004; McDougall, Shane, and Oviatt 1994; Knight and Cavusgil 1996) would fit into this picture.
20
The "incentive effects" Returns to innovation: Higher potential returns on future innovation outcomes due to
larger markets Competition: Firms are forced to be more efficient stimulating innovation activities
In the process of exporting globally engaged firms interact with foreign competitors and customers from whom they learn. Firms could gain information from additional sources ('global knowledge sourcing') about processes or product features. This helps to improve the quality of the product or increase the efficiency of production processes (BIS 2010; Filippetti, Frenz, and Ietto-Gillies 2009; Greenaway and Kneller 2007; Zahra, Ucbasaran, and Newey 2009). Moreover, a company might also learn from the second direction of internationalisation, namely imports. Damijan and Kostevc (2010) argue that a company has to learn to export and it can do so by importing first*. On the one hand, importing often equalises cheaper suppliers leading to productivity gains. On the other hand, importing also allows for technology imports. Both patterns open opportunities and resources for innovation projects. In their paper, Damijan and Kostevc (2010) state that both exports and imports can foster innovation activities of companies, which then allows for (further) exports.
One can distinguish between 'learning effects' needed to engage in a foreign market at all, and 'learning effects' that result from the interaction with foreign firms and customers. In the first case, customers in foreign markets might have different preferences and demand improvements, amendments or changes to products or services (Chaplin 2009). These adaptations often require additional innovation efforts. In the latter case, companies learn from their customers via feedback loops. Exporting firms have the opportunity to capture ideas from a great number of new and different markets as well as from a wider range of cultural perspectives. This might lead to an extended knowledge base of exporting firms when comparing with their counterparts, which sell in the national market only (Pittiglio, Sica, and Villa 2009).
However, learning strongly depends on a company's absorptive capacity, especially in fast changing industries. These companies have to react quickly to new developments and need the capacity in terms of resources and skills to take advantage of these opportunities (BIS 2010). However, sector specific technological regimes strongly determine potential learning effects. This implies that these learning opportunities are likely to vary across sectors. Within sectors instead, learning is more likely to occur either in young or in exporting firms (Delgado, Farinas, und Ruano 2002, Isgut and Fernandes 2007, Kraay 1999, Castellani 2002).
Nonetheless, whether a company benefits from exporting in terms of learning-by-exporting is strongly related to the relative stage of development of the country the firm is exporting to. The higher developed a target country, the more a company might learn, if it has adequate absorptive capacity (BIS 2010). Girma et al. (2008) argue that firms that lie below the international technology frontier have the highest potential to benefit from technology transfers, while on the other hand, domestic technologies are more important than foreign technologies in the US, since US firms are often world technology leaders (Baldwin and Gu 2004). Although some authors mainly concentrate
* A currently published report analysing the internationalisation behaviour of SMEs also found that SMEs most often start international activities by importing (European Commission 2010b).
21
their argument on less developed countries (Van Biesebroeck 2005; Blalock and Gertler 2004), it seems worthwhile to investigate the learning effects controlling for the stage of development also on the European level.
Learning effects might also occur in the opposite direction, since international engagement also increases the risk of knowledge leakage. Firm internal knowledge spills over to competitors diminishing a company's competitive position as it allows its competitors to imitate a product or learn from its innovation efforts (Sanna-Randaccio and Veugelers 2007). These knowledge leakages, but also favourable inward knowledge flows are more likely if a company's home country and the target country share a common language and or are technologically close to each other in terms of sharing similar technological standards in the specific sector.
Considering financial returns of exporting as a further positive effect of internationalisation, exports normally raise the revenues of a firm. These revenues can be invested in R&D, leading to higher innovation activities. Qualitative evidence supports this view that increased sales, gained from overseas activity, provide resources – not necessarily restricted on financial resources – for further product development (Chaplin 2009). In particular 'Born Globals' may be more reliant on returns from exporting to fund their innovation investments. Additionally, the fact that exporting firms serve a larger market than non-exporting firms has also an impact on the incentives to innovate. Foreseeable returns of exports can increase the innovation activities of firms. Companies active in export markets have already shouldered the sunk costs needed to engage in international markets. This increases the willingness to take the risk of innovation projects (BIS 2010).
The incentives to innovate are also strongly linked to the competitive environment in which a company is embedded. Competition forces firms to improve their performance and innovation is one way to do so. Furthermore it is often assumed that competition is tougher in international markets than in domestic markets (Bernard and Jensen 1999) and selling abroad therefore results in additional pressure to innovate (cf. Filippetti et al. 2009)*.
2.3.2 Evidence on the impact of internationalisation on innovation When analysing the effects of internationalisation on a company's economic performance, two patterns have to be disentangled. Exports might affect (i) productivity and turnover, and/or (ii) innovation activities.
In the literature, the term 'learning-by-exporting' is often used to describe both aspects in an undifferentiated fashion. For instance, a company may be able to learn from new customers abroad resulting in an input for the company's R&D department. This input causes improvements in products or production processes and hence increases productivity. On the other hand, a company may reap economies of scale for an innovative product by serving a larger market abroad, which leads directly to higher productivity.
* High competition in export markets decreases incentives to participate in these markets on the one hand. On the other hand, once a company decided to export, it has incentives to innovate to remain competitive.
22
These effects are often difficult to isolate in empirical studies, however recent work documents conclusive evidence that exporting firms are more likely to be innovative or at least to invest more in innovation. Aw et al. (2007) find evidence for learning-by-exporting in the Taiwanese electronics industry. They conclude that firms benefit from technology that is transferred from foreign customers. In another study for Taiwan Aw et al. (2008) show that the probability of investing in R&D increases if firms have prior export experience. Baldwin and Gu (2004) conclude that Canadian exporters are more innovative than non-exporters, both before and after they entered the export market. They find four facts to support the conjecture of a positive effect of exporting on innovation: (i) exporting is linked to an increasing use of technology at plants; (ii) exporting increases the availability of information about advanced technologies and foreign sourcing for these technologies; (iii) exporting was connected to an increase in the incidence of R&D collaboration agreements with foreign buyers; and (iv) exporting is associated with higher degrees of novelty of new innovations.
Girma et al. (2008) establish positive effects of exports on R&D intensity for Irish firms. The same study does not find evidence for learning effects for British firms, however. Damijan et al. (2008) find a strong positive relationship between past innovation and exporting for Slovenian firms. They also show that exporting firms have a higher probability to start process innovations. However, they do not find the same evidence for product innovations. In another paper, Damijan and Kostevc (2008) find similar results but argue that they cannot identify the direction of causality between innovation and exporting. Salomon and Shaver (2005) conclude for Spanish firms that exporters increase their patent applications subsequent to exporting and also increase their product innovations. The results of Harris and Li (2005) indicate similar patterns for the UK. Companies that export are also more likely to engage in (continuous) R&D and to be innovative. Hessels (2007) shows that exports have a positive impact on a firm's intentions to invest in new products or services the following year. However, the effect diminishes when looking at SMEs only.
The analysis of the effects of exporting on innovation is difficult to explore using quantitative data. Almost all studies surveyed in this section cannot explain through which transmission channels exports impacts on innovation. We will shed some light on this aspect in our empirical analysis.
2.4 Innovation, internationalisation and economic performance
2.4.1 Innovation, competitiveness and firm growth Innovation can lead to employment, turnover or sales growth. An early study by Hall (1987) established that R&D investments have a larger effect on employment growth than other types of physical investment in US manufacturing industries. Yasuda (2005) shows a positive effect for Japanese manufacturing companies, firms in wholesale and retail trade. Yang and Huang (2005) confirm these results for industrial firms in Taiwan. Del Monte and Papagni (2003) establish that innovation has a positive effect on sales growth in Italian industrial firms.
Some studies find contradicting results, when economic performance is measured in terms of employment growth. An early study by Brouwer and Kleinknecht (1993) finds for a sample of Dutch manufacturing firms that the growth of R&D intensity correlates negatively with employment
23
growth. Klette and Furre (1998) instead find no clear-cut relationship for Norway. This can be explained by at least two factors. First, as innovation has a positive impact on productivity the physical input of labour decreases per unit of output. If the labour-saving effect through process innovation outweighs the employment effect of market expansion, employment is likely to stay constant or even decrease (see Hölzl and Reinstaller 2007, 2010). Second, the positive effect of innovation on employment may be neutralised if firms are not able to appropriate the returns to their innovation activities either because of imitation or because competitors launch rival product innovations at the same time. In both case market shares may not change (cf. Kafouros et al. 2008). However, innovation is then still important as a company otherwise would lose market shares.
Recent research shows that R&D and innovation are important mostly for firms in countries close to the technological frontier. In other words, those firms that are at the leading edge have to innovate to increase their productivity and remain competitive. In non-frontier economies, companies settle their comparative advantage on lower wage levels and imitation (Acemoglu et al. 2006). While innovation is therefore a distinctive determinant for high-growth firms in frontier countries, no statistically significant effect can be found for non-frontier countries (Hölzl and Friesenbichler 2010).
2.4.2 The productivity gap between exporters and non-exporters We have already discussed in the previous section that there is strong evidence that the most productive firms select themselves into the export market. This implies that a productivity gap will emerge between exporters and non-exporters because only the best companies are able to overcome the entry barriers of foreign markets (Wagner 2007a; López 2005).
In the analysis of the effects of exporting on productivity at the firm level two dimensions have to be considered. First, exporting can improve a firm's productivity performance (e.g. indirectly via learning effects and innovation as described above), second, exporting can results in growth of employment and/or turnover (Bernard and Jensen 1999, European Commission 2010b). This last factor is referred to as the 'volume' effect. Exports lead to an expansion of business activities as the company serves a larger market. As the turnover increases the firm needs more employees to serve its market. The main argument for productivity growth through the volume effect are higher economies of scale leading to lower unit costs (Greenaway and Kneller 2007) or decreasing costs due to the 'full use of existing capacity' (BIS 2010). Some contributions argue that the productivity effects of exporting are solely due to volume effects (Isgut and Fernandes 2007, Bernard and Jensen 1999). The reason is that these studies observe a strong fall in productivity for firms that leave export markets. If other effects, like the learning-by-exporting effect were dominant, productivity should not diminish so markedly, as it would be reasonable to assume that the export experience is valuable to a company also in non-export related activities, and that this experience is not lost at once when the firm stops exporting.
Another aspect that is closely related to the beneficial effects of product innovation is the price effect. Productivity of exporters can increase because the firm may be able to charge higher prices in foreign markets. This may be the case if the purchasing power in the target country is higher
24
than in the domestic market such that consumers in these countries are able and willing to pay a higher price, or if the exported product provides some exclusive value in use that is valued highly by customers. However, one should keep in mind that the general rule is that serving foreign market is usually more expensive than serving the domestic market. This may affect productivity even negatively when the extra-costs of exporting exceed the price gap between foreign and domestic markets. However, if a higher price in the export market outweighs the additional costs of exporting, productivity might be higher solely due to this price effect. De Loecker's (2007) conclusion that productivity gains from exporting are higher for firms exporting to high income countries, might be interpreted as an indication of the price effect.
Box 4: Why are exporting companies more productive than non-exporters? Evidence from the literature.
the "volume effects"
higher economies of scale leading to lower unit costs
output and employment growth (not necessarily increasing productivity)
the "price effect"
different prices in (export) markets (direction unclear)
the "competition effects"
"self-selection" companies are already more productive when starting to export
competitive pressure forces the unproductive firms to exit the market (~ ex-post self-selection)
competitive pressure leads to efficiency gains (e.g. by cutting costs) within a firm
the "learning effects"
indirect: new ideas gathered through exporting as inputs to innovative activities
get in touch with new corporate culture in the export market increasing organisational efficiency (equals organisational process innovation)
the "resource effects"
new contacts to cheaper suppliers
using a wider range of resources available globally / in the served markets
the "specialisation effect"
when exporting companies reduce their product diversity, they might increase efficiency in their core products
There is also a broad consensus in the literature that competition is expected to be higher in export markets than in the domestic market (e.g. Pittiglio, Sica, and Villa 2009, Isgut und Fernandes 2007, Bernard and Jensen 1999). Based on this assumption, it has to be concluded either that the price effect is always negative, because higher competition leads to lower prices, or firms have to improve their performance to stay in the export market. Fierce competition is therefore both a selection criterion for foreign markets, and an incentive to take the risk of innovative projects that would not have been undertaken in less competitive environments (Greenaway and Kneller 2007, Filippetti, Frenz, and Ietto-Gillies 2009). Furthermore, firms might cut their costs to withstand the competitive pressure improving their productivity performance. Baldwin and Gu (2004), for instance, argue that companies reduce their product diversity when starting to export and focus on a few core products in order to increasing efficiency in their production. Mayer, Melitz, and Ottaviano (2010) add that tougher competition in export markets induces a firm to skew its export sales towards its best performing products resulting in productivity improvements.
This competition effect "is nominally at odds with the behaviour of a profit-maximizing firm which would be expected to improve performance with or without the incentive of exporting" (Bernard and
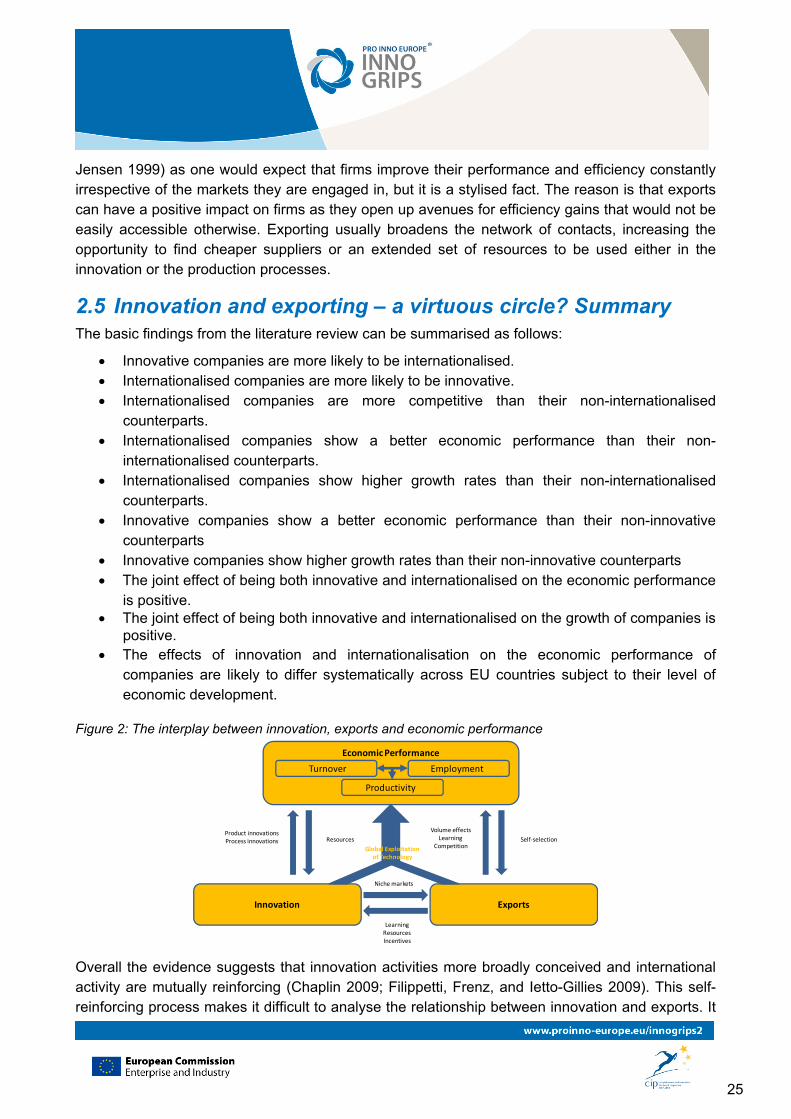
25
Jensen 1999) as one would expect that firms improve their performance and efficiency constantly irrespective of the markets they are engaged in, but it is a stylised fact. The reason is that exports can have a positive impact on firms as they open up avenues for efficiency gains that would not be easily accessible otherwise. Exporting usually broadens the network of contacts, increasing the opportunity to find cheaper suppliers or an extended set of resources to be used either in the innovation or the production processes.
2.5 Innovation and exporting – a virtuous circle? Summary The basic findings from the literature review can be summarised as follows:
Innovative companies are more likely to be internationalised. Internationalised companies are more likely to be innovative. Internationalised companies are more competitive than their non-internationalised
counterparts. Internationalised companies show a better economic performance than their non-
internationalised counterparts. Internationalised companies show higher growth rates than their non-internationalised
counterparts. Innovative companies show a better economic performance than their non-innovative
counterparts Innovative companies show higher growth rates than their non-innovative counterparts The joint effect of being both innovative and internationalised on the economic performance
is positive. The joint effect of being both innovative and internationalised on the growth of companies is
positive. The effects of innovation and internationalisation on the economic performance of
companies are likely to differ systematically across EU countries subject to their level of economic development.
Figure 2: The interplay between innovation, exports and economic performance
Economic Performance
Turnover Employment
Productivity
Innovation Exports
LearningResourcesIncentives
Niche markets
Product innovationsProcess innovations Resources Self-selection
Volume effectsLearning
CompetitionGlobal Exploitationof Technology
Overall the evidence suggests that innovation activities more broadly conceived and international activity are mutually reinforcing (Chaplin 2009; Filippetti, Frenz, and Ietto-Gillies 2009). This self-reinforcing process makes it difficult to analyse the relationship between innovation and exports. It
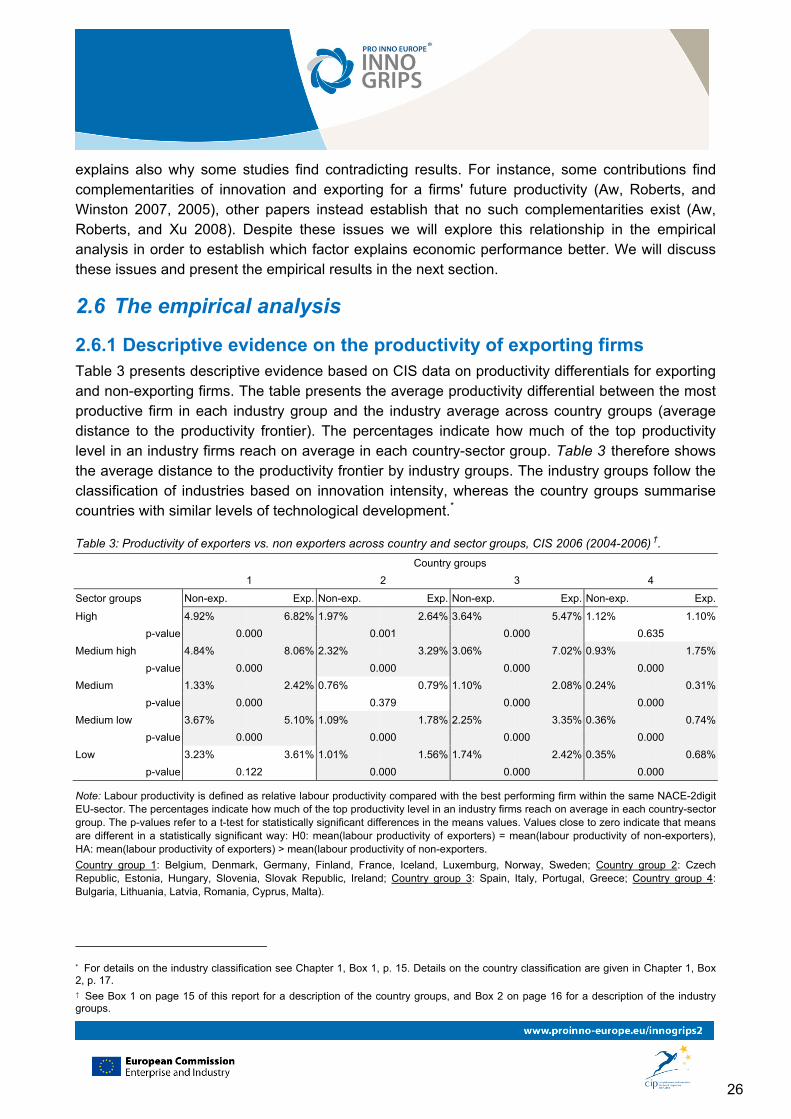
26
explains also why some studies find contradicting results. For instance, some contributions find complementarities of innovation and exporting for a firms' future productivity (Aw, Roberts, and Winston 2007, 2005), other papers instead establish that no such complementarities exist (Aw, Roberts, and Xu 2008). Despite these issues we will explore this relationship in the empirical analysis in order to establish which factor explains economic performance better. We will discuss these issues and present the empirical results in the next section.
2.6 The empirical analysis
2.6.1 Descriptive evidence on the productivity of exporting firms Table 3 presents descriptive evidence based on CIS data on productivity differentials for exporting and non-exporting firms. The table presents the average productivity differential between the most productive firm in each industry group and the industry average across country groups (average distance to the productivity frontier). The percentages indicate how much of the top productivity level in an industry firms reach on average in each country-sector group. Table 3 therefore shows the average distance to the productivity frontier by industry groups. The industry groups follow the classification of industries based on innovation intensity, whereas the country groups summarise countries with similar levels of technological development.*
Table 3: Productivity of exporters vs. non exporters across country and sector groups, CIS 2006 (2004-2006) †.
Country groups
1 2 3 4
Sector groups Non-exp. Exp. Non-exp. Exp. Non-exp. Exp. Non-exp. Exp.
High 4.92% 6.82% 1.97% 2.64% 3.64% 5.47% 1.12% 1.10%
p-value 0.000 0.001 0.000 0.635
Medium high 4.84% 8.06% 2.32% 3.29% 3.06% 7.02% 0.93% 1.75%
p-value 0.000 0.000 0.000 0.000
Medium 1.33% 2.42% 0.76% 0.79% 1.10% 2.08% 0.24% 0.31%
p-value 0.000 0.379 0.000 0.000
Medium low 3.67% 5.10% 1.09% 1.78% 2.25% 3.35% 0.36% 0.74%
p-value 0.000 0.000 0.000 0.000
Low 3.23% 3.61% 1.01% 1.56% 1.74% 2.42% 0.35% 0.68%
p-value 0.122 0.000 0.000 0.000
Note: Labour productivity is defined as relative labour productivity compared with the best performing firm within the same NACE-2digit EU-sector. The percentages indicate how much of the top productivity level in an industry firms reach on average in each country-sector group. The p-values refer to a t-test for statistically significant differences in the means values. Values close to zero indicate that means are different in a statistically significant way: H0: mean(labour productivity of exporters) = mean(labour productivity of non-exporters), HA: mean(labour productivity of exporters) > mean(labour productivity of non-exporters.
Country group 1: Belgium, Denmark, Germany, Finland, France, Iceland, Luxemburg, Norway, Sweden; Country group 2: Czech Republic, Estonia, Hungary, Slovenia, Slovak Republic, Ireland; Country group 3: Spain, Italy, Portugal, Greece; Country group 4: Bulgaria, Lithuania, Latvia, Romania, Cyprus, Malta).
* For details on the industry classification see Chapter 1, Box 1, p. 15. Details on the country classification are given in Chapter 1, Box 2, p. 17. † See Box 1 on page 15 of this report for a description of the country groups, and Box 2 on page 16 for a description of the industry groups.
27
Table 3 shows that across industry and country groups exporting firms are more productive.* It is also apparent that across all industries firms in country group 1 (i.e. countries with high direct technological intensity) and country group 3 (i.e. Southern European countries with low direct and indirect technology intensity) are more productive on average as compared to the firms located in country groups 2 and 4 that collect the New Member States. This indicates that there are considerable differences in the sources of competitive advantage across country groups. Another aspect worth mentioning is that in the technologically most advanced member states (country group 1) firms are on average most productive in the industries with medium-high, medium and medium low innovation intensity. These are the industries where these countries have traditionally a strong competitive position.
2.6.2 Specification issues and methodology We will investigate the direction of the causal relationship between internationalisation and innovation, and the effect of both dimensions on economic performance (measured by employment growth turnover growth, and productivity). Box 5 gives an overview on central aspects of the empirical analysis that will be performed here. Using CIS3 data, we estimate 2-step Heckman models explaining (i) innovation intensity (defined as input variable, with innovation propensity in the first stage), and (ii) export intensity (with export propensity in the first stage). Besides controlling for firm size and other firm characteristics (such as dummies for enterprise group, newly founded firms, etc.), sector characteristics, the distance to the technological frontier (by estimating the equations for the four country groups separately), and innovation and internationalisation barriers respectively, we integrate innovation variables in the export equations and vice versa. In order to check for causality, we use export intensity in 1998 to explain innovation input in 2000, while we use innovation output indicators (turnover share of innovative products, a dummy for process innovation, and a dummy whether a company performs R&D continuously) to explain exports. It is possible to estimate export propensities and export intensities only for CIS 3 data (1998-2000), as the later waves of the CIS do not contain information on the export volume. For the CIS 4 (2002-2004) and the CIS 2006 we will therefore only estimate the export propensities.
In order to analyse the effects of both innovation and internationalisation on economic performance, we again use CIS data from different waves to explain the performance variables turnover growth, employment growth and productivity respectively by a set of control variables, export intensity in two years earlier (only for the CIS3), the turnover share of innovative products and a process innovation dummy (using OLS). We also include a variable (export intensity x share of innovative products) to analyse the joint effects of both dimensions on the performance.
* The only exception are highly innovation intense firms in country group 4, medium innovation intense firms in country group 2 and firms in low innovation intensive sectors in country group 1.
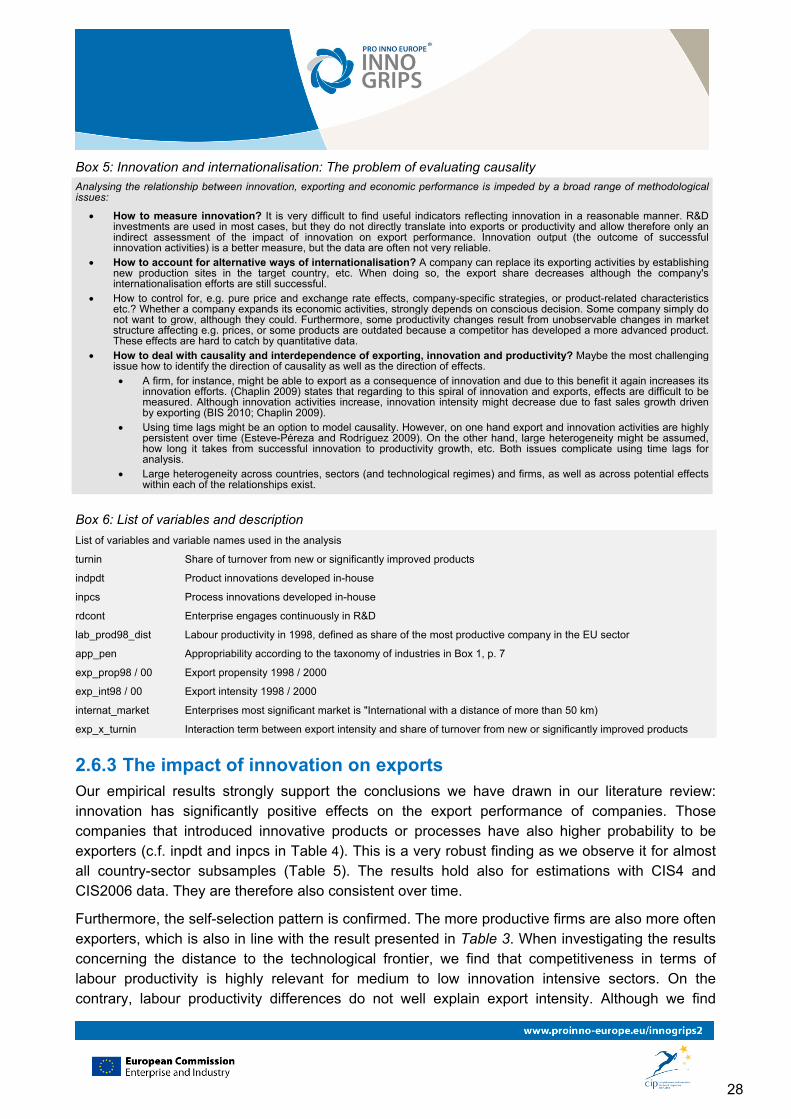
28
Box 5: Innovation and internationalisation: The problem of evaluating causality
Analysing the relationship between innovation, exporting and economic performance is impeded by a broad range of methodological issues:
How to measure innovation? It is very difficult to find useful indicators reflecting innovation in a reasonable manner. R&D investments are used in most cases, but they do not directly translate into exports or productivity and allow therefore only an indirect assessment of the impact of innovation on export performance. Innovation output (the outcome of successful innovation activities) is a better measure, but the data are often not very reliable.
How to account for alternative ways of internationalisation? A company can replace its exporting activities by establishing new production sites in the target country, etc. When doing so, the export share decreases although the company's internationalisation efforts are still successful.
How to control for, e.g. pure price and exchange rate effects, company-specific strategies, or product-related characteristics etc.? Whether a company expands its economic activities, strongly depends on conscious decision. Some company simply do not want to grow, although they could. Furthermore, some productivity changes result from unobservable changes in market structure affecting e.g. prices, or some products are outdated because a competitor has developed a more advanced product. These effects are hard to catch by quantitative data.
How to deal with causality and interdependence of exporting, innovation and productivity? Maybe the most challenging issue how to identify the direction of causality as well as the direction of effects. A firm, for instance, might be able to export as a consequence of innovation and due to this benefit it again increases its
innovation efforts. (Chaplin 2009) states that regarding to this spiral of innovation and exports, effects are difficult to be measured. Although innovation activities increase, innovation intensity might decrease due to fast sales growth driven by exporting (BIS 2010; Chaplin 2009).
Using time lags might be an option to model causality. However, on one hand export and innovation activities are highly persistent over time (Esteve-Péreza and Rodríguez 2009). On the other hand, large heterogeneity might be assumed, how long it takes from successful innovation to productivity growth, etc. Both issues complicate using time lags for analysis.
Large heterogeneity across countries, sectors (and technological regimes) and firms, as well as across potential effects within each of the relationships exist.
Box 6: List of variables and description
List of variables and variable names used in the analysis
turnin Share of turnover from new or significantly improved products
indpdt Product innovations developed in-house
inpcs Process innovations developed in-house
rdcont Enterprise engages continuously in R&D
lab_prod98_dist Labour productivity in 1998, defined as share of the most productive company in the EU sector
app_pen Appropriability according to the taxonomy of industries in Box 1, p. 7
exp_prop98 / 00 Export propensity 1998 / 2000
exp_int98 / 00 Export intensity 1998 / 2000
internat_market Enterprises most significant market is "International with a distance of more than 50 km)
exp_x_turnin Interaction term between export intensity and share of turnover from new or significantly improved products
2.6.3 The impact of innovation on exports Our empirical results strongly support the conclusions we have drawn in our literature review: innovation has significantly positive effects on the export performance of companies. Those companies that introduced innovative products or processes have also higher probability to be exporters (c.f. inpdt and inpcs in Table 4). This is a very robust finding as we observe it for almost all country-sector subsamples (Table 5). The results hold also for estimations with CIS4 and CIS2006 data. They are therefore also consistent over time.
Furthermore, the self-selection pattern is confirmed. The more productive firms are also more often exporters, which is also in line with the result presented in Table 3. When investigating the results concerning the distance to the technological frontier, we find that competitiveness in terms of labour productivity is highly relevant for medium to low innovation intensive sectors. On the contrary, labour productivity differences do not well explain export intensity. Although we find
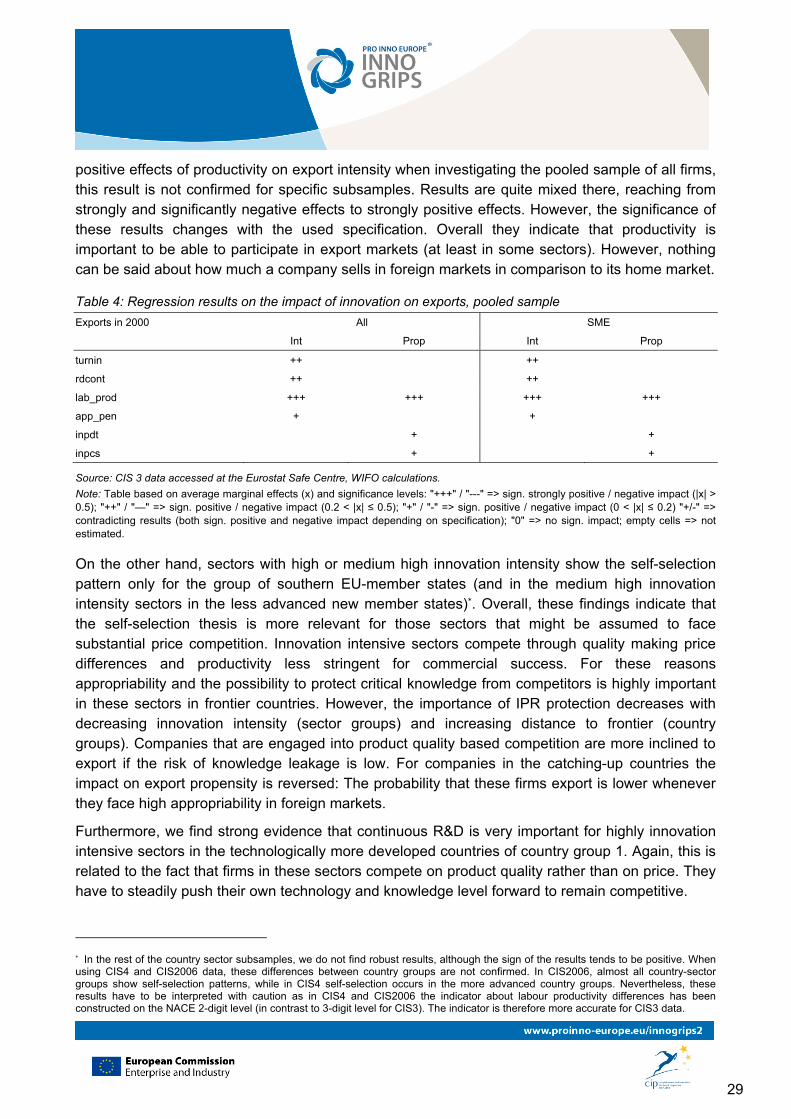
29
positive effects of productivity on export intensity when investigating the pooled sample of all firms, this result is not confirmed for specific subsamples. Results are quite mixed there, reaching from strongly and significantly negative effects to strongly positive effects. However, the significance of these results changes with the used specification. Overall they indicate that productivity is important to be able to participate in export markets (at least in some sectors). However, nothing can be said about how much a company sells in foreign markets in comparison to its home market.
Table 4: Regression results on the impact of innovation on exports, pooled sample
Exports in 2000 All SME
Int Prop Int Prop
turnin ++ ++
rdcont ++ ++
lab_prod +++ +++ +++ +++
app_pen + +
inpdt + +
inpcs + +
Source: CIS 3 data accessed at the Eurostat Safe Centre, WIFO calculations.
Note: Table based on average marginal effects (x) and significance levels: "+++" / "---" => sign. strongly positive / negative impact (|x| > 0.5); "++" / "—" => sign. positive / negative impact (0.2 < |x| ≤ 0.5); "+" / "-" => sign. positive / negative impact (0 < |x| ≤ 0.2) "+/-" => contradicting results (both sign. positive and negative impact depending on specification); "0" => no sign. impact; empty cells => not estimated.
On the other hand, sectors with high or medium high innovation intensity show the self-selection pattern only for the group of southern EU-member states (and in the medium high innovation intensity sectors in the less advanced new member states)*. Overall, these findings indicate that the self-selection thesis is more relevant for those sectors that might be assumed to face substantial price competition. Innovation intensive sectors compete through quality making price differences and productivity less stringent for commercial success. For these reasons appropriability and the possibility to protect critical knowledge from competitors is highly important in these sectors in frontier countries. However, the importance of IPR protection decreases with decreasing innovation intensity (sector groups) and increasing distance to frontier (country groups). Companies that are engaged into product quality based competition are more inclined to export if the risk of knowledge leakage is low. For companies in the catching-up countries the impact on export propensity is reversed: The probability that these firms export is lower whenever they face high appropriability in foreign markets.
Furthermore, we find strong evidence that continuous R&D is very important for highly innovation intensive sectors in the technologically more developed countries of country group 1. Again, this is related to the fact that firms in these sectors compete on product quality rather than on price. They have to steadily push their own technology and knowledge level forward to remain competitive.
* In the rest of the country sector subsamples, we do not find robust results, although the sign of the results tends to be positive. When using CIS4 and CIS2006 data, these differences between country groups are not confirmed. In CIS2006, almost all country-sector groups show self-selection patterns, while in CIS4 self-selection occurs in the more advanced country groups. Nevertheless, these results have to be interpreted with caution as in CIS4 and CIS2006 the indicator about labour productivity differences has been constructed on the NACE 2-digit level (in contrast to 3-digit level for CIS3). The indicator is therefore more accurate for CIS3 data.
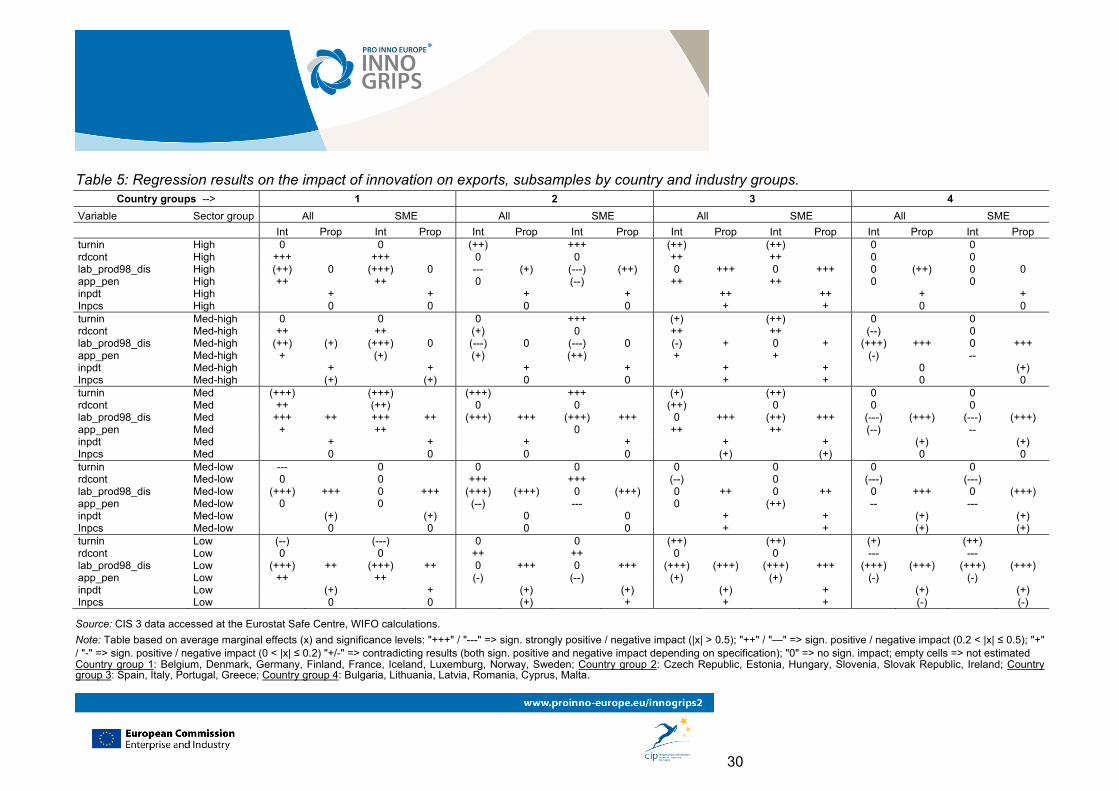
30
Table 5: Regression results on the impact of innovation on exports, subsamples by country and industry groups. Country groups --> 1 2 3 4
Variable Sector group All SME All SME All SME All SME
Int Prop Int Prop Int Prop Int Prop Int Prop Int Prop Int Prop Int Prop turnin High 0 0 (++) +++ (++) (++) 0 0 rdcont High +++ +++ 0 0 ++ ++ 0 0 lab_prod98_dis High (++) 0 (+++) 0 --- (+) (---) (++) 0 +++ 0 +++ 0 (++) 0 0 app_pen High ++ ++ 0 (--) ++ ++ 0 0 inpdt High + + + + ++ ++ + + Inpcs High 0 0 0 0 + + 0 0 turnin Med-high 0 0 0 +++ (+) (++) 0 0 rdcont Med-high ++ ++ (+) 0 ++ ++ (--) 0 lab_prod98_dis Med-high (++) (+) (+++) 0 (---) 0 (---) 0 (-) + 0 + (+++) +++ 0 +++ app_pen Med-high + (+) (+) (++) + + (-) -- inpdt Med-high + + + + + + 0 (+) Inpcs Med-high (+) (+) 0 0 + + 0 0 turnin Med (+++) (+++) (+++) +++ (+) (++) 0 0 rdcont Med ++ (++) 0 0 (++) 0 0 0 lab_prod98_dis Med +++ ++ +++ ++ (+++) +++ (+++) +++ 0 +++ (++) +++ (---) (+++) (---) (+++) app_pen Med + ++ 0 ++ ++ (--) -- inpdt Med + + + + + + (+) (+) Inpcs Med 0 0 0 0 (+) (+) 0 0 turnin Med-low --- 0 0 0 0 0 0 0 rdcont Med-low 0 0 +++ +++ (--) 0 (---) (---) lab_prod98_dis Med-low (+++) +++ 0 +++ (+++) (+++) 0 (+++) 0 ++ 0 ++ 0 +++ 0 (+++) app_pen Med-low 0 0 (--) --- 0 (++) -- --- inpdt Med-low (+) (+) 0 0 + + (+) (+) Inpcs Med-low 0 0 0 0 + + (+) (+) turnin Low (--) (---) 0 0 (++) (++) (+) (++) rdcont Low 0 0 ++ ++ 0 0 --- --- lab_prod98_dis Low (+++) ++ (+++) ++ 0 +++ 0 +++ (+++) (+++) (+++) +++ (+++) (+++) (+++) (+++) app_pen Low ++ ++ (-) (--) (+) (+) (-) (-) inpdt Low (+) + (+) (+) (+) + (+) (+) Inpcs Low 0 0 (+) + + + (-) (-)
Source: CIS 3 data accessed at the Eurostat Safe Centre, WIFO calculations.
Note: Table based on average marginal effects (x) and significance levels: "+++" / "---" => sign. strongly positive / negative impact (|x| > 0.5); "++" / "—" => sign. positive / negative impact (0.2 < |x| ≤ 0.5); "+" / "-" => sign. positive / negative impact (0 < |x| ≤ 0.2) "+/-" => contradicting results (both sign. positive and negative impact depending on specification); "0" => no sign. impact; empty cells => not estimated Country group 1: Belgium, Denmark, Germany, Finland, France, Iceland, Luxemburg, Norway, Sweden; Country group 2: Czech Republic, Estonia, Hungary, Slovenia, Slovak Republic, Ireland; Country group 3: Spain, Italy, Portugal, Greece; Country group 4: Bulgaria, Lithuania, Latvia, Romania, Cyprus, Malta.
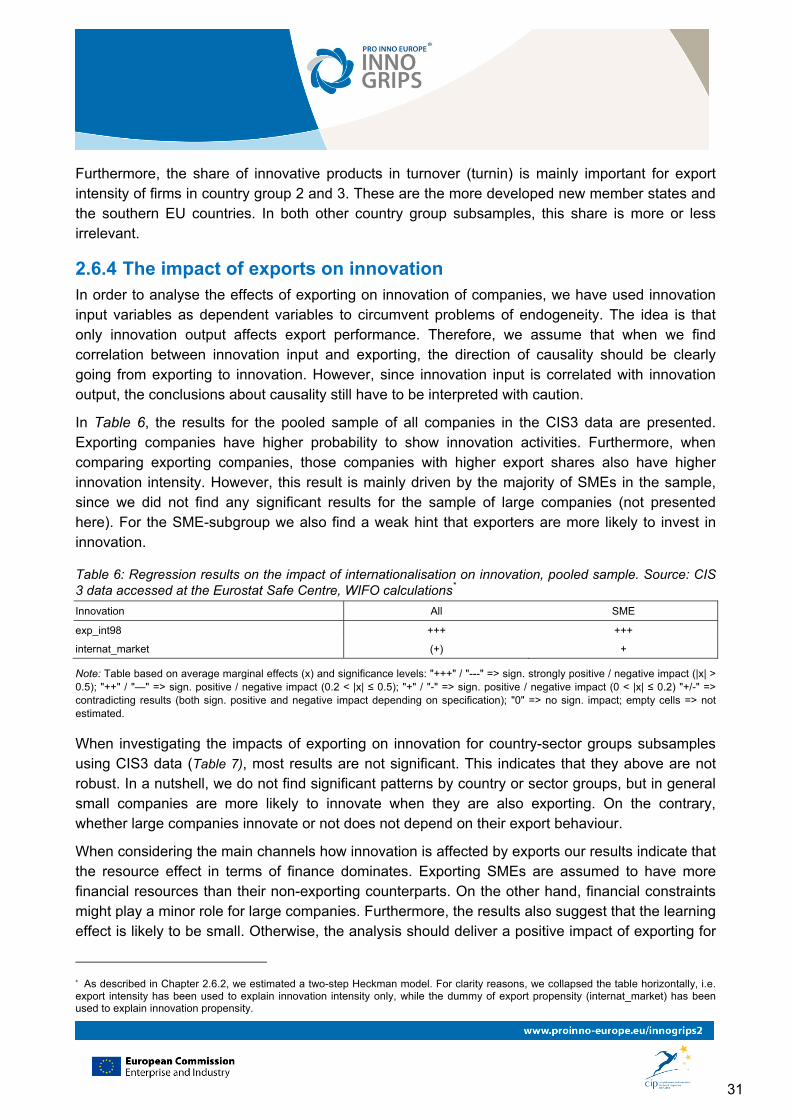
31
Furthermore, the share of innovative products in turnover (turnin) is mainly important for export intensity of firms in country group 2 and 3. These are the more developed new member states and the southern EU countries. In both other country group subsamples, this share is more or less irrelevant.
2.6.4 The impact of exports on innovation In order to analyse the effects of exporting on innovation of companies, we have used innovation input variables as dependent variables to circumvent problems of endogeneity. The idea is that only innovation output affects export performance. Therefore, we assume that when we find correlation between innovation input and exporting, the direction of causality should be clearly going from exporting to innovation. However, since innovation input is correlated with innovation output, the conclusions about causality still have to be interpreted with caution.
In Table 6, the results for the pooled sample of all companies in the CIS3 data are presented. Exporting companies have higher probability to show innovation activities. Furthermore, when comparing exporting companies, those companies with higher export shares also have higher innovation intensity. However, this result is mainly driven by the majority of SMEs in the sample, since we did not find any significant results for the sample of large companies (not presented here). For the SME-subgroup we also find a weak hint that exporters are more likely to invest in innovation.
Table 6: Regression results on the impact of internationalisation on innovation, pooled sample. Source: CIS 3 data accessed at the Eurostat Safe Centre, WIFO calculations*
Innovation All SME
exp_int98 +++ +++
internat_market (+) +
Note: Table based on average marginal effects (x) and significance levels: "+++" / "---" => sign. strongly positive / negative impact (|x| > 0.5); "++" / "—" => sign. positive / negative impact (0.2 < |x| ≤ 0.5); "+" / "-" => sign. positive / negative impact (0 < |x| ≤ 0.2) "+/-" => contradicting results (both sign. positive and negative impact depending on specification); "0" => no sign. impact; empty cells => not estimated.
When investigating the impacts of exporting on innovation for country-sector groups subsamples using CIS3 data (Table 7), most results are not significant. This indicates that they above are not robust. In a nutshell, we do not find significant patterns by country or sector groups, but in general small companies are more likely to innovate when they are also exporting. On the contrary, whether large companies innovate or not does not depend on their export behaviour.
When considering the main channels how innovation is affected by exports our results indicate that the resource effect in terms of finance dominates. Exporting SMEs are assumed to have more financial resources than their non-exporting counterparts. On the other hand, financial constraints might play a minor role for large companies. Furthermore, the results also suggest that the learning effect is likely to be small. Otherwise, the analysis should deliver a positive impact of exporting for
* As described in Chapter 2.6.2, we estimated a two-step Heckman model. For clarity reasons, we collapsed the table horizontally, i.e. export intensity has been used to explain innovation intensity only, while the dummy of export propensity (internat_market) has been used to explain innovation propensity.
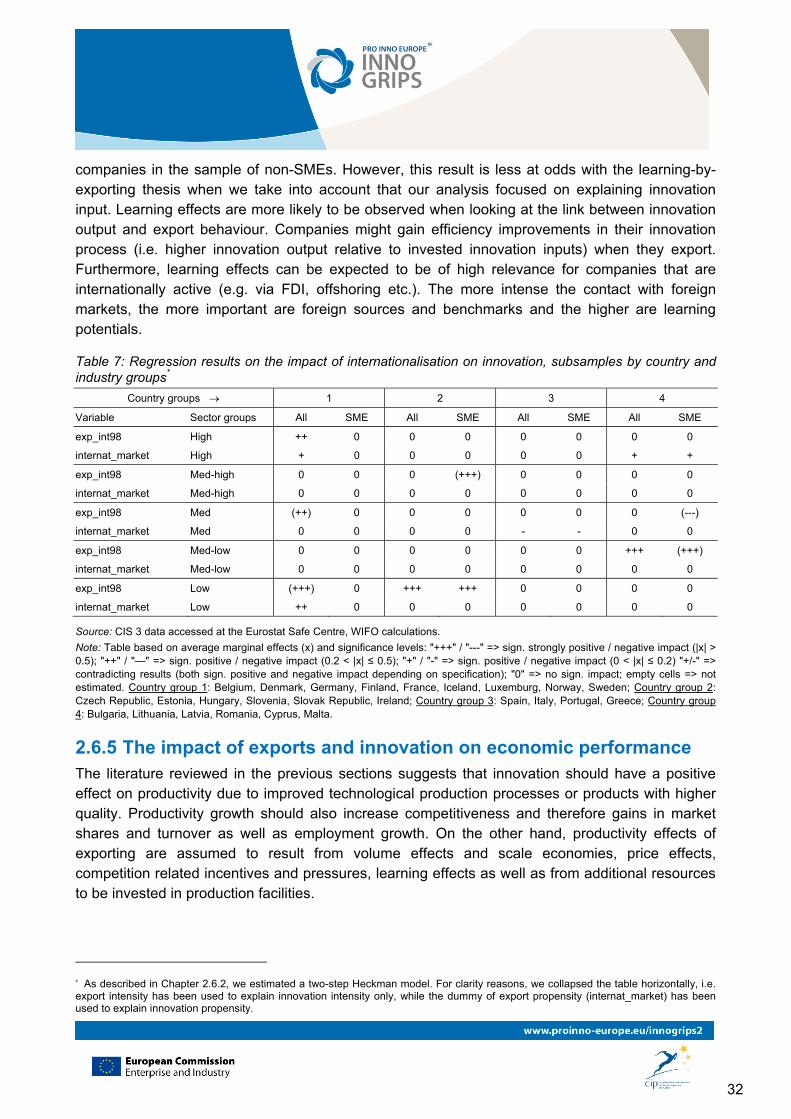
32
companies in the sample of non-SMEs. However, this result is less at odds with the learning-by-exporting thesis when we take into account that our analysis focused on explaining innovation input. Learning effects are more likely to be observed when looking at the link between innovation output and export behaviour. Companies might gain efficiency improvements in their innovation process (i.e. higher innovation output relative to invested innovation inputs) when they export. Furthermore, learning effects can be expected to be of high relevance for companies that are internationally active (e.g. via FDI, offshoring etc.). The more intense the contact with foreign markets, the more important are foreign sources and benchmarks and the higher are learning potentials.
Table 7: Regression results on the impact of internationalisation on innovation, subsamples by country and industry groups*
Country groups 1 2 3 4
Variable Sector groups All SME All SME All SME All SME
exp_int98 High ++ 0 0 0 0 0 0 0
internat_market High + 0 0 0 0 0 + +
exp_int98 Med-high 0 0 0 (+++) 0 0 0 0
internat_market Med-high 0 0 0 0 0 0 0 0
exp_int98 Med (++) 0 0 0 0 0 0 (---)
internat_market Med 0 0 0 0 - - 0 0
exp_int98 Med-low 0 0 0 0 0 0 +++ (+++)
internat_market Med-low 0 0 0 0 0 0 0 0
exp_int98 Low (+++) 0 +++ +++ 0 0 0 0
internat_market Low ++ 0 0 0 0 0 0 0
Source: CIS 3 data accessed at the Eurostat Safe Centre, WIFO calculations.
Note: Table based on average marginal effects (x) and significance levels: "+++" / "---" => sign. strongly positive / negative impact (|x| > 0.5); "++" / "—" => sign. positive / negative impact (0.2 < |x| ≤ 0.5); "+" / "-" => sign. positive / negative impact (0 < |x| ≤ 0.2) "+/-" => contradicting results (both sign. positive and negative impact depending on specification); "0" => no sign. impact; empty cells => not estimated. Country group 1: Belgium, Denmark, Germany, Finland, France, Iceland, Luxemburg, Norway, Sweden; Country group 2: Czech Republic, Estonia, Hungary, Slovenia, Slovak Republic, Ireland; Country group 3: Spain, Italy, Portugal, Greece; Country group 4: Bulgaria, Lithuania, Latvia, Romania, Cyprus, Malta.
2.6.5 The impact of exports and innovation on economic performance The literature reviewed in the previous sections suggests that innovation should have a positive effect on productivity due to improved technological production processes or products with higher quality. Productivity growth should also increase competitiveness and therefore gains in market shares and turnover as well as employment growth. On the other hand, productivity effects of exporting are assumed to result from volume effects and scale economies, price effects, competition related incentives and pressures, learning effects as well as from additional resources to be invested in production facilities.
* As described in Chapter 2.6.2, we estimated a two-step Heckman model. For clarity reasons, we collapsed the table horizontally, i.e. export intensity has been used to explain innovation intensity only, while the dummy of export propensity (internat_market) has been used to explain innovation propensity.
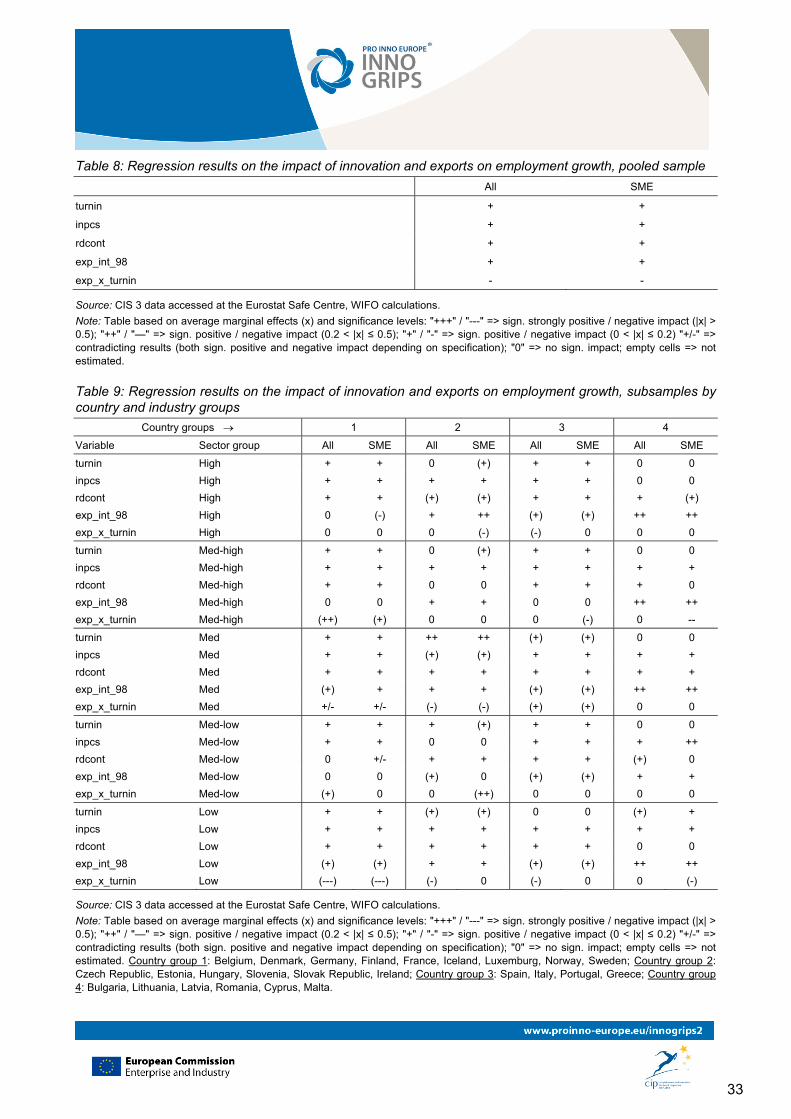
33
Table 8: Regression results on the impact of innovation and exports on employment growth, pooled sample
All SME
turnin + +
inpcs + +
rdcont + +
exp_int_98 + +
exp_x_turnin - -
Source: CIS 3 data accessed at the Eurostat Safe Centre, WIFO calculations.
Note: Table based on average marginal effects (x) and significance levels: "+++" / "---" => sign. strongly positive / negative impact (|x| > 0.5); "++" / "—" => sign. positive / negative impact (0.2 < |x| ≤ 0.5); "+" / "-" => sign. positive / negative impact (0 < |x| ≤ 0.2) "+/-" => contradicting results (both sign. positive and negative impact depending on specification); "0" => no sign. impact; empty cells => not estimated.
Table 9: Regression results on the impact of innovation and exports on employment growth, subsamples by country and industry groups
Country groups 1 2 3 4
Variable Sector group All SME All SME All SME All SME
turnin High + + 0 (+) + + 0 0
inpcs High + + + + + + 0 0
rdcont High + + (+) (+) + + + (+)
exp_int_98 High 0 (-) + ++ (+) (+) ++ ++
exp_x_turnin High 0 0 0 (-) (-) 0 0 0
turnin Med-high + + 0 (+) + + 0 0
inpcs Med-high + + + + + + + +
rdcont Med-high + + 0 0 + + + 0
exp_int_98 Med-high 0 0 + + 0 0 ++ ++
exp_x_turnin Med-high (++) (+) 0 0 0 (-) 0 --
turnin Med + + ++ ++ (+) (+) 0 0
inpcs Med + + (+) (+) + + + +
rdcont Med + + + + + + + +
exp_int_98 Med (+) + + + (+) (+) ++ ++
exp_x_turnin Med +/- +/- (-) (-) (+) (+) 0 0
turnin Med-low + + + (+) + + 0 0
inpcs Med-low + + 0 0 + + + ++
rdcont Med-low 0 +/- + + + + (+) 0
exp_int_98 Med-low 0 0 (+) 0 (+) (+) + +
exp_x_turnin Med-low (+) 0 0 (++) 0 0 0 0
turnin Low + + (+) (+) 0 0 (+) +
inpcs Low + + + + + + + +
rdcont Low + + + + + + 0 0
exp_int_98 Low (+) (+) + + (+) (+) ++ ++
exp_x_turnin Low (---) (---) (-) 0 (-) 0 0 (-)
Source: CIS 3 data accessed at the Eurostat Safe Centre, WIFO calculations.
Note: Table based on average marginal effects (x) and significance levels: "+++" / "---" => sign. strongly positive / negative impact (|x| > 0.5); "++" / "—" => sign. positive / negative impact (0.2 < |x| ≤ 0.5); "+" / "-" => sign. positive / negative impact (0 < |x| ≤ 0.2) "+/-" => contradicting results (both sign. positive and negative impact depending on specification); "0" => no sign. impact; empty cells => not estimated. Country group 1: Belgium, Denmark, Germany, Finland, France, Iceland, Luxemburg, Norway, Sweden; Country group 2: Czech Republic, Estonia, Hungary, Slovenia, Slovak Republic, Ireland; Country group 3: Spain, Italy, Portugal, Greece; Country group 4: Bulgaria, Lithuania, Latvia, Romania, Cyprus, Malta.
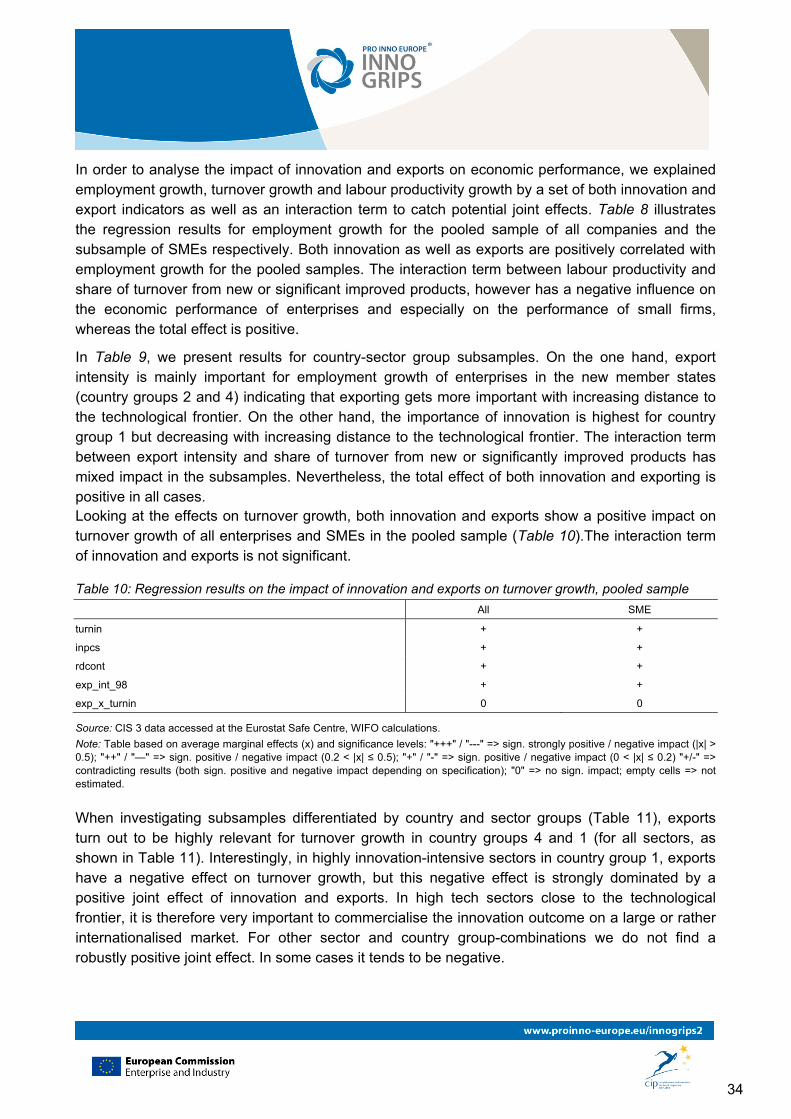
34
In order to analyse the impact of innovation and exports on economic performance, we explained employment growth, turnover growth and labour productivity growth by a set of both innovation and export indicators as well as an interaction term to catch potential joint effects. Table 8 illustrates the regression results for employment growth for the pooled sample of all companies and the subsample of SMEs respectively. Both innovation as well as exports are positively correlated with employment growth for the pooled samples. The interaction term between labour productivity and share of turnover from new or significant improved products, however has a negative influence on the economic performance of enterprises and especially on the performance of small firms, whereas the total effect is positive.
In Table 9, we present results for country-sector group subsamples. On the one hand, export intensity is mainly important for employment growth of enterprises in the new member states (country groups 2 and 4) indicating that exporting gets more important with increasing distance to the technological frontier. On the other hand, the importance of innovation is highest for country group 1 but decreasing with increasing distance to the technological frontier. The interaction term between export intensity and share of turnover from new or significantly improved products has mixed impact in the subsamples. Nevertheless, the total effect of both innovation and exporting is positive in all cases. Looking at the effects on turnover growth, both innovation and exports show a positive impact on turnover growth of all enterprises and SMEs in the pooled sample (Table 10).The interaction term of innovation and exports is not significant.
Table 10: Regression results on the impact of innovation and exports on turnover growth, pooled sample
All SME
turnin + +
inpcs + +
rdcont + +
exp_int_98 + +
exp_x_turnin 0 0
Source: CIS 3 data accessed at the Eurostat Safe Centre, WIFO calculations.
Note: Table based on average marginal effects (x) and significance levels: "+++" / "---" => sign. strongly positive / negative impact (|x| > 0.5); "++" / "—" => sign. positive / negative impact (0.2 < |x| ≤ 0.5); "+" / "-" => sign. positive / negative impact (0 < |x| ≤ 0.2) "+/-" => contradicting results (both sign. positive and negative impact depending on specification); "0" => no sign. impact; empty cells => not estimated.
When investigating subsamples differentiated by country and sector groups (Table 11), exports turn out to be highly relevant for turnover growth in country groups 4 and 1 (for all sectors, as shown in Table 11). Interestingly, in highly innovation-intensive sectors in country group 1, exports have a negative effect on turnover growth, but this negative effect is strongly dominated by a positive joint effect of innovation and exports. In high tech sectors close to the technological frontier, it is therefore very important to commercialise the innovation outcome on a large or rather internationalised market. For other sector and country group-combinations we do not find a robustly positive joint effect. In some cases it tends to be negative.
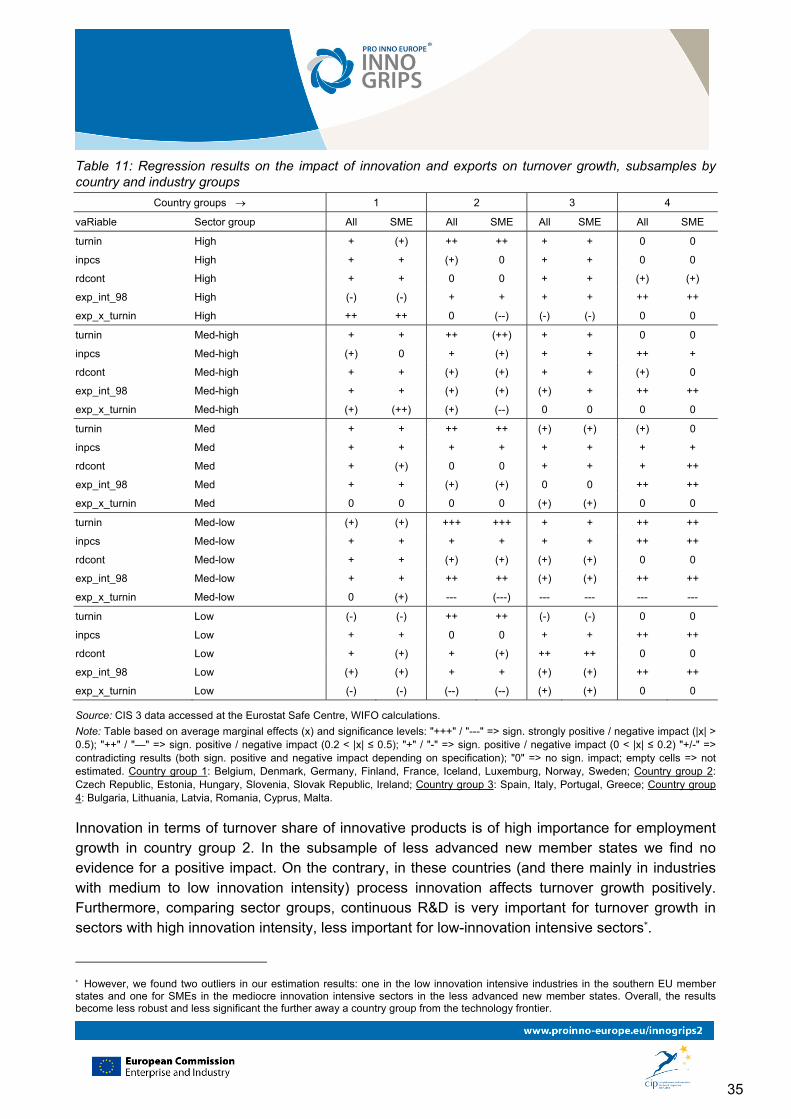
35
Table 11: Regression results on the impact of innovation and exports on turnover growth, subsamples by country and industry groups
Country groups 1 2 3 4
vaRiable Sector group All SME All SME All SME All SME
turnin High + (+) ++ ++ + + 0 0
inpcs High + + (+) 0 + + 0 0
rdcont High + + 0 0 + + (+) (+)
exp_int_98 High (-) (-) + + + + ++ ++
exp_x_turnin High ++ ++ 0 (--) (-) (-) 0 0
turnin Med-high + + ++ (++) + + 0 0
inpcs Med-high (+) 0 + (+) + + ++ +
rdcont Med-high + + (+) (+) + + (+) 0
exp_int_98 Med-high + + (+) (+) (+) + ++ ++
exp_x_turnin Med-high (+) (++) (+) (--) 0 0 0 0
turnin Med + + ++ ++ (+) (+) (+) 0
inpcs Med + + + + + + + +
rdcont Med + (+) 0 0 + + + ++
exp_int_98 Med + + (+) (+) 0 0 ++ ++
exp_x_turnin Med 0 0 0 0 (+) (+) 0 0
turnin Med-low (+) (+) +++ +++ + + ++ ++
inpcs Med-low + + + + + + ++ ++
rdcont Med-low + + (+) (+) (+) (+) 0 0
exp_int_98 Med-low + + ++ ++ (+) (+) ++ ++
exp_x_turnin Med-low 0 (+) --- (---) --- --- --- ---
turnin Low (-) (-) ++ ++ (-) (-) 0 0
inpcs Low + + 0 0 + + ++ ++
rdcont Low + (+) + (+) ++ ++ 0 0
exp_int_98 Low (+) (+) + + (+) (+) ++ ++
exp_x_turnin Low (-) (-) (--) (--) (+) (+) 0 0
Source: CIS 3 data accessed at the Eurostat Safe Centre, WIFO calculations.
Note: Table based on average marginal effects (x) and significance levels: "+++" / "---" => sign. strongly positive / negative impact (|x| > 0.5); "++" / "—" => sign. positive / negative impact (0.2 < |x| ≤ 0.5); "+" / "-" => sign. positive / negative impact (0 < |x| ≤ 0.2) "+/-" => contradicting results (both sign. positive and negative impact depending on specification); "0" => no sign. impact; empty cells => not estimated. Country group 1: Belgium, Denmark, Germany, Finland, France, Iceland, Luxemburg, Norway, Sweden; Country group 2: Czech Republic, Estonia, Hungary, Slovenia, Slovak Republic, Ireland; Country group 3: Spain, Italy, Portugal, Greece; Country group 4: Bulgaria, Lithuania, Latvia, Romania, Cyprus, Malta.
Innovation in terms of turnover share of innovative products is of high importance for employment growth in country group 2. In the subsample of less advanced new member states we find no evidence for a positive impact. On the contrary, in these countries (and there mainly in industries with medium to low innovation intensity) process innovation affects turnover growth positively. Furthermore, comparing sector groups, continuous R&D is very important for turnover growth in sectors with high innovation intensity, less important for low-innovation intensive sectors*.
* However, we found two outliers in our estimation results: one in the low innovation intensive industries in the southern EU member states and one for SMEs in the mediocre innovation intensive sectors in the less advanced new member states. Overall, the results become less robust and less significant the further away a country group from the technology frontier.
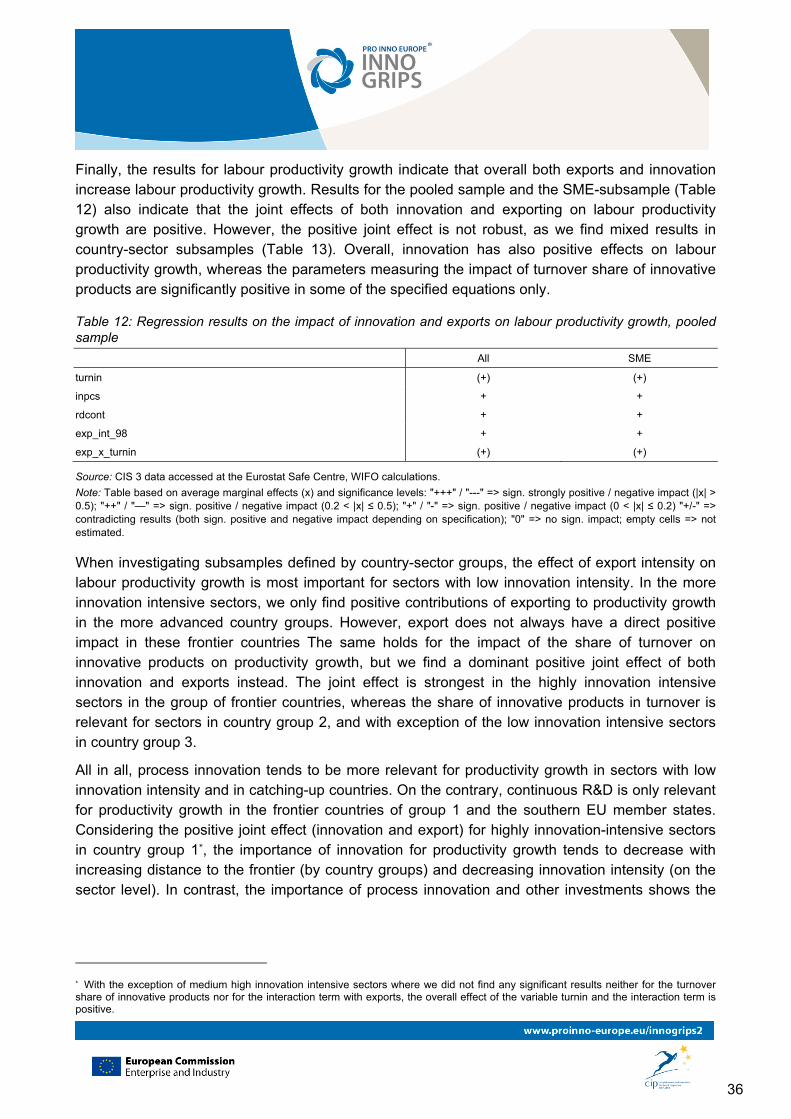
36
Finally, the results for labour productivity growth indicate that overall both exports and innovation increase labour productivity growth. Results for the pooled sample and the SME-subsample (Table 12) also indicate that the joint effects of both innovation and exporting on labour productivity growth are positive. However, the positive joint effect is not robust, as we find mixed results in country-sector subsamples (Table 13). Overall, innovation has also positive effects on labour productivity growth, whereas the parameters measuring the impact of turnover share of innovative products are significantly positive in some of the specified equations only.
Table 12: Regression results on the impact of innovation and exports on labour productivity growth, pooled sample
All SME
turnin (+) (+)
inpcs + +
rdcont + +
exp_int_98 + +
exp_x_turnin (+) (+)
Source: CIS 3 data accessed at the Eurostat Safe Centre, WIFO calculations.
Note: Table based on average marginal effects (x) and significance levels: "+++" / "---" => sign. strongly positive / negative impact (|x| > 0.5); "++" / "—" => sign. positive / negative impact (0.2 < |x| ≤ 0.5); "+" / "-" => sign. positive / negative impact (0 < |x| ≤ 0.2) "+/-" => contradicting results (both sign. positive and negative impact depending on specification); "0" => no sign. impact; empty cells => not estimated.
When investigating subsamples defined by country-sector groups, the effect of export intensity on labour productivity growth is most important for sectors with low innovation intensity. In the more innovation intensive sectors, we only find positive contributions of exporting to productivity growth in the more advanced country groups. However, export does not always have a direct positive impact in these frontier countries The same holds for the impact of the share of turnover on innovative products on productivity growth, but we find a dominant positive joint effect of both innovation and exports instead. The joint effect is strongest in the highly innovation intensive sectors in the group of frontier countries, whereas the share of innovative products in turnover is relevant for sectors in country group 2, and with exception of the low innovation intensive sectors in country group 3.
All in all, process innovation tends to be more relevant for productivity growth in sectors with low innovation intensity and in catching-up countries. On the contrary, continuous R&D is only relevant for productivity growth in the frontier countries of group 1 and the southern EU member states. Considering the positive joint effect (innovation and export) for highly innovation-intensive sectors in country group 1*, the importance of innovation for productivity growth tends to decrease with increasing distance to the frontier (by country groups) and decreasing innovation intensity (on the sector level). In contrast, the importance of process innovation and other investments shows the
* With the exception of medium high innovation intensive sectors where we did not find any significant results neither for the turnover share of innovative products nor for the interaction term with exports, the overall effect of the variable turnin and the interaction term is positive.
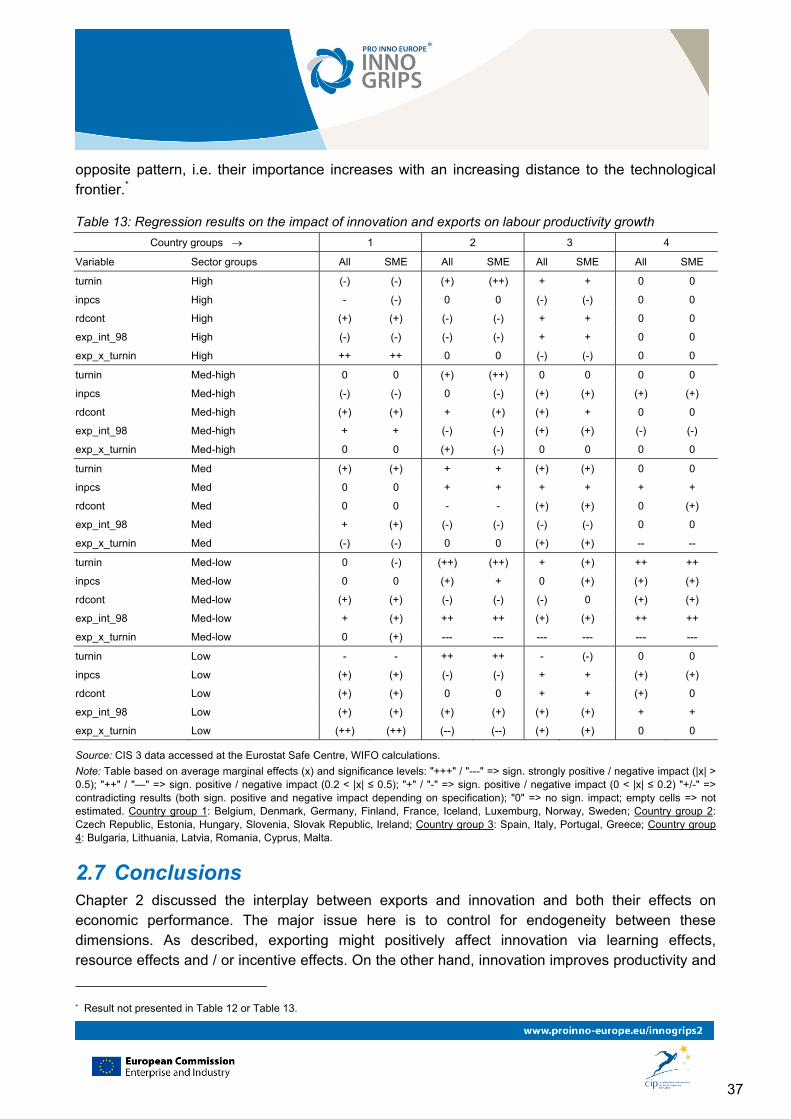
37
opposite pattern, i.e. their importance increases with an increasing distance to the technological frontier.*
Table 13: Regression results on the impact of innovation and exports on labour productivity growth
Country groups 1 2 3 4
Variable Sector groups All SME All SME All SME All SME
turnin High (-) (-) (+) (++) + + 0 0
inpcs High - (-) 0 0 (-) (-) 0 0
rdcont High (+) (+) (-) (-) + + 0 0
exp_int_98 High (-) (-) (-) (-) + + 0 0
exp_x_turnin High ++ ++ 0 0 (-) (-) 0 0
turnin Med-high 0 0 (+) (++) 0 0 0 0
inpcs Med-high (-) (-) 0 (-) (+) (+) (+) (+)
rdcont Med-high (+) (+) + (+) (+) + 0 0
exp_int_98 Med-high + + (-) (-) (+) (+) (-) (-)
exp_x_turnin Med-high 0 0 (+) (-) 0 0 0 0
turnin Med (+) (+) + + (+) (+) 0 0
inpcs Med 0 0 + + + + + +
rdcont Med 0 0 - - (+) (+) 0 (+)
exp_int_98 Med + (+) (-) (-) (-) (-) 0 0
exp_x_turnin Med (-) (-) 0 0 (+) (+) -- --
turnin Med-low 0 (-) (++) (++) + (+) ++ ++
inpcs Med-low 0 0 (+) + 0 (+) (+) (+)
rdcont Med-low (+) (+) (-) (-) (-) 0 (+) (+)
exp_int_98 Med-low + (+) ++ ++ (+) (+) ++ ++
exp_x_turnin Med-low 0 (+) --- --- --- --- --- ---
turnin Low - - ++ ++ - (-) 0 0
inpcs Low (+) (+) (-) (-) + + (+) (+)
rdcont Low (+) (+) 0 0 + + (+) 0
exp_int_98 Low (+) (+) (+) (+) (+) (+) + +
exp_x_turnin Low (++) (++) (--) (--) (+) (+) 0 0
Source: CIS 3 data accessed at the Eurostat Safe Centre, WIFO calculations.
Note: Table based on average marginal effects (x) and significance levels: "+++" / "---" => sign. strongly positive / negative impact (|x| > 0.5); "++" / "—" => sign. positive / negative impact (0.2 < |x| ≤ 0.5); "+" / "-" => sign. positive / negative impact (0 < |x| ≤ 0.2) "+/-" => contradicting results (both sign. positive and negative impact depending on specification); "0" => no sign. impact; empty cells => not estimated. Country group 1: Belgium, Denmark, Germany, Finland, France, Iceland, Luxemburg, Norway, Sweden; Country group 2: Czech Republic, Estonia, Hungary, Slovenia, Slovak Republic, Ireland; Country group 3: Spain, Italy, Portugal, Greece; Country group 4: Bulgaria, Lithuania, Latvia, Romania, Cyprus, Malta.
2.7 Conclusions Chapter 2 discussed the interplay between exports and innovation and both their effects on economic performance. The major issue here is to control for endogeneity between these dimensions. As described, exporting might positively affect innovation via learning effects, resource effects and / or incentive effects. On the other hand, innovation improves productivity and
* Result not presented in Table 12 or Table 13.

38
therefore increases a company's competitiveness such that it selects itself into the export market. Alternatively, product innovations might also create (temporary) monopolies in niche markets.
We tested these issues emerging from the literature using CIS data. In order to overcome problems referring to endogeneity, we empirically investigated the effects of exporting in the first year of the observed time frame on innovation input, while we explained in a second model exports in the final observed year by innovation output indicators. We found strong evidence that innovation improves the export performance of companies, whereas this pattern varies with the stage of economic development. While firms in highly innovative sectors in the more advanced member states need high degrees of appropriability, i.e. the possibility to protect their innovations, and have to continuously improve their knowledge base to participate in export markets, it is productivity and price-based competitiveness for low innovation-intensive sectors. This reflects the alternative patterns of niche markets on one hand, and self-selection on the other, that allow firms to export.
While the nature of the data does not allow us to draw satisfactory conclusions on the causal link between exports and innovation, we could find positive effects of exporting on innovation activities only for small companies, while large companies are not more likely to innovate when they are exporting. We therefore concluded that the positive impact of exports results from additional financial resources available for exporting SMEs, while learning effects are comparably small. However, we only investigated exports but did not consider different kinds of internationalisation due to data constraints. The picture might change in this case.
Finally, in this chapter we argue that both innovation and exports have positive effects on a firm's economic performance. We find strong evidence that innovation is an important driver for productivity growth, whereas the positive effect increases when a company (and the country the firm is located in) approaches the technology frontier. Furthermore, our results indicate that in the medium to low innovation intensive sectors productivity growth is mainly driven by process innovations, while in high-technology sectors in the more advanced member states productivity growth is strongly driven by product innovations. This is in line with the idea that in high-tech niche markets it is product quality which leads to higher prices. Competition in these markets is not based on prices but on product quality. In the low-technology sectors, competition is mainly based on prices and therefore process innovation plays a decisive role.
In addition, we also find evidence that the effects of innovation and exporting on employment and turnover growth follow patterns that are dependent of the technological stage of development. The impact of exports on employment growth increases with an increasing distance of the company's home country from the technological frontier. Companies in these countries have a comparative advantage in wage levels. Interestingly, exporting has positive effects on labour productivity mainly in highly innovation-intensive sectors in the more advanced countries on the one hand, and in less innovation-intensive sectors in countries that are further away from the technological frontier. Probably, this result reflects comparative advantages and volume effects (economies of scale) of exporting. The prior companies increase their export share by increased competitiveness based on high-quality products, the latter based on wage levels.
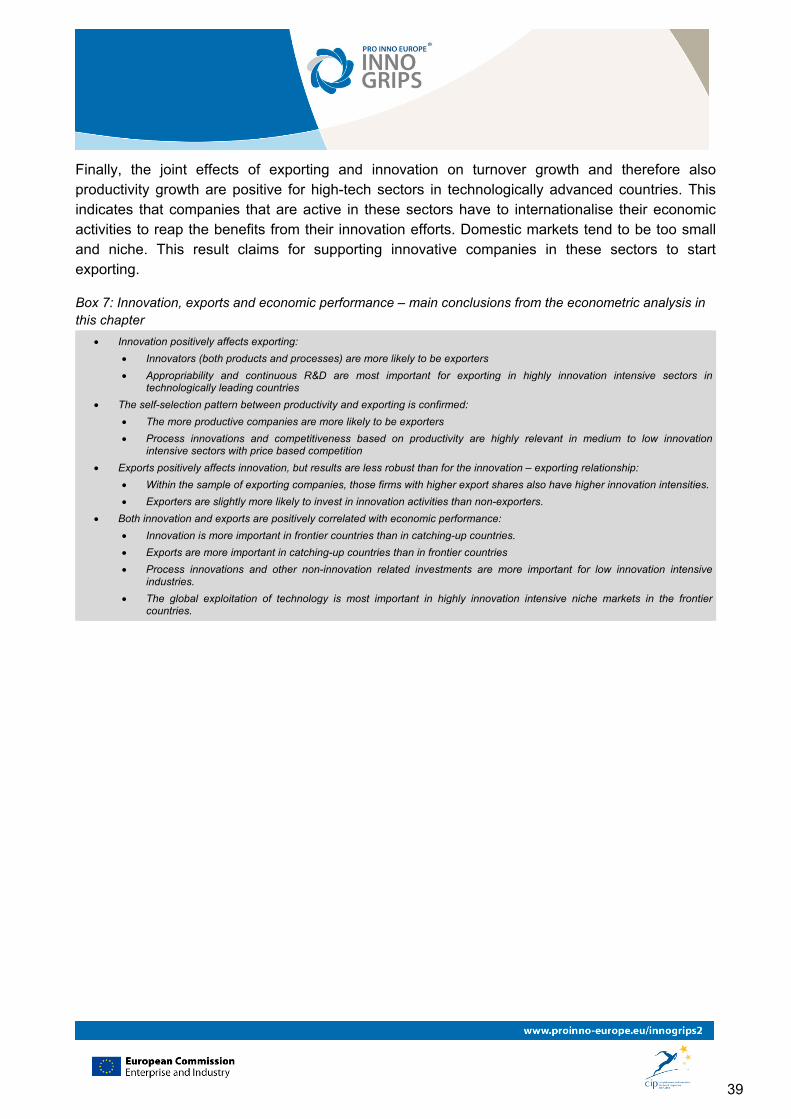
39
Finally, the joint effects of exporting and innovation on turnover growth and therefore also productivity growth are positive for high-tech sectors in technologically advanced countries. This indicates that companies that are active in these sectors have to internationalise their economic activities to reap the benefits from their innovation efforts. Domestic markets tend to be too small and niche. This result claims for supporting innovative companies in these sectors to start exporting.
Box 7: Innovation, exports and economic performance – main conclusions from the econometric analysis in this chapter
Innovation positively affects exporting:
Innovators (both products and processes) are more likely to be exporters
Appropriability and continuous R&D are most important for exporting in highly innovation intensive sectors in technologically leading countries
The self-selection pattern between productivity and exporting is confirmed:
The more productive companies are more likely to be exporters
Process innovations and competitiveness based on productivity are highly relevant in medium to low innovation intensive sectors with price based competition
Exports positively affects innovation, but results are less robust than for the innovation – exporting relationship:
Within the sample of exporting companies, those firms with higher export shares also have higher innovation intensities.
Exporters are slightly more likely to invest in innovation activities than non-exporters.
Both innovation and exports are positively correlated with economic performance:
Innovation is more important in frontier countries than in catching-up countries.
Exports are more important in catching-up countries than in frontier countries
Process innovations and other non-innovation related investments are more important for low innovation intensive industries.
The global exploitation of technology is most important in highly innovation intensive niche markets in the frontier countries.

40
3 The barriers to innovation
3.1 Introduction In this section of the study we concentrate on barriers to innovation and consider the interaction between internationalisation and innovation. Chapter 2 has shown that barriers to innovation are also barriers to internationalisation. We will make explicit the role of innovation barriers for internationalised and non-internationalised firms as well as for SMEs and non-SMEs. Innovation is a principal driver of growth at the firm level. As we have argued in the introductory chapter the nature of innovation has been shown to vary subject to the distance to the technological frontier of the country in which it is located. This implies that there is a close relationship between innovation at the firm level and the characteristics of the innovation system in which it is embedded. For this reason factors hampering innovation activities of firms are likely to differ across countries as well.
The main research question is whether there are important obstacles to innovation of European firms that are within the influence of innovation policies at the EU- and the national level and hence whether policies can foster innovation so as to foster internationalisation In this chapter we concentrate on:
Technological, knowledge, financial and skill-related barriers to innovation: In which countries, in which industries and in which type of firms are they felt most urgently?
Economic regulation as a barrier to innovation Standards and norms: Are they drivers or barriers to innovation activities at the firm level? The role of IPR regimes for the innovative activities of firms
We investigate these questions using both quantitative and qualitative evidence. The quantitative evidence is based on different waves of the European Community Innovation Survey and here especially the answers to the question regarding hampering factors. This permits to study barriers to innovation and to provide evidence on the importance of hampering factors for different groups of firms.
Chapters 3 and 4 of the present report provide a survey and a quantitative assessment on recent research that aims at understanding the causes of the interrelation between economic performance and global engagement of firms. This research has mainly focussed on the question whether high productivity firms select themselves into global activities or whether firms that engage in global activities become more productive due their presence on the more competitive international markets. One of the possible sources is innovativeness and R&D. Criscuolo et al. (2010) document that internationalised firms generate more innovation outputs and use more innovation inputs. In their econometric study they show that the advantage in innovation-output is generally driven by their greater use of different knowledge inputs and higher learning capacities. Table 14 reports the fraction of innovative and non-innovative firms for country groups using CIS 3 data.
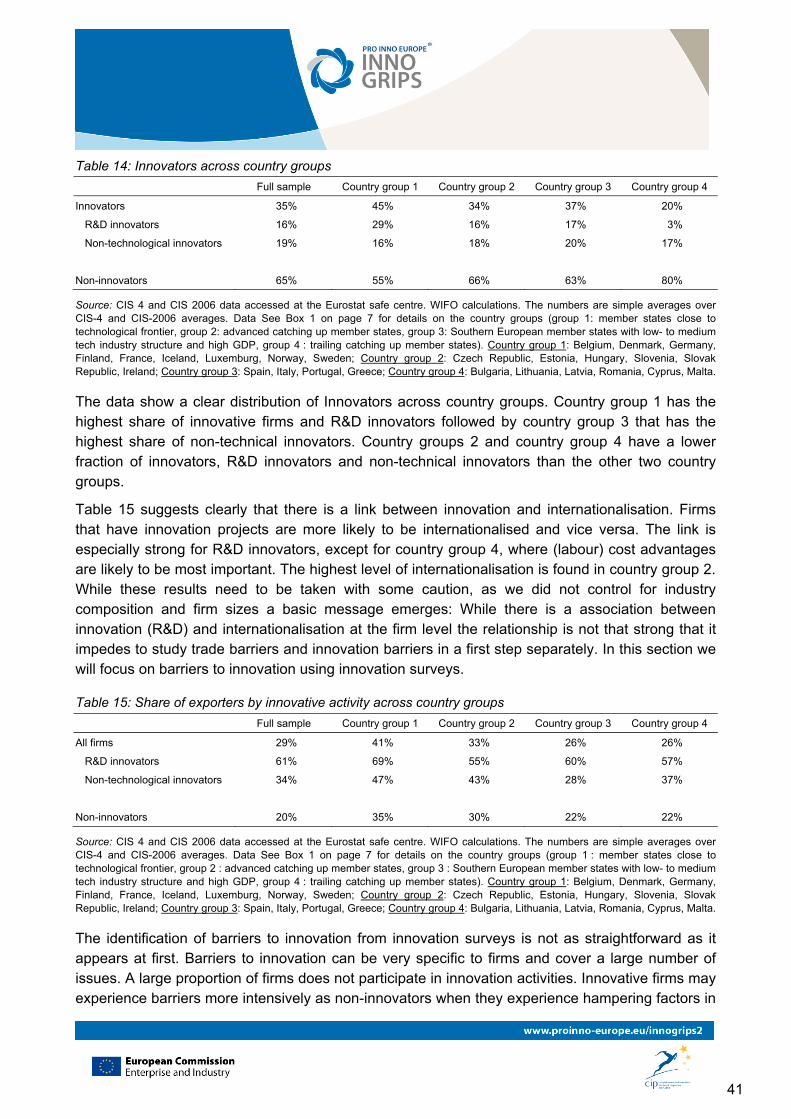
41
Table 14: Innovators across country groups
Full sample Country group 1 Country group 2 Country group 3 Country group 4
Innovators 35% 45% 34% 37% 20%
R&D innovators 16% 29% 16% 17% 3%
Non-technological innovators 19% 16% 18% 20% 17%
Non-innovators 65% 55% 66% 63% 80%
Source: CIS 4 and CIS 2006 data accessed at the Eurostat safe centre. WIFO calculations. The numbers are simple averages over CIS-4 and CIS-2006 averages. Data See Box 1 on page 7 for details on the country groups (group 1: member states close to technological frontier, group 2: advanced catching up member states, group 3: Southern European member states with low- to medium tech industry structure and high GDP, group 4 : trailing catching up member states). Country group 1: Belgium, Denmark, Germany, Finland, France, Iceland, Luxemburg, Norway, Sweden; Country group 2: Czech Republic, Estonia, Hungary, Slovenia, Slovak Republic, Ireland; Country group 3: Spain, Italy, Portugal, Greece; Country group 4: Bulgaria, Lithuania, Latvia, Romania, Cyprus, Malta.
The data show a clear distribution of Innovators across country groups. Country group 1 has the highest share of innovative firms and R&D innovators followed by country group 3 that has the highest share of non-technical innovators. Country groups 2 and country group 4 have a lower fraction of innovators, R&D innovators and non-technical innovators than the other two country groups.
Table 15 suggests clearly that there is a link between innovation and internationalisation. Firms that have innovation projects are more likely to be internationalised and vice versa. The link is especially strong for R&D innovators, except for country group 4, where (labour) cost advantages are likely to be most important. The highest level of internationalisation is found in country group 2. While these results need to be taken with some caution, as we did not control for industry composition and firm sizes a basic message emerges: While there is a association between innovation (R&D) and internationalisation at the firm level the relationship is not that strong that it impedes to study trade barriers and innovation barriers in a first step separately. In this section we will focus on barriers to innovation using innovation surveys.
Table 15: Share of exporters by innovative activity across country groups
Full sample Country group 1 Country group 2 Country group 3 Country group 4
All firms 29% 41% 33% 26% 26%
R&D innovators 61% 69% 55% 60% 57%
Non-technological innovators 34% 47% 43% 28% 37%
Non-innovators 20% 35% 30% 22% 22%
Source: CIS 4 and CIS 2006 data accessed at the Eurostat safe centre. WIFO calculations. The numbers are simple averages over CIS-4 and CIS-2006 averages. Data See Box 1 on page 7 for details on the country groups (group 1 : member states close to technological frontier, group 2 : advanced catching up member states, group 3 : Southern European member states with low- to medium tech industry structure and high GDP, group 4 : trailing catching up member states). Country group 1: Belgium, Denmark, Germany, Finland, France, Iceland, Luxemburg, Norway, Sweden; Country group 2: Czech Republic, Estonia, Hungary, Slovenia, Slovak Republic, Ireland; Country group 3: Spain, Italy, Portugal, Greece; Country group 4: Bulgaria, Lithuania, Latvia, Romania, Cyprus, Malta.
The identification of barriers to innovation from innovation surveys is not as straightforward as it appears at first. Barriers to innovation can be very specific to firms and cover a large number of issues. A large proportion of firms does not participate in innovation activities. Innovative firms may experience barriers more intensively as non-innovators when they experience hampering factors in
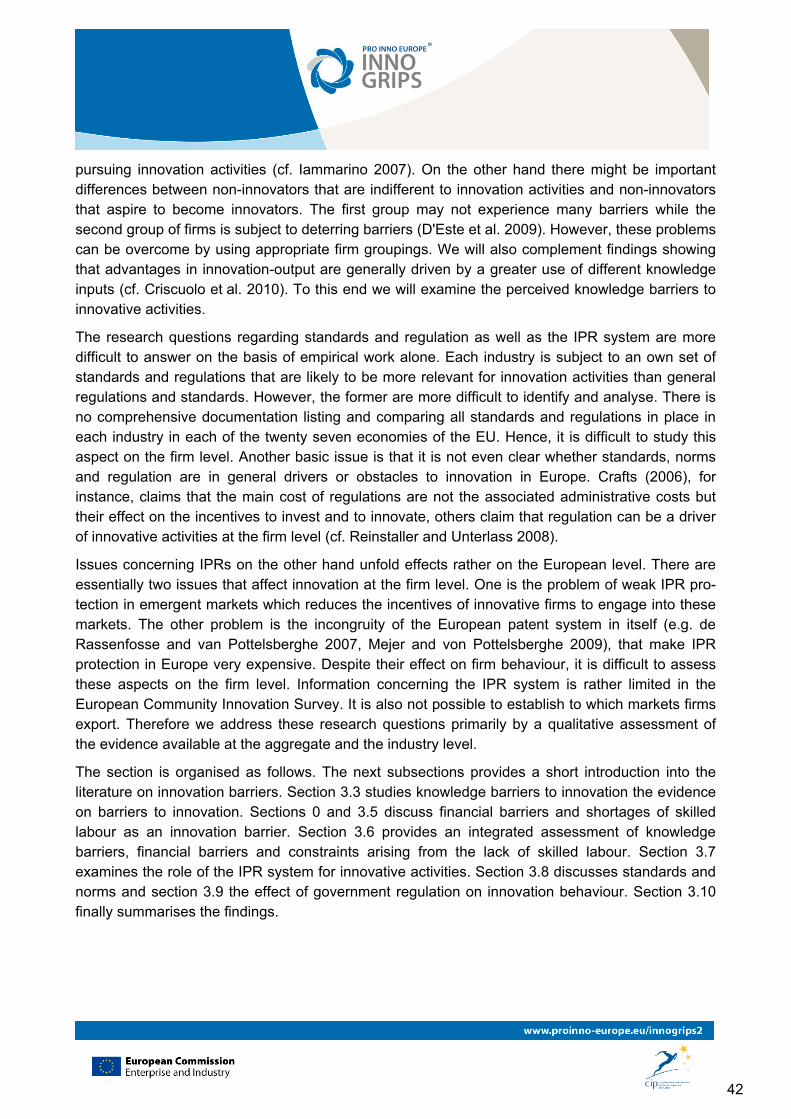
42
pursuing innovation activities (cf. Iammarino 2007). On the other hand there might be important differences between non-innovators that are indifferent to innovation activities and non-innovators that aspire to become innovators. The first group may not experience many barriers while the second group of firms is subject to deterring barriers (D'Este et al. 2009). However, these problems can be overcome by using appropriate firm groupings. We will also complement findings showing that advantages in innovation-output are generally driven by a greater use of different knowledge inputs (cf. Criscuolo et al. 2010). To this end we will examine the perceived knowledge barriers to innovative activities.
The research questions regarding standards and regulation as well as the IPR system are more difficult to answer on the basis of empirical work alone. Each industry is subject to an own set of standards and regulations that are likely to be more relevant for innovation activities than general regulations and standards. However, the former are more difficult to identify and analyse. There is no comprehensive documentation listing and comparing all standards and regulations in place in each industry in each of the twenty seven economies of the EU. Hence, it is difficult to study this aspect on the firm level. Another basic issue is that it is not even clear whether standards, norms and regulation are in general drivers or obstacles to innovation in Europe. Crafts (2006), for instance, claims that the main cost of regulations are not the associated administrative costs but their effect on the incentives to invest and to innovate, others claim that regulation can be a driver of innovative activities at the firm level (cf. Reinstaller and Unterlass 2008).
Issues concerning IPRs on the other hand unfold effects rather on the European level. There are essentially two issues that affect innovation at the firm level. One is the problem of weak IPR pro-tection in emergent markets which reduces the incentives of innovative firms to engage into these markets. The other problem is the incongruity of the European patent system in itself (e.g. de Rassenfosse and van Pottelsberghe 2007, Mejer and von Pottelsberghe 2009), that make IPR protection in Europe very expensive. Despite their effect on firm behaviour, it is difficult to assess these aspects on the firm level. Information concerning the IPR system is rather limited in the European Community Innovation Survey. It is also not possible to establish to which markets firms export. Therefore we address these research questions primarily by a qualitative assessment of the evidence available at the aggregate and the industry level.
The section is organised as follows. The next subsections provides a short introduction into the literature on innovation barriers. Section 3.3 studies knowledge barriers to innovation the evidence on barriers to innovation. Sections 0 and 3.5 discuss financial barriers and shortages of skilled labour as an innovation barrier. Section 3.6 provides an integrated assessment of knowledge barriers, financial barriers and constraints arising from the lack of skilled labour. Section 3.7 examines the role of the IPR system for innovative activities. Section 3.8 discusses standards and norms and section 3.9 the effect of government regulation on innovation behaviour. Section 3.10 finally summarises the findings.
43
3.2 Barriers to innovation
3.2.1 What are barriers to innovation? External vs. internal barriers Given the large number of studies using innovation survey data surprisingly few contributions have analysed the role of hampering factors to innovation in depth. Barriers to innovation can be internal or external to the firm. Many important barriers to innovation are found within the enterprise. Innovation has the connotation of newness. Adopting new technologies, introducing new products and organisational structures creates resistance within the firm. While internal and external changes often stimulate innovative exploration, internal resistance to change often prevents it. Within larger and established firm many different barriers to innovation that affect negatively a firm's ability to create radical innovations can be identified (Assink 2006):
1. Adoption barriers that are related to dominant designs, path dependency and successful products limit the ability to search for new disruptive innovations. Such adoption barriers are often increased by excessive bureaucracy in large enterprises leading to a status-quo bias status-quo bias where deviations from the standard are perceived as negative.
2. Mindset barriers that are related to the inability to unlearn the old logic of how products and markets work. This may also associated with the lack of distinctive competencies to detect and to exploit opportunities arising from external changes.
3. Risk barriers are associated with an excessive reliance on routines and experience and an unwillingness to cannibalise the own product markets. Disruptive innovations often threaten the existing products of established firms.
4. Nascent barriers that are associated with management capabilities to foster thinking out of the box and the management of the innovation process.
These barriers are internal to the firm and are closely related to the specific management and organisation of a firm. These barriers do not necessarily imply that radical innovation cannot take place within the firm but they indicate that existing organisations try to resist to changes, which need not be a bad thing. Not every innovation project is worth being executed. Innovation barriers can thus also be considered as organisational screening devices to filter worthy innovation projects from unworthy ones. Tang and Yeo (2003) argue that such internal barriers may even lead to an improvement of the innovation performance of enterprises. This shows that innovation barriers do not indicate barriers to innovation but that they need to be considered as factors that affect the innovation process within enterprises, deterring, delaying or changing innovative ideas and innovation projects (Mirow, Hölzle and Gemünden 2007).
In this section we argue that this finding from the management literature carries also over to external barriers to innovation that are more important from a public policy perspective.
External barriers to innovation are related to the institutional and the market context and are thus closely associated to market, government and system failures. While internal barriers to innovation are primarily an issue of management, organisation and firm competences, external barriers emerge when the firm interacts with other firms, agents or institutions in the economic and innovation system. Issues such as standardisation, regulation, financing of innovation, availability of skilled labour and technology transfer decrease the incidence of external barriers to innovation
44
to firms with high-potential innovation projects and form the basis for policy measures to foster the innovation potential of an economy.
However, the evidence on internal barriers to innovation is also of interest to policy makers as it helps to understand how firms actually innovate and how external barriers affect the innovation potential of firms. But only evidence external barriers to innovation provide a sound basis for policy intervention. The basic rationale for this view – that external barriers are relevant as policy rationale but not internal barriers to innovation - is that unexploited innovation opportunities by large firms are often taken up by innovative entrepreneurs and start-ups.* Therefore, in this report we focus on barriers to innovation that are external to the firm. We distinguish between two types of barriers:
1. Innovation barriers related to the availability of resources such as technological and market knowledge, financial resources and skilled labour.
2. Innovation barriers related to legislation such as standardisation, regulation and intellectual property rights.
Chapter 4 deals with barriers to internationalisation. While innovation and internationalisation theory follow different narratives, both barriers to innovation and barriers to internationalisation conceptualise internal barriers as firm specific and external barriers as related to the firm's environment in terms of framework conditions, support systems, etc. Some barriers can be internal and external, e.g. financial barriers. If a firm cannot finance innovation from internal funds, it needs to turn to external sources of finance. If it cannot obtain external sources of finance, we call it financially constrained. The same holds true for skill barriers to innovation – a lack of skills for innovation may be resolved by internal training or by external recruitment. Again, we call a firm skill constrained when it does not manage to find appropriately skilled employees on the external recruitment market. Our focus within barriers to innovation is on these external barriers, as there is a case for public policy to intervene only once a firm runs into external barriers.
Concerning barriers to internationalisation, the case is somewhat different – internationalisation support programmes aim inter alia at increasing the awareness of managers to export opportunities and at removing internal non-financial problems such as a lack of export know-how. Basically, there is a difference in how much public policy can do – advanced science and technology degrees cannot be produced by individual firms, whereas export know-how and training for SMEs can easily be supported.
3.2.2 Firm, country and industry characteristics are likely to influence the pattern of barriers observed
The framework of analysis of the present report emphasises the concept of distance to the frontier. In fact the available evidence shows that the bulk of expenditure is concentrated in a few countries. Using the country groups of Reinstaller and Unterlass (2010) the technologic frontier is defined at
* This shows that there is a close relationship between entrepreneurship policy and innovation policy. In fact, the promotion of high-technology entrepreneurship and early stage venture capital is today an important element of innovation policy.
45
the country level using information on GDP levels and direct and indirect R&D intensities. * Frontier countries are those countries where the comparative advantage is built on knowledge and innovation activities. Non-frontier economies in contrast are countries that still have catch-up potentials and have comparative advantage due to favourable factor costs. This suggests that not only the number of innovating firms (extend innovation activity) but also the nature of innovative activities will be different across countries. Catch-up countries will focus primarily on technology transfer and building up of absorptive capacity, while frontier countries need to engage in more explorative and risky innovation activities. This suggests that country characteristics (proxied by the distance to the frontier) should also influence the importance firms attach to different barriers of innovation.
At the firm level, it is well known that the characteristics of the firms affect the perception of barriers to innovation. Arundel (1997), Mohnen and Rosa (2000), Baldwin and Lin (2002), Galia and Legros (2004) and Iammarino et al. (2007) show that innovative firms attach higher importance to the hampering factors to innovation than non- innovators. In addition within the group of innovating firms the obstacles were considered more relevant firms having high innovation and R&D intensities. The positive link between innovation intensity and the propensity to evaluate as important barriers to innovation is less surprising when the original question of the CIS is considered, that emphasises hampering factors not barriers. Therefore in the empirical literature the answers are generally considered as firms' assessment of the obstacles and as a measure of their ability to overcome them. Baldwin and Lin (2002) and Galia and Legros (2004) provide two possible complementary interpretations:
1. Performing innovation activities increases the awareness of the difficulties encountered, without preventing firms' to pursue innovation projects.
2. The formulation of the CIS question on obstacles leads firms to assess the problems they faced and have overcome in performing innovation activities.
Table 16 provides some evidence on differences in the perception of innovation barriers across types of innovators and country groups. From these descriptive statistics emerges clearly that the lack of skilled labour is the most important constraint followed by lack of external financing and knowledge barriers to innovation. Across country groups it seems to be that mentioning that innovation barriers are relevant increases with the technological distance. Firms in country group 1 report the lowest number, followed by country group 2, county group 3 and last country group 4.
The definition of barrier-related non-innovators used in this study implies that this type of firm experiences barriers highest, especially the lack of financing, followed by R&D innovators and non-technological innovators. Non-barrier-related non-innovators record the lowest scores for innovation barriers. These firms are in general not hampered by their innovation activities because they do not aspire to engage in innovation.
* The countries that are part of each group are listed at the end of each table or figure. For more details see also Box 1, p. 15 for details on the construction of these country groups. See Box 1 on page 19.
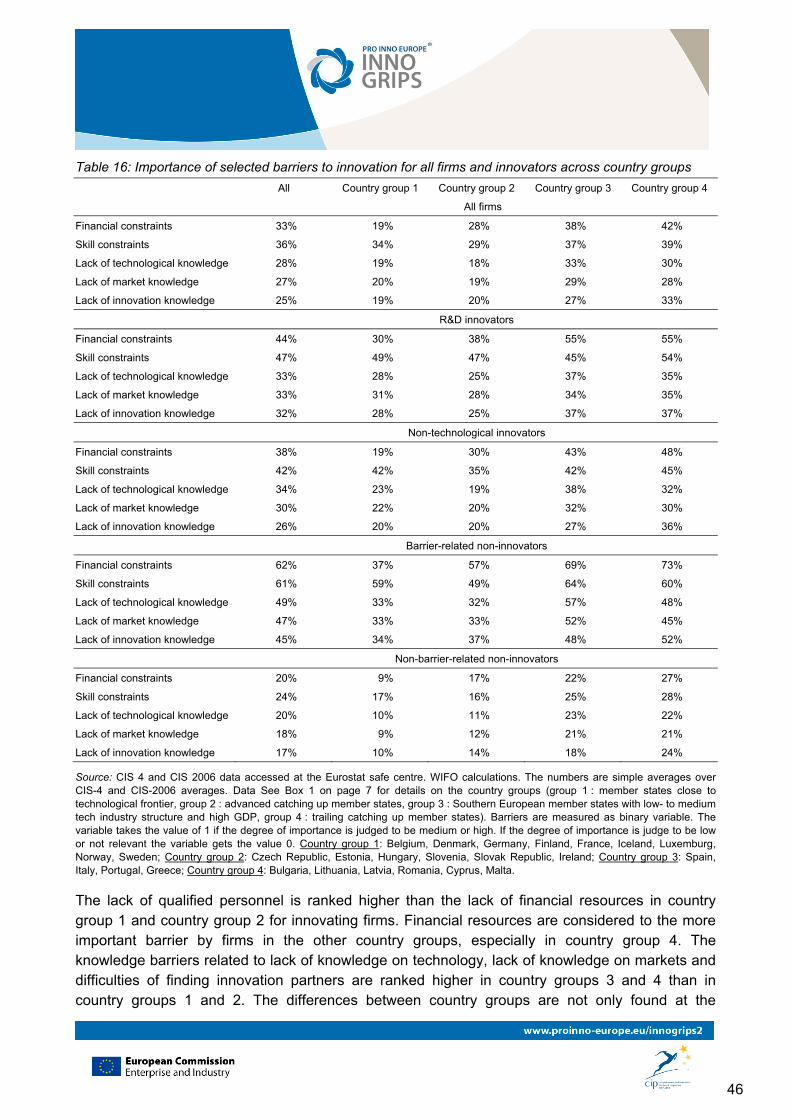
46
Table 16: Importance of selected barriers to innovation for all firms and innovators across country groups
All Country group 1 Country group 2 Country group 3 Country group 4
All firms
Financial constraints 33% 19% 28% 38% 42%
Skill constraints 36% 34% 29% 37% 39%
Lack of technological knowledge 28% 19% 18% 33% 30%
Lack of market knowledge 27% 20% 19% 29% 28%
Lack of innovation knowledge 25% 19% 20% 27% 33%
R&D innovators
Financial constraints 44% 30% 38% 55% 55%
Skill constraints 47% 49% 47% 45% 54%
Lack of technological knowledge 33% 28% 25% 37% 35%
Lack of market knowledge 33% 31% 28% 34% 35%
Lack of innovation knowledge 32% 28% 25% 37% 37%
Non-technological innovators
Financial constraints 38% 19% 30% 43% 48%
Skill constraints 42% 42% 35% 42% 45%
Lack of technological knowledge 34% 23% 19% 38% 32%
Lack of market knowledge 30% 22% 20% 32% 30%
Lack of innovation knowledge 26% 20% 20% 27% 36%
Barrier-related non-innovators
Financial constraints 62% 37% 57% 69% 73%
Skill constraints 61% 59% 49% 64% 60%
Lack of technological knowledge 49% 33% 32% 57% 48%
Lack of market knowledge 47% 33% 33% 52% 45%
Lack of innovation knowledge 45% 34% 37% 48% 52%
Non-barrier-related non-innovators
Financial constraints 20% 9% 17% 22% 27%
Skill constraints 24% 17% 16% 25% 28%
Lack of technological knowledge 20% 10% 11% 23% 22%
Lack of market knowledge 18% 9% 12% 21% 21%
Lack of innovation knowledge 17% 10% 14% 18% 24%
Source: CIS 4 and CIS 2006 data accessed at the Eurostat safe centre. WIFO calculations. The numbers are simple averages over CIS-4 and CIS-2006 averages. Data See Box 1 on page 7 for details on the country groups (group 1 : member states close to technological frontier, group 2 : advanced catching up member states, group 3 : Southern European member states with low- to medium tech industry structure and high GDP, group 4 : trailing catching up member states). Barriers are measured as binary variable. The variable takes the value of 1 if the degree of importance is judged to be medium or high. If the degree of importance is judge to be low or not relevant the variable gets the value 0. Country group 1: Belgium, Denmark, Germany, Finland, France, Iceland, Luxemburg, Norway, Sweden; Country group 2: Czech Republic, Estonia, Hungary, Slovenia, Slovak Republic, Ireland; Country group 3: Spain, Italy, Portugal, Greece; Country group 4: Bulgaria, Lithuania, Latvia, Romania, Cyprus, Malta.
The lack of qualified personnel is ranked higher than the lack of financial resources in country group 1 and country group 2 for innovating firms. Financial resources are considered to the more important barrier by firms in the other country groups, especially in country group 4. The knowledge barriers related to lack of knowledge on technology, lack of knowledge on markets and difficulties of finding innovation partners are ranked higher in country groups 3 and 4 than in country groups 1 and 2. The differences between country groups are not only found at the
47
aggregate level but also at the level of the different country groups. For example, the higher importance of skill constraints for firms in country group 1 is found for R&D innovators but also for barrier-related and non-barrier-related non-innovators.
The overall message is that differences matter for the perception and experience of barriers to innovation:
1. The perception of barriers to innovation is higher for innovating firms than for non-innovating firms. R&D innovators perceive barriers to innovation as more important than nontechnology innovators. This clearly shows that hampering factors should be considered as barriers that can be overcome, at least by innovative firms.
2. The distance to the frontier matters for the perception and experience of different innovation barriers. Firms in countries closer to technological frontier attach more importance to the lack of skilled labour than to lack of financing. For countries far away from the distance from the frontier it is the opposite.
Thus we will carry out an econometric analysis for the different country groups, the different sector groups following Peneder's (2010) taxonomy and with regard to the innovation activity of firms separately.
Important from a policy perspective is that not much is known about the barriers to innovation and the extent to which barriers actually deter the take-up of innovation by non-innovative firms. The existing literature on barriers to innovation has concentrated on the perception of barriers among innovative firms (e.g. Mohnen and Rosa 1999) or treated non-innovative firms as an undifferentiated group (Hölzl and Friesenbichler 2009, Iammarino et al. 2007). By looking more into detail into the group of non-innovative firms and differentiating between different types of non-innovative firms we are able to provide a richer picture on the barriers to innovation and their importance.
With this motivation in mind it is important to point out the most relevant hampering factors to firm innovation. This will enable us to draw policy recommendations targeting the most relevant barriers to innovation. Figure 3 reports the constraints to innovative activities faced by SMEs according to the Observatory of European SME survey. It emerges that a large fraction of European SMEs did not plan to carry out innovation activities and thus did not report any hampering factors to innovative activity. This was reported by 37 percent in the EU15 and 39% in the New Member States (NMS12). Access to finance is the most important constraint for innovation in the EU27 followed by expensive labour force and limited demand for innovation. In the NMS12 two hampering effects stand out: access to finance (13 percent) and lack of skilled labour (11 percent).*
* These results from the Observatory of European SMEs are similar to the results of the community survey as reported in table 3.
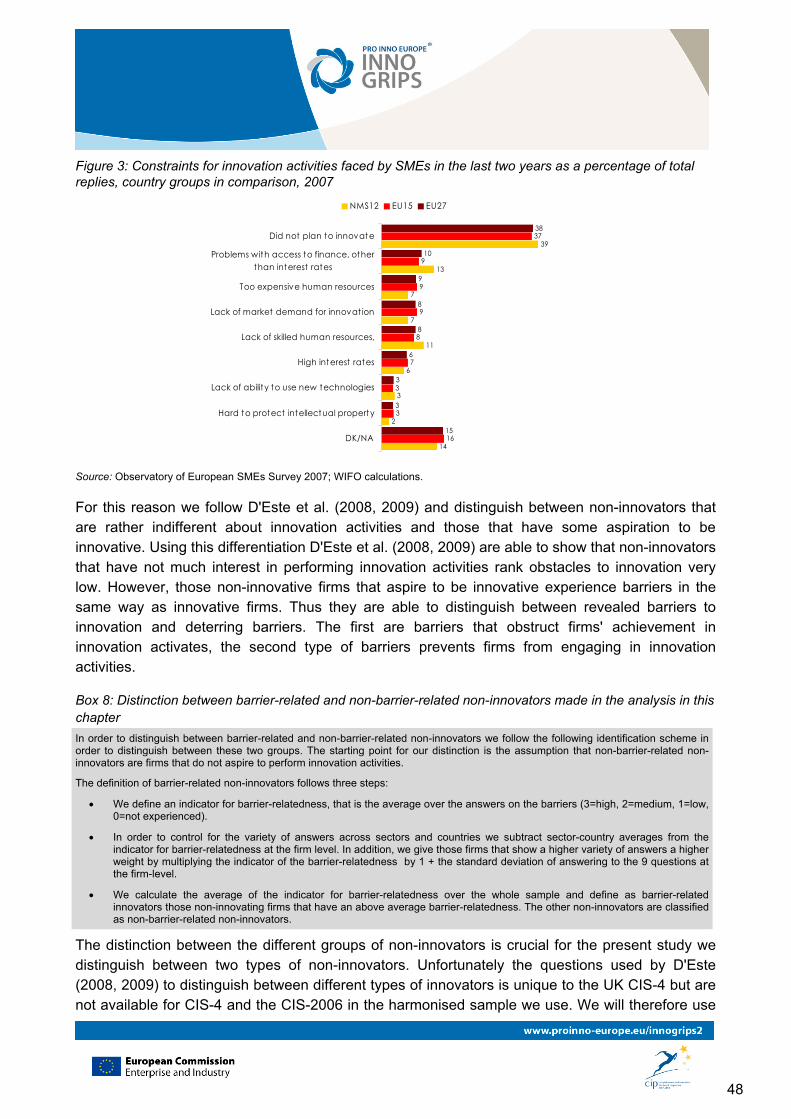
48
Figure 3: Constraints for innovation activities faced by SMEs in the last two years as a percentage of total replies, country groups in comparison, 2007
14
2
3
6
11
7
7
13
39
16
3
3
7
8
9
9
9
37
15
3
3
6
8
8
9
10
38
DK/NA
Hard to protect intellectual property
Lack of abilit y to use new technologies
High interest rates
Lack of skilled human resources,
Lack of market demand for innovat ion
Too expensive human resources
Problems with access to finance, otherthan interest rates
Did not plan to innovate
NMS12 EU15 EU27
Source: Observatory of European SMEs Survey 2007; WIFO calculations.
For this reason we follow D'Este et al. (2008, 2009) and distinguish between non-innovators that are rather indifferent about innovation activities and those that have some aspiration to be innovative. Using this differentiation D'Este et al. (2008, 2009) are able to show that non-innovators that have not much interest in performing innovation activities rank obstacles to innovation very low. However, those non-innovative firms that aspire to be innovative experience barriers in the same way as innovative firms. Thus they are able to distinguish between revealed barriers to innovation and deterring barriers. The first are barriers that obstruct firms' achievement in innovation activates, the second type of barriers prevents firms from engaging in innovation activities.
Box 8: Distinction between barrier-related and non-barrier-related non-innovators made in the analysis in this chapter
In order to distinguish between barrier-related and non-barrier-related non-innovators we follow the following identification scheme in order to distinguish between these two groups. The starting point for our distinction is the assumption that non-barrier-related non-innovators are firms that do not aspire to perform innovation activities.
The definition of barrier-related non-innovators follows three steps:
We define an indicator for barrier-relatedness, that is the average over the answers on the barriers (3=high, 2=medium, 1=low, 0=not experienced).
In order to control for the variety of answers across sectors and countries we subtract sector-country averages from the indicator for barrier-relatedness at the firm level. In addition, we give those firms that show a higher variety of answers a higher weight by multiplying the indicator of the barrier-relatedness by 1 + the standard deviation of answering to the 9 questions at the firm-level.
We calculate the average of the indicator for barrier-relatedness over the whole sample and define as barrier-related innovators those non-innovating firms that have an above average barrier-relatedness. The other non-innovators are classified as non-barrier-related non-innovators.
The distinction between the different groups of non-innovators is crucial for the present study we distinguish between two types of non-innovators. Unfortunately the questions used by D'Este (2008, 2009) to distinguish between different types of innovators is unique to the UK CIS-4 but are not available for CIS-4 and the CIS-2006 in the harmonised sample we use. We will therefore use
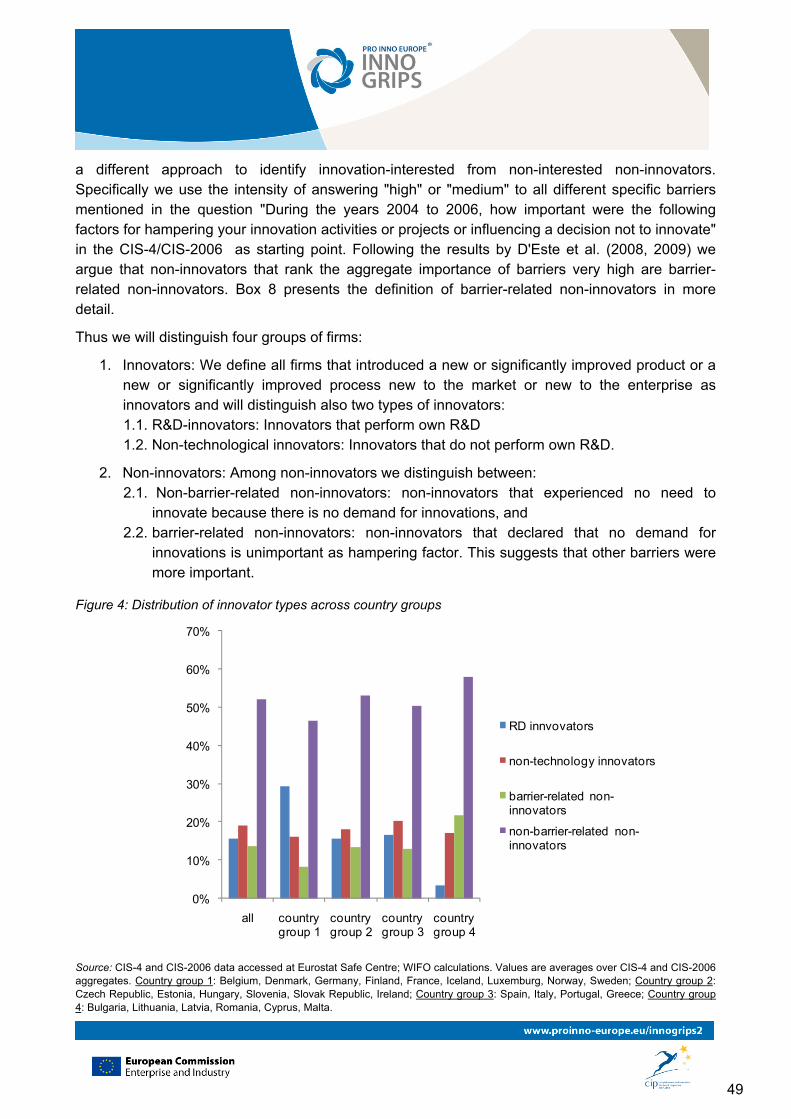
49
a different approach to identify innovation-interested from non-interested non-innovators. Specifically we use the intensity of answering "high" or "medium" to all different specific barriers mentioned in the question "During the years 2004 to 2006, how important were the following factors for hampering your innovation activities or projects or influencing a decision not to innovate" in the CIS-4/CIS-2006 as starting point. Following the results by D'Este et al. (2008, 2009) we argue that non-innovators that rank the aggregate importance of barriers very high are barrier-related non-innovators. Box 8 presents the definition of barrier-related non-innovators in more detail.
Thus we will distinguish four groups of firms:
1. Innovators: We define all firms that introduced a new or significantly improved product or a new or significantly improved process new to the market or new to the enterprise as innovators and will distinguish also two types of innovators: 1.1. R&D-innovators: Innovators that perform own R&D 1.2. Non-technological innovators: Innovators that do not perform own R&D.
2. Non-innovators: Among non-innovators we distinguish between: 2.1. Non-barrier-related non-innovators: non-innovators that experienced no need to
innovate because there is no demand for innovations, and 2.2. barrier-related non-innovators: non-innovators that declared that no demand for
innovations is unimportant as hampering factor. This suggests that other barriers were more important.
Figure 4: Distribution of innovator types across country groups
0%
10%
20%
30%
40%
50%
60%
70%
all country group 1
country group 2
country group 3
country group 4
RD innvovators
non-technology innovators
barrier-related non-innovators
non-barrier-related non-innovators
Source: CIS-4 and CIS-2006 data accessed at Eurostat Safe Centre; WIFO calculations. Values are averages over CIS-4 and CIS-2006 aggregates. Country group 1: Belgium, Denmark, Germany, Finland, France, Iceland, Luxemburg, Norway, Sweden; Country group 2: Czech Republic, Estonia, Hungary, Slovenia, Slovak Republic, Ireland; Country group 3: Spain, Italy, Portugal, Greece; Country group 4: Bulgaria, Lithuania, Latvia, Romania, Cyprus, Malta.
50
Figure 4 presents the distribution of the groups across country groups. Country group 1 has the highest number of R&D innovators, followed by country groups 2 and 3. Country group 4 has the lowest number of R&D innovators. The opposite is true for non-barrier-related non-innovators. Non-technology innovators are distributed in a quite similar way across the country groups. The highest share is in country group 3 followed by country groups 3, 2 and 1. The difference in the distribution of barrier-related non-innovators is quite unequal. Most barrier-related non-innovators are found in country group 4 followed by country group 2 and 3. Country group 1 has the lowest share of barrier-related non-innovators.
3.2.3 The set-up of the empirical studies on barriers to innovation As Table 16 suggests the barriers to innovation studied in sections 3.3 to 3.5 of this report, namely lack of knowledge, lack of financing and lack of qualified personnel can be studied in a similar way using CIS data. Using the same set-up for the econometric analysis – method and independent variables - has the advantage to make the results regarding the determinants of different barriers comparable and eases the interpretation of the results.
3.2.3.1 Construction of the barriers variables
Let us start with the construction of the dependent variables. The CIS questionnaires have one question where they ask all firms how they perceive barriers to innovation. Firms are asked to assess the importance of the barriers using a 4 valued scale from high importance over medium to low importance and not relevant. From these answers we construct a binary variable that takes on the value of 1 if the firm considers the degree of importance of the barrier as high or medium. The variable takes on the value of 0 if the firm considers the barrier of low importance or not relevant at all. The rationale for constructing the dependent variable in this way is that we have then a indicator that discriminates whether firms judge the barrier to be important or not.*
3.2.3.2 Dependent variables
The primary goal of the analysis is to uncover systematic differences between different types of innovative and non-innovative firms across country groups. This limits the construction of dependent variables to the questions in the CIS that are answered by all firms. Therefore we do not include any specific information on the innovation process.
The basic specification is the following:
Barrier = f(FS, GAZ, INTER, GP_fo, GP_do, manuf)
Where FS denotes firm size, GAZ the fact whether the firm is a fast growing firm, INTER whether the firm is internationalised or not, GP_fo is a dummy variable denoting that the firm is part of a foreign corporate group, GP_do is a dummy variable denoting that the firm is part of a domestic
* The reduction of informational content of the dependent variable – we do not differentiate between high and medium on the one hand and low and not relevant on the other hand – allows us to use probit regression models instead of ordered models that would take into account all four characteristics of the original variables. Specification tests have shown that ordered probit failed to converge in a number of specifications and that no qualitative differences with regard to interpretation emerge.
51
corporate group and manuf is a dummy indicating that the firm is in the manufacturing sector. In addition we use aggregated sector dummies following the innovation taxonomy by Peneder (2010) that distinguishes 5 different sector groups according to innovation intensity in the country group regressions and country group dummies in the sector regressions to uncover results that are not driven by country and sector specificities.
Firm size is measured by the logarithm of employees. This variable is important in this study as it proxies firm size and provides evidence on the issue whether smaller or larger firms perceive the specific barriers more importantly. It is generally assumed that because of their small size SMEs experience higher barriers to innovation as they lack the resources for innovation and lack of resources to circumvent regulatory problems.
It is interesting to see whether successful high growth firms judge innovation barriers differently than firms that have normal growth rates. Given the fact that high growth firms are important for net employment generation and the diffusion of technology it is surprising that we do not know more about them (cf. Hölzl and Friesenbichler 2008, Henrekson and Johansson 2010, Coad and Hölzl 2010). There are reasons to think that high growth firms judge barriers lighter than other firms – because they were successful or not hampered by the factors - on the other hand there it could be that such firms made much effort to overcome the obstacles.
Like other studies investigating high-growth firms (Schreyer 2000, Hölzl and Friesenbichler 2008, 2010), we measure firm growth by an index that helps reduce the bias toward larger firms (absolute growth) and small firms (relative growth rate).* The index we use was pioneered by Schreyer (2000) and is a combination of the proportional and absolute growth indexes:
0
0
,
,,, )(
ti
tititi x
xxxm ,
where tix , and 0,tix denote size at the end and at the beginning of the period under consideration.
This growth indicator still depends on firm size, but has a smaller bias toward firm size than the proportional or absolute measures of growth. We use a relative cut-off point and select the top 5% of growing firms as high-growth firms. The indicator for high growth firms is thus a dummy variable including the top 5% of fast growing firms.
It is generally thought that it is easier for firms to access knowledge sources within the same enterprise than going outside of the enterprise. Larger enterprises usually consist of groups of firms. Thus firms being part of a corporate group may have scale advantages compared to independent firms of the same size. Knowledge and financial resources can be shared between the firms of an enterprise (internal markets for know-how and internal financial markets). In addition critical human capital can be can be temporarily reallocated between enterprises belonging to the same corporate group much more easily than between independent firms. For that reason we include dummy variables that identify whether the firm is part of a corporate group.
* Proportional growth is biased towards small firms, as small units are much more likely to exhibit high rates of proportional growth than large firms. It is easier to double the size of the firm for a firm with one employee than for a firm with 500 employees. Absolute growth is the absolute change in size. It is easier for large firms to add 10 employees than for a very small firm. Measuring growth in absolute or relative terms can lead to different results (Schreyer 2000, Shepherd and Wiklund, Hölzl and Coad 2010).
52
We take foreign ownership separately into account, as foreign ownership may give access to better technology than is possible within domestic company groups. In fact, the literature on multinationals emphasises that multinationals tend to be larger, have a higher level of accumulated competence and tend to be more research-intensive than purely domestic firms (Cantwell 1995, Iammarino et al. 2007). Thus belonging to an enterprise group may affect the importance and perception of obstacles. We use separate dummy variables for
1. Whether the firm is part of a foreign multinational, and 2. Whether the firm is part of a domestic corporate group
As the goal of the chapter is to study the barriers to internationalisation we include also a dummy variable for internationalisation into the analysis. Last but not least we include sector controls including whether the firm is a manufacturing firm or not and country group dummies if required.
3.3 Knowledge barriers to innovation
3.3.1 What are knowledge barriers to innovation? It is well known that innovation is complex and generally a phenomenon that involves more than one knowledge base. Thus knowledge barriers to innovation can be very specific to firms and their knowledge management. On the other hand they are also related to the institutional and business environment. The presence of technology transfer institutions and the availability of highly educated may relax knowledge barriers related to technological knowledge. The emergence of dedicated consultancy and service firms in the areas of technology and business know-how can be seen as business responses to the fact that no firms – especially smaller ones – can afford to have all possible knowledge-related competences in-house. In fact, innovation more than every other business process is generally considered to be based on collaborative efforts. The whole idea of open innovation is based on the fact that innovation is frequently associated with a bringing together of distinct knowledge-bases, user-producer interaction and a quite sophisticated division of labour.
However, there is not only one kind of knowledge that is relevant to the innovation process. Knowledge can have quite distinct characteristics. One distinction is between codified knowledge and tacit knowledge. The first is associated with scientific knowledge that is written down, while the second denotes know-how, that is often not possible or too expensive to codify. Johnson, Lorenz and Lundvall (2002) provide a simple taxonomy of knowledge that makes clear that knowledge barriers are not exclusively due to missing absorptive capacities. They argue that there are four different kinds of knowledge that find appropriate representation at the individual level:
1. The first category is "Know-what" and referrers primarily to information about facts. At the organisational level it corresponds to information databases.
2. "Know-why" refers to knowledge in terms of explanations. A primary example is scientific knowledge that is or primary importance to innovation processes in science-based industries such as electronics or chemistry. While scientific knowledge is generally considered to be information, it is partly also tacit as its use is often dependent on specific,
53
sometimes even personal skills. At the organisational level "know-why" refers to "shared models of interpretation".
3. "Know- how" refers to the ability to do something, that is skills. Know-how is typically a kind of knowledge that is developed and kept within the borders of individual firms or research teams. At the organisational level "know-how" corresponds to organisational routines.
4. Finally, "Know-who" refers to the network aspect of knowledge. The nature of innovation as the recombination of existing knowledge shows that for innovation processes collaboration and the establishment of a composite knowledge base is very important. This type of knowledge involves information about who knows what and who knows what to do. At the level of the organisation this refers to "shared networks".
These different aspects of knowledge refer to different knowledge barriers to innovation. This makes clear that there is a close relationship between innovation barriers and missing (specific) absorptive capacities. But lack in absorptive capacity is not the whole story. With open innovation and the distributed nature of knowledge "know-who" becomes relevant. Knowledge is associated with the competences and skills to process information, as well with knowing where to look for which information. This idea of knowledge makes clear that knowledge barriers to innovation refer to the availability of resources to acquire and process information.
3.3.2 Knowledge barriers and SMEs Innovation and competitiveness are key factors in determining economic performance. In an economic context where innovation plays a key role for competition, the ability of SMEs to create, access and commercialise new knowledge is fundamental to sustained growth. Thus knowledge barriers seem to be particularly relevant for SMEs. As innovative activities have some aspect of fixed outlays SME in general have more difficulties than large firms to afford the absorptive capacities to acquire knowledge and the means to access the knowledge and to establish the collaborations required for their innovation activities. This suggests that barriers to innovation are more serious for small firms than for large firms. It is more likely that large non-innovative firms are non-innovative by choice, while for SME's barriers may play an important role.
But lack of resources is not the whole story. Baumol (2007) argues that the specialty of entrepreneurial small firms is to drive radical innovation, while incremental less spectacular improvements are the province of established incumbents and large firms. Rothwell and Dodgson (1994) emphasise that the role of small firms for innovation is more important with low entry costs, the existence of market niches and the existence of networks for collaboration. Acs and Audretsch (1987) provide empirical evidence that large firms are more innovative in concentrated industries with high barriers to entry, whereas small firms perform better in competitive markets. In addition, entrepreneurial small firms appear to be better at exploiting external economies deriving from a more innovative environment, due to a proximity to universities and the R&D centres of large firms (Acs et al. 1994, Audretsch and Vivarelli 1994, Rogers 2004). However, when it comes to formal R&D it is generally confirmed that R&D expenditures increase firm size (Scherer 1965). This has been explained with the size advantages of large firms in terms of internal knowledge, financial resources for innovation, sales base and market power (Cohen and Klepper 1996). When patents and innovation counts are considered, a robust result appears to emerge, indicating that innovation
54
productivity tends to decline with firm size (e.g. Bound et. al. 1984, Acs and Audretsch 1990). This may be related to sectoral specificities as sectors with incremental technical change favour (larger) incumbents while sectors which are characterised by more radical innovation patterns that do not require an extensive knowledge base internal to the firm favour (small) newcomers (Breschi et al. 2000, Malerba 2004). This is in largely in accordance to the results reported by Cohen and Klepper (1994) and Vaona and Pianta (2008): Small firms focus on product innovations in market niches.
This is mirrored also by research that attempts to identify entrepreneurship as input into the production function. The 'knowledge filter' theory of entrepreneurship (e.g. Acs et al. 2004, 2005) identifies entrepreneurship as a transfer mechanism that facilitates the process of knowledge spillovers and transforms new knowledge into economic knowledge and growth. Thus small successful firms in high technology sectors should experience lower barriers to entry. We investigate therefore also the role of high growth. Fast growing entrepreneurial firms are an important source of dynamism in modern economies. In order to put the results into perspective we will also analyse other barriers to innovation and control for different types of firms.
3.3.3 Knowledge barriers and internationalisation There are a number of studies on the interaction between innovation and international activities. Often the degree of internationalisation of firms is seen as function of the firm's innovative activities that are considered as proxy for the level and complexity of accumulated competence (e.g. Markusen 1984, Rugman 1981). On average multinationals tend to be larger, have a higher level of accumulated competence and tend to be more research-intensive than purely domestic firms (Iammarino et al. 2007). Technological activity in modern multinationals is organised in international networks that allow the strategic integration of different paths of innovation (e.g. Cantwell 1995, Veugelers and Cassiman 2004). The extent to which multinational enterprises engage in innovative activities depend on their technological strategy and the characteristics of the host environment. Thus being part of a multinational group should reduce the perception that the lack of technological and market knowledge acts as an innovation barrier. Knowledge and information transfer within connected firms broadens the available knowledge base (know-what, know-how and know-who). This should have an effect if the firm is part of a domestic corporate group. The effect of internationalisation in the form of exporting is more difficult to assess. The evidence that internationalised firms operate internationally and are subject to competitive pressure from firms from other countries leads to suspect that exporting firms are more aware of technological knowledge gaps than firms that operate only domestically. Internationalised firms access foreign markets that may follow slightly different customs and rules than the domestic market. For this reason differentiated market knowledge is more relevant to them than to domestic firms.
3.3.4 Empirical results The basic set-up of the empirical study has been described in Chapters 2.2.2. and 2.2.3. The descriptive statistics in Table 16 have shown that especially innovators are generally more likely to report a lack of information on technology than non-innovative firms. Here we report the results of our econometric analysis with the aim to uncover systematic differences between different types of
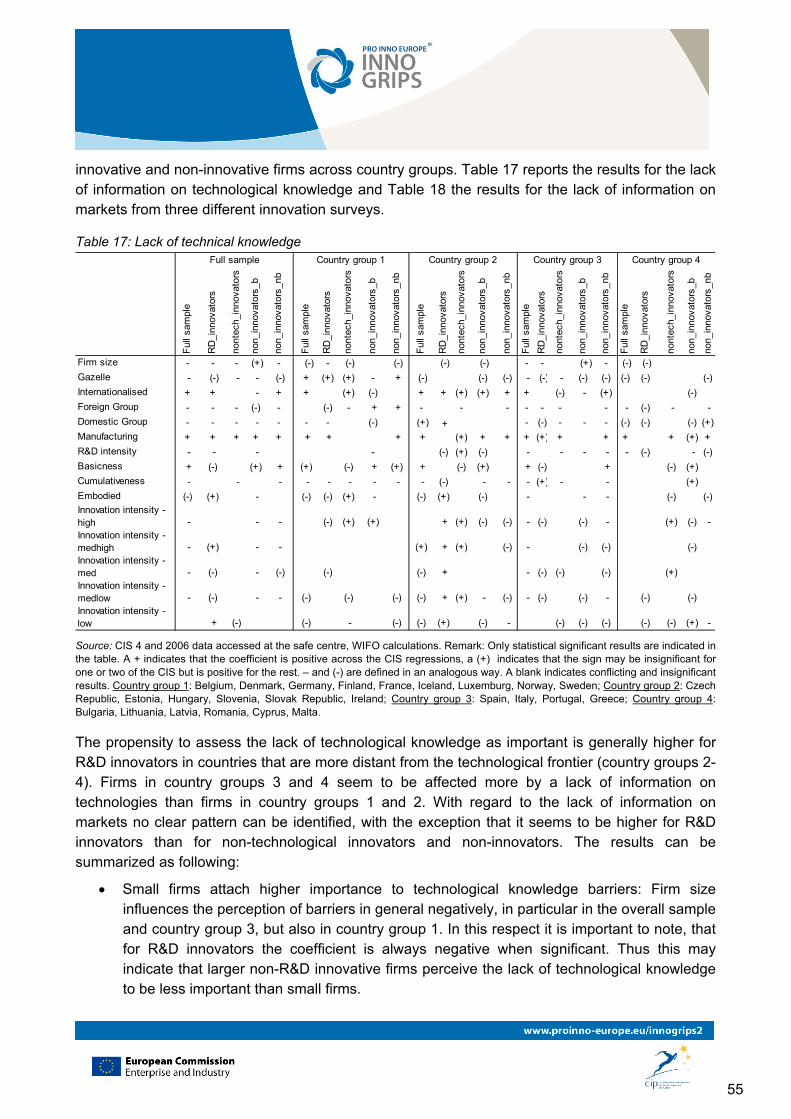
55
innovative and non-innovative firms across country groups. Table 17 reports the results for the lack of information on technological knowledge and Table 18 the results for the lack of information on markets from three different innovation surveys.
Table 17: Lack of technical knowledge
Ful
l sam
ple
RD
_inn
ovat
ors
nont
ech_
inno
vato
rs
non_
inno
vato
rs_b
non_
inno
vato
rs_n
b
Ful
l sam
ple
RD
_inn
ovat
ors
nont
ech_
inno
vato
rs
non_
inno
vato
rs_b
non_
inno
vato
rs_n
b
Ful
l sam
ple
RD
_inn
ovat
ors
nont
ech_
inno
vato
rs
non_
inno
vato
rs_b
non_
inno
vato
rs_n
b
Ful
l sam
ple
RD
_inn
ovat
ors
nont
ech_
inno
vato
rs
non_
inno
vato
rs_b
non_
inno
vato
rs_n
b
Ful
l sam
ple
RD
_inn
ovat
ors
nont
ech_
inno
vato
rs
non_
inno
vato
rs_b
non_
inno
vato
rs_n
b
Firm size - - - (+) - (-) - (-) (-) (-) (-) - - (+) - (-) (-)
Gazelle - (-) - - (-) + (+) (+) - + (-) (-) (-) - (-) - (-) (-) (-) (-) (-)
Internationalised + + - + + (+) (-) + + (+) (+) + + (-) - (+) (-)
Foreign Group - - - (-) - (-) - + + - - - - - - - - (-) - -
Domestic Group - - - - - - - (-) (+) + - (-) - - - (-) (-) (-) (+)
Manufacturing + + + + + + + + + (+) + + + (+) + + + + (+) +
R&D intensity - - - - (-) (+) (-) - - - - - (-) - (-)
Basicness + (-) (+) + (+) (-) + (+) + (-) (+) + (-) + (-) (+)
Cumulativeness - - - - - - - - - (-) - - - (+) - - (+)
Embodied (-) (+) - (-) (-) (+) - (-) (+) (-) - - - (-) (-)Innovation intensity - high - - - (-) (+) (+) + (+) (-) (-) - (-) (-) - (+) (-) -Innovation intensity - medhigh - (+) - - (+) + (+) (-) - (-) (-) (-)Innovation intensity - med - (-) - (-) (-) (-) + - (-) (-) (-) (+)Innovation intensity - medlow - (-) - - (-) (-) (-) (-) + (+) - (-) - (-) (-) - (-) (-)Innovation intensity - low + (-) (-) - (-) (-) (+) (-) - (-) (-) (-) (-) (-) (+) -
Full sample Country group 1 Country group 2 Country group 3 Country group 4
Source: CIS 4 and 2006 data accessed at the safe centre, WIFO calculations. Remark: Only statistical significant results are indicated in the table. A + indicates that the coefficient is positive across the CIS regressions, a (+) indicates that the sign may be insignificant for one or two of the CIS but is positive for the rest. – and (-) are defined in an analogous way. A blank indicates conflicting and insignificant results. Country group 1: Belgium, Denmark, Germany, Finland, France, Iceland, Luxemburg, Norway, Sweden; Country group 2: Czech Republic, Estonia, Hungary, Slovenia, Slovak Republic, Ireland; Country group 3: Spain, Italy, Portugal, Greece; Country group 4: Bulgaria, Lithuania, Latvia, Romania, Cyprus, Malta.
The propensity to assess the lack of technological knowledge as important is generally higher for R&D innovators in countries that are more distant from the technological frontier (country groups 2-4). Firms in country groups 3 and 4 seem to be affected more by a lack of information on technologies than firms in country groups 1 and 2. With regard to the lack of information on markets no clear pattern can be identified, with the exception that it seems to be higher for R&D innovators than for non-technological innovators and non-innovators. The results can be summarized as following:
Small firms attach higher importance to technological knowledge barriers: Firm size influences the perception of barriers in general negatively, in particular in the overall sample and country group 3, but also in country group 1. In this respect it is important to note, that for R&D innovators the coefficient is always negative when significant. Thus this may indicate that larger non-R&D innovative firms perceive the lack of technological knowledge to be less important than small firms.
56
High growth firms do report a lower incidence of technological knowledge barriers on average: Being a fast growing firm (gazelle) affects the assessment of the importance of the lack of information on technology differently across the country groups. In country group 1 (closest to the technology frontier) fast growing firms have a higher propensity to indicate barriers to innovation due to lack of information of technology. This stands in clear contrast to the other country groups, where fast growing firms indicate a lower than average propensity to state that lack of knowledge on technology is an important barrier to innovation. In country group 1 we identify only for barrier-related non-innovators we identify a negative sign as in the other groups.
Internationalised firms report higher technology knowledge barriers to innovation: Except for non-barrier-related innovators in country group 1 and non-technological innovators in country group 3 and most firm types in country group 4 the sign is positive. Probably reflecting the greater awareness of their technology gaps of firms facing international competition.
Among the most robust results is that being part of a foreign corporate group significantly affects the perception of technological knowledge barriers. These firms rate knowledge barriers as being less severe. Our results therefore confirm the findings reported in the literature survey. The only exception is the evidence for country group 1. It is contradictory for innovators and non-innovators and the results are statistically not significant. Being part of a domestic corporate group also influences the perception of barriers negatively in country group 3. This may be due to the small average firm size in these countries (Pagano and Schivardi 2003). In country group 2 instead firms that are part of a domestic corporate group assess knowledge barriers as being important. This may indicate that R&D innovators in country group 2 are more dependent on foreign technology sourcing.
Firms in R&D intensive industries report a lower incidence of technological knowledge barriers: The industry R&D intensity exerts a negative effect on the perception of the importance of lack of technological information on average. This result is almost entirely driven by the results for country group 3. The cumulativeness of the knowledge base is negatively associated with a lack of information on technology.
Last but not least, manufacturing firms are more likely to perceive a lack of information on technology as a barrier.
As discussed in the literature survey technological knowledge is only one important aspect of knowledge barriers. Another other is economic knowledge on markets. Table 18 reports the results for the analysis of the importance of lack of information on markets. The results can be summarized as follows:
Small firms attach higher importance to market knowledge barriers: Firm size influences the perception of barriers in general negatively. In this respect it is important to note, that for R&D innovators the coefficient is always negative when significant. Only for barrier-related non-innovators in country group 1 and 3 and in the full sample we report a positive coefficient. In the group of barrier-related firms larger firms report higher lack of knowledge about markets.
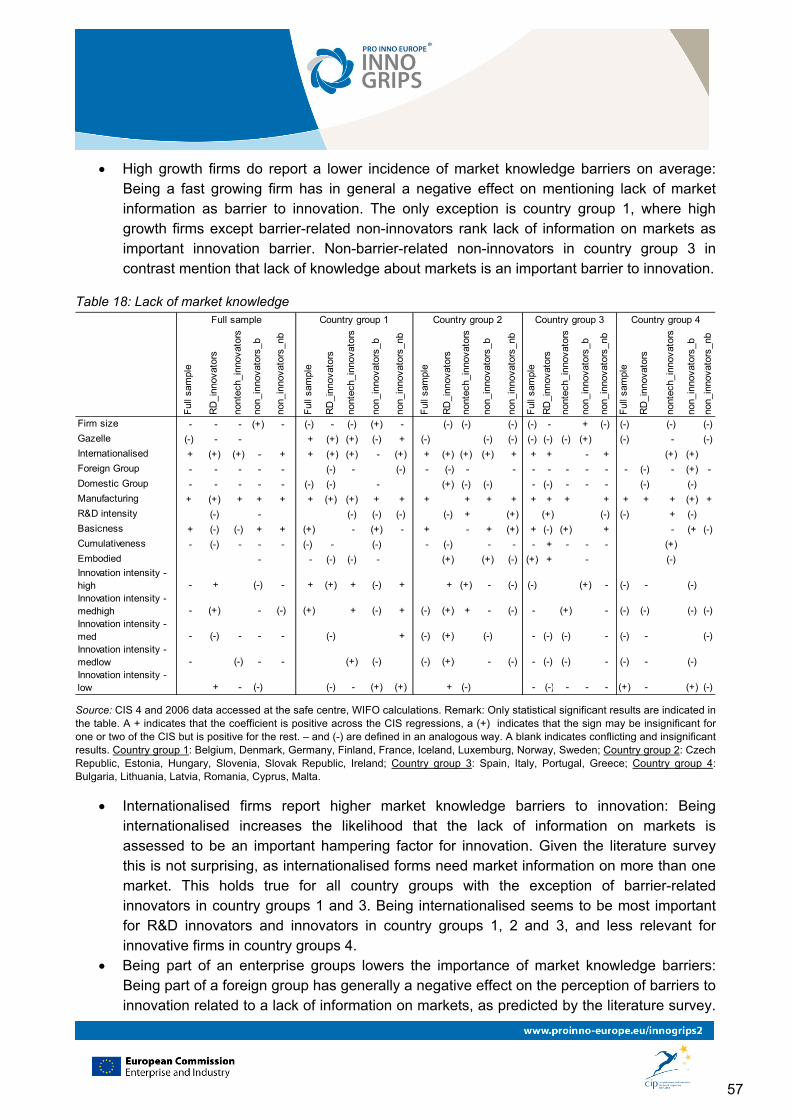
57
High growth firms do report a lower incidence of market knowledge barriers on average: Being a fast growing firm has in general a negative effect on mentioning lack of market information as barrier to innovation. The only exception is country group 1, where high growth firms except barrier-related non-innovators rank lack of information on markets as important innovation barrier. Non-barrier-related non-innovators in country group 3 in contrast mention that lack of knowledge about markets is an important barrier to innovation.
Table 18: Lack of market knowledge
Ful
l sam
ple
RD
_inn
ovat
ors
nont
ech_
inno
vato
rs
non_
inno
vato
rs_b
non_
inno
vato
rs_n
b
Ful
l sam
ple
RD
_inn
ovat
ors
nont
ech_
inno
vato
rs
non_
inno
vato
rs_b
non_
inno
vato
rs_n
b
Ful
l sam
ple
RD
_inn
ovat
ors
nont
ech_
inno
vato
rs
non_
inno
vato
rs_b
non_
inno
vato
rs_n
b
Ful
l sam
ple
RD
_inn
ovat
ors
nont
ech_
inno
vato
rs
non_
inno
vato
rs_b
non_
inno
vato
rs_n
b
Ful
l sam
ple
RD
_inn
ovat
ors
nont
ech_
inno
vato
rs
non_
inno
vato
rs_b
non_
inno
vato
rs_n
b
Firm size - - - (+) - (-) - (-) (+) - (-) (-) (-) (-) - + (-) (-) (-) (-)
Gazelle (-) - - + (+) (+) (-) + (-) (-) (-) (-) (-) (-) (+) (-) - (-)
Internationalised + (+) (+) - + + (+) (+) - (+) + (+) (+) (+) + + + - + (+) (+)
Foreign Group - - - - - (-) - (-) - (-) - - - - - - - - (-) - (+) -
Domestic Group - - - - - (-) (-) - (+) (-) (-) - (-) - - - (-) (-)
Manufacturing + (+) + + + + (+) (+) + + + + + + + + + + + + + (+) +
R&D intensity (-) - (-) (-) (-) (-) + (+) (+) (-) (-) + (-)
Basicness + (-) (-) + + (+) - (+) - + - + (+) + (-) (+) + - (+ (-)
Cumulativeness - (-) - - - (-) - (-) - (-) - - - + - - - (+)
Embodied - - (-) (-) - (+) (+) (-) (+) + - (-)Innovation intensity - high - + (-) - + (+) + (-) + + (+) - (-) (-) (+) - (-) - (-)Innovation intensity - medhigh - (+) - (-) (+) + (-) + (-) (+) + - (-) - (+) - (-) (-) (-) (-)Innovation intensity - med - (-) - - - (-) + (-) (+) (-) - (-) (-) - (-) - (-)Innovation intensity - medlow - (-) - - (+) (-) (-) (+) - (-) - (-) (-) - (-) - (-)Innovation intensity - low + - (-) (-) - (+) (+) + (-) - (-) - - - (+) - (+) (-)
Full sample Country group 1 Country group 2 Country group 3 Country group 4
Source: CIS 4 and 2006 data accessed at the safe centre, WIFO calculations. Remark: Only statistical significant results are indicated in the table. A + indicates that the coefficient is positive across the CIS regressions, a (+) indicates that the sign may be insignificant for one or two of the CIS but is positive for the rest. – and (-) are defined in an analogous way. A blank indicates conflicting and insignificant results. Country group 1: Belgium, Denmark, Germany, Finland, France, Iceland, Luxemburg, Norway, Sweden; Country group 2: Czech Republic, Estonia, Hungary, Slovenia, Slovak Republic, Ireland; Country group 3: Spain, Italy, Portugal, Greece; Country group 4: Bulgaria, Lithuania, Latvia, Romania, Cyprus, Malta.
Internationalised firms report higher market knowledge barriers to innovation: Being internationalised increases the likelihood that the lack of information on markets is assessed to be an important hampering factor for innovation. Given the literature survey this is not surprising, as internationalised forms need market information on more than one market. This holds true for all country groups with the exception of barrier-related innovators in country groups 1 and 3. Being internationalised seems to be most important for R&D innovators and innovators in country groups 1, 2 and 3, and less relevant for innovative firms in country groups 4.
Being part of an enterprise groups lowers the importance of market knowledge barriers: Being part of a foreign group has generally a negative effect on the perception of barriers to innovation related to a lack of information on markets, as predicted by the literature survey.
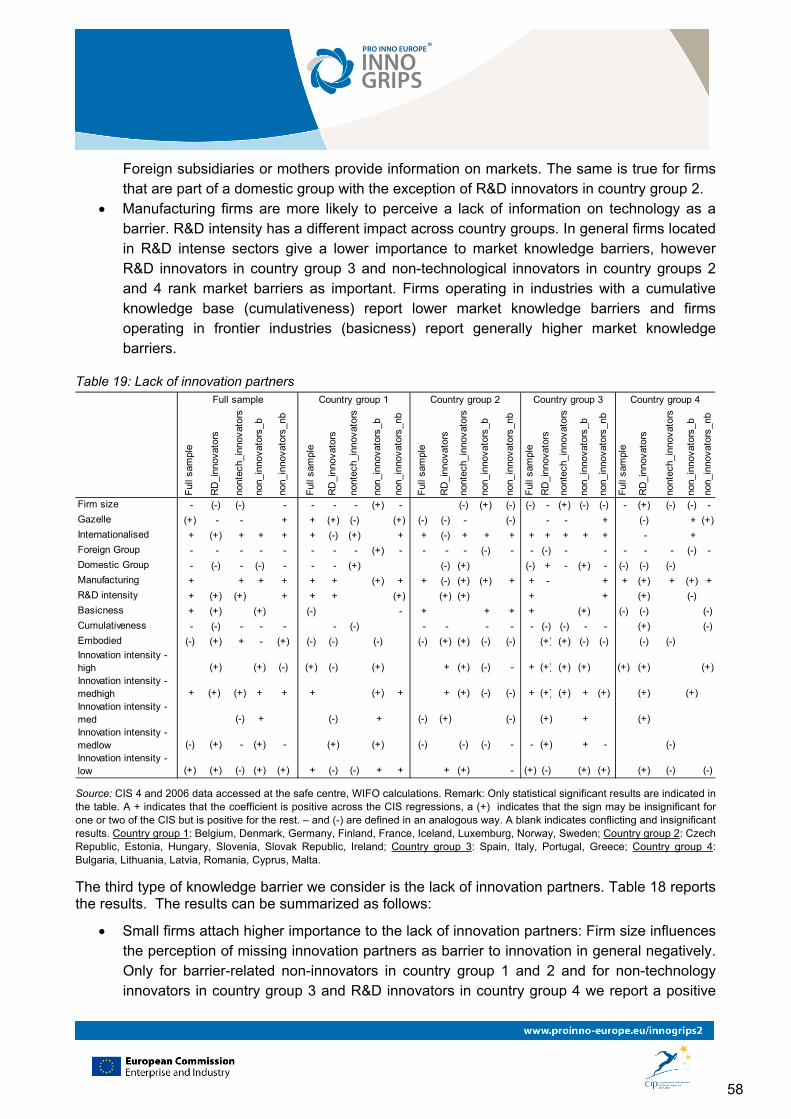
58
Foreign subsidiaries or mothers provide information on markets. The same is true for firms that are part of a domestic group with the exception of R&D innovators in country group 2.
Manufacturing firms are more likely to perceive a lack of information on technology as a barrier. R&D intensity has a different impact across country groups. In general firms located in R&D intense sectors give a lower importance to market knowledge barriers, however R&D innovators in country group 3 and non-technological innovators in country groups 2 and 4 rank market barriers as important. Firms operating in industries with a cumulative knowledge base (cumulativeness) report lower market knowledge barriers and firms operating in frontier industries (basicness) report generally higher market knowledge barriers.
Table 19: Lack of innovation partners
Ful
l sam
ple
RD
_inn
ovat
ors
nont
ech_
inno
vato
rs
non_
inno
vato
rs_b
non_
inno
vato
rs_n
b
Ful
l sam
ple
RD
_inn
ovat
ors
nont
ech_
inno
vato
rs
non_
inno
vato
rs_b
non_
inno
vato
rs_n
b
Ful
l sam
ple
RD
_inn
ovat
ors
nont
ech_
inno
vato
rs
non_
inno
vato
rs_b
non_
inno
vato
rs_n
b
Ful
l sam
ple
RD
_inn
ovat
ors
nont
ech_
inno
vato
rs
non_
inno
vato
rs_b
non_
inno
vato
rs_n
b
Ful
l sam
ple
RD
_inn
ovat
ors
nont
ech_
inno
vato
rs
non_
inno
vato
rs_b
non_
inno
vato
rs_n
b
Firm size - (-) (-) - - - - (+) - (-) (+) (-) (-) - (+) (-) (-) - (+) (-) (-) -
Gazelle (+) - - + + (+) (-) (+) (-) (-) - (-) - - + (-) + (+)
Internationalised + (+) + + + + (-) (+) + + (-) + + + + + + + + - +
Foreign Group - - - - - - - - (+) - - - - (-) - - (-) - - - - - (-) -
Domestic Group - (-) - (-) - - - (+) (-) (+) (-) + - (+) - (-) (-) (-)
Manufacturing + + + + + + (+) + + (-) (+) (+) + + - + + (+) + (+) +
R&D intensity + (+) (+) + + + (+) (+) (+) + + (+) (-)
Basicness + (+) (+) (-) - + + + + (+) (-) (-) (-)
Cumulativeness - (-) - - - - (-) - - - - - (-) (-) - - (+) (-)
Embodied (-) (+) + - (+) (-) (-) (-) (-) (+) (+) (-) (-) (+) (+) (-) (-) (-) (-)Innovation intensity - high (+) (+) (-) (+) (-) (+) + (+) (-) - + (+) (+) (+) (+) (+) (+)Innovation intensity - medhigh + (+) (+) + + + (+) + + (+) (-) (-) + (+) (+) + (+) (+) (+)Innovation intensity - med (-) + (-) + (-) (+) (-) (+) + (+)Innovation intensity - medlow (-) (+) - (+) - (+) (+) (-) (-) (-) - - (+) + - (-)Innovation intensity - low (+) (+) (-) (+) (+) + (-) (-) + + + (+) - (+) (-) (+) (+) (+) (-) (-)
Full sample Country group 1 Country group 2 Country group 3 Country group 4
Source: CIS 4 and 2006 data accessed at the safe centre, WIFO calculations. Remark: Only statistical significant results are indicated in the table. A + indicates that the coefficient is positive across the CIS regressions, a (+) indicates that the sign may be insignificant for one or two of the CIS but is positive for the rest. – and (-) are defined in an analogous way. A blank indicates conflicting and insignificant results. Country group 1: Belgium, Denmark, Germany, Finland, France, Iceland, Luxemburg, Norway, Sweden; Country group 2: Czech Republic, Estonia, Hungary, Slovenia, Slovak Republic, Ireland; Country group 3: Spain, Italy, Portugal, Greece; Country group 4: Bulgaria, Lithuania, Latvia, Romania, Cyprus, Malta.
The third type of knowledge barrier we consider is the lack of innovation partners. Table 18 reports the results. The results can be summarized as follows:
Small firms attach higher importance to the lack of innovation partners: Firm size influences the perception of missing innovation partners as barrier to innovation in general negatively. Only for barrier-related non-innovators in country group 1 and 2 and for non-technology innovators in country group 3 and R&D innovators in country group 4 we report a positive
59
coefficient. No clear conclusion can be given on high growth firms. However, as before the sign of R&D innovators in country group 1 is positive in contrast to the sign for R&D innovators in the other country groups that is always negative.
Internationalised firms report higher lack of innovation partners as barriers to innovation: Being internationalised increases the likelihood that the lack of innovation partners is assessed to be an important hampering factor for innovation. However, there are important differences between R&D innovators and other innovators. R&D innovators in country groups 1, 2 and 4 report a negative sign while R&D innovators in country group 3 report a positive sign.
Being part of an enterprise groups lowers the importance of lack of innovation partners as barriers to innovation. Being part of a foreign or a domestic group generally has a negative effect on the perception of the barriers.
Manufacturing firms are more likely to perceive a lack of information on technology as a barrier. R&D intensity has a uniform positive impact across country groups. In general firms located in R&D intense sectors give a higher importance to the lack of innovation partners as barrier to innovation. Firms operating in industries with a cumulative knowledge base (cumulativeness) report lower problems of finding innovation partners.
3.3.5 Discussion and messages Knowledge barriers to innovation are important especially for small firms and for independent firms that innovate. The results are consistent with the idea that knowledge barriers are more relevant for firms that have been internationalised, as these firms recognise the need for technological and market knowledge due to their operation on more competitive markets.
Table 20 summarizes the empirical findings on knowledge barriers. Some of the results are quite symmetric across country groups: SMEs report in general higher knowledge barriers than small firms (negative sign on firm size), high growth firms generally report a lower incidence by knowledge barriers (except for country group 1). Internationalised firms report higher knowledge barriers to innovation, but not firms that are part of an enterprise group (domestic or foreign). Manufacturing firms face higher knowledge barriers than service firms and firms operating in an industry characterized by a cumulative knowledge base report lower knowledge barriers than firms that operate in frontier industries close to academic research (basicness) and R&D intensive industries.
With regard to information on markets European and national policies focussing on the provision of information on foreign markets are in place. With regard to fighting barriers to innovation due to technological barriers and lack of innovation partners, innovation policies that focus on technology transfer and collaboration are central. This is related on the one hand on research infrastructure and on the other hand on the design of innovation policies. The subsidiary principle limits direct program ownership of the EU, as the effectiveness of policy measures depends on the specific innovation system. Thus the focus on policy learning and policy coordination at the level of EU policies is the right approach. However, there are indications that public support for innovation in
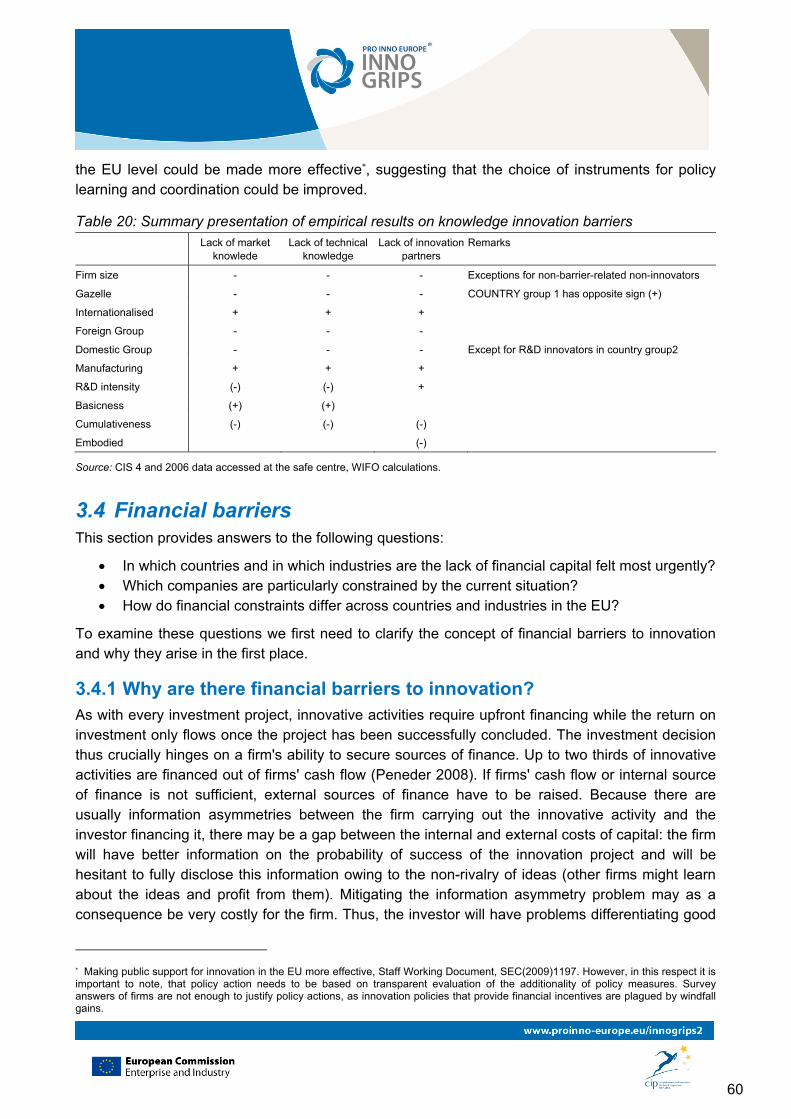
60
the EU level could be made more effective*, suggesting that the choice of instruments for policy learning and coordination could be improved.
Table 20: Summary presentation of empirical results on knowledge innovation barriers Lack of market
knowlede Lack of technical
knowledge Lack of innovation
partners Remarks
Firm size - - - Exceptions for non-barrier-related non-innovators
Gazelle - - - COUNTRY group 1 has opposite sign (+)
Internationalised + + +
Foreign Group - - -
Domestic Group - - - Except for R&D innovators in country group2
Manufacturing + + +
R&D intensity (-) (-) +
Basicness (+) (+)
Cumulativeness (-) (-) (-)
Embodied (-)
Source: CIS 4 and 2006 data accessed at the safe centre, WIFO calculations.
3.4 Financial barriers This section provides answers to the following questions:
In which countries and in which industries are the lack of financial capital felt most urgently? Which companies are particularly constrained by the current situation? How do financial constraints differ across countries and industries in the EU?
To examine these questions we first need to clarify the concept of financial barriers to innovation and why they arise in the first place.
3.4.1 Why are there financial barriers to innovation? As with every investment project, innovative activities require upfront financing while the return on investment only flows once the project has been successfully concluded. The investment decision thus crucially hinges on a firm's ability to secure sources of finance. Up to two thirds of innovative activities are financed out of firms' cash flow (Peneder 2008). If firms' cash flow or internal source of finance is not sufficient, external sources of finance have to be raised. Because there are usually information asymmetries between the firm carrying out the innovative activity and the investor financing it, there may be a gap between the internal and external costs of capital: the firm will have better information on the probability of success of the innovation project and will be hesitant to fully disclose this information owing to the non-rivalry of ideas (other firms might learn about the ideas and profit from them). Mitigating the information asymmetry problem may as a consequence be very costly for the firm. Thus, the investor will have problems differentiating good
* Making public support for innovation in the EU more effective, Staff Working Document, SEC(2009)1197. However, in this respect it is important to note, that policy action needs to be based on transparent evaluation of the additionality of policy measures. Survey answers of firms are not enough to justify policy actions, as innovation policies that provide financial incentives are plagued by windfall gains.
61
projects from bad, leading her to ask for a premium on the rate of return required for the funds provided or simply to deny financing as higher interest rates might attract riskier projects (adverse selection). If a firm cannot obtain all the external finance it wants because either the cost of external finance is too high relative to the cost of internal finance or external financing is simply denied, it is said to be financially constrained (Hall 2002, Stiglitz and Weiss 1981).
Further explanations for the gap between the costs of internal and external finance include moral hazard on the part of the inventor – a special case of information asymmetry – arising from the separation of ownership and management as well as the tax code (Hall 2002). The traditional pecking order of finance follows from the gap between the cost of internal and external finance: internal sources of finance are preferred to external sources, among the latter debt is preferred to equity because equity dilutes the firm owner's ownership share (Myers 2000).
In the following section we examine which characteristics of innovative activities, of firms, industries and countries are likely to lead to a more pervasive perception of financial constraints.
3.4.2 Occurrence of financial constraints
3.4.2.1 Project level
At the level of innovative activities or innovation projects, three related features that are likely to influence the occurrence of financial barriers are noteworthy.
First, innovative activities are risky, meaning that their output is uncertain. The degree of uncertainty varies with the nature of innovation projects. While some are of a more incremental nature, improving existing products or processes, others are aimed at developing entirely new products or processes. Problems of information asymmetry, but also of moral hazard and hence financial constraints will be more acute the higher the degree of novelty of an innovation project (Binz and Czarnitzki 2008).*
Second, when the knowledge produced by innovative activities is difficult to be kept secret, the returns on the investment may not be fully appropriated by the firm carrying out the innovative activity, i.e. the appropriability of returns is low. This problem is mitigated when the knowledge produced can be protected by intellectual property rights. (Haeussler et. al. 2009) find that in the presence of patent applications, venture capital financing occurs earlier. Seeking external finance when the appropriability is low will create problems from both the perspective of the firm and the investor: the firm will be reluctant to share information on the innovation project with an outsider and the investor will be reluctant to fund a project without appropriate quality signals (Hall 2002). Lower appropriability should ceteris paribus lead to higher financial constraints.
Third, as innovative investment is labour intense, a big part of it consists of wages of the employees involved in the innovation project. Their efforts create an intangible asset, the firm's knowledge base, which will be lost when the employees leave unless the knowledge has been
* In general, more fundamental, disruptive or radical innovation projects will be faced with higher internal and external innovation barriers relating to resources, organisational aspects etc. (Assink, 2006; Mirow et al., 2007)
62
codified (Hall 2002). There are thus very little collateral or tangible assets as a by-product of innovative activities which could be used to obtain external financing.
3.4.2.2 Firm level
At the firm level, empirical analysis frequently associates four characteristics of firms with being more prone to financial constraints: size, age, and innovativeness and growth orientation. A fifth one – being part of a corporate group – has already been discussed above in general terms.
In particular small firms may be more prone to financial constraints as a result of indivisibilities in innovation projects – innovative activities often cannot be broken down in continuous small projects (another way of saying this is that the unit costs of innovative activities are higher for SMEs than for large firms, as there are fixed costs) - and less collateral (Canepa and Stoneman 2008; Cosh et al. 2009; Angelini and Generale 2008; Bond et al. 2003; Hyytinen and Toivanen 2005). Young firms often have short track records on which to base financial screening and their cash flow is either low or inexistent. Firms featuring high innovation intensity will have a high share of innovative projects, leading to intangible assets and risky investments, i.e. little collateral and pronounced uncertainty as to the results of the innovative activities.
A combination of these characteristics is likely to be particularly prone to financial constraints. (Cosh et al. 2009) find that small young firms with novel innovations are capital constrained, while older or large firms with novel innovations are not. This is an intuitive result, as an older firm will be able to show its track record to overcome any information asymmetry. Again, problems of small firms with little collateral may be mitigated if they can show some kind of intellectual property right, usually in the form of patents (Samaniego 2009). Of course, public support is also a mitigation option which we will describe more in detail when we discuss policies to alleviate financial constraints.
The high cost of external finance for small, young and innovative companies will lead them to seek external finance only when they have significant growth objectives. Hence, growth oriented companies are naturally more attracted to external nonce (Cosh et al. 2009). However, as fast-growing firms are also mostly successful firms, they may perceive barriers to innovation differently and as a consequence not report financial constraints more often than average firms. Summarising the discussion at the firm level, even if financial constraints in the narrow sense affect only a limited number of firms, this same subset of firms may also disproportionately contribute to overall economic growth (Peneder 2008).
3.4.2.3 Industry level
At the industry level, we observe as for the firm level that the frequency of distribution of innovative projects influences which sectors are more likely to report financial constraints. Rajan and Zingales (1998) group manufacturing sectors by their dependence on external financing which according to Jaumotte and Pain (2005) are also the most R&D-intense. In times of credit rationing, these sectors face more pronounced financial constraints than other sectors, visible in pro-cyclical R&D spending (Aghion et al. 2008). Overall, technology-producing sectors are more prone to financial barriers to innovation than technology-using sectors (Reinstaller and Unterlass 2008). Innovative
63
services firms usually have very little collateral on offer, so they are also more likely to suffer from financial constraints.
3.4.2.4 Country level
At the country level, the level of financial development is the most important determinant of financial constraints. Sectors highly dependent on external finance grow faster in countries which feature a highly developed financial system (Rajan and Zingales 1998) – the cost of external finance is lower in such countries. Financial development can be measured by a series of indicators available in the Levine dataset (Beck et al. 2010), e.g. the sum of stock market capitalisation/GDP and private credit/GDP. Figure 5 shows financial market development across the EU. The UK, Benelux and Scandinavian countries as well as Spain feature the most developed markets, with the big continental economies Germany, Italy and France following behind. The Eastern European countries are generally least developed. Financial constraints bite particularly in countries with less developed financial markets – emerging market countries -, where they not only hold back firms' growth (Angelini and Generale 2008) but also prevent domestic firms from reaping the benefits from trade liberalisation in terms of productivity gains (Gorodnichenko and Schnitzer 2010): their innovative activities are constrained by the availability of external finance. Financial constraints in emerging markets may force firms to choose between innovation and internationalisation, which shows up in the joint incidence of export and innovation activities decreasing in the severity of financial constraints.
The occurrence of financial constraints may further vary with the type of the financial system. The literature usually distinguishes between bank- and market-based systems. Bank-based systems may provide external finance more readily to firms in sectors featuring a technological regime of cumulativeness and incremental innovation, while market-based systems lower the cost of external finance for firms engaged in more fundamental, science-based innovation with little collateral (Hall and Soskice 2001; Müller and Zimmermann 2009). E.g., this holds true for the biotech sector, which is R&D intense but has a low investment ratio (for machinery, equipment etc), while a sector flourishing in bank-based systems is the energy sector. Bank-based systems are better at mitigating information asymmetries (for established firms) due to the closer, more long-term relationship between the bank and the firm, while market-based systems are better at aligning the interests of the managers and the owners or financiers of a firm, reducing the moral hazard problem.
Financial constraints also vary by the source of external funds. Cosh et al. (2009) name banks, venture capital funds, factoring and leasing firms, suppliers/customers as well as private individuals as providers of external finance. Most of the literature deals with the difference between banks and venture capitalists or business angels in providing external finance. Loans by banks usually require some kind of collateral in the form of tangible assets (machinery, equipment, etc.). The more innovative activity focuses on creating new knowledge intangible assets rather than on development activities with tangible components, the more difficult it will be to find collateral for a loan. The information asymmetries between the firm carrying out such an innovative project and the bank providing the finance are not easily resolved in the standard risk-adjustment models of banks.
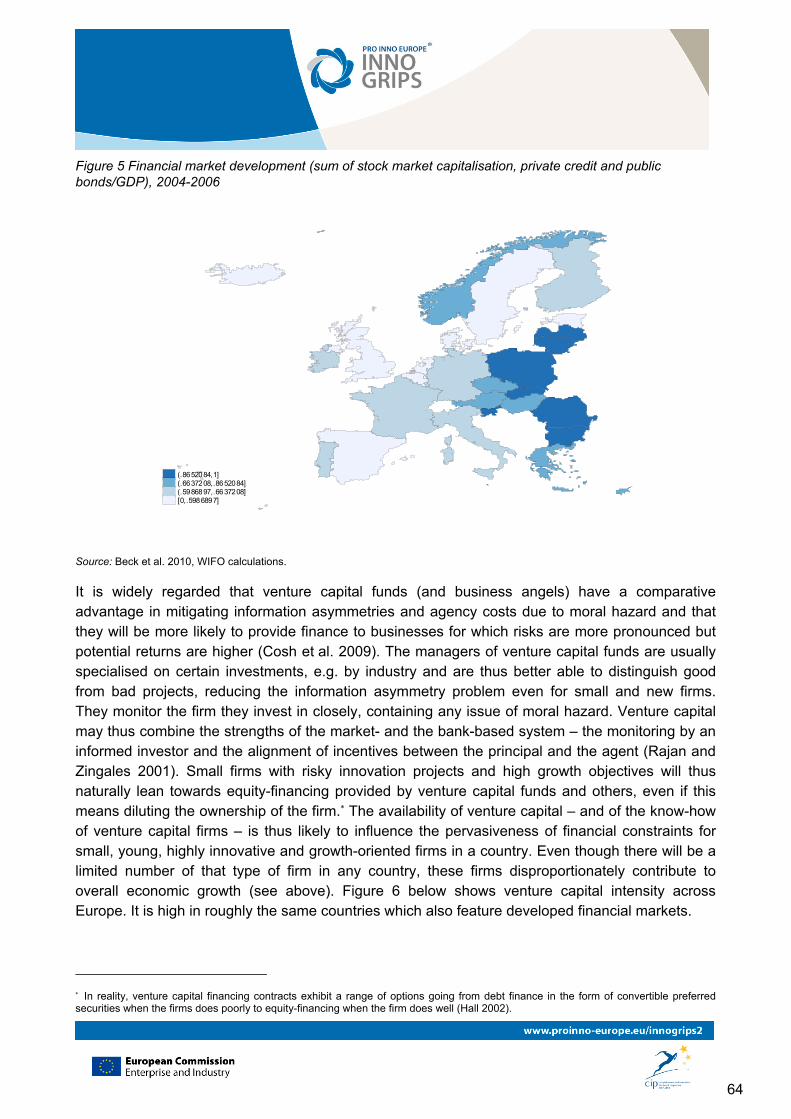
64
Figure 5 Financial market development (sum of stock market capitalisation, private credit and public bonds/GDP), 2004-2006
(.8652084,1](.6637208,.8652084](.5986897,.6637208][0,.5986897]
Source: Beck et al. 2010, WIFO calculations.
It is widely regarded that venture capital funds (and business angels) have a comparative advantage in mitigating information asymmetries and agency costs due to moral hazard and that they will be more likely to provide finance to businesses for which risks are more pronounced but potential returns are higher (Cosh et al. 2009). The managers of venture capital funds are usually specialised on certain investments, e.g. by industry and are thus better able to distinguish good from bad projects, reducing the information asymmetry problem even for small and new firms. They monitor the firm they invest in closely, containing any issue of moral hazard. Venture capital may thus combine the strengths of the market- and the bank-based system – the monitoring by an informed investor and the alignment of incentives between the principal and the agent (Rajan and Zingales 2001). Small firms with risky innovation projects and high growth objectives will thus naturally lean towards equity-financing provided by venture capital funds and others, even if this means diluting the ownership of the firm.* The availability of venture capital – and of the know-how of venture capital firms – is thus likely to influence the pervasiveness of financial constraints for small, young, highly innovative and growth-oriented firms in a country. Even though there will be a limited number of that type of firm in any country, these firms disproportionately contribute to overall economic growth (see above). Figure 6 below shows venture capital intensity across Europe. It is high in roughly the same countries which also feature developed financial markets.
* In reality, venture capital financing contracts exhibit a range of options going from debt finance in the form of convertible preferred securities when the firms does poorly to equity-financing when the firm does well (Hall 2002).
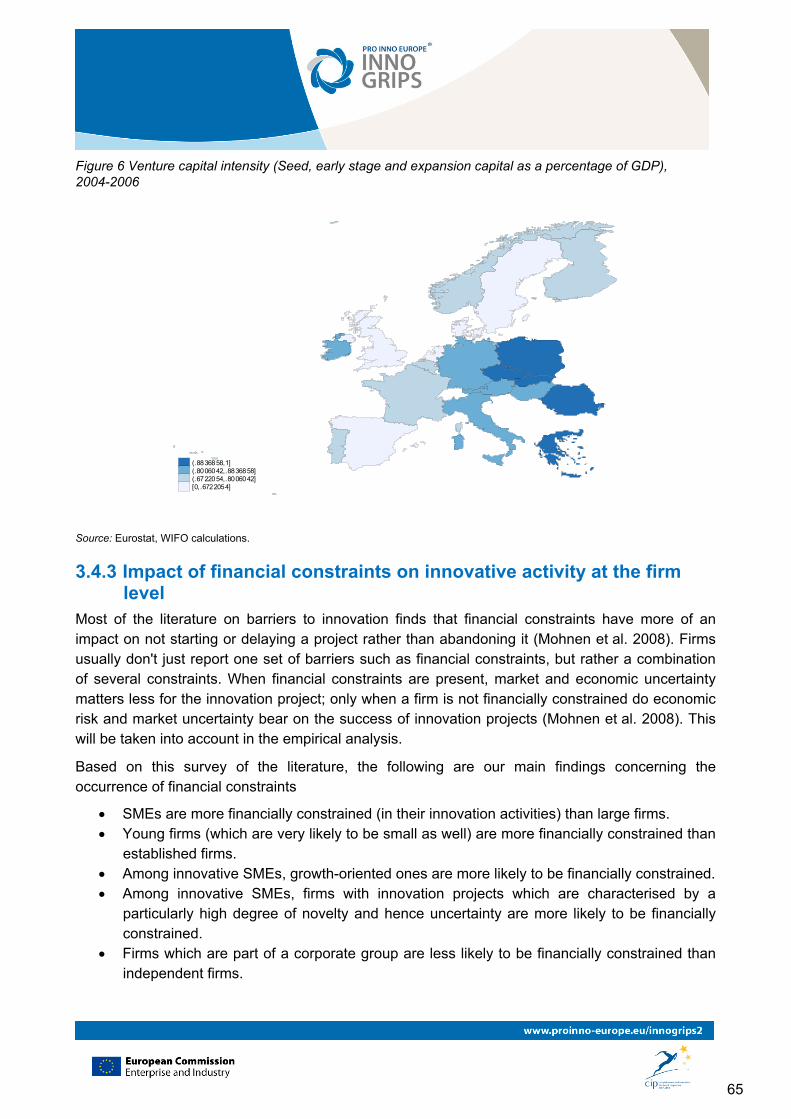
65
Figure 6 Venture capital intensity (Seed, early stage and expansion capital as a percentage of GDP), 2004-2006
(.8836858,1](.8006042,.8836858](.6722054,.8006042][0,.6722054]
Source: Eurostat, WIFO calculations.
3.4.3 Impact of financial constraints on innovative activity at the firm level
Most of the literature on barriers to innovation finds that financial constraints have more of an impact on not starting or delaying a project rather than abandoning it (Mohnen et al. 2008). Firms usually don't just report one set of barriers such as financial constraints, but rather a combination of several constraints. When financial constraints are present, market and economic uncertainty matters less for the innovation project; only when a firm is not financially constrained do economic risk and market uncertainty bear on the success of innovation projects (Mohnen et al. 2008). This will be taken into account in the empirical analysis.
Based on this survey of the literature, the following are our main findings concerning the occurrence of financial constraints
SMEs are more financially constrained (in their innovation activities) than large firms. Young firms (which are very likely to be small as well) are more financially constrained than
established firms. Among innovative SMEs, growth-oriented ones are more likely to be financially constrained. Among innovative SMEs, firms with innovation projects which are characterised by a
particularly high degree of novelty and hence uncertainty are more likely to be financially constrained.
Firms which are part of a corporate group are less likely to be financially constrained than independent firms.
66
Sectors – and hence any firms therein - which are heavily dependent on external finance are more financially constrained in countries featuring a less developed financial system.
SMEs which in principle would be attractive investment targets for VC funds (highly innovative and growth oriented) are more financially constrained in countries with a low intensity of venture capital than the same type of SMEs active in countries with higher venture capital intensities.
Young, innovative and small firms which can show some form of IPR – in particular, a patent – for the result of their innovation activity are less likely to be affected by financial constraints.
Firms with less developed financial markets are likely to be financially constrained. Firms in emerging countries struggle to pursue innovation and internationalisation activities
at the same time.
3.4.4 Empirical analysis The basic set-up has been described in chapters 3.2.2. and 3.2.3. The descriptive statistics in Table 16 have shown that innovative firms in countries at the frontier (country group 1) are generally less likely to report financial constraints than innovative firms in countries not as close to the frontier (country groups 2-4). Moreover, innovative firms are more likely to be internationalised (Table 15). To identify financial barriers to innovation, we use the variable hfin* in CIS2003 and hfout† in CIS4 as well as in CIS2006, following Canepa and Stoneman (2008).
Here we report the results of our econometric analysis with the aim to uncover systematic differences between different types of innovative and non-innovative firms across country groups. Table 21 below shows the results for the financial barriers to innovation from different innovation surveys. The top row shows the name of the different groups of firms for which the regressions have been run (full sample of all countries, R&D-innovators of country group 1, etc.). The rows below indicate the impact of characteristics of firms on the probability of reporting financial constraints. A plus or minus sign refer to a significant positive or negative association. E.g., a plus sign at the intersection of the firm group "R&D-innovators within country group 1" with the characteristic "internationalised" means that internationalised firms in country group 1 engaged in R&D activities are more likely to report financial constraints than non-internationalised R&D-innovators. We integrated the information from the different innovation surveys by showing a coefficient in case all the different surveys showed the same result, a coefficient in brackets in case one survey showed a significant result while the others did not and an empty cell in case there was no significant or conflicting results. In addition to all the standard variables described above, we have included country-level information on the development of financial markets
* "If your enterprise experienced any hampering factors during the period 1998-2000, please grade the importance of the relevant factors": "Lack of appropriate sources of finance". † "During the three years 2002 to 2004, how important were the following factors for hampering your innovation activities or projects or influencing a decision not to innovate?": "Lack of finance from sources outside your enterprise"
67
(measures as described above) and on the intensity of venture capital (seed and early stage capital as a% of GDP).*
Characteristics of firms which increase the probability of perceiving financial barriers to innovation are the following:
Being part of a foreign corporate group: Among the most robust results confirming our literature survey is the importance of being part of a foreign corporate group. Being part of a domestic corporate group also influences the perception of barriers negatively, in particular in country group 3 which may be due to the small average firm size in these countries (Pagano and Schivardi 2003).
Firm size influences the perception of barriers negatively, in particular in country group 3, but also in country group 1, 2 and 4. Firm size matters nearly always for R&D innovators and non-tech innovators.
Cumulativeness of the innovation process: when a firm gets its information for the innovation process mainly from internal rather than external sources, it is less likely to report financial constraints. Cumulativeness may be interpreted as a proxy of the degree of novelty of an innovation, or for the extent of knowledge creation involved – when it is high, a firm produces innovations mainly drawing from its internal knowledge base, which given a trend towards specialisation in research and science-based technological change indicates a rather low level of new knowledge creation. As described above, riskier innovations are more difficult to be financed externally.
Financial development and venture capital intensity: according to the literature described above, venture capital intensity plays a role for R&D innovators in advanced countries, while financial market development more broadly lowers the perception of financial barriers to innovation.
Characteristics of firms which increase the probability of perceiving financial barriers to innovation are the following:
Being internationalised and innovative at the same time. This confirms the results from Gorodnichenko and Schnitzer (2010). Running international and innovative activities at the same time is difficult.
R&D intensity, in accordance with the literature described above. Manufacturing firms, with the exception of R&D innovators. The latter may be well targeted
by public funding schemes. The separate Table 22 below the main regression output Table 21 shows that services sectors – retail, tourism, banking, insurance, real estate etc. are significantly less likely to perceive financial barriers to innovation with the exception of the software sector 72 and sector 73 research services, which are more likely to perceive financial barriers.
Table 22 below shows the perception of financial barriers in services sectors, as discussed above.
* Hence, for every firm in a country this information will be the same. This may give rise to correlations of the error term within a country. We correct for that by using cluster-robust standard errors.
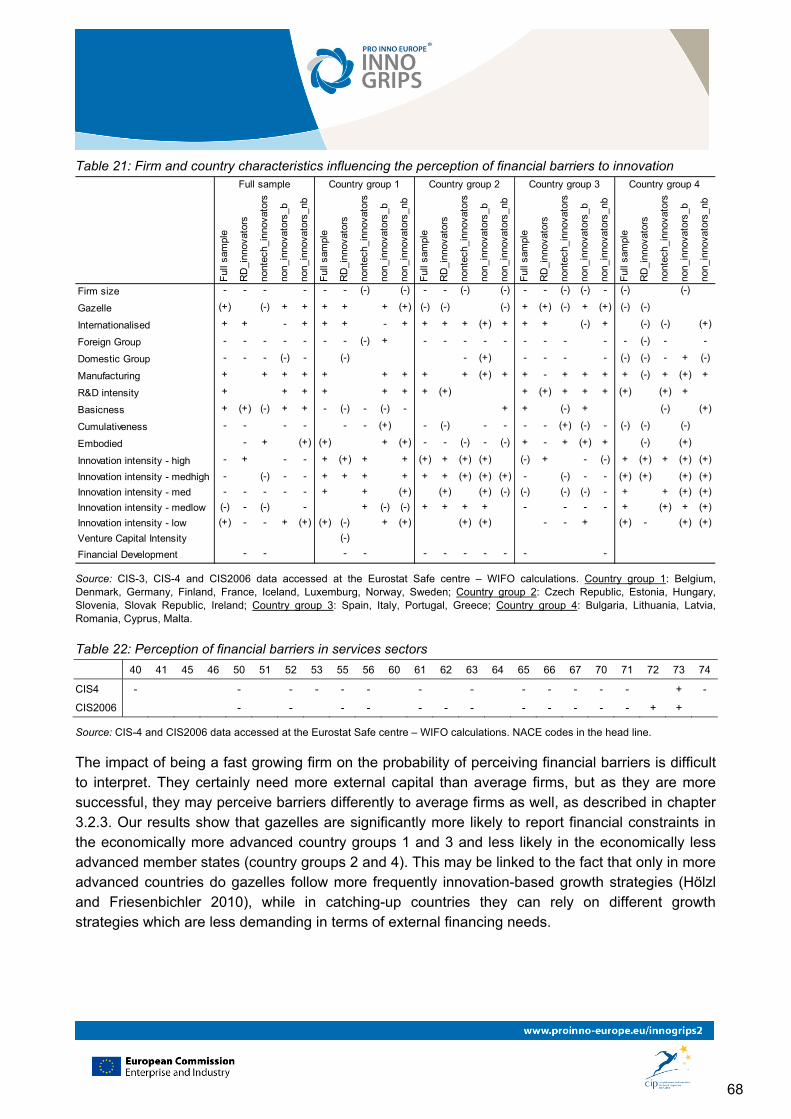
68
Table 21: Firm and country characteristics influencing the perception of financial barriers to innovation
Ful
l sam
ple
RD
_inn
ovat
ors
nont
ech_
inno
vato
rs
non_
inno
vato
rs_b
non_
inno
vato
rs_n
b
Ful
l sam
ple
RD
_inn
ovat
ors
nont
ech_
inno
vato
rs
non_
inno
vato
rs_b
non_
inno
vato
rs_n
b
Ful
l sam
ple
RD
_inn
ovat
ors
nont
ech_
inno
vato
rs
non_
inno
vato
rs_b
non_
inno
vato
rs_n
b
Ful
l sam
ple
RD
_inn
ovat
ors
nont
ech_
inno
vato
rs
non_
inno
vato
rs_b
non_
inno
vato
rs_n
b
Ful
l sam
ple
RD
_inn
ovat
ors
nont
ech_
inno
vato
rs
non_
inno
vato
rs_b
non_
inno
vato
rs_n
b
Firm size - - - - - - (-) (-) - - (-) (-) - - (-) (-) - (-) (-)
Gazelle (+) (-) + + + + + (+) (-) (-) (-) + (+) (-) + (+) (-) (-)
Internationalised + + - + + + - + + + + (+) + + + (-) + (-) (-) (+)
Foreign Group - - - - - - - (-) + - - - - - - - - - - (-) - -
Domestic Group - - - (-) - (-) - (+) - - - - (-) (-) - + (-)
Manufacturing + + + + + + + + + (+) + + - + + + + (-) + (+) +
R&D intensity + + + + + + + (+) + (+) + + + (+) (+) +
Basicness + (+) (-) + + - (-) - (-) - + + (-) + (-) (+)
Cumulativeness - - - - - - (+) - (-) - - - - (+) (-) - (-) (-) (-)
Embodied - + (+) (+) + (+) - - (-) - (-) + - + (+) + (-) (+)
Innovation intensity - high - + - - + (+) + + (+) + (+) (+) (-) + - (-) + (+) + (+) (+)
Innovation intensity - medhigh - (-) - - + + + + + + (+) (+) (+) - (-) - - (+) (+) (+) (+)
Innovation intensity - med - - - - - + + (+) (+) (+) (-) (-) (-) (-) - + + (+) (+)
Innovation intensity - medlow (-) - (-) - + (-) (-) + + + + - - - - + (+) + (+)
Innovation intensity - low (+) - - + (+) (+) (-) + (+) (+) (+) - - + (+) - (+) (+)
Venture Capital Intensity (-)
Financial Development - - - - - - - - - - -
Full sample Country group 1 Country group 2 Country group 3 Country group 4
Source: CIS-3, CIS-4 and CIS2006 data accessed at the Eurostat Safe centre – WIFO calculations. Country group 1: Belgium, Denmark, Germany, Finland, France, Iceland, Luxemburg, Norway, Sweden; Country group 2: Czech Republic, Estonia, Hungary, Slovenia, Slovak Republic, Ireland; Country group 3: Spain, Italy, Portugal, Greece; Country group 4: Bulgaria, Lithuania, Latvia, Romania, Cyprus, Malta.
Table 22: Perception of financial barriers in services sectors
40 41 45 46 50 51 52 53 55 56 60 61 62 63 64 65 66 67 70 71 72 73 74
CIS4 - - - - - - - - - - - - - + -
CIS2006 - - - - - - - - - - - - + +
Source: CIS-4 and CIS2006 data accessed at the Eurostat Safe centre – WIFO calculations. NACE codes in the head line.
The impact of being a fast growing firm on the probability of perceiving financial barriers is difficult to interpret. They certainly need more external capital than average firms, but as they are more successful, they may perceive barriers differently to average firms as well, as described in chapter 3.2.3. Our results show that gazelles are significantly more likely to report financial constraints in the economically more advanced country groups 1 and 3 and less likely in the economically less advanced member states (country groups 2 and 4). This may be linked to the fact that only in more advanced countries do gazelles follow more frequently innovation-based growth strategies (Hölzl and Friesenbichler 2010), while in catching-up countries they can rely on different growth strategies which are less demanding in terms of external financing needs.
69
A direct comparison with the US is difficult, as no comparable survey data exist. However, there is an alternative way to test for financial constraints to innovative or R&D activity.* An R&D investment equation can be estimated to test for the excess sensitivity to cash flow shocks. Studies using this approach usually find that US firms may experience financial constraints to R&D activity. Hall (1992) reports a large positive elasticity between R&D and cash flow in a sample of U.S. manufacturing firms, Himmelberg and Petersen (1994) find an economically large and statistically significant relationship between R&D investment and internal finance looking at a panel of 179 U.S. small firms in high-tech industries. Comparing the US to continental European economies, the US firms often shows more sensitivity of R&D to cash flow than continental economies. This greater sensitivity may arise because they are financially constrained or because firms react more quickly given the discipline in market-based financial systems (Hall 2002, see above). The literature using the R&D investment equation cannot discriminate between these two cases. However, it seems safe to say that US firms face the same basic problems as European firms in raising external finance for innovative activities, as discussed above (in terms of lack of collateral, uncertainty, etc.). In comparison with Europe, the US features much more developed financial markets and much more active and vibrant venture capital activity. This is one of the reasons for the superior post-entry growth performance of US firms, also related to the "born global" phenomenon (see chapter 4). In addition, the US has a well developed public support system to address financial problems of young, highly innovative firms: the Small Business Innovation Research Act obliges all the federal agencies to reserve 2.5% of their budget for small, innovative firms.
3.5 Skill shortages as barriers to innovation This chapter provides answers to the following questions:
In which countries and in which industries are shortages of highly skilled workers felt most urgently?
Which companies are particularly constrained by the current situation? How do the constraints of innovation differ across countries and industries in the EU?
To examine these questions we first need to clarify the concept of skill constraints to innovation and why they arise in the first place.
3.5.1 Why are there skill constraints? Skilled human resources are a precondition for undertaking innovative activities. Skill constraints, or skill gaps, shortages etc., refer to deficiencies in the availability of trained employees or skilled vacancies that take some time to fill (Green et al. 1998). From surveys it also emerges that employers usually think about difficulties with recruiting new employees rather than about skill shortages in their current workforce when asked about skill constraints (Green et al. 1998, Causer and Jones 1993).
* The following is based on Hall (2002).

70
To understand why there are skill constraints we first need to understand which skills are required for innovative activities. Although R&D activities certainly need a workforce that is trained in math, science, engineering, the range of skills necessary for successful innovation is much wider. Innovation processes are strongly heterogeneous. For example, they have a strong sector-specific and technology-specific dimension. The specific skills that are employed as inputs in the innovation generating process will depend as well on the nature of the innovation in question – whether it is (technological or non-technological) product, process or organisational innovation. Technological product innovation not only requires advanced technical and scientific skills but also business skills, e.g. in the form of market research to assess the market potential of the innovation. Process and organisational innovation need in addition to technical skills knowledge of organisational and workflow design, relationship management as well as communication (Hölzl and Bonin 2010). Thus many of the relevant competencies are related to "soft skills". A fundamental skill for all kinds of innovation is the ability to update one's skills as technology and business methods move forward. The observation that innovation is increasingly performed in collaboration between several firms and other organisations implies that innovation requires greater managerial skills that help to form and to sustain collaborative arrangements. The importance of a broad understanding of skills pertinent to innovation is confirmed by survey results. When asked about skill constraints, employers will not only mention technical skills but also soft skills (Green et al. 1998, Causer and Jones 1993). However, the discussion of recent years has certainly focused on tertiary graduates from science and engineering. In fact, shortages of science, engineering and technology have been reported for several European countries and for the USA (Machin and McNally 2007). The education and the training system produce skills required for innovative activities. We examine each in turn to see why they may fail to produce the skills required for innovative activities.
The education system may fail to provide either the quantity or quality of skilled human resources necessary for innovative activities. Problems of quantity may sometimes simply follow from the fact that in many countries educational institutions – at the secondary or at the tertiary level - are government financed. Decisions on quantity may as a result not follow labour market needs but public budget constraints. Problems of quantity at the tertiary level may be related to quality features of the educational layers below tertiary education. E.g., countries with early streaming of children into different school types according to ability usually feature low participation in tertiary education.
Educational supply is also characterised by relative inelasticity, following demographic trends and structural school reforms, but not the business cycle which influences firms' labour demand (see below) (Booth et al. 1996). Skill mismatch is the main concern when it comes to quality issues of educational systems. Skill mismatch occurs when the choice of education made by individuals does not correspond to the needs of the labour market. In both higher and vocational education there seem to be poor signals between skills employers demand and skills people acquire. The problems are manifold and even if overcome, the problem of the lag of time between the choice of education and the entry into the labour market will always remain: skills in high demand in a particular year may only lead to a higher supply of skills around four years later, when that skill may not be demanded anymore – innovation creates skill mismatch simply by constantly changing

71
the required skills (Hölzl and Bonin 2010). When technological change accelerates, we would thus expect to see more skill mismatch and more skill constraints (see below).
Education cannot reflect the high idiosyncrasy of skills needed at the firm level and must be complemented by training. The free market generally does not provide sufficient incentives for training for both firms and employees (Booth et al. 1996). Because most training is usually only useful for a limited number of firms, firms are imperfect competitors for labour, meaning that they can exert some market power in the wage setting process and workers' wages will be less than their marginal products. Hence, workers cannot appropriate all the returns from their training, leading to suboptimal incentives to train on the part of workers. When workers are mobile between firms, the potential benefits from training can also accrue to other firms, leading to distorted incentives to provide training on the part of firms (the poaching externality). It will be difficult to impossible to set up a cost sharing scheme between the firm and the workers which provides sufficient incentives for training. This basic problem is exacerbated by further market failures, such as credit constraints for employees - human capital cannot be used as collateral against loan default. This concerns in particular the long-term unemployed who are often not in a position to secure financing for training (Acemoglu 1996).
The skills provided by the training system also depend on the education system: in general, it is people with higher or better educational attainment who are more likely to receive additional training (Lynch 1992, Booth 1991). Higher education raises workers' absorptive capacities – the ability to learn and adapt. This implies that retraining during working life is easier for individuals with good general education. As a consequence, there are important interrelationships between the education and the training system. Any problems should thus not be seen in isolation but with a view to the entire education and training system.
3.5.2 General aspects of the incidence of skill constraints Which factors determine the incidence of skills constraints? We will first talk about some general features influencing skill constraints before we turn to characteristics of firms, industries and countries likely to lead to the occurrence of skill constraints.
3.5.2.1 Skill-biased technological change
The most important trend affecting skill constraints is skill-biased technological change, i.e., change that is "biased" by favouring workers with higher levels of education and skill over those with lower levels. This bias occurs because the introduction of a new technology will increase the demand for workers whose skills and knowledge complement that technology (Siegel 1999). The twentieth century and the most recent years have been characterised by pervasive skill-biased technical change even in developing countries because the rapid increase in the supply of skilled workers has induced the development of skill-complementary technologies (Berman et al. 1998, Acemoglu 2002). Skill constraints have not risen dramatically as the supply of skilled workers – of tertiary graduates in S&T in particular – has grown along with demands – or even determined
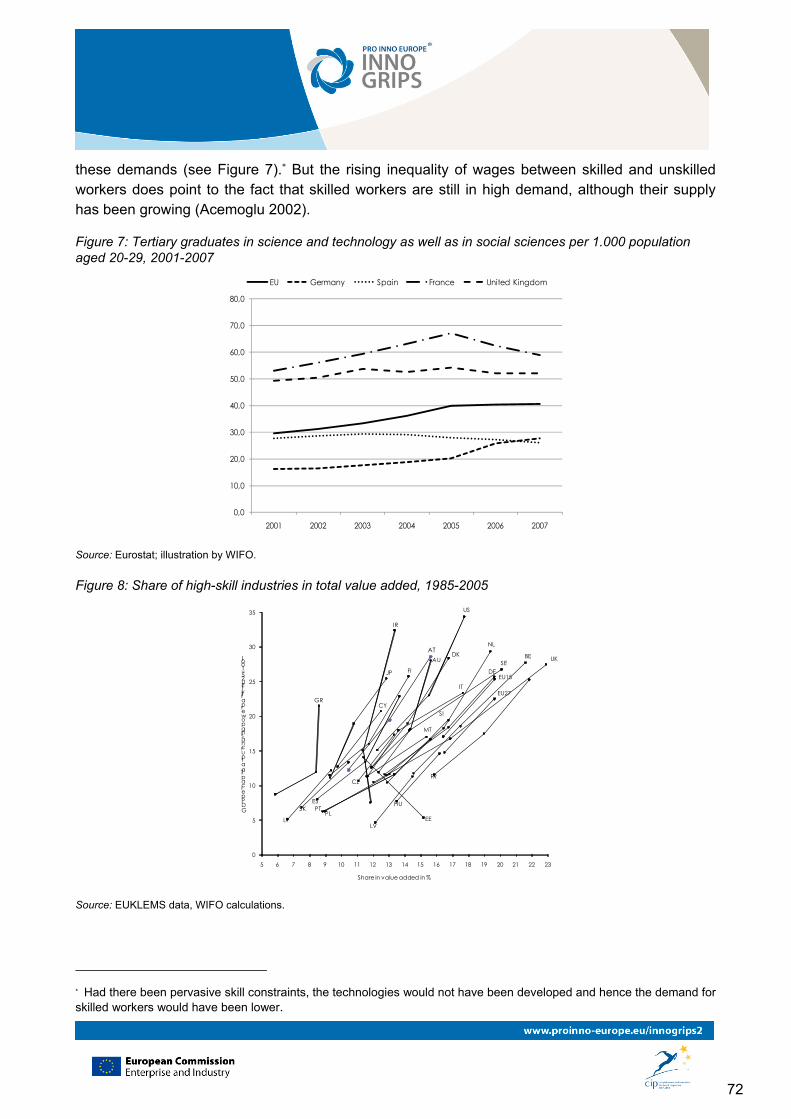
72
these demands (see Figure 7).* But the rising inequality of wages between skilled and unskilled workers does point to the fact that skilled workers are still in high demand, although their supply has been growing (Acemoglu 2002).
Figure 7: Tertiary graduates in science and technology as well as in social sciences per 1.000 population aged 20-29, 2001-2007
0,0
10,0
20,0
30,0
40,0
50,0
60,0
70,0
80,0
2001 2002 2003 2004 2005 2006 2007
EU Germany Spain France United Kingdom
Source: Eurostat; illustration by WIFO.
Figure 8: Share of high-skill industries in total value added, 1985-2005
BEDK
DE
GR
ES
FR
IR
IT
NLAT
PT
FISE
UK
JP
US
CY
CZ
EE
HU
LTLV
MT
PL
SI
SK
AU
EU15
EU27
0
5
10
15
20
25
30
35
5 6 7 8 9 10 11 12 13 14 15 16 17 18 19 20 21 22 23
GDP per capita at purchasing power parity (EU25=100)
Share in value added in %
Source: EUKLEMS data, WIFO calculations.
* Had there been pervasive skill constraints, the technologies would not have been developed and hence the demand for skilled workers would have been lower.
73
Many indicators show this development. The share of innovative activities in the total value added activities of firms has been rising, as evidenced by increasing shares of researchers in the labour force (OECD 2009). In addition the data also show that there is an ongoing structural change towards education intensive industries (Peneder 2007, Figure 8). Skill-biased technological change is likely to continue in the future. High- and medium-level skilled occupations are expected to continue growing over the 2010-2020 decade, while the expansion demand (the number of job openings for newly created jobs) for low skilled labour is expected to decline (Hölzl and Bonin 2010).
3.5.2.2 Pro-cyclical skill constraints
Another universalistic feature of skill shortages related to innovative activities is that they are pro-cyclical. The relative inelasticity of the education and training system clashes with the volatility of the business cycle – as the upswing sets in, many firms want to recruit new staff not only to increase production capacity but also to increase innovative activities as the uncertainty linked with innovative outcomes means that they are sensitive to demand fluctuations (Comin and Gertler 2006). This may be less so for pure R&D activities, as high adjustment costs induce firms to smooth R&D spending (Hall 2002). However, R&D is still clearly pro-cyclical (Barlevy 2007). Also management literature reports that although R&D personnel would be expected to be treated as a strategic resource somehow shielded from market volatility, competitive pressures and uncertainty about future demand leads to cyclical variations in the R&D workforce (Causer and Jones 1993).
3.5.2.3 Skill constraints and ageing
Skill constraints may rise due to demographic ageing, when fewer people leave the education system but firms which mainly serve international – growing – markets continue to expand their activities; even when firms also grow less but the share of innovative activities continues to rise, then demographic ageing will put limits on the availability of skilled resources.
3.5.2.4 Endogeneity of skill constraints
To some extent, occurrence of skill constraints may be endogenous because firms may adapt to a country's institutional framework and choose a product mix reflecting the available skill mix. This argument rests on the complementarity of skills and innovation, similar to skill-biased technological change (Redding 1996). Hence, when there is a low supply of skills, firms might specialise in products which require a limited amount of skills (the low-skill low-quality-trap) and vice versa. Complementarities between skills and innovation may also be related to the type of quality of skills – e.g. countries with abundant provision of industry- or firm-specific skills may foster industrial specialisation in sectors which feature a technological regime of cumulative knowledge while abundant provision of general science skills may foster sectors which rely on science-based innovation (Hall and Soskice 2001) (see below the discussion on vocational vs. general skills and on the impact of labour market regulation on the skill mismatch).
74
3.5.3 Occurrence of skills constraints at the firm, industry and country level
This section reviews the evidence on skill constraints' occurrence.
3.5.3.1 Firm level
At the firm level, small innovative firms are usually put at a disadvantage because they are less able to bear overhead and transaction costs (Storey 1994, Haskel and Martin 2001). SMEs cannot afford to send their employees to long off-the-job formal training programmes because highly skilled people involved in innovative activities are needed to finish projects which will generate cash-flow. Large firms are much more able to offer structured, longer-term trainee programmes to new university graduates which is also why many tertiary graduates tend to choose a large firm as their first employer (Westhead et al. 2001, Causer and Jones 1993). Moreover, SMEs are often seen as less prestigious and as paying less than large firms. Larger firms are also more likely to be able to wait longer until a suitable candidate comes up while SMEs have less flexibility in carrying vacancies and will usually settle down with a not so ideal candidate (Causer and Jones 1993).
Recruitment processes involve transaction costs which put SMEs at a disadvantage (Westhead et al. 2001): The recruitment of graduates can be expensive and risky for SMEs. They lack the structures and resources to plan and to make the best use of graduate skills, and to make them operational quickly. SMEs also lack time for building links with tertiary education institutions. What time they have for external networking needs to be devoted to customers and suppliers, on whom survival depends. SMEs have also less time to analyse skill problems, and whether they are best addressed by new recruitment, by a placement student (internship), or by upgrading the skills of existing workers. SMEs need new employees to make a real contribution to productivity quickly. All of this means that innovative SMEs have more difficulties attracting skilled workers coming out of the education system and are also more limited in their training possibilities. SMEs may thus be disproportionately affected by skill-biased technological change – even if overall the supply of skilled workers rises.
An additional factor increasing the likelihood of experiencing skill constraints is the growth orientation of a firm independently of the business cycle (Green et al. 1998, Kölling 2002). There is a lot of heterogeneity at the firm level. Even in the current crisis, 20% of firms expanded exports, a quarter of them by more than 20% (Navaretti et al. 2010). The opposite holds true as well - even in upturns, some firms suffer from shrinking markets or stiff competition and shed highly skilled employees (Causer and Jones 1993). Of course, growth orientation and innovativeness are not independent of each other in frontier countries (Hölzl and Friesenbichler 2010). Innovative firms are more likely to expand they employment than non-innovative firms (e.g. Pianta 2005, Spezia and Vivarelli 2002).
According to some studies, one of the most important determinants of skills constraints is the local skill base. More shortages are suffered by firms in areas of low unemployment and low educational attainment (Haskel and Martin 1993). This means that firms in either peripheral or economically successful regions will be more affected by skill shortages. However, it is likely that the thickness of local labour markets even if featuring low unemployment will reduce skill constraints in relation
75
to thin local labour markets in peripheral regions: An industrial concentration supports a thick local labour market, especially for specialised skills, so that employees find it easier to find employers and vice versa (Krugman 1998). As with financial constraints, small, innovative and growth-oriented firms are most likely to be affected by skill constraints. In addition, firms in peripheral regions with a thin local skills base are likely to be hit by skill constraints.
3.5.3.2 Industry level
At the industry level, Crespi and Patel (2008) find that skills acquired in formal education are more important in industries characterised by a more radical innovation mode and high R&D budgets than for industries characterised by a more incremental mode of innovation and low and medium R&D budgets. Likewise, Barras (1986, 1990) claims that innovation patterns in services are special. Compared with innovation in manufacturing, innovation in services tends to be less reliant on R&D and scientific and technical skills. Overall differences between shortages in industry are likely to be persistent since occupational mobility is low. Different technological regimes (cf. Peneder 2010) are also likely to give rise to different patterns of skills constraints, even if sectoral specialisation is influenced by the institutional framework of a country.*
Following Pavitt's (1984) taxonomy of industrial innovation, Hölzl and Bonin (2010) distinguish five patterns of innovation and their skill requirements. The first pattern is that of science-based firms. This pattern is usually found in pharmaceuticals, biotechnology and electronics, where scientific knowledge is developed and applied to new and technology-based markets. Innovation activities take place primarily in corporate R&D laboratories.
The second pattern is that of specialist supplier firms. This pattern is usually found in instrumentation and specialist computer software. The firms are generally very small and produce specialised equipment mainly for science-based and scale-intensive firms. The competitive advantage of these firms is their ability to work closely with lead users. The key skills are therefore the ability to engage in interaction learning and to provide specific solutions for their customers. Skills required are highly practical skills in programming and engineering that relate to problem solving.
The third pattern is that of scale intensive firms. The car industry is a primary example for this pattern. The volume of production is the key to these firms. By spreading the costs of R&D over a large output the unit costs of R&D may be low even if the aggregate level of R&D can be high. Innovation typically occurs at different levels. The first level is general product development which requires high engineering skills. The second level is product design which is about tailoring general products to specific markets. This requires market knowledge and design capabilities. The third level is the organisation of the production process that requires engineering skills but also increasingly managerial skills as such firms increasingly moved away from in-house production towards 'system integration'.
The fourth pattern is information-intensive firms. This pattern is characteristic for certain service sectors such as finance, retailing, publishing and travel. The main technology used is information
* Sectoral specialisation occurs because of the skills provided by the national education and training system.
76
technology, where some of the software is developed in-house. The key technology skill is the ability to develop software, to integrate information technologies into systems such as logistics. The main purpose of innovation is to design and operate systems of information processing.
The fifth pattern is supplier-dominated firms. These firms are primarily users of technology. The firms operate usually in market with relatively simple products. This pattern is the dominant pattern in the economy. Here entrepreneurial skills for spotting market trends and the ability of the workforce to implement and use new technologies are essential.
For the coming years, projections indicate that while the general trend towards up-skilling continues, it may be different across sectors (Hölzl and Bonin 2010). Some industries are expected to follow this general trend more intensely, while for other sectors especially in the service sector this tendency will be much more limited. The strong demand for soft skills in all qualification levels confirms the importance of general, rather than very specific skills.
3.5.3.3 Country level
At the country level, there are different hypotheses as to which may be more affected by skill constraints.
3.5.3.4 General vs. vocational education systems
There are two related hypotheses as to how the orientation of an education system matters for supplying the skills needed for innovative activities. The first one contends that higher education becomes more important for innovation and hence economic growth as a country approaches the technological frontier (Aghion et al. 2005, Aghion and Howitt 2006, Vandenbussche et al. 2006). There is some empirical evidence in the papers cited; Hölzl and Friesenbichler (2008) find that firms consider the availability of qualified personnel to be more important as a hampering factor to innovation in countries closer to the technological frontier than in catch up countries. Countries at the frontier with a relatively low supply of tertiary graduates might thus be more skill constrained than countries at the frontier featuring an ample supply of tertiary graduates.
A related approach maintains that with the increasing pace of technical change and the rise of new general purpose technologies such as information technology, general education becomes more important (Krueger and Kumar 2004). General education enables workers to operate new production technologies. Firms in economies with a high supply of general skills thus have greater flexibility in technology choice, which generates higher rates of economic growth. This argument does not rest on the distance to the frontier. Systems which focus on vocational education usually feature lower shares of higher education, so that both approaches seem to stress the importance of education systems featuring high participation in tertiary, general education. This is quite a change from the 80s or even the beginning of the 90s, when the apprenticeship systems of Germany and Austria were the envy of other countries.
Figure 9 and Figure 10 below show the share of tertiary graduates in the working age population and the share of science and technology graduates per 1.000 of the population aged 20 to 29.High shares are light blue, low shares are dark blue.
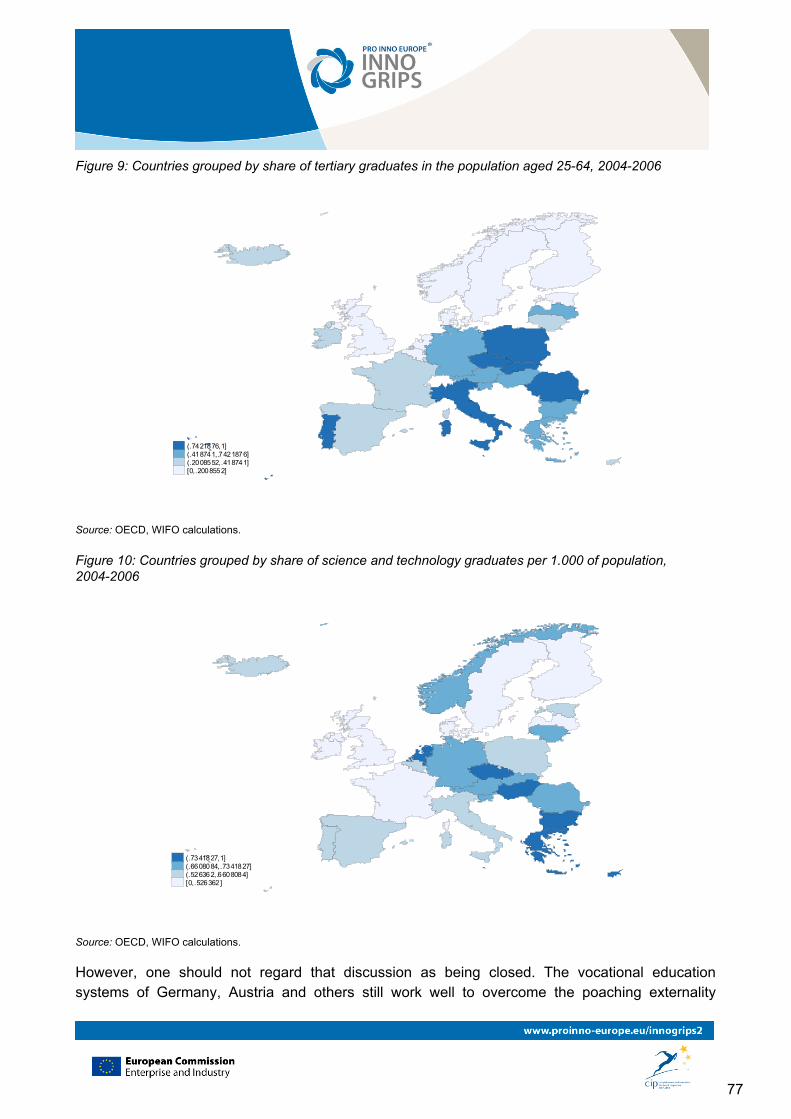
77
Figure 9: Countries grouped by share of tertiary graduates in the population aged 25-64, 2004-2006
(.7421876,1](.418741,.7421876](.2008552,.418741][0,.2008552]
Source: OECD, WIFO calculations.
Figure 10: Countries grouped by share of science and technology graduates per 1.000 of population, 2004-2006
(.7341827,1](.6608084,.7341827](.526362,.6608084][0,.526362]
Source: OECD, WIFO calculations.
However, one should not regard that discussion as being closed. The vocational education systems of Germany, Austria and others still work well to overcome the poaching externality

78
mentioned above (for a description of how apprenticeship systems deal with the poaching externality, see Booth and Satchell 1996). It is possible that technological change will henceforth advance more in specific technologies rather than in general purpose technologies – e.g. in environmental technology, favouring countries which find it easier to foster the supply of industry- and firm-specific skills. At the time being however, vocationally oriented systems such as Germany (see Kölling 2002) and also Austria (Janger 2009) definitely face shortages of tertiary trained workers in science and technology.
Skill mismatch
There is substantial variation in skill mismatch rates across the EU Member States. In particular, the incidence of mismatch in the sense of workers not employed in jobs suited to their education and training is larger in the south of Europe (Italy, Portugal, Greece) than in the rest of EU15 and in the New Member States (Hölzl and Bonin 2010). The differences between countries, which are also rather stable over time, suggest that national labour market institutions and education systems may have an impact on the different types of skill mismatches and hence on the incidence of skill constraints.
A labour market institution which reduces matching efficiency in the labour market is employment protection legislation. Imposed firing costs reduce worker flows between jobs. Thus one would expect more skill mismatches on labour markets with more stringent employment protection legislation. According to Wasmer et al. (2007), the portion of workers who are not over-qualified in their job and also well matched to their education and training is systematically lower in countries with less strict employment protection legislation. However, employment protection legislation does provide incentives for workers to acquire industry- and firm-specific skills. In countries with well working vocational systems, the negative impact of EPL may be reduced, e.g. in Germany. In countries with very low EPL, skill mismatch may be lower, but there may be undersupply of industry- and firms-specific skills, increasing skill constraints for firms in need for such skills. Countries with rigid EPL and without strong vocational training systems such as Spain will however feature stronger skill constraints.
Dual labour markets are unequivocally bad for the supply of skills. Temporary workers receive much less training, since neither workers nor employers see any future in their relationship. This loss of human capital formation is likely to become more acute in the years to come. Recoveries from financial crises are usually associated with a large use of temporary contracts, since uncertainty and liquidity constraints discourage firms from making long-term commitments. The experience of Japan and Sweden in the 1990s is quite revealing. Upon leaving the recession, these two countries experienced a strong rise in the share of temporary contracts, which also meant less skill acquisition at the workplace for new generations of workers (Bentolila, Boeri, and Cahuc 2010).
Skills shortages may also reflect imperfections in the public education system that does not provide the kinds of education and training in demand on the labour market. One piece of evidence for this is that the responsiveness of schooling choices to differential returns to education by field of study appears smaller in countries where fees charged for higher education are lower (Machin and McNally 2007).

79
3.5.4 Impact of skill constraints at the firm level Usually firm level evidence shows the complementary nature of skills and innovation. Without skills, firm can't fully reap the benefits from their innovations if they manage to innovate at all (Leiponen 2005). A shortage of skilled personnel most frequently leads to seriously slowing down an innovative project (Mohnen et al. 2008). Prolonged skill constraints may lead to substitution of skilled workers by unskilled workers, decreasing productivity (Haskel and Martin 2001).
Green et al. (2007) analyse micro data from the CIS 4 for the UK. Their results show strong links between skills and innovation both at the sectoral and at the firm level. In particular, they provide evidence that a higher share of workers with tertiary education is strongly correlated with both organisational and technological innovation. Weaker evidence is obtained for innovation propensity and expenditures devoted to the training of employees. In addition, Green at al. (2007) note a positive association of the propensity to innovate and reporting "lack of qualified personnel" as barrier to innovation. This suggests that a lack of skilled labour is a hampering factor that influences primarily the decision to further innovation and commercialisation, but less the decision of a firm to become innovative altogether.
Based on this survey of the literature, the following are our main findings concerning the occurrence of skill constraints
Small, young, innovative and growth-oriented firms are more likely to be affected by skill constraints.
Firms in peripheral regions with a thin local skills base are more likely to be hit by skill constraints.
Firms in countries producing a comparatively low share of tertiary graduates (particularly in science and technology, but also overall) and which are close to the frontier are likely to be constrained by skill shortages.
Firms in countries with strong dual labour markets and hence a high share of workers on temporary contracts are likely to experience skill constraints.
Firms in countries with rigid employment protection and low vocational training are more likely to report skill constraints.
Firms facing education systems which are unresponsive to labour market needs (skill mismatch) are more likely to report skill barriers to innovation.
3.5.5 Empirical analysis The basic set-up has been described in chapters 3.2.2. and 3.2.3. The descriptive statistics in Table 16 have shown that innovative firms in countries at the frontier (country group 1) are generally more likely to report skill constraints than innovative firms in countries not as close to the frontier (country groups 2-4). Here we report the results of our econometric analysis with the aim to uncover systematic differences between different types of innovative and non-innovative firms across country groups. Table 23 below shows the results for the skill barriers to innovation from three different innovation surveys. In addition to all the standard variables described above, we have included country-level information on tertiary graduates in science and technology, overall

80
tertiary education as well as the share of students enrolled in upper secondary education pursuing vocational education. All data are taken from the OECD.
Characteristics of firms which lower the probability of perceiving skill barriers to innovation are the following:
Firm size, similar to the case of financial barriers. The case studies in Reinstaller and Unterlass (2008) also show that usually large firms have fewer difficulties in attracting talented employees.
Being part of a foreign corporate group; Being part of a domestic corporate group, especially in country group 1 and 3; The amount of tertiary graduates in S&T influences the perception of barriers in country
group 1 and 2 (the technology-producing and –using countries). Overall tertiary education matters in particular for the richer country groups 1 and 3.
Characteristics of firms which exert a significant positive influence on the probability of perceiving skill barriers to innovation are the following:
Being innovative and internationalised at the same time (controlling for firm size, being part of a corporate group etc.).
Being R&D intense; Being a manufacturing firm; Being a fast growing innovative or barrier-related non-innovative firm in country group 1.
This is in line with Hölzl and Friesenbichler (2010) who find that mainly in frontier countries are gazelles associated with higher innovative activities and hence need a more highly skilled workforce.
The amount of students in vocational education has ambiguous effects. In country group 1 it has a positive effect on the perception of barriers while in country group 3 it has a negative effect. This may reflect the finding described above that firms in countries with rigid employment protection and low vocational training are more likely to report skill constraints. In country group 1 the positive effect may reflect the need for more general education as described above.
With the available data, we cannot examine the effects of firms being based in peripheral regions, or of firms active in countries with strong dual labour markets or in countries with high levels of skill mismatch.
It is difficult to compare the European situation concerning skill barriers to the US as no similar surveys exist. However, in terms of tertiary science and technology graduates, it is well known that foreign highly-skilled immigrants are now taking a substantial share of Masters' and PhD's degrees in science and technology without crowding out native students: according to the 2000 census, immigrants accounted for 24% and 47% of US scientists and engineers with bachelor and doctorate qualifications (Chellaraj et al. 2008). Without this influx of foreign students, the US would not be able to perform the same amount of R&D. Many foreign highly-skilled immigrants come to the US to profit from the excellent graduate schools at the American research universities such as MIT, Caltech, Berkeley, etc.
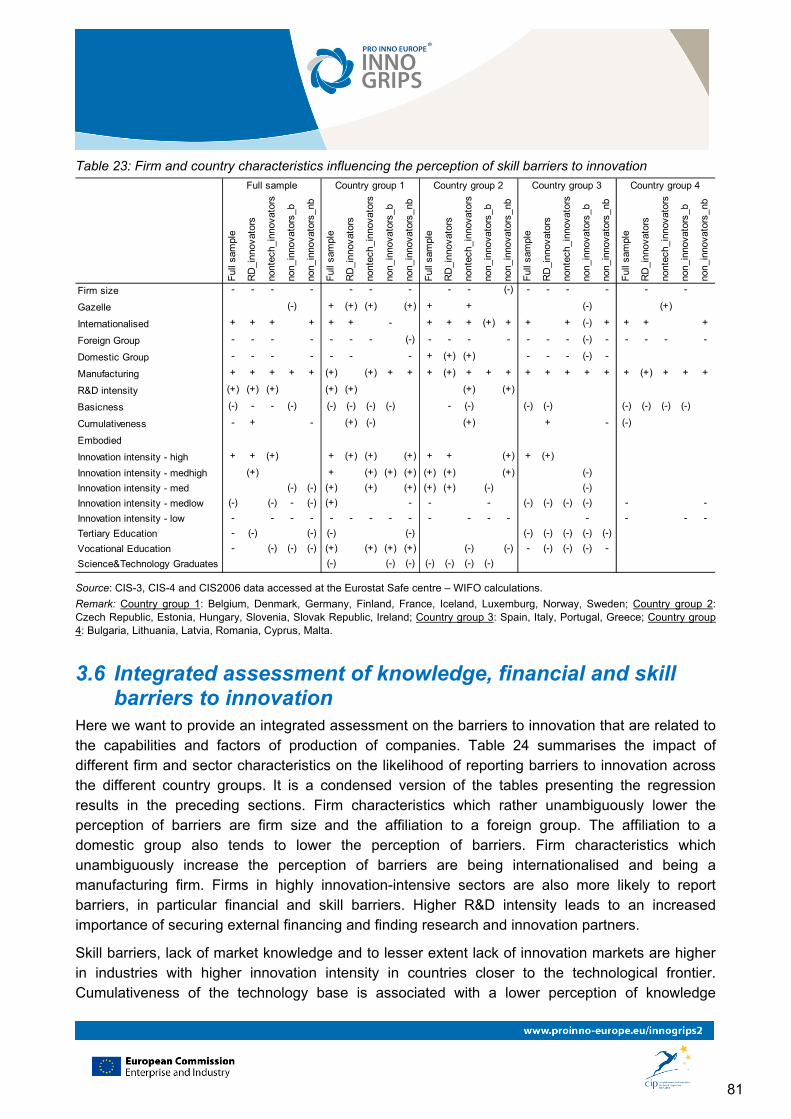
81
Table 23: Firm and country characteristics influencing the perception of skill barriers to innovation
Ful
l sam
ple
RD
_inn
ovat
ors
nont
ech_
inno
vato
rs
non_
inno
vato
rs_b
non_
inno
vato
rs_n
b
Ful
l sam
ple
RD
_inn
ovat
ors
nont
ech_
inno
vato
rs
non_
inno
vato
rs_b
non_
inno
vato
rs_n
b
Ful
l sam
ple
RD
_inn
ovat
ors
nont
ech_
inno
vato
rs
non_
inno
vato
rs_b
non_
inno
vato
rs_n
b
Ful
l sam
ple
RD
_inn
ovat
ors
nont
ech_
inno
vato
rs
non_
inno
vato
rs_b
non_
inno
vato
rs_n
b
Ful
l sam
ple
RD
_inn
ovat
ors
nont
ech_
inno
vato
rs
non_
inno
vato
rs_b
non_
inno
vato
rs_n
b
Firm size - - - - - - - - - (-) - - - - - -
Gazelle (-) + (+) (+) (+) + + (-) (+)
Internationalised + + + + + + - + + + (+) + + + (-) + + + +
Foreign Group - - - - - - - (-) - - - - - - - (-) - - - - -
Domestic Group - - - - - - - + (+) (+) - - - (-) -
Manufacturing + + + + + (+) (+) + + + (+) + + + + + + + + + (+) + + +
R&D intensity (+) (+) (+) (+) (+) (+) (+)
Basicness (-) - - (-) (-) (-) (-) (-) - (-) (-) (-) (-) (-) (-) (-)
Cumulativeness - + - (+) (-) (+) + - (-)
Embodied
Innovation intensity - high + + (+) + (+) (+) (+) + + (+) + (+)
Innovation intensity - medhigh (+) + (+) (+) (+) (+) (+) (+) (-)
Innovation intensity - med (-) (-) (+) (+) (+) (+) (+) (-) (-)
Innovation intensity - medlow (-) (-) - (-) (+) - - - (-) (-) (-) (-) - -
Innovation intensity - low - - - - - - - - - - - - - - - - -
Tertiary Education - (-) (-) (-) (-) (-) (-) (-) (-) (-)
Vocational Education - (-) (-) (-) (+) (+) (+) (+) (-) (-) - (-) (-) (-) -
Science&Technology Graduates (-) (-) (-) (-) (-) (-) (-)
Full sample Country group 1 Country group 2 Country group 3 Country group 4
Source: CIS-3, CIS-4 and CIS2006 data accessed at the Eurostat Safe centre – WIFO calculations.
Remark: Country group 1: Belgium, Denmark, Germany, Finland, France, Iceland, Luxemburg, Norway, Sweden; Country group 2: Czech Republic, Estonia, Hungary, Slovenia, Slovak Republic, Ireland; Country group 3: Spain, Italy, Portugal, Greece; Country group 4: Bulgaria, Lithuania, Latvia, Romania, Cyprus, Malta.
3.6 Integrated assessment of knowledge, financial and skill barriers to innovation
Here we want to provide an integrated assessment on the barriers to innovation that are related to the capabilities and factors of production of companies. Table 24 summarises the impact of different firm and sector characteristics on the likelihood of reporting barriers to innovation across the different country groups. It is a condensed version of the tables presenting the regression results in the preceding sections. Firm characteristics which rather unambiguously lower the perception of barriers are firm size and the affiliation to a foreign group. The affiliation to a domestic group also tends to lower the perception of barriers. Firm characteristics which unambiguously increase the perception of barriers are being internationalised and being a manufacturing firm. Firms in highly innovation-intensive sectors are also more likely to report barriers, in particular financial and skill barriers. Higher R&D intensity leads to an increased importance of securing external financing and finding research and innovation partners.
Skill barriers, lack of market knowledge and to lesser extent lack of innovation markets are higher in industries with higher innovation intensity in countries closer to the technological frontier. Cumulativeness of the technology base is associated with a lower perception of knowledge
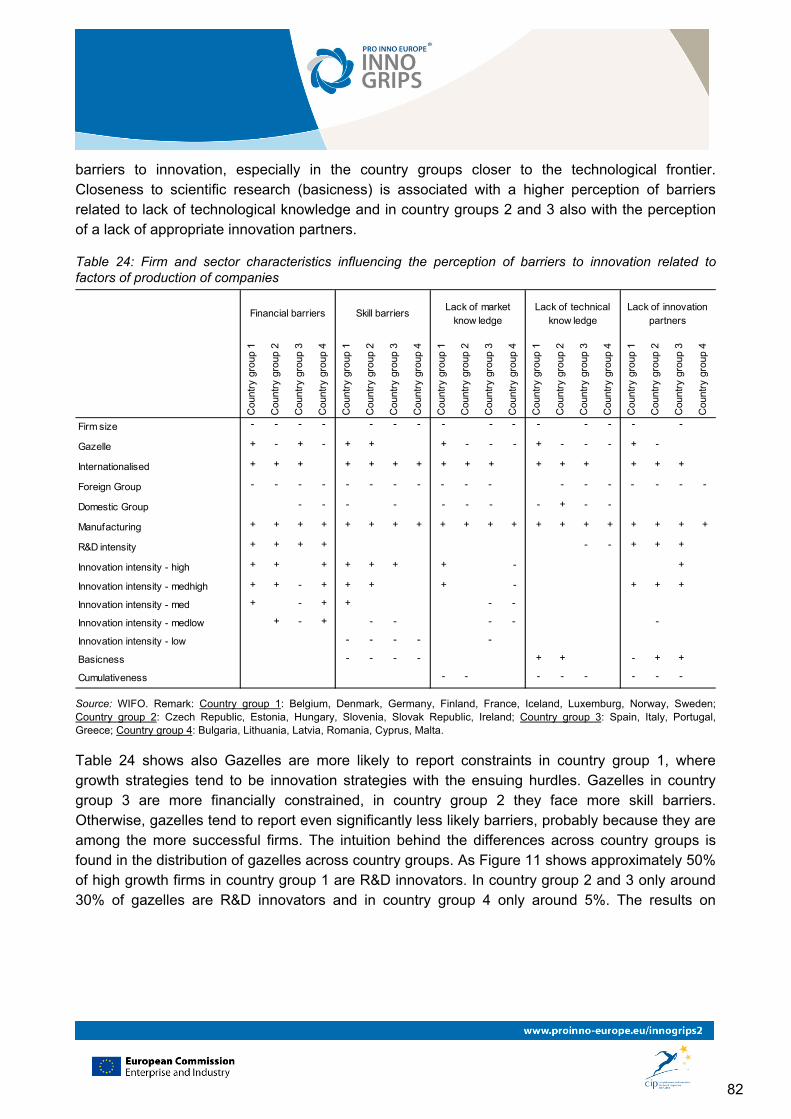
82
barriers to innovation, especially in the country groups closer to the technological frontier. Closeness to scientific research (basicness) is associated with a higher perception of barriers related to lack of technological knowledge and in country groups 2 and 3 also with the perception of a lack of appropriate innovation partners.
Table 24: Firm and sector characteristics influencing the perception of barriers to innovation related to factors of production of companies
Cou
ntry
gro
up 1
Cou
ntry
gro
up 2
Cou
ntry
gro
up 3
Cou
ntry
gro
up 4
Cou
ntry
gro
up 1
Cou
ntry
gro
up 2
Cou
ntry
gro
up 3
Cou
ntry
gro
up 4
Cou
ntry
gro
up 1
Cou
ntry
gro
up 2
Cou
ntry
gro
up 3
Cou
ntry
gro
up 4
Cou
ntry
gro
up 1
Cou
ntry
gro
up 2
Cou
ntry
gro
up 3
Cou
ntry
gro
up 4
Cou
ntry
gro
up 1
Cou
ntry
gro
up 2
Cou
ntry
gro
up 3
Cou
ntry
gro
up 4
Firm size - - - - - - - - - - - - - - -
Gazelle + - + - + + + - - - + - - - + -
Internationalised + + + + + + + + + + + + + + + +
Foreign Group - - - - - - - - - - - - - - - - - -
Domestic Group - - - - - - - - + - -
Manufacturing + + + + + + + + + + + + + + + + + + + +
R&D intensity + + + + - - + + +
Innovation intensity - high + + + + + + + - +
Innovation intensity - medhigh + + - + + + + - + + +
Innovation intensity - med + - + + - -
Innovation intensity - medlow + - + - - - - -
Innovation intensity - low - - - - -
Basicness - - - - + + - + +
Cumulativeness - - - - - - - -
Financial barriers Skill barriersLack of market
know ledgeLack of technical
know ledgeLack of innovation
partners
Source: WIFO. Remark: Country group 1: Belgium, Denmark, Germany, Finland, France, Iceland, Luxemburg, Norway, Sweden; Country group 2: Czech Republic, Estonia, Hungary, Slovenia, Slovak Republic, Ireland; Country group 3: Spain, Italy, Portugal, Greece; Country group 4: Bulgaria, Lithuania, Latvia, Romania, Cyprus, Malta.
Table 24 shows also Gazelles are more likely to report constraints in country group 1, where growth strategies tend to be innovation strategies with the ensuing hurdles. Gazelles in country group 3 are more financially constrained, in country group 2 they face more skill barriers. Otherwise, gazelles tend to report even significantly less likely barriers, probably because they are among the more successful firms. The intuition behind the differences across country groups is found in the distribution of gazelles across country groups. As Figure 11 shows approximately 50% of high growth firms in country group 1 are R&D innovators. In country group 2 and 3 only around 30% of gazelles are R&D innovators and in country group 4 only around 5%. The results on
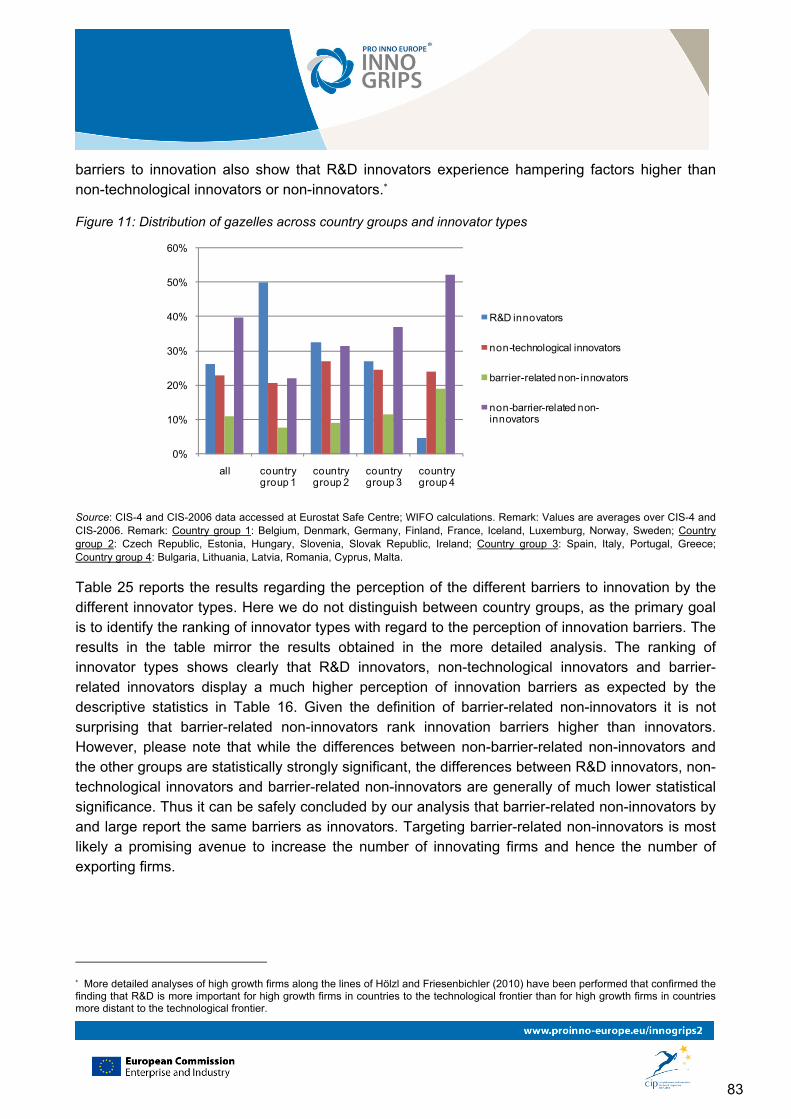
83
barriers to innovation also show that R&D innovators experience hampering factors higher than non-technological innovators or non-innovators.*
Figure 11: Distribution of gazelles across country groups and innovator types
0%
10%
20%
30%
40%
50%
60%
all country group 1
country group 2
country group 3
country group 4
R&D innovators
non-technological innovators
barrier-related non- innovators
non-barrier-related non-innovators
Source: CIS-4 and CIS-2006 data accessed at Eurostat Safe Centre; WIFO calculations. Remark: Values are averages over CIS-4 and CIS-2006. Remark: Country group 1: Belgium, Denmark, Germany, Finland, France, Iceland, Luxemburg, Norway, Sweden; Country group 2: Czech Republic, Estonia, Hungary, Slovenia, Slovak Republic, Ireland; Country group 3: Spain, Italy, Portugal, Greece; Country group 4: Bulgaria, Lithuania, Latvia, Romania, Cyprus, Malta.
Table 25 reports the results regarding the perception of the different barriers to innovation by the different innovator types. Here we do not distinguish between country groups, as the primary goal is to identify the ranking of innovator types with regard to the perception of innovation barriers. The results in the table mirror the results obtained in the more detailed analysis. The ranking of innovator types shows clearly that R&D innovators, non-technological innovators and barrier-related innovators display a much higher perception of innovation barriers as expected by the descriptive statistics in Table 16. Given the definition of barrier-related non-innovators it is not surprising that barrier-related non-innovators rank innovation barriers higher than innovators. However, please note that while the differences between non-barrier-related non-innovators and the other groups are statistically strongly significant, the differences between R&D innovators, non-technological innovators and barrier-related non-innovators are generally of much lower statistical significance. Thus it can be safely concluded by our analysis that barrier-related non-innovators by and large report the same barriers as innovators. Targeting barrier-related non-innovators is most likely a promising avenue to increase the number of innovating firms and hence the number of exporting firms.
* More detailed analyses of high growth firms along the lines of Hölzl and Friesenbichler (2010) have been performed that confirmed the finding that R&D is more important for high growth firms in countries to the technological frontier than for high growth firms in countries more distant to the technological frontier.
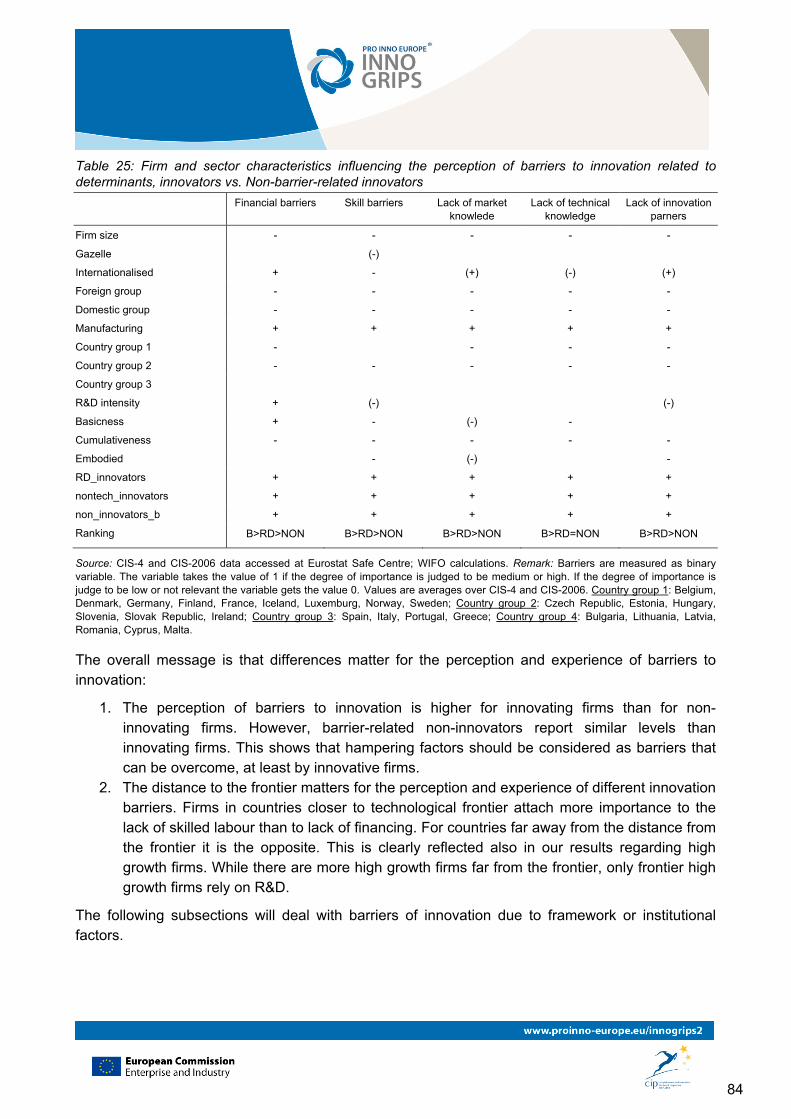
84
Table 25: Firm and sector characteristics influencing the perception of barriers to innovation related to determinants, innovators vs. Non-barrier-related innovators
Financial barriers Skill barriers Lack of market knowlede
Lack of technical knowledge
Lack of innovation parners
Firm size - - - - -
Gazelle (-)
Internationalised + - (+) (-) (+)
Foreign group - - - - -
Domestic group - - - - -
Manufacturing + + + + +
Country group 1 - - - -
Country group 2 - - - - -
Country group 3
R&D intensity + (-) (-)
Basicness + - (-) -
Cumulativeness - - - - -
Embodied - (-) -
RD_innovators + + + + +
nontech_innovators + + + + +
non_innovators_b + + + + +
Ranking B>RD>NON B>RD>NON B>RD>NON B>RD=NON B>RD>NON
Source: CIS-4 and CIS-2006 data accessed at Eurostat Safe Centre; WIFO calculations. Remark: Barriers are measured as binary variable. The variable takes the value of 1 if the degree of importance is judged to be medium or high. If the degree of importance is judge to be low or not relevant the variable gets the value 0. Values are averages over CIS-4 and CIS-2006. Country group 1: Belgium, Denmark, Germany, Finland, France, Iceland, Luxemburg, Norway, Sweden; Country group 2: Czech Republic, Estonia, Hungary, Slovenia, Slovak Republic, Ireland; Country group 3: Spain, Italy, Portugal, Greece; Country group 4: Bulgaria, Lithuania, Latvia, Romania, Cyprus, Malta.
The overall message is that differences matter for the perception and experience of barriers to innovation:
1. The perception of barriers to innovation is higher for innovating firms than for non-innovating firms. However, barrier-related non-innovators report similar levels than innovating firms. This shows that hampering factors should be considered as barriers that can be overcome, at least by innovative firms.
2. The distance to the frontier matters for the perception and experience of different innovation barriers. Firms in countries closer to technological frontier attach more importance to the lack of skilled labour than to lack of financing. For countries far away from the distance from the frontier it is the opposite. This is clearly reflected also in our results regarding high growth firms. While there are more high growth firms far from the frontier, only frontier high growth firms rely on R&D.
The following subsections will deal with barriers of innovation due to framework or institutional factors.
85
3.7 The role of IPR regimes for the innovative activities of firms This section provides information on the following questions:
What is needed to modernise the European IPR regime? In particular, what policy adaptations would be necessary to foster further business development in the online environment?
Which companies are particularly constrained by the current situation?
3.7.1 What does IPR do? As described in section 2.4 on financial constraints, intellectual property rights (IPR) are a way to alleviate the problems associated with investment into the creation of new knowledge which arise from the non-rivalry in consumption of knowledge. Other firms could imitate or copy the knowledge at low cost and hence easily destroy the competitive advantage gained by the creation of new knowledge.
IPR increases the appropriability of returns to innovations, i.e. profits for the firm which introduced the innovations. As a consequence, IPR influences the incentives to innovate – when a firm can make more money out of given investment costs, this investment is more likely to be undertaken. A sound IPR regime constricts imitation and hence has an impact on expected revenues from innovation acting as an incentive to engage into more innovation (Reinstaller and Unterlass 2010). Results from a survey among businesses showed that the "majority was convinced that registered IPR ensured financial stability and higher revenues, thus motivating firms to pursue more innovation" (IPR Expert Group 2007, p.11).
The incentive effect of IPR varies by sector. In some sectors, it is very strong because without formal intellectual property protection investment in innovation would be barely profitable (e.g., automotive, pharmaceuticals, ICT); in other sectors, it is small as other strategies dominate to protect the knowledge created by investment in innovation (e.g. textiles, energy).
IPR comes in various forms, among them trademarks, copyrights and patents. "Informal" IPR strategies include secrecy, exploiting first-mover advantages or embodied technology. For an exhaustive list see IPR Expert Group (2007, p. 23). Secrecy is an often recommended alternative to patenting as it allows customers to reverse engineering and replication (Boldrin and Levine 2002), allows the working of competitive markets (Encaoua et al. 2006) and may lengthen the first mover advantage (Encaoua and Lefouili 2006). If property rights are low, the value of disclosure is offset by the increased risk of imitation, which brings firms to protect large inventions through secrecy (Anton and Yao 2004; Encaoua and Lefouili 2006). On the other hand, patents favour the diffusion of knowledge and therefore the replication of patented inventions is less costly than inventions that are kept secret. Secrecy and other informal IPR protection are definitely a "cheap" way for SMEs to protect their innovations. Among SMEs, informal IPR protection methods clearly dominate patents as an IPR strategy, even if formal IPR are becoming more important (see below and IPR Expert Group 2007). However, as our policy focus is the European patent system, we will limit our discussion to the formal IPR system and to problems with IPR enforcement in third countries.

86
3.7.2 Affordability of patent protection and lacking IPR enforcement as potential barriers to innovation for SMEs
The formal IPR system, in particular the patent system, is sometimes criticised for impeding innovation. E.g., patents may work against technological progress at the country or world level when they hold back the diffusion of knowledge as a result of patent rights which are too strict or which grant monopoly rights for the underlying innovation for too long a time, actually reducing incentives to innovate for the patent holder. Moreover, there is a discussion on the recent surge in patents and concerns about patent quality (see, e.g. Jaffe and Lerner 2004). The design of patent systems is as a consequence subject to frequent changes with the objectives to avoid the patent system working as a barrier against innovation.
Here we focus, however, on features of the IPR system which may work as a barrier to innovation in particular for SMEs. From a policy perspective, there are two main issues, the affordability of IPR and IPR enforcement in potential export destinations. Protection of intellectual property becomes more important for innovation and firm growth the closer the gap to the technological frontier, as firms will increasingly rely on innovation-based strategies to gain competitive advantage over their rivals.
3.7.2.1 Affordability of IPR as a barrier to innovation
At the firm level, the benefit of increased appropriability of returns has to be weighed against the cost of obtaining intellectual property protection, both in terms of the direct costs associated with applying for a patent and of making public the knowledge protected by a patent.
In principle, SMEs require an IPR strategy just like large firms to fully reap the fruits of their innovative investment. A proper IP department would add considerable fixed cost to SMEs cost base. As a result, SMEs often rely on external consultants and government support. At the same time, IPR is becoming more important as a consequence of several developments: the rise of innovation-based strategies in economies close to the frontier, the trend towards more open innovation which leads to more collaborative innovation and the ever more complex nature of innovation which leads to specialisation and to increased licensing of technologies in which the firm is not specialised (IPR Expert Group 2007).
Compared to the IPR systems in the United States or in Japan the European system (and here especially the patent system) is less attractive for innovators. According to many authors (e.g. Harhoff 2006; Mejer and Pottelsberghe 2008; van Pottelsberghe de la Potterie and François 2009; Pottelsberghe 2009), comparatively high costs and the complexity of the regime present specific burdens for SMEs, both in terms of patent filing and also in terms of patent enforcement. German SMEs have reported that large firms may use the threat of patent litigation to keep SMEs out of the market (IPR Expert Group 2007).
What makes a patent in Europe up to ten times (depending on the geographical scope of protection) more expensive compared to the US or Japan is not the higher quality of its examination process but rather translation costs. Once granted by the EPO the patent has to be translated, validated, put in force and renewed in each national patent system. Moreover, each patent system has its own legislation and its own renewal fees structure. National patent offices
87
grant patents independently of the EPO with the result of heterogeneous quality standards and the possibility of parallel litigation in various countries. At the EU level there is very little if any coordination of patent policies with other policies. There is also no representative of the European patent system at international negotiations.
Several recommendations have been discussed in the last 40 years that should improve and harmonise patenting in Europe. The London Agreement on translation requirements was ratified by 15 out of 34 member states in May 2008. It reduces translation costs dramatically. Mejer and Pottelsberghe (2008) calculated that patenting costs were reduced by 20 to 30 percent in the wake of the agreement. However, the relative cost of a patent in Europe is still at least five times higher than in the US.
Patents also play a role as a signalling device for external investors. This mainly concerns firms which are suitable for VC funding. Here, the information asymmetries involved with risky innovation projects carried out by young, independent start-ups can be partly resolved by formal IPR protection. The affordability of IPR can as a result work as a barrier to innovation, both by diminishing the expected returns to innovation and by making it more difficult to obtain external financing.
3.7.2.2 IPR enforcement in third countries as a barrier to internationalisation
Despite the fact that most of the WTO members have adopted legislation implementing minimum standards of IPR enforcement based on the TRIPS agreement, the levels of IPR infringement continue to increase every year (see e.g. the IPR Enforcement Report 2009 of the European Commission (2009). China remains the highest priority country regarding IPR enforcement, with other countries close behind in specific sectors, such as India for medicines or Indonesia for foodstuff and beverages. Deficiencies in IPR systems are noted not only in emerging countries but also in developed countries. This is for instance the case for Israel (major deficiencies regarding pharmaceutical-related IPR issues) and Canada (deficiencies regarding the protection of copyright, pharmaceuticals) (European Commission 2009).
International efforts to improve IPR enforcement have been opposed by countries like Brazil and India, often supported by China, Argentina and others. This has prevented some of these institutions from addressing pressing IPR enforcement issues that could suitably be resolved multilaterally. High levels of IPR violations discourage foreign investment (European Commission 2005). If efforts at internationalisation are held back by weakly enforced IPR, the growth potential of innovations may not be fully realised. It is to be expected that in particular SMEs lack the resources to devise appropriate strategies for the protection of their IPR in export markets.
3.7.3 Main messages on IPRs Particularly SMEs and other people or organisations in countries close to the frontier
without the resources to afford the high cost both in terms of time and money of filing a patent (e.g. universities or independent inventors) are put at a disadvantage by the current system.
88
The high cost of European IPR affects not only incentives to innovate, but also financial constraints as it is easier to obtain VC financing when a patent application has been filed.
SMEs will also face more difficulties in protecting their IPR abroad.
3.8 Standards and norms as drivers or barriers to innovation
3.8.1 Introduction Standards are pervasive in modern economies. They are most visible in the modern information and communication technologies. It is possible to use any printer on a computer, to use any DVD player to play a specific DVD and most web pages are readable in any browser. However, standards go beyond ICT and networks. The paper we use is generally in a standardised format. Standardisation provides benefits to the customers and to the producer. Benefits for the user range from the more intensive competition of producers of compatible or standardised products to network externalities and reduced uncertainty. For producers standards create the possibility to reap economies, to signal quality to the consumers and to reduce uncertainty in demand. Already historians identified the central role of standards for the growth of trade (e.g. Dilke 1987, Erwin 1960, Groom 1960).
Standards are coordination devices that reduce the uncertainty and economise on transaction costs. With regard to R&D standards reduce uncertainty by providing a direction for R&D efforts, especially for incremental innovation activities that are oriented at improving the product performance while remaining within the realm of the standard. A standard is thus able to set the stage for subsequent innovative efforts. However, standardisation can also put a brake on innovation by constraining the search space for new innovation. Standards have often also a public-goods characteristic. Once established, standards are available to all firms - also competitors - that may free ride on the setup costs. Standards can emerge by different processes. They may be instituted by internal decisions of single firms that hold large market shares, by mutual agreement among producers, by first mover advantages, or even by government bodies or the power of large customers. In contrast to regulation the application of standards is generally not forced upon the users or producers. It is essentially the outcome of a coordination process. The question is whether standards and norms are facilitators to the growth through internationalisation of European firms. In order to answer this question we need to go beyond qualitative aspects. We will investigate the quantitative effects regarding the CIS in the section on regulation, as in the CIS 3 and the CIS 4 there are no questions that uniquely identify standards distinct from regulatory requirements.
3.8.2 What do standards do? To understand the relationship between innovation, diffusions and the standardisation and the use the standards it is necessary to answer the question what the economic function of standards is. The existing literature suggests that standards help to solve one or more of four distinct functions. Table 26Fehler! Verweisquelle konnte nicht gefunden werden. taken from Swann (2000) provides an overview. The four main kinds of economic functions are:
89
1. Providing for inter-operability or compatibility between different parts of a product or between products that constitute a system or network. Developments in information and communication technology have shown the importance of standards for the compatibility of interfaces. Economic theory has identified two particular economic phenomena that determine producer and consumer decisions under such circumstances. The first is that consumers and producers face switching costs after having invested in a specific system or product. The cost to switch to another system becomes increasingly expensive (Farrell and Shapiro 1988, Klemperer 1987a, 1987b, von Weizsäcker 1984). The second phenomenon is that producer and consumer choices are subject to network externalities (e.g. Arthur 1983, Farrell and Saloner 1985, Katz and Shapiro 1986). The basic idea of network externalities is that it is desirable to choose a system that is widely used by others. As emphasised by David (1985) if both of phenomena exist then there is a risk that markets get locked into inferior designs. Both producers and consumers will only switch to a new system if others follow suit. In the context of network effects compatibility or interface standards help to increase network effects. In such a case the winner of a battle between different standards will not necessarily be the best standard from a technological perspective but the one that has been most effective in building a network of other producers including third party producers. This suggests that network effects may cause welfare problems, as increasing returns to adoption may even lead to the selection of inferior standards. A superior standard is then unlikely to succeed due to excess inertia in the system. This opens up the issue of monopoly. In fact huge industries have grown on the back of proprietary standards (e.g. Windows) that give a central role to a dominant enterprise. Public standards may not be established in such a context. The standardisation process may be to slow or even be undermined by market participants.
2. The provision of a minimum level of quality, which may be defined in terms of functionality of safety of products. These standards are called minimum quality or safety standards. In this case standards help to solve information asymmetries between buyers and sellers that may lead to a severe market failure when bad sellers drive good sellers out of the market. Ackerlof (1970) showed that under circumstances of severe information asymmetries markets for high quality products may break down. In this case Gresham's Law - the proposition that the "bad drives out the good" – holds. This demonstrates the negative effects of information asymmetries. Minimum quality or quality discrimination can help to overcome this problem, if they are well understood and provide confidence to the buyer (Leland 1979). Standards are not the only instrument to solve severe information asymmetries but they can be very effective. Thereby minimum quality standards reduce search and transaction costs (e.g. Hudson and Jones 1997). There is no need to establish these minimum standards by public authorities they can also defined cooperatively by groups of producers. The danger of privately established standards however is that they might be self-serving, on the other hand public standardisation may be subject to regulatory capture.*
* Regulatory capture is a form of government failure. It occurs when a public regulatory agency created to act in the public interest acts instead in favor of commercial or special interests it is charged with regulating.
90
3. The third function of standards is that they allow reducing the variety of products. This allows on the one hand for the exploitation of economies of scale by limiting wasteful product differentiation. On the other hand variety reduction limits risks and transaction costs faced by suppliers. These standards reduce the risks that face suppliers, even if they thus face more competition (Swann 1985). If the possible range of nails and bolts is reduced to some standardised measures this allows firms to produce on a larger scale and provides the benefit to the user that he will get the required nails and bolts also from other suppliers. With custom-made nails and bolts both transaction and production costs will be higher. It can also be argued that this function of standards allows them to function as focusing device. The availability of standards provides the stability necessary to shape future innovation efforts. Especially in new markets standards can help to focus innovation efforts (Swann 2000). In generally markets are able to generate variety-reducing standards, as this mechanism of standardisation can also work firm by firm. However, market-based standards may not achieve the goal to function as focusing device. On the other hand the risk of regulatory capture is present also with this kind of standard.
4. Standards allow the provision of information. This function of a standard is generally associated with the other three functions. With a product description standard a producer can confirm that his product is indeed what he and the consumer expects it to be and reduces therefore the risk of compensation or litigation for him and the customer. Most standards that provide a product description also offer one or more of the other functions.
Table 26: Effects of standards
Positive Effects Negative Effects Will the market define a standard?
Problems with a Market Standards
Problem with Public Standards
Compatibility/ Interface
Network externalities Monopopoly Yes Lock-in to inferior standard
Slow to define
Not necessarily open May be undermined by market process
Risk of monopoly Risk of Regulatory capture
Minimum Quality/ Correction for Gresham's Law
Regulatory Capture Not as such, though there are other mechanisms
Risk of Gresham's Law
Risk of regulatory capture
Quality Discrimination Reduced Transaction Costs
Any 'standard' is liable to be self-serving
Variety Reduction Economies of Scale, Critical Mass
Reduced Choice Yes May not help to define focus or achieve cohesion
Risk of regulatory capture
Information Standards
Facilitates Trade; Regulatory Capture Can do but incomplete
Incomplete may not be open
Risk of regulatory capture
Reduced Transaction Costs
Unlikely to measure characteristics which show product in poor light
Source: Swann 2000, compiled based on Tables 1 and 3.
The economic benefits from standards accrue only when standards are used in the economic sphere. The publication of a standard itself does not create economic value. The available
91
evidence suggests that standards have a macro-economic impact (e.g. DIN 2000, Blind and Jungmittag 2000, Swann and Temple 1995, DTI 2005). The results show that
standards play an important role in the diffusion of innovation standards act as stimulus to innovation the contribution of standards to economic growth is as important as the contribution of
patents and that
standards have a positive effect on trade, especially international standards
Swann and Temple (1995), Blind and Jungmittag (2000) and Blind (2004) found also that standards have a positive effect on trade and there is also some evidence that standards increase competitive advantage. These studies also suggest that standards are helpful to the operation of markets and reduce transaction costs. International standards remove technical barriers to international trade. However, idiosyncratic national standards can of course also act as important barrier to trade (e.g. Lecraw 1987). With regard to innovation it is found that standards are a good proxy to measure the extent of technological diffusion and provide an important infrastructure for innovation (Swann 2000).
3.8.3 Standards and innovation on the macroeconomic level Acemoglu, Gancia and Zilibotti (2010) present a theoretical work where innovation and standardisation are considered to be two different engines of economic growth. The basic idea is that innovation is the exploration of the product and process space, while standardisation is coupled to the diffusion of new technologies and products. Standardisation is a costly process which creates cheaper ways of producing new products, for example by substituting high skilled labour with lower-skilled labour. This frees high skill labour for innovation activities. At the same time standardisation leads to a cost reduction and thereby it reduces the potential profits from new products and technologies thus discouraging innovation. This highlights the importance of standardisation for the innovation process. However, the view that there is a trade-off between standardisation and innovation might not be the whole story. Swann (2000) presents a very simple conceptual model where he argues that standards are important as focussing devices by restricting the search space for innovative activities thereby structuring innovative search in way that is advantageous to the absence of standards. Thus the basic idea of Swann's model is that standardisation provides an infrastructure for innovation and aids subsequent innovation. Standards are essential in enabling and shaping patterns of innovation. On the one hand much innovation will take place in the neighbourhood of the standard by improving single characteristics without eliminating the standard. In the absence of the standard the search space is unlimited and the exploration of the product or technology space is less directed and characterised by to little exploitation of economies of scale. With patent protection Swann argues that the due to the protection by property right local search is restricted. This view on standards suggests that standardisation is a precondition for innovative search.
Both perspectives are relevant. On the one hand there is a trade-off between standardisation and innovation. With established standards it is very difficult to introduce products or processes that are
92
only marginally better. The improvement needs to be substantial enough in order to make the existing standard obsolete. Thereby the existence of a standard guides innovative efforts.*
Indirect evidence for the importance of standards for innovation comes from growth studies that use standard counts in order to explore the impact on growth and productivity growth. Both the results of Jungmittag et al. (1999) and DTI (2005) suggest that standards are important for productivity growth, but slightly less than patents and that the importance of standards has declined since the 1980s.
3.8.4 Standards and innovation on the microeconomic level The fact that standards are not imposed upon market participants does limit the importance of standards as barriers to innovation compared to regulation. Obsolete standards can be easily replaced. Evidence for the UK shows that the withdrawal of standards has increased along with the growth of the catalogue of standards of the British Standard Institute (DTI 2005, 51).† However, this does not provide empirical evidence at the micro level on whether standards enable or constrain innovation. Unfortunately questions on effect of standards are not part of the harmonised CIS-3, CIS-4 and CIS2006. It is not possible to distinguish between standards and regulation. However, in the report by DTI (2005) a study by Peter Swann is reported that used the UK CIS-3 where firms were asked specific questions regarding standards.
The evidence clearly indicates that standards are an important source of information for innovating firms. As Blind (2004) states "Researchers, developers, construction engineers and marketing experts utilise … standardisation documents as important sources of information about the state of technology". The pattern of responses reveal that 70% of respondents say that standards constrain innovation and approximately 70% say that standards are a source of innovation. In fact, standards are considered to be more important than all institutional sources of innovation and on par with competitors and professional conferences and meetings.
The results suggest that the following types of firms are more likely to say that technical standards are a source of information:
Firms with a higher proportion of tertiary graduates Product and process innovators that have longer term innovation activities, and Firms that have some sort of innovation cooperation
In addition there is a non-linear relationship between the average age of standards and the use of standards as information source. Brand new standards are not that important than somewhat older standards. However, outdated standards loose information content. The evidence on health and environmental standards, that are likely closer to regulation than technical standards, shows
* According to Swann (2000) there is an important difference between open standards and proprietary standards with regard of their functioning as focussing device. Proprietary standards are much closer to IPR protection and usually do not permit local innovative searches around the standard by other firms than the standard setter. † With network effects a lock-in to suboptimal standards may be possible, because switching costs may be too high. However, as this relates to the presence of network effects in the selection of unsponsored standards, thus covers only a minority of standards used.
93
similar patterns, except that the share of tertiary graduates is insignificant and that these standards are used primarily by process innovators and not by product innovators.
The results on the constraining role of standards show that there is a non-linear relationship between the age and number of standards. Interestingly, the firm characteristics that were relevant in characterizing the use of standards as a source of innovation are not significant. Instead, it is found that firms that operate on a local or regional market are more likely to report standards as constraining factor than firms that operate on the national or international market. According to Swann this is not surprising: "The competitiveness of enterprises operating in national (and especially international) markets depends on them meeting relevant standards. These enterprises are less likely to feel that the standard constrains them in a way that has adverse implications for their competitiveness".
Unfortunately this evidence on constraining factors covers both standards and regulation. It is only available for one country that is located in country group 1. The results from the CIS clearly show what we have discussed in the previous section: Standards constrain innovation and provide valuable information at the same time. The evidence on the characteristics of the firms suggests that standards are an important source of information for innovative firms. Standards and norms constrain also innovation activities of firms that are only regionally active.
3.8.5 The internationalisation of standards Standards help to create a common trading environment by easing communication about product specifications. International standards ensure that parts produced across borders are compatible and networks are interoperable. The increase in international trade has led to an internationalisation of standards and norms. International standards facilitate exchange and access to markets. Different national standards may create barriers to trade that are analysed in detail in Chapter 3 of the present report.*
For Europe the Europeanization and internationalisation of standards is central to achieve the single market in goods and services. In Europe EU harmonisation of standards and norms in particular led to a decline in purely national standards.† The evidence for the UK provided by DTI (2005) shows clearly that the rise in the total number of standards was accompanied by a relative decline in national standards, and that most of the growth of the catalogue of BSI (British Standard Institute) has been the result of the increase of European standards originating from CEN, CENELEC and ETSI. The patterns for the UK show that in 1948 almost all standards were national standards and until the mid-70s more than 90% of the catalogue was of British origin. By 2003 the situation had dramatically changed; only 25% of the standards in the catalogue were national standards. The same holds true for Germany. DIN (2000) reports that share of national norms
* A large variety of standards does not necessarily need imply barriers of trade. For example consider the large variety of power plugs worldwide and in the EU (see the Wikipedia article AC power plugs and sockets: http://en.wikipedia.org/wiki/AC_power_ plugs_and_sockets for details). Many of the different standards are partly interoperable: One can fit an Europlug (CEE 7/16) safely into most Type E (French), type F (CEE 7/4 "Schuko"), Type H (Israeli), CEE 7/7, Type J (Swiss), Type K (Danish) and Type L (Italian) outlets, as well as BS 4573 UK shaver sockets. † Purely national standards are those that are neither equivalent nor identical to standards issued by an international body (ISO, IEC) or in the European context (CEN, CENELEC or ETSI).
94
declined in 2000 to less than 20%. In 2005 between 85% and 90% of standardisation projects are of European or international origin (Blind 2006).
The internationalisation of standards is also relevant for innovation policy. Standardisation in an early stage of technological development involves the successful transfer of research results into products and processes. This can be very important for firms being active in new markets because standards provide a focussing device for the commercial success of new markets. This shows that standards are especially relevant in the establishment of innovative lead markets. Lead markets are markets for new goods and services. Early standardisation allows defining concepts, classifications and to establish measurement and test procedures. These early standards provide focussing devices for further innovation and for consumers of innovative products. Thereby the early standards are path breaking and provide the starting point for the establishment of global standards. This provides a competitive advantage for firms in the lead market to access foreign markets. At the same time the establishment of an open standard affects market structure and the associated incentives to innovate.
Open standardisation increase the intensity of competition compared to closed standards. However, guiding early standardisation processes is difficult as it requires the identification of promising themes of standardisation. In addition new impulses from R&D need to be integrated into the ongoing process of standardisation. In order to foster innovative activities the use of technical standards has advantages vis-a-vis an approach that uses regulation, as obsolete standards prove to be a much lower barrier to innovation than obsolete (technical) regulation.
3.8.6 Standardisation and SMEs It is often argued that SMEs do not have enough voice in the formal standardisation processes. This refers primarily to standardisation by public or semi-public bodies. In de-facto market-based standardisation processes SMEs generally have no voice, except in a nascent market in which all players are SMEs. According to research of EIM (2006) SMEs often consider standards as a burden. It shows that SME are in favour of a standardisation process that leads to standards that are
1. easily comprehensible and clearly arranged; 2. contain instruction for implementing standards and concrete technical solutions, instead of
general concepts; 3. repeat excerpts from other standards instead of referring to them.
The compliance to standards (for example ISO 9000) creates administrative costs that can be substantial for SMEs. Therefore many SMEs consider standards as created by large enterprises for large enterprises. They do not feel involved in the creation of new standards. The results of a survey among German SMEs by the German Commission for Occupational Health and Safety and Standards (KAN)* shows quite similar views and reveals that this impression is widely held among SMEs in Europe.
* http://www.kan.de.
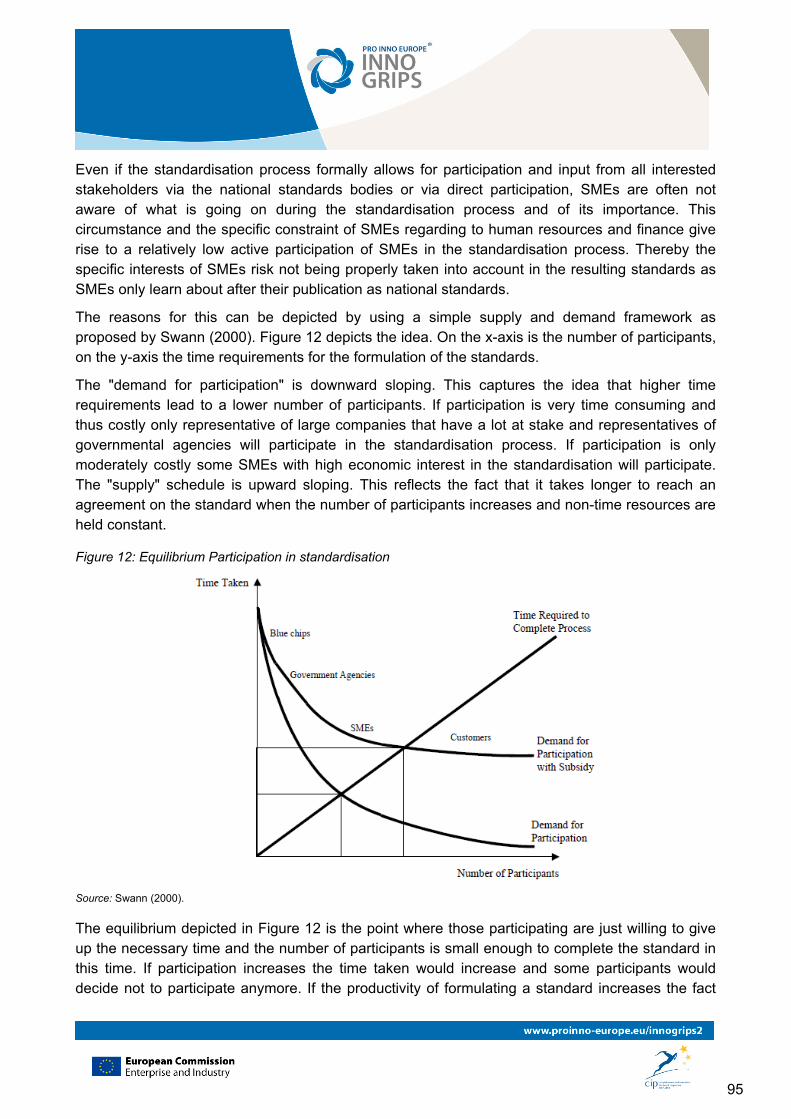
95
Even if the standardisation process formally allows for participation and input from all interested stakeholders via the national standards bodies or via direct participation, SMEs are often not aware of what is going on during the standardisation process and of its importance. This circumstance and the specific constraint of SMEs regarding to human resources and finance give rise to a relatively low active participation of SMEs in the standardisation process. Thereby the specific interests of SMEs risk not being properly taken into account in the resulting standards as SMEs only learn about after their publication as national standards.
The reasons for this can be depicted by using a simple supply and demand framework as proposed by Swann (2000). Figure 12 depicts the idea. On the x-axis is the number of participants, on the y-axis the time requirements for the formulation of the standards.
The "demand for participation" is downward sloping. This captures the idea that higher time requirements lead to a lower number of participants. If participation is very time consuming and thus costly only representative of large companies that have a lot at stake and representatives of governmental agencies will participate in the standardisation process. If participation is only moderately costly some SMEs with high economic interest in the standardisation will participate. The "supply" schedule is upward sloping. This reflects the fact that it takes longer to reach an agreement on the standard when the number of participants increases and non-time resources are held constant.
Figure 12: Equilibrium Participation in standardisation
Source: Swann (2000).
The equilibrium depicted in Figure 12 is the point where those participating are just willing to give up the necessary time and the number of participants is small enough to complete the standard in this time. If participation increases the time taken would increase and some participants would decide not to participate anymore. If the productivity of formulating a standard increases the fact
96
that less time is necessary increases participation but then it puts again an upward pressure on the time table.
If the equilibrium time taken is considered to be too slow, speeding up the standardisation process would require a rationing of membership. However, limiting membership by fees or other restrictions may lead to inefficient outcomes especially if some particular types of participants (e.g. customers and SMEs) are excluded. This is especially relevant if the process of standardisation produces standards that are primarily usable by those which are defining them, not by absent groups (e.g. SMEs). This may lead to standards that do not account for the needs of absent groups. Thus limiting membership to speed up the process of standardisation my help to speed up standardisation processes but is likely to have undesirable effects on the long-term economic benefits of standards. The introduction of a subsidy as depicted in Figure 12 shifts the demand curve up and increases the equilibrium time requirement and participation in the standardisation process. If only the speed of the standardisation process is deemed to be important then a subsidy is a bad idea. However, if standardisation is concerned with the coverage and applicability of standards then this may be a price that is worth to pay.
3.8.7 Summary Standards are in general conducive the economic growth and an important element of the innovation infrastructure. The literature survey has shown that standard perform an important role for the diffusion of technology and as focussing device for innovative search. By decreasing variety standards reduce the variety of open avenues for innovative search. However, they act as focussing and structuring device that guides future innovation activities. This is also reflected by the fact that firms regard standards as important information sources for innovation activities. Thus in general standards should be considered as important elements of the modern innovation process. From the literature survey emerges clearly that standards are
conducive for international trade, of comparable importance as patents as sources for innovation activities, and provide guidance for innovation activities.
From an innovation policy perspective standards are an important element of technology transfer and central in order to establish lead markets. In most of the areas of research, patenting, innovation and standardisation SMEs are at disadvantages compared to large companies. Therefore many SMEs see the process of standardisation as subject to regulatory capture by large firms. However, it is important to note that the participation of SMEs in the process of standardisation is akin to technology transfer: expert knowledge is provided for SMEs, communication about technological requirements for using specific techniques and a point of departure for the cooperation between enterprises, research institutions and the public sector. In order to increase the participation of SMEs in standardisation processes it is necessary to
Reduce information deficits regarding rules and products, reduce costs of participation (opportunity costs and lack of qualified personnel), and improve enterprise competencies.
97
3.9 Regulation and innovation
3.9.1 Introduction Standards and regulation are closely related. If regulation is concerned with technical issues it is generally based on standards. The main difference is the strictness of enforcement. The use of standards is voluntary – maybe enforced by the other market participants. Regulation in contrast entails the control of behaviours by rules or restrictions.
Regulation is in general considered in the form of legal restrictions promulgated by the government or a government authority. However, there exist also instances of self-regulation trough trade association, certification and market regulation that are closely related to standards and norms. In general firms breaching regulations will be fined either by a public authority or by self-governing bodies.
Regulation is mandated by public authorities in order to prevent outcomes that might otherwise occur. Common forms of regulation are controls on market entries, controls on prices, wages, processes of registration or licensing to approve new products and services or processes of inspections in order to ensure standard compliance.
Regulation is expected to provide benefits but creates also costs. The observable costs are related to the costs of administering the regulatory infrastructure. More important are often the unintended consequences which may affect in an undesirable way the incentives to act. Our question is whether regulation does affect the incentives to innovate. It is generally argued that product market regulation may have an innovation-hindering effect on innovation.
One difficulty when analyzing the effect of regulation on innovation is that regulation is a very broad issue. Regulation can be sector-specific or economy-wide. The regulations that guide the approval of new drugs are specific to the pharmaceutical industry but general entry regulations affect all new entrants regardless of the industry of operation. Some industries are heavily regulated such as pharmaceuticals, energy or liberal professions. Other industries are much more lightly regulated.
3.9.2 What does regulation do? Regulations impose restrictions on the action of businesses. In many areas some regulation is necessary to ensure the proper working of market processes. Regulation is very often a response to market failures. Regulation and competition policy perform a similar function, apart from timing. Regulation is rule-based and ex-ante, while competition policy enters the picture ex-post. However, there are in addition differences between ex-ante regulation and ex-post antitrust. In the realm of regulated industries a relevant difference is that regulatory authorities have more knowledge about firms than antitrust authorities (Bourreau and Dogan 2001). Cave and Crowther (1996) emphasised that regulation is often used to achieve specifically defined social and political objectives while competition policy implies in contrast minimal intervention to correct specific market failures.
98
Regulation and innovation have been discussed for several decades now in the economic literature. Regulation is generally seen as controlling and restricting policy instrument that has a corrective function against undesirable market outcomes. Regulation is generally seen as cheap instrument that is supplied in response to the demand of the public to correct for externalities, monopolistic phenomena, information failures and the inadequate provision of public goods (Posner 1974). However, the effects of regulation are not costless.
The literature on the relationship between regulation and investment shows that product market regulation has important effects on economic activities. Regulation increases the costs of entry in markets, as regulation leads to compliance costs. This may affect mark-ups over marginal costs (and hence prices) due to higher entry barriers, a stable oligopoly with a lower number of firms. Most regulations do not only cause entry costs and costs of administering the regulation in the public sector but also affect existing firms' costs when they face administrative costs due to the regulation. If regulation of natural monopolies or natural oligopolies imposes a ceiling on the rate of return on capital, then regulation affects also the structure of factor demand. Under such regulation the demand for capital is higher than the demand for labour (Averch and Johnson 1962). Overall, Alesina et al. (2005) show, that higher regulation is associated with lower investment activity. These findings carry also over to innovation, as innovation is essentially a complex form of investment. However, with regard to the incentives to innovate the issues are less clear. Bassanini and Ernst (2002) find a negative correlation between the intensity of product market regulation and the R&D expenditures. The findings of Amable et al. (2010) suggest that the negative effect of product market regulation is reduced when countries approach the technological frontier. Swann (2005) shows based on CIS data for the UK that regulation can be an important source of innovation but also a severe obstacle.
Even more important differences emerge, when one considers environmental regulation. Porter (1990) emphasised that strict environmental regulation may act as focusing device for innovation. Following the study of Porter and van der Linde (1995) many have studied the impact of strict environmental regulation on the development of new environmental technologies. However, as most of the approaches apply a static framework they are not able to consider the long-term dynamic feedback loops between regulation and innovation (cf. Kemp 1998). Kemp (2000) emphasises that stringent regulations like product bans are often necessary for radical innovation responses. Non-stringent regulations will generally lead to incremental innovation, as product modifications or improvements to existing technology to comply with new regulations are easier to implement (Hall and Kerr 2003).
This argument makes clear that regulation is relevant for innovation policy. But interestingly the majority of existing typologies and taxonomies of innovation policies in the associated literature seldom includes regulation as important innovation policy (see Rodriguez and Montalvo 2007). However, in recently regulation has been identified as important element of innovation policy that can guide public demand can define and extent the competitive space and can work as focussing device to direct innovation activities towards specific directions (e.g. Edler and Georghiou 2007, Soete and Arundel 1995, Legrand et al. 2002). Thereby regulation is not only seen as constraining but also as enabling device. Today regulation (together with standardisation) is considered an
99
important instrument to improve the framework conditions for innovation. The danger of making regulation more conducive to innovation is that innovation-enhancing goals may conflict with the traditional rationales of the regulations. For instance, speeding up the costly process of the approval for new drugs may increase the incentives to innovate but may lead to less safe drugs.
3.9.3 Different kinds of regulations and their impact on innovation As there are many different forms of regulation ranging from product market regulation to labour market regulation to the establishment environmental regulation. Each of the different kinds of regulation influences innovation. Accordingly, Table 27 distinguishes between eight different kinds of regulations and their effects on innovation activities in the economy. The first set of regulations is product market regulations including competition enhancing regulations. A reduction of product market regulation entails an increase in competition. However, the relationship between competition and innovation is ambiguous. For example, much of the Schumpeterian literature postulates a positive relationship between profits and innovation. In most innovation-based models of endogenous growth innovation efforts increase with the monopoly position. On the other hand competition may also have a positive effect on innovation. Incumbent firms may have higher innovation incentives to fend of competitors. New entrants may challenge established firms. Aghion et al. (2005) consider both effects and conclude that that competition has a positive effect on innovation at very low and very high levels.
Empirical studies in general show a positive relationship between competition and innovation. For example Bassanini and Ernst (2002) find a negative correlation between the extent of product market regulation and R&D intensity. Blind (2010) confirms this result. Swann (2005) shows that regulation is both an incentive and a barrier to innovation. Most of the more recent economic research shows that increased competition stimulates R&D. Aghion et al. (2005) argue that incumbents aim at escaping competition. Incumbents may have incentives to innovate in order to pre-empt rivals (Gilbert and Newbery 1982, Klette and Griliches 2000).
However incumbents usually face higher opportunity cost of adopting potentially challenging technologies as long as the knowledge of the old technology is not or only partially transferable to the new one (e.g. Arrow 1962, Jovanovic and Nyarko 1996). Aghion et al. (2005) find a inverse U-shaped relationship between competition and patents as innovation indicator for the UK. However, the evidence regarding product market regulation is mixed. Amable et al. (2010) extend the analysis by Aghion et al. (2005) and find that the negative effect of product market regulation declines when countries approach the technology frontier. Also other studies report weak correlations between product market competition indicators and R&D investment.
The specific relationship between product market competition and incentives to innovate remains an open issue. This is also related to the fact, that most regulation indicators considered in the empirical analyses are not industry-specific. The available results suggest that competition has a positive impact on innovation that declines when countries catch up to the technological frontier. However, it is important also to note in this respect that due to the high correlation of aggregate regulation indicators among themselves a precise identification of the effects of single regulations is difficult at least if one uses a small set of countries (Hölzl and Reinstaller 2009).
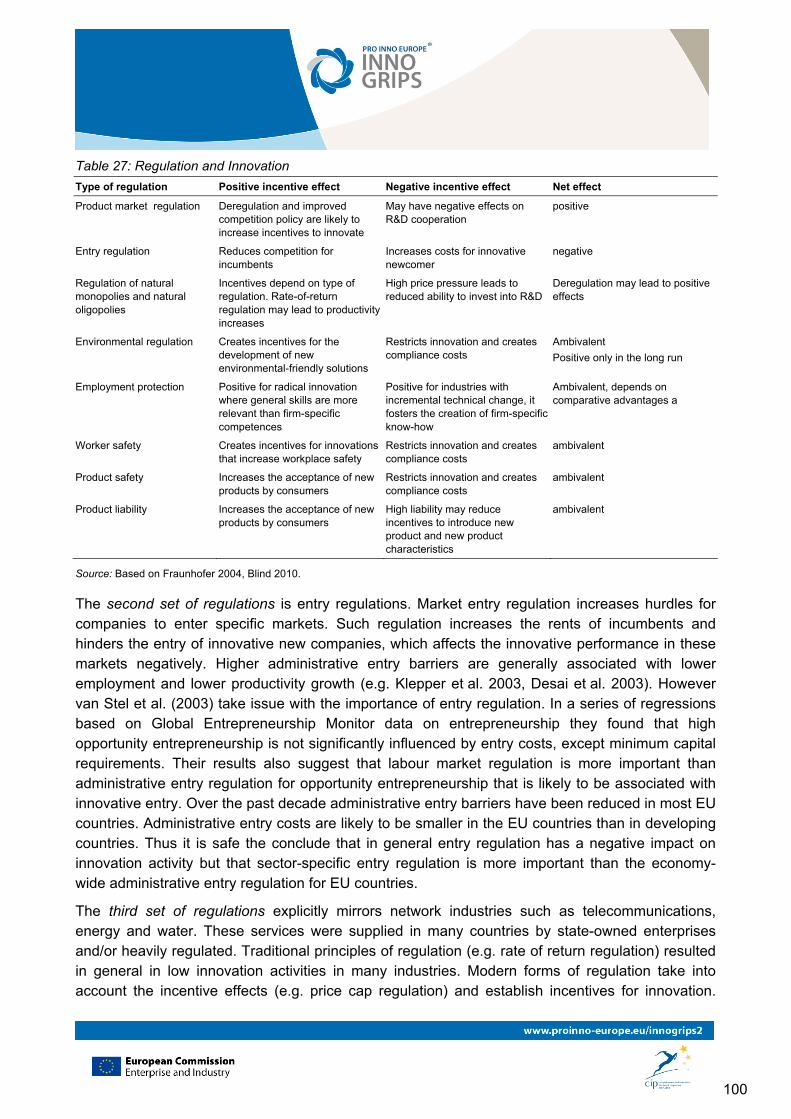
100
Table 27: Regulation and Innovation
Type of regulation Positive incentive effect Negative incentive effect Net effect
Product market regulation Deregulation and improved competition policy are likely to increase incentives to innovate
May have negative effects on R&D cooperation
positive
Entry regulation Reduces competition for incumbents
Increases costs for innovative newcomer
negative
Regulation of natural monopolies and natural oligopolies
Incentives depend on type of regulation. Rate-of-return regulation may lead to productivity increases
High price pressure leads to reduced ability to invest into R&D
Deregulation may lead to positive effects
Environmental regulation Creates incentives for the development of new environmental-friendly solutions
Restricts innovation and creates compliance costs
Ambivalent
Positive only in the long run
Employment protection Positive for radical innovation where general skills are more relevant than firm-specific competences
Positive for industries with incremental technical change, it fosters the creation of firm-specific know-how
Ambivalent, depends on comparative advantages a
Worker safety Creates incentives for innovations that increase workplace safety
Restricts innovation and creates compliance costs
ambivalent
Product safety Increases the acceptance of new products by consumers
Restricts innovation and creates compliance costs
ambivalent
Product liability Increases the acceptance of new products by consumers
High liability may reduce incentives to introduce new product and new product characteristics
ambivalent
Source: Based on Fraunhofer 2004, Blind 2010.
The second set of regulations is entry regulations. Market entry regulation increases hurdles for companies to enter specific markets. Such regulation increases the rents of incumbents and hinders the entry of innovative new companies, which affects the innovative performance in these markets negatively. Higher administrative entry barriers are generally associated with lower employment and lower productivity growth (e.g. Klepper et al. 2003, Desai et al. 2003). However van Stel et al. (2003) take issue with the importance of entry regulation. In a series of regressions based on Global Entrepreneurship Monitor data on entrepreneurship they found that high opportunity entrepreneurship is not significantly influenced by entry costs, except minimum capital requirements. Their results also suggest that labour market regulation is more important than administrative entry regulation for opportunity entrepreneurship that is likely to be associated with innovative entry. Over the past decade administrative entry barriers have been reduced in most EU countries. Administrative entry costs are likely to be smaller in the EU countries than in developing countries. Thus it is safe the conclude that in general entry regulation has a negative impact on innovation activity but that sector-specific entry regulation is more important than the economy-wide administrative entry regulation for EU countries.
The third set of regulations explicitly mirrors network industries such as telecommunications, energy and water. These services were supplied in many countries by state-owned enterprises and/or heavily regulated. Traditional principles of regulation (e.g. rate of return regulation) resulted in general in low innovation activities in many industries. Modern forms of regulation take into account the incentive effects (e.g. price cap regulation) and establish incentives for innovation.
101
Alesina et al. (2005) show that deregulation in these industries increases the incentives to invest. Blind (2010) summarises that most studies show, that innovative activities increase after deregulation and privatisation.
The fourth set of regulations is environmental regulations which have received considerable attention because of the increasing importance of environmental issues (Kemp 1998). Environmental regulation has led to forced changes in the production process. In some instances this led to changes in the market structure and provided a window of opportunity for new entrants. In addition environmental regulation has led to the creation of new industries and new products that have fewer negative impacts on the environment. Kemp (1998) emphasises the role of regulation as modulator for technical change and innovation. Strict regulations may change the direction of innovative search towards the search for new products and processes that have a less negative impact on the environment. The idea that strict regulation may induce innovation was put forward by Porter (1990) in his famous hypothesis that strict regulation may lead to a double dividend. Although ambitious regulations may be challenging for a domestic industry at the beginning they lead not only to an improvement for the environment but help also to increase international competitiveness (Porter and van der Linde 1995). However, environmental regulations do also restrict firms in their innovative activities and cause substantial additional costs which may affect competitiveness negatively. The empirical literature (e.g. Jaffe and Palmer 1997, Shadbegian and Gray 2003) is not conclusive regarding the short- and medium-term effects of regulation on the development of new environmental technologies. However, as the literature survey by Gonzalez (2009) shows, a large number of studies finds positive long-run impacts of environmental regulations on innovation.
However, it is often claimed that environmental regulations are often based on existing technologies and do not provide incentives to innovate but provide incentives for adoption of technologies (e.g. Mickwitz et al. 2008). However, Visser et al. (2008), Minkewitz et al. (2008) and Paraskevopoulou (2009) demonstrate that anticipatory effects stimulate testing of undemonstrated technologies and lead to the early market creation for more sustainable products. Thus new regulations and the discussion about new regulations (anticipation effect) (Paraskevopoulou 2009) establishes a focussing device for technological exploration.
The effect of employment protection on innovation is ambivalent. Bassanini and Ernst (2002) find in one of the few studies relating employment protection to innovation that the relationship depends on the institutional set-up of wage bargaining. They find that labour market flexibility is positively related with R&D in low-tech industries and in general for countries with a decentralised system of wage bargaining.* On the other hand, countries with a coordinated system of industrial relations show a negative relationship between labour market flexibility and R&D intensity. This result can be interpreted on the basis of two different effects. The improvement of productivity may lead to downsizing or reshuffling employees and accordingly innovation is discouraged by legislation to hinder labour adjustment. The second explanation builds on the correlation between
* Uncoordinated decentralised industrial relations systems (e.g. US, UK): firms satisfy their competence requirements by hiring adequately skilled workers on the labor. Coordinated industrial relations systems: firms resort more frequently to their internal labor market and pay themselves for the cost of competence accumulation through training and on-the-job learning.
102
technological specialisation and labour market institutions (e.g. Hall and Soskice 2001). Countries with a coordinated set of wage bargaining have a technological specialisation in technologies characterised by incremental technological change. High adjustment costs foster the acquisition of firm-specific skills. On the other hand countries with a very flexible labour market show a technological specialisation in technologies that are characterised by more radical changes (e.g. Hall and Soskice 2001).
Product safety regulations are different across sectors. Some products such as cars or drugs either have important externalities in their use and/or their use is subject to substantial asymmetric information between user and producer. Such products are generally characterised by strong product and safety protections. Innovation activities are subject to important regulations so that the link between regulation and innovation is quite close. Safety regulations may inhibit innovations or make the introduction on the market very costly. However, one benefit of strong regulations is that they signal minimum product safety of new products. This could well have positive effects on innovation incentives. In a similar way work safety regulations provide incentives for the development and adoption of technologies that display higher labour safety. However, these regulations may lead to entry barriers and higher costs. Therefore the effect on innovation is ambivalent. With regard to product liability the available evidence is mixed. While some studies find positive effects if fines are moderate (e.g. Viscusi and Moore 1993), other studies find no impact on innovation or even a tendency to promote existing technologies (Parchomovsky and Stein 2008).
Also intellectual property rights are established by regulation. Because of its importance for innovation it is discussed in Section 3.6.
Overall the evidence shows that different regulations affect the innovation behaviour differently. Regulation in general creates costs and affects the incentives to innovate. Regulation that creates entry barriers and/or substantial compliance costs is likely to have negative effects on innovation. On the other hand, regulation that creates substantial anticipative effects that some products and processes may be outlawed (or become more expensive for firms to produce) may act as focussing devices for directed innovation activities. In the literature the latter effect is primarily discussed in the context of environmental regulation, where regulation and the anticipation of new regulations may encourage the emergence and diffusion of innovations.
3.9.4 Regulation and innovation: evidence from specific industries In order to assess the importance of regulation for innovation and the incentives to innovate it is useful to look at specific industries and their reaction to regulation.
3.9.4.1 Detergents*
Synthetic detergents that consist of different components were developed from the 1930s on. The improved performance of synthetic detergents and the increased prices of fats and oils that are
* This draws mainly on the research by Paraskevopoulou (2008, 2009a, 2009b) who studied the co-evolution of sectoral regulation and technological innovation in the detergent industry.
103
necessary for soap production led to gradual substitution of soap by synthetic detergents. Paraskevopoulou (2009) emphasises that the basic design of synthetic detergents has largely been developed by the 1960s with the introduction of enzymes into the synthetic detergents. From the 1960s on public pressure and regulation became important inducement mechanisms for product innovation channelling research efforts. In the early 1960s environmental concerns regarding the increased amount of foam in rivers became a concern. Public action led to legislation and to development of low foaming detergents. In Germany the discharge of non-biologically degraded materials into sewage systems was prohibited, while in the US and UK industrial agreements were established to alter the manufacturing process. The second issue was the eutrophication attributed to the use of phosphates by the detergent industry. The replacement of phosphates became a hot topic due to environmental concerns, public pressure and the anticipation of regulation. In the mid 1970s low phosphate detergents were introduced and in the 1980s phosphate-free detergents were introduced in the markets. The issue of phosphates is an interesting case, as research efforts were initiated by anticipation of public action that failed to materialise. Despite the importance of eutrophication, the use of phosphates is still not regulated at the European level. Only a few member states banned phosphates through national legislation after phosphate-free detergents became available. However, the majority of detergents used in dishwashers are still phosphate-based. The third public concern was enzymes that were suspected to lead to respiratory allergies and asthma incidents in the work force. This led to changes in the production process anticipating and following regulatory action. During the 1980s and 1990s much effort was put into diversifying the products in terms of use (e.g. kitchen, bathroom surfaces) and forms (e.g. concentrations, liquids). In the 2000s the global concerns on energy saving focussed research on low temperature detergents. In addition new regulation led to the increased use of more environmentally friendly processes and technologies.
The research by Paraskevopoulou (2008, 2009) highlights the interactive character of regulation and innovation that results from the proactive behaviour of firms reacting to the anticipation of regulation in response to societal problems. This allows firms at the same time to influence the regulatory process. The anticipation of regulation triggers firms' activities to influence their institutional and economic environment and innovative activities.
3.9.4.2 Telecommunications
The telecommunications industry is one of the most dynamic industries concerning both sector-specific regulation and technological dynamism (Borreau and Dogan 2000). In the telecommunication industry two types of innovation underlie competition: innovation for new services and innovation for alternative network infrastructures. The former is provided mainly by telecommunication firms while the source for the latter is equipment suppliers. To ensure the development of a self sustaining competitive market sector specific regulations target the market structure. The aim of these interventions is to induce firms to behave in a competitive manner so that benefits (lower prices), better quality and an extended variety of products are achieved. Regulatory policies should consider the dynamic aspect of competition, in order to accomplish the objectives in the telecommunications industry. As a matter of fact technological change altered the organisation of the industry rapidly. Hence the speed of innovation (especially in the new markets)
104
should be reflected by regulation. Many regulatory measures could become inefficient or obsolete as a consequence when regulatory authorities do not respond fast enough to follow the rapid change of the market.
From an economic perspective regulation in telecoms is needed because telecommunication industries have the character of natural monopolies and oligopolies. Symmetric ex-ante price regulation, more precisely the regulation of interconnection charges and retail prices, alters the distribution of profits within the industry and reduces the scope to set monopoly prices. This affects industry profits and accordingly the incentives to innovate for incumbents and new entrants. This depends on the nature of the regulation. In telecommunications symmetric ex-ante price and entry regulations may reduce the incentives for technological adoption (pre-emption). Asymmetric regulation in contrast – where incumbents operating in both network and service markets are regulated heavier than new entrants – could create higher incentives for innovation and adoption of new technologies by entrants. Lighter regulation would increase the incentives for innovation by the incumbents.
Interconnection charges constitute roughly 50% of the total operating expenses for providing telecommunication services. Interconnection charges are generally regulated. In the economics literature this refers to the literature on the relative merit of two different modes of regulation: Rate of return (ROR) versus price cap (PC) regulation. In the literature it is generally assumed that ROR regulation leads to overinvestment and overcapitalisation. However, the empirical evidence is weak (Greenwald and Sharkey 1989, Charlton and Perloff 2000). Published work for the telecommunication industry generally supports the view that PC regulation is more supportive of innovation. However, Gabel and Huang (2008) found no evidence for this proposition studying the US telecommunication markets. They argue that with expensive investments ROR regulation may be more efficient for the adoption of new technology, perhaps because ROR regulation has the property of shifting the risk of new investments towards rate payers.*
Important in all network industries are the issues of unbundling and compatibility. Unbundling separates the network infrastructure from the operation on the network. Giving the entrant's access to the local network fosters service based competition by providing equal opportunities to other new entrants to supply differentiated services. However, it may hinder or encourage incentives to invest in new alternative network structures. Compatibility refers to the enforcement of standards in a network industry. Compatible systems avoid both static and dynamic losses which come about due to lessened competition and eliminated incentives for innovation, respectively.
With regard to the emergence and practice of regulation in the telecommunications industry the results of Duso and Seldesachts (2010) show that the change from analogue to digital technologies in the mobile telecom industries at the beginning of the 1990s was driven by political issues.
* However, if the direction of technical change would favour more labour intensive technologies, then PC regulation would have advantages because it does not attach importance for the direction of technological change as ROR does.
105
3.9.4.3 Pulp and paper
In the 1980s and 1990s concerns over dioxin in paper products and wastewater led to the development of techniques that reduced the use of chlorine in the pulp and paper industry. As described by Reinstaller (2005) and Popp et al. (2007) it was public and consumer pressure that first led to this development. Firms innovated by anticipating regulatory changes. In fact, the development of alternative bleaching technologies increased before new environmental regulations were put in place. Popp et al. (2007) emphasise that this anticipatory effect was limited. Not all firms participated. Voluntary programs and labelling by industry was not well-suited for additional innovation. The implementation of stricter regulations led to a second wave on innovative activities and adoption of new technologies. Finland and Sweden enacted stricter regulations and achieved faster diffusion of the new technologies than in the US and Japan that enacted a weaker regulation and later on. This example shows that regulation and the threat of coming regulation is not only a focussing device for innovative activities but also affect the diffusion and adoption of new technologies.
Interestingly, the pulp and paper example also shows that there are dangers to the use of early regulation. Early standardisation in Finland and Sweden led to the adoption of TCF technologies, later on technological research led to ECF technologies that have the same environmental characteristics but are cheaper in the production process.
3.9.4.4 Pharmaceuticals
Casper and Matraves (2003) state that the pharmaceutical industry remains highly regulated but there have been important movements towards increased market harmonisation. Due to the Single European Market legislation, the European Medicines Evaluation Agency (EMEA) has recommended biotechnology and other "high tech" drugs for EU-wide circulation in the EU, reported any adverse reaction, and coordinated inspections since January 1st, 1995. Application to the EMEA is optional for other products, using non-leading-edge technologies, where firms that supply the local market only negotiate with national agencies.
With one single license the EMEA has the power to centrally approve medicines. The International Conference on Harmonisation (ICH) was implemented in 1990 to bring together regulatory authorities and drug developers from the major domestic markets (US, EU, Japan) to internationally harmonise regulatory procedures. In 1997 the US and the EU signed the Pharmaceutical Mutual Recognition Agreement that eliminated regulatory barriers as inspection of manufacturing facilities, which had increased cost and caused delays in availability.
Concerning price intervention, the common mounting governmental concern over increasing healthcare cost leads to a negative impact on pharmaceutical prices by reducing reimbursement rates and increasing the "limited lists" (Matraves 1999). In comparison to the US, where there is very little direct price intervention, in the EU and Japan there is indirectly substantial price intervention due to a high degree of public procurement. In these countries most pharmaceuticals are not purchased by the final consumer but prices are set through bargaining with a public agency. This changes bargaining power consequently prices are much lower in countries with a high share of public procurement. Despite the implementation of the Single European Market,
106
significant variation in price formation and reimbursement of medicinal products across member states remain.
However, the effect on innovation is unclear. Friederiszick et al. (2009) find that in designing optimal pharmaceutical pricing and reimbursement regulation, the benefits of more affordable or cost-effective drugs must be traded against the costs of less pharmaceutical innovation, with fewer projects being developed in general and in particular in low-margin therapeutic areas and with little potential of being considered highly innovative at the time of market launch. This effect is amplified because innovation in pharmaceuticals is expensive, also due to the expensive approval regulation that aims at assuring product safety. DiMasi et al. (2003) estimated that the average cost of bringing a new drug to the market has a present value cost of 800 million US dollar. Adams and Brantner (2006) estimated the cost to be anywhere from $500 million to $2 billion. This led to the charge that regulation leads to longer development times and shortens the period during which drug companies can earn the returns. Thus existing regulation tends to reduce innovation incentives. Apart from the fact that there is also considerable criticism on the innovation behaviour of the pharmaceutical industry*, there are, however, also considerable public policy responses to the reduced innovation incentives. First, basic research that is a central ingredient for applied pharmaceutical research is massively publicly financed at universities, government and private laboratories. Second, there are important financial incentives for firms that develop drugs for rare diseases, so called orphan drugs. The EU regulation No 141/2000 stipulates that pharmaceuticals developed to treat rare diseases are referred to as orphan medicinal products. The EU's definition of an orphan condition is broader than that of the USA, in that it also covers some tropical diseases that are primarily found in developing nations. The EU's legislation is administered by the Committee on Orphan Medicinal Products of the EMA.
The discussions on the politics of regulation (e.g. Pommerand 2006, Carpenter 2010) confirm largely the picture drawn by Paraskevopoulou (2009) for the detergents industry. The identification of a market failure leads to the anticipation of regulation. The bargaining process over the regulation is dominated by proactive lobbying of the interested parties. However, in the case of pharmaceuticals regulation does not provide a focussing device for the direction of innovation. Regulation is primarily oriented at providing product safety for users. Thus other policy instruments such as public funding and specific tax incentives provide relevant devices to guide the direction of research.
3.9.5 The importance of regulation for innovation: empirical results After having provided insights into the working of regulation and innovation in specific industries, let us now provide some evidence on regulation as incentive to innovate in a cross-industry setting. This analysis exploits the fact that in harmonised CIS 3, CIS 4 and CIS 2006 questionnaires firms are asked about the effects of their innovation activities. The question is "How important were each of the following effects of your product (good or service) and process innovations introduced during
* An editorial in the respected journal The Lancet this is formulated as follows: "In last-ditch flings at seeking new markets, the drugs industry can only come up with new indications for old drugs and me-too compounds to barge into existing markets." (The Lancet (2004) Is that it, then, for blockbuster drugs?
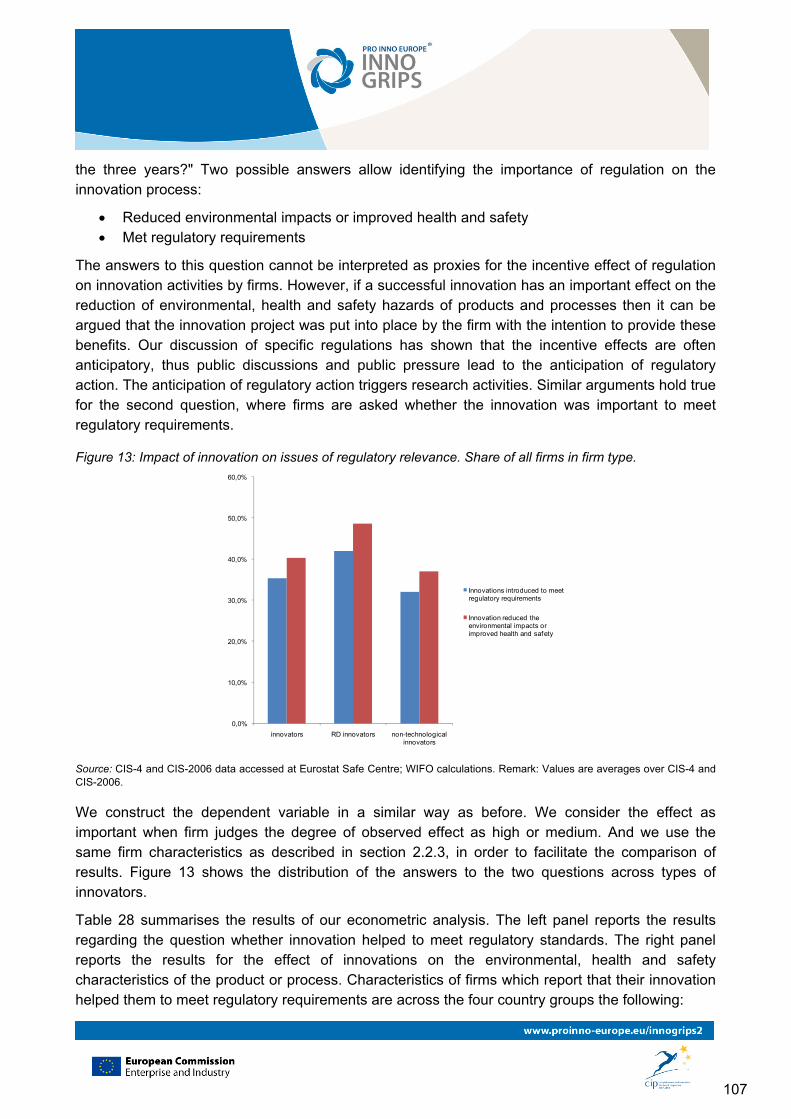
107
the three years?" Two possible answers allow identifying the importance of regulation on the innovation process:
Reduced environmental impacts or improved health and safety Met regulatory requirements
The answers to this question cannot be interpreted as proxies for the incentive effect of regulation on innovation activities by firms. However, if a successful innovation has an important effect on the reduction of environmental, health and safety hazards of products and processes then it can be argued that the innovation project was put into place by the firm with the intention to provide these benefits. Our discussion of specific regulations has shown that the incentive effects are often anticipatory, thus public discussions and public pressure lead to the anticipation of regulatory action. The anticipation of regulatory action triggers research activities. Similar arguments hold true for the second question, where firms are asked whether the innovation was important to meet regulatory requirements.
Figure 13: Impact of innovation on issues of regulatory relevance. Share of all firms in firm type.
0,0%
10,0%
20,0%
30,0%
40,0%
50,0%
60,0%
innovators RD innovators non-technological innovators
Innovations introduced to meet regulatory requirements
Innovation reduced the environmental impacts or improved health and safety
Source: CIS-4 and CIS-2006 data accessed at Eurostat Safe Centre; WIFO calculations. Remark: Values are averages over CIS-4 and CIS-2006.
We construct the dependent variable in a similar way as before. We consider the effect as important when firm judges the degree of observed effect as high or medium. And we use the same firm characteristics as described in section 2.2.3, in order to facilitate the comparison of results. Figure 13 shows the distribution of the answers to the two questions across types of innovators.
Table 28 summarises the results of our econometric analysis. The left panel reports the results regarding the question whether innovation helped to meet regulatory standards. The right panel reports the results for the effect of innovations on the environmental, health and safety characteristics of the product or process. Characteristics of firms which report that their innovation helped them to meet regulatory requirements are across the four country groups the following:
108
Innovation projects targeted at meeting regulatory standards seems to be more frequent for larger firms than for small firms across all country groups. This might be related to the fact, that larger firms perform more often process innovations than smaller firms do.
Fast growing firm (gazelle) report in general that their innovations had the goal to meet regulatory requirements. However, there is a difference across country groups. For country groups 2, 3 and 4 the relationship seems to be positive, while for country group 1 the relationship is negative. This seems to suggest that in this country group the anticipation of regulation is more important than for firms in the other country groups. The same pattern holds true for firms that operate in international markets.
Being part of an international firm reduces the likelihood of doing innovations to meet regulatory requirements, except in country group 1. In all likelihood this is more related to the fact that international firms in country groups 2 and 3 generally are affiliated to firms from country group 1. These have already adopted products and processes that fit the regulatory requirements, and therefore there is no need to innovate to meet regulatory requirements. This argument seems more plausible than the conjecture that internationalised firms are able to set up production in areas with lower regulatory requirements.
Manufacturing firms more often mention that their innovations had met regulatory standards.
In general both product and process innovators report a high impact of their innovations on the regulatory requirements. R&D innovators report on average that the impact of their innovations on regulatory requirements is higher than for non-technological innovators.
Characteristics of firms which report a significant positive effect of their innovation activities on environmental impact on, health impact on and safety of the their products and processes are the following:
Larger firms generally report a higher impact of their innovation activities on the environmental, health and safety characteristics of their products and processes. This result is quite robust across country groups and types of innovators and suggests that anticipatory R&D is performed largely by large and established firms on the market.
Fast growing firm (gazelle) report that their innovations provide such effects more often than other firms. This result holds especially for country groups 1, 2 and 3 but not for country group 4.
Firms that operate in international markets mention that their innovation had a positive effect on environment, health and safety characteristics of their products than non-internationalised firms.
Being part of a foreign corporate group is a (weakly) important characteristic only for country group 1. Interestingly the impact of being part of an international or national group decreases the likelihood that firms report a high impact of their innovation activities on the environmental, health and safety characteristics of their products and processes.
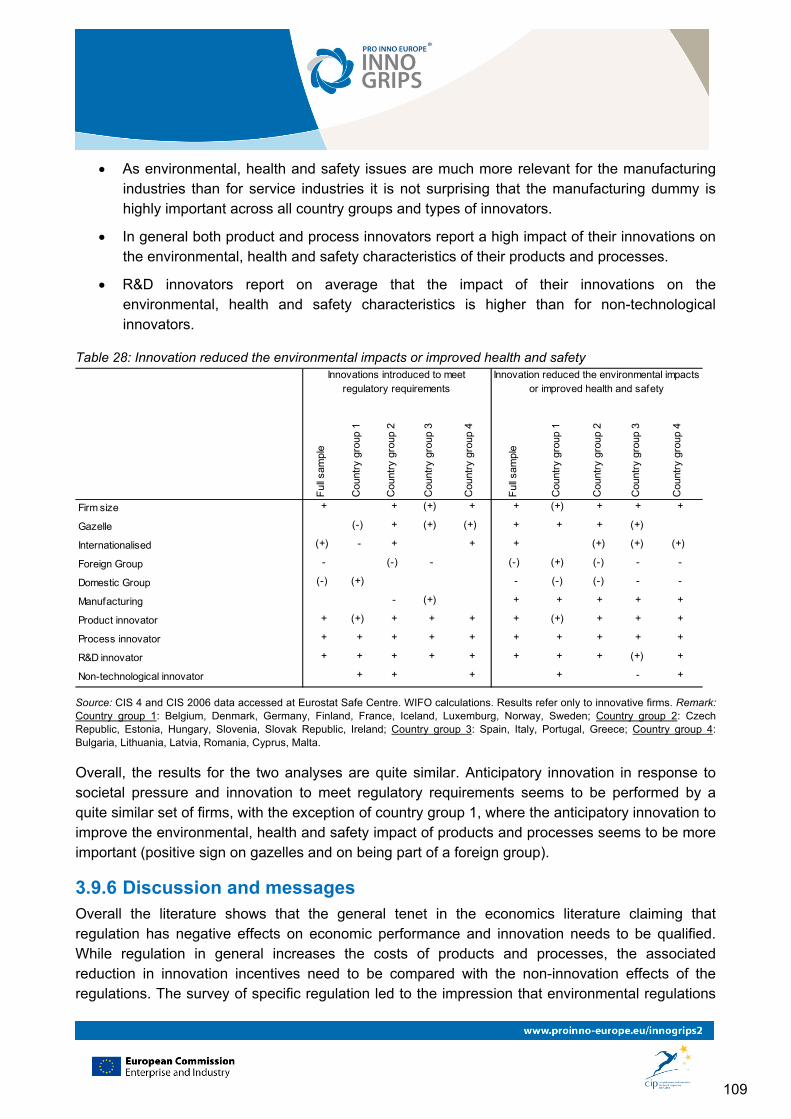
109
As environmental, health and safety issues are much more relevant for the manufacturing industries than for service industries it is not surprising that the manufacturing dummy is highly important across all country groups and types of innovators.
In general both product and process innovators report a high impact of their innovations on the environmental, health and safety characteristics of their products and processes.
R&D innovators report on average that the impact of their innovations on the environmental, health and safety characteristics is higher than for non-technological innovators.
Table 28: Innovation reduced the environmental impacts or improved health and safety
Ful
l sam
ple
Cou
ntry
gro
up 1
Cou
ntry
gro
up 2
Cou
ntry
gro
up 3
Cou
ntry
gro
up 4
Ful
l sam
ple
Cou
ntry
gro
up 1
Cou
ntry
gro
up 2
Cou
ntry
gro
up 3
Cou
ntry
gro
up 4
Firm size + + (+) + + (+) + + +
Gazelle (-) + (+) (+) + + + (+)
Internationalised (+) - + + + (+) (+) (+)
Foreign Group - (-) - (-) (+) (-) - -
Domestic Group (-) (+) - (-) (-) - -
Manufacturing - (+) + + + + +
Product innovator + (+) + + + + (+) + + +
Process innovator + + + + + + + + + +
R&D innovator + + + + + + + + (+) +
Non-technological innovator + + + + - +
Innovations introduced to meet regulatory requirements
Innovation reduced the environmental impacts or improved health and safety
Source: CIS 4 and CIS 2006 data accessed at Eurostat Safe Centre. WIFO calculations. Results refer only to innovative firms. Remark: Country group 1: Belgium, Denmark, Germany, Finland, France, Iceland, Luxemburg, Norway, Sweden; Country group 2: Czech Republic, Estonia, Hungary, Slovenia, Slovak Republic, Ireland; Country group 3: Spain, Italy, Portugal, Greece; Country group 4: Bulgaria, Lithuania, Latvia, Romania, Cyprus, Malta.
Overall, the results for the two analyses are quite similar. Anticipatory innovation in response to societal pressure and innovation to meet regulatory requirements seems to be performed by a quite similar set of firms, with the exception of country group 1, where the anticipatory innovation to improve the environmental, health and safety impact of products and processes seems to be more important (positive sign on gazelles and on being part of a foreign group).
3.9.6 Discussion and messages Overall the literature shows that the general tenet in the economics literature claiming that regulation has negative effects on economic performance and innovation needs to be qualified. While regulation in general increases the costs of products and processes, the associated reduction in innovation incentives need to be compared with the non-innovation effects of the regulations. The survey of specific regulation led to the impression that environmental regulations
110
are more important than other regulations in providing focussing devices for innovation activities. This may be associated with the fact that environmental regulation creates substantial costs for the firms and the development of solution problems may provide substantial competitive advantage. In fact, the firms in a sector are heterogeneous. Firms that developed more environmentally friendly production technologies or substitutes may act as promoters and supporters of more restrictive environmental regulation. This is the dynamic interplay described by Kemp (2000), where innovations may pave the way for new regulations.
The costs and benefits of regulation can only be assessed by an industry by industry basis. In general competition-enhancing regulation or deregulation creates incentives to innovate for both incumbents and new entrants. However, we would argue that the use of regulation as innovation policy is constrained to a few regulations that act as focussing devices for new innovations – mainly environmental regulation and regulations that are established because of strong public pressure.
The literature on the politics of regulation shows that there is a close relationship between standards and regulation. Often regulation uses standards to define acceptable behaviour and voluntary industry standards and codes of conduct are often used in response to public and political pressure for regulation. Thus much of what has been said with regard to standards holds also true for regulation. The difference is that regulation imposes mandatory standards while norms are voluntary.
With regard to regulation EU policy is also subject to the subsidiarity principle. What is the role of the EU with regard to regulation? Common rules, standards and norms are central for the establishment of an undistorted and free single market. As mentioned earlier it is a central role of the EU to act as regulator. Member states face the temptations to side-step the free and undistorted trade within the Union, in order to protect domestic producers from competitors. There might even be a conflict with the subsidiary principle, because national regulation may aim to achieve legitimate national political goals but erects at the same time costly or insurmountable barrier to trade. In case of doubt, priority should be given to the completion of the single market and centralised regulation, especially when the principle of mutual recognition of regulation breaks down or leads to excessive regulatory competition. From an innovation policy point of view a common regulation is similar to the reduction of product market regulation, thus it should provide increased incentives for innovation.
3.10 Conclusions on the analysis of barriers of innovation This Chapter has examined the factors hampering innovation of innovative firms. Chapter 2 has shown that internationalisation and innovation are closely complementary. This implies that barriers to innovation hamper competition of European firms on non-EU markets. This section has examined first innovation barriers that are internal to the firm and closely related to the decision to allocate resources to innovation investment. These barriers are knowledge as well as financial and skill barriers. The second part of this chapter has examined innovation barriers that are external to the firm as well. These barriers are IPR protection, standards and regulation.
111
Knowledge barriers refer to a lack of knowledge on technologies, markets and knowledge sources. This report shows that small firms and firms that are not part of a larger corporate group are more likely to experience such problems. With respect to larger corporations or affiliated groups they cannot spread overhead costs related to knowledge sourcing activities or measures of internal knowledge management over a larger output or several productive units. Smaller firms are also more likely to report technical knowledge barriers in industries where it is more difficult to build up new knowledge as it is more heavily based on previous competencies. The analysis also indicates that firms with high skill intensity or firms that are internationalised systematically report to experience higher knowledge barriers to innovation. They are better aware of the limits of their knowledge as they operate on more competitive markets and hence report higher barriers. When identifying barriers it is therefore important to look at these firms. Looking at industry characteristics the results indicate that the lack of technical knowledge is perceived as being important especially in industries with medium or low innovation intensity. Manufacturing firms are also more likely to report knowledge barriers than firms in service sectors.
Financial barriers to innovation and shortages of skilled personnel affect similar firm types. Financial barriers are closely related to the risk profile of the firm. They have a higher impact on innovation for SMEs and young firms with very novel products and technologies, as well as on fast growing firms. The same applies to R&D intensive firms and firms that rely heavily on basic research. Firms that are engaged in both innovation and internationalisation are also more likely to report to be financially constrained as carrying out both activities at the same time is more risky. Essentially the same types of firms perceive shortages of skilled personnel as a serious problem. The likely reason for this analogy is that risky activities such as innovation and internationalisation are in most cases also more skill and technology intensive. The results presented here show that manufacturing firms are on average also more likely to report both barriers as a factor constraining innovation than service firms. In line with the general findings on technological upgrading across EU member states we also find that financial and skill constraints more serious the more technologically advanced a firm and the country it is located in are.
Looking at firm types this chapter shows that R&D innovators, non-technological innovators and barrier-related non-innovators display a much higher perception of innovation barriers. Given the definition of barrier-related non-innovators it is not surprising that barrier-related non-innovators rank innovation barriers higher than innovators. More surprising is that after controlling for a variety of firm and industry characteristics non-technological innovators have higher propensities to mention skill constraints and lack of market knowledge as important hampering factors to innovation than R&D innovators. This finding needs to be considered cautiously however, as its statistical significance is not very high. Thus it can be safely concluded by our analysis that barrier-related non-innovators by and large report the same barriers as innovators.
Fast growing SMEs (gazelles) are more likely to report different constraints in function of the level of technological development of the country in which they are located. In the most advanced countries growth strategies tend to be innovation strategies. As a consequence they report problems related to all barriers discussed so far. Gazelles in the Southern European countries tend to indicate to be more financially constrained. Gazelles in the countries that heavily import
112
technologies seem to face higher skill barriers. The intuition behind the differences across country groups is found in the distribution of gazelles across country groups. Approximately 50% of high growth firms located in the technologically most advanced countries are R&D innovators. In the group of technology importers and Southern European countries only around 30% of gazelles are R&D innovators and in the technologically least developed countries the figure goes down to around 5%. The results are thus in line with the findings on barriers to innovation for R&D innovators who report higher barriers than other types of firms. Otherwise, gazelles are less likely to report barriers than other firms as probably they are among the more successful firms.
Ownership of IPRs can help firms to overcome problems to access finance: young SMEs that can protect their innovations better through IPRs are less likely to be affected by financial constraints for technology intensive firms. It is easier to obtain VC financing when a patent application has been filed. However, it is widely acknowledged that the current European IPR system is not favourable for innovation. The lack of a single European patent makes it very expensive to get protection of intellectual property for a large number of countries. SMEs and other people or organisations without the resources to afford the high cost both in terms of time and money of filing a patent are put at a disadvantage by the current system.
Standards play an important role for the diffusion of technology and as focussing device for innovative search. They are also conducive to international trade as they help defining important product characteristics in foreign markets more clearly. SMEs benefit from the process of standardisation as it leads to transfer of expert knowledge and supports cooperation between enterprises, research institutions and the public sector. For these reasons standards are of comparable importance as source for innovation as patents. However, guiding early standardisation processes is difficult as it requires the identification of promising themes of standardisation. In addition new impulses from R&D need to be integrated into the ongoing process of standardisation. Otherwise standardisation runs the risk to cause an early lock-in to inferior technologies. On the other hand, as in most of the areas of research, patenting, innovation and standardisation SMEs are at disadvantages compared to large companies. Therefore many SMEs see the process of standardisation as subject to regulatory capture by large firms.
There is a close relationship between standards and regulation. Regulation is often based on standards to define acceptable behaviour, and codes of conduct are frequently used in response to public and political pressure for regulation. The difference is that regulation imposes mandatory standards. This tends to increase the costs of products and processes, and thereby reduces incentives to innovate. However, regulations can also act as a focusing device for innovation. Competition-enhancing regulation or deregulation can also create incentives to innovate for both incumbents and new entrants. However, the use of regulation as innovation policy seems to be relatively limited. Environmental regulations and regulations that are established because of strong public pressure are more important than other regulations in providing focusing devices for innovation activities. It also does not affect all firms equally. Larger firms and exporting firms report more often that their innovations improved the environmental, health and safety characteristics of their products or processes. The same firms state that their innovation activities helped to meet regulatory requirements.

113
4 The barriers to internationalisation This chapter aims to discover how firm-specific challenges, international trade barriers and language and cultural barriers affect the internationalisation of innovative firms and sectors in Europe, especially SMEs. It relies on a literature review of the main results available on the topics relevant for EU policy. The review will be complemented by empirical evidence from CIS micro-data and data at the level of industrial sectors.
The analysis seeks to gain insights into the following questions:
For which types of firms do trade barriers have a negative effect on their growth performance?
How do the barriers to internationalisation differ across countries and industries in the EU? Which types of firms in which countries are particularly affected by language and cultural
barriers?
The chapter begins with a literature overview of several relevant lines of research on the barriers to internationalisation and then continues with evidence on the activities of European SMEs, focussing on the country and sector differentiation outlined in Chapter 2. Special emphasis will be placed on institutional as well as language and cultural factors that continue to inhibit a more intensive internationalisation of SMEs.
4.1 Introduction European SMEs have been presented with new trading opportunities and growth potentials due to the dismantlement of trade barriers in the course of the globalisation dynamics in recent years, and because of the largely unimpeded circulation of production factors in Europe. A recent survey revealed that a significant number of European SMEs is already engaged in exporting: Some 25% of SMEs within the EU27 reported exports over the last three years. However, only half of them (13% of European SMEs) extend their activities beyond the EU market (European Commission 2010).* The fact that the majority of European SMEs does not export shows that there are still various barriers to a greater internationalisation of their activities.
The research on the internationalisation activities of firms suffers severely from the fact that, so far, no unified theoretical framework has been developed (Keupp and Gassmann 2009). Especially the recent discussion about the so called 'born globals' emphasises the fact that internationalisation may occur more rapidly and also in more diverse forms than predicted by traditional theories (Madsen and Servais 1997, Crick and Spence 2005, Gilroy et al. 2008, Brennan and Garvey 2009). Since a unified theory of SME-internationalisation is still missing, the views on barriers vary according to the theoretical viewpoint taken (Johanson and Vahlne 1977, Cohen and Levinthal 1990, de Clerq et al. 2005, Westhead 2007). In terms of the drivers for internationalisation, the eclectic and descriptive "OLI framework" (Dunning 1988, 2000) captures ownership-specific factors
* This data stems from a very recent report on the "Internationalisation of European SMEs" and is based on a survey of 9480 SMEs in 33 European countries that was conducted in 2009.
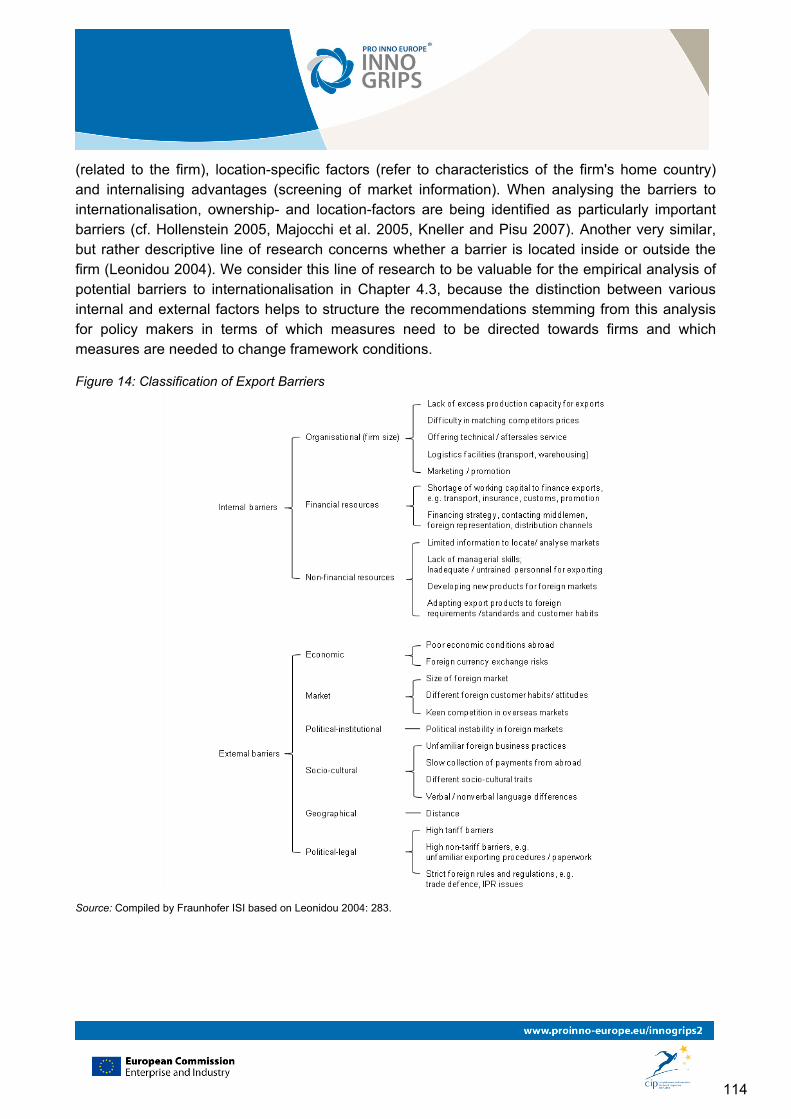
114
(related to the firm), location-specific factors (refer to characteristics of the firm's home country) and internalising advantages (screening of market information). When analysing the barriers to internationalisation, ownership- and location-factors are being identified as particularly important barriers (cf. Hollenstein 2005, Majocchi et al. 2005, Kneller and Pisu 2007). Another very similar, but rather descriptive line of research concerns whether a barrier is located inside or outside the firm (Leonidou 2004). We consider this line of research to be valuable for the empirical analysis of potential barriers to internationalisation in Chapter 4.3, because the distinction between various internal and external factors helps to structure the recommendations stemming from this analysis for policy makers in terms of which measures need to be directed towards firms and which measures are needed to change framework conditions.
Figure 14: Classification of Export Barriers
Source: Compiled by Fraunhofer ISI based on Leonidou 2004: 283.
115
4.2 Barriers to internationalisation: their internal and external dimensions
There are two distinct types of barriers to internationalisation which are relevant for companies (Leonidou et al. 1998, Leonidou 2004). The first are internal to firms and refer to barriers associated with organisational, financial and non-financial resources.* Organisational shortcomings include inefficiencies in production, marketing, or logistics, while non-financial factors refer, for example, to informational deficits in terms of identifying and selecting international opportunities. Non-financial barriers also include the role of the owner or managers, whose perception of risks may critically affect internationalisation decisions (Arranz and de Arroyabe 2009). The second are external and refer to barriers originating from the environment in which the firm operates. They include barriers which cannot be influenced by the firm itself. They can be grouped according to economic conditions, foreign market circumstances, geographical settings, political-institutional factors, socio-cultural aspects, and political-legal aspects (own compilation based on Leonidou 2004). Figure 14 gives an overview of the different dimensions of barriers to internationalisation.
4.2.1 Internal barriers
4.2.1.1 Firm size and resources
Despite the fact that the decision to engage in export activities is an individual decision of the firm (Crick and Spence 2005, Arranz and de Arroyabe 2009), there are certain challenges that are strictly related to the firm's size and the resources it has available. However, the size of a firm is not the only major factor. Leonidou's classification and the empirical results of a recent OECD study (2009) list the financial and non-financial resources needed for internationalisation, which do not necessarily depend on firm size.
The size of the firm has often been portrayed as a determining factor of internationalisation (see Ruzzier et al. 2006 for an overview of different strategies of SMEs and MNEs). This includes organisational aspects such as production, logistics, marketing or service capacities. Larger firms can profit from economies of scale regarding the infrastructures needed for these tasks and can thus offer better prices (see also section 4.2.3, where we summarize the barriers most relevant for SMEs).
Financial resources are needed to bear the costs of internationalisation. These entail large up-front costs for screening markets or defining the entry strategy (Lu and Beamish 2001, Hollenstein 2005). A company – irrespective of its size – not only requires financial resources for financing customs, insurance, transportation, distribution and promotion, but has to invest in strategy building, identifying the opportunities in foreign markets, setting-up first contacts, etc. even before entering foreign markets (Peteraf 1993, Morgan & Katsikeas 1997, Hessels and Terjesen 2010). The availability of such working capital may not only depend on firm size but also the firm's
* In this chapter the internal dimension of the barriers refers exclusively to firm specific issues. There is a slight difference to the debate about the barriers to innovation which is outlined in the beginning of chap. 3.
116
productivity (see previous chapter) and stock of capital. Venture capital and public support for internationalisation play an important role in this respect (Acs and Szerb 2006).
Non-financial resources refer to the firm's capabilities to internationalise its economic activities. Firms use a wide variety of entry modes into foreign markets such as selling via agents and distributors, licensing, franchising and other contractual arrangements (Burgel and Murray 2000, Crick and Jones 2000, Oviatt et al. 2004). It can be assumed that those entry modes will be selected that minimise transaction costs. These costs may be reduced if a firm has access to a network of partners abroad. The existence of network barriers seems to be more relevant for more differentiated goods than for homogeneous products (Rauch 1999). This suggests that technology-intensive firms are more likely to face network barriers than firms that trade in lower technology and less differentiated goods (Chaplin 2009). Besides contacts and networks which help to overcome informational gaps, it is important that the firm has highly-skilled managers who are able to deal with exporting (Arranz and de Arroyabe 2008). Finally, exporting may require new products to be developed for foreign markets or existing products to be adapted to the foreign market requirements. The innovative capacity of a firm is assumed to have a high impact on internationalisation (see the previous chapter), i.e. a lack of innovativeness can pose a barrier to internationalisation.
Firm size, financial and non-financial resources define the (meta-)set of internal barriers which are tested in our empirical analysis.
4.2.1.2 Export experience
Whether a particular firm identifies a barrier as relevant for its activities is often related to export experience (Kneller and Pisu 2007). The basic argument is that firms that have exported in the past perceive internal and external barriers to be less important than export novices. As export experience rises, the total number of perceived barriers tends to decline. Therefore, the internationalisation of SMEs as well as the barriers they face should be considered with regard to their position along the exporting experience spectrum (Westhead 2008). There are various ways to differentiate the types of firms according to their export experience. Leonidou (2004) identifies three types of exporters: non-exporters that have no export experience but future potential, current exporters that are currently involved in international activities, and ex-exporters that used to be exporters and see export barriers from an experiential point of view.* The impact of export barriers varies greatly among these three groups.
The number of years a firm has been exporting is consistently related to the perception of export barriers in contrast to several other indicators such as R&D intensity, the size of the firm or even export intensity (Kneller and Pisu 2007). However, there seems to be diminishing marginal utility here because a slight increase in absolute experience has a disproportionately large impact on export intensity for firms in their early stages (Majocchi et al. 2005).
* In a similar way Westhead (2007) breaks down the experience of firms into disinterested exporters, disappointed exporters, export capable firms, and committed exporters.
117
The export experience of a firm will also be included in the empirical analysis. Here, we are going to show how different barriers affect export propensity (the likelihood of a firm to export) on the one hand and export intensity (the export share of the total turnout) on the other hand, assuming that export intensities increase with experience. Thus we are able to differentiate between barriers which prevent firms from exporting at all and barriers which prevent (experienced) firms from expanding exports.
4.2.2 External barriers External trade barriers continue to have an effect on global markets (Kneller & Pisu 2008). Some of these barriers are quite stable or vary only in the long-term perspective, such as the economic capabilities of a country, political stability or geographical and cultural aspects. Some can be influenced by political decisions or agreements and can thus be regarded as alterable in a medium-term or even short-term perspective.
4.2.2.1 Alterable external barriers
We perceive political-legal barriers to internationalisation as changeable, as they can be altered by political decisions or agreements or lowered by support mechanisms.
Political-legal barriers include tariff and non-tariff barriers and strict foreign rules or regulations (such as trade defence mechanisms or IPR rules). For several sectors, tariffs are still important for exports, but there does not seem to be any consistent or predictable pattern as to where they are applied (Fliess & Busquets 2006).*
Non-Tariff Barriers (NTBs) have become more prominent over time and seem to matter more in international trade since tariffs have been lowered in the course of various WTO Trade Rounds. These external barriers mainly refer to the paperwork needed for registration and documentation, customs procedures, quantitative restrictions, standards, or sanitary and other technical requirements (see also COM(2008) 874 final). These behind-the-border regulations seem to hamper trade more than formal at-the-border rules (COM(2008) 874 final). Today, NTBs are considered to be more relevant than formal tariffs and quotas. The most frequent non-tariff barriers are burdensome customs procedures as well as discriminatory tax rules and practices, technical regulations, standards and conformity assessment procedures, sanitary and phytosanitary (SPS) measures. Other, more investment-oriented issues include poor protection of intellectual property rights, barriers to trade in services and foreign direct investment, or the abusive use of subsidies. The costs that arise through NTBs vary across both goods and countries. Usually, behind-the-border regulations are higher in developing countries than those reported for the OECD countries (Anderson and von Wincoop 2004).
* Most countries use tariffs and quotas to grant protection to economic sectors that are of strategic importance (Agriculture, ICT, certain consumer goods, etc.).
118
4.2.2.2 Stable external barriers
Based on Leonidou's (2004) collection of external barriers, we group economic and market conditions as well as political-institutional and socio-cultural conditions under this heading. These are all outside the direct reach of policy makers and tend to change only in the long run, if at all.
Economic and market conditions refer to the basic characteristics of foreign countries and markets such as economic power, currency stability, market size, customer habits or intensity of competition on the market. Economic conditions have to be regarded not as market entry barriers, but rather as structural barriers, as they indicate whether any markets for foreign goods actually exist.
Political-legal factors (e.g. tariff and non-tariff barriers, see above) often have to do with the overall institutional quality of the respective country. Institutions are considered to have a strong impact on economic development (North 1991, Acemoglu et al. 2005). A "good" institutional setting should enforce property rights, constrain the actions of elites, politicians, and other powerful groups and ensure some degree of equal opportunities for broad segments of society (Acemoglu 2003). These conditions are often not met, especially in developing countries. It has also been argued that the quality of political institutions significantly influences international trade (Dollar & Kraay 2003). The finding that countries with a similar institutional quality share a higher volume of trade (Linders et al. 2005) also has implications for the EU's foreign and development policy.
The decision to export is also influenced by factors relating to language and cultural barriers (Linders 2008). Market attraction has a geographical dimension, as markets in nearby international locations are preferred which have less political and cultural uncertainty than those that are geographically distant (Ateljevic 2004). Cultural barriers are relevant both within the EU and outside it, but might be assumed to be higher for exports to non-EU countries.
a.) Language Barriers
Many obstacles to internationalisation are encountered in the initial stages of the process and are often related to language problems (Disdier and Mayer 2007). Even though language barriers are apparently diminishing as English is becoming increasingly adopted as the standard language for business interactions, the respective language of the target country remains important, especially regarding marketing issues. Language proficiency also improves access to the local market (costumers, competitors, authorities, etc.) and therefore helps to reduce information deficiencies.
A widespread assumption is that if two countries share the same language, this will promote trade between them (e.g. Eaton and Kortum 2002). However, more recent research has revealed that bilingualism is very important with regard to communication and that linguistic diversity and literacy at home are positively correlated with foreign trade (Melitz 2008). This line of research also assumes that language competencies matter for different sorts of goods: rudimentary communication might suffice for trading homogeneous goods, while heterogeneous goods may well require more sophisticated language skills (Melitz 2008).
It can be assumed that these barriers are more severe in countries where the population is not generally proficient in the major world languages of English, Spanish and French (not to mention Chinese and Indian). Similarly one might expect SMEs to have export relations with those
119
countries with a similar cultural and language background (e.g. Spanish SMEs have much stronger relations with Latin America). Overcoming these types of barriers ultimately has to do with educational and immigration policies.
b.) Cultural Barriers
Cultural differences cover everything from religious differences to values, customs and attitudes. Their effect on the exporting firm is intangible as they determine consumer behaviour, marketing strategies or societal cleavages. "Bilateral affinity" (the mutuality of positive opinion about each other) has a positive impact on trade patterns (Disdier and Mayer 2007).* The underlying assumption is that countries which share similar cultural features have more similar tastes, lower communication and information costs and greater trust – all of which together contribute to increased levels of trade.
Economic relations are influenced by the level of bilateral trust, which in turn is the result of a historical process. Cultural aspects such as a shared religion or a history of conflicts influence public opinions and trust (Guiso et al. 2004). Lower levels of trust between countries result in less trade, less portfolio investment, and less direct investment. Based on the fact that cultural features are embodied in people, it is assumed that cultural differences decrease with migration (Rauch 2001). There is evidence that bilateral migration has a significant and robust impact on promoting trade (Rauch and Trindade 2002).†
If two countries share the same language (which reduces trading costs) and past colonial links (which establishes trade networks) this has been shown to increase trade. Rauch and Trindade (2002) focus on the existence of ethnic networks and are able to show that they reduce information uncertainties between trade partners. Reduced uncertainties due to ethnic networks explain bilateral trade flows. However, it needs to be emphasised that it is extremely difficult to filter out whether the export decision was based on cultural ties or simple business opportunities.
Taken together, cultural barriers are still important in today's analyses of international trade. Approaches such as cultural differences are, however, difficult to integrate in statistical models. We will incorporate language and cultural barriers into our model by focussing on language competencies and different socio-cultural traits (colonial ties).
4.2.2.3 Sector-specific external barriers
On closer inspection, several of the above mentioned external barriers are more relevant for a specific sector than for another. A closer analysis of SPS measures for example is more relevant for agricultural trade than for machinery. Following the sectoral approach of the present study (see
* The affinity between two countries "[…] (which notably influences preferences of consumers) […] is itself generated by a complex mixture of exogenous "historical accidents" (good or bad) that arose between the two countries, and more endogenous economic characteristics of the two countries." (Disdier and Mayer 2007: 1141) † While most studies focus on the level of cultural familiarity to explain trade flows, Linders et al (2005) employ the concept of cultural distance, which is defined as the extent to which the shared norms and values in one country differ from those in another. The concept refers to four dimensions along which cultures may differ (Hofstede 2001 as referred to by Linders et al 2005): Equality of power, uncertainty avoidance, individual vs. collective values, masculine vs. feminine values. However, it is difficult to operationalise this concept.
120
Box 1, p. 7 in this report, Peneder 2010) it may be argued that external barriers have different effects on the sectoral level.
A general distinction between economic sectors can be drawn between service and manufacturing (Lejpras 2009).* It can be assumed that barriers to internationalisation affect manufacturing and service sectors differently inasmuch as the service sector requires more costumer oriented actions and presence on the ground (Wolfmayr 2008). In the case of services, non-tariff barriers such as government regulations, licensing or certification requirements or other measures that act as market access barriers (e.g. amount of firms allowed to enter the market) are more likely to be encountered than broader measures such as tariffs (Wolfmayr 2008).
Even though some progress has been made regarding the dismantling of tariffs and export subsidies, there are still large differences between WTO members' position regarding sectoral market access improvements and reductions in trade distorting domestic support. This is mainly the case in agricultural trade. Here, tariffs and domestic and export subsidies vary a lot among countries. The EU's tariff and export subsidy on bovine meat, for example, are both in excess of 100% while Australia does not intervene at all (Ghazalian 2007).
Agriculture is a classic example of trade protection of upstream sectors (Høj et al. 2007). Other sectors that often receive special treatment in terms of competition policy include network industries, broadcasting, publishing, professional services, banking and insurance. Often, political goals such as consumer protection, financial system stability or universal service are mentioned to justify the exclusion of foreign competitors (Høj 2007).
In certain sectors, technical regulations act as important barriers to trade. They entail additional export market access costs. To meet national technical specificities, exporters must customize their products to meet certain technical norms, health, safety or environmental norms, or have to go through lengthy product labelling and conformity assessment procedures (Felbermayr 2008).
The protection of intellectual property rights (IPR) in the export destination is an important aspect for international trade. It can be assumed that limited IP protection may act as a barrier for trade and subsequently for technology transfer (Copenhagen Economic 2009). This is also important regarding the transfer of green technologies to large developing countries such as China which are in need for such technologies but show poor IP protection. Additionally it is important to note that in the case of carbon abatement technology, the BRICs often levy tariffs above 10 percent on such technology. They also apply various NTBs in the form of burdensome pre-shipment inspection and informal "additional payments" (Copenhagen Economics 2009).
Following this short overview we assume that certain sector-specific external barriers such as limited IPR protection or technical regulations are more important for companies in certain countries that consider these barriers as relevant for their innovation process. Up to now there seems to be no consensus whether companies in specific industrial sectors are particularly negatively affected by trade barriers. Therefore we include a sector variable (based on Peneder
* Services are often characterized by four aspects that strongly determine their internationalisation opportunities and their difference from manufacturing: services are often (i) intangible, (ii) short-lived, (iii) inseparable, and also (iv) heterogeneous.
121
2010) into the empirical analysis in order to gain insights on the impact of the barriers that were identified so far on certain sectors.
4.2.2.4 Country-specific external barriers
The identified external barriers in this study ranging from economic to political-legal factors (see Figure 14) are not only sector-specific but also country-specific. It was mentioned that a "good" institutional setting is a prerequisite for economic growth and also for being a credible trading partner. Stable economic conditions and low currency risks are among the most important requirements for trade (Kneller & Pisu 2006).
With regard to market barriers it is necessary to recall that certain variables have different effects depending on whether the target or the home country is the unit of analysis. One example is market size. It is argued that smaller home markets are a driver for internationalisation due to the fact that domestic firms can not achieve economies of scale and therefore turn towards international markets (de Clerq et al. 2005, Oviatt and McDougall 1999). Regarding target countries, smaller markets may act as a trade curtailing factor since it can be assumed that interested exporters rather consider trading with larger markets such as the US or China than with smaller countries.
In the context of the home country of the firm external conditions include the quality and also the amount of highly skilled personnel depend on the country's educational system, but also on cultural aspects of the respective country. Moreover, the availability of (and also the proximity to) research facilities such as universities supports exporting activities (Lejpras 2009).
The home country's distance to the technological frontier also determines the institutions that are required for a successful product innovation process (see above, also Reinstaller and Unterlass 2010). If the necessary institutions are not present, countries will find it difficult to commit their private sector to engage in innovations.
The scope of external barrier in target countries is more ample. The sophistication of buyers in foreign markets have been portrayed as being a driver for innovation as it increases the demand for technological products of higher quality (Hollanders & Arundel 2007). However, highly demanding and pretentious customers in target markets can be a barrier for firms in countries with less technological sophisticated industries. The notion of sophisticated buyers is also important for intra-sectoral competition between countries (i.e. high-tech competition between the US, Japan, and the EU). As customers become more informed about technological standards and prices, these countries become involved in price competition. The notion of sophisticated buyers is also important with regard to the Intra-EU market: One might expect buyers in the technological advanced countries to be more sophisticated for which it may become difficult for a firm form a less developed country to access these markets despite the free circulation of goods in the EU. Buyer sophistication is relatively stable external barrier.
Government regulation of business activity is an equally important determinant of growth and trade activities. The World bank Doing Business database (www.doingbusiness.org) contains indicators on regulations that effect business performance in 135 countries in seven regulatory areas: starting a business, hiring and laying off workers, registering property, getting bank credit, protecting equity
122
investors, enforcing contracts in the courts, and closing a business. It is shown by Djankov et al. (2006) that a more business friendly regulatory environment has positive impacts on economic growth. Business-friendly regulation can also be a proxy for the overall institutional quality.
Another important aspect regarding the institutional environment is investor protection regulations. A system of good investor protection leads more favourable framework conditions and increased economic opportunities (John et al. 2007). Such country characteristics are also important for a firm's internal governance (Doige et al. 2007) and good corporate governance may be considered a sign for reliable trading partners. In countries with poor financial development, companies will find it optimal not to invest in good governance and investor protection because they cannot expect any gains on the (capital) market (Doige et al. 2007). Taken together, investor protection granted by the state, economic development, the financial development, and the openness of the firm's are all important determinants of a firm's governance.
Barriers to trade vary among countries. Despite a largely liberalized trade and openness to foreign competition there are still various barriers in place (for an extensive overview of barriers to competition among OECD member states see Høj et al. 2007). There are partly significant differences among OECD member states in terms of market access via NTBs and/or competition policies. For example, while the exploitation of market power in setting prices is a violation of competition law in most OECD countries, for others such as Canada, Mexico, New Zealand, Norway or the US this does not constitute a violation (Høj 2007). Additionally, competition may be increased by easing restrictions on inward FDI in services and increased foreign access to procurement markets especially in Austria, Japan, New Zealand, the Nordic countries and Switzerland (Høj 2007). The overall global cost of such NTBs is immense. It is estimated that the overall costs of NTBs to European operators in China alone have been estimated at € 21.4 billion.*
On the country level, socio-cultural features may be related to political legal factors. It was presented by Gatti (2004), that the level of trade barriers is significantly associated with the level of corruption. The level of corruption can be used as an indicator for foreign business practices.
4.2.3 SME specific issues In a recent report reviewing various European and non-European studies the OECD examined the main barriers to greater internationalisation as reported by SMEs (OECD 2009). According to this study, the most important barriers to internationalisation for SMEs are very firm-specific. They include:
Shortages of working capital to finance exports. Limitations in finance and related physical resources continue to act as a main barrier to the internationalisation of SMEs especially for those that are in the initial stages of international activities.
Limited information to locate/analyse markets. This reflects the fact that even in times of extensive information availability information gaps remain a critical challenge to SMEs.
The inability to contact potential overseas customers. This barrier also relates to the information deficits that SME face when engaging in export activities. They might include
* See http://trade.ec.europa.eu/doclib/docs/2007/february/tradoc _133299.pdf.
123
obtaining adequate representation in target export markets, finding an appropriate foreign market partner or the difficulty of gaining access to an adequate distribution channel in foreign markets.
Lack of managerial time, skills and knowledge. The performance of many SMEs often depends on the abilities of the owner/ manager. Firm-level decisions to start international activities are largely motivated by the perceptions of management (Smith et al. 2006). The limited managerial knowledge base emerged as a top barrier to SME internationalisation in several recent surveys (e.g. Crick and Spence 2005).
These findings are consistent with many other studies on this topic (e.g. Hollenstein 2005; Kneller and Pisu 2007) that show that most barriers to internationalisation are internal to the firm. Limited financial resources might be a result of limited firm size. However, the inability to generate economies of scale might act as a far more important barrier (difficulty to match prices).
In terms of external barriers SMEs are in general more affected by formal tariff barriers because they often trade processed goods rather than semi-processed or raw materials (Flies and Busquets 2006). SMEs are also generally more vulnerable to the effects of NTBs since these regulations increase the price of a product in a foreign market. Administrative procedures and other implicit barriers hinder SMEs in their internationalisation efforts more than larger companies since large companies have the necessary resources to face these kinds of barriers (Leonidou 2004, Hollenstein 2005). Last, but not least, the effects of language and cultural barriers for SMEs depend on the personnel in charge of exporting activities while larger companies probably find it easier to hire more experienced employees.
Even though several barriers are more relevant for SMEs than for larger companies, SMEs are not unable to overcome their structural deficits. Brennan and Garvey (2009) for example highlight the fact that knowledge (in its various dimensions) can help to overcome certain barriers and therefore needs to be considered a driver of internationalisation. This notion is also important considering the insights on "born globals" (Oviatt and McDougall 1999, 2005). These firms, mainly SMEs, start their operations on an international scale because of their innovative capacity and their ability to serve costumers in niche markets. Additionally, the management in "Born Globals" is less hampered by infrastructural and "psychological" barriers as it is more entrepreneurial with a global strategic outlook compared to other firms (Knight et al. 2004). Therefore, the supposed "psychic distance" of far away markets and the tendency to start producing for the home market tends to decrease. International activities may have positive feedbacks on the innovative performance of SMEs as international learning and knowledge accumulation can also improve the product innovations in SMEs (Zahra et al. 2009).
Brenan and Garvey (2009) summarize the insights of the debate about the "Born Globals" as follows:
There is evidence of an increased pace of internationalisation in knowledge-intensive industries.
Knowledge-intensive products and services tend to have high costs up-front and low (or zero) marginal costs. The high level of intangible assets may drive the need for quicker market access and changes the incremental nature of internationalisation.
124
Developments in information technology may contribute to lower costs in internationalisation particularly when knowledge is the subject of the exchange.
Especially for firms operation in high technology sectors access to international knowledge networks determines the success of their international endeavours (Oviatt and McDougall 2005). Firms in high-tech sectors seem to increasingly utilize more partners and networks which allow high-tech SMEs with limited resources to learn and enter foreign markets more quickly (Saarenketo et al. 2004). Even though the barriers for technology-based firms vary significantly among the individual firm because their competitive advantage often depends on the possession of a very unique asset (Karagozoglu and Lindell 1998) it can be argued that network barriers are more relevant for SMEs than for larger firms.
Last but not least the export opportunities of SMEs are a result of their innovative capabilities. Results for technology-intensive SMEs (López Rodríguez and García Rodríguez 2005) indicate that innovations are highly significant for the export intensity. The positive effect of innovations on export activities of SMEs is constant across countries and can be found in studies regarding the studies from Turkish firms (Özçelik and Taymaz 2004), German and UK firms (Roper and Love 2005), or Italian firms (Basilie 2002).
The notion that internationalisation is accelerated by knowledge factors has several implications for policy makers and will also be included in the empirical analysis in Chap. 4.3.
4.2.4 Summing up the debate In this study, we are organizing the existing research and our empirical analyses of barriers to internationalisation along the major distinction between internal and external barriers. This is valuable, as these barriers occur at different levels: internal barriers are firm-specific, while external barriers occur at sectoral and country level. Thus, when deriving policy recommendations from our results, we can again draw on this distinction and conclude which measures should be targeted to companies and which (framework) measures are necessary in order to overcome external barriers. For the external barriers, we refer moreover to stable and alterable barriers, indicating that only the latter ones can be subject to short-term or mid-term political actions. External barriers are further differentiated along sector and country-specific lines.
The review in the previous section suggests that barriers are perceived differently among companies depending on their firm-specific characteristics. Still, firm size is expected to be an important variable and firm-specific resource barriers are the primary reasons for limited internationalisation activities (OECD 2009: 10). Different non-financial resources have been highlighted, indicating a high or increasing importance of these factors. They include contacts and networks which help to gain information about foreign market opportunities. Moreover, skilled personnel are relevant for exporting. With reference to the previous chapter we perceive also the innovativeness of a firm to be a central factor for internationalisation. Existing research moreover suggests that these internal barriers affect market entry and export intensity of a firm differently.
The external barriers refer to the framework conditions that a firm operates in. From the perspective of policy-making, most relevant factors are tariff and non-tariff barriers and strict
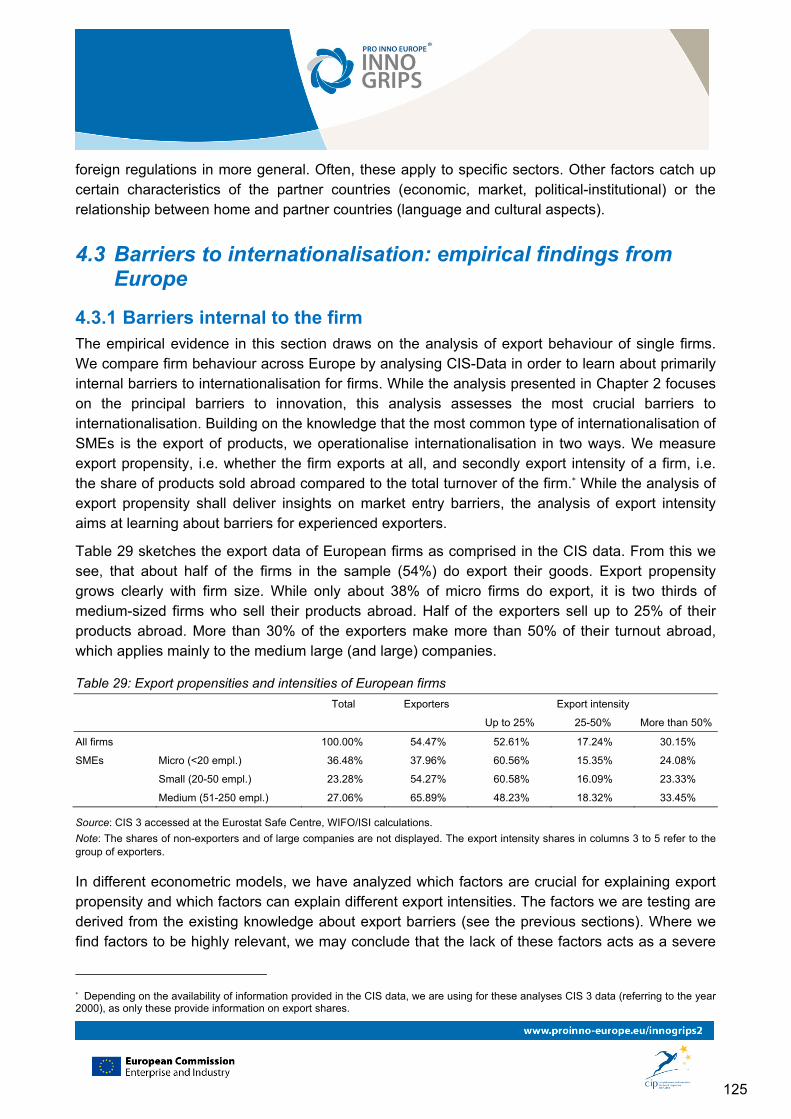
125
foreign regulations in more general. Often, these apply to specific sectors. Other factors catch up certain characteristics of the partner countries (economic, market, political-institutional) or the relationship between home and partner countries (language and cultural aspects).
4.3 Barriers to internationalisation: empirical findings from Europe
4.3.1 Barriers internal to the firm The empirical evidence in this section draws on the analysis of export behaviour of single firms. We compare firm behaviour across Europe by analysing CIS-Data in order to learn about primarily internal barriers to internationalisation for firms. While the analysis presented in Chapter 2 focuses on the principal barriers to innovation, this analysis assesses the most crucial barriers to internationalisation. Building on the knowledge that the most common type of internationalisation of SMEs is the export of products, we operationalise internationalisation in two ways. We measure export propensity, i.e. whether the firm exports at all, and secondly export intensity of a firm, i.e. the share of products sold abroad compared to the total turnover of the firm.* While the analysis of export propensity shall deliver insights on market entry barriers, the analysis of export intensity aims at learning about barriers for experienced exporters.
Table 29 sketches the export data of European firms as comprised in the CIS data. From this we see, that about half of the firms in the sample (54%) do export their goods. Export propensity grows clearly with firm size. While only about 38% of micro firms do export, it is two thirds of medium-sized firms who sell their products abroad. Half of the exporters sell up to 25% of their products abroad. More than 30% of the exporters make more than 50% of their turnout abroad, which applies mainly to the medium large (and large) companies.
Table 29: Export propensities and intensities of European firms
Total Exporters Export intensity
Up to 25% 25-50% More than 50%
All firms 100.00% 54.47% 52.61% 17.24% 30.15%
SMEs Micro (<20 empl.) 36.48% 37.96% 60.56% 15.35% 24.08%
Small (20-50 empl.) 23.28% 54.27% 60.58% 16.09% 23.33%
Medium (51-250 empl.) 27.06% 65.89% 48.23% 18.32% 33.45%
Source: CIS 3 accessed at the Eurostat Safe Centre, WIFO/ISI calculations.
Note: The shares of non-exporters and of large companies are not displayed. The export intensity shares in columns 3 to 5 refer to the group of exporters.
In different econometric models, we have analyzed which factors are crucial for explaining export propensity and which factors can explain different export intensities. The factors we are testing are derived from the existing knowledge about export barriers (see the previous sections). Where we find factors to be highly relevant, we may conclude that the lack of these factors acts as a severe
* Depending on the availability of information provided in the CIS data, we are using for these analyses CIS 3 data (referring to the year 2000), as only these provide information on export shares.
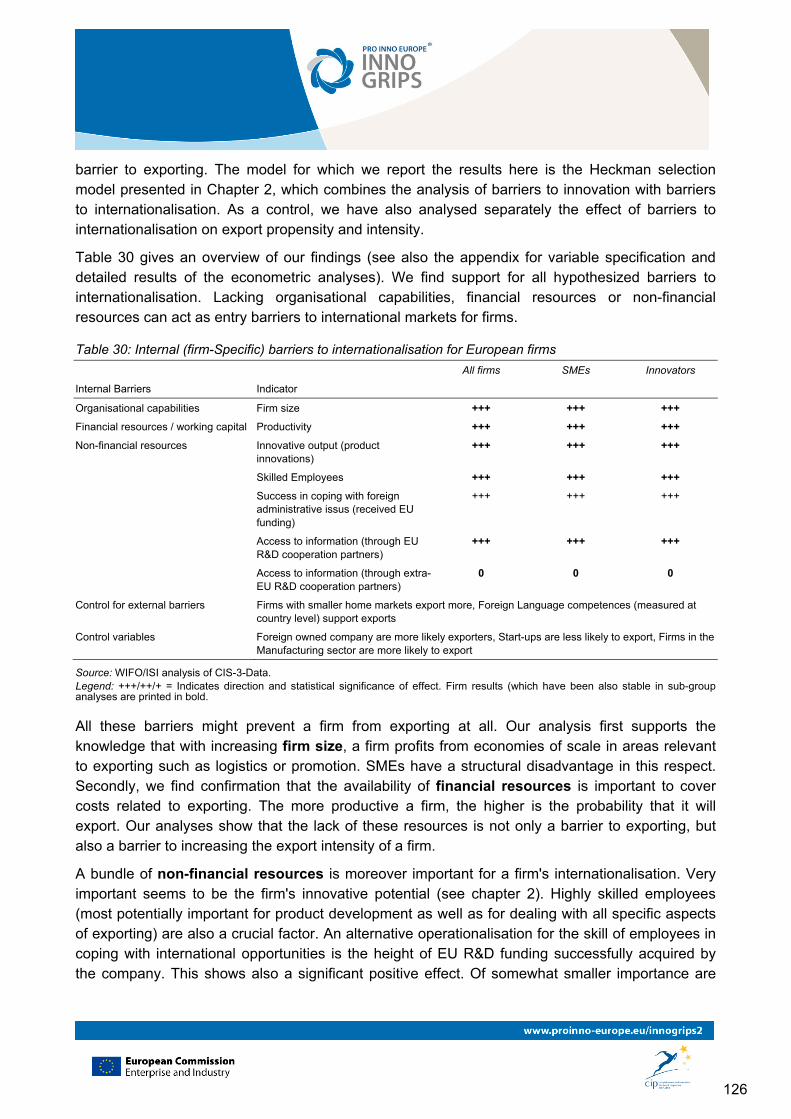
126
barrier to exporting. The model for which we report the results here is the Heckman selection model presented in Chapter 2, which combines the analysis of barriers to innovation with barriers to internationalisation. As a control, we have also analysed separately the effect of barriers to internationalisation on export propensity and intensity.
Table 30 gives an overview of our findings (see also the appendix for variable specification and detailed results of the econometric analyses). We find support for all hypothesized barriers to internationalisation. Lacking organisational capabilities, financial resources or non-financial resources can act as entry barriers to international markets for firms.
Table 30: Internal (firm-Specific) barriers to internationalisation for European firms
All firms SMEs Innovators
Internal Barriers Indicator
Organisational capabilities Firm size +++ +++ +++
Financial resources / working capital Productivity +++ +++ +++
Non-financial resources Innovative output (product innovations)
+++ +++ +++
Skilled Employees +++ +++ +++
Success in coping with foreign administrative issus (received EU funding)
+++ +++ +++
Access to information (through EU R&D cooperation partners)
+++ +++ +++
Access to information (through extra-EU R&D cooperation partners)
0 0 0
Control for external barriers Firms with smaller home markets export more, Foreign Language competences (measured at country level) support exports
Control variables Foreign owned company are more likely exporters, Start-ups are less likely to export, Firms in the Manufacturing sector are more likely to export
Source: WIFO/ISI analysis of CIS-3-Data. Legend: +++/++/+ = Indicates direction and statistical significance of effect. Firm results (which have been also stable in sub-group analyses are printed in bold.
All these barriers might prevent a firm from exporting at all. Our analysis first supports the knowledge that with increasing firm size, a firm profits from economies of scale in areas relevant to exporting such as logistics or promotion. SMEs have a structural disadvantage in this respect. Secondly, we find confirmation that the availability of financial resources is important to cover costs related to exporting. The more productive a firm, the higher is the probability that it will export. Our analyses show that the lack of these resources is not only a barrier to exporting, but also a barrier to increasing the export intensity of a firm.
A bundle of non-financial resources is moreover important for a firm's internationalisation. Very important seems to be the firm's innovative potential (see chapter 2). Highly skilled employees (most potentially important for product development as well as for dealing with all specific aspects of exporting) are also a crucial factor. An alternative operationalisation for the skill of employees in coping with international opportunities is the height of EU R&D funding successfully acquired by the company. This shows also a significant positive effect. Of somewhat smaller importance are
127
international research cooperation contacts, which might help to get access to information about foreign markets and consumer preferences. This is only true for contacts within the EU.
These barriers apply overall to firms in Europe, and our results do not reveal crucial differences for SMEs or for innovative companies. Different sub-group analyses have revealed no stronger effects for SMEs than those for the whole sample as regards market entry barriers.
However, we have also analysed export intensity in order to learn about possible barriers for exporters to increase their export activities. Here, we do not find barriers which systematically apply to the whole sample. In general, it seems that SMEs are affected by such barriers (see for details below), while generally firms operating in innovation intensive sectors (high or medium-high) are least affected.We have controlled for a number of external barriers, which will be discussed in section 4.3.2. Other control variables support the general knowledge such as foreign owned companies are expected to export more, start-ups are expected to concentrate on national markets first and finally exports in the service sector are still exceeded by far by those of the manufacturing sectors.
4.3.1.1 Internal barriers with a strong effect for SMEs
A separate analysis only for the SMEs in the sample confirms the findings for the overall sample, with some slight differences.
For SMEs, the relative importance of non-financial barriers shows also some differences compared to the overall sample. It appears that research cooperation contacts in and outside the EU are more important for exporting.* We assume that these contacts and joint research projects provide access to information about consumer needs and markets in other countries. As this information is available without additional costs, this might explain why this is a helpful factor in particular for SMEs – and a barrier to internationalisation accordingly in case such contacts are lacking.
With reference to the discussion about "Born Globals" in the literature, we did have a separate look at them in the analysis. These results have to be considered with caution, as the sample has been quite small compared to the rest of the analysis (N=424).† Overall, we can say that "Born Globals" face less barriers to internationalisation than other firms. In particular they are not hampered by size or financial effects. We find that their very high export intensities are linked to high innovative output, having already received EU funding and existing research cooperations with non-EU partners. Most likely, these firms are start-ups of internationally active researchers who want to commercialise their research results.
4.3.1.2 Internal barriers with a strong effect for specific country-sector groups
The analysis of internal barriers has also been broken down to the different country and sector groups specified in our concept. Among many minor differences, we found one effect to appear more systematically. Firms operating in sectors with high or medium-high innovation intensity do
* These findings are based on finding the coefficients of these variables being considerably higher for SMEs. † We have defined "Born Globals" as firms, which achieve more than 50% of their turnover by exporting only two years after they have been established. Results are not being displayed in detail.
128
profit considerably from existing research contacts (within the EU) when entering international markets. This applies in particular for firms located in country groups 1 and 3, which are comprised of "old" EU member states. From this one can clearly conclude that firms in new member states do not yet such networks and will profit from building up international/EU networks, too.
4.3.2 Barriers external to the firm The analysis at the level of the individual firms using CIS data allows including some barriers external to the firm, such as factors connected to the sector a firm is operating in or special characteristics of the country the firm is located in. It does not allow including specific barriers related to or posed by the partner countries, as the CIS data do not specify the destinations of the exports.
For this reason, we have calculated separately how national sectors are affected by trade barriers on exports of their partner countries. We have used the export shares by partner countries and sectors as a weighting indicator for the barriers in order to find out which external barriers are currently of highest relevance to European exporters. We have used barrier indicators which are available on the national level only. Whenever possible we have broken down the barrier indicators on the sector level. In order to estimate the impact of these export barriers on the national sector of the exporting country, we aggregated the barriers of the partner countries according to the amount of exports in the partner countries. We have used export data of European countries from 2006 from the UN Comtrade database for manufacturing and the Eurostat Balance of Payments database for service sectors (see the Appendix for details on the methodology). * Table 31 gives an over view on the data used in this analysis.
These different data sources allow to split up the export shares into three sector groups. According to the Peneder (2010) classification, sectors in sector group 1 are characterized as highly innovative, sector group 2 comprises medium-high innovative sectors and sector group 3 the rest of the sectors, i.e. medium to low innovative sectors including the services sectors.
Before reporting the results of the descriptive analysis of export barriers, we have a look at the export shares of European countries. With respect to destinations, the most relevant market for European firms is the EU internal market (see the Table D1 in the appendix for a detailed overview of export shares). Considering extra-EU trade the most important destinations are wider Europe (non-EU), and NAFTA countries, in particular the US. While these are markets for more or less all EU firms, there is also a small part of exporting activities which is more country specific. For example firms from Nordic and Eastern countries (i.e. from Finland, Estonia, Lithuania, Latvia or Poland) do export a considerable amount to Russia and other CIS (formerly Soviet) states. Likewise Southern states (i.e. Greece, Bulgaria, Cyprus, Spain), but also France or Poland have larger export shares in the Mediterranean, including the Maghreb. Countries, which can be classified as technology producers (group 1 of the classification used in our analysis), are exporting to Japan, China and some ASEAN states, and to a smaller extent also to African or
* In order to increase comparability of results with the CIS-data analyses, as these include data of firms from Iceland and Norway. We used export data from 2006 to avoid any bias caused by the economic crisis which strongly affected exports.
129
Mercosur states. From other country groups, also Ireland, Portugal and Malta appear as high-tech exporters to Asia and/or BRICs countries. Portugal moreover exports to African states, and, like Spain or Italy also to South American states, mainly to Brazil. Destinations in the Caribbean, Pacific, Oceania, Middle East or South Korea do play in a numerical sense only a very small role for European exporters (see the Table D1 in the appendix for a detailed overview of export shares).
The following descriptive analysis of the weighted external barriers to internationalisation distinguishes among alterable and stable barriers as outlined in section 4.2.2. We have used different data sources for operationalizing the barriers, among them are data from World Economic Forum, World bank Doing business, Development and Governance indicators, DG Trade's Market Access Database and CEPII Distance data (see the appendix for details of variable specification).
4.3.2.1 Alterable external barriers
Results in this section refer to a variety of different indicators for political-legal barriers to export.
First, we present the descriptive analysis of data about tariff barriers by the World Economic Forum. The description of this and the following variables is based each on the analysis of data presented in a world map and three data tables.
The world map shows the strength of the barriers in countries worldwide. The world map in Figure 15 displays the trade-weighted average tariff rate per country. Darker red colours indicate higher barriers for these countries, the grey colour indicates missing values for this variable. The map shows that the highest average tariff rates can be found in Egypt and Syria, followed closely by Russia, China, Tunisia, Algeria, Morocco, Israel, Jordan and some others. The US, Brazil or India have also tariffs, but on average at a more moderate level.* The blue shades used for EU countries indicate how much the exports of this country are affected by the barrier. Finland and Lithuania are the most affected countries in Europe. France, Germany, the Netherlands, UK, Italy, and Cyprus also face tariff barriers. States, like Belgium, Luxembourg, Czech Republic or Slovakia are not very much affected by tariff barriers. The blue shades given in the table correspond to the absolute values displayed in the row "TOTAL" of the table above the world map.
Finding some European countries more affected than others depends on the different patterns of trading partners the countries have (see also the above description of main trading partners and Table D1 in the appendix). In the appendix, we display in Table D3 the barrier posed by average tariff rates for world regions by sectors and European countries. We find, that Finland and Lithuania are the most affected countries in Europe, because of their main export partner Russia, but also Estonia and Latvia are affected for the same reason. France, Germany, the Netherlands, UK, Italy, and Cyprus face tariff barriers, because of exports to Mediterranean states, again Russia, some to China and exports to the US.
* The alternative operationalisation as the sum of Tariffs and Duties mentioned in DG Trade's Market Access Data Base shows very similar results.
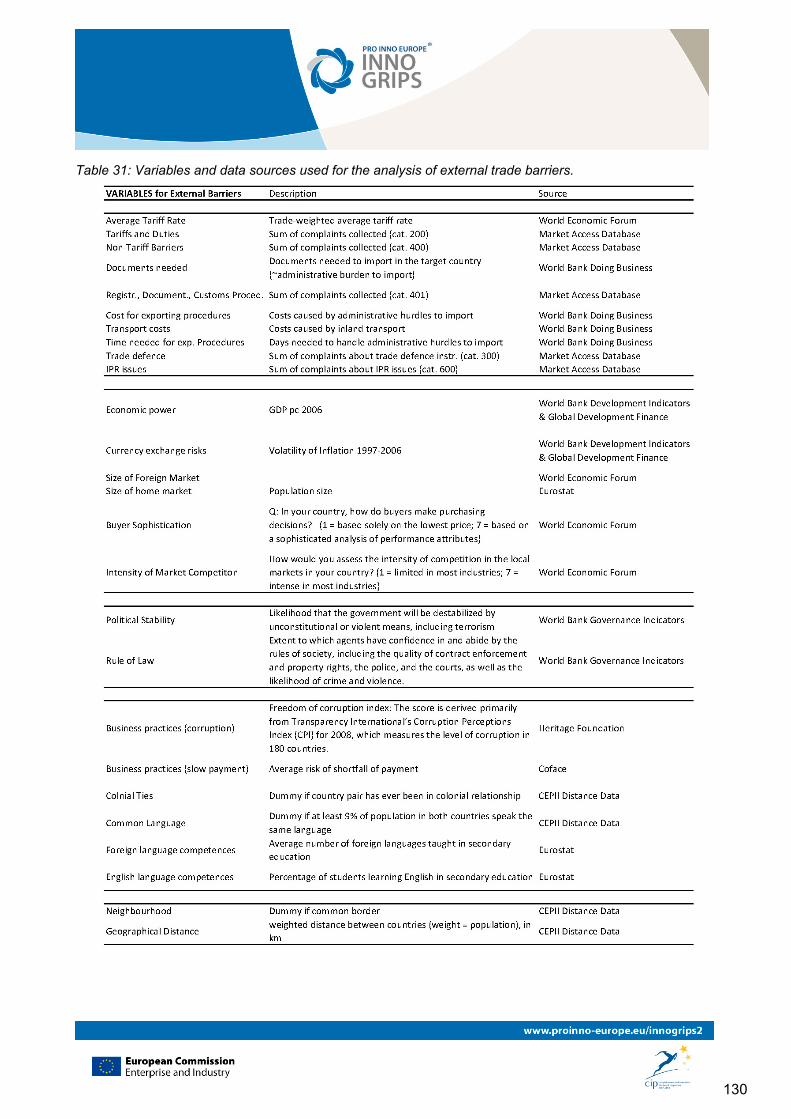
130
Table 31: Variables and data sources used for the analysis of external trade barriers.
131
The table in Figure 15 also shows that the higher the innovative level of a sector, the more affected are the sectors by tariff barriers (see column Rowmean). The values given for the sector groups display how much the sector groups in one country are affected compared to the total value for the country, i.e highly innovative sectors in Germany are 1.52 times more affected by trade barriers than German exports on average.
As an additional information, Table D2 in the appendix lists the strength of the tariff barrier for each sector by exporting country. Among the highly innovative sectors, manufacturing of machinery and equipment (NACE 29, see also the full list of NACE classification used in Appendix B) is most affected, and among the medium-high innovative sectors it is manufacturing of chemical products (NACE 24, see the column Rowmean). Due to high export shares some sectors in some countries are quite stronlgy affected. In Cyprus, this applies to the tobacco industry (NACE 16), in Lithuania to machinery and equipment (NACE 29), motor vehicles (NACE 34), and some others. The Finnish computer industry (NACE 30) is also affected above average. In Greece, the coke and petroleum industry faces high tariffs, too, and in Luxembourg this applies to the manufacturing of transport equipment (NACE 35).
We use different indicators for non-Tariff Barriers. For an overall picture, we look at the sum of non-tariff barriers collected in DG Trade's Market Access Data Base (see Figure 16). Complaints concerning non-tariff trade barriers mostly apply to the United States, Russia, China, India, and Mexico. Among those states, for which moderate barriers are recorded, are Ukraine, Kazakhstan, Turkey, Tunisia, Algeria, Egypt, Japan, Canada, Brazil and Mercosur as well as some ASEAN states. In Europe, Norway and the United Kingdom are the most affected countries followed by Lithuania, France, Finland, Ireland, the Netherlands and Greece. This is due to barriers above average in the United States and very high export shares from many of the countries mentioned above to the US. It also applies for exports to Russia (from Nordic European countries). As Spain, Slovenia and Slovakia have very low export shares to the United States but rather export to EU Member States and countries without non-tariff barriers they are merely affected by them (see also Table D5 in the Appendix).
In many countries, exports from sectors with high innovation intensity drive the high value. According to Table D4 in the appendix, this applies to medical and optical instruments manufacturing (NACE 33), computer services (NACE 72) as well as research and development services (NACE 73). In particular, this applies to highly innovative sectors in Luxembourg, Spain and Malta. Among sectors with medium-high innovation intensity, manufacturing of transport equipment (NACE 35) is affected most. Countries, where medium-high innovative sectors have to deal with this barrier are Spain, Ireland and Slovenia. Finally, also all tranport activities (land, pipeline, water, air, NACE 60 to 63) face strong non-tariff barriers.
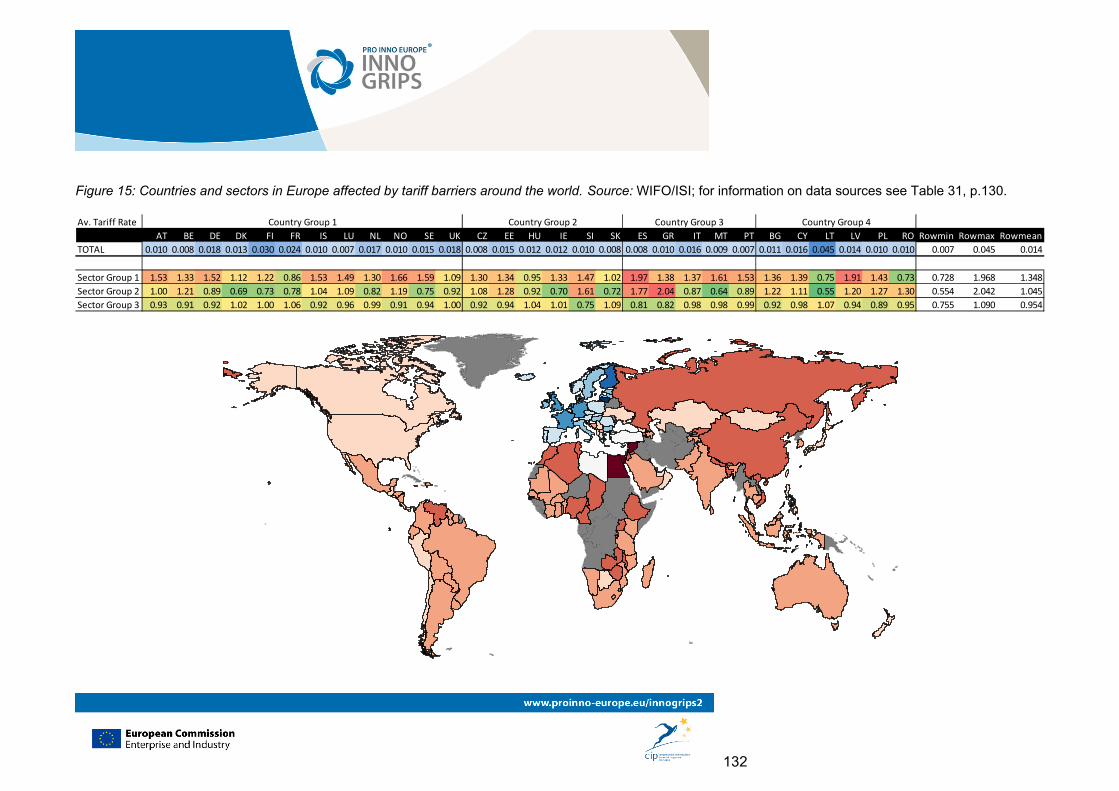
132
Figure 15: Countries and sectors in Europe affected by tariff barriers around the world. Source: WIFO/ISI; for information on data sources see Table 31, p.130.
Av. Tariff Rate
AT BE DE DK FI FR IS LU NL NO SE UK CZ EE HU IE SI SK ES GR IT MT PT BG CY LT LV PL RO Rowmin Rowmax Rowmean
TOTAL 0.010 0.008 0.018 0.013 0.030 0.024 0.010 0.007 0.017 0.010 0.015 0.018 0.008 0.015 0.012 0.012 0.010 0.008 0.008 0.010 0.016 0.009 0.007 0.011 0.016 0.045 0.014 0.010 0.010 0.007 0.045 0.014
Sector Group 1 1.53 1.33 1.52 1.12 1.22 0.86 1.53 1.49 1.30 1.66 1.59 1.09 1.30 1.34 0.95 1.33 1.47 1.02 1.97 1.38 1.37 1.61 1.53 1.36 1.39 0.75 1.91 1.43 0.73 0.728 1.968 1.348
Sector Group 2 1.00 1.21 0.89 0.69 0.73 0.78 1.04 1.09 0.82 1.19 0.75 0.92 1.08 1.28 0.92 0.70 1.61 0.72 1.77 2.04 0.87 0.64 0.89 1.22 1.11 0.55 1.20 1.27 1.30 0.554 2.042 1.045
Sector Group 3 0.93 0.91 0.92 1.02 1.00 1.06 0.92 0.96 0.99 0.91 0.94 1.00 0.92 0.94 1.04 1.01 0.75 1.09 0.81 0.82 0.98 0.98 0.99 0.92 0.98 1.07 0.94 0.89 0.95 0.755 1.090 0.954
Country Group 1 Country Group 2 Country Group 3 Country Group 4
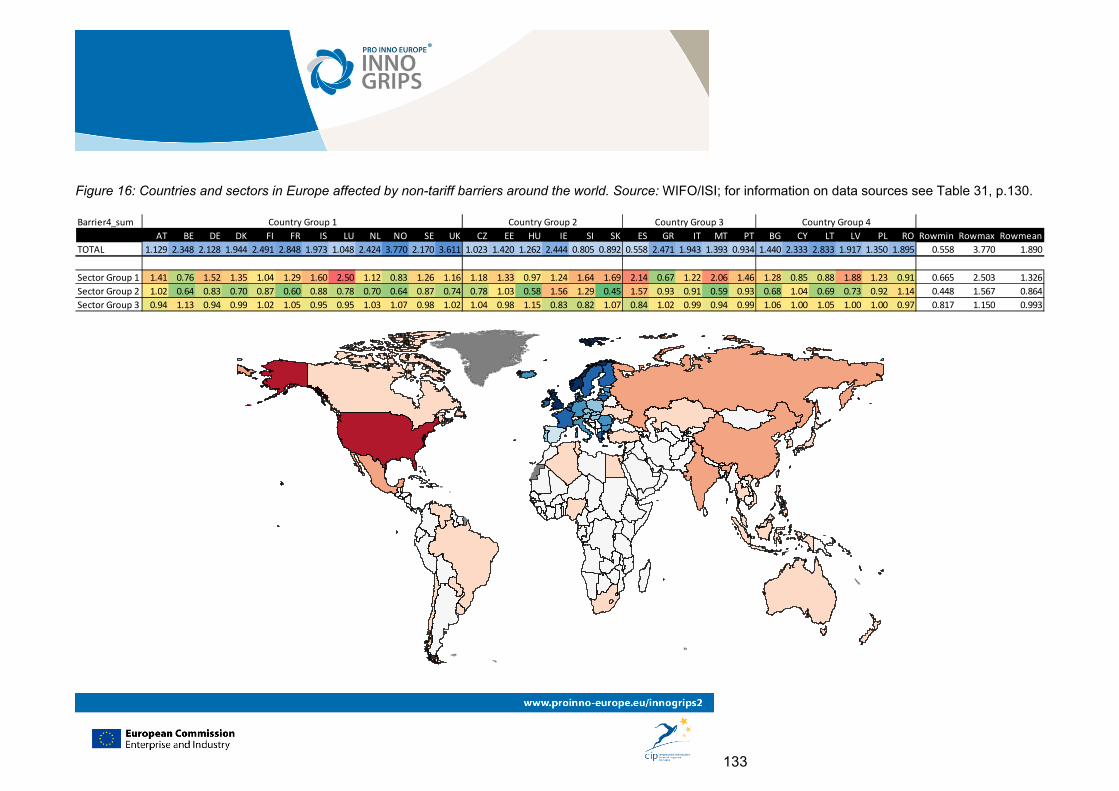
133
Figure 16: Countries and sectors in Europe affected by non-tariff barriers around the world. Source: WIFO/ISI; for information on data sources see Table 31, p.130.
Barrier4_sum
AT BE DE DK FI FR IS LU NL NO SE UK CZ EE HU IE SI SK ES GR IT MT PT BG CY LT LV PL RO Rowmin Rowmax Rowmean
TOTAL 1.129 2.348 2.128 1.944 2.491 2.848 1.973 1.048 2.424 3.770 2.170 3.611 1.023 1.420 1.262 2.444 0.805 0.892 0.558 2.471 1.943 1.393 0.934 1.440 2.333 2.833 1.917 1.350 1.895 0.558 3.770 1.890
Sector Group 1 1.41 0.76 1.52 1.35 1.04 1.29 1.60 2.50 1.12 0.83 1.26 1.16 1.18 1.33 0.97 1.24 1.64 1.69 2.14 0.67 1.22 2.06 1.46 1.28 0.85 0.88 1.88 1.23 0.91 0.665 2.503 1.326
Sector Group 2 1.02 0.64 0.83 0.70 0.87 0.60 0.88 0.78 0.70 0.64 0.87 0.74 0.78 1.03 0.58 1.56 1.29 0.45 1.57 0.93 0.91 0.59 0.93 0.68 1.04 0.69 0.73 0.92 1.14 0.448 1.567 0.864
Sector Group 3 0.94 1.13 0.94 0.99 1.02 1.05 0.95 0.95 1.03 1.07 0.98 1.02 1.04 0.98 1.15 0.83 0.82 1.07 0.84 1.02 0.99 0.94 0.99 1.06 1.00 1.05 1.00 1.00 0.97 0.817 1.150 0.993
Country Group 1 Country Group 2 Country Group 3 Country Group 4
134
There are many data about one specific non-tariff barrier: Problems with exporting procedures and paperwork. We compare four different operationalisations for this aspect: Documents, time and cost required for exporting/importing (stemming from the World Bank Doing Business data)* and an indicator generated from DG Trade's MADB data summing up barriers mentioned in the category "Registration, Documentation, Customs Procedures" (no. 401). From the last one, we see that most complaints refer to procedures in the United States, Russia, Mexico, and Nigeria. Ukraine, Turkey, Paraguay, Kazakhstan, India and some of the ASEAN countries have moderately high barriers (figure not displayed here). As again from the perspective of exporting European firms the most relevant among these countries are the United States and Russia, and hence the same applies here as has been said already with respect to non-tariff barriers in general.
A similar picture is being drawn by the WEF data on necessary documents needed to import in the target country (administrative burden to import). Although, here, documents required for exporting to the United States appear to be less in numbers compared to those required for most other countries. According to these data, documentation as a non-tariff barrier affects most Lithuanian and Finnish exports to Russia and other CIS states (e.g. Azerbaijan, Kazakhstan, Tajikistan, Ukraine), as well as exports to central African states and to Mediterranean states (Morocco, Algeria, Syria). Yet, also some EU neighbouring countries pose high documentation requirements on imports. This is true for Albania, Turkey, Croatia, Kosovo, Bosnia and Herzegovina.
Documents needed for intra-EU trade are five at maximum required by Slovenia, Slovakia, Spain, Bulgaria and Romania. Compared to "standard documents" required by many states such as a bill of lading, a commercial invoice or a packing list, these countries ask on top for a technical standard or health certificate or, in the case of Romania, for a CMR document for road transport. Czech Republic, Hungary, Slovakia, Greece, Austria, France and Portugal are most affected by the documentation needed for exporting to these EU member states.
Looking at costs of exporting (costs caused by administrative hurdles to import) separately, a somewhat different picture is being drawn. High costs occur for exports to many African, Middle Eastern and CIS states, Mexico or Venezuela. Administrative procedures are also costly within Europe, e.g. for exports to Kosovo, Iceland, and to some extent also for Serbia, Switzerland and Macedonia . Exports to Turkey or China are comparatively at a lower cost. Portugal is most affected by this barrier, followed by Germany, France and Latvia. Portugal is most affected by this barrier, as it exports a larger share to African countries. For France and Latvia, the costs in the European neighbourhood, the CIS states and some in the Mediterranean seem to matter. Germany's diversified export profile with medium-high to high costs in many different partner countries leads to this high total sum of administrative export costs. The largest shares of these export handling costs are due to inland transport costs. Figure 17 therefore displays this barrier in more detail. Transport is most expensive in central African, CIS and Middle Eastern states, but
* For internal EU-trade these data have been corrected. For exports within the internal market, we have not counted the documents, time and costs needed for customs procedures as well as for terminal handling, as intra-EU trade is assumed not to take place via ports to a larger extent.
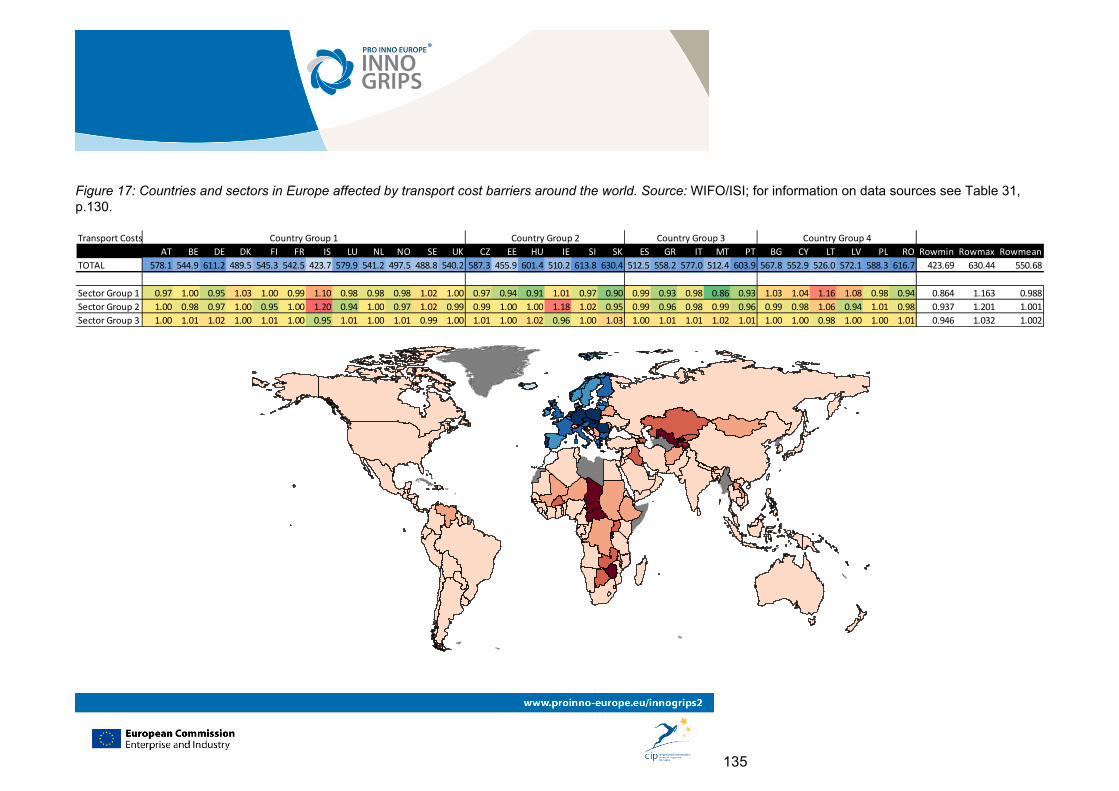
135
Figure 17: Countries and sectors in Europe affected by transport cost barriers around the world. Source: WIFO/ISI; for information on data sources see Table 31, p.130.
Transport Costs
AT BE DE DK FI FR IS LU NL NO SE UK CZ EE HU IE SI SK ES GR IT MT PT BG CY LT LV PL RO Rowmin Rowmax Rowmean
TOTAL 578.1 544.9 611.2 489.5 545.3 542.5 423.7 579.9 541.2 497.5 488.8 540.2 587.3 455.9 601.4 510.2 613.8 630.4 512.5 558.2 577.0 512.4 603.9 567.8 552.9 526.0 572.1 588.3 616.7 423.69 630.44 550.68
Sector Group 1 0.97 1.00 0.95 1.03 1.00 0.99 1.10 0.98 0.98 0.98 1.02 1.00 0.97 0.94 0.91 1.01 0.97 0.90 0.99 0.93 0.98 0.86 0.93 1.03 1.04 1.16 1.08 0.98 0.94 0.864 1.163 0.988
Sector Group 2 1.00 0.98 0.97 1.00 0.95 1.00 1.20 0.94 1.00 0.97 1.02 0.99 0.99 1.00 1.00 1.18 1.02 0.95 0.99 0.96 0.98 0.99 0.96 0.99 0.98 1.06 0.94 1.01 0.98 0.937 1.201 1.001
Sector Group 3 1.00 1.01 1.02 1.00 1.01 1.00 0.95 1.01 1.00 1.01 0.99 1.00 1.01 1.00 1.02 0.96 1.00 1.03 1.00 1.01 1.01 1.02 1.01 1.00 1.00 0.98 1.00 1.00 1.01 0.946 1.032 1.002
Country Group 1 Country Group 2 Country Group 3 Country Group 4
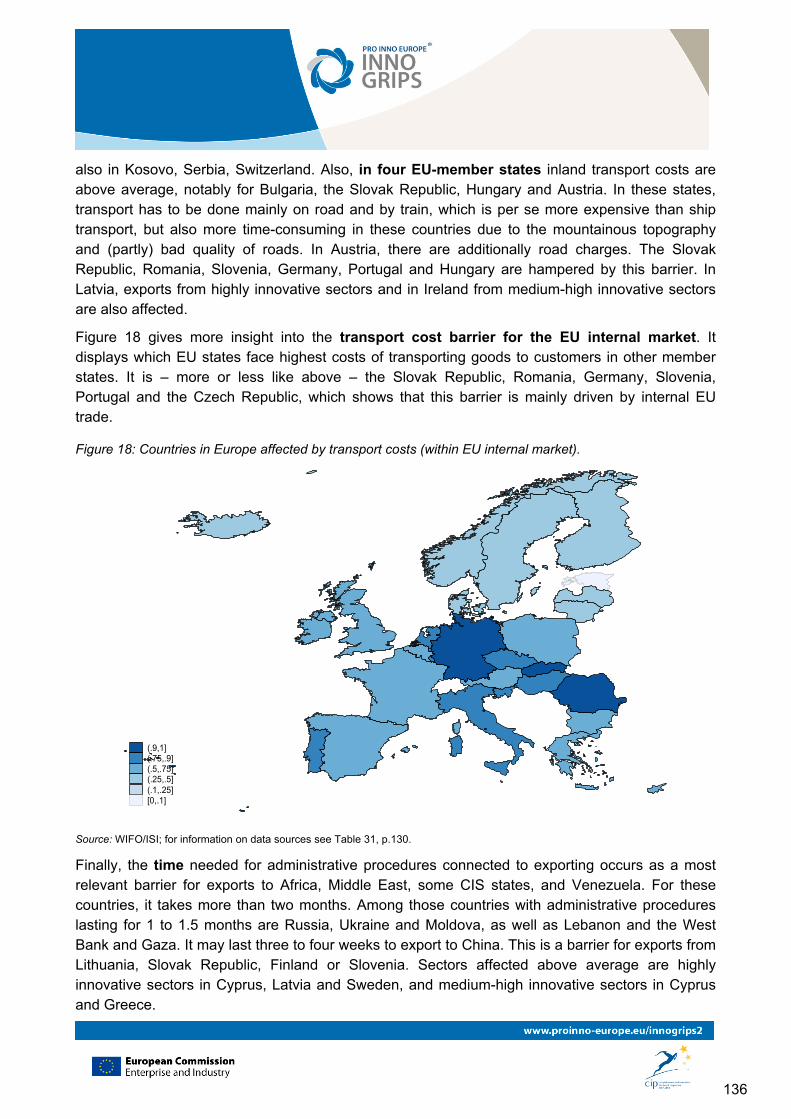
136
also in Kosovo, Serbia, Switzerland. Also, in four EU-member states inland transport costs are above average, notably for Bulgaria, the Slovak Republic, Hungary and Austria. In these states, transport has to be done mainly on road and by train, which is per se more expensive than ship transport, but also more time-consuming in these countries due to the mountainous topography and (partly) bad quality of roads. In Austria, there are additionally road charges. The Slovak Republic, Romania, Slovenia, Germany, Portugal and Hungary are hampered by this barrier. In Latvia, exports from highly innovative sectors and in Ireland from medium-high innovative sectors are also affected.
Figure 18 gives more insight into the transport cost barrier for the EU internal market. It displays which EU states face highest costs of transporting goods to customers in other member states. It is – more or less like above – the Slovak Republic, Romania, Germany, Slovenia, Portugal and the Czech Republic, which shows that this barrier is mainly driven by internal EU trade.
Figure 18: Countries in Europe affected by transport costs (within EU internal market).
(.9,1](.75,.9](.5,.75](.25,.5](.1,.25][0,.1]
Source: WIFO/ISI; for information on data sources see Table 31, p.130.
Finally, the time needed for administrative procedures connected to exporting occurs as a most relevant barrier for exports to Africa, Middle East, some CIS states, and Venezuela. For these countries, it takes more than two months. Among those countries with administrative procedures lasting for 1 to 1.5 months are Russia, Ukraine and Moldova, as well as Lebanon and the West Bank and Gaza. It may last three to four weeks to export to China. This is a barrier for exports from Lithuania, Slovak Republic, Finland or Slovenia. Sectors affected above average are highly innovative sectors in Cyprus, Latvia and Sweden, and medium-high innovative sectors in Cyprus and Greece.
137
However, also procedures for exports within the EU may take long, e.g. about three weeks to Poland, where document handling takes time or to 2.5 weeks to Czech Republic or Slovak Republic, which is due to time needed for inland transport Many EU-states face the time barrier for their internal market trade: Slovak Republic, Romania, Slovenia, Bulgaria, Cyprus, Hungary, Czech Republic, Germany and Austria.
Strict Foreign rules and regulations may also in a wider sense (beyond non-tariff barriers) become relevant for exporters. This aspect is being captured in a check for trade defence instruments in foreign countries. Complaints collected by DG Trade's Market Access Database with regard to trade defence instruments are mainly addressed to the United States followed by Australia, India and Turkey. UK and to a lesser extent all states exporting a larger share to the United States are affected by trade defence instruments.
Trade defence has most remarkable effects on sectors with high innovation intensity. Like non-tariff barriers, this applies to medical and optical instruments manufacturing (NACE 33), computer services (NACE 72) as well as research and development services (NACE 73).
Another aspect of stricht foreign regulation is the way a country deals with IPR issues. DG Trade's Market Access Database collects complaints about IPR issues acting as barriers to exporting. Although few in numbers, complaints concentrate on the US, Turkey, Vietnam and New Zealand. The Netherlands and Germany are most affected, followed by Bulgaria, Greece, and Italy. According to our findings, in particular exports of medium or low innovative sectors are most affected by strict IPR rules in the US. Strict IPR rules in Turkey apply to all sectors.
4.3.2.2 Stable external barriers
a.) Economic Barriers
Economic barriers which might arise from the general economic condition of a state or from currency exchange risks have been analysed using the GDP per capita and the volatility of inflation. Countries with low per capita income are many African, Middle East and ASEAN countries and to a smaller extent also China and India. High volatility of inflation correlates with economic power and applies mainly to central African countries. Overall, the results show that EU states only very rarely export to countries with very small economic power. So, economic factors seem to act as structural barriers to internationalisation, as they affect the overall motivation to export.
b.) Market Barriers
Market barriers are the size of the overall market, the intensity of competition in certain markets as well as different foreign customer habits and attitudes. Market size is particularly large in the US and the whole NAFTA, the BRICs, Japan or Australia and in the larger EU member states. EU states export overall a lot within the EU, to NAFTA, only a few to the BRICs and almost nothing to Australia or Japan. Insofar, market size is like economic conditions, rather a structural factor which might indicate market potential, as e.g. visible for the BRICs countries.
An additional result in terms of market size is coming from the analysis of the data at firm level in order to learn about internal barriers. Here, we included the size of the firm's home market as a
138
control variable and found that this had an explanatory power for a firm's decision to export: The smaller the home market, the more likely a firm will internationalise.
Our proxy variable for different customer habits is buyer sophistication ranging from low sophistication based solely on the price of a product to high sophistication based on an analysis of different features of a product (data collected by World Eocnomic Forum). High buyer sophistication may require from exporters to develop new products for these markets or to adapt existing ones. According to our findings, the most sophisticated buyers are located in Japan, European (Switzerland, Luxembourg, Denmark, UK, Netherlands,…) and NAFTA countries (US, Canada), but also in others such as China (also Taiwan, Hong Kong), Singapore, Australia, India and ASEAN countries. As most European countries export to other EU states and the US, this means that they are all highly affected by the requirement to adapt products to markets, which should rather be termed as a challenge than a barrier. In particular specific customer habits apply mainly to exporters from group 1 countries (technology producers) as well as exports from highly innovative sectors in Ireland or Malta.
Finally we look at the intensity of competition on foreign markets. We find that most markets today can be characterized as highly competitive (c.f. the world map in Figure 19). Like for buyer sophistication, this affects all exports within Europe and to the USA and Canada, as well as to Japan, China, India or Australia, and again, it is more to be seen as a challenge than a barrier.
According to the table within Figure 19, many European countries are affected by high competition, in particular Luxembourg, Belgium, Norway, and Czech Republic. Many technology procucers (country group 1) are severely affected, clearly driven by the high export shares within the EU and to the USA and Canada (see Table D9 in the appendix). Most countries face this challenge across all sectors, it only appears to be more severe for high innovative sectors in the more specialised exporting countries Ireland and Malta (see also Table D8 in the appendix).
c.) Political-Institutional Barriers
As indicators for the general political-institutional setup of countries in the world we look at the political stability and the rule of law in these countries as provided by the World bank governance data. We find for both variables similar results, with lowest values for political stability and rule of law in (central) Africa, Middle East, Russia and some states in Southern America (see Figure 20). Given existing export shares, countries which export to Russia (and partly other CIS states) are mainly affected by uncertainties arising from these factors. These are the Nordic European countries. Again, Portugal as an exporter to Africa is also confronted with risks arising from political instability (see also the Appendix for more details in Tables D10 and D11).
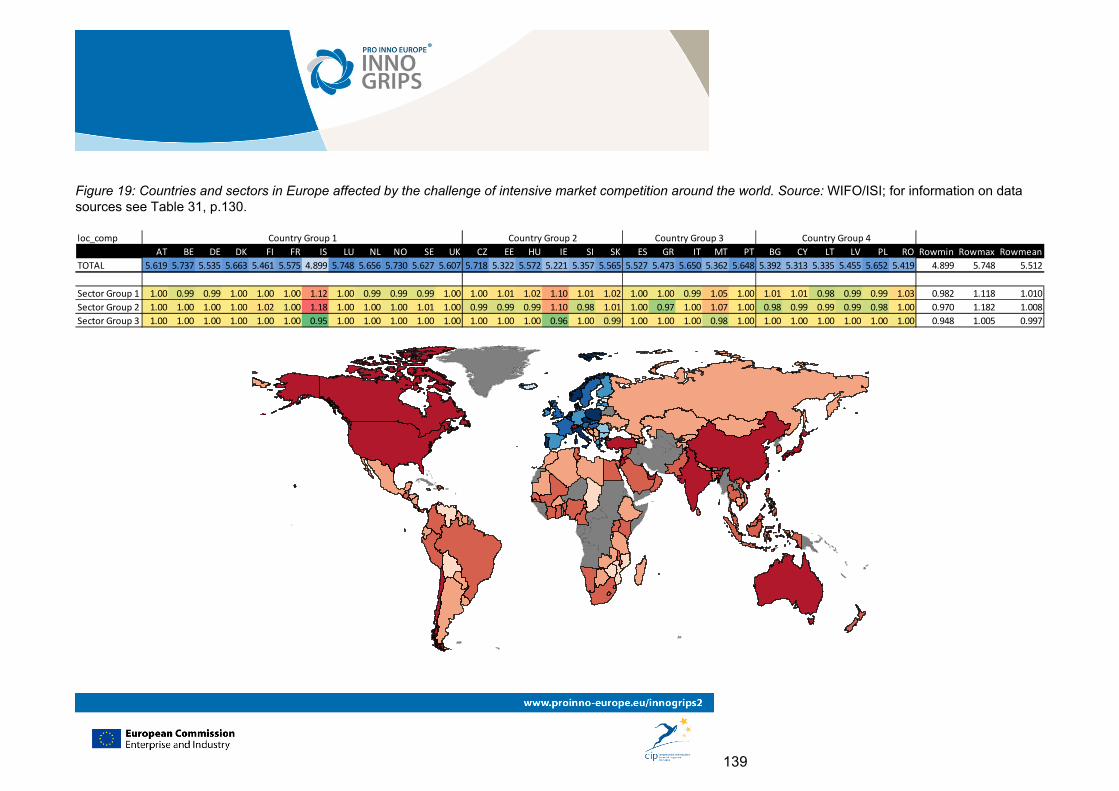
139
Figure 19: Countries and sectors in Europe affected by the challenge of intensive market competition around the world. Source: WIFO/ISI; for information on data sources see Table 31, p.130.
loc_comp
AT BE DE DK FI FR IS LU NL NO SE UK CZ EE HU IE SI SK ES GR IT MT PT BG CY LT LV PL RO Rowmin Rowmax Rowmean
TOTAL 5.619 5.737 5.535 5.663 5.461 5.575 4.899 5.748 5.656 5.730 5.627 5.607 5.718 5.322 5.572 5.221 5.357 5.565 5.527 5.473 5.650 5.362 5.648 5.392 5.313 5.335 5.455 5.652 5.419 4.899 5.748 5.512
Sector Group 1 1.00 0.99 0.99 1.00 1.00 1.00 1.12 1.00 0.99 0.99 0.99 1.00 1.00 1.01 1.02 1.10 1.01 1.02 1.00 1.00 0.99 1.05 1.00 1.01 1.01 0.98 0.99 0.99 1.03 0.982 1.118 1.010
Sector Group 2 1.00 1.00 1.00 1.00 1.02 1.00 1.18 1.00 1.00 1.00 1.01 1.00 0.99 0.99 0.99 1.10 0.98 1.01 1.00 0.97 1.00 1.07 1.00 0.98 0.99 0.99 0.99 0.98 1.00 0.970 1.182 1.008
Sector Group 3 1.00 1.00 1.00 1.00 1.00 1.00 0.95 1.00 1.00 1.00 1.00 1.00 1.00 1.00 1.00 0.96 1.00 0.99 1.00 1.00 1.00 0.98 1.00 1.00 1.00 1.00 1.00 1.00 1.00 0.948 1.005 0.997
Country Group 1 Country Group 2 Country Group 3 Country Group 4
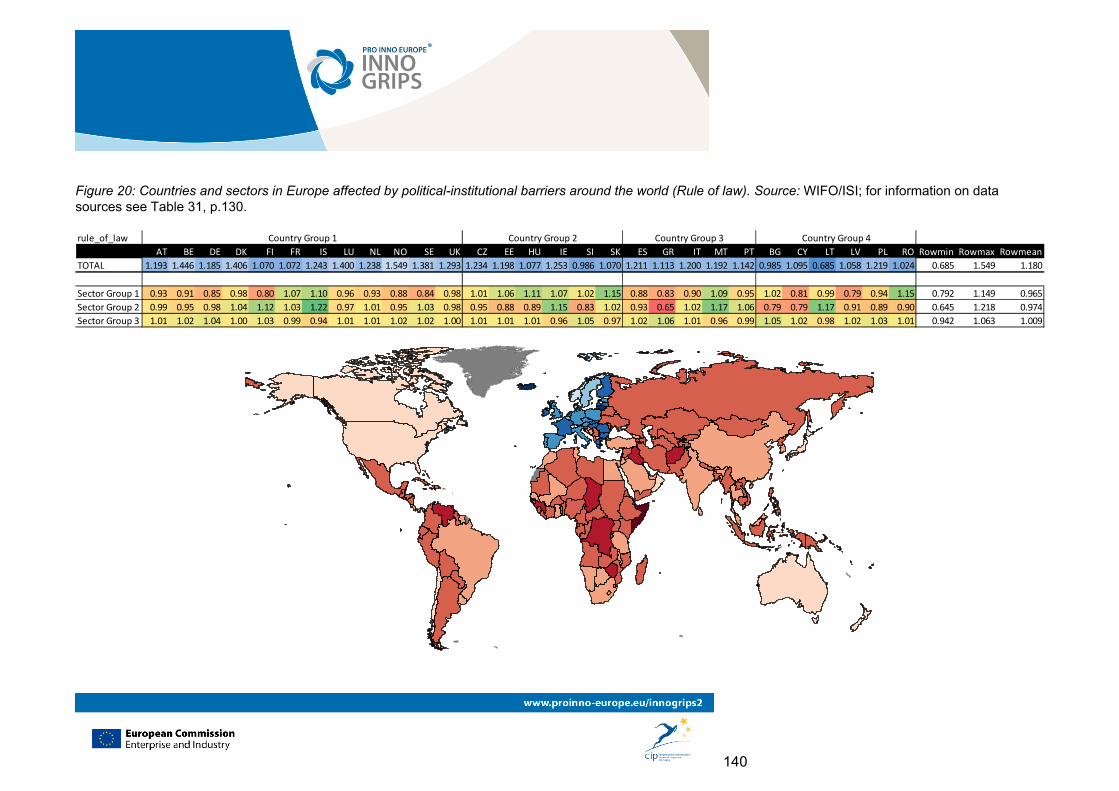
140
Figure 20: Countries and sectors in Europe affected by political-institutional barriers around the world (Rule of law). Source: WIFO/ISI; for information on data sources see Table 31, p.130.
rule_of_law
AT BE DE DK FI FR IS LU NL NO SE UK CZ EE HU IE SI SK ES GR IT MT PT BG CY LT LV PL RO Rowmin Rowmax Rowmean
TOTAL 1.193 1.446 1.185 1.406 1.070 1.072 1.243 1.400 1.238 1.549 1.381 1.293 1.234 1.198 1.077 1.253 0.986 1.070 1.211 1.113 1.200 1.192 1.142 0.985 1.095 0.685 1.058 1.219 1.024 0.685 1.549 1.180
Sector Group 1 0.93 0.91 0.85 0.98 0.80 1.07 1.10 0.96 0.93 0.88 0.84 0.98 1.01 1.06 1.11 1.07 1.02 1.15 0.88 0.83 0.90 1.09 0.95 1.02 0.81 0.99 0.79 0.94 1.15 0.792 1.149 0.965
Sector Group 2 0.99 0.95 0.98 1.04 1.12 1.03 1.22 0.97 1.01 0.95 1.03 0.98 0.95 0.88 0.89 1.15 0.83 1.02 0.93 0.65 1.02 1.17 1.06 0.79 0.79 1.17 0.91 0.89 0.90 0.645 1.218 0.974
Sector Group 3 1.01 1.02 1.04 1.00 1.03 0.99 0.94 1.01 1.01 1.02 1.02 1.00 1.01 1.01 1.01 0.96 1.05 0.97 1.02 1.06 1.01 0.96 0.99 1.05 1.02 0.98 1.02 1.03 1.01 0.942 1.063 1.009
Country Group 1 Country Group 2 Country Group 3 Country Group 4
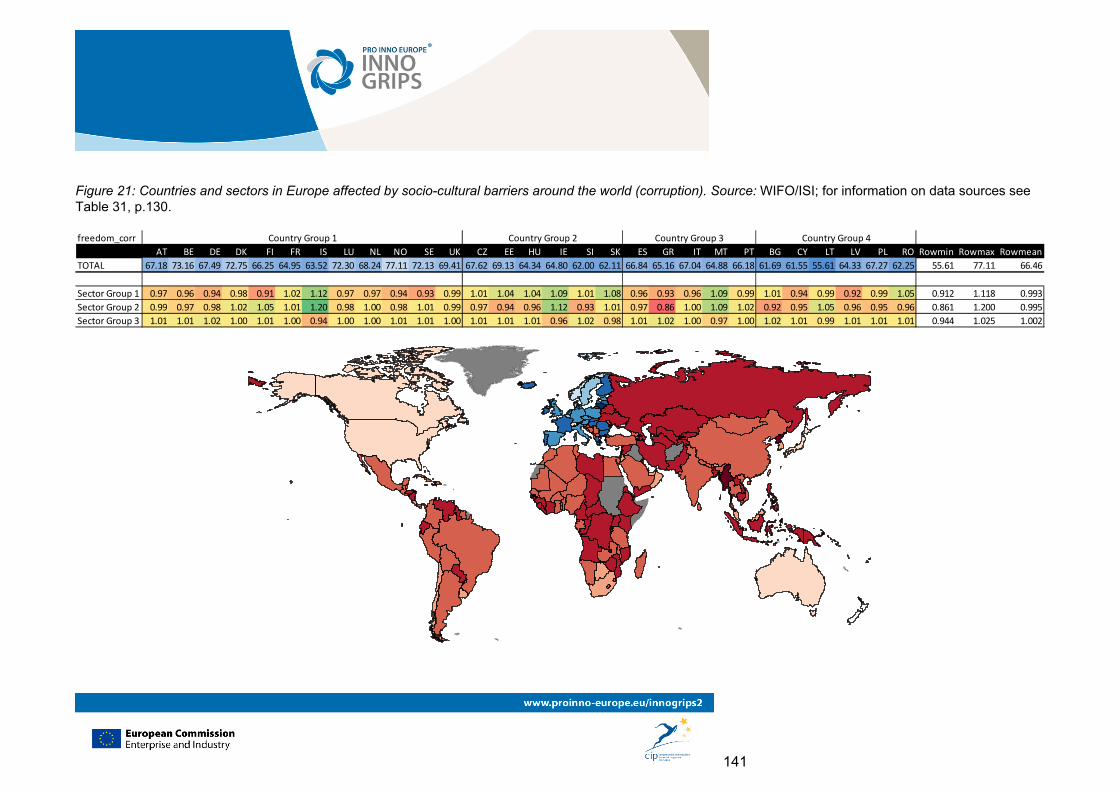
141
Figure 21: Countries and sectors in Europe affected by socio-cultural barriers around the world (corruption). Source: WIFO/ISI; for information on data sources see Table 31, p.130.
freedom_corr
AT BE DE DK FI FR IS LU NL NO SE UK CZ EE HU IE SI SK ES GR IT MT PT BG CY LT LV PL RO Rowmin Rowmax Rowmean
TOTAL 67.18 73.16 67.49 72.75 66.25 64.95 63.52 72.30 68.24 77.11 72.13 69.41 67.62 69.13 64.34 64.80 62.00 62.11 66.84 65.16 67.04 64.88 66.18 61.69 61.55 55.61 64.33 67.27 62.25 55.61 77.11 66.46
Sector Group 1 0.97 0.96 0.94 0.98 0.91 1.02 1.12 0.97 0.97 0.94 0.93 0.99 1.01 1.04 1.04 1.09 1.01 1.08 0.96 0.93 0.96 1.09 0.99 1.01 0.94 0.99 0.92 0.99 1.05 0.912 1.118 0.993
Sector Group 2 0.99 0.97 0.98 1.02 1.05 1.01 1.20 0.98 1.00 0.98 1.01 0.99 0.97 0.94 0.96 1.12 0.93 1.01 0.97 0.86 1.00 1.09 1.02 0.92 0.95 1.05 0.96 0.95 0.96 0.861 1.200 0.995
Sector Group 3 1.01 1.01 1.02 1.00 1.01 1.00 0.94 1.00 1.00 1.01 1.01 1.00 1.01 1.01 1.01 0.96 1.02 0.98 1.01 1.02 1.00 0.97 1.00 1.02 1.01 0.99 1.01 1.01 1.01 0.944 1.025 1.002
Country Group 1 Country Group 2 Country Group 3 Country Group 4

142
d.) Socio-cultural Barriers
We have operationalized different cultural and language aspects mentioned in the literature. First, we use corruption as an indicator for foreign business practices (see Figure 21). In worldwide comparison Russia, other CIS states, Middle Eastern states, some in central Africa, some Caribbean states, Lebanon, Libya, and some ASEAN states (Philippines, Indonesia, Vietnam) are facing considerable corruption in business and political life. Considering that the export shares from European countries to many of these states are very low, corruption as an indicator for different business practices seems to be most relevant for those states exporting to Russia (Finland and the Baltic States), and moreover for those states exporting larger shares in the Mediterranean (Lebanon, Lybia etc.) such as Greece, Cyprus, Bulgaria, Romania and France (see also the Appendix for more details in Tables D12 and D13).
We analyse secondly the slow collection of payments in foreign countries as an alternative indicator for foreign business practices. We find that a relevant risk of shortfall in payment exists for countries which export to Russia and other CIS states as well as those exporting to Northern African states. So, these results show a very similar picture of foreign business practices to what has been found by analysing corruption data.
We have further included a variable, which indicates similar cultural traits in terms of a common colonial tie. Colonial ties can only partly explain trade relationships (e.g. UK with USA, Baltic states with Russia, Spain and Portugal with Mercosur, Portugal with some African states, or Greece with Turkey). Further on, we have checked language similarities of exporting and receiving country. Both variables reproduce results of existing research, meaning that colonial ties and language familiarities cannot or only partially explain existing export relationships. This means that the lack of a common history or common language do not act as barriers to internationalisation.
However, we know already from the analysis of the firm-specific data (Section 4.3.1) that language competences are important for internationalisation. Measured at the country level (in terms of the number of foreign languages taught in secondary education), this variable could explain higher exports of firms from that specific country.
Figure 22 shows the spread of language competences across Europe. It is particularly high in Germany and Norway, Ireland and Portugal, meaning that many countries, in particular in Southern and Eastern Europe are affected by a language barrier. This result can be interpreted as reconfirming what has been found earlier in the literature about bilingualism. Firms in countries which can be regarded as bilingual do export more. As in these countries foreign languages play a more important role in secondary education, our variable captures the same phenomenon, and the lack of training in foreign languages can be regarded as a barrier to internationalisation. This finding goes beyond the knowledge of English, which has been controlled separately for, but had no effect on internationalisation, as English language competence is almost spread evenly across EU countries.
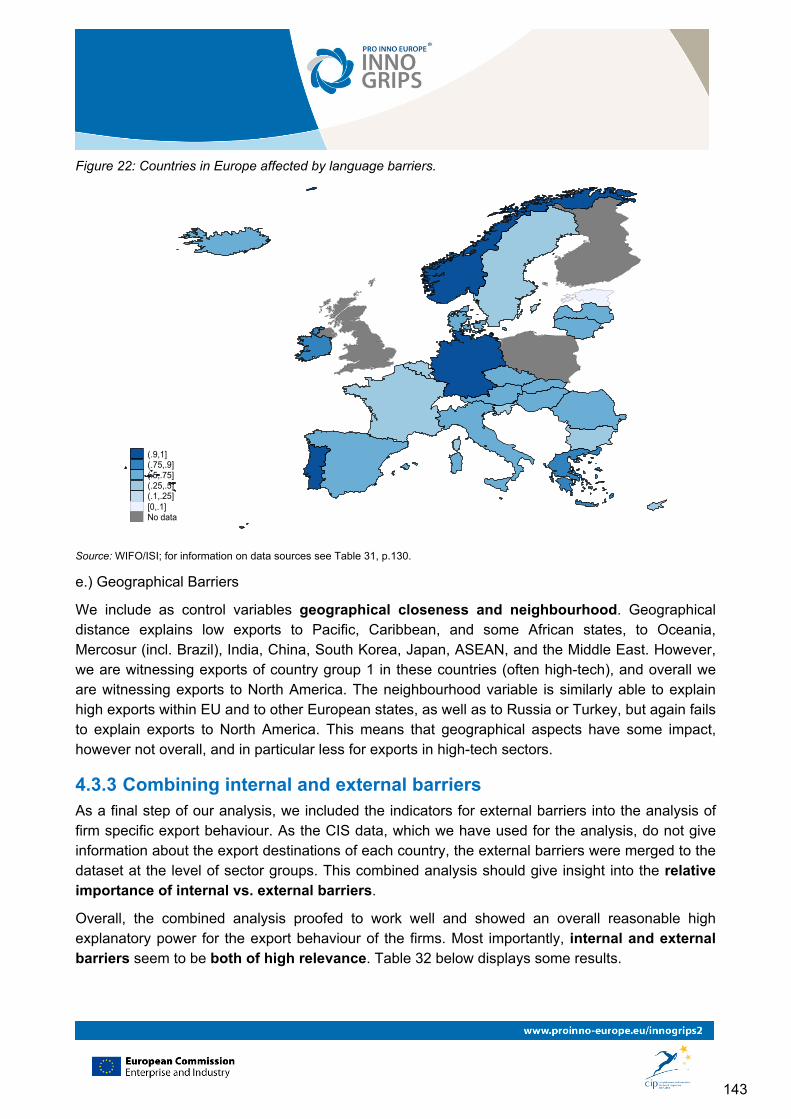
143
Figure 22: Countries in Europe affected by language barriers.
(.9,1](.75,.9](.5,.75](.25,.5](.1,.25][0,.1]No data
Source: WIFO/ISI; for information on data sources see Table 31, p.130.
e.) Geographical Barriers
We include as control variables geographical closeness and neighbourhood. Geographical distance explains low exports to Pacific, Caribbean, and some African states, to Oceania, Mercosur (incl. Brazil), India, China, South Korea, Japan, ASEAN, and the Middle East. However, we are witnessing exports of country group 1 in these countries (often high-tech), and overall we are witnessing exports to North America. The neighbourhood variable is similarly able to explain high exports within EU and to other European states, as well as to Russia or Turkey, but again fails to explain exports to North America. This means that geographical aspects have some impact, however not overall, and in particular less for exports in high-tech sectors.
4.3.3 Combining internal and external barriers As a final step of our analysis, we included the indicators for external barriers into the analysis of firm specific export behaviour. As the CIS data, which we have used for the analysis, do not give information about the export destinations of each country, the external barriers were merged to the dataset at the level of sector groups. This combined analysis should give insight into the relative importance of internal vs. external barriers.
Overall, the combined analysis proofed to work well and showed an overall reasonable high explanatory power for the export behaviour of the firms. Most importantly, internal and external barriers seem to be both of high relevance. Table 32 below displays some results.
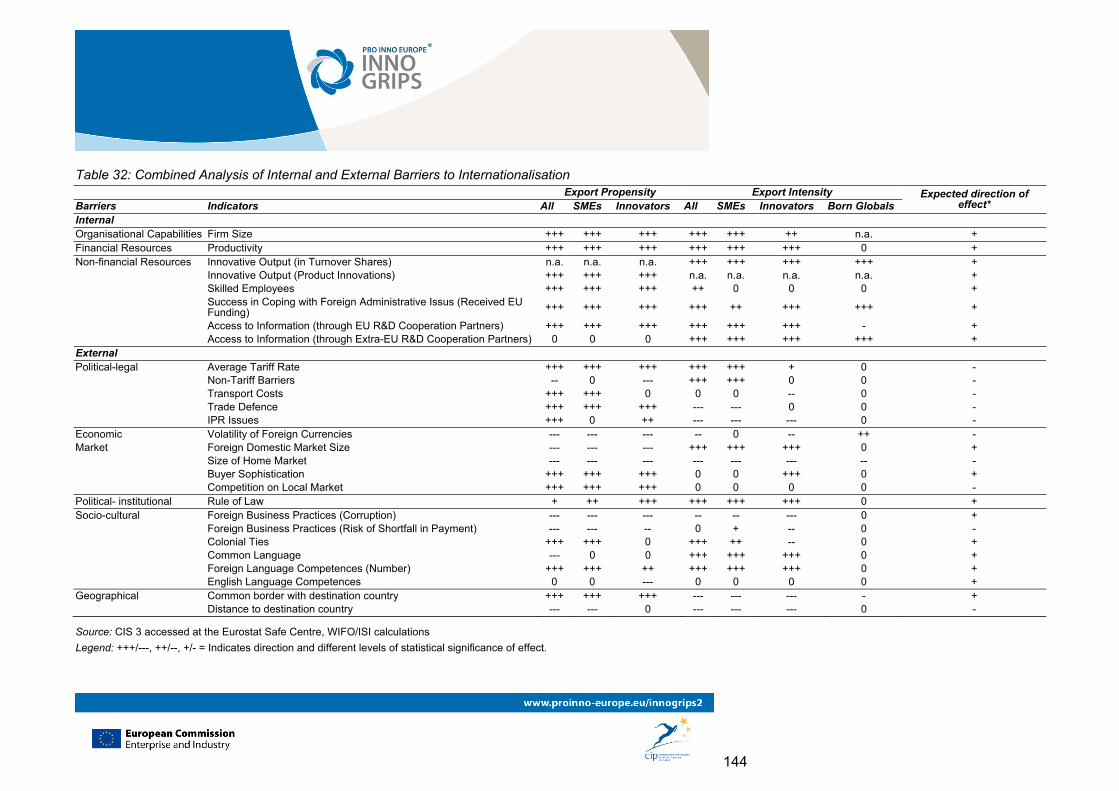
144
Table 32: Combined Analysis of Internal and External Barriers to Internationalisation Export Propensity Export Intensity Expected direction of
effect* Barriers Indicators All SMEs Innovators All SMEs Innovators Born Globals Internal Organisational Capabilities Firm Size +++ +++ +++ +++ +++ ++ n.a. + Financial Resources Productivity +++ +++ +++ +++ +++ +++ 0 + Non-financial Resources Innovative Output (in Turnover Shares) n.a. n.a. n.a. +++ +++ +++ +++ + Innovative Output (Product Innovations) +++ +++ +++ n.a. n.a. n.a. n.a. + Skilled Employees +++ +++ +++ ++ 0 0 0 +
Success in Coping with Foreign Administrative Issus (Received EU Funding) +++ +++ +++ +++ ++ +++ +++ +
Access to Information (through EU R&D Cooperation Partners) +++ +++ +++ +++ +++ +++ - + Access to Information (through Extra-EU R&D Cooperation Partners) 0 0 0 +++ +++ +++ +++ + External Political-legal Average Tariff Rate +++ +++ +++ +++ +++ + 0 - Non-Tariff Barriers -- 0 --- +++ +++ 0 0 - Transport Costs +++ +++ 0 0 0 -- 0 - Trade Defence +++ +++ +++ --- --- 0 0 - IPR Issues +++ 0 ++ --- --- --- 0 - Economic Volatility of Foreign Currencies --- --- --- -- 0 -- ++ - Market Foreign Domestic Market Size --- --- --- +++ +++ +++ 0 + Size of Home Market --- --- --- --- --- --- -- - Buyer Sophistication +++ +++ +++ 0 0 +++ 0 + Competition on Local Market +++ +++ +++ 0 0 0 0 - Political- institutional Rule of Law + ++ +++ +++ +++ +++ 0 + Socio-cultural Foreign Business Practices (Corruption) --- --- --- -- -- --- 0 + Foreign Business Practices (Risk of Shortfall in Payment) --- --- -- 0 + -- 0 - Colonial Ties +++ +++ 0 +++ ++ -- 0 + Common Language --- 0 0 +++ +++ +++ 0 + Foreign Language Competences (Number) +++ +++ ++ +++ +++ +++ 0 + English Language Competences 0 0 --- 0 0 0 0 + Geographical Common border with destination country +++ +++ +++ --- --- --- - + Distance to destination country --- --- 0 --- --- --- 0 -
Source: CIS 3 accessed at the Eurostat Safe Centre, WIFO/ISI calculations
Legend: +++/---, ++/--, +/- = Indicates direction and different levels of statistical significance of effect.
145
In particular, with respect to the relative importance of individual export barriers, we find that
Non-tariff barriers, unstable political and economic conditions (rule of law, volatility of currency), the risk of shortfall in payment, missing colonial ties or language competences and a large distance to the potential destination (and vice versa a missing common border) act as market entry barriers, i.e. they do prevent firms from exporting at all;*
In particular firms with small home markets do export, but export is not restricted to large foreign markets;†
Despite high tariffs, high transport costs, trade defence or IPR barriers and high corruption, firms do export.‡ This means that firms are affected every day by these barriers, and working on the removal of these barriers could perhaps help to increase export shares. This is perhaps less true for tariffs, as the results for the export intensity of firms show: Despite high tariffs, also exports are high. But it could have a positive effect on export intensity of firms, if transport costs, trade defence or IPR barriers or corruption were lower in the export partner countries;§
European firms export to markets which are characterized by high buyer sophistication and competition. Both is to be understood as a challenge for companies rather than a barrier for them.
Born Globals face only few internal barriers and no external barriers at all.**
* Effects show to be in the expected direction. However, the result for non-tariff barriers is not straightforward, as at the same time, high NTB are linked to high export intensities. † See unexpected direction of effect for indicator "Foreign domestic market size". ‡ See unexpected direction of effects for these indicators. § As the table shows, for these indicators the effects with regard to export intensity show the expected sign, i.e. are barriers to increasing export shares. ** As the signs for the few significant effects of external barriers are not in the expected direction.
146
Box 9: Views of US SMEs on Barriers to Exporting and Strategies to Overcome those Barriers
According to the United States International Trade Commission Report (2010) and their report on "Small and Medium-sized Enterprises: US and EU Export Activities, and Barriers and Opportunities Experienced by US Firms", there are several comparable significant barriers to exporting noted also by US SMEs.
First, the domestic barriers are reported to be related mainly to limited access to finance and to difficulties associated with export regulations. Essential for international activities is the ability to finance sales to foreign buyers. Similar to the situation in the EU, it is often difficult for SMEs to get bank financing that is appropriate for international activities. Financing daily operations is another challenge, not only for exports, but also for domestic activities. Many young SMEs are not able to qualify for bank financing.
Apart from financing, US domestic laws and regulations also serve as severe export barriers. Export controls limit exports of specific goods and services (dual-use and military-use products) to specific countries. In general, US companies agree to such controls, but they have to comply with extensive paperwork and many firms are concerned about accidentally violating the regulations. In addition, foreign firms are faced by import regulations and tariffs which are considered barriers if US firms have to import specific goods as intermediate inputs. SMEs of agricultural and manufacturing industries also reported that transportation costs are significant constraints to exports.
Second, foreign barriers limit access to knowledge of foreign markets and regulations. The costs of understanding and complying with foreign regulations (laws) can pose significant barriers to exporting. Due to the limitations in equity capital, small firms are faced with the inability to hire personnel dedicated to navigating the market and regulatory environments of potential export markets. Another important barrier to increasing SME exports is the lack of intellectual property protection (for example China). These poor regulatory environments combined with foreign tariffs hamper the competition with local producers in foreign markets.
For SMEs, the lack of knowledge about foreign markets with a large 'psychic distance' in language and culture is much more difficult than for a large company. There are difficulties in identifying foreign customers and markets and it is vital for SMEs to become proficient in the languages of the emerging markets (BRICS). In most cases, their small size prevents them from hiring the staff needed to identify export opportunities, establish relationships with foreign buyers, and understand import regulations.
Third, US SMEs have developed certain strategies to cope with some barriers to exporting. On the one hand, they use collaboration networks with other firms in the same industry and with larger firms or a distribution (broker) agent. On the other hand, they take advantage of government programs and work through trade associations. Generally, across all industries many SMEs work closely with global shipping and logistic firms, because they can help them access foreign markets by dealing with logistic services.
When comparing EU and US developments the report finds that the US market is much more integrated than the European one:
there are significant differences in terms of export volume (4 times higher in the EU than in the US),
there is only a slight difference between US and EU agencies in granting medium- and long-term export credits, but there are more opportunities to receive pre-export financing and short-term credit in the US than in the EU, and
SMEs in Europe have more sources and a higher level of assistance in foreign markets as well as more financial support for participating in international trade fairs than their US counterparts.
According to the report there are certain structural differences between the US and the EU that help to explain the different export performance. In the US, SMEs play a less prominent role in both manufacturing and exports. With regard to manufacturing, SMEs in the US accounted for some 13% of exports and 19% of sales in 2005; while in the EU it was 34% and 45% respectively. The structural differences between the US and EU are the result historical idiosyncratic developments which lead to certain features that favoured the development of large firms in the US (free market economy, integrated market, common language, etc.). In contrast, the European market has been, of course, historically fragmented. The report points out that its economic integration is not yet comparable to that in the US which partly explains the predominance of SMEs in the EU.
All in all, the report of the United States International Trade Commission largely confirms the same issues regarding the barriers to internationalisation that were presented in this report for Europe. However, the level of detail, especially regarding sectors and country specifics, could (understandably) not be matched and should be left for future research. A systematic comparison of barriers to internationalisation in the US and the EU might shed light on the cross effects of trade barriers or joint effects of trade diversion on sectoral level.
4.4 Conclusions: The impact of internal and external barriers to internationalisation
In our analysis we have found evidence that lacking organisational capabilities, financial resources or non-financial resources can act as barriers to internationalisation for firms. All these barriers might prevent a firm from exporting at all and also from increasing export intensities. With increasing firm size, a firm profits from economies of scale in areas relevant to exporting. SMEs have a structural disadvantage in this respect. The availability of financial resources is important to cover costs related to exporting. However, there is also a bundle of other resources that are important for internationalisation both in terms of firms taking up exports and firms increasing their export intensity. The most important factors are related to the firm's innovative potential and highly
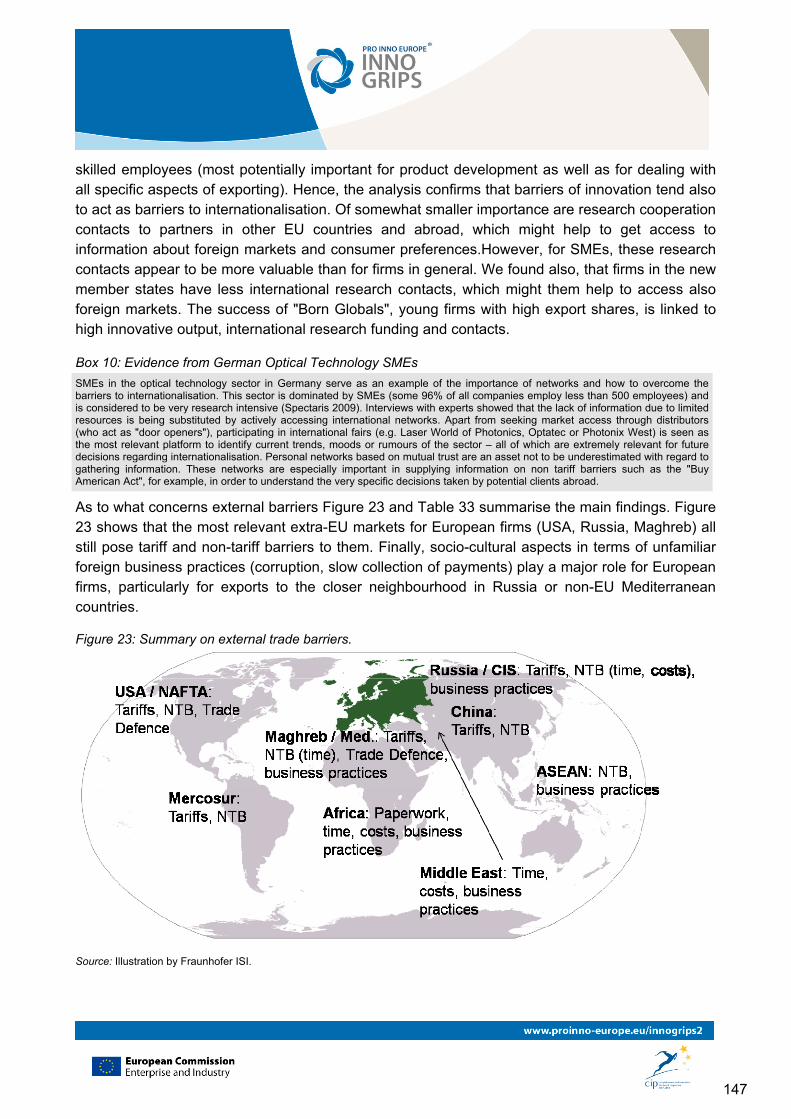
147
skilled employees (most potentially important for product development as well as for dealing with all specific aspects of exporting). Hence, the analysis confirms that barriers of innovation tend also to act as barriers to internationalisation. Of somewhat smaller importance are research cooperation contacts to partners in other EU countries and abroad, which might help to get access to information about foreign markets and consumer preferences.However, for SMEs, these research contacts appear to be more valuable than for firms in general. We found also, that firms in the new member states have less international research contacts, which might them help to access also foreign markets. The success of "Born Globals", young firms with high export shares, is linked to high innovative output, international research funding and contacts.
Box 10: Evidence from German Optical Technology SMEs
SMEs in the optical technology sector in Germany serve as an example of the importance of networks and how to overcome the barriers to internationalisation. This sector is dominated by SMEs (some 96% of all companies employ less than 500 employees) and is considered to be very research intensive (Spectaris 2009). Interviews with experts showed that the lack of information due to limited resources is being substituted by actively accessing international networks. Apart from seeking market access through distributors (who act as "door openers"), participating in international fairs (e.g. Laser World of Photonics, Optatec or Photonix West) is seen as the most relevant platform to identify current trends, moods or rumours of the sector – all of which are extremely relevant for future decisions regarding internationalisation. Personal networks based on mutual trust are an asset not to be underestimated with regard to gathering information. These networks are especially important in supplying information on non tariff barriers such as the "Buy American Act", for example, in order to understand the very specific decisions taken by potential clients abroad.
As to what concerns external barriers Figure 23 and Table 33 summarise the main findings. Figure 23 shows that the most relevant extra-EU markets for European firms (USA, Russia, Maghreb) all still pose tariff and non-tariff barriers to them. Finally, socio-cultural aspects in terms of unfamiliar foreign business practices (corruption, slow collection of payments) play a major role for European firms, particularly for exports to the closer neighbourhood in Russia or non-EU Mediterranean countries.
Figure 23: Summary on external trade barriers.
Source: Illustration by Fraunhofer ISI.
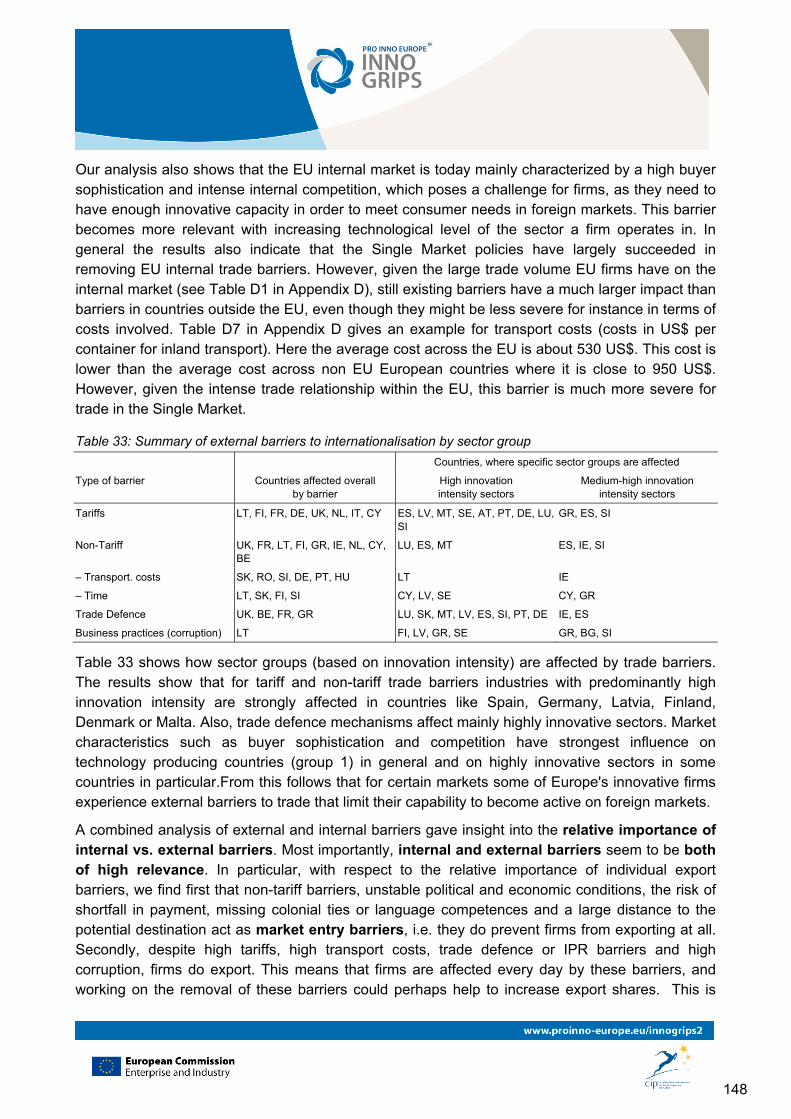
148
Our analysis also shows that the EU internal market is today mainly characterized by a high buyer sophistication and intense internal competition, which poses a challenge for firms, as they need to have enough innovative capacity in order to meet consumer needs in foreign markets. This barrier becomes more relevant with increasing technological level of the sector a firm operates in. In general the results also indicate that the Single Market policies have largely succeeded in removing EU internal trade barriers. However, given the large trade volume EU firms have on the internal market (see Table D1 in Appendix D), still existing barriers have a much larger impact than barriers in countries outside the EU, even though they might be less severe for instance in terms of costs involved. Table D7 in Appendix D gives an example for transport costs (costs in US$ per container for inland transport). Here the average cost across the EU is about 530 US$. This cost is lower than the average cost across non EU European countries where it is close to 950 US$. However, given the intense trade relationship within the EU, this barrier is much more severe for trade in the Single Market.
Table 33: Summary of external barriers to internationalisation by sector group
Countries, where specific sector groups are affected
Type of barrier Countries affected overall by barrier
High innovation intensity sectors
Medium-high innovation intensity sectors
Tariffs LT, FI, FR, DE, UK, NL, IT, CY ES, LV, MT, SE, AT, PT, DE, LU, SI
GR, ES, SI
Non-Tariff UK, FR, LT, FI, GR, IE, NL, CY, BE
LU, ES, MT ES, IE, SI
– Transport. costs SK, RO, SI, DE, PT, HU LT IE
– Time LT, SK, FI, SI CY, LV, SE CY, GR
Trade Defence UK, BE, FR, GR LU, SK, MT, LV, ES, SI, PT, DE IE, ES
Business practices (corruption) LT FI, LV, GR, SE GR, BG, SI
Table 33 shows how sector groups (based on innovation intensity) are affected by trade barriers. The results show that for tariff and non-tariff trade barriers industries with predominantly high innovation intensity are strongly affected in countries like Spain, Germany, Latvia, Finland, Denmark or Malta. Also, trade defence mechanisms affect mainly highly innovative sectors. Market characteristics such as buyer sophistication and competition have strongest influence on technology producing countries (group 1) in general and on highly innovative sectors in some countries in particular.From this follows that for certain markets some of Europe's innovative firms experience external barriers to trade that limit their capability to become active on foreign markets.
A combined analysis of external and internal barriers gave insight into the relative importance of internal vs. external barriers. Most importantly, internal and external barriers seem to be both of high relevance. In particular, with respect to the relative importance of individual export barriers, we find first that non-tariff barriers, unstable political and economic conditions, the risk of shortfall in payment, missing colonial ties or language competences and a large distance to the potential destination act as market entry barriers, i.e. they do prevent firms from exporting at all. Secondly, despite high tariffs, high transport costs, trade defence or IPR barriers and high corruption, firms do export. This means that firms are affected every day by these barriers, and working on the removal of these barriers could perhaps help to increase export shares. This is

149
perhaps less true for tariffs, as the results for the export intensity of firms show: Despite high tariffs, also exports are high. But it could have a positive effect on export intensity of firms, if transport costs, trade defence or IPR barriers or corruption were lower in the export partner countries.
150
5 Summing up: Barriers to innovation and internationalisation for Europe's innovative companies
In Chapter 2 of this report we have analysed the relationship between innovation and internationalisation at the firm level. The results of our analysis show that innovative companies are more likely to export. On average they have also higher export shares, higher productivity and turnover growth. Across all countries and industries the likelihood that an innovative firm exports is determined by its productivity levels and by product innovations. The same holds if only innovative SMEs are analysed. The export shares or the export intensity of innovative firms instead depends additionally on different factors. Our results show that more innovative firms export also a higher share of their production. In this context firms are considered to be more innovative if they obtain a higher share of their turnover by selling innovative products. Other factors that affect the export intensity are labour productivity, continuous R&D activities, labour productivity, and a high appropriability of the returns to their innovation investments. The same factors drive export intensity also for innovative SMEs. The results from the pooled cross country sample for innovative firms in 21 member states confirm the results that have been obtained in past studies on single countries.
However, if we break down our analysis to subsamples which differentiate innovative firms in terms of the average technological capability of the countries in which firms are located and by the dominant technological regimes in the industries in which firms operate, then the results show that the aforementioned determinants of export propensity and export intensity are not equally important across subgroups, whereas Product innovations largely determine the export propensity of innovative firms in the most innovation intensive industries across all country groups, whereas labour productivity plays only a subordinate role in these industries. However, as the innovation intensity of the industry in which a firm operates decreases, labour productivity becomes more important as a determinant of the export propensity. This suggests that firms in the most innovative industries draw their competitive advantage from establishing markets in which their products provide high value to users, whereas firms in less innovative industries are on average more likely to engage into cost based competition. The determinants of the export intensity instead vary less across industry types and more across country groups. The export intensity of innovators in the technologically more advanced countries is largely determined by continuous R&D, the degree of appropriability of returns to innovation (e.g. strong IPRs) and to a lesser extent by labour productivity, whereas in the countries that are predominantly technology importers no clear picture emerges as to the principal determinants. The overall picture is that continuous R&D and appropriability are important drivers of exports for innovative companies located in countries with advanced technological capability whereas R&D plays a more subordinate role for exports by innovative firms located in countries that are predominantly technology importers.
Establishing the impact of exporting on innovation is more difficult due to the specifics of the CIS data. However, our exploratory econometric analysis shows that exporting has positive effects on innovation for the pooled firm sample for 21 countries. If we break down the analysis to the
151
country-sector subsamples the results are not consistent. This suggests that for the available data no clear cut impact of exports on innovation can be established. However, other research based on better data for specific countries indicates that exporting has a positive impact on innovation such that this evidence supports our finding for the pooled sample. It triggers learning effects and access to larger markets increases the turnover of exporting firms such that larger amounts of the cash flow can be devoted to innovation and R&D investments. Overall, the available evidence suggests that innovation and export activities are closely related and that they may be considered to be two sides of the same coin. This emerges also from the analysis of the impact of innovation and exporting on different economic performance indicators.
Innovation activities and exporting affect the economic performance in terms of employment and productivity growth of firms positively. Our results confirm the common wisdom that innovation is an important driver for productivity growth. However, our analytical approach allows us to draw a more differentiated picture. Our findings suggest that in industries with medium to low innovation intensity productivity growth is mainly driven by process innovations, while in industries with high innovation intensity especially in the member states that are technologically more advanced productivity growth depends more heavily on product innovations. This is in line with the findings of other studies that in technologically more advanced member states competition is more heavily based on product quality and the development of niche markets, whereas in member states that are in a process of catching up competition is based on price advantages.
This indicates that the catching up process (or the process of economic convergence in the EU) is one of technological upgrading. If firms are technologically less advanced and the framework conditions in the countries in which they are located are not favourable to top level technological research and development, then they increase their competitiveness through technology transfer and by exploiting their cost advantages on export markets. Technology transfer however implies that firms start internationalising by importing technologies and knowledge from more advanced firms and countries. This way of improving competitiveness however starts to lose importance as firms develop their technological capabilities and economic framework conditions improve in such a way that factor costs rise. This erases the cost advantages on export markets, and firms have to start upgrading their products and technologies if their aim is to compete successfully on domestic and international markets. As a consequence the importance of continuous R&D activities and product innovation as a core source of competitive advantage on international markets rises relative to technology acquisition. This pattern of technology upgrading of course calls for a differentiated policy approach to innovation and internationalisation across country groups.
The evidence presented so far indicates that innovation and exporting are highly complementary. For this reason we have examined both factors hampering innovation across EU member states, and factors hampering internationalisation efforts of innovative industries and firms. Chapter 3 was devoted to different aspects that may hamper or foster innovation. We have distinguished between barriers to innovation that are related to the capabilities and factors of production of companies, and barriers related to legal and institutional conditions. Under the former type we have subsumed knowledge barriers, financial barriers and skill shortages, whereas the latter refer to IPRs,
152
standards and regulations. We present first the evidence gathered on barriers to innovation related to the factors of production of firms.
Knowledge barriers to innovation relate to the lack of knowledge on technologies, markets and knowledge sources. The results of our econometric analysis show that small firms and firms that are not part of a larger corporate group are more likely to experience knowledge barriers. The reason for this is that larger corporations or affiliated groups have a size advantage. They are able to spread overhead costs related to knowledge sourcing activities or measures of internal knowledge management over a larger output. Smaller firms therefore are at a disadvantage as they often cannot afford to explore information on markets and technologies systematically. On the other hand, the results show also that firms that are already internationalised systematically report to experience higher knowledge barriers to innovation. The same finding applies to firms with higher skill intensity. These firms are better aware of the limits of their knowledge as they operate on more competitive markets and hence report higher barriers. If on the other hand the knowledge base of an industry is characterised by high cumulativeness firms are more likely to report technical knowledge barriers. In these industries it is more difficult to build up new knowledge as it is more heavily based on previous competencies. This makes it more difficult for smaller firms to access critical knowledge. Overall the results indicate that the lack of technical knowledge is perceived as being important especially in industries with medium or low innovation intensity. Manufacturing firms are also more likely to report knowledge barriers than firms in service sectors. An analysis between innovative and non-innovative firms has not revealed any significant differences.
Another set of barriers that constrain the innovation activities of firms are financial barriers to innovation. Previous research has shown that financial barriers have a higher impact on innovation for SMEs and young firms. Larger companies and companies that are part of a larger corporate group are less likely to experience such problems, as due to their size it is easier to set up collateral or reallocate funds within the group. Financial barriers are particularly important for SMEs with very novel products and technologies. Past research has shown that research intensive firms are more likely to experience financial barriers. Our results show that this holds also for firms that rely heavily on advanced knowledge for instance from research institutes or universities. However, IPRs are important in this respect: SMEs which can show some form of IPR for the result of their innovation activity – in particular, a patent –are less likely to be affected by financial constraints. Firms that are engaged in both innovation and internationalisation are also more likely to report that their innovation activities are hampered by financial issues. Carrying out both activities at the same time is more risky, and therefore it is more difficult to find credit. This holds true as well for non-innovative firms which want to innovate but are held back by barriers, whereas non-innovative, internationalised firms which do not want or need to innovate are less likely to be financially constrained.
The perception of financial barriers to innovation is heavily related to the general institutional framework conditions. Firms in industries that are heavily dependent on external finance are more likely to experience financial barriers to innovation in countries with less developed financial systems. Our results show that smaller firms are financially more constrained especially in the
153
economically most advanced EU member states. Innovative firms there need more VC/PE based funding as they are less likely to have tangible capital to offer as collateral. Indeed, our results indicate that SMEs which in principle would be attractive investment targets for VC funds (highly innovative and growth oriented) are more financially constrained in countries with a low intensity of venture capital than the same type of SMEs active in countries with higher venture capital intensities. Furthermore, our results show that fast-growing firms are significantly more likely to report financial constraints in the richer country groups 1 and 3 and less likely in the economically less advanced country groups 2 and 4. This may be linked to the fact that only in more advanced countries do fast-growing firms follow more frequently innovation-based growth strategies (Hölzl and Friesenbichler 2010), while in catching-up countries they can rely on different growth strategies which are less demanding in terms of external financing needs.
Another important factor that constrains innovative firms across Europe is skill shortages. Previous research on the impact of skill shortages on innovation shows that small, young, innovative and growth-oriented firms are more likely to be affected by skill constraints especially in the most advanced economies of the EU than firms that do not have these characteristics. Several contributions maintain that firms in peripheral regions with a thin local skills base are more likely to be hit by skill constraints. Institutional and economic framework conditions have generally been shown to have a significant impact on the perception of skill constraints on the side of innovative firms. Firms in countries producing a comparatively low share of tertiary graduates (particularly in science and technology, but also overall) and which are economically and technologically more advanced are likely to be constrained by skill shortages. Firms in countries with strong dual labour markets and hence a high share of workers on temporary contracts are also likely to experience skill constraints. Finally, firms in countries with rigid employment protection and low vocational training are also more likely to report skill constraints. In both cases the reasons are that (potential) employees and firms tend to under invest in human capital formation because of adverse incentives.
In our analysis we have explored the characteristics of innovative firms that report skill constraints. Controlling for all other factors, firms that are innovative, active on international markets and not affiliated to a foreign group are more likely to report skill barriers. This is most likely related to the fact that these firms are on average more skill and technology intensive. Indeed, for R&D and skill intensive firms skill shortages constitute serious hampering factors for innovation. This holds true as well for firms which have not innovated successfully, but which want to innovate and are held back by skill shortages (barrier-related non-innovators). Also fast growing SMEs, so-called gazelles, operating in the technologically most advanced countries are more likely to report skill constraints as hampering factors. Manufacturing firms are on average also more likely to report the lack of skilled labour as a factor constraining innovation than service firms. Overall, these results indicate that skill constraints become more serious the more technologically advanced a firm and the country it is located in are. This evidence points to serious failure of the education system of the most advanced EU economies to turn out highly skilled labour at sufficiently high rates.
Turning to institutional factors that affect innovation adversely we have first looked at issues related to the intellectual property rights regime (IPR). In this area there exists already a
154
considerable body of evidence which we have reviewed in this study. The current European IPR system has several characteristics that are unfavourable for innovation. Most importantly, there is currently no single European patent, yet, and the costs an applicant has to incur after the grant of a patent by the European Patent Office (EPO) in terms of translation, validation and transaction costs is very high. The costs per claim per capita are about ten times higher than in the US. SMEs and other people or organisations without the resources to afford the high cost both in terms of time and money of filing a patent (e.g. universities or independent inventors) are put at a disadvantage by the current system. SMEs will also face more difficulties in protecting their IPR abroad. This affects not only incentives to innovate, but also financial constraints as it is easier to obtain VC financing when a patent application has been filed.
Standards are in general conducive to economic growth and an important element of the innovation infrastructure. Previous research shows that standards perform an important role for the diffusion of technology and as focussing device for innovative search. They act as focussing and structuring device that guides future innovation activities, but at the same time they also limit variety and thereby reduce the number of avenues open for innovative search. On the one hand, this reduces the cost of innovation activities but on the other hand it may also obstruct promising avenues of research. However, firms generally regard standards as important information sources for innovation activities. Thus, in general standards should be considered as important elements of the modern innovation process. The literature also shows that standards are conducive for international trade as they help defining important product characteristics in foreign markets more clearly. The evidence indicates that standards are of comparable importance as source for innovation as patents because they provide guidance to innovation activities. Early standardisation is also a central ingredient for the establishment of a lead market. However, guiding early standardisation processes is difficult as it requires the identification of promising themes of standardisation. In addition new impulses from R&D need to be integrated into the ongoing process of standardisation.
Standards are seen as barrier to innovation primarily by firms that operate on local markets. In most of the areas of research, patenting, innovation and standardisation SMEs are at disadvantages compared to large companies. Therefore many SMEs see the process of standardisation as subject to regulatory capture by large firms. However, it is important to note that the participation of SMEs in the process of standardisation is akin to technology transfer: expert knowledge is provided for SMEs, communication about technological requirements for using specific techniques and a point of departure for the cooperation between enterprises, research institutions and the public sector. In this sense they are an important element of technology transfer. In order to increase the participation of SMEs in standardisation processes it is necessary to reduce information deficits regarding rules and products, and to reduce costs of participation (opportunity costs and lack of qualified personnel), and improve enterprise competencies.
The literature on the politics of regulation shows that there is a close relationship between standards and regulation. Often regulation uses standards to define acceptable behaviour and voluntary industry standards. Codes of conduct are frequently used in response to public and political pressure for regulation. Thus much of what has been said with regard to standards holds also for regulation. The difference is that regulation imposes mandatory standards while norms are
155
voluntary. The evidence indicates that the general tenet in the economics literature claiming that regulation has negative effects on economic performance and innovation needs to be qualified. While regulation in general increases the costs of products and processes, the associated reduction in innovation incentives need to be compared with the non-innovation effects of the regulations. The costs and benefits of regulation can only be assessed by an industry by industry basis. In general competition-enhancing regulation or deregulation creates incentives to innovate for both incumbents and new entrants.
Our survey of the literature and findings from the analysis of available data on innovation at the firm level suggest that the use of regulation as innovation policy is relatively limited. The survey of regulation in several industries led to the impression that environmental regulations are more important than other regulations in providing focusing devices for innovation activities. This may be associated with the fact that environmental regulation creates substantial costs for the firms and the development of solution problems may provide substantial competitive advantage. The anticipation of regulation and societal pressure trigger firm innovation activities. Successful innovation allows governments then to put regulation in place afterwards that is required in order to force all firms to use the new production technique (environmental regulation). Our analysis of the CIS data revealed that larger firms and exporting firms report more often that their innovations improved the environmental, health and safety characteristics of their products or processes. The same firms state that their innovation activities helped to meet regulatory requirements. The survey of the relevant literature and the evidence produced for this report suggest however, that regulation can be a successful instrument of innovation and internationalisation policies mainly in the area of environmental regulation and regulations that are established because of strong public pressure. In these cases regulations act as focusing devices for new innovations.
The first part of this report has shown the close relationship between innovation and internationalisation. Internationalisation by innovative firms is therefore constrained by both different types of barriers to innovation and by trade barriers. For this reason we have examined also barriers to internationalisation. In analogy to innovation barriers one can distinguish between barriers related to firm characteristics, and barriers related to institutional factors or policies such as tariffs or non-tariff trade barriers that cannot be influenced by the single company. Barriers to internationalisation that are related firm to characteristics can be analysed using CIS data. External barriers instead have to be analysed using industry specific data and an industry taxonomy that classifies them according to their innovation intensity.
Considering internal trade barriers first, our results show that the export propensity clearly increases with firm size. While only about 38% of micro firms do export, it is two thirds of medium-sized firms who sell their products abroad. These figures capture the overall propensity. Unfortunately it is not possible to establish whether it varies for firms exporting to the Single Market and for firms exporting to non-EU markets. However, industry specific export shares show that across EU member states firms export most intensively to other member states. Hence, these results reflect mostly the propensity of innovative firms in Europe to become active on the Single Market. More detailed research using different data is needed here to overcome this shortcoming. Overall, the internal barriers to internationalisation beyond organisational and financial resources seem to be related to a lack of innovative capabilities, of information and capabilities which are
156
closely linked to some of the firm specific barriers to innovation. Indeed, the results indicate that among internal (firm-specific) barriers, the lack of highly skilled employees as well as a lack of knowledge about international opportunities is the most important factor. Particularly SMEs find it generally difficult to find the right international trading partner. The lack of financial resources is an important barrier to internationalisation for similar reasons as this affects innovation behaviour.
Turning to external barriers to internationalisation our analysis reveals that they arise when firms export to specific countries. Tariff barriers are relevant for firms exporting to countries in the north of Africa and the Middle East, Russia, China, and also to the US, Brazil or India. Non-tariff trade barriers instead hamper exports to the United States, Russia, China, India, and Mexico. Across all EU member states these barriers affect firms in highly innovative industries more heavily than those in other industries. Issues with IPRs (e.g. weak enforcement, high likelihood of contestation) or trade defence rules (e.g. anti-dumping measures) are also relevant. They affect internationalisation efforts of firms especially in industries with medium or low innovation intensity across all EU member states negatively. Issues of trade defence are significant for exports to the US, whereas the Market Access Data Base of the European Commission reports issues related to IPRs for Turkey and the US. The IPR issues with the US affect industries with high innovation intensity more heavily. Cultural aspects are also significant barriers to internationalisation: The lack of knowledge of foreign languages and related problems to understanding foreign habits and business practices affect exports to Russia or non-EU Mediterranean countries.
Looking at intra-EU trade we find that even in the Single Market barriers continue to exist. We find that costs for inland transport are rather high within some EU countries. Another aspect that increases the difficulty of exporting to the EU internal market is that it is characterised by high buyer sophistication which forces firms to adapt their product features and characteristics to the customers' habits and attitudes. This characteristic of the internal market may act as a hampering factor for firms that are constrained by internal barriers to internationalisation. This indicates that the relatively high heterogeneity of preferences of customers across EU member states is likely to put European innovators at a disadvantage with respect to innovators operating in economic areas that are more homogeneous. However, this may also be seen as a factor that increases the flexibility of European innovators to adapt to a heterogeneous business environment, which eventually may be beneficial for exporting to non-EU markets.
A combined analysis of external and internal barriers gave insight into the relative importance of internal vs. external barriers. Most importantly, internal and external barriers seem to be both of high relevance. In particular, with respect to the relative importance of individual export barriers, we find first that non-tariff barriers, unstable political and economic conditions, the risk of shortfall in payment, missing colonial ties or language competences and a large distance to the potential destination act as market entry barriers, i.e. they do prevent firms from exporting at all. Secondly, despite high tariffs, high transport costs, trade defence or IPR barriers and high corruption, firms do export. This means that firms are affected every day by these barriers, and working on the removal of these barriers could perhaps help to increase export shares. This is perhaps less true for tariffs, as the results for the export intensity of firms show: Despite high tariffs, also exports are
157
high. But it could have a positive effect on export intensity of firms, if transport costs, trade defence or IPR barriers or corruption were lower in the export partner countries.
To conclude, the three analytical chapters of this report show that internationalisation and innovation are closely related. Barriers to innovation therefore act also as barriers to internationalisation, and trade barriers on the other hand have also a negative impact on innovation. The removal of barriers to innovation will positively affect the internationalisation efforts of innovative firms, whereas the elimination of barriers to internationalisation is likely to foster innovation activities of firms. Our study of the barriers to innovation and the barriers to internationalisation supports the view that innovation and internationalisation are two sides of the same coin. Indeed, firm specific barriers to innovation and firm specific barriers to internationalisation are largely congruent. The results show however also that the perception of barriers varies across countries. Firms in technologically more advanced countries are more likely to perceive both innovation and internationalisation barriers as more pressing because they are also more heavily engaged in these activities, and also because the principal drivers of innovation differ across these country groups. This calls for a differentiated policy approach. Another important qualification emerging from our analysis is that it is possible to identify in the CIS non-innovators that do not engage into innovation and internationalisation because they perceive certain barriers that force them to limit their engagement in these activities. They are distinct from non-innovators or firms that do not internationalise because they operate on local markets and have no intension to expand their activities beyond their regional or national reach. Hence, the former group represents an important target for policy that should be addressed in a more focused way.
158
6 Internationalisation and innovation: Issues for EU policy
6.1 Introduction The empirical results of this study – summarised in the previous chapter – show that innovation and internationalisation of firms are closely linked. This implies that barriers to innovation act also as barriers to internationalisation, while trade barriers have also a negative impact on innovation. The removal of barriers to innovation will positively affect the internationalisation efforts of innovative firms, whereas the elimination of barriers to internationalisation is likely to foster innovation activities of firms. The results have also shown that significant barriers in both areas exist and that not all firms are equally affected by them. The aim of this chapter therefore is to give a concise overview on the policies that are in place at the EU level to support innovation and internationalisation and to give an assessment on whether these policies are adequate in the light of our results. We will also discuss at which administrative level (EU or member state) specific measures should be pursued.
The European Commission attaches high importance to these questions in its new strategy Europe 2020 (European Commission 2010c) and the Flagship Initiative "Innovation Union" (European Commission 2010d). In the communication on the Innovation Union the European Commission expresses a commitment to remove the remaining barriers for entrepreneurs to "bring ideas to the market". Among other goals the EC defines better access to finance, particularly for SMEs, affordable IPRs, smarter and more ambitious regulation and targets, and a faster setting of interoperable standards as principal barriers to be addressed. The communication calls also for member states to reach agreement on the EU patent before the end of the year 2010. All these aspects have been analysed in this report, and we will therefore discuss EU policies on the background of our findings. Finally, the communication on the Innovation Union urges also to link EU and national research and innovation systems better up with each other. This implies that a better coordination of policies between the different administrative levels is necessary. We will discuss this aspect as well. However, it should be noted that this assessment cannot be comprehensive, as a policy mapping and a detailed impact assessment are beyond the scope of this report.
In this chapter we will first review EU policies addressing the different barriers analysed in the analytical part of this report. In the second part of this chapter we will also look at how some member states try to support innovation and internationalisation in firms.
159
6.2 EU policy measures addressing barriers to innovation and internationalisation
6.2.1 Policies targeted at knowledge barriers to innovation Alleviating knowledge barriers to innovation requires a broad mix of measures. Barriers related to information on technology and innovation collaboration are one of the starting points of innovation policy, while the provision of information on markets is an important part of activities to promote exporting. The 10th principle of the Small Business Act emphasises that the EU and the member states should support and encourage SMEs to benefit from exporting, in particular through market specific support and business training activities.
6.2.1.1 Lack of market information as barrier to innovation
As the results reported in Chapter 3 suggest SMEs need assistance in getting information on foreign markets and overcome barriers to business that may have cultural or regulatory roots. In order to help SMEs in exporting the Commission
has established Market Access Teams in key export markets that aim at a cooperation of Member States' trade councillors and EU business organisations in order to improve SMEs' information on trade barriers markets outside the EU.
will promote trade facilitation both in the context of the WTO and in bilateral negotiations and in particular aim at opening up of non-EU countries' procurement markets
will continue to facilitate EU SMEs' access to the markets of candidate and other neighbourhood countries
intends to establish European Business Centres in 2009 in selected markets, starting with the fast-growing economies of India and China
Beside these policy measures in the SBA member states are asked to put in place schemes that encourage coaching of SMEs by large companies in order to bring them to international markets. These policy measures aim primarily at increasing the share of new exporting firms by reducing informational barriers and are discussed in more detail in section 5.2 of this report.
6.2.1.2 Lack of technological information as barrier to innovation
With regard to barriers to information on technology there are two important levers. The first one consists in improving the quality of the informational environment of firms – the quality of university research and the quality of government research. The second level consists in the propagation and fostering of co-operation between universities, public and private research institutes and firms, and between large and small firms, both domestically and internationally. This goal is addressed in Guideline 4 of the Europe 2020 strategy "Optimising support for R&D and innovation, strengthening the knowledge triangle and unleashing the potential of the digital economy" and since a long time integral part of EU innovation policy. Since the mid-1980s innovation policy in the EU has become a multi-level policy area regarding contents, budgets and institutions (Grande 2000, Borras 2003). The Lisbon European Council in 2000 has served to strengthen the common innovation and research policy objectives based on the Lisbon strategy in European countries. In

160
outlining EU policy initiatives to fight knowledge gaps in area of technological information and know-how it is useful to distinguish three different roles of the European Commission in the European innovation policy landscape:
The European Union acts as regulator. This function becomes particularly clear in the policy area of intellectual property rights, standards and other regulations that are relevant to innovation policy, such as state aid guidelines.
The European Commission acts as programme owner by funding or co-funding innovation activities in the Member States. The most important instruments in this regard are the 7th Research Framework Programme, the Competitiveness and Innovation Programme and the Structural Funds.
The third role stems from the need to manage and to coordinate the complex horizontal policy field of innovation policy, which is in fact a multi-layer policy field. In policy areas where there is no mandate for the EU to act as policy maker, regulator and/or as programme owner due to missing rationales from a subsidiarity perspective, the European Union takes on the role of communicator, with the "right" to initiate discussions, to propose coordinates solutions and to monitor Member State progress on the agreed goals (Leo et al. 2008).
For policies that deal with technological barriers and barriers to innovation collaboration, regulation plays a minor role. Standards can act as device of information on technologies but are discussed in detail in section 2.6 of the present report. Therefore, we focus on the specific support policies implemented in the CIP and the FP and the function of the EU as communicator and coordinator.
The three programmes (FP, CIP and Cohesion Funds) are distinct since the Commission has focused on different phases and actors of the innovation process. The framework programmes are oriented towards the provision of EU-wide public goods and policies in the fields of science, technology and research. While there is a strong focus on supranational collaboration, there is also a strong orientation on scientific and technological excellence that implies that policies in the framework programmes are not directed towards the closing of technology gaps in small firms. The exception is the Capacities programme in the FP that covers 8.1% of the FP7 budged. The objective of this program is to support research infrastructures, research for the benefit of small and medium-sized enterprises (SMEs) and the research potential of European regions (Regions of Knowledge), as well as to contribute to the realisation of the full research potential (Convergence Regions) of the enlarged Union. The initiatives grouped under the Capacities programme have as primary interest regional policies and are often directed at technology transfer. These initiatives are often complementary to the Structural Funds.
The Competitiveness and Innovation Programme (CIP) brings together several existing quite specific programmes supporting competitiveness and innovation into a common framework. In the Entrepreneurship and Innovation Programme (59.8 % of the budget) beside providing funding for start-up and growing SMEs, the creation of an environment beneficial to SME cooperation, innovation in enterprises, entrepreneurship and innovation culture, enterprise- and innovation-related economic and administrative reforms including policy analyses (Pro INNO Europe and Europe INNOVA) are central goals. The Information and Communications Technology (ICT) Policy
161
Support Programme (20.1 % of the budget) is aimed at creating a Single European information space by strengthening the internal market for information products and services, and stimulating innovation through a wider adoption of investment in ICT. The Intelligent Energy – Europe Programme (20.1 % of the budget) supports sustainable development in the field of energy. Overall the CIP is oriented towards the diffusion and adoption of new technologies. Its purpose is to bridge the gap between basic research (within the Framework Programme) and measures related to business practices, industry processes and sector strategies. The CIP primarily targets at SMEs, business support services and policy learning. It is thereby primarily an instrument to target informational barriers to innovation.
It is the explicit aim of the Commission to orient structural policies towards the strategic goals of the EU2020 agenda, taken up in the Communication on the Innovation Union with the aim of creating a single innovation market. One of the aims is improve the use of existing Structural funds for research and innovation projects. Thus the aim of Structural Funds therefore is not only to redistribute financial resources but also to strengthen the factors determining regional development. This emphasis on innovation has been present in the Structural Funds since some time. Between 2000 and 2006 RTI expenditures amounted to about 5.2 % of the total Structural Funds (European Commission 2007), but there were substantial differences between countries (Hölzl 2006). The challenge of RTI policy in the Cohesion and Structural Funds is to assist adapting local policies and institutions in order to aid the enhancement and realignment of workable local and national innovation systems, including the promotion of collaboration and technology transfer to reduce barriers related to missing information on technology.
The reaction of cohesion regions and countries crucially depends on the ability of their innovation systems to develop innovative networks and formal and informal institutions that support growth. Evaluations of RTI activities in Structural Funds for the period 1994-1999 suggest a high failure rate (Circa et al. 1999). Failure was primarily related to a strategic incoherence of the RTI investment and regional development strategies. It also turned out that orientation towards R&D-intensive industries often had no impact in less favoured regions due to lack of focus on activities reflecting and reinforcing local comparative advantages (Midelfart-Knarvik and Overman 2002). This suggests strongly that policy actions to fight knowledge barriers due to technology need to take account of the local innovation system. Thus the subsidiary principle limits EU policy in this policy area to the establishment of forums for policy learning and to the role of communicator to propose coordinated solutions and to monitor Member State progress.
6.2.1.3 Lack of innovation partners as barrier to innovation
There is evidence for important international spillovers of both public and private research (e.g. Keller 2004). Most innovation promotion policies by member states, however, are targeted at domestic innovation collaboration. The (industrial part) of the Framework Programmes is thus the most extensive public support scheme for cross-European innovation collaboration with a focus on thematic priorities that are related to EU-wide goods or directed towards issues with large a potential for spillovers.
162
For the support of SMEs the issues are a bit different. Most innovation-activating policy measures for SMEs have a local character, because international collaboration is much more expensive than local collaboration. Only for a small set of firms, most likely SMEs with a very high R&D intensity whose relevant market is global from start there might be a strong case for dedicated support of cross-border collaboration.
Nevertheless there is a strong case for collaboration-oriented R&D policies for SMEs. Even if research collaboration with universities and other firms is more expensive than performing an innovation project alone, there are indications that collaborative projects support the building up of innovation capacities of SMEs if research grants for large firms are tied to collaboration requirements. For the most advanced countries that need to focus more on break-through innovation the use of collaboration requirements and collaboration programmes may actually also increase the additionality of public money used for enterprise R&D promotion, as collaborative projects are most likely not the R&D projects the firms can do alone.
Table 34: EU policy instruments to alleviate knowledge barriers
Institution Policy Description
European Commission Framework Programmes R&D policy with a focus on European public goods. Generally of minor importance for SMEs, except the capacities programme that is oriented at providing funding for research in favour of SMEs (knowledge gaps)
European Commission Community Innovation Programmes
Policy learning, coordination of cluster programmes,
European Commission, CEN CENELEC, ETSI
Coordination of standard setting Standard setting by CEN, CENELEC and ETSI
European Commission & Member States
Structural Funds/ESF Regional policy
European Commission Higher education policy Bologna for higher education system, European Qualification Framework (EQF), monitoring member states
Source: European Commission, compiled by WIFO.
6.2.1.4 Assessment
Technological knowledge barriers to innovation and innovation collaboration are at the centre stage of innovation and research policy in Europe, especially at the European level. Most European innovation promotion schemes entail a form of international innovation collaboration. Given the importance of innovation policy for developed economies such as most EU countries and the differences between countries regarding their research and innovation capacities (distance to the frontier), it is no wonder that innovation policy in the EU is a complex multi-level policy field. In addition innovation policy is not only horizontal but has also important sectoral aspects, as the thematic scope of the framework programmes shows.
In this context it is important to note that not all innovation and research policy initiatives need concern innovation barriers of small firms. Many innovation and research policy goals are built on research excellence, especially in the EU framework programmes. Many firms reporting innovation constraints due to lack of technological knowledge and innovation partners are small innovative or barrier-related non-innovators. The transaction costs of acquiring technological knowledge and collaborative R&D projects are comparably more expensive for small firms than for larger firms.
163
This implies generally that in order to counter technological knowledge barriers and lack of innovation partners action needs to be set at the sub-national or national level. Regional and national innovation systems are diverse and policies need to fit into the specific innovation system.
This institutes a warning. Best practices might be context-dependent and not transferable. This implies that the subsidiary principle limits EU policy in this policy area. The main role of the EU level is to establish framework conditions that allow for policy learning across regions and Member States. The results on gazelles by Hölzl and Friesenbichler (2010) and in this report suggest strongly that R&D is a comparative advantage of high growth firms especially in countries close to the technological frontier. This clearly limits centralized EU involvement. However, there are few policy areas where smart action is necessary:
1. Cross-border research collaboration is often restricted by national innovation promotion agencies. The framework programmes and other EU initiatives are important in this respect as require international collaboration.
2. The EU should put pressure on the establishment of more collaborative R&D programmes. Most innovation promotion programmes at the national level do not have collaboration requirements. In order to foster the technological competencies of SMEs and technology diffusion to SMEs it might worthwhile to promote the use of collaboration requirements in public innovation promotion (especially for larger firms).
3. What seems to be lacking so far in direct funding is an integrated perspective on innovation and internationalisation. Here internationalisation could enter the funding criteria in R&D promotion schemes, especially for larger firms and established larger SMEs. This might also help to reduce windfall gains and increase the additionality of public innovation funding.
4. With regard to research infrastructure investment it needs the local and regional specialisation patterns need to be taken into account otherwise "cathedrals in the desert" without any connection to the local and regional SMEs might result. Nevertheless research infrastructure might be more important than R&D funding for closing gaps (especially of SMEs) related to technological knowledge and lack of innovation partners.
5. Last but not least, innovation funding needs to be evaluated rigorously with regard to its additionality effects. Only stringent evaluations can provide policy makers with the necessary knowledge to select or tune their policy instruments. Basing the instruments on market failures is a first step. Providing clear policy goals is a second step. The third step is evaluation of the functioning of innovation funding. Here simply listening at the voice of recipients does not reveal the effectiveness of the programme to achieve additionality and value for money. In the light of the consolidation needs of public budgets in the Member States a push for the use of more transparent and rigorous evaluation methods also in the field of innovation promotion seems to be timely.
6.2.2 Policies targeted at financial barriers to innovation Alleviating financial constraints to innovation requires a broad mix of measures. There are two levers, the first one consisting in regulatory policies to foster financial development and venture capital fund activity, the second one consisting in direct support to firms affected by financial
164
constraints, either via firm-level financial support in the form of capital guarantees, public venture capital etc. or in the form of grants or subsidies to R&D projects (see Peneder 2008, for a survey). We examine each in turn, describing EU-level policy tools and initiatives.
6.2.2.1 Regulatory initiatives
Financial development depends on financial stability and convergence toward international standards. Important issues in particular for emerging countries are stock market development, small- and medium-size enterprise financing, and defined-contribution pension systems (de la Torre et al. 2007). More generally, among the determinants of financial development are macro-economic stability, the quality of economic institutions (measures of law enforcement and institutional quality, as financial intermediation requires contracting) as well as corporate governance, creditor and investor protection; the existence of a diversified class of institutional investors such as pension funds; and last but not least a robust regulatory framework for bank supervision, as most dramatically shown in the crisis of 2008 and 2009.
Financial openness is also very important once a minimum level of quality in domestic institutions has been reached. In European catching up countries the market for government securities is usually well established, but the market for securities issued by firms and financial institutions is usually thin (Zoli 2007).
The EU has two main tools which influence financial development. Every EU member state operates within the single market which also includes financial markets*; and Euro Area member states are in addition affected by the Single Currency. Both significantly contribute to financial development. Catching-up countries such as Slovenia and Slovakia can expect to face fewer financial constraints to innovation over the coming years, as they integrate with Euro Area financial markets. In particular the expansion of the market for corporate bonds is set to improve financial development in Euro Area countries (Hartmann et al. 2003). Of course the crisis of 2008/9 shows the need for substantial improvement in financial sector regulation even in advanced countries.
As regards venture capital, financial development is a precondition for venture capital fund activity due to the required funds from institutional investors and due to the business model of venture capital funds which requires liquid exit markets on which to sell the company they invested in. Hence, EU tools to foster financial development indirectly are good for venture capital development as well (e.g. stock market integration). But then an additional set of framework conditions is necessary, e.g. taxation rules for private equity funds (which can be accompanied by fiscal incentives to financial investors such as capital gains tax exemption), enabling institutional investors such as pension funds to invest in venture capital funds etc. The latter seems to be a crucial issue at the moment as seen by the European Venture Capital Association – there are too few institutional investors in Europe with the right profile to invest in venture capital (EVCA 2010). Particularly "European" tasks in fostering the availability of venture capital are further efforts to
1. integrate European stock markets, 2. remove obstacles to cross-border investment by venture capital funds and
* A major recent initiative to improve financial market integration in Europe was the Financial Services Action Plan.
165
3. continue working on a single European patent at much cheaper cost, as patents work as quality signals for VC funds.
The European Commission is aware of these issues, referring to venture capital as a European innovation bottleneck (European Commission 2009a; see also the Small Business Act (European Commission 2008)) and is already pursuing policies to help overcome them to create a pan-European venture capital market (see, e.g. European Commission 2009b).
Venture capital fund activity relies on a considerable amount of specialised know-how which takes years to form. Networks, bridging mechanisms between individual and corporate investors as well as entrepreneurs can as a consequence speed up this process. In almost every country, however, public support was and is crucial to the creation of a successful venture capital industry. This leads us to the second set of policies aimed at alleviating financial constraints.
6.2.2.2 Direct and indirect monetary support to firms
We will first examine initiatives to provide equity finance and then initiatives which provide direct R&D funding.
At the national level, many public funds try to provide money at the early or seed stage of new ventures, while venture capital funds mostly come in at a later stage. While the role of public funds is acknowledged, the EVCA (EVCA 2010) warns against too much reliance on public funds as this is a structural weakness and leads to venture capital funds which are not competitive. A fund-of-funds strategy which the European Investment Fund (EIF), the risk financing arm of the EIB, is pursuing at the European level seems to be more apt at pairing public and private money efficiently.
The competitiveness and innovation programme of the European Union provides equity finance to SMEs using the European Investment Fund as a vehicle. The EIF also provides guarantees for SME financing. Many of these policies are linked with national-level institutions.
As regards direct project funding, Hyytinen and Toivanen (2005) show that government funding can be effective in mitigating financial constraints which hold back innovation and growth, in particular for firms active in sectors heavily dependent on external finance. Several policies at the EU level provide R&D funding, such as the framework programme, the new risk sharing finance facility of the Commission in cooperation with the EIB etc. (see Table 35). One policy approach – the Enterprise Europe Network (EEN) – works as a one-stop shop for SME advice. Inter alia it supports SMEs to gain access to finance, but also with regard to intellectual property rights, internationalisation, EU law and standards and technology transfer. This network mainly redirects SMEs to the other policies mentioned in Table 35. This instrument will be discussed more in depth later. It can be seen as one step towards integrating help for independent, small firms which pursue internationalisation and innovation activities at the same time and are hence particularly financially constrained.
166
Table 35: EU-level activities to lower financial constraints to innovation
Institution Policy Description
European Commission & Member States
EU2020 Guidelines for Member States' policies bearing on access to finance, venture capital etc.
European Commission/EIB-EIF (SME risk financing arm of EIB)
Competitiveness and Innovation Framework Programme
Equity finance for SMEs (GIF), SME guarantee facility (SMEG)
EC/EIB Risk Sharing Finance Facility (7. FP for Research)
Financing of risky research projects and infrastructures
European Commission SME techweb (7. FP for Research) SME-gateway to research framework programmes (e.g. eraSME for research acquiring SMEs)
European Commission Structural Funds / European Regional Development Fund ERDF
Inter alia, financing of research and innovation projects in less developed regions (e.g. JEREMIE initiative)
European Commission Enterprise Europe Network Working closely with national-level institutions, this network provides advice for SMEs on a range of issues not just access to finance, also internationalisation.
European Commission Financial Market Integration/Financial Services Action Plan
Fosters financial development via market integration
European Commission/European system of Central Banks
Euro Area Fosters financial development via increased market integration and common standards and rules.
Source: European Commission, compiled by WIFO.
Box 11: EU2020 guidelines on access to finance, venture capital and R&D funding
Guideline 4: Optimising support for R&D and innovation, strengthening the knowledge triangle and unleashing the potential of the digital economy
Member States' R&D and innovation policies should be set within an EU context in order to enhance opportunities for pooling public and private resources in areas with EU value added, exploiting synergies with EU funds, thus achieving sufficient scale and avoiding fragmentation. ... With a view to promoting private investment in research and innovation, Member States should improve framework conditions notably with regard to the business environment, competitive and open markets — combine fiscal incentives and other financial instruments with measures to facilitate access to private finance (including risk-capital).
Guideline 6: Improving the business and consumer environment and modernising the industrial base
Member States should continue to improve the business environment by ... supporting small and medium-sized enterprises (SMEs) in line with the 'Small Business Act for Europe' and the 'Think Small First' principle, ensuring stable and integrated financial services markets, facilitating access to finance, ..., supporting internationalisation of SMEs and promoting entrepreneurship.
In the EU2020 agenda two guidelines mention the overall topic of access to finance, venture capital and R&D funding (see Box 11).
6.2.2.3 Assessment
The EC communication on reviewing community innovation policy in a changing world (European Commission 2009a) cites several bottlenecks for the development of innovation in Europe, among them venture capital, education and IPR. However, direct funding of R&D and innovation projects is not among them, probably rightly so as a multitude of options at the EU, national and regional levels are available. The challenge here, as reflected in the EU2020 guidelines, is rather a more coherent and coordinated approach among the member states to reap synergies and reach critical mass.
However, what seems to be lacking so far in direct funding is an integrated perspective on innovation and internationalisation. Our empirical results indicate that pursuing both activities at the same time financially constrains firms. One way to remedy this could be explicitly acknowledging twin innovation and internationalisation activities in funding criteria, in particular for independent
167
SMEs. Especially in advanced countries close to the frontier, private financial markets can go a long way towards financing innovation. Direct funding needs to be very selective and focused to avoid any deadweight loss. Pursuing internationalisation could enter the selection criteria.
The European Commission is aware of the challenges involved in removing the bottleneck venture capital. It comes as a surprise then that its role in the EU2020 guidelines is not very prominent. Financial market integration in the framework of the European Single Market and Euro Area membership are powerful tools to enhance financial development, which provides considerable advantages to catching up countries which are EU members. There is not only a direct effect on growth via the many mechanisms developed financial systems bring with them but also a strong indirect effect which works via alleviating financial constraints to innovation. The benefits of this integrated market stop short however when it comes to venture capital, where national markets are still very fragmented. Many rules of importance to deeper national venture capital markets are in the remit of national authorities.
There is as a consequence room in the multilateral country surveillance exercise of the EU2020 process to put more focus on fostering venture capital in particular via the adaptation of national regulations impeding the activity of venture capital funds, among them restrictions on investment rules for institutional investors. Efforts at the EU level to make full use of EU-level powers within the Single Market should continue as well to overcome the fragmentation of national markets. Entrepreneurship and venture capital are emerging as global enterprises (Lerner 2009). This is why it is important to attract foreign venture capital funds and why the fragmentation of European venture capital markets is so costly and detrimental to entrepreneurial activity across Europe.
Evidence has shown that applying for patents matters for obtaining venture capital financing. Hence, creating a single European patent at lower fees would also alleviate financial constraints for highly innovative, young and small firms. Such reforms should be high on the agenda, as over the next year's public budgets for R&D and innovation support will be in short supply due to the consolidation in the wake of the crisis. Regulatory reforms for venture capital and a single European patent do not cost much but could substantially contribute to alleviating financial constraints. This set of reforms is particularly important for advanced countries, as firms there put increasing emphasis on innovation-based growth strategies which often require intellectual property protection and external financing. They could be put to Member States with renewed vigour pointing out their low to non-existent impact on public budgets, while their impact on growth could be considerable.
For catching-up countries, apart from R&D funding and financial support policies, the most effective tool against financial constraints is probably further financial market integration and Euro membership. This will enhance financial development. Of course, policy needs to make sure a new regulatory framework for banks after the crisis works.
6.2.3 Policies targeted at skill constraints The overall quality and quantity of human resources for innovation is a central driver of economic growth. Lack of such resources invariably leads to skill barriers to innovation at the firm level. The
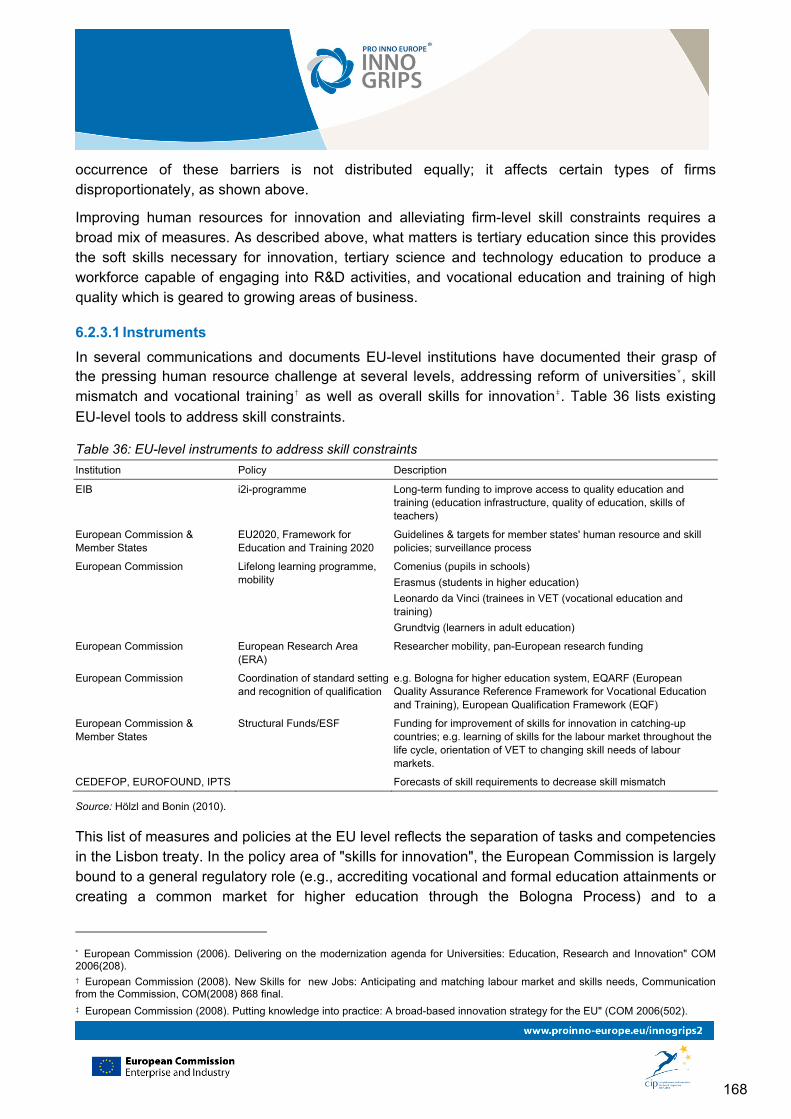
168
occurrence of these barriers is not distributed equally; it affects certain types of firms disproportionately, as shown above.
Improving human resources for innovation and alleviating firm-level skill constraints requires a broad mix of measures. As described above, what matters is tertiary education since this provides the soft skills necessary for innovation, tertiary science and technology education to produce a workforce capable of engaging into R&D activities, and vocational education and training of high quality which is geared to growing areas of business.
6.2.3.1 Instruments
In several communications and documents EU-level institutions have documented their grasp of the pressing human resource challenge at several levels, addressing reform of universities*, skill mismatch and vocational training† as well as overall skills for innovation‡. Table 36 lists existing
EU-level tools to address skill constraints.
Table 36: EU-level instruments to address skill constraints
Institution Policy Description
EIB i2i-programme Long-term funding to improve access to quality education and training (education infrastructure, quality of education, skills of teachers)
European Commission & Member States
EU2020, Framework for Education and Training 2020
Guidelines & targets for member states' human resource and skill policies; surveillance process
European Commission Lifelong learning programme, mobility
Comenius (pupils in schools)
Erasmus (students in higher education)
Leonardo da Vinci (trainees in VET (vocational education and training)
Grundtvig (learners in adult education)
European Commission European Research Area (ERA)
Researcher mobility, pan-European research funding
European Commission Coordination of standard setting and recognition of qualification
e.g. Bologna for higher education system, EQARF (European Quality Assurance Reference Framework for Vocational Education and Training), European Qualification Framework (EQF)
European Commission & Member States
Structural Funds/ESF Funding for improvement of skills for innovation in catching-up countries; e.g. learning of skills for the labour market throughout the life cycle, orientation of VET to changing skill needs of labour markets.
CEDEFOP, EUROFOUND, IPTS Forecasts of skill requirements to decrease skill mismatch
Source: Hölzl and Bonin (2010).
This list of measures and policies at the EU level reflects the separation of tasks and competencies in the Lisbon treaty. In the policy area of "skills for innovation", the European Commission is largely bound to a general regulatory role (e.g., accrediting vocational and formal education attainments or creating a common market for higher education through the Bologna Process) and to a
* European Commission (2006). Delivering on the modernization agenda for Universities: Education, Research and Innovation" COM 2006(208). † European Commission (2008). New Skills for new Jobs: Anticipating and matching labour market and skills needs, Communication from the Commission, COM(2008) 868 final. ‡ European Commission (2008). Putting knowledge into practice: A broad-based innovation strategy for the EU" (COM 2006(502).

169
coordinating role that focuses on mobilising Member States via the open method of coordination. The open method of coordination is the tool of the Lisbon and the EU2020 agendas, mainly working with exchange of best practice and soft peer pressure. The European Commission can issue non-binding recommendations if a Member State does not follow up on the Integrated Guidelines.
The two main documents concerning the open method of coordination are the updated strategic framework for European cooperation in education and training ("ET 2020", EC 2009) and the guidelines and objectives within the EU2020 agenda. The strategic framework sets strategic objectives and five benchmarks aimed at measuring the overall progress made at the European level.
The strategic objectives are:
the realisation of lifelong learning and learner mobility, the improvement of outcome quality and efficiency, the promotion of equity and active citizenship, and the enhancement of innovation and creativity, including entrepreneurship.
The five benchmarks are:
By 2020, an average of at least 15% of all adults should participate in lifelong learning. By 2020, the share of low-achieving 15-year-olds in reading, mathematics and science
should be less than 15 percent. By 2020, the share of early leavers from education and training should be less than 10%. By 2020, the share of 30-34 year olds with tertiary educational attainment should be at
least 40%. By 2020, at least 95% of the children between the age of four and the starting age for
compulsory primary education should participate in early childhood education.
Within the Flagship Initiative "Youth on the move" within the EU2020 agenda the aim is to "enhance the performance and international attractiveness of Europe's higher education institutions and raise the overall quality of all levels of education and training in the EU, combining both excellence and equity, by promoting student mobility and trainees' mobility, and improve the employment situation of young people. The Commission intends inter alia to work:
To integrate and enhance the EU's mobility, university and researchers' programmes (such as Erasmus, Erasmus Mundus, Tempus and Marie Curie) and link them up with national programmes and resources;
to step up the modernisation agenda of higher education (curricula, governance and financing) including by benchmarking university performance and educational outcomes in a global context.
6.2.3.2 Assessment
The box below shows the EU2020 guidelines concerning skills for innovation. They and the framework for education and training are very comprehensive and address many issues which

170
would lower the occurrence of skill constraints at the firm level. There are a number of issues which could be further developed in this regard:
The two main skill guidelines within EU2020 are actually part of the employment guidelines. This reflects the traditional association of education policies with employment objectives and policies. At the Member State level, this is even more pronounced – there is little integration between innovation, employment and education policies which may lead to skill constraints as R&D and innovation policies supporting innovative activities require appropriate human resources for innovation.
In some countries, e.g. Austria, the R&D target for 2010 was pursued vigorously and successfully, but without duly considering the consequences of a steeply rising R&D intensity for the supply of skills in the workforce – innovation and education policies are not properly integrated.
Countries featuring strong dual labour markets – e.g. a couple of Southern European countries – are more likely to be affected by skill constraints. Employment and innovation policies are not properly integrated, as the negative effect on skills for innovation is not fully considered.
In this regard, the current national strategy of Finland outlining education, science, technology and innovation policy appears to be the prime example for an integrated approach to skills for innovation among the EU Member States (Bonin and Hölzl 2010).
The fact that independent internationalised and innovative firms are more likely to report skill constraints is to the knowledge of the author not reflected in any European-level programmes. Partnering up with the national level, SMEs could e.g. receive help for employing highly qualified employees, both in terms of the recruitment process and in terms of subsidies, e.g. the social insurance fees for the first year could be paid. This is just a suggestion, elaborating ways to help small, independent firms which are innovative and internationalised at the same time merits a study on its own.
The one-stop shop network for SME advice, Enterprise Europe Network, does not provide coaching in terms of skills and human resources. Possible areas of activity could e.g. be skill planning and recruitment of highly qualified tertiary graduates, where SMEs are disadvantaged in comparison with the attractive opportunities large firms can offer in terms of training programmes etc. Fast-growing SMEs have particularly high recruitment needs relative to the size of their existing workforce, implying substantial administrative costs and time spent trying to find appropriate candidates. Internationalised and innovative firms could get special support.
Another problem area is the diversity of national approaches to vocational education and training. Only few European countries have established strict quality assurance systems or adopted measures to ensure that the content of vocational schemes is well aligned with the rest of the education system and labour market needs. Higher quality vocational education geared to labour market needs could become a clearer policy focus by establishing Europe-wide benchmarks on vocational education and training. This is planned by the European Commission. Our analysis on skill constraints being influenced by vocational training

171
underscores these efforts. In particular the Southern-European countries (country group 3) may profit from improved vocational skills which in turn could support the expansion of technological innovators, an underrepresented firm group in the Southern European countries. As a result, exports could rise and contribute to decreasing macro-economic imbalances within the euro area, a core objective of EU2020.
EU2020 could be even clearer on the point that especially for advanced countries, human resources for innovation are probably the most important policy priority for the next ten years. This implies that reforms of the education system, in particular of higher education, but also of Pre-school and secondary systems, should be among the core reform policies in the next ten years. This message can be conveyed in the process of the multilateral country surveillance.
Compared with the previous framework ("ET2010"), the goal for graduates in science and technology has been dropped. Given the importance of the supply of such graduates and the lack of other EU-level instruments to focus policy attention at the Member State level on the skills for innovation issue, this decision can be questioned.
Box 12: EU2020 guidelines relevant for skills for innovation
Guideline 4: Optimising support for R&D and innovation, strengthening the knowledge triangle and unleashing the potential of the digital economy (...) In line with guidelines 8 and 9, Member States should equip people with a broad range of skills needed for innovation in all its forms, and should ensure a sufficient supply of science, mathematics and engineering graduates. School curricula should strive to support creativity, innovation, and entrepreneurship.
Guideline 8: Developing a skilled workforce responding to labour market needs promoting job quality and lifelong learning. Member States should promote productivity and employability through an adequate supply of knowledge and skills to match current and future demand in the labour market. Quality initial education and attractive vocational training must be complemented with effective incentives for lifelong learning, second-chance opportunities, ensuring every adult the chance to move one step up in their qualification, and by targeted migration and integration policies. Member States should develop systems for recognising acquired competencies, remove barriers to occupational and geographical mobility of workers, promote the acquisition of transversal competences and creativity, and focus their efforts particularly on supporting those with low skills and increasing the employability of older workers, while at the same time enhance the training, skills and experience of highly skilled workers, including researchers. In cooperation with social partners and business, Member States should improve access to training, strengthen education and career guidance combined with systematic information on new job openings and opportunities, promotion of entrepreneurship and enhanced anticipation of skill needs. Investment in human resource development, up-skilling and participation in lifelong learning schemes should be promoted through joint financial contributions from governments, individuals and employers. To support young people and in particular those not in employment, education or training, Member States in cooperation with the social partners, should enact schemes to help recent graduates find initial employment or further education and training opportunities, including apprenticeships, and intervene rapidly when young people become unemployed. Regular monitoring of the performance of up-skilling and anticipation policies should help identify areas for improvement and increase the responsiveness of education and training systems to labour market needs. EU funds should be fully mobilised by Member States to support these objectives.
Guideline 9: Improving the performance of education and training systems at all levels and increasing participation in tertiary education In order to ensure access to quality education and training for all and to improve educational outcomes, Member States should invest efficiently in education and training systems notably to raise the skill level of the EU's workforce, allowing it to meet the rapidly changing needs of modern labour markets. Action should cover all sectors (from early childhood education and schools through to higher education, vocational education and training, as well as adult training) taking also into account learning in informal and non-formal contexts. Reforms should aim to ensure the acquisition of the key competencies that every individual needs for success in a knowledge-based economy, notably in terms of employability, further learning, or ICT skills. Steps should be taken to ensure learning mobility of young people and teachers becomes the norm. Member States should improve the openness and relevance of education and training systems, particularly by implementing national qualification frameworks enabling flexible learning pathways and by developing partnerships between the worlds of education/training and work. The teaching profession should be made more attractive. Higher education should become more open to non-traditional learners and participation in tertiary or equivalent education should be increased. With a view to reducing the number of young people not in employment, education, or training, Member States should take all necessary steps to prevent early school leaving.
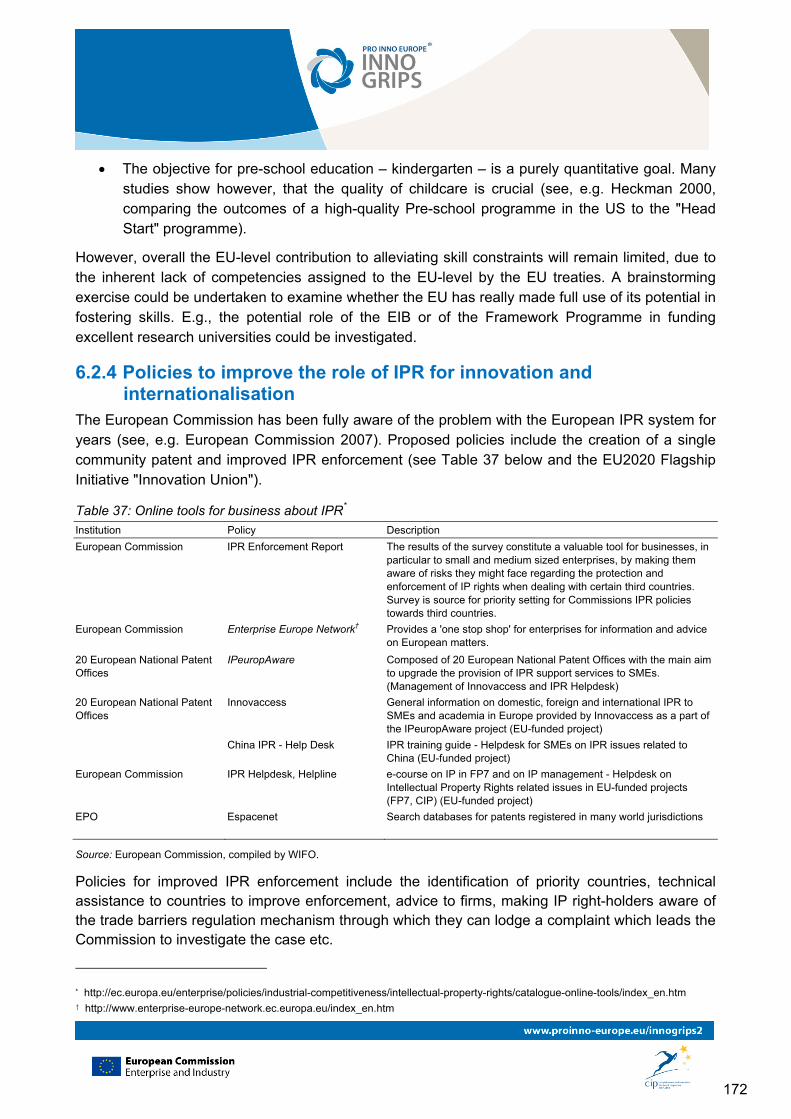
172
The objective for pre-school education – kindergarten – is a purely quantitative goal. Many studies show however, that the quality of childcare is crucial (see, e.g. Heckman 2000, comparing the outcomes of a high-quality Pre-school programme in the US to the "Head Start" programme).
However, overall the EU-level contribution to alleviating skill constraints will remain limited, due to the inherent lack of competencies assigned to the EU-level by the EU treaties. A brainstorming exercise could be undertaken to examine whether the EU has really made full use of its potential in fostering skills. E.g., the potential role of the EIB or of the Framework Programme in funding excellent research universities could be investigated.
6.2.4 Policies to improve the role of IPR for innovation and internationalisation
The European Commission has been fully aware of the problem with the European IPR system for years (see, e.g. European Commission 2007). Proposed policies include the creation of a single community patent and improved IPR enforcement (see Table 37 below and the EU2020 Flagship Initiative "Innovation Union").
Table 37: Online tools for business about IPR* Institution Policy Description
European Commission IPR Enforcement Report The results of the survey constitute a valuable tool for businesses, in particular to small and medium sized enterprises, by making them aware of risks they might face regarding the protection and enforcement of IP rights when dealing with certain third countries. Survey is source for priority setting for Commissions IPR policies towards third countries.
European Commission Enterprise Europe Network†
Provides a 'one stop shop' for enterprises for information and advice on European matters.
20 European National Patent Offices
IPeuropAware
Composed of 20 European National Patent Offices with the main aim to upgrade the provision of IPR support services to SMEs. (Management of Innovaccess and IPR Helpdesk)
20 European National Patent Offices
Innovaccess General information on domestic, foreign and international IPR to SMEs and academia in Europe provided by Innovaccess as a part of the IPeuropAware project (EU-funded project)
China IPR - Help Desk IPR training guide - Helpdesk for SMEs on IPR issues related to China (EU-funded project)
European Commission IPR Helpdesk, Helpline e-course on IP in FP7 and on IP management - Helpdesk on Intellectual Property Rights related issues in EU-funded projects (FP7, CIP) (EU-funded project)
EPO Espacenet
Search databases for patents registered in many world jurisdictions
Source: European Commission, compiled by WIFO.
Policies for improved IPR enforcement include the identification of priority countries, technical assistance to countries to improve enforcement, advice to firms, making IP right-holders aware of the trade barriers regulation mechanism through which they can lodge a complaint which leads the Commission to investigate the case etc.
* http://ec.europa.eu/enterprise/policies/industrial-competitiveness/intellectual-property-rights/catalogue-online-tools/index_en.htm † http://www.enterprise-europe-network.ec.europa.eu/index_en.htm

173
Within the EU2020 Flagship Initiative "Innovation Union" the European Commission aims at improving framework conditions for businesses to innovate. In particular it urges member states to move quickly to create the single EU Patent and a specialised Patent Court, modernise the framework of copyright and trademarks, improve access of SMEs to Intellectual Property Protection and so forth. From all measures listed in the "Innovation Union" the measures and commitments listed with respect to IPRs are the ones to which the document gives highest priority. Given our review of the relevant findings this pressure is justified.
6.2.4.1 Suggestions for reform
According to a survey among firms (IPR Expert Group 2007) SMEs were in favour of additional government assistance especially in the form of:
support in applying for IPRs; reduction of costs or financial support in meeting them; simplification and shortening of procedures; provision of information and services; better access to patent databases.
Pottelsberghe (2009) proposes a number of solutions to improve the current situation and to strengthen the European system. Harmonisation is the key word, which comes along with reduction in translation requirements, reduction of the complexity and reduction of costs, which could be reached due to the long discussed Community patent.
A single Community patent
This "one-stop-shop" would simplify the filing and granting process in the EU with a single renewal fee schedule and a centralised litigation system. Parallel litigation would be avoided followed by high costs and uncertainty generated by differing litigation outcomes. Besides the drastic reduction of the cost-factor for applicants the EPO as well as the NPOs would generate more income (Pottelsberghe and Danguy 2009). It is important to choose the right fee policy in order to set the incentives right. Up-to-grant fees could be higher in Europe than in the US to justify a minimum degree of quality in the examination process and to reach a certain self-selection of applicants. However an increase of fees or costs should be avoided as it would stimulate firms to adopt filing strategies aiming at delaying the grant date. The Community Patent could be complemented by a special status for SMEs at the EPO, as at the USPTO and the JPO. This could include reduced application fees for SMEs. The IPR expert group (IPR Expert Group 2007) also makes many suggestions for removing barriers to IPR use by SMEs. Their results on supporting IPR use by SMEs call for identifying:
which policy instruments at the national and European level are most effective; how support and advice is best delivered; best modes of collaboration, and division of labour between Member States, the European
Union and Commission, and the European Patent Organisation; issues that have to be dealt with elsewhere such as litigation insurance, technology transfer
and licensing, and changes to the tax regimes.
174
A further support for SMEs innovation activities would be a collaborative patent framework at the global level that may save cost and time. There are several ways to achieve this. The Patent Prosecution Highway (PPH) launched in 2008 is a bilateral agreement to speed-up examination and reduce backlogs, but may reduce global patent quality. Hence, projects like PPH with its "fast-track" component should be avoided as they focus on the output of patents instead of input and the quality of the examination process.
Instead, a global patent standard (GPS) should be created to address three areas: free access to key information (transparency), convergence of work procedures and of human resource practices at the patent offices (Pottelsberghe 2009). Improved transparency concerning granting or pending of patents would re-install confidence in the system, especially for SMEs, universities and independent inventors and may reduce pendency and hence backlogs. Structural, global convergence of work procedures should tackle indicators that influence the speed and outcome of examinations as, for instance, the identification of ownership of the invention, the used methodology to assess the inventive step, the allowed time to reply to a communication or the possibility to split a patent. These factors are necessary for an effective mutual recognition of the work performed by three offices (USPTO, JPO and EPO).
Convergence of human resource practices, such as setting incentives to keep experienced examiners as well as trainings and education, could improve patent quality. Individual examiners, which are essential to the examination process, should get more attention as they contribute to the quality of the system.
Reform suggestions for software protection*
Contrary to patents, where in case of software related inventions the exclusive right to apply the idea is protected, copyrights protect the original expression, the originally coded program. This is the exclusive option to protect software in Europe as computer related inventions are patentable only if they produce a technical effect. (However, Hall (2009) found a number of such patents in the European patent system.) The fact that software and business methods are patentable in the US system does not mean that the European system should follow it in order to harmonise the patent system globally (Bakels and Hugenholtz 2002). In contrary, several scholars, including Dreyfuss (2001), Bessen and Meurer (2008) or Bakels and Hugenholtz (2002), recommend a reinstatement of the business method exception in the United States, because the quality of patents, especially in the software and business method area, is too low as a result of an increasing granting rate.
Because of the sequential nature of software innovation, where an invention follows up on previous ones, patenting may slow down innovation as "when innovation is sequential and complementary, standard reasoning about patents and imitation may get turned on its head. Imitation becomes a spur to innovation, while strong patents become an impediment" (Bessen and Maskin 2002, p.4). Because patents impede access to knowledge and therewith slow down the technological process,
* One of the questions for this chapter was "What policy adaptations would be necessary to foster further business development in the online environment?"
175
software firms are better off if they are imitated in order to benefit from the competitors' innovation at later stages. Even if initial rents are lower in the absence of patents, benefits may outweigh the current loss when the firm is allowed to build further products around the innovation made by the competitor that used her innovation before (Bessen and Maskin 2002).
Due to the special nature of software several proposals have been made for the implementation of a sui generis right, i.e. a special form of IPR for software, as an alternative to patent protection (Tauchert 1998, 1999). Bakels and Hugenholtz (2002) recommend shorter protection terms for patents on computer program related inventions because development cycles are shorter in this industry.
Concluding, future efforts should focus on the definition of (non-) patentable software in Europe in order to define a flexible property right system. Instead of implementing software patents, the possibility of strengthening the copyright system or subsidizing the established Open Source Software should be kept in mind.
6.2.4.2 Assessment
Our analysis of the European IPR system as a barrier to innovation for SMEs does not produce any major new insights. There are many quite well formulated policy suggestions which if realised would considerably facilitate access to IPR by SMEs, enhancing incentives to innovate and alleviating financial constraints to innovation which in turn could substantially boost SMEs internationalisation activities.
However, our analysis makes the case for reform with renewed urgency for two reasons. First, there is a double dividend to be had by reforming the IPR system – it will increase incentives to innovate and make planned innovations possible due to easier external venture capital financing (which concerns a small, but fast growing group of firms). Both will lead to improved export performance which is particularly important for Southern European countries and the macro-economic balance of the Euro Area.
Second, IPR reforms are a "cheap" way to spur growth in times of budgetary consolidation. Framing the IPR issue as ultimately influencing macro-economic imbalances, export and growth performance in times of consolidation may win increased political impetus for reform. Given the uncertain macro-economic outlook and the budgetary consolidation strategies of Member States, any low hanging fruit, i.e. growth reforms which do not require a substantial amount of public funds, should be reaped first.
The fact that the US and Japan provide their SMEs with a far better IPR system should also concern policy makers. Some improvement could come from a review of national support schemes which would lead to increased best practice sharing, e.g. within the EU2020 multilateral country surveillance procedure.
6.2.5 Policies targeted at standardisation Given the evidence provided in the literature survey, it is not surprising that the European Commission and the Council of the European Union have identified standardisation as a key
176
instrument in order to foster innovation (COM (2008)133 final). In addition Standardisation is supported at the European level, as European standards are an essential ingredient for the Single Market. Standards are also a central ingredient of regulation. In some areas, the reliance on voluntary standards should help to remove regulatory barriers to innovation.
Standardisation can also be used for strategic trade policy to promote the competitiveness of domestic producers, especially in the trade of new products. DIN (2000) emphasises that national companies participate in national standardisation process because they want these standards to have an influence on European and international standards. New standards are necessary to accompany the emergence of new markets. This implies that a strong role in international standardisation is also a means of capitalising on European leadership in new markets and gaining first-mover advantages in global markets.
European stakeholders intervene in standardisation both formally and informally. Formal standardisation is organised by a three-level structure including national standards bodies (NSBs), the three European Standards Organisations (CEN, CENELEC, ETSI) and international organisations. Industry engages in informal standardisation initiatives in numerous forums and consortia, with different characteristic regarding longevity, sectoral coverage and territorial scope.
6.2.5.1 Regulatory initiatives
With regard to innovation and technology policy the Commission especially emphasised the use of standards to support specific priority actions (COM(2008)133 final):
The Commission aims at developing standards to support the eco-design of Energy-using Products, the measurement of greenhouse gas emission and the introduction of renewable energies in order to foster Sustainable industrial policy at the European level.
The Commission aims to support the development of standards to support lead markets in different promising areas.
The Commission anticipates that the use of standards can help in order to foster innovative public procurement.
In the area of ICT integration the Commission seeks a revision of ICT standardisation policy in order to foster innovation and the adoption of societal application of ICT.
As the literature shows there is an interaction between (open) standardisation and innovation. This requires that the development of standards is market-driven, but also that standard bodies need to collaborate with industry in order to create appropriate standards at the relevant level. Thus the Commission invited the European Standard Organisations to develop less formal standardisation deliverables when appropriate for industry and user needs. Public funded research could be an important element to foster early standardisation. The Commission also invited European Standard Organisations to create technology watch activities with a focus to facilitate the transfer of EU-funded research into standardisation activities.
6.2.5.2 Standards and SMEs
For the purpose of the present report the participation of SMEs in the standardisation process is of great relevance. Policy making at the EU level takes this into account. The pilot project
177
"Euromanagement: standardisation, certification, quality, hygiene and safety in the workplace" performed in 1994 looked at the problems encountered by SMEs with respect to European standardisation. The results indicate that
1. SMEs hold a lack of knowledge of Single Market principles, 2. SMEs have difficulties in accessing relevant information, 3. SMEs have problems to understand and to apply EU directives and norms, and that 4. there are shortages in the participation of SMEs in European standardisation work.
In 1998 the Report "Efficiency and accountability in European standardisation under the new approach" was published where specific reference was made to the issue to bring standardisation to the attention of market participants, in particular SMEs. In 2008 the European Commission published the Communication "Towards an increased contribution from standardisation to innovation in Europe" (COM (2008) 133 final) where they emphasise to substantially increase its financial support to European coordination of SME representation in standardisation. Within the Small Business Act from 2008 the Commission will introduce provisions to consolidate the commitment of the Member States to include SMEs in standardisation at national level. The national level is the most important context for most SMEs. In the Small Business Act the "think small first" principle is given much space. With regard to standardisation processes member states were invited to revise standardisation with the goal to improve the transparency of standardisation activities as well as the cost-benefit balance of participation for SMEs and users. The commission announced that EU financial support to promote SMEs' participation and defence of their interests in standardisation and to improve SMEs' information on, and use of, European standards is increased substantially (to €1 million in 2008 and € 2.1 million from 2009). In addition the Commission invited member states to
Encourage National Standards Bodies to reconsider their business model in order to reduce the cost of access to standards (especially for SMEs), and
to invite National Standards Bodies, together with European Standards Organisations, to carry out promotion and information campaigns to encourage SMEs to make better use of standards and provide feedback on their content.
In order to foster the use of European standards by SMEs the Commission invited standard organisations to publish abstracts of standards without access restrictions.
The same issues are taken up in the Communication "Towards an increased contribution from standardisation to innovation in Europe".
6.2.5.3 An assessment
Standardisation is important and standardisation and regulation have recently gained remarkable importance for innovation policy at the EU level. The importance of standards and regulation for the Single Market mirrors this development. Standards and regulation play an important role for ambitious innovation policy projects by the European Commission (e.g. lead market initiative, innovation-supporting public procurement). The support of standardisation and the support of SMEs in the standardisation process go into the right direction.
178
However, it needs to be recognized that the use of standards and regulations for innovation policy purposes has also limits. The use of standardisation as policy tool leads to the establishment of a number of committee standards and a mimicking of regulation. Committee standards are sometimes used for regulation or de-facto regulation. The evidence presented in the chapter on regulation has clearly shown that regulation is only under specific instances a driver of innovation.
With regard to standards it needs to be taken into account that the life of standards is limited and they need to undergo maintenance. The average lifetime of a standard varies significantly across fields of standardisation. In telecommunications the average service life of a standard is around 5 years. Thus standardisation is an ongoing process that does not end with the first establishment of a standard. Here standards need to be responsive to market forces.
Overall the evidence presented in this study suggests that while standards and regulations are important, they have also limits. The use of these instruments needs to be assessed on a case by case basis, and their costs and benefits can only be assessed by a market by market basis.
6.2.6 Policies targeted at barriers to internationalisation As was shown in the previous chapters, various internal as well as external factors act as barriers to internationalisation for European companies. The analysis of the support mechanisms focuses mainly on external barriers since many of the relevant internal barriers have been either addressed in previous chapters (e.g. 5.1.3) or are of structural nature and difficult to change by mere legislation (e.g. the size of the firm). Regarding the external barriers it was shown that tarriff barriers still matter the higher the innovative level of a sector is. However, as suggested by the literature and confirmed by EU communications, non-Tariff Barriers play a constantly more important role in international trade. We found that complaints concerning non-tariff trade barriers mostly apply to countries with very high export shares from many of the European countries. Therefore, this chapter deals with question whether the institutional support mechanisms of the EU are appropriate to overcome these barriers and to further strengthen the internationalisation of European SMEs.
Another dimension concerns the European market since also some EU countries and EU neighbouring countries pose high documentation requirements on imports. This shows that Single Market policies have largely succeeded in removing EU internal trade barriers but that there still are various Intra-European barriers (see also the current Monti Report of 2010). Given the large trade volume EU firms have on the internal market, still existing barriers have a much larger impact than barriers in countries outside the EU. The high buyer sophistication and intense internal competition act as barriers for firms because they need to have enough innovative capacity in order to meet consumer needs in European (lead) markets. This barrier becomes more relevant with increasing technological level of the sector a firm operates in.
A broad mix of policy instruments is required to remove the barriers to internationalisation. It was mentioned above that NTBs such as burdensome customs procedures as well as discriminatory tax rules and practices, technical regulations, standards and conformity assessment procedures or SPS measures in foreign countries are becoming more important than the traditional policy-based
179
trade constraints such as import tariffs and duties. In order to remove these behind the border regulations the Commission considers a mix of the following instruments.
Table 38: European policies and tools to remove trade barriers
Institution Policy Description
European Commission Global Europe framework (COM/2006/0567)
Removing concrete barriers that EU businesses face in third country markets. The strategy is based on public consultation to develop a more intense cooperation between the Commission and the member states.
European Commission Negotiations of trade agreements Negotiations within the WTO System, but also bilateral FTAs. NTBs are more easily negotiated on a bilateral level. GATS to address barriers to trade in services.*
European Commission & Member States
Bilateral dialogues and Trade Missions Provide a forum to address trade barriers and regulatory issues without negotiating on a ministerial level right away (trade diplomacy)
WTO Formal instruments (WTO Technical Barriers to Trade agreement and WTO SPS agreement)
The EU actively uses WTO dispute settlement instruments to reduce the market access barriers for EU companies.
European Commission Mutual Recognition Agreements Recognition of EU rules regarding technical regulations and standards for industrial products.
European Commission, Member States, Businesses
The Market Access Partnership Pool the resources and expertise to detect, analyse and remove trade barriers. The main instrument is the Market Access Advisory Committee (MAAC). Installation of Market Access Teams
European Commission & Member States
Small Business Act Universalisation of the "Think small first"-principle.
European Commission & Member States
Enterprise Europe Network Network of some 570 contact points in 45 countries. Support for target-oriented match-making
European Commission EUROSTARS Market-driven, project based funding scheme specifically for SMEs
Source: European Commission, compiled by WIFO.
6.2.6.1 The Market Access Partnership (MAP)
The MAP deserves some credit at this point since it constitutes a joint effort by the Commission, the memeber states annd European businesses to achieve the goals of a better international market access of European firm, the EU's initial Market Access Strategy of 1996 was rejuvenated and the Market Access Partnership (MAP) was launched in 2007 (EU 2007). The central goal of the MAP was to consult with European businesses on the ground as local expertise makes trade barriers easier to identify and to address. Another important element of the MAP was the implementation of the Market Access Database (MADB) that provides an online record of barriers under examination in EU trading partners. The key elements include:
The implementation of the Market Access Database (MADB) to provide online record of barriers
* The GATS does not captures all barriers which are in place, but concentrates on the 6 types of restrictions listed under the Agreement that are in principle prohibited. (1) the number of service suppliers allowed, (2) the value of transactions or assets, (3) the total quantity of service output, (4) the number of persons that may be employed, (5) the type of legal entity through which a service supplier is permitted to supply a service, and (6) participation of foreign capital (Wolfmayr 2008).
180
Setting up of EU Market Access Teams outside the EU to identify and tackling trade barriers
Implementation of working groups on EU level to examine particular problems, sectors and issues
Focus on the enforcement of global and bilateral trade rules (through WTO dispute settlement, bilateral dispute settlement arrangements and Europe's trade barrier regulation)
The MADB has a central function within the Market Access Strategy.* It is an open method to keep a public record of obstacles to trade and to provide information and practical operational measures. The potential trade barriers are analysed by the Market Access Unit of DG Trade which also defines appropriate actions. The MADB holds valuable information for interested exporters in form of the Exporter's Guide to Import Formalities which contains information on import procedures and the Applied Tariffs Database which allows obtaining the customs duty and internal taxes that apply to a particular good in a foreign market. The MADB thus aims at reducing the information deficits of European companies.
6.2.6.2 Special assistance to SMEs
In general, the support for SMEs is in the hands of the member states and there are countless different national support schemes across Europe. The main strategy for strengthening the sustainable growth and competitiveness of SMEs from part of the EU is the so-called "Small Business Act" (SBA) for Europe (2008) in which the Commission lays out the principles for creating a more favourable environment for SMEs, including encouraging and supporting SMEs to benefit from growth of markets outside the EU (COM(2008) 394 final). The SBA consists of 10 proposals for future actions to actively support European SMEs. Taken together they constitute a normative guideline to raise awareness among Member states to design legislation guided by the so called "Think Small First" principle. The governance of the SBA remains weak as Member states are "invited" to follow the proposed guidelines. Among other things the SBA contains relevant aspects for the internationalisation activities such as to facilitate access to finance and to encourage and support SMEs to benefit from the growth of international markets.
Apart from the SBA, the EU also runs the Enterprise Europe Network (EEN) and the EUROSTARS program (under the EUREKA scheme), an approach to support international cooperation specifically regarding high-tech SMEs.
The EEN was founded within CIP in 2008 and has set up a network of some 570 business support organisations (contact points) in 45 countries. The mission of the EEN is clearly focussed on the internationalisation of SMEs. It offers support in finding international partners by maintaining a business cooperation database that allows for target-oriented match-making. Additionally the EEN offers support in questions regarding technology transfer, access to finance, research funding and even intellectual property and patents. Therefore, the EEN is close to a one-stop-shop for SMEs that whish to internationalise their business activities.
* In the Report on the Implementation of the MAS of 2009 it is mentioned that 173 barriers were identified in 24 countries (European Commission 2009). In this regard most commonly tariff increases and non-tariff border restrictions were resolved while it is generally difficult to evaluate the impact of 'behind-border-barriers'.
181
SMEs are positively influenced particularly by research cooperation contacts in and outside the EU. Also the positive effect of skilled employees is stronger than for the overall sample. There are various programmes that focus especially on SMEs. One example is the EUROSTARS-programme that was also launched in 2008 and joins 32 countries through the EUREKA network of national offices. EUROSTARS is a project based funding scheme that is specifically designed for SMEs. The project must be market driven and aimed at the development of a new product, process or service. It requires two participants from two different participating countries with a research-performing SME being the main participant (at least 50% of the project's core activity should be carried out by SMEs). It is too soon to give an evidence-based appraisal of either the EEN or the EUROSTARS schemes.
It was outlined in the empirical chapter that financial resources can act as a barrier to internationalisation of firms. This aspect that holds true for innovation as well as for internationalisation activities is adressed by the direct and indirect funding schemes outlined in chapter 5.1.2.2. While these transfers are mainly distributed in order to increase the firms innovative capacities, they have an indirect effect on the international competitiveness and therefore contribute also to internationalisation. There are, however, no special funds dedicated only for building up international activities (costs for accessing foreign networks, etc.).
6.2.6.3 Assessment
The EU has a large portfolio of policy instruments that are relevant for removing certain barriers. Internationalisation in terms of exporting is supported by the EU through its trade policy that focuses mainly on the removal of external barriers. The EU actions mainly take place on the strategic level such as the Doha negotiations or the negotiation of FTAs and have a clear focus on the opening of markets for European firms (see also Global Europe Strategy). Since informal NTBs are becoming increasingly relevant for slowing down international trade, these issues are being discussed in multi- and bilateral forums as well. Therefore, in terms of opening up foreign markets the EU foreign trade instruments seem appropriate.
The empirical analysis found that research cooperation contacts in and outside the EU are very important for exporting. The EU efforts to construct a European Research Area (ERA) seem to be leading in the right direction. However, especially micro and small companies find it difficult to apply in FP7 programs due to the extensive paperwork involved. With regard to Intra-EU barriers such as buyer sophistication there are only a few mechanisms in place such as the EUROSTARS programme or the SBA. Since these barriers become more relevant as trade in Europe increases, instruments that raise the competitiveness of SMEs of emerging economies may be considered in order for them to benifit from Intra-European opportunities.
In respect of the internal barriers to internationalisation faced by European firms as treated in chapter 4.1 the EU support is less pronounced. There are several support mechanisms for SMEs in general but there is no (financial) support for internationalisation activities. Especially for functional and marketing barriers there is no support. The MADB aims at reducing the internal informational barriers, but since this instrument is rather young it is too early to say whether it was successful in getting more business to internationalise. However, it can be concluded that most
182
measures undertaken to resolve these barriers focused on individual products and were not applied in a horizontal manner. The MADB also does not give information about business opportunities or analysis of foreign markets. This shortcoming might be overcome with the proposed setting up of European trade offices in important markets.
There is hardly any program which connects internationalisation and innovation. Often there is financial assistance for start-up activities. Programs focusing on SME support regarding international product development or technological development subsidies for example are non-existent.
It was shown in the empirical analysis that language competence plays an important role for internationalisation and continue to act as important barriers to trade in various regions. Especially language competencies in the home countries of (potential) exporters act as significant barriers. The EU advocates multilingualism and within the EU system DG Education and Culture offers a large variety of programs to stimulate multilingualism and intercultural exchange. The main activities take place within the inner-European mobility schemes ERASMUS, LEONARDO and COMENIUS. While these are appropriate measures in terms of European integration they do include entrepreneurial issues and do not help to reduce the perceived barriers to internationalisation. However, the EU should consider demanding more efforts from the Member States in terms of language proficiency. Especially language and cultural training regarding countries outside the EU is apparently very rare.
It must also be acknowledged that there are several barriers that take either a very long effort to change or might even not change at all. Especially those external barriers that we labled "stable" such as economic barriers (per capita income, volatility of inflation) or foreign market barriers (size of export market) are beyond the scope of European legislation. This is even more so in the case of political-institutional barriers such as political stability and the rule of law. The development of foreign markets is a long-term goal that ultimately concers European diplomacy or development policy.
We were able to show in the empirical analysis in Chap 4.3, that the barriers to internationalisation vary considerably regarding the sector of a firm and the position towards the technological frontier of the country where it is located. Consequently, the needs and rationales for public support vary across member states. However, the support of the EU has not yet come up with a differentiated sector and country oriented approach that addresses the individual needs of firms.
6.3 Spotlight on the support of internationalisation and innovation in some member states
6.3.1 Introduction In the previous chapters it became evident that the EU level has several policy tools for the support of innovation on the one side and for the support of internationalisation of EU companies on the other. However, it seems that there are hardly any approaches that merge these activities. While the EU support regarding internationalisation is roughly devoted to create favourable framework conditions (opening up foreign markets) the support from the individual member states involves
183
much more direct forms of political intervention, e.g. direct monetary support. However, this report clearly shows the mutual influence and importance of internationalisation and innovation and illustrates that these two go hand in hand. Even though we have to leave a more ample and systematic study to further research it is possible to give a short overview of what is being done on the country level to promote SME exports. The following chapter reviews the efforts of internationalisation support on the member state level of five countries and gives an assessment if there are indications of the inclusion of innovation. It was beyond the scope of this project to conduct a systematic EU-wide analysis of national export promotion programs on the one hand and innovation support on the other and to assess their interactions. Therefore this chapter should be seen as a tentative overview on how internationalisation support of some member states considers innovation aspects and to start a debate on policy learning at all levels.
There are many instruments available for a country to support its exporting companies. These include the provision of information about developments in foreign markets, assistance in finding partners or contacting agents, financial assistance such as trade credits or insurance services (such as the German Hermes-loans), or special incentives such as cost-sharing programs. This chapter provides information from three European countries (Germany Finland, and the United Kingdom) and compares their efforts for export promotion and improved international competitiveness. These countries were chosen because of its different approaches, their export intensity and geographical distribution. The information is mainly taken from homepage information from relevant agencies, important country strategy reports as well as comparable EU publications (INNO-Policy Trend Charts and SBA Fact Sheets). It is telling that neither the Trend Charts nor the SBA fact sheets consider internationalisation and innovation at the same time in a systematic manner. This might, however, be an undertaking for future research.Table 39 presents some initial key figures for the five countries at stake. Note that they show considerable differences in terms of export performance, intra and extra EU trade as well as gross domestic expenditures on R&D (GERD).
There are several studies that find strong evidence for the positive impacts of public trade promotion programs. The impact of overseas trade missions in the UK for example has been evaluated by Spence (2003), who states that this instrument has contributed positively to the generation of international sales (similar Pfeifer et al. 1998). In a review of 47 international High-Growth SME Support Initiatives Autio et al. (2007) suggest "[…] that a balanced policy effort to raise the level of high-growth entrepreneurial activity would have to cross policy departments and be coordinated at a high level. High-growth entrepreneurial activity therefore presents quite unique challenges for policy-makers" (ibid. 71). Especially the important role of internationalisation for high-growth SMEs is apparently often neglected. The following Figure gives an overview about the different categories for high-growth business support and the specific role of internationalisation support for each category.
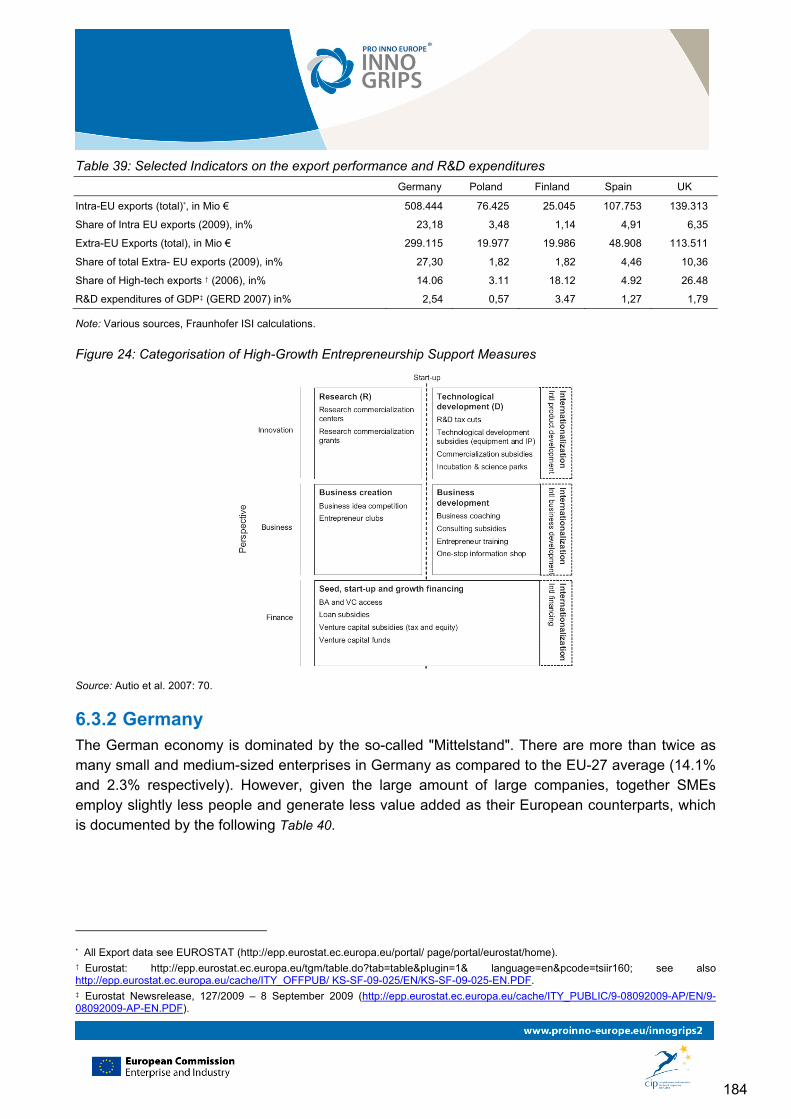
184
Table 39: Selected Indicators on the export performance and R&D expenditures
Germany Poland Finland Spain UK
Intra-EU exports (total)*, in Mio € 508.444 76.425 25.045 107.753 139.313
Share of Intra EU exports (2009), in% 23,18 3,48 1,14 4,91 6,35
Extra-EU Exports (total), in Mio € 299.115 19.977 19.986 48.908 113.511
Share of total Extra- EU exports (2009), in% 27,30 1,82 1,82 4,46 10,36
Share of High-tech exports † (2006), in% 14.06 3.11 18.12 4.92 26.48
R&D expenditures of GDP‡ (GERD 2007) in% 2,54 0,57 3.47 1,27 1,79
Note: Various sources, Fraunhofer ISI calculations.
Figure 24: Categorisation of High-Growth Entrepreneurship Support Measures
Source: Autio et al. 2007: 70.
6.3.2 Germany The German economy is dominated by the so-called "Mittelstand". There are more than twice as many small and medium-sized enterprises in Germany as compared to the EU-27 average (14.1% and 2.3% respectively). However, given the large amount of large companies, together SMEs employ slightly less people and generate less value added as their European counterparts, which is documented by the following Table 40.
* All Export data see EUROSTAT (http://epp.eurostat.ec.europa.eu/portal/ page/portal/eurostat/home). † Eurostat: http://epp.eurostat.ec.europa.eu/tgm/table.do?tab=table&plugin=1& language=en&pcode=tsiir160; see also http://epp.eurostat.ec.europa.eu/cache/ITY_OFFPUB/ KS-SF-09-025/EN/KS-SF-09-025-EN.PDF. ‡ Eurostat Newsrelease, 127/2009 – 8 September 2009 (http://epp.eurostat.ec.europa.eu/cache/ITY_PUBLIC/9-08092009-AP/EN/9-08092009-AP-EN.PDF).
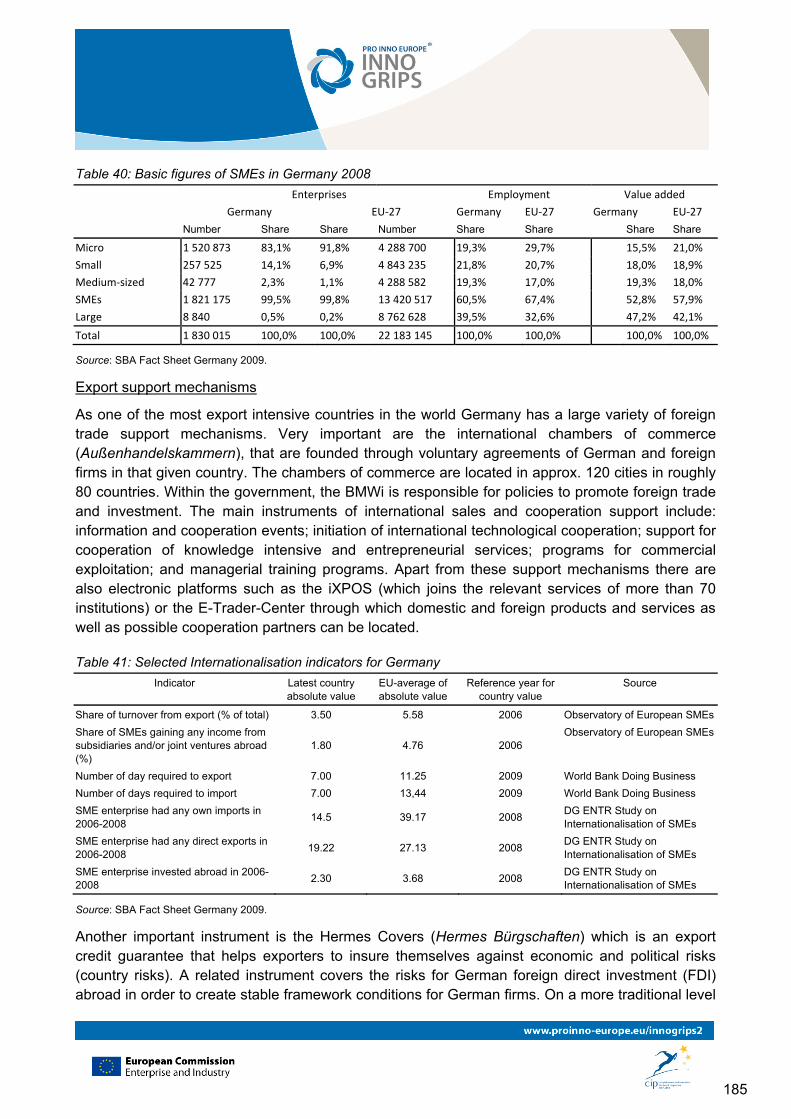
185
Table 40: Basic figures of SMEs in Germany 2008
Enterprises Employment Value added
Germany EU-27 Germany EU-27 Germany EU-27
Number Share Share Number Share Share Share Share
Micro 1 520 873 83,1% 91,8% 4 288 700 19,3% 29,7% 15,5% 21,0%
Small 257 525 14,1% 6,9% 4 843 235 21,8% 20,7% 18,0% 18,9%
Medium-sized 42 777 2,3% 1,1% 4 288 582 19,3% 17,0% 19,3% 18,0%
SMEs 1 821 175 99,5% 99,8% 13 420 517 60,5% 67,4% 52,8% 57,9%
Large 8 840 0,5% 0,2% 8 762 628 39,5% 32,6% 47,2% 42,1%
Total 1 830 015 100,0% 100,0% 22 183 145 100,0% 100,0% 100,0% 100,0%
Source: SBA Fact Sheet Germany 2009.
Export support mechanisms
As one of the most export intensive countries in the world Germany has a large variety of foreign trade support mechanisms. Very important are the international chambers of commerce (Außenhandelskammern), that are founded through voluntary agreements of German and foreign firms in that given country. The chambers of commerce are located in approx. 120 cities in roughly 80 countries. Within the government, the BMWi is responsible for policies to promote foreign trade and investment. The main instruments of international sales and cooperation support include: information and cooperation events; initiation of international technological cooperation; support for cooperation of knowledge intensive and entrepreneurial services; programs for commercial exploitation; and managerial training programs. Apart from these support mechanisms there are also electronic platforms such as the iXPOS (which joins the relevant services of more than 70 institutions) or the E-Trader-Center through which domestic and foreign products and services as well as possible cooperation partners can be located.
Table 41: Selected Internationalisation indicators for Germany
Indicator Latest country absolute value
EU-average of absolute value
Reference year for country value
Source
Share of turnover from export (% of total) 3.50 5.58 2006 Observatory of European SMEs
Share of SMEs gaining any income from subsidiaries and/or joint ventures abroad (%)
1.80 4.76 2006 Observatory of European SMEs
Number of day required to export 7.00 11.25 2009 World Bank Doing Business
Number of days required to import 7.00 13,44 2009 World Bank Doing Business
SME enterprise had any own imports in 2006-2008
14.5 39.17 2008 DG ENTR Study on Internationalisation of SMEs
SME enterprise had any direct exports in 2006-2008
19.22 27.13 2008 DG ENTR Study on Internationalisation of SMEs
SME enterprise invested abroad in 2006-2008
2.30 3.68 2008 DG ENTR Study on Internationalisation of SMEs
Source: SBA Fact Sheet Germany 2009.
Another important instrument is the Hermes Covers (Hermes Bürgschaften) which is an export credit guarantee that helps exporters to insure themselves against economic and political risks (country risks). A related instrument covers the risks for German foreign direct investment (FDI) abroad in order to create stable framework conditions for German firms. On a more traditional level
186
the BMWi uses foreign fairs as an export marketing and information instrument. In addition to trade fairs the BMWi aims to give political support to German companies in international affairs (door-opener, lobbying, etc.). Finally, there are programs for certain segments of the SME landscape such as the so-called Vermarktungshilfeprogramm (marketing support program) that is specifically targeted towards SMEs in East-Germany in order to support them in intensifying their international activities. Two more recent events include the introduction of the Foreign Trade Offensive of March 2010 (which aims at putting more emphasis on SMEs and offering a more coordinated support) and the newly formed foreign trade and inward investment agency, which is called Germany Trade and Invest (in 2009).
Innovation and Internationalisation
The main actors for supporting innovation are the Federal Ministry for Education and Research (BMBF) and the Federal Ministry of Economics and Technology (BMWi). BMBF and BMWi share the responsibility for innovation policy: While the BMBF is responsible for top-level R&D projects within thematic programs, co-funding for basic and applied research at public research organisations; technology transfer and researcher mobility the BMWi is responsible for designing appropriate framework conditions incl. competition policy; offering direct financial support to SMEs through grants, loans and venture capital; providing infrastructure support; and provide grant funding for application-oriented research programs (INNO Policy Trend Chart Germany 2009).
The German economy is very dependent upon the development on the world markets as a result of its high export ratio. The Federal Government runs programs specifically designed for SMEs to support research, development and innovation (RD&I) activities, including grants for research projects such as the ZIM program (Zentrales Innovationsprogramm Mittelstand) and financing mechanisms for R&D through the state-owned KfW-Bank. There are dozens of other innovation support programmes for SMEs targeting innovation barriers such as seed financing (e.g. the seed fund for High-Tech start-ups, 272 Mio. €), programmes designed to support top-level research in SMEs (KMU-innovativ, approx. 300 Mio. €), or initiatives supporting applied R&D (such as the ERP-Innovation programmes, up to 5 Mio. €).
However, even though German SMEs are highly innovative and perform well above EU average in terms of innovation, their international activities lack behind. As regards international activities (such as share of turnover from exports, share of SMEs gaining any income from subsidiaries and/or joint ventures abroad or SME enterprise had any direct exports in 2006-2008), German SMEs perform below EU average (SBA fact sheet 09). This might also be a reason why the Internationalisation Strategy (presented by the Federal Government in 2008) calls for more intensified international cooperation on all levels.
Germany disposes over a large variety of support mechanisms regarding internationalisation and innovation. However, signs of a joint approach are scarce. The introduction of the marketing support program, the newly formed Germany Trade and Invest agency or recent legislation such as the inter-ministerial Internationalisation Strategy of the Federal Government all aim at the right direction.
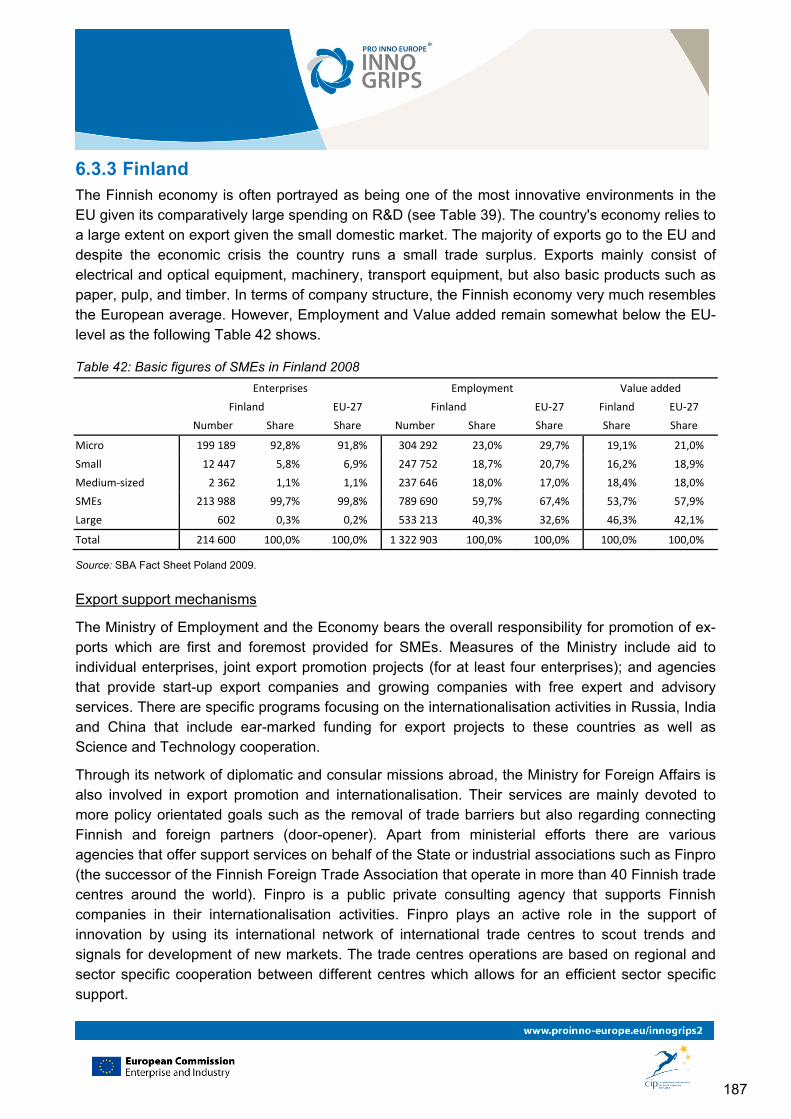
187
6.3.3 Finland The Finnish economy is often portrayed as being one of the most innovative environments in the EU given its comparatively large spending on R&D (see Table 39). The country's economy relies to a large extent on export given the small domestic market. The majority of exports go to the EU and despite the economic crisis the country runs a small trade surplus. Exports mainly consist of electrical and optical equipment, machinery, transport equipment, but also basic products such as paper, pulp, and timber. In terms of company structure, the Finnish economy very much resembles the European average. However, Employment and Value added remain somewhat below the EU-level as the following Table 42 shows.
Table 42: Basic figures of SMEs in Finland 2008
Enterprises Employment Value added
Finland EU-27 Finland EU-27 Finland EU-27
Number Share Share Number Share Share Share Share
Micro 199 189 92,8% 91,8% 304 292 23,0% 29,7% 19,1% 21,0%
Small 12 447 5,8% 6,9% 247 752 18,7% 20,7% 16,2% 18,9%
Medium-sized 2 362 1,1% 1,1% 237 646 18,0% 17,0% 18,4% 18,0%
SMEs 213 988 99,7% 99,8% 789 690 59,7% 67,4% 53,7% 57,9%
Large 602 0,3% 0,2% 533 213 40,3% 32,6% 46,3% 42,1%
Total 214 600 100,0% 100,0% 1 322 903 100,0% 100,0% 100,0% 100,0%
Source: SBA Fact Sheet Poland 2009.
Export support mechanisms
The Ministry of Employment and the Economy bears the overall responsibility for promotion of ex-ports which are first and foremost provided for SMEs. Measures of the Ministry include aid to individual enterprises, joint export promotion projects (for at least four enterprises); and agencies that provide start-up export companies and growing companies with free expert and advisory services. There are specific programs focusing on the internationalisation activities in Russia, India and China that include ear-marked funding for export projects to these countries as well as Science and Technology cooperation.
Through its network of diplomatic and consular missions abroad, the Ministry for Foreign Affairs is also involved in export promotion and internationalisation. Their services are mainly devoted to more policy orientated goals such as the removal of trade barriers but also regarding connecting Finnish and foreign partners (door-opener). Apart from ministerial efforts there are various agencies that offer support services on behalf of the State or industrial associations such as Finpro (the successor of the Finnish Foreign Trade Association that operate in more than 40 Finnish trade centres around the world). Finpro is a public private consulting agency that supports Finnish companies in their internationalisation activities. Finpro plays an active role in the support of innovation by using its international network of international trade centres to scout trends and signals for development of new markets. The trade centres operations are based on regional and sector specific cooperation between different centres which allows for an efficient sector specific support.
188
Other agencies include Finnvera (offering export credit and financing expertise to SMEs in the initial stages of an internationalisation project) or Finnpartners and Finnfund both of which are offering support for cooperation opportunities in developing countries. Some recent programs that were specifically designed to raise interest to export in new sectors include the Cultural Export Development Program 2007-2011 and the Development Program for Business Growth and Internationalisation of Creative Sectors that was partly funded by the ESF.
Innovation and internationalisation
Due to its small internal market the Finnish economy depends on the international competitiveness in order to exploit market opportunities abroad. The economy was hit hard by the global downturn as the export and import volume fell by 25.5% and 19.4% respectively in the first quarter of 2009 (compared to the same period in 2008). In the past certain clusters or individual domestic MNUs were largely responsible for increasing productivity, R&D investments and exports. However, this picture is tarnished by an apparent lack of innovative growth-oriented SMEs and start-ups, which is perceived to be one of the major weaknesses (INNO Policy Trend Chart 09). Much of the export dynamic in Finland is based on the existence of internationally well known and very competitive companies.
Table 43: Selected Internationalisation indicators for Finland
Indicator Latest country absolute value
EU-average of absolute value
Reference year for country value
Source
Share of turnover from export (% of total) 5.50 5.58 2006 Observatory of European SMEs
Share of SMEs gaining any income from subsidiaries and/or joint ventures abroad (%)
7.90 4.76 2006 Observatory of European SMEs
Number of day required to export 8.00 11.25 2009 World Bank Doing Business
Number of days required to import 8.00 13,44 2009 World Bank Doing Business
SME enterprise had any own imports in 2006-2008
25.83 39.17 2008 DG ENTR Study on Internationalisation of SMEs
SME enterprise had any direct exports in 2006-2008
16.40 27.13 2008 DG ENTR Study on Internationalisation of SMEs
SME enterprise invested abroad in 2006-2008
4.30 3.68 2008 DG ENTR Study on Internationalisation of SMEs
Source: SBA Fact Sheet Finland 2009.
The importance of Tekes for the Finnish innovation system must not be underestimated. In 2009 Tekes was responsible for some 30% (or 574.9 Mio. €) of public support for R&D. The programmes include grants for individual as well as for cooperative projects. The Finnish support programmes for SMEs are complemented by the services of various agencies that support SMEs in internationalisation of their business activities. In 2009 some 400 companies benefitted from these services. Still, the internationalisation of business activities remains one of the main bottlenecks of the Finnish Innovation System (www.evaluation.fi).
SMEs are affected twofold as they face direct challenges due to global and domestic downturns, moreover, they face indirect challenges as they often act as suppliers, sub-contractors and service providers to MNUs which themselves are coping with shrinking demand. The Finnish National
189
Reform Programme 2008-2010 also identified these challenges as one of the major weaknesses calling for a better support of innovative growth-oriented SMEs and start-ups (Finish Ministry of Finance 2008). However, the overall situation compared to the EU average is still favourable as Table 43 clearly shows.
A very recent evaluation of the Finnish Innovation system carried out by a panel of 18 international and Finnish experts on innovation policy concluded among others that the internationalisation of the Finnish National innovation Systems remains one of the key challenges for the future (the full report can easily be accessed at www.evaluation.fi). Among other shortcomings the evaluation states that there is a clear need for a broad upgrading of the quality of exports and production as the country is not specializing in the world market in knowledge intensive industries.
In Finland, the challenge of increasing the country's exports has been taken up by recent evaluations and legislations. Agencies such as Finpro and Tekes play a vital role for both innovation and internationalisation. Especially Finpro offers rather differentiated support for SME on all stages of their internationalisation activities (including for high-tech start-ups). However, internationalisation of SMEs remains an issue to be tackled by future legislation.
6.3.4 UK In contrast to the EU average the UK enterprise structure has a slight bias towards larger companies. However, given the fact that the UK has the highest VAT threshold in the EU many SMEs (especially micro enterprises) operate below this level and do not appear in the statistics (SBA Fact Sheet UK 09, FN 3). Employment and value added generated by SMEs is significantly lower than in the EU. Especially regarding employment there is a surprising 13% difference.*
Table 44: Basic figures of SMEs in the UK 2008
Enterprises Employment Value added
United Kingdom EU-27 United Kingdom EU-27 United Kingdom EU-27
Number Share Share Number Share Share Billion € Share Share
Micro 1 420 417 87,5% 91,8% 3 817 765 21,5% 29,7% 216 18,5% 21,0%
Small 170 372 10,5% 6,9% 3 183 757 17,9% 20,7% 181 15,5% 18,9%
Medium-sized 27 348 1,7% 1,1% 2 723 685 15,4% 17,0% 194 16,6% 18,0%
SMEs 1 618 137 99,6% 99,8% 9 725 207 54,8% 67,4% 591 50,7% 57,9%
Large 5 970 0,4% 0,2% 8 012 260 45,2% 32,6% 576 49,3% 42,1%
Total 1 624 107 100,0% 100,0% 17 737 467 100,0% 100,0% 1 166 100,0% 100,0%
Source: SBA Fact Sheet UK 2009.
Export support mechanisms
The UK is a service orientated economy. The country has been running a foreign trade deficit in recent years. In the course of the current global downturn exports and imports both fell sharply. External trade is not biased towards Europe as the majority of exports are going to countries
* This finding might be attributed to the fact that the economic structure in the UK (as an Anglo-Saxon economy) favors the emergence of large companies which seems to confirm the findings for the US economy mentioned at the end of chapter 4.
190
outside the EU27. The main exported commodities include manufactured goods, fuels, chemicals, food, beverages, tobacco.
In order to support UK enterprises in their international activities the respective efforts of the Foreign & Commonwealth Office (FCO) and the Department for Business, Innovation and Skills (BIS) were centralized in the UK Trade & Investment (UKTI) which today acts as the main agency for internationalisation support in the UK. The UKTI offers a wide range of free support services to UK companies getting started in international trade mainly through its "Developing Your International Trade Potential" Program. Companies may join the if they have less than 250 employees, less than € 50 million turnover, make 25% or less of turnover from exports and if they are new, novice or passive exporters. The most important services offered include: access to one an International Trade Adviser that are located in over 40 local offices around the country; entry into UKTI's support schemes for exporters "Passport to Export" (an export capability assessment) and "Gateway for Global Growth" (offering free strategic review service to experienced exporters). Another UKTI support line ("Accessing International Markets") is designed for experienced exporters. The goal is to remove trade barriers and offer information, contacts, and support from UKTI staff and overseas through the UK's network of embassies, consulates and other offices in some 96 markets. The FCO joins in with reports on emerging markets.
There are several new programs such as the engaging "Fiscal Stimulus Initiative (FSI)" that offers specific help for UK companies to access opportunities arising from new fiscal stimulus packages in overseas markets. The FSI aims to raise awareness of these packages and assist UK companies in exploitation of these potential business opportunities.
Table 45: Selected Internationalisation indicators for UK
Indicator Latest country absolute value
EU-average of absolute value
Reference year for country value
Source
Share of turnover from export (% of total) 3,60 5.58 2006 Observatory of European SMEs
Share of SMEs gaining any income from subsidiaries and/or joint ventures abroad (%)
7.50 4.76 2006 Observatory of European SMEs
Number of day required to export 13.00 11.25 2009 World Bank Doing Business
Number of days required to import 13.00 13,44 2009 World Bank Doing Business
SME enterprise had any own imports in 2006-2008
21.36 39.17 2008 DG ENTR Study on Internationalisation of SMEs
SME enterprise had any direct exports in 2006-2008
21.08 27.13 2008 DG ENTR Study on Internationalisation of SMEs
SME enterprise invested abroad in 2006-2008
2.19 3.68 2008 DG ENTR Study on Internationalisation of SMEs
Source: SBA Fact Sheet UK 2009.
Innovation and internationalisation
Since June 2009, BIS covers the responsibilities of the former Department for Business, Enterprise and Regulatory Reform (BERR) and the former Department for Innovation, Universities and Skills
191
(DIUS) that both existed only about two years and emerged from the Department for Trade and Industry. It focuses on the topics of innovation, regulation, entrepreneurship, business, universities and training, qualifications, science, research and innovation. With the creation of the BIS the innovation support measures are concentrated in one government unit. BIS exerts several functions such as co-creator of research policy and as regulator for the framework conditions for innovation on the one hand, and as funding facility with an emphasis on higher education on the other. BIS cooperates with a number of facilities at the operational level (see Department for business innovation and skills (BIS) 2009: 58), such as in the implementation of innovation measures with the regional development agencies in England.
According to INNO Policy Trend Chart 2009 the UK has no large-scale direct funding program for industrial R&D. Instead the UK Government considers indirect and 'soft' measures to stimulate corporate R&D a more effective way rather than directly providing funds to firms. The largest innovation supporting mechanisms are R&D Tax Credits. There are, however, various funding initiatives specifically designed for SMEs including the Grant for Research & Development and several programs to promote the supply finance to start-ups and SMEs. Relatively low R&D expenditures and certain challenges regarding the commercialisation of research activities seem to be the major innovation challenges.
In order to tackle these challenges, to increase the country's international competitiveness of SMEs and to entangle the multitude publicly-funded schemes for business support the Government is streamlining its efforts to one package (accessible through Business Link). This package will join national, regional and European funding opportunities. More than 2000 different measures regarding consultancy, information, qualification and other services as well as direct support mechanisms were simplified to 30 in the course of the Business Support Simplification Programme. Unified access is offered through the label "Solutions for Business".
The nine Regional Development Agencies (RDAs) play an important role in the portfolio of SME Innovation support in England. There are similar institutions in the other regions (Scottish Enterprise, the Welsh Development Agency, Invest Northern Ireland). In 2008/09 more than £300 Mio were distributed through the RDAs. Each of the RDAs sets priorities according to its regional idiosyncrasies.
The UK serves as an example for the trend for centralisation of services. During the last years UKTI and BIS centralized their respective support measures in order to give especially SMEs a single point of contact. The UKTI support offers a wide range of services for different stages of export experience, while the recent re restructuring of the innovation support aims to simplify the application procedures. However, given that these developments occurred only very recently it is too soon to determine whether there are efforts to coordinate internationalisation and innovation.
6.3.5 Conclusions and suggestions for further research The comparison of the European countries presents evidence that there is a large variety of export support mechanisms across member states. It was shown that export support has become a very important activity. Export support as means to exploit international opportunities is part of the policy tool kit in all countries. There are at least three developments worth mentioning:

192
the inter-ministerial Internationalisation Strategy in Germany which includes a chapter on supporting the international competitiveness of SMEs
the sectoral approach of the Finnish Trade Centres in the Finpro System and the tendencies for centralizing internationalisation support and support for innovation in
the UK
Regarding the design and configuration of public support there is a trend for centralisation of services in certain public agencies that design and coordinate these programs in many countries (though never as intensive as in the UK it seems). The public support programs are implemented and executed by federal, regional and private actors ranging from embassies in foreign countries and trade chambers (popular in the German case) to regional support agencies (important in the UK). From a programmatic standpoint there seems to be a tendency to give support for all steps of the internationalisation process (the findings of Springer 2008 are similar). All countries have incentives for domestic companies to engage in international activities. Some even have very prominent examples of Foreign Direct Investment attraction programs (such as the UK for example with UKTI).
However, there is hardly any program which connects internationalisation and innovation support as suggested in Figure 24 above. Innovative high-growth SMEs are seldom in the focus of public support, and if so the support is been given by two different entities. The success of these measures thus depends largely on the coordination between these entities. To analyze the coordination mechanisms currently in place or to evaluate the experiences of novel joint approaches was beyond the scope of this chapter but future research could to give some indication on European best practices in this regard.
Often there is financial assistance for start-up activities and international business development support. Programs focusing on SME support regarding international product development or technological development subsidies for example are rare to non-existent. Policy maker should consider the international dimension since many of the high-growth firms tend to operate on a global basis and one might assume that more public support for their international activities might yield higher growth and survival rates. It was also shown in the empirical chapter that "Born Globals" are often the result of academic start-ups which justify a more pronounced support.
When considering the export performance of the three countries at stake (see Table 39) and public support seems to correlate with export performance: Germany, as Europe's leading export nation, also has a rather diversified supporting system. This of course raises the question of causality which we also have to leave for future studies. Do more support programs lead to more exports or do more exports require more programs? Currently it is difficult to assess the impacts since there is no data about the key variables (such as the relationship of internationalisation strategies and export promotion, the amount of resources being raised for export promotion, the importance of the qualification of coaches, etc.). Future studies should also focus on sectoral differences. For example, Boter & Lundström (2005) find that SMEs in traditional manufacturing sectors utilize public support to a higher extent than service companies which they attribute to the fact that the services supplied by public agencies are mainly designed to fit the needs of the manufacturing sector.
193
Summing up we could show that all countries are relevant exporters and all have export supporting mechanisms. However, it also became apparent that public support does not seem to have caught up with the rapidly changing international environment and the developments regarding firm behaviour (international innovation, Born Globals). The granted support follows a rather schematic "old fashioned" way even though several countries introduced promising reforms as for example the merger and integration of services. However, SME support should be integrated and systematic in order to have a long lasting effect. This means considering "usual" export support as well as support for international innovation activities.
6.4 General assessment of EU policy on innovation and internationalisation
The summary review of EU policies addressing the link between innovation and internationalisation of this report shows that until recently it has not been identified as an important aspect to support innovation and link up different EC policy areas. In most areas the explicit link between internationalisation and innovation is missing both in terms of past policies at the EU level (SEC(2009) 1194 final) and in terms of being identified as an important aspect to support innovation and link up different EC policy areas. Recently this situation has changed For instance in 2008 the Enterprise Europe Network (EEN) has been set up that links up 570 business support organisations (contact points) in 45 countries. It offers support in finding international partners by maintaining a business cooperation database that allows for target-oriented match-making. Additionally the EEN offers support in questions regarding technology transfer, access to finance, research funding and even intellectual property and patents. Therefore, the EEN is close to a one-stop-shop for SMEs that whish to internationalise their business activities. Other programmes, such as the EUROSTARS-programme have also been launched recently. These are recent developments such that it is too soon to give an evidence-based appraisal.
The review of policies related to both barriers to innovation and barriers to internationalisation at the EU level shows that there is a large portfolio of measures addressing all the barriers discussed in this report. However, there is a large dispersion of responsibilities across different EU institutions and different administrative units of the European Commission. This report has shown that firms face considerable information problems when trying to overcome innovation and internationalisation barriers. As a consequence of this dispersion of measures, the availability of information to firms may be problematic. The EEN is an instrument to overcome such information deficits. However, it should be assessed whether this instrument provides all the relevant information or whether the scope of its data base should be extended. Furthermore, it should also be assessed whether all firms and firm types that report barriers to innovation, are equally well supported by the instruments that are currently in place. The dispersion of measures within and across different administrative levels might also be a source of redundancies, policy inconsistencies and contradictory incentives. As the communication on the Innovation Union commits to link EU and national research and innovation systems better up with each other a systematic of whether all instruments in place are able to reach firms that face barriers and whether the incentives they provide are consistent.

194
Looking at the link between innovation and internationalisation support at the level of the member states this report has explored how these are organized in a few member states. Even this very limited review shows that there is a considerable variety in terms of how member states deal with this issue. Some have well targeted instruments in place that combine both dimensions whereas others do not link up the two issues. Member states can learn from each other as to what concerns best practices in this policy field. While internationalisation policies for firms remain in the domain of the Member states the EU has an important role to play: The European Commission could initiate a policy learning exercise in this field.
195
7 Conclusions
7.1 Summary and policy recommendations This report contributes to our understanding of how innovation and internationalisation are linked at the firm level. Despite some limitations related to the available data it is the first study that has examined the issue across all EU member states. The results show that innovative companies are more likely to export. On average they have also higher export shares, higher productivity and turnover growth. Across all countries and industries the likelihood that an innovative firm exports is determined by its productivity levels and by product innovations. The export shares of innovative firms depend also on continuous R&D activities and the degree of appropriability of the returns to their innovation investments. If the latter is high firms export more.
A breakdown of the analysis to subsamples which differentiate innovative firms in terms of the average technological capability of the countries in which firms are located reveals that differences across country groups exist. The results show that the importance of product innovations, continuous R&D and appropriability increase with the level of economic and technological development of the country in which the firm is located for both the export propensity and the export shares firms. These factors are less important for the internationalisation of innovative firms located in technologically less developed countries.
With the available data it is more difficult to analyse the impact of exports on innovation. However, our results indicate that exporting has positive effects on innovation. It triggers learning on markets and technologies. The access to larger markets increases also the turnover of exporting firms such that larger amounts of the cash flow can be devoted to innovation and R&D investments. Overall, the available evidence suggests that innovation and export activities are closely related. They may be considered to be two sides of the same coin. This emerges also from the analysis of the impact of innovation and exporting on different economic performance indicators. Indeed, our analysis shows that both innovation activities and exporting affect the economic performance of firms in terms of employment and productivity growth positively. While the study confirms the common wisdom that innovation is an important driver for productivity growth it also reveals a more differentiated picture. In industries with medium to low innovation intensity productivity growth is more closely associated with process innovations, whereas in industries with high innovation intensity product innovations are more important. The same holds if firms of identical industries are compared across country groups. In the member states that are technologically more advanced productivity growth at the firm level is associated with product innovations, whereas in less advanced or catching up countries technology transfer is more significant.
Taken together the results indicate that the process of catching up and economic and technical convergence across EU member states is closely linked to technological upgrading which influences innovation and internationalisation patters across countries in different ways. If firms are technologically less advanced and the framework conditions in the countries in which they are located are not favourable to top level R&D, then they increase their competitiveness through
196
technology transfer and by exploiting their cost advantages on export markets. This implies, however, that firms in these countries start internationalising by importing technologies and knowledge from more advanced firms and countries. The internationalisation process of firms in more advanced countries is instead more often driven by product innovations. For this competitive advantage to be sustainable product innovations need to be introduced steadily. This in turn requires continuous R&D activities such that their importance as a core source of competitive advantage on international markets rises relative to technology acquisition and improvement of acquired technologies. This pattern of technology upgrading of course calls for a differentiated policy approach to innovation and internationalisation across country groups. Policies aiming at making firms more competitive through innovation across member states need to take into account of these differences in order to be successful.
Box 13: Recommendations related to the evidence on the relationship between innovation and internationalisation
It is advisable to design policy support measures that stimulate innovation and internationalisation at the same time.
The observed pattern of technology upgrading calls for a differentiated policy approach to innovation and internationalisation across countries.
This report has also examined the factors hampering innovation and internationalisation at the level of innovative industries and firms across EU member states. It is well known that different barriers to innovation exist for innovative firms in Europe. In its recent Communication on the Innovation Union (European Commission 2010d) the European Commission has pledged to work towards a removal of the remaining barriers for entrepreneurs to "bring ideas to the market". Among other goals the EC defines better access to finance, particularly for SMEs, affordable IPRs, smarter and more ambitious regulation and targets, and a faster setting of interoperable standards as principal barriers to be addressed. The communication calls on member states to reach agreement on the EU patent before the end of the year 2010. As this report shows that internationalisation and innovation are closely complementary the commitment by the EC to address barriers to innovation should be given even higher urgency because barriers to innovation should also be conceived as barriers to internationalisation. This implies that barriers to innovation hamper competition of European firms on non-EU markets. The present report provides evidence on the characteristics of the firms that are affected by innovation barriers which should allow policy makers to calibrate policy instruments better. It also examines how and to what extent "traditional" trade barriers affect innovative firms and industries across EU member states.
Knowledge barriers refer to a lack of knowledge on technologies, markets and knowledge sources. This report shows that small firms and firms that are not part of a larger corporate group are more likely to experience such problems. With respect to larger corporations or affiliated groups they cannot spread overhead costs related to knowledge sourcing activities or measures of internal knowledge management over a larger output or several productive units. Smaller firms are also more likely to report technical knowledge barriers in industries where it is more difficult to build up new knowledge as it is more heavily based on previous competencies. The analysis also indicates that firms with high skill intensity or firms that are internationalised systematically report to
197
experience higher knowledge barriers to innovation. They are better aware of the limits of their knowledge as they operate on more competitive markets and hence report higher barriers. When identifying barriers it is therefore important to look at these firms. Looking at industry characteristics the results indicate that the lack of technical knowledge is perceived as being important especially in industries with medium or low innovation intensity. Manufacturing firms are also more likely to report knowledge barriers than firms in service sectors.
Financial barriers to innovation and shortages of skilled personnel affect similar firm types. Financial barriers are closely related to the risk profile of the firm. They have a higher impact on innovation for SMEs and young firms with very novel products and technologies, as well as on fast growing firms. The same applies to R&D intensive firms and firms that rely heavily on basic research. Firms that are engaged in both innovation and internationalisation are also more likely to report to be financially constrained as carrying out both activities at the same time is more risky. Essentially the same types of firms perceive shortages of skilled personnel as a serious problem. The likely reason for this analogy is that risky activities such as innovation and internationalisation are in most cases also more skill and technology intensive. The report shows that manufacturing firms are on average also more likely to report both barriers as a factor constraining innovation than service firms. In line with the general findings on technological upgrading across EU member states we also find that financial and skill constraints more serious the more technologically advanced a firm and the country it is located in are.
Looking at firm types the results show that R&D innovators, non-technological innovators and barrier-related non-innovators display a much higher perception of innovation barriers. Given the definition of barrier-related non-innovators it is not surprising that barrier-related non-innovators rank innovation barriers higher than innovators. More surprising is that after controlling for a variety of firm and industry characteristics non-technological innovators have higher propensities to mention skill constraints and lack of market knowledge as important hampering factors to innovation than R&D innovators. This finding needs to be considered cautiously however, as its statistical significance is not very high. Thus it can be safely concluded by our analysis that barrier-related non-innovators by and large report the same barriers as innovators. Targeting barrier-related non-innovators is most likely a promising avenue to increase the number of innovating firms and hence the number of exporting firms. These firms represent indeed idle innovation potential in European business.
The results show that fast growing SMEs (gazelles) report different barriers to innovation in function of the level of technological development of the country in which they are located. In the most advanced countries growth strategies tend to be innovation strategies. As a consequence they report problems related to all barriers discussed so far. Gazelles in the Southern European countries tend to rate financial barriers as being most severe, whereas gazelles in the countries that heavily import technologies predominantly indicate that the lack of skilled labour is most significant. The intuition behind the differences across country groups is found in the distribution of gazelles across country groups. Approximately 50% of high growth firms located in the technologically most advanced countries are R&D innovators. In the group of technology importers and Southern European countries only around 30% of gazelles are R&D innovators and in the
198
technologically least developed countries the figure goes down to around 5%. The results are thus in line with the findings on barriers to innovation for R&D innovators who report higher barriers than other types of firms. Otherwise, gazelles are less likely to report barriers than other firms as probably they are among the more successful firms.
Box 14: Recommendations related to barriers to innovation
In its Communication on the Flagship Initiative "Innovation Union" the European Commission has committed itself to make progress to remove innovation barriers further. As the Union has grown the variation of the factors driving and hampering internationalisation and innovation across member states has increased. Policies originating from this initiative should take into account the differences that exist across country groups in the EU and target different needs better.
Targeting barrier-related non-innovators is most likely a promising avenue to increase the number of innovating firms and hence the number of exporting firms.
The evidence points to failures of the education systems in a number of EU Member States that lead to shortages of skilled labour affecting innovative firms most seriously. These member states should put more emphasis on general higher education and training policies.
Internationalised and innovative firms are more likely to report skill constraints. EU level initiatives such as the Enterprise Europe Network could provide coaching in areas such as skill planning and recruitment of highly qualified tertiary graduates, where SMEs are disadvantaged in comparison with the attractive opportunities large firms can offer in terms of training programmes.
Efforts should continue to overcome the fragmentation of national markets and foster financial development in general (also for business angels and other forms of risk capital). There is room for a multilateral country surveillance exercise that could screen national regulations impeding the activity of venture capital funds or business angels such as restrictions on investment rules for institutional investors.
Ownership of IPRs can help firms to overcome problems to access finance: young SMEs that can protect their innovations better through IPRs are less likely to be affected by financial constraints for technology intensive firms. It is easier to obtain VC financing when a patent application has been filed. However, it is widely acknowledged that the current European IPR system is not favourable for innovation. The lack of a single European patent makes it very expensive to get protection of intellectual property for a large number of countries. SMEs and other people or organisations without the resources to afford the high cost both in terms of time and money of filing a patent are put at a disadvantage by the current system. This evidence therefore indicates that the single European patent should be implemented as soon as possible.
Standards play an important role for the diffusion of technology and as focussing device for innovative search. They are also conducive to international trade as they help defining important product characteristics in foreign markets more clearly. SMEs benefit from the process of standardisation as it leads to transfer of expert knowledge and supports cooperation between enterprises, research institutions and the public sector. For these reasons standards are of comparable importance as source for innovation as patents. However, guiding early standardisation processes is difficult as it requires the identification of promising themes of standardisation. In addition new impulses from R&D need to be integrated into the ongoing process of standardisation. Otherwise standardisation runs the risk to cause an early lock-in to inferior technologies. On the other hand, as in most of the areas of research, patenting, innovation and standardisation SMEs are at disadvantages compared to large companies. Therefore many SMEs see the process of standardisation as subject to regulatory capture by large firms. In order to increase the participation of SMEs in standardisation processes it is necessary to reduce
199
information deficits regarding rules and products, and to reduce costs of participation (opportunity costs and lack of qualified personnel), and improve enterprise competencies.
There is a close relationship between standards and regulation. Regulation is often based on standards to define acceptable behaviour, and codes of conduct are frequently used in response to public and political pressure for regulation. The difference is that regulation imposes mandatory standards. This tends to increase the costs of products and processes, and thereby reduces incentives to innovate. However, regulations can also act as a focusing device for innovation. Competition-enhancing regulation or deregulation can also create incentives to innovate for both incumbents and new entrants. However, the use of regulation as innovation policy seems to be relatively limited. Environmental regulations and regulations that are established because of strong public pressure are more important than other regulations in providing focusing devices for innovation activities. It also does not affect all firms equally. Larger firms and exporting firms report more often that their innovations improved the environmental, health and safety characteristics of their products or processes. The same firms state that their innovation activities helped to meet regulatory requirements.
The European Commission has recognised the importance of standards and regulations in its Communication on the Innovation Union where it maintains that smart and ambitious regulation can be a key driver for innovation, and in particular for eco-innovation. The document also argues that standards can play a role in shortening the innovation cycle, and that they can be an instrument to set standards at the global level which can give European firms a competitive edge. This study could not look into these issues exhaustively and more research in this direction is needed. However, it finds that while standards and regulations are important, they have also clear limits. The use of these instruments should be assessed on a case by case basis, and their costs and benefits can only be assessed by an industry by industry basis.
Box 15: Recommendations related to institutional framework conditions for innovation
The evidence reviewed in this report calls with renewed urgency for a fast track implementation of the single European patent. A global patent standard (GPS) should be created to address three areas: free access to key information (transparency), convergence of work procedures and of human resource practices at the patent offices. With regard to the issue of software patents future efforts should focus on the definition of (non-) patentable software in Europe in order to define a flexible property right system. Instead of implementing software patents, the possibility of strengthening the copyright system or subsidizing the established Open Source Software should be kept in mind.
The European Commission has recognised the importance of standards and regulations in its Communication on the Flagship Initiative "Innovation Union" where it maintains that smart and ambitious regulation can be a key driver for innovation, and in particular for eco-innovation. The evidence presented in this study suggests that while standards and regulations are important, they have also clear limits. The use of these instruments should be assessed on a case by case basis, and their costs and benefits can only be assessed on an industry by industry basis.
The analysis of the barriers to internationalisation has distinguished between barriers related to firm characteristics, and barriers related to institutional factors or policies such as tariffs or non-tariff trade barriers that cannot be influenced by the single company. The most relevant internal barriers to internationalisation are the lack of innovative capabilities, of information and capabilities which are closely linked to some of the firm specific barriers to innovation, such as the lack of highly skilled employees or the lack of knowledge about international opportunities. Particularly SMEs find it generally difficult to find the right international trading partner. The lack of financial resources is an important barrier to internationalisation for similar reasons as this affects
200
innovation behaviour. However, the participation of SMEs in European research networks strongly correlates with a higher export propensity of SMEs. "Born Globals" on the other hand perceive barriers to internationalisation as being less stringent than other exporters. These are technology based or academic start-ups operating on a global scale. The likelihood that a new firm is a "Born Global" is closely related to favourable framework conditions with respect to entrepreneurship and research in a country.
The report shows that external trade barriers are relevant for innovative firms. Tariff barriers affect firms exporting to countries in the north of Africa and the Middle East, Russia, China, and also to the US, Brazil or India. Non-tariff trade barriers instead hamper exports to the United States, Russia, China, India, and Mexico. Across all EU member states these barriers affect firms in highly innovative industries more heavily than those in other industries. Issues with IPRs (e.g. weak enforcement, high likelihood of contestation) or trade defence rules (e.g. anti-dumping measures) are also relevant. Cultural aspects are also significant barriers to internationalisation: The lack of knowledge of foreign languages and related problems to understanding foreign habits and business practices affect exports to Russia or non-EU Mediterranean countries. Looking at intra-EU trade evidence presented in this study indicates that despite the Single Market barriers continue to exist in intra-EU trade. The costs for inland transport continue to be rather high within some EU countries. Trade between member states is also hampered by paperwork related to exports. For instance, some Member States require technical standard or health certificates which firms from other EU Member States have to present when they export to these countries.
Box 16: Recommendations related to barriers to trade for the EU's innovative firms
The EU should continue to support the participation of SMEs in European research networks and other kinds of partnering events and provide incentives to expand these activities in all research schemes (JTIs, ERA Nets, EUREKA, etc.). This could be done in a more systematic manner in order to give SMEs the opportunity to reap the commercial benefits of the research cooperation for example by giving them access to information about developments in foreign markets.
The evidence also indicates that firms from New Member States are underrepresented in these research networks so far. They may not have the necessary capabilities to access these networks yet. Therefore the EU should increase its support for SMEs that were not yet part of such a research network.
Good framework conditions for research and entrepreneurship at the national level favour the creation of fast growing SMEs and "Born Globals". Policy makers in the EU Member States should therefore consider that technology based start-ups tend to operate on a global basis. Better public support for their international activities might yield higher growth and survival rates.
The EU should continue to work towards the removal of trade barriers. Given the data limitations faced in this study DG Trade and DG Enterprise could work more closely together to assess more in depth whether and how innovative SMEs are affected by trade barriers, and which policies could support their way into international markets best.
A summary review of EU policies shows that until recently the link between innovation and internationalisation has not been given high priority. As a consequence this dimension has been missing in past policies. Recently this situation has changed For instance in 2008 the Enterprise Europe Network (EEN) has been set up. It links up 570 business support organisations (contact points) in 45 countries. It offers support in finding international partners by maintaining a business cooperation database that allows for target-oriented match-making. Additionally the EEN offers support in questions regarding technology transfer, access to finance, research funding and even intellectual property and patents. Therefore, the EEN is close to a one-stop-shop for SMEs that whish to internationalise their business activities. Other programmes, such as the EUROSTARS-programme have also been launched recently. These are recent developments such that it is too
201
soon to give an evidence-based appraisal. Despite this development, the review of policies in place reveals that the link between innovation and internationalisation could be combined more thoroughly across different policies.
Looking at the link between innovation and internationalisation support mechanism at the level of the member states this report has explored how they are organized in a few member states. Even this very limited review shows that there is a considerable variety in terms of how member states deal with this issue. Some have well targeted instruments in place that combine both dimensions whereas others do not link up the two policies and related instruments. Member states can learn from each other as to what concerns best practices in this policy field. While internationalisation policies for firms remain in the domain of the Member states the EU has an important role to play: The European Commission could initiate a policy learning exercise in this field.
Turning finally to the barriers to innovation and internationalisation the review of related policies at the EU level shows that there is a large portfolio of measures addressing all the barriers discussed in this report. However, there is also a large dispersion of responsibilities across different EU institutions and different administrative units of the European Commission. This is likely to cause problems for firms that seek support as it increases search costs. The dispersion of measures within and across different administrative levels might also be a source of redundancies, policy inconsistencies and contradictory incentives.
Box 17: Recommendations related to policies supporting innovation and internationalisation
It would be advisable to conduct a systematic EU-wide review of national export promotion programs and innovation support measures. This review should analyse to what extent these policy areas are linked up across member states, assess their complementarities, and identify best practices. The aim of the exercise should be to assess how instruments in both fields can be designed in such a way that they mutually reinforce each other. This could be an important source for policy learning.
As the EC Flagship initiative "Innovation Union" commits to link EU and national research and innovation systems better up, this review should also consider the interactions and complementarities between national and EU level instruments.
It should be assessed to what extent the dispersion of measures supporting either innovation or internationalisation or both across all administrative levels is in itself a source of knowledge barriers for companies trying to innovate or export.
As part of such assessment it could be examined whether the EEN provides all the relevant information for specific firm types, whether the scope of its data base should be extended or whether other instruments are needed.
7.2 Limits of current study and avenues for further research The principal aim of this report is to analyse barriers to internationalisation and growth for Europe's innovative firms. The principal results were obtained using firm level data from the European Community Innovation Survey (CIS) for 21 countries for the years 1998-2000, 2002-2004, and 2004-2006. These data were accessed at the Eurostat Safe Centre. The choice to use this data source was determined by the fact that the principal was interested in evidence at the level of innovative firms. The CIS is the best data source in this respect. However, it has also some shortcomings as the CIS was not designed to assess the internationalisation of firms and certain firm level barriers. Export shares of firms are available only for CIS 3 data. Import shares instead are not available at all. For this reason the link between different internationalisation and innovation capabilities at the firm level continue to remain somewhat unclear. More research and better EU wide data are needed. Especially the role of importing could be assessed only indirectly by analysing the pattern of innovation expenditures with respect to the level of economic development of the country in which the firm was located. Another problem related to the CIS data is that they
202
are not available as a firm panel, i.e. we cannot observe the behaviour of each firm over time. However, given the time lag involved between innovation activities and successful exports this would be necessary to be able to make clear cut causal statements on the relationship between innovation and exports. It might be worth to consider link up CIS surveys over time in order to assess questions that imply a change of behaviour over time. This is already done by some member states. It would be advisable to extend this practice to all member states.
We had to complement our analysis with literature surveys and other data sources. Because of these data issues our analysis of the trade barriers remains largely descriptive. Further analyses are needed in this respect in order to assess how firms perceive trade barriers and rate their impact on their innovation investments and internationalisation strategies. Given the data limitations faced in this study DG Trade and DG Enterprise could work more closely together to assess more in depth whether and how innovative SMEs are affected by trade barriers, and which policies could support their way into international markets best.
From a more general perspective it has to be acknowledged that there is also no data source available that links information on innovation investments, internationalisation and both trade and innovation barriers. Given that these two aspects of firm behaviour seem to be closely linked this is a shortcoming. In order to provide better data for evidence based policy making it would be advisable to consider developing the CIS in such a way that both aspects are adequately covered. This could be done by collapsing the CIS survey with other firm level surveys. Some examples exist in this respect already in some member states. The EC could take the initiative to start a discussion related to the collection of relevant firm level data across EU member states.
Finally, due to obvious need to narrow the scope of the present study that covers already a large number of topics each of which should have been analysed at great depth in its own right this report could not provide a very detailed policy mapping of all the measures both at the EU level and the level of the Member states concerning all barriers to innovation and barriers to internationalisation. An impact assessment of these measures would in any case have been beyond the scope of this report. However, both a policy mapping and an assessment of the impact of these policies on firm behaviour would be necessary for essentially two reasons: the first reason is that this report points to the close complementarity of innovation and internationalisation. It would be important to learn more whether and how policies both at the EU level and the level of member states deal with this issue. The second reason is that the EC Communication on the Flagship initiative "Innovation Union" urges to better link EU and national research and innovation systems with each other. This implies that a better coordination of policies between the different administrative levels is necessary. Our results indicate however that the measures supporting both the removal of innovation barriers and internationalisation show a considerable dispersion at the EU level and the level of member states. An EU wide map of measures that target both innovation and internationalisation could therefore provide useful intelligence. One could build here on data bases that have been built during projects in the past (e.g. Trend Chart).
To conclude, our discussion of regulations and standards relied very much on literature reviews and small case studies. However, as this review has revealed these instruments unfold their impact (and also their benefits) largely at the level of industrial sectors, and each industry is
203
affected in a different way. It is therefore very difficult to develop general statements on the importance of these instruments at the level of entire economies or even integrated economic areas such as the Single Market. A broad study that would map all relevant standards and regulations and assess their impact on the economic performance of industries and firms across Member States could prove to be very valuable to devise in depth advice in this policy area to which recent EC policy documents attach great importance.
204
References Acemoglu, D., 1996. Credit constraints, investment externalities and growth. In: Booth u. a., 1996. pp. 41-62.
Acemoglu, D., 2002. Technical Change, Inequality, and the Labor Market, Journal of Economic Literature 40, pp. 7-72.
Acemoglu, D., Aghion, P. and Zilibotti, F., 2006. Distance to frontier, selection and economic growth. Journal of the European Economic Association 4(1), pp. 37–74
Acemoglu, D., Johnson and S., Robinson, J., 2005. The Rise of Europe: Atlantic Trade, Institutional Change, and Economic Growth, in: The American Economic Review, Volume 95, Number 3, June 2005 , pp. 546-579(34).
Acemoglu, D., 2003. Root Causes. A historical approach to assessing the role of institutions in economic development, in: Finance & Development, June 2003, pp. 27-30.
Acemoglu, D., Gancia, G. and Zilibotti, F., 2010. Competing Engines of Growth: Innovation and Standardization. NBER Working Papers 15958.
Acs, Z., Audretsch, D., Braunerhjelm, P. and Carlsson, B., 2004. The missing link: The knowledge filter and entrepreneurship in endogenous growth, CEPR Discussion paper No. 4783, CEPR London.
Acs, Z, Audretsch, D. Braunerhjelm, P. and Carlsson, B., 2005. Growth and entrepreneurship: an empirical assessment, CEPR Discussion paper No. 5409, CEPR London.
Acs, Z.J. and Audretsch, D.B., 1987. Innovation, Market Structure and Firm Size, Review of Economics and Statistics, 69, pp. 567-575.
Acs, Z.J., Audretsch, D.B., 1990. Innovation and Small Firms, Cambridge, MA, MIT Press.
Acs, Z.J., Audretsch, D.B. and Feldman, M.P., 1994. R&D Spillovers and Recipient Firm Size, Review of Economics and Statistics, 76 (2), pp. 336- 39.
Acs, Z., Morck, R., Shaver, J. M. and Yeung, B., 1997. The Internationalization of Small and Medium-Sized Enterprises: A Policy Perspective. Small Business Economics 9, pp. 7-20.
Acs, Z. J. and Szerb, L., 2006. Entrepreneurship, Economic Growth and Public Policy, in: Small Business Economics, Vol. 28, pp. 109–122.
Adams, C. and Brantner, V., 2006. Estimating the Cost of New Drug Development: Is it really $802m? Health Affairs, March/April, pp. 420-428.
Aghion, P., Boustan, L., Hoxby, C. and Vandenbussche, J., 2005. Exploiting States’ Mistakes to Identify the Causal Impact of Higher Education on Growth.
Aghion, P. and Howitt, P., 2006. Joseph Schumpeter Lecture Appropriate Growth Policy: A Unifying Framework, Journal of the European Economic Association, 1 April 2006, 4(2-3), pp. 269-314.
Aghion, P., Bloom, N., Blundell, R., Griffith, R. and Howitt, P., 2005. Competition and Innovation: An Inverted-U Relationship. In: Quaterly Journal of Economics, 120 (2), pp. 701–728.
Aghion, P., Dewatripont, M., Hoxby, C., Mas-Colell A. and Sapir A., 2008. Higher aspirations: An agenda for reforming European universities. Brussels: Bruegel Blueprint Series.
Aghion, P., Askenazy, P., Berman, N., Cette, G. and Eymard, L., 2010. Credit Constraints and the Cyclicality of R&D Investment: Evidence from France, SSRN eLibrary, Februar 2008, http://papers.ssrn.com/sol3/papers.cfm?abstract_id=1680324 (accessed November 15th 2010).
Akerlof, G.. 1970. The Market for ‘Lemons’:Qualitative Uncertainty and the Market Mechanism, Quarterly Journal of Economics 84:3, pp. 488–500.
Alesina, A., Nicoletti, G., Ardagna, S., and Schiantarelli, F., 2005. Regulation and Investment, Journal of the European Economic Association 3, pp. 791–825.
Alvarez, R. and López, R. A., 2005. Exporting and performance: evidence from Chilean plants. Canadian Journal of Economics/Revue canadienne d'économique 38(4), pp. 1384–1400.
Amable, B., Demmou, L. and Ledezma, I., 2010. Product market regulation, innovation, and distance to frontier, 19(1), pp. 117-159.
Anderson, J.E. and van Wincoop, E., 2004. Trade costs, Journal of Economic Literature, Vol. 42(3), pp. 691-751.
Anderton, B., 1999. UK Trade Performance and the Role of Product Quality, Innovation and Hysteresis: Some Preliminary Results. Scottish Journal of Political Economy 46(5), pp. 570-595.
Angelini, P. and Generale, A., 2008. On the Evolution of Firm Size Distributions, The American Economic Review, März 2008, (98), pp. 426-438.

205
Anton, J. J. and Yao, D. A., 2004. "Little Patents and Big Secrets: Managing Intellectual Property", The RAND Journal of Economics, Spring 2004, 35(1), S. 1-22.
Antràs, P., 2005. Incomplete Contracts and the Product Cycle. The American Economic Review 95(4), pp. 1054-1073.
Arranz, N. and De Arroyabe, J.C., 2009. Internationalization Process of Spanish Small Firms: Strategies, Transactions and Barriers. International Small Business Journal. 27 pp. 420-441.
Archibugi, D. and Michie, J., 1995. The globalisation of technology: a new taxonomy. Cambridge Journal of Econometrics 19(1), pp. 121-140.
Arnold, J. M. and Hussinger, K., 2005. Export Behavior and Firm Productivity in German Manufacturing. A Firm-Level Analysis. Review of World Economics 141(2), pp. 219-243.
Arrow, K. J., 1962. The economic implications of learning by doing. The review of economic studies 29(3), pp. 155–173.
Arrow, K. J., 1962. Economic Welfare and the Allocation of Resources for Innovation, in Nelson, R.R. (ed.), The Rate and Direction of Inventive Activity, Princeton University Press.
Arthur, W. B., 1983. Competing technologies and lock-in by historical small events: the dynamics of allocation under increasing returns. International Institute for Applied Systems Analysis Paper WP-83-92, Laxenburg, Austria.
Arundel, A., 1997. Enterprise strategies and Barriers to innovation, in: Arundel, A., Garrelfs, R. (eds.) Innovation Measurement and Policies, Vol. 50, EIMS Publication, European Commission, pp. 101-108.
Assink, M., 2006. The inhibitors of disruptive innovation capability: a conceptual model, European Journal of Innovation Management, vol. 9, no.2, pp. 215-233.
Ateljevic, J., 2004. Enhanced Transition through Outward Internationalsation: Outward FDI by Slowenian Firms. International Small Business Journal, 22:6, pp. 619-622.
Audretsch, D. and Vivarelli, M., 1994. Small Firms and R&D Spillovers: Evidence from Italy, Revue d’Economie Industrielle, 67, pp. 225 -237.
Autio, E., Kronlund, M. and Kovalainen, A., 2007. High-Growth SME Support Initiatives in Nine Countries: Analysis, Categorization, and Recommendations. Report prepared for the Finnish Ministry of Trade and Industry. MTI Publications, Helsinki.
Averch, H. and Johnson, L., 1962. Behavior of the firm under regulatory constraint. In: American Economic Review, 52, pp. 1052–1069.
Aw, B. Y, Roberts, M. J. and Xu, D. Y., 2008. R&D investments, exporting, and the evolution of firm productivity. American Economic Review 98(2): 451–456.
Aw, B. Y, Roberts, M. J. and Winston, T., 2005. The Complementary Role of Exports and R&D Investments as Sources of Productivity Growth. NBER Working Paper 11774.
Aw, B. Y., Roberts, M. J. and Winston, T., 2007. Export market participation, investments in R&D and worker training, and the evolution of firm productivity. The World Economy 30(1), p. 83.
Aw, B. Y, Chung, S. and Roberts, M. J., 2000. Productivity and turnover in the export market. Micro-level evidence from the Republic of Korea and Taiwan (China). The World Bank Economic Review 14(1), p. 65.
Bakels, R. and Hugenholtz, P. B., 2002. The Patentability of Computer Programs, http://scholar.google.at/scholar?q=Bakels,+R.+and+P.+B.+Hugenholtz+(2002).+%E2%80%9CThe+Patentability+of+Computer+Programs&hl=de&as_sdt=0&as_vis=1&oi=scholart (accessed on August 4th 2010).
Baldwin J. and Lin Z., 2002. Impediments to advanced technology adoption for Canadian manufacturers, Research Policy, 31, pp. 1-18.
Baldwin, J. R and Gu, W., 2003. Export-market participation and productivity performance in Canadian manufacturing. Canadian Journal of Economics 36(3), pp. 634–657.
Baldwin, J. R. and Gu, W., 2004. Trade liberalization: Export-market participation, productivity growth, and innovation. Oxford Review of Economic Policy 20(3), p. 372.
Barras R., 1990. Interactive innovation in financial and business services: the vanguard of the service revolution, Research Policy, 19.3, pp. 215-237
Barras, R., 1986. Towards a theory of innovation in services, Research Policy 15, pp. 161-173
Barrios, S., Görg, H. and Strobl, E., 2001. Explaining Firms' Export Behaviour: The Role of R&D and Spillovers. FEDEA Working Paper 12. Available at: http://papers.ssrn.com/sol3/papers.cfm?abstract_id=286713 [accessed April 13, 2010].
Barlevy, G., 2007. On the Cyclicality of Research and Development, The American Economic Review, 97(4), pp. 1131-1164.
Basile, R., 2001. Export behaviour of Italian manufacturing firms over the nineties: the role of innovation. Research policy 30(8), pp. 1185–1201.
Bassanini, A. and Ernst, E., 2002. Labour Market Institutions, Product Market Regulation, and Innovation: Cross Country Evidence, ECO/WKP(2002)2, OECD.
206
Bastos, P. and Silva. J., 2010. The quality of a firm's exports: Where you export to matters. Journal of International Economics 82, pp. 99–111.
Basu, S. and Weil, D.N., 1998. Appropriate technology and growth. Quarterly Journal of Economics 113, 1025–1054.
Baumol, W.J., 2007. Small enterprises, Large Firms, Productivity Growth and Wages, Journal of Policy Modelling, doi: 10.1016/j.jpolmod.2008.04.002.
Beck, T., Demirguc-Kunt, A. and Levine, R., 2010. Financial Institutions and Markets across Countries and over Time: The Updated Financial Development and Structure Database, The World Bank Economic Review, 24(1), pp. 77–92.
Becker, S. O. and Egger, P. H., 2009. Endogenous product versus process innovation and a firm’s propensity to export. Empirical Economics, pp. 1–26.
Beerepot, M. and Beerepot, N. 2007. Government regulation as an impetus for innovation: Evidence from energy performance regulation in the Dutch residential building sector, Energy Policy 35 (2007), pp. 4812-4825.
Bentolila, S., Boeri, T. and Cahuc, P., 2010. Ending the Scourge of Dual Labour Markets. Vox http://www.voxeu.org/index.php?q=node/5289, July 12th 2010.
Berman, E., Bound, J. and Machin, S., 1998. Implications of Skill-Biased Technological Change: International Evidence*, Quarterly Journal of Economics, 1 November 1998, 113(4), pp. 1245-1279.
Bernard, A. B. and Jensen, B., 1999. Exceptional exporter performance: cause, effect, or both?. Journal of International Economics 47(1), pp. 1–25.
Bessen, J. and Maskin, E., 2002. Sequential Innovation, Patents, and Imitation, MIT Working Paper Department of Economics, (revised version), http://ideas.repec.org/p/ads/wpaper/0025.html (zugegriffen 5 August 2010).
Bessen, J. and Meurer, M. J., 2008. Patent failure: How judges, bureaucrats, and Lawyers put innovators at risk. Princeton: Princeton University Press.
Bigsten, A., Collier, P., Dercon, S., Fatchamps, M., Gauthier, B., Gunning, J.W., Habarurema, J., Oduro, A., Oostendorp, R., Pattillo, C., Söderbom, M., Teal, F. and Zeufack, A., 2000. Exports and Firm-Level Efficiency in African Manufacturing. Working Papers Series.
BIS, 2010. Internationalisation of Innovative and High Growth SMEs. BIS Economics Paper 5.
Blalock, G. and Gertler, P. J., 2004. Learning from exporting revisited in a less developed setting. Journal of Development Economics 75(2), pp. 397–416.
Blanchard, O.J. and Giavazzi, F., 2003. Macroeconomic Effects of Regulation and Deregulation in Goods and Labor Markets. Quarterly Journal of Economics, 118, pp. 879-908.
Bleaney, M., and Wakelin, K., 2002. Efficiency, Innovation and Exports, Oxford Bulletin of Economics and Statistics 64(1), pp. 3–15.
Blind, K., 2004. The Economic of Standards: Theory, Evidence, Policy, Edward Elgar, Cheltenham.
Blind, K., 2010. The Influence of Regulations on Innovation: A Quantitative Assessment for OECD Countries, mimeo.
Blind, K., Grupp, H., Hullmann, A. and Jungmittag, A., 2000. Gesamtwirtschaftlicher Nutzen der Normung. Zusammenfassung der Ergebnisse. Wissenschaftlicher Endbericht mit praktischen Beispielen. Teil B: Volkswirtschaftlicher Nutzen, Berlin: Beuth, 2000.
Boldrin, M. and Levine, D. K., 2002. The case against intellectual property, Papers and Proceedings, American Economic Review, pp. 209–212.
Bond, S., Elston, J. A., Mairesse, J. and Mulkay, B., 2003. Financial Factors and Investment in Belgium, France, Germany, and the United Kingdom: A Comparison Using Company Panel Data, Review of Economics and Statistics 85(1), pp. 153-165.
Booth, A. L., 1991. Job-related formal training: Who receives it and what is it worth. Oxford Bulletin of Economics and Statistics, 1991, 53(3), pp. 281-294.
Booth, A. L. and Snower, D. J. 1996. Acquiring skills: market failures, their symptoms and policy responses. Cambridge: Cambridge University Press.
Booth, A. and Satchell, S., 1996. On apprenticeship qualifications and labour mobility. In: Booth, Snower, 1996, pp. 285-297.
Borras, S., 2003. The Innovation Policy of the European Union. Cheltenham: Edward Elgar, 2003.
Bound, J., Cummins, C., Griliches, Z., Hall, B.H. and Jaffe, A., 1984. Who does R&D and who patents, in Griliches, Z. (ed.), R&D Patents and Productivity, Chicago, University of Chicago Press for the NBER.
Bourreau, M. and Dogan, P., 2001. Regulation and innovation in the telecommunications industry. Telecommunications Policy 25, pp. 167-184.
Brennan L. and Garvey, D., 2009. The role of knowledge in internationalization, in: Research in International Business and Finance 23, pp. 120–133.
207
Breschi, S., Malerba, F. and Orsenigo, L., 2000, Technological regimes and Schumpeterian pattern of innovation, Economic Journal 110, pp. 388- 410. (Cohen and Klepper, 1996).
Brouwer, E., Kleinknecht, A. and Reijnen, J.O.N., 1993. Employment growth and innovation at the firm level. Journal of Evolutionary Economics 3(2), pp. 153–159.
Brouwer, E. and Kleinknecht, A., 1993. Technology and a firms export intensity: the need for adequate innovation measurement. Konjunkturpolitik 39(5), pp. 315–325.
Burgel, O. and Murray, G.C., 2000. The International Market Entry Choices of Start-Up Companies in High-Technology Industries. Journal of International Marketing, 8 (2), pp. 33-62.
Burgel, O. and Murray, G. C., 2000. The international market entry choices of start-up companies in high-technology industries. Journal of International Marketing 8(2), pp. 33–62.
Buxton, T., Mayes, D. and Murfin, A., 1991. UK - Trade Performance and R&D, Economics of Innovation and New Technology 1(3), p. 243.
Canepa, A. and Stoneman, P., 2008. Financial constraints to innovation in the UK: evidence from CIS2 and CIS3, Oxford Economic Papers, Oktober 2008, 60(4), pp.. 711-730.
Cantwell, J.A., 1995. The globalization of technology: what remains of the product cycle model? Cambridge Journal of Economics 19, pp. 155-174.
Cantwell, J., 1995. The Globalisation of Technology: What Remains of the Product Cycle Model?, Cambridge Journal of Economics, 19(1), pp. 155-74.
Carpenter, D., 2010. Reputation and Power: Organizational Image and Pharmaceutical Regulation at the FDA, Princeton University Press.
Casper, St. and Matraves, C., 2003. Institutional Frameworks and Innovation in the German and UK Pharmaceutical Industry. Research Policy 32: pp. 1865–1897.
Cassiman, B. and Golovko, E., 2007. Innovation and the Export-productivity Link, CEPR Discussion Papers 6411.
Cassiman, B. and Martınez-Ros, E. 2007. Product Innovation and Exports. IESE working paper, mimeo.
Castellani, D., 2002. Export behavior and productivity growth. Evidence from Italian manufacturing firms. Review of World Economics 138(4), pp. 605–628.
Causer, G. and Jones, C., 1993. Responding to 'Skill Shortages': Recruitment and Retention In A High Technology Labour Market, Human Resource Management Journal, 1993, 3(3), pp. 1-20.
Cave, M. and Crowther, P., 1996. Determining the Level of Regulation in EU Telecommunications: A Preliminary Assessment, Telecommunications Policy, Vol. 20, No. 10, December 1996.
Cave, M. and Crowther, P., 1996. Regulating interconnection charges from a competition law perspective. ITS XIth biennial conference, Seville, Spain.
Chaplin, H., 2009. An Investigation of the Barriers to Internationalisation Faced by young Technology Intensive Firms, Paper presented at the High Technology Small firms Conference 28-29 May 2009, Manchester Business School, Manchester.
Charlton,D. and Perloff, P., 2000. Modern Industrial Organization, 3rd Ed., Reading, MA: Addison Wesley Longman Inc.
Chellaraj, G., Maskus, K. E. and Mattoo, A., 2008. The Contribution of International Graduate Students to US Innovation, Review of International Economics, 16(3), pp. 444-462.
Chiesa, G. and Denicolò, V., 2001. Patents, Prices and Optimal Innovation Policy. University of Bologna Working Papers.
CIRCA, University of Athens, PricewatherhouseCoopers, Evaluation of Research, technological development and innovation related actions under Structural Funds (Objective 1 and 6), European Commission, DG Regio, 1999.
Cleff, T., Grimpe, C., Rammer, C., Schmiele, A. and Spielkamp, A., 2008. Analysis of regulatory and policy issues influencing sectoral innovation patterns - Horizontal report. Brussels: Europe Innova Sectoral Innovation Watch, DG Enterprise.
Clerides, S. K, Lach, S. and Tybout, J. R., 1998. Is Learning by Exporting Important? Micro-Dynamic Evidence from Colombia, Mexico, and Morocco. Quarterly Journal of Economics 113(3), pp. 903–947.
Coad, A. and Hölzl W., 2010. Firm growth: Empirical Studies, WIFO Working Paper 361.
Cohen, W. M. and Levinthal, D. A., 1990. Absorptive Capacity: A New Perspective on Learning and Innovation, Administrative Science Quarterly 35, 128–152.
Cohen, W.M., and Klepper, S., 1994. Firm size and the nature of innovation within industries: the case of process and product R&D, Review of Economics and Statistics, 788 (2), pp. 232 243.
Comin, D. and Gertler, M., 2006. Medium-Term Business Cycles, The American Economic Review 96, pp. 523-551.
208
Copenhagen Economics and The IPR Company, 2009. Are IPR a Barrier to the Transfer of Climate Change Technology? Report commissioned by DG Trade, Copenhagen.
Cosh, A., Cumming, D. and Hughes, A., 2009. Outside Enterpreneurial Capital*, The Economic Journal, 119(540), pp. 1494-1533.
Crafts, N., 2006. Regulation and productivity performance, Oxford Review of Economic Policy, 22, pp. 186-202.
Crepon, B., Duguet, E. and Mairesse, J., 1998. Research, innovation, and productivity: an econometric analysis at the firm level. Economics of Innovation and New Technology 7(2), pp. 115-158.
Crespi, G. and Patel, P., 2008. Innovation and competition: Sector level evidence. Europe Innova Sectoral Innovation Watch deliverable WP4. Brussels: European Commission, DG Enterprise.
Crick, D. and Jones, M.V., 2000. Small High-Technology Firms and International High-Technology Markets. Journal of International Marketing, 8 (2), pp. 63-85.
Crick, D. and Spence, M., 2005. The internationalisation of ‘high performing’ UK high-tech SMEs: a study of planned and unplanned strategies, in: International Business Review 14 (2005), pp. 167–185.
Criscuolo Haskel J.E. and Slaughter, M.J., 2010. Global engagement and the innovation activities of firms. International Journal of Industrial Organization 28(2), pp. 191-202.
Crowell and Moring 2006. Final Report of the Evaluation of the European Union Market Access Database, Brussels, online: http://trade.ec.europa.eu/doclib/docs/2006/november/tradoc_130518.2.pdf
D’Este, P., Iammarino, S., Savona, M. and von Tunzelmann, N., 2008. Barriers to Innovation: Evidence from the UK Community Innovation Survey. SPRU Electronic Working Paper Series.
D’Este, P., Iammarino, S., Savona, M. and von Tunzelmann, N., 2009. Revealed versus Deterring Barriers to Innovation Evidence from the 4th Community Innovation Survey (CIS4), DIUS Working Paper 09 -09, Department for innovation, University and Skills.
Damijan, J. P., Kostevc, C. and Polanec, S., 2008. From innovation to exporting or vice versa? Causal link between innovation activity and exporting in Slovenian microdata. LICOS Centre for Institutions and Economic Performance Discussion Paper 204.
Damijan, J. P. and Kostevc, Č., 2008. Causal Link between Exporting and Innovation Activity, DYNREG Working Papers 22.
Damijan, J. P. and Kostevc, Č. 2010. Learning from trade through innovation: Causal link between imports, exports and innovation in Spanish microdata. LICOS Discussion Paper Series 264/2010.
David, P. A., 1985. Clio and the Economics of QWERTY, American Economic Review (Papers and Proceedings) 75, pp. 332-37.
de Clercq, D., Sapienza, H.J. and Crijns, H., 2005. The Internationalization of Small and Medium-Sized Firms. Small Business Economics 24, pp. 409–419.
De Fraja, G., 1997. Entry, prices, and investment in regulated markets, Journal of Regulatory Economics, 11, pp. 257-270.
de la Torre, A., Gozzi, J. C. and Schmukler, S. L., 2007. Financial Development: Maturing and Emerging Policy Issues, The World Bank Research Observer, 20 März 2007, 22(1), pp. 67-102.
De Loecker, J., 2007. Do exports generate higher productivity? Evidence from Slovenia. Journal of International Economics 73(1), pp. 69–98.
Del Monte, A. and Papagni, E., 2003. R&D and the growth of firms: empirical analysis of a panel of Italian firms* 1, Research policy 32(6), pp. 1003–1014.
Delgado, M. A., Farinas, J. C. and Ruano, S., 2002. Firm productivity and export markets: a non-parametric approach. Journal of international Economics 57(2), pp. 397–422.
de Rassenfosse, G. and van Pottelsberghe de la Potterie, B., 2007. Per un pugno di dollari: a first look at the price elasticity of patents“, Oxford Review of Economic Policy 23, pp. 558-567.
de Rassenfosse, G. and van Pottelsberghe de la Potterie, B., 2009. A policy insight into the R&D-patent relationship, Research Policy 38(5), pp. 779-792.
Desai, M., Gompers, P. and Lerner, J., 2003. Institutions, Capital Constraints and Entrepreneurial Firm Dynamics: Evidence from Europe, NBER Working Paper No. 10165.
DiMasi, J., Hansen, R. and Grabowski, H., 2003. The Price of Innovation: New Estimates of Drug Development Costs. Journal of Health Economics, 22, pp. 151-185.
DIN, 2000. Economic Benefits of Standardization: Summary of Results, Berlin: Beuth Verlag GmbH and Deutsches Institut fur Normung.
Disdier, A.C. and Mayer, T., 2007. Je t’aime, moi non plus : Bilateral Opinions and International Trade. European Journal of Political Economy, 23, pp. 1140-1159.
Djankov, S., McLiesh, C. and Ramalho, R., 2006. Regulation and Growth, Working Paper, The World Bank, March 17 2006, online: http://ssrn.com/abstract=893321.
209
Doidge, C., Karolyi, G.A. and Stulz, R.M., 2007. Why do countries matter so much for corporate governance? Journal of Financial Economics 86, pp.1–39.
Dollar, D. and Kraay, A., 2003. Institutions, trade, and growth, in: Journal of Monetary Economics, 50 (1), pp. 133-162.
Dreyfuss, R. C., 2001. Examining state street bank: Developments in business method patenting. Computer und Recht International 1, pp. 1-9.
DTI, 2005. The empirical economics of standards, Department of Trade and Industry Economics Paper No. 12.
Dunning, J. H., 1988. Explaining International Production, London.
Dunning, J. H., 2000. The Eclectic Paradigm as an Envelope for Economic and Business Theories of MNE Activity. International Business Review 9(2), pp. 163–190.
Duso, T. and Seldeslachts, J., 2010. The political economy of mobile telecommunications liberalization: Evidence from the OECD countries, Journal of Comparative Economics, 38(2), pp. 199-216.
Eaton, J. and Kortum, S., 2002. Technology, geography and trade. Econometrica 70(5), pp. 1741-1779.
Ebling, G. and Janz, N., 1999. Export and Innovation Activities in the German Service Sector. ZEW Discussion Paper 99-53.
Edler, J. and Georghiou, L., 2007. Public procurement and innovation--Resurrecting the demand side, Research Policy 36, pp. 949-963.
Edquist, C., Malerba, F., Metcalfe, S., Montobbio, F. and Steinmueller, E., 2004. Sectoral systems: implications for European innovation policy. In: Malerba, F. (Ed.), Sectoral Systems of Innovation: Concepts, Issues and Analyses of Six Major Sectors in Europe. Cambridge University Press, Cambridge, pp. 427–464.
EIM Business & Policy Research, 2006. SMEs and Standardization in Europe – 23 good practices to promote the participation of craft and SME enterprises in standardization and the use of standards. Zoetermeer, the Netherlands: EIM Business & Policy Research.
Encaoua, D., Guellec, D. and Martínez, C., 2006. Patent systems for encouraging innovation: Lessons from economic analysis, Research Policy, November 2006, 35(9), pp. 1423-1440.
Encaoua, D. and Lefouili, Y., 2006. Choosing intellectual protection: imitation, patent strength and licensing, CESifo Working Papers Nr. 1715.
Erwin, K.G., 1960. Romance of Weights and Measures. New York: Viking Press.
Esteve-Pérez, S. and Rodríguez, D., 2009. The dynamics of trade and innovation: a joint approach. Mimeo. Universidad de Valencia, Universidad Complutense de Madrid.
European Commission, 2005. Strategy for the enforcement of intellectual property rights in third countries. Communication from the Commission, (2005)C 129/03.
European Commission, 2006a. Putting Knowledge into Action: A broad-based innovation strategy for the EU, Communication from the Commission, COM(2006) 502 final.
European Commission, 2006b. Delivering on the modernisation agenda for universities: education, research and innovation. Communication from the Commission, COM(2006) 208 final.
European Commission, 2006c. Global Europe – Competing in the world. A contribution to the EU's Growth and Jobs Strategy. Communication from the Commission, COM(2006) 0567, http://trade.ec.europa.eu/doclib/docs/2006/october/tradoc_130380.pdf
European Commission, 2007a. Supporting the internationalisation of SMEs: Final Report of the Expert Group, Brussels: European Commission Enterprise and Industry Directorate-General.
European Commission, 2007b. Enhancing the patent system in Europe, COM(2007) 165 final.
European Commission, 2007c. Global Europe: A Stronger Partnership to deliver market access for European Exporters. Communication from the Commission, COM(2007) 183 final. http://trade.ec.europa.eu/ doclib/docs/2007/april/tradoc_134591.pdf
European Commission, 2007d. Final Report of the Expert Group on Supporting the internationalisation of SMEs, Brussels, DG Enterprise and Industry, Accessed online 30.08.2010: http://ec.europa.eu/enterprise/policies/sme/files/support_measures/internationalisation/report_internat_en.pdf
European Commission, 2008a. A “Small Business Act” for Europe. Communication from the Commission, COM(2008) 394 final, 2008.
European Commission, 2008b. On the external dimension of the Lisbon strategy for Growth and jobs: Reporting on market access and setting the framework for more effective international regulatory cooperation, Communication from the Commission, COM (2008) 874 final.
European Commission, 2009a. Reviewing Community innovation policy in a changing world, Communication from the Commission, COM(2009) 442 final.
European Commission, 2009b. Summary Report. Cross-Border Venture Capital in the European Union. European Commission work on removing obstacles. December 2009.
210
European Commission, 2009c. Global Europe Annual Report 2009 - Implementing the Market Access Strategy, online: http://trade.ec.europa.eu/doclib/docs/2010/march/tradoc_145851.pdf.
European Commission, 2009d. IPR enforcement report 2009. SEC(2009), 1360.
European Commission, 2009e. Assessing Community innovation policies in the period 2005-2009, Communication from the Commission, SEC(2009) 1194 final.
European Commission, 2010a. Think Small First, http://ec.europa.eu/enterprise/policies/sme/small-business-act/think-small-first/ (accessed 30.08.2010).
European Commission, 2010b. Internationalisation of European SMEs, Final Report, DG Enterprise and Industry, Brussels: http://ec.europa.eu/enterprise/policies/sme/files/support_measures/internationalisation/internationalisation_sme_final_en.pdf
European Commission, 2010c. Europe 2020. A European strategy for smart, sustainable and inclusive growth. COM(2010) 2020.
European Commission, 2010d. Europe 2020 Flagship initiative Innovation Union. COM(2010) 546 final.
EVCA, 2010. EVCA Venture Capital White paper, 2010.
Falk, R., Hölzl, W. and Leo, H., 2008. On the Roles and Rationales of European STI-Policies. In: Subsidiarity and Economic Reform in Europe, Springer Berlin Heidelberg.
Fang, L. and Rogerson, R., 2007. Product market regulation and market work: A benchmark analysis. NBER Working Paper No. 12891.
Farrell, J. and Saloner, G., 1985. Standardization, Compatibility, and Innovation, RAND Journal of Economics, 16(1), pp. 70-83.
Farrell, J. and Saloner, G., 1988. Coordination through Committees and Markets, RAND Journal of Economics, 19(2), pp. 235-252.
Felbermayr, G.J. and Jung, B., 2008. Sorting It Out - Technical Barriers to Trade and Industry Productivity, FIW Working Paper No.14, February 2008, Vienna.
Filippetti, A., Frenz, M. and Ietto-Gillies, G., 2009. Is the innovation performance of countries related to their internationalisation? Brussels: European Commission.
Fischer, E. and Reuber, A.R., 2003. “Targeting Export Support to SMEs: Owners' International Experience as a Segmentation Basis.” Small Business Economics 20(1), pp. 69-82.
Fliess, B. and Busquets, C., 2006. The Role of Trade Barriers in SME Internationalisation”, OECD Trade Policy Working Papers, No. 45, OECD Publishing.
Francois, J., Pindyuk, O. and Woerz, J., 2008. Trade Effects of Services Trade Liberalization in the EU, IIDE discussion paper: 200808-01, Vienna.
Friederiszick, H., Tosini, N., de Véricourt, F. and Wakeman, S., 2009. An Economic Assessment of the Relationship between Price Regulation and Incentives to Innovate in the Pharmaceutical Industry, White Paper No. WP–109–03; ESMT European School of Management and Technology, 2009.
Gabel, D.J. and Huang, K.G., 2008. Promoting Innovation and the Deployment of Advanced Telecommunications Services to Businesses. Contemporary Economic Policy, 26(2), pp. 229-247.
Galia, F. and Legros, D., 2004. Complementarities between obstacles to innovation: evidence from France, Research Policy: 33, pp. 1185-1199.
Ganslandt, M. and Markusen, J. R., 2001. Standards and Related Regulations in International Trade: A Modeling Approach. NBER Working Paper No. W8346
Gatti, R., 2004. Explaining corruption: are open countries less corrupt? Journal of International Development, 16: 6, pp. 851-861.
Geels, F., 2004. From sectoral systems of innovation to socio-technical systems: insights about dynamics and change from sociology and institutional theory. Research Policy 33, pp. 897–920.
Ghazalian, P., Tamini, L., Larue, B. and Gervais, J.-P., 2007. A Gravity approach to evaluate the significance of trade liberalization in vertically-related goods in the presence of non-tariff barriers, MPRA Paper No. 2744, Online at http://mpra.ub.uni-muenchen.de/2744/
Gilbert, R. J. and Newbery, D. M. G., 1982. "Preemptive Patenting and the Persistence of Monopoly, American Economic Review, 72(3), pp. 514-26.
Gilroy, B.M., Baier, M. and Lukas, E., 2008. Small- and Medium-sized Enterprises (SMEs) in internationally operating R&D networks: recent findings and trends. International Journal of Globalisation and Small Business, Vol. 2, No. 3, pp. 325–341.
Girma, S., Greenaway, D. and Kneller. R., 2004. Entry to export markets and productivity. A microeconometric analysis of matched firms. Review of International Economics 12, pp. 855–866.
Girma, S., Görg, H. and Hanley, A., 2008. R&D and exporting: A comparison of British and Irish firms. Review of World Economics 144(4), pp. 750–773.
211
Gonzalez, P.D., 2009. The empirical analysis of the determinants for environmental technological change: A research agenda. In: Ecological Economics, 68 (3), pp. 861–878.
Gorodnichenko, Y. and Schnitzer, M., 2010. Financial constraints and innovation: Why poor countries don't catch up, National Bureau of Economic Research Working Paper Series, März 2010, (No. 15792), http://www.nber.org/papers/w15792 (zugegriffen 5 Juli 2010).
Goto, A. and Suzuki, K., 1989. R & D capital, rate of return on R & D investment and spillover of R & D in Japanese manufacturing industries. The Review of Economics and Statistics 71(4), pp. 555–564.
Grande, E., 2000. Multi-level governance: institutionelle Besonderheiten und Funktionsbedingungen des europäischen Mehrebenensystems, in E. Grande and M. Jachtenfuchs (eds.), Wie problemlösungsfähig ist die EU? Regieren im europäischen Mehrebenensystem. Nomos, Baden Baden, pp. 11-30.
Green, F., Machin, S. and Wilkinson, D., 1998. The Meaning and Determinants of Skills Shortages, Oxford Bulletin of Economics and Statistics, 60(2), pp. 165-187.
Greenwald, B. and Sharkey., W., 1989. The Economics of Deregulation of Local Exchange Telecommunications, Journal of Regulatory Economics, Vol. 1, pp. 319-339
Greenaway, D. and Kneller, R., 2007. Firm heterogeneity, exporting and foreign direct investment: A survey. The Economic Journal 117, pp. F134-F161.
Greenhalgh, C., 1990. Innovation and trade performance in the UK. Economic Journal 100, pp. 105-118.
Griffith, R., Harrison, R. and Simpson, H., 2006. Product Market Reform and Innovation in the EU, The Institute for Fiscal Studies Working Paper WP06/17.
Griliches, Z., Mairesse, J., 1984. “Productivity and R&D at the Firm Level.” In R&D, Patents, and Productivity, Chicago: University of Chicago Press, p. 339-374.
Groom A., 1960. How we Weigh and Measure. London: Routledge & Kegan Paul
Grossman, G.M. and Helpman, E., 1995. Technology and trade. In: Handbook of International Economics, editors. G.M. Grossman und K. Rogoff. Amsterdam: Elsevier.
Gruber, W. H., Mehta, D. and Vernon, R., 1967. The R&D Factor in International Trade and Investment of U.S. Industries. Journal of Political Economy 75, pp. 20-37.
Guiso, L., Sapienza, P. and Zingales, L., 2004. Cultural Biases in Economic Exchange. NBER Working Paper 11005, Cambridge.
Haeussler, C., Harhoff, D., Mueller, E., 2009. To Be Financed or Not…-The Role of Patents for Venture Capital Financing, CEPR Discussion Papers, (7115).
Hall, B. H., 1987. The relationship between firm size and firm growth in the US manufacturing sector. The Journal of Industrial Economics 35(4), pp. 583–606.
Hall, B. H., 1992. Research and Development at the Firm Level: Does the Source of Financing Matter? NBER Working Paper No. 4096 (June).
Hall, B. H., 2009. Business and Financial Method Patents, Innovation, and Policy, NBER Working Paper, (14868), http://www.nber.org/papers/w14868.
Hall, B. H., 2002. The Financing of Research and Development, Oxford Review of Economic Policy 18(1), pp. 35-51.
Hall, J. and Kerr, R., 2003. Innovation dynamics and environmental technologies: the emergence of fuel cell technology. Journal of Cleaner Production 11, pp. 459–471.
Hall, P. A. and Soskice, D. W., 2001. Varieties of capitalism: the institutional foundations of comparative advantage, Oxford University Press.
Harhoff, D., 2006. Intellectual property rights in Europe–where do we stand and where should we go? Contribution to the project: Globalisation Challenges for Europe and Finland.
Harris, R.I.D. and Li, Q.C., 2005. Establishment Level Empirical Study Of Links Between Exporting, Innovation, and Productivity. UKTI.
Harris, R., and Li, Q.C., 2009. Exporting, R&D, and absorptive capacity in UK establishments. Oxford Economic Papers 61(1), p. 74.
Harris, R., and Li, Q., 2007. Firm level empirical study of the contribution of exporting to UK productivity growth.
Hartmann, P., Maddaloni, A., and Manganelli, S., 2003. The Euro-area financial system: structure, integration, and policy initiatives, Oxford Review of Economic Policy, 19(1), p. 180.
Haskel, J. and Martin, C., 1996. Skill shortages, productivity growth and wage inflation. In Booth A., and Snower D., (eds). Acquiring Skills: Market Failures, their Symptoms and Policy Responses. Cambridge University Press., pp. 147-174.
Haskel, J. and Martin, C., 2001. Technology, wages, and skill shortages: evidence from UK micro data, Oxford Economic Papers, Oktober 2001, 53(4), pp. 642-658.
212
Haskel, J. and Martin, C., 1993. The Causes of Skill Shortages in Britain, New Series, Oxford Economic Papers, Oktober 1993, 45(4), pp. 573-588.
Haeussler, C., Harhoff, D. and Müller, E., 2009. To Be Financed or Not…-The Role of Patents for Venture Capital Financing, CEPR Discussion Papers No. 7115.
Heckman, J.J., 2000. Policies to foster human capital, Research in Economics, März 2000, 54(1), pp. 3-56.
Henrekson, M. and Johansson, D., 2010. Gazelles as Job Creators - A Survey and Interpretation of the Evidence, Small Business Economics, 35(2), pp. 227-244.
Hessels, J. and Terjesen, S., 2010. Resource dependency and institutional theory perspectives on direct and indirect export choices, in: Small Business Economics, Vol. 34, pp. 203–220.
Hessels, S.J.A., 2007. Innovation and international involvement of Dutch SMEs. International Journal of Entrepreneurship and Small Business 4(3), pp. 234–255.
Himmelberg, C. P. and Peterson, B.C., 1994. R&D and Internal Finance: A Panel Study of Small Firms in High-Tech Industries, Review of Economics and Statistics 76, pp. 38-51.
Hirsch, S. and Bijaoui, I., 1985. R&D intensity and export performance: a micro view, Review of World Economics 121(2), pp. 238–251.
Hofstede, G., 2001. Culture’s Consequences: comparing values, behaviors, institutions, and organizations across nations. Thousand Oaks, London, New Delhi: Sage Publications.
Høj, J., Jimenez, M., Maher, M., Nicoletti, G. and Wise, M., 2007. Product Market Competition in the OECD Countries – Taking Stock and Moving Forward, OECD Economics Department, Working Papers No. 575.
Hollanders, H. and Arundel, A., 2007. Differences in socio-economic conditions and regulatory environment: explaining variations in national innovation performance and policy implications, December 2007, INNO-Metrics Thematic Paper.
Hollenstein, H., 2005. Determinants of International Activities: Are SMEs Different? Small Business Economics 24, pp. 431-450.
Hölzl, W., 2006. Cohesion and excellence. Two ways to a better Europe? Tip – technology, information, policy consulting, Working Paper April 2006.
Hölzl W. and Reinstaller, A., 2007. The impact of technology and demand shocks on structural dynamics. Evidence from Austrian manufacturing. Structural Change and Economic Dynamics 18 (2), pp. 145-166.
Hölzl, W. and Reinstaller, A., 2008. Market Structure: Sectoral Indicators. In M. Peneder (editor). Sectoral Growth Drivers and Competitivness in the European Union. Luxemburg: Publication Office of the European Communities.
Hölzl W. and Reinstaller, A., 2010. On the heterogeneity of sectoral growth and structural dynamics: Evidence from Austrian manufacturing industries. Forthcoming in Applied Economics.
Hölzl, W. and Bonin, H., 2010. The Links between Job Creation, Innovation, Education and Training: An Assessment of Policies Pursued at EU Level, European Parliament.
Hölzl, W. and Friesenbichler, K., 2008. Gazelles. Final Sector Report for the Europe Innova – Innovation Watch Project.
Hölzl, W., and Friesenbichler, K., 2010. High-growth firms, innovation and the distance to the frontier. Economics Bulletin 30(2), pp. 1016-1024.
Horvath, G.T. and Janger, J., 2008. Zwischenbilanz der Internationalisierungsoffensive "Go International", Update 2008. Wien: WIFO.
Huber, P., Reinstaller, A., Unterlass, F. and Ebersberger, B., 2010. Study on mobility patterns and career paths of EU researchers: Industrial researcher mobility study. Prepared for the European Commission, DG Research Directorate C.
Hudson, J. and Jones, P., 1997. The Gains of Standardization from Reduced Search Costs, in M. J. Holler and E. Niskanen, (eds.) EURAS Yearbook of Standardization Volume 1, Munich: Munich Institute of Integrated Studies.
Hyytinen, A. and Toivanen, O., 2005. Do financial constraints hold back innovation and growth?: Evidence on the role of public policy, Research Policy, 34(9), pp. 1385–1403.
Iacovone, L. and Javorcik, B.S., 2008. Multi-product exporters: Diversification and micro-level dynamics. World Bank Working Paper 4723.
Iammarino, S., Sanna-Randaccio, F. and Savona, M., 2007. The perception of obstacles to innovation. Multinational and domestic firms in Italy. BETA Working Paper 2007-12, Strasbourg.
IPR Expert Group, 2007. A Memorandum on removing barriers for a better use of IPR by SMEs. Pro INNO Europe, European Commission DG Enterprise and Industry, http://www.proinno-europe.eu/ NWEV/uploaded_documents/IPR_Expert_group_report_final_23_07_07.pdf.
Isgut, A., 2001. What's Different about Exporters? Evidence from Colombian Manufacturing. The Journal of Development Studies 37(5), pp. 57-82.
Isgut, A. and Fernandes, A., 2007. Learning-by-Exporting Effects: Are They for Real? MPRA Paper 3121.
213
Ito, K. and Pucik, V., 1993. R&D Spending, Domestic Competition, and Export Performance of Japanese Manufacturing Firms. Strategic Management Journal 14(1), pp. 61-75.
Jaffe, A. and Palmer, K., 1997. Environmental regulation and innovation: A panel data study, Review of Economics and Statistics 79, pp. 610-619
Jaffe, A.B. and Lerner, J., 2004. Innovation and its discontents: how our broken patent system is endangering innovation and progress, and what to do about it, Princeton University Press.
Janger, J., 2009. Rahmenbedingungen. Report 1 of the Evaluation of Government Funding in RDTI from a Systems Perspective in Austria. Commissioned by the Federal Ministry for Transport, Innovation and Technology, and the Federal Ministry of Economic Affairs, Family and Youth
Jaumotte, F. and Pain, N., 2005. From Ideas to Development: The Determinants of R&D and Patenting, OECD, Economics Department, Dezember 2005, http://ideas.repec.org/p/oec/ecoaaa/457-en.html (accessed October 9th 2010).
Johanson, J. and Wiedersheim-Paul, F., 1975. “The Internationalization of the Firm. Four Swedish Cases.” Journal of Management Studies 12: 305-322.
Johanson, J. and Vahlne, J. E., 1977. The internationalization process of the firm. A model of knowledge development and increasing foreign market commitments. Journal of International Business Studies 8(1), pp. 23–32.
John, K., Litov, L. and Yeung, B., 2008. Corporate Governance and Risk-Taking, in: Journal of Finance, Vol. 63, No. 4, pp. 1679-1728.
Jovanovic, B., 1979. Job matching and the theory of turnover, Journal of Political Economy, 87(5).
Jovanovic, B. and Nyarko, Y., 1996. Learning by Doing and the Choice of Technology, Econometrica, 64(6), pp. 1299-1310.
Jungmittag A., Blind, K. and Grupp, H., 1999. Innovation, Standardisation and the Long-term Production Funtion: A Co-integration Analysis for Germany 1960-1996, Zeitschrift für Wirtschafts-und-Sozialwissenschaften, 119, pp. 205-222.
Kafouros, M.I., Buckley, P.J., Sharp, J.A. and Wang, C., 2008. The role of internationalization in explaining innovation performance. Technovation 28(1-2), pp. 63-74.
Karagozoglu, N. and Lindell, M., 1998. Internationalization of Small And Medium-Sized Technology-Based Firms: An Exploratory Study, in: Journal of Small Business Management, Vol. 36, pp. 44-59.
Katz M. L. and Shapiro, C., 1986. Technology Adoption in the Presence of Network Externalities, Journal of Political Economy, 94 (4), pp. 822-841
Keesing, D.B., 1967. The Impact of Research and Development on United States Trade. The Journal of Political Economy 75(1), pp. 38-48.
Keller, W., 1998. Are international R&D spillovers trade-related? Analyzing spillovers among randomly matched trade partners. European Economic Review 42(8), pp. 1469–1481.
Keller, W., 2004. International Technology Diffusion, Journal of Economic Literature, 42, pp. 752-782
Kemp, R., 1998. Environmental regulation and innovation: Key issues and questions for research, in: F. Leone and J. Hemmelskamp, Seville, pp. 12–39.
Kemp, R., 2000. Technology and environmental policy—innovation effects of past policies and suggestions for improvement. In: OECD Proceedings: Innovation and the Environment. OECD, Paris, pp. 35–61.
Kemp, R., Smith, K. and Becher, G., 2000. How should we study the relationship between environmental regulation and innovation?, in JRC-IPTS and Enterprise DG, ed.: The impact of EU regulation on innovation of European
Keupp, M. and Gassmann, O., 2009. The Past and the Future of International Entrepreneurship: A Review and Suggestions for Developing the Field. Journal of Management 2009; 35; pp. 600-633.
Klapper, L., Laeven, L. and Rajan, R., 2006. Entry regulation as a barrier to entrepreneurship, Journal of Financial Economics 82, pp. 591-629.
Klemperer, P., 1987a. Markets with Consumer Switching Costs, Quarterly Journal of Economics, pp. 375-394.
Klemperer, P., 1987b. The Competitiveness of Markets with Switching Costs, RAND Journal of Economics, 18 (1), pp. 138-150
Klette, T.J. and Furre, S.E., 1998. Innovation and Job Creation in a Small Open Economy–Evidence from Norwegian Manufacturing Plants 1982-1992. Economics of Innovation and New Technology 5(2-4), pp. 247–272.
Klette, T. and Griliches Z., 2000. Empirical patterns of firm growth and R&D investment: A quality ladder model interpretation. Economic. Journal 110:363-87.
Kneller, R. and Pisu, M., 2007. Export Barriers: What are They and Who Do They Matter To? University of Nottingham Working Paper No. 2007/12.
Knight, G.A. and Cavusgil, S.T., 1996. The born global firm: A challenge to traditional internationalization theory. Advances in international marketing 8(1), pp. 11–26.
214
Knight, G.A., Madsen, T.K. and Servais, P., 2004. An inquiry into born-global firms in Europe and the U.S.A. Int. Market. Rev. 21, pp. 645–665.
Kölling, A., 2002. Fachkräftebedarf als betriebliches Matching-Problem (Demand for qualified employees as a matching-problem for firms), Mitteilungen aus der Arbeitsmarkt- und Berufsforschung, 35(4), pp. 566-579.
Kraay, A., 1999. Exportations et performances economiques. Etude d'un panel d'enterprises chinoises. Revue d'économie du développement (1-2), pp. 183–207.
Krueger, D. and Kumar, K.B., 2004. US-Europe differences in technology-driven growth: quantifying the role of education, Journal of Monetary Economics, Januar 2004, 51(1), pp. 161-190.
Krugman, P., 1998. What's new about the new economic geography? Oxford Review of Economic Policy, 14(2), pp. 7-17.
Kumar, N. and Siddharthan, N.S., 1994. Technology, firm size and export behaviour in developing countries: the case of Indian enterprises. Journal of Development Studies 31(2), pp. 289–309.
Lachenmaier, S. and Wössmann, L., 2006. Does innovation cause exports? Evidence from exogenous innovation impulses and obstacles using German micro data. Oxford Economic Papers 58(2), p. 317.
Lancet, The, 2004. Editorial, The Lancet, 364 September 25, 2004, p. 1100.
Lefebvre, É., Lefebvre, L.A. and Bourgault, M., 1998. R&D-Related Capabilities as Determinants of Export Performance. Small Business Economics 10(4), pp. 365-377.
Lecraw D. J., 1987. Japanese Standards: A Barrier to Trade? in H.L. Gabel (ed.) Product Standardisation and Competitive Strategy, Amsterdam: North Holland, pp. 29-46
Leiponen, A., 2005. Skills and innovation, International Journal of Industrial Organization, Juni 2005, 23(5-6), pp.. 303-323.
Lejpras, A., 2009. Determinants of Internationalization: Differences between Service and Manufacturing SMEs, Deutsches Institut für Wirtschaftsforschung Discussion Paper Series 886.
Leland, H. E., 1979. Quacks, Lemons, and Licensing: a Theory of Minimum Quality Standards, Journal of Political Economy, 87, pp. 1328-1346
Lengrand, L. and Associés, PREST, ANRT, 2002. Innovation tomorrow - Innovation policy and the regulatory framework: Making innovation an integral part of the broader structural agenda, Innovation papers No 28, (Directorate-General for Enterprise, Luxembourg).
Leonidou, L., 2004. An Analysis of the Barriers Hindering Small Business Export Development. Journal of Small Business Management, 42:3, pp. 279-302.
Leonidou, L.C., Katsikeas, C.S. and Piercy, N.F., 1998. Identifying managerial influences on exporting: Past research and future directions. Journal of International Marketing, Vol. 6, No. 2, pp. 74-92.
Lerner, J., 2009. Boulevard of broken dreams: why public efforts to boost entrepreneurship and venture capital have failed--and what to do about it, Princeton University Press, 20 Oktober 2009.
Liebowitz, S. J. and Margolis, S.E., 1990. The fable of the keys, Journal of Law and Economics 33, pp. 1-25
Liebowitz, S.J. and Margolis, S.E., 1994. Network Externality: an Uncommon Tragedy, Journal of Economic Perspectives, vol. 8(2), pp. 133-150
Lileeva, A. and Trefler, D., 2007. Improved Access to Foreign Markets Raises Plant-Level Productivity... For Some Plants. NBER Working Paper W13297. Available at: http://papers.ssrn.com/sol3/papers.cfm?abstract_id=1005900 [Zugegriffen April 13, 2010].
Linders, G.J., Slangen, A., de Groot, H. and Beugelsdijk, S., 2005. Cultural and Institutional Determinants of Bilateral Trade Flows. Tinbergen Institute Discussion Paper TI 2005-074/3.
Llobet, G., Hopenhayn, H. and Mitchell, M., 2006. Rewarding sequential innovators, patents, prises and buyouts. Federal Reserve Bank of Minneapolis, 2000, 273(Research Department Staff Report).
López, R.A., 2005. Trade and growth: Reconciling the macroeconomic and microeconomic evidence. Journal of Economic Surveys 19(4), pp. 623.
López Rodríguez, J. and García Rodríguez, R., 2005. Technology and export behaviour: A resource-based view approach. International Business Review 14, pp. 539–557.
Los, B. and Timmer, M.P., 2005. The appropriate technology explanation of productivity growth differentials: An empirical approach Journal of Development Economics 77 (2005), pp. 517–531.
Lu, J.W. and Beamish, P.W., 2001. The internationalization and Performance of SMEs, in: Strategic Management Journal 22(6-7), pp. 565-586.
Lynch, L.M., 1992. Private-Sector Training and the Earnings of Young Workers, The American Economic Review, März 1992, 82(1), pp. 299-312.
215
Lyon, T. and Huang, H., 1995. Asymmetric regulation and incentives for innovation. Industrial and Corporate Change, 4(4), pp. 769-776.
Machin, S. and McNally, S., 2007. Tertiary education systems and labour markets.
Madsen, T.K. and Servais, P., 1997. The internationalization of born globals: an evolutionary process? International Business Review, Vol. 6 No.6, pp. 551-581.
Majocchi, A., Bocchiocchi, E. and Mayrhofer, U., 2005. Firm size, business experience and export intensity in SMEs: A longitudinal approach to complex relationships. International Business Review 14, pp. 719–738.
Malerba, F. ed., 2004. Sectoral systems of innovation, Cambridge, Cambridge University Press.
Markusen, J.R., 1984. Multinationals, Multi-Plant Economies, and the Gains from Trade. Journal of International Economics 16, pp. 205-226.
Maskell, P. and Kebir, L., 2006. What qualifies as cluster theory? In: Asheim, B., Cooke, P., Martin, R. (Eds.), Clusters and Regional Development: Critical Reflections and Explorations. Routledge, London, pp. 30–49.
Matraves, C., 1999. Market Structure, R&D and Advertising in the Pharmaceutical Industry, Journal of Industrial Economics, 47(2), pp. 169-194
Mayer, T., Melitz, M. J. and Ottaviano, G. I.P., 2010. Market size, competition, and the product mix of exporters. National Bank of Belgium - Working Paper Research 202 (2010).
Mayer, T. and Ottaviano, G., 2007. The happy few: new facts on the internationalisation of European firms. Bruegel-CEPR EFIM2007 Report 3.
McDougall, P.P., Shane, S. and Oviatt, B.M., 1994. Explaining the formation of international new ventures: The limits of theories from international business research. Journal of Business Venturing 9(6), pp. 469–487.
Mejer, M. and Pottelsberghe, B.V., 2008. The London Agreement and the Cost of Patenting in Europe, Bruegel Working Paper (5), http://ideas.repec.org/p/eca/wpaper/2008_032.html (accessed August 2nd 2010).
Melitz, M.J., 2003. The impact of trade on intra-industry reallocations and aggregate industry productivity. Econometrica 71(6), pp. 1695–1725.
Messina, J. 2006. The role of product market regulations in the process of structural change. European Economic Review 50, pp. 1863–1890.
Melitz, M.J. and Ottaviano, G. I. P., 2008. Market Size, Trade, and Productivity. Review of Economic Studies 75(1), pp. 295-316.
Mickwitz, P., Hyvättinen, H., and Kivimaa, P., 2008. The role of policy instruments in the innovation and diffusion of environmentally friendlier technologies: popular claims versus case study experiences. Journal of Cleaner Production, 16. pp.162-170.Minkewitz et al (2008)
Middlefart-Knarvik, K. H. and Overman, H.G. 2002. Delocation and European integration: is structural spending justified? Economic Policy, 17, pp. 321-360.
Mirow, Ch., Hölzle, K. and Gemünden, H. G., 2007. Systematisierung, Erklärungsbeiträge und Effekte von Innovationsbarrieren. Journal für Betriebswirtschaftslehre, Jhg. 57, pp. 101-134.
Mohnen P., and Rosa, J., 2000. Barriers to innovation in service industries in Canada, Science and Technology Redesign Project, Research Paper 7, Statistics Canada.
Mohnen, P., Palm, F., van der Loeff, S. and Tiwari, A., 2008. Financial Constraints and Other Obstacles: are they a Threat to Innovation Activity? De Economist, 1 Juni 2008, 156(2), pp. 201-214.
Morgan, R. and Katsikeas, C., 1997. Obstacles to export initiation and expansion, in: International Journal of Management Science, Vol. 25, No.6, pp. 677-90.
Müller, E. and Zimmermann, V., 2009. The importance of equity finance for R&D activity, Small Business Economics, 1 Oktober 2009, 33(3), pp. 303-318.
Myers, S.C., 2000. Outside equity, Journal of Finance, vol. 55, pp. 1005–37.
Navaretti, B. and Schivardi, O., 2010. The global operations of European Firms, 2010.
Nicoletti, G. and Scarpetta, S., 2003, Regulation, productivity and growth, OECD evidence, Economic Policy 18, pp. 9–72.
Niederbach, P., Alexander, C. and Furlani, A., 2007. Exploratory Team Report on High-Growth Innovative SMEs, Pro Inno Europe, European Commission, DG Enterprise and Industry, http://www.innova-eu.net/docs/high-growth_innovative_SMEs1.pdf
Nguyen A.N., Jones, N., Nguyen, N.D. and Nguyen C.D., 2009. Capitalising on Innovation for Exports by the SME Sector. DEPOCEN Working Papers 15.
North, D.C., 1991. Institutions. In: The Journal of Economic Perspectives, Vol. 5, No. 1, pp. 97–112.
Nunn, N., 2007. Relationship-Specificity, Incomplete Contracts, and the Pattern of Trade, in: The Quarterly Journal of Economics, pp. 659 – 600.
216
Observatory of European SMEs Survey, 2007.
OECD, 2009. Top Barriers and Drivers to SME Internationalization. Report by the OECD Working Party on SMEs and Entrepreneurship, OECD.
Ojala, A. and Tyrväinen, P., 2007. Entry barriers of small and medium-sized software firms in the Japanese market, Thunderbird International Business Review, 49(6), pp. 689 – 705.
Oviatt, B. M. and McDougall, P.P., 1999. A Framework for Understanding Accelerated International Entrepreneurship, in: Richard W. Wright (ed.) International Entrepreneurship: Globalization of Emerging Businesses, Stamford, JAI Press, pp. 23–40.
Oviatt, B. M. and McDougall, P.P., 2004. Toward a theory of international new ventures. Journal of International Business Studies 36(1): pp. 29–41.
Oviatt, B. and McDougall, P. P., 2005. Defining International Entrepreneurship and Modeling the Speed of Internationalization. Entrepreneurship Theory and Practice 27, pp. 537–553.
Özçelik, E. and Taymaz, E., 2004. Does innovativeness matter for international competitiveness in developing countries? The case of Turkish manufacturing industries. Research Policy, 33, pp. 409–425.
Pagano, P. and Schivardi, F., 2003. Firm size distribution and growth, Scandinavian Journal of Economics, vol. 105, issue 2, pp. 255-274.
Pakes, A. and Schankerman, M., 1984. The rate of obsolescence of patents, research gestation lags, and the private rate of return to research resources. In: R&D, Patents and Productivity, eds. Zvi Griliches. Chicago: University of Chicago Press, pp. 98-112.
Paraskevopoulou, E., 2008. EU Regulation: _Implications for the Industry Government Relationship and the Pattern of Innovation EU-US Early Career Researcher Conference on Research and Innovation Studies University of Twente, Enschede, The Netherlands July 2008.
Paraskevopoulou, E., 2009. EU Regulation: a Hidden Innovation policy? PhD and Early Career Researcher ConferenceChallenges in Research and Innovation Policy Studies29th June – 2nd July 2009Manchester Institute of Innovation Research, Manchester Business School.
Paraskevopoulou, E., 2010. Co-evolution of sectoral regulation and technological innovation in the detergents industry in Europe Technical Change: History, Economics and Policy, SPRU Freeman Centre, 29-30 March 2010.
Parchomovsky, G. and Stein, A., 2008. Torts and Innovation, Michigan Law Review, pp. 285-315.
Pavitt, K., 1984. Sectoral patterns of technical change: Towards a taxonomy and a theory, Research Policy 13(6), pp. 343-373.
Peneder, M., 2007. A sectoral taxonomy of educational intensity. Empirica 34, pp. 189-212.
Peneder, M., 2008. The problem of private under-investment in innovation: A policy mind map. Technovation 28, pp. 518-530.
Peneder, M., 2010. Technological regimes and the variety of innovation behaviour: Creating integrated taxonomies of firms and sectors. Research Policy 39, pp. 323-334.
Peneder, M., 2010. Firm Growth, Schumpeterian Entrepreneurship and Venture Capital, in Cumming, D.J. (ed.), Oxford Handbook of Venture Capital, Oxford University Press (forthcoming).
Peteraf, M., 1993. The cornerstones of competitive advantage: a resource-based view, in: Strategic Management Journal, Vol. 14, No.3, pp. 179-91.
Pfeiffer, R., Burgemeister, H., Hibbert, E. and Spence, M., 1998. A comparative survey of trade fairs in the UK and Germany in three industry sectors. Journal of European Business Education, 7(2), pp. 52–69.
Pianta, M., 2005. Innovation and Employment. In Fagerberg, Mowery and Nelson (eds.), The Oxford Handbook of Innovation, Oxford: Oxford University Press, pp. 568–598.
Pittiglio, R., Sica, E. and Villa, S., 2009. Innovation and internationalization: the case of Italy. The Journal of Technology Transfer 34(6): pp. 588-602.
Pla-Barber, J. and Alegre, J., 2007. Analysing the link between export intensity, innovation and firm size in a science-based industry, in: International Business Review 16, pp. 275–293.
Pomerand, G., 2006. EU Pharmaceutical Regulation: The Politics of Policy-Making, Manchester University Press, Manchester.
Popp, D.C., Hafner, T. and Johnstone, N., 2007. Policy vs. Consumer Pressure: Innovation and Diffusion of Alternative Bleaching Technologies in the Pulp Industry. NBER Working Paper, No. 13439
Posner, R.A., 1974. Theories of Economic Regulation, Bell Journal of Economics, 5(2), pp. 335-358.
Porter, M. E., 1990. The Competitive Advantage of Nations, New York: Free Press.
Porter, M.E. and van der Linde, C., 1995. Toward a New Conception of the Environment–Competitiveness Relationship. In: Journal of Economic Perspectives, 9 (4), pp. 97–118.Posner 1974).
217
Rajan, R.G. and Zingales, L., 1998. Financial Dependence and Growth, The American Economic Review, Juni 1998, 88(3), pp. 559-586.
Rajan, R.G. and Zingales, L., 2001. Financial Systems, Industrial Structure, and Growth, Oxford Review of Economic Policy 17(4), pp. 467-482.
Rauch, J.E., 1999. Networks versus Markets in International Trade. Journal of International Economics. 48, pp. 7-35.
Rauch, J., 2001. Business and social networks in international trade. Journal of Economic Literature 39, pp. 1177–1203.
Rauch, J. E. and Trindade, V., 2002. Ethnic Chinese networks in international trade. Review of Economics and Statistics, Vol. 84, pp. 116-130.
Redding, S., 1996. The Low-Skill, Low-Quality Trap: Strategic Complementarities between Human Capital and R & D. Economic Journal 106(435), pp. 458-470.
Reinstaller, A., 2005. Policy entrepreneurship in the co-evolution of institutions, preferences, and technology. Comparing the diffusion of totally chlorine free pulp bleaching technologies in the US and Sweden. Research Policy 34 (9), pp. 1366-1384.
Reinstaller, A. and Unterlass, F., 2008. What is the right strategy for more innovation in Europe? Drivers and Challenges for innovation performance at the sector level- Synthesis Report. Luxemburg: Office for Official Publications of the European Communities. http://www.europe-innova.org/servlet/Doc?cid=10396&lg=EN
Reinstaller, A. and Unterlass F., 2010. Sectoral Innovation Modes and the State of Economic Development: Implications for Innovation Policy in the New Member States. In: Radosevic S., Kaderabkova, A. (eds.). Innovation Policy in Multi-Tier Europe. The Specific Challenges of the Central And Eastern European Countries. Aldershot: Edward Elgar Publ.
Reinstaller, A., 2005. Policy entrepreneurship in the co-evolution of institutions, preferences, and technology. Comparing the diffusion of totally chlorine free pulp bleaching technologies in the US an Sweden. Research Policy 34 (9), pp. 1366-1384.
Riordan, M., 1992. Regulation and preemptive technology adoption. Rand Journal of Economics, 23(3), pp. 334-349.
Rodriguez, V. and Montalvo, C., 2007. Innovation Policies From the European Union: Methods for Classification, Bulletin of Science Technology Society 27, pp. 467-481.
Rogers, M., 2004. Networks, Firm Size and Innovation, Small Business Economics, 22, pp. 141-153.
Roper S. and Love, J.H., 2002. Innovation and export performance: evidence from the UK and German manufacturing plants, in: Research Policy, Vol. 31, pp. 1087–1102.
Roper, S. and Love, J., 2002. Innovation and export performance: Evidence from the UK and German manufacturing plants. Research Policy, 31, pp. 1087–1102.
Roper, S. and Love, J.H., 2002. Innovation and export performance: evidence from the UK and German manufacturing plants. Research Policy 31(7), pp. 1087-1102.
Rothwell, R. and Dodgson, M., 1994. Innovation and Size of Firm, in Dodgson, M., Rothwell, R. (eds.), The Handbook of Industrial Innovation, Cheltenham, UK, Edward Elgar.
Rugman, A.M., 1981. Research and Development by Multinational and Domestic Firms in Canada, Canadian Public Policy, 7(4), pp. 604-616.
Rugman, A., 1981. Inside the Multinationals. London: Croom Helm.
Ruzzier, M., Hisrich, R.D. and Antoncic, B., 2006. SME internationalization research: past, present, and future, in: Journal of Small Business and Enterprise Development, Vol. 13, Nr. 4, pp. 476-497.
Saarenketoa, S., Puumalainenb, K., Kuivalainena, O. and Kylaheikob, K., 2004. Dynamic knowledge-related learning processes in internationalizing high-tech SMEs, in: International Journal of Production Economics, Vol. 89, pp. 363–378.
Salomon, R.M. and Shaver, J. M., 2005. Learning by exporting: new insights from examining firm innovation. Journal of Economics & Management Strategy 14(2), pp. 431–460.
Samaniego, R., 2009. Financing Creative Destruction, 10 Dezember 2009, http://mpra.ub.uni-muenchen.de/22348/ (zugegriffen 9 Juli 2010).
Sanna-Randaccio, F. and Veugelers, R., 2007. Multinational knowledge spillovers with decentralised RD: a game-theoretic approach. Journal of International Business Studies 38(1), pp. 47–63.
Scherer, F.M., 1965. Firm Size, market structure, opportunity and the output patented inventions, American Economic Review, 55, pp. 1097-1125.
Schreyer, P., 2000. High-growth Firms and Employment, OECD STI Working Paper 2000/3.
Scotchmer, S., 2004. Innovation and Incentives, The MIT Press.
Serti, F. and Tomasi, C., 2008. Self-Selection and Post-Entry Effects of Exports: Evidence from Italian Manufacturing Firms. Review of World Economics 144(4), pp. 660-694.
218
Shackley, S. and Green, K., 2007. A conceptual framework for exploring transitions to decarbonised energy systems in the United Kingdom. Energy 32, pp. 221–236.
Shadbegian, R., and Gray, W., 2005. Pollution Abatement Expenditures and Plant-Level Productivity: A Production Function Approach, Ecological Economics 54, pp.196-208.
Siegel, D.S., 1999. Skill-biased technological change, WE Upjohn Institute for Employment Research.
Smith, D., Gregoire, P. and Lu, M., 2006. Manager's Perceptions of Export Barriers: A Cross-Cultural Perspective of Service Firms, Journal of Transnational Management, 12 (1), pp. 51-68.
Smith, V., Madsen, E.S. and Dilling-Hansen, M., 2002. Do R&D investments affect export performance? The Danish Institute for Studies in Research and Research Policy Working Paper 2002/4.
Smits, R. and Kuhlmann, S., 2004. The rise of systematic instruments in innovation policy. International Journal of Foresight and Innovation Policy 1 (1/2), pp. 4–32.
Soete, L., and Arundel, A., 1995. European innovation policy for environmentally sustainable development: Application of a systems model of technical change, Journal of European Public Policy 2, pp. 285 - 315.
Spence, M., 2003. Evaluating export promotion programmes: UK overseas trade missions and export performance. Small Business Economics, 20, pp. 83–103.
Spiezia, V. and Vivarelli, M., 2002. Innovation and employment: a critical survey, In Greenan, N., L’Horty, Y., Mairesse, J., (eds.) Productivity, inequality, and the digital economy : A Transatlantic Perspective, MIT Press, Cambridge (Mass.), pp. 101–131.
Sterlacchini, A., 2001. The determinants of export performance: a firm-level study of Italian manufacturing. Review of World Economics 137(3), pp. 450–472.
Stiglitz, J. E. and Weiss, A., 1981. Credit Rationing in Markets with Imperfect Information, The American Economic Review, Juni 1981, 71(3), pp. 393-410.
Storey, D. J., 1994. Understanding the small business sector, Chapman & Hall.
Swann, G.M.P., 2000. The Economics of Standardization, Report for Department of Trade and Industry, Standards and Technical Regulations Directorate.
Swann, G.M.P., 1985. Product Competition in Microprocessors, Journal of Industrial Economics, Vol.34 (1), pp.33-54.
Swann, G.M.P. and Temple, P., 1995. BSI Standards and Trade Performance, BSI (British Standards Institution) News.
Swann, P., 2005. Do Standards Enable or Constrain Innovation? In: The Empirical Economics of Standards. Department of Trade and Industry (ed.). London, pp. 76–120.
Tauchert, W., 1998. Examination of software-related applications at the German patent office, Patent World, (103), pp. 33-37.
Tauchert, W., 1999. Zur Patentierbarkeit von Programmen für Datenverarbeitungsanlagen, Mitteilungen der deutschen Patentanwälte, (90), pp. 248-252.
United States International Trade Commission, 2010. Small and Medium-Sized Enterprises: U.S. and EU Export Activities, and Barriers and Opportunities Experienced by U.S. Firms, Investigation No. 332-509, USITC Publication 4169, July 2010.
Van Biesebroeck, J., 2005. Exporting raises productivity in sub-Saharan African manufacturing firms. Journal of International Economics 67(2), pp. 373–391.
Vandenbussche, J., Aghion, P. and Meghir, C., 2006. "Growth, distance to frontier and composition of human capital", Journal of Economic Growth, 23 Juni 2006, 11(2), pp. 97-127.
van Pottelsberghe de la Potterie, B., 2009. Lost property: The European patent system and why it doesn’t work, BRUEGEL BLUEPRINT SERIES, (9), http://www.bruegel.org/publications/show/publication/lost-property-the-european-patent-system-and-why-it-doesnt-work.html (zugegriffen 2 August 2010).
van Pottelsberghe de la Potterie, B., and Danguy, J., 2009. Cost Benefit Analysis of the Community Patent, Bruegel Working Paper, (8), http://econpapers.repec.org/paper/brewpaper/382.htm (zugegriffen 3 August 2010).
van Pottelsberghe de la Potterie, B. and François, D., 2009. "The Cost Factor in Patent Systems", Journal of Industry, Competition and Trade 9(4), pp. 329-355.
van Stel, A., Storey, D. and Thurik, R., 2006. The effect of business regulations on nascent and actual entrepreneurship, Max Planck Institute of Economics, Discussion Papers on Entrepreneurship, Growth and Public Policy, No. 0408, February 2006.
Vaona, A. and Pianta, M., 2008. Firm Size and Innovation in European Manufacturing, Small Business Economics, Springer, Vol. 30(3), pp. 283-299.
Veugelers R. and Cassiman, B., 2004. Foreign subsidiaries as a channel of international technology diffusion: Some direct firm level evidence from Belgium, European Economic Review 48, pp. 455-476.
219
Viscusi, K.W. and Moore, M.J., 1993. Product Liability, Research and Development, and Innovation. In: Journal of Political Economy, 101, pp. 161–184.
Visser, R., Jongen M. and Zwetsloot, G., 2008. Business-driven innovations towards more sustainable chemical products, Journal of Cleaner Production, 16, 1, pp. 85-94.
von Tunzelman, N. and Nassehi, S., 2004. Technology policy, European Union enlargement, and economic, social and political sustainability, Science and Public Policy 31, pp. 475-483.
Wagner, J., 2007a. Exports and Productivity. Comparable Evidence for 14 Countries. University of Nottingham Research Paper 41. Available at: http://papers.ssrn.com/sol3/papers.cfm?abstract_id=1048341 [Zugegriffen April 13, 2010].
Wagner, J., 2007b. Exports and Productivity: A Survey of the Evidence from Firm-level Data. World Economy 30(1), pp. 60-82.
Wakelin, K., 1998. Innovation and export behaviour at the firm level. Research Policy 26(7-8), pp. 829-841.
Wakelin, K., 2001. Productivity growth and R&D expenditure in UK manufacturing firms. Research policy 30(7), pp. 1079–1090.
Wasmer, E., Fredrikson, P, Lamo, A., Messina, J. and Peri, G., 2007. The macroeconomics of education, in: Brunello, G. et al (eds.), Education and Training in Europe, Oxford University Press.
Westhead, P., Storey, D. J. and Martin, F., 2001. Outcomes reported by students who participated in the 1994 Shell Technology Enterprise Programme, Entrepreneurship & Regional Development: An International Journal, 2001, 13(2), pp. 163.
Westhead, P., 2008. International opportunity exploitation behaviour reported by "types" of firms relating to exporting. Journal of small business and enterprise development, 15:3, pp. 431- 456.
Wiersema, M. and Bowen, H., 2008. Corporate diversification: The impact of foreign competition, industry globalization, and product diversification. Strategic Management Journal 29, pp. 115-132.
Wiklund, J. and Shepherd, D.A., 2005. Entrepreneurial Orientation and Small Business Performance: A Configurational Approach. Journal of Business Venturing 20(1), pp. 71-91.
Willmore, L., 1992. Tansnationals and foreign trade: Evidence from Brazil. Journal of Development Studies 28(2), pp. 314–335.
Wolfmayr, Y., 2008. Trade Barriers in Services and Competitive Strengths in the Austrian Service Sector - An Analysis at the Detailed Sector Level, in: FIW Research Report No. 007, June 2008, Vienna.
Yang, C.H. and Huang, C.H., 2005. R&D, size and firm growth in Taiwan‘s electronics industry. Small Business Economics 25(5), pp. 477–487.
Yasuda, T., 2005. Firm growth, size, age and behavior in Japanese manufacturing. Small Business Economics 24(1), pp. 1–15.
Zahra, S.A., Ucbasaran, D. and Newey, L. R., 2009. Social knowledge and SMEs’ innovative gains from internationalization. European Management Review 6(2), pp. 81–93.
Zahra, S.A., Ucbasaran, D. and Newey, L.R., 2009. Social knowledge and SMEs’ innovative gains from internationalization, in: European Management Review, Vol. 6, pp. 81–93.
Zanetti, F., 2009. Effects of product and labor market regulation on macroeconomic outcomes. Journal of Macroeconomics 31, pp. 320–332.
Zhao, H. and Li, H., 1997. R&D and export: An empirical analysis of Chinese manufacturing firms. The Journal of High Technology Management Research 8(1), pp. 89–105.
Zoli, E., 2007. Financial development in emerging Europe: the unfinished agenda, International Monetary Fund.
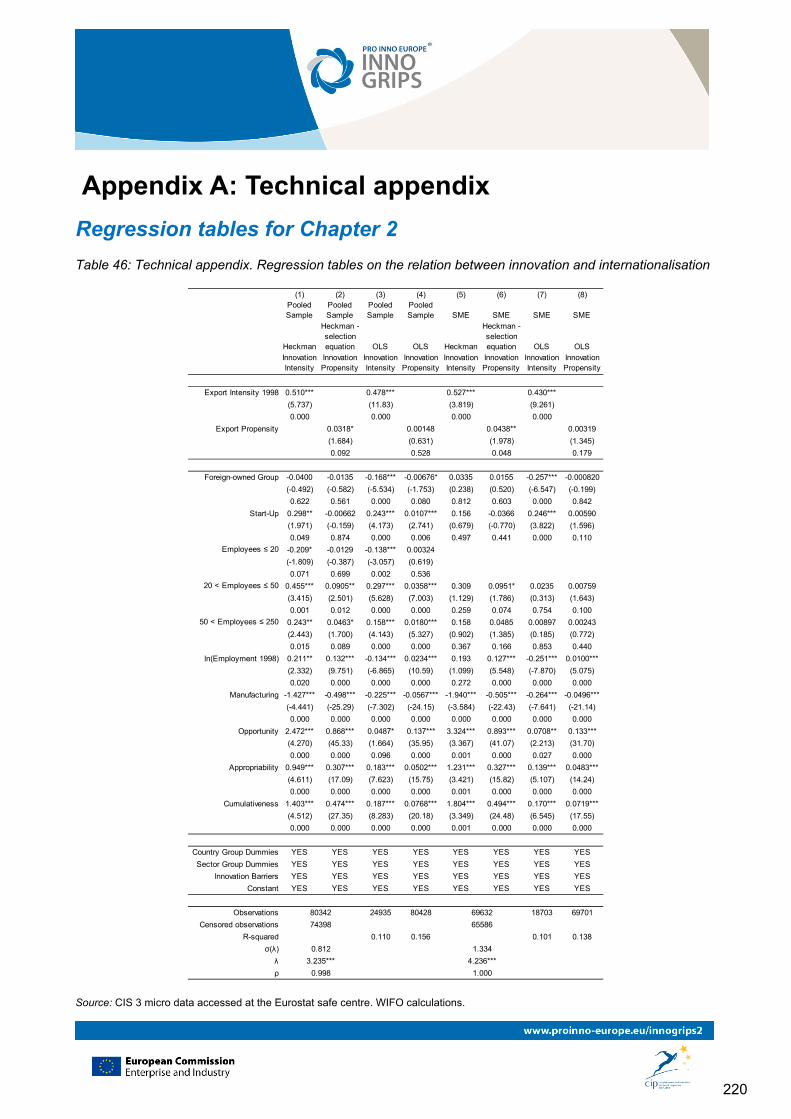
220
Appendix A: Technical appendix
Regression tables for Chapter 2
Table 46: Technical appendix. Regression tables on the relation between innovation and internationalisation
(1) (2) (3) (4) (5) (6) (7) (8)Pooled Sample
Pooled Sample
Pooled Sample
Pooled Sample SME SME SME SME
Heckman
Heckman - selection equation OLS OLS Heckman
Heckman - selection equation OLS OLS
Innovation Intensity
Innovation Propensity
Innovation Intensity
Innovation Propensity
Innovation Intensity
Innovation Propensity
Innovation Intensity
Innovation Propensity
Export Intensity 1998 0.510*** 0.478*** 0.527*** 0.430***
(5.737) (11.83) (3.819) (9.261)
0.000 0.000 0.000 0.000
Export Propensity 0.0318* 0.00148 0.0438** 0.00319
(1.684) (0.631) (1.978) (1.345)
0.092 0.528 0.048 0.179
Foreign-owned Group -0.0400 -0.0135 -0.168*** -0.00676* 0.0335 0.0155 -0.257*** -0.000820
(-0.492) (-0.582) (-5.534) (-1.753) (0.238) (0.520) (-6.547) (-0.199)
0.622 0.561 0.000 0.080 0.812 0.603 0.000 0.842
Start-Up 0.298** -0.00662 0.243*** 0.0107*** 0.156 -0.0366 0.246*** 0.00590
(1.971) (-0.159) (4.173) (2.741) (0.679) (-0.770) (3.822) (1.596)
0.049 0.874 0.000 0.006 0.497 0.441 0.000 0.110
Employees ≤ 20 -0.209* -0.0129 -0.138*** 0.00324
(-1.809) (-0.387) (-3.057) (0.619)
0.071 0.699 0.002 0.536
20 < Employees ≤ 50 0.455*** 0.0905** 0.297*** 0.0358*** 0.309 0.0951* 0.0235 0.00759
(3.415) (2.501) (5.628) (7.003) (1.129) (1.786) (0.313) (1.643)
0.001 0.012 0.000 0.000 0.259 0.074 0.754 0.100
50 < Employees ≤ 250 0.243** 0.0463* 0.158*** 0.0180*** 0.158 0.0485 0.00897 0.00243
(2.443) (1.700) (4.143) (5.327) (0.902) (1.385) (0.185) (0.772)
0.015 0.089 0.000 0.000 0.367 0.166 0.853 0.440
ln(Employment 1998) 0.211** 0.132*** -0.134*** 0.0234*** 0.193 0.127*** -0.251*** 0.0100***
(2.332) (9.751) (-6.865) (10.59) (1.099) (5.548) (-7.870) (5.075)
0.020 0.000 0.000 0.000 0.272 0.000 0.000 0.000
Manufacturing -1.427*** -0.498*** -0.225*** -0.0567*** -1.940*** -0.505*** -0.264*** -0.0496***
(-4.441) (-25.29) (-7.302) (-24.15) (-3.584) (-22.43) (-7.641) (-21.14)
0.000 0.000 0.000 0.000 0.000 0.000 0.000 0.000
Opportunity 2.472*** 0.868*** 0.0487* 0.137*** 3.324*** 0.893*** 0.0708** 0.133***
(4.270) (45.33) (1.664) (35.95) (3.367) (41.07) (2.213) (31.70)
0.000 0.000 0.096 0.000 0.001 0.000 0.027 0.000
Appropriability 0.949*** 0.307*** 0.183*** 0.0502*** 1.231*** 0.327*** 0.139*** 0.0483***
(4.611) (17.09) (7.623) (15.75) (3.421) (15.82) (5.107) (14.24)
0.000 0.000 0.000 0.000 0.001 0.000 0.000 0.000
Cumulativeness 1.403*** 0.474*** 0.187*** 0.0768*** 1.804*** 0.494*** 0.170*** 0.0719***
(4.512) (27.35) (8.283) (20.18) (3.349) (24.48) (6.545) (17.55)
0.000 0.000 0.000 0.000 0.001 0.000 0.000 0.000
Country Group Dummies YES YES YES YES YES YES YES YES
Sector Group Dummies YES YES YES YES YES YES YES YES
Innovation Barriers YES YES YES YES YES YES YES YES
Constant YES YES YES YES YES YES YES YES
Observations 24935 80428 18703 69701
Censored observations
R-squared 0.110 0.156 0.101 0.138
σ(λ)
λ
ρ
69632
1.334
4.236***
1.000
65586
80342
0.812
3.235***
0.998
74398
Source: CIS 3 micro data accessed at the Eurostat safe centre. WIFO calculations.
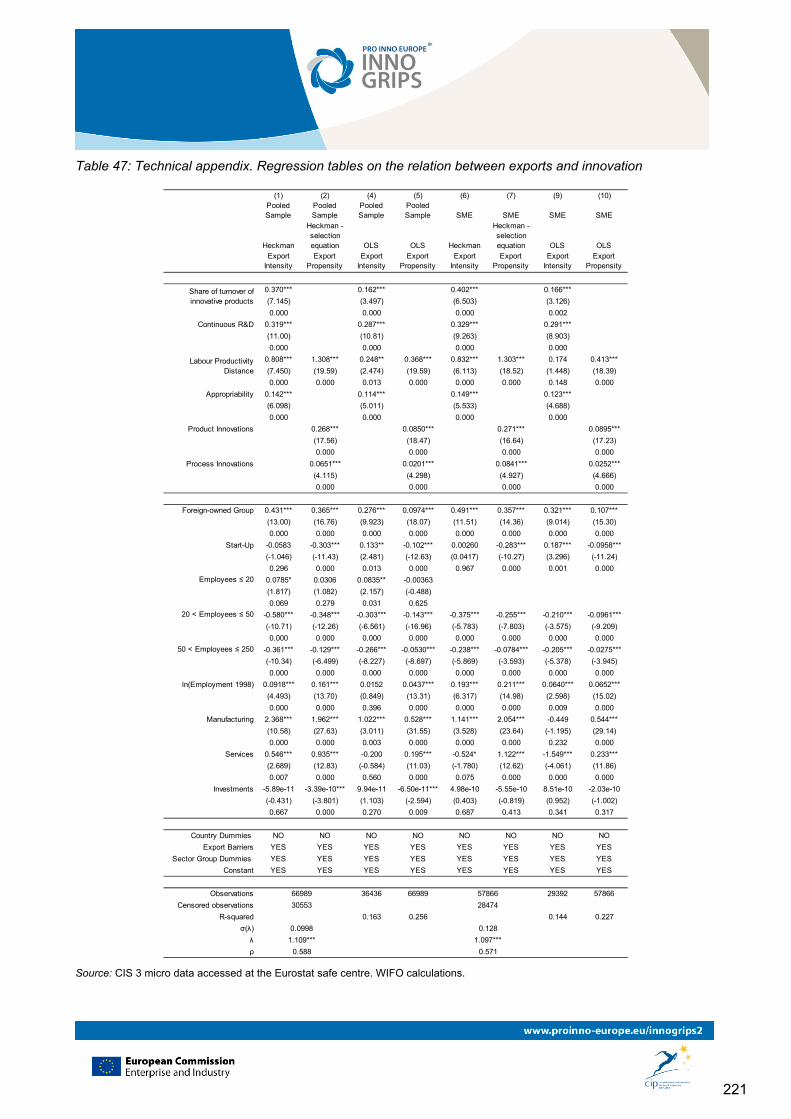
221
Table 47: Technical appendix. Regression tables on the relation between exports and innovation
(1) (2) (4) (5) (6) (7) (9) (10)Pooled Sample
Pooled Sample
Pooled Sample
Pooled Sample SME SME SME SME
Heckman
Heckman - selection equation OLS OLS Heckman
Heckman - selection equation OLS OLS
Export Intensity
Export Propensity
Export Intensity
Export Propensity
Export Intensity
Export Propensity
Export Intensity
Export Propensity
0.370*** 0.162*** 0.402*** 0.166***
(7.145) (3.497) (6.503) (3.126)
0.000 0.000 0.000 0.002
Continuous R&D 0.319*** 0.287*** 0.329*** 0.291***
(11.00) (10.81) (9.263) (8.903)
0.000 0.000 0.000 0.000
0.808*** 1.308*** 0.248** 0.368*** 0.832*** 1.303*** 0.174 0.413***
(7.450) (19.59) (2.474) (19.59) (6.113) (18.52) (1.448) (18.39)
0.000 0.000 0.013 0.000 0.000 0.000 0.148 0.000
Appropriability 0.142*** 0.114*** 0.149*** 0.123***
(6.098) (5.011) (5.533) (4.688)
0.000 0.000 0.000 0.000
Product Innovations 0.268*** 0.0850*** 0.271*** 0.0895***
(17.56) (18.47) (16.64) (17.23)
0.000 0.000 0.000 0.000
Process Innovations 0.0651*** 0.0201*** 0.0841*** 0.0252***
(4.115) (4.298) (4.927) (4.666)
0.000 0.000 0.000 0.000
Foreign-owned Group 0.431*** 0.365*** 0.276*** 0.0974*** 0.491*** 0.357*** 0.321*** 0.107***
(13.00) (16.76) (9.923) (18.07) (11.51) (14.36) (9.014) (15.30)
0.000 0.000 0.000 0.000 0.000 0.000 0.000 0.000
Start-Up -0.0583 -0.303*** 0.133** -0.102*** 0.00260 -0.283*** 0.187*** -0.0958***
(-1.046) (-11.43) (2.481) (-12.63) (0.0417) (-10.27) (3.296) (-11.24)
0.296 0.000 0.013 0.000 0.967 0.000 0.001 0.000
Employees ≤ 20 0.0785* 0.0306 0.0835** -0.00363
(1.817) (1.082) (2.157) (-0.488)
0.069 0.279 0.031 0.625
20 < Employees ≤ 50 -0.580*** -0.348*** -0.303*** -0.143*** -0.375*** -0.255*** -0.210*** -0.0961***
(-10.71) (-12.26) (-6.561) (-16.96) (-5.783) (-7.803) (-3.575) (-9.209)
0.000 0.000 0.000 0.000 0.000 0.000 0.000 0.000
50 < Employees ≤ 250 -0.361*** -0.129*** -0.266*** -0.0530*** -0.238*** -0.0784*** -0.205*** -0.0275***
(-10.34) (-6.499) (-8.227) (-8.697) (-5.869) (-3.593) (-5.378) (-3.945)
0.000 0.000 0.000 0.000 0.000 0.000 0.000 0.000
ln(Employment 1998) 0.0918*** 0.161*** 0.0152 0.0437*** 0.193*** 0.211*** 0.0640*** 0.0652***
(4.493) (13.70) (0.849) (13.31) (6.317) (14.98) (2.598) (15.02)
0.000 0.000 0.396 0.000 0.000 0.000 0.009 0.000
Manufacturing 2.368*** 1.962*** 1.022*** 0.528*** 1.141*** 2.054*** -0.449 0.544***
(10.58) (27.63) (3.011) (31.55) (3.528) (23.64) (-1.195) (29.14)
0.000 0.000 0.003 0.000 0.000 0.000 0.232 0.000
Services 0.546*** 0.935*** -0.200 0.195*** -0.524* 1.122*** -1.549*** 0.233***
(2.689) (12.83) (-0.584) (11.03) (-1.780) (12.62) (-4.061) (11.86)
0.007 0.000 0.560 0.000 0.075 0.000 0.000 0.000
Investments -5.89e-11 -3.39e-10*** 9.94e-11 -6.50e-11*** 4.98e-10 -5.55e-10 8.51e-10 -2.03e-10
(-0.431) (-3.801) (1.103) (-2.594) (0.403) (-0.819) (0.952) (-1.002)
0.667 0.000 0.270 0.009 0.687 0.413 0.341 0.317
Country Dummies NO NO NO NO NO NO NO NO
Export Barriers YES YES YES YES YES YES YES YES
Sector Group Dummies YES YES YES YES YES YES YES YES
Constant YES YES YES YES YES YES YES YES
Observations 36436 66989 29392 57866
Censored observations
R-squared 0.163 0.256 0.144 0.227
σ(λ)
λ
ρ 0.588
0.0998
1.109***
0.128
1.097***
0.571
28474
66989 57866
30553
Share of turnover of innovative products
Labour Productivity Distance
Source: CIS 3 micro data accessed at the Eurostat safe centre. WIFO calculations.
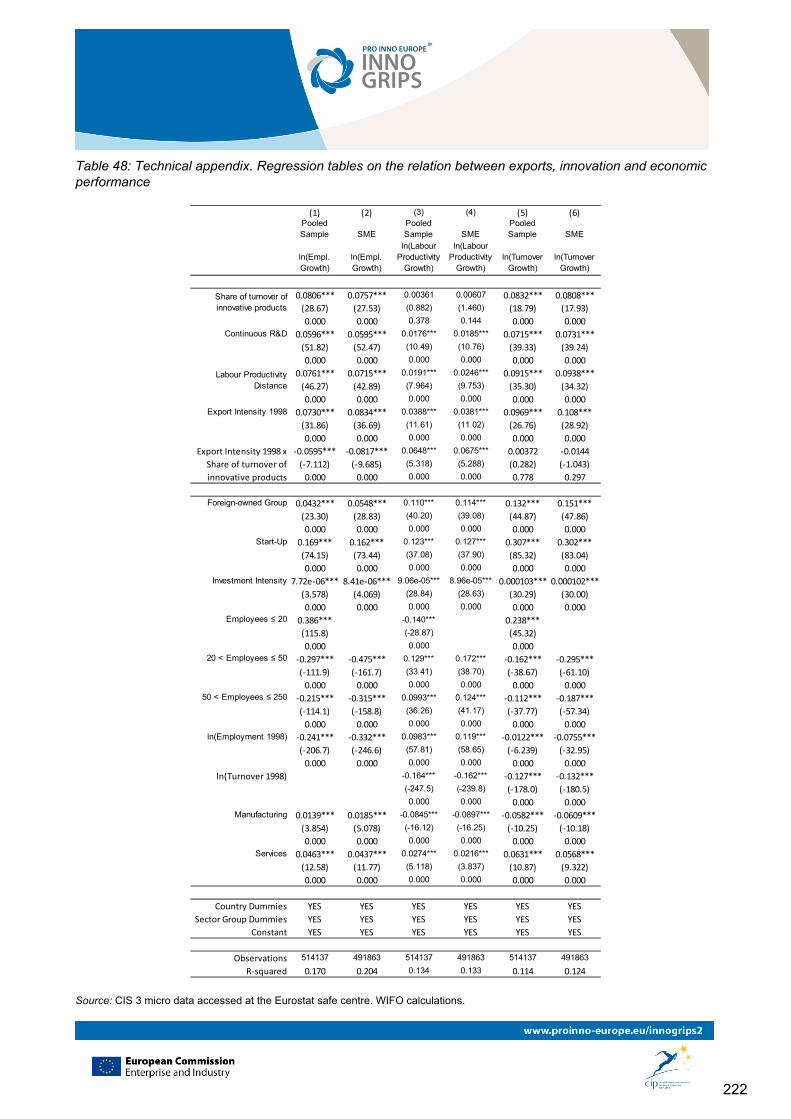
222
Table 48: Technical appendix. Regression tables on the relation between exports, innovation and economic performance
(1) (2) (3) (4) (5) (6)Pooled Sample SME
Pooled Sample SME
Pooled Sample SME
ln(Empl. Growth)
ln(Empl. Growth)
ln(Labour Productivity
Growth)
ln(Labour Productivity
Growth)ln(Turnover
Growth)ln(Turnover
Growth)
0.0806*** 0.0757*** 0.00361 0.00607 0.0832*** 0.0808***
(28.67) (27.53) (0.882) (1.460) (18.79) (17.93)
0.000 0.000 0.378 0.144 0.000 0.000Continuous R&D 0.0596*** 0.0595*** 0.0176*** 0.0185*** 0.0715*** 0.0731***
(51.82) (52.47) (10.49) (10.76) (39.33) (39.24)
0.000 0.000 0.000 0.000 0.000 0.000
0.0761*** 0.0715*** 0.0191*** 0.0246*** 0.0915*** 0.0938***
(46.27) (42.89) (7.964) (9.753) (35.30) (34.32)
0.000 0.000 0.000 0.000 0.000 0.000Export Intensity 1998 0.0730*** 0.0834*** 0.0388*** 0.0381*** 0.0969*** 0.108***
(31.86) (36.69) (11.61) (11.02) (26.76) (28.92)
0.000 0.000 0.000 0.000 0.000 0.000
-0.0595*** -0.0817*** 0.0648*** 0.0675*** 0.00372 -0.0144
(-7.112) (-9.685) (5.318) (5.288) (0.282) (-1.043)
0.000 0.000 0.000 0.000 0.778 0.297
Foreign-owned Group 0.0432*** 0.0548*** 0.110*** 0.114*** 0.132*** 0.151***
(23.30) (28.83) (40.20) (39.08) (44.87) (47.86)
0.000 0.000 0.000 0.000 0.000 0.000Start-Up 0.169*** 0.162*** 0.123*** 0.127*** 0.307*** 0.302***
(74.15) (73.44) (37.08) (37.90) (85.32) (83.04)
0.000 0.000 0.000 0.000 0.000 0.000Investment Intensity 7.72e-06*** 8.41e-06*** 9.06e-05*** 8.96e-05*** 0.000103*** 0.000102***
(3.578) (4.069) (28.84) (28.63) (30.29) (30.00)
0.000 0.000 0.000 0.000 0.000 0.000Employees ≤ 20 0.386*** -0.140*** 0.238***
(115.8) (-28.87) (45.32)
0.000 0.000 0.00020 < Employees ≤ 50 -0.297*** -0.475*** 0.129*** 0.172*** -0.162*** -0.295***
(-111.9) (-161.7) (33.41) (38.70) (-38.67) (-61.10)
0.000 0.000 0.000 0.000 0.000 0.00050 < Employees ≤ 250 -0.215*** -0.315*** 0.0993*** 0.124*** -0.112*** -0.187***
(-114.1) (-158.8) (36.26) (41.17) (-37.77) (-57.34)
0.000 0.000 0.000 0.000 0.000 0.000ln(Employment 1998) -0.241*** -0.332*** 0.0983*** 0.119*** -0.0122*** -0.0755***
(-206.7) (-246.6) (57.81) (58.65) (-6.239) (-32.95)
0.000 0.000 0.000 0.000 0.000 0.000
ln(Turnover 1998) -0.164*** -0.162*** -0.127*** -0.132***(-247.5) (-239.8) (-178.0) (-180.5)0.000 0.000 0.000 0.000
Manufacturing 0.0139*** 0.0185*** -0.0845*** -0.0897*** -0.0582*** -0.0609***
(3.854) (5.078) (-16.12) (-16.25) (-10.25) (-10.18)
0.000 0.000 0.000 0.000 0.000 0.000Services 0.0463*** 0.0437*** 0.0274*** 0.0216*** 0.0631*** 0.0568***
(12.58) (11.77) (5.118) (3.837) (10.87) (9.322)
0.000 0.000 0.000 0.000 0.000 0.000
Country Dummies YES YES YES YES YES YES
Sector Group Dummies YES YES YES YES YES YES
Constant YES YES YES YES YES YES
Observations 514137 491863 514137 491863 514137 491863
R-squared 0.170 0.204 0.134 0.133 0.114 0.124
Share of turnover of innovative products
Labour Productivity Distance
Export Intensity 1998 x
Share of turnover of
innovative products
Source: CIS 3 micro data accessed at the Eurostat safe centre. WIFO calculations.
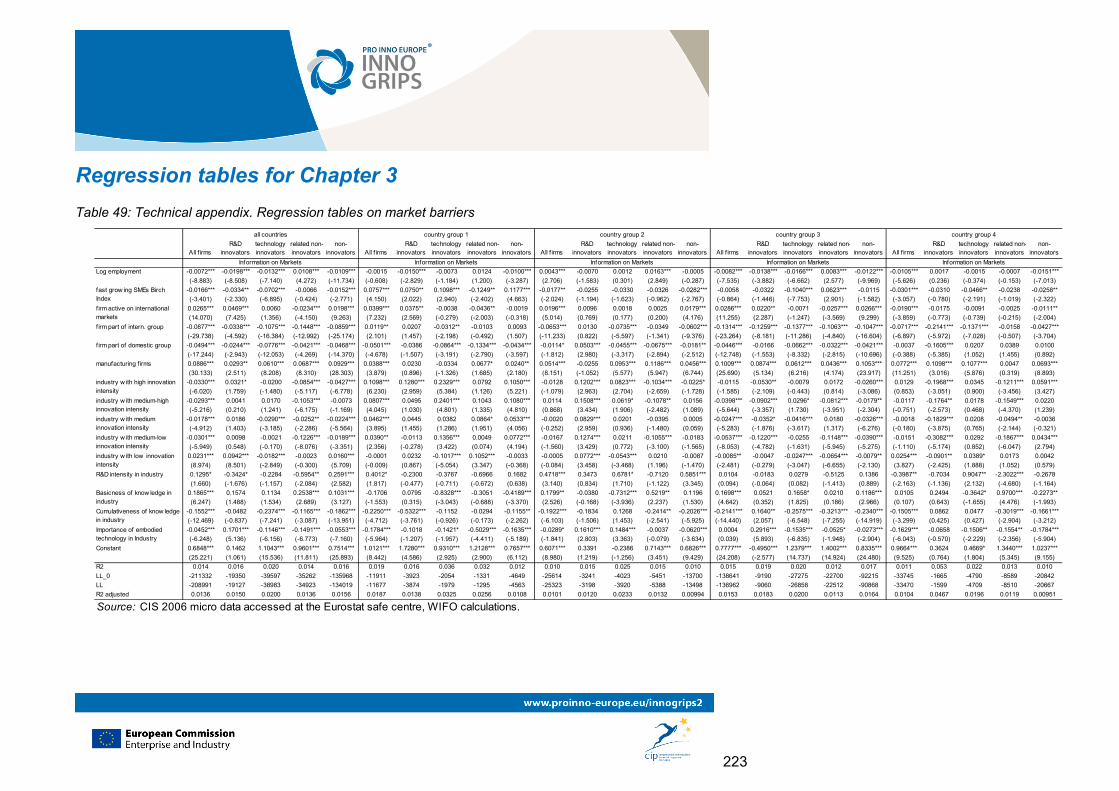
223
Regression tables for Chapter 3
Table 49: Technical appendix. Regression tables on market barriers
All f irmsR&D
innovatorstechnology innovators
related non-innovators
non-innovators All f irms
R&D innovators
technology innovators
related non-innovators
non-innovators All f irms
R&D innovators
technology innovators
related non-innovators
non-innovators All f irms
R&D innovators
technology innovators
related non-innovators
non-innovators All f irms
R&D innovators
technology innovators
related non-innovators
non-innovators
Log employment -0.0072*** -0.0198*** -0.0132*** 0.0108*** -0.0109*** -0.0015 -0.0150*** -0.0073 0.0124 -0.0100*** 0.0043*** -0.0070 0.0012 0.0163*** -0.0005 -0.0082*** -0.0138*** -0.0166*** 0.0083*** -0.0122*** -0.0105*** 0.0017 -0.0015 -0.0007 -0.0151***
(-8.883) (-8.508) (-7.140) (4.272) (-11.734) (-0.608) (-2.829) (-1.184) (1.200) (-3.287) (2.706) (-1.583) (0.301) (2.849) (-0.287) (-7.535) (-3.882) (-6.662) (2.577) (-9.969) (-5.626) (0.236) (-0.374) (-0.153) (-7.013)
-0.0166*** -0.0334** -0.0702*** -0.0066 -0.0152*** 0.0757*** 0.0750** 0.1098*** -0.1249** 0.1177*** -0.0177** -0.0255 -0.0330 -0.0326 -0.0282*** -0.0058 -0.0322 -0.1040*** 0.0623*** -0.0115 -0.0301*** -0.0310 -0.0466** -0.0238 -0.0258**
(-3.401) (-2.330) (-6.895) (-0.424) (-2.771) (4.150) (2.022) (2.940) (-2.402) (4.663) (-2.024) (-1.194) (-1.623) (-0.962) (-2.767) (-0.864) (-1.446) (-7.753) (2.901) (-1.582) (-3.057) (-0.780) (-2.191) (-1.019) (-2.322)
0.0265*** 0.0469*** 0.0060 -0.0234*** 0.0198*** 0.0399*** 0.0375** -0.0038 -0.0436** -0.0019 0.0196*** 0.0096 0.0018 0.0025 0.0179*** 0.0286*** 0.0220** -0.0071 -0.0257*** 0.0266*** -0.0190*** -0.0175 -0.0091 -0.0025 -0.0111**
(14.070) (7.425) (1.356) (-4.150) (9.263) (7.232) (2.569) (-0.279) (-2.003) (-0.318) (5.014) (0.769) (0.177) (0.200) (4.176) (11.255) (2.287) (-1.247) (-3.569) (9.299) (-3.859) (-0.773) (-0.739) (-0.215) (-2.004)
f irm part of intern. group -0.0877*** -0.0338*** -0.1075*** -0.1448*** -0.0859*** 0.0119** 0.0207 -0.0312** -0.0103 0.0093 -0.0653*** 0.0130 -0.0735*** -0.0349 -0.0602*** -0.1314*** -0.1259*** -0.1377*** -0.1063*** -0.1047*** -0.0717*** -0.2141*** -0.1371*** -0.0158 -0.0427***
(-29.738) (-4.592) (-16.384) (-12.992) (-25.174) (2.101) (1.457) (-2.198) (-0.492) (1.507) (-11.233) (0.822) (-5.597) (-1.341) (-9.376) (-23.264) (-8.181) (-11.286) (-4.840) (-16.604) (-6.897) (-5.972) (-7.028) (-0.507) (-3.704)
f irm part of domestic group -0.0494*** -0.0244*** -0.0776*** -0.0421*** -0.0468*** -0.0501*** -0.0386 -0.0864*** -0.1334*** -0.0434*** -0.0114* 0.0503*** -0.0455*** -0.0675*** -0.0181** -0.0446*** -0.0166 -0.0662*** -0.0322*** -0.0421*** -0.0037 -0.1605*** 0.0207 0.0389 0.0100
(-17.244) (-2.943) (-12.053) (-4.269) (-14.370) (-4.678) (-1.507) (-3.191) (-2.790) (-3.597) (-1.812) (2.980) (-3.317) (-2.894) (-2.512) (-12.748) (-1.553) (-8.332) (-2.815) (-10.696) (-0.388) (-5.385) (1.052) (1.455) (0.892)
manufacturing f irms 0.0886*** 0.0293** 0.0610*** 0.0687*** 0.0929*** 0.0388*** 0.0230 -0.0334 0.0677* 0.0240** 0.0514*** -0.0255 0.0953*** 0.1186*** 0.0456*** 0.1009*** 0.0874*** 0.0612*** 0.0436*** 0.1053*** 0.0772*** 0.1098*** 0.1077*** 0.0047 0.0693***
(30.133) (2.511) (8.208) (8.310) (28.303) (3.879) (0.896) (-1.326) (1.685) (2.180) (8.151) (-1.052) (5.577) (5.947) (6.744) (25.690) (5.134) (6.216) (4.174) (23.917) (11.251) (3.016) (5.876) (0.319) (8.893)
-0.0330*** 0.0321* -0.0200 -0.0854*** -0.0427*** 0.1098*** 0.1280*** 0.2329*** 0.0792 0.1050*** -0.0128 0.1202*** 0.0823*** -0.1034*** -0.0225* -0.0115 -0.0530** -0.0079 0.0172 -0.0260*** 0.0129 -0.1968*** 0.0345 -0.1211*** 0.0591***
(-6.020) (1.759) (-1.480) (-5.117) (-6.778) (6.230) (2.959) (5.384) (1.126) (5.221) (-1.079) (2.963) (2.704) (-2.659) (-1.728) (-1.585) (-2.109) (-0.443) (0.814) (-3.086) (0.853) (-3.051) (0.900) (-3.456) (3.427)
-0.0293*** 0.0041 0.0170 -0.1053*** -0.0073 0.0807*** 0.0495 0.2401*** 0.1043 0.1080*** 0.0114 0.1508*** 0.0619* -0.1078** 0.0156 -0.0398*** -0.0902*** 0.0296* -0.0812*** -0.0179** -0.0117 -0.1764** 0.0178 -0.1549*** 0.0220
(-5.216) (0.210) (1.241) (-6.175) (-1.169) (4.045) (1.030) (4.801) (1.335) (4.810) (0.868) (3.434) (1.906) (-2.482) (1.089) (-5.644) (-3.357) (1.730) (-3.951) (-2.304) (-0.751) (-2.573) (0.468) (-4.370) (1.239)
-0.0178*** 0.0186 -0.0290*** -0.0252** -0.0224*** 0.0462*** 0.0445 0.0382 0.0864* 0.0533*** -0.0020 0.0829*** 0.0201 -0.0395 0.0005 -0.0247*** -0.0352* -0.0416*** 0.0180 -0.0326*** -0.0018 -0.1829*** 0.0208 -0.0494** -0.0036
(-4.912) (1.403) (-3.185) (-2.286) (-5.564) (3.895) (1.455) (1.286) (1.951) (4.056) (-0.252) (2.959) (0.936) (-1.480) (0.059) (-5.283) (-1.876) (-3.617) (1.317) (-6.276) (-0.180) (-3.875) (0.765) (-2.144) (-0.321)
-0.0301*** 0.0098 -0.0021 -0.1226*** -0.0189*** 0.0390** -0.0113 0.1356*** 0.0049 0.0772*** -0.0167 0.1274*** 0.0211 -0.1055*** -0.0183 -0.0537*** -0.1220*** -0.0255 -0.1148*** -0.0390*** -0.0151 -0.3082*** 0.0292 -0.1867*** 0.0434***
(-5.949) (0.548) (-0.170) (-8.076) (-3.351) (2.356) (-0.278) (3.422) (0.074) (4.194) (-1.560) (3.429) (0.772) (-3.100) (-1.565) (-8.053) (-4.782) (-1.631) (-5.945) (-5.275) (-1.110) (-5.174) (0.852) (-6.047) (2.794)
0.0231*** 0.0942*** -0.0182*** -0.0023 0.0160*** -0.0001 0.0232 -0.1017*** 0.1052*** -0.0033 -0.0005 0.0772*** -0.0543*** 0.0210 -0.0087 -0.0085** -0.0047 -0.0247*** -0.0654*** -0.0079** 0.0254*** -0.0901** 0.0389* 0.0173 0.0042
(8.974) (8.501) (-2.849) (-0.300) (5.709) (-0.009) (0.867) (-5.054) (3.347) (-0.368) (-0.084) (3.458) (-3.468) (1.196) (-1.470) (-2.481) (-0.279) (-3.047) (-6.655) (-2.130) (3.827) (-2.425) (1.888) (1.052) (0.579)
R&D intensity in industry 0.1295* -0.3424* -0.2284 -0.5954** 0.2591*** 0.4012* -0.2300 -0.3767 -0.6966 0.1682 0.4718*** 0.3473 0.6781* -0.7120 0.5851*** 0.0104 -0.0183 0.0279 -0.5125 0.1386 -0.3987** -0.7034 0.9047** -2.3022*** -0.2678
(1.660) (-1.676) (-1.157) (-2.084) (2.582) (1.817) (-0.477) (-0.711) (-0.672) (0.638) (3.140) (0.834) (1.710) (-1.122) (3.345) (0.094) (-0.064) (0.082) (-1.413) (0.889) (-2.163) (-1.136) (2.132) (-4.680) (-1.164)
0.1865*** 0.1574 0.1134 0.2538*** 0.1031*** -0.1706 0.0795 -0.8328*** -0.3051 -0.4189*** 0.1799** -0.0380 -0.7312*** 0.5219** 0.1196 0.1698*** 0.0521 0.1658* 0.0210 0.1186*** 0.0105 0.2494 -0.3642* 0.9700*** -0.2273**
(6.247) (1.488) (1.534) (2.689) (3.127) (-1.553) (0.315) (-3.043) (-0.688) (-3.370) (2.526) (-0.168) (-3.936) (2.237) (1.530) (4.642) (0.352) (1.825) (0.186) (2.966) (0.107) (0.643) (-1.655) (4.476) (-1.993)
-0.1552*** -0.0482 -0.2374*** -0.1165*** -0.1862*** -0.2250*** -0.5322*** -0.1152 -0.0294 -0.1155** -0.1922*** -0.1834 0.1268 -0.2414** -0.2026*** -0.2141*** 0.1640** -0.2575*** -0.3213*** -0.2340*** -0.1505*** 0.0862 0.0477 -0.3019*** -0.1661***
(-12.469) (-0.837) (-7.241) (-3.087) (-13.951) (-4.712) (-3.761) (-0.926) (-0.173) (-2.262) (-6.103) (-1.506) (1.453) (-2.541) (-5.925) (-14.440) (2.057) (-6.548) (-7.255) (-14.919) (-3.299) (0.425) (0.427) (-2.904) (-3.212)
-0.0452*** 0.1701*** -0.1146*** -0.1491*** -0.0553*** -0.1784*** -0.1018 -0.1421* -0.5029*** -0.1635*** -0.0289* 0.1610*** 0.1484*** -0.0037 -0.0620*** 0.0004 0.2916*** -0.1535*** -0.0525* -0.0273*** -0.1629*** -0.0658 -0.1506** -0.1554** -0.1784***
(-6.248) (5.136) (-6.156) (-6.773) (-7.160) (-5.964) (-1.207) (-1.957) (-4.411) (-5.189) (-1.841) (2.803) (3.363) (-0.079) (-3.634) (0.039) (5.893) (-6.835) (-1.948) (-2.904) (-6.043) (-0.570) (-2.229) (-2.356) (-5.904)
0.6848*** 0.1462 1.1043*** 0.9601*** 0.7514*** 1.0121*** 1.7280*** 0.9310*** 1.2128*** 0.7657*** 0.6071*** 0.3391 -0.2386 0.7143*** 0.6826*** 0.7777*** -0.4950*** 1.2379*** 1.4002*** 0.8335*** 0.9664*** 0.3624 0.4669* 1.3440*** 1.0237***
(25.221) (1.061) (15.536) (11.811) (25.893) (8.442) (4.586) (2.925) (2.900) (6.112) (8.980) (1.219) (-1.256) (3.451) (9.429) (24.208) (-2.577) (14.737) (14.924) (24.480) (9.525) (0.764) (1.804) (5.345) (9.155)
R2 0.014 0.016 0.020 0.014 0.016 0.019 0.016 0.036 0.032 0.012 0.010 0.015 0.025 0.015 0.010 0.015 0.019 0.020 0.012 0.017 0.011 0.053 0.022 0.013 0.010
LL_0 -211332 -19350 -39597 -35262 -135968 -11911 -3923 -2054 -1331 -4649 -25614 -3241 -4023 -5451 -13700 -138641 -9190 -27275 -22700 -92215 -33745 -1665 -4790 -8589 -20842
LL -208991 -19127 -38983 -34923 -134019 -11677 -3874 -1979 -1295 -4563 -25323 -3198 -3920 -5388 -13498 -136962 -9060 -26858 -22512 -90868 -33470 -1599 -4709 -8510 -20667
R2 adjusted 0.0136 0.0150 0.0200 0.0136 0.0156 0.0187 0.0138 0.0325 0.0256 0.0108 0.0101 0.0120 0.0233 0.0132 0.00994 0.0153 0.0183 0.0200 0.0113 0.0164 0.0104 0.0467 0.0196 0.0119 0.00951
Source: CIS 2006 micro data accessed at the Eurostat safe centre, WIFO calculations.
all countries country group 1 country group 2 country group 3 country group 4
Information on Markets
Constant
Information on Markets Information on Markets Information on Markets Information on Markets
industry w ith medium-low innovation intensity
industry w ith low innovation intensity
Basicness of know ledge in industry
Cumulativeness of know ledge in industry
Importance of embodied technology in Industry
fast grow ing SMEs Birch Index
firm active on international markets
industry w ith high innovation intensity
industry w ith medium-high innovation intensity
industry w ith medium innovation intensity
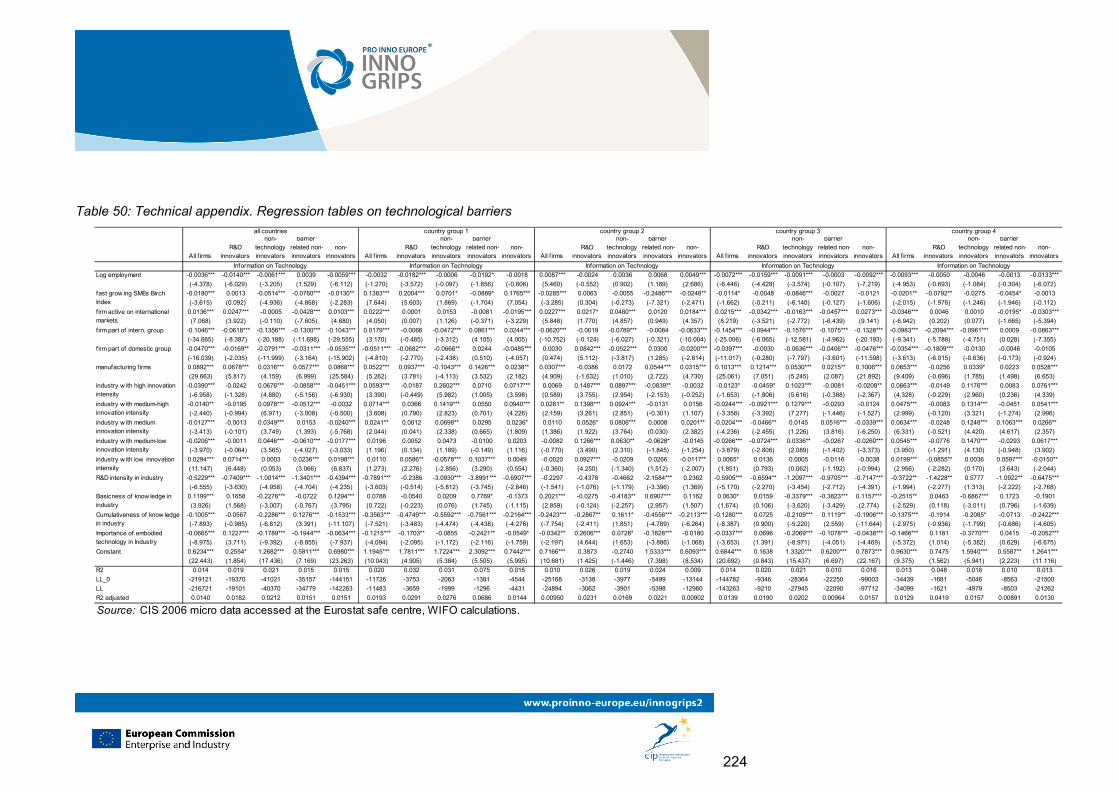
224
Table 50: Technical appendix. Regression tables on technological barriers
All f irmsR&D
innovators
non-technology innovators
barrier related non-innovators
non-innovators All f irms
R&D innovators
non-technology innovators
barrier related non-innovators
non-innovators All f irms
R&D innovators
non-technology innovators
barrier related non-innovators
non-innovators All f irms
R&D innovators
non-technology innovators
barrier related non-innovators
non-innovators All f irms
R&D innovators
non-technology innovators
barrier related non-innovators
non-innovators
Log employment -0.0036*** -0.0140*** -0.0061*** 0.0039 -0.0059*** -0.0032 -0.0182*** -0.0006 -0.0192* -0.0018 0.0087*** -0.0024 0.0036 0.0068 0.0049*** -0.0072*** -0.0159*** -0.0091*** -0.0003 -0.0092*** -0.0093*** -0.0050 -0.0046 -0.0013 -0.0133***
(-4.378) (-6.029) (-3.205) (1.529) (-6.112) (-1.270) (-3.572) (-0.097) (-1.856) (-0.606) (5.460) (-0.552) (0.902) (1.189) (2.686) (-6.446) (-4.428) (-3.574) (-0.107) (-7.219) (-4.953) (-0.693) (-1.084) (-0.304) (-6.072)
-0.0180*** 0.0013 -0.0514*** -0.0760*** -0.0130** 0.1383*** 0.2004*** 0.0701* -0.0889* 0.1765*** -0.0285*** 0.0063 -0.0055 -0.2486*** -0.0248** -0.0114* -0.0048 -0.0846*** -0.0027 -0.0121 -0.0201** -0.0792** -0.0275 -0.0454* -0.0013
(-3.615) (0.092) (-4.936) (-4.868) (-2.283) (7.644) (5.603) (1.869) (-1.704) (7.054) (-3.285) (0.304) (-0.273) (-7.321) (-2.471) (-1.662) (-0.211) (-6.140) (-0.127) (-1.606) (-2.015) (-1.976) (-1.246) (-1.946) (-0.112)
0.0136*** 0.0247*** -0.0005 -0.0428*** 0.0103*** 0.0222*** 0.0001 0.0153 -0.0081 -0.0195*** 0.0227*** 0.0217* 0.0480*** 0.0120 0.0184*** 0.0215*** -0.0342*** -0.0163*** -0.0457*** 0.0273*** -0.0346*** 0.0046 0.0010 -0.0195* -0.0303***
(7.068) (3.922) (-0.110) (-7.605) (4.680) (4.050) (0.007) (1.126) (-0.371) (-3.229) (5.848) (1.770) (4.857) (0.949) (4.357) (8.219) (-3.521) (-2.772) (-6.439) (9.141) (-6.942) (0.202) (0.077) (-1.665) (-5.394)
f irm part of intern. group -0.1046*** -0.0618*** -0.1356*** -0.1300*** -0.1043*** 0.0179*** -0.0066 -0.0472*** 0.0861*** 0.0244*** -0.0620*** -0.0019 -0.0789*** -0.0084 -0.0633*** -0.1454*** -0.0944*** -0.1576*** -0.1075*** -0.1328*** -0.0983*** -0.2094*** -0.0961*** 0.0009 -0.0863***
(-34.665) (-8.387) (-20.188) (-11.698) (-29.555) (3.170) (-0.485) (-3.312) (4.105) (4.005) (-10.752) (-0.124) (-6.027) (-0.321) (-10.004) (-25.006) (-6.065) (-12.581) (-4.962) (-20.193) (-9.341) (-5.788) (-4.751) (0.028) (-7.355)
f irm part of domestic group -0.0470*** -0.0169** -0.0791*** -0.0311*** -0.0535*** -0.0511*** -0.0682*** -0.0666** 0.0244 -0.0485*** 0.0030 0.0842*** -0.0522*** 0.0300 -0.0200*** -0.0397*** -0.0030 -0.0636*** -0.0406*** -0.0476*** -0.0354*** -0.1809*** -0.0130 -0.0046 -0.0105
(-16.039) (-2.035) (-11.999) (-3.164) (-15.902) (-4.810) (-2.770) (-2.438) (0.510) (-4.057) (0.474) (5.112) (-3.817) (1.285) (-2.814) (-11.017) (-0.280) (-7.797) (-3.601) (-11.598) (-3.613) (-6.015) (-0.636) (-0.173) (-0.924)
manufacturing f irms 0.0892*** 0.0678*** 0.0316*** 0.0577*** 0.0868*** 0.0522*** 0.0937*** -0.1043*** 0.1426*** 0.0238** 0.0307*** -0.0386 0.0172 0.0544*** 0.0315*** 0.1013*** 0.1214*** 0.0530*** 0.0215** 0.1006*** 0.0653*** -0.0256 0.0339* 0.0223 0.0528***
(29.663) (5.817) (4.159) (6.999) (25.584) (5.262) (3.781) (-4.113) (3.532) (2.182) (4.909) (-1.632) (1.010) (2.722) (4.730) (25.061) (7.051) (5.245) (2.087) (21.892) (9.409) (-0.696) (1.785) (1.498) (6.653)
-0.0390*** -0.0242 0.0676*** -0.0858*** -0.0451*** 0.0593*** -0.0187 0.2602*** 0.0710 0.0717*** 0.0069 0.1487*** 0.0897*** -0.0839** -0.0032 -0.0123* -0.0459* 0.1023*** -0.0081 -0.0208** 0.0663*** -0.0149 0.1176*** 0.0083 0.0761***
(-6.958) (-1.328) (4.880) (-5.156) (-6.930) (3.390) (-0.449) (5.982) (1.005) (3.598) (0.589) (3.755) (2.954) (-2.153) (-0.252) (-1.653) (-1.806) (5.616) (-0.388) (-2.367) (4.328) (-0.229) (2.960) (0.236) (4.339)
-0.0140** -0.0195 0.0978*** -0.0512*** -0.0032 0.0714*** 0.0366 0.1419*** 0.0550 0.0940*** 0.0281** 0.1398*** 0.0924*** -0.0131 0.0156 -0.0244*** -0.0921*** 0.1279*** -0.0293 -0.0124 0.0475*** -0.0083 0.1314*** -0.0451 0.0541***
(-2.440) (-0.994) (6.971) (-3.008) (-0.500) (3.608) (0.790) (2.823) (0.701) (4.226) (2.159) (3.261) (2.851) (-0.301) (1.107) (-3.358) (-3.392) (7.277) (-1.446) (-1.527) (2.999) (-0.120) (3.321) (-1.274) (2.996)
-0.0127*** -0.0013 0.0349*** 0.0153 -0.0240*** 0.0241** 0.0012 0.0698** 0.0295 0.0236* 0.0110 0.0526* 0.0806*** 0.0008 0.0201** -0.0204*** -0.0466** 0.0145 0.0516*** -0.0339*** 0.0634*** -0.0248 0.1248*** 0.1063*** 0.0266**
(-3.413) (-0.101) (3.749) (1.393) (-5.768) (2.044) (0.041) (2.338) (0.665) (1.809) (1.386) (1.922) (3.764) (0.030) (2.382) (-4.236) (-2.455) (1.226) (3.816) (-6.250) (6.331) (-0.521) (4.420) (4.617) (2.357)
-0.0206*** -0.0011 0.0446*** -0.0610*** -0.0177*** 0.0196 0.0052 0.0473 -0.0100 0.0203 -0.0082 0.1266*** 0.0630** -0.0628* -0.0145 -0.0266*** -0.0724*** 0.0336** -0.0267 -0.0260*** 0.0545*** -0.0776 0.1470*** -0.0293 0.0617***
(-3.970) (-0.064) (3.565) (-4.027) (-3.033) (1.196) (0.134) (1.189) (-0.149) (1.116) (-0.770) (3.490) (2.310) (-1.845) (-1.254) (-3.879) (-2.806) (2.089) (-1.402) (-3.373) (3.950) (-1.291) (4.130) (-0.948) (3.902)
0.0294*** 0.0714*** 0.0003 0.0236*** 0.0198*** 0.0110 0.0586** -0.0578*** 0.1037*** 0.0049 -0.0020 0.0927*** -0.0209 0.0266 -0.0117** 0.0065* 0.0136 0.0005 -0.0116 -0.0038 0.0199*** -0.0855** 0.0036 0.0597*** -0.0150**
(11.147) (6.448) (0.053) (3.066) (6.837) (1.273) (2.276) (-2.856) (3.290) (0.554) (-0.360) (4.250) (-1.340) (1.512) (-2.007) (1.851) (0.793) (0.062) (-1.192) (-0.994) (2.956) (-2.282) (0.170) (3.643) (-2.044)
R&D intensity in industry -0.5229*** -0.7409*** -1.0014*** -1.3401*** -0.4394*** -0.7891*** -0.2386 -3.0930*** -3.8991*** -0.6907*** -0.2297 -0.4378 -0.4662 -2.1584*** 0.2362 -0.5905*** -0.6594** -1.2097*** -0.9705*** -0.7147*** -0.3722** -1.4228** 0.5777 -1.0922** -0.6475***
(-6.555) (-3.630) (-4.958) (-4.704) (-4.235) (-3.603) (-0.514) (-5.812) (-3.745) (-2.646) (-1.541) (-1.076) (-1.179) (-3.396) (1.369) (-5.170) (-2.270) (-3.454) (-2.712) (-4.391) (-1.994) (-2.277) (1.313) (-2.222) (-2.768)
0.1199*** 0.1658 -0.2276*** -0.0722 0.1294*** 0.0788 -0.0540 0.0209 0.7769* -0.1373 0.2021*** -0.0275 -0.4183** 0.6907*** 0.1162 0.0630* 0.0159 -0.3379*** -0.3823*** 0.1157*** -0.2515** 0.0463 -0.6867*** 0.1723 -0.1901
(3.926) (1.568) (-3.007) (-0.767) (3.795) (0.722) (-0.223) (0.076) (1.745) (-1.115) (2.859) (-0.124) (-2.257) (2.957) (1.507) (1.674) (0.106) (-3.620) (-3.429) (2.774) (-2.529) (0.118) (-3.011) (0.796) (-1.639)
-0.1005*** -0.0567 -0.2286*** 0.1276*** -0.1533*** -0.3563*** -0.4749*** -0.5592*** -0.7561*** -0.2164*** -0.2423*** -0.2867** 0.1611* -0.4556*** -0.2113*** -0.1280*** 0.0725 -0.2109*** 0.1119** -0.1906*** -0.1375*** -0.1914 -0.2085* -0.0713 -0.2422***
(-7.893) (-0.985) (-6.812) (3.391) (-11.107) (-7.521) (-3.483) (-4.474) (-4.438) (-4.276) (-7.754) (-2.411) (1.851) (-4.789) (-6.264) (-8.387) (0.900) (-5.220) (2.559) (-11.644) (-2.975) (-0.936) (-1.799) (-0.686) (-4.605)
-0.0665*** 0.1227*** -0.1789*** -0.1944*** -0.0634*** -0.1215*** -0.1703** -0.0855 -0.2421** -0.0549* -0.0342** 0.2606*** 0.0728* -0.1828*** -0.0180 -0.0337*** 0.0696 -0.2069*** -0.1078*** -0.0438*** -0.1466*** 0.1181 -0.3770*** 0.0415 -0.2052***
(-8.975) (3.711) (-9.392) (-8.855) (-7.937) (-4.094) (-2.095) (-1.172) (-2.116) (-1.759) (-2.197) (4.644) (1.653) (-3.886) (-1.068) (-3.653) (1.391) (-8.971) (-4.051) (-4.469) (-5.372) (1.014) (-5.382) (0.629) (-6.675)
0.6234*** 0.2554* 1.2682*** 0.5811*** 0.6980*** 1.1945*** 1.7811*** 1.7224*** 2.3092*** 0.7442*** 0.7166*** 0.3873 -0.2740 1.5333*** 0.6093*** 0.6844*** 0.1638 1.3320*** 0.6200*** 0.7873*** 0.9630*** 0.7475 1.5940*** 0.5587** 1.2641***
(22.443) (1.854) (17.436) (7.169) (23.263) (10.043) (4.905) (5.384) (5.505) (5.995) (10.681) (1.425) (-1.446) (7.398) (8.534) (20.692) (0.843) (15.437) (6.697) (22.167) (9.375) (1.562) (5.941) (2.223) (11.116)
R2 0.014 0.019 0.021 0.015 0.015 0.020 0.032 0.031 0.075 0.015 0.010 0.026 0.019 0.024 0.009 0.014 0.020 0.021 0.010 0.016 0.013 0.048 0.018 0.010 0.013
LL_0 -219121 -19370 -41021 -35157 -144151 -11726 -3753 -2063 -1381 -4544 -25168 -3138 -3977 -5499 -13144 -144782 -9346 -28364 -22250 -99003 -34439 -1681 -5046 -8563 -21500
LL -216721 -19101 -40370 -34779 -142263 -11483 -3659 -1999 -1296 -4431 -24894 -3062 -3901 -5398 -12960 -143263 -9210 -27945 -22090 -97712 -34099 -1621 -4979 -8503 -21262
R2 adjusted 0.0140 0.0182 0.0212 0.0151 0.0151 0.0193 0.0291 0.0276 0.0686 0.0144 0.00950 0.0231 0.0169 0.0221 0.00902 0.0139 0.0190 0.0202 0.00964 0.0157 0.0129 0.0419 0.0157 0.00891 0.0130
Source: CIS 2006 micro data accessed at the Eurostat safe centre, WIFO calculations.
all countries country group 1 country group 2 country group 3 country group 4
Information on Technology Information on Technology
Basicness of know ledge in industry
Cumulativeness of know ledge in industry
Importance of embodied technology in Industry
industry w ith high innovation intensity
f irm active on international markets
fast grow ing SMEs Birch Index
Information on Technology Information on Technology Information on Technology
Constant
industry w ith low innovation intensity
industry w ith medium-low innovation intensity
industry w ith medium innovation intensity
industry w ith medium-high innovation intensity
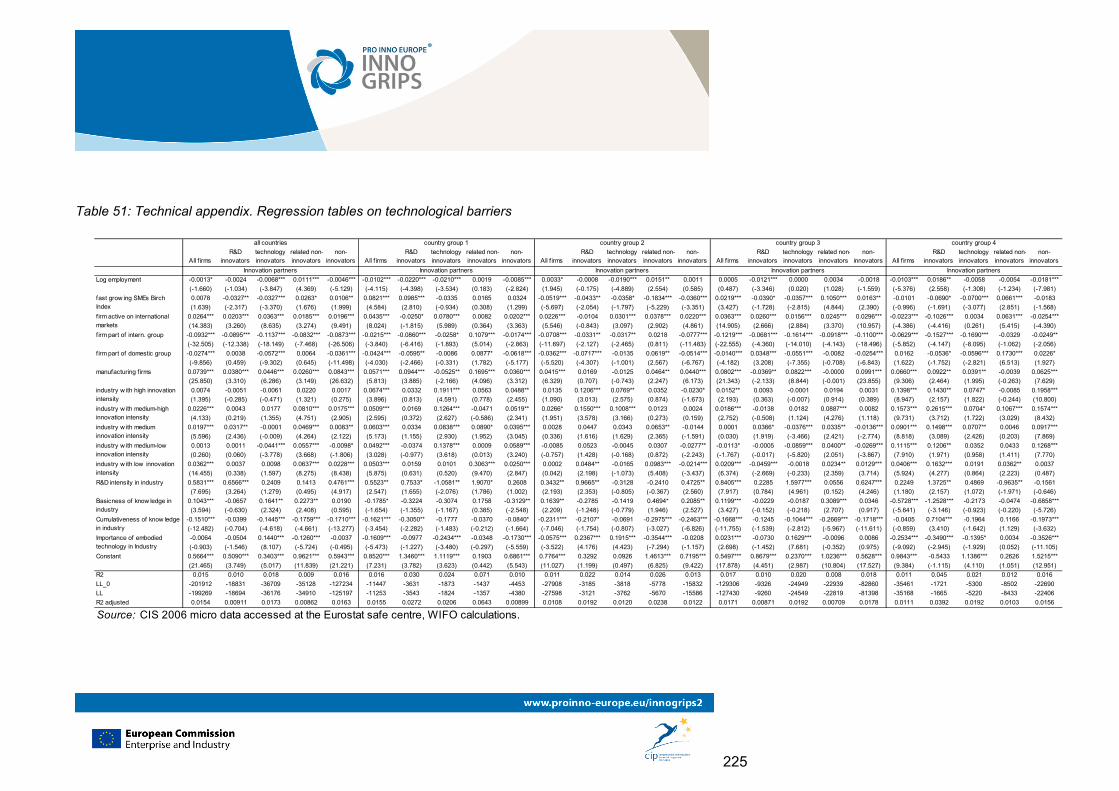
225
Table 51: Technical appendix. Regression tables on technological barriers
All f irmsR&D
innovatorstechnology innovators
related non-innovators
non-innovators All f irms
R&D innovators
technology innovators
related non-innovators
non-innovators All f irms
R&D innovators
technology innovators
related non-innovators
non-innovators All f irms
R&D innovators
technology innovators
related non-innovators
non-innovators All f irms
R&D innovators
technology innovators
related non-innovators
non-innovators
Log employment -0.0013* -0.0024 -0.0068*** 0.0111*** -0.0046*** -0.0102*** -0.0220*** -0.0210*** 0.0019 -0.0085*** 0.0033* -0.0008 -0.0190*** 0.0151** 0.0011 0.0005 -0.0121*** 0.0000 0.0034 -0.0018 -0.0103*** 0.0186** -0.0058 -0.0054 -0.0181***
(-1.660) (-1.034) (-3.847) (4.369) (-5.129) (-4.115) (-4.398) (-3.534) (0.183) (-2.824) (1.945) (-0.175) (-4.889) (2.554) (0.585) (0.487) (-3.346) (0.020) (1.028) (-1.559) (-5.376) (2.558) (-1.308) (-1.234) (-7.981)
0.0078 -0.0327** -0.0327*** 0.0263* 0.0106** 0.0821*** 0.0985*** -0.0335 0.0165 0.0324 -0.0519*** -0.0433** -0.0358* -0.1834*** -0.0360*** 0.0219*** -0.0390* -0.0357*** 0.1050*** 0.0163** -0.0101 -0.0690* -0.0700*** 0.0661*** -0.0183
(1.639) (-2.317) (-3.370) (1.676) (1.999) (4.584) (2.810) (-0.934) (0.308) (1.299) (-5.697) (-2.054) (-1.797) (-5.229) (-3.351) (3.427) (-1.728) (-2.815) (4.844) (2.390) (-0.996) (-1.691) (-3.077) (2.851) (-1.568)
0.0264*** 0.0203*** 0.0363*** 0.0185*** 0.0196*** 0.0435*** -0.0250* 0.0780*** 0.0082 0.0202*** 0.0226*** -0.0104 0.0301*** 0.0378*** 0.0220*** 0.0363*** 0.0260*** 0.0156*** 0.0245*** 0.0296*** -0.0223*** -0.1026*** 0.0034 0.0631*** -0.0254***
(14.383) (3.260) (8.635) (3.274) (9.491) (8.024) (-1.815) (5.989) (0.364) (3.363) (5.546) (-0.843) (3.097) (2.902) (4.861) (14.905) (2.666) (2.884) (3.370) (10.957) (-4.386) (-4.416) (0.261) (5.415) (-4.390)
f irm part of intern. group -0.0932*** -0.0895*** -0.1137*** -0.0832*** -0.0873*** -0.0215*** -0.0860*** -0.0258* 0.1079*** -0.0174*** -0.0708*** -0.0331** -0.0317** 0.0218 -0.0777*** -0.1219*** -0.0681*** -0.1614*** -0.0918*** -0.1100*** -0.0629*** -0.1527*** -0.1690*** -0.0329 -0.0249**
(-32.505) (-12.338) (-18.149) (-7.468) (-26.506) (-3.840) (-6.416) (-1.893) (5.014) (-2.863) (-11.697) (-2.127) (-2.465) (0.811) (-11.483) (-22.555) (-4.360) (-14.010) (-4.143) (-18.496) (-5.852) (-4.147) (-8.095) (-1.062) (-2.056)
f irm part of domestic group -0.0274*** 0.0038 -0.0572*** 0.0064 -0.0361*** -0.0424*** -0.0595** -0.0086 0.0877* -0.0618*** -0.0362*** -0.0717*** -0.0135 0.0619** -0.0514*** -0.0140*** 0.0348*** -0.0551*** -0.0082 -0.0254*** 0.0162 -0.0536* -0.0596*** 0.1730*** 0.0226*
(-9.856) (0.459) (-9.302) (0.645) (-11.498) (-4.030) (-2.466) (-0.331) (1.782) (-5.177) (-5.520) (-4.307) (-1.001) (2.567) (-6.767) (-4.182) (3.208) (-7.355) (-0.708) (-6.843) (1.622) (-1.752) (-2.821) (6.513) (1.927)
manufacturing f irms 0.0739*** 0.0380*** 0.0446*** 0.0260*** 0.0843*** 0.0571*** 0.0944*** -0.0525** 0.1695*** 0.0360*** 0.0415*** 0.0169 -0.0125 0.0464** 0.0440*** 0.0802*** -0.0369** 0.0822*** -0.0000 0.0991*** 0.0660*** 0.0922** 0.0391** -0.0039 0.0625***
(25.850) (3.310) (6.286) (3.149) (26.632) (5.813) (3.885) (-2.166) (4.096) (3.312) (6.329) (0.707) (-0.743) (2.247) (6.173) (21.343) (-2.133) (8.844) (-0.001) (23.855) (9.306) (2.464) (1.995) (-0.263) (7.629)
0.0074 -0.0051 -0.0061 0.0220 0.0017 0.0674*** 0.0332 0.1911*** 0.0563 0.0488** 0.0135 0.1206*** 0.0769** 0.0352 -0.0230* 0.0152** 0.0093 -0.0001 0.0194 0.0031 0.1398*** 0.1430** 0.0747* -0.0085 0.1958***
(1.395) (-0.285) (-0.471) (1.321) (0.275) (3.896) (0.813) (4.591) (0.778) (2.455) (1.090) (3.013) (2.575) (0.874) (-1.673) (2.193) (0.363) (-0.007) (0.914) (0.389) (8.947) (2.157) (1.822) (-0.244) (10.800)
0.0226*** 0.0043 0.0177 0.0810*** 0.0175*** 0.0509*** 0.0169 0.1264*** -0.0471 0.0519** 0.0266* 0.1550*** 0.1008*** 0.0123 0.0024 0.0186*** -0.0138 0.0182 0.0887*** 0.0082 0.1573*** 0.2615*** 0.0704* 0.1067*** 0.1574***
(4.133) (0.219) (1.355) (4.751) (2.905) (2.595) (0.372) (2.627) (-0.586) (2.341) (1.951) (3.578) (3.166) (0.273) (0.159) (2.752) (-0.508) (1.124) (4.276) (1.118) (9.731) (3.712) (1.722) (3.029) (8.432)
0.0197*** 0.0317** -0.0001 0.0469*** 0.0083** 0.0603*** 0.0334 0.0838*** 0.0890* 0.0395*** 0.0028 0.0447 0.0343 0.0653** -0.0144 0.0001 0.0366* -0.0376*** 0.0335** -0.0136*** 0.0901*** 0.1498*** 0.0707** 0.0046 0.0917***
(5.596) (2.436) (-0.009) (4.264) (2.122) (5.173) (1.155) (2.930) (1.952) (3.045) (0.336) (1.616) (1.629) (2.365) (-1.591) (0.030) (1.919) (-3.466) (2.421) (-2.774) (8.818) (3.089) (2.426) (0.203) (7.869)
0.0013 0.0011 -0.0441*** 0.0557*** -0.0098* 0.0492*** -0.0374 0.1378*** 0.0009 0.0589*** -0.0085 0.0523 -0.0045 0.0307 -0.0277** -0.0113* -0.0005 -0.0859*** 0.0400** -0.0269*** 0.1115*** 0.1206** 0.0352 0.0433 0.1268***
(0.260) (0.060) (-3.778) (3.668) (-1.806) (3.028) (-0.977) (3.618) (0.013) (3.240) (-0.757) (1.428) (-0.168) (0.872) (-2.243) (-1.767) (-0.017) (-5.820) (2.051) (-3.867) (7.910) (1.971) (0.958) (1.411) (7.770)
0.0362*** 0.0037 0.0098 0.0637*** 0.0228*** 0.0503*** 0.0159 0.0101 0.3063*** 0.0250*** 0.0002 0.0484** -0.0165 0.0983*** -0.0214*** 0.0209*** -0.0459*** -0.0018 0.0234** 0.0129*** 0.0406*** 0.1632*** 0.0191 0.0362** 0.0037
(14.455) (0.338) (1.597) (8.275) (8.438) (5.875) (0.631) (0.520) (9.470) (2.847) (0.042) (2.198) (-1.073) (5.408) (-3.437) (6.374) (-2.669) (-0.233) (2.359) (3.714) (5.924) (4.277) (0.864) (2.223) (0.487)
R&D intensity in industry 0.5831*** 0.6566*** 0.2409 0.1413 0.4761*** 0.5523** 0.7533* -1.0581** 1.9070* 0.2608 0.3432** 0.9665** -0.3128 -0.2410 0.4725** 0.8405*** 0.2285 1.5977*** 0.0556 0.6247*** 0.2249 1.3725** 0.4869 -0.9635** -0.1561
(7.695) (3.264) (1.279) (0.495) (4.917) (2.547) (1.655) (-2.076) (1.786) (1.002) (2.193) (2.353) (-0.805) (-0.367) (2.560) (7.917) (0.784) (4.961) (0.152) (4.246) (1.180) (2.157) (1.072) (-1.971) (-0.646)
0.1043*** -0.0657 0.1641** 0.2273** 0.0190 -0.1785* -0.3224 -0.3074 0.1758 -0.3129** 0.1639** -0.2785 -0.1419 0.4694* 0.2085** 0.1199*** -0.0229 -0.0187 0.3089*** 0.0346 -0.5728*** -1.2528*** -0.2173 -0.0474 -0.6858***
(3.594) (-0.630) (2.324) (2.408) (0.595) (-1.654) (-1.355) (-1.167) (0.385) (-2.548) (2.209) (-1.248) (-0.779) (1.946) (2.527) (3.427) (-0.152) (-0.218) (2.707) (0.917) (-5.641) (-3.146) (-0.923) (-0.220) (-5.726)
-0.1510*** -0.0399 -0.1445*** -0.1759*** -0.1710*** -0.1621*** -0.3050** -0.1777 -0.0370 -0.0840* -0.2311*** -0.2107* -0.0691 -0.2975*** -0.2463*** -0.1668*** -0.1245 -0.1044*** -0.2669*** -0.1718*** -0.0405 0.7104*** -0.1964 0.1166 -0.1973***
(-12.482) (-0.704) (-4.618) (-4.661) (-13.277) (-3.454) (-2.282) (-1.483) (-0.212) (-1.664) (-7.046) (-1.754) (-0.807) (-3.027) (-6.826) (-11.755) (-1.539) (-2.812) (-5.967) (-11.611) (-0.859) (3.410) (-1.642) (1.129) (-3.632)
-0.0064 -0.0504 0.1440*** -0.1260*** -0.0037 -0.1609*** -0.0977 -0.2434*** -0.0348 -0.1730*** -0.0575*** 0.2367*** 0.1915*** -0.3544*** -0.0208 0.0231*** -0.0730 0.1629*** -0.0096 0.0086 -0.2534*** -0.3490*** -0.1395* 0.0034 -0.3526***
(-0.903) (-1.546) (8.107) (-5.724) (-0.495) (-5.473) (-1.227) (-3.480) (-0.297) (-5.559) (-3.522) (4.176) (4.423) (-7.294) (-1.157) (2.698) (-1.452) (7.681) (-0.352) (0.975) (-9.092) (-2.945) (-1.929) (0.052) (-11.105)
0.5664*** 0.5090*** 0.3403*** 0.9621*** 0.5943*** 0.8520*** 1.3460*** 1.1119*** 0.1903 0.6861*** 0.7764*** 0.3292 0.0926 1.4613*** 0.7195*** 0.5497*** 0.8679*** 0.2370*** 1.0236*** 0.5628*** 0.9843*** -0.5433 1.1386*** 0.2626 1.5215***
(21.465) (3.749) (5.017) (11.839) (21.221) (7.231) (3.782) (3.623) (0.442) (5.543) (11.027) (1.199) (0.497) (6.825) (9.422) (17.878) (4.451) (2.987) (10.804) (17.527) (9.384) (-1.115) (4.110) (1.051) (12.951)
R2 0.015 0.010 0.018 0.009 0.016 0.016 0.030 0.024 0.071 0.010 0.011 0.022 0.014 0.026 0.013 0.017 0.010 0.020 0.008 0.018 0.011 0.045 0.021 0.012 0.016
LL_0 -201912 -18831 -36709 -35128 -127234 -11447 -3631 -1873 -1437 -4453 -27908 -3185 -3818 -5778 -15832 -129306 -9326 -24949 -22939 -82860 -35461 -1721 -5300 -8502 -22690
LL -199269 -18694 -36176 -34910 -125197 -11253 -3543 -1824 -1357 -4380 -27598 -3121 -3762 -5670 -15586 -127430 -9260 -24549 -22819 -81398 -35168 -1665 -5220 -8433 -22406
R2 adjusted 0.0154 0.00911 0.0173 0.00862 0.0163 0.0155 0.0272 0.0206 0.0643 0.00899 0.0108 0.0192 0.0120 0.0238 0.0122 0.0171 0.00871 0.0192 0.00709 0.0178 0.0111 0.0392 0.0192 0.0103 0.0156
Source: CIS 2006 micro data accessed at the Eurostat safe centre, WIFO calculations.
country group 1 country group 2 country group 3 country group 4
Innovation partners Innovation partners Innovation partners Innovation partners Innovation partners
all countries
industry w ith low innovation intensity
Basicness of know ledge in industry
Cumulativeness of know ledge in industry
Importance of embodied technology in Industry
Constant
industry w ith medium-low innovation intensity
fast grow ing SMEs Birch Index
firm active on international markets
industry w ith high innovation intensity
industry w ith medium-high innovation intensity
industry w ith medium innovation intensity
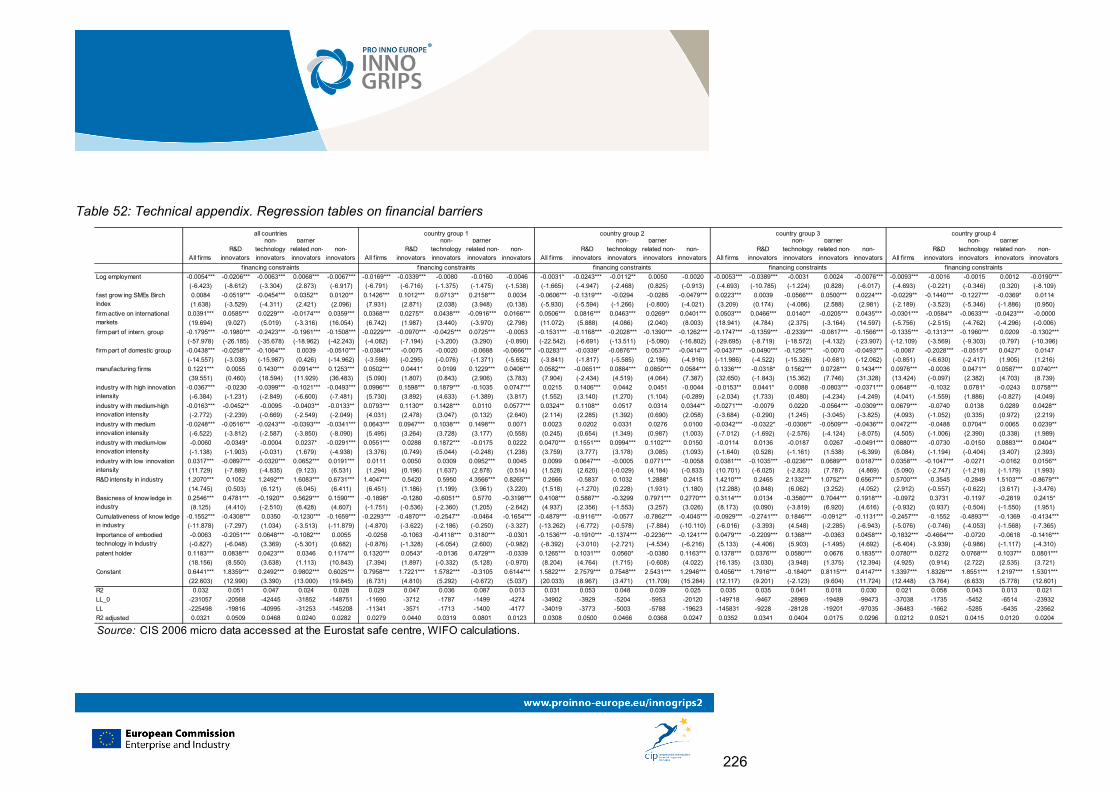
226
Table 52: Technical appendix. Regression tables on financial barriers
All f irmsR&D
innovators
non-technology innovators
barrier related non-innovators
non-innovators All f irms
R&D innovators
non-technology innovators
barrier related non-innovators
non-innovators All f irms
R&D innovators
non-technology innovators
barrier related non-innovators
non-innovators All f irms
R&D innovators
non-technology innovators
barrier related non-innovators
non-innovators All f irms
R&D innovators
non-technology innovators
barrier related non-innovators
non-innovators
Log employment -0.0054*** -0.0206*** -0.0063*** 0.0068*** -0.0067*** -0.0169*** -0.0339*** -0.0080 -0.0160 -0.0046 -0.0031* -0.0243*** -0.0112** 0.0050 -0.0020 -0.0053*** -0.0389*** -0.0031 0.0024 -0.0076*** -0.0093*** -0.0016 -0.0015 0.0012 -0.0190***
(-6.423) (-8.612) (-3.304) (2.873) (-6.917) (-6.791) (-6.716) (-1.375) (-1.475) (-1.538) (-1.665) (-4.947) (-2.468) (0.825) (-0.913) (-4.693) (-10.785) (-1.224) (0.828) (-6.017) (-4.693) (-0.221) (-0.346) (0.320) (-8.109)
0.0084 -0.0519*** -0.0454*** 0.0352** 0.0120** 0.1426*** 0.1012*** 0.0713** 0.2158*** 0.0034 -0.0606*** -0.1319*** -0.0294 -0.0285 -0.0479*** 0.0223*** 0.0039 -0.0566*** 0.0500*** 0.0224*** -0.0229** -0.1440*** -0.1227*** -0.0369* 0.0114
(1.638) (-3.529) (-4.311) (2.421) (2.096) (7.931) (2.871) (2.038) (3.948) (0.138) (-5.930) (-5.594) (-1.266) (-0.800) (-4.021) (3.209) (0.174) (-4.086) (2.588) (2.981) (-2.189) (-3.523) (-5.346) (-1.886) (0.950)
0.0391*** 0.0585*** 0.0229*** -0.0174*** 0.0359*** 0.0368*** 0.0275** 0.0438*** -0.0916*** 0.0166*** 0.0506*** 0.0816*** 0.0463*** 0.0269** 0.0401*** 0.0503*** 0.0466*** 0.0140** -0.0205*** 0.0435*** -0.0301*** -0.0584** -0.0633*** -0.0423*** -0.0000
(19.694) (9.027) (5.019) (-3.316) (16.054) (6.742) (1.987) (3.440) (-3.970) (2.798) (11.072) (5.888) (4.086) (2.040) (8.003) (18.941) (4.784) (2.375) (-3.164) (14.597) (-5.756) (-2.515) (-4.762) (-4.296) (-0.006)
f irm part of intern. group -0.1795*** -0.1980*** -0.2423*** -0.1961*** -0.1508*** -0.0229*** -0.0970*** -0.0425*** 0.0725*** -0.0053 -0.1531*** -0.1168*** -0.2028*** -0.1390*** -0.1262*** -0.1747*** -0.1359*** -0.2339*** -0.0817*** -0.1566*** -0.1335*** -0.1313*** -0.1960*** 0.0209 -0.1302***
(-57.978) (-26.185) (-35.678) (-18.962) (-42.243) (-4.082) (-7.194) (-3.200) (3.290) (-0.890) (-22.542) (-6.691) (-13.511) (-5.090) (-16.802) (-29.695) (-8.719) (-18.572) (-4.132) (-23.907) (-12.109) (-3.569) (-9.303) (0.797) (-10.396)
f irm part of domestic group -0.0438*** -0.0258*** -0.1064*** 0.0039 -0.0510*** -0.0384*** -0.0075 -0.0020 -0.0688 -0.0666*** -0.0283*** -0.0339* -0.0876*** 0.0537** -0.0414*** -0.0437*** -0.0490*** -0.1256*** -0.0070 -0.0493*** -0.0087 -0.2028*** -0.0515** 0.0427* 0.0147
(-14.557) (-3.038) (-15.987) (0.426) (-14.962) (-3.598) (-0.295) (-0.076) (-1.371) (-5.652) (-3.841) (-1.817) (-5.585) (2.196) (-4.916) (-11.986) (-4.522) (-15.326) (-0.681) (-12.062) (-0.851) (-6.630) (-2.417) (1.905) (1.216)
manufacturing f irms 0.1221*** 0.0055 0.1430*** 0.0914*** 0.1253*** 0.0502*** 0.0441* 0.0199 0.1229*** 0.0406*** 0.0582*** -0.0651** 0.0884*** 0.0850*** 0.0584*** 0.1336*** -0.0318* 0.1562*** 0.0728*** 0.1434*** 0.0976*** -0.0036 0.0471** 0.0587*** 0.0740***
(39.551) (0.460) (18.594) (11.929) (36.483) (5.090) (1.807) (0.843) (2.906) (3.783) (7.904) (-2.434) (4.519) (4.064) (7.387) (32.650) (-1.843) (15.362) (7.746) (31.328) (13.424) (-0.097) (2.382) (4.703) (8.739)
-0.0367*** -0.0230 -0.0399*** -0.1021*** -0.0493*** 0.0996*** 0.1598*** 0.1879*** -0.1035 0.0747*** 0.0215 0.1406*** 0.0442 0.0451 -0.0044 -0.0153** 0.0441* 0.0088 -0.0803*** -0.0371*** 0.0648*** -0.1032 0.0781* -0.0243 0.0758***
(-6.384) (-1.231) (-2.849) (-6.600) (-7.481) (5.730) (3.892) (4.633) (-1.389) (3.817) (1.552) (3.140) (1.270) (1.104) (-0.289) (-2.034) (1.733) (0.480) (-4.234) (-4.249) (4.041) (-1.559) (1.886) (-0.827) (4.049)
-0.0163*** -0.0452** -0.0095 -0.0403** -0.0133** 0.0793*** 0.1130** 0.1428*** 0.0110 0.0577*** 0.0324** 0.1108** 0.0517 0.0314 0.0344** -0.0271*** -0.0079 0.0220 -0.0564*** -0.0309*** 0.0679*** -0.0740 0.0138 0.0289 0.0428**
(-2.772) (-2.239) (-0.669) (-2.549) (-2.049) (4.031) (2.478) (3.047) (0.132) (2.640) (2.114) (2.285) (1.392) (0.690) (2.058) (-3.684) (-0.290) (1.245) (-3.045) (-3.825) (4.093) (-1.052) (0.335) (0.972) (2.219)
-0.0248*** -0.0516*** -0.0243*** -0.0393*** -0.0341*** 0.0643*** 0.0947*** 0.1038*** 0.1498*** 0.0071 0.0023 0.0202 0.0331 0.0276 0.0100 -0.0342*** -0.0322* -0.0306** -0.0509*** -0.0436*** 0.0472*** -0.0488 0.0704** 0.0065 0.0239**
(-6.522) (-3.812) (-2.587) (-3.850) (-8.090) (5.495) (3.264) (3.728) (3.177) (0.558) (0.245) (0.654) (1.349) (0.987) (1.003) (-7.012) (-1.692) (-2.576) (-4.124) (-8.075) (4.505) (-1.006) (2.390) (0.338) (1.989)
-0.0060 -0.0349* -0.0004 0.0237* -0.0291*** 0.0551*** 0.0288 0.1872*** -0.0175 0.0222 0.0470*** 0.1551*** 0.0994*** 0.1102*** 0.0150 -0.0114 0.0136 -0.0187 0.0267 -0.0491*** 0.0880*** -0.0730 -0.0150 0.0883*** 0.0404**
(-1.138) (-1.903) (-0.031) (1.679) (-4.938) (3.376) (0.749) (5.044) (-0.248) (1.238) (3.759) (3.777) (3.178) (3.085) (1.093) (-1.640) (0.528) (-1.161) (1.538) (-6.399) (6.084) (-1.194) (-0.404) (3.407) (2.393)
0.0317*** -0.0897*** -0.0320*** 0.0652*** 0.0191*** 0.0111 0.0050 0.0309 0.0952*** 0.0045 0.0099 0.0647*** -0.0005 0.0771*** -0.0058 0.0381*** -0.1035*** -0.0236*** 0.0689*** 0.0187*** 0.0358*** -0.1047*** -0.0271 -0.0162 0.0156**
(11.729) (-7.889) (-4.835) (9.123) (6.531) (1.294) (0.196) (1.637) (2.878) (0.514) (1.528) (2.620) (-0.029) (4.184) (-0.833) (10.701) (-6.025) (-2.823) (7.787) (4.869) (5.090) (-2.747) (-1.218) (-1.179) (1.993)
R&D intensity in industry 1.2070*** 0.1052 1.2492*** 1.6083*** 0.6731*** 1.4047*** 0.5420 0.5950 4.3566*** 0.8265*** 0.2666 -0.5837 0.1032 1.2888* 0.2415 1.4210*** 0.2465 2.1332*** 1.0752*** 0.6567*** 0.5700*** -0.3545 -0.2849 1.5103*** -0.8679***
(14.745) (0.503) (6.121) (6.045) (6.411) (6.451) (1.186) (1.199) (3.961) (3.220) (1.518) (-1.270) (0.228) (1.931) (1.180) (12.288) (0.848) (6.062) (3.252) (4.052) (2.912) (-0.557) (-0.622) (3.617) (-3.476)
0.2546*** 0.4781*** -0.1920** 0.5629*** 0.1590*** -0.1898* -0.1280 -0.6051** 0.5770 -0.3198*** 0.4108*** 0.5887** -0.3299 0.7971*** 0.2770*** 0.3114*** 0.0134 -0.3580*** 0.7044*** 0.1918*** -0.0972 0.3731 -0.1197 -0.2819 0.2415*
(8.125) (4.410) (-2.510) (6.428) (4.607) (-1.751) (-0.536) (-2.360) (1.205) (-2.642) (4.937) (2.356) (-1.553) (3.257) (3.026) (8.173) (0.090) (-3.819) (6.920) (4.616) (-0.932) (0.937) (-0.504) (-1.550) (1.951)
-0.1552*** -0.4308*** 0.0350 -0.1230*** -0.1659*** -0.2293*** -0.4870*** -0.2547** -0.0464 -0.1654*** -0.4879*** -0.9116*** -0.0577 -0.7862*** -0.4045*** -0.0929*** -0.2741*** 0.1846*** -0.0912** -0.1131*** -0.2457*** -0.1552 -0.4893*** -0.1369 -0.4134***
(-11.878) (-7.297) (1.034) (-3.513) (-11.879) (-4.870) (-3.622) (-2.186) (-0.250) (-3.327) (-13.262) (-6.772) (-0.578) (-7.884) (-10.110) (-6.016) (-3.393) (4.548) (-2.285) (-6.943) (-5.076) (-0.746) (-4.053) (-1.568) (-7.365)
-0.0063 -0.2051*** 0.0648*** -0.1082*** 0.0055 -0.0258 -0.1063 -0.4118*** 0.3180*** -0.0301 -0.1536*** -0.1910*** -0.1374*** -0.2236*** -0.1241*** 0.0479*** -0.2209*** 0.1368*** -0.0363 0.0458*** -0.1832*** -0.4664*** -0.0720 -0.0618 -0.1416***
(-0.827) (-6.048) (3.369) (-5.301) (0.682) (-0.876) (-1.328) (-6.054) (2.600) (-0.982) (-8.392) (-3.010) (-2.721) (-4.534) (-6.216) (5.133) (-4.406) (5.903) (-1.495) (4.692) (-6.404) (-3.939) (-0.986) (-1.117) (-4.310)
0.1183*** 0.0838*** 0.0423*** 0.0346 0.1174*** 0.1320*** 0.0543* -0.0136 0.4729*** -0.0339 0.1265*** 0.1031*** 0.0560* -0.0380 0.1163*** 0.1378*** 0.0376*** 0.0580*** 0.0676 0.1835*** 0.0780*** 0.0272 0.0768*** 0.1037** 0.0801***
(18.156) (8.550) (3.638) (1.113) (10.843) (7.394) (1.897) (-0.332) (5.128) (-0.970) (8.204) (4.764) (1.715) (-0.608) (4.022) (16.135) (3.030) (3.948) (1.375) (12.394) (4.925) (0.914) (2.722) (2.535) (3.721)
0.6441*** 1.8359*** 0.2492*** 0.9802*** 0.6025*** 0.7958*** 1.7221*** 1.5782*** -0.3105 0.6144*** 1.5822*** 2.7579*** 0.7548*** 2.5431*** 1.2946*** 0.4056*** 1.7916*** -0.1840** 0.8115*** 0.4147*** 1.3397*** 1.8326*** 1.8551*** 1.2197*** 1.5301***
(22.603) (12.990) (3.390) (13.000) (19.845) (6.731) (4.810) (5.292) (-0.672) (5.037) (20.033) (8.967) (3.471) (11.709) (15.284) (12.117) (9.201) (-2.123) (9.604) (11.724) (12.448) (3.764) (6.633) (5.778) (12.601)
R2 0.032 0.051 0.047 0.024 0.028 0.029 0.047 0.036 0.087 0.013 0.031 0.053 0.048 0.039 0.025 0.035 0.035 0.041 0.018 0.030 0.021 0.058 0.043 0.013 0.021
LL_0 -231057 -20568 -42445 -31852 -148751 -11690 -3712 -1787 -1499 -4274 -34902 -3929 -5204 -5953 -20120 -149718 -9467 -28969 -19489 -99473 -37038 -1735 -5452 -6514 -23932
LL -225498 -19816 -40995 -31253 -145208 -11341 -3571 -1713 -1400 -4177 -34019 -3773 -5003 -5788 -19623 -145831 -9228 -28128 -19201 -97035 -36483 -1662 -5285 -6435 -23562
R2 adjusted 0.0321 0.0509 0.0468 0.0240 0.0282 0.0279 0.0440 0.0319 0.0801 0.0123 0.0308 0.0500 0.0466 0.0368 0.0247 0.0352 0.0341 0.0404 0.0175 0.0296 0.0212 0.0521 0.0415 0.0120 0.0204
Source: CIS 2006 micro data accessed at the Eurostat safe centre, WIFO calculations.
industry w ith medium-low innovation intensity
fast grow ing SMEs Birch Index
firm active on international markets
industry w ith high innovation intensity
industry w ith medium-high innovation intensity
industry w ith medium innovation intensity
industry w ith low innovation intensity
Basicness of know ledge in industry
Cumulativeness of know ledge in industry
Importance of embodied technology in Industry
Constant
patent holder
f inancing constraints f inancing constraints f inancing constraints f inancing constraints f inancing constraints
all countries country group 1 country group 2 country group 3 country group 4
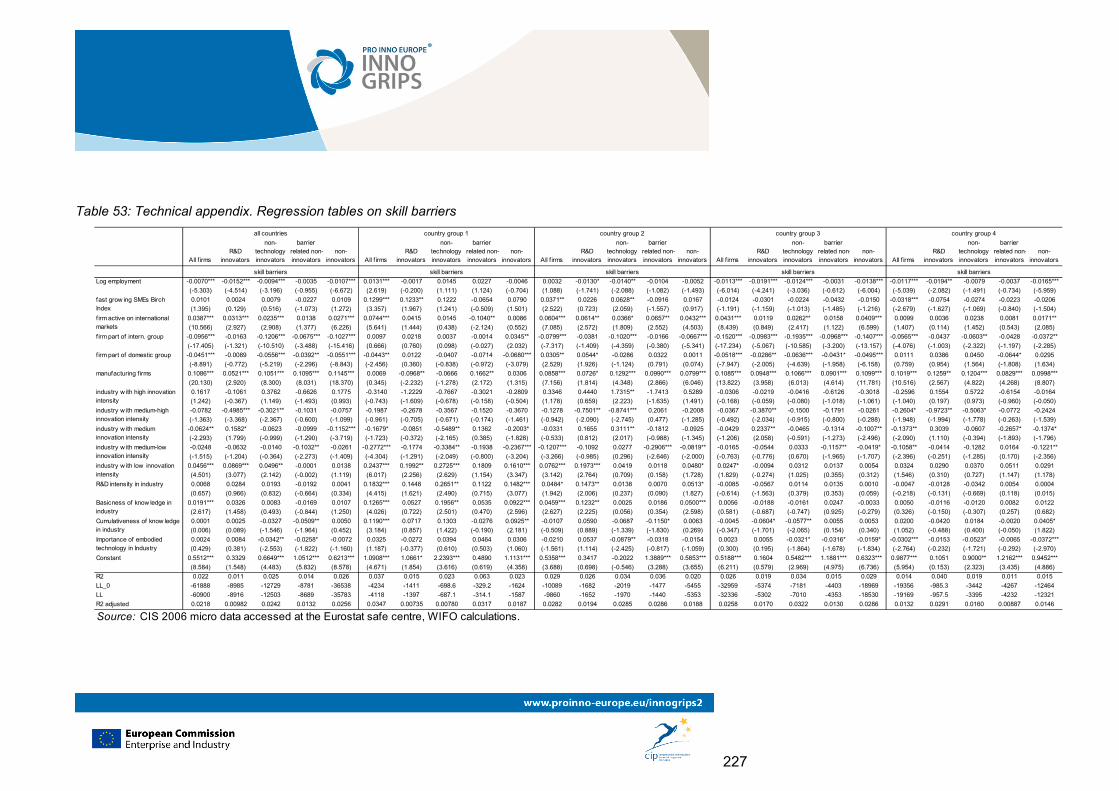
227
Table 53: Technical appendix. Regression tables on skill barriers
All f irmsR&D
innovators
non-technology innovators
barrier related non-innovators
non-innovators All f irms
R&D innovators
non-technology innovators
barrier related non-innovators
non-innovators All f irms
R&D innovators
non-technology innovators
barrier related non-innovators
non-innovators All f irms
R&D innovators
non-technology innovators
barrier related non-innovators
non-innovators All f irms
R&D innovators
non-technology innovators
barrier related non-innovators
non-innovators
Log employment -0.0070*** -0.0152*** -0.0094*** -0.0035 -0.0107*** 0.0131*** -0.0017 0.0145 0.0227 -0.0046 0.0032 -0.0130* -0.0140** -0.0104 -0.0052 -0.0113*** -0.0191*** -0.0124*** -0.0031 -0.0138*** -0.0117*** -0.0194** -0.0079 -0.0037 -0.0165***
(-5.303) (-4.514) (-3.196) (-0.955) (-6.672) (2.619) (-0.200) (1.111) (1.124) (-0.704) (1.088) (-1.741) (-2.088) (-1.082) (-1.493) (-6.014) (-4.241) (-3.036) (-0.612) (-6.004) (-5.039) (-2.082) (-1.491) (-0.734) (-5.959)
0.0101 0.0024 0.0079 -0.0227 0.0109 0.1299*** 0.1233** 0.1222 -0.0654 0.0790 0.0371** 0.0226 0.0628** -0.0916 0.0167 -0.0124 -0.0301 -0.0224 -0.0432 -0.0150 -0.0318*** -0.0754 -0.0274 -0.0223 -0.0206
(1.395) (0.129) (0.516) (-1.073) (1.272) (3.357) (1.967) (1.241) (-0.509) (1.501) (2.522) (0.723) (2.059) (-1.557) (0.917) (-1.191) (-1.159) (-1.013) (-1.485) (-1.216) (-2.679) (-1.627) (-1.069) (-0.840) (-1.504)
0.0387*** 0.0313*** 0.0235*** 0.0138 0.0271*** 0.0744*** 0.0415 0.0145 -0.1040** 0.0086 0.0604*** 0.0614** 0.0366* 0.0657** 0.0432*** 0.0431*** 0.0119 0.0262** 0.0158 0.0409*** 0.0099 0.0036 0.0238 0.0081 0.0171**
(10.566) (2.927) (2.908) (1.377) (6.226) (5.641) (1.444) (0.438) (-2.124) (0.552) (7.085) (2.572) (1.809) (2.552) (4.503) (8.439) (0.849) (2.417) (1.122) (6.599) (1.407) (0.114) (1.452) (0.543) (2.085)
f irm part of intern. group -0.0956*** -0.0163 -0.1206*** -0.0675*** -0.1027*** 0.0097 0.0218 0.0037 -0.0014 0.0345** -0.0799*** -0.0381 -0.1020*** -0.0166 -0.0667*** -0.1520*** -0.0983*** -0.1935*** -0.0968*** -0.1407*** -0.0565*** -0.0437 -0.0603** -0.0428 -0.0372**
(-17.405) (-1.321) (-10.510) (-3.488) (-15.416) (0.666) (0.760) (0.098) (-0.027) (2.032) (-7.317) (-1.409) (-4.359) (-0.380) (-5.341) (-17.234) (-5.067) (-10.585) (-3.200) (-13.157) (-4.076) (-1.003) (-2.322) (-1.197) (-2.285)
f irm part of domestic group -0.0451*** -0.0089 -0.0556*** -0.0392** -0.0551*** -0.0443** 0.0122 -0.0407 -0.0714 -0.0680*** 0.0305** 0.0544* -0.0286 0.0322 0.0011 -0.0518*** -0.0286** -0.0636*** -0.0431* -0.0495*** 0.0111 0.0386 0.0450 -0.0644* 0.0295
(-8.891) (-0.772) (-5.219) (-2.296) (-8.843) (-2.456) (0.360) (-0.838) (-0.972) (-3.079) (2.529) (1.926) (-1.124) (0.791) (0.074) (-7.947) (-2.005) (-4.639) (-1.958) (-6.158) (0.759) (0.954) (1.564) (-1.808) (1.634)
manufacturing f irms 0.1086*** 0.0521*** 0.1051*** 0.1095*** 0.1145*** 0.0069 -0.0968** -0.0666 0.1662** 0.0306 0.0858*** 0.0726* 0.1292*** 0.0990*** 0.0799*** 0.1085*** 0.0948*** 0.1066*** 0.0901*** 0.1099*** 0.1019*** 0.1259** 0.1204*** 0.0829*** 0.0998***
(20.130) (2.920) (8.300) (8.031) (18.370) (0.345) (-2.232) (-1.278) (2.172) (1.315) (7.156) (1.814) (4.348) (2.866) (6.046) (13.822) (3.958) (6.013) (4.614) (11.781) (10.516) (2.567) (4.822) (4.268) (8.807)
0.1617 -0.1061 0.3762 -0.6626 0.1775 -0.3140 -1.2229 -0.7667 -0.3021 -0.2809 0.3346 0.4440 1.7315** -1.7413 0.5289 -0.0306 -0.0219 -0.0416 -0.6126 -0.3018 -0.2596 0.1554 0.5722 -0.6154 -0.0164
(1.242) (-0.367) (1.149) (-1.493) (0.993) (-0.743) (-1.609) (-0.678) (-0.158) (-0.504) (1.178) (0.659) (2.223) (-1.635) (1.491) (-0.168) (-0.059) (-0.080) (-1.018) (-1.061) (-1.040) (0.197) (0.973) (-0.960) (-0.050)
-0.0782 -0.4985*** -0.3021** -0.1031 -0.0757 -0.1987 -0.2678 -0.3567 -0.1520 -0.3670 -0.1278 -0.7501** -0.8741*** 0.2061 -0.2008 -0.0367 -0.3870** -0.1500 -0.1791 -0.0261 -0.2604* -0.9723** -0.5063* -0.0772 -0.2424
(-1.363) (-3.368) (-2.367) (-0.600) (-1.099) (-0.961) (-0.705) (-0.671) (-0.174) (-1.461) (-0.942) (-2.090) (-2.745) (0.477) (-1.285) (-0.492) (-2.034) (-0.915) (-0.800) (-0.288) (-1.948) (-1.994) (-1.778) (-0.263) (-1.539)
-0.0624** 0.1582* -0.0623 -0.0999 -0.1152*** -0.1679* -0.0851 -0.5489** 0.1362 -0.2003* -0.0331 0.1655 0.3111** -0.1812 -0.0925 -0.0429 0.2337** -0.0465 -0.1314 -0.1007** -0.1373** 0.3039 -0.0607 -0.2657* -0.1374*
(-2.293) (1.799) (-0.999) (-1.290) (-3.719) (-1.723) (-0.372) (-2.165) (0.385) (-1.828) (-0.533) (0.812) (2.017) (-0.988) (-1.345) (-1.206) (2.058) (-0.591) (-1.273) (-2.496) (-2.090) (1.110) (-0.394) (-1.893) (-1.796)
-0.0248 -0.0632 -0.0140 -0.1032** -0.0261 -0.2772*** -0.1774 -0.3384** -0.1938 -0.2367*** -0.1207*** -0.1092 0.0277 -0.2906*** -0.0819** -0.0165 -0.0544 0.0333 -0.1157** -0.0419* -0.1058** -0.0414 -0.1282 0.0164 -0.1221**
(-1.515) (-1.204) (-0.364) (-2.273) (-1.409) (-4.304) (-1.291) (-2.049) (-0.800) (-3.204) (-3.266) (-0.985) (0.296) (-2.646) (-2.000) (-0.763) (-0.776) (0.670) (-1.965) (-1.707) (-2.396) (-0.251) (-1.285) (0.170) (-2.356)
0.0456*** 0.0869*** 0.0496** -0.0001 0.0138 0.2437*** 0.1992** 0.2725*** 0.1809 0.1610*** 0.0762*** 0.1973*** 0.0419 0.0118 0.0480* 0.0247* -0.0094 0.0312 0.0137 0.0054 0.0324 0.0290 0.0370 0.0511 0.0291
(4.501) (3.077) (2.142) (-0.002) (1.119) (6.017) (2.256) (2.629) (1.154) (3.347) (3.142) (2.764) (0.709) (0.158) (1.728) (1.829) (-0.274) (1.025) (0.355) (0.312) (1.546) (0.310) (0.727) (1.147) (1.178)
R&D intensity in industry 0.0068 0.0284 0.0193 -0.0192 0.0041 0.1832*** 0.1448 0.2651** 0.1122 0.1482*** 0.0484* 0.1473** 0.0138 0.0070 0.0513* -0.0085 -0.0567 0.0114 0.0135 0.0010 -0.0047 -0.0128 -0.0342 0.0054 0.0004
(0.657) (0.966) (0.832) (-0.664) (0.334) (4.415) (1.621) (2.490) (0.715) (3.077) (1.942) (2.006) (0.237) (0.090) (1.827) (-0.614) (-1.563) (0.379) (0.353) (0.059) (-0.218) (-0.131) (-0.669) (0.118) (0.015)
0.0191*** 0.0326 0.0083 -0.0169 0.0107 0.1265*** 0.0527 0.1956** 0.0535 0.0922*** 0.0459*** 0.1232** 0.0025 0.0186 0.0500*** 0.0056 -0.0188 -0.0161 0.0247 -0.0033 0.0050 -0.0116 -0.0120 0.0082 0.0122
(2.617) (1.458) (0.493) (-0.844) (1.250) (4.026) (0.722) (2.501) (0.470) (2.596) (2.627) (2.225) (0.056) (0.354) (2.598) (0.581) (-0.687) (-0.747) (0.925) (-0.279) (0.326) (-0.150) (-0.307) (0.257) (0.682)
0.0001 0.0025 -0.0327 -0.0509** 0.0050 0.1190*** 0.0717 0.1303 -0.0276 0.0925** -0.0107 0.0590 -0.0687 -0.1150* 0.0063 -0.0045 -0.0604* -0.0577** 0.0055 0.0053 0.0200 -0.0420 0.0184 -0.0020 0.0405*
(0.006) (0.089) (-1.546) (-1.964) (0.452) (3.184) (0.857) (1.422) (-0.190) (2.181) (-0.509) (0.889) (-1.339) (-1.830) (0.269) (-0.347) (-1.701) (-2.065) (0.154) (0.340) (1.052) (-0.488) (0.400) (-0.050) (1.822)
0.0024 0.0084 -0.0342** -0.0258* -0.0072 0.0325 -0.0272 0.0394 0.0464 0.0306 -0.0210 0.0537 -0.0879** -0.0318 -0.0154 0.0023 0.0055 -0.0321* -0.0316* -0.0159* -0.0302*** -0.0153 -0.0523* -0.0065 -0.0372***
(0.429) (0.381) (-2.553) (-1.822) (-1.160) (1.187) (-0.377) (0.610) (0.503) (1.060) (-1.561) (1.114) (-2.425) (-0.817) (-1.059) (0.300) (0.195) (-1.864) (-1.678) (-1.834) (-2.764) (-0.232) (-1.721) (-0.292) (-2.970)
0.5512*** 0.3329 0.6649*** 1.0512*** 0.6213*** 1.0908*** 1.0661* 2.2393*** 0.4890 1.1131*** 0.5358*** 0.3417 -0.2022 1.3889*** 0.5853*** 0.5188*** 0.1604 0.5482*** 1.1881*** 0.6323*** 0.9877*** 0.1051 0.9000** 1.2162*** 0.9452***
(8.584) (1.548) (4.483) (5.832) (8.578) (4.671) (1.854) (3.616) (0.619) (4.358) (3.688) (0.698) (-0.546) (3.288) (3.655) (6.211) (0.579) (2.969) (4.975) (6.736) (5.954) (0.153) (2.323) (3.435) (4.886)
R2 0.022 0.011 0.025 0.014 0.026 0.037 0.015 0.023 0.063 0.023 0.029 0.026 0.034 0.036 0.020 0.026 0.019 0.034 0.015 0.029 0.014 0.040 0.019 0.011 0.015
LL_0 -61888 -8985 -12729 -8781 -36538 -4234 -1411 -698.6 -329.2 -1624 -10089 -1682 -2019 -1477 -5455 -32959 -5374 -7181 -4403 -18969 -19356 -985.3 -3442 -4267 -12464
LL -60900 -8916 -12503 -8689 -35783 -4118 -1397 -687.1 -314.1 -1587 -9860 -1652 -1970 -1440 -5353 -32336 -5302 -7010 -4353 -18530 -19169 -957.5 -3395 -4232 -12321
R2 adjusted 0.0218 0.00982 0.0242 0.0132 0.0256 0.0347 0.00735 0.00780 0.0317 0.0187 0.0282 0.0194 0.0285 0.0286 0.0188 0.0258 0.0170 0.0322 0.0130 0.0286 0.0132 0.0291 0.0160 0.00887 0.0146
Source: CIS 2006 micro data accessed at the Eurostat safe centre, WIFO calculations.
industry w ith medium-low innovation intensity
fast grow ing SMEs Birch Index
firm active on international markets
industry w ith high innovation intensity
industry w ith medium-high innovation intensity
industry w ith medium innovation intensity
industry w ith low innovation intensity
Basicness of know ledge in industry
Cumulativeness of know ledge in industry
Importance of embodied technology in Industry
Constant
skill barriers skill barriers skill barriers skill barriers skill barriers
all countries country group 1 country group 2 country group 3 country group 4
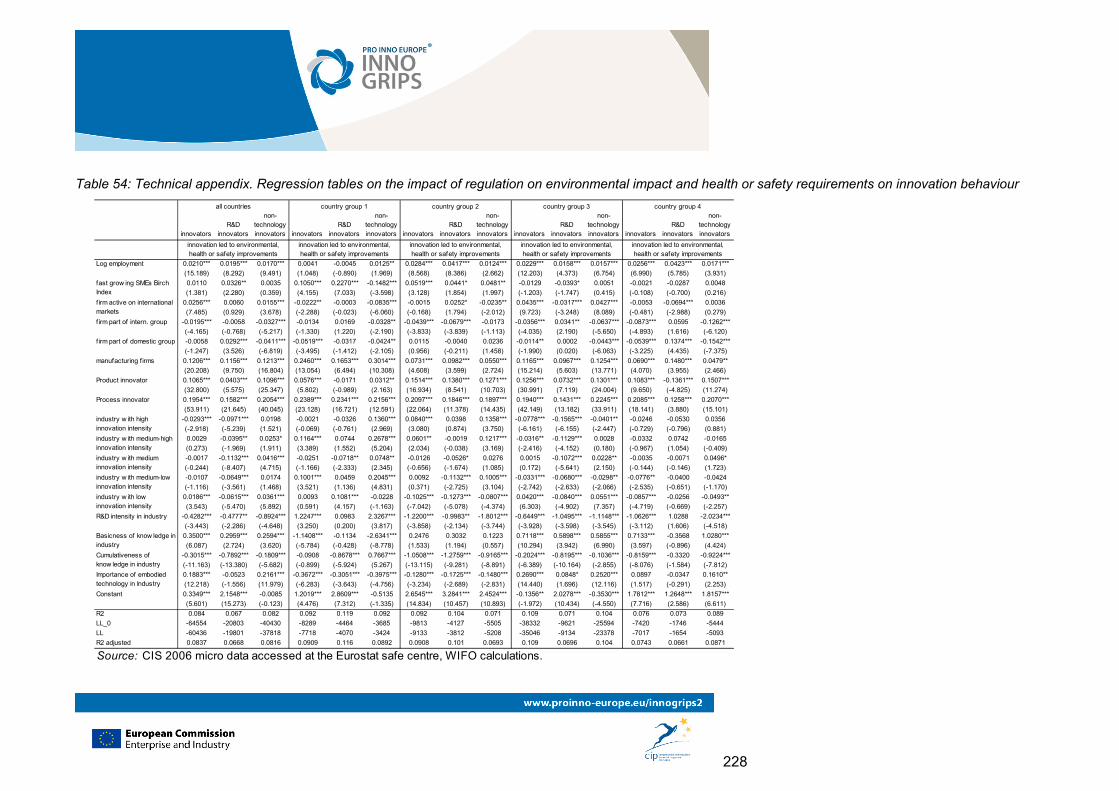
228
Table 54: Technical appendix. Regression tables on the impact of regulation on environmental impact and health or safety requirements on innovation behaviour
innovatorsR&D
innovators
non-technology innovators innovators
R&D innovators
non-technology innovators innovators
R&D innovators
non-technology innovators innovators
R&D innovators
non-technology innovators innovators
R&D innovators
non-technology innovators
Log employment 0.0210*** 0.0195*** 0.0170*** 0.0041 -0.0045 0.0125** 0.0284*** 0.0417*** 0.0124*** 0.0229*** 0.0158*** 0.0157*** 0.0256*** 0.0423*** 0.0171***
(15.189) (8.292) (9.491) (1.048) (-0.890) (1.969) (8.568) (8.386) (2.662) (12.203) (4.373) (6.754) (6.990) (5.785) (3.931)
0.0110 0.0326** 0.0035 0.1050*** 0.2270*** -0.1482*** 0.0519*** 0.0441* 0.0481** -0.0129 -0.0393* 0.0051 -0.0021 -0.0287 0.0048
(1.381) (2.280) (0.359) (4.155) (7.033) (-3.598) (3.128) (1.854) (1.997) (-1.203) (-1.747) (0.415) (-0.108) (-0.700) (0.216)
0.0256*** 0.0060 0.0155*** -0.0222** -0.0003 -0.0835*** -0.0015 0.0252* -0.0235** 0.0435*** -0.0317*** 0.0427*** -0.0053 -0.0694*** 0.0036
(7.485) (0.929) (3.678) (-2.288) (-0.023) (-6.060) (-0.168) (1.794) (-2.012) (9.723) (-3.248) (8.089) (-0.481) (-2.988) (0.279)
firm part of intern. group -0.0195*** -0.0058 -0.0327*** -0.0134 0.0169 -0.0328** -0.0439*** -0.0679*** -0.0173 -0.0356*** 0.0341** -0.0637*** -0.0873*** 0.0595 -0.1262***
(-4.165) (-0.768) (-5.217) (-1.330) (1.220) (-2.190) (-3.833) (-3.839) (-1.113) (-4.035) (2.190) (-5.650) (-4.893) (1.616) (-6.120)
firm part of domestic group -0.0058 0.0292*** -0.0411*** -0.0519*** -0.0317 -0.0424** 0.0115 -0.0040 0.0236 -0.0114** 0.0002 -0.0443*** -0.0539*** 0.1374*** -0.1542***
(-1.247) (3.526) (-6.819) (-3.495) (-1.412) (-2.105) (0.956) (-0.211) (1.458) (-1.990) (0.020) (-6.063) (-3.225) (4.435) (-7.375)
manufacturing firms 0.1206*** 0.1156*** 0.1213*** 0.2460*** 0.1653*** 0.3014*** 0.0731*** 0.0982*** 0.0550*** 0.1165*** 0.0967*** 0.1254*** 0.0690*** 0.1480*** 0.0479**
(20.208) (9.750) (16.804) (13.054) (6.494) (10.308) (4.608) (3.599) (2.724) (15.214) (5.603) (13.771) (4.070) (3.955) (2.466)
0.1065*** 0.0403*** 0.1096*** 0.0576*** -0.0171 0.0312** 0.1514*** 0.1380*** 0.1271*** 0.1256*** 0.0732*** 0.1301*** 0.1083*** -0.1361*** 0.1507***
(32.800) (5.575) (25.347) (5.802) (-0.989) (2.163) (16.934) (8.541) (10.703) (30.991) (7.119) (24.004) (9.650) (-4.825) (11.274)
0.1954*** 0.1582*** 0.2054*** 0.2389*** 0.2341*** 0.2156*** 0.2097*** 0.1846*** 0.1897*** 0.1940*** 0.1431*** 0.2245*** 0.2085*** 0.1258*** 0.2070***
(53.911) (21.645) (40.045) (23.128) (16.721) (12.591) (22.064) (11.378) (14.435) (42.149) (13.182) (33.911) (18.141) (3.880) (15.101)
-0.0293*** -0.0971*** 0.0198 -0.0021 -0.0326 0.1360*** 0.0840*** 0.0398 0.1358*** -0.0778*** -0.1565*** -0.0401** -0.0246 -0.0530 0.0356
(-2.918) (-5.239) (1.521) (-0.069) (-0.761) (2.969) (3.080) (0.874) (3.750) (-6.161) (-6.155) (-2.447) (-0.729) (-0.796) (0.881)
0.0029 -0.0395** 0.0253* 0.1164*** 0.0744 0.2678*** 0.0601** -0.0019 0.1217*** -0.0316** -0.1129*** 0.0028 -0.0332 0.0742 -0.0165
(0.273) (-1.969) (1.911) (3.389) (1.552) (5.204) (2.034) (-0.038) (3.169) (-2.416) (-4.152) (0.180) (-0.967) (1.054) (-0.409)
-0.0017 -0.1132*** 0.0416*** -0.0251 -0.0718** 0.0748** -0.0126 -0.0526* 0.0276 0.0015 -0.1072*** 0.0228** -0.0035 -0.0071 0.0496*
(-0.244) (-8.407) (4.715) (-1.166) (-2.333) (2.345) (-0.656) (-1.674) (1.085) (0.172) (-5.641) (2.150) (-0.144) (-0.146) (1.723)
-0.0107 -0.0649*** 0.0174 0.1001*** 0.0459 0.2045*** 0.0092 -0.1132*** 0.1005*** -0.0331*** -0.0680*** -0.0298** -0.0776** -0.0400 -0.0424
(-1.116) (-3.561) (1.468) (3.521) (1.136) (4.831) (0.371) (-2.725) (3.104) (-2.742) (-2.633) (-2.066) (-2.535) (-0.651) (-1.170)
0.0186*** -0.0615*** 0.0361*** 0.0093 0.1081*** -0.0228 -0.1025*** -0.1273*** -0.0807*** 0.0420*** -0.0840*** 0.0551*** -0.0857*** -0.0256 -0.0493**
(3.543) (-5.470) (5.892) (0.591) (4.157) (-1.163) (-7.042) (-5.078) (-4.374) (6.303) (-4.902) (7.357) (-4.719) (-0.669) (-2.257)
R&D intensity in industry -0.4282*** -0.4777** -0.8924*** 1.2247*** 0.0983 2.3267*** -1.2200*** -0.9983** -1.8012*** -0.6449*** -1.0495*** -1.1148*** -1.0626*** 1.0288 -2.0234***
(-3.443) (-2.286) (-4.648) (3.250) (0.200) (3.817) (-3.858) (-2.134) (-3.744) (-3.928) (-3.598) (-3.545) (-3.112) (1.606) (-4.518)
0.3500*** 0.2959*** 0.2594*** -1.1408*** -0.1134 -2.6341*** 0.2476 0.3032 0.1223 0.7118*** 0.5898*** 0.5855*** 0.7133*** -0.3568 1.0280***
(6.087) (2.724) (3.620) (-5.784) (-0.428) (-8.778) (1.533) (1.194) (0.557) (10.294) (3.942) (6.990) (3.597) (-0.896) (4.424)
-0.3015*** -0.7892*** -0.1809*** -0.0908 -0.8678*** 0.7667*** -1.0508*** -1.2759*** -0.9165*** -0.2024*** -0.8195*** -0.1036*** -0.8159*** -0.3320 -0.9224***
(-11.163) (-13.380) (-5.682) (-0.899) (-5.924) (5.267) (-13.115) (-9.281) (-8.891) (-6.389) (-10.164) (-2.855) (-8.076) (-1.584) (-7.812)
0.1883*** -0.0523 0.2161*** -0.3672*** -0.3051*** -0.3975*** -0.1280*** -0.1725*** -0.1480*** 0.2690*** 0.0848* 0.2520*** 0.0897 -0.0347 0.1610**
(12.218) (-1.556) (11.979) (-6.283) (-3.643) (-4.756) (-3.234) (-2.689) (-2.831) (14.440) (1.696) (12.116) (1.517) (-0.291) (2.253)
0.3349*** 2.1548*** -0.0085 1.2019*** 2.8609*** -0.5135 2.6545*** 3.2841*** 2.4524*** -0.1356** 2.0278*** -0.3530*** 1.7812*** 1.2648*** 1.8157***
(5.601) (15.273) (-0.123) (4.476) (7.312) (-1.335) (14.834) (10.457) (10.893) (-1.972) (10.434) (-4.550) (7.716) (2.586) (6.611)
R2 0.084 0.067 0.082 0.092 0.119 0.092 0.092 0.104 0.071 0.109 0.071 0.104 0.076 0.073 0.089
LL_0 -64554 -20803 -40430 -8289 -4464 -3685 -9813 -4127 -5505 -38332 -9621 -25594 -7420 -1746 -5444
LL -60436 -19801 -37818 -7718 -4070 -3424 -9133 -3812 -5208 -35046 -9134 -23378 -7017 -1654 -5093
R2 adjusted 0.0837 0.0668 0.0816 0.0909 0.116 0.0892 0.0908 0.101 0.0693 0.109 0.0696 0.104 0.0743 0.0661 0.0871
Source: CIS 2006 micro data accessed at the Eurostat safe centre, WIFO calculations.
all countries country group 1 country group 2 country group 3 country group 4
innovation led to environmental, health or safety improvements
innovation led to environmental, health or safety improvements
innovation led to environmental, health or safety improvements
innovation led to environmental, health or safety improvements
innovation led to environmental, health or safety improvements
fast grow ing SMEs Birch Index
firm active on international markets
Product innovator
Process innovator
industry w ith high innovation intensity
Cumulativeness of know ledge in industry
Importance of embodied technology in Industry
Constant
industry w ith medium-high innovation intensity
industry w ith medium innovation intensity
industry w ith medium-low innovation intensity
industry w ith low innovation intensity
Basicness of know ledge in industry
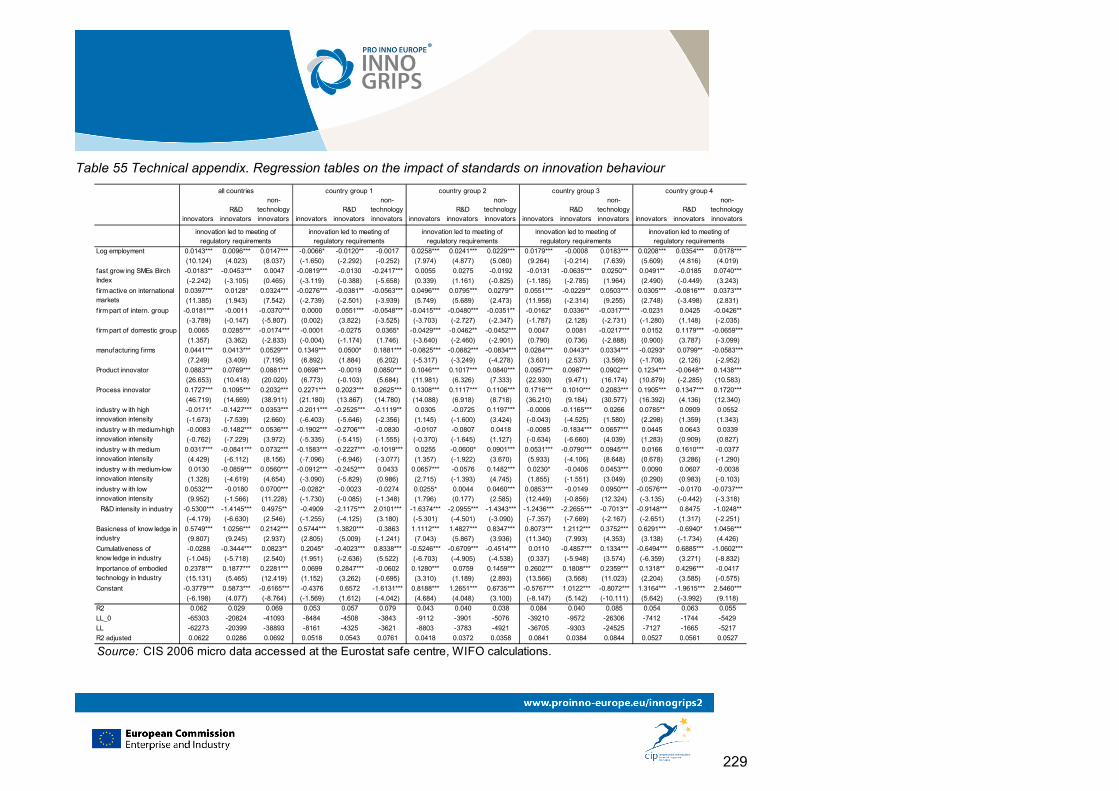
229
Table 55 Technical appendix. Regression tables on the impact of standards on innovation behaviour
innovatorsR&D
innovators
non-technology innovators innovators
R&D innovators
non-technology innovators innovators
R&D innovators
non-technology innovators innovators
R&D innovators
non-technology innovators innovators
R&D innovators
non-technology innovators
Log employment 0.0143*** 0.0096*** 0.0147*** -0.0066* -0.0120** -0.0017 0.0258*** 0.0241*** 0.0229*** 0.0179*** -0.0008 0.0183*** 0.0208*** 0.0354*** 0.0178***
(10.124) (4.023) (8.037) (-1.650) (-2.292) (-0.252) (7.974) (4.877) (5.080) (9.264) (-0.214) (7.639) (5.609) (4.816) (4.019)
-0.0183** -0.0453*** 0.0047 -0.0819*** -0.0130 -0.2417*** 0.0055 0.0275 -0.0192 -0.0131 -0.0635*** 0.0250** 0.0491** -0.0185 0.0740***
(-2.242) (-3.105) (0.465) (-3.119) (-0.388) (-5.658) (0.339) (1.161) (-0.825) (-1.185) (-2.785) (1.964) (2.490) (-0.449) (3.243)
0.0397*** 0.0128* 0.0324*** -0.0276*** -0.0381** -0.0563*** 0.0496*** 0.0795*** 0.0279** 0.0551*** -0.0229** 0.0503*** 0.0305*** -0.0816*** 0.0373***
(11.385) (1.943) (7.542) (-2.739) (-2.501) (-3.939) (5.749) (5.689) (2.473) (11.958) (-2.314) (9.255) (2.748) (-3.498) (2.831)
firm part of intern. group -0.0181*** -0.0011 -0.0370*** 0.0000 0.0551*** -0.0548*** -0.0415*** -0.0480*** -0.0351** -0.0162* 0.0336** -0.0317*** -0.0231 0.0425 -0.0426**
(-3.789) (-0.147) (-5.807) (0.002) (3.822) (-3.525) (-3.703) (-2.727) (-2.347) (-1.787) (2.128) (-2.731) (-1.280) (1.148) (-2.035)
firm part of domestic group 0.0065 0.0285*** -0.0174*** -0.0001 -0.0275 0.0365* -0.0429*** -0.0462** -0.0452*** 0.0047 0.0081 -0.0217*** 0.0152 0.1179*** -0.0659***
(1.357) (3.362) (-2.833) (-0.004) (-1.174) (1.746) (-3.640) (-2.460) (-2.901) (0.790) (0.736) (-2.888) (0.900) (3.787) (-3.099)
manufacturing f irms 0.0441*** 0.0413*** 0.0529*** 0.1349*** 0.0500* 0.1881*** -0.0825*** -0.0882*** -0.0834*** 0.0284*** 0.0443** 0.0334*** -0.0293* 0.0799** -0.0583***
(7.249) (3.409) (7.195) (6.892) (1.884) (6.202) (-5.317) (-3.249) (-4.278) (3.601) (2.537) (3.569) (-1.708) (2.126) (-2.952)
0.0883*** 0.0769*** 0.0881*** 0.0698*** -0.0019 0.0850*** 0.1046*** 0.1017*** 0.0840*** 0.0957*** 0.0987*** 0.0902*** 0.1234*** -0.0648** 0.1438***
(26.653) (10.418) (20.020) (6.773) (-0.103) (5.684) (11.981) (6.326) (7.333) (22.930) (9.471) (16.174) (10.879) (-2.285) (10.583)
0.1727*** 0.1095*** 0.2032*** 0.2271*** 0.2023*** 0.2625*** 0.1308*** 0.1117*** 0.1106*** 0.1716*** 0.1010*** 0.2083*** 0.1905*** 0.1347*** 0.1720***
(46.719) (14.669) (38.911) (21.180) (13.867) (14.780) (14.088) (6.918) (8.718) (36.210) (9.184) (30.577) (16.392) (4.136) (12.340)
-0.0171* -0.1427*** 0.0353*** -0.2011*** -0.2525*** -0.1119** 0.0305 -0.0725 0.1197*** -0.0006 -0.1165*** 0.0266 0.0785** 0.0909 0.0552
(-1.673) (-7.539) (2.660) (-6.403) (-5.646) (-2.356) (1.145) (-1.600) (3.424) (-0.043) (-4.525) (1.580) (2.298) (1.359) (1.343)
-0.0083 -0.1482*** 0.0536*** -0.1902*** -0.2706*** -0.0830 -0.0107 -0.0807 0.0418 -0.0085 -0.1834*** 0.0657*** 0.0445 0.0643 0.0339
(-0.762) (-7.229) (3.972) (-5.335) (-5.415) (-1.555) (-0.370) (-1.645) (1.127) (-0.634) (-6.660) (4.039) (1.283) (0.909) (0.827)
0.0317*** -0.0841*** 0.0732*** -0.1583*** -0.2227*** -0.1019*** 0.0255 -0.0600* 0.0901*** 0.0531*** -0.0790*** 0.0945*** 0.0166 0.1610*** -0.0377
(4.429) (-6.112) (8.156) (-7.096) (-6.946) (-3.077) (1.357) (-1.922) (3.670) (5.933) (-4.106) (8.648) (0.678) (3.286) (-1.290)
0.0130 -0.0859*** 0.0560*** -0.0912*** -0.2452*** 0.0433 0.0657*** -0.0576 0.1482*** 0.0230* -0.0406 0.0453*** 0.0090 0.0607 -0.0038
(1.328) (-4.619) (4.654) (-3.090) (-5.829) (0.986) (2.715) (-1.393) (4.745) (1.855) (-1.551) (3.049) (0.290) (0.983) (-0.103)
0.0532*** -0.0180 0.0700*** -0.0282* -0.0023 -0.0274 0.0255* 0.0044 0.0460*** 0.0853*** -0.0149 0.0950*** -0.0576*** -0.0170 -0.0737***
(9.952) (-1.566) (11.228) (-1.730) (-0.085) (-1.348) (1.796) (0.177) (2.585) (12.449) (-0.856) (12.324) (-3.135) (-0.442) (-3.318)
-0.5300*** -1.4145*** 0.4975** -0.4909 -2.1175*** 2.0101*** -1.6374*** -2.0955*** -1.4343*** -1.2436*** -2.2655*** -0.7013** -0.9148*** 0.8475 -1.0248**
(-4.179) (-6.630) (2.546) (-1.255) (-4.125) (3.180) (-5.301) (-4.501) (-3.090) (-7.357) (-7.669) (-2.167) (-2.651) (1.317) (-2.251)
0.5749*** 1.0256*** 0.2142*** 0.5744*** 1.3820*** -0.3863 1.1112*** 1.4827*** 0.8347*** 0.8073*** 1.2112*** 0.3752*** 0.6291*** -0.6940* 1.0456***
(9.807) (9.245) (2.937) (2.805) (5.009) (-1.241) (7.043) (5.867) (3.936) (11.340) (7.993) (4.353) (3.138) (-1.734) (4.426)
-0.0288 -0.3444*** 0.0823** 0.2045* -0.4023*** 0.8338*** -0.5246*** -0.6709*** -0.4514*** 0.0110 -0.4857*** 0.1334*** -0.6494*** 0.6885*** -1.0602***
(-1.045) (-5.718) (2.540) (1.951) (-2.636) (5.522) (-6.703) (-4.905) (-4.538) (0.337) (-5.948) (3.574) (-6.359) (3.271) (-8.832)
0.2378*** 0.1877*** 0.2281*** 0.0699 0.2847*** -0.0602 0.1280*** 0.0759 0.1459*** 0.2602*** 0.1808*** 0.2359*** 0.1318** 0.4296*** -0.0417
(15.131) (5.465) (12.419) (1.152) (3.262) (-0.695) (3.310) (1.189) (2.893) (13.566) (3.568) (11.023) (2.204) (3.585) (-0.575)
-0.3779*** 0.5873*** -0.6165*** -0.4376 0.6572 -1.6131*** 0.8188*** 1.2651*** 0.6735*** -0.5767*** 1.0122*** -0.8072*** 1.3164*** -1.9615*** 2.5460***
(-6.198) (4.077) (-8.764) (-1.569) (1.612) (-4.042) (4.684) (4.048) (3.100) (-8.147) (5.142) (-10.111) (5.642) (-3.992) (9.118)
R2 0.062 0.029 0.069 0.053 0.057 0.079 0.043 0.040 0.038 0.084 0.040 0.085 0.054 0.063 0.055
LL_0 -65303 -20824 -41093 -8484 -4508 -3843 -9112 -3901 -5076 -39210 -9572 -26306 -7412 -1744 -5429
LL -62273 -20399 -38893 -8161 -4325 -3621 -8803 -3783 -4921 -36705 -9303 -24525 -7127 -1665 -5217
R2 adjusted 0.0622 0.0286 0.0692 0.0518 0.0543 0.0761 0.0418 0.0372 0.0358 0.0841 0.0384 0.0844 0.0527 0.0561 0.0527
Source: CIS 2006 micro data accessed at the Eurostat safe centre, WIFO calculations.
all countries country group 1 country group 2 country group 3 country group 4
Constant
innovation led to meeting of regulatory requirements
innovation led to meeting of regulatory requirements
industry w ith medium-high innovation intensity
industry w ith medium innovation intensity
industry w ith medium-low innovation intensity
industry w ith low innovation intensity
Basicness of know ledge in industry
fast grow ing SMEs Birch Index
firm active on international markets
Product innovator
Process innovator
industry w ith high innovation intensity
R&D intensity in industry
innovation led to meeting of regulatory requirements
innovation led to meeting of regulatory requirements
innovation led to meeting of regulatory requirements
Cumulativeness of know ledge in industry
Importance of embodied technology in Industry
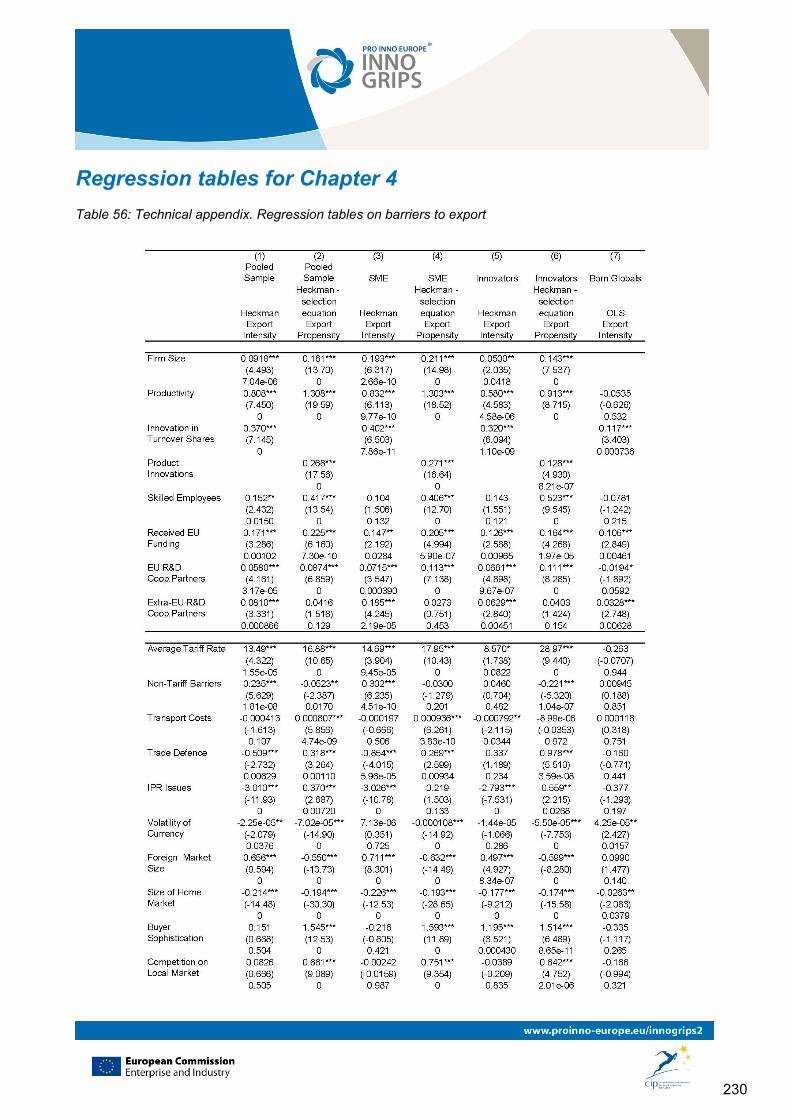
230
Regression tables for Chapter 4
Table 56: Technical appendix. Regression tables on barriers to export
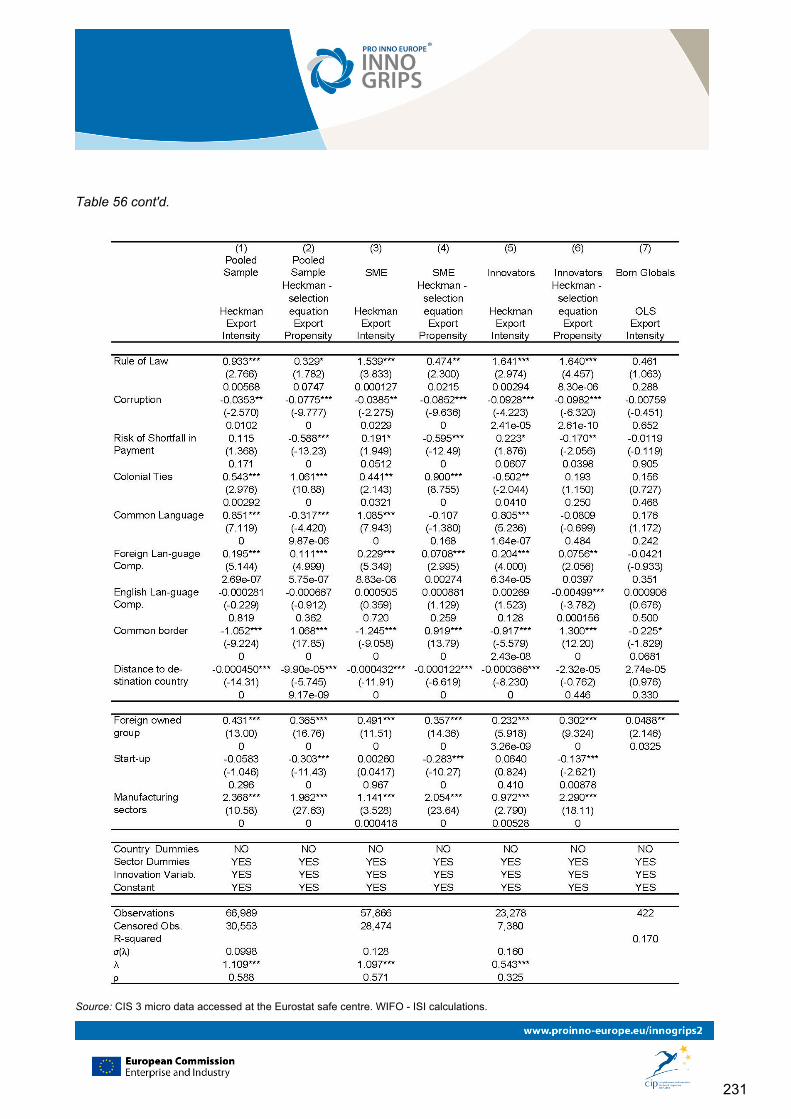
231
Table 56 cont'd.
Source: CIS 3 micro data accessed at the Eurostat safe centre. WIFO - ISI calculations.
232
Methodology used for the descriptive analysis of external trade barriers in Chapter 4
We calculated how national sectors are affected by trade barriers on exports of their partner countries. We used barrier indicators which are available on the national level only. Whenever possible we have broken down the barrier indicators on the sector level. In order to estimate the impact of these export barriers on the national sector of the exporting country, we aggregated the barriers of the partner countries according to the amount of exports in the partner countries. We therefore used export data from 2006* from the UN Comtrade database for manufacturing (NACE Rev. 1.1 15-36, plus 40) and the Eurostat Balance of Payments database for service sectors (NACE Rev. 1.1 50-74; see Table D1 in this appendix). For each of these national sectors in the 27 EU countries plus Iceland and Norway, we calculated the weights wijk according to (1)
(1)
kijk
ijkijkw
exp
exp, whereas by definition
kijkw 1
with expijk is the nominal export of sector j in country i to partner country k. These weights have been used to calculate the weighted impact of the respective barrier of partner countries k (partially also varying by sector j) for national EU sectors:
(2) jkk
ijkij barrierwwbarrier *_
In principle, barrier_wij is the weighted average of the barrier of its partner countries.
In order to illustrate (1) how the exporting EU countries are affected by the trade barrier, and (2) how the partner countries contribute, we present in Table D2, D4, D6, D8, D10, and D12 in this appendix barrier_wij for each sector in the EU countries as well as averages for sector groups†. The sector group rows are also presented in the table in the text. In D3, D5, D7, D9, D11, and D13 we present the average contribution of partner country groups to the barriers displayed in the tables with even numbers.
Additionally, we present a world map (or a map of EU countries‡). The map shows the absolute value of the country's barrier for non-EU countries. The more intense the colour (red) is, the higher is the barrier.
* We used export data from 2006 to avoid any bias caused by the economic crisis which strongly affected exports. † Averages for sector groups are calculated by weighting the sectoral value with the sector's value added share within the sector group. ‡ We present the map for EU-countries only whenever an indicator also varies by the exporting country. For instance, the variable common language has different entries for a partner country depending on the exporting country. The US shares for example a common language with the UK, but not with Germany, etc.
233
Appendix B: Country groups (trade regions) and NACE industry classes
Groups of states (trade regions)
African, Caribbean and Pacific Group of States (ACP)
African states: Angola, Benin, Botswana, Burundi, Cameroon, Chad, Comoros, Congo, Congo, d'Ivoire, Djibouti, Eritrea, Ethiopia, Faso, Gabon, Gambia, Ghana, Guinea, Guinea, Guinea-Bissau, Kenya, Leone, Lesotho, Liberia, Madagascar, Malawi, Mali, Mauritania, Mauritius, Mozambique, Namibia, Niger, Nigeria, Príncipe, Republic, Rwanda, Senegal, Seychelles, Somalia, Sudan, Swaziland, Tanzania, Togo, Uganda, Verde, Zambia, Zimbabwe
Caribbean states: Bahamas, Barbados, Barbuda, Belise, Dominica, Grenada, Grenadines, Guyana, Haiti, Jamaica, Lucia, needed], Nevis, Republic, Suriname, Tobago,
Pacific states: Fiji, Guinea, Islands, Islands, Islands, Kiribati, Micronesia, Nauru, , Niue, Palau, Samoa, Tonga, Tuvalu, Vanuatu
ASEAN
Brunei, Cambodia, Indonesia, Laos, Malaysia, Myanmar, Philippines, Singapore, Thailand, Vietnam,
NAFTA
USA, Canada, Mexico
CIS
Armenia, Azerbaijan, Belarus, Kazakhstan, Kyrgyzstan, Moldova, Russia, Tajikistan, Turkmenistan, Ukraine
Mercosur
Argentina, Brazil, Paraguay, Uruguay, Bolivia, Chile,
BRIC
Brazil, Russia, India, China
234
EURMED
Algeria, Egypt, Jordan, Israel, Lebanon, Morocco, Palestine, Syria, Tunisia, Turkey
Oceania
Australia, New Zealand, Christmas Island, Cocos (Keeling) Islands, Coral Sea Islands , Norfolk Island, Melanesia, Fiji, Indonesia (Oceania part only), New Caledonia (France), Papua New Guinea, Solomon Islands, Vanuatu, Micronesia, Federated States of Micronesia, Guam (USA), Kiribati, Marshall Islands, Nauru, Northern Mariana Islands (USA) , Palau, United States Wake Island (USA) , Polynesia, American Samoa (USA) , Cook Islands (NZ), Easter Island (Chile), French Polynesia (France), Hawaii (USA), Niue (NZ), Pitcairn Islands (UK), Samoa, Tokelau (NZ), Tonga, Tuvalu, Wallis and Futuna (France)
NACE Rev 1.1. two digit classification used in this report
NACE DESCRIPTION A Agriculture, hunting and forestry 01 Agriculture, hunting and related service activities 02 Forestry, logging and related service activities B Fishing 05 Fishing, fish farming and related service activities C Mining and quarrying CA Mining and quarrying of energy producing materials
10 Mining of coal and lignite; extraction of peat
11 Extraction of crude petroleum and natural gas; service activities incidental to oil and gas extraction, excluding surveying
12 Mining of uranium and thorium ores CB Mining and quarrying, except of energy producing materials
13 Mining of metal ores 14 Other mining and quarrying
D Manufacturing DA Manufacture of food products, beverages and tobacco
15 Manufacture of food products and beverages 16 Manufacture of tobacco products
DB Manufacture of textiles and textile products 17 Manufacture of textiles 18 Manufacture of wearing apparel; dressing and dyeing of fur
DC Manufacture of leather and leather products 19 Tanning and dressing of leather; manufacture of luggage, handbags, saddlery, harness and footwear
DD Manufacture of wood and wood products
20 Manufacture of wood and of products of wood and cork, except furniture; manufacture of articles of straw and plaiting materials
DE Manufacture of pulp, paper and paper products; publishing and printing 21 Manufacture of pulp, paper and paper products 22 Publishing, printing and reproduction of recorded media
DF Manufacture of coke, refined petroleum products and nuclear fuel 23 Manufacture of coke, refined petroleum products and nuclear fuel
DG Manufacture of chemicals, chemical products and man-made fibres 24 Manufacture of chemicals and chemical products
DH Manufacture of rubber and plastic products 25 Manufacture of rubber and plastic products
DI Manufacture of other non-metallic mineral products 26 Manufacture of other non-metallic mineral products
DJ Manufacture of basic metals and fabricated metal products 27 Manufacture of basic metals
235
28 Manufacture of fabricated metal products, except machinery and equipment DK Manufacture of machinery and equipment n.e.c.
29 Manufacture of machinery and equipment n.e.c. DL Manufacture of electrical and optical equipment
30 Manufacture of office machinery and computers 31 Manufacture of electrical machinery and apparatus n.e.c. 32 Manufacture of radio, television and communication equipment and apparatus 33 Manufacture of medical, precision and optical instruments, watches and clocks
DM Manufacture of transport equipment 34 Manufacture of motor vehicles, trailers and semi-trailers 35 Manufacture of other transport equipment
DN Manufacturing n.e.c. 36 Manufacture of furniture; manufacturing n.e.c. 37 Recycling
E Electricity, gas and water supply 40 Electricity, gas, steam and hot water supply 41 Collection, purification and distribution of water
F Construction 45 Construction
G Wholesale and retail trade; repair of motor vehicles, motorcycles and personal and household goods 50 Sale, maintenance and repair of motor vehicles and motorcycles; retail sale of automotive fuel 51 Wholesale trade and commission trade, except of motor vehicles and motorcycles 52 Retail trade, except of motor vehicles and motorcycles; repair of personal and household goods
H Hotels and restaurants 55 Hotels and restaurants
I Transport, storage and communication 60 Land transport; transport via pipelines 61 Water transport 62 Air transport 63 Supporting and auxiliary transport activities; activities of travel agencies 64 Post and telecommunications
J Financial intermediation 65 Financial intermediation, except insurance and pension funding 66 Insurance and pension funding, except compulsory social security 67 Activities auxiliary to financial intermediation
K Real estate, renting and business activities 70 Real estate activities 71 Renting of machinery and equipment without operator and of personal and household goods 72 Computer and related activities 73 Research and development 74 Other business activities
L Public administration and defence; compulsory social security 75 Public administration and defence; compulsory social security
M Education 80 Education
N Health and social work 85 Health and social work
O Other community, social and personal service activities 90 Sewage and refuse disposal, sanitation and similar activities 91 Activities of membership organisations n.e.c. 92 Recreational, cultural and sporting activities 93 Other service activities
P Activities of households 95 Activities of households as employers of domestic staff 96 Undifferentiated goods producing activities of private households for own use 97 Undifferentiated services producing activities of private households for own use
Q Extra-territorial organisations and bodies 99 Extra-territorial organisations and bodies
236
Appendix D: Data tables for trade barriers
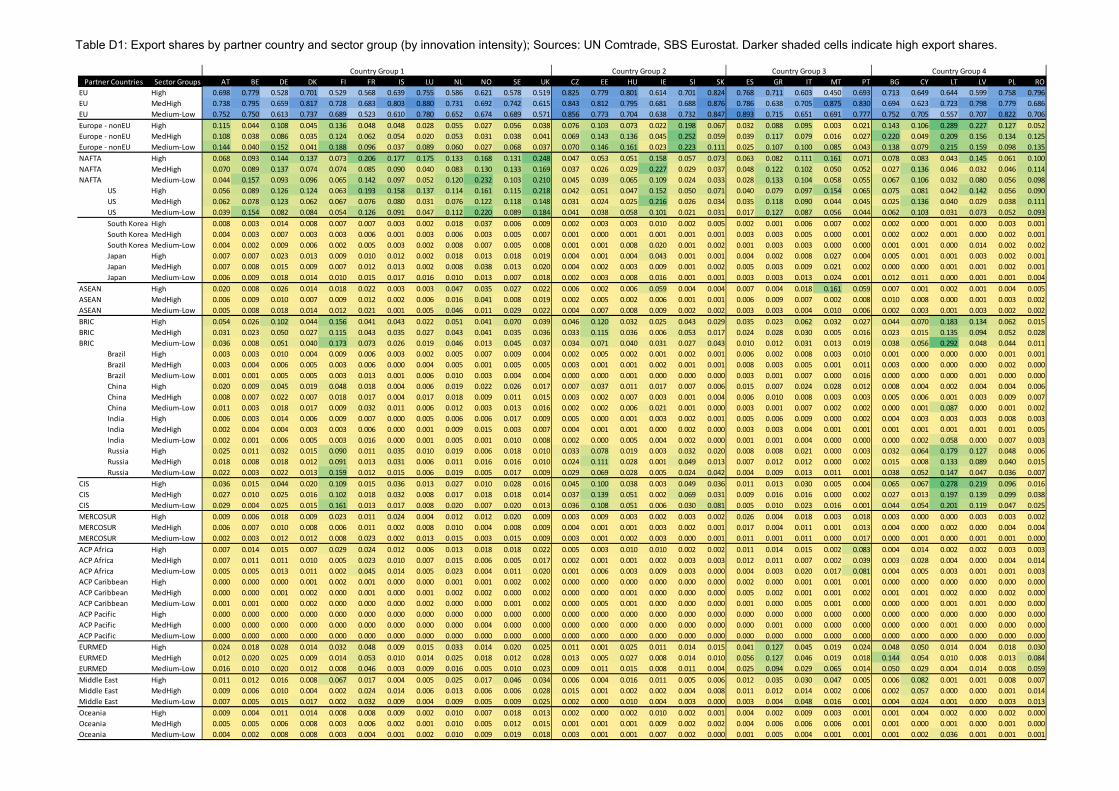
Table D1: Export shares by partner country and sector group (by innovation intensity); Sources: UN Comtrade, SBS Eurostat. Darker shaded cells indicate high export shares.
Sector Groups AT BE DE DK FI FR IS LU NL NO SE UK CZ EE HU IE SI SK ES GR IT MT PT BG CY LT LV PL RO
EU High 0.698 0.779 0.528 0.701 0.529 0.568 0.639 0.755 0.586 0.621 0.578 0.519 0.825 0.779 0.801 0.614 0.701 0.824 0.768 0.711 0.603 0.450 0.693 0.713 0.649 0.644 0.599 0.758 0.796
EU MedHigh 0.738 0.795 0.659 0.817 0.728 0.683 0.803 0.880 0.731 0.692 0.742 0.615 0.843 0.812 0.795 0.681 0.688 0.876 0.786 0.638 0.705 0.875 0.830 0.694 0.623 0.723 0.798 0.779 0.686
EU Medium-Low 0.752 0.750 0.613 0.737 0.689 0.523 0.610 0.780 0.652 0.674 0.689 0.571 0.856 0.773 0.704 0.638 0.732 0.847 0.893 0.715 0.651 0.691 0.777 0.752 0.705 0.557 0.707 0.822 0.706
Europe - nonEU High 0.115 0.044 0.108 0.045 0.136 0.048 0.048 0.028 0.055 0.027 0.056 0.038 0.076 0.103 0.073 0.022 0.198 0.067 0.032 0.088 0.095 0.003 0.021 0.143 0.106 0.289 0.227 0.127 0.052
Europe - nonEU MedHigh 0.108 0.038 0.086 0.035 0.124 0.062 0.054 0.020 0.053 0.031 0.038 0.041 0.069 0.143 0.136 0.045 0.252 0.059 0.039 0.117 0.079 0.016 0.027 0.220 0.049 0.209 0.156 0.134 0.125
Europe - nonEU Medium-Low 0.144 0.040 0.152 0.041 0.188 0.096 0.037 0.089 0.060 0.027 0.068 0.037 0.070 0.146 0.161 0.023 0.223 0.111 0.025 0.107 0.100 0.085 0.043 0.138 0.079 0.215 0.159 0.098 0.135
NAFTA High 0.068 0.093 0.144 0.137 0.073 0.206 0.177 0.175 0.133 0.168 0.131 0.248 0.047 0.053 0.051 0.158 0.057 0.073 0.063 0.082 0.111 0.161 0.071 0.078 0.083 0.043 0.145 0.061 0.100
NAFTA MedHigh 0.070 0.089 0.137 0.074 0.074 0.085 0.090 0.040 0.083 0.130 0.133 0.169 0.037 0.026 0.029 0.227 0.029 0.037 0.048 0.122 0.102 0.050 0.052 0.027 0.136 0.046 0.032 0.046 0.114
NAFTA Medium-Low 0.044 0.157 0.093 0.096 0.065 0.142 0.097 0.052 0.120 0.232 0.103 0.210 0.045 0.039 0.065 0.109 0.024 0.033 0.028 0.133 0.104 0.058 0.055 0.067 0.106 0.032 0.080 0.056 0.098
US High 0.056 0.089 0.126 0.124 0.063 0.193 0.158 0.137 0.114 0.161 0.115 0.218 0.042 0.051 0.047 0.152 0.050 0.071 0.040 0.079 0.097 0.154 0.065 0.075 0.081 0.042 0.142 0.056 0.090
US MedHigh 0.062 0.078 0.123 0.062 0.067 0.076 0.080 0.031 0.076 0.122 0.118 0.148 0.031 0.024 0.025 0.216 0.026 0.034 0.035 0.118 0.090 0.044 0.045 0.025 0.136 0.040 0.029 0.038 0.111
US Medium-Low 0.039 0.154 0.082 0.084 0.054 0.126 0.091 0.047 0.112 0.220 0.089 0.184 0.041 0.038 0.058 0.101 0.021 0.031 0.017 0.127 0.087 0.056 0.044 0.062 0.103 0.031 0.073 0.052 0.093
South Korea High 0.008 0.003 0.014 0.008 0.007 0.007 0.003 0.002 0.018 0.037 0.006 0.009 0.002 0.003 0.003 0.010 0.002 0.005 0.002 0.001 0.006 0.007 0.002 0.002 0.000 0.001 0.000 0.003 0.001
South Korea MedHigh 0.004 0.003 0.007 0.003 0.003 0.006 0.001 0.003 0.006 0.003 0.005 0.007 0.001 0.000 0.001 0.001 0.001 0.001 0.003 0.003 0.005 0.000 0.001 0.002 0.002 0.001 0.000 0.002 0.001
South Korea Medium-Low 0.004 0.002 0.009 0.006 0.002 0.005 0.003 0.002 0.008 0.007 0.005 0.008 0.001 0.001 0.008 0.020 0.001 0.002 0.001 0.003 0.003 0.000 0.000 0.001 0.001 0.000 0.014 0.002 0.002
Japan High 0.007 0.007 0.023 0.013 0.009 0.010 0.012 0.002 0.018 0.013 0.018 0.019 0.004 0.001 0.004 0.043 0.001 0.001 0.004 0.002 0.008 0.027 0.004 0.005 0.001 0.001 0.003 0.002 0.001
Japan MedHigh 0.007 0.008 0.015 0.009 0.007 0.012 0.013 0.002 0.008 0.038 0.013 0.020 0.004 0.002 0.003 0.009 0.001 0.002 0.005 0.003 0.009 0.021 0.002 0.000 0.000 0.001 0.001 0.002 0.001
Japan Medium-Low 0.006 0.009 0.018 0.014 0.010 0.015 0.017 0.016 0.010 0.013 0.007 0.018 0.002 0.003 0.008 0.016 0.001 0.001 0.003 0.003 0.013 0.024 0.001 0.012 0.011 0.000 0.001 0.001 0.004
ASEAN High 0.020 0.008 0.026 0.014 0.018 0.022 0.003 0.003 0.047 0.035 0.027 0.022 0.006 0.002 0.006 0.059 0.004 0.004 0.007 0.004 0.018 0.161 0.059 0.007 0.001 0.002 0.001 0.004 0.005
ASEAN MedHigh 0.006 0.009 0.010 0.007 0.009 0.012 0.002 0.006 0.016 0.041 0.008 0.019 0.002 0.005 0.002 0.006 0.001 0.001 0.006 0.009 0.007 0.002 0.008 0.010 0.008 0.000 0.001 0.003 0.002
ASEAN Medium-Low 0.005 0.008 0.018 0.014 0.012 0.021 0.001 0.005 0.046 0.011 0.029 0.022 0.004 0.007 0.008 0.009 0.002 0.002 0.003 0.003 0.004 0.010 0.006 0.002 0.003 0.001 0.003 0.002 0.002
BRIC High 0.054 0.026 0.102 0.044 0.156 0.041 0.043 0.022 0.051 0.041 0.070 0.039 0.046 0.120 0.032 0.025 0.043 0.029 0.035 0.023 0.062 0.032 0.027 0.044 0.070 0.183 0.134 0.062 0.015
BRIC MedHigh 0.031 0.023 0.050 0.027 0.115 0.043 0.035 0.027 0.043 0.041 0.035 0.036 0.033 0.115 0.036 0.006 0.053 0.017 0.024 0.028 0.030 0.005 0.016 0.023 0.015 0.135 0.094 0.052 0.028
BRIC Medium-Low 0.036 0.008 0.051 0.040 0.173 0.073 0.026 0.019 0.046 0.013 0.045 0.037 0.034 0.071 0.040 0.031 0.027 0.043 0.010 0.012 0.031 0.013 0.019 0.038 0.056 0.292 0.048 0.044 0.011
Brazil High 0.003 0.003 0.010 0.004 0.009 0.006 0.003 0.002 0.005 0.007 0.009 0.004 0.002 0.005 0.002 0.001 0.002 0.001 0.006 0.002 0.008 0.003 0.010 0.001 0.000 0.000 0.000 0.001 0.001
Brazil MedHigh 0.003 0.004 0.006 0.005 0.003 0.006 0.000 0.004 0.005 0.001 0.005 0.005 0.003 0.001 0.001 0.002 0.001 0.001 0.008 0.003 0.005 0.001 0.011 0.003 0.000 0.000 0.000 0.002 0.000
Brazil Medium-Low 0.001 0.001 0.005 0.005 0.003 0.013 0.001 0.006 0.010 0.003 0.004 0.004 0.000 0.000 0.001 0.000 0.000 0.000 0.003 0.001 0.007 0.000 0.016 0.000 0.000 0.000 0.001 0.000 0.000
China High 0.020 0.009 0.045 0.019 0.048 0.018 0.004 0.006 0.019 0.022 0.026 0.017 0.007 0.037 0.011 0.017 0.007 0.006 0.015 0.007 0.024 0.028 0.012 0.008 0.004 0.002 0.004 0.004 0.006
China MedHigh 0.008 0.007 0.022 0.007 0.018 0.017 0.004 0.017 0.018 0.009 0.011 0.015 0.003 0.002 0.007 0.003 0.001 0.004 0.006 0.010 0.008 0.003 0.003 0.005 0.006 0.001 0.003 0.009 0.007
China Medium-Low 0.011 0.003 0.018 0.017 0.009 0.032 0.011 0.006 0.012 0.003 0.013 0.016 0.002 0.002 0.006 0.021 0.001 0.000 0.003 0.001 0.007 0.002 0.002 0.000 0.001 0.087 0.000 0.001 0.002
India High 0.006 0.003 0.014 0.006 0.009 0.007 0.000 0.005 0.006 0.006 0.017 0.009 0.005 0.000 0.001 0.003 0.002 0.001 0.005 0.006 0.009 0.000 0.002 0.004 0.003 0.003 0.003 0.008 0.003
India MedHigh 0.002 0.004 0.004 0.003 0.003 0.006 0.000 0.001 0.009 0.015 0.003 0.007 0.004 0.001 0.001 0.000 0.002 0.000 0.003 0.003 0.004 0.001 0.001 0.001 0.001 0.001 0.001 0.001 0.005
India Medium-Low 0.002 0.001 0.006 0.005 0.003 0.016 0.000 0.001 0.005 0.001 0.010 0.008 0.002 0.000 0.005 0.004 0.002 0.000 0.001 0.001 0.004 0.000 0.000 0.000 0.002 0.058 0.000 0.007 0.003
Russia High 0.025 0.011 0.032 0.015 0.090 0.011 0.035 0.010 0.019 0.006 0.018 0.010 0.033 0.078 0.019 0.003 0.032 0.020 0.008 0.008 0.021 0.000 0.003 0.032 0.064 0.179 0.127 0.048 0.006
Russia MedHigh 0.018 0.008 0.018 0.012 0.091 0.013 0.031 0.006 0.011 0.016 0.016 0.010 0.024 0.111 0.028 0.001 0.049 0.013 0.007 0.012 0.012 0.000 0.002 0.015 0.008 0.133 0.089 0.040 0.015
Russia Medium-Low 0.022 0.003 0.022 0.013 0.159 0.012 0.015 0.006 0.019 0.005 0.017 0.009 0.029 0.069 0.028 0.005 0.024 0.042 0.004 0.009 0.013 0.011 0.001 0.038 0.052 0.147 0.047 0.036 0.007
CIS High 0.036 0.015 0.044 0.020 0.109 0.015 0.036 0.013 0.027 0.010 0.028 0.016 0.045 0.100 0.038 0.003 0.049 0.036 0.011 0.013 0.030 0.005 0.004 0.065 0.067 0.278 0.219 0.096 0.016
CIS MedHigh 0.027 0.010 0.025 0.016 0.102 0.018 0.032 0.008 0.017 0.018 0.018 0.014 0.037 0.139 0.051 0.002 0.069 0.031 0.009 0.016 0.016 0.000 0.002 0.027 0.013 0.197 0.139 0.099 0.038
CIS Medium-Low 0.029 0.004 0.025 0.015 0.161 0.013 0.017 0.008 0.020 0.007 0.020 0.013 0.036 0.108 0.051 0.006 0.030 0.081 0.005 0.010 0.023 0.016 0.001 0.044 0.054 0.201 0.119 0.047 0.025
MERCOSUR High 0.009 0.006 0.018 0.009 0.023 0.011 0.024 0.004 0.012 0.012 0.020 0.009 0.003 0.009 0.003 0.002 0.003 0.002 0.026 0.004 0.018 0.003 0.018 0.003 0.000 0.000 0.003 0.003 0.002
MERCOSUR MedHigh 0.006 0.007 0.010 0.008 0.006 0.011 0.002 0.008 0.010 0.004 0.008 0.009 0.004 0.001 0.001 0.003 0.002 0.001 0.017 0.004 0.011 0.001 0.013 0.004 0.000 0.002 0.000 0.004 0.004
MERCOSUR Medium-Low 0.002 0.003 0.012 0.012 0.008 0.023 0.002 0.013 0.015 0.003 0.015 0.009 0.003 0.001 0.002 0.003 0.000 0.001 0.011 0.001 0.011 0.000 0.017 0.000 0.001 0.000 0.001 0.001 0.000
ACP Africa High 0.007 0.014 0.015 0.007 0.029 0.024 0.012 0.006 0.013 0.018 0.018 0.022 0.005 0.003 0.010 0.010 0.002 0.002 0.011 0.014 0.015 0.002 0.083 0.004 0.014 0.002 0.002 0.003 0.003
ACP Africa MedHigh 0.007 0.011 0.011 0.010 0.005 0.023 0.010 0.007 0.015 0.006 0.005 0.017 0.002 0.001 0.001 0.002 0.003 0.003 0.012 0.011 0.007 0.002 0.039 0.003 0.028 0.004 0.000 0.004 0.014
ACP Africa Medium-Low 0.005 0.005 0.013 0.011 0.002 0.045 0.014 0.005 0.023 0.004 0.011 0.020 0.001 0.006 0.003 0.009 0.003 0.000 0.004 0.003 0.020 0.017 0.081 0.004 0.005 0.003 0.001 0.001 0.003
ACP Caribbean High 0.000 0.000 0.000 0.001 0.002 0.001 0.000 0.000 0.001 0.001 0.002 0.002 0.000 0.000 0.000 0.000 0.000 0.000 0.002 0.000 0.001 0.001 0.001 0.000 0.000 0.000 0.000 0.000 0.000
ACP Caribbean MedHigh 0.000 0.000 0.001 0.002 0.000 0.001 0.000 0.001 0.002 0.002 0.000 0.002 0.000 0.000 0.001 0.000 0.000 0.000 0.005 0.002 0.001 0.001 0.002 0.001 0.001 0.002 0.000 0.002 0.000
ACP Caribbean Medium-Low 0.001 0.001 0.000 0.002 0.000 0.000 0.000 0.002 0.000 0.000 0.001 0.002 0.000 0.005 0.001 0.000 0.000 0.000 0.001 0.000 0.005 0.001 0.000 0.000 0.000 0.001 0.001 0.000 0.000
ACP Pacific High 0.000 0.000 0.000 0.000 0.000 0.000 0.000 0.000 0.000 0.000 0.000 0.000 0.000 0.000 0.000 0.000 0.000 0.000 0.000 0.000 0.000 0.000 0.000 0.000 0.000 0.000 0.000 0.000 0.000
ACP Pacific MedHigh 0.000 0.000 0.000 0.000 0.000 0.000 0.000 0.000 0.000 0.004 0.000 0.000 0.000 0.000 0.000 0.000 0.000 0.000 0.000 0.001 0.000 0.000 0.000 0.000 0.000 0.001 0.000 0.000 0.000
ACP Pacific Medium-Low 0.000 0.000 0.000 0.000 0.000 0.000 0.000 0.000 0.000 0.000 0.000 0.000 0.000 0.000 0.000 0.000 0.000 0.000 0.000 0.000 0.000 0.000 0.000 0.000 0.000 0.000 0.000 0.000 0.000
EURMED High 0.024 0.018 0.028 0.014 0.032 0.048 0.009 0.015 0.033 0.014 0.020 0.025 0.011 0.001 0.025 0.011 0.014 0.015 0.041 0.127 0.045 0.019 0.024 0.048 0.050 0.014 0.004 0.018 0.030
EURMED MedHigh 0.012 0.020 0.025 0.009 0.014 0.053 0.010 0.014 0.025 0.018 0.012 0.028 0.013 0.005 0.027 0.008 0.014 0.010 0.056 0.127 0.046 0.019 0.018 0.144 0.054 0.010 0.008 0.013 0.084
EURMED Medium-Low 0.016 0.010 0.020 0.012 0.008 0.046 0.003 0.009 0.016 0.005 0.010 0.023 0.009 0.011 0.015 0.008 0.011 0.004 0.025 0.094 0.029 0.065 0.014 0.050 0.029 0.004 0.014 0.008 0.059
Middle East High 0.011 0.012 0.016 0.008 0.067 0.017 0.004 0.005 0.025 0.017 0.046 0.034 0.006 0.004 0.016 0.011 0.005 0.006 0.012 0.035 0.030 0.047 0.005 0.006 0.082 0.001 0.001 0.008 0.007
Middle East MedHigh 0.009 0.006 0.010 0.004 0.002 0.024 0.014 0.006 0.013 0.006 0.006 0.028 0.015 0.001 0.002 0.002 0.004 0.008 0.011 0.012 0.014 0.002 0.006 0.002 0.057 0.000 0.000 0.001 0.014
Middle East Medium-Low 0.007 0.005 0.015 0.017 0.002 0.032 0.009 0.004 0.009 0.005 0.009 0.025 0.002 0.000 0.010 0.004 0.003 0.000 0.003 0.004 0.048 0.016 0.001 0.004 0.024 0.001 0.000 0.003 0.013
Oceania High 0.009 0.004 0.011 0.014 0.008 0.008 0.009 0.002 0.010 0.007 0.018 0.013 0.002 0.000 0.002 0.010 0.002 0.001 0.004 0.002 0.009 0.003 0.001 0.001 0.004 0.002 0.000 0.002 0.000
Oceania MedHigh 0.005 0.005 0.006 0.008 0.003 0.006 0.002 0.001 0.010 0.005 0.012 0.015 0.001 0.001 0.001 0.009 0.002 0.002 0.004 0.006 0.006 0.006 0.001 0.001 0.000 0.001 0.000 0.001 0.000
Oceania Medium-Low 0.004 0.002 0.008 0.008 0.003 0.004 0.001 0.002 0.010 0.009 0.019 0.018 0.003 0.001 0.001 0.007 0.002 0.000 0.001 0.005 0.004 0.001 0.001 0.001 0.002 0.036 0.001 0.001 0.001
Country Group 4
Partner Countries
Country Group 1 Country Group 2 Country Group 3
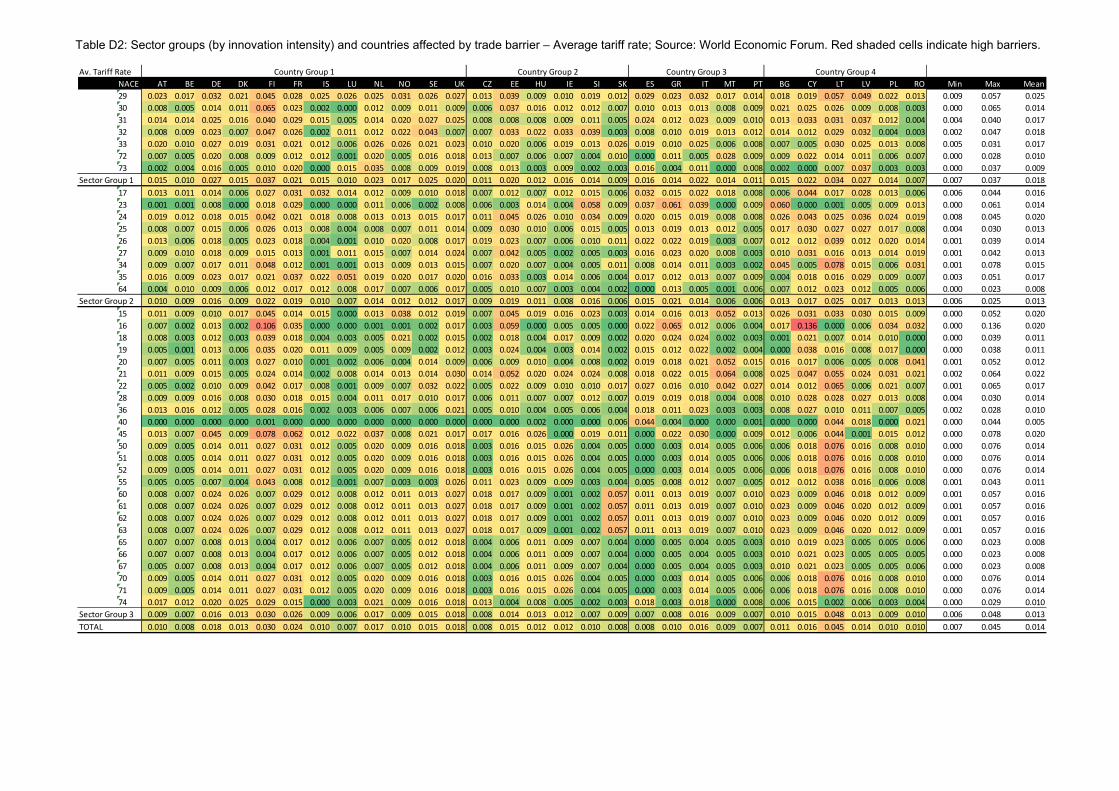
Table D2: Sector groups (by innovation intensity) and countries affected by trade barrier – Average tariff rate; Source: World Economic Forum. Red shaded cells indicate high barriers.
Av. Tariff Rate
NACE AT BE DE DK FI FR IS LU NL NO SE UK CZ EE HU IE SI SK ES GR IT MT PT BG CY LT LV PL RO Min Max Mean
29 0.023 0.017 0.032 0.021 0.045 0.028 0.025 0.026 0.025 0.031 0.026 0.027 0.013 0.039 0.009 0.010 0.019 0.012 0.029 0.023 0.032 0.017 0.014 0.018 0.019 0.057 0.049 0.022 0.013 0.009 0.057 0.025
30 0.008 0.005 0.014 0.011 0.065 0.023 0.002 0.000 0.012 0.009 0.011 0.009 0.006 0.037 0.016 0.012 0.012 0.007 0.010 0.013 0.013 0.008 0.009 0.021 0.025 0.026 0.009 0.008 0.003 0.000 0.065 0.014
31 0.014 0.014 0.025 0.016 0.040 0.029 0.015 0.005 0.014 0.020 0.027 0.025 0.008 0.008 0.008 0.009 0.011 0.005 0.024 0.012 0.023 0.009 0.010 0.013 0.033 0.031 0.037 0.012 0.004 0.004 0.040 0.017
32 0.008 0.009 0.023 0.007 0.047 0.026 0.002 0.011 0.012 0.022 0.043 0.007 0.007 0.033 0.022 0.033 0.039 0.003 0.008 0.010 0.019 0.013 0.012 0.014 0.012 0.029 0.032 0.004 0.003 0.002 0.047 0.018
33 0.020 0.010 0.027 0.019 0.031 0.021 0.012 0.006 0.026 0.026 0.021 0.023 0.010 0.020 0.006 0.019 0.013 0.026 0.019 0.010 0.025 0.006 0.008 0.007 0.005 0.030 0.025 0.013 0.008 0.005 0.031 0.017
72 0.007 0.005 0.020 0.008 0.009 0.012 0.012 0.001 0.020 0.005 0.016 0.018 0.013 0.007 0.006 0.007 0.004 0.010 0.000 0.011 0.005 0.028 0.009 0.009 0.022 0.014 0.011 0.006 0.007 0.000 0.028 0.010
73 0.002 0.004 0.016 0.005 0.010 0.020 0.000 0.015 0.035 0.008 0.009 0.019 0.008 0.013 0.003 0.009 0.002 0.003 0.016 0.004 0.011 0.000 0.008 0.002 0.000 0.007 0.037 0.003 0.003 0.000 0.037 0.009
Sector Group 1 0.015 0.010 0.027 0.015 0.037 0.021 0.015 0.010 0.023 0.017 0.025 0.020 0.011 0.020 0.012 0.016 0.014 0.009 0.016 0.014 0.022 0.014 0.011 0.015 0.022 0.034 0.027 0.014 0.007 0.007 0.037 0.018
17 0.013 0.011 0.014 0.006 0.027 0.031 0.032 0.014 0.012 0.009 0.010 0.018 0.007 0.012 0.007 0.012 0.015 0.006 0.032 0.015 0.022 0.018 0.008 0.006 0.044 0.017 0.028 0.013 0.006 0.006 0.044 0.016
23 0.001 0.001 0.008 0.000 0.018 0.029 0.000 0.000 0.011 0.006 0.002 0.008 0.006 0.003 0.014 0.004 0.058 0.009 0.037 0.061 0.039 0.000 0.009 0.060 0.000 0.001 0.005 0.009 0.013 0.000 0.061 0.014
24 0.019 0.012 0.018 0.015 0.042 0.021 0.018 0.008 0.013 0.013 0.015 0.017 0.011 0.045 0.026 0.010 0.034 0.009 0.020 0.015 0.019 0.008 0.008 0.026 0.043 0.025 0.036 0.024 0.019 0.008 0.045 0.020
25 0.008 0.007 0.015 0.006 0.026 0.013 0.008 0.004 0.008 0.007 0.011 0.014 0.009 0.030 0.010 0.006 0.015 0.005 0.013 0.019 0.013 0.012 0.005 0.017 0.030 0.027 0.027 0.017 0.008 0.004 0.030 0.013
26 0.013 0.006 0.018 0.005 0.023 0.018 0.004 0.001 0.010 0.020 0.008 0.017 0.019 0.023 0.007 0.006 0.010 0.011 0.022 0.022 0.019 0.003 0.007 0.012 0.012 0.039 0.012 0.020 0.014 0.001 0.039 0.014
27 0.009 0.010 0.018 0.009 0.015 0.013 0.001 0.011 0.015 0.007 0.014 0.024 0.007 0.042 0.005 0.002 0.005 0.003 0.016 0.023 0.020 0.008 0.003 0.010 0.031 0.016 0.013 0.014 0.019 0.001 0.042 0.013
34 0.009 0.007 0.017 0.011 0.048 0.012 0.001 0.001 0.013 0.009 0.013 0.015 0.007 0.020 0.007 0.004 0.005 0.011 0.008 0.014 0.011 0.003 0.002 0.045 0.005 0.078 0.015 0.006 0.031 0.001 0.078 0.015
35 0.016 0.009 0.023 0.017 0.021 0.037 0.022 0.051 0.019 0.020 0.017 0.020 0.016 0.033 0.003 0.014 0.006 0.004 0.017 0.012 0.013 0.007 0.009 0.004 0.018 0.016 0.029 0.009 0.007 0.003 0.051 0.017
64 0.004 0.010 0.009 0.006 0.012 0.017 0.012 0.008 0.017 0.007 0.006 0.017 0.005 0.010 0.007 0.003 0.004 0.002 0.000 0.013 0.005 0.001 0.006 0.007 0.012 0.023 0.012 0.005 0.006 0.000 0.023 0.008
Sector Group 2 0.010 0.009 0.016 0.009 0.022 0.019 0.010 0.007 0.014 0.012 0.012 0.017 0.009 0.019 0.011 0.008 0.016 0.006 0.015 0.021 0.014 0.006 0.006 0.013 0.017 0.025 0.017 0.013 0.013 0.006 0.025 0.013
15 0.011 0.009 0.010 0.017 0.045 0.014 0.015 0.000 0.013 0.038 0.012 0.019 0.007 0.045 0.019 0.016 0.023 0.003 0.014 0.016 0.013 0.052 0.013 0.026 0.031 0.033 0.030 0.015 0.009 0.000 0.052 0.020
16 0.007 0.002 0.013 0.002 0.106 0.035 0.000 0.000 0.001 0.001 0.002 0.017 0.003 0.059 0.000 0.005 0.005 0.000 0.022 0.065 0.012 0.006 0.004 0.017 0.136 0.000 0.006 0.034 0.032 0.000 0.136 0.020
18 0.008 0.003 0.012 0.003 0.039 0.018 0.004 0.003 0.005 0.021 0.002 0.015 0.002 0.018 0.004 0.017 0.009 0.002 0.020 0.024 0.024 0.002 0.003 0.001 0.021 0.007 0.014 0.010 0.000 0.000 0.039 0.011
19 0.005 0.001 0.013 0.006 0.035 0.020 0.011 0.009 0.005 0.009 0.002 0.012 0.003 0.024 0.004 0.003 0.014 0.002 0.015 0.012 0.022 0.002 0.004 0.000 0.038 0.016 0.008 0.017 0.000 0.000 0.038 0.011
20 0.007 0.005 0.011 0.003 0.027 0.010 0.001 0.002 0.006 0.004 0.014 0.009 0.006 0.009 0.010 0.004 0.008 0.002 0.019 0.018 0.021 0.052 0.015 0.016 0.017 0.006 0.005 0.008 0.041 0.001 0.052 0.012
21 0.011 0.009 0.015 0.005 0.024 0.014 0.002 0.008 0.014 0.013 0.014 0.030 0.014 0.052 0.020 0.024 0.024 0.008 0.018 0.022 0.015 0.064 0.008 0.025 0.047 0.055 0.024 0.031 0.021 0.002 0.064 0.022
22 0.005 0.002 0.010 0.009 0.042 0.017 0.008 0.001 0.009 0.007 0.032 0.022 0.005 0.022 0.009 0.010 0.010 0.017 0.027 0.016 0.010 0.042 0.027 0.014 0.012 0.065 0.006 0.021 0.007 0.001 0.065 0.017
28 0.009 0.009 0.016 0.008 0.030 0.018 0.015 0.004 0.011 0.017 0.010 0.017 0.006 0.011 0.007 0.007 0.012 0.007 0.019 0.019 0.018 0.004 0.008 0.010 0.028 0.028 0.027 0.013 0.008 0.004 0.030 0.014
36 0.013 0.016 0.012 0.005 0.028 0.016 0.002 0.003 0.006 0.007 0.006 0.021 0.005 0.010 0.004 0.005 0.006 0.004 0.018 0.011 0.023 0.003 0.003 0.008 0.027 0.010 0.011 0.007 0.005 0.002 0.028 0.010
40 0.000 0.000 0.000 0.000 0.001 0.000 0.000 0.000 0.000 0.000 0.000 0.000 0.000 0.000 0.002 0.000 0.000 0.006 0.044 0.004 0.000 0.000 0.001 0.000 0.000 0.044 0.018 0.000 0.021 0.000 0.044 0.005
45 0.013 0.007 0.045 0.009 0.078 0.062 0.012 0.022 0.037 0.008 0.021 0.017 0.017 0.016 0.026 0.000 0.019 0.011 0.000 0.022 0.030 0.000 0.009 0.012 0.006 0.044 0.001 0.015 0.012 0.000 0.078 0.020
50 0.009 0.005 0.014 0.011 0.027 0.031 0.012 0.005 0.020 0.009 0.016 0.018 0.003 0.016 0.015 0.026 0.004 0.005 0.000 0.003 0.014 0.005 0.006 0.006 0.018 0.076 0.016 0.008 0.010 0.000 0.076 0.014
51 0.008 0.005 0.014 0.011 0.027 0.031 0.012 0.005 0.020 0.009 0.016 0.018 0.003 0.016 0.015 0.026 0.004 0.005 0.000 0.003 0.014 0.005 0.006 0.006 0.018 0.076 0.016 0.008 0.010 0.000 0.076 0.014
52 0.009 0.005 0.014 0.011 0.027 0.031 0.012 0.005 0.020 0.009 0.016 0.018 0.003 0.016 0.015 0.026 0.004 0.005 0.000 0.003 0.014 0.005 0.006 0.006 0.018 0.076 0.016 0.008 0.010 0.000 0.076 0.014
55 0.005 0.005 0.007 0.004 0.043 0.008 0.012 0.001 0.007 0.003 0.003 0.026 0.011 0.023 0.009 0.009 0.003 0.004 0.005 0.008 0.012 0.007 0.005 0.012 0.012 0.038 0.016 0.006 0.008 0.001 0.043 0.011
60 0.008 0.007 0.024 0.026 0.007 0.029 0.012 0.008 0.012 0.011 0.013 0.027 0.018 0.017 0.009 0.001 0.002 0.057 0.011 0.013 0.019 0.007 0.010 0.023 0.009 0.046 0.018 0.012 0.009 0.001 0.057 0.016
61 0.008 0.007 0.024 0.026 0.007 0.029 0.012 0.008 0.012 0.011 0.013 0.027 0.018 0.017 0.009 0.001 0.002 0.057 0.011 0.013 0.019 0.007 0.010 0.023 0.009 0.046 0.020 0.012 0.009 0.001 0.057 0.016
62 0.008 0.007 0.024 0.026 0.007 0.029 0.012 0.008 0.012 0.011 0.013 0.027 0.018 0.017 0.009 0.001 0.002 0.057 0.011 0.013 0.019 0.007 0.010 0.023 0.009 0.046 0.020 0.012 0.009 0.001 0.057 0.016
63 0.008 0.007 0.024 0.026 0.007 0.029 0.012 0.008 0.012 0.011 0.013 0.027 0.018 0.017 0.009 0.001 0.002 0.057 0.011 0.013 0.019 0.007 0.010 0.023 0.009 0.046 0.020 0.012 0.009 0.001 0.057 0.016
65 0.007 0.007 0.008 0.013 0.004 0.017 0.012 0.006 0.007 0.005 0.012 0.018 0.004 0.006 0.011 0.009 0.007 0.004 0.000 0.005 0.004 0.005 0.003 0.010 0.019 0.023 0.005 0.005 0.006 0.000 0.023 0.008
66 0.007 0.007 0.008 0.013 0.004 0.017 0.012 0.006 0.007 0.005 0.012 0.018 0.004 0.006 0.011 0.009 0.007 0.004 0.000 0.005 0.004 0.005 0.003 0.010 0.021 0.023 0.005 0.005 0.005 0.000 0.023 0.008
67 0.005 0.007 0.008 0.013 0.004 0.017 0.012 0.006 0.007 0.005 0.012 0.018 0.004 0.006 0.011 0.009 0.007 0.004 0.000 0.005 0.004 0.005 0.003 0.010 0.021 0.023 0.005 0.005 0.006 0.000 0.023 0.008
70 0.009 0.005 0.014 0.011 0.027 0.031 0.012 0.005 0.020 0.009 0.016 0.018 0.003 0.016 0.015 0.026 0.004 0.005 0.000 0.003 0.014 0.005 0.006 0.006 0.018 0.076 0.016 0.008 0.010 0.000 0.076 0.014
71 0.009 0.005 0.014 0.011 0.027 0.031 0.012 0.005 0.020 0.009 0.016 0.018 0.003 0.016 0.015 0.026 0.004 0.005 0.000 0.003 0.014 0.005 0.006 0.006 0.018 0.076 0.016 0.008 0.010 0.000 0.076 0.014
74 0.017 0.012 0.020 0.025 0.029 0.015 0.000 0.003 0.021 0.009 0.016 0.018 0.013 0.004 0.008 0.005 0.002 0.003 0.018 0.003 0.018 0.000 0.008 0.006 0.015 0.002 0.006 0.003 0.004 0.000 0.029 0.010
Sector Group 3 0.009 0.007 0.016 0.013 0.030 0.026 0.009 0.006 0.017 0.009 0.015 0.018 0.008 0.014 0.013 0.012 0.007 0.009 0.007 0.008 0.016 0.009 0.007 0.010 0.015 0.048 0.013 0.009 0.010 0.006 0.048 0.013
TOTAL 0.010 0.008 0.018 0.013 0.030 0.024 0.010 0.007 0.017 0.010 0.015 0.018 0.008 0.015 0.012 0.012 0.010 0.008 0.008 0.010 0.016 0.009 0.007 0.011 0.016 0.045 0.014 0.010 0.010 0.007 0.045 0.014
Country Group 3 Country Group 4Country Group 2Country Group 1
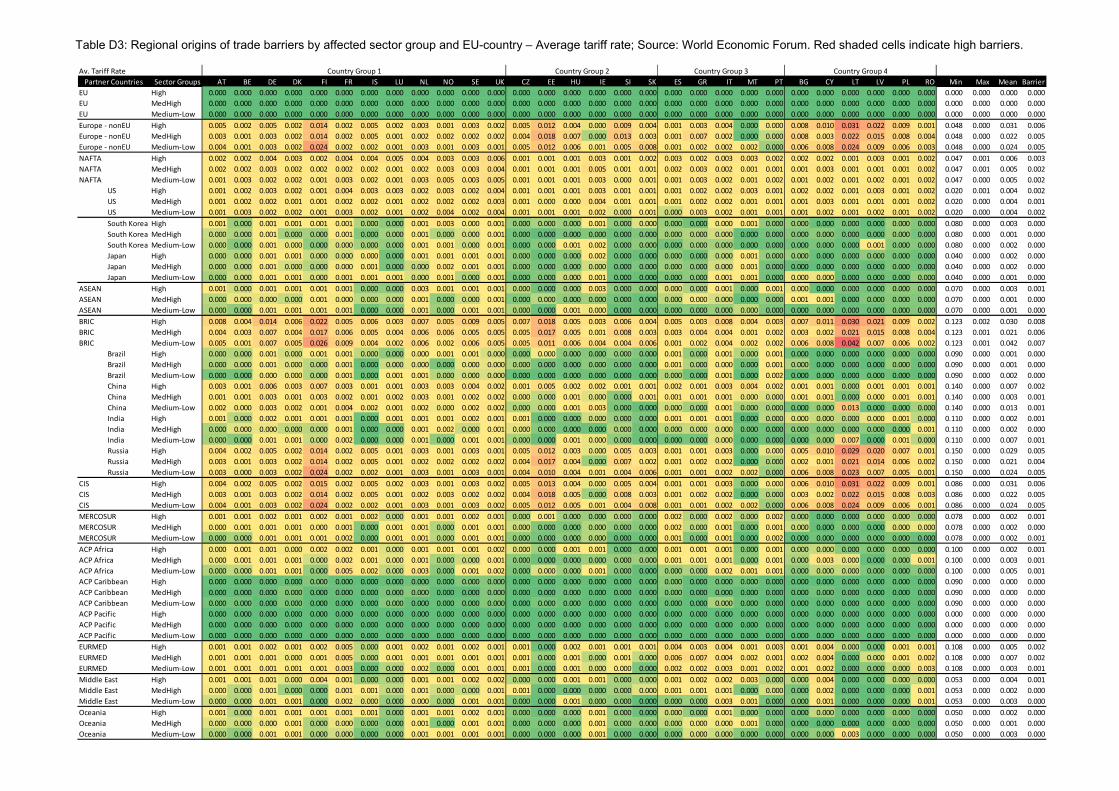
Table D3: Regional origins of trade barriers by affected sector group and EU-country – Average tariff rate; Source: World Economic Forum. Red shaded cells indicate high barriers.
Av. Tariff Rate
Sector Groups AT BE DE DK FI FR IS LU NL NO SE UK CZ EE HU IE SI SK ES GR IT MT PT BG CY LT LV PL RO Min Max Mean Barrier
EU High 0.000 0.000 0.000 0.000 0.000 0.000 0.000 0.000 0.000 0.000 0.000 0.000 0.000 0.000 0.000 0.000 0.000 0.000 0.000 0.000 0.000 0.000 0.000 0.000 0.000 0.000 0.000 0.000 0.000 0.000 0.000 0.000 0.000
EU MedHigh 0.000 0.000 0.000 0.000 0.000 0.000 0.000 0.000 0.000 0.000 0.000 0.000 0.000 0.000 0.000 0.000 0.000 0.000 0.000 0.000 0.000 0.000 0.000 0.000 0.000 0.000 0.000 0.000 0.000 0.000 0.000 0.000 0.000
EU Medium-Low 0.000 0.000 0.000 0.000 0.000 0.000 0.000 0.000 0.000 0.000 0.000 0.000 0.000 0.000 0.000 0.000 0.000 0.000 0.000 0.000 0.000 0.000 0.000 0.000 0.000 0.000 0.000 0.000 0.000 0.000 0.000 0.000 0.000
Europe - nonEU High 0.005 0.002 0.005 0.002 0.014 0.002 0.005 0.002 0.003 0.001 0.003 0.002 0.005 0.012 0.004 0.000 0.009 0.004 0.001 0.003 0.004 0.000 0.000 0.008 0.010 0.031 0.022 0.009 0.001 0.048 0.000 0.031 0.006
Europe - nonEU MedHigh 0.003 0.001 0.003 0.002 0.014 0.002 0.005 0.001 0.002 0.002 0.002 0.002 0.004 0.018 0.007 0.000 0.013 0.003 0.001 0.007 0.002 0.000 0.000 0.008 0.003 0.022 0.015 0.008 0.004 0.048 0.000 0.022 0.005
Europe - nonEU Medium-Low 0.004 0.001 0.003 0.002 0.024 0.002 0.002 0.001 0.003 0.001 0.003 0.001 0.005 0.012 0.006 0.001 0.005 0.008 0.001 0.002 0.002 0.002 0.000 0.006 0.008 0.024 0.009 0.006 0.003 0.048 0.000 0.024 0.005
NAFTA High 0.002 0.002 0.004 0.003 0.002 0.004 0.004 0.005 0.004 0.003 0.003 0.006 0.001 0.001 0.001 0.003 0.001 0.002 0.003 0.002 0.003 0.003 0.002 0.002 0.002 0.001 0.003 0.001 0.002 0.047 0.001 0.006 0.003
NAFTA MedHigh 0.002 0.002 0.003 0.002 0.002 0.002 0.002 0.001 0.002 0.003 0.003 0.004 0.001 0.001 0.001 0.005 0.001 0.001 0.002 0.003 0.002 0.001 0.001 0.001 0.003 0.001 0.001 0.001 0.002 0.047 0.001 0.005 0.002
NAFTA Medium-Low 0.001 0.003 0.002 0.002 0.001 0.003 0.002 0.001 0.003 0.005 0.003 0.005 0.001 0.001 0.001 0.003 0.000 0.001 0.001 0.003 0.002 0.001 0.002 0.001 0.002 0.001 0.002 0.001 0.002 0.047 0.000 0.005 0.002
US High 0.001 0.002 0.003 0.002 0.001 0.004 0.003 0.003 0.002 0.003 0.002 0.004 0.001 0.001 0.001 0.003 0.001 0.001 0.001 0.002 0.002 0.003 0.001 0.002 0.002 0.001 0.003 0.001 0.002 0.020 0.001 0.004 0.002
US MedHigh 0.001 0.002 0.002 0.001 0.001 0.002 0.002 0.001 0.002 0.002 0.002 0.003 0.001 0.000 0.000 0.004 0.001 0.001 0.001 0.002 0.002 0.001 0.001 0.001 0.003 0.001 0.001 0.001 0.002 0.020 0.000 0.004 0.001
US Medium-Low 0.001 0.003 0.002 0.002 0.001 0.003 0.002 0.001 0.002 0.004 0.002 0.004 0.001 0.001 0.001 0.002 0.000 0.001 0.000 0.003 0.002 0.001 0.001 0.001 0.002 0.001 0.002 0.001 0.002 0.020 0.000 0.004 0.002
South Korea High 0.001 0.000 0.001 0.001 0.001 0.001 0.000 0.000 0.001 0.003 0.000 0.001 0.000 0.000 0.000 0.001 0.000 0.000 0.000 0.000 0.000 0.001 0.000 0.000 0.000 0.000 0.000 0.000 0.000 0.080 0.000 0.003 0.000
South Korea MedHigh 0.000 0.000 0.001 0.000 0.000 0.001 0.000 0.000 0.001 0.000 0.000 0.001 0.000 0.000 0.000 0.000 0.000 0.000 0.000 0.000 0.000 0.000 0.000 0.000 0.000 0.000 0.000 0.000 0.000 0.080 0.000 0.001 0.000
South Korea Medium-Low 0.000 0.000 0.001 0.000 0.000 0.000 0.000 0.000 0.001 0.001 0.000 0.001 0.000 0.000 0.001 0.002 0.000 0.000 0.000 0.000 0.000 0.000 0.000 0.000 0.000 0.000 0.001 0.000 0.000 0.080 0.000 0.002 0.000
Japan High 0.000 0.000 0.001 0.001 0.000 0.000 0.000 0.000 0.001 0.001 0.001 0.001 0.000 0.000 0.000 0.002 0.000 0.000 0.000 0.000 0.000 0.001 0.000 0.000 0.000 0.000 0.000 0.000 0.000 0.040 0.000 0.002 0.000
Japan MedHigh 0.000 0.000 0.001 0.000 0.000 0.000 0.001 0.000 0.000 0.002 0.001 0.001 0.000 0.000 0.000 0.000 0.000 0.000 0.000 0.000 0.000 0.001 0.000 0.000 0.000 0.000 0.000 0.000 0.000 0.040 0.000 0.002 0.000
Japan Medium-Low 0.000 0.000 0.001 0.001 0.000 0.001 0.001 0.001 0.000 0.001 0.000 0.001 0.000 0.000 0.000 0.001 0.000 0.000 0.000 0.000 0.001 0.001 0.000 0.000 0.000 0.000 0.000 0.000 0.000 0.040 0.000 0.001 0.000
ASEAN High 0.001 0.000 0.001 0.001 0.001 0.001 0.000 0.000 0.003 0.001 0.001 0.001 0.000 0.000 0.000 0.003 0.000 0.000 0.000 0.000 0.001 0.000 0.001 0.000 0.000 0.000 0.000 0.000 0.000 0.070 0.000 0.003 0.001
ASEAN MedHigh 0.000 0.000 0.000 0.000 0.001 0.000 0.000 0.000 0.001 0.000 0.000 0.001 0.000 0.000 0.000 0.000 0.000 0.000 0.000 0.000 0.000 0.000 0.000 0.001 0.001 0.000 0.000 0.000 0.000 0.070 0.000 0.001 0.000
ASEAN Medium-Low 0.000 0.000 0.001 0.001 0.001 0.001 0.000 0.000 0.001 0.000 0.001 0.001 0.000 0.000 0.001 0.000 0.000 0.000 0.000 0.000 0.000 0.000 0.000 0.000 0.000 0.000 0.000 0.000 0.000 0.070 0.000 0.001 0.000
BRIC High 0.008 0.004 0.014 0.006 0.022 0.005 0.006 0.003 0.007 0.005 0.009 0.005 0.007 0.018 0.005 0.003 0.006 0.004 0.005 0.003 0.008 0.004 0.003 0.007 0.011 0.030 0.021 0.009 0.002 0.123 0.002 0.030 0.008
BRIC MedHigh 0.004 0.003 0.007 0.004 0.017 0.006 0.005 0.004 0.006 0.006 0.005 0.005 0.005 0.017 0.005 0.001 0.008 0.003 0.003 0.004 0.004 0.001 0.002 0.003 0.002 0.021 0.015 0.008 0.004 0.123 0.001 0.021 0.006
BRIC Medium-Low 0.005 0.001 0.007 0.005 0.026 0.009 0.004 0.002 0.006 0.002 0.006 0.005 0.005 0.011 0.006 0.004 0.004 0.006 0.001 0.002 0.004 0.002 0.002 0.006 0.008 0.042 0.007 0.006 0.002 0.123 0.001 0.042 0.007
Brazil High 0.000 0.000 0.001 0.000 0.001 0.001 0.000 0.000 0.000 0.001 0.001 0.000 0.000 0.000 0.000 0.000 0.000 0.000 0.001 0.000 0.001 0.000 0.001 0.000 0.000 0.000 0.000 0.000 0.000 0.090 0.000 0.001 0.000
Brazil MedHigh 0.000 0.000 0.001 0.000 0.000 0.001 0.000 0.000 0.000 0.000 0.000 0.000 0.000 0.000 0.000 0.000 0.000 0.000 0.001 0.000 0.000 0.000 0.001 0.000 0.000 0.000 0.000 0.000 0.000 0.090 0.000 0.001 0.000
Brazil Medium-Low 0.000 0.000 0.000 0.000 0.000 0.001 0.000 0.001 0.001 0.000 0.000 0.000 0.000 0.000 0.000 0.000 0.000 0.000 0.000 0.000 0.001 0.000 0.002 0.000 0.000 0.000 0.000 0.000 0.000 0.090 0.000 0.002 0.000
China High 0.003 0.001 0.006 0.003 0.007 0.003 0.001 0.001 0.003 0.003 0.004 0.002 0.001 0.005 0.002 0.002 0.001 0.001 0.002 0.001 0.003 0.004 0.002 0.001 0.001 0.000 0.001 0.001 0.001 0.140 0.000 0.007 0.002
China MedHigh 0.001 0.001 0.003 0.001 0.003 0.002 0.001 0.002 0.003 0.001 0.002 0.002 0.000 0.000 0.001 0.000 0.000 0.001 0.001 0.001 0.001 0.000 0.000 0.001 0.001 0.000 0.000 0.001 0.001 0.140 0.000 0.003 0.001
China Medium-Low 0.002 0.000 0.003 0.002 0.001 0.004 0.002 0.001 0.002 0.000 0.002 0.002 0.000 0.000 0.001 0.003 0.000 0.000 0.000 0.000 0.001 0.000 0.000 0.000 0.000 0.013 0.000 0.000 0.000 0.140 0.000 0.013 0.001
India High 0.001 0.000 0.002 0.001 0.001 0.001 0.000 0.001 0.001 0.001 0.002 0.001 0.001 0.000 0.000 0.000 0.000 0.000 0.001 0.001 0.001 0.000 0.000 0.000 0.000 0.000 0.000 0.001 0.000 0.110 0.000 0.002 0.001
India MedHigh 0.000 0.000 0.000 0.000 0.000 0.001 0.000 0.000 0.001 0.002 0.000 0.001 0.000 0.000 0.000 0.000 0.000 0.000 0.000 0.000 0.000 0.000 0.000 0.000 0.000 0.000 0.000 0.000 0.001 0.110 0.000 0.002 0.000
India Medium-Low 0.000 0.000 0.001 0.001 0.000 0.002 0.000 0.000 0.001 0.000 0.001 0.001 0.000 0.000 0.001 0.000 0.000 0.000 0.000 0.000 0.000 0.000 0.000 0.000 0.000 0.007 0.000 0.001 0.000 0.110 0.000 0.007 0.001
Russia High 0.004 0.002 0.005 0.002 0.014 0.002 0.005 0.001 0.003 0.001 0.003 0.001 0.005 0.012 0.003 0.000 0.005 0.003 0.001 0.001 0.003 0.000 0.000 0.005 0.010 0.029 0.020 0.007 0.001 0.150 0.000 0.029 0.005
Russia MedHigh 0.003 0.001 0.003 0.002 0.014 0.002 0.005 0.001 0.002 0.002 0.002 0.002 0.004 0.017 0.004 0.000 0.007 0.002 0.001 0.002 0.002 0.000 0.000 0.002 0.001 0.021 0.014 0.006 0.002 0.150 0.000 0.021 0.004
Russia Medium-Low 0.003 0.000 0.003 0.002 0.024 0.002 0.002 0.001 0.003 0.001 0.003 0.001 0.004 0.010 0.004 0.001 0.004 0.006 0.001 0.001 0.002 0.002 0.000 0.006 0.008 0.023 0.007 0.005 0.001 0.150 0.000 0.024 0.005
CIS High 0.004 0.002 0.005 0.002 0.015 0.002 0.005 0.002 0.003 0.001 0.003 0.002 0.005 0.013 0.004 0.000 0.005 0.004 0.001 0.001 0.003 0.000 0.000 0.006 0.010 0.031 0.022 0.009 0.001 0.086 0.000 0.031 0.006
CIS MedHigh 0.003 0.001 0.003 0.002 0.014 0.002 0.005 0.001 0.002 0.003 0.002 0.002 0.004 0.018 0.005 0.000 0.008 0.003 0.001 0.002 0.002 0.000 0.000 0.003 0.002 0.022 0.015 0.008 0.003 0.086 0.000 0.022 0.005
CIS Medium-Low 0.004 0.001 0.003 0.002 0.024 0.002 0.002 0.001 0.003 0.001 0.003 0.002 0.005 0.012 0.005 0.001 0.004 0.008 0.001 0.001 0.002 0.002 0.000 0.006 0.008 0.024 0.009 0.006 0.001 0.086 0.000 0.024 0.005
MERCOSUR High 0.001 0.001 0.002 0.001 0.002 0.001 0.002 0.000 0.001 0.001 0.002 0.001 0.000 0.001 0.000 0.000 0.000 0.000 0.002 0.000 0.002 0.000 0.002 0.000 0.000 0.000 0.000 0.000 0.000 0.078 0.000 0.002 0.001
MERCOSUR MedHigh 0.000 0.001 0.001 0.001 0.000 0.001 0.000 0.001 0.001 0.000 0.001 0.001 0.000 0.000 0.000 0.000 0.000 0.000 0.002 0.000 0.001 0.000 0.001 0.000 0.000 0.000 0.000 0.000 0.000 0.078 0.000 0.002 0.000
MERCOSUR Medium-Low 0.000 0.000 0.001 0.001 0.001 0.002 0.000 0.001 0.001 0.000 0.001 0.001 0.000 0.000 0.000 0.000 0.000 0.000 0.001 0.000 0.001 0.000 0.002 0.000 0.000 0.000 0.000 0.000 0.000 0.078 0.000 0.002 0.001
ACP Africa High 0.000 0.001 0.001 0.000 0.002 0.002 0.001 0.000 0.001 0.001 0.001 0.002 0.000 0.000 0.001 0.001 0.000 0.000 0.001 0.001 0.001 0.000 0.001 0.000 0.000 0.000 0.000 0.000 0.000 0.100 0.000 0.002 0.001
ACP Africa MedHigh 0.000 0.001 0.001 0.001 0.000 0.002 0.001 0.000 0.001 0.000 0.000 0.001 0.000 0.000 0.000 0.000 0.000 0.000 0.001 0.001 0.001 0.000 0.001 0.000 0.003 0.000 0.000 0.000 0.001 0.100 0.000 0.003 0.001
ACP Africa Medium-Low 0.000 0.000 0.001 0.001 0.000 0.005 0.002 0.000 0.003 0.000 0.001 0.002 0.000 0.000 0.000 0.001 0.000 0.000 0.000 0.000 0.002 0.001 0.001 0.000 0.000 0.000 0.000 0.000 0.000 0.100 0.000 0.005 0.001
ACP Caribbean High 0.000 0.000 0.000 0.000 0.000 0.000 0.000 0.000 0.000 0.000 0.000 0.000 0.000 0.000 0.000 0.000 0.000 0.000 0.000 0.000 0.000 0.000 0.000 0.000 0.000 0.000 0.000 0.000 0.000 0.090 0.000 0.000 0.000
ACP Caribbean MedHigh 0.000 0.000 0.000 0.000 0.000 0.000 0.000 0.000 0.000 0.000 0.000 0.000 0.000 0.000 0.000 0.000 0.000 0.000 0.000 0.000 0.000 0.000 0.000 0.000 0.000 0.000 0.000 0.000 0.000 0.090 0.000 0.000 0.000
ACP Caribbean Medium-Low 0.000 0.000 0.000 0.000 0.000 0.000 0.000 0.000 0.000 0.000 0.000 0.000 0.000 0.000 0.000 0.000 0.000 0.000 0.000 0.000 0.000 0.000 0.000 0.000 0.000 0.000 0.000 0.000 0.000 0.090 0.000 0.000 0.000
ACP Pacific High 0.000 0.000 0.000 0.000 0.000 0.000 0.000 0.000 0.000 0.000 0.000 0.000 0.000 0.000 0.000 0.000 0.000 0.000 0.000 0.000 0.000 0.000 0.000 0.000 0.000 0.000 0.000 0.000 0.000 0.000 0.000 0.000 0.000
ACP Pacific MedHigh 0.000 0.000 0.000 0.000 0.000 0.000 0.000 0.000 0.000 0.000 0.000 0.000 0.000 0.000 0.000 0.000 0.000 0.000 0.000 0.000 0.000 0.000 0.000 0.000 0.000 0.000 0.000 0.000 0.000 0.000 0.000 0.000 0.000
ACP Pacific Medium-Low 0.000 0.000 0.000 0.000 0.000 0.000 0.000 0.000 0.000 0.000 0.000 0.000 0.000 0.000 0.000 0.000 0.000 0.000 0.000 0.000 0.000 0.000 0.000 0.000 0.000 0.000 0.000 0.000 0.000 0.000 0.000 0.000 0.000
EURMED High 0.001 0.001 0.002 0.001 0.002 0.005 0.000 0.001 0.002 0.001 0.002 0.001 0.001 0.000 0.002 0.001 0.001 0.001 0.004 0.003 0.004 0.001 0.003 0.001 0.004 0.000 0.000 0.001 0.001 0.108 0.000 0.005 0.002
EURMED MedHigh 0.001 0.001 0.001 0.000 0.001 0.005 0.000 0.001 0.001 0.001 0.001 0.001 0.001 0.000 0.001 0.000 0.001 0.000 0.006 0.007 0.004 0.002 0.001 0.002 0.004 0.000 0.000 0.001 0.002 0.108 0.000 0.007 0.002
EURMED Medium-Low 0.001 0.001 0.001 0.001 0.001 0.003 0.000 0.000 0.002 0.000 0.001 0.001 0.001 0.000 0.001 0.000 0.000 0.000 0.002 0.002 0.003 0.001 0.002 0.001 0.002 0.000 0.000 0.000 0.003 0.108 0.000 0.003 0.001
Middle East High 0.001 0.001 0.001 0.000 0.004 0.001 0.000 0.000 0.001 0.001 0.002 0.002 0.000 0.000 0.001 0.001 0.000 0.000 0.001 0.002 0.002 0.003 0.000 0.000 0.004 0.000 0.000 0.000 0.000 0.053 0.000 0.004 0.001
Middle East MedHigh 0.000 0.000 0.001 0.000 0.000 0.001 0.001 0.000 0.001 0.000 0.000 0.001 0.001 0.000 0.000 0.000 0.000 0.000 0.001 0.001 0.001 0.000 0.000 0.000 0.002 0.000 0.000 0.000 0.001 0.053 0.000 0.002 0.000
Middle East Medium-Low 0.000 0.000 0.001 0.001 0.000 0.002 0.000 0.000 0.000 0.000 0.001 0.001 0.000 0.000 0.001 0.000 0.000 0.000 0.000 0.000 0.003 0.001 0.000 0.000 0.001 0.000 0.000 0.000 0.001 0.053 0.000 0.003 0.000
Oceania High 0.001 0.000 0.001 0.001 0.001 0.001 0.001 0.000 0.001 0.001 0.002 0.001 0.000 0.000 0.000 0.001 0.000 0.000 0.000 0.000 0.001 0.000 0.000 0.000 0.000 0.000 0.000 0.000 0.000 0.050 0.000 0.002 0.000
Oceania MedHigh 0.000 0.000 0.000 0.001 0.000 0.000 0.000 0.000 0.001 0.000 0.001 0.001 0.000 0.000 0.000 0.001 0.000 0.000 0.000 0.000 0.000 0.001 0.000 0.000 0.000 0.000 0.000 0.000 0.000 0.050 0.000 0.001 0.000
Oceania Medium-Low 0.000 0.000 0.001 0.001 0.000 0.000 0.000 0.000 0.001 0.001 0.001 0.001 0.000 0.000 0.000 0.001 0.000 0.000 0.000 0.000 0.000 0.000 0.000 0.000 0.000 0.003 0.000 0.000 0.000 0.050 0.000 0.003 0.000
Country Group 1 Country Group 2 Country Group 3 Country Group 4
Partner Countries
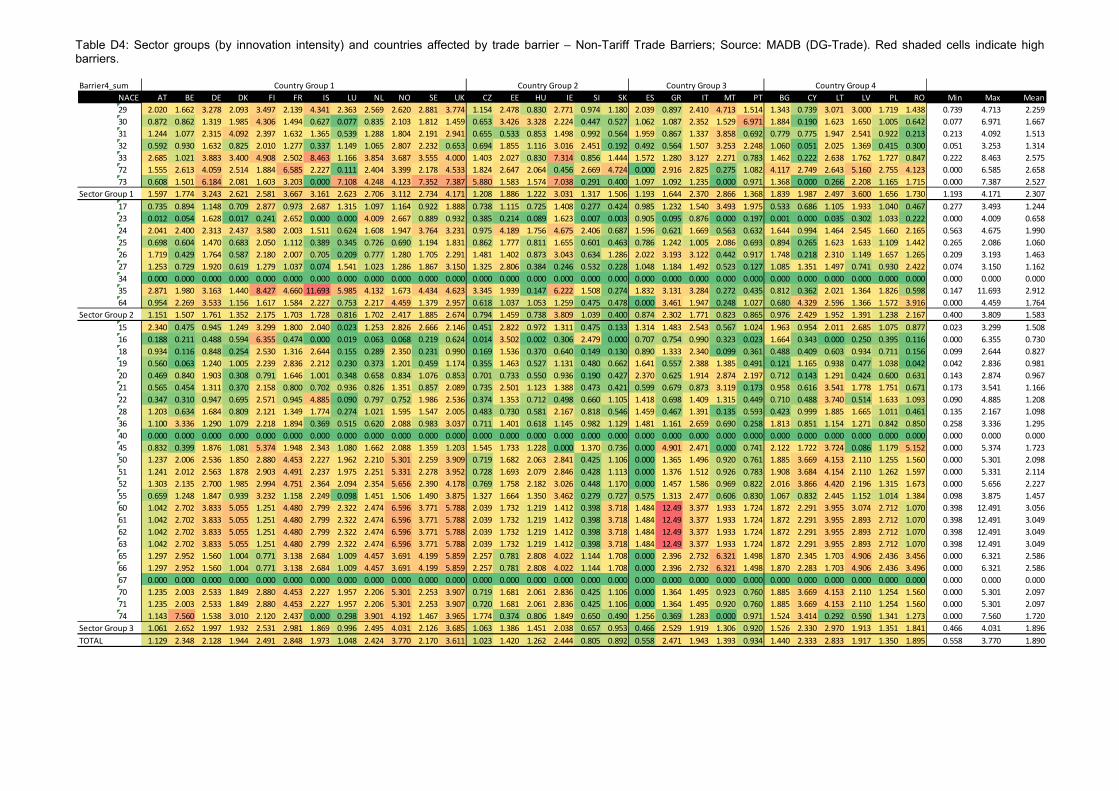
Table D4: Sector groups (by innovation intensity) and countries affected by trade barrier – Non-Tariff Trade Barriers; Source: MADB (DG-Trade). Red shaded cells indicate high barriers.
Barrier4_sum
NACE AT BE DE DK FI FR IS LU NL NO SE UK CZ EE HU IE SI SK ES GR IT MT PT BG CY LT LV PL RO Min Max Mean
29 2.020 1.662 3.278 2.093 3.497 2.139 4.341 2.363 2.569 2.620 2.881 3.774 1.154 2.478 0.830 2.771 0.974 1.180 2.039 0.897 2.410 4.713 1.514 1.343 0.739 3.071 3.000 1.719 1.438 0.739 4.713 2.259
30 0.872 0.862 1.319 1.985 4.306 1.494 0.627 0.077 0.835 2.103 1.812 1.459 0.653 3.426 3.328 2.224 0.447 0.527 1.062 1.087 2.352 1.529 6.971 1.884 0.190 1.623 1.650 1.005 0.642 0.077 6.971 1.667
31 1.244 1.077 2.315 4.092 2.397 1.632 1.365 0.539 1.288 1.804 2.191 2.941 0.655 0.533 0.853 1.498 0.992 0.564 1.959 0.867 1.337 3.858 0.692 0.779 0.775 1.947 2.541 0.922 0.213 0.213 4.092 1.513
32 0.592 0.930 1.632 0.825 2.010 1.277 0.337 1.149 1.065 2.807 2.232 0.653 0.694 1.855 1.116 3.016 2.451 0.192 0.492 0.564 1.507 3.253 2.248 1.060 0.051 2.025 1.369 0.415 0.300 0.051 3.253 1.314
33 2.685 1.021 3.883 3.400 4.908 2.502 8.463 1.166 3.854 3.687 3.555 4.000 1.403 2.027 0.830 7.314 0.856 1.444 1.572 1.280 3.127 2.271 0.783 1.462 0.222 2.638 1.762 1.727 0.847 0.222 8.463 2.575
72 1.555 2.613 4.059 2.514 1.884 6.585 2.227 0.111 2.404 3.399 2.178 4.533 1.824 2.647 2.064 0.456 2.669 4.724 0.000 2.916 2.825 0.275 1.082 4.117 2.749 2.643 5.160 2.755 4.123 0.000 6.585 2.658
73 0.608 1.501 6.184 2.081 1.603 3.203 0.000 7.108 4.248 4.123 7.352 7.387 5.880 1.583 1.574 7.038 0.291 0.400 1.097 1.092 1.235 0.000 0.971 1.368 0.000 0.266 2.208 1.165 1.715 0.000 7.387 2.527
Sector Group 1 1.597 1.774 3.243 2.621 2.581 3.667 3.161 2.623 2.706 3.112 2.734 4.171 1.208 1.886 1.222 3.031 1.317 1.506 1.193 1.644 2.370 2.866 1.368 1.839 1.987 2.497 3.600 1.656 1.730 1.193 4.171 2.307
17 0.735 0.894 1.148 0.709 2.877 0.973 2.687 1.315 1.097 1.164 0.922 1.888 0.738 1.115 0.725 1.408 0.277 0.424 0.985 1.232 1.540 3.493 1.975 0.533 0.686 1.105 1.933 1.040 0.467 0.277 3.493 1.244
23 0.012 0.054 1.628 0.017 0.241 2.652 0.000 0.000 4.009 2.667 0.889 0.932 0.385 0.214 0.089 1.623 0.007 0.003 0.905 0.095 0.876 0.000 0.197 0.001 0.000 0.035 0.302 1.033 0.222 0.000 4.009 0.658
24 2.041 2.400 2.313 2.437 3.580 2.003 1.511 0.624 1.608 1.947 3.764 3.231 0.975 4.189 1.756 4.675 2.406 0.687 1.596 0.621 1.669 0.563 0.632 1.644 0.994 1.464 2.545 1.660 2.165 0.563 4.675 1.990
25 0.698 0.604 1.470 0.683 2.050 1.112 0.389 0.345 0.726 0.690 1.194 1.831 0.862 1.777 0.811 1.655 0.601 0.463 0.786 1.242 1.005 2.086 0.693 0.894 0.265 1.623 1.633 1.109 1.442 0.265 2.086 1.060
26 1.719 0.429 1.764 0.587 2.180 2.007 0.705 0.209 0.777 1.280 1.705 2.291 1.481 1.402 0.873 3.043 0.634 1.286 2.022 3.193 3.122 0.442 0.917 1.748 0.218 2.310 1.149 1.657 1.265 0.209 3.193 1.463
27 1.253 0.729 1.920 0.619 1.279 1.037 0.074 1.541 1.023 1.286 1.867 3.150 1.325 2.806 0.384 0.246 0.532 0.228 1.048 1.184 1.492 0.523 0.127 1.085 1.351 1.497 0.741 0.930 2.422 0.074 3.150 1.162
34 0.000 0.000 0.000 0.000 0.000 0.000 0.000 0.000 0.000 0.000 0.000 0.000 0.000 0.000 0.000 0.000 0.000 0.000 0.000 0.000 0.000 0.000 0.000 0.000 0.000 0.000 0.000 0.000 0.000 0.000 0.000 0.000
35 2.871 1.980 3.163 1.440 8.427 4.660 11.693 5.985 4.132 1.673 4.434 4.623 3.345 1.939 0.147 6.222 1.508 0.274 1.832 3.131 3.284 0.272 0.435 0.812 0.362 2.021 1.364 1.826 0.598 0.147 11.693 2.912
64 0.954 2.269 3.533 1.156 1.617 1.584 2.227 0.753 2.217 4.459 1.379 2.957 0.618 1.037 1.053 1.259 0.475 0.478 0.000 3.461 1.947 0.248 1.027 0.680 4.329 2.596 1.366 1.572 3.916 0.000 4.459 1.764
Sector Group 2 1.151 1.507 1.761 1.352 2.175 1.703 1.728 0.816 1.702 2.417 1.885 2.674 0.794 1.459 0.738 3.809 1.039 0.400 0.874 2.302 1.771 0.823 0.865 0.976 2.429 1.952 1.391 1.238 2.167 0.400 3.809 1.583
15 2.340 0.475 0.945 1.249 3.299 1.800 2.040 0.023 1.253 2.826 2.666 2.146 0.451 2.822 0.972 1.311 0.475 0.133 1.314 1.483 2.543 0.567 1.024 1.963 0.954 2.011 2.685 1.075 0.877 0.023 3.299 1.508
16 0.188 0.211 0.488 0.594 6.355 0.474 0.000 0.019 0.063 0.068 0.219 0.624 0.014 3.502 0.002 0.306 2.479 0.000 0.707 0.754 0.990 0.323 0.023 1.664 0.343 0.000 0.250 0.395 0.116 0.000 6.355 0.730
18 0.934 0.116 0.848 0.254 2.530 1.316 2.644 0.155 0.289 2.350 0.231 0.990 0.169 1.536 0.370 0.640 0.149 0.130 0.890 1.333 2.340 0.099 0.361 0.488 0.409 0.603 0.934 0.711 0.156 0.099 2.644 0.827
19 0.560 0.063 1.240 1.005 2.239 2.836 2.212 0.230 0.373 1.201 0.459 1.174 0.355 1.463 0.527 1.131 0.480 0.662 1.641 0.557 2.388 1.385 0.491 0.121 1.165 0.938 0.477 1.038 0.042 0.042 2.836 0.981
20 0.469 0.840 1.903 0.308 0.791 1.646 1.001 0.348 0.658 0.834 1.076 0.853 0.701 0.733 0.550 0.936 0.190 0.427 2.370 0.625 1.914 2.874 2.197 0.712 0.143 1.291 0.424 0.600 0.631 0.143 2.874 0.967
21 0.565 0.454 1.311 0.370 2.158 0.800 0.702 0.936 0.826 1.351 0.857 2.089 0.735 2.501 1.123 1.388 0.473 0.421 0.599 0.679 0.873 3.119 0.173 0.958 0.616 3.541 1.778 1.751 0.671 0.173 3.541 1.166
22 0.347 0.310 0.947 0.695 2.571 0.945 4.885 0.090 0.797 0.752 1.986 2.536 0.374 1.353 0.712 0.498 0.660 1.105 1.418 0.698 1.409 1.315 0.449 0.710 0.488 3.740 0.514 1.633 1.093 0.090 4.885 1.208
28 1.203 0.634 1.684 0.809 2.121 1.349 1.774 0.274 1.021 1.595 1.547 2.005 0.483 0.730 0.581 2.167 0.818 0.546 1.459 0.467 1.391 0.135 0.593 0.423 0.999 1.885 1.665 1.011 0.461 0.135 2.167 1.098
36 1.100 3.336 1.290 1.079 2.218 1.894 0.369 0.515 0.620 2.088 0.983 3.037 0.711 1.401 0.618 1.145 0.982 1.129 1.481 1.161 2.659 0.690 0.258 1.813 0.851 1.154 1.271 0.842 0.850 0.258 3.336 1.295
40 0.000 0.000 0.000 0.000 0.000 0.000 0.000 0.000 0.000 0.000 0.000 0.000 0.000 0.000 0.000 0.000 0.000 0.000 0.000 0.000 0.000 0.000 0.000 0.000 0.000 0.000 0.000 0.000 0.000 0.000 0.000 0.000
45 0.832 0.399 1.876 1.081 5.374 1.948 2.343 1.080 1.662 2.088 1.359 1.203 1.545 1.733 1.228 0.000 1.370 0.736 0.000 4.901 2.471 0.000 0.741 2.122 1.722 3.724 0.086 1.179 5.152 0.000 5.374 1.723
50 1.237 2.006 2.536 1.850 2.880 4.453 2.227 1.962 2.210 5.301 2.259 3.909 0.719 1.682 2.063 2.841 0.425 1.106 0.000 1.365 1.496 0.920 0.761 1.885 3.669 4.153 2.110 1.255 1.560 0.000 5.301 2.098
51 1.241 2.012 2.563 1.878 2.903 4.491 2.237 1.975 2.251 5.331 2.278 3.952 0.728 1.693 2.079 2.846 0.428 1.113 0.000 1.376 1.512 0.926 0.783 1.908 3.684 4.154 2.110 1.262 1.597 0.000 5.331 2.114
52 1.303 2.135 2.700 1.985 2.994 4.751 2.364 2.094 2.354 5.656 2.390 4.178 0.769 1.758 2.182 3.026 0.448 1.170 0.000 1.457 1.586 0.969 0.822 2.016 3.866 4.420 2.196 1.315 1.673 0.000 5.656 2.227
55 0.659 1.248 1.847 0.939 3.232 1.158 2.249 0.098 1.451 1.506 1.490 3.875 1.327 1.664 1.350 3.462 0.279 0.727 0.575 1.313 2.477 0.606 0.830 1.067 0.832 2.445 1.152 1.014 1.384 0.098 3.875 1.457
60 1.042 2.702 3.833 5.055 1.251 4.480 2.799 2.322 2.474 6.596 3.771 5.788 2.039 1.732 1.219 1.412 0.398 3.718 1.484 12.49 3.377 1.933 1.724 1.872 2.291 3.955 3.074 2.712 1.070 0.398 12.491 3.056
61 1.042 2.702 3.833 5.055 1.251 4.480 2.799 2.322 2.474 6.596 3.771 5.788 2.039 1.732 1.219 1.412 0.398 3.718 1.484 12.49 3.377 1.933 1.724 1.872 2.291 3.955 2.893 2.712 1.070 0.398 12.491 3.049
62 1.042 2.702 3.833 5.055 1.251 4.480 2.799 2.322 2.474 6.596 3.771 5.788 2.039 1.732 1.219 1.412 0.398 3.718 1.484 12.49 3.377 1.933 1.724 1.872 2.291 3.955 2.893 2.712 1.070 0.398 12.491 3.049
63 1.042 2.702 3.833 5.055 1.251 4.480 2.799 2.322 2.474 6.596 3.771 5.788 2.039 1.732 1.219 1.412 0.398 3.718 1.484 12.49 3.377 1.933 1.724 1.872 2.291 3.955 2.893 2.712 1.070 0.398 12.491 3.049
65 1.297 2.952 1.560 1.004 0.771 3.138 2.684 1.009 4.457 3.691 4.199 5.859 2.257 0.781 2.808 4.022 1.144 1.708 0.000 2.396 2.732 6.321 1.498 1.870 2.345 1.703 4.906 2.436 3.456 0.000 6.321 2.586
66 1.297 2.952 1.560 1.004 0.771 3.138 2.684 1.009 4.457 3.691 4.199 5.859 2.257 0.781 2.808 4.022 1.144 1.708 0.000 2.396 2.732 6.321 1.498 1.870 2.283 1.703 4.906 2.436 3.496 0.000 6.321 2.586
67 0.000 0.000 0.000 0.000 0.000 0.000 0.000 0.000 0.000 0.000 0.000 0.000 0.000 0.000 0.000 0.000 0.000 0.000 0.000 0.000 0.000 0.000 0.000 0.000 0.000 0.000 0.000 0.000 0.000 0.000 0.000 0.000
70 1.235 2.003 2.533 1.849 2.880 4.453 2.227 1.957 2.206 5.301 2.253 3.907 0.719 1.681 2.061 2.836 0.425 1.106 0.000 1.364 1.495 0.923 0.760 1.885 3.669 4.153 2.110 1.254 1.560 0.000 5.301 2.097
71 1.235 2.003 2.533 1.849 2.880 4.453 2.227 1.957 2.206 5.301 2.253 3.907 0.720 1.681 2.061 2.836 0.425 1.106 0.000 1.364 1.495 0.920 0.760 1.885 3.669 4.153 2.110 1.254 1.560 0.000 5.301 2.097
74 1.143 7.560 1.538 3.010 2.120 2.437 0.000 0.298 3.901 4.192 1.467 3.965 1.774 0.374 0.806 1.849 0.650 0.490 1.256 0.369 1.283 0.000 0.971 1.524 3.414 0.292 0.590 1.341 1.273 0.000 7.560 1.720
Sector Group 3 1.061 2.652 1.997 1.932 2.531 2.981 1.869 0.996 2.495 4.031 2.126 3.685 1.063 1.386 1.451 2.038 0.657 0.953 0.466 2.529 1.919 1.306 0.920 1.526 2.330 2.970 1.913 1.351 1.841 0.466 4.031 1.896
TOTAL 1.129 2.348 2.128 1.944 2.491 2.848 1.973 1.048 2.424 3.770 2.170 3.611 1.023 1.420 1.262 2.444 0.805 0.892 0.558 2.471 1.943 1.393 0.934 1.440 2.333 2.833 1.917 1.350 1.895 0.558 3.770 1.890
Country Group 3 Country Group 4Country Group 2Country Group 1
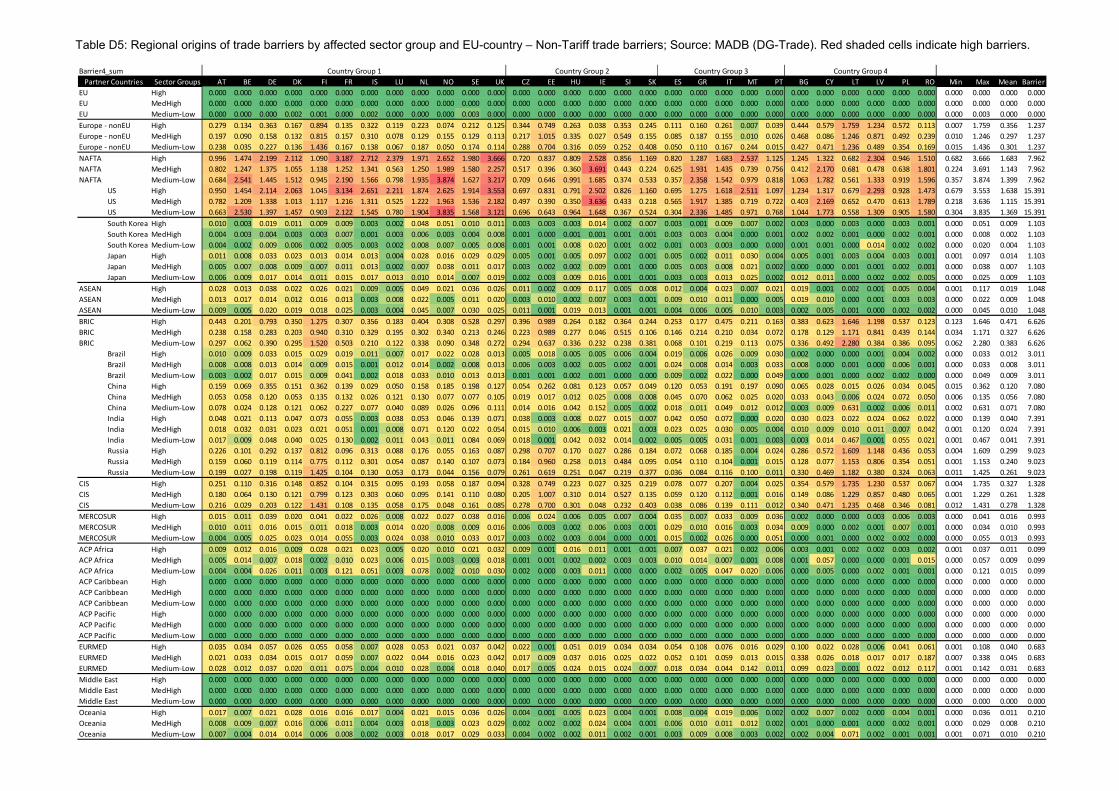
Table D5: Regional origins of trade barriers by affected sector group and EU-country – Non-Tariff trade barriers; Source: MADB (DG-Trade). Red shaded cells indicate high barriers.
Barrier4_sum
Sector Groups AT BE DE DK FI FR IS LU NL NO SE UK CZ EE HU IE SI SK ES GR IT MT PT BG CY LT LV PL RO Min Max Mean Barrier
EU High 0.000 0.000 0.000 0.000 0.000 0.000 0.000 0.000 0.000 0.000 0.000 0.000 0.000 0.000 0.000 0.000 0.000 0.000 0.000 0.000 0.000 0.000 0.000 0.000 0.000 0.000 0.000 0.000 0.000 0.000 0.000 0.000 0.000
EU MedHigh 0.000 0.000 0.000 0.000 0.000 0.000 0.000 0.000 0.000 0.000 0.000 0.000 0.000 0.000 0.000 0.000 0.000 0.000 0.000 0.000 0.000 0.000 0.000 0.000 0.000 0.000 0.000 0.000 0.000 0.000 0.000 0.000 0.000
EU Medium-Low 0.000 0.000 0.000 0.002 0.001 0.000 0.002 0.000 0.000 0.000 0.003 0.000 0.000 0.000 0.000 0.000 0.000 0.000 0.000 0.000 0.000 0.000 0.000 0.000 0.000 0.000 0.000 0.000 0.000 0.000 0.003 0.000 0.000
Europe - nonEU High 0.279 0.134 0.363 0.167 0.894 0.135 0.322 0.119 0.223 0.074 0.212 0.125 0.344 0.749 0.263 0.038 0.353 0.245 0.111 0.160 0.261 0.007 0.039 0.444 0.579 1.759 1.234 0.572 0.113 0.007 1.759 0.356 1.237
Europe - nonEU MedHigh 0.197 0.090 0.158 0.132 0.815 0.157 0.310 0.078 0.129 0.155 0.129 0.113 0.217 1.015 0.335 0.027 0.549 0.155 0.085 0.187 0.155 0.010 0.026 0.468 0.086 1.246 0.871 0.492 0.239 0.010 1.246 0.297 1.237
Europe - nonEU Medium-Low 0.238 0.035 0.227 0.136 1.436 0.167 0.138 0.067 0.187 0.050 0.174 0.114 0.288 0.704 0.316 0.059 0.252 0.408 0.050 0.110 0.167 0.244 0.015 0.427 0.471 1.236 0.489 0.354 0.169 0.015 1.436 0.301 1.237
NAFTA High 0.996 1.474 2.199 2.112 1.090 3.187 2.712 2.379 1.971 2.652 1.980 3.666 0.720 0.837 0.809 2.528 0.856 1.169 0.820 1.287 1.683 2.537 1.125 1.245 1.322 0.682 2.304 0.946 1.510 0.682 3.666 1.683 7.962
NAFTA MedHigh 0.802 1.247 1.375 1.055 1.138 1.252 1.341 0.563 1.250 1.989 1.580 2.257 0.517 0.396 0.360 3.691 0.443 0.224 0.625 1.931 1.435 0.739 0.756 0.412 2.170 0.681 0.478 0.638 1.801 0.224 3.691 1.143 7.962
NAFTA Medium-Low 0.684 2.541 1.445 1.512 0.945 2.190 1.566 0.798 1.935 3.874 1.627 3.217 0.709 0.646 0.991 1.685 0.374 0.533 0.357 2.358 1.542 0.979 0.818 1.063 1.782 0.561 1.333 0.919 1.596 0.357 3.874 1.399 7.962
US High 0.950 1.454 2.114 2.063 1.045 3.134 2.651 2.211 1.874 2.625 1.914 3.553 0.697 0.831 0.791 2.502 0.826 1.160 0.695 1.275 1.618 2.511 1.097 1.234 1.317 0.679 2.293 0.928 1.473 0.679 3.553 1.638 15.391
US MedHigh 0.782 1.209 1.338 1.013 1.117 1.216 1.311 0.525 1.222 1.963 1.536 2.182 0.497 0.390 0.350 3.636 0.433 0.218 0.565 1.917 1.385 0.719 0.722 0.403 2.169 0.652 0.470 0.613 1.789 0.218 3.636 1.115 15.391
US Medium-Low 0.663 2.530 1.397 1.457 0.903 2.122 1.545 0.780 1.904 3.835 1.568 3.121 0.696 0.643 0.964 1.648 0.367 0.524 0.304 2.336 1.485 0.971 0.768 1.044 1.773 0.558 1.309 0.905 1.580 0.304 3.835 1.369 15.391
South Korea High 0.010 0.003 0.019 0.011 0.009 0.009 0.003 0.002 0.048 0.051 0.010 0.011 0.003 0.003 0.003 0.014 0.002 0.007 0.003 0.001 0.009 0.007 0.002 0.003 0.000 0.003 0.000 0.003 0.001 0.000 0.051 0.009 1.103
South Korea MedHigh 0.004 0.003 0.004 0.003 0.003 0.007 0.001 0.003 0.006 0.003 0.004 0.008 0.001 0.000 0.001 0.001 0.001 0.001 0.003 0.003 0.004 0.000 0.001 0.002 0.002 0.001 0.000 0.002 0.001 0.000 0.008 0.002 1.103
South Korea Medium-Low 0.004 0.002 0.009 0.006 0.002 0.005 0.003 0.002 0.008 0.007 0.005 0.008 0.001 0.001 0.008 0.020 0.001 0.002 0.001 0.003 0.003 0.000 0.000 0.001 0.001 0.000 0.014 0.002 0.002 0.000 0.020 0.004 1.103
Japan High 0.011 0.008 0.033 0.023 0.013 0.014 0.013 0.004 0.028 0.016 0.029 0.029 0.005 0.001 0.005 0.097 0.002 0.001 0.005 0.002 0.011 0.030 0.004 0.005 0.001 0.003 0.004 0.003 0.001 0.001 0.097 0.014 1.103
Japan MedHigh 0.005 0.007 0.008 0.009 0.007 0.011 0.013 0.002 0.007 0.038 0.011 0.017 0.003 0.002 0.002 0.009 0.001 0.000 0.005 0.003 0.008 0.021 0.002 0.000 0.000 0.001 0.001 0.002 0.001 0.000 0.038 0.007 1.103
Japan Medium-Low 0.006 0.009 0.017 0.014 0.011 0.015 0.017 0.013 0.010 0.014 0.007 0.019 0.002 0.003 0.009 0.016 0.001 0.001 0.003 0.003 0.013 0.025 0.002 0.012 0.011 0.000 0.002 0.002 0.005 0.000 0.025 0.009 1.103
ASEAN High 0.028 0.013 0.038 0.022 0.026 0.021 0.009 0.005 0.049 0.021 0.036 0.026 0.011 0.002 0.009 0.117 0.005 0.008 0.012 0.004 0.023 0.007 0.021 0.019 0.001 0.002 0.001 0.005 0.004 0.001 0.117 0.019 1.048
ASEAN MedHigh 0.013 0.017 0.014 0.012 0.016 0.013 0.003 0.008 0.022 0.005 0.011 0.020 0.003 0.010 0.002 0.007 0.003 0.001 0.009 0.010 0.011 0.000 0.005 0.019 0.010 0.000 0.001 0.003 0.003 0.000 0.022 0.009 1.048
ASEAN Medium-Low 0.009 0.005 0.020 0.019 0.018 0.025 0.003 0.004 0.045 0.007 0.030 0.025 0.011 0.001 0.019 0.013 0.001 0.001 0.004 0.006 0.005 0.010 0.003 0.002 0.005 0.001 0.000 0.002 0.002 0.000 0.045 0.010 1.048
BRIC High 0.443 0.201 0.793 0.350 1.275 0.307 0.356 0.183 0.404 0.308 0.528 0.297 0.396 0.989 0.264 0.182 0.364 0.244 0.253 0.177 0.475 0.211 0.163 0.383 0.623 1.646 1.198 0.537 0.123 0.123 1.646 0.471 6.626
BRIC MedHigh 0.238 0.158 0.283 0.203 0.940 0.310 0.329 0.195 0.302 0.340 0.213 0.246 0.223 0.989 0.277 0.046 0.515 0.106 0.146 0.214 0.210 0.034 0.072 0.178 0.129 1.171 0.841 0.439 0.144 0.034 1.171 0.327 6.626
BRIC Medium-Low 0.297 0.062 0.390 0.295 1.520 0.503 0.210 0.122 0.338 0.090 0.348 0.272 0.294 0.637 0.336 0.232 0.238 0.381 0.068 0.101 0.219 0.113 0.075 0.336 0.492 2.280 0.384 0.386 0.095 0.062 2.280 0.383 6.626
Brazil High 0.010 0.009 0.033 0.015 0.029 0.019 0.011 0.007 0.017 0.022 0.028 0.013 0.005 0.018 0.005 0.005 0.006 0.004 0.019 0.006 0.026 0.009 0.030 0.002 0.000 0.000 0.001 0.004 0.002 0.000 0.033 0.012 3.011
Brazil MedHigh 0.008 0.008 0.013 0.014 0.009 0.015 0.001 0.012 0.014 0.002 0.008 0.013 0.006 0.003 0.002 0.005 0.002 0.001 0.024 0.008 0.014 0.003 0.033 0.008 0.000 0.001 0.000 0.006 0.001 0.000 0.033 0.008 3.011
Brazil Medium-Low 0.003 0.002 0.017 0.015 0.009 0.041 0.002 0.018 0.033 0.010 0.013 0.013 0.001 0.001 0.002 0.001 0.000 0.000 0.009 0.002 0.022 0.000 0.049 0.000 0.001 0.000 0.002 0.002 0.000 0.000 0.049 0.009 3.011
China High 0.159 0.069 0.355 0.151 0.362 0.139 0.029 0.050 0.158 0.185 0.198 0.127 0.054 0.262 0.081 0.123 0.057 0.049 0.120 0.053 0.191 0.197 0.090 0.065 0.028 0.015 0.026 0.034 0.045 0.015 0.362 0.120 7.080
China MedHigh 0.053 0.058 0.120 0.053 0.135 0.132 0.026 0.121 0.130 0.077 0.077 0.105 0.019 0.017 0.012 0.025 0.008 0.008 0.045 0.070 0.062 0.025 0.020 0.033 0.043 0.006 0.024 0.072 0.050 0.006 0.135 0.056 7.080
China Medium-Low 0.078 0.024 0.128 0.121 0.062 0.227 0.077 0.040 0.089 0.026 0.096 0.111 0.014 0.016 0.042 0.152 0.005 0.002 0.018 0.011 0.049 0.012 0.012 0.003 0.009 0.631 0.002 0.006 0.011 0.002 0.631 0.071 7.080
India High 0.048 0.021 0.113 0.047 0.073 0.055 0.003 0.038 0.053 0.046 0.139 0.071 0.038 0.003 0.008 0.027 0.015 0.007 0.042 0.050 0.072 0.000 0.020 0.030 0.023 0.022 0.024 0.062 0.022 0.000 0.139 0.040 7.391
India MedHigh 0.018 0.032 0.031 0.023 0.021 0.051 0.001 0.008 0.071 0.120 0.022 0.054 0.015 0.010 0.006 0.003 0.021 0.003 0.023 0.025 0.030 0.005 0.004 0.010 0.009 0.010 0.011 0.007 0.042 0.001 0.120 0.024 7.391
India Medium-Low 0.017 0.009 0.048 0.040 0.025 0.130 0.002 0.011 0.043 0.011 0.084 0.069 0.018 0.001 0.042 0.032 0.014 0.002 0.005 0.005 0.031 0.001 0.003 0.003 0.014 0.467 0.001 0.055 0.021 0.001 0.467 0.041 7.391
Russia High 0.226 0.101 0.292 0.137 0.812 0.096 0.313 0.088 0.176 0.055 0.163 0.087 0.298 0.707 0.170 0.027 0.286 0.184 0.072 0.068 0.185 0.004 0.024 0.286 0.572 1.609 1.148 0.436 0.053 0.004 1.609 0.299 9.023
Russia MedHigh 0.159 0.060 0.119 0.114 0.775 0.112 0.301 0.054 0.087 0.140 0.107 0.073 0.184 0.960 0.258 0.013 0.484 0.095 0.054 0.110 0.104 0.001 0.015 0.128 0.077 1.153 0.806 0.354 0.051 0.001 1.153 0.240 9.023
Russia Medium-Low 0.199 0.027 0.198 0.119 1.425 0.104 0.130 0.053 0.173 0.044 0.156 0.079 0.261 0.619 0.251 0.047 0.219 0.377 0.036 0.084 0.116 0.100 0.011 0.330 0.469 1.182 0.380 0.324 0.063 0.011 1.425 0.261 9.023
CIS High 0.251 0.110 0.316 0.148 0.852 0.104 0.315 0.095 0.193 0.058 0.187 0.094 0.328 0.749 0.223 0.027 0.325 0.219 0.078 0.077 0.207 0.004 0.025 0.354 0.579 1.735 1.230 0.537 0.067 0.004 1.735 0.327 1.328
CIS MedHigh 0.180 0.064 0.130 0.121 0.799 0.123 0.303 0.060 0.095 0.141 0.110 0.080 0.205 1.007 0.310 0.014 0.527 0.135 0.059 0.120 0.112 0.001 0.016 0.149 0.086 1.229 0.857 0.480 0.065 0.001 1.229 0.261 1.328
CIS Medium-Low 0.216 0.029 0.203 0.122 1.431 0.108 0.135 0.058 0.175 0.048 0.161 0.085 0.278 0.700 0.301 0.048 0.232 0.403 0.038 0.086 0.139 0.111 0.012 0.340 0.471 1.235 0.468 0.346 0.081 0.012 1.431 0.278 1.328
MERCOSUR High 0.015 0.011 0.039 0.020 0.041 0.022 0.026 0.008 0.022 0.027 0.038 0.016 0.006 0.024 0.006 0.005 0.007 0.004 0.035 0.007 0.033 0.009 0.036 0.002 0.000 0.000 0.003 0.006 0.003 0.000 0.041 0.016 0.993
MERCOSUR MedHigh 0.010 0.011 0.016 0.015 0.011 0.018 0.003 0.014 0.020 0.008 0.009 0.016 0.006 0.003 0.002 0.006 0.003 0.001 0.029 0.010 0.016 0.003 0.034 0.009 0.000 0.002 0.001 0.007 0.001 0.000 0.034 0.010 0.993
MERCOSUR Medium-Low 0.004 0.005 0.025 0.023 0.014 0.055 0.003 0.024 0.038 0.010 0.033 0.017 0.003 0.002 0.003 0.004 0.000 0.001 0.015 0.002 0.026 0.000 0.051 0.000 0.001 0.000 0.002 0.002 0.000 0.000 0.055 0.013 0.993
ACP Africa High 0.009 0.012 0.016 0.009 0.028 0.021 0.023 0.005 0.020 0.010 0.021 0.032 0.009 0.001 0.016 0.011 0.001 0.001 0.007 0.037 0.021 0.002 0.006 0.003 0.001 0.002 0.002 0.003 0.002 0.001 0.037 0.011 0.099
ACP Africa MedHigh 0.005 0.014 0.007 0.018 0.002 0.010 0.023 0.006 0.015 0.003 0.003 0.018 0.001 0.001 0.002 0.002 0.003 0.003 0.010 0.014 0.007 0.001 0.008 0.001 0.057 0.000 0.000 0.001 0.015 0.000 0.057 0.009 0.099
ACP Africa Medium-Low 0.004 0.004 0.026 0.011 0.003 0.121 0.051 0.003 0.078 0.002 0.010 0.030 0.002 0.000 0.003 0.011 0.000 0.000 0.002 0.005 0.047 0.020 0.006 0.000 0.005 0.000 0.002 0.001 0.001 0.000 0.121 0.015 0.099
ACP Caribbean High 0.000 0.000 0.000 0.000 0.000 0.000 0.000 0.000 0.000 0.000 0.000 0.000 0.000 0.000 0.000 0.000 0.000 0.000 0.000 0.000 0.000 0.000 0.000 0.000 0.000 0.000 0.000 0.000 0.000 0.000 0.000 0.000 0.000
ACP Caribbean MedHigh 0.000 0.000 0.000 0.000 0.000 0.000 0.000 0.000 0.000 0.000 0.000 0.000 0.000 0.000 0.000 0.000 0.000 0.000 0.000 0.000 0.000 0.000 0.000 0.000 0.000 0.000 0.000 0.000 0.000 0.000 0.000 0.000 0.000
ACP Caribbean Medium-Low 0.000 0.000 0.000 0.000 0.000 0.000 0.000 0.000 0.000 0.000 0.000 0.000 0.000 0.000 0.000 0.000 0.000 0.000 0.000 0.000 0.000 0.000 0.000 0.000 0.000 0.000 0.000 0.000 0.000 0.000 0.000 0.000 0.000
ACP Pacific High 0.000 0.000 0.000 0.000 0.000 0.000 0.000 0.000 0.000 0.000 0.000 0.000 0.000 0.000 0.000 0.000 0.000 0.000 0.000 0.000 0.000 0.000 0.000 0.000 0.000 0.000 0.000 0.000 0.000 0.000 0.000 0.000 0.000
ACP Pacific MedHigh 0.000 0.000 0.000 0.000 0.000 0.000 0.000 0.000 0.000 0.000 0.000 0.000 0.000 0.000 0.000 0.000 0.000 0.000 0.000 0.000 0.000 0.000 0.000 0.000 0.000 0.000 0.000 0.000 0.000 0.000 0.000 0.000 0.000
ACP Pacific Medium-Low 0.000 0.000 0.000 0.000 0.000 0.000 0.000 0.000 0.000 0.000 0.000 0.000 0.000 0.000 0.000 0.000 0.000 0.000 0.000 0.000 0.000 0.000 0.000 0.000 0.000 0.000 0.000 0.000 0.000 0.000 0.000 0.000 0.000
EURMED High 0.035 0.034 0.057 0.026 0.055 0.058 0.007 0.028 0.053 0.021 0.037 0.042 0.022 0.001 0.051 0.019 0.034 0.034 0.054 0.108 0.076 0.016 0.029 0.100 0.022 0.028 0.006 0.041 0.061 0.001 0.108 0.040 0.683
EURMED MedHigh 0.021 0.033 0.034 0.015 0.017 0.059 0.007 0.022 0.044 0.016 0.023 0.042 0.017 0.009 0.037 0.016 0.025 0.022 0.052 0.101 0.059 0.013 0.015 0.338 0.026 0.018 0.017 0.017 0.187 0.007 0.338 0.045 0.683
EURMED Medium-Low 0.028 0.012 0.037 0.020 0.011 0.075 0.004 0.010 0.028 0.004 0.018 0.040 0.017 0.005 0.024 0.015 0.024 0.007 0.018 0.034 0.044 0.142 0.011 0.099 0.023 0.001 0.022 0.012 0.117 0.001 0.142 0.031 0.683
Middle East High 0.000 0.000 0.000 0.000 0.000 0.000 0.000 0.000 0.000 0.000 0.000 0.000 0.000 0.000 0.000 0.000 0.000 0.000 0.000 0.000 0.000 0.000 0.000 0.000 0.000 0.000 0.000 0.000 0.000 0.000 0.000 0.000 0.000
Middle East MedHigh 0.000 0.000 0.000 0.000 0.000 0.000 0.000 0.000 0.000 0.000 0.000 0.000 0.000 0.000 0.000 0.000 0.000 0.000 0.000 0.000 0.000 0.000 0.000 0.000 0.000 0.000 0.000 0.000 0.000 0.000 0.000 0.000 0.000
Middle East Medium-Low 0.000 0.000 0.000 0.000 0.000 0.000 0.000 0.000 0.000 0.000 0.000 0.000 0.000 0.000 0.000 0.000 0.000 0.000 0.000 0.000 0.000 0.000 0.000 0.000 0.000 0.000 0.000 0.000 0.000 0.000 0.000 0.000 0.000
Oceania High 0.017 0.007 0.021 0.028 0.016 0.016 0.017 0.004 0.021 0.015 0.036 0.026 0.004 0.001 0.005 0.023 0.004 0.001 0.008 0.004 0.019 0.006 0.002 0.002 0.007 0.002 0.000 0.004 0.001 0.000 0.036 0.011 0.210
Oceania MedHigh 0.008 0.009 0.007 0.016 0.006 0.011 0.004 0.003 0.018 0.003 0.023 0.029 0.002 0.002 0.002 0.024 0.004 0.001 0.006 0.010 0.011 0.012 0.002 0.001 0.000 0.001 0.000 0.002 0.001 0.000 0.029 0.008 0.210
Oceania Medium-Low 0.007 0.004 0.014 0.014 0.006 0.008 0.002 0.003 0.018 0.017 0.029 0.033 0.004 0.002 0.002 0.011 0.002 0.001 0.003 0.009 0.008 0.003 0.002 0.002 0.004 0.071 0.002 0.001 0.001 0.001 0.071 0.010 0.210
Country Group 1 Country Group 2 Country Group 3 Country Group 4
Partner Countries
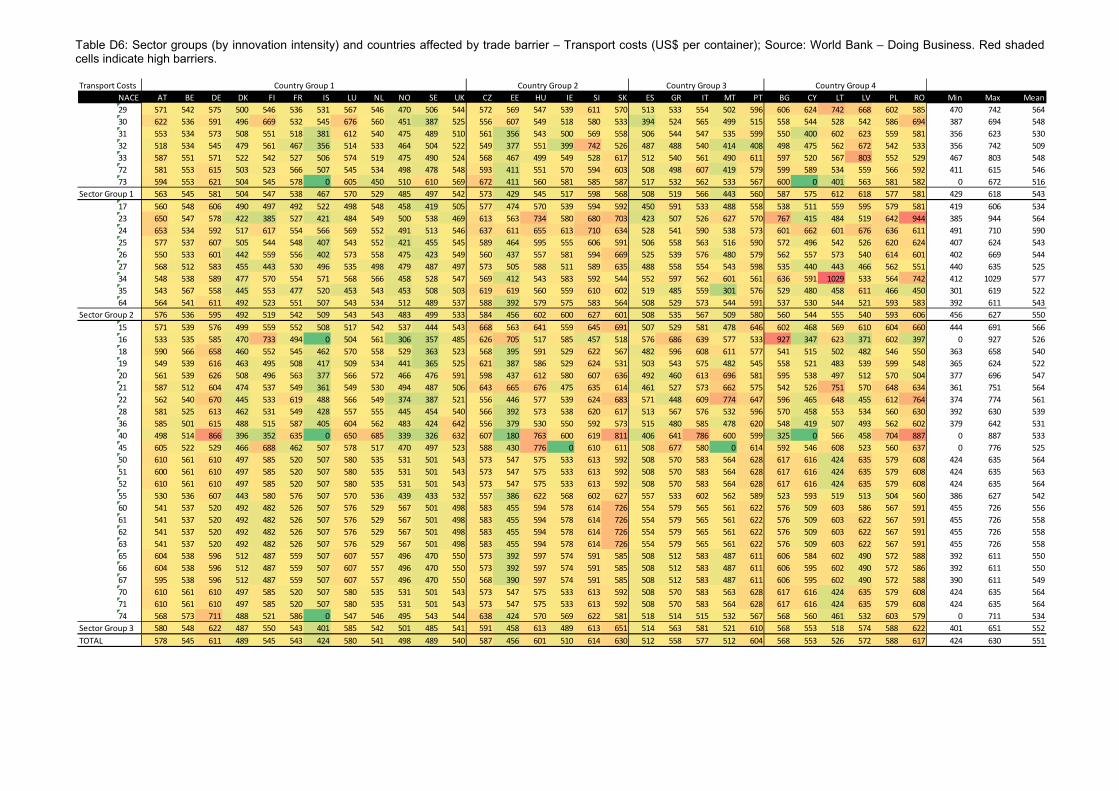
Table D6: Sector groups (by innovation intensity) and countries affected by trade barrier – Transport costs (US$ per container); Source: World Bank – Doing Business. Red shaded cells indicate high barriers.
Transport Costs
NACE AT BE DE DK FI FR IS LU NL NO SE UK CZ EE HU IE SI SK ES GR IT MT PT BG CY LT LV PL RO Min Max Mean
29 571 542 575 500 546 536 531 567 546 470 506 544 572 569 547 539 611 570 513 533 554 502 596 606 624 742 668 602 585 470 742 564
30 622 536 591 496 669 532 545 676 560 451 387 525 556 607 549 518 580 533 394 524 565 499 515 558 544 528 542 586 694 387 694 548
31 553 534 573 508 551 518 381 612 540 475 489 510 561 356 543 500 569 558 506 544 547 535 599 550 400 602 623 559 581 356 623 530
32 518 534 545 479 561 467 356 514 533 464 504 522 549 377 551 399 742 526 487 488 540 414 408 498 475 562 672 542 533 356 742 509
33 587 551 571 522 542 527 506 574 519 475 490 524 568 467 499 549 528 617 512 540 561 490 611 597 520 567 803 552 529 467 803 548
72 581 553 615 503 523 566 507 545 534 498 478 548 593 411 551 570 594 603 508 498 607 419 579 599 589 534 559 566 592 411 615 546
73 594 553 621 504 545 578 0 605 450 510 610 569 672 411 560 581 585 587 517 532 562 533 567 600 0 401 563 581 582 0 672 516
Sector Group 1 563 545 581 504 547 538 467 570 529 485 497 542 573 429 545 517 598 568 508 519 566 443 560 587 575 612 618 577 581 429 618 543
17 560 548 606 490 497 492 522 498 548 458 419 505 577 474 570 539 594 592 450 591 533 488 558 538 511 559 595 579 581 419 606 534
23 650 547 578 422 385 527 421 484 549 500 538 469 613 563 734 580 680 703 423 507 526 627 570 767 415 484 519 642 944 385 944 564
24 653 534 592 517 617 554 566 569 552 491 513 546 637 611 655 613 710 634 528 541 590 538 573 601 662 601 676 636 611 491 710 590
25 577 537 607 505 544 548 407 543 552 421 455 545 589 464 595 555 606 591 506 558 563 516 590 572 496 542 526 620 624 407 624 543
26 550 533 601 442 559 556 402 573 558 475 423 549 560 437 557 581 594 669 525 539 576 480 579 562 557 573 540 614 601 402 669 544
27 568 512 583 455 443 530 496 535 498 479 487 497 573 505 588 511 589 635 488 558 554 543 598 535 440 443 466 562 551 440 635 525
34 548 538 589 477 570 554 571 568 566 458 528 547 569 412 543 583 592 544 552 597 562 601 561 636 591 1029 533 564 742 412 1029 577
35 543 567 558 445 553 477 520 453 543 453 508 503 619 619 560 559 610 602 519 485 559 301 576 529 480 458 611 466 450 301 619 522
64 564 541 611 492 523 551 507 543 534 512 489 537 588 392 579 575 583 564 508 529 573 544 591 537 530 544 521 593 583 392 611 543
Sector Group 2 576 536 595 492 519 542 509 543 543 483 499 533 584 456 602 600 627 601 508 535 567 509 580 560 544 555 540 593 606 456 627 550
15 571 539 576 499 559 552 508 517 542 537 444 543 668 563 641 559 645 691 507 529 581 478 646 602 468 569 610 604 660 444 691 566
16 533 535 585 470 733 494 0 504 561 306 357 485 626 705 517 585 457 518 576 686 639 577 533 927 347 623 371 602 397 0 927 526
18 590 566 658 460 552 545 462 570 558 529 363 523 568 395 591 529 622 567 482 596 608 611 577 541 515 502 482 546 550 363 658 540
19 549 539 616 463 495 508 417 509 534 441 365 525 621 387 586 529 624 531 503 543 575 482 545 558 521 483 539 599 548 365 624 522
20 561 539 626 508 496 563 377 566 572 466 476 591 598 437 612 580 607 636 492 460 613 696 581 595 538 497 512 570 504 377 696 547
21 587 512 604 474 537 549 361 549 530 494 487 506 643 665 676 475 635 614 461 527 573 662 575 542 526 751 570 648 634 361 751 564
22 562 540 670 445 533 619 488 566 549 374 387 521 556 446 577 539 624 683 571 448 609 774 647 596 465 648 455 612 764 374 774 561
28 581 525 613 462 531 549 428 557 555 445 454 540 566 392 573 538 620 617 513 567 576 532 596 570 458 553 534 560 630 392 630 539
36 585 501 615 488 515 587 405 604 562 483 424 642 556 379 530 550 592 573 515 480 585 478 620 548 419 507 493 562 602 379 642 531
40 498 514 866 396 352 635 0 650 685 339 326 632 607 180 763 600 619 811 406 641 786 600 599 325 0 566 458 704 887 0 887 533
45 605 522 529 466 688 462 507 578 517 470 497 523 588 430 776 0 610 611 508 677 580 0 614 592 546 608 523 560 637 0 776 525
50 610 561 610 497 585 520 507 580 535 531 501 543 573 547 575 533 613 592 508 570 583 564 628 617 616 424 635 579 608 424 635 564
51 600 561 610 497 585 520 507 580 535 531 501 543 573 547 575 533 613 592 508 570 583 564 628 617 616 424 635 579 608 424 635 563
52 610 561 610 497 585 520 507 580 535 531 501 543 573 547 575 533 613 592 508 570 583 564 628 617 616 424 635 579 608 424 635 564
55 530 536 607 443 580 576 507 570 536 439 433 532 557 386 622 568 602 627 557 533 602 562 589 523 593 519 513 504 560 386 627 542
60 541 537 520 492 482 526 507 576 529 567 501 498 583 455 594 578 614 726 554 579 565 561 622 576 509 603 586 567 591 455 726 556
61 541 537 520 492 482 526 507 576 529 567 501 498 583 455 594 578 614 726 554 579 565 561 622 576 509 603 622 567 591 455 726 558
62 541 537 520 492 482 526 507 576 529 567 501 498 583 455 594 578 614 726 554 579 565 561 622 576 509 603 622 567 591 455 726 558
63 541 537 520 492 482 526 507 576 529 567 501 498 583 455 594 578 614 726 554 579 565 561 622 576 509 603 622 567 591 455 726 558
65 604 538 596 512 487 559 507 607 557 496 470 550 573 392 597 574 591 585 508 512 583 487 611 606 584 602 490 572 588 392 611 550
66 604 538 596 512 487 559 507 607 557 496 470 550 573 392 597 574 591 585 508 512 583 487 611 606 595 602 490 572 586 392 611 550
67 595 538 596 512 487 559 507 607 557 496 470 550 568 390 597 574 591 585 508 512 583 487 611 606 595 602 490 572 588 390 611 549
70 610 561 610 497 585 520 507 580 535 531 501 543 573 547 575 533 613 592 508 570 583 563 628 617 616 424 635 579 608 424 635 564
71 610 561 610 497 585 520 507 580 535 531 501 543 573 547 575 533 613 592 508 570 583 564 628 617 616 424 635 579 608 424 635 564
74 568 573 711 488 521 586 0 547 546 495 543 544 638 424 570 569 622 581 518 514 515 532 567 568 560 461 532 603 579 0 711 534
Sector Group 3 580 548 622 487 550 543 401 585 542 501 485 541 591 458 613 489 613 651 514 563 581 521 610 568 553 518 574 588 622 401 651 552
TOTAL 578 545 611 489 545 543 424 580 541 498 489 540 587 456 601 510 614 630 512 558 577 512 604 568 553 526 572 588 617 424 630 551
Country Group 3 Country Group 4Country Group 2Country Group 1
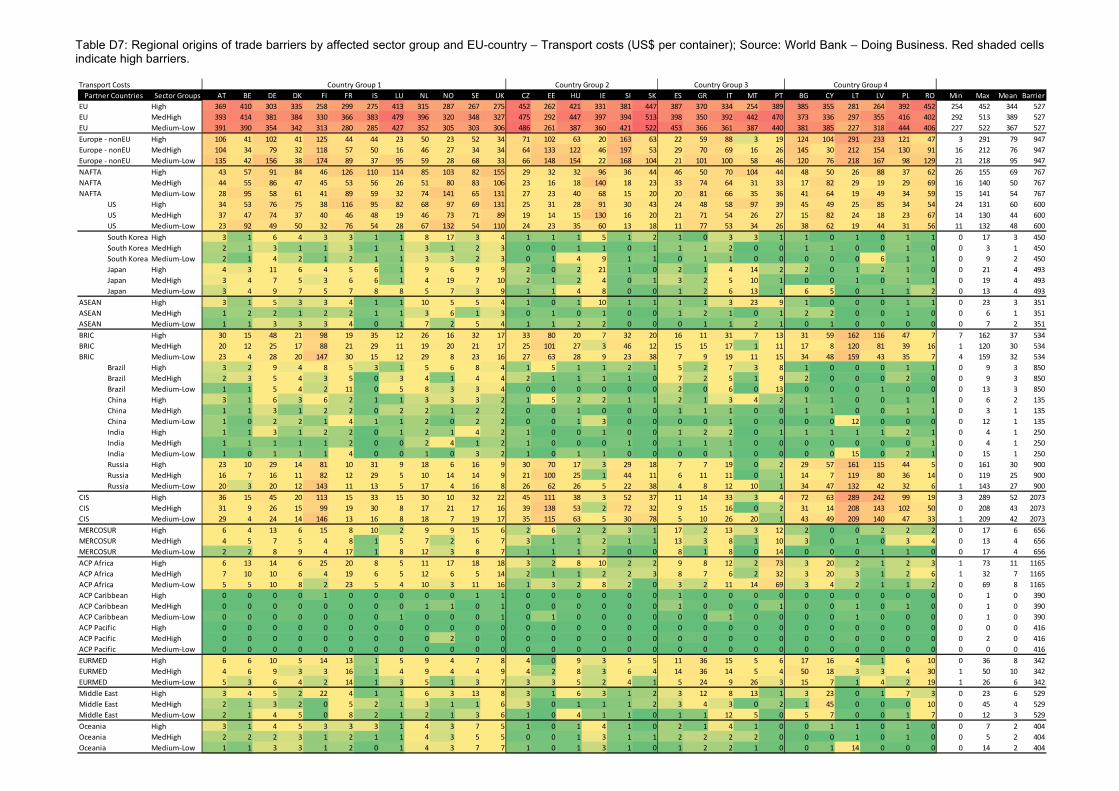
Table D7: Regional origins of trade barriers by affected sector group and EU-country – Transport costs (US$ per container); Source: World Bank – Doing Business. Red shaded cells indicate high barriers.
Transport Costs
Sector Groups AT BE DE DK FI FR IS LU NL NO SE UK CZ EE HU IE SI SK ES GR IT MT PT BG CY LT LV PL RO Min Max Mean Barrier
EU High 369 410 303 335 258 299 275 413 315 287 267 275 452 262 421 331 381 447 387 370 334 254 389 385 355 281 264 392 452 254 452 344 527
EU MedHigh 393 414 381 384 330 366 383 479 396 320 348 327 475 292 447 397 394 513 398 350 392 442 470 373 336 297 355 416 402 292 513 389 527
EU Medium-Low 391 390 354 342 313 280 285 427 352 305 303 306 486 261 387 360 421 522 453 366 361 387 440 381 385 227 318 444 406 227 522 367 527
Europe - nonEU High 106 41 102 41 125 44 44 23 50 23 52 34 71 102 63 20 163 63 22 59 88 3 19 124 104 291 233 121 47 3 291 79 947
Europe - nonEU MedHigh 104 34 79 32 118 57 50 16 46 27 34 34 64 133 122 46 197 53 29 70 69 16 26 145 30 212 154 130 91 16 212 76 947
Europe - nonEU Medium-Low 135 42 156 38 174 89 37 95 59 28 68 33 66 148 154 22 168 104 21 101 100 58 46 120 76 218 167 98 129 21 218 95 947
NAFTA High 43 57 91 84 46 126 110 114 85 103 82 155 29 32 32 96 36 44 46 50 70 104 44 48 50 26 88 37 62 26 155 69 767
NAFTA MedHigh 44 55 86 47 45 53 56 26 51 80 83 106 23 16 18 140 18 23 33 74 64 31 33 17 82 29 19 29 69 16 140 50 767
NAFTA Medium-Low 28 95 58 61 41 89 59 32 74 141 65 131 27 23 40 68 15 20 20 81 66 35 36 41 64 19 49 34 59 15 141 54 767
US High 34 53 76 75 38 116 95 82 68 97 69 131 25 31 28 91 30 43 24 48 58 97 39 45 49 25 85 34 54 24 131 60 600
US MedHigh 37 47 74 37 40 46 48 19 46 73 71 89 19 14 15 130 16 20 21 71 54 26 27 15 82 24 18 23 67 14 130 44 600
US Medium-Low 23 92 49 50 32 76 54 28 67 132 54 110 24 23 35 60 13 18 11 77 53 34 26 38 62 19 44 31 56 11 132 48 600
South Korea High 3 1 6 4 3 3 1 1 8 17 3 4 1 1 1 5 1 2 1 0 3 3 1 1 0 1 0 1 1 0 17 3 450
South Korea MedHigh 2 1 3 1 1 3 1 1 3 1 2 3 0 0 1 1 0 1 1 1 2 0 0 1 1 0 0 1 0 0 3 1 450
South Korea Medium-Low 2 1 4 2 1 2 1 1 3 3 2 3 0 1 4 9 1 1 0 1 1 0 0 0 0 0 6 1 1 0 9 2 450
Japan High 4 3 11 6 4 5 6 1 9 6 9 9 2 0 2 21 1 0 2 1 4 14 2 2 0 1 2 1 0 0 21 4 493
Japan MedHigh 3 4 7 5 3 6 6 1 4 19 7 10 2 1 2 4 0 1 3 2 5 10 1 0 0 1 0 1 1 0 19 4 493
Japan Medium-Low 3 4 9 7 5 7 8 8 5 7 3 9 1 1 4 8 0 0 1 2 6 13 1 6 5 0 1 1 2 0 13 4 493
ASEAN High 3 1 5 3 3 4 1 1 10 5 5 4 1 0 1 10 1 1 1 1 3 23 9 1 0 0 0 1 1 0 23 3 351
ASEAN MedHigh 1 2 2 1 2 2 1 1 3 6 1 3 0 1 0 1 0 0 1 2 1 0 1 2 2 0 0 1 0 0 6 1 351
ASEAN Medium-Low 1 1 3 3 3 4 0 1 7 2 5 4 1 1 2 2 0 0 0 1 1 2 1 0 1 0 0 0 0 0 7 2 351
BRIC High 30 15 48 21 98 19 35 12 26 16 32 17 33 80 20 7 32 20 16 11 31 7 13 31 59 162 116 47 7 7 162 37 534
BRIC MedHigh 20 12 25 17 88 21 29 11 19 20 21 17 25 101 27 3 46 12 15 15 17 1 11 17 8 120 81 39 16 1 120 30 534
BRIC Medium-Low 23 4 28 20 147 30 15 12 29 8 23 16 27 63 28 9 23 38 7 9 19 11 15 34 48 159 43 35 7 4 159 32 534
Brazil High 3 2 9 4 8 5 3 1 5 6 8 4 1 5 1 1 2 1 5 2 7 3 8 1 0 0 0 1 1 0 9 3 850
Brazil MedHigh 2 3 5 4 3 5 0 3 4 1 4 4 2 1 1 1 1 0 7 2 5 1 9 2 0 0 0 2 0 0 9 3 850
Brazil Medium-Low 1 1 5 4 2 11 0 5 8 3 3 4 0 0 0 0 0 0 2 0 6 0 13 0 0 0 1 0 0 0 13 3 850
China High 3 1 6 3 6 2 1 1 3 3 3 2 1 5 2 2 1 1 2 1 3 4 2 1 1 0 0 1 1 0 6 2 135
China MedHigh 1 1 3 1 2 2 0 2 2 1 2 2 0 0 1 0 0 0 1 1 1 0 0 1 1 0 0 1 1 0 3 1 135
China Medium-Low 1 0 2 2 1 4 1 1 2 0 2 2 0 0 1 3 0 0 0 0 1 0 0 0 0 12 0 0 0 0 12 1 135
India High 1 1 3 1 2 2 0 1 2 1 4 2 1 0 0 1 0 0 1 2 2 0 1 1 1 1 1 2 1 0 4 1 250
India MedHigh 1 1 1 1 1 2 0 0 2 4 1 2 1 0 0 0 1 0 1 1 1 0 0 0 0 0 0 0 1 0 4 1 250
India Medium-Low 1 0 1 1 1 4 0 0 1 0 3 2 1 0 1 1 0 0 0 0 1 0 0 0 0 15 0 2 1 0 15 1 250
Russia High 23 10 29 14 81 10 31 9 18 6 16 9 30 70 17 3 29 18 7 7 19 0 2 29 57 161 115 44 5 0 161 30 900
Russia MedHigh 16 7 16 11 82 12 29 5 10 14 14 9 21 100 25 1 44 11 6 11 11 0 1 14 7 119 80 36 14 0 119 25 900
Russia Medium-Low 20 3 20 12 143 11 13 5 17 4 16 8 26 62 26 5 22 38 4 8 12 10 1 34 47 132 42 32 6 1 143 27 900
CIS High 36 15 45 20 113 15 33 15 30 10 32 22 45 111 38 3 52 37 11 14 33 3 4 72 63 289 242 99 19 3 289 52 2073
CIS MedHigh 31 9 26 15 99 19 30 8 17 21 17 16 39 138 53 2 72 32 9 15 16 0 2 31 14 208 143 102 50 0 208 43 2073
CIS Medium-Low 29 4 24 14 146 13 16 8 18 7 19 17 35 115 63 5 30 78 5 10 26 20 1 43 49 209 140 47 33 1 209 42 2073
MERCOSUR High 6 4 13 6 15 8 10 2 9 9 15 6 2 6 2 2 3 1 17 2 13 3 12 2 0 0 2 2 2 0 17 6 656
MERCOSUR MedHigh 4 5 7 5 4 8 1 5 7 2 6 7 3 1 1 2 1 1 13 3 8 1 10 3 0 1 0 3 4 0 13 4 656
MERCOSUR Medium-Low 2 2 8 9 4 17 1 8 12 3 8 7 1 1 1 2 0 0 8 1 8 0 14 0 0 0 1 1 0 0 17 4 656
ACP Africa High 6 13 14 6 25 20 8 5 11 17 18 18 3 2 8 10 2 2 9 8 12 2 73 3 20 2 1 2 3 1 73 11 1165
ACP Africa MedHigh 7 10 10 6 4 19 6 5 12 6 5 14 2 1 1 2 2 3 8 7 6 2 32 3 20 3 1 2 6 1 32 7 1165
ACP Africa Medium-Low 5 5 10 8 2 23 5 4 10 3 11 16 1 3 2 8 2 0 3 2 11 14 69 3 4 2 1 1 2 0 69 8 1165
ACP Caribbean High 0 0 0 0 1 0 0 0 0 0 1 1 0 0 0 0 0 0 1 0 0 0 0 0 0 0 0 0 0 0 1 0 390
ACP Caribbean MedHigh 0 0 0 0 0 0 0 0 1 1 0 1 0 0 0 0 0 0 1 0 0 0 1 0 0 1 0 1 0 0 1 0 390
ACP Caribbean Medium-Low 0 0 0 0 0 0 0 1 0 0 0 1 0 1 0 0 0 0 0 0 1 0 0 0 0 1 0 0 0 0 1 0 390
ACP Pacific High 0 0 0 0 0 0 0 0 0 0 0 0 0 0 0 0 0 0 0 0 0 0 0 0 0 0 0 0 0 0 0 0 416
ACP Pacific MedHigh 0 0 0 0 0 0 0 0 0 2 0 0 0 0 0 0 0 0 0 0 0 0 0 0 0 0 0 0 0 0 2 0 416
ACP Pacific Medium-Low 0 0 0 0 0 0 0 0 0 0 0 0 0 0 0 0 0 0 0 0 0 0 0 0 0 0 0 0 0 0 0 0 416
EURMED High 6 6 10 5 14 13 1 5 9 4 7 8 4 0 9 3 5 5 11 36 15 5 6 17 16 4 1 6 10 0 36 8 342
EURMED MedHigh 4 6 9 3 3 16 1 4 9 4 4 9 4 2 8 3 6 4 14 36 14 5 4 50 18 3 3 4 30 1 50 10 342
EURMED Medium-Low 5 3 6 4 2 14 1 3 5 1 3 7 3 3 5 2 4 1 5 24 9 26 3 15 7 1 4 2 19 1 26 6 342
Middle East High 3 4 5 2 22 4 1 1 6 3 13 8 3 1 6 3 1 2 3 12 8 13 1 3 23 0 1 7 3 0 23 6 529
Middle East MedHigh 2 1 3 2 0 5 2 1 3 1 1 6 3 0 1 1 1 2 3 4 3 0 2 1 45 0 0 0 10 0 45 4 529
Middle East Medium-Low 2 1 4 5 0 8 2 1 2 1 3 6 1 0 4 1 1 0 1 1 12 5 0 5 7 0 0 1 7 0 12 3 529
Oceania High 3 1 4 5 3 3 3 1 4 3 7 5 1 0 1 4 1 0 2 1 4 1 0 0 1 1 0 1 0 0 7 2 404
Oceania MedHigh 2 2 2 3 1 2 1 1 4 3 5 5 0 0 1 3 1 1 2 2 2 2 0 0 0 1 0 1 0 0 5 2 404
Oceania Medium-Low 1 1 3 3 1 2 0 1 4 3 7 7 1 0 1 3 1 0 1 2 2 1 0 0 1 14 0 0 0 0 14 2 404
Country Group 1 Country Group 2 Country Group 3 Country Group 4
Partner Countries
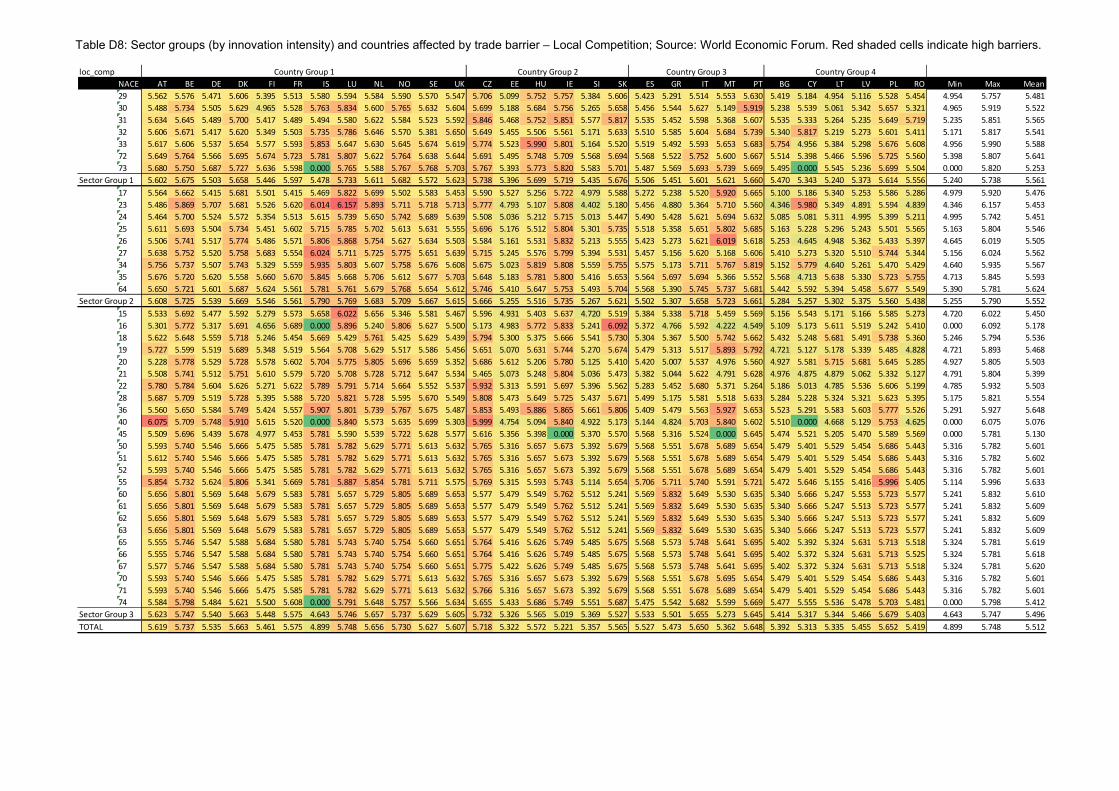
Table D8: Sector groups (by innovation intensity) and countries affected by trade barrier – Local Competition; Source: World Economic Forum. Red shaded cells indicate high barriers.
loc_comp
NACE AT BE DE DK FI FR IS LU NL NO SE UK CZ EE HU IE SI SK ES GR IT MT PT BG CY LT LV PL RO Min Max Mean
29 5.562 5.576 5.471 5.606 5.395 5.513 5.580 5.594 5.584 5.590 5.570 5.547 5.706 5.099 5.752 5.757 5.384 5.606 5.423 5.291 5.514 5.553 5.630 5.419 5.184 4.954 5.116 5.528 5.454 4.954 5.757 5.481
30 5.488 5.734 5.505 5.629 4.965 5.528 5.763 5.834 5.600 5.765 5.632 5.604 5.699 5.188 5.684 5.756 5.265 5.658 5.456 5.544 5.627 5.149 5.919 5.238 5.539 5.061 5.342 5.657 5.321 4.965 5.919 5.522
31 5.634 5.645 5.489 5.700 5.417 5.489 5.494 5.580 5.622 5.584 5.523 5.592 5.846 5.468 5.752 5.851 5.577 5.817 5.535 5.452 5.598 5.368 5.607 5.535 5.333 5.264 5.235 5.649 5.719 5.235 5.851 5.565
32 5.606 5.671 5.417 5.620 5.349 5.503 5.735 5.786 5.646 5.570 5.381 5.650 5.649 5.455 5.506 5.561 5.171 5.633 5.510 5.585 5.604 5.684 5.739 5.340 5.817 5.219 5.273 5.601 5.411 5.171 5.817 5.541
33 5.617 5.606 5.537 5.654 5.577 5.593 5.853 5.647 5.630 5.645 5.674 5.619 5.774 5.523 5.990 5.801 5.164 5.520 5.519 5.492 5.593 5.653 5.683 5.754 4.956 5.384 5.298 5.676 5.608 4.956 5.990 5.588
72 5.649 5.764 5.566 5.695 5.674 5.723 5.781 5.807 5.622 5.764 5.638 5.644 5.691 5.495 5.748 5.709 5.568 5.694 5.568 5.522 5.752 5.600 5.667 5.514 5.398 5.466 5.596 5.725 5.560 5.398 5.807 5.641
73 5.680 5.750 5.687 5.727 5.636 5.598 0.000 5.765 5.588 5.767 5.768 5.703 5.767 5.393 5.773 5.820 5.583 5.701 5.487 5.569 5.693 5.739 5.669 5.495 0.000 5.545 5.236 5.699 5.504 0.000 5.820 5.253
Sector Group 1 5.602 5.675 5.503 5.658 5.446 5.597 5.478 5.733 5.611 5.682 5.572 5.623 5.738 5.396 5.699 5.719 5.435 5.676 5.506 5.451 5.601 5.621 5.660 5.470 5.343 5.240 5.373 5.614 5.556 5.240 5.738 5.561
17 5.564 5.662 5.415 5.681 5.501 5.415 5.469 5.822 5.699 5.502 5.583 5.453 5.590 5.527 5.256 5.722 4.979 5.588 5.272 5.238 5.520 5.920 5.665 5.100 5.186 5.340 5.253 5.586 5.286 4.979 5.920 5.476
23 5.486 5.869 5.707 5.681 5.526 5.620 6.014 6.157 5.893 5.711 5.718 5.713 5.777 4.793 5.107 5.808 4.402 5.180 5.456 4.880 5.364 5.710 5.560 4.346 5.980 5.349 4.891 5.594 4.839 4.346 6.157 5.453
24 5.464 5.700 5.524 5.572 5.354 5.513 5.615 5.739 5.650 5.742 5.689 5.639 5.508 5.036 5.212 5.715 5.013 5.447 5.490 5.428 5.621 5.694 5.632 5.085 5.081 5.311 4.995 5.399 5.211 4.995 5.742 5.451
25 5.611 5.693 5.504 5.734 5.451 5.602 5.715 5.785 5.702 5.613 5.631 5.555 5.696 5.176 5.512 5.804 5.301 5.735 5.518 5.358 5.651 5.802 5.685 5.163 5.228 5.296 5.243 5.501 5.565 5.163 5.804 5.546
26 5.506 5.741 5.517 5.774 5.486 5.571 5.806 5.868 5.754 5.627 5.634 5.503 5.584 5.161 5.531 5.832 5.213 5.555 5.423 5.273 5.621 6.019 5.618 5.253 4.645 4.948 5.362 5.433 5.397 4.645 6.019 5.505
27 5.638 5.752 5.520 5.758 5.683 5.554 6.024 5.711 5.725 5.775 5.651 5.639 5.715 5.245 5.576 5.799 5.394 5.531 5.457 5.156 5.620 5.168 5.606 5.410 5.273 5.320 5.510 5.744 5.344 5.156 6.024 5.562
34 5.756 5.737 5.507 5.743 5.329 5.559 5.935 5.803 5.607 5.758 5.676 5.608 5.675 5.023 5.819 5.808 5.559 5.755 5.575 5.173 5.711 5.767 5.819 5.152 5.779 4.640 5.261 5.470 5.429 4.640 5.935 5.567
35 5.676 5.720 5.620 5.558 5.660 5.670 5.845 5.668 5.706 5.612 5.677 5.703 5.648 5.183 5.781 5.800 5.416 5.653 5.564 5.697 5.694 5.366 5.552 5.568 4.713 5.638 5.330 5.723 5.755 4.713 5.845 5.593
64 5.650 5.721 5.601 5.687 5.624 5.561 5.781 5.761 5.679 5.768 5.654 5.612 5.746 5.410 5.647 5.753 5.493 5.704 5.568 5.390 5.745 5.737 5.681 5.442 5.592 5.394 5.458 5.677 5.549 5.390 5.781 5.624
Sector Group 2 5.608 5.725 5.539 5.669 5.546 5.561 5.790 5.769 5.683 5.709 5.667 5.615 5.666 5.255 5.516 5.735 5.267 5.621 5.502 5.307 5.658 5.723 5.661 5.284 5.257 5.302 5.375 5.560 5.438 5.255 5.790 5.552
15 5.533 5.692 5.477 5.592 5.279 5.573 5.658 6.022 5.656 5.346 5.581 5.467 5.596 4.931 5.403 5.637 4.720 5.519 5.384 5.338 5.718 5.459 5.569 5.156 5.543 5.171 5.166 5.585 5.273 4.720 6.022 5.450
16 5.301 5.772 5.317 5.691 4.656 5.689 0.000 5.896 5.240 5.806 5.627 5.500 5.173 4.983 5.772 5.833 5.241 6.092 5.372 4.766 5.592 4.222 4.549 5.109 5.173 5.611 5.519 5.242 5.410 0.000 6.092 5.178
18 5.622 5.648 5.559 5.718 5.246 5.454 5.669 5.429 5.761 5.425 5.629 5.439 5.794 5.300 5.375 5.666 5.541 5.730 5.304 5.367 5.500 5.742 5.662 5.432 5.248 5.681 5.491 5.738 5.360 5.246 5.794 5.536
19 5.727 5.599 5.519 5.689 5.348 5.519 5.564 5.708 5.629 5.517 5.586 5.456 5.651 5.070 5.631 5.744 5.270 5.674 5.479 5.313 5.517 5.893 5.792 4.721 5.127 5.178 5.339 5.485 4.828 4.721 5.893 5.468
20 5.228 5.778 5.529 5.728 5.578 5.602 5.704 5.775 5.805 5.696 5.659 5.352 5.686 5.612 5.206 5.780 5.125 5.410 5.420 5.007 5.537 4.976 5.560 4.927 5.581 5.715 5.681 5.645 5.285 4.927 5.805 5.503
21 5.508 5.741 5.512 5.751 5.610 5.579 5.720 5.708 5.728 5.712 5.647 5.534 5.465 5.073 5.248 5.804 5.036 5.473 5.382 5.044 5.622 4.791 5.628 4.976 4.875 4.879 5.062 5.332 5.127 4.791 5.804 5.399
22 5.780 5.784 5.604 5.626 5.271 5.622 5.789 5.791 5.714 5.664 5.552 5.537 5.932 5.313 5.591 5.697 5.396 5.562 5.283 5.452 5.680 5.371 5.264 5.186 5.013 4.785 5.536 5.606 5.199 4.785 5.932 5.503
28 5.687 5.709 5.519 5.728 5.395 5.588 5.720 5.821 5.728 5.595 5.670 5.549 5.808 5.473 5.649 5.725 5.437 5.671 5.499 5.175 5.581 5.518 5.633 5.284 5.228 5.324 5.321 5.623 5.395 5.175 5.821 5.554
36 5.560 5.650 5.584 5.749 5.424 5.557 5.907 5.801 5.739 5.767 5.675 5.487 5.853 5.493 5.886 5.865 5.661 5.806 5.409 5.479 5.563 5.927 5.653 5.523 5.291 5.583 5.603 5.777 5.526 5.291 5.927 5.648
40 6.075 5.709 5.748 5.910 5.615 5.520 0.000 5.840 5.573 5.635 5.699 5.303 5.999 4.754 5.094 5.840 4.922 5.173 5.144 4.824 5.703 5.840 5.602 5.510 0.000 4.668 5.129 5.753 4.625 0.000 6.075 5.076
45 5.509 5.696 5.439 5.678 4.977 5.453 5.781 5.590 5.539 5.722 5.628 5.577 5.616 5.356 5.398 0.000 5.370 5.570 5.568 5.316 5.524 0.000 5.645 5.474 5.521 5.205 5.470 5.589 5.569 0.000 5.781 5.130
50 5.593 5.740 5.546 5.666 5.475 5.585 5.781 5.782 5.629 5.771 5.613 5.632 5.765 5.316 5.657 5.673 5.392 5.679 5.568 5.551 5.678 5.689 5.654 5.479 5.401 5.529 5.454 5.686 5.443 5.316 5.782 5.601
51 5.612 5.740 5.546 5.666 5.475 5.585 5.781 5.782 5.629 5.771 5.613 5.632 5.765 5.316 5.657 5.673 5.392 5.679 5.568 5.551 5.678 5.689 5.654 5.479 5.401 5.529 5.454 5.686 5.443 5.316 5.782 5.602
52 5.593 5.740 5.546 5.666 5.475 5.585 5.781 5.782 5.629 5.771 5.613 5.632 5.765 5.316 5.657 5.673 5.392 5.679 5.568 5.551 5.678 5.689 5.654 5.479 5.401 5.529 5.454 5.686 5.443 5.316 5.782 5.601
55 5.854 5.732 5.624 5.806 5.341 5.669 5.781 5.887 5.854 5.781 5.711 5.575 5.769 5.315 5.593 5.743 5.114 5.654 5.706 5.711 5.740 5.591 5.721 5.472 5.646 5.155 5.416 5.996 5.405 5.114 5.996 5.633
60 5.656 5.801 5.569 5.648 5.679 5.583 5.781 5.657 5.729 5.805 5.689 5.653 5.577 5.479 5.549 5.762 5.512 5.241 5.569 5.832 5.649 5.530 5.635 5.340 5.666 5.247 5.553 5.723 5.577 5.241 5.832 5.610
61 5.656 5.801 5.569 5.648 5.679 5.583 5.781 5.657 5.729 5.805 5.689 5.653 5.577 5.479 5.549 5.762 5.512 5.241 5.569 5.832 5.649 5.530 5.635 5.340 5.666 5.247 5.513 5.723 5.577 5.241 5.832 5.609
62 5.656 5.801 5.569 5.648 5.679 5.583 5.781 5.657 5.729 5.805 5.689 5.653 5.577 5.479 5.549 5.762 5.512 5.241 5.569 5.832 5.649 5.530 5.635 5.340 5.666 5.247 5.513 5.723 5.577 5.241 5.832 5.609
63 5.656 5.801 5.569 5.648 5.679 5.583 5.781 5.657 5.729 5.805 5.689 5.653 5.577 5.479 5.549 5.762 5.512 5.241 5.569 5.832 5.649 5.530 5.635 5.340 5.666 5.247 5.513 5.723 5.577 5.241 5.832 5.609
65 5.555 5.746 5.547 5.588 5.684 5.580 5.781 5.743 5.740 5.754 5.660 5.651 5.764 5.416 5.626 5.749 5.485 5.675 5.568 5.573 5.748 5.641 5.695 5.402 5.392 5.324 5.631 5.713 5.518 5.324 5.781 5.619
66 5.555 5.746 5.547 5.588 5.684 5.580 5.781 5.743 5.740 5.754 5.660 5.651 5.764 5.416 5.626 5.749 5.485 5.675 5.568 5.573 5.748 5.641 5.695 5.402 5.372 5.324 5.631 5.713 5.525 5.324 5.781 5.618
67 5.577 5.746 5.547 5.588 5.684 5.580 5.781 5.743 5.740 5.754 5.660 5.651 5.775 5.422 5.626 5.749 5.485 5.675 5.568 5.573 5.748 5.641 5.695 5.402 5.372 5.324 5.631 5.713 5.518 5.324 5.781 5.620
70 5.593 5.740 5.546 5.666 5.475 5.585 5.781 5.782 5.629 5.771 5.613 5.632 5.765 5.316 5.657 5.673 5.392 5.679 5.568 5.551 5.678 5.695 5.654 5.479 5.401 5.529 5.454 5.686 5.443 5.316 5.782 5.601
71 5.593 5.740 5.546 5.666 5.475 5.585 5.781 5.782 5.629 5.771 5.613 5.632 5.766 5.316 5.657 5.673 5.392 5.679 5.568 5.551 5.678 5.689 5.654 5.479 5.401 5.529 5.454 5.686 5.443 5.316 5.782 5.601
74 5.584 5.798 5.484 5.621 5.500 5.608 0.000 5.791 5.648 5.757 5.566 5.634 5.655 5.433 5.686 5.749 5.551 5.687 5.475 5.542 5.682 5.599 5.669 5.477 5.555 5.536 5.478 5.703 5.481 0.000 5.798 5.412
Sector Group 3 5.623 5.747 5.540 5.663 5.448 5.575 4.643 5.746 5.657 5.737 5.629 5.605 5.732 5.326 5.565 5.019 5.369 5.527 5.533 5.501 5.655 5.273 5.645 5.414 5.317 5.344 5.466 5.679 5.403 4.643 5.747 5.496
TOTAL 5.619 5.737 5.535 5.663 5.461 5.575 4.899 5.748 5.656 5.730 5.627 5.607 5.718 5.322 5.572 5.221 5.357 5.565 5.527 5.473 5.650 5.362 5.648 5.392 5.313 5.335 5.455 5.652 5.419 4.899 5.748 5.512
Country Group 3 Country Group 4Country Group 2Country Group 1
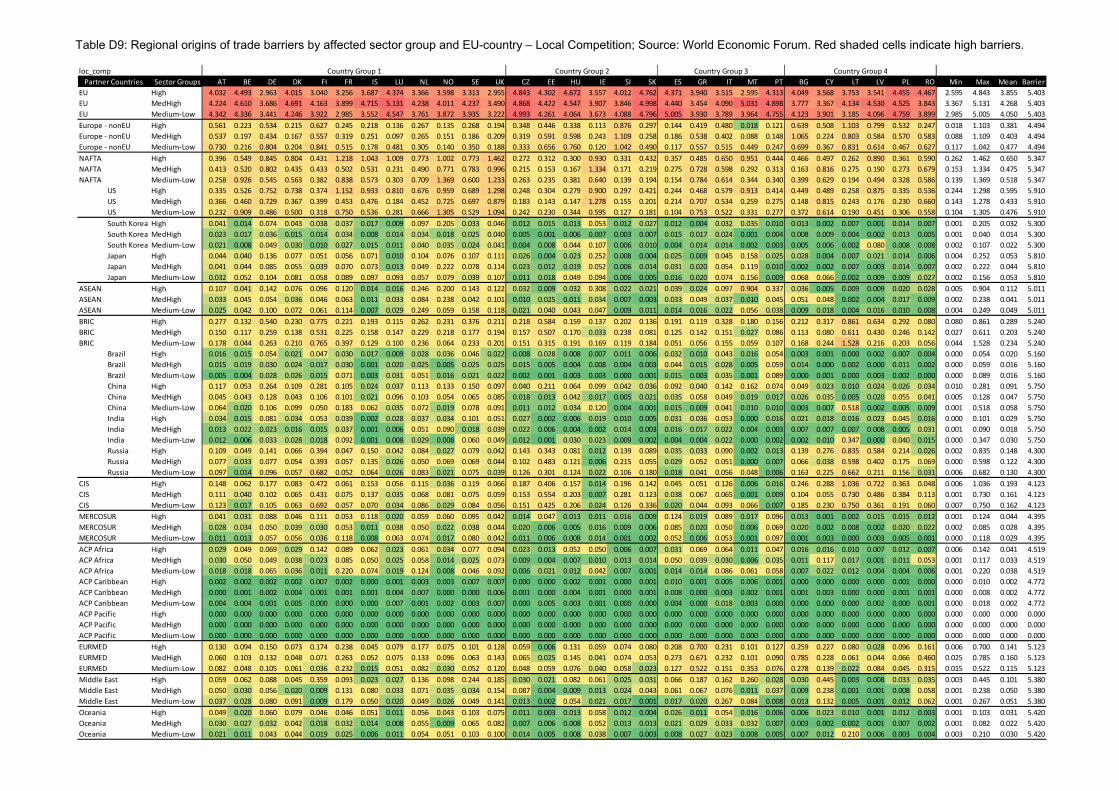
Table D9: Regional origins of trade barriers by affected sector group and EU-country – Local Competition; Source: World Economic Forum. Red shaded cells indicate high barriers.
loc_comp
Sector Groups AT BE DE DK FI FR IS LU NL NO SE UK CZ EE HU IE SI SK ES GR IT MT PT BG CY LT LV PL RO Min Max Mean Barrier
EU High 4.032 4.493 2.963 4.015 3.040 3.256 3.687 4.374 3.366 3.598 3.313 2.955 4.843 4.302 4.672 3.557 4.012 4.762 4.371 3.940 3.515 2.595 4.313 4.049 3.568 3.753 3.541 4.455 4.467 2.595 4.843 3.855 5.403
EU MedHigh 4.224 4.610 3.686 4.691 4.163 3.899 4.715 5.131 4.238 4.011 4.237 3.490 4.868 4.422 4.547 3.907 3.846 4.998 4.440 3.454 4.090 5.031 4.898 3.777 3.367 4.134 4.530 4.525 3.843 3.367 5.131 4.268 5.403
EU Medium-Low 4.342 4.336 3.441 4.246 3.922 2.985 3.552 4.547 3.761 3.872 3.935 3.222 4.993 4.261 4.064 3.673 4.088 4.796 5.005 3.930 3.789 3.964 4.755 4.123 3.901 3.185 4.096 4.759 3.899 2.985 5.005 4.050 5.403
Europe - nonEU High 0.561 0.223 0.534 0.215 0.627 0.245 0.218 0.136 0.267 0.135 0.268 0.194 0.348 0.446 0.338 0.113 0.876 0.297 0.144 0.419 0.480 0.018 0.121 0.639 0.508 1.103 0.799 0.532 0.247 0.018 1.103 0.381 4.494
Europe - nonEU MedHigh 0.537 0.197 0.434 0.167 0.557 0.319 0.251 0.097 0.265 0.151 0.186 0.209 0.319 0.591 0.598 0.243 1.109 0.258 0.186 0.538 0.402 0.088 0.148 1.065 0.224 0.803 0.584 0.570 0.583 0.088 1.109 0.403 4.494
Europe - nonEU Medium-Low 0.730 0.216 0.804 0.204 0.841 0.515 0.178 0.481 0.305 0.140 0.350 0.188 0.333 0.656 0.760 0.120 1.042 0.490 0.117 0.557 0.515 0.449 0.247 0.699 0.367 0.831 0.614 0.467 0.627 0.117 1.042 0.477 4.494
NAFTA High 0.396 0.549 0.845 0.804 0.431 1.218 1.043 1.009 0.773 1.002 0.773 1.462 0.272 0.312 0.300 0.930 0.331 0.432 0.357 0.485 0.650 0.951 0.444 0.466 0.497 0.262 0.890 0.361 0.590 0.262 1.462 0.650 5.347
NAFTA MedHigh 0.413 0.520 0.802 0.435 0.433 0.502 0.531 0.231 0.490 0.771 0.783 0.996 0.215 0.153 0.167 1.334 0.171 0.219 0.275 0.728 0.598 0.292 0.313 0.163 0.816 0.275 0.190 0.273 0.679 0.153 1.334 0.475 5.347
NAFTA Medium-Low 0.258 0.926 0.545 0.563 0.382 0.838 0.573 0.303 0.709 1.369 0.600 1.233 0.263 0.235 0.381 0.640 0.139 0.194 0.154 0.784 0.614 0.344 0.340 0.399 0.629 0.194 0.494 0.328 0.586 0.139 1.369 0.518 5.347
US High 0.335 0.526 0.752 0.738 0.374 1.152 0.933 0.810 0.676 0.959 0.689 1.298 0.248 0.304 0.279 0.900 0.297 0.421 0.244 0.468 0.579 0.913 0.414 0.449 0.489 0.258 0.875 0.335 0.536 0.244 1.298 0.595 5.910
US MedHigh 0.366 0.460 0.729 0.367 0.399 0.453 0.476 0.184 0.452 0.725 0.697 0.879 0.183 0.143 0.147 1.278 0.155 0.201 0.214 0.707 0.534 0.259 0.275 0.148 0.815 0.243 0.176 0.230 0.660 0.143 1.278 0.433 5.910
US Medium-Low 0.232 0.909 0.486 0.500 0.318 0.750 0.536 0.281 0.666 1.305 0.529 1.094 0.242 0.230 0.344 0.595 0.127 0.181 0.104 0.753 0.522 0.331 0.277 0.372 0.614 0.190 0.451 0.306 0.558 0.104 1.305 0.476 5.910
South Korea High 0.041 0.014 0.074 0.043 0.038 0.037 0.017 0.009 0.097 0.205 0.033 0.046 0.012 0.015 0.013 0.053 0.012 0.027 0.012 0.004 0.032 0.035 0.010 0.013 0.002 0.007 0.001 0.014 0.007 0.001 0.205 0.032 5.300
South Korea MedHigh 0.023 0.017 0.036 0.015 0.014 0.034 0.008 0.014 0.034 0.018 0.025 0.040 0.005 0.001 0.006 0.007 0.003 0.007 0.015 0.017 0.024 0.001 0.004 0.008 0.009 0.004 0.002 0.013 0.005 0.001 0.040 0.014 5.300
South Korea Medium-Low 0.021 0.008 0.049 0.030 0.010 0.027 0.015 0.011 0.040 0.035 0.024 0.041 0.004 0.008 0.044 0.107 0.006 0.010 0.004 0.014 0.014 0.002 0.003 0.005 0.006 0.002 0.080 0.008 0.008 0.002 0.107 0.022 5.300
Japan High 0.044 0.040 0.136 0.077 0.051 0.056 0.071 0.010 0.104 0.076 0.107 0.111 0.026 0.004 0.023 0.252 0.008 0.004 0.025 0.009 0.045 0.158 0.025 0.028 0.004 0.007 0.021 0.014 0.006 0.004 0.252 0.053 5.810
Japan MedHigh 0.041 0.044 0.085 0.055 0.039 0.070 0.073 0.013 0.049 0.222 0.078 0.114 0.023 0.012 0.019 0.052 0.006 0.014 0.031 0.020 0.054 0.119 0.010 0.002 0.002 0.007 0.003 0.014 0.007 0.002 0.222 0.044 5.810
Japan Medium-Low 0.032 0.052 0.104 0.081 0.058 0.089 0.097 0.093 0.057 0.079 0.039 0.107 0.011 0.018 0.049 0.094 0.006 0.005 0.016 0.020 0.074 0.156 0.009 0.068 0.066 0.002 0.009 0.009 0.027 0.002 0.156 0.053 5.810
ASEAN High 0.107 0.041 0.142 0.076 0.096 0.120 0.014 0.016 0.246 0.200 0.143 0.122 0.032 0.009 0.032 0.308 0.022 0.021 0.039 0.024 0.097 0.904 0.337 0.036 0.005 0.009 0.009 0.020 0.028 0.005 0.904 0.112 5.011
ASEAN MedHigh 0.033 0.045 0.054 0.036 0.046 0.063 0.011 0.033 0.084 0.238 0.042 0.101 0.010 0.025 0.011 0.034 0.007 0.003 0.033 0.049 0.037 0.010 0.045 0.051 0.048 0.002 0.004 0.017 0.009 0.002 0.238 0.041 5.011
ASEAN Medium-Low 0.025 0.042 0.100 0.072 0.061 0.114 0.007 0.029 0.249 0.059 0.158 0.118 0.021 0.040 0.043 0.047 0.009 0.011 0.014 0.016 0.022 0.056 0.038 0.009 0.018 0.004 0.016 0.010 0.008 0.004 0.249 0.049 5.011
BRIC High 0.277 0.132 0.540 0.230 0.775 0.221 0.193 0.115 0.262 0.231 0.376 0.211 0.218 0.584 0.159 0.137 0.202 0.136 0.191 0.119 0.328 0.180 0.156 0.212 0.317 0.861 0.634 0.292 0.080 0.080 0.861 0.289 5.240
BRIC MedHigh 0.150 0.117 0.259 0.138 0.531 0.225 0.158 0.147 0.229 0.218 0.177 0.194 0.157 0.507 0.170 0.033 0.238 0.081 0.125 0.142 0.151 0.027 0.086 0.113 0.080 0.611 0.430 0.246 0.142 0.027 0.611 0.203 5.240
BRIC Medium-Low 0.178 0.044 0.263 0.210 0.765 0.397 0.129 0.100 0.236 0.064 0.233 0.201 0.151 0.315 0.191 0.169 0.119 0.184 0.051 0.056 0.155 0.059 0.107 0.168 0.244 1.528 0.216 0.203 0.056 0.044 1.528 0.234 5.240
Brazil High 0.016 0.015 0.054 0.021 0.047 0.030 0.017 0.009 0.028 0.036 0.046 0.022 0.008 0.028 0.008 0.007 0.011 0.006 0.032 0.010 0.043 0.016 0.054 0.003 0.001 0.000 0.002 0.007 0.004 0.000 0.054 0.020 5.160
Brazil MedHigh 0.015 0.019 0.030 0.024 0.017 0.030 0.001 0.020 0.025 0.005 0.025 0.025 0.015 0.005 0.004 0.008 0.004 0.003 0.044 0.015 0.028 0.005 0.059 0.014 0.000 0.002 0.000 0.011 0.002 0.000 0.059 0.016 5.160
Brazil Medium-Low 0.005 0.004 0.028 0.026 0.015 0.071 0.003 0.031 0.051 0.016 0.021 0.022 0.002 0.001 0.003 0.003 0.000 0.001 0.015 0.003 0.035 0.001 0.089 0.000 0.001 0.000 0.003 0.002 0.000 0.000 0.089 0.016 5.160
China High 0.117 0.053 0.264 0.109 0.281 0.105 0.024 0.037 0.113 0.133 0.150 0.097 0.040 0.211 0.064 0.099 0.042 0.036 0.092 0.040 0.142 0.162 0.074 0.049 0.023 0.010 0.024 0.026 0.034 0.010 0.281 0.091 5.750
China MedHigh 0.045 0.043 0.128 0.043 0.106 0.101 0.021 0.096 0.103 0.054 0.065 0.085 0.018 0.013 0.042 0.017 0.005 0.021 0.035 0.058 0.049 0.019 0.017 0.026 0.035 0.005 0.020 0.055 0.041 0.005 0.128 0.047 5.750
China Medium-Low 0.064 0.020 0.106 0.099 0.050 0.183 0.062 0.035 0.072 0.019 0.078 0.091 0.011 0.012 0.034 0.120 0.004 0.001 0.015 0.009 0.041 0.010 0.010 0.003 0.007 0.518 0.002 0.005 0.009 0.001 0.518 0.058 5.750
India High 0.034 0.015 0.081 0.034 0.053 0.039 0.002 0.028 0.037 0.034 0.101 0.051 0.027 0.002 0.006 0.019 0.010 0.005 0.031 0.036 0.053 0.000 0.016 0.021 0.018 0.016 0.023 0.045 0.016 0.000 0.101 0.029 5.750
India MedHigh 0.013 0.022 0.023 0.016 0.015 0.037 0.001 0.006 0.051 0.090 0.018 0.039 0.022 0.006 0.004 0.002 0.014 0.003 0.016 0.017 0.022 0.004 0.003 0.007 0.007 0.007 0.008 0.005 0.031 0.001 0.090 0.018 5.750
India Medium-Low 0.012 0.006 0.033 0.028 0.018 0.092 0.001 0.008 0.029 0.008 0.060 0.049 0.012 0.001 0.030 0.023 0.009 0.002 0.004 0.004 0.022 0.000 0.002 0.002 0.010 0.347 0.000 0.040 0.015 0.000 0.347 0.030 5.750
Russia High 0.109 0.049 0.141 0.066 0.394 0.047 0.150 0.042 0.084 0.027 0.079 0.042 0.143 0.343 0.081 0.012 0.139 0.089 0.035 0.033 0.090 0.002 0.013 0.139 0.276 0.835 0.584 0.214 0.026 0.002 0.835 0.148 4.300
Russia MedHigh 0.077 0.033 0.077 0.054 0.393 0.057 0.135 0.026 0.050 0.069 0.069 0.044 0.102 0.483 0.121 0.006 0.215 0.055 0.029 0.052 0.051 0.000 0.007 0.066 0.038 0.598 0.402 0.175 0.069 0.000 0.598 0.122 4.300
Russia Medium-Low 0.097 0.014 0.096 0.057 0.682 0.052 0.064 0.026 0.083 0.021 0.075 0.039 0.126 0.301 0.124 0.022 0.106 0.180 0.018 0.041 0.056 0.048 0.006 0.163 0.225 0.662 0.211 0.156 0.031 0.006 0.682 0.130 4.300
CIS High 0.148 0.062 0.177 0.083 0.472 0.061 0.153 0.056 0.115 0.036 0.119 0.066 0.187 0.406 0.157 0.014 0.196 0.142 0.045 0.051 0.126 0.006 0.016 0.246 0.288 1.036 0.722 0.363 0.048 0.006 1.036 0.193 4.123
CIS MedHigh 0.111 0.040 0.102 0.065 0.431 0.075 0.137 0.035 0.068 0.081 0.075 0.059 0.153 0.554 0.203 0.007 0.281 0.123 0.038 0.067 0.065 0.001 0.009 0.104 0.055 0.730 0.486 0.384 0.113 0.001 0.730 0.161 4.123
CIS Medium-Low 0.123 0.017 0.105 0.063 0.692 0.057 0.070 0.034 0.086 0.029 0.084 0.056 0.151 0.425 0.206 0.024 0.126 0.336 0.020 0.044 0.093 0.066 0.007 0.185 0.230 0.750 0.361 0.191 0.060 0.007 0.750 0.162 4.123
MERCOSUR High 0.041 0.031 0.088 0.046 0.111 0.053 0.118 0.020 0.059 0.060 0.095 0.042 0.014 0.047 0.013 0.011 0.016 0.009 0.124 0.019 0.089 0.017 0.096 0.013 0.001 0.002 0.015 0.015 0.012 0.001 0.124 0.044 4.395
MERCOSUR MedHigh 0.028 0.034 0.050 0.039 0.030 0.053 0.011 0.038 0.050 0.022 0.038 0.044 0.020 0.006 0.005 0.016 0.009 0.006 0.085 0.020 0.050 0.006 0.069 0.020 0.002 0.008 0.002 0.020 0.022 0.002 0.085 0.028 4.395
MERCOSUR Medium-Low 0.011 0.013 0.057 0.056 0.036 0.118 0.008 0.063 0.074 0.017 0.080 0.042 0.011 0.006 0.008 0.014 0.001 0.002 0.052 0.006 0.053 0.001 0.097 0.001 0.003 0.000 0.003 0.005 0.001 0.000 0.118 0.029 4.395
ACP Africa High 0.029 0.049 0.069 0.029 0.142 0.089 0.062 0.023 0.061 0.034 0.077 0.094 0.023 0.013 0.052 0.050 0.006 0.007 0.031 0.069 0.064 0.011 0.047 0.016 0.016 0.010 0.007 0.012 0.007 0.006 0.142 0.041 4.519
ACP Africa MedHigh 0.030 0.050 0.049 0.038 0.023 0.085 0.050 0.025 0.058 0.014 0.025 0.073 0.009 0.004 0.007 0.010 0.013 0.014 0.050 0.039 0.030 0.006 0.035 0.011 0.117 0.017 0.001 0.011 0.053 0.001 0.117 0.033 4.519
ACP Africa Medium-Low 0.018 0.018 0.065 0.036 0.011 0.220 0.074 0.019 0.124 0.008 0.046 0.092 0.006 0.021 0.012 0.042 0.007 0.001 0.014 0.014 0.086 0.061 0.058 0.007 0.022 0.012 0.004 0.004 0.006 0.001 0.220 0.038 4.519
ACP Caribbean High 0.002 0.002 0.002 0.002 0.007 0.002 0.000 0.001 0.003 0.003 0.007 0.007 0.000 0.000 0.002 0.001 0.000 0.001 0.010 0.001 0.005 0.006 0.001 0.000 0.000 0.000 0.000 0.001 0.000 0.000 0.010 0.002 4.772
ACP Caribbean MedHigh 0.000 0.001 0.002 0.004 0.001 0.001 0.001 0.004 0.007 0.000 0.000 0.006 0.001 0.000 0.004 0.001 0.000 0.001 0.008 0.000 0.003 0.002 0.001 0.001 0.003 0.000 0.000 0.001 0.001 0.000 0.008 0.002 4.772
ACP Caribbean Medium-Low 0.004 0.004 0.001 0.005 0.000 0.000 0.000 0.007 0.001 0.002 0.003 0.007 0.000 0.005 0.003 0.001 0.000 0.000 0.004 0.000 0.018 0.003 0.000 0.000 0.000 0.000 0.002 0.000 0.001 0.000 0.018 0.002 4.772
ACP Pacific High 0.000 0.000 0.000 0.000 0.000 0.000 0.000 0.000 0.000 0.000 0.000 0.000 0.000 0.000 0.000 0.000 0.000 0.000 0.000 0.000 0.000 0.000 0.000 0.000 0.000 0.000 0.000 0.000 0.000 0.000 0.000 0.000 0.000
ACP Pacific MedHigh 0.000 0.000 0.000 0.000 0.000 0.000 0.000 0.000 0.000 0.000 0.000 0.000 0.000 0.000 0.000 0.000 0.000 0.000 0.000 0.000 0.000 0.000 0.000 0.000 0.000 0.000 0.000 0.000 0.000 0.000 0.000 0.000 0.000
ACP Pacific Medium-Low 0.000 0.000 0.000 0.000 0.000 0.000 0.000 0.000 0.000 0.000 0.000 0.000 0.000 0.000 0.000 0.000 0.000 0.000 0.000 0.000 0.000 0.000 0.000 0.000 0.000 0.000 0.000 0.000 0.000 0.000 0.000 0.000 0.000
EURMED High 0.130 0.094 0.150 0.073 0.174 0.238 0.045 0.079 0.177 0.075 0.101 0.128 0.059 0.006 0.131 0.059 0.074 0.080 0.208 0.700 0.231 0.101 0.127 0.259 0.227 0.080 0.028 0.096 0.161 0.006 0.700 0.141 5.123
EURMED MedHigh 0.060 0.103 0.132 0.048 0.071 0.263 0.052 0.075 0.133 0.096 0.063 0.143 0.065 0.025 0.145 0.041 0.074 0.053 0.273 0.671 0.232 0.101 0.090 0.785 0.228 0.061 0.044 0.066 0.460 0.025 0.785 0.160 5.123
EURMED Medium-Low 0.082 0.048 0.105 0.061 0.036 0.232 0.015 0.051 0.082 0.030 0.052 0.120 0.048 0.059 0.076 0.040 0.058 0.023 0.127 0.522 0.151 0.353 0.076 0.278 0.139 0.022 0.084 0.045 0.315 0.015 0.522 0.115 5.123
Middle East High 0.059 0.062 0.088 0.045 0.359 0.093 0.023 0.027 0.136 0.098 0.244 0.185 0.030 0.021 0.082 0.061 0.025 0.031 0.066 0.187 0.162 0.260 0.028 0.030 0.445 0.003 0.008 0.033 0.035 0.003 0.445 0.101 5.380
Middle East MedHigh 0.050 0.030 0.056 0.020 0.009 0.131 0.080 0.033 0.071 0.035 0.034 0.154 0.087 0.004 0.009 0.013 0.024 0.043 0.061 0.067 0.076 0.011 0.037 0.009 0.238 0.001 0.001 0.008 0.058 0.001 0.238 0.050 5.380
Middle East Medium-Low 0.037 0.028 0.080 0.091 0.009 0.179 0.050 0.020 0.049 0.026 0.049 0.141 0.013 0.002 0.054 0.021 0.017 0.001 0.017 0.020 0.267 0.084 0.008 0.013 0.132 0.005 0.001 0.012 0.062 0.001 0.267 0.051 5.380
Oceania High 0.049 0.020 0.060 0.079 0.046 0.046 0.051 0.011 0.056 0.043 0.103 0.075 0.011 0.003 0.013 0.058 0.012 0.004 0.026 0.011 0.054 0.016 0.006 0.006 0.023 0.010 0.001 0.012 0.003 0.001 0.103 0.031 5.420
Oceania MedHigh 0.030 0.027 0.032 0.042 0.018 0.032 0.014 0.008 0.055 0.009 0.065 0.082 0.007 0.006 0.008 0.052 0.013 0.013 0.021 0.029 0.033 0.032 0.007 0.003 0.002 0.002 0.001 0.007 0.002 0.001 0.082 0.022 5.420
Oceania Medium-Low 0.021 0.011 0.043 0.044 0.019 0.025 0.006 0.011 0.054 0.051 0.103 0.100 0.014 0.005 0.008 0.038 0.007 0.003 0.008 0.027 0.023 0.008 0.005 0.007 0.012 0.210 0.006 0.003 0.004 0.003 0.210 0.030 5.420
Country Group 1 Country Group 2 Country Group 3 Country Group 4
Partner Countries
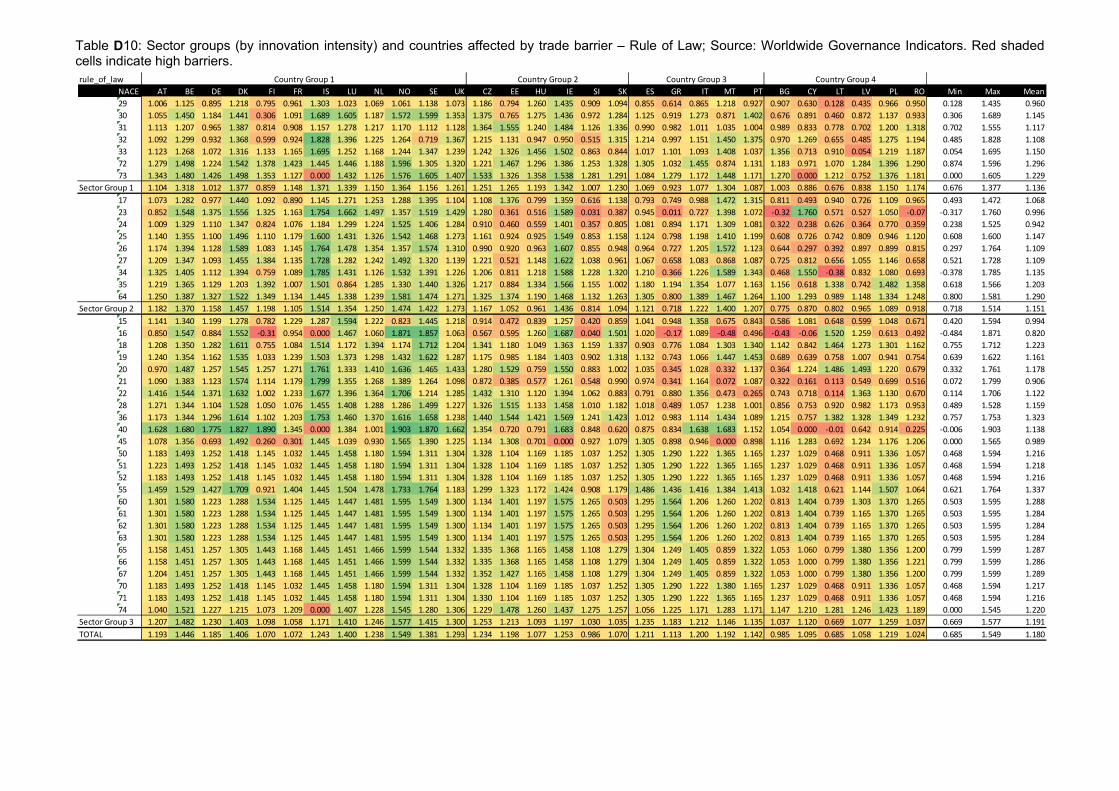
Table D10: Sector groups (by innovation intensity) and countries affected by trade barrier – Rule of Law; Source: Worldwide Governance Indicators. Red shaded cells indicate high barriers.
rule_of_law
NACE AT BE DE DK FI FR IS LU NL NO SE UK CZ EE HU IE SI SK ES GR IT MT PT BG CY LT LV PL RO Min Max Mean
29 1.006 1.125 0.895 1.218 0.795 0.961 1.303 1.023 1.069 1.061 1.138 1.073 1.186 0.794 1.260 1.435 0.909 1.094 0.855 0.614 0.865 1.218 0.927 0.907 0.630 0.128 0.435 0.966 0.950 0.128 1.435 0.960
30 1.055 1.450 1.184 1.441 0.306 1.091 1.689 1.605 1.187 1.572 1.599 1.353 1.375 0.765 1.275 1.436 0.972 1.284 1.125 0.919 1.273 0.871 1.402 0.676 0.891 0.460 0.872 1.137 0.933 0.306 1.689 1.145
31 1.113 1.207 0.965 1.387 0.814 0.908 1.157 1.278 1.217 1.170 1.112 1.128 1.364 1.555 1.240 1.484 1.126 1.336 0.990 0.982 1.011 1.035 1.004 0.989 0.833 0.778 0.702 1.200 1.318 0.702 1.555 1.117
32 1.092 1.299 0.932 1.368 0.599 0.924 1.828 1.396 1.225 1.264 0.719 1.367 1.215 1.131 0.947 0.950 0.515 1.315 1.214 0.997 1.151 1.450 1.375 0.970 1.269 0.655 0.485 1.275 1.194 0.485 1.828 1.108
33 1.123 1.268 1.072 1.316 1.133 1.165 1.695 1.252 1.168 1.244 1.347 1.239 1.242 1.326 1.456 1.502 0.863 0.844 1.017 1.101 1.093 1.408 1.037 1.356 0.713 0.910 0.054 1.219 1.187 0.054 1.695 1.150
72 1.279 1.498 1.224 1.542 1.378 1.423 1.445 1.446 1.188 1.596 1.305 1.320 1.221 1.467 1.296 1.386 1.253 1.328 1.305 1.032 1.455 0.874 1.131 1.183 0.971 1.070 1.284 1.396 1.290 0.874 1.596 1.296
73 1.343 1.480 1.426 1.498 1.353 1.127 0.000 1.432 1.126 1.576 1.605 1.407 1.533 1.326 1.358 1.538 1.281 1.291 1.084 1.279 1.172 1.448 1.171 1.270 0.000 1.212 0.752 1.376 1.181 0.000 1.605 1.229
Sector Group 1 1.104 1.318 1.012 1.377 0.859 1.148 1.371 1.339 1.150 1.364 1.156 1.261 1.251 1.265 1.193 1.342 1.007 1.230 1.069 0.923 1.077 1.304 1.087 1.003 0.886 0.676 0.838 1.150 1.174 0.676 1.377 1.136
17 1.073 1.282 0.977 1.440 1.092 0.890 1.145 1.271 1.253 1.288 1.395 1.104 1.108 1.376 0.799 1.359 0.616 1.138 0.793 0.749 0.988 1.472 1.315 0.811 0.493 0.940 0.726 1.109 0.965 0.493 1.472 1.068
23 0.852 1.548 1.375 1.556 1.325 1.163 1.754 1.662 1.497 1.357 1.519 1.429 1.280 0.361 0.516 1.589 0.031 0.387 0.945 0.011 0.727 1.398 1.072 -0.32 1.760 0.571 0.527 1.050 -0.07 -0.317 1.760 0.996
24 1.009 1.329 1.110 1.347 0.824 1.076 1.184 1.299 1.224 1.525 1.406 1.284 0.910 0.460 0.559 1.401 0.357 0.805 1.081 0.894 1.171 1.309 1.081 0.322 0.238 0.626 0.364 0.770 0.359 0.238 1.525 0.942
25 1.140 1.355 1.100 1.496 1.110 1.179 1.600 1.431 1.326 1.542 1.468 1.273 1.161 0.924 0.925 1.549 0.853 1.158 1.124 0.798 1.198 1.410 1.199 0.608 0.726 0.742 0.809 0.946 1.120 0.608 1.600 1.147
26 1.174 1.394 1.128 1.589 1.083 1.145 1.764 1.478 1.354 1.357 1.574 1.310 0.990 0.920 0.963 1.607 0.855 0.948 0.964 0.727 1.205 1.572 1.123 0.644 0.297 0.392 0.897 0.899 0.815 0.297 1.764 1.109
27 1.209 1.347 1.093 1.455 1.384 1.135 1.728 1.282 1.242 1.492 1.320 1.139 1.221 0.521 1.148 1.622 1.038 0.961 1.067 0.658 1.083 0.868 1.087 0.725 0.812 0.656 1.055 1.146 0.658 0.521 1.728 1.109
34 1.325 1.405 1.112 1.394 0.759 1.089 1.785 1.431 1.126 1.532 1.391 1.226 1.206 0.811 1.218 1.588 1.228 1.320 1.210 0.366 1.226 1.589 1.343 0.468 1.550 -0.38 0.832 1.080 0.693 -0.378 1.785 1.135
35 1.219 1.365 1.129 1.203 1.392 1.007 1.501 0.864 1.285 1.330 1.440 1.326 1.217 0.884 1.334 1.566 1.155 1.002 1.180 1.194 1.354 1.077 1.163 1.156 0.618 1.338 0.742 1.482 1.358 0.618 1.566 1.203
64 1.250 1.387 1.327 1.522 1.349 1.134 1.445 1.338 1.239 1.581 1.474 1.271 1.325 1.374 1.190 1.468 1.132 1.263 1.305 0.800 1.389 1.467 1.264 1.100 1.293 0.989 1.148 1.334 1.248 0.800 1.581 1.290
Sector Group 2 1.182 1.370 1.158 1.457 1.198 1.105 1.514 1.354 1.250 1.474 1.422 1.273 1.167 1.052 0.961 1.436 0.814 1.094 1.121 0.718 1.222 1.400 1.207 0.775 0.870 0.802 0.965 1.089 0.918 0.718 1.514 1.151
15 1.141 1.340 1.199 1.278 0.782 1.229 1.287 1.594 1.222 0.823 1.445 1.218 0.914 0.472 0.839 1.257 0.420 0.859 1.041 0.948 1.358 0.675 0.843 0.586 1.081 0.648 0.599 1.048 0.671 0.420 1.594 0.994
16 0.850 1.547 0.884 1.552 -0.31 0.954 0.000 1.467 1.060 1.871 1.857 1.063 0.567 0.595 1.260 1.687 0.040 1.501 1.020 -0.17 1.089 -0.48 0.496 -0.43 -0.06 1.520 1.259 0.613 0.492 -0.484 1.871 0.820
18 1.208 1.350 1.282 1.611 0.755 1.084 1.514 1.172 1.394 1.174 1.712 1.204 1.341 1.180 1.049 1.363 1.159 1.337 0.903 0.776 1.084 1.303 1.340 1.142 0.842 1.464 1.273 1.301 1.162 0.755 1.712 1.223
19 1.240 1.354 1.162 1.535 1.033 1.239 1.503 1.373 1.298 1.432 1.622 1.287 1.175 0.985 1.184 1.403 0.902 1.318 1.132 0.743 1.066 1.447 1.453 0.689 0.639 0.758 1.007 0.941 0.754 0.639 1.622 1.161
20 0.970 1.487 1.257 1.545 1.257 1.271 1.761 1.333 1.410 1.636 1.465 1.433 1.280 1.529 0.759 1.550 0.883 1.002 1.035 0.345 1.028 0.332 1.137 0.364 1.224 1.486 1.493 1.220 0.679 0.332 1.761 1.178
21 1.090 1.383 1.123 1.574 1.114 1.179 1.799 1.355 1.268 1.389 1.264 1.098 0.872 0.385 0.577 1.261 0.548 0.990 0.974 0.341 1.164 0.072 1.087 0.322 0.161 0.113 0.549 0.699 0.516 0.072 1.799 0.906
22 1.416 1.544 1.371 1.632 1.002 1.233 1.677 1.396 1.364 1.706 1.214 1.285 1.432 1.310 1.120 1.394 1.062 0.883 0.791 0.880 1.356 0.473 0.265 0.743 0.718 0.114 1.363 1.130 0.670 0.114 1.706 1.122
28 1.271 1.344 1.104 1.528 1.050 1.076 1.455 1.408 1.288 1.286 1.499 1.227 1.326 1.515 1.133 1.458 1.010 1.182 1.018 0.489 1.057 1.238 1.001 0.856 0.753 0.920 0.982 1.173 0.953 0.489 1.528 1.159
36 1.173 1.344 1.296 1.614 1.102 1.203 1.753 1.460 1.370 1.616 1.658 1.238 1.440 1.544 1.421 1.569 1.241 1.423 1.012 0.983 1.114 1.434 1.089 1.215 0.757 1.382 1.328 1.349 1.232 0.757 1.753 1.323
40 1.628 1.680 1.775 1.827 1.890 1.345 0.000 1.384 1.001 1.903 1.870 1.662 1.354 0.720 0.791 1.683 0.848 0.620 0.875 0.834 1.638 1.683 1.152 1.054 0.000 -0.01 0.642 0.914 0.225 -0.006 1.903 1.138
45 1.078 1.356 0.693 1.492 0.260 0.301 1.445 1.039 0.930 1.565 1.390 1.225 1.134 1.308 0.701 0.000 0.927 1.079 1.305 0.898 0.946 0.000 0.898 1.116 1.283 0.692 1.234 1.176 1.206 0.000 1.565 0.989
50 1.183 1.493 1.252 1.418 1.145 1.032 1.445 1.458 1.180 1.594 1.311 1.304 1.328 1.104 1.169 1.185 1.037 1.252 1.305 1.290 1.222 1.365 1.165 1.237 1.029 0.468 0.911 1.336 1.057 0.468 1.594 1.216
51 1.223 1.493 1.252 1.418 1.145 1.032 1.445 1.458 1.180 1.594 1.311 1.304 1.328 1.104 1.169 1.185 1.037 1.252 1.305 1.290 1.222 1.365 1.165 1.237 1.029 0.468 0.911 1.336 1.057 0.468 1.594 1.218
52 1.183 1.493 1.252 1.418 1.145 1.032 1.445 1.458 1.180 1.594 1.311 1.304 1.328 1.104 1.169 1.185 1.037 1.252 1.305 1.290 1.222 1.365 1.165 1.237 1.029 0.468 0.911 1.336 1.057 0.468 1.594 1.216
55 1.459 1.529 1.427 1.709 0.921 1.404 1.445 1.504 1.478 1.733 1.764 1.183 1.299 1.323 1.172 1.424 0.908 1.179 1.486 1.436 1.416 1.384 1.413 1.032 1.418 0.621 1.144 1.507 1.064 0.621 1.764 1.337
60 1.301 1.580 1.223 1.288 1.534 1.125 1.445 1.447 1.481 1.595 1.549 1.300 1.134 1.401 1.197 1.575 1.265 0.503 1.295 1.564 1.206 1.260 1.202 0.813 1.404 0.739 1.303 1.370 1.265 0.503 1.595 1.288
61 1.301 1.580 1.223 1.288 1.534 1.125 1.445 1.447 1.481 1.595 1.549 1.300 1.134 1.401 1.197 1.575 1.265 0.503 1.295 1.564 1.206 1.260 1.202 0.813 1.404 0.739 1.165 1.370 1.265 0.503 1.595 1.284
62 1.301 1.580 1.223 1.288 1.534 1.125 1.445 1.447 1.481 1.595 1.549 1.300 1.134 1.401 1.197 1.575 1.265 0.503 1.295 1.564 1.206 1.260 1.202 0.813 1.404 0.739 1.165 1.370 1.265 0.503 1.595 1.284
63 1.301 1.580 1.223 1.288 1.534 1.125 1.445 1.447 1.481 1.595 1.549 1.300 1.134 1.401 1.197 1.575 1.265 0.503 1.295 1.564 1.206 1.260 1.202 0.813 1.404 0.739 1.165 1.370 1.265 0.503 1.595 1.284
65 1.158 1.451 1.257 1.305 1.443 1.168 1.445 1.451 1.466 1.599 1.544 1.332 1.335 1.368 1.165 1.458 1.108 1.279 1.304 1.249 1.405 0.859 1.322 1.053 1.060 0.799 1.380 1.356 1.200 0.799 1.599 1.287
66 1.158 1.451 1.257 1.305 1.443 1.168 1.445 1.451 1.466 1.599 1.544 1.332 1.335 1.368 1.165 1.458 1.108 1.279 1.304 1.249 1.405 0.859 1.322 1.053 1.000 0.799 1.380 1.356 1.221 0.799 1.599 1.286
67 1.204 1.451 1.257 1.305 1.443 1.168 1.445 1.451 1.466 1.599 1.544 1.332 1.352 1.427 1.165 1.458 1.108 1.279 1.304 1.249 1.405 0.859 1.322 1.053 1.000 0.799 1.380 1.356 1.200 0.799 1.599 1.289
70 1.183 1.493 1.252 1.418 1.145 1.032 1.445 1.458 1.180 1.594 1.311 1.304 1.328 1.104 1.169 1.185 1.037 1.252 1.305 1.290 1.222 1.380 1.165 1.237 1.029 0.468 0.911 1.336 1.057 0.468 1.594 1.217
71 1.183 1.493 1.252 1.418 1.145 1.032 1.445 1.458 1.180 1.594 1.311 1.304 1.330 1.104 1.169 1.185 1.037 1.252 1.305 1.290 1.222 1.365 1.165 1.237 1.029 0.468 0.911 1.336 1.057 0.468 1.594 1.216
74 1.040 1.521 1.227 1.215 1.073 1.209 0.000 1.407 1.228 1.545 1.280 1.306 1.229 1.478 1.260 1.437 1.275 1.257 1.056 1.225 1.171 1.283 1.171 1.147 1.210 1.281 1.246 1.423 1.189 0.000 1.545 1.220
Sector Group 3 1.207 1.482 1.230 1.403 1.098 1.058 1.171 1.410 1.246 1.577 1.415 1.300 1.253 1.213 1.093 1.197 1.030 1.035 1.235 1.183 1.212 1.146 1.135 1.037 1.120 0.669 1.077 1.259 1.037 0.669 1.577 1.191
TOTAL 1.193 1.446 1.185 1.406 1.070 1.072 1.243 1.400 1.238 1.549 1.381 1.293 1.234 1.198 1.077 1.253 0.986 1.070 1.211 1.113 1.200 1.192 1.142 0.985 1.095 0.685 1.058 1.219 1.024 0.685 1.549 1.180
Country Group 3 Country Group 4Country Group 2Country Group 1
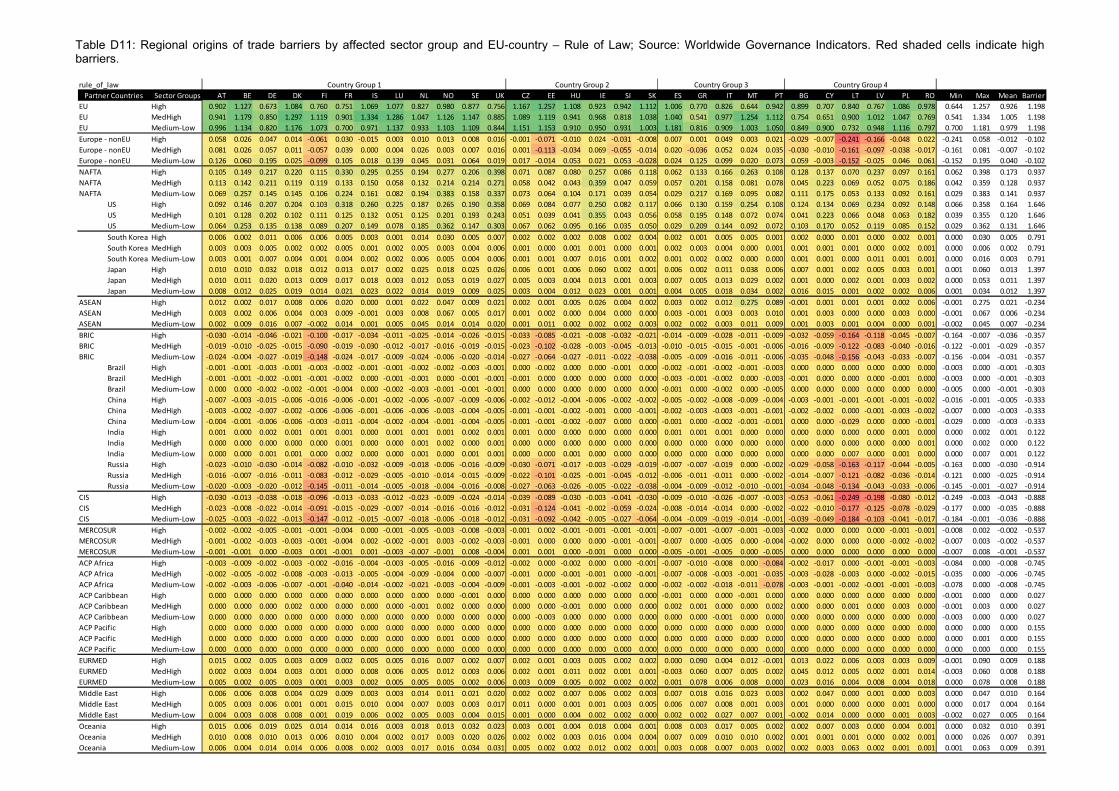
Table D11: Regional origins of trade barriers by affected sector group and EU-country – Rule of Law; Source: Worldwide Governance Indicators. Red shaded cells indicate high barriers.
rule_of_law
Sector Groups AT BE DE DK FI FR IS LU NL NO SE UK CZ EE HU IE SI SK ES GR IT MT PT BG CY LT LV PL RO Min Max Mean Barrier
EU High 0.902 1.127 0.673 1.084 0.760 0.751 1.069 1.077 0.827 0.980 0.877 0.756 1.167 1.257 1.108 0.923 0.942 1.112 1.006 0.770 0.826 0.644 0.942 0.899 0.707 0.840 0.767 1.086 0.978 0.644 1.257 0.926 1.198
EU MedHigh 0.941 1.179 0.850 1.297 1.119 0.901 1.334 1.286 1.047 1.126 1.147 0.885 1.089 1.119 0.941 0.968 0.818 1.038 1.040 0.541 0.977 1.254 1.112 0.754 0.651 0.900 1.012 1.047 0.769 0.541 1.334 1.005 1.198
EU Medium-Low 0.996 1.134 0.820 1.176 1.073 0.700 0.971 1.137 0.933 1.103 1.109 0.844 1.151 1.153 0.910 0.950 0.931 1.003 1.181 0.816 0.909 1.003 1.050 0.849 0.900 0.732 0.948 1.116 0.797 0.700 1.181 0.979 1.198
Europe - nonEU High 0.058 0.026 0.047 0.014 -0.061 0.030 -0.015 0.003 0.010 0.013 0.008 0.016 -0.001 -0.071 -0.010 0.024 -0.031 -0.008 0.007 0.001 0.049 0.003 0.021 -0.029 -0.007 -0.241 -0.166 -0.048 0.022 -0.241 0.058 -0.012 -0.102
Europe - nonEU MedHigh 0.081 0.026 0.057 0.011 -0.057 0.039 0.000 0.004 0.026 0.003 0.007 0.016 0.001 -0.113 -0.034 0.069 -0.055 -0.014 0.020 -0.036 0.052 0.024 0.035 -0.030 -0.010 -0.161 -0.097 -0.038 -0.017 -0.161 0.081 -0.007 -0.102
Europe - nonEU Medium-Low 0.126 0.060 0.195 0.025 -0.099 0.105 0.018 0.139 0.045 0.031 0.064 0.019 0.017 -0.014 0.053 0.021 0.053 -0.028 0.024 0.125 0.099 0.020 0.073 0.059 -0.003 -0.152 -0.025 0.046 0.061 -0.152 0.195 0.040 -0.102
NAFTA High 0.105 0.149 0.217 0.220 0.115 0.330 0.295 0.255 0.194 0.277 0.206 0.398 0.071 0.087 0.080 0.257 0.086 0.118 0.062 0.133 0.166 0.263 0.108 0.128 0.137 0.070 0.237 0.097 0.161 0.062 0.398 0.173 0.937
NAFTA MedHigh 0.113 0.142 0.211 0.119 0.119 0.133 0.150 0.058 0.132 0.214 0.214 0.271 0.058 0.042 0.043 0.359 0.047 0.059 0.057 0.201 0.158 0.081 0.078 0.045 0.223 0.069 0.052 0.075 0.186 0.042 0.359 0.128 0.937
NAFTA Medium-Low 0.069 0.257 0.145 0.145 0.106 0.224 0.161 0.082 0.194 0.383 0.158 0.337 0.073 0.064 0.104 0.171 0.039 0.054 0.029 0.217 0.169 0.095 0.082 0.111 0.175 0.053 0.133 0.092 0.161 0.029 0.383 0.141 0.937
US High 0.092 0.146 0.207 0.204 0.103 0.318 0.260 0.225 0.187 0.265 0.190 0.358 0.069 0.084 0.077 0.250 0.082 0.117 0.066 0.130 0.159 0.254 0.108 0.124 0.134 0.069 0.234 0.092 0.148 0.066 0.358 0.164 1.646
US MedHigh 0.101 0.128 0.202 0.102 0.111 0.125 0.132 0.051 0.125 0.201 0.193 0.243 0.051 0.039 0.041 0.355 0.043 0.056 0.058 0.195 0.148 0.072 0.074 0.041 0.223 0.066 0.048 0.063 0.182 0.039 0.355 0.120 1.646
US Medium-Low 0.064 0.253 0.135 0.138 0.089 0.207 0.149 0.078 0.185 0.362 0.147 0.303 0.067 0.062 0.095 0.166 0.035 0.050 0.029 0.209 0.144 0.092 0.072 0.103 0.170 0.052 0.119 0.085 0.152 0.029 0.362 0.131 1.646
South Korea High 0.006 0.002 0.011 0.006 0.006 0.005 0.003 0.001 0.014 0.030 0.005 0.007 0.002 0.002 0.002 0.008 0.002 0.004 0.002 0.001 0.005 0.005 0.001 0.002 0.000 0.001 0.000 0.002 0.001 0.000 0.030 0.005 0.791
South Korea MedHigh 0.003 0.003 0.005 0.002 0.002 0.005 0.001 0.002 0.005 0.003 0.004 0.006 0.001 0.000 0.001 0.001 0.000 0.001 0.002 0.003 0.004 0.000 0.001 0.001 0.001 0.001 0.000 0.002 0.001 0.000 0.006 0.002 0.791
South Korea Medium-Low 0.003 0.001 0.007 0.004 0.001 0.004 0.002 0.002 0.006 0.005 0.004 0.006 0.001 0.001 0.007 0.016 0.001 0.002 0.001 0.002 0.002 0.000 0.000 0.001 0.001 0.000 0.011 0.001 0.001 0.000 0.016 0.003 0.791
Japan High 0.010 0.010 0.032 0.018 0.012 0.013 0.017 0.002 0.025 0.018 0.025 0.026 0.006 0.001 0.006 0.060 0.002 0.001 0.006 0.002 0.011 0.038 0.006 0.007 0.001 0.002 0.005 0.003 0.001 0.001 0.060 0.013 1.397
Japan MedHigh 0.010 0.011 0.020 0.013 0.009 0.017 0.018 0.003 0.012 0.053 0.019 0.027 0.005 0.003 0.004 0.013 0.001 0.003 0.007 0.005 0.013 0.029 0.002 0.001 0.000 0.002 0.001 0.003 0.002 0.000 0.053 0.011 1.397
Japan Medium-Low 0.008 0.012 0.025 0.019 0.014 0.021 0.023 0.022 0.014 0.019 0.009 0.025 0.003 0.004 0.012 0.023 0.001 0.001 0.004 0.005 0.018 0.034 0.002 0.016 0.015 0.001 0.002 0.002 0.006 0.001 0.034 0.012 1.397
ASEAN High 0.012 0.002 0.017 0.008 0.006 0.020 0.000 0.001 0.022 0.047 0.009 0.021 0.002 0.001 0.005 0.026 0.004 0.002 0.003 0.002 0.012 0.275 0.089 -0.001 0.001 0.001 0.001 0.002 0.006 -0.001 0.275 0.021 -0.234
ASEAN MedHigh 0.003 0.002 0.006 0.004 0.003 0.009 -0.001 0.003 0.008 0.067 0.005 0.017 0.001 0.002 0.000 0.004 0.000 0.000 0.003 -0.001 0.003 0.003 0.010 0.001 0.003 0.000 0.000 0.003 0.000 -0.001 0.067 0.006 -0.234
ASEAN Medium-Low 0.002 0.009 0.016 0.007 -0.002 0.014 0.001 0.005 0.045 0.014 0.014 0.020 0.001 0.011 0.002 0.002 0.002 0.003 0.002 0.002 0.003 0.011 0.009 0.001 0.003 0.001 0.004 0.000 0.001 -0.002 0.045 0.007 -0.234
BRIC High -0.030 -0.014 -0.046 -0.021 -0.100 -0.017 -0.034 -0.011 -0.025 -0.014 -0.026 -0.015 -0.033 -0.085 -0.021 -0.008 -0.032 -0.021 -0.014 -0.009 -0.028 -0.011 -0.009 -0.032 -0.059 -0.164 -0.118 -0.045 -0.007 -0.164 -0.007 -0.036 -0.357
BRIC MedHigh -0.019 -0.010 -0.025 -0.015 -0.090 -0.019 -0.030 -0.012 -0.017 -0.016 -0.019 -0.015 -0.023 -0.102 -0.028 -0.003 -0.045 -0.013 -0.010 -0.015 -0.015 -0.001 -0.006 -0.016 -0.009 -0.122 -0.083 -0.040 -0.016 -0.122 -0.001 -0.029 -0.357
BRIC Medium-Low -0.024 -0.004 -0.027 -0.019 -0.148 -0.024 -0.017 -0.009 -0.024 -0.006 -0.020 -0.014 -0.027 -0.064 -0.027 -0.011 -0.022 -0.038 -0.005 -0.009 -0.016 -0.011 -0.006 -0.035 -0.048 -0.156 -0.043 -0.033 -0.007 -0.156 -0.004 -0.031 -0.357
Brazil High -0.001 -0.001 -0.003 -0.001 -0.003 -0.002 -0.001 -0.001 -0.002 -0.002 -0.003 -0.001 0.000 -0.002 0.000 0.000 -0.001 0.000 -0.002 -0.001 -0.002 -0.001 -0.003 0.000 0.000 0.000 0.000 0.000 0.000 -0.003 0.000 -0.001 -0.303
Brazil MedHigh -0.001 -0.001 -0.002 -0.001 -0.001 -0.002 0.000 -0.001 -0.001 0.000 -0.001 -0.001 -0.001 0.000 0.000 0.000 0.000 0.000 -0.003 -0.001 -0.002 0.000 -0.003 -0.001 0.000 0.000 0.000 -0.001 0.000 -0.003 0.000 -0.001 -0.303
Brazil Medium-Low 0.000 0.000 -0.002 -0.002 -0.001 -0.004 0.000 -0.002 -0.003 -0.001 -0.001 -0.001 0.000 0.000 0.000 0.000 0.000 0.000 -0.001 0.000 -0.002 0.000 -0.005 0.000 0.000 0.000 0.000 0.000 0.000 -0.005 0.000 -0.001 -0.303
China High -0.007 -0.003 -0.015 -0.006 -0.016 -0.006 -0.001 -0.002 -0.006 -0.007 -0.009 -0.006 -0.002 -0.012 -0.004 -0.006 -0.002 -0.002 -0.005 -0.002 -0.008 -0.009 -0.004 -0.003 -0.001 -0.001 -0.001 -0.001 -0.002 -0.016 -0.001 -0.005 -0.333
China MedHigh -0.003 -0.002 -0.007 -0.002 -0.006 -0.006 -0.001 -0.006 -0.006 -0.003 -0.004 -0.005 -0.001 -0.001 -0.002 -0.001 0.000 -0.001 -0.002 -0.003 -0.003 -0.001 -0.001 -0.002 -0.002 0.000 -0.001 -0.003 -0.002 -0.007 0.000 -0.003 -0.333
China Medium-Low -0.004 -0.001 -0.006 -0.006 -0.003 -0.011 -0.004 -0.002 -0.004 -0.001 -0.004 -0.005 -0.001 -0.001 -0.002 -0.007 0.000 0.000 -0.001 0.000 -0.002 -0.001 -0.001 0.000 0.000 -0.029 0.000 0.000 -0.001 -0.029 0.000 -0.003 -0.333
India High 0.001 0.000 0.002 0.001 0.001 0.001 0.000 0.001 0.001 0.001 0.002 0.001 0.001 0.000 0.000 0.000 0.000 0.000 0.001 0.001 0.001 0.000 0.000 0.000 0.000 0.000 0.000 0.001 0.000 0.000 0.002 0.001 0.122
India MedHigh 0.000 0.000 0.000 0.000 0.000 0.001 0.000 0.000 0.001 0.002 0.000 0.001 0.000 0.000 0.000 0.000 0.000 0.000 0.000 0.000 0.000 0.000 0.000 0.000 0.000 0.000 0.000 0.000 0.001 0.000 0.002 0.000 0.122
India Medium-Low 0.000 0.000 0.001 0.001 0.000 0.002 0.000 0.000 0.001 0.000 0.001 0.001 0.000 0.000 0.001 0.000 0.000 0.000 0.000 0.000 0.000 0.000 0.000 0.000 0.000 0.007 0.000 0.001 0.000 0.000 0.007 0.001 0.122
Russia High -0.023 -0.010 -0.030 -0.014 -0.082 -0.010 -0.032 -0.009 -0.018 -0.006 -0.016 -0.009 -0.030 -0.071 -0.017 -0.003 -0.029 -0.019 -0.007 -0.007 -0.019 0.000 -0.002 -0.029 -0.058 -0.163 -0.117 -0.044 -0.005 -0.163 0.000 -0.030 -0.914
Russia MedHigh -0.016 -0.007 -0.016 -0.011 -0.083 -0.012 -0.029 -0.005 -0.010 -0.014 -0.015 -0.009 -0.022 -0.101 -0.025 -0.001 -0.045 -0.012 -0.006 -0.011 -0.011 0.000 -0.002 -0.014 -0.007 -0.121 -0.082 -0.036 -0.014 -0.121 0.000 -0.025 -0.914
Russia Medium-Low -0.020 -0.003 -0.020 -0.012 -0.145 -0.011 -0.014 -0.005 -0.018 -0.004 -0.016 -0.008 -0.027 -0.063 -0.026 -0.005 -0.022 -0.038 -0.004 -0.009 -0.012 -0.010 -0.001 -0.034 -0.048 -0.134 -0.043 -0.033 -0.006 -0.145 -0.001 -0.027 -0.914
CIS High -0.030 -0.013 -0.038 -0.018 -0.096 -0.013 -0.033 -0.012 -0.023 -0.009 -0.024 -0.014 -0.039 -0.089 -0.030 -0.003 -0.041 -0.030 -0.009 -0.010 -0.026 -0.007 -0.003 -0.053 -0.061 -0.249 -0.198 -0.080 -0.012 -0.249 -0.003 -0.043 -0.888
CIS MedHigh -0.023 -0.008 -0.022 -0.014 -0.091 -0.015 -0.029 -0.007 -0.014 -0.016 -0.016 -0.012 -0.031 -0.124 -0.041 -0.002 -0.059 -0.024 -0.008 -0.014 -0.014 0.000 -0.002 -0.022 -0.010 -0.177 -0.125 -0.078 -0.029 -0.177 0.000 -0.035 -0.888
CIS Medium-Low -0.025 -0.003 -0.022 -0.013 -0.147 -0.012 -0.015 -0.007 -0.018 -0.006 -0.018 -0.012 -0.031 -0.092 -0.042 -0.005 -0.027 -0.064 -0.004 -0.009 -0.019 -0.014 -0.001 -0.039 -0.049 -0.184 -0.103 -0.041 -0.017 -0.184 -0.001 -0.036 -0.888
MERCOSUR High -0.002 -0.002 -0.005 -0.001 -0.001 -0.004 0.000 -0.001 -0.005 -0.003 -0.008 -0.003 -0.001 0.002 -0.001 -0.001 -0.001 -0.001 -0.007 -0.001 -0.007 -0.001 -0.003 -0.002 0.000 0.000 0.000 -0.001 -0.001 -0.008 0.002 -0.002 -0.537
MERCOSUR MedHigh -0.001 -0.002 -0.003 -0.003 -0.001 -0.004 0.002 -0.002 -0.001 0.003 -0.002 -0.003 -0.001 0.000 0.000 0.000 -0.001 -0.001 -0.007 0.000 -0.005 0.000 -0.004 -0.002 0.000 0.000 0.000 -0.002 -0.002 -0.007 0.003 -0.002 -0.537
MERCOSUR Medium-Low -0.001 -0.001 0.000 -0.003 0.001 -0.001 0.001 -0.003 -0.007 -0.001 0.008 -0.004 0.001 0.001 0.000 -0.001 0.000 0.000 -0.005 -0.001 -0.005 0.000 -0.005 0.000 0.000 0.000 0.000 0.000 0.000 -0.007 0.008 -0.001 -0.537
ACP Africa High -0.003 -0.009 -0.002 -0.003 -0.002 -0.016 -0.004 -0.003 -0.005 -0.016 -0.009 -0.012 -0.002 0.000 -0.002 0.000 0.000 -0.001 -0.007 -0.010 -0.008 0.000 -0.084 -0.002 -0.017 0.000 -0.001 -0.001 -0.003 -0.084 0.000 -0.008 -0.745
ACP Africa MedHigh -0.002 -0.005 -0.002 -0.008 -0.003 -0.013 -0.005 -0.004 -0.009 -0.004 0.000 -0.007 -0.001 0.000 -0.001 -0.001 0.000 -0.001 -0.007 -0.008 -0.003 -0.001 -0.035 -0.003 -0.028 -0.003 0.000 -0.002 -0.015 -0.035 0.000 -0.006 -0.745
ACP Africa Medium-Low -0.002 -0.003 -0.006 -0.007 -0.001 -0.040 -0.014 -0.002 -0.021 -0.003 -0.004 -0.009 -0.001 -0.003 -0.001 -0.002 -0.002 0.000 -0.002 -0.002 -0.018 -0.011 -0.078 -0.003 -0.001 -0.002 -0.001 -0.001 -0.003 -0.078 0.000 -0.008 -0.745
ACP Caribbean High 0.000 0.000 0.000 0.000 0.000 0.000 0.000 0.000 0.000 0.000 -0.001 0.000 0.000 0.000 0.000 0.000 0.000 0.000 -0.001 0.000 0.000 -0.001 0.000 0.000 0.000 0.000 0.000 0.000 0.000 -0.001 0.000 0.000 0.027
ACP Caribbean MedHigh 0.000 0.000 0.000 0.002 0.000 0.000 0.000 0.000 -0.001 0.002 0.000 0.000 0.000 0.000 -0.001 0.000 0.000 0.000 0.002 0.001 0.000 0.000 0.002 0.000 0.000 0.001 0.000 0.003 0.000 -0.001 0.003 0.000 0.027
ACP Caribbean Medium-Low 0.000 0.000 0.000 0.000 0.000 0.000 0.000 0.000 0.000 0.000 0.000 0.000 0.000 -0.003 0.000 0.000 0.000 0.000 0.000 0.000 -0.001 0.000 0.000 0.000 0.000 0.000 0.000 0.000 0.000 -0.003 0.000 0.000 0.027
ACP Pacific High 0.000 0.000 0.000 0.000 0.000 0.000 0.000 0.000 0.000 0.000 0.000 0.000 0.000 0.000 0.000 0.000 0.000 0.000 0.000 0.000 0.000 0.000 0.000 0.000 0.000 0.000 0.000 0.000 0.000 0.000 0.000 0.000 0.155
ACP Pacific MedHigh 0.000 0.000 0.000 0.000 0.000 0.000 0.000 0.000 0.000 0.001 0.000 0.000 0.000 0.000 0.000 0.000 0.000 0.000 0.000 0.000 0.000 0.000 0.000 0.000 0.000 0.000 0.000 0.000 0.000 0.000 0.001 0.000 0.155
ACP Pacific Medium-Low 0.000 0.000 0.000 0.000 0.000 0.000 0.000 0.000 0.000 0.000 0.000 0.000 0.000 0.000 0.000 0.000 0.000 0.000 0.000 0.000 0.000 0.000 0.000 0.000 0.000 0.000 0.000 0.000 0.000 0.000 0.000 0.000 0.155
EURMED High 0.015 0.002 0.005 0.003 0.009 0.002 0.005 0.005 0.016 0.007 0.002 0.007 0.002 0.001 0.003 0.005 0.002 0.002 0.000 0.090 0.004 0.012 -0.001 0.013 0.022 0.006 0.003 0.003 0.009 -0.001 0.090 0.009 0.188
EURMED MedHigh 0.002 0.003 0.004 0.003 0.001 0.000 0.008 0.006 0.005 0.012 0.003 0.006 0.002 0.001 0.011 0.002 0.001 0.001 -0.003 0.060 0.007 0.005 0.002 0.045 0.012 0.005 0.002 0.001 0.014 -0.003 0.060 0.008 0.188
EURMED Medium-Low 0.005 0.002 0.005 0.003 0.001 0.003 0.002 0.005 0.005 0.005 0.002 0.006 0.003 0.009 0.005 0.002 0.002 0.002 0.001 0.078 0.006 0.008 0.000 0.023 0.016 0.004 0.008 0.004 0.018 0.000 0.078 0.008 0.188
Middle East High 0.006 0.006 0.008 0.004 0.029 0.009 0.003 0.003 0.014 0.011 0.021 0.020 0.002 0.002 0.007 0.006 0.002 0.003 0.007 0.018 0.016 0.023 0.003 0.002 0.047 0.000 0.001 0.000 0.003 0.000 0.047 0.010 0.164
Middle East MedHigh 0.005 0.003 0.006 0.001 0.001 0.015 0.010 0.004 0.007 0.003 0.003 0.017 0.011 0.000 0.001 0.001 0.003 0.005 0.006 0.007 0.008 0.001 0.003 0.001 0.000 0.000 0.000 0.001 0.000 0.000 0.017 0.004 0.164
Middle East Medium-Low 0.004 0.003 0.008 0.008 0.001 0.019 0.006 0.002 0.005 0.003 0.004 0.015 0.001 0.000 0.004 0.002 0.002 0.000 0.002 0.002 0.027 0.007 0.001 -0.002 0.014 0.000 0.000 0.001 0.003 -0.002 0.027 0.005 0.164
Oceania High 0.015 0.006 0.019 0.025 0.014 0.014 0.016 0.003 0.018 0.013 0.032 0.023 0.003 0.001 0.004 0.018 0.004 0.001 0.008 0.003 0.017 0.005 0.002 0.002 0.007 0.003 0.000 0.004 0.001 0.000 0.032 0.010 0.391
Oceania MedHigh 0.010 0.008 0.010 0.013 0.006 0.010 0.004 0.002 0.017 0.003 0.020 0.026 0.002 0.002 0.003 0.016 0.004 0.004 0.007 0.009 0.010 0.010 0.002 0.001 0.001 0.001 0.000 0.002 0.001 0.000 0.026 0.007 0.391
Oceania Medium-Low 0.006 0.004 0.014 0.014 0.006 0.008 0.002 0.003 0.017 0.016 0.034 0.031 0.005 0.002 0.002 0.012 0.002 0.001 0.003 0.008 0.007 0.003 0.002 0.002 0.003 0.063 0.002 0.001 0.001 0.001 0.063 0.009 0.391
Country Group 1 Country Group 2 Country Group 3 Country Group 4
Partner Countries
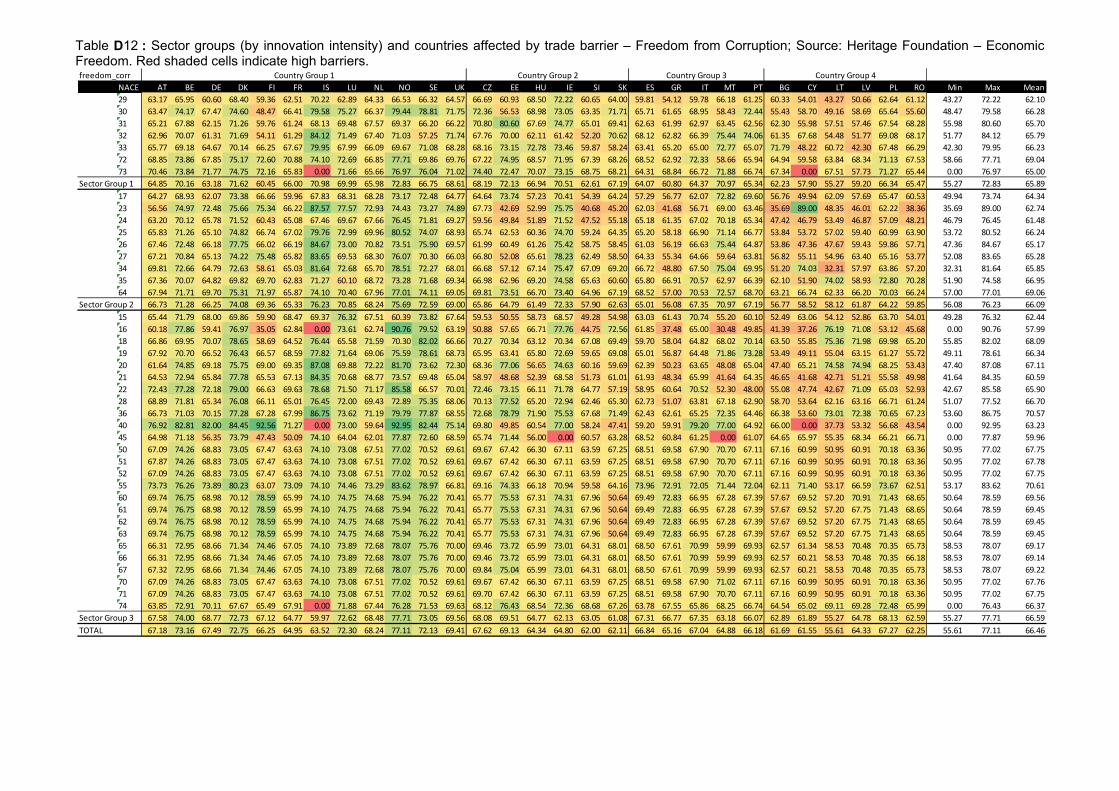
Table D12 : Sector groups (by innovation intensity) and countries affected by trade barrier – Freedom from Corruption; Source: Heritage Foundation – Economic Freedom. Red shaded cells indicate high barriers.
freedom_corr
NACE AT BE DE DK FI FR IS LU NL NO SE UK CZ EE HU IE SI SK ES GR IT MT PT BG CY LT LV PL RO Min Max Mean
29 63.17 65.95 60.60 68.40 59.36 62.51 70.22 62.89 64.33 66.53 66.32 64.57 66.69 60.93 68.50 72.22 60.65 64.00 59.81 54.12 59.78 66.18 61.25 60.33 54.01 43.27 50.66 62.64 61.12 43.27 72.22 62.10
30 63.47 74.17 67.47 74.60 48.47 66.41 79.58 75.27 66.37 79.44 78.81 71.75 72.36 56.53 68.98 73.05 63.35 71.71 65.71 61.65 68.95 58.43 72.44 55.43 58.70 49.16 58.69 65.64 55.60 48.47 79.58 66.28
31 65.21 67.88 62.15 71.26 59.76 61.24 68.13 69.48 67.57 69.37 66.20 66.22 70.80 80.60 67.69 74.77 65.01 69.41 62.63 61.99 62.97 63.45 62.56 62.30 55.98 57.51 57.46 67.54 68.28 55.98 80.60 65.70
32 62.96 70.07 61.31 71.69 54.11 61.29 84.12 71.49 67.40 71.03 57.25 71.74 67.76 70.00 62.11 61.42 52.20 70.62 68.12 62.82 66.39 75.44 74.06 61.35 67.68 54.48 51.77 69.08 68.17 51.77 84.12 65.79
33 65.77 69.18 64.67 70.14 66.25 67.67 79.95 67.99 66.09 69.67 71.08 68.28 68.16 73.15 72.78 73.46 59.87 58.24 63.41 65.20 65.00 72.77 65.07 71.79 48.22 60.72 42.30 67.48 66.29 42.30 79.95 66.23
72 68.85 73.86 67.85 75.17 72.60 70.88 74.10 72.69 66.85 77.71 69.86 69.76 67.22 74.95 68.57 71.95 67.39 68.26 68.52 62.92 72.33 58.66 65.94 64.94 59.58 63.84 68.34 71.13 67.53 58.66 77.71 69.04
73 70.46 73.84 71.77 74.75 72.16 65.83 0.00 71.66 65.66 76.97 76.04 71.02 74.40 72.47 70.07 73.15 68.75 68.21 64.31 68.84 66.72 71.88 66.74 67.34 0.00 67.51 57.73 71.27 65.44 0.00 76.97 65.00
Sector Group 1 64.85 70.16 63.18 71.62 60.45 66.00 70.98 69.99 65.98 72.83 66.75 68.61 68.19 72.13 66.94 70.51 62.61 67.19 64.07 60.80 64.37 70.97 65.34 62.23 57.90 55.27 59.20 66.34 65.47 55.27 72.83 65.89
17 64.27 68.93 62.07 73.38 66.66 59.96 67.83 68.31 68.28 73.17 72.48 64.77 64.64 73.74 57.23 70.41 54.39 64.24 57.29 56.77 62.07 72.82 69.60 56.76 49.94 62.09 57.69 65.47 60.53 49.94 73.74 64.34
23 56.56 74.97 72.48 75.66 75.34 66.22 87.57 77.57 72.93 74.43 73.27 74.89 67.73 42.69 52.99 75.75 40.68 45.20 62.03 41.68 56.71 69.00 63.46 35.69 89.00 48.35 46.01 62.22 38.36 35.69 89.00 62.74
24 63.20 70.12 65.78 71.52 60.43 65.08 67.46 69.67 67.66 76.45 71.81 69.27 59.56 49.84 51.89 71.52 47.52 55.18 65.18 61.35 67.02 70.18 65.34 47.42 46.79 53.49 46.87 57.09 48.21 46.79 76.45 61.48
25 65.83 71.26 65.10 74.82 66.74 67.02 79.76 72.99 69.96 80.52 74.07 68.93 65.74 62.53 60.36 74.70 59.24 64.35 65.20 58.18 66.90 71.14 66.77 53.84 53.72 57.02 59.40 60.99 63.90 53.72 80.52 66.24
26 67.46 72.48 66.18 77.75 66.02 66.19 84.67 73.00 70.82 73.51 75.90 69.57 61.99 60.49 61.26 75.42 58.75 58.45 61.03 56.19 66.63 75.44 64.87 53.86 47.36 47.67 59.43 59.86 57.71 47.36 84.67 65.17
27 67.21 70.84 65.13 74.22 75.48 65.82 83.65 69.53 68.30 76.07 70.30 66.03 66.80 52.08 65.61 78.23 62.49 58.50 64.33 55.34 64.66 59.64 63.81 56.82 55.11 54.96 63.40 65.16 53.77 52.08 83.65 65.28
34 69.81 72.66 64.79 72.63 58.61 65.03 81.64 72.68 65.70 78.51 72.27 68.01 66.68 57.12 67.14 75.47 67.09 69.20 66.72 48.80 67.50 75.04 69.95 51.20 74.03 32.31 57.97 63.86 57.20 32.31 81.64 65.85
35 67.36 70.07 64.82 69.82 69.70 62.83 71.27 60.10 68.72 73.28 71.68 69.34 66.98 62.96 69.20 74.58 65.63 60.60 65.80 66.91 70.57 62.97 66.39 62.10 51.90 74.02 58.93 72.80 70.28 51.90 74.58 66.95
64 67.94 71.71 69.70 75.31 71.97 65.87 74.10 70.40 67.96 77.01 74.11 69.05 69.81 73.51 66.70 73.40 64.96 67.19 68.52 57.00 70.53 72.57 68.70 63.21 66.74 62.33 66.20 70.03 66.24 57.00 77.01 69.06
Sector Group 2 66.73 71.28 66.25 74.08 69.36 65.33 76.23 70.85 68.24 75.69 72.59 69.00 65.86 64.79 61.49 72.33 57.90 62.63 65.01 56.08 67.35 70.97 67.19 56.77 58.52 58.12 61.87 64.22 59.85 56.08 76.23 66.09
15 65.44 71.79 68.00 69.86 59.90 68.47 69.37 76.32 67.51 60.39 73.82 67.64 59.53 50.55 58.73 68.57 49.28 54.98 63.03 61.43 70.74 55.20 60.10 52.49 63.06 54.12 52.86 63.70 54.01 49.28 76.32 62.44
16 60.18 77.86 59.41 76.97 35.05 62.84 0.00 73.61 62.74 90.76 79.52 63.19 50.88 57.65 66.71 77.76 44.75 72.56 61.85 37.48 65.00 30.48 49.85 41.39 37.26 76.19 71.08 53.12 45.68 0.00 90.76 57.99
18 66.86 69.95 70.07 78.65 58.69 64.52 76.44 65.58 71.59 70.30 82.02 66.66 70.27 70.34 63.12 70.34 67.08 69.49 59.70 58.04 64.82 68.02 70.14 63.50 55.85 75.36 71.98 69.98 65.20 55.85 82.02 68.09
19 67.92 70.70 66.52 76.43 66.57 68.59 77.82 71.64 69.06 75.59 78.61 68.73 65.95 63.41 65.80 72.69 59.65 69.08 65.01 56.87 64.48 71.86 73.28 53.49 49.11 55.04 63.15 61.27 55.72 49.11 78.61 66.34
20 61.64 74.85 69.18 75.75 69.00 69.35 87.08 69.88 72.22 81.70 73.62 72.30 68.36 77.06 56.65 74.63 60.16 59.69 62.39 50.23 63.65 48.08 65.04 47.40 65.21 74.58 74.94 68.25 53.43 47.40 87.08 67.11
21 64.53 72.94 65.84 77.78 65.53 67.13 84.35 70.68 68.77 73.57 69.48 65.04 58.97 48.68 52.39 68.58 51.73 61.01 61.93 48.34 65.99 41.64 64.35 46.65 41.68 42.71 51.21 55.58 49.98 41.64 84.35 60.59
22 72.43 77.28 72.18 79.00 66.63 69.63 78.68 71.50 71.17 85.58 66.57 70.01 72.46 73.15 66.11 71.78 64.77 57.19 58.95 60.64 70.52 52.30 48.00 55.08 47.74 42.67 71.09 65.03 52.93 42.67 85.58 65.90
28 68.89 71.81 65.34 76.08 66.11 65.01 76.45 72.00 69.43 72.89 75.35 68.06 70.13 77.52 65.20 72.94 62.46 65.30 62.73 51.07 63.81 67.18 62.90 58.70 53.64 62.16 63.16 66.71 61.24 51.07 77.52 66.70
36 66.73 71.03 70.15 77.28 67.28 67.99 86.75 73.62 71.19 79.79 77.87 68.55 72.68 78.79 71.90 75.53 67.68 71.49 62.43 62.61 65.25 72.35 64.46 66.38 53.60 73.01 72.38 70.65 67.23 53.60 86.75 70.57
40 76.92 82.81 82.00 84.45 92.56 71.27 0.00 73.00 59.64 92.95 82.44 75.14 69.80 49.85 60.54 77.00 58.24 47.41 59.20 59.91 79.20 77.00 64.92 66.00 0.00 37.73 53.32 56.68 43.54 0.00 92.95 63.23
45 64.98 71.18 56.35 73.79 47.43 50.09 74.10 64.04 62.01 77.87 72.60 68.59 65.74 71.44 56.00 0.00 60.57 63.28 68.52 60.84 61.25 0.00 61.07 64.65 65.97 55.35 68.34 66.21 66.71 0.00 77.87 59.96
50 67.09 74.26 68.83 73.05 67.47 63.63 74.10 73.08 67.51 77.02 70.52 69.61 69.67 67.42 66.30 67.11 63.59 67.25 68.51 69.58 67.90 70.70 67.11 67.16 60.99 50.95 60.91 70.18 63.36 50.95 77.02 67.75
51 67.87 74.26 68.83 73.05 67.47 63.63 74.10 73.08 67.51 77.02 70.52 69.61 69.67 67.42 66.30 67.11 63.59 67.25 68.51 69.58 67.90 70.70 67.11 67.16 60.99 50.95 60.91 70.18 63.36 50.95 77.02 67.78
52 67.09 74.26 68.83 73.05 67.47 63.63 74.10 73.08 67.51 77.02 70.52 69.61 69.67 67.42 66.30 67.11 63.59 67.25 68.51 69.58 67.90 70.70 67.11 67.16 60.99 50.95 60.91 70.18 63.36 50.95 77.02 67.75
55 73.73 76.26 73.89 80.23 63.07 73.09 74.10 74.46 73.29 83.62 78.97 66.81 69.16 74.33 66.18 70.94 59.58 64.16 73.96 72.91 72.05 71.44 72.04 62.11 71.40 53.17 66.59 73.67 62.51 53.17 83.62 70.61
60 69.74 76.75 68.98 70.12 78.59 65.99 74.10 74.75 74.68 75.94 76.22 70.41 65.77 75.53 67.31 74.31 67.96 50.64 69.49 72.83 66.95 67.28 67.39 57.67 69.52 57.20 70.91 71.43 68.65 50.64 78.59 69.56
61 69.74 76.75 68.98 70.12 78.59 65.99 74.10 74.75 74.68 75.94 76.22 70.41 65.77 75.53 67.31 74.31 67.96 50.64 69.49 72.83 66.95 67.28 67.39 57.67 69.52 57.20 67.75 71.43 68.65 50.64 78.59 69.45
62 69.74 76.75 68.98 70.12 78.59 65.99 74.10 74.75 74.68 75.94 76.22 70.41 65.77 75.53 67.31 74.31 67.96 50.64 69.49 72.83 66.95 67.28 67.39 57.67 69.52 57.20 67.75 71.43 68.65 50.64 78.59 69.45
63 69.74 76.75 68.98 70.12 78.59 65.99 74.10 74.75 74.68 75.94 76.22 70.41 65.77 75.53 67.31 74.31 67.96 50.64 69.49 72.83 66.95 67.28 67.39 57.67 69.52 57.20 67.75 71.43 68.65 50.64 78.59 69.45
65 66.31 72.95 68.66 71.34 74.46 67.05 74.10 73.89 72.68 78.07 75.76 70.00 69.46 73.72 65.99 73.01 64.31 68.01 68.50 67.61 70.99 59.99 69.93 62.57 61.34 58.53 70.48 70.35 65.73 58.53 78.07 69.17
66 66.31 72.95 68.66 71.34 74.46 67.05 74.10 73.89 72.68 78.07 75.76 70.00 69.46 73.72 65.99 73.01 64.31 68.01 68.50 67.61 70.99 59.99 69.93 62.57 60.21 58.53 70.48 70.35 66.18 58.53 78.07 69.14
67 67.32 72.95 68.66 71.34 74.46 67.05 74.10 73.89 72.68 78.07 75.76 70.00 69.84 75.04 65.99 73.01 64.31 68.01 68.50 67.61 70.99 59.99 69.93 62.57 60.21 58.53 70.48 70.35 65.73 58.53 78.07 69.22
70 67.09 74.26 68.83 73.05 67.47 63.63 74.10 73.08 67.51 77.02 70.52 69.61 69.67 67.42 66.30 67.11 63.59 67.25 68.51 69.58 67.90 71.02 67.11 67.16 60.99 50.95 60.91 70.18 63.36 50.95 77.02 67.76
71 67.09 74.26 68.83 73.05 67.47 63.63 74.10 73.08 67.51 77.02 70.52 69.61 69.70 67.42 66.30 67.11 63.59 67.25 68.51 69.58 67.90 70.70 67.11 67.16 60.99 50.95 60.91 70.18 63.36 50.95 77.02 67.75
74 63.85 72.91 70.11 67.67 65.49 67.91 0.00 71.88 67.44 76.28 71.53 69.63 68.12 76.43 68.54 72.36 68.68 67.26 63.78 67.55 65.86 68.25 66.74 64.54 65.02 69.11 69.28 72.48 65.99 0.00 76.43 66.37
Sector Group 3 67.58 74.00 68.77 72.73 67.12 64.77 59.97 72.62 68.48 77.71 73.05 69.56 68.08 69.51 64.77 62.13 63.05 61.08 67.31 66.77 67.35 63.18 66.07 62.89 61.89 55.27 64.78 68.13 62.59 55.27 77.71 66.59
TOTAL 67.18 73.16 67.49 72.75 66.25 64.95 63.52 72.30 68.24 77.11 72.13 69.41 67.62 69.13 64.34 64.80 62.00 62.11 66.84 65.16 67.04 64.88 66.18 61.69 61.55 55.61 64.33 67.27 62.25 55.61 77.11 66.46
Country Group 3 Country Group 4Country Group 2Country Group 1
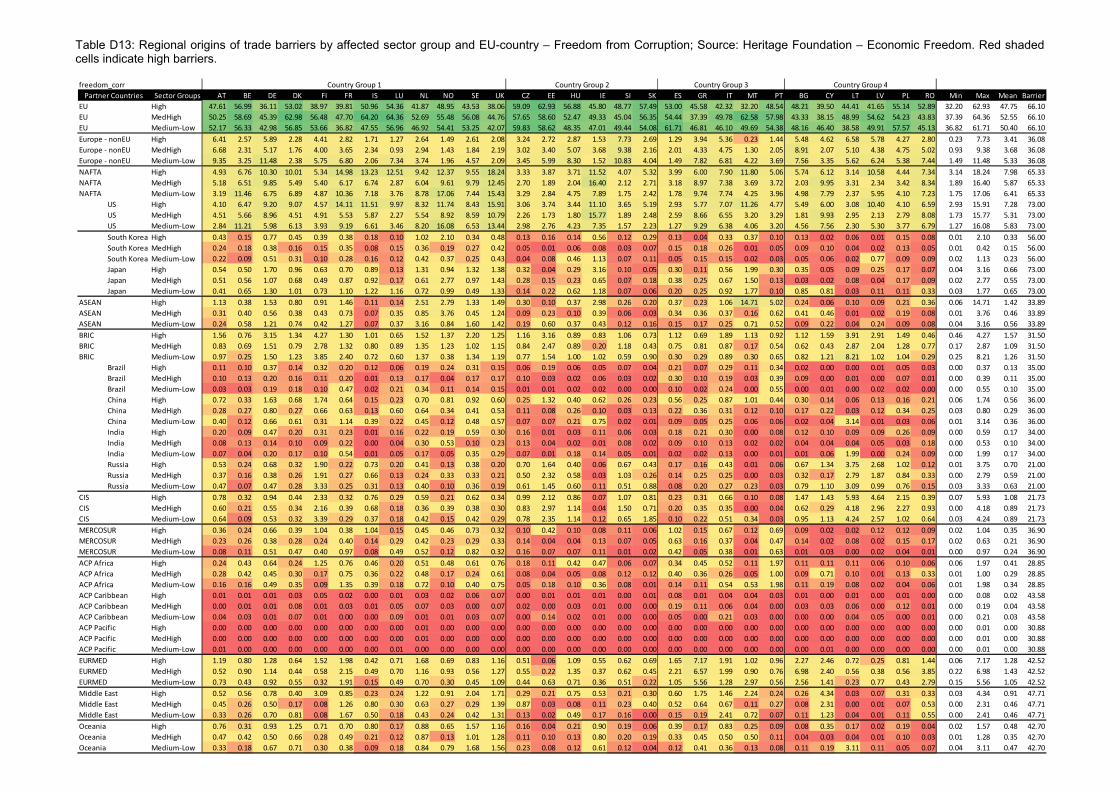
Table D13: Regional origins of trade barriers by affected sector group and EU-country – Freedom from Corruption; Source: Heritage Foundation – Economic Freedom. Red shaded cells indicate high barriers.
freedom_corr
Sector Groups AT BE DE DK FI FR IS LU NL NO SE UK CZ EE HU IE SI SK ES GR IT MT PT BG CY LT LV PL RO Min Max Mean Barrier
EU High 47.61 56.99 36.11 53.02 38.97 39.81 50.96 54.36 41.87 48.95 43.53 38.06 59.09 62.93 56.88 45.80 48.77 57.49 53.00 45.58 42.32 32.20 48.54 48.21 39.50 44.41 41.65 55.14 52.89 32.20 62.93 47.75 66.10
EU MedHigh 50.25 58.69 45.39 62.98 56.48 47.70 64.20 64.36 52.69 55.48 56.08 44.76 57.65 58.60 52.47 49.33 45.04 56.35 54.44 37.39 49.78 62.58 57.98 43.33 38.15 48.99 54.62 54.23 43.83 37.39 64.36 52.55 66.10
EU Medium-Low 52.17 56.33 42.98 56.85 53.66 36.82 47.55 56.96 46.92 54.41 53.25 42.07 59.83 58.62 48.35 47.01 49.44 54.08 61.71 46.81 46.10 49.69 54.38 48.16 46.40 38.58 49.91 57.57 45.13 36.82 61.71 50.40 66.10
Europe - nonEU High 6.41 2.57 5.89 2.28 4.41 2.82 1.71 1.27 2.64 1.49 2.61 2.08 3.24 2.72 2.87 1.53 7.73 2.69 1.29 3.94 5.36 0.23 1.44 5.48 4.62 6.58 5.78 4.27 2.80 0.23 7.73 3.41 36.08
Europe - nonEU MedHigh 6.68 2.31 5.17 1.76 4.00 3.65 2.34 0.93 2.94 1.43 1.84 2.19 3.02 3.40 5.07 3.68 9.38 2.16 2.01 4.33 4.75 1.30 2.05 8.91 2.07 5.10 4.38 4.75 5.02 0.93 9.38 3.68 36.08
Europe - nonEU Medium-Low 9.35 3.25 11.48 2.38 5.75 6.80 2.06 7.34 3.74 1.96 4.57 2.09 3.45 5.99 8.30 1.52 10.83 4.04 1.49 7.82 6.81 4.22 3.69 7.56 3.35 5.62 6.24 5.38 7.44 1.49 11.48 5.33 36.08
NAFTA High 4.93 6.76 10.30 10.01 5.34 14.98 13.23 12.51 9.42 12.37 9.55 18.24 3.33 3.87 3.71 11.52 4.07 5.32 3.99 6.00 7.90 11.80 5.06 5.74 6.12 3.14 10.58 4.44 7.34 3.14 18.24 7.98 65.33
NAFTA MedHigh 5.18 6.51 9.85 5.49 5.40 6.17 6.74 2.87 6.04 9.61 9.79 12.45 2.70 1.89 2.04 16.40 2.12 2.71 3.18 8.97 7.38 3.69 3.72 2.03 9.95 3.31 2.34 3.42 8.34 1.89 16.40 5.87 65.33
NAFTA Medium-Low 3.19 11.46 6.75 6.89 4.87 10.36 7.18 3.76 8.78 17.06 7.44 15.43 3.29 2.84 4.75 7.89 1.75 2.42 1.78 9.74 7.74 4.25 3.96 4.98 7.79 2.37 5.95 4.10 7.23 1.75 17.06 6.41 65.33
US High 4.10 6.47 9.20 9.07 4.57 14.11 11.51 9.97 8.32 11.74 8.43 15.91 3.06 3.74 3.44 11.10 3.65 5.19 2.93 5.77 7.07 11.26 4.77 5.49 6.00 3.08 10.40 4.10 6.59 2.93 15.91 7.28 73.00
US MedHigh 4.51 5.66 8.96 4.51 4.91 5.53 5.87 2.27 5.54 8.92 8.59 10.79 2.26 1.73 1.80 15.77 1.89 2.48 2.59 8.66 6.55 3.20 3.29 1.81 9.93 2.95 2.13 2.79 8.08 1.73 15.77 5.31 73.00
US Medium-Low 2.84 11.21 5.98 6.13 3.93 9.19 6.61 3.46 8.20 16.08 6.53 13.44 2.98 2.76 4.23 7.35 1.57 2.23 1.27 9.29 6.38 4.06 3.20 4.56 7.56 2.30 5.30 3.77 6.79 1.27 16.08 5.83 73.00
South Korea High 0.43 0.15 0.77 0.45 0.39 0.38 0.18 0.10 1.02 2.10 0.34 0.48 0.13 0.16 0.14 0.56 0.12 0.29 0.13 0.04 0.33 0.37 0.10 0.13 0.02 0.06 0.01 0.15 0.08 0.01 2.10 0.33 56.00
South Korea MedHigh 0.24 0.18 0.38 0.16 0.15 0.35 0.08 0.15 0.36 0.19 0.27 0.42 0.05 0.01 0.06 0.08 0.03 0.07 0.15 0.18 0.26 0.01 0.05 0.09 0.10 0.04 0.02 0.13 0.05 0.01 0.42 0.15 56.00
South Korea Medium-Low 0.22 0.09 0.51 0.31 0.10 0.28 0.16 0.12 0.42 0.37 0.25 0.43 0.04 0.08 0.46 1.13 0.07 0.11 0.05 0.15 0.15 0.02 0.03 0.05 0.06 0.02 0.77 0.09 0.09 0.02 1.13 0.23 56.00
Japan High 0.54 0.50 1.70 0.96 0.63 0.70 0.89 0.13 1.31 0.94 1.32 1.38 0.32 0.04 0.29 3.16 0.10 0.05 0.30 0.11 0.56 1.99 0.30 0.35 0.05 0.09 0.25 0.17 0.07 0.04 3.16 0.66 73.00
Japan MedHigh 0.51 0.56 1.07 0.68 0.49 0.87 0.92 0.17 0.61 2.77 0.97 1.43 0.28 0.15 0.23 0.65 0.07 0.18 0.38 0.25 0.67 1.50 0.13 0.03 0.02 0.08 0.04 0.17 0.09 0.02 2.77 0.55 73.00
Japan Medium-Low 0.41 0.65 1.30 1.01 0.73 1.10 1.22 1.16 0.72 0.99 0.49 1.33 0.14 0.22 0.62 1.18 0.07 0.06 0.20 0.25 0.92 1.77 0.10 0.85 0.81 0.03 0.11 0.11 0.33 0.03 1.77 0.65 73.00
ASEAN High 1.13 0.38 1.53 0.80 0.91 1.46 0.11 0.14 2.51 2.79 1.33 1.49 0.30 0.10 0.37 2.98 0.26 0.20 0.37 0.23 1.06 14.71 5.02 0.24 0.06 0.10 0.09 0.21 0.36 0.06 14.71 1.42 33.89
ASEAN MedHigh 0.31 0.40 0.56 0.38 0.43 0.73 0.07 0.35 0.85 3.76 0.45 1.24 0.09 0.23 0.10 0.39 0.06 0.03 0.34 0.36 0.37 0.16 0.62 0.41 0.46 0.01 0.02 0.19 0.08 0.01 3.76 0.46 33.89
ASEAN Medium-Low 0.24 0.58 1.21 0.74 0.42 1.27 0.07 0.37 3.16 0.84 1.60 1.42 0.19 0.60 0.37 0.43 0.12 0.16 0.15 0.17 0.25 0.71 0.52 0.09 0.22 0.04 0.24 0.09 0.08 0.04 3.16 0.56 33.89
BRIC High 1.56 0.76 3.15 1.34 4.27 1.30 1.01 0.65 1.52 1.37 2.20 1.25 1.16 3.16 0.89 0.83 1.06 0.73 1.12 0.69 1.89 1.13 0.92 1.12 1.59 3.91 2.91 1.49 0.46 0.46 4.27 1.57 31.50
BRIC MedHigh 0.83 0.69 1.51 0.79 2.78 1.32 0.80 0.89 1.35 1.23 1.02 1.15 0.84 2.47 0.89 0.20 1.18 0.43 0.75 0.81 0.87 0.17 0.54 0.62 0.43 2.87 2.04 1.28 0.77 0.17 2.87 1.09 31.50
BRIC Medium-Low 0.97 0.25 1.50 1.23 3.85 2.40 0.72 0.60 1.37 0.38 1.34 1.19 0.77 1.54 1.00 1.02 0.59 0.90 0.30 0.29 0.89 0.30 0.65 0.82 1.21 8.21 1.02 1.04 0.29 0.25 8.21 1.26 31.50
Brazil High 0.11 0.10 0.37 0.14 0.32 0.20 0.12 0.06 0.19 0.24 0.31 0.15 0.06 0.19 0.06 0.05 0.07 0.04 0.21 0.07 0.29 0.11 0.34 0.02 0.00 0.00 0.01 0.05 0.03 0.00 0.37 0.13 35.00
Brazil MedHigh 0.10 0.13 0.20 0.16 0.11 0.20 0.01 0.13 0.17 0.04 0.17 0.17 0.10 0.03 0.02 0.06 0.03 0.02 0.30 0.10 0.19 0.03 0.39 0.09 0.00 0.01 0.00 0.07 0.01 0.00 0.39 0.11 35.00
Brazil Medium-Low 0.03 0.03 0.19 0.18 0.10 0.47 0.02 0.21 0.34 0.11 0.14 0.15 0.01 0.01 0.02 0.02 0.00 0.00 0.10 0.02 0.24 0.00 0.55 0.00 0.01 0.00 0.02 0.02 0.00 0.00 0.55 0.10 35.00
China High 0.72 0.33 1.63 0.68 1.74 0.64 0.15 0.23 0.70 0.81 0.92 0.60 0.25 1.32 0.40 0.62 0.26 0.23 0.56 0.25 0.87 1.01 0.44 0.30 0.14 0.06 0.13 0.16 0.21 0.06 1.74 0.56 36.00
China MedHigh 0.28 0.27 0.80 0.27 0.66 0.63 0.13 0.60 0.64 0.34 0.41 0.53 0.11 0.08 0.26 0.10 0.03 0.13 0.22 0.36 0.31 0.12 0.10 0.17 0.22 0.03 0.12 0.34 0.25 0.03 0.80 0.29 36.00
China Medium-Low 0.40 0.12 0.66 0.61 0.31 1.14 0.39 0.22 0.45 0.12 0.48 0.57 0.07 0.07 0.21 0.75 0.02 0.01 0.09 0.05 0.25 0.06 0.06 0.02 0.04 3.14 0.01 0.03 0.06 0.01 3.14 0.36 36.00
India High 0.20 0.09 0.47 0.20 0.31 0.23 0.01 0.16 0.22 0.19 0.59 0.30 0.16 0.01 0.03 0.11 0.06 0.03 0.18 0.21 0.30 0.00 0.08 0.12 0.10 0.09 0.09 0.26 0.09 0.00 0.59 0.17 34.00
India MedHigh 0.08 0.13 0.14 0.10 0.09 0.22 0.00 0.04 0.30 0.53 0.10 0.23 0.13 0.04 0.02 0.01 0.08 0.02 0.09 0.10 0.13 0.02 0.02 0.04 0.04 0.04 0.05 0.03 0.18 0.00 0.53 0.10 34.00
India Medium-Low 0.07 0.04 0.20 0.17 0.10 0.54 0.01 0.05 0.17 0.05 0.35 0.29 0.07 0.01 0.18 0.14 0.05 0.01 0.02 0.02 0.13 0.00 0.01 0.01 0.06 1.99 0.00 0.24 0.09 0.00 1.99 0.17 34.00
Russia High 0.53 0.24 0.68 0.32 1.90 0.22 0.73 0.20 0.41 0.13 0.38 0.20 0.70 1.64 0.40 0.06 0.67 0.43 0.17 0.16 0.43 0.01 0.06 0.67 1.34 3.75 2.68 1.02 0.12 0.01 3.75 0.70 21.00
Russia MedHigh 0.37 0.16 0.38 0.26 1.91 0.27 0.66 0.13 0.24 0.33 0.33 0.21 0.50 2.32 0.58 0.03 1.03 0.26 0.14 0.25 0.25 0.00 0.03 0.32 0.17 2.79 1.87 0.84 0.33 0.00 2.79 0.59 21.00
Russia Medium-Low 0.47 0.07 0.47 0.28 3.33 0.25 0.31 0.13 0.40 0.10 0.36 0.19 0.61 1.45 0.60 0.11 0.51 0.88 0.08 0.20 0.27 0.23 0.03 0.79 1.10 3.09 0.99 0.76 0.15 0.03 3.33 0.63 21.00
CIS High 0.78 0.32 0.94 0.44 2.33 0.32 0.76 0.29 0.59 0.21 0.62 0.34 0.99 2.12 0.86 0.07 1.07 0.81 0.23 0.31 0.66 0.10 0.08 1.47 1.43 5.93 4.64 2.15 0.39 0.07 5.93 1.08 21.73
CIS MedHigh 0.60 0.21 0.55 0.34 2.16 0.39 0.68 0.18 0.36 0.39 0.38 0.30 0.83 2.97 1.14 0.04 1.50 0.71 0.20 0.35 0.35 0.00 0.04 0.62 0.29 4.18 2.96 2.27 0.93 0.00 4.18 0.89 21.73
CIS Medium-Low 0.64 0.09 0.53 0.32 3.39 0.29 0.37 0.18 0.42 0.15 0.42 0.29 0.78 2.35 1.14 0.12 0.65 1.85 0.10 0.22 0.51 0.34 0.03 0.95 1.13 4.24 2.57 1.02 0.64 0.03 4.24 0.89 21.73
MERCOSUR High 0.36 0.24 0.66 0.39 1.04 0.38 1.04 0.15 0.45 0.46 0.73 0.32 0.10 0.42 0.10 0.08 0.11 0.06 1.02 0.15 0.67 0.12 0.69 0.09 0.02 0.02 0.12 0.12 0.09 0.02 1.04 0.35 36.90
MERCOSUR MedHigh 0.23 0.26 0.38 0.28 0.24 0.40 0.14 0.29 0.42 0.23 0.29 0.33 0.14 0.04 0.04 0.13 0.07 0.05 0.63 0.16 0.37 0.04 0.47 0.14 0.02 0.08 0.02 0.15 0.17 0.02 0.63 0.21 36.90
MERCOSUR Medium-Low 0.08 0.11 0.51 0.47 0.40 0.97 0.08 0.49 0.52 0.12 0.82 0.32 0.16 0.07 0.07 0.11 0.01 0.02 0.42 0.05 0.38 0.01 0.63 0.01 0.03 0.00 0.02 0.04 0.01 0.00 0.97 0.24 36.90
ACP Africa High 0.24 0.43 0.64 0.24 1.25 0.76 0.46 0.20 0.51 0.48 0.61 0.76 0.18 0.11 0.42 0.47 0.06 0.07 0.34 0.45 0.52 0.11 1.97 0.11 0.11 0.11 0.06 0.10 0.06 0.06 1.97 0.41 28.85
ACP Africa MedHigh 0.28 0.42 0.45 0.30 0.17 0.75 0.36 0.22 0.48 0.17 0.24 0.61 0.08 0.04 0.05 0.08 0.12 0.12 0.40 0.36 0.26 0.05 1.00 0.09 0.71 0.10 0.01 0.13 0.33 0.01 1.00 0.29 28.85
ACP Africa Medium-Low 0.16 0.16 0.49 0.35 0.09 1.35 0.39 0.18 0.72 0.10 0.40 0.75 0.05 0.18 0.10 0.36 0.08 0.01 0.14 0.11 0.54 0.53 1.98 0.11 0.19 0.08 0.02 0.04 0.06 0.01 1.98 0.34 28.85
ACP Caribbean High 0.01 0.01 0.01 0.03 0.05 0.02 0.00 0.01 0.03 0.02 0.06 0.07 0.00 0.01 0.01 0.01 0.00 0.01 0.08 0.01 0.04 0.04 0.03 0.01 0.00 0.01 0.00 0.01 0.00 0.00 0.08 0.02 43.58
ACP Caribbean MedHigh 0.00 0.01 0.01 0.08 0.01 0.03 0.01 0.05 0.07 0.03 0.00 0.07 0.02 0.00 0.03 0.01 0.00 0.00 0.19 0.11 0.06 0.04 0.00 0.03 0.03 0.06 0.00 0.12 0.01 0.00 0.19 0.04 43.58
ACP Caribbean Medium-Low 0.04 0.03 0.01 0.07 0.01 0.00 0.00 0.09 0.01 0.01 0.03 0.07 0.00 0.14 0.02 0.01 0.00 0.00 0.05 0.00 0.21 0.03 0.00 0.00 0.00 0.04 0.05 0.00 0.01 0.00 0.21 0.03 43.58
ACP Pacific High 0.00 0.00 0.00 0.00 0.00 0.00 0.00 0.00 0.01 0.00 0.00 0.00 0.00 0.00 0.00 0.00 0.00 0.00 0.00 0.00 0.00 0.00 0.00 0.00 0.00 0.00 0.00 0.00 0.00 0.00 0.01 0.00 30.88
ACP Pacific MedHigh 0.00 0.00 0.00 0.00 0.00 0.00 0.00 0.00 0.01 0.00 0.00 0.00 0.00 0.00 0.00 0.00 0.00 0.00 0.00 0.00 0.00 0.00 0.00 0.00 0.00 0.00 0.00 0.00 0.00 0.00 0.01 0.00 30.88
ACP Pacific Medium-Low 0.01 0.00 0.00 0.00 0.00 0.00 0.00 0.01 0.00 0.00 0.00 0.00 0.00 0.00 0.00 0.00 0.00 0.00 0.00 0.00 0.00 0.00 0.00 0.00 0.01 0.00 0.00 0.00 0.00 0.00 0.01 0.00 30.88
EURMED High 1.19 0.80 1.28 0.64 1.52 1.98 0.42 0.71 1.68 0.69 0.83 1.16 0.51 0.06 1.09 0.55 0.62 0.69 1.65 7.17 1.91 1.02 0.96 2.27 2.46 0.72 0.25 0.81 1.44 0.06 7.17 1.28 42.52
EURMED MedHigh 0.52 0.90 1.14 0.44 0.58 2.15 0.49 0.70 1.16 0.93 0.56 1.27 0.55 0.22 1.35 0.37 0.62 0.45 2.21 6.57 1.99 0.90 0.76 6.98 2.40 0.56 0.38 0.56 3.85 0.22 6.98 1.43 42.52
EURMED Medium-Low 0.73 0.43 0.92 0.55 0.32 1.91 0.15 0.49 0.70 0.30 0.45 1.09 0.44 0.63 0.71 0.36 0.51 0.22 1.05 5.56 1.28 2.97 0.56 2.56 1.41 0.23 0.77 0.43 2.79 0.15 5.56 1.05 42.52
Middle East High 0.52 0.56 0.78 0.40 3.09 0.85 0.23 0.24 1.22 0.91 2.04 1.71 0.29 0.21 0.75 0.53 0.21 0.30 0.60 1.75 1.46 2.24 0.24 0.26 4.34 0.03 0.07 0.31 0.33 0.03 4.34 0.91 47.71
Middle East MedHigh 0.45 0.26 0.50 0.17 0.08 1.26 0.80 0.30 0.63 0.27 0.29 1.39 0.87 0.03 0.08 0.11 0.23 0.40 0.52 0.64 0.67 0.11 0.27 0.08 2.31 0.00 0.01 0.07 0.53 0.00 2.31 0.46 47.71
Middle East Medium-Low 0.33 0.26 0.70 0.81 0.08 1.67 0.50 0.18 0.43 0.24 0.42 1.31 0.13 0.02 0.49 0.17 0.16 0.00 0.15 0.19 2.41 0.72 0.07 0.11 1.23 0.04 0.01 0.11 0.55 0.00 2.41 0.46 47.71
Oceania High 0.76 0.31 0.93 1.25 0.71 0.70 0.80 0.17 0.88 0.65 1.57 1.16 0.16 0.04 0.21 0.90 0.19 0.06 0.39 0.17 0.83 0.25 0.09 0.08 0.35 0.17 0.02 0.19 0.04 0.02 1.57 0.48 42.70
Oceania MedHigh 0.47 0.42 0.50 0.66 0.28 0.49 0.21 0.12 0.87 0.13 1.01 1.28 0.11 0.10 0.13 0.80 0.20 0.19 0.33 0.45 0.50 0.50 0.11 0.04 0.03 0.04 0.01 0.10 0.03 0.01 1.28 0.35 42.70
Oceania Medium-Low 0.33 0.18 0.67 0.71 0.30 0.38 0.09 0.18 0.84 0.79 1.68 1.56 0.23 0.08 0.12 0.61 0.12 0.04 0.12 0.41 0.36 0.13 0.08 0.11 0.19 3.11 0.11 0.05 0.07 0.04 3.11 0.47 42.70
Country Group 1 Country Group 2 Country Group 3 Country Group 4
Partner Countries