Nonlinear Effects in Stiffness Modeling of Robotic Manipulators
Upload
charite-deCategory
view
0download
0
INSTITUTE OF PHYSICS PUBLISHING PHYSICS IN MEDICINE AND BIOLOGY
Phys. Med. Biol. 51 (2006) 747–758 doi:10.1088/0031-9155/51/3/018
Derivation of elastic stiffness from site-matchedmineral density and acoustic impedance maps
Kay Raum1,2, Robin O Cleveland1,5, Francoise Peyrin3,4
and Pascal Laugier1
1 Laboratoire d’Imagerie Parametrique, CNRS/Universite Paris 6, UMR 762315,rue de l’Ecole de Medecine, 75006 Paris, France2 Q-BAM Group, Department of Orthopedics, Martin Luther University of Halle-Wittenberg,Magdeburger Straße 22, 06097 Halle, Germany3 CREATIS; CNRS, UMR 5515; INSERM, U630; INSA, 69621 Villeurbanne Cedex, France4 ESRF, BP 220, 38043 Grenoble Cedex, France5 Department of Aerospace and Mechanical Engineering, Boston University,110 Cummington Street, Boston, MA 02215, USA
E-mail: [email protected]
Received 23 June 2005, in final form 20 September 2005Published 19 January 2006Online at stacks.iop.org/PMB/51/747
Abstract200 MHz acoustic impedance maps and site-matched synchrotron radiationmicro computed tomography (SR-µCT) maps of tissue degree ofmineralization of bone (DMB) were used to derive the elastic coefficient c33
in cross sections of human cortical bone. To accomplish this goal, a modelwas developed to relate the DMB accessible with SR-µCT to mass density.The formulation incorporates the volume fractions and densities of the majorbone tissue components (collagen, mineral and water), and accounts for tissueporosity. We found that the mass density can be well modelled by a second-order polynomial fit to DMB (R2 = 0.999) and appears to be consistent withmeasurements of many different types of mineralized tissues. The derivedelastic coefficient c33 correlated more strongly with the acoustic impedance(R2 = 0.996) than with mass density (R2 = 0.310). This finding suggeststhat estimates of c33 made from measurements of the acoustic impedance aremore reliable than those made from density measurements. Mass density andelastic coefficient were in the range between 1.66 and 2.00 g cm−3 and 14.8 and75.4 GPa, respectively. Although SAM inspection is limited to the evaluation ofcarefully prepared sample surfaces, it provides a two-dimensional quantitativeestimate of elastic tissue properties at the tissue level.
1. Introduction
The stiffness of the bone is a fundamental property for the mechanical function of theskeleton (Currey 1999). Direct measurement of bone stiffness at the tissue level (i.e., at
0031-9155/06/030747+12$30.00 © 2006 IOP Publishing Ltd Printed in the UK 747

748 K Raum et al
a microscopic scale) is important to elucidate the relation between the intrinsic elasticity ofbone and its macroscopic biomechanical response (Hengsberger et al 2003, Silva et al 2004),microdamage (Zioupos and Currey 1998), ageing (Hoffler et al 2000), response to therapy(Turner et al 1996), or to describe bone phenotype in small animal models and geneticallymodified mice (Akhter et al 2004, Chen et al 2003, Hengsberger et al 2005). In addition, thegrowing capabilities for tissue-level computational stress analysis or for numerical simulationof ultrasound propagation in bone require an accurate knowledge of tissue stiffness and itsspatial distribution and anisotropy. However, material properties at the tissue-level are difficultto measure directly, and most biomechanical testing or ultrasound measurement methods arecarried out at a macroscopic scale. These measurements are not adequate to resolve bonemicroarchitecture, and therefore can only provide an estimate of bone elastic properties ata scale where they are determined by both the elastic coefficients of the matrix and by itsmicrostructure (e.g., porosity).
Several empirical or mathematical models have been developed to predict bone elasticityfrom the degree of mineralization (Hellmich et al 2004b, Burstein et al 1975, Pidapartiet al 1994, 1996) as the latter can be determined from radiographic measurements, e.g.dual energy x-ray absorptiometry (DEXA), quantitative computed tomography (QCT) andSR-µCT. Although numerous studies have shown that increasing mineralization results intissue stiffening, the principal relation between mineral density and tissue elasticity is notclear yet and, given the typical variation in density and elasticity in most materials, it islikely that mineralization will not be able to determine elasticity with sufficient accuracy.In particular information about tissue anisotropy cannot be obtained from the measurementof mass density. Local measurements of elasticity at a tissue-level require high resolutionmeasurement techniques such as nanoindentation or scanning acoustic microscopy (Turneret al 1999).
In contrast to nanoindentation scanning acoustic microscopy (SAM) is non-destructive,is not limited to spot measurements and can provide 2D images of the mechanical properties(Bumrerraj and Katz 2001). For example, SAM operated in a confocal pulse-echo regimeprovides a 2D surface map of the characteristic acoustic impedance Z with a resolutionvarying from 23 µm at 50 MHz (Raum et al 2004) to better than 2 µm at 900 MHz (Raumet al 2003). For frequency ranges above 25 MHz SAM provides sufficient spatial resolutionto differentiate between tissue and microstructural cavities (Raum et al 2004). It has beendemonstrated that Z reflects elastic anisotropy (Hofmann et al 2006, Raum et al 2004) andcorrelates well with Young’s modulus obtained by nanoindentation (Hofmann et al 2006). Ina companion paper (Raum et al 2006) we have shown that bone microstructure such as osteonsand interstitial tissue can be separated from canals and osteocyte lacunae on 200 MHz SAMimages. Consequently, using appropriate image processing tools to separate the solid matrixfrom voids, intrinsic tissue acoustical impedance, unaffected by bone microstructure, can bedetermined. Because the acoustic impedance is explicitly related to density and stiffness,measurements of Z can be used to derive tissue stiffness.
In this study the principal relations between acoustic impedance, mass and mineral densityand elastic stiffness coefficient are derived on the basis of site-matched maps of acousticimpedance Z and degree of mineralization of bone DMB obtained from 200 MHz SAM andSR-µCT measurements, respectively. The elastic coefficient c33 can be expressed explicitly interms of Z and mass density. Because density cannot be directly measured with micrometreresolution it was necessary to develop a model that related tissue DMB accessible withSR-µCT to microscopic tissue mass density. The model is based on the volume fractions ofthe major bone tissue components and was applied to SAM and SR-µCT measurements onhuman radius (Raum et al 2006).

Derivation of elastic stiffness from SAM and SR-µCT 749
2. Materials and methods
The sample population included 2 female and 8 male radius bones from human cadaver donors,of age between 68 and 90 (75.9 ± 6.8 years). From each radius a cross section was cut fromthe central part of the diaphysis. Ethical approval for collection of samples was granted bythe Human Ethics Committee of the Institute of Anatomy at the University Rene Descartes(Paris, France). The tissue donors or their legal guardians provided informed written consentto provide their tissues for investigation, in accord with legal clauses stated in the FrenchCode of Public Health (Code de la Sante Publique Francais). We employ two independentmeasurements (SAM and SR-µCT) to determine local elastic properties of the bone samples.SR-µCT measures the three-dimensional distribution of the tissue degree of mineralizationof bone DMB (Nuzzo et al 2002). SAM yields two-dimensional maps of the characteristicacoustic impedance Z (Raum et al 2003). Local estimates of both parameters were obtainedby spatial fusion of DMB and Z images using the image registration tools of Matlab 6.5 (TheMathworks Inc, Natick, MA, USA) and custom developed software. Further details on samplepreparation and measurements methods can be found in our companion paper (Raum et al2006).
2.1. Relation between acoustic and elastic properties
For an orthotropic material the relation between compressional sound velocity νP , mass densityρ and elastic stiffness coefficient is:
cii = ρ · ν2P i, (1)
where i is the direction of orthogonal symmetry (Briggs 1992). The characteristic acousticimpedance measured by the SAM can be expressed as Zi = ρνP i,and so the stiffness can bedetermined by
cii = Z2i
ρ. (2)
Therefore, it is possible to recover the elastic coefficients cii from the independent estimation ofmass density and the acoustic impedance Zi . We note that to obtain other elastic coefficients itis necessary to know additional parameters. For example, cortical bone tissue in the peripheralskeleton is usually assumed to have transverse isotropic material properties with equal Young’smoduli in the radial plane (1 and 2 axes) and a higher Young’s modulus in the longitudinaldirection (3 axis), that is, E1 = E2 < E3. With this assumption the Young’s modulus in thex3-direction is given by:
E3 = (1 + ν12) (1 − ν12 − 2ν13ν31)
1 − ν212
· c33, (3)
where ν12 is the Poisson’s ratio in the cross-sectional plane (x1x2−plane) and ν13 = ν23 andν31 = ν32 are the Poisson ratios in the longitudinal section (i.e., x1x3- and x1x2-) planes(Agarwal and Broutman 1990). Determining the Poisson ratios would require furtherindependent measurements. However, at the tissue level these quantities have not beenascertained yet. Therefore, an isotropic Poisson ratio νiso = 0.3 is usually assumed for thederivation of the Young’s modulus in bone (Rho et al 2002, Xu et al 2003, Zysset et al 1999).With this assumption equation (3) becomes
E3 = 0.7429c33. (4)
750 K Raum et al
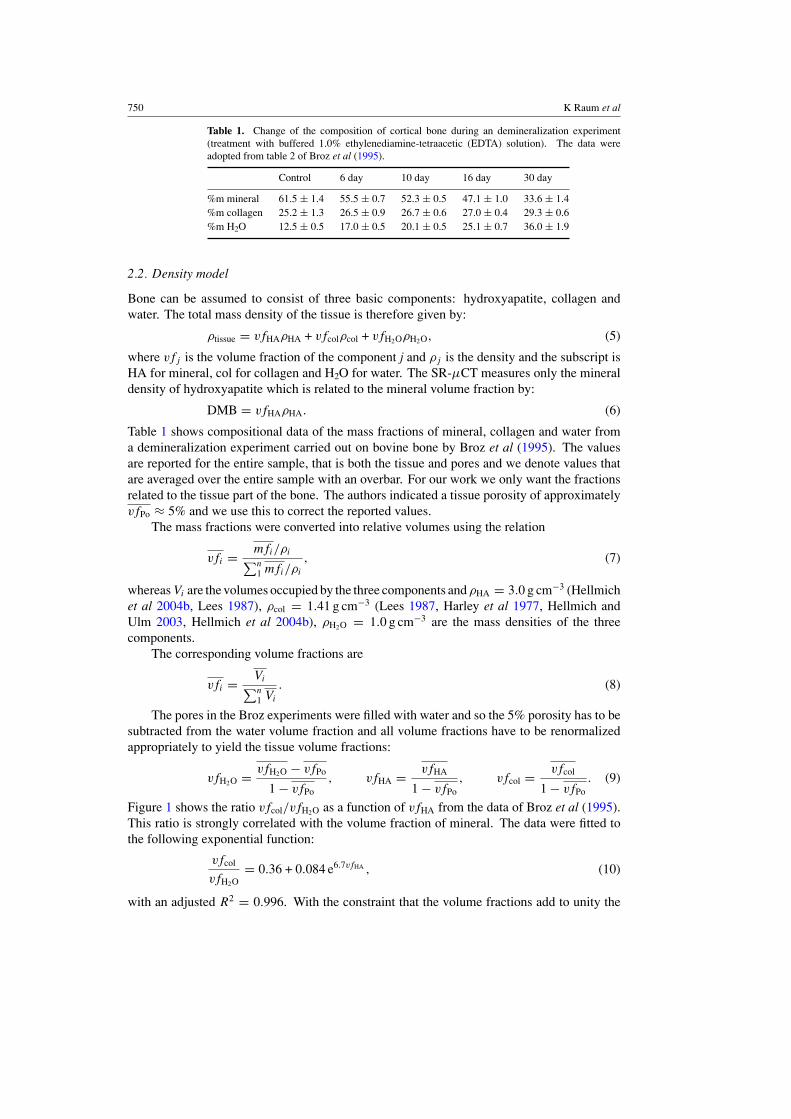
Table 1. Change of the composition of cortical bone during an demineralization experiment(treatment with buffered 1.0% ethylenediamine-tetraacetic (EDTA) solution). The data wereadopted from table 2 of Broz et al (1995).
Control 6 day 10 day 16 day 30 day
%m mineral 61.5 ± 1.4 55.5 ± 0.7 52.3 ± 0.5 47.1 ± 1.0 33.6 ± 1.4%m collagen 25.2 ± 1.3 26.5 ± 0.9 26.7 ± 0.6 27.0 ± 0.4 29.3 ± 0.6%m H2O 12.5 ± 0.5 17.0 ± 0.5 20.1 ± 0.5 25.1 ± 0.7 36.0 ± 1.9
2.2. Density model
Bone can be assumed to consist of three basic components: hydroxyapatite, collagen andwater. The total mass density of the tissue is therefore given by:
ρtissue = vfHAρHA + vfcolρcol + vfH2OρH2O, (5)
where vfj is the volume fraction of the component j and ρj is the density and the subscript isHA for mineral, col for collagen and H2O for water. The SR-µCT measures only the mineraldensity of hydroxyapatite which is related to the mineral volume fraction by:
DMB = vfHAρHA. (6)
Table 1 shows compositional data of the mass fractions of mineral, collagen and water froma demineralization experiment carried out on bovine bone by Broz et al (1995). The valuesare reported for the entire sample, that is both the tissue and pores and we denote values thatare averaged over the entire sample with an overbar. For our work we only want the fractionsrelated to the tissue part of the bone. The authors indicated a tissue porosity of approximatelyvfPo ≈ 5% and we use this to correct the reported values.
The mass fractions were converted into relative volumes using the relation
vfi = mfi/ρi∑n
1 mfi/ρi
, (7)
whereas Vi are the volumes occupied by the three components and ρHA = 3.0 g cm−3 (Hellmichet al 2004b, Lees 1987), ρcol = 1.41 g cm−3 (Lees 1987, Harley et al 1977, Hellmich andUlm 2003, Hellmich et al 2004b), ρH2O = 1.0 g cm−3 are the mass densities of the threecomponents.
The corresponding volume fractions are
vfi = Vi∑n
1 Vi
. (8)
The pores in the Broz experiments were filled with water and so the 5% porosity has to besubtracted from the water volume fraction and all volume fractions have to be renormalizedappropriately to yield the tissue volume fractions:
vfH2O = vfH2O − vfPo
1 − vfPo, vfHA = vfHA
1 − vfPo, vfcol = vfcol
1 − vfPo. (9)
Figure 1 shows the ratio vfcol/vfH2O as a function of vfHA from the data of Broz et al (1995).This ratio is strongly correlated with the volume fraction of mineral. The data were fitted tothe following exponential function:
vfcol
vfH2O= 0.36 + 0.084 e6.7vfHA , (10)
with an adjusted R2 = 0.996. With the constraint that the volume fractions add to unity the

Derivation of elastic stiffness from SAM and SR-µCT 751
0.5
Figure 1. Volume fraction ratio vfcol/vfH2O as a function of vfHA as derived from data publishedby Broz et al (1995). The data were fitted to an exponential function.
mfc
oll/H
2O
vfco
ll/H
2O
0.5
Figure 2. Mass and volume fractions of collagen and water as a function of mineralization withand without correction for tissue porosity.
individual volume fractions are derived from the measurement of DMB:
vfH2O = (1 − vfHA)(
vfcol
vfH2O+ 1
) , (11)
vfcol = 1 − (vfHA + vfH2O). (12)
The data imply that for any given vfHA the volume fractions of collagen and water canbe determined. In figure 2 the mass and volume fractions of collagen and water are plotted asa function of the fractions of hydroxyapatite with and without correction for porosity. Thesevolume fractions can be converted into tissue density and DMB using equations (5) and (6).
The relation between DMB and tissue density with and without correction for the tissueporosity is shown in figure 3. Using the restraint that DMB is equal to ρHA for vfHA = 1, theformulation we derived above can be approximated very well with a second-order polynomialfit (R2 = 0.999, p < 0.0001, RMSE = 0.0088 g cm−3):
ρtissue = 1.12 g cm−3 + 0.73 · DMB − 0.033 cm3 g−1 · DMB2, (13)
where DMB is in g cm−3. Since the data from the Broz experiment were obtained by chemicaldegradation of the mineral content in bovine bone, the relationships between mineral, collagenand water content may not be representative of the properties of excised human bone. Figure 3

752 K Raum et al
Figure 3. Global relation between DMB and tissue mass density. The quantities were derivedfrom data published by Broz et al (1995) and studies by Lees et al (1979, 1982, 1994, 1996). Thelatter were compiled by Hellmich and Ulm (2002). The sample size is No = 6, N× = 37 andN+ = 43. (The subscripts correspond to the marker style in the graph.)
compares the model data with collated data published by Hellmich and Ulm (2002), for whichdata include a variety of different species, anatomical sites of normal and treated tissues(e.g. cow tibia, rabbit femur, elephant radius, human femur, deer antler, porpoise and horsetympanic bulla, bovine dentine, malleus, incus and periotic of fin whale). It can be seen thatthe model determined from the Broz data agrees very well with the data of Hellmich andUlm and gives confidence that the model is appropriate for many different types of bone anddegrees of mineralization.
3. Results
3.1. Effect of model parameters
Literature values for the mass density of hydroxyapatite vary from 3.0 g cm−3 to 3.16 g cm−3
(Elliott 1969, Young and Elliott 1966, Broz et al 1995). A value higher than 3.0 g cm−3 resultsin an increase of the predicted tissue density. For a typical mineralization in bone the increaseis in the order of 1% (e.g. 1.22% for ρHA = 3.16 g cm−3 and DMB ∼1.2 g cm−3).
The porosity correction factor used is 5% and the impact of using 0% and 5% wasconsidered. The maximum difference in the predicted tissue density was 1.3% (for Po = 0%,vfHA = 0). For a DMB of 1.2 g cm−3 the predicted density was 0.42% higher for Po = 10%and 0.3% lower for Po = 0% compared to the values obtained with a porosity of 5%.
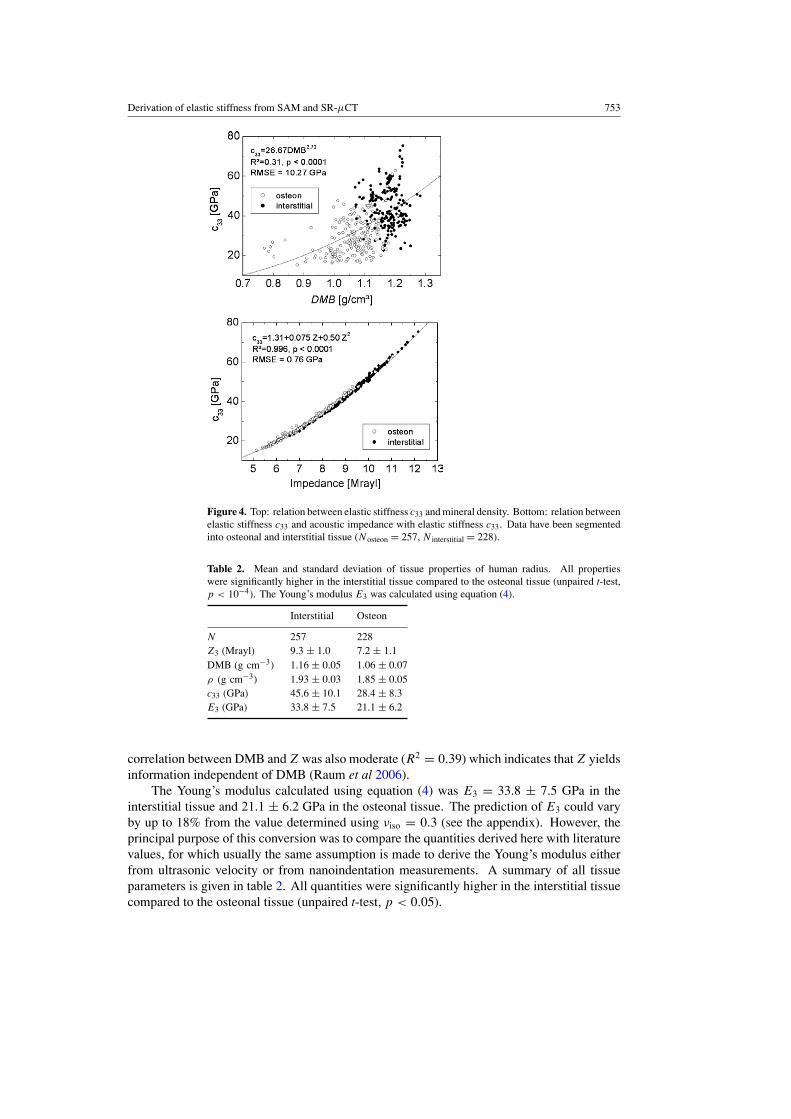
3.2. Relation between Z, DMB and elastic parameters
The relation between DMB and Z for site-matched data obtained from cross sections of humancortical radius has been shown in a companion paper (Raum et al 2006). The elastic coefficientc33 derived from 257 and 228 measurements of Z and DMB in osteonal and interstitial tissue,respectively, was in the range between 14.8 and 75.4 GPa. In figure 4 we show a plot ofc33 versus DMB and c33 versus Z. While the correlation coefficient of a power fit betweenDMB and c33 was moderate (R2 = 0.31, p < 0.0001), the acoustic impedance correlatesalmost perfectly with c33 (R2 > 0.99, p < 0.0001). This is consistent with the fact that the
Derivation of elastic stiffness from SAM and SR-µCT 753
Figure 4. Top: relation between elastic stiffness c33 and mineral density. Bottom: relation betweenelastic stiffness c33 and acoustic impedance with elastic stiffness c33. Data have been segmentedinto osteonal and interstitial tissue (Nosteon = 257, N interstitial = 228).
Table 2. Mean and standard deviation of tissue properties of human radius. All propertieswere significantly higher in the interstitial tissue compared to the osteonal tissue (unpaired t-test,p < 10−4). The Young’s modulus E3 was calculated using equation (4).
Interstitial Osteon
N 257 228Z3 (Mrayl) 9.3 ± 1.0 7.2 ± 1.1DMB (g cm−3) 1.16 ± 0.05 1.06 ± 0.07ρ (g cm−3) 1.93 ± 0.03 1.85 ± 0.05c33 (GPa) 45.6 ± 10.1 28.4 ± 8.3E3 (GPa) 33.8 ± 7.5 21.1 ± 6.2
correlation between DMB and Z was also moderate (R2 = 0.39) which indicates that Z yieldsinformation independent of DMB (Raum et al 2006).
The Young’s modulus calculated using equation (4) was E3 = 33.8 ± 7.5 GPa in theinterstitial tissue and 21.1 ± 6.2 GPa in the osteonal tissue. The prediction of E3 could varyby up to 18% from the value determined using νiso = 0.3 (see the appendix). However, theprincipal purpose of this conversion was to compare the quantities derived here with literaturevalues, for which usually the same assumption is made to derive the Young’s modulus eitherfrom ultrasonic velocity or from nanoindentation measurements. A summary of all tissueparameters is given in table 2. All quantities were significantly higher in the interstitial tissuecompared to the osteonal tissue (unpaired t-test, p < 0.05).

754 K Raum et al
4. Discussion
We have developed a model to derive local tissue mass density and elastic properties fromSR-µCT and SAM measurements. SR-µCT provided a measure of DMB. From previouslypublished experimental data we were able to employ empirical relations to ascertain the volumefractions of collagen and water in bone for a known mineral volume fraction. Using a mixinglaw the mass density of bone tissue was determined and we found that it can be well modelledby a second-order polynomial fit to DMB with a relative RMSE of approximately 0.8%.
The principal relation between mass and mineral density was insensitive to the tissueporosity (within the evaluated range of parameters). The incorporation of tissue porosity intothe model resulted in a shift of absolute mass and mineral density values on the regressionline towards smaller values. The maximum potential bias in the estimation of the tissue massdensity due to uncertainties in the model assumptions is in the order of 1.2% (i.e., ∼1%uncertainty due to the assumption of ρHA and ∼0.42% for the assumption of porosity). Theexpression we developed appears to be consistent with measurements of many different typesof bone as has been seen by others.
The combination of estimated local tissue mass density with measurements of impedanceallowed us to derive the elastic coefficient c33 of the tissue. We found that c33 correlated morestrongly with Z3 than with ρtissue occurred for two reasons. First, the physics tells us that c33
depends on the square of Z3. Second, the measurements show that Z3 has a larger variation(relative standard deviation RSD: 17.9%) than ρtissue (RSD: 2.8%). The large variance of Z3
and c33 could be related to a variety of factors, e.g. tissue anisotropy, collagen cross linking,size and interconnection of mineral platelets which affect the elastic properties but will notaffect the density measurement. Therefore, measurements of density are unlikely to be ableto provide precise predictions of elastic properties in bone. On the other hand, the strongcorrelation of Z3 and c33 implies that Z3 may be a good proxy for c33 and reliable estimatesof c33 can be made from measurements of Z3 alone.
Many nanoindentation studies have been performed on wet or dry cortical and trabecularbone with and without pathologies (Jamsa et al 2002, Rho et al 1999a, 1999b, 2001a, 2001b,2002, Turner et al 1999, Zysset et al 1999, Hoffler et al 2000). The estimated values forYoung’s modulus were in the range from 15 to 27 GPa and 10 to 18 GPa for cortical andtrabecular bones, respectively. This is consistent with our data which yielded a Young’smodulus of cortical tissue of 27.9 ± 9.4 GPa (mean and standard deviation of all measuredsites).
We found that interstitial tissue had higher value properties than osteonal tissue, that is,then interstitial tissue was more dense, stiffer and had a higher acoustic impedance. Theobservation of a higher elastic modulus in interstitial tissue compared to osteonal tissue isconsistent with results obtained from micromechanical measurements. The value for osteonaltissue (21.1 ± 6.2 GPa) compares well with values obtained by nanoindentation, e.g. 19.1 ±5.4 GPa in wet specimen from the femoral diaphysis (Zysset et al 1999) and 22.4 ± 1.2 GPain dry cortical bone of the tibia (Rho et al 1999a). However, our value obtained for interstitialtissue (33.8 ± 7.5 GPa) is higher than those obtained by nanoindentation. For example, in thestudy by Rho et al (1999a) the average modulus in interstitial tissue was 23.4 ± 1.2 GPa. Inaddition to the multiplicity of inherent factors that influence the tissue elastic modulus, e.g.species, anatomical site, age, physical activity, tissue preparation, one of the crucial points forderiving this property from the acoustic or micromechanical measurement is the knowledgeof the anisotropic Poisson ratios. As was mentioned beforehand the prediction error for ourconversion from c33 to E3 using the isotropic assumption may be as high as ±22.2% (i.e.,∼2.2% for ρtissue, ∼2.0% for Z2
3 and ∼18% for the conversion factor). It is well accepted

Derivation of elastic stiffness from SAM and SR-µCT 755
that cortical bone is anisotropic and it has been reported that the anisotropy ratio AR variesbetween osteonal and interstitial tissue from 1.35 to 1.55 (Rho et al 1999a). Since AR directlyaffects the factor for the conversion from c33 to E3, the validation of this conversion certainlymerits further investigation.
An alternative method to determining elastic constants is through mixture laws (Currey1969, Hellmich et al 2004a, Lees 1987, Pidaparti et al 1994, 1996, Sevostianov and Kachanov2000). In this case one only uses the volume fraction of the various components and theirphysical properties from which the properties of the mixture can be ascertained. However, thenature of the microstructure of the bone affects the form of the mixture law to be employed(Hellmich et al 2004b). Our measurements indicated localized interstitial regions with stiffnessvalues up to 75 GPa (E3 ∼ 55 GPa). For comparison, Young’s modulus, Poisson ratio andstiffness of isotropic hydroxyapatite powder are EHA = 114 GPa, νHA = 0.27 and cHA =153 GPa, respectively (Gilmore and Katz 1982). The wide variation we observe in c33 over arelatively uniform sample population indicates that homogenized mixture laws are probablynot going to be able to capture the heterogeneous elastic properties of bone tissue.
The methodology we described here was able to derive one elastic coefficient (c33) forbone. For an isotropic linear elastic solid the stiffness tensor is described by two independentproperties and so at least one more measurement would be necessary. Measurements ofshear waves or surface waves are acoustic based techniques and several attempts have beenmade to determine these sound velocities (Jorgensen and Kundu 2002, Raum and Brandt2003a, 2003b). However, these techniques require to defocus below the sample surface,which is associated both with a dramatic loss of spatial resolution and with the potential ofintroducing artefacts due to the heterogeneity of bone tissue. An alternate method to obtainthe independent constants is to probe the sample at various observation angles and to fit thedata to an orthotropic or transverse isotropic model (Currey 1969, Hofmann et al 2006, Reillyand Burstein 1975).
We further note that these measurements only yield linear elastic properties and that forproper modelling of bone it would be necessary to measure the local full nonlinear response ofthe material including phenomena such as plasticity and strain rate dependence, measurementsof failure criteria and in particular the change in material properties as bone suffers micro-damage. Although some measurements have been reported for macroscopic samples, localmeasurements of these effects at the tissue level remain a challenge.
In conclusion, high resolution impedance mapping in conjunction with mineral densitymapping provides locally resolved distribution of tissue elasticity. As part of this processit was necessary to employ further data about the relative ratios of water, collagen andmineral. The variability of the elastic coefficient c33 was well depicted by the acousticimpedance, while c33 did not have a strong correlation with mineral density, that is,these data indicate that radiographic measurements cannot be used to determine the elasticproperties of the bone. The values predicted by this method were in general agreementwith literature values although we identified regions of tissue with stiffness values thatwere considerably higher than previously published values. We hypothesize that previousmethods (except for nanoindentaion) have not been sensitive enough to capture thislocal tissue heterogeneity. However, scanning acoustic microscopy (SAM) at 200 MHzallows quantitative imaging of structural and micromechanical material properties with aspatial resolution approximating that of optical microscopy. Development and validationof quantitative SAM on small animal models may offer interesting perspectives forpharmaceutical companies. In addition, the knowledge of material properties gained fromquantitative SAM can be used in numerical models of bone for finite element or finite differencemodelling.
756 K Raum et al
Acknowledgments
The authors are grateful for the financial support by the DAAD PPP program #D/0122910, theDeutsche Forschungsgemeinschaft, Grant Ra 1380/1-1 and the MAE program PAI PROCOPE04544UM. In addition K Raum acknowledges support from CNRS (Poste Chercheur Associe)and R O Cleveland acknowledges a ‘Bourses de Recherche’ from the Scientific AdvisoryBoard of the Mayor of Paris.
Appendix
Effect of Poisson ratio on estimation of Young’s modulus
In principle the anisotropic Poisson ratios νij could vary between −1 and 0.5. However, it islikely that the values are positive and vary in a range between 0.2 and 0.4 (Zysset et al 1999).With the assumption that the material is transverse isotropic with E1 = E2 < E3 it followsthat ν12 = ν21, and ν13 = ν23 < ν31 = ν32. Further constraints arise from the symmetry of thecompliance matrix:
ν13
E1= ν31
E3. (A.1)
Anisotropy ratios(AR = E3E
−11
)in cortical bone obtained by 50 MHz sound velocity and
nanoindentation measurements have been reported to be in the range between 1.35 and 1.55(Fan et al 2002, Rho et al 1999a, Swadener et al 2001, Takano et al 1999, Turner et al 1999).Within these limits (0.2 < νij < 0.4, 1.35 < AR < 1.55) the factor in equation (4) variesbetween 0.606 and 0.865. Therefore, the error associated with the assumption of an isotropicPoisson ratio on the estimation of E3 is within ±18%.
References
Agarwal B D and Broutman L J 1990 Analysis and Performance of Fiber Composites (New York: Wiley)Akhter M P, Fan Z and Rho J Y 2004 Bone intrinsic material properties in three inbred mouse strains Calcif. Tissue
Int. 75 416–20Briggs G A 1992 Acoustic Microscopy (Oxford: Clarendon)Broz J J, Simske S J and Greenberg A R 1995 Material and compositional properties of selectively demineralized
cortical bone J. Biomech. 28 1357–68Bumrerraj S and Katz J L 2001 Scanning acoustic microscopy study of human cortical and trabecular bone Ann.
Biomed. Eng. 29 1034–42Burstein A H, Zika J M, Heiple K G and Klein L 1975 Contribution of collagen and mineral to the elastic-plastic
properties of bone J. Bone Joint Surg. Am. 57 956–61Chen Q, Rho J Y, Fan Z, Laulederkind S J and Raghow R 2003 Congenital lack of COX-2 affects mechanical and
geometric properties of bone in mice Calcif. Tissue Int. 73 387–92Currey J D 1969 The relationship between the stiffness and the mineral content of bone J. Biomech. 2 477–80Currey J D 1999 What determines the bending strength of compact bone? J. Exp. Biol. 202 2495–503Elliott J C 1969 Recent progress in the chemistry, crystal chemistry and structure of the apatites Calcif. Tissue
Res. 3 293–307Fan Z, Swadener J G, Rho J Y, Roy M E and Pharr G M 2002 Anisotropic properties of human tibial cortical bone
as measured by nanoindentation J. Orthop. Res. 20 806–10Gilmore R S and Katz J L 1982 Elastic properties of apatites J. Mater. Sci. 17 1131–41Harley R, James D, Miller A and White J W 1977 Phonons and the elastic moduli of collagen and muscle
Nature 267 285–7Hellmich C, Barthelemy J F and Dormieux L 2004a Mineral–collagen interactions in elasticity of bone ultrastructure—
a continuum micromechanics approach Eur. J. Mech. A 23 783–810Hellmich C and Ulm F J 2002 Are mineralized tissues open crystal foams reinforced by crosslinked collagen? Some
energy arguments J. Biomech. 35 1199–212
Derivation of elastic stiffness from SAM and SR-µCT 757
Hellmich C and Ulm F J 2003 Average hydroxyapatite concentration is uniform in the extracollagenous ultrastructureof mineralized tissues: evidence at the 1–10-microm scale Biomech. Model. Mechanobiol. 2 21–36
Hellmich C, Ulm F J and Dormieux L 2004b Can the diverse elastic properties of trabecular and cortical bone beattributed to only a few tissue-independent phase properties and their interactions? Arguments from a multiscaleapproach Biomech. Model. Mechanobiol. 2 219–38
Hengsberger S, Ammann P, Legros B, Rizzoli R and Zysset P 2005 Intrinsic bone tissue properties in adult ratvertebrae: modulation by dietary protein Bone 36 134–41
Hengsberger S, Enstroem J, Peyrin F and Zysset P 2003 How is the indentation modulus of bone tissue related to itsmacroscopic elastic response? A validation study J. Biomech. 36 1503–9
Hoffler C E, Moore K E, Kozloff K, Zysset P K, Brown M B and Goldstein S A 2000 Heterogeneity of bonelamellar-level elastic moduli Bone 26 603–9
Hofmann T, Heyroth F, Meinhard H, Fraenzel W and Raum K 2006 Assessment of composition and anisotropicelastic properties of secondary osteon lamellae J. Biomech. at press
Jamsa T, Rho J Y, Fan Z, MacKay C A, Marks Jr S C and Tuukkanen J 2002 Mechanical properties in long bones ofrat osteopetrotic mutations J. Biomech. 35 161–5
Jorgensen C S and Kundu T 2002 Measurement of material elastic constants of trabecular bone: a micromechanicalanalytic study using a 1 GHz acoustic microscope J. Orthop. Res. 20 151–8
Lees S 1982 Ultrasonic measurements of deer antler, bovine tibia and tympanic bulla J. Biomech. 15 867–74Lees S 1987 Considerations regarding the structure of the mammalian mineralized osteoid from viewpoint of the
generalized packing model Conn. Tissue Res. 16 281–303Lees S, Hanson D B and Page E A 1996 Some acoustical properties of the otic bones of a fin whale J. Acoust. Soc.
Am. 99 2421–7Lees S, Hanson D, Page E and Mook H A 1994 Comparison of dosage-dependent effects of beta-aminopropionitrile,
sodium fluoride, and hydrocortisone on selected physical properties of cortical bone J. Bone Miner. Res. 91377–89
Lees S, Heeley J D and Cleary P F 1979 A study of some properties of a sample of bovine cortical bone usingultrasound Calcif. Tissue Int. 29 107–17
Nuzzo S, Peyrin F, Cloetens P, Baruchel J and Boivin G 2002 Quantification of the degree of mineralization of bonein three dimension using synchrotron radiation microtomography Med. Phys. 29 2672–81
Pidaparti R M, Chandran A, Takano Y and Turner C H 1996 Bone mineral lies mainly outside collagen fibrils:predictions of a composite model for osteonal bone J. Biomech. 29 909–16
Pidaparti R V, Chandran A and Turner C H 1994 A composite model to predict the elastic anisotropy of osteonalbone Adv. Bioeng. 28 55–6
Raum K and Brandt J 2003a High-frequency acoustic dispersion of surface waves using timeresolved broadbandmicroscopy Proc. IEEE Ultrason. Symp. (Honolulu) pp 799–802
Raum K and Brandt J 2003b Simultaneous determination of acoustic impedance, longitudinal and lateral wavevelocities for the characterization of the elastic microstructure of cortical bone Proc. World Congress Ultrasound(Paris) pp 321–4
Raum K, Jenderka K V, Klemenz A and Brandt J 2003 Multi layer analysis—quantitative scanning acousticmicroscopy for tissue characterization at a microscopic scale IEEE Trans. Ultrason. Ferroelectr. Freq.Control 50 507–16
Raum K, Leguerney I, Chandelier F, Talmant M, Saied A, Peyrin F and Laugier P 2006 Site-matched assessmentof structural and tissue properties of bone with scanning acoustic microscopy and synchrotron radiation µCTPhys. Med. Biol. 51 733–46
Raum K, Reisshauer J and Brandt J 2004 Frequency and resolution dependence of the anisotropic impedance estimationin cortical bone using time-resolved scanning acoustic microscopy J. Biomed. Mater. Res. A 71 430–8
Reilly D T and Burstein A H 1975 The elastic and ultimate properties of compact bone tissue J Biomech.8 393–405
Rho J Y, Currey J D, Zioupos P and Pharr G M 2001a The anisotropic Young’s modulus of equine secondary osteonesand interstitial bone determined by nanoindentation J. Exp. Biol. 204 1775–81
Rho J Y, Mishra S R, Chung K, Bai J and Pharr G M 2001b Relationship between ultrastructure and the nanoindentationproperties of intramuscular herring bones Ann. Biomed. Eng. 29 1082–8
Rho J Y, Roy M E, Tsui T Y and Pharr G M 1999a Elastic properties of microstructural components of human bonetissue as measured by nanoindentation J. Biomed. Mater. Res. 45 48–54
Rho J Y, Zioupos P, Currey J D and Pharr G M 1999b Variations in the individual thick lamellar properties withinosteons by nanoindentation Bone 25 295–300
Rho J Y, Zioupos P, Currey J D and Pharr G M 2002 Microstructural elasticity and regional heterogeneity in humanfemoral bone of various ages examined by nanoindentation J. Biomech. 35 189–98

758 K Raum et al
Sevostianov I and Kachanov M 2000 Impact of the porous microstructure on the overall elastic properties of theosteonal cortical bone J. Biomech. 33 881–8
Silva M J, Brodt M D, Fan Z and Rho J Y 2004 Nanoindentation and whole-bone bending estimates of materialproperties in bones from the senescence accelerated mouse SAMP6 J. Biomech. 37 1639–46
Swadener J G, Rho J Y and Pharr G M 2001 Effects of anisotropy on elastic moduli measured by nanoindentation inhuman tibial cortical bone J. Biomed. Mater. Res. 57 108–12
Takano Y, Turner C H, Owan I, Martin R B, Lau S T, Forwood M R and Burr D B 1999 Elastic anisotropy and collagenorientation of osteonal bone are dependent on the mechanical strain distribution J. Orthop. Res. 17 59–66
Turner C H, Rho J Y, Takano Y, Tsui T Y and Pharr G M 1999 The elastic properties of trabecular and cortical bonetissues are similar: results from two microscopic measurement techniques J. Biomech. 32 437–41
Turner C H, Takano Y and Hirano T 1996 Reductions in bone strength after fluoride treatment are not reflected intissue-level acoustic measurements Bone 19 603–7
Xu J, Rho J Y, Mishra S R and Fan Z 2003 Atomic force microscopy and nanoindentation characterization of humanlamellar bone prepared by microtome sectioning and mechanical polishing technique J. Biomed. Mater. Res.A 67 719–26
Young R A and Elliott J C 1966 Atomic-scale bases for several properties of apatites Arch. Oral Biol. 11 699–707Zioupos P and Currey J D 1998 Changes in the stiffness, strength, and toughness of human cortical bone with age
Bone 22 57–66Zysset P K, Guo X E, Hoffler C E, Moore K E and Goldstein S A 1999 Elastic modulus and hardness of cortical and
trabecular bone lamellae measured by nanoindentation in the human femur J. Biomech. 32 1005–12
Copyright © 2022 FDOKUMEN