Metallic Nanoparticle Integrated Ternary Polymer Blend of ...
Upload
independentCategory
view
2download
0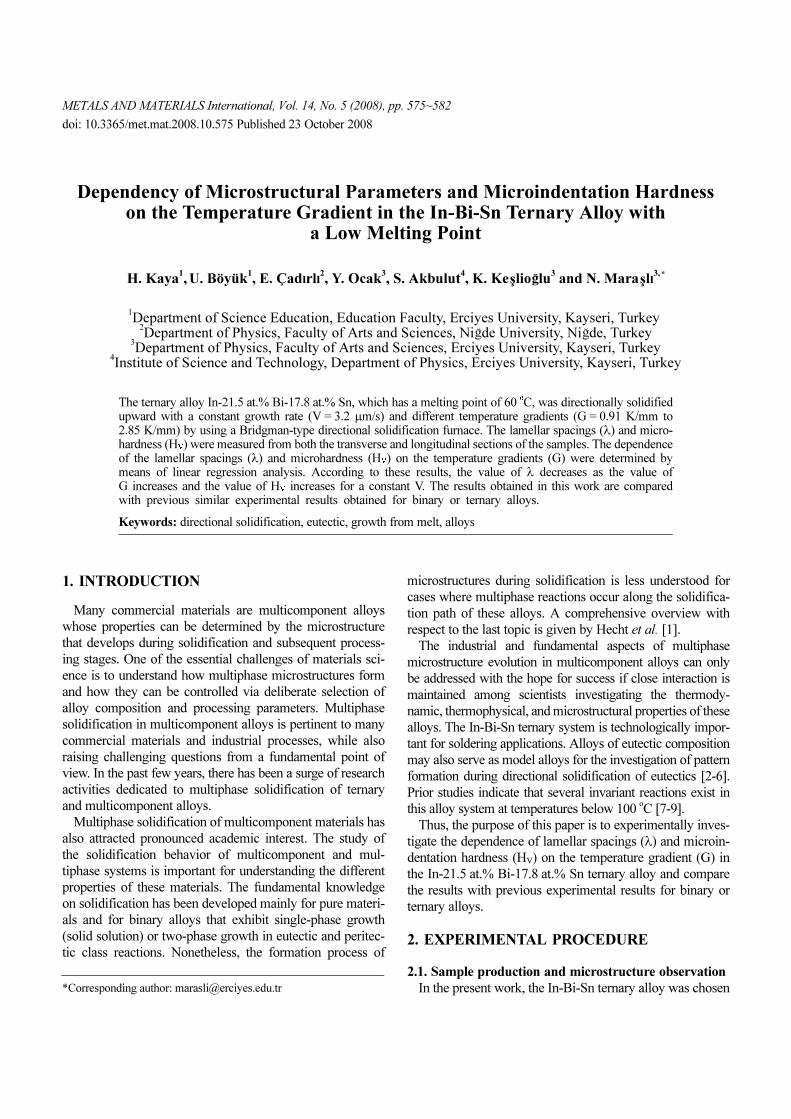
METALS AND MATERIALS International, Vol. 14, No. 5 (2008), pp. 575~582
Dependency of Microstructural Parameters and Microindentation Hardnesson the Temperature Gradient in the In-Bi-Sn Ternary Alloy with
a Low Melting Point
H. Kaya1, U. Böyük
1, E. Çadlrll
2, Y. Ocak
3, S. Akbulut
4, K. Ke lio lu
3 and N. Mara ll
3,*
1Department of Science Education, Education Faculty, Erciyes University, Kayseri, Turkey 2Department of Physics, Faculty of Arts and Sciences, Ni de University, Ni de, Turkey
3Department of Physics, Faculty of Arts and Sciences, Erciyes University, Kayseri, Turkey
4Institute of Science and Technology, Department of Physics, Erciyes University, Kayseri, Turkey
The ternary alloy In-21.5 at.% Bi-17.8 at.% Sn, which has a melting point of 60oC, was directionally solidified
upward with a constant growth rate (V = 3.2 μm/s) and different temperature gradients (G = 0.91 K/mm to2.85 K/mm) by using a Bridgman-type directional solidification furnace. The lamellar spacings (λ) and micro-hardness (HV) were measured from both the transverse and longitudinal sections of the samples. The dependenceof the lamellar spacings (λ) and microhardness (HV) on the temperature gradients (G) were determined bymeans of linear regression analysis. According to these results, the value of λ decreases as the value ofG increases and the value of HV increases for a constant V. The results obtained in this work are comparedwith previous similar experimental results obtained for binary or ternary alloys.
Keywords: directional solidification, eutectic, growth from melt, alloys
s g˘ s
g˘ g˘
1. INTRODUCTION
Many commercial materials are multicomponent alloys
whose properties can be determined by the microstructure
that develops during solidification and subsequent process-
ing stages. One of the essential challenges of materials sci-
ence is to understand how multiphase microstructures form
and how they can be controlled via deliberate selection of
alloy composition and processing parameters. Multiphase
solidification in multicomponent alloys is pertinent to many
commercial materials and industrial processes, while also
raising challenging questions from a fundamental point of
view. In the past few years, there has been a surge of research
activities dedicated to multiphase solidification of ternary
and multicomponent alloys.
Multiphase solidification of multicomponent materials has
also attracted pronounced academic interest. The study of
the solidification behavior of multicomponent and mul-
tiphase systems is important for understanding the different
properties of these materials. The fundamental knowledge
on solidification has been developed mainly for pure materi-
als and for binary alloys that exhibit single-phase growth
(solid solution) or two-phase growth in eutectic and peritec-
tic class reactions. Nonetheless, the formation process of
microstructures during solidification is less understood for
cases where multiphase reactions occur along the solidifica-
tion path of these alloys. A comprehensive overview with
respect to the last topic is given by Hecht et al. [1].
The industrial and fundamental aspects of multiphase
microstructure evolution in multicomponent alloys can only
be addressed with the hope for success if close interaction is
maintained among scientists investigating the thermody-
namic, thermophysical, and microstructural properties of these
alloys. The In-Bi-Sn ternary system is technologically impor-
tant for soldering applications. Alloys of eutectic composition
may also serve as model alloys for the investigation of pattern
formation during directional solidification of eutectics [2-6].
Prior studies indicate that several invariant reactions exist in
this alloy system at temperatures below 100oC [7-9].
Thus, the purpose of this paper is to experimentally inves-
tigate the dependence of lamellar spacings (λ) and microin-
dentation hardness (HV) on the temperature gradient (G) in
the In-21.5 at.% Bi-17.8 at.% Sn ternary alloy and compare
the results with previous experimental results for binary or
ternary alloys.
2. EXPERIMENTAL PROCEDURE
2.1. Sample production and microstructure observation
In the present work, the In-Bi-Sn ternary alloy was chosen*Corresponding author: [email protected]
doi: 10.3365/met.mat.2008.10.575 Published 23 October 2008
576 H. Kaya et al.
with a composition of In-21.5 at.% Bi-17.8 at.% Sn for the
growth of the eutectic structure from the ternary liquid.
Thus, the In-21.5 at.% Bi-17.8 at.% Sn alloy was prepared in
a vacuum furnace [10] with 99.9 % pure indium, 99.99 %
pure bismuth and 99.99 % pure tin. After sufficient time was
allowed for the melt homogenization, the molten alloy was
poured into 10 graphite crucibles (250 mm in length, 4 mm
ID, and 6.35 mm OD) held in a specially constructed casting
furnace (hot filling furnace) at approximately 30oC above
the melting point of alloy. The molten alloy was then direc-
tionally frozen from bottom to top to ensure that the crucible
was completely full.
Each sample was then positioned in a Bridgman-type fur-
nace in a graphite cylinder (300 mm in length, 10 mm ID,
and 40 mm OD). The details of the apparatus and experi-
mental procedures are given in [10-16]. In the experimental
technique, the sample was usually heated at about 50oC,
100oC, 150
oC, 200
oC, and 250
oC above the melting tem-
perature to get a different temperature gradient of the sam-
ple, and the sample was then grown by being pulled
downwards by a constant speeded synchronous motor after
the stabilization of the thermal conditions in the furnace
under an argon atmosphere. After a steady state growth of
10 cm to 12 cm, the samples were quenched by being rap-
idly pulled down into a water reservoir. The temperature of
the water in the reservoir varied from about 20oC to 25
oC.
The water cooling was sufficient to get a well-defined solid-
liquid interface at a melting temperature higher than 100oC
but, after a few experimental works, the water cooling
appeared to be insufficient to produce a well-defined solid-
liquid interface at a melting temperature lower than 100oC.
The task of investigating how the microstructure parame-
ters depend on the temperature gradient is diffucult because
the experimental conditions preclude any wide-ranging tem-
perature gradients. The task is even more difficult at a low
melting temperature. The melting point of the In-21.5 at.%
Bi-17.8 at.% Sn ternary alloy was measured to be 60oC with
a standard route. Thus, in the present work, the water tem-
perature in the reservoir was kept at minus 10oC to an accu-
racy of ± 0.01 K by means of a Poly Science digital 9102
model heating/refrigerating circulating bath containing an
aqueous ethylene glycol solution; this method ensure the
largest temperature gradients and a well-quenched solid-liq-
uid interface. The temperature on the sample was controlled
to an accuracy of ± 0.01 K with a Eurotherm 2604-type con-
troller. The solidification of the samples for five different
temperature gradients was carried out in a range of 0.91 K/
mm to 2.85 K/mm at a constant growth rate (3.2 μm/s). Fig-
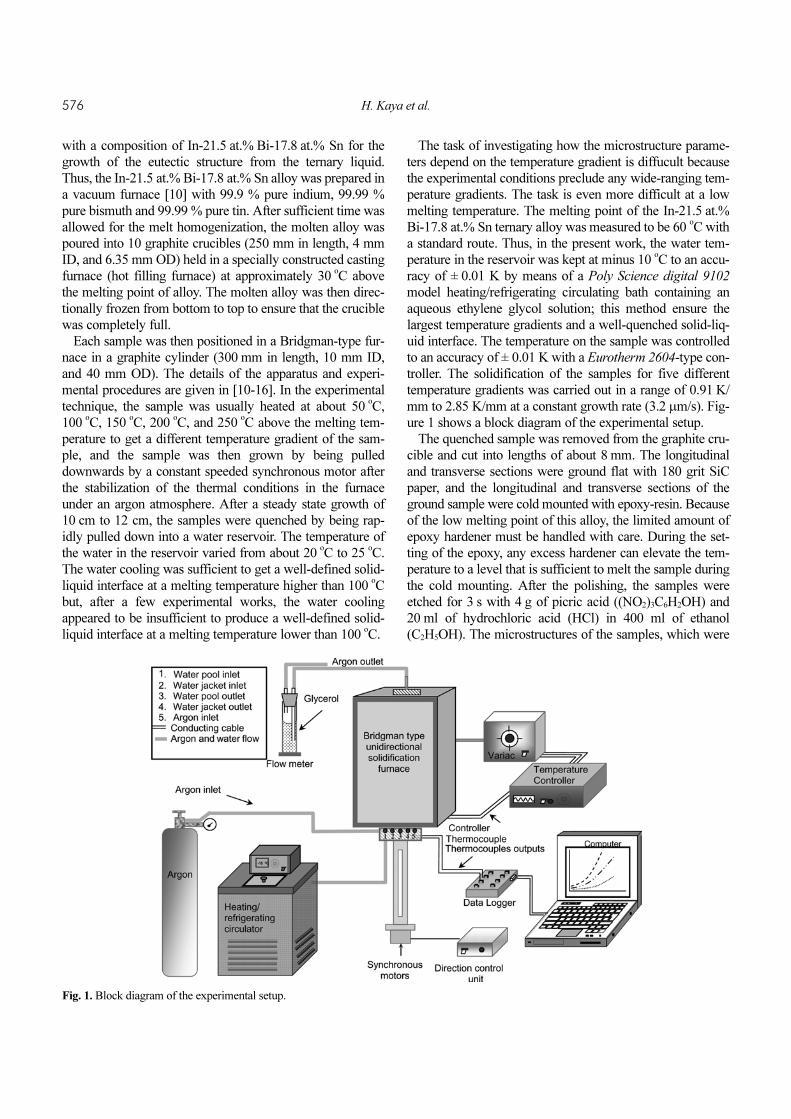
ure 1 shows a block diagram of the experimental setup.
The quenched sample was removed from the graphite cru-
cible and cut into lengths of about 8 mm. The longitudinal
and transverse sections were ground flat with 180 grit SiC
paper, and the longitudinal and transverse sections of the
ground sample were cold mounted with epoxy-resin. Because
of the low melting point of this alloy, the limited amount of
epoxy hardener must be handled with care. During the set-
ting of the epoxy, any excess hardener can elevate the tem-
perature to a level that is sufficient to melt the sample during
the cold mounting. After the polishing, the samples were
etched for 3 s with 4 g of picric acid ((NO2)3C6H2OH) and
20 ml of hydrochloric acid (HCl) in 400 ml of ethanol
(C2H5OH). The microstructures of the samples, which were
Fig. 1. Block diagram of the experimental setup.
Dependency of Microstructural Parameters and Microindentation Hardness on the Temperature... 577
revealed after the metallographic process, were photo-
graphed with an Olympus DP12 digital camera placed in
conjunction with an Olympus BHX-type light optical micro-
scope. A graticule (200 × 0.01 = 2 mm) was also photo-
graphed with the same objective.
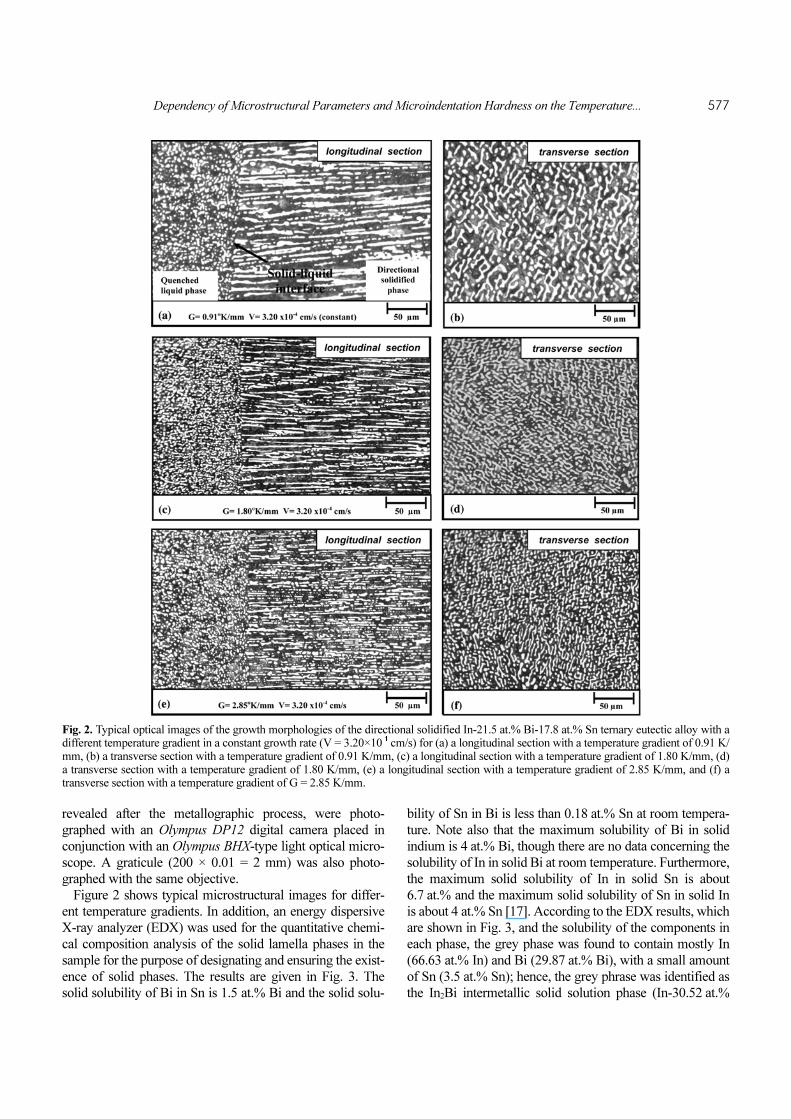
Figure 2 shows typical microstructural images for differ-
ent temperature gradients. In addition, an energy dispersive
X-ray analyzer (EDX) was used for the quantitative chemi-
cal composition analysis of the solid lamella phases in the
sample for the purpose of designating and ensuring the exist-
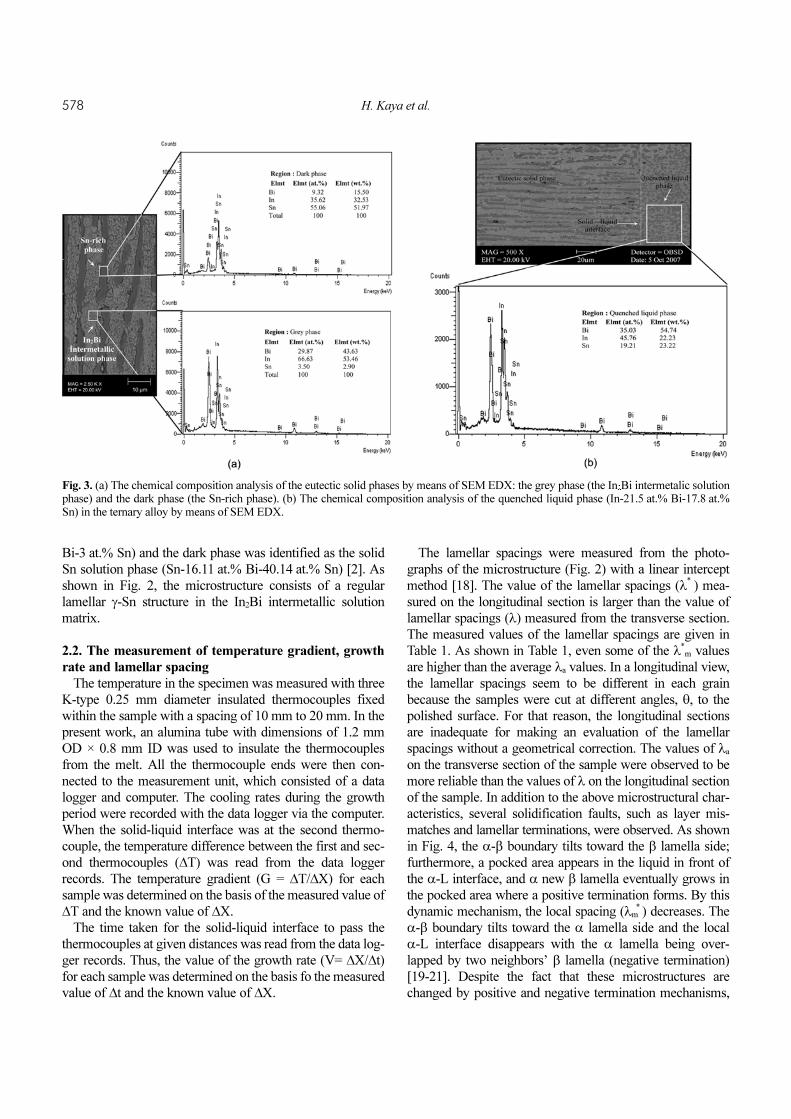
ence of solid phases. The results are given in Fig. 3. The
solid solubility of Bi in Sn is 1.5 at.% Bi and the solid solu-
bility of Sn in Bi is less than 0.18 at.% Sn at room tempera-
ture. Note also that the maximum solubility of Bi in solid
indium is 4 at.% Bi, though there are no data concerning the
solubility of In in solid Bi at room temperature. Furthermore,
the maximum solid solubility of In in solid Sn is about
6.7 at.% and the maximum solid solubility of Sn in solid In
is about 4 at.% Sn [17]. According to the EDX results, which
are shown in Fig. 3, and the solubility of the components in
each phase, the grey phase was found to contain mostly In
(66.63 at.% In) and Bi (29.87 at.% Bi), with a small amount
of Sn (3.5 at.% Sn); hence, the grey phrase was identified as
the In2Bi intermetallic solid solution phase (In-30.52 at.%
Fig. 2. Typical optical images of the growth morphologies of the directional solidified In-21.5 at.% Bi-17.8 at.% Sn ternary eutectic alloy with adifferent temperature gradient in a constant growth rate (V = 3.20×10
-4 cm/s) for (a) a longitudinal section with a temperature gradient of 0.91 K/
mm, (b) a transverse section with a temperature gradient of 0.91 K/mm, (c) a longitudinal section with a temperature gradient of 1.80 K/mm, (d)a transverse section with a temperature gradient of 1.80 K/mm, (e) a longitudinal section with a temperature gradient of 2.85 K/mm, and (f) atransverse section with a temperature gradient of G = 2.85 K/mm.
578 H. Kaya et al.
Bi-3 at.% Sn) and the dark phase was identified as the solid
Sn solution phase (Sn-16.11 at.% Bi-40.14 at.% Sn) [2]. As
shown in Fig. 2, the microstructure consists of a regular
lamellar γ-Sn structure in the In2Bi intermetallic solution
matrix.
2.2. The measurement of temperature gradient, growth
rate and lamellar spacing
The temperature in the specimen was measured with three
K-type 0.25 mm diameter insulated thermocouples fixed
within the sample with a spacing of 10 mm to 20 mm. In the
present work, an alumina tube with dimensions of 1.2 mm
OD × 0.8 mm ID was used to insulate the thermocouples
from the melt. All the thermocouple ends were then con-
nected to the measurement unit, which consisted of a data
logger and computer. The cooling rates during the growth
period were recorded with the data logger via the computer.
When the solid-liquid interface was at the second thermo-
couple, the temperature difference between the first and sec-
ond thermocouples (ΔT) was read from the data logger
records. The temperature gradient (G = ΔT/ΔX) for each
sample was determined on the basis of the measured value of
ΔT and the known value of ΔX.
The time taken for the solid-liquid interface to pass the
thermocouples at given distances was read from the data log-
ger records. Thus, the value of the growth rate (V= ΔX/Δt)
for each sample was determined on the basis fo the measured
value of Δt and the known value of ΔX.
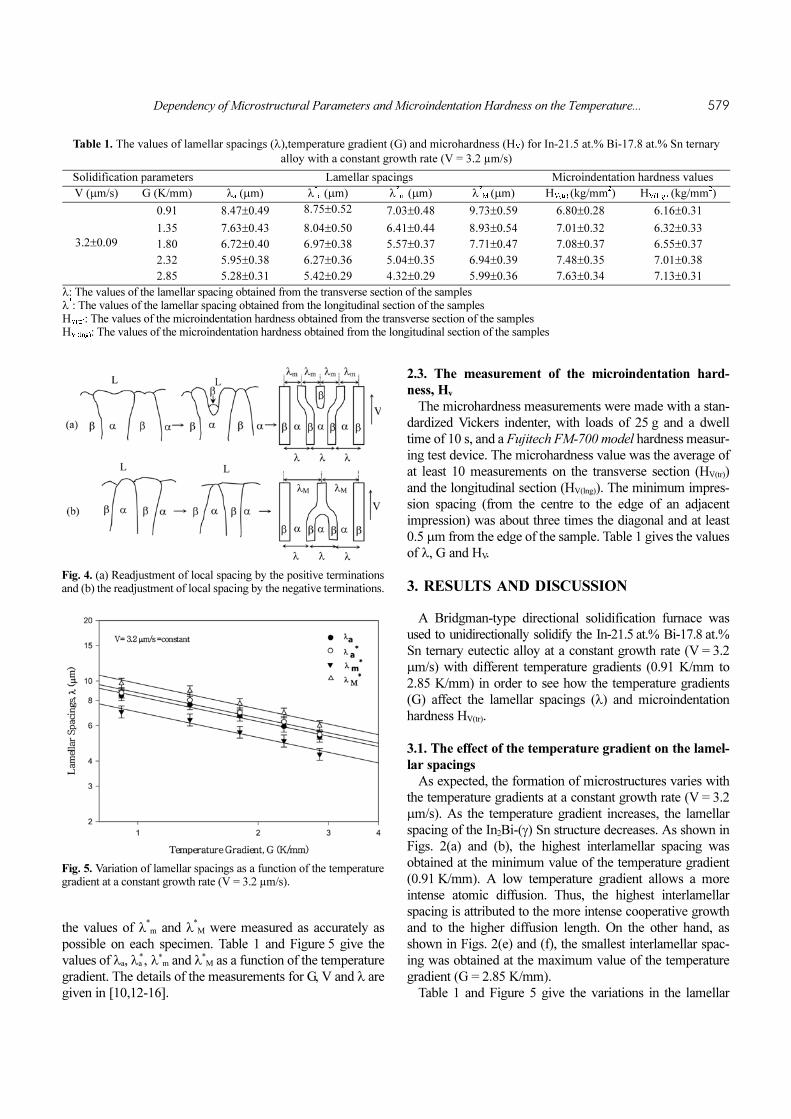
The lamellar spacings were measured from the photo-
graphs of the microstructure (Fig. 2) with a linear intercept
method [18]. The value of the lamellar spacings (λ* ) mea-
sured on the longitudinal section is larger than the value of
lamellar spacings (λ) measured from the transverse section.
The measured values of the lamellar spacings are given in
Table 1. As shown in Table 1, even some of the λ*m values
are higher than the average λa values. In a longitudinal view,
the lamellar spacings seem to be different in each grain
because the samples were cut at different angles, θ, to the
polished surface. For that reason, the longitudinal sections
are inadequate for making an evaluation of the lamellar
spacings without a geometrical correction. The values of λa
on the transverse section of the sample were observed to be
more reliable than the values of λ on the longitudinal section
of the sample. In addition to the above microstructural char-
acteristics, several solidification faults, such as layer mis-
matches and lamellar terminations, were observed. As shown
in Fig. 4, the α-β boundary tilts toward the β lamella side;
furthermore, a pocked area appears in the liquid in front of
the α-L interface, and α new β lamella eventually grows in
the pocked area where a positive termination forms. By this
dynamic mechanism, the local spacing (λm* ) decreases. The
α-β boundary tilts toward the α lamella side and the local
α-L interface disappears with the α lamella being over-
lapped by two neighbors’ β lamella (negative termination)
[19-21]. Despite the fact that these microstructures are
changed by positive and negative termination mechanisms,
Fig. 3. (a) The chemical composition analysis of the eutectic solid phases by means of SEM EDX: the grey phase (the In2Bi intermetalic solutionphase) and the dark phase (the Sn-rich phase). (b) The chemical composition analysis of the quenched liquid phase (In-21.5 at.% Bi-17.8 at.%Sn) in the ternary alloy by means of SEM EDX.
Dependency of Microstructural Parameters and Microindentation Hardness on the Temperature... 579
the values of λ*m and λ
*M were measured as accurately as
possible on each specimen. Table 1 and Figure 5 give the
values of λa, λa*, λ
*m and λ*
M as a function of the temperature
gradient. The details of the measurements for G, V and λ are
given in [10,12-16].
2.3. The measurement of the microindentation hard-
ness, Hv
The microhardness measurements were made with a stan-
dardized Vickers indenter, with loads of 25 g and a dwell
time of 10 s, and a Fujitech FM-700 model hardness measur-
ing test device. The microhardness value was the average of
at least 10 measurements on the transverse section (HV(tr))
and the longitudinal section (HV(lng)). The minimum impres-
sion spacing (from the centre to the edge of an adjacent
impression) was about three times the diagonal and at least
0.5 μm from the edge of the sample. Table 1 gives the values
of λ, G and HV.
3. RESULTS AND DISCUSSION
A Bridgman-type directional solidification furnace was
used to unidirectionally solidify the In-21.5 at.% Bi-17.8 at.%
Sn ternary eutectic alloy at a constant growth rate (V = 3.2
μm/s) with different temperature gradients (0.91 K/mm to
2.85 K/mm) in order to see how the temperature gradients
(G) affect the lamellar spacings (λ) and microindentation
hardness HV(tr).
3.1. The effect of the temperature gradient on the lamel-
lar spacings
As expected, the formation of microstructures varies with
the temperature gradients at a constant growth rate (V = 3.2
μm/s). As the temperature gradient increases, the lamellar
spacing of the In2Bi-(γ) Sn structure decreases. As shown in
Figs. 2(a) and (b), the highest interlamellar spacing was
obtained at the minimum value of the temperature gradient
(0.91 K/mm). A low temperature gradient allows a more
intense atomic diffusion. Thus, the highest interlamellar
spacing is attributed to the more intense cooperative growth
and to the higher diffusion length. On the other hand, as
shown in Figs. 2(e) and (f), the smallest interlamellar spac-
ing was obtained at the maximum value of the temperature
gradient (G = 2.85 K/mm).
Table 1 and Figure 5 give the variations in the lamellar
Table 1. The values of lamellar spacings (λ),temperature gradient (G) and microhardness (HV) for In-21.5 at.% Bi-17.8 at.% Sn ternary
alloy with a constant growth rate (V = 3.2 µm/s)
Solidification parameters Lamellar spacings Microindentation hardness values
V (μm/s) G (K/mm) λa (μm) λ*a (μm) λ
*m (μm) λ
*M
(μm) HV(tr) (kg/mm
2) HV(lng) (kg/mm
2)
3.2±0.09
0.91 8.47±0.49 8.75±0.52 7.03±0.48 9.73±0.59 6.80±0.28 6.16±0.31
1.35 7.63±0.43 8.04±0.50 6.41±0.44 8.93±0.54 7.01±0.32 6.32±0.33
1.80 6.72±0.40 6.97±0.38 5.57±0.37 7.71±0.47 7.08±0.37 6.55±0.37
2.32 5.95±0.38 6.27±0.36 5.04±0.35 6.94±0.39 7.48±0.35 7.01±0.38
2.85 5.28±0.31 5.42±0.29 4.32±0.29 5.99±0.36 7.63±0.34 7.13±0.31
λ: The values of the lamellar spacing obtained from the transverse section of the samplesλ
*: The values of the lamellar spacing obtained from the longitudinal section of the samples
HV(tr): The values of the microindentation hardness obtained from the transverse section of the samplesHV (lng): The values of the microindentation hardness obtained from the longitudinal section of the samples
Fig. 4. (a) Readjustment of local spacing by the positive terminationsand (b) the readjustment of local spacing by the negative terminations.
Fig. 5. Variation of lamellar spacings as a function of the temperaturegradient at a constant growth rate (V = 3.2 µm/s).
580 H. Kaya et al.
spacings (λ) with the temperature gradients (G) at a constant
growth rate (V = 3.2 μm/s). The variation of λ versus G is
essentially linear on a logarithmic scale. As shown in Table 1
and Fig. 5, the data form straight lines and the linear regres-
sion analysis gives the proportionality equation as
(for the constant G) (1)
where k is a constant and m is an exponent value of the tem-
perature gradient. The relation between the interlamellar
spacings and the temperature gradient was determined by
using linear regression analysis; and the results are given in
Table 2. As shown in Table 2 and Fig. 5, the exponent values
of the temperature gradient (G) for λa, λa*, λ
*m and λ
*M are
0.40, 0.42, 0.43, and 0.40, respectively. The dependence of λ
values on the temperature gradient is apparently exponential,
and the average exponential value of the temperature gradient
is 0.41.
The influence of the temperature gradient (G) on the
microstructure parameters has not been considered in theo-
retical studies in terms of binary or ternary eutectic growth.
As shown in Fig. 5 and Table 1, the influence of G on the
microstructure parameters (λa, λa* , λ
*m and λ
*M) cannot be
ignored for eutectic systems. Several authors have investi-
gated the influence of the temperature gradient on the lamel-
lar spacings [10,12-14,16,22,23]. The exponential value
(0.40) obtained for the transverse section in this work is in
quite good agreement with the value of 0.37, which was
obtained by Gündüz et al. [12] for the Al-Si binary eutectic
alloy and by Çadlrll et al. [13] for the Pb-Cd binary eutectic
alloy. This exponential value of 0.40 is somewhat higher
than the values of 0.33, 0.30 and 0.28, which were obtained
by Toloui and Hellawell [22] for the Al-Si binary eutectic
alloy, Çadlrll et al. [10] for the Al-Cu binary eutectic alloy,
and Kaya et al. [14] for the Sn-Zn binary eutectic alloy,
respectively. Moreover, the exponential value of 0.40 is
somewhat smaller than the values of 0.49 and 0.47 obtained
by Çadlrll and Gündüz [16] for the Pb-Sn binary eutectic
alloy and Kaya et al. [23] for the Bi-Cd binary eutectic alloy,
respectively.
3.2. The effect of the growth rate and lamellar spacing
on the microindentation hardness
The mechanical properties such as the microhardness (HV)
of the directional solidified materials also depend on the
solidification parameters, namely the temperature gradient
(G). The relations of the microhardness (HV), the temperature
gradient (G) and the lamellar spacings (λ) can be expressed
as follows [15,24-28]:
(2)
(3)
where m and n are the exponential values of the temperature
gradient and the lamellar spacing, respectively, and k1 and k2
are the constants that can be experimentally determined.
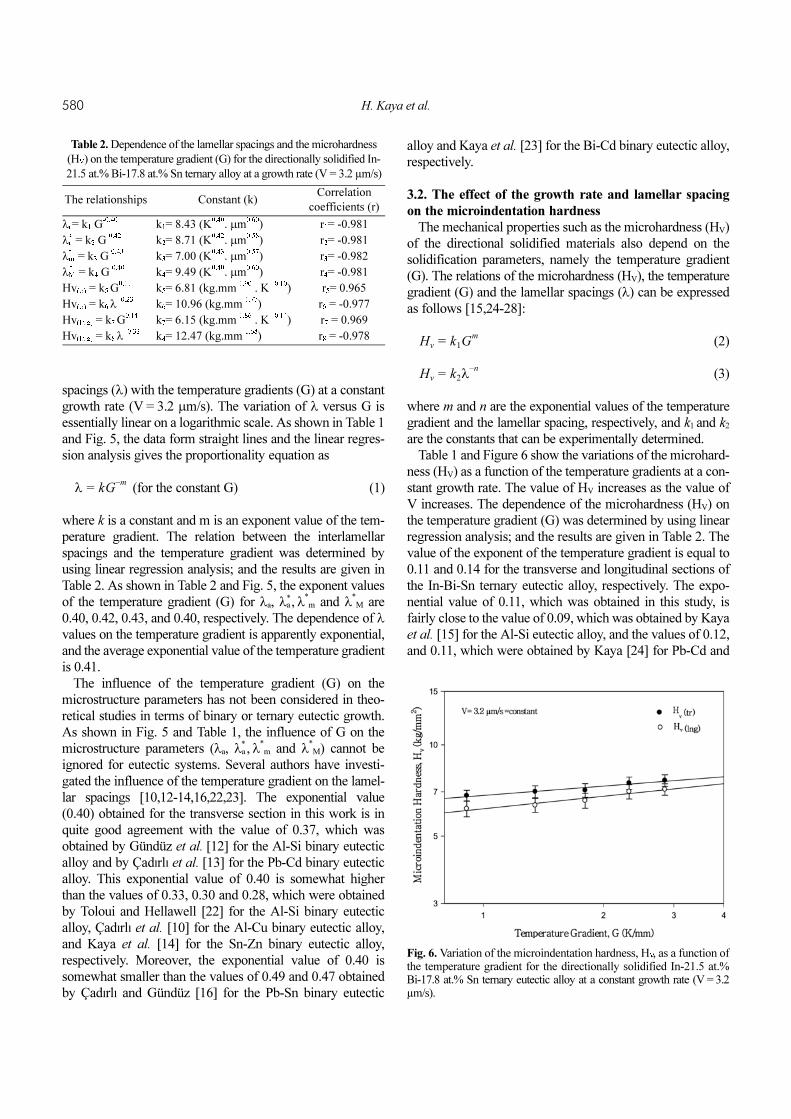
Table 1 and Figure 6 show the variations of the microhard-
ness (HV) as a function of the temperature gradients at a con-
stant growth rate. The value of HV increases as the value of
V increases. The dependence of the microhardness (HV) on
the temperature gradient (G) was determined by using linear
regression analysis; and the results are given in Table 2. The
value of the exponent of the temperature gradient is equal to
0.11 and 0.14 for the transverse and longitudinal sections of
the In-Bi-Sn ternary eutectic alloy, respectively. The expo-
nential value of 0.11, which was obtained in this study, is
fairly close to the value of 0.09, which was obtained by Kaya
et al. [15] for the Al-Si eutectic alloy, and the values of 0.12,
and 0.11, which were obtained by Kaya [24] for Pb-Cd and
λ kGm–
=
Hv
k1Gm
=
Hv
k2λn–
=
Table 2. Dependence of the lamellar spacings and the microhardness
(HV) on the temperature gradient (G) for the directionally solidified In-
21.5 at.% Bi-17.8 at.% Sn ternary alloy at a growth rate (V = 3.2 µm/s)
The relationships Constant (k)Correlation
coefficients (r)
λa= k1 G-0.40
k1= 8.43 (K0.40
. μm0.60
) r1= -0.981
λa* = k2 G
-0.42k2= 8.71 (K
0.42. μm
0.58) r2= -0.981
λm*
= k3 G-0.43
k3= 7.00 (K0.43
. μm0.57
) r3= -0.982
λM*
= k4 G-0.40
k4= 9.49 (K0.40
. μm0.60
) r4= -0.981
Hv(tr) = k5 G0.11
k5= 6.81 (kg.mm-1.90
. K -0.10
) r5= 0.965
Hv(tr) = k6 λ -0.23
k6= 10.96 (kg.mm-1.77
) r6 = -0.977
Hv(ln g) = k7 G0.14
k7= 6.15 (kg.mm-1.86
. K -0.14
) r7 = 0.969
Hv(ln g) = k8 λ -0.32
k8= 12.47 (kg.mm-1.68
) r8 = -0.978
Fig. 6. Variation of the microindentation hardness, HV, as a function ofthe temperature gradient for the directionally solidified In-21.5 at.%Bi-17.8 at.% Sn ternary eutectic alloy at a constant growth rate (V = 3.2µm/s).
Dependency of Microstructural Parameters and Microindentation Hardness on the Temperature... 581
Bi-Cd eutectic alloys, respectively. The exponential value of
0.11 is greater than the values of 0.05 and 0.04, which were
obtained respectively by Yllmaz and Elliott [25] for Al-Si
eutectic alloy and Kaya [24] for the Sn-Zn eutectic alloy
under similar solidification conditions.
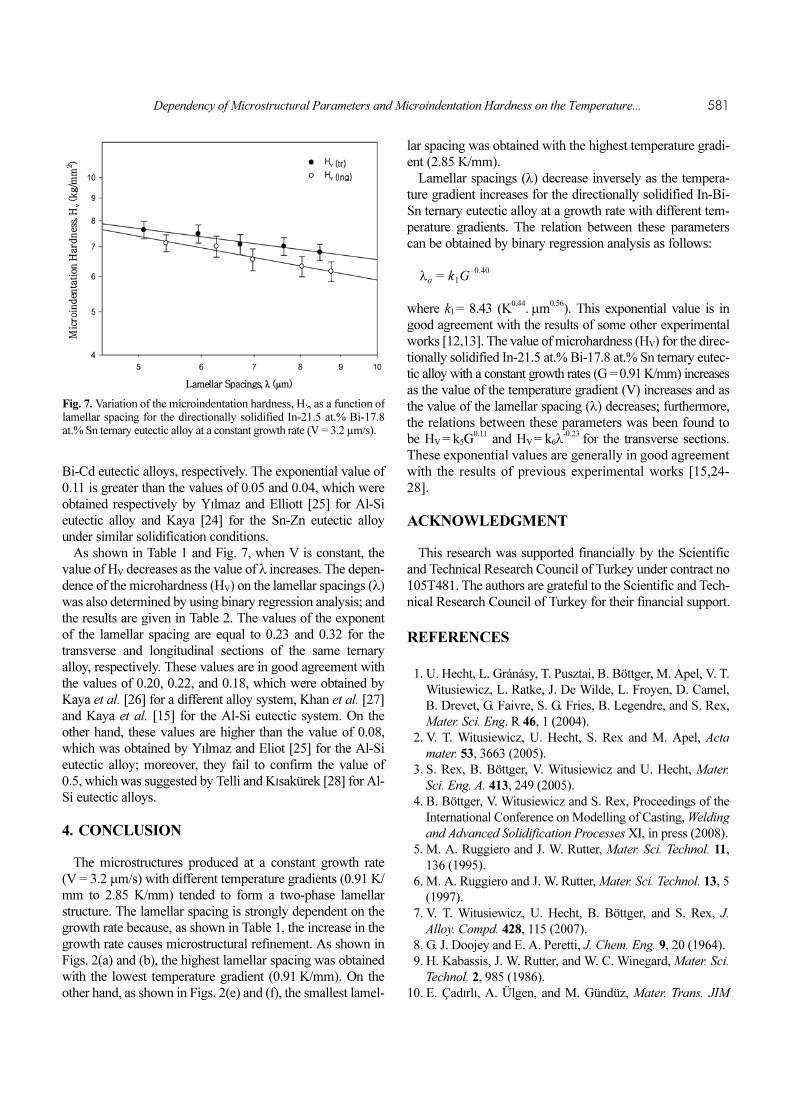
As shown in Table 1 and Fig. 7, when V is constant, the
value of HV decreases as the value of λ increases. The depen-
dence of the microhardness (HV) on the lamellar spacings (λ)
was also determined by using binary regression analysis; and
the results are given in Table 2. The values of the exponent
of the lamellar spacing are equal to 0.23 and 0.32 for the
transverse and longitudinal sections of the same ternary
alloy, respectively. These values are in good agreement with
the values of 0.20, 0.22, and 0.18, which were obtained by
Kaya et al. [26] for a different alloy system, Khan et al. [27]
and Kaya et al. [15] for the Al-Si eutectic system. On the
other hand, these values are higher than the value of 0.08,
which was obtained by Yllmaz and Eliot [25] for the Al-Si
eutectic alloy; moreover, they fail to confirm the value of
0.5, which was suggested by Telli and Klsakürek [28] for Al-
Si eutectic alloys.
4. CONCLUSION
The microstructures produced at a constant growth rate
(V = 3.2 μm/s) with different temperature gradients (0.91 K/
mm to 2.85 K/mm) tended to form a two-phase lamellar
structure. The lamellar spacing is strongly dependent on the
growth rate because, as shown in Table 1, the increase in the
growth rate causes microstructural refinement. As shown in
Figs. 2(a) and (b), the highest lamellar spacing was obtained
with the lowest temperature gradient (0.91 K/mm). On the
other hand, as shown in Figs. 2(e) and (f), the smallest lamel-
lar spacing was obtained with the highest temperature gradi-
ent (2.85 K/mm).
Lamellar spacings (λ) decrease inversely as the tempera-
ture gradient increases for the directionally solidified In-Bi-
Sn ternary eutectic alloy at a growth rate with different tem-
perature gradients. The relation between these parameters
can be obtained by binary regression analysis as follows:
where k1 = 8.43 (K0.44
. μm0.56
). This exponential value is in
good agreement with the results of some other experimental
works [12,13]. The value of microhardness (HV) for the direc-
tionally solidified In-21.5 at.% Bi-17.8 at.% Sn ternary eutec-
tic alloy with a constant growth rates (G = 0.91 K/mm) increases
as the value of the temperature gradient (V) increases and as
the value of the lamellar spacing (λ) decreases; furthermore,
the relations between these parameters was been found to
be HV = k5G0.11
and HV = k6λ-0.23
for the transverse sections.
These exponential values are generally in good agreement
with the results of previous experimental works [15,24-
28].
ACKNOWLEDGMENT
This research was supported financially by the Scientific
and Technical Research Council of Turkey under contract no
105T481. The authors are grateful to the Scientific and Tech-
nical Research Council of Turkey for their financial support.
REFERENCES
1. U. Hecht, L. Gránásy, T. Pusztai, B. Böttger, M. Apel, V. T.Witusiewicz, L. Ratke, J. De Wilde, L. Froyen, D. Camel,B. Drevet, G. Faivre, S. G. Fries, B. Legendre, and S. Rex,Mater. Sci. Eng. R 46, 1 (2004).
2. V. T. Witusiewicz, U. Hecht, S. Rex and M. Apel, Acta
mater. 53, 3663 (2005).3. S. Rex, B. Böttger, V. Witusiewicz and U. Hecht, Mater.
Sci. Eng. A. 413, 249 (2005).4. B. Böttger, V. Witusiewicz and S. Rex, Proceedings of the
International Conference on Modelling of Casting, Welding
and Advanced Solidification Processes XI, in press (2008).5. M. A. Ruggiero and J. W. Rutter, Mater. Sci. Technol. 11,
136 (1995).6. M. A. Ruggiero and J. W. Rutter, Mater. Sci. Technol. 13, 5
(1997).7. V. T. Witusiewicz, U. Hecht, B. Böttger, and S. Rex, J.
Alloy. Compd. 428, 115 (2007).8. G. J. Doojey and E. A. Peretti, J. Chem. Eng. 9, 20 (1964).9. H. Kabassis, J. W. Rutter, and W. C. Winegard, Mater. Sci.
Technol. 2, 985 (1986).10. E. Çadlrll, A. Ülgen, and M. Gündüz, Mater. Trans. JIM
λa
k1G0.40–
=
Fig. 7. Variation of the microindentation hardness, HV, as a function oflamellar spacing for the directionally solidified In-21.5 at.% Bi-17.8at.% Sn ternary eutectic alloy at a constant growth rate (V = 3.2 µm/s).
582 H. Kaya et al.
40, 989 (1999).11. D. G. McCartney, Ph. D. Thesis, p. 85, University of
Oxford, UK 85 (1981).12. M. Gündüz, H. Kaya, E. Çadlrll, and A. Özmen, Mat. Sci.
Eng. A 369, 215 (2004).13. E. Çadlrll, H. Kaya, and M. Gündüz, Mat. Res. Bull. 38,
1457 (2003).14. H. Kaya, E. Çadlrll, and M. Gündüz, J. Mat. Eng. Perf. 12,
456 (2003).15. H. Kaya, E. Çadlrll, M. Gündüz, and A. Ülgen, J. Mat.
Eng. Per. 12, 544 (2003).16. E. Çadlrll and M. Gündüz, J. Mat. Proceess. Tech. 97, 74
(2000).17. M. Hansen and K. Anderko, Constitutions of Binary Alloys,
p. 303, McGraw-Hill Book Company, New York (1958). 18. A. Ourdjini, J. Liu, and R. Elliott, Mater. Sci. Tech. 10, 312
(1994).19. G. Sharma, R. V. Ramanujan, and G. P. Tivari, Acta mater.
48, 875 (2000).20. J. M. Liu, Mat. Sci. Eng. A 157, 73 (1992).21. J. M. Liu, Z. C. Wu, and Z. G. Liu, Scripta metall. 27, 715
(1992).22. B. Toloui and A. Hellawell, Acta metallurgica 24, 565
(1976).23. H. Kaya, E. Çadlrll, and M. Gündüz, J. Mat. Proc. Tech.
183, 310 (2007).24. H. Kaya, Ph. D. Thesis, p. 114-128, University of Gazi,
Institute of Science and Technology Ankara, Turkey(2001).
25. F. Yllmaz and R. Elliott, J. Mat. Sci. 24, 2065 (1989).26. H. Kaya, M. Gündüz, E. Çadlrll, and O. Uzun, J. Mat. Sci.
39, 6571 (2004).27. S. Khan, A. Ourdjini, Q. S. Hamed, M. A. A. Najafabadi,
and R. Elliott, J. Mat. Sci. 28, 5957 (1993).28. A. Telli and S. E. Klsakürek, Mat. Sci and Tech. 4, 153
(1988).
Copyright © 2022 FDOKUMEN