Department of Finance Powerpoint Template
17
Epidemiology & economy Data as per 25 th November
-
Upload
khangminh22 -
Category
Documents
-
view
1 -
download
0
Transcript of Department of Finance Powerpoint Template

Epidemiology & economy
Data as per 25th November

2 An Roinn Airgeadais | Department of Finance
VIRUS INCIDENCE

3 An Roinn Airgeadais | Department of Finance
COVID-19 INCIDENCE – Ireland and other European countries
Source: ECDC, Dept of Finance calculations.
Ireland
first wave secondwave
Rolling 14-day incidence per 100,000 of the population
0
200
400
600
800
1000
1200
1400
1600
1800
2000
01/03/2020 01/04/2020 01/05/2020 01/06/2020 01/07/2020 01/08/2020 01/09/2020 01/10/2020 01/11/2020

4 An Roinn Airgeadais | Department of Finance
0
0.1
0.2
0.3
0.4
0.5
0.6
0.7
0.8
0.9
1
0
50
100
150
200
250
300Level 3
Level 3 effects Level 5 effects
Level 5
L3 + 14 days L5 + 14 days
COVID-19 INCIDENCE – Ireland in second wave14-day rolling average per 100,000 population
Source: ECDC, Dept of Finance calculations Up to 19th November..

5 An Roinn Airgeadais | Department of Finance
HEALTHCARE OUTCOMES

6 An Roinn Airgeadais | Department of Finance
COVID-19 HOSPITALISATION RATE – Ireland and other European Countries
Source: ECDC, Dept of Finance calculations. Up to 15th November.
Cases in hospital per 100,000 population
Ireland
first wave
second wave
0
10
20
30
40
50
60
70
80
90
02/02/2020 02/03/2020 02/04/2020 02/05/2020 02/06/2020 02/07/2020 02/08/2020 02/09/2020 02/10/2020 02/11/2020

7 An Roinn Airgeadais | Department of Finance
COVID-19 INTENSIVE CARE – Ireland and other European Countries
Source: ECDC, Dept of Finance calculations. Up to 13th November.
Ireland
first wave
Cases in intensive care per 100,000
second wave
0
2
4
6
8
10
12
14
27/03/2020 27/04/2020 27/05/2020 27/06/2020 27/07/2020 27/08/2020 27/09/2020 27/10/2020

8 An Roinn Airgeadais | Department of FinanceSource: ECDC, Dept of Finance calculations.
Ireland
Italyfirst
wavesecond wave
Rolling 14-day fatalities per million people
COVID-19 FATALITIES – Ireland and other European countries
0
50
100
150
200
250
300
350
12/03/2020 12/04/2020 12/05/2020 12/06/2020 12/07/2020 12/08/2020 12/09/2020 12/10/2020 12/11/2020

9 An Roinn Airgeadais | Department of Finance
TESTING

10 An Roinn Airgeadais | Department of Finance
COVID-19 TESTING – Ireland and other European Countries
Source: Hasell, J., Mathieu, E., Beltekian, D. et al. A cross-country database of COVID-19 testing. Sci Data 7, 345 (2020). https://doi.org/10.1038/s41597-020-00688-8, Dept of Finance calculations. Up to 20th November.
Rolling 7-day average of tests per 1,000 population
Ireland
0
1
2
3
4
5
6
7
8
9
10
27/01/2020 27/02/2020 27/03/2020 27/04/2020 27/05/2020 27/06/2020 27/07/2020 27/08/2020 27/09/2020 27/10/2020
11 An Roinn Airgeadais | Department of Finance
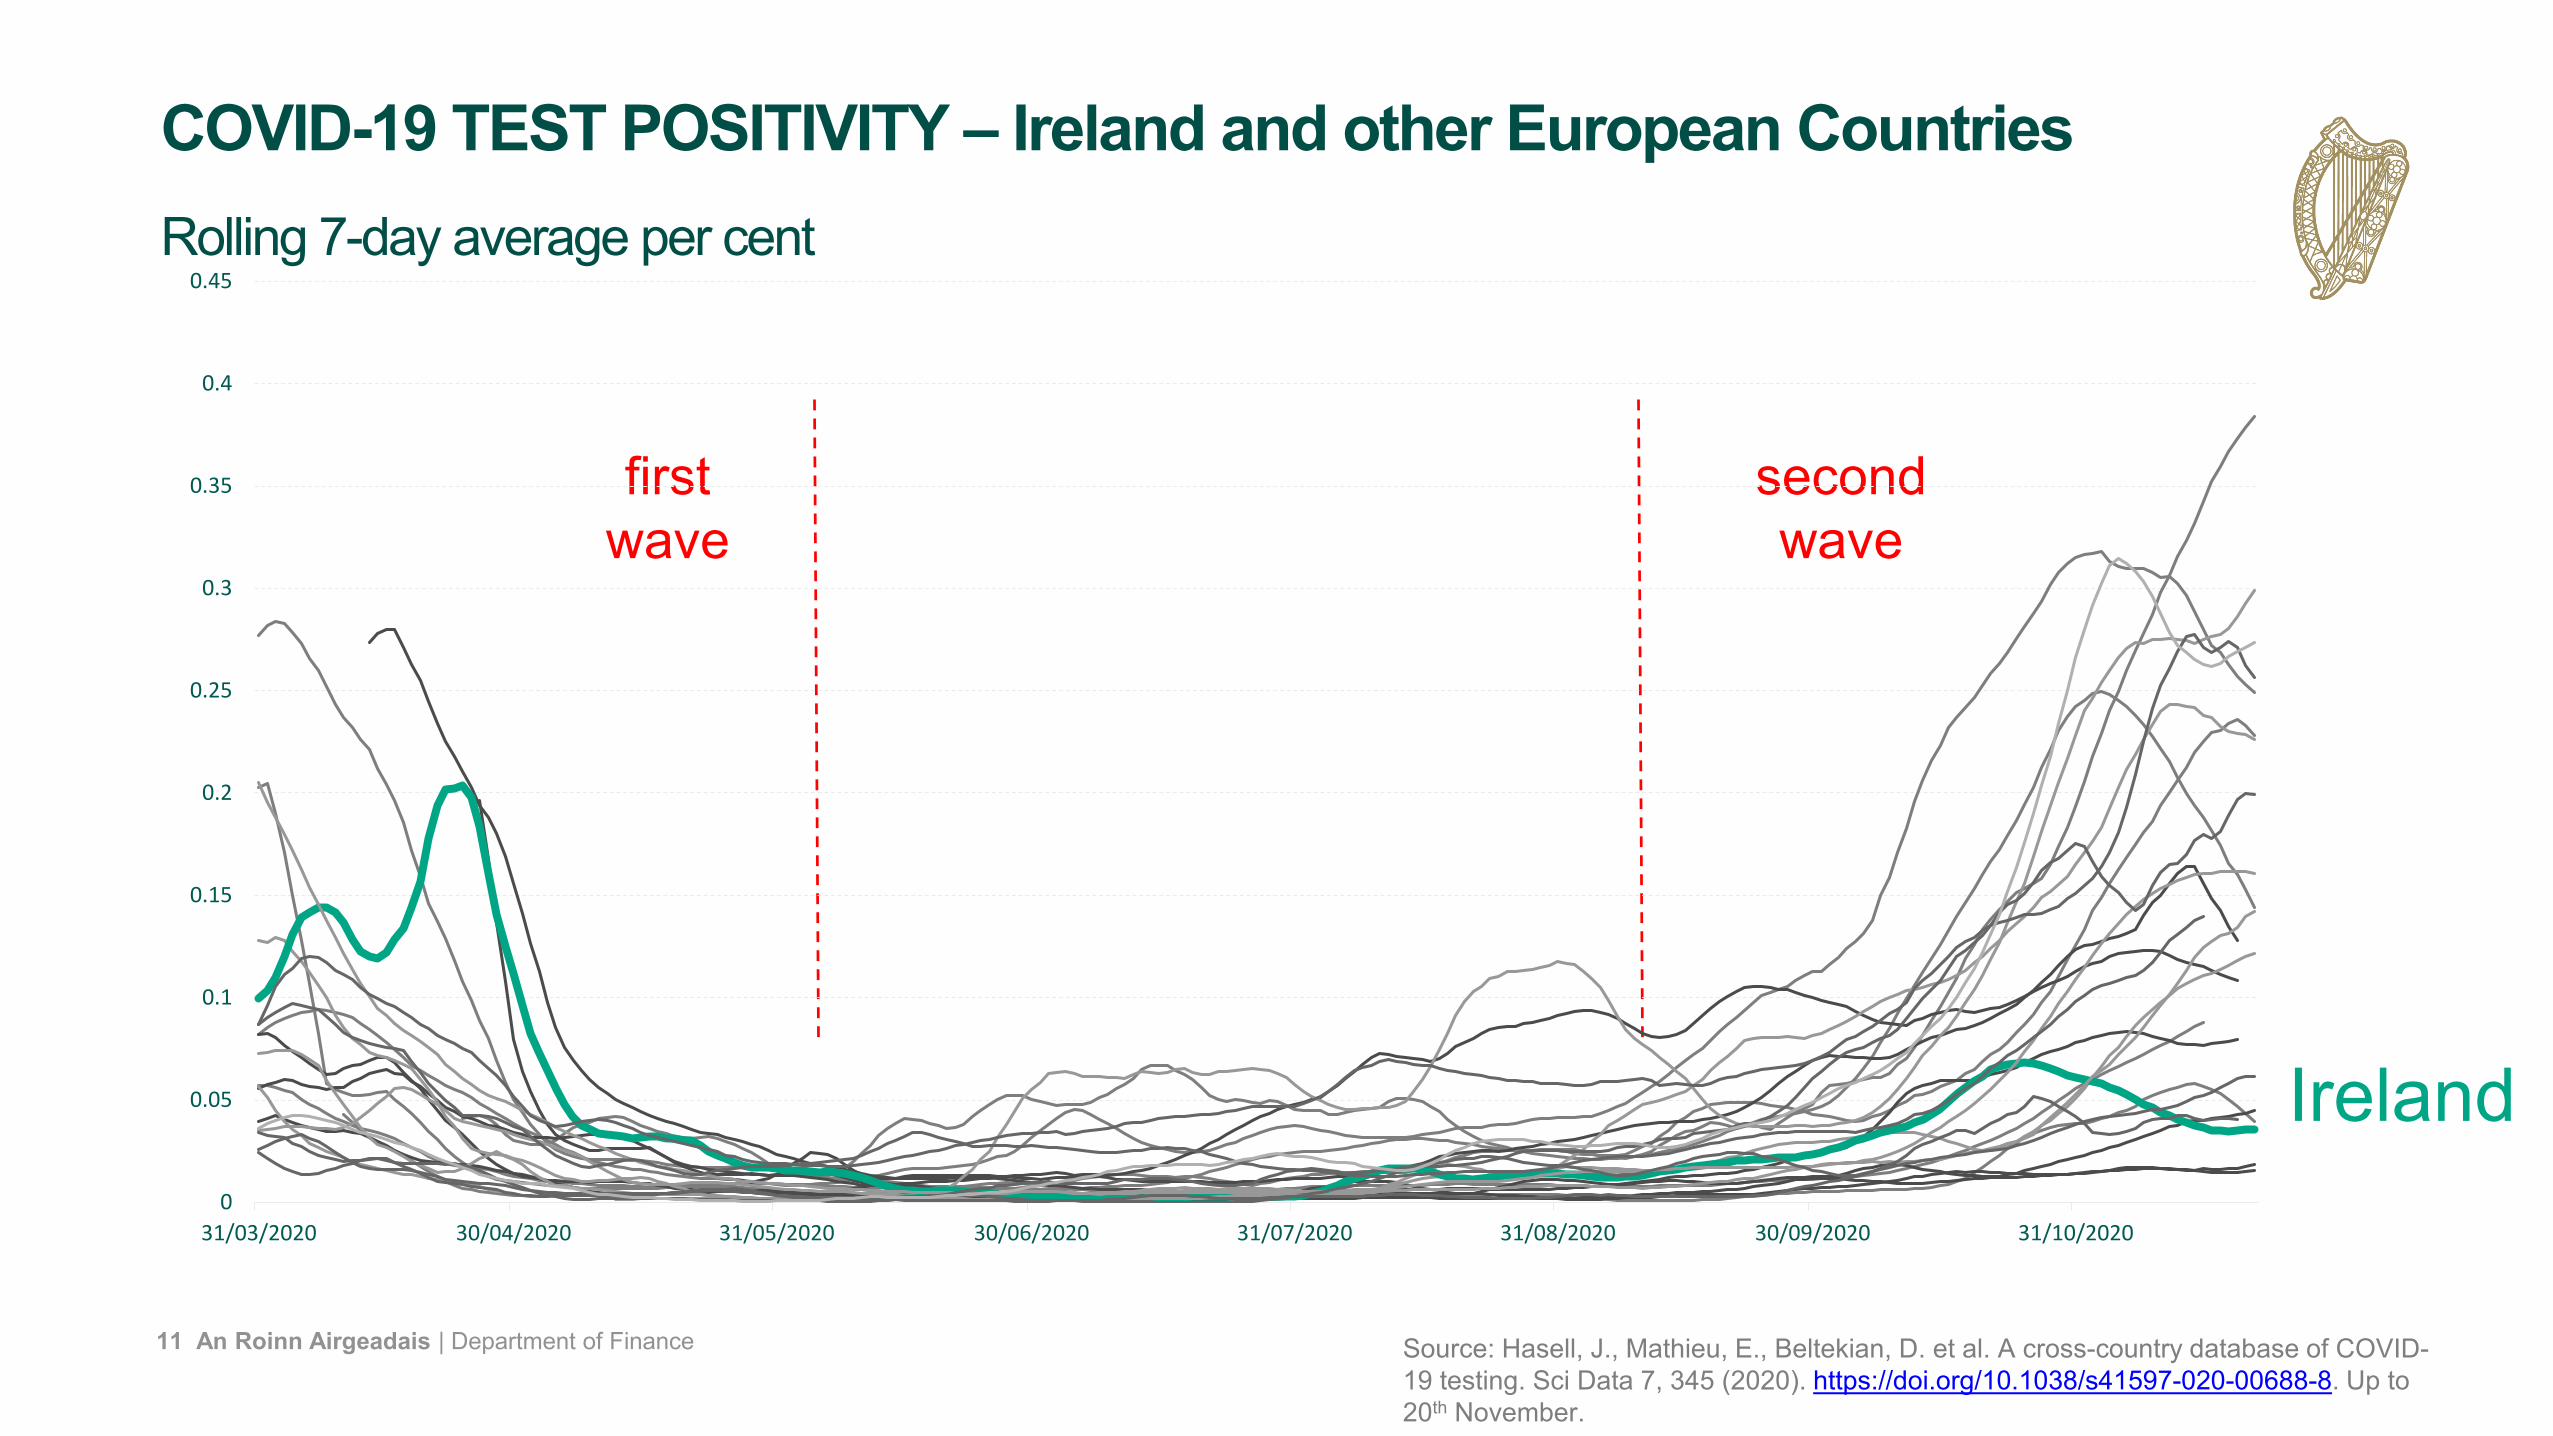
COVID-19 TEST POSITIVITY – Ireland and other European Countries
Source: Hasell, J., Mathieu, E., Beltekian, D. et al. A cross-country database of COVID-19 testing. Sci Data 7, 345 (2020). https://doi.org/10.1038/s41597-020-00688-8. Up to 20th November.
Rolling 7-day average per cent
first wave
second wave
0
0.05
0.1
0.15
0.2
0.25
0.3
0.35
0.4
0.45
31/03/2020 30/04/2020 31/05/2020 30/06/2020 31/07/2020 31/08/2020 30/09/2020 31/10/2020
Ireland

12 An Roinn Airgeadais | Department of Finance
LOCKDOWN STRINGENCY AND ECONOMY

13 An Roinn Airgeadais | Department of Finance
COVID-19 : Oxford Lockdown Stringency Index
Source: University of Oxford. Up to 23rd
November.
100 = most stringent; 0 = least stringent
Irelanddark grey = 3 most stringent[DE, ES, PT]
light grey = 3least stringent[EE, HR, LT]
0
10
20
30
40
50
60
70
80
90
100
01/02/2020 01/03/2020 01/04/2020 01/05/2020 01/06/2020 01/07/2020 01/08/2020 01/09/2020 01/10/2020 01/11/2020

14 An Roinn Airgeadais | Department of Finance
Lockdown stringency vs. GDP impact
AT BE
BG
CY
CZDE
DKEE
ES
FI
FR
GB
HRHUIE (MDD)
IT
LTLU LV
NL PL
PT
RO
SI
SK
-25%
-20%
-15%
-10%
-5%
0%50 55 60 65 70 75 80 85
2020
Q2
GDP
fall
Oxford Stringency Index (Q2 avg.)
Source: Department of Finance calculations

15 An Roinn Airgeadais | Department of Finance
A FRAMEWORK FOR THINKING ABOUT TRADE-OFFS

16 An Roinn Airgeadais | Department of Finance
Health / Economic Trade Off
Source: ECDC, HPSC (COVID-19 confirmed deaths),CSO (UCOD), Dept of Finance calculations.Data: To 31st October 2020Adapted from The Financial Times
ATDE
ES
FI
FR
GB
IE (MDD) IT
LT LU
NL
PT
SI
IE (GDP)
IE (Confirmed deaths only, MDD)IE(UCOD* only, MDD)
-30%
-25%
-20%
-15%
-10%
-5%
0%0 100 200 300 400 500 600 700 800 900 1000
2019
Q4-
2020
Q2
GDP
fall
COVID-19 deaths per million population
Fewer DeathsSmaller economic hit
Fewer DeathsLarger economic hit
More DeathsLarger economic hit
More DeathsSmaller economic hit
EU average deaths per million population (308)
EU avg H2 GDP fall(-14.3%)
*UCOD: Underlying cause of deathNote: UCOD data is only available up to 31st October; in order to ensure like-with-like, the average death rate for the ECDC data is alsocalculated and presented on the basis of data to end-October. If all ECDC data were used (i.e. data up to 25/11/20), the average death ratewould be 426 per million instead of 308.

17 An Roinn Airgeadais | Department of Finance
Policy trilemma – graphical illustrationHEALTH
OUTCOMES
ECONOMIC OUTCOMES
SOCIETAL OUTCOMES
SWEET SPOT