
Department of Physiotherapy faculty of allIED medical sciences
Upload
khangminh22Category
view
1download
0
DEPARTMENT OF CIVIL ENGINEERING
FACULTY OF ENGINEERING & TECHNOLOGY
TRANSPORTATION ENGINEERING – I (Highway Engineering)
Topics to be covered:
Speed Study
Spot Speed Study
Methods used for Spot Speed Study
Presentation of Data
Speed and Delay Study
Methods used for Spot Speed Study
PREPARED BY:
SHASHIKANT SRIVASTAVA
ASSISTANT PROFESSOR DEPARTMENT
OF CIVIL ENGINEERING
FACULTY OF ENGINEERING & TECHNOLOGY
RAMA UNIVERSITY UTTAR PRADESH, KANPUR (INDIA)
SPEED STUDY :
Speed data is needed for a variety of traffic analyses.
Spot speed data refers to measurement of individual speeds of vehicles passing a point on a roadway. Care must be taken to conduct
the study appropriately so that the sample data will adequately reflect speed characteristics of the population.
Traffic flow is influenced by the speed of the traffic on existing roads.
Speed is a function of several factors such as the geometric design features, traffic conditions like the presence of other vehicles, time
and place, the environment, and the driver, and the traffic system in general.
Speed studies and speed-delay studies are useful in several ways such as:
(i) Designing geometric feature of the highway
(ii) Planning traffic regulation and control measures
(iii) Studying traffic capacity of a highway
(iv) Accident studies
(v) Cost-benefit analysis of a highway project
(vi) Studying traffic trends for future use.
The different types of speed considered are:
SPOT SPEED: This is the instantaneous speed of a vehicle at a specified location.
RUNNING SPEED: This is the average speed maintained by a vehicle over a given stretch of highway while the vehicle is
actually in motion; the clause “while the vehicle is actually in motion” is significant because the running speed is determined by
dividing the length of the stretch by the time for which the vehicle is in motion (The running time excludes that part of the journey time
for which the vehicle suffers delay, for example, at controlled intersections.)
SPEED STUDY :
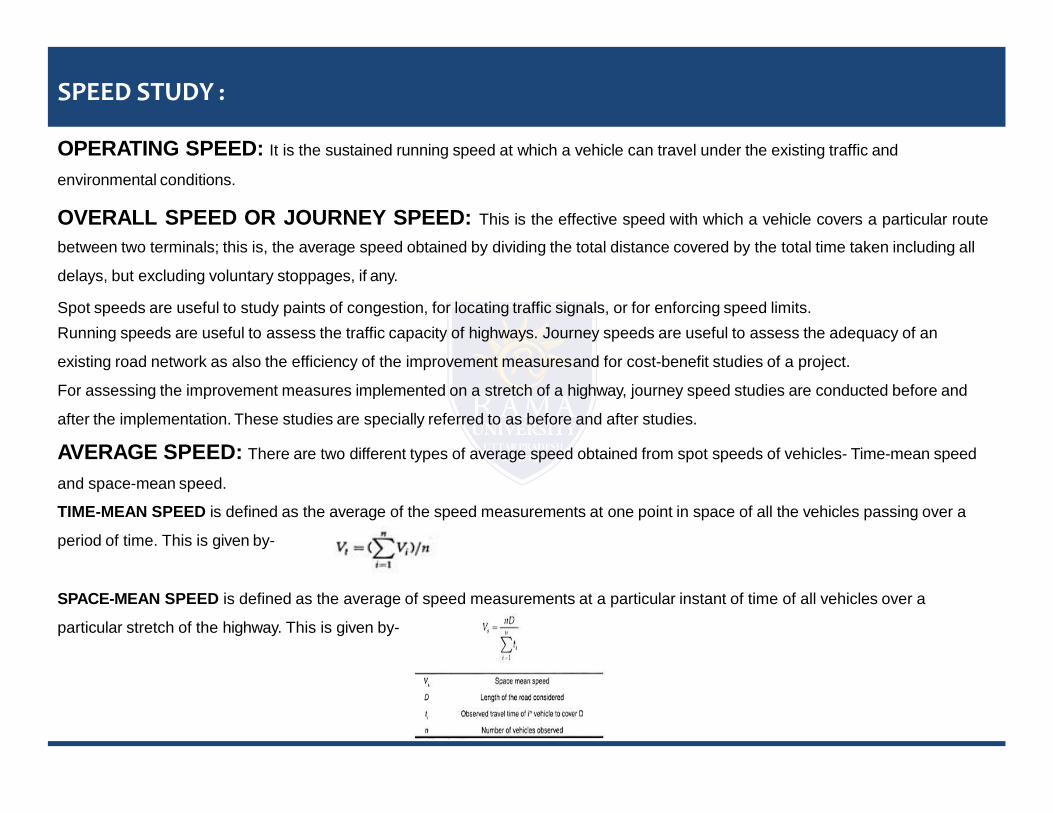
OPERATING SPEED: It is the sustained running speed at which a vehicle can travel under the existing traffic and
environmental conditions.
OVERALL SPEED OR JOURNEY SPEED: This is the effective speed with which a vehicle covers a particular route
between two terminals; this is, the average speed obtained by dividing the total distance covered by the total time taken including all
delays, but excluding voluntary stoppages, if any.
Spot speeds are useful to study paints of congestion, for locating traffic signals, or for enforcing speed limits.
Running speeds are useful to assess the traffic capacity of highways. Journey speeds are useful to assess the adequacy of an
existing road network as also the efficiency of the improvement measures and for cost-benefit studies of a project.
For assessing the improvement measures implemented on a stretch of a highway, journey speed studies are conducted before and
after the implementation. These studies are specially referred to as before and after studies.
AVERAGE SPEED: There are two different types of average speed obtained from spot speeds of vehicles- Time-mean speed
and space-mean speed.
TIME-MEAN SPEED is defined as the average of the speed measurements at one point in space of all the vehicles passing over a
period of time. This is given by-
SPACE-MEAN SPEED is defined as the average of speed measurements at a particular instant of time of all vehicles over a
particular stretch of the highway. This is given by-
SPOT SPEED STUDIES :
SPOT SPEED STUDIES : Speed is an important transportation consideration because it relates to safety, time, comfort,
convenience, and economics. Spot speed studies are used to determine the speed distribution of a traffic stream at a specific
location. The data gathered in spot speed studies are used to determine vehicle speed percentiles, which are useful in making many
speed-related decisions. Spot speed data have a number of safety applications, including the following :
1. Determining existing traffic operations and evaluation of traffic control devices
a. Evaluating and determining proper speed limits
b. Determining the 50th and 85th speed percentiles
c. Evaluating and determining proper advisory speeds
d. Establishing the limits of no-passing zones
e. Determining the proper placements of traffic control signs and markings
f. Setting appropriate traffic signal timing
2. Establishing roadway design elements
a. Evaluating and determining proper intersection sight distance
b. Evaluating and determining proper passing sight distance
c. Evaluating and determining proper stopping sight distance
3. Assessing roadway safety questions
a. Evaluating and verifying speeding problems
b. Assessing speed as a contributor to vehicle crashes
c. Investigating input from the public or other officials
4. Monitoring traffic speed trends by systematic ongoing speed studies
5. Measuring effectiveness of traffic control devices or traffic programs, including signs and markings, traffic operational changes,
and speed enforcement programs.
METHODS OF MEASURING SPOT SPEEDS:
The methods available for spot speed measurement may be classified as:
1. Direct observation of the time taken by a vehicle to cover a known distance.
2. Radar speedometer method.
3. Electronic meter method
4. Photographic methods.
The direct observation method can be further classified to long-base method and short-base method.
The long-base method is sub-divided to:
(i) Direct measurement of time
(ii) Enoscope Method
(iii) Pressure contact tubes.
Section of the Observation Point:
The criteria for this are:
1) Appropriate location for the specific purpose of study, intersection zones
2) Minimum influence of the observers and equipment on the driver and their speeds
3) Straight and level section of the highway to minimise the effect of geometric elements and roadside developments.
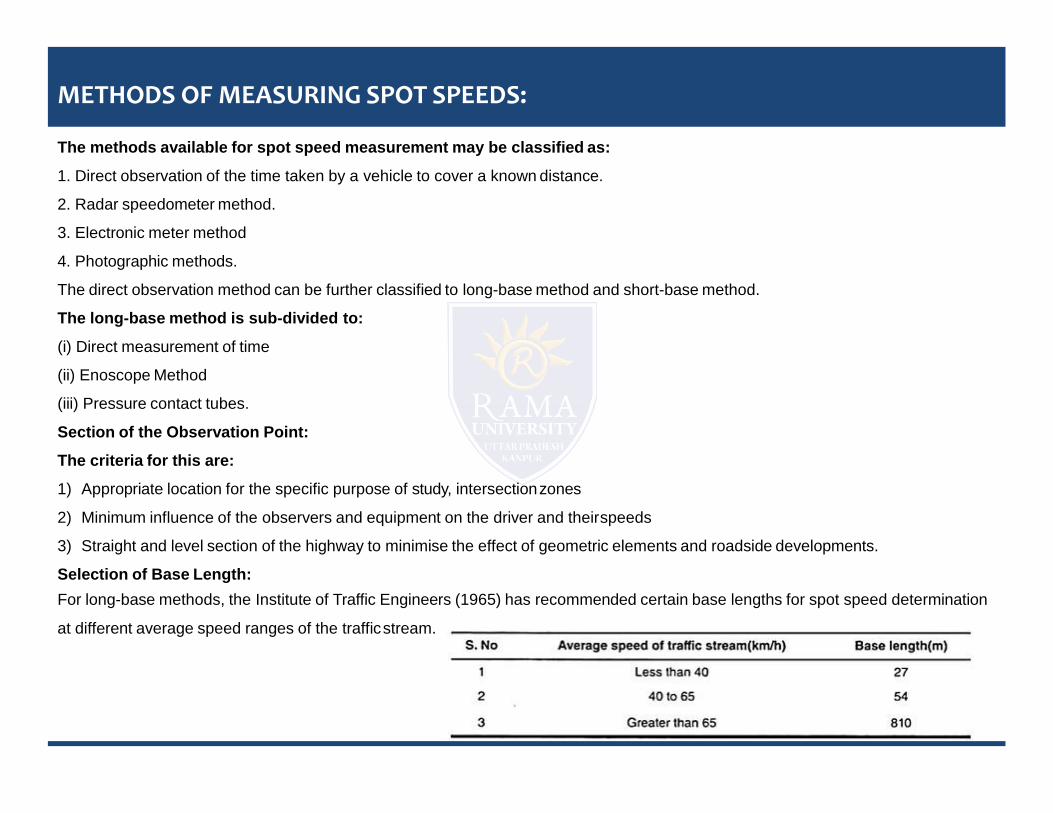
Selection of Base Length:
For long-base methods, the Institute of Traffic Engineers (1965) has recommended certain base lengths for spot speed determination
at different average speed ranges of the traffic stream.
METHODS OF MEASURING SPOT SPEEDS:
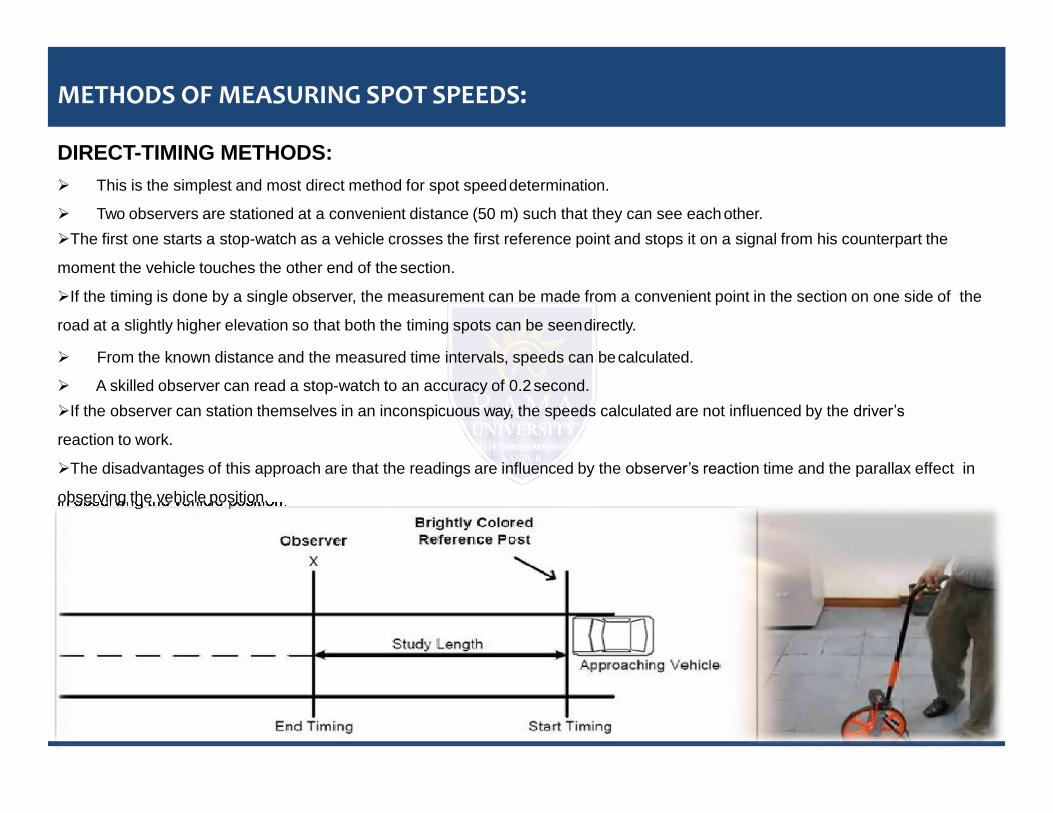
DIRECT-TIMING METHODS:
This is the simplest and most direct method for spot speed determination.
Two observers are stationed at a convenient distance (50 m) such that they can see each other.
The first one starts a stop-watch as a vehicle crosses the first reference point and stops it on a signal from his counterpart the
moment the vehicle touches the other end of the section.
If the timing is done by a single observer, the measurement can be made from a convenient point in the section on one side of the
road at a slightly higher elevation so that both the timing spots can be seen directly.
From the known distance and the measured time intervals, speeds can be calculated.
A skilled observer can read a stop-watch to an accuracy of 0.2 second.
If the observer can station themselves in an inconspicuous way, the speeds calculated are not influenced by the driver’s
reaction to work.
The disadvantages of this approach are that the readings are influenced by the observer’s reaction time and the parallax effect in
observing the vehicle position.
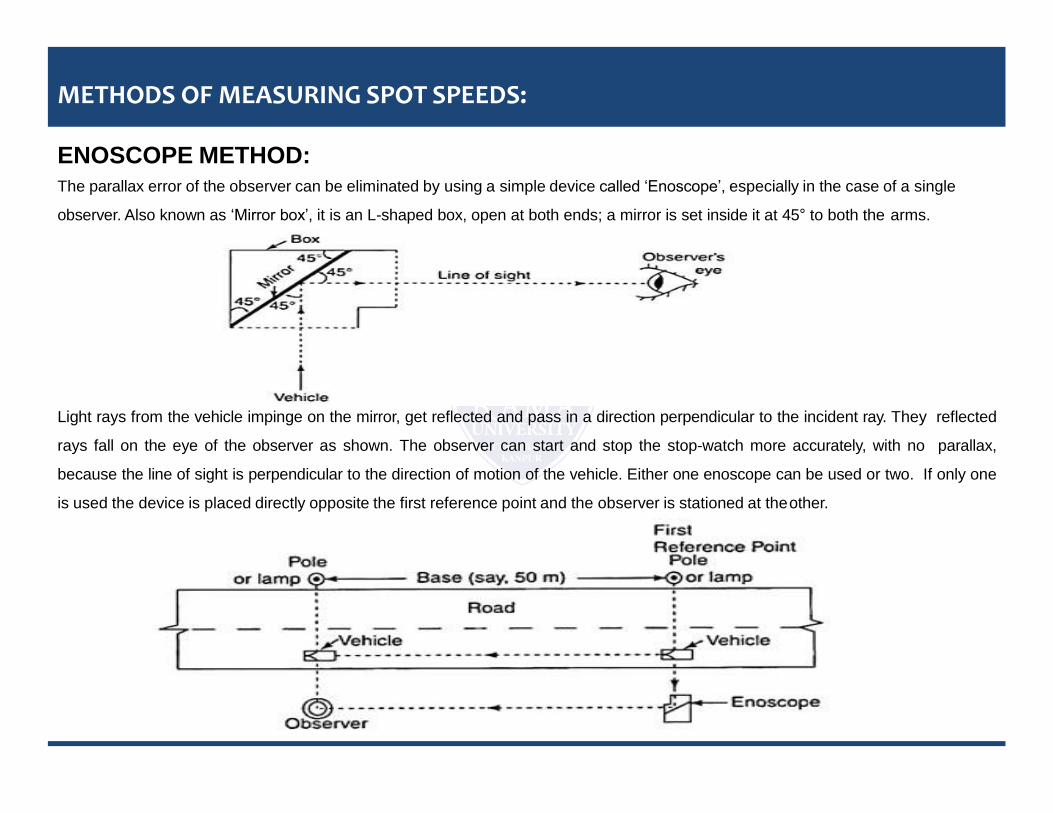
ENOSCOPE METHOD:
The parallax error of the observer can be eliminated by using a simple device called ‘Enoscope’, especially in the case of a single
observer. Also known as ‘Mirror box’, it is an L-shaped box, open at both ends; a mirror is set inside it at 45° to both the arms.
METHODS OF MEASURING SPOT SPEEDS:
Light rays from the vehicle impinge on the mirror, get reflected and pass in a direction perpendicular to the incident ray. They reflected
rays fall on the eye of the observer as shown. The observer can start and stop the stop-watch more accurately, with no parallax,
because the line of sight is perpendicular to the direction of motion of the vehicle. Either one enoscope can be used or two. If only one
is used the device is placed directly opposite the first reference point and the observer is stationed at the other.
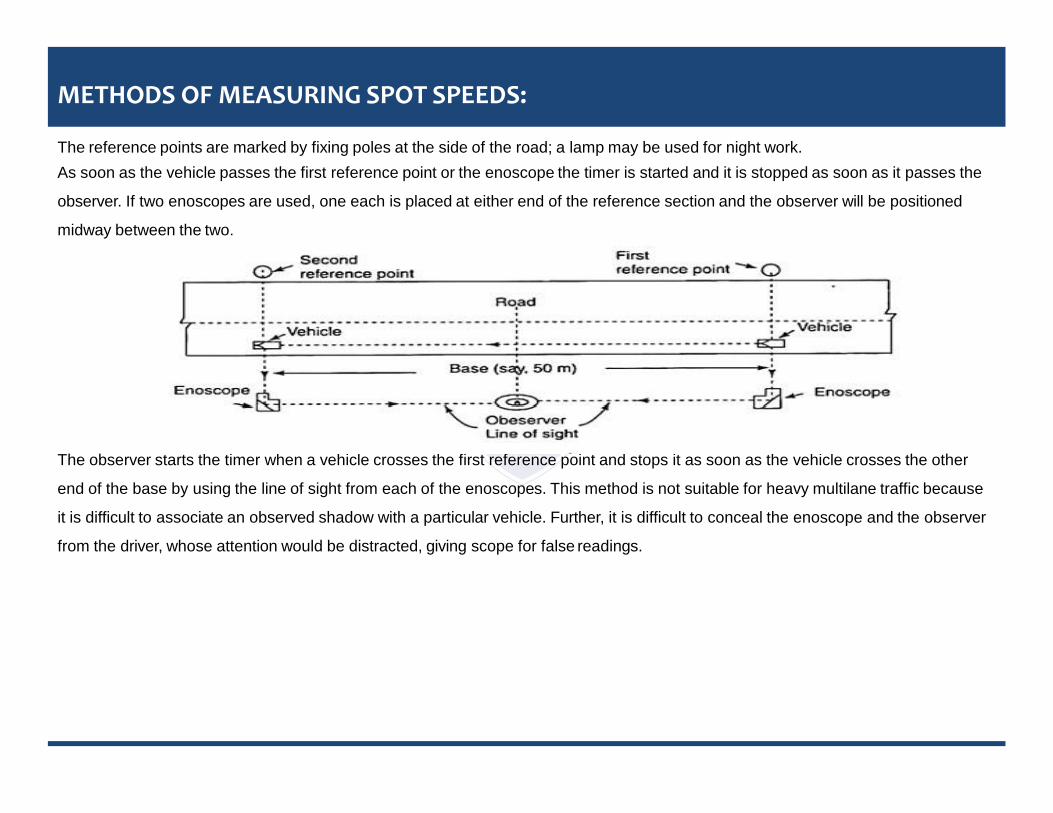
The reference points are marked by fixing poles at the side of the road; a lamp may be used for night work.
As soon as the vehicle passes the first reference point or the enoscope the timer is started and it is stopped as soon as it passes the
observer. If two enoscopes are used, one each is placed at either end of the reference section and the observer will be positioned
midway between the two.
METHODS OF MEASURING SPOT SPEEDS:
The observer starts the timer when a vehicle crosses the first reference point and stops it as soon as the vehicle crosses the other
end of the base by using the line of sight from each of the enoscopes. This method is not suitable for heavy multilane traffic because
it is difficult to associate an observed shadow with a particular vehicle. Further, it is difficult to conceal the enoscope and the observer
from the driver, whose attention would be distracted, giving scope for false readings.
METHODS OF MEASURING SPOT SPEEDS:
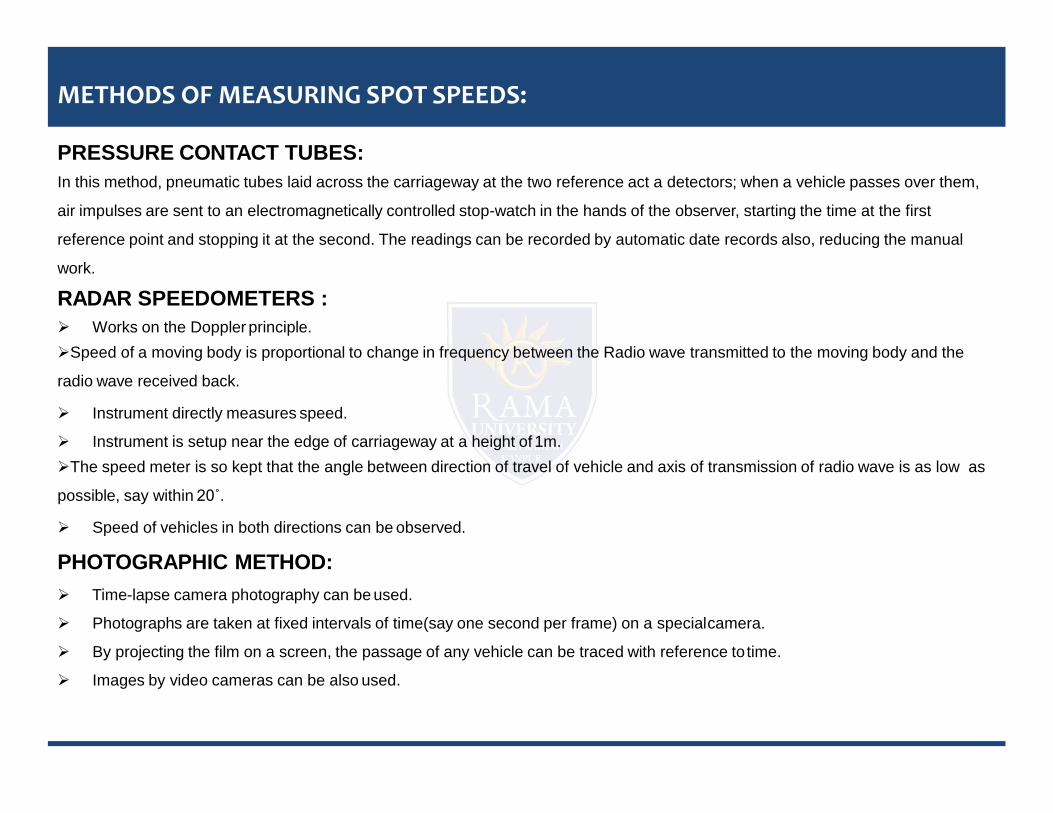
PRESSURE CONTACT TUBES:
In this method, pneumatic tubes laid across the carriageway at the two reference act a detectors; when a vehicle passes over them,
air impulses are sent to an electromagnetically controlled stop-watch in the hands of the observer, starting the time at the first
reference point and stopping it at the second. The readings can be recorded by automatic date records also, reducing the manual
work.
RADAR SPEEDOMETERS :
Works on the Doppler principle.
Speed of a moving body is proportional to change in frequency between the Radio wave transmitted to the moving body and the
radio wave received back.
Instrument directly measures speed.
Instrument is setup near the edge of carriageway at a height of 1m.
The speed meter is so kept that the angle between direction of travel of vehicle and axis of transmission of radio wave is as low as
possible, say within 20˚.
Speed of vehicles in both directions can be observed.
PHOTOGRAPHIC METHOD:
Time-lapse camera photography can be used.
Photographs are taken at fixed intervals of time(say one second per frame) on a special camera.
By projecting the film on a screen, the passage of any vehicle can be traced with reference to time.
Images by video cameras can be also used.
PRESENTATION OF DATA :
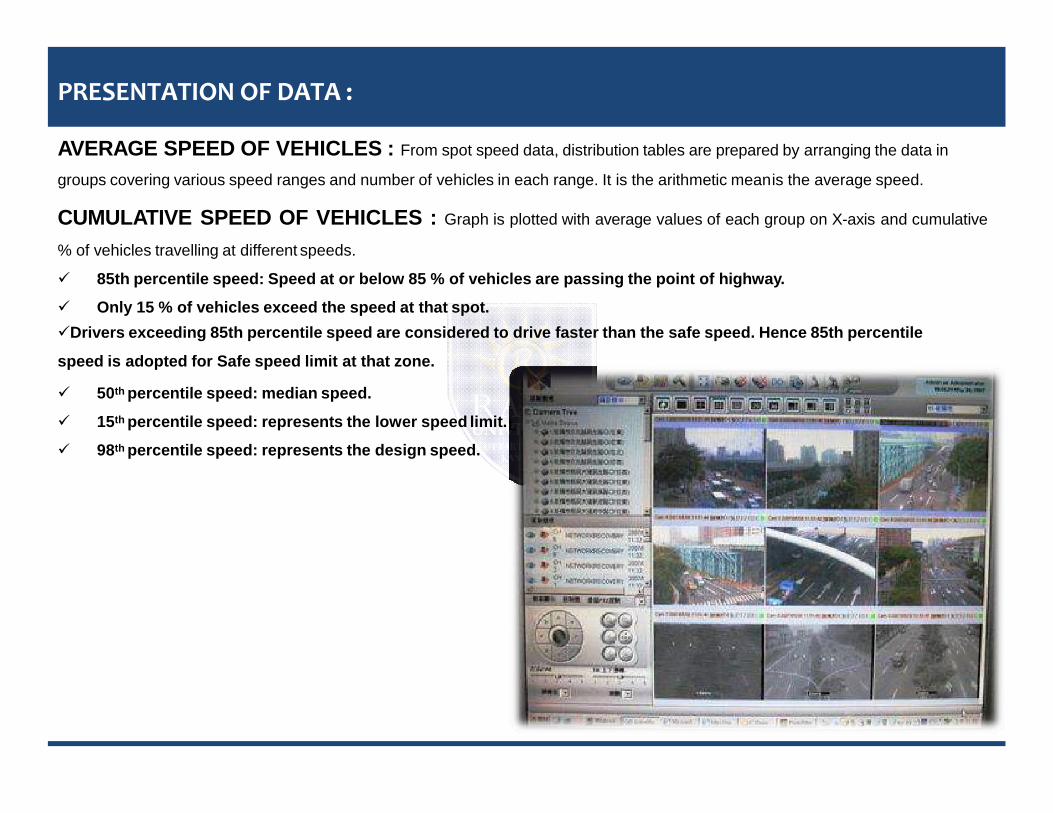
AVERAGE SPEED OF VEHICLES : From spot speed data, distribution tables are prepared by arranging the data in
groups covering various speed ranges and number of vehicles in each range. It is the arithmetic mean is the average speed.
CUMULATIVE SPEED OF VEHICLES : Graph is plotted with average values of each group on X-axis and cumulative
% of vehicles travelling at different speeds.
85th percentile speed: Speed at or below 85 % of vehicles are passing the point of highway.
Only 15 % of vehicles exceed the speed at that spot.
Drivers exceeding 85th percentile speed are considered to drive faster than the safe speed. Hence 85th percentile
speed is adopted for Safe speed limit at that zone.
50th percentile speed: median speed.
15th percentile speed: represents the lower speed limit.
98th percentile speed: represents the design speed.
SPEED AND DELAY STUDY :
A travel time study determines the average time required and also the amount of delay caused on a given route. Delay is the extra
time spent by drivers against their expectation. Data obtained from travel time and delay studies give a good indication of the level of
service on the study section. These data aids the traffic engineer in identifying locations like presence of intersections, which may
require special attention in order to improve the overall flow of traffic on the route. Speed and delay studies give running speeds,
overall speeds, fluctuations in speed and delay between two stations of a road spaced far apart. They also give the information such
as amount, location, duration, frequency and causes of the delay in the traffic stream. There can be different forms of delay depending
on location:
STOPED TIME DELAY : It is the delay during which the vehicles is at rest.
APPROACH DELAY : It is due to deceleration to and acceleration from a stop to stopped time delay.
TIME IN QUEUE DELAY : It is the time between a vehicle joinin the end of the queue at a signalized or stop controlled intersectio
and the tie it crosses the intersection (stop line).
CONTROL DELAY (OR FIXED DELAY) : It is the delay caused by controlled device such as signals, includes both approach delay
and time-in-queue delay.
OPERATIONAL DELAY : It is the delay caused due to impedance of other traffic.
There are several methods to conduct travel time and delay studies, namely :
a) Floating Car Technique (requires test vehicle)
b) Average Speed Technique (requires test vehicle)
c) Moving Vehicle Technique (requires test vehicle)
d) License Plate observations.
e) Interview.
f) Its Advanced Technologies.
METHODS OF SPEED AND DELAY STUDY :
FLOATING CAR TECHNIQUE :
In the floating car method, a test vehicle is driven over a given course of travel at approximately the average speed of the stream,
thus trying to float with the traffic stream.
A number of test runs are made along the study stretch and a group of observers the various the details. One observer is seated in
the floating car with two stop watches. One of the stop watches is used to record the time at various control points like intersections,
bridges or any other fixed points in each trip. The other stop watch is used to find the duration of individual delays.
The time, location cause of these delays are recorded by the second observer either or suitable tabular forms or by voice recordings
equipment. The number of vehicles overtaking the test vehicle and that overtaken by the test vehicle are noted in each trip by a third
observer. The number of vehicles travelling in the opposite direction in each trip is noted by a fourth observer.
However in mixed traffic flow, more number of observers will be required to count the vehicles of different classes.
In this method the detailed information is obtained concerning all phases of speed and delay including locations, durations and
causes of delay.
The average journey time T (minute) in the direction of flow q is given by:
q = average volume = (na+ny)/(ta+tw)
T = average Journey time = tw-(ny/q)
Where , q = flow of vehicles (volume per minute), in one direction of the stream
na = average number of vehicles counted in the direction of the stream when the test vehicle travels in the opposite direction
ny = the average number of vehicles overtaking test vehicle minus the number of vehicles overtaken when test in the direction of q
tw = average journey time, in minute when the test vehicle is travelling with the stream q
ta = average journey time, in minute when test vehicle is running against the stream q
METHODS OF SPEED AND DELAY STUDY :
LICENSE PLATE METHOD :
In the license plate or vehicle number method, synchronized stop watches or voice recording equipment are used.
Observers are stationed at the entrance and exit of a test section where information of travel time is required.
The timings and vehicles numbers are noted by the observers of the selected sample.
From the office computations, travel time of each vehicle could be found.
But this method does not give important details like causes of delays, delay duration and number of intersections within the test
section.
In this method observers are stationed at the ends of measuring section, about 0.5-1.00 km long.
The time and registration number of the vehicles entering and leaving the section are noted using synchronized watches.
By watching the registration numbers later, the journey times and speed can be determined. If the traffic is too heavy to record,
some methods of sampling can be adopted. For instance, noting down only numbers ending with an odd number will yield a 50 per
cent sample.
The vehicle classification can also be noted in this method thus yielding this additional information. The accuracy that is
possible in recording time is about +0.01 minutes, which then gives an accuracy of 1 to 2 percent for journeys lasting about one
minute.
The watches are supported on the recording board and are slowed to run continuously. Watches divided in to tenths and
hundredths of a minute are desirable as they facilitate subsequent analysis.
Duration more than two hours is likely to cause undue strain on the observers. Two observers are normally employed for each
direction of travel, one for nothing the registration number and calling the same, the other for recording it along with the time.
Two observers can record at the rate of about 300 vehicles per hour.
METHODS OF SPEED AND DELAY STUDY :
INTERVIEW TECHNIQUE : In the interview technique, the work can be completed in a short time by interviewing and
collecting details from the road users on the spot. However the data collected may not provide with all details correctly.
ELEVATED OBSERVER TECHNIQUE :
Elevated observations and photographic technique are useful for studying short test sections like intersection etc.
The method is well suited to study the speeds along different roads in an area.
Since conditions may vary from section to section on the route, the route is divided into convenient sections, say 0.75 to 1.5 km in
length; it is desirable to have the ends of these sections at major intersections so that large discontinuous speed and flow do not
occur inside the section.
It is convenient to have the routes to be closed circuits in either direction.
Intersection delays studies need special attention as this is one of the major problems of many metropolitan cities.
Such studies at each intersection will help in evaluating the efficiency and effectiveness of the control device like signal system, the
remedial measures for accidents etc.
Copyright © 2022 FDOKUMEN