Department of Civil and Structural Engineering - CORE
196
UNIVERSITY OF SHEFFIELD Department of Civil and Structural Engineering The Structural Response of Industrial Portal Frame Structures in Fire By Shao Young Wong A thesis submitted in partial fulfilment of the requirements for the Degree of Doctor of Philosophy May 2001
-
Upload
khangminh22 -
Category
Documents
-
view
3 -
download
0
Transcript of Department of Civil and Structural Engineering - CORE

UNIVERSITY OF SHEFFIELD
Department of Civil and Structural Engineering
The Structural Response of Industrial Portal Frame
Structures in Fire
By
Shao Young Wong
A thesis submitted in partial fulfilment of the requirements for the Degree of Doctor of Philosophy
May 2001
ABSTRACT
A number of recent fires in single-storey warehouses have drawn attention to a
current lack of understanding about the structural response of industrial portal frame
structures to elevated temperatures. This research project has investigated the
subject by conducting fire tests on a scaled model and by computer modelling using the non-linear finite element program VULCAN. This program has been developed
in-house by the University of Sheffield and is capable of modelling the behaviour of three-dimensional steel and composite frames at elevated temperatures. It has been
validated throughout its development. An initial investigation was conducted to
validate the program for analysing inclined members, which form part of a pitched-
roof portal frame, but for which it was not initially developed. Additional features
were implemented into the program where necessary.
A series of indicative fire tests was conducted at the Health and Safety Laboratories,
Buxton. A scaled portal frame model was designed and built, and three major fire
tests were conducted in this structure. In the third of these tests the heated rafters
experienced a snap-through failure mechanism, in which fire hinges could clearly be
identified. The experimental results were then used for validating the numerical
results produced by VULCAN analyses. The correlations were relatively close, both
for predictions of displacements and failure temperatures. This gave increased
confidence in using VULCAN to conduct a series of parametric studies. The
parametric studies included two- and three-dimensional analyses, and a number of
parameters were investigated, including the effects of vertical and horizontal load,
frame geometry, heating profiles and base rotational stiffness. The influence of
secondary members was investigated in the three-dimensional studies using different
fire scenarios.
A simplified calculation method has been developed for estimating the critical
temperatures of portal frames in fire. The results compare well with predictions from
VULCAN. The current guidance document for portal frames in boundary conditions has been reviewed, and the concept of performance-based design for portal frame
structures has been discussed.

CONTENTS
LIST OF FIGURES ............................................................................ v
LIST OF TABLES ........................................................................... ix
NOTATIONS ................................................................................. xii
ACKNOWLEDGEMENT ................................................................ xiii
DECLARATION ............................................................................ xiii
1 INTRODUCTION ............................................................................................. 1
1.1 FIRE CONCEPTS ...............................................................................................
2
1.2 STEEL PROPERTIES AT ELEVATED TEMPERATURE ............................................
4
1.3 STEEL PORTAL FRAME DESIGN AND CONSTRUCTION .......................................
9
1.3.1 Portal Frames in Fire ........................................................................... 10
1.4 STRUCTURAL COMPUTER MODELLING .......................................................... 13
1.4.1 VULCAN .............................................................................................. 13
1.4.2 The Application of VULCAN ................................................................
16
1.5 LAYOUT AND SCOPE OF RESEARCH ...............................................................
16
2 PRELIMINARY STUDIES ON VULCAN AND PORTAL FRAMES IN FIRE ................................................................................................................. 19
2.1 RATIONALISATION OF VULCAN ................................................................... 19
2.1.1 The Effect of Strain Degrees of Freedom ..............................................
20
2.1.2 Inclined Structural Element ..................................................................
21
2.2 MODIFICATION OF RAMBERG-OSGOOD MODEL .............................................
25
2.3 ROTATIONAL STIFFNESS OF SEMI-RIGID CONNECTION ...................................
28
2.4 SOLUTION PROCEDURE FOR VULCAN ..........................................................
32
2.5 INITIAL STUDIES OF PORTAL FRAMES IN FIRE ................................................
35
2.5.1 Goal-Post Portal Frame ....................................................................... 35
2.5.2 Pitched-Roof Portal Frame .................................................................. 38
2.6 CONCLUSION ................................................................................................. 44
3 INDICATIVE FIRE TESTS ........................................................................... 45
3.1 INTRODUCTION .............................................................................................. 45
1

3.2 DESIGN OF THE INDICATIVE PANEL ................................................................
46
3.3 THE FIRST INDICATIVE TEST .........................................................................
48
3.4 THE SECOND INDICATIVE TESTS ....................................................................
51
3.5 THE THIRD INDICATIVE TEST ........................................................................
56
3.6 DISCUSSION ON INDICATIVE PANEL TESTS .....................................................
58
3.7 DESIGN OF THE PORTAL FRAME WAREHOUSE ................................................
60
3.8 CONCLUSION .................................................................................................
61
4 FIRE TESTS ON A SCALED PORTAL FRAME AND COMPUTER
MODELLING ................................................................................................. 63
4.1 THE TESTING SYSTEM AND INSTRUMENTATION ............................................. 63
4.1.1 Temperatures Measurement .................................................................
64
4.1.2 Displacement Measurement ................................................................. 65
4.1.3 The Loading System ..............................................................................
65
4.1.4 Base Connection ...................................................................................
66
4.1.5 Lateral Support ....................................................................................
67
4.2 THE FIRST ExPERIMENT - HEATING OF THE WHOLE RAFTER .........................
68
4.2.1 Experimental Results ............................................................................ 70
4.2.2 Post-test Inspection ..............................................................................
71
4.2.3 Computer Analysis ...............................................................................
72
4.3 THE SECOND ExPERimENT - EDGE FIRE TEST ................................................ 75
4.3.1 Experimental Results ............................................................................ 77
4.3.2 Post-test Inspection .............................................................................. 78
4.3.3 Computer Analysis ............................................................................... 79
4.4 THE THIRD TEST - OVERALL RAFTER HEATED ..............................................
81
4.4.1 Alteration to the Testing System ...........................................................
82
4.4.2 The Test ................................................................................................
83
4.4.3 Experimental Results ............................................................................
84
4.4.4 Post-test Inspection ..............................................................................
87
4.4.5 Computer Analysis ...............................................................................
89
4.5 FURTHER DISCUSSION ................................................................................... 92
4.6 CONCLUSION ................................................................................................. 93
5 PARAMETRIC STUDIES 1 -TWO DIMENSIONAL ANALYSIS ........... 94
ii

5.1 THE EFFECT OF LOAD RATIO .........................................................................
95
5.2 THE EFFECT OF SPAN AND COLUMN HEIGHT .................................................
98
5.3 THE EFFECT OF DIFFERENT FIRE SCENARIOS ...............................................
103
5.4 THE EFFECT OF WIND (HORIZONTAL) LOAD ................................................
107
5.5 THE EFFECT OF BASE ROTATIONAL STIFFNESS .............................................
112
5.6 CONCLUSION ...............................................................................................
117
6 PARAMETRIC STUDIES 2- THREE DIMENSIONAL ANALYSIS .... 119
6.1 THE 3-DIMENSIONAL MODEL AND ASSUMPTIONS ........................................
119
6.1.1 3-Dimensional VULCAN Model ........................................................
121
6.2 CASE 1- ENTIRE ROOF HEATED .................................................................
121
6.2.1 Further Analysis .................................................................................
126
6.3 CASE 2- LOCAL FIRE SCENARIOS 1 ............................................................
126
6.3.1 Internal Forces within Purlins ............................................................
130
CASE 3- LOCAL FIRE SCENARIO 2 ......................................................................
133
6.5 CASE 4- LOCAL FIRE SCENARIO 3 ..............................................................
135
6.6 DISCUSSION AND CONCLUSION ....................................................................
136
7 DEVELOPMENT OF SIMPLIFIED ESTIMATION OF CRITICAL
TEMPERATURES FOR PORTAL FRAMES IN FIRE ............................ 139
7.1 THE SIMPLIFIED METHOD ............................................................................
140
7.2 APPLICATION OF THE SIMPLIFIED METHOD .................................................. 141
7.2.1 Goal-Post Portal Frame - Entire Rafter Heated ................................ 141
7.2.2 Goal-Post Portal Frame - Localised Heating Profile ........................
143
7.2.3 Pitched-Roof Portal Frame - Entire Rafter Heated ...........................
145
7.2.4 Pitched-Roof Portal Frame - Localised Heating Profile ....................
146
7.3 VALIDATION OF THE SIMPLIFIED METHOD ................................................... 147
7.3.1 Goal-Post Portal Frame - Entire Rafters Heated ...............................
147
7.3.2 Goal-Post Portal Frame - Localised Heating Profile ........................
148
7.3.3 Pitched-Roof Portal Frame - Entire Rafters Heated ..........................
149
7.3.4 Pitched-Roof Portal Frame - Localised Heating Profile ....................
150
7.4 DISCUSSION ................................................................................................ 151
7.4.1 Strain Level ........................................................................................
152
7.4.2 Negative Reduction Factor .................................................................
152
iii

7.4.3 Validity of the Concept of Fire Hinges ............................................... 153
7.4.4 Practical Issues .................................................................................. 154
7.4.5 Benefits of the Simplified Approach .................................................... 155
7.5 CONCLUSION ...............................................................................................
155
8 DISCUSSION ................................................................................................ 157
8.1 INITIAL RESEARCH OBJECTIVES ...................................................................
157
8.2 CURRENT GUIDANCE DOCUMENT ................................................................
159
8.2.1 Practicality ......................................................................................... 161
8.2.2 Internal Fire Spread ........................................................................... 163 8.3 PERFORMANCE-BASED DESIGN - NATURAL FIRES
....................................... 164 8.4 CONCLUSION
............................................................................................... 167
9 CONCLUSIONS ........................................................................................... 169
9.1 FIRE TESTS .................................................................................................. 169 9.2 PARAMETRIC STUDIES
................................................................................. 170
9.3 FURTHER INVESTIGATION ............................................................................
173
9.4 RECOMMENDATIONS FOR FURTHER WORK ..................................................
174
9.5 CONCLUDING REMARKS ..............................................................................
175
REFERENCES ............................................................................. 176
iv

LIST OF FIGURES
FIGURE 1.1 DEVELOPMENT OF A NATURAL FIRE .......................................................... 2
FIGURE 1.2 STRENGTH REDUCTION FACTORS FOR STRUCTURAL STEEL AT ELEVATED
TEMPERATURES ................................................................................................... 4
FIGURE 1.3 STRESS-STRAIN CHARACTERISTICS FOR GRADE 43 STEEL AT ELEVATED
TEMPERATURES ................................................................................................... 5
FIGURE 1.4 THERMAL ELONGATION OF STEEL AT ELEVATED TEMPERATURE . ............... 7
FIGURE 1.5 DIFFERENT TYPES OF PORTAL FRAMES. (A) FLAT ROOF; (B) PINNED BASE;
(C) FIXED BASE; (D) DIFFERENT SECTIONS WITH HAUNCHES; (E) LEAN-TO FRAME;
(F)NORTH LIGHT; (G) MONITOR ROOF; (H) PORTAL WITH CRANE; (1) TIED PORTAL
......................................................................................................................... 10
FIGURE 1.6 FRAME DIMENSIONS ................................................................................ 12
FIGURE 1.7 NOTATION FOR STRAIN DISPLACEMENT EQUATION .................................. 14
FIGURE 2.1 NODAL DEGREES OF FREEDOM IN VULCAN ........................................... 19
FIGURE 2.2 CANTU-EVER 13EANI - LARGE DISPLACEMENT TEST ................................... 20
FIGURE 2.3 COMPARISON OF FIXED AND FREE STRAIN DEGREE OF FREEDOM .............. 21
FIGURE 2.4 THE LAYOUT OF THE MODELS .................................................................. 22
FIGURE 2.5 COMPARISON OF THE NORMAL AND ROTATED GOAL-POST PORTAL FRAMES
......................................................................................................................... 23
FIGURE 2.6 VERTICAL DISPLACEMENT FOR STRAIN INVESTIGATION OF FRAME B ....... 24
FIGURE 2.7 VULCAN ANALYSIS .............................................................................. 25
FIGURE 2.8 COEFFICIENTS FOR THE RAMBERG-OSGOOD EQUATION FOR STEEL ......... 26
FIGURE 2.9 TlIE ORIGINAL RAmBERG-OSGOOD STRESS-STRAIN CURVES FOR S275
STEEL ................................................................................................................ 27
FIGURE 2.10 THE MODIFIED (SMOOTHED) RAMBERG-OSGOOD STRESS-STRAIN CURVES
FOR S275 STEEL ................................................................................................ 27
FIGuRE2.11 PORTAL FRAME ANALYSIS WMISMOOTHED RAMBERG-OSGOOD STRESS-
STRAIN CURVES ................................................................................................. 28
FIGURE 2.12 COMPARISON BETWEEN BAILEY'S AND EC3 DEGRADATION MODEL ...... 31
FIGURE 2.13 COMPARISON BETWEEN LESTONJONES' AND EC3 DEGRADATION MODEL
......................................................................................................................... 31
FIGURE 2.14 NEWTON-RAPHSON SOLUTION PROCEDURE ........................................... 33
V

FIGURE 2.15 SNAP-THROUGH BEHAVIOUR ................................................................. 34
FIGURE 2.16 GENERAL LAYOUT OF THE GOAL-POST PORTAL FRAME .......................... 36
FIGURE 2.17 ELEMENT LAYOUT ................................................................................ 36
FIGURE 2.18 VERTICAL DISPLACEMENT AT THE BEAM MID-SPAN FOR DIFFERENT
HEATING REGIMES ............................................................................................. 37
FIGURE 2.19 DEFLECTED SHAPES OF THE GOAL-POST PORTAL FRAME HEATED TO
PROFILE NO. 1 ...................................................................................................
38
FIGURE 2.20 GENERAL LAYOUT OF THE PITCHED-ROOF PORTAL FRAME WITH FIXED
BASES ................................................................................................................ 39
FIGURE 2.21 FINITE ELEMENT MODEL OF THE PITCHED-ROOF PORTAL FRAME WITH
FIXED BASES ...................................................................................................... 39
FIGURE 2.22 VERTICAL DISPLACEMENT AT THE APEX UNDER DIFFERENT HEATING
PROFILES . .......................................................................................................... 40
FIGURE 2.23 DEFLECTED SHAPES OF PITCHED-ROOF FIXED-BASE FRAME UNDER
HEATING PROFILE NO. I ..................................................................................... 41
FIGURE 2.24 DEFLECTED SHAPES OF PrTCHED-ROOF FIXED-BASE FRAME UNDER
HEATING PROFILE NO. 5 .....................................................................................
41
]FIGURE 2.25 DEFLECTED SHAPES OF PITCHED-ROOF FIXED-BASE FRAME UNDER
HEATING PROFILE No. 7 ..................................................................................... 42
FIGURE 2.26 VERTICAL DISPLACEMENT AT THE APEX OF PITCHED-ROOF PORTAL FRAME
WITH PINNED BASES ........................................................................................... 43
FIGURE 2.27 DEFLECTED SHAPES OF PITCHED-ROOF PINNED-BASE FRAME UNDER
HEATING PROFILE NO. 5 ..................................................................................... 43 FIGURE 3.1 THE INDICATIVE TEST PANEL ................................................................... 46 FIGURE 3.2 FRONT VIEW (LEFT) AND ELEVATION (RIGHT) OF THE PANEL ................... 46 FIGURE 3.3 PLAN VIEW OF THE INDICATIVE ............................................................... 47 FIGURE 3.4 ISOMETRIC SKETCH OF THE CONNECTION DETAILS ................................... 47 FIGURE 3.5 POSITIONS OF THERMOCOUPLES .............................................................. 48 FIGURE 3.6 THE FIRST INDICATIVE PANEL TEST ......................................................... 49 FIGURE 3.7 TEMPERATURES RECORDED FROM THE FIRST INDICATIVE PANEL TEST ..... 49 FIGURE 3.8 COMPARISON BETWEEN RESULTS FROM TASEF AND THERMAL IMAGES.. 50 FIGURE 3.9 AN EXAMPLE OF THE THERMAL IMAGE .................................................... 50 FIGURE 3.10 PANEL AND THE PURLIN CONDITION AFTER I sT TEST
............................ 51
V1

FIGuRE3.11 POSITION OFTHERMOCOUPLES FOR THE SECOND AND THIRD INDICATIVE
TESTS ................................................................................................................ 52
]FIGURE 3.12 SET-UP OF THE SECOND TEST WITH BAFFLE IN PLACE ............................. 53
FIGURE 3.13 SET-UP OF THE BAFFLE FOR THE SECOND TEST ....................................... 53
FIGURE 3.14 THE SECOND INDICATIVE TEST .............................................................. 54
FIGURE 3.15 TEMPERATURE DISTRIBUTION RECORDED FROM THE SECOND INDICATIVE
TEST .................................................................................................................. 54
FIGURE 3.16 COMPARISON BETWEEN THERMAL IMAGE AND THERMOCOUPLE
TEMPERATURES AND FIRES-73 ANALYSIS -SECOND INDICATIVE TEST ............. 55
FIGURE 3.18 THE THIRD INDICATIVE PANEL TEST ........................ ............................. 56
FIGURE 3.19 TEMPERATURE DISTRIBUTIONS RECORDED FROM THE THIRD INDICATIVE
TEST .................................................................................................................. 57
FIGURE 3.20 COMPARISON BETWEEN THERMAL IMAGING TEMPERATURES AND FIRES-
T3 ANALYSIS - THIRD INDICATIVE TEST ............................................................ 57
FIGURE 3.21 CONDITION OF PANEL AFTER THE FIRE TESTS ......................................... 58
FIGURE 3.22 GENERAL LAYOUT OF THE EXPERIMENT STRUCTURE ............................. 62
FIGURE 4.1 THE WAREHOUSE MODEL ....................................................................... 63
FIGURE 4.2 POSITIONS OF THERMOCOUPLES .............................................................. 64
FIGURE 4.3 THE LOADING SYSTEM FOR THE PORTAL FRAME ...................................... 66
FIGURE 4.4 DIMENSIONS OF BASE CONNECT10N ......................................................... 66
FIGuRE4.5 BASE CONNECTION ................................................................................. 67
FIGURE 4.6 LATERAL SUPPORT SYSTEM ..................................................................... 68
FIGURE 4.7 EARLY STAGE OF THE FIRST TEST ............................................................ 69
FIGURE 4.8 RECORDED TEMPERATURES DURING THE FIRST TEST ............................... 70
FIGURE 4.9 RECORDED DISPLACEMENTS DURING THE FIRST TEST .............................. 70
FIGURE 4.10 TEMPERATURE COMPARISON BEr%VEEN TOP AND BOTTOM FLANGES ...... 71
FlGuRE4.11 THE RAFrER DEFORMATIONS AFI'ER THE FIRST TEST ............................. 72
FIGURE 4.12 HORIZONTAL DISPLACEMENTS AT LEFT EAVES ...................................... 73
FIGURE 4.13 HORIZONTAL DISPLACEMENTS AT RIGHT EAVES .................................... 74
FIGURE 4.14 VERTICAL DISPLACEMENTS AT APEX ..................................................... 74
FIGURE, 4.15 THE SECOND FIRE TEST: EARLY STAGES ................................................ 76
FIGURE 4.16 TEMPERATURES RECORDED THROUGHOUT THE SECOND FIRE TEST ........ 77
FIGURE 4.17 RECORDED DISPLACEMENTS FOR THE SECOND FIRE TEST ....................... 78
FIGURE 4.18 LATERAL DEFORMATION OF RAFrER FROM THE SECOND FIRE TEST ........ 79
vii

FIGURE 4.19 HORIZONTAL DISPLACEMENT AT LEFT EAVES ........................................ 80
FIGURE 4.20 HORIZONTAL DISPLACEMENT AT RIGHT EAVES ...................................... 80
FIGURE 4.21 VERTICAL DISPLACEMENT AT APEX ....................................................... 81
FIGURE 4.22 FUEL SUPPLYING SYSTEM ...................................................................... 82
FIGURE 4.23 BASE CONNECTION DETAILS .................................................................. 83
FIGURE 4.24 SNAP-THROUGH FAILURE DURING THE THIRD FIRE TEST ...... ................. 84
FIGURE 4.25 RECORDED TEMPERATURES FROM THE THIRD TEST ................................ 85
FIGURE 4.26 RECORDED DISPLACEMENTS FROM THE THIRD TEST ............................... 86
FIGURE 4.27 COLLAPSE OF THE PORTAL FRAME (TOP) AND FIRE HINGES FORMED
DURING THE TEST (BOTrO. '-l) .............................................................................. r, -7 FIGURE 4.28 THREE-DINIENSIONAL VULCAN MODEL ON THE TI-HRD TEST ................ 89 FIGURE 4.29 VERTICAL DISPLACENT14T AT APEX ....................................................... 90
FIGURE 4.30 HORIZONTAL DISPLACEMENT AT RIGHT EAVES ...................................... 91
FIGURE 4.31 HORIZONTAL DISPLACEMENT AT LEFT' EAVES ........................................ 91
FIGURE 4.32 DEFLECTED SHAPE PREDICTED By VULCAN (3-DIMENSIONAL VIEW) .. 92
FIGURE 5.1 PARAmETRic STUDIES - LOAD RATIOS ................................................... 95
FIGURE 5.2 VERTICAL DISPLACEMENT AT APEX ....................................................... 97
FIGURE 5.3 SPREAD OF EAVES .................................................................................. 97
FIGURE 5.5 VERTICAL DISPLACEMENT OF APEx - VARIABLE COLUMN HEIGHTS .....
100
FIGURE 5.6 PARAMETRIC STUDIES ON SPAN AND COLUMN HEIGHT OF PORTAL FRAMES
....................................................................................................................... lot
FIGURE 5.7 FAILURE TEMPERATURES OF PORTAL FRAMES ......................................
102
FIGURE 5.8 FAILURE TEMPERATURES FOR FRAMES PLOTTED AGAINST LOAD RATIO.. 103
FIGURE 5.9 HEATING PROFILES OF PORTAL FkAmEs IN VARIOUS FIRE SCENARIOS.. 104
FIGURE 5.10 APEx DISPLACEMENT FOR VARIOUS FIRE SCENARIOS - LOAD RATIO 0.2
....................................................................................................................... 105
FIGURE 5. It APEx DISPLACEMENT FOR VARIOUS FIRE SCENARIOS - LOAD RATIO 0.7
....................................................................................................................... 106
FIGURE 5.12 SPREAD OF EAVES FOR HEATING PROFILE (A) .....................................
107
FIGURE 5.13 WIND LOAD ........................................................................................
108
FIGURE 5.14 SPREAD OF EAVES - ANALYSES wrrH FULL WIND LOAD ....................
109
FIGURE 5.15 SPREAD OF EAVES - ANALYSES wrrH 0.33 WIND LOAD FACTOR ........
109
FIGURE 5.16 WIND UPLIFT EFFEcr ON PORTAL FRAME ...........................................
110
FIGURE 5.17 SPREAD OF EAVES - THE EFFECT OF HORIZONTAL FORCES .................
III
viii

FIGURE 5.18 DEFLECTED SHAPE OF PORTAL FRAME, 80% HoRizoNTAL LoAD, 0.2 VERTICAL LOAD RATIO
. .................................................................................. 112 FIGURE 5.19 VERTICAL DISPLACEMENT AT ApEx - EFFECT OF BASE ROTATIONAL
STIFFNESS ....................................................................................................... 113
FIGURE 5.20 VERTICAL DISPLACEMENT AT ApEx - Saii-RIGID BASE WITH VARIOUS
LOAD RATIOS .................................................................................................. 115
FIGURE 5.21 HoRizoNTAL SPREAD OF EAVES - SEmi-RIGID BASE WITH VARIOUS
LOAD RATIOS .................................................................................................. 115 FIGURE 5.22 COMPARISON OF FAILURE TEMPERATURES WITH PINNED AND SEMI-RIGID
BASES ..................................... ........................................................................ 116 FIGURE 6.1 SIMULATION OF Z-PURLIN IN VULCAN ............................................... 120 FIGURE 6.2 VULCAN MODEL OF 3-DimENslOANL PORTAL FRAME WAREHOUSE
... 121 FIGURE 6.3 CASE I- DEFLECTED SHAPE
................................................................. 123 FIGURE 6.4 VERTICAL DISPLACEMENT AT APEX - 2D vs. 3D ANALYSIS .................. 125 FIGURE 6.5 LOCAL FIRE SCENARIOS ........................................................................ 127 FIGURE 6.6 DEFLECTED SHAPE - FIRE SCENARIO (C)
................................................ 128 FIGURE 6.7 VERTICAL DISPLACEMENTS AT APEX - LOAD RATIO 0.2 ........................ 129 FIGURE 6.8 AxiAL FORCES WITHIN PURLINS - FIRE SCENARIO (A)
........................... 131 FIGURE 6.9 AxIAL FORCES WITHIN PURLINS - FIRE SCENARIO (C)
........................... 131 FIGURE 6.10 lNTERNAL FORCES OF MEMBER 261 ..................................................... 132 FIGURE 6.11 CASE 3- TWO BAY HEATED ................................................................ 133 FIGURE 6.12 APEX DISPLACEMENT OF PFI .............................................................. 134 FIGURE 6.13 CASE 4- CORNER FIRE ....................................................................... 136 FIGURE 7.1 GoAL-PosT PORTAL Fp. AmE WITH RAFTERS HEATED
........................... 142 FIGURE 7.2 FAILURE MECHANISMS - (UFr) COMBINED MECHANISM AND (RIGHT)
SWAY MECHANISM ......................................................................................... 142
FIGURE 7.3 FAILURE MECHANISM AND LOCATION OF FIRE HINGES - FRAME HEATED
OVERALL ......................................................................................................... 145 FIGURE 7.4 ApEx VERTICAL DISPLACEMENT - TYPICAL FAILURES PREDICTED 13Y
VULCAN ....................................................................................................... 152 FIGURE 7.5 VERTICAL DISPLACEMENT AT ApEx ..................................................... 154 FIGURE 8.1 MODEL FOR CALCULATION OF OVERTURNING MOMENT ......................... 160 FIGURE 8.2 BASE OVERTURNING MOMENT VS. COLUMN ROTATION AND RAFTER
TEMPERATURES ............................................................................................... 161
tx

FIGURE 8.3 COMPARTMENT WALLS - SEPARATION OF DIFFERENT OWNERSHIP (TOP) OR
TYPES OF OCCUPANCY (BOTTOlvi) .....................................................................
163
FIGURE 8.4 NATURAL FIRES vs. STANDARD FIRE CURVE .......................................... 166
X

LIST OF TABLES
TABLE 1.1 CALORIFIC VALUES OF TYPICAL MATERIALS ............................................... 3
TABLE 2.1 COMBINATIONS OF DIFFERENT NUMBERS OF ELEMENTS ........................... 23
TABLE 2.2 REDUCTION FACTORS FOR TI iE SEMI-RIGID CONNECTION .......................... 30
TABLE 2.3 THE HEATING REGIMES ........................................................................... 37
TABLE 2.4 HEATING REGIMES FOR THE PITCHED-ROOF PORTAL FRAME WITH FIXED
BASES ................................................................................................................ 39
TABLE 5.1 PORTAL FRAmEs WITH FIXED COLUMN HEIGHT OF 7m ............................. 99
TABLE 5.2 PORTAL FRAmEs WITH FIXED SPAN OF 30m ........................................... 100
TABLE 7.1 COMPARISON OF CRITICAL TEMPERATURES ON GOAL-POST PORTAL FRAME
- ENTIRE RAFTERS HEATED ............................................................................
147
TABLE7.2 ...............................................................................................................
148
TABLE 7.3 COMPARISON OF CRITICAL TEMPERATURES ON GOAL-POST PORTAL FkAmE
- LocAusED HEATING PROFILE ......................................................................
148
TABLE 7.4 COMPARISON OF FAILURE TEMPERATURES FROM VULCAN AND
SIMPLIFIED APPROACH - PITCIIED-ROOF FRAME WITH ENTIRE RAFTER HEATED.
....................................................................................................................... 149 TABLE7.5 COMPARISON OF FAILURE TEMPERATURES FROM VULCAN AND
SIMPLIFIED APPROACH - VARIOUS GEOMETRIES ..............................................
150
TABLE 7.6 SWAY MECHANISM FOR PITCHED ROOF PORTAL FRAME .......................
150
TABLE7.7 COMPARISON OF FAILURE TEMPERATURES FROM VULCAN AND
SIMPLIFIED APPROACH - PITCHED ROOF FRAME WITH LocALisED HEATING
PROFILE . .........................................................................................................
151
xi

Notation
(Only the general notations used during this thesis are presented here. Symbols
which have only been used once and are of a more specific nature have been clearly
explained where they arise in the text. )
Si Displacement
C Strain
7I Strength reduction factor at elevated temperature
a Stress
0,0 Rotation
01 Column base rotation
At, I31, N, Temperature dependent Ramberg-Osgood parameters
A Cross section area
E Young Modulus
lip Perimeter of section exposed to fire
Iitz, Iyy Second moment area about major/minor axis
M, Internal moment
Alp Plastic moment resistance
Wi External Load
XIl

ACKNOWLEDGEMENT
The author is greatly indebted to Prof. Ian Burgess and Prof. Roger Plank for their
excellent supervision and support during this research project. The financial
assistance from Health and Safety Laboratories, Buxton and Overseas Research
Scholarship is gratefully acknowledged.
I would also like to thank Graham Atkinson of HSL, Buxton for the kind assistance
and discussions throughout the fire tests. Intellectual support from my colleagues of
the Steel Fire research group is very much appreciated and acknowledged.
Finally, I would like to thank my parents, brother and sister for the endless support from Malaysia, and Winsome who often inspires and motivates me during the work.
DECLARATION
Except where specific reference has been made to the work of others, this thesis is
the result of my own work. No part of it has been submitted to any University for a
degree, diploma, or other qualification.
Shao Young Wong
alts

Chapter 1: Introduction
1 Introduction
Over half of the total market share of the constructional steelwork fabricated in the
United Kingdom is used in single-storey buildings. Portal frame construction is the
most common form of these single-storey buildings found on any modem industrial
estate, due to the fact that it is simple and cost-efficient. A steel portal frame
structure is a rigid plane frame with assumed full continuity at the intersections of the
column and rafter members. In the United Kingdom it is usual to design such
structures plastically. However, steel is very vulnerable in fire due to its high thermal
conductivity, losing strength and stiffness rapidly compared to other materials. The
steel industry has invested much research in finding better solutions this major disadvantage, such as alternative design methods, new protective materials, improvement to steel properties etc. A number of recent fires in single-storey
warehouses" have drawn attention to a current lack of understanding about the
structural response of industrial portal frame structures to elevated temperatures.
Regulatory requirements state that all buildings require a minimum degree of fire
resistance to fulfil two main objectives:
" To ensure life safety, which includes allowing the occupants to leave and fire
fighting personnel to enter if necessary.
" To minimise property or financial losses, and delay the spread of fire to adjoining
property.
Structures designed using ambient-temperature steel properties are usually required
to be insulated so that their temperatures remain sufficiently low in the event of fire.
This is the most common method at present, but is a prescriptive method.
Alternatively, high-temperature properties of steel can be taken into account in
design, considering the load ratio, temperature gradient, dimensions and stress distribution.
The fire safety of all buildings in England and Wales is governed by the provisions
of Approved Document B8. The regulations in the document apply only to structural
elements used in:
9 Buildings, or parts of buildings, of more than one storey;
" Single-storey buildings built close to a property boundary.
I

Chapter 1: Introduction
Therefore, there may be no need for fire resistance for portal frame structures. In
fact, it is stated in the document that:
"It is considered technically and economically feasible to design the
foundation and its connection to the portal frame so that it would transmit the
overturning moment caused by the collapse, in a fire, of unprotected rafters, purlins
and some roof cladding while allowing the external wall to continue to perform its
structural function. "
The Steel Construction Institute has therefore published a document9 which gives
guidance on designing the column bases to resist rafter collapse. The basis of the
method is a plastic collapse model of the rafter in fire, and will be elaborated later in
this chapter.
1.1 Fire Concepts
Pre flashover
Ignition Smouldering phase
Post flashover
Heating
Figure 1.1 Development of a natural fire
Cooling
In considering the occurrence of a typical fire, Figure 1.1 shows the diagram of a
natural fire curve, where four stages are defined. The first (ignition) stage is most
important to allow early detection and suppression, whereas the risk to life or
property is not very high in this phase. When the fire develops into the second
2

Chapter 1: Introduction
(smouldering) stage, there will be progressive smoke production from combustible
materials, causing danger to the occupants. The structural damage is still small at this
phase until a critical point, known as flashover, is reached depending on the fire load
density and ventilation. This indicates that the fire is out of control, and the post-
flashover temperatures typically rise to between 600°C and 1000°C. At this point, it
is no longer possible for fire fighting to be effective, except to protect the
neighbourhood. When the combustible materials finish burning, the temperature will begin to decrease, and this is hence defined as the cooling stage.
Fire in a portal frame warehouse can be different from natural fires in commercial buildings, depending on the material stored in the warehouse, which subsequently becomes the fuel for the fire. Provided there is sufficient ventilation, the fire growth
rate and the ultimate temperature achieved are solely dependent of the type of
material available for burning. DD240 Part 1, Application of Fire Safety
Engineering Principles to Fire Safety in Buildings (1997) 11, published by British
Standards Institute gives values of effective fire load density, expressed in
megafoules per square metre of floor area, which is directly related to the effective
calorific values of different materials. Table 1.1 shows several examples:
Material Calorific
(MJ/kg)
Value Material Calorific Value
(MJ/kg)
Paper, cardboard 17 Epoxy 34
Cotton 18 Polystyrene 40
Methanol 20 Liquid gasoline 44
Polyester 31 Paraffin wax 47
Table 1.1 Calorific values of typical materials
It is specified in the same code that industrial storage units have to be designed for an
ultra-fast fire growth rate, where 1000 kW will be produced in 75 seconds (compared
to 300 seconds for the medium fire growth rate required. for offices and dwelling).
However, the concept of flashover applies most clearly to fires in relatively small
enclosures, whereas a portal frame warehouse will normally occupy a larger space
without many compartments. It will require a longer time for flashover to take place,
and this only happens after a substantial local fire has developed. A. J. O'Meagher12
3

Chapter 1: Introduction
(1992) has introduced a "developing fire" concept, where a fire begins at a particular location over a finite time period, and then spreads outwards to other parts of the
building. The portal frames are therefore heated locally and the affected area will increase as the fire develops, causing an increased length or number of portals to be
heated.
The concept implies that parts of a structural frame which are near to the fire will
become very hot, and hence the local material strength will decrease substantially;
whereas the rest of frame remains cooler and the strength is not affected. The
validity of this concept is inferred from post-fire observations of single-storey
buildings and from knowledge of how structures behave under elevated temperature.
1.2 Steel Properties at Elevated Temperature
One of the major advantages of using steel for structural applications is its good
strength-to-weight ratio. However, steel begins to lose strength at about 200°C and
continues to lose strength at a much faster rate from 400°C to 750°C. Above this
temperature, the degradation of the remaining strength continues at a slower rate
until approximately 1500°C, at which melting point is reached.
1.2 EC3 - 0.5% strain EC3 - 1.5% strain EC3 - 2.0% strain BS5950 - 0.5% Strain
BS5950 - 1.5% Strain
"""BS5950 - 2.0% Strain
0.4 t---------------------------------- \ti X ______________________,
0+ 0 100 200 300 400 500 600 700 800 900 1000
Temperature (°C)
Figure 1.2 Strength reduction factors for structural steel at elevated
temperatures
4

Chapter 1: Introduction
Recent design codes BS5950 Part 813 and EC3 Part 1.215 have published strength
reduction factors of steel at different strain levels. The reduction factors are defined
as the residual strength of steel at a certain temperature, relative to its strength at
ambient temperature. They vary at different strain limits because there is a gradual
increase in strength with strain at elevated temperature after yielding, unlike at
ambient temperature where a yield stress plateau is obtained. Figure 1.2 shows a
comparison of the strength reduction factors between the codes for Grade 43 steel.
The actual stress-strain data of steel published in BS5950 and EC3 are based on the
high temperature stress-strain tests conducted by Kirby and Preston" (1988). A
Ramberg-Osgood'6 type of equation has been used as one of mathematical models to
represent this stress-strain behaviour, and most of the computer analyse performed in
this research adopt this model for calculation. The curves for Grade 43 steel are
shown in Figure 1.3.
300 1
0 0.002 0.004 0.006 0.008 0.01 0.012 0.014 0.016 0.018 0.02
Strain
t 20°C A 200°C
400°C
500°C
ý"- 600°C
700°C
NOT
Figure 1.3 Stress-strain characteristics for Grade 43 steel at elevated
temperatures.
The Ramberg-Osgood model16 modifies strain at a given stress by the use of three
temperature-dependent parameters -Ar, B ,r and N-1. The equation is as follows:
ET = 6T
+0.01 6T
aAT bB.,. (1.01)
H,.
5

Chapter 1: Introduction
Where e1 and o, represent strain and stress respectively at temperature t, and
E a_180x10'
b= ßy 250
and
AT= 180xlO'
BT = 0.00134T2 -0.26T+254.67 NT = 237 -1.58T
AT= (194-0.14t)x103
BT= 242
NT= 15.3 x 10-'(400 - T)3*1 T =15.3x10-'(400-T)3*` +6
AT = (295.33 - 0.3933T)x 103
BT= 492.667 - 0.6266T
NT= 6
AT = (30.5 - 0.015T)x 10'
BT= 306 - 0.36T
NT = 0.04t - 22
for 20°C <_ T: 5 100°C
for 100°C < T: 5 400°C
for 400°C < T: 5 700°C
for 700°C < T: 5 800°C
Similar stress-strain data is published in EC3 Part 1.215 where the mathematical
model is represented by one elliptical and two linear equations, and stresses are
calculated from given strains. This model is based on the same experimented results
from Kirby and Preston (1988); therefore the stress-strain curves are very close to the
Ramberg-Osgood model.
While considering the stress-strain behaviour of steel at elevated temperature, creep
is one of the factors that need to be considered. Creep is defined as a visco-elastic
strain which occurs with the passage of time under a constant stress state, at a rate
which in controlled by the temperature. Research has been conducted into the effect
of creep and at the different heating rates likely to be encountered in actual building
fires. Witteveen'8 (1977) concluded from his earlier test results that with heating
6

Chapter 1: Introduction
rates ranging from 5° to 50°C per minute, and at temperatures not exceeding 600°C,
no significant effect of creep was found. Aribert and Abdel Aziz'9 (1987) reported
creep effect becomes significant at temperatures in excess of 545°C. The stress-
strain data shown in Figure 1.3 is obtained with a consistent heating rate of 10°C per
minute, which is believed to a good representation of real fires in average buildings.
Thermal elongation of steel in fire is critical to structural behaviour. Its main effects
are thermal bowing and induced internal compression. The rate of thermal expansion increases almost linearly as temperature increases until about 720°C at which the
microstructure undergoes a phase-change. As the steel absorbs energy and adopts a denser internal structure, thermal elongation stays constant up to 860°C and then
starts increasing again. The variation of thermal expansion with temperature
published in EC3 Part 1.2 is shown in Figure 1.4.
1.60E-02
1.40E-02 -------------------------------------------------
1.20E-02 ---------------------------------------------------
1.00E-02i------------------------------------------ c ----------------
.4 rn 8.00E-03 ------------------------------- =. C
.2 W 6.00E-03 - ------------------------
4.00E-03 + -----------------
2.00E-03 +--------
0.00E+00 0 100 200 300 400 500 600 700 800 900 1000
Temperature (°C)
Figure 1.4 Thermal elongation of steel at elevated temperature.
The thermal elongation used throughout this research follows the EC3 data as shown
below:
=-2.416x10⁻⁴ +1.2x10-ST+0.4x10⁻⁸T2 for 20°C<T<-750°C 1
Al =1.1x10⁻² I
for 750°C < T<_ 860°C
7

Chapter 1: Introduction
ý =-6.2x10⁻³ +2. Ox10-ST
1 for 860°C < T< 1200°C
(1.02)
where,
I= original length at 20°C
Al = the thermal induced expansion
T= temperature of steel
The specific heat of steel may be defined as the heat stored in a unit mass of steel for
a unit temperature rise in °K. It increases slowly as temperature rises up to 700°C,
when the steel's internal lattice structure changes and causes the specific heat to
increase rapidly around 735°C, and reduces to almost the original level after that.
The model of specific heat published by EC3 is shown below:
Cs = 425+7.73x10-'T-1.69x10⁻³T3 +2.22x10⁻⁶T3 J/kgK
for 20°C <_ T: 5 600°C
13002 CS = 666 +3
,2 J/kgK for 600°C < T: 5 735°C
738-T
C. =545+ 17820
J/kgK T-731
for 735°C < T: 5 900°C
Cs = 650 J/kgK for 900°C < T: 5 1200°C
(1.03)
where
Cs = thermal conductivity
T= steel temperature
Thermal conductivity of steel reduces as temperature increases up to 800°C, beyond
which it stays unchanged. It is measured by the amount of heat in unit time passing
8

Chapter 1: Introduction
through a unit cross-sectional area of steel subject to a unit temperature gradient, EC3 part 1.2 gives the values as:
XQ =54-3.33x10⁻²T W/mK
A, = 27.3 W/mK
for 20°S T: 5 800°C
for 800°C < T: 5 1200°C
(1.04)
where
As = specific heat
t= steel temperature
The density of steel is almost independent of temperature, and is given by EC3 part
1.2 as 7850 kg/m3. Similarly, Poisson's ratio is taken as 0.3.
1.3 Steel Portal Frame Design and Construction
Single-storey portal frames can be constructed in many different shapes, Figure 1.5
illustrates various types that are used as main frames. They can be designed with
elastic or plastic methods. Either way the connections between the columns and
rafters must be capable of transmitting moments between the members.
If an elastic analysis is chosen, then computer software is normally used to help in
solving a series of analyses with multiple load cases. Once individual member forces
have been calculated, where both the column and rafters will normally be subject to a
combination of moment and compression, they should be designed as normal beam-
columns according to BS5950 Part 114. Special considerations are given to lateral-
torsional buckling, where allowance is made for the restraining effects of purlins,
sheeting rails and cladding attached to the outer flanges of the main frame members.
However, since the mid 1950s, portal frame construction in the U. K. has been widely based on the principles of plastic design. Often the frames are the basic pitched-roof
variety shown in Figs. 1.05 (b) and (c), of which the pinned base is more popular
with designer as it avoids high foundation cost, as well as the complexity of forming
a rigid connection.
9

Chapter 1: Introduction
ca)
/\
(b) ý WAM (ý)
ýý (d) (e) -- (f) ,
Jý Fi
-. - -3- (g) (h) (0
Figure 1.5 Different types of portal frames. (a) flat roof; (b) pinned base; (c) fixed base; (d) different sections with haunches; (e) lean-to frame; (f)north light; (g) monitor roof; (h) portal with crane; (i) tied portal
Plastic analyses involve identifying all possible collapse mechanisms of the portal frames and consider the lowest value of the collapse load when suitable sections are chosen. Further checks are performed to ensure that no other form of failure
prevents the attainment of this collapse mechanism. Several publications 20,24 which deal with the detail design of portals by this method can be found, due to the
popularity of this form of construction.
In this research, initial studies were conducted on flat-roof portal frames (Figure 1.5 (a)) and further studies were concentrated on basic pitched-roof portal frames with pinned and fixed bases (Figure 1.5 (b) and (c)).
1.3.1 Portal Frames in Fire
When fire starts in a single-storey portal frame structure, the rafter will be heated and
expand, causing outward deflection of the eaves. As the fire develops further, the
strength of the rafter will decrease substantially, and the rafter has to support only dead load from its self-weight, purlins, cladding and insulation. Rafter collapse will
eventually take place, associated with some torsional instability due to the loss of
purlins. The rafter, at this stage, is acting partially as a catenary with tensile force
10

Chapter 1: Introduction
pulling the tops of columns inwards. Total collapse happens when sufficient hinges
form in the portal frames, either on columns or rafters, to create a mechanism. 12 There has been limited research done on portal frames in fire, . Current fire
resistance design concentrates almost entirely on the prevention of fire spread
beyond the building of origin by ensuring that column base connections retain
sufficient rigidity to prevent collapse of the boundary wall. The U. K. regulatory
authorities require the designer either to provide fire protection for the rafters, or to
ensure that the base of the column would resist the forces caused by the rafter
collapse in fire.
The only guide for designers in the U. K. to follow when considering portal frames in
fire is the publication from The Steel Construction Institute: The Behaviour of Steel
Portal Frames in Boundary Conditions (1990?. The main purpose of this
publication is to satisfy the U. K. authorities' concern that fires may spread to another
building. Several assumptions was made in the document in order to derive the
simplified equations given:
" Both columns will lean inwards by one degree.
" The rafter elongation is 2%, which includes thermal expansion and various
deformations.
" The steel yield strength at failure caused by fire is equal 0.065 of the normal
strength.
" The haunch length is equal to 10% of the span.
Although some of these assumptions are arguable, the method is believed to produce
conservative results and is widely accepted. The equations are given as follows:
Vertical reaction = 0.5W f SL + dead weight of wall (1.05)
Horizontal Reaction =KWf SGA - CM
p G
(1.06)
Overturning moment =K Wf SGY A+ B -M v
GY - 0.06 (1.07)
Where,
G, Y and L are the dimensions shown in Figure 1.6.
11

Chapter 1: Introduction
Wf = load at time of collapse
S= distance between frame centres (m)
Mp = plastic moment of resistance
K= Modification factor
0= cos-(0.97 cos 00) = original rafter pitch
6o = final rafter pitch
A= 1+1
4tan6 96
B= e-GZ
8G
C=0.255cos00 sin 0
-ý Y
11 ýýT
L T
Figure 1.6 Frame dimensions
Some of the parameters in the equation are created to simplify the original formulas
so that the result from the simplified method is near to the real solution. The
parameters are calibrated against frames with spans greater than 12m. In calculating
the required base overturning moment, it is also suggested that a minimum positive 10% of the plastic moment resistance of the column should always be considered, if
the values calculated from the equation are less.
O'Meagher et al (1992) 12 has conducted research into single-storey industrial
buildings in fire for the Australian Institute of Steel Construction, as a supplement to
the Building Code of Australia (BCA). They concluded that the application of fire-
protection to the columns of the steel portal frames would have no influence on the deformation mode or their fire resistance. There is also no need to fire-protect the
roofs of the supporting steelwork when designed according to BCA. Parametric
studies were conducted using a finite element program ABAQUS 26,27 on 20 portal frames with different spans, load and heating profile. It was found the most of these failed with an acceptable failure mode.
12

Chapter 1: Introduction
1.4 Structural Computer Modelling
Modelling of structural behaviour using the finite element method by computer has
been very popular in recent years. The main reasons is the relatively high cost of
conducting real structural tests. Once computer modelling has been showed to be
capable of analysing real structures with acceptable accuracy, large-scale parametric
studies can be performed to investigate the influences of particular factors on
structural behaviour. The method has become particularly feasible due to the improved performance, in terms of speed and storage, of modem desktop computers.
VULCAN, a non-linear finite element program developed at the University of Sheffield, was used throughout this research for the purposes of computer modelling for validation and parametric studies.
1.4.1 VULCAN
The development of VULCAN is based on another program, INSTAF, which was
written by EI-Zanaty and Murray at the University of Alberta in 198028. INSTAF is
capable of analysing two-dimensional steel frames at ambient temperature,
incorporating the geometrical non-linearity, penetration of material yielding into the
cross section and spread of inelastic zones along member lengths. The code was
written in the FORTRAN programming language. By 1990, El-Rimawi and Saab 29 ' 30
from the University of Sheffield had successfully included the effect of thermal
distribution due to fire into INSTAF, and a Ramberg-Osgood representation was
used for the stress-strain data. After that, Najar'9 further developed the program to
allow three-dimensional behaviour be analysed. Bailey3l added the capability to
include semi-rigid connections introduced as spring elements, continuous concrete
slab represented by shell elements, strain reversal in cooling and flexural shear forces
to allow lateral-torsional buckling. Most recently, Huang 33,36 further extended the
shell elements into a layered formulation which gives a better representation of
concrete cracking. As the program can only analyse I-shaped symmetric cross
sections, Cai39 has included the capability to analyse asymmetric beams. Validation
of the program has been carried out at each stage of development.
13

Chapter 1: Introduction
In the VULCAN model, beam-column elements are represented by two-noded line
elements. The basic finite element model presented by El-Zanaty and Murray in the
original INSTAF adopted the non-linear large displacement-strain equation as:
Ez=llö+2[ýll0)2-+ -(Vö)2]-yVo Ii- llö+ `VoJ
]+Y2(vD2[1+
(V 2 1-iVö)2 (1 oý
ý
(1.08)
where,
Ez = strain in z direction
it, vo, vo are the first and second derivatives of the deflection components shown in
Figure 1.7.
I Y
"I
v, v
r-
0
Z -----iý
-1 I- A
Lb
Figure 1.7 Notation for strain displacement equation
Within this model, each node has five degrees of freedom. When Na ar extended the capability into three-dimensional analysis an extra term w' was added, associated
with three additional degrees of freedom in the local coordinates. This gives a total
of eleven degrees of freedom per node in global coordinates. Every effort was made to retain the higher-order terms to enable geometrical non-linearity to be represented
properly.
A physical beam-column member is separated into a number of finite elements, interconnected at nodal points. The displacements of these nodal points are to be
14

Chapter 1: Introduction
solved within the structural analysis. Shape functions are then used to define the
displacements within an element bounded by nodal points. Displacements at any
point along the element can therefore be defined, and the state of strain can be found
by using the large-displacement equation (1.08).
As is typical in finite element analysis, equilibrium is enforced between boundary
stresses and the external loads. The Principle of Virtual Work is applied, and the
equation is shown as:
dW =f azaezav -ýQ){aý} =0 v
where,
QZ = axial stress
8ez = virtual axial strain (derivation from equation 1.08)
(Q) = row vector of external loads
{aq}= column vector of imposed virtual displacements
(1.09)
The standard stiffness relationship given by a typical finite element procedure is
shown as:
[K]{q}= {Q}
where,
[K] = tangent stiffness matrix
{q} = vector of nodal displacement
{ Q) = vector of nodal forces
(i. io)
In VULCAN, Gaussian integration42 is applied to evaluate terms in equation 1.09.
An iterative method of solution is required due to the non-linearities, and therefore
the Newton-Raphson solution procedure was adopted.
The spring elements introduced by Bailey fit within the same finite element theory
used for beam-column elements, except that their rotational stiffness properties are
15

Chapter 1: Introduction
modified in the analysis to simulate the behaviour of moment connections. Shell
elements have only five degrees of freedom at each node in local-coordinates,
representing displacements in three dimensions and rotations about two bending
axes. Shell elements are not used within this project and the details can be found in
relevant publications.
At present, extensive research is in progress to improve the modelling of
connections, conducted by Al-Jabri 40,41 and Spyrou. Geometrical nonlinearity of
shell elements is under development by Allam37'38 and Huang 34,3s
1.4.2 The Application of VULCAN
Since there is no user-interface for VULCAN, a textual input file needs to be created
to define a structural problem. The input file will specify the structure as a series of
nodes connected by a number of beam-column, spring and shell elements with different material properties, together with heating criteria. Most recently, Shepherd 32 has reformulated the input format, using blocks of data with labels so that
the measuring of each of the numerical values can be identified easily.
VULCAN will read the input file and perform the structural analysis, recording the
results in a separate output file. Similarly, output results are written into blocks, and the user can select the required results on particular nodes to be written into different
files so that a speadsheet program can process the results efficiently. Shepherd 43 has
created an interactive graphical software tool called SHOWGRID, which can read the input and output files and displayed the arrangement and results graphically. The
option to display the deflected shapes from output files as series of animations is
available.
1.5 Layout and Scope of Research
This research was conducted in conjunction with the Health and Safety Uboratories
at Buxton. The main objective of the research was to investigate the behaviour of
steel portal frames in fire. Previous research concentrated mostly on the boundary
conditions, and it was believed that other aspects of the behaviour n-dght control the
way in which the fire develops, the modes of failures and the probability of its
control by fire fighters. Necessary investigations were also conducted onto the
16

Chapter 1: Introduction
capabilities of VULCAN as a computer modelling tool and some changes were made
to improve its performance.
A general introduction to steel properties, portal frame behaviour in fire and the finite element program VULCAN have been presented in this chapter. Particular
attention has been given to the widely accepted portal frame document published by
SCI, which was produced to satisfy the U. K. authorities.
In the next chapter, the feasibility of using VULCAN to analyse portal frames is
investigated, concentrating particularly on the analysis of sloping members since
pitched roofs are necessary. Modifications done to the VULCAN are also presented.
As part of the research project, experiments were conducted at Buxton in which a
scale model of a steel portal frame was constructed and tested under fire. Chapter 3
describes in detail the indicative tests and three major fire tests performed, along
with the test results. The following chapter compares the test results with computer
analyses performed by VULCAN. The test results obtained are discussed, as are the
significance of the comparison as well as the physical observations. VULCAN
analysis is also validated against the test results.
Once the validation of VULCAN has been done, the software is used to perform a
series of parametric studies, investigating various factors. Chapter 5 describes the first series of parametric studies in which two-dimensional frames are investigated.
The parameters concerned are the load ratios, frame geometries, heating profiles,
effect. of horizontal load and rotational stiffness. The next series of parametric
studies involve analyses on three dimensional full scale frame, where the effects of the secondary elements are included with different fire scenarios. The three dimensional parametric studies are presented in Chapter 6. Discussions on the
studies are given at the ends of these two chapters respectively.
In Chapter 7a simplified method to estimate the critical temperatures of portal frames in fire is proposed. Its purpose is to enable practising engineers to perform
quick hand calculations to obtain the failure temperature, with acceptable accuracy.
Examples of calculation are also presented.
Further discussions on other aspects of the research are presented in Chapter 8.
These include looking at aspects required by the original research proposal and
17

Chapter 1: Introduction
review of the current guide for portal frame with boundary conditions. A more
general view on performance based design approach is also briefly discussed.
Finally, general conclusions are drawn in the final chapter, along with
recommendations for future research.
18

Chapter 2: Preliminary Studies on VULCAN and Portal Frames in Fire
2 Preliminary Studies on VULCAN and Portal Frames in Fire
A preliminary investigation into the use of VULCAN has been conducted, giving
priority to rationalising the finite element code for use in analysing structural
elements not aligned with the primary axes. The study was necessary because the
most common form of portal frame is constructed with a sloping roof. Such
applications had not been addressed in any previous studies.
These studies also investigate the Ramberg-Osgood stress-strain curve adopted in
VULCAN and the modelling of semi-rigid connections at elevated temperatures. The solution procedure adopted by VULCAN and its significance is also briefly
discussed. Some initial studies of the behaviour of goal-post (flat-roof) portal frames
using VULCAN followed at the end of the chapter.
2.1 Rationalisation of VULCAN
When a VULCAN analysis is conducted, the structure is divided into a finite number
of elements prior to the actual calculation, and each element is connected between
two nodal points. Each node is associated with II degrees of freedom, namely 8V 8W At & &V
displacements (u v and w), rotations (&, 8Y and strains ( 8z , 8Y and &
), as
well as twisting and warping. The nine basic degrees of freedom (omitting twisting
and warping) are shown in Figure 2.1.
Figure 2.1 Nodal degrees of freedom in VULCAN
19

Chapter 2. Preliminary Studies on VULCAN and Portal Frames in Fire
The strain degrees of freedom are retained so that the effect of geometrical non- linearity and large displacement behaviour of structures can be modelled more
accurately by the development of plastic hinges through spread of yield. These
strains are defined in local co-ordinates, and then transformed to the global directions. Therefore, the global strain degrees of freedo-n can be fixed or freed in
the input file when setting up finite element analysis. However, if a structural
member is not placed parallel to a global axis (e. g. an inclined member), the logic of
whether to free or to fix the global strain degrees of freedom is rather uncertain.
2.1.1 The Effect of Strain Degrees of Freedom
In order to investigate the effect of the strain degrees of freedom, a simple cantilever beam has been set up to compare the behaviour under large displacement. The yield
stress of the beam has been artificially changed to an infinite value so that the large-
displacement criteria can be met. This is a load-deflection analysis which does not involve elevated temperature. The results of the analyses are shown in Figure 2.2.
6m
Load, P (kN)
3000 4000 5000 6000 7000 8
-1000 E E
-1500 m E m
-2000 CL
O -2500
-3000
-3500
- Horizontal Displacement, Free Strain (du/dz)
- Vertical Displacement, Free Strain (du/dz)
Horizontal Displacement, Fixed Strain
Vertical Displacement, Fixed Strain
Vertical Displacement, Linear Elastic Analysis
Figure 2.2 Cantilever beam - large displacement test
20

Chapter 2: Preliminary Studies on VULCAN and Portal Frames in Fire
It can be seen that the difference in displacement between the free- and fixed-strain
cases is not significant until the vertical displacements exceed 500mm, which is
equivalent to span/12. The failure criterion of a single structural element under fire
test is often taken as span/30, although inspections from full-scale fire tests on real
buildings such as the Cardington composite frame have suggested that a real
structure can sustain displacement well beyond the span/30.
Figure 2.3 shows the difference in percentage terms between the free- and fixed-
strain cases. The difference between horizontal displacements is more than 50% at 60OOkN, where the vertical displacement reaches approximately span/2.
-Horizontal Displacement
-Vertical Displacement
iiiiiii
0 1000 2000 3000 4000 5000 6000 7000 8000 Load (kN)
Figure 2.3 Comparison of fixed and free strain degree of freedom
The strain degree of freedom has been shown to affect significantly the analysis at large displacement. It will be beneficial to retain these degrees of freedom to model
second-order effects while analysing portal frames.
2.1.2 Inclined Structural Element
Within the cantilever beam analysis with free strain in Section 2.1.1, the horizontal
strain degree of freedom (&) was freed whereas the other two strain degrees of 45Z
freedom were fixed. This is because the beam element was parallel with the Z axis
and therefore the local and global axes are in line. However, when analysing an
21

Chapter 2: Preliminary Studies on VULCAN and Portal Frames in Fire
inclined member, the global strain degrees of freedom have either to be free or fixed
before the local stiffness matrix is assembled.
A simple test was carried out to investigate the issue. A two-dimensional goal-post
portal frame was set up and modelled using VULCAN. The same frame was then
rotated by 30' so that all the members were inclined to the global axes. Both layouts
are shown in Figure 2.4. If VULCAN can handle the transformation correctly, it is
expected that both the normal and rotated portal frames should demonstrate the same behaviour and give the same amount of vertical displacement.
ý
W
0.1 w I Vertical
Displacement
Frame A Figure 2.4 The layout of the models
Each of the frames was modelled in 2 different ways, using 14 and 28 elements
respectively. This enables a more complete comparison between them. The results
are shown in Figure 2.5. It is seen from the plot that, if the strain degrees of freedom
are introduced into the inclined portal frame B, the results obtained are not
consistent, even between the cases using different numbers of elements. When strain
effects are fixed, all the results are consistent. This indicates that having the global
strain degree of freedom free does not represent the boundary conditions accurately
for the inclined member.
Further analyses were conducted with different combinations of numbers of elements for the rafters and columns, as well as testing various boundary conditions,
particularly at the connections.
22

Chapter 2: Preliminary Studies on VULCAN and Portal Frames in Fire
Load (kN)
0 D 40 60 80 1 00 120 140 1 R)
-50+
E-1(X)
-150 ý ß
-200
-250f
Frame A, Fixed strains Frame A, Including strains
-*- Frame A, 14 elements, Fixed strains
+Frame B, 14 elements, Including strain
-- Frame B, 28 elements, Fixed strains
-s-Frame B, 28elements, Including strains
Figure 2.5 Comparison of the normal and rotated goal-post portal frames
Table 2.1 below shows the cases of combinations used for further investigation.
Each case was analysed with free and fixed strain degrees of freedom on both the
normal and rotated frame.
Case 1 4 elements for each columns and 6 elements for each rafters.
Case 2 8 elements for each columns and 12 elements for each rafters.
Case 3 1 elements for each columns and 6 elements for each rafters.
Case 4 1 elements for each columns and 12 elements for each rafters.
Table 2.1 Combinations of different numbers of elements
It was realised that, at the connection between the column and rafter, both the
vertical and horizontal strains are free at this particular node. However, the second-
order effect at the connection is thought have little effect on the structural behaviour.
Therefore, all the cases were analysed again with free strain at the rafter-to-rafter and
column-to-column nodes, but all strain degrees of freedom were fixed at the rafter-
to-column joint nodes.
it was found, in all the cases, that the results from the non-rotated frame were
consistent. Figure 2.6 plots all the vertical displacements at mid-span from the cases
of the rotated frame B.
23

Chapter 2. Preliminary Studies on VULCAN and Portal Frames in Fire
Load (kN)
0
-100
E E
-200 E (D
-300 Q W
Ö -400
-500
-600
-700
0
Case 1, Include Strain
- Case 1, Fixed Strain
-Case 1, Fixed strain at Connection
-a-Case 2, Include Strain
- Case 2, Fixed Strain
-Case 2, Fixed strain at Connection
Case 3, Include Strain
Case 3, Fixed Strain
Case 3, Fixed strain at Connection
Case 4, Include Strain
-Case 4, Fixed Strain Case 4, Fixed strain at Connection
80 100 120 -i -i 140 160 1s
. ý; ý
Figure 2.6 Vertical displacement for strain investigation of Frame B
0
From the displacement plot, some inconsistency can be seen in results when the
strain degree of freedom is allowed. It also gives different displacements when
different combinations of element numbers are used. However, when the strains are fixed at the connection nodes and left free elsewhere, then all cases give very similar
results. These analyses also reach higher displacement levels compared to the fixed-
strain cases.
It is therefore reasonable to model the inclined members with the strain degree of freedom fixed at the joints without compromising the geometrical non-linearity given by VULCAN analysis. The approach can be applied to the analysis of pitched-roof
portal frames, where the strain degree of freedom of the node at the beam-to-rafter
and rafter-to-rafter apex connection will be fixed. The secondary effect can be
included at the nodes between connections.
Further tests on pitched-roof portal frames using this approach were conducted and it
was found that results produced were consistent. All the analyses conducted for the
parametric studies in the later chapters have adopted the same approach in modelling
the frames.
24

Chapter 2: Preliminary Studies on VULCAN and Portal Frames in Fire
2.2 Modification of Ramberg-Osgood Model
While investigating the strain degree of freedom in the previous study, some analyses
were conducted at elevated temperatures. With certain boundary conditions it was
found that the deflection paths output by VULCAN were not reasonable, particularly
at around 700'C. Figure 2.7 shows some of the vertical displacements at the apex of
a pitched-roof portal frame produced by VULCAN. It is obvious that the
displacement curves have discontinuities at about 700'C, which do not seem
structurally reasonable.
Figure 2.7 VULCAN analysis
It was thought that this phenomenon was related to the form of the existing Ramberg-Osgood stress-strain curves adopted in VULCAN. The Ramberg-Osgood
mode19 for stress-strain curves of steel at elevated temperatures modifies the strains
at a given stress by the use of three temperature-dependent parameters, namely A,, B,
and Nt. VULCAN uses this model for the analysis of structural behaviour at elevated
temperatures.
The Ramberg-Osgood equation is given as
6T ßT )Nr
ET = AT
+ BT
where e, and or, represent strain and stress respectively at temperature t.
(2.1)
25

Chapter 2: Preliminary Studies on VULCAN and Portal Frames in Fire
Value of BT and NT
300
50+
Value of AT
z 200000
180000
160000
140000
120000
100000
80000
60000
40000
20000
0+ iiiiiiiiiF0 0 100 200 300 400 500 600 700 800 900 1000
Temperature (C)
Figure 2.8 Coefficients for the Ramberg-Osgood Equation for steel
Figure 2.8 shows the value of each parameter in Eq. 2.1 as a function of temperature.
Note that At and Bt have previously been smoothed at 400'C by Shepherd 32 . The
green lines are the original Ramberg-Osgood curves for the coefficients At and Bt; it
can be seen that there is a sudden change at 700'C.
In order to smooth the curves around 700'C, polynomials were derived to impose a
gradual change on the coefficients between 650'C and 750'C, and these are shown
as the red and blue lines in Figure 2.8. The minimal polynomials required to match
the value and gradient of each coefficient are cubics, which are expressed between
650' and 750'C as
A, = -0.01129522917 t3 + 25.04696979 t2 - 18637.68776 t+ 4673770.117
(2.2)
Bt = 0.000000094 t; + 0.001356 t2 -2.222025 t +1024.0875 (2.3)
From Figure 2.9 it can be seen that the stress-strains curves for the original Ramberg-
Osgood model just below 700'C are more closely bunched than above 700'C.
Figure 2.10 shows the modified model where the gaps between curves reduce
Smoothed BT
NT
Smoothed AT
Orignal Romberg-Osgood Curve
26

Chapter 2: Preliminarv Studies on VULCAN and Portal Frames in Fire
continuously. Therefore, there will not be a sudden change in the behaviour of steel
during the analysis.
I{IIIIýI
0 0.002 0.004 0.006 0.008 0.01 0.012 0.014 0.016 0.018
Strain
0.02
Figure 2.9 The original Ramberg-Osgood stress-strain curves for S275 steel
12U
100+
80+
60+
40+
0 0.002 0.004 0.006 0.008 arty
0.012 0.014 0.016 0.018 0.02
Figure 2.10 The modified (Smoothed) Ramberg-Osgood stress-strain curves for
S275 steel
27

Chapter 2. - Preliminary Studies on VULCAN anti Portal Frames in Fire
The modified Ramberg-Osgood curves are denoted as Smoothed Ramberg-Osgood
curves. The cases shown in Figure 2.7 were re-analysed using the smoothed curves.
and the results are plotted in Figure 2.11. It can be seen that the apparent
discontinuity at 700'C in Figure 2.7 has almost been eliminated. It is felt that the
smoothed model gives a more logical representation of stress-strain behaviour in a
temperature range where metallurgical changes are not believed to affect the
mechanical behaviour. It will also be beneficial to the convergence of the analysis if
sudden changes are avoided.
0 100 200 300 400 500 600 700 600 900
-100
E -200 }
C
E -300
-400 in a u ý -500 aý >
-600
-700 Temperature (C)
-6-1 -2
t3 -4
5
0
Figure 2.11 Portal frame analysis with Smoothed Ramberg-Osgood stress-strain
curves
2.3 Rotational Stiffness of Semi-Rigid Connection
By changing the external boundary conditions, pinned and rigid connections within a
structure can be modelled by VULCAN. However, most of the practical connections designed and built in real buildings are not truly pinned or rigid joints but have semi-
rigid characteristics. They are known as semi-figid connections, and their behaviour 44,46 has been the subject of ongoing research, particularly at elevated temperatures
When Bailey 31 et al included spring elements in VULCAN, their function was to
represent the semi-figid behaviour of connections. The pre-existing spring element
could be modelled by:
28

Chapter 2: Preliminary Stidies on VULCAN and Portal Frames In Fire
Specifying a rotational stifffiess value, which remains constant at elevated temperature; or
Choosing the existing "flush-end-plate" or "extended end plate" model, for which the degradation of the rotational stiffness at elevated temperature was determined
from a series of fire teStS46,47 on a specific size of beam-column connections.
In order to have the flexibility to model various types and sizes of connection especially for the modelling of column bases in this research work, it was necessary to develop a new semi-rigid routine so that an initial rotational stiffness could be
specified and reduced accordingly as temperatures increase.
The mathematical expressions for the existing "flush-end-plate" and "extended-end-
plate" in VULCAN can again be represented by the Ramberg-Osgood expression as
Mý ýzS =
Mý +
Nr
c AT BT (2.4)
where 0, is the rotation in radians
M, is the corresponding applied moment
AT, BT and NT are the temperature-dependent coefficients.
Leston-Jones 43 44 has conducted some elevated temperature moment-rotation tests on
connections, and adopted the same expression to represent the results by curve-fitting AT9 BT and NT- Studies were also performed to investigate the effect on ftme
behaviour. The same approach has also been adopted by Al-Jabri46 who conducted a
subsequent study of the influence of elevated-temperature connection behaviour on
overall frame behaviour.
Among the three temperature-dependent coefficients within the Ramberg-Osgood
expression, At has the dominant influence on the initial tangent for the curve whereas the maximum plateau value is mainly dependent on BT. NT controls the curvature between the initial slope and the plateau.
Once the moment-rotation curve for ambient temperature has been determined by
experiment or numerical modelling (e. g. by using the component method proposed in
Eurocode 3 Annex J) it can be represented mathematically by the Ramberg-Osgood
29

Chapter 2: Preliminary Studies on VULCAN and Portal Frames in Fire
expression, choosing suitable coefficients. The initial rotational stiffness (- 80,
of
the connection can represented by the coefficient At and yielding of the connection
can be represented by BT-
When the coefficients are obtained, they can then be reduced accordingly to
represent the elevated temperature characteristic. The reduction factors for the
stress-strain relationship of steel at elevated-temperature given by Eurocode3 Part 1.2
have been chosen to represent the degradation of the semi-rigid connections, as
shown in Table 2.2.
Temperature (*C) Reduction factor for AT
(raken as kE, 6 from EC3 Part 1.2)
Reduction factor for BT Craken as ky. 9 ftom EC3 Part 1.2)
20 1.0 1.0 100 1.0 1.0 200 1.0 0.9 300 1.0 0.8 400 1.0 0.7 500 0.78 0.6 600 0.47 0.31 700 0.23 0.13 800 0.11 0.09 900 0.06 0.0675 1000 0.04 0.045
1100 0.02 0.0225 1200 0 0
Table 2.2 Reduction factors for the semi-rigid connection
As NT represents the curving between the initial slope and the plateau, Leston-Jones
made it constant in his degradation model and stated that NT does not degrade with
increasing temperatures. AI-Jabri had a similar finding from his experiments.
Therefore, NT was not degraded in the rotational stiffness model at elevated
temperature.
A spreadsheet was created to assist in determining the values of AT, BT and NT at
ambient temperature from a given moment-rotation curve. These values can then be
entered into VULCAN so that the appropriate semi-rigid characteristic at elevated
temperature can be modelled. For example, to model a semi-rigid column base the
ambient temperature moment-rotation curve can be determined using the component
method and represented by the Ramberg-Osgood expression. The coefficients AT,
30

Chapter 2: Preliminary Studies on VULCAN and Portal Frames in Fire
BT and NT are then used by VULCAN to produce appropriate rotations at particular
moment and temperature levels.
Bailey's Model
-100 200
-300 -400 -500 -550
650
-750
EC3 Model
...... 100 200 300 400
--- 500
------550 ------650
0 750
Figure 2.12 Comparison between Bailey's and EC3 degradation model
Leston-Jones' Model """"" 100
200 300 400
EC3 Model i---100
200 300 400
--500 600
0 20 40 60
Rotation (mRad) 80 100 120
Figure 2.13 Comparison between Leston-Jones' and EC3 degradation model
31

Chapter 2: Preliminary Studies on VULCAN and Portal Frames in Fire
The degraded moment-rotation curves can be plotted from the spreadsheet and
compared against the models proposed by Bailey, which was the pre-existing model in VULCAN, and Leston-Jones is curve-fit from his experimental results. Figures
2.12 and 2.13 show the comparisons.
Although some of the results are not close in the comparions, the new rotational
stiffness model is believed to provide a comprehensive numerical method
representing the degradation of semi-rigid connections at elevated temperature. The
model has now been introduced into VULCAN. However, it is beyond the scope of
this research project to further investigate the validity of the model for all ranges of
connections, including various sizes and types.
2.4 Solution Procedure for VULCAN
An iteration process is commonly used in non-linear finite element programs to
obtain a solution, which is usually the displacements from a given set of applied forces, using the stiffness matrix of the element. There are a number of solution
procedures available to be adopted with the finite element method. The Newton-
Raphson method is one of the favourite choices, due to its relative simplicity and high accuracy within a common set of problem types.
VULCAN currently adopts the Newton-Raphsoný9 method to obtain a displacement
solution at given load level, and from that other unknowns are calculated. The whole
process is to be repeated at each higher temperature (with reduced stress-strain
curves) so that the series of elevated temperature solutions is determined. This type
of solution procedure is normally adequate for most practical problems, unless it is
necessary to find solutions beyond limit points.
32

Chapter 2: Preliminary Studies on VULCAN and Portal Frames in Fire
v ýv 0 J
Displacement
Figure 2.14 Newton-Raphson solution procedure
Figure 2.14 shows a typical solution path in a one-dimensional manner. It can be
seen that each iteration step is governed by the load increment, and the changes in
displacement become larger when approaching the desired solution, hence becoming
less easily convergent. If the tangent stiffness changes from positive to negative, the
iteration process will diverge and fail to produce an answer. The solution nearest to
zero tangent stiffness (the limit point) will be the final solution and is taken as the
failure point for the structural system.
In some circumstances where the overall structural system experiences a snap- through or snap-back behaviour, the response of the structure is prompt and the displacement increases dramatically as the internal forces decrease due to the sudden loss of stiffness. However, the structure manages to regain stability after the snap- through and continues to deflect further in a stable fashion as load increases. The
Newton-Raphson method is not usually able to follow such a the displacement path,
and often takes the limit point as the "failure" of the structure. Figure 2.15 illustrates
the phenomenon.
33

Chapter 2: Preliminary Studies on VULCAN and Portal Frames in Fire
10 Co 0 J
Displacement
Figure 2.15 Snap-through behaviour
Snap-through behaviour can happen to pitched-roof portal frames. The columns of
the portal frame restrain the rafters from deflecting when loaded or heated in fire,
thus generating horizontal compression forces up to a point where the rafter angle is
sufficiently shallow for the apex to dive vertically in a dramatic fashion. The portal frame can then regain stability for a further load range before collapsing.
Other solution procedures are available to overcome the problem, but usually involve
a longer iteration process. Crisfield 50 proposed a modified Rik's approach to
overcome limit points and to be able to solve for convoluted load-deflection paths. This is applied in conjunction with the Newton-Raphson method by introducing an
extra constraint equation. Other possible solution procedures include the Displacement Control Method49 , which displacement increment steps are applied
rather than load increment steps. Arc-Length method 51 * involves controlling a norm
of all degrees of freedom to achieve a more stable solution procedure and to handle
snap-through behaviour.
Shepherd 32 et al have recently conducted an investigation into various solution
procedures and the possibility of implementing extra options to be used in
conjunction with the existing Newton-Raphson method for VULCAN. It was found
that the Arc-Length method is indeed suitable to be included into VULCAN analysis. Simple structural tests were set up to test these alternative solution procedures.
34

Chapter 2: Preliminary Studies on VULCAN and Portal Frames in Fire
To date the Arc-Length method has not been fully implemented in VULCAN.
Hence post-snap-through behaviour of the pitched-roof portal frame can not be
predicted by the finite element program.
2.5 Initial Studies of Portal Frames in Fire
The objective of this section is to test the capability of VULCAN in analysing portal frame structures. The study was conducted prior to an extensive rationalisation of the code, and therefore the strain degrees of freedom were fixed so that reliable
analytical results could be obtained for moderate deflections. Several models were
set up to examine the response predicted by the program with different cases of frames and heating zones. Only 2-dimensional frames were examined, without haunches at the eaves or apex. In most cases only a small proportion of the frame
was heated, rather than assuming that the fire covered the entire width of the frame.
2.5.1 Goal-Post Portal Frame
Figure 2.16 shows the general layout of the model which was set up, and Figure 2.17
shows the elements used to represent it. Several different heating regimes were imposed, and the details of these are provided in Table 2.3.
From the analysis using VULCAN, results in terms of displacements, rotations and
strains at each node were obtained. A graph of the mid-span deflections of the roof beam against temperature is shown in Figure 2.18 to allow examination of the trends in behaviour of the heated frame in the different heating regimes. A typical deflected
shape, amplified with respect to the original dimensions, is also presented in Figure
2.19.
35

Chapter 2: Preliminary Studies on VULCAN and Portal Frames in Fire
i
"-7l foed %s
100 kN
451026"
5' 2IOx&2J
W-fb., 4 be.
20000
Figure 2.16 General layout of the goal-post portal frame
t rce gi__, t� ct'. ci --1 tc. fl ei 0 en CI . fl fefl C, flCI
flayrt I finwi 11 (ell)
ýIWA 3 f6wi 12 U12
? 6mr&2 M) fleffea 15 M
f lewnt I Ul) flewt 14 Ull
tkmROMY NmertbUN' Nwd7MY fkffw9B(f5)' týmmtjo(tjo)
7; 7,
Figure 2.17 Element layout
36

Chapter 2. - Preliminarýv Studies (in VULCAN and Portal Frames in Fire
Profile No. Heated Element
E4, E5
E4, E5, E6
3 E3, E4, E5
4 E3, E4, E5, E6
5 E5
6 E5, E6
7 E5, E6, E7, E8, E9, E 10
8 Whole frame was heated
Table 2.3 The Heating Regimes
0 -100 +
100
tl 2
--0-3 4
_.. ý 5 6
8
Temperature (°C) 200 300 400 500 600 700
-260 Displacement (mm)
Figure 2.18 Vertical displacement at the beam mid-span for different heating
regimes
37

Chapter 2: Preliminary Studies on VULCAN and Portal Frames in Fire
41 w
)KN
Heatled Flement
*Original Framc 20'C 180'C 340'C
X 500')C 49 587.5'C
Not to sc ale: Deflect ions 35 times exaggerat ed
Figure 2.19 Deflected shapes of the goal-post portal frame heated to profile no. I
For the deflected shapes shown in Figure 2.19, elements 4 and 5 are heated and hence expand, causing the initial upward displacement at the eaves. As the column bases of the frame are fixed against rotation, this provides further restraint to the
frame, which effectively pushes the left-hand eaves joint further in the upward direction. Subsequently, due to the material degradation at high temperature, the
mid-span of the beam deflects downwards and continues to deflect until the first
plastic hinge is formed. Steel starts to degrade rapidly after 400'C, and this
phenomenon can be seen in Figure 2.18, in which the mid-span deflection increases
considerably above this temperature.
It can be concluded that the behaviour of this rectangular three-member frame as
analysed by VULCAN is perfectly logical.
2.5.2 Pitched-Roof Portal Frame
It was decided to conduct a test similar to that on the goal-post frame on a pitched-
roof portal frame, to see whether similar behaviour occurred.
38

Chapter 2: Preliminary Studies on VULCAN and Portal Frames in Fire
2.5.2.1 Fixed-Base Frame
The initial approach was to examine a pitched-roof portal frame with both column bases fixed. A larger, more representative, span of 30m was used. The general layout is shown in Figure 2.20.
4
7
hl6
Figure 2.20 General layout of the pitched-roof portal frame with fixed bases
267
950-1
C 21
E6 E5 M
"I,
1000 11
Figure 2.21 Finite element model of the pitched-roof portal framc with fixed bases
Profile No. Heated Element(s) I E7, E8 2 E7, E8, E9 3 E7, E8, E9, EIO 4 E7, E8, E9, EIO, Ell 5 E7, E8, E9, El 0, Ell, El 2 6 E22, E23 7 E21, E22, E23, E24
18 E20, E21, E22, E23, E24, E25
Table 2.4 Heating regimes for the pitched-roof portal frame with fixed bases
39
ic

Chapter 2. - Preliminarýv Studies on VULCAN and Portal Frames in Fire
The predicted displacements at the apex are plotted in Figure 2.22. Note that heating
profiles 1,2,3,4 and 5 are cases in which the top left eaves of the frame was heated,
whereas profiles 6,7 and 8 are cases in which the apex was heated. These are cases
where the apex acts as a "smoke reservoir" and hence it is heated symmetrically.
Temperature (T)
100 200 300 400 500 600 700 800 900
-50
-100
-150
-200
-250
-300
-350
-400 Displacement (mm)
Heating Profile -a- 1
2 -+- 3
4 5 6
-3E-- 7 8
Figure 2.22 Vertical displacement at the apex under different heating profiles.
From Figure 2.22, it can be seen that the comer-heated frames have a trend of deflection which is very similar from one case to another, but is quite different from
the cases which are heated in the region of the apex. Several deflected shapes of the
frame are shown in Figure 2.23 and Figure 2.24.
For the cases where the eaves region is heated it can be seen that, as the heated zone
temperature increases, the rafter near to the heated comer experiences higher
deflection, which is to be expected. Similarly to the goal-post portal frame described
earlier, the fixity of the bases against rotation provides restraint to the frame against
severe sway displacement. Inevitably there is a slight upward displacement of the
heated comer due to thermal expansion of the column.
From Figure 2.22 it can be seen that in the centrally heated cases the apex displaces
upward gradually as temperature increases. This can be explained by inspection of
40

Chapter 2. - Preliminary Studies on VULCAN and Portal Frames in Fire
the deflected shapes plotted in Figure 2.25. The fixed bases provide stiffness which
prevents the column from being pushed outwards, and hence prevents downward
deflection at the apex. At the same time, thermal expansion again forces the apex to
deflect upward. However, the centres of both of the rafters deflect gradually
downward due to material degradation while being heated.
Norinal Frame A 20"('
500"C
mm Hcalý: d Heniew
A A
A AA AAA
A AA AAA
A
L
Not loscale: IX-flection values arc 35 tinics cxa, -,,.! cra(cd
Figure 2.23 Deflected shapes of pitched-roof fixed-base frame under heating
profile no. 1
Normal Frame 20'C 5(X)"C 614.4'C
LeO00010
m 1
me 00 lm MM m mMI
N Ne m0ý ýV
Not to scale. Deflections 35 times exaggerated III
Figure 2.24 Deflected shapes of pitched-roof fixed-base frame under heating
profile no. 5
41

Chapter 2: Preliminary Studies on VULCAN and Portal Frames in Fire
y s ®
ý
b
-S
*--I
ý
Not to scale: Deflections 50 times exaggerated
iiii
Normal Frame
20'C
500"C
827.5'C
Figure 2.25 Deflected shapes of pitched-roof fixed-base frame under heating
profile no. 7
2.5.2.2 Pinned-Base Frame
Having realised that fixed bases have a considerable effect on the frame while it is
being heated, and also because in reality most industrial portals are designed with
nominally pinned bases, a similar frame was then modelled with pinned bases to both
columns. A similar layout to that used in Figure 2.20 was used, except that slightly
smaller equal point loads of 70 kN were applied to the mid-points of both rafters. An
identical set of heating regimes was used so that the results could be compared directly. Figure 2.26 shows the graph of predicted vertical displacement at the apex
against temperature.
When the bases are not restrained against rotation, it is predictable that the frame will
suffer higher horizontal eaves displacements. In addition, vertical displacements at
each node are higher compared to the fixed-base model. In this case the whole frame
deflects downwards despite the effect of thermal expansion of the rafters. This kind
of structure can be considered as more vulnerable when exposed to fire.
42

Chapter 2: Preliminary Studies on VULCAN and Portal Frames in Fire
Temperature ('C)
0 100 200 300 4W 5W 6W 7W -150 L0iiii
-200 1
-250 1
-300 1
-350 1
-400 1
--1 2
-. -- 3 -4
5 6 7
-I-- 8
-450 ' Displacement (mm)
Figure 2.26 Vertical displacement at the apex of pitched-roof portal frame with
pinned bases
Normal Frame ' 220 C
400'C ' 620 C
, . 0000
-- 4 ý r
AL
- A A A
A X4
A A A AAA A'
W-0-0-0
Not to scale: Deflections 25 times exaggerated
k
Figure 2.27 Deflected shapes of pitched-roof pinned-base frame under heating
profile no. 5
43

Chapter 2: Preliminary Studies on VULCAN and Portal Frames in Fire
In typical industrial portal frames it is difficult and not usually cost-efficient to
provide fixed bases, and it is obviously impossible to create a pure pinned base
which gives no rotational restraint at all. Therefore, it is worth investigating typical
rotational stiffnesses for the bases used in portal frame construction so that
appropriate data can be tested in VULCAN analysis.
2.6 Conclusion
An investigation of the finite element code VULCAN has been performed so that it
can be used to analyse portal frames with sloping members, without sacrificing the higher-order terms which are likely to affect the analysis at high displacements.
Further work has been conducted to refine the Ramberg-Osgood stress-strain curves in VULCAN. Degradation of semi-rigid connections at elevated temperatures using the EC3 steel strength and stiffness reduction factors was included into VULCAN.
Various types connection can be represented provided the ambient-temperature behaviour is available.
Preliminary studies of the behaviour of portal frames were performed using VULCAN. The plots of the portal frame deflections at elevated temperatures were found to be logical, giving confidence in the capability of VULCAN to analyse such
structures.
The overall studies were aimed to provide a refined numerical tool to model portal frame behaviour in fire. VULCAN will be applied to modelling the experimental
results obtained from the fire tests conducted at Buxton, hence validating the
analytical results. The finite element code will also be used to conduct a series of
parametric studies and validation of the simple calculation technique proposed later
in the thesis.
44

Chapter 3: Indicative Fire Tests
3 Indicative Fire Tests
As part of the research project sponsored by Health and Safety Laboratories to investigate the behaviour of industrial portal frames, a series of fire tests on a scale-
model portal frame were planned to be conducted at the Health and Safety
Laboratory at Buxton. The laboratory had relatively little experience in conducting fire tests on real structures and it was proposed first to conduct a series of indicative
tests on steel panels prior to the portal frame tests.
The 115 scale portal frame structure will be described at a later stage. It is intended
to represent the behaviour of real portal frames in fire, mainly by ensuring that the
geometry and load level are realistic compared to contemporary construction.
This chapter will describe the indicative panels and their significance in detail.
3.1 Introduction
This section describes the indicative fire tests conducted on the 60' and Ilt"
November 1997. The tests involved a steel panel, supported by Z-purlins and I-
beams and heated by a gas flame. The purpose of these tests was to give a general indication of the temperature distributions to be expected in the region of the purlins
and cladding panels.
The opportunity was taken to investigate the instrumentation available at Health and Safety Laboratories for this type of experiment. It was necessary to record the
atmosphere and steel temperatures throughout the test, which can be recorded by
thermocouples conventionally. The use of a thermal imaging camera was introduced, enabling the temperatures of any part visible to the camera to be recorded
and distinguished using colour coding. The benefit of using the thermal imaging
camera was to reduce the number of thermocouples required and to maximise the information obtained from the tests.
It was essential to ensure that all data required were recorded and available for each fire test, as it is costly and time-consurning to repeat a fire test.
Figure 3.1 shows a picture of the panel before the experiment. The surfaces of the
steel panels, beams and purlins were all painted black so that the surface ernissivity
45

Chapter 3: Indicative Fire Tests
was close to unity, thus allowing the use of the thermal imaging camera to show the
surface temperatures during the test.
Figure 3.1 The indicative test panel
Three tests were perfonned, using different fire intensities and durations.
3.2 Design of the Indicative Panel
Given the purpose of conducting the indicative tests, the structural performance of
the panels was not the critical factor and therefore the panels were supported in the
most convenient way possible.
Figure 3.2,3.3 and 3.4 show the design of the panel for the indicative tests. Since
the members do not support any loading other than self-weight, the smallest size of
UB section was used. The panel was suspended from chains at the four comers to
the roof of the shed in which the experiment took place.
Figure 3.2 Front view (left) and Elevation (right) of the panel
46

Chapter 3: Indicative Fire Tests
MONT VEW
Figure 3.3 Plan View of the indicative
Figure 3.4 Isometric sketch of the connection details
Structural details: Rafter size: 127x76xl3 UB
A= 16.5 cm'
1,,,, = 473 cný
Mass per metre = 13.0 kg
Hp/A = 325 (4 sided profile)
Purlin size: 142x58xl. 8 Z pulins
A=8.53 cm 2
lxx = 74.1 CM4
Mass per metre = 6.7 kg
Roof Cladding: H. H.
Robertson (UK) Ltd.,
IBR9
Thickness = 0.6 mm
47

Chapter 3. - Indicative Fire Tests
3.3 The First Indicative Test
The first test was carried out on 6h November 1997. Six thermocouples were used in
this test; Figure 3.5 shows the positions relative to the fire. None of the
thermocouples were welded onto the steel, which means that they were only
measuring the air temperatures around the steel. The steel surfaces were viewed
using the thermal imaging camera, so that temperature distributions could be
obtained.
Figure 3.5 Positions of thermocouples
The gas flame burned for about 3 minutes with a gas flow of 100 litres/min.
Thermocouples 1,2 and 3 measured the temperatures around the Z-purlins; 4,5 and
10 measured temperatures around the I-beam.
Figure 3.6 shows a picture taken during the test. Figure 3.7 plots the recorded
temperatures of each thermocouple against time. A computer prograrn, TASEF52'
written in Fortran77 code was then used to predict the temperature distribution of the
steel purlins from the gas temperatures, and the results were compared against those
indicated by the thermal camera images. Figure 3.8 illustrates the results from the
program. Figure 3.9 is a thermal image of the whole panel towards the end of the
test. Figure 3.10 shows the condition of the panel and the purlin after the test.
48

Chapter 3: Indicative Fire Tests
Figure 3.6 The first indicative panel test
-Purlins Under (TC3) -Purlins Side l(TC 1)
Purlins Side 2(TC 2) -Beam Under(TC 10) -Beam Side l(TC 4) - Beam Side 2(TC 51
0 20 40 60 80 100 Time (s)
120 140 160
Figure 3.7 Temperatures recorded from the first indicative panel test
180
49

Chapter 3: Indicative Fire Tests
1000
900
800
700
600
500
400
300
200
100
0 40 60 80 100
Time (s)
Top Flange(Tasef)
-Bottom Flange(Tasef)
Mid Web(Tasef)
Top Flange(Thermal Images)
Bottom Flange(Thermal Images)
Mid Web(Thermal Images)
120 140 160 180 20
Figure 3.8 Comparison between results from TASEF and thermal images
Figure 3.9 An example of the thermal image
50

Chapter 3: Indicative Fire Tests
Figure 3.10 Panel and the purlin condition after 1st Test
The results of TASEF show generally lower steel temperatures profile compared to
those indicated from thermal images, but the margin of difference is acceptable. This
gives confidence that TASEF is capable of predicting steel temperatures 2-
dimensionally with good accuracy. However, from inspection after the test, it could be seen that some of the black paint on the purlin and underside of the panel had
fallen off due to the intense heat. The emissivity of the purlin may therefore vary
throughout the test. Hence, there may be some reason to doubt the accuracy of the
thermal images in representing the real element temperatures.
There was no significant structural damage to the panels after the test. This is logical
since the beams and purlins were not loaded and they were not restrained at their
ends.
3.4 The Second Indicative Test
Further indicative tests were conducted at Buxton on 2l't November 1997, in which
2 thermocouples were welded onto the steel Fbeam, enabling the actual temperatures
of the steel to be recorded in order to compare against the temperatures given by the
thermal images from the camera.
The design of the panel for these second and third tests was identical to the first. The
positions of the thermocouples were slightly changed, as some of them were to
measure steel temperature instead of the air temperature. Figure 3.11 shows the
51

Chapter 3: Indicative Fire Tests
positions in detail. Thermocouples 1,2 and 3 were placed near to the Z-purlins; 9,
10 and 12 were placed near to the I-beam, and II and 16 were actually welded onto
the top and bottom flanges of the beam respectively.
Figure 3.11 Position of thermocouples for the second and third indicative tests
For the second test, a baffle was put underneath the centre of the panel so that the gas
flame and the heat flow were essentially 2-dimensional and hence concentrated on
the heating of the sections of which thermocouples were placed. Fig. 3.12 illustrates
the set-up of the baffle in a picture taken before the test was carried out. For this
experiment the steel temperature was expected to be high, as most of the heat
released was collected and concentrated within the baffle. 160 lit/rnýin of gas flow
was maintained throughout the test, which lasted for about 5 minutes.
Although the baffle was designed to contain the fire and heat, the actual fire was so
intense during the test that the flame extended out of the baffle. As a result, the beam
section with the welded-on thermocouple was fully engulfed in the fire for most of
the time. Therefore the temperatures surrounding the beam thermocouples can be
expected to be similar to those recording temperatures around the Z-purlin.
Figure 3.14 shows the steel beam engulfed in flame during this test.
52

Chapter 3. - Indicative Fire Tests
Figure 3.12 Set-up of the second test with baffle in place
5
FroNf VEW
20 ccý
fF 76 5&1 ýIN A
Ifl
2o
5ection A-A
I
'F0516on of [3affle
Frokiew
Figure 3.13 Set-up of the haffle for the second test
:7 t30
53

Chapter 3: Indicative Fire Tests
Figure 3.14 The second indicative test
1000
900 ý 800-
7001
600
500
400
300
200
100
0
-TC I
-TC 2 TC 3 TC 9
-TC 10
-TC 11
-TC 12
-TC 16
0 50 100 150 200 250 300 350 400 450 500 Time (s)
Figure 3.15 Temperature distribution recorded from the second indicative test
Figure 3.15 shows the recorded temperatures for each thermocouple. A separate
computer program, FIRES-T3 53 , was obtained and made executable in Fortran77
code. The program is capable of predicting steel temperatures, given the surrounding
atmosphere temperature, and can perform a 3-dimensional analysis. With the gas
temperature data from the test, FIRES-T3 was used to predict the temperatures of the
I-beam section on which thermocouples were placed. Figure 3.16 shows the
54

Chapter 3: Indicative Fire Tests
comparison between the experimental results and the output from FIRES-T3. The
temperature readings from the thermal images are plotted with an indication of their
range of error. This is because the thermal images can only show refined colour
variation due to thermal changes to an accuracy of ±5%. Temperatures of the steel
surface obtained from the thermocouples are plotted to the same figure so that
comparison can be made and hence the accuracy of the thermal images assessed.
450
400
350 ý
-300 ý 0
d) S- 250 d I-
92001 E 1'- 150 ý
100
0
TC11
100
TC 16
Top Flange(RRES-T3)
Botton Flange(FIRES- T3)
- -Mid ftb(RRES-T3)
Top Flange (Thermal Images)
Boftorn Flange (Thermal Images) Mid Web(Thermal Images)
600
Figure 3.16 Comparison between thermal image and thermocouple
temperatures and FIRES-T3 analysis - second indicative test
Figure 3.17 Condition of panel after the second indicative test
200 300
Time (s)
400 500
55

Chapter 3: Indicative Fire Tests
3.5 The Third Indicative Test
As soon as the panel had cooled after the second indicative test, the baffle was
removed and the third test was conducted.
The arrangement of the thermocouples was unchanged, and the same gas bumer was
used. A slight reduction in gas flows was made for this test, and a discharge of 150
lit/min was applied. It was expected that the fire would spread over the whole panel,
and the heat was not contained. Therefore, the steel temperatures in this test were
expected to be much lower.
Figure 3.18 shows the penetration of fire onto the steel panel.
Figure 3.18 The third indicative panel test
The temperature data taken from the thermocouples is plotted in Figure 3.19. It can be seen that the gas temperatures near the I-beam are much lower than those around
the purlin which was engulfed in the flame. The beam steel temperatures closely follow the gas temperature.
The gas temperatures were again fed into the program FIRES-T3 for prediction of
the steel temperatures. Figure 3.20 compares the recorded thermocouple
temperatures against the analysis from FIRES-T3. The reading from the thermal
images is also plotted in the figure with bars indicating the range of error.
Figure 3.21 shows the condition of the purlin and beam after the tests. The black
paint on the surface of the hottest part of purlin was seen to have fallen off, and the
56

Chapter 3: Indicative Fire Tests
purlin was slightly distorted by the intense heat. No further significant darnage was
observed.
1000
900
800
700
600
500
400
300
200
100
0 0
ý11 .
100 200 300
Time (s)
DWý
400
v -TC 1
-TC 2 TC 3 TC 9
-TC 10
-TC 11
-TC 12
-TC 16
500 600
Figure 3.19 Temperature distributions recorded from the third indicative test
-- TC 11
TC 16
- Top Flange(FIRES-T3)
Botton Flange(FIRES- T3)
-- Mid Web(FIRES-T3)
Top Flange (Thermal Images) Bottom Flange (Thermal Images) Mid Web(Thermal Images)
0 100 200 300
Time (s)
400 500 600
Figure 3.20 Comparison between thermal imaging temperatures and FIRES-T3
analysis - third indicative test
57

Chapter 3. - Indicative Fire Tests
Figure 3.21 Condition of panel after the fire tests
3.6 Discussion on Indicative Panel Tests
The first test was significant in developing the experimental techniques to be used
and generating some thoughts for the fire tests, for instance on the use of the thermal
imaging camera and the necessity of having thermocouples to record steel
temperatures. The temperatures read from the thermal images from the first test
were encouraging when compared against the analytical results obtained from the
computer program TASEF.
In order to ensure the accuracy of the thermal imaging camera, some further testing
was conducted. In the following second and third tests, the top and bottom flange
temperatures were checked by some thermocouples welded onto these elements.
While examining the steel temperatures taken from these tests, it was found that the
bottom flange of the beam was hotter than the top flange during the second test,
whereas the reverse condition was found for the third test. The rationalisation is that
the baffle installed only in the second test effectively channelled most of the heat
from the gas flame and heated the beam intensively. The heat was then transferred to
the panel through the top flange and lost to the surrounding environment through
convection and radiation. In the third test, where the baffle was removed, the heat
was distributed to the surroundings evenly and the panel formed a shield to collect hot gases underneath it. The rate of heat loss beneath the panel was greater than the
convection and radiation through the air above it. It is believed that a layer of hot air,
58

Chapter 3: Indicative Fire Tests
with thickness of approximately 10% of the height from the fire to the panel, was formed beneath the panel. Therefore, the top flange was hotter than the bottom
flange.
During a warehouse fire, the condition of the second test may be expected if an intense fire is ignited and flash-over takes place with high fuel load. However, if a
small local fire occurs, the fire condition of the third test may be predicted. However,
from the structural point of view, the temperature difference between the top and bottom flange is not significant enough to cause any thermal bowing to take place in
the beam. It is therefore suggested that an evenly distributed temperature profile can be adopted across the section in analysing the structural behaviour.
On the other hand, comparing steel temperatures taken from the thermocouples and
analytical results for the second and third tests, these temperatures compares well
with each other. Analytical tools can predict steel temperature from the surrounding
air temperature with relatively good accuracy, provided sufficiently accurate data is
obtained for input.
The temperatures measured in the second test are more precisely predicted by
FIRES-T3 compared to results from the third test. This is because there was more
uncertainty about fire conditions in the third test. This was conducted without the
baffle, and hence variations in the wind condition, the emissivity of the fire, etc can
affect the analysis. This fire condition and the heat transfer mechanism for the
second test are more stable and predictable. The overall results are considered
acceptable.
it can be seen from Figures 3.16 and 3.20 that temperature values indicated by the
thermal images were generally higher than those recorded from the thermocouples.
There is little reason to doubt the accuracy of the thermocouples, since they compare
well with the analytical predictions. The reason suggested for the apparently higher
temperature readings from thermal imaging is that the layer of hot gases collecting
underneath the panel may have been recorded by the thermal image camera and
interpreted as the steel temperature. The black paint on the steel surface was flaking
off throughout the test but the thermal imaging camera has assumed an unchanged
emissivity throughout the test.
59

Chapter 3: Indicative Fire Tests
The general rule of radiation is governed by heat leaving a surface due to both
reflection and emission, and on reaching a second surface, experiencing reflection as
well as absorption. When the approximation of a blackbody is assumed, the process
can be simplified by eliminating reflection from the equation. As soon as the black
paint on the beam peels off, the thermal image camera can be over-estimating the
temperature by recognising the natural colour of the beam as a high temperature
surface. However, it is rather difficult to quantify the level of errors, and amount of
paint which came off during the test.
Consequently, a decision was made to abandon the use of the thermal imaging
camera in the following tests, and conventional thermocouples were used instead.
3.7 Design of the Portal Frame Warehouse
Following the indicative panel tests conducted at Buxton, a 115 scaled portal frame
structure was built and tested under fire conditions. Displacements and temperature
were measured and recorded with reference to time during these experiments. The
experience from the indicative tests was beneficial in the setting up of the testing
apparatus.
The major purpose of the frame model tests was to observe the collapse behaviour of
a portal frame at elevated temperature, and the numerical data were used to validate
the analytical results produced by VULCAN.
It was intended to design the portal frame to BS 5950, with the appropriate load level
and resistance. The designed structure is a scaled-down model of a portal frame of 30m span and 12m column height with a scale reduction of 1: 5. The rafter pitch is
14.90
Figure 3.22 shows the layout of the structure, as designed by the author. It was later
realised that even with the smallest UB section available, this would still be too
strong to be adopted with the given geometry and self-weight to achieve a reasonable design. It was therefore decided to add extra imposed loading to the roof, so that the
total loading (including the self-weight) was equivalent to a load ratio of 0.2 on the
internal portal frames. This load level was an estimate of the extreme case likely to
be encountered during a fire in reality.
60

Chapter 3: Indicative Fire Tests
A fire was to be ignited below internal portal frame, and temperatures were measured
along the rafters and columns. Displacements would be taken at the ridge and eaves
of the heated portal frame. It was planned to investigate different fire scenarios, with the details of the portal frame design being improved if necessary so that a typical
portal frame structure could be modelled.
Further details on the instrumentation and the tests themselves will be described in
Chapter 4, along with the results and numerical modelling.
3.8 Conclusion
Three indicative tests were conducted prior to the fire tests on scaled portal frame
structures which were planned for the research project. These indicative tests were
mainly aimed at examining the temperature distributions around frame members and
purlins in the roof-space of a portal frame subjected to a local fire. Experience on
conducting structural fire tests was also gained. It was found that the steel
temperatures could be predicted with acceptable accuracy by existing thermal
analysis software. This is significant in that it allows structural fire analysis to be
conducted with reasonable confidence that the temperature distributions in the
steelwork are representative of reality.
A 1: 5 scale model of a portal frame structure was designed and constructed for the
actual fire tests. The following chapter will give details on these experiments.
61

Chapter 3: Indicative Fire Tests
"E lý, Z. T
0 3:
r0
N Co -0 cý
*ii m) m0E x -i r- E to .c0 0 rl' «o «a
.0m0 E-E '2' E
CL cz Li C, 4
800 I
103
loj
loj
2000
a
-o a -a
x
z
!2 14.9*
IL t 0
CL
o r
11
C-
6c 00
14 Sý IIII LLJ
11 3::
800
60 1 00 0 1 L.
a) E 0 V)
I
2000 1-
I
I
I
Figure 3.22 General layout of the experiment structure
62

Chapter 4. - Fire Tests on a Scaled Portal Frame and Computer Modelling
4 Fire Tests on a Scaled Portal Frame and Computer Modelling
Following the series of indicative fire tests described in Chapter 3, a scaled portal frame warehouse model was constructed at the Health and Safety Laboratory,
Buxton to be tested under fire. The portal frame has been designed and shown in
Chapter 3. The main purpose of conducting these tests was to investigate the
structural behaviour of steel portal frames at elevated temperature. Figure 4.1 shows
the completed portal frame structure model. A goal post frame was constructed
outside the test structure, which acted as a reference datum for the purpose of
measuring displacements.
Figure 4.1 The Warehouse Model
Three major fire tests were conducted on the internal frame. This chapter describes
these experiments in detail, and shows the recorded test results. The structural
behaviour will then be modelled with VULCAN after the test so that the results can
be compared and validated.
4.1 The Testing System and Instrumentation
This section describes the setting-up of the series of fire tests on the portal frame
structure, including the instrumentation used for measuring the temperatures and
deflections. A gravity loading system was included, since it was necessary to add
extra loading to the frame to represent typical portal frame action.
63

Chapter 4: Fire Tests on a Scaled Portal Frame and Computer Modelling
4.1.1 Temperatures Measurement
With the experience gained from the previous indicative test it was decided to adopt
conventional thermocouples for measuring the steel and gas temperatures. It was important to record accurate temperature profiles across the portal frame under test
so that they could be applied to the computer modelling.
Figure 4.2 shows the positions of the thermocouples used in the tests. Sl to S16
denote the thermocouples welded onto the steel. Thermocouples S4, S5, S6 and S9,
SIO and Sll were welded onto the top, mid-web and bottom flange of the steel
section at the eaves and apex respectively. The other steel thermocouples were
welded onto the web at the various positions shown. Other thermocouples, Gasl, 2
and 3 measured the atmosphere temperature at the two eaves and the apex.
Gas 2
Figure 4.2 Positions of thermocouples
All thermocouples were connected to a data logger away from the test structure,
using insulated wires and cables. Care was taken to ensure that the measurements
would not be affected by heat during the experiment.
it was recognised that temperature measurement on the purlins spanning between
portal frames could be potentially useful. However the purlins were very thin and hence it was difficult to weld on the thermocouples. It is relatively accurate to
assume that the purlin temperature is nearly equal to the gas temperature under these
circumstances.
64

Chapter 4: Fire Tests on a Scaled Portal Frame and Computer Modelling
4.1.2 Displacement Measurement
Three position sensors were acquired for the purpose of displacement measurement. The position sensor is an accurate electromechanical device which translates linear
motion into a proportional electrical signal that can be recorded by data logger. It
consists of a measuring cable which winds onto a machined calibrated cable drum.
The drum is mounted onto a shaft which is tensioned by a coil spring providing
constant pull-in force to maintain cable tension and control.
In operation, the free end of the measuring cable is attached to the measurement
point of the portal frame, where the sensor then converts the linear cable movement into a rotary motion as it winds on or off the cable drum. The motion is then
converted into an electrical output signal which can be calibrated and read as displacement measurement. The particular position sensor was manufactured by
ASM with a model number of WSIO-1000-IOV-LIO. The measurement range is Im
with a 0-10 V signal condition and linearity of ±0.1%.
With three position sensors available, it was decided to measure the horizontal
movements of the two eaves and the vertical movement of the apex. The devices
were fixed and secured on the reference frame and calibration of movements was done before every test.
4.1.3 The Loading System
As described in the previous chapter, it was necessary impose some extra vertical load onto the portal frame so that a representative loading level could be achieved.
For a normal industrial portal frame warehouse the extreme loading case likely to be
encountered during a real fire was estimated to be 0.2 of the failure load. In order to
represent this accurately, the most practical way was to impose three point loads, at
the apex and the two mid-points of the rafters respectively. This is relatively similar
to the representation of a uniformly distributed load.
The extra loading was achieved by hanging a barrel filled with water onto the portal
frame rafters at each loading point. The amount of water was controlled to the
intended load level. The barrels were covered by additional insulation during the fire
tests in order to prevent loss of water due to evaporation in the heated environment.
Figure 4.3 shows the set-up of the loaded frame. This same loading system was
65

Chapter 4: Fire Tests on a Scaled Portal Frame and Computer Modelling
adopted for all fire tests conducted and was proven to be a relatively efficient
solution for the purpose.
Figure 4.3 The Loading system for the portal frame
4.1.4 Base Connection
It was intended to create nominally pinned base connections for the test frame, but
also to represent a practical portal frame. The test frame was constructed with a base
plate welded onto the column and placed onto four bolts which were embedded into
a rectangular concrete footing. The concrete footing supports one side of all the
portal frame columns.
Rafters
i
==j
0 127x76xl3 UB
r-
200
0
0
Figure 4.4 Dimensions of base connection
66

Chapter 4: Fire Tests on a Scaled Portal Frame anti Computer Modelling
The base plate was 150mm x 200mm with a thickness of l2rnrn. The bolts are 12mm in diameter. Figure 4.4 shows the actual dimensions of the base plate. In
order to create a pinned effect, only the two outer bolts were fastened with nuts while
the inner bolts were released freely. This enabled the column to rotate outward
easily when the rafters expanded. It was not totally obvioi, s that this represented well
a pinned base, but a typical industrial portal frame would have a base with four bolts
and this would be regarded as a pinned base. It was intended to review the base
condition after the first test if any refinement was necessary.
Figure 4.5 Base connection
4.1.5 Lateral Support
Each frame constructed for the portal frame structure was cross braced with steel
strip. In addition, purlins were placed at spacing of 1.5m and Im on the rafters and
columns respectively to support the cladding profiles. The purlins were 120mm deep
by 50mm wide with thickness of approximately 1.5mm. Figure 4.6 shows the lateral
support system.
67

Chapter 4. - Fire Tests on a Scaled Portal Frame and Computer Modelling
Figure 4.6 Lateral support s3 stem
4.2 The First Experiment - Heating of the Whole Rafter
This test aimed to produce a fire extending across the whole rafter. The initial
thought was to have the temperature along the entire rafters increased evenly until
the portal frame failed. Hence a line fire was produced to achieve the intended
heating profile.
Due to the nature of the testing environment, which was situated within the HSL and
office compound, smoke releases were a concern and it was intended to keep the test
as short as possible. It was decided to use liquid heptane as the burning fuel, which
can produce a high level of heat with a relatively low level of smoke, and is
relatively easy to handle.
A separate support system was made to hold a long rectangular metal tray which was
used to contain the burning fuel. The independent framework was to ensure that its
self-weight was not added to the portal frame. The metal tray was raised about 1.5
metres above ground level. The intention was to concentrate heating on the rafters
with majority of the column lengths remaining relatively cool. The entire setup can be seen in Figure 4.3.
68

Chapter 4: Fire Tests on a Scaled Portal Frame and Computer Modelling
It can be seen from the same figure that the entire front gable sheeting had been
removed (as compared to Figure 4.1). This was to provide sufficient ventilation for
the burning fuel. A preliminary test had been conducted in the presence of a front
cladding with an opening of 1.5m by 1.5m. Due to the lack of ventilation, only part
of the liquid heptane ignited, but the majority evaporated and incinerated just outside
the opening where more oxygen was available. Consequently, high temperatures
within the portal frame compartment could not be achieved.
When sufficient ventilation was available, all the heptane fuel was ignited and burnt
underneath the rafters, and efficiently heated the section. Figure 4.7 shows the initial
stage of the fire. The smoke produced was solely due to burning of the plastic
coating on the cladding, which created a slight concern from the local occupants.
Figure 4.7 Early stage of the first test
However, the fire was more susceptible to the surrounding air movements with the
large opening. At a late stage in the test it was realised that there was some difficulty
in controlling the burning rate due to the ventilation condition. It was almost
impossible to heat up the rafter evenly as the fire and heat were drawn naturally to
the apex of the frame, and a small amount of wind could deflect the effect of the fire
so that the heating became asymmetric.
The fire lasted only for about 10 minutes, although 120 litres of heptane were used.
Some parts of the steel were heated to just over 900'C, and a certain extent of
deflection was observed and recorded. However, the frame did not collapse totally.
69

1000 ý
800 ý
600 ý
400 ý
200 ý
800
-Steel I
-Steel 2 Steel 3 Steel 4
-Steel 5
-Steel 6
- Steel 7
-Steel 8 Steel 9 Steel 10 Steel 11 Steel 12 Steel 13 Steel 14 Steel 15 Steel 16
-Gas 1 Gas 2 Gas 3
ISO Curve
Figure 4.8 Recorded temperatures during the first test
A1
0 200 400 Time (s)
600 0
Horiz Disp I
Vertical Disp 2
Horiz Disp 3
Chapter 4. - Fire Tests on a Scaled Portal Frame and Computer Modelling
4.2.1 Experimental Results
Figure 4.8 and 4.9 plot temperature and deflection against time respectively. The
positions of the thermocouples can be found in Figure 4.2. The Standard ISO 834
fire curve has been plotted in the temperature graph as a reference for the heating rate
during the test.
1200
11me (S)
Figure 4.9 Recorded displacements during the first test
From the temperature plots, the hottest part of the portal frame was the apex and the
temperature gradually reduced towards the two eaves (Steel 3 and Steel 14). Heating
was more intense across the fight rafter due to the air movement, which resulted in a
higher temperature at the right eaves. The column sections below the level of the
heating tray remained below 150'C, as recorded by steel 1,2,15 and 16. Cooling
70

Chapter 4: Fire Tests on a Scaled Portal Frame and Computer Modelling
started to take place as soon as the fuel finished burning, after approximately 600
seconds.
The temperature difference between the top and bottom flanges at the apex was
almost negligible, but a temperature gap of up to 55' was seen at the left eaves. The
top flange was hotter than the bottom flange at both locations. Figure 4.10 compares
the temperatures at these locations.
900
$00- 700-
600-
500- CL E
400-
0
300
200
100
Steel 4
-Steel 6
-- Steel 9 Steel 11
0 100 200 300 400 500 600 700 Soo 900 1000
Timo (s)
Figure 4.10 Temperature comparison between top and bottom flanges
From the displacement plot (Figure 4.9), the apex can be seen to deflect upwards
initially until 400 seconds, when it started to deflect downward. This agrees with the
preliminary studies conducted in Chapter 2, in which the apex was identified as
having an upward deflection due to the restraint by columns before a snap-through
took place.
It can be seen from the same graph that the left eaves (Disp 1) hardly moved during
the test but the fight eaves (Disp 3) had a more substantial outward movement due to
the expansion of rafters. This could be due to the fact that the fight-hand side of the
portal frame was heated more intensively during the test. There was some indication
the fight eaves was pulled in during the cooling stage after approximately 700
seconds.
4.2.2 Post-test Inspection
On inspecting the portal frame visually after the test, it was found that the whole of
each rafter had been deflected into an S-shape in the vertical plane. The mid-span
purlin point (which is also one of the three loaded positions) appeared to be the point
71

Chapter 4: Fire Tests on a Scaled Portal Frame and Computer Modelling
with zero curvature. The upward bowing of the half rafter near to the eaves may be
explained by the temperature difference between top and bottom flange recorded by
from the thermocouples. However, the extent of damage due to this phenomenon is
insignificant.
On the hotter half of the frame, the rafters had deformed laterally to a certain extent
with a slight rotation. This is due to the fact that the top flange was restrained by the
purlin, where as the bottom flange was free to deform.
These were the only significant deformations observed and the rafters as a whole had
not failed in a collapse mode. The purlins were believed to have given a substantial
level of horizontal restraint to the rafter. Figure 4.11 shows the shapes of the
deformed rafters.
Figure 4.11 The Rafter deformations after the first test
4.2.3 Computer Analysis
The first fire test was modelled with the finite element program VULCAN. Due to
the nature of the test, in which only one portal frame was heated and the others
remained relatively cool, a two dimensional analysis should be sufficient at this stage
for the purpose of comparison. The cross bracing between columns should provide
72

Chapter 4: Fire Tests on a Scaled Portal Frame and Computer Motielling
significant lateral restraint. especially since most of the columns stayed cool below
the burning tray.
The temperature profile for the model was input as obtained from the thermocouples;
this was considered sufficient to represent the overall test situation accurately.
However, one of the major uncertainties for the modelling was to predict the
rotational stiffnesses of the base connection. It is believed that significant stiffness
exists at the base. although the connections had been made as simple as possible. It
was found during the analysis that the base rotational stiffness affects the amount of deflection significantly.
Two analyses were therefore conducted. one with a pinned-base assumption and the
other with a semi-rigid connection of 2 kNnVmrad. This figure is considered to be a
reasonable finite value between the imaginary fixed and pinned assumptions used by
the program. from the previous investigation into the base stiffness.
The results in terms of displacement from the VULCAN analysis were plotted
against temperature and compared against the expenmental figures. The reference
temperature was taken as the highest temperature in the steel. and the comparison
was made at the apex and the two eaves. Figure 4.12,4.13 and 4.14 show the
comparison at left eaves. right eaves and apex respectively.
40
30
20-
0-
20 40 60 so 100 120
, 10.
10.
-30-
-40- Tempenftre (*C)
Figure 4.12 Horizontal displacenwnts at left eaves
Test results i
Pinnod base
Semi-rigid bass
73

Chapter 4: Fire Tests on a Scaled Portal Frame and Computer Modelling
140-
120-
100. '9
Go.
40-
20-
Test results
- Pinned base
Semi-rigid base
0- 0 200 400 ew ew 1000 12w
TomMeture (*C)
Figure 4.13 Horizontal displacements at right eaves
40 -
20 4
0
-20
-40 0
-60 1
-80 -
-100 - Temperature (*C)
Figure 4.14 Vertical displacements at apex It can be seen from the comparisons that the serni-rigid base analysis follows more
closely the experimental results. especially at the apex and in terms of the
temperature at which downward displacement started to take place. The difference
between the pinned-base and semi-rigid-base portal frame behaviour can be seen
quite clearly.
Although the cooling effect has not been modelled using VULCAN. it can be seen from the experimental curves that permanent strains within the test frame were
apparently present. The frame could be near to the failure stage if it had been heated
further.
74

Chapter 4: Fire Tests on a Scaled Portal Frame and Computer Modelling
Using the analytical results from VULCAN, the internal forces throughout the frame
could be obtained. With the moment and compression force within the rafter section,
a minor-axis buckling calculation can be done. The simple calculation is to
investigate the apparent lateral bending or buckling seen on the rafters after the test
(Figure 4.11).
From the calculations it was shown that minor-axis buckling could take place when
the steel temperature exceeded 720'C. However, the calculation is based on the
assumption that the supports of the rafters do not move during the test, while small
amount of horizontal deflection was recorded. It can be concluded that minor-axis buckling of rafters can take place, but that it did not adversely affect the overall behaviour of the portal frame in fire.
4.3 The Second Experiment - Edge Fire Test
As planned according to the testing schedule, a second test was to be conducted soon
after the first test. Since collapse did not take place in the previous test, it was
considered unnecessary to rebuild the structure for subsequent testing. The adjacent
internal bay of the portal frame structure, which had not sustained any deformation
during the first test, was used for this second fire test.
This test was intended to heat just one edge of the portal frame, simulating the effect
of a local fire in a warehouse. It was also thought useful to investigate the
temperature distribution along the columns as the fire grows.
Since the previous fire test had only lasted for about 10 minutes, it was considered
appropriate to arrange a longer-lasting fire so that the steel in the fire zone could stay
at the maximum temperature for a longer period of time. It was again intended to
create a collapse mechanism in this test, and preliminary studies indicated that the
steel temperature would have to reach over 1000*C if a collapsing portal frame was
to be seen.
It was therefore decided to use timber cribs as the fuel, replacing the burning tray and
heptane. The timber cribs were stacked in aI xI x 2m shape, placed underneath the
rafters of the test frame at the left-hand edge. The cribs were estimated to have a
burning-time of more than an hour.
75

Chapter 4. - Fire Tests on a Scaled Portal Frame and Computer Modelling
The front of the structure was again left open again for ventilation purposes. The
testing conditions and all measurement devices were similar to the first test. All the
measuring devices, including the reference frame outside the portal frame, were
moved to the location of the new test frame.
Figure 4.15 shows the tesi. It can be seen that flame front extended almost to the
apex of the structure, with the entire left-hand column engulfed in fire.
'M -, 1, jr
Figure 4.1-5 The second fire test: Early stages
The entire test lasted for well over 40 minutes before the fire was manually
extinguished. The compartment temperature achieved a state of equilibrium after
approximately 10 minutes, when the heat input balanced the loss of heat to the
surroundings. This equilibrium state prevented a further increase in temperature.
The hottest part of the steel achieved a similar temperature to the fire atmosphere and
stayed unchanged for approximately 30 minutes. Most of the rafter achieved an
equilibrium temperature which continued for at least 30 minutes.
The maximum steel temperature recorded was about 800'C. With this temperature, it
was not surprising to see no collapse mechanism of the portal frame during the test.
Beside this, there was no significant asymmetric movement or deformation observed
throughout the test, although one half of the frame was much hotter than the other. A
decision was made to terminate the test after the fire had burned for 40 minutes.
76

Chapter 4. - Fire Tests on a Scaled Portal Frame and Computer Modelling
4.3.1 Experimental Results
Figure 4.16 plots the steel and gas temperatures recorded during the fire test, along
with the Standard ISO 834 fire curve. The gas temperature of the hottest part
matches the ISO curve well, by pure coincidence.
-Stool I
-Stool 2 Sl**13 S1091,11
-Stool 5
-Stool 6 Stool 7
-Stool 8 Stool 9 Stool 10 Stool II Stool 12 Stool 13 Stool 14 Stool 15 Stool 16
-Gas 1 Gas 2 Gas 3 ISO Curve
0 500 1000 2000 2500 3000 3500 4000 Time (s)
1500
Figure 4.16 Temperatures recorded throughout the second fire test
While comparing the gas temperatures at the three different positions, it was found
that the apex within the compartment was the hottest part, with a maximum
temperature of 870'C. This effect was first encountered during the indicative test
where the steel sheeting collected the hot gas and channelled it to the higher part of
the structure, rather than the eaves. The unheated eaves remained relatively cool,
with a maximum temperature just below 320'C.
Comparing the top and bottom flange temperatures at apex and eaves, the difference
between them was almost negligible. This is because the rate of heating is relatively
slow with the burning cribs, compared to the rapid ignition of the heptane used in the
previous test. The longer-lasting test also enabled the temperature to be distributed
more evenly to the entire section rather than just heated locally.
The temperature distribution along the column near the fire was rational. The mid-
section temperature was very similar to that at the top of the column; the bottom of
the column heated more slowly but eventually caught up with the top part. As for the
cooler half of the frame, temperatures reduced as the distance from fire increased,
with the bottom of the column temperature remaining close to ambient temperature.
77

Chapter 4: Fire Tests on a Scaled Portal Frame and Computer Modelling
Figure 4.17 shows the displacements measured during the fire test. Since only one
side of the portal was heated vigorously, the vertical displacement was predictably
smaller compared to the first test. The vertical displacement at the apex was
approximately 80mm, and the heated eaves (Disp 3) sustained a larger horizontal
deflection than the cooler eaves. The cooler eaves sustained negligible movement
throughout the test.
so
0
Horizontal Disp 1 Vertical Disp 2 Horizontal DisR3 so
40
20
0
-20
-40
-60 Time (s)
Figure 4.17 Recorded displacements for the second fire test
4.3.2 Post-test Inspection
Although this fire lasted longer than the first test, the temperatures were not as
severe. Due to the asymmetric heating of the frame there was a slight swaying to the
left, which could not be detected visually.
Apart from this, the local deformations observed were very similar to those in the
first test, where the most apparent visual deformation was lateral bending over the
hottest part of the rafters, buckling between purlin points. This could be anticipated
since the previous calculation on combined bending and compression had indicated
that minor-axis buckling could take place at temperature in excess of 750T. Again,
an S-shape deformation in the vertical plane could be seen on the rafters. Figure 4.18
shows the lateral deformation of the rafters.
it is interesting to see that even when the majority of the column was heated to
approximately 700'C, there was no visible local or overall deformation of the
column. Its post-test condition was almost intact apart from some char marks.
78

Chapter 4: Fire Tests on a Scaled Portal Frame and Computer Modelling
Similarly, the cladding and purlins did not sustain any significant damage, in the
sense that they stayed intact on the roof and the side faqade throughout the test.
Minor twisting and bending were seen on the purlins. However, the cladding and
purlins were relatively lightly loaded compared to their normal state when used in a
real portal frame warehouse.
f
Figure 4.18 Lateral deformation of rafter from the second fire test
The detail of the deformed shape and the amount of displacement sustained was
recorded by measuring after the frame had cooled down.
4.3.3 Computer Analysis
The test was again modelled with VULCAN, applying the same assumptions as in
the previous modelling. The temperatures recorded from the testing were fed into
the input file as closely as possible. The same frame was modelled with pinned base
and semi-figid base connections.
79

Chapter 4: Fire Tests on a Scaled Portal Frame and Computer Modelling
The vertical displacements at the apex and the horizontal displacements at the two
eaves were extracted from the analytical output. These were then plotted on the
same graph together with the experimental data, so that the comparison could be
seen. Figure 4.19,4.20 and 4.21 show the plots, in which the displacements have
been plotted against the highest temperatures in the steel so that a more
comprehensive comparison can be made.
0
-20
-40
-f -60
E -so
E-loo
. 2-120 CL
MA 0-140
-160
-180
Test Data -Pinned Base -Semi-rigid Base
Temperature (OC) Figure 4.19 Horizontal displacement at left eaves
TGMPMM" (OP
Figure 4.20 Horizontal displacement at right eaves
80

Chapter 4: Fire Tests on a Scaled Portal Frame and Computer Modelling
40
20
Test Data
- pin semi-rigid
1
Temperature (oC)
Figure 4.21 Vertical displacement at apex From the displacement plots, once again it was found the analysis with semi-figid base connections compares better with the experimental results. The vertical displacement at the apex in particular closely follows the test data. Since the portal
frame was modelled two-dimensionally, the effects of other lateral elements such as
purlins and cladding were ignored in the analysis.
Both the purlins and cladding are relatively flexible in the vertical direction, and
therefore would not contribute much in resisting vertical deflection of the portal
frame. However, the horizontal interaction provided by the cladding and purlins
could be more significant in preventing the free horizontal expansion of rafters. The
combination of purlins, cladding and cross bracing is rather complicated and
virtually impossible to model. This may explain why VULCAN predicted the
vertical displacements more accurately in both tests.
overall, the comparison is satisfying, and the capability of VULCAN is further
validated.
4.4 The Third Test - Overall Rafter Heated
It was rather disappointing not to have a structural collapse in the previous two tests.
It was planned to have the following test reproducing the heating scenario of the first
one, (i. e. overall rafters heated). Several refinements were made to the test frame to
81

Chapter 4: Fire Tests on a Scaled Portal Frame and Computer Modelling
investigate some parameters influencing the portal frame behaviour; namely the base
rotational stiffness and minor axis bending of rafters observed in the previous tests.
It was also more important to achieve a collapse mechanism in the fire test.
4.4.1 Alteration to the Testing System
The main reasons for not achieving a collapse mechanism previously were
considered to be insufficient heating of the steel and underestimation of the effect of
base rotational stiffness.
in order to achieve a higher temperature for the steel, it was decided to put some insulation on the roof of the structure. A high temperature could then be maintained
over a longer period to enable the entire rafter section to be heated evenly. The
majority of the length of the rafters would have to reach an average of 900"C to have
a more significant failure.
The use of liquid heptane as fuel is efficient in heating, and a controllable fuel supply
system was devised as shown in Figure 4.22. The liquid heptane reached the
burning tray at a rate controlled by its natural pressure difference through the
connecting pipe, and a valve was fitted onto the pipe so that more fuel could be
provided during the fire if necessary. This was to ensure a continuous combustion
until collapse of the frame occurred. The burning tray was slightly tilted so that the
heptane could reach the end remote from the feeding point.
Supply of Heptane
Pressure difference
I (
Figure 4.22 Fuel supplying system On the portal frame itself, the two internal frames were rebuilt after the first two
tests. An attempt was made to achieve pinned base conditions to the greatest extent
possible for the test frame. This was intended to eliminate the uncertainty from the
VULCAN analysis.
82

Chapter 4: Fire Tests on a Scaled Portal Frame and Computer Modelling
To enable free rotation at the base, a bar of approximately 6mm diameter was placed
underneath the base plate of the column. All the nuts were loosened so that the base
plate could rotate freely. Figure 4.23 shows the details.
oo rrrrrZ 3
0 r--j 10 7ýý -4
-, - - --- -, "ýff I Ir
-
Elevation Plan Figure 4.23 Base connection details
To counteract the lateral buckling found in the exposed rafter zone between purlins,
it was decided to weld one steel strip between frames mid-way between adjacent
purlin points, parallel to the purlins. The steel strip was attached to the top flanges of
the rafters by welding, and reduced the effective buckling length of the rafter about
its minor axis. However, having artificially created a pinned base for the columns,
the axial thrust within the rafters was expected to be lower due to the reduced
restraint at the column tops.
4.4.2 The Test
With the testing experience gained from the previous two fire tests, the setting-up of
this test went relatively smoothly. A video camera was used to record the entire
experiment. The fire was ignited with a shallow depth of heptane in the burning tray.
The entire burning tray was soon ignited, heating the full length of the rafters.
Supply of heptane was required occasionally.
Shortly after 5 minutes into the test, the apex was seen to be starting to deflect
downward. Without much warning a little later, the apex underwent a vertical dive
and the entire rafters were seen to collapse rapidly. This was the snap-through
failure always predicted by VULCAN analysis. The alterations proposed for this test
had proven to be significant in creating a collapse mechanism. Figure 4.24 shows a
picture taken shortly after the snap-through failure, where the name was still fiercely
heating the steel.
-'I
83

Chapter 4. - Fire Tests on a Scaled Portal Frame and Computer Modelling
Figure 4.24 Snap-through failure during the third fire test
4.4.3 Experimental Results
Figure 4.25 plots the temperatures recorded by the thermocouples during the test.
The results can be compared against the ISO 834 fire temperature, although the fire
only lasted for approximately 500 seconds. In fact, the displacement plot shown in
Figure 4.27 indicates that the snap-through took place at approximately 280 seconds
after ignition. Average gas temperature stayed at around 900'C.
With such a short-lived but intense fire, the column section below the fire was not
exposed to much radiation and remained near to ambient temperature throughout the
test. The steel above the burning tray was totally engulfed in flame once the fire was ignited. This was shown from the gas temperature curves, which fall in the same
temperature region across the whole portal frame for the duration of the test.
84

Chapter 4: Fire Tests on a Scaled Portal Frame and Computer Modelling
-Steel I Steel 2 Steel 3 Steel 4
-Steel 5
-Steel 6
- Steel 7 -Steel 8
Steel 9 Steel 10 Steel 11 Steel 12 Steel 13 Steel 14 Steel 15 Steel 16
-Gas 1 Gas 2 Gas 3
0 100 200 300
Time (s)
400 500 600 ISO Curve
Figure 4.25 Recorded temperatures from the third test
With this intense heating, steel temperatures along the rafters were relatively even.
The eaves area appeared to be heating slightly behind the mid-section of the rafters,
since the eaves were less exposed to the fire. The temperature difference between
the top and bottom flanges was not significant as a result of the totally engulfing fire.
Maximum steel temperature reached just below 1040'C at thermocouple S 12, which
is just right to the apex. It was later found from the inspection after test that a plastic
(fire) hinge had formed in this region.
From the plot of displacements shown in Figure 4.26, the apex did not deflect until
300 seconds into the test, when it started to deflect downward quickly and eventually
dived vertically. Both eaves were initially deflected outward due to the steel
expansion until the snap-through took place, after which they were both pulled
inward (the reversal of displacement shown in the curves) by the rafters in catenary
action.
85

Chapter 4: Fire Tests on a Scaled Portal Frame and Computer Modelling
Such catenary actions induced in the rafters are well recognised. In fact, the SCI
publication written by Newman9 has called for a larger foundation to be designed for
portal frames with sensitive boundary conditions. Portal frame columns in these
cases are required to remain stable so that they can continue to support the fire-
resisting faqade. This publication is widely recognised by Building Control and has
become a design requirement.
400
3001
200
1001
100 200
Horizontal Disp 1 (Left Eaves)
-Vertical Disp 2 (Apex)
Horizontal Disp 3 (Right Eaves)
3O-eo--- 7
-1001
-200 Time (s)
Figure 4.26 Recorded displacements from the third test
if the horizontal displacement graph is investigated more closely, it can be seen that
the right-hand eaves (Disp 3) has been pulled in by a bigger margin than the left
eaves (Disp 1). In fact, the reversal effect on the left eaves is much gentler compared
to the sharp effect at the right eaves. This indicates that the failure of the portal
frame was not induced by a "beam mechanism", but was more likely a "combined
mechanism". (Obviously the sway mechanism has been ruled out, given the loading
details. )
A detailed study on failure modes of portal frames in fire has been conducted, and
parametric studies are presented in Chapter 5.
0
86

Chapter 4: Fire Tests on a Scaled Portal Frame and Computer Modelling
4.4.4 Post-test Inspection
An inspection of the collapsed frame was carried out after the steel had cooled down.
A collapse mechanism had been produced in which the rafters had deflected
considerably. In fact, the rafters only stopped deflecting when the water-filled barrel
touched ground and relieved the vertical load on the rafters. The formation of plastic
hinges on the rafters could be clearly seen. Two hinges were seen to be located near
to the eaves, one at each side. An additional hinge could be seen to be forming just to
the left of the loading point on the left-hand rafter of the portal frame.
Figure 4.27 Collapse of the portal frame (top) and fire hinges formed during the test (bottom)
if the temperatures were uniform along the rafters, bending moments could create
four plastic hinges in the snap through situation (two near to the apex and two near to
the eaves). However, three hinges is sufficient to induce a snap-through failure in
combined mechanism. The form of failure mechanism will be investigated at a later
stage in these studies.
87

Chapter 4: Fire Tests on a Scaled Portal Frame and Computer Modelling
Figure 4.27 shows the collapsed shape of the portal frame It can be seen from this figure that the steel rafter section has rotated by approximately 90' about its axis,
starting a short distance from the right-hand eaves (at the position of the third plastic hinge formed). The section at this position had detached from the purlins and steel
strips which normally provided the restraint against rotation. Such phenomena could happen to industrial portal frames in fire. The purlin section used for the test frame
is relatively large compared to the rafter section, and the restraint provided by purlins in a normal portal frame structure will be less compared to the test situation. The
rafters will be subject to minor axis bending as soon as this rotation takes place, and become more vulnerable at elevated temperatures.
On the other half of the portal frame the purlin was still attached to the rafters and
this rotation did not take place. It is believed that the purlins could help substantially in providing restraint, although they were seen to have deformed rather badly.
Despite the massive deformation sustained by the rafters of the portal frame the
columns had remained relatively undamaged. Due to the low level of restraint from
the column bases, these bases effectively only resist horizontal force, without
resisting bending. It was shown from the thermocouples that the steel of the columns
remains almost unheated throughout the transient testing period.
While inspecting the roof cladding, it was found that this was not ripped through
during the test, but actually managed to maintain its integrity throughout the test. There was no observation of fire penetration of the roof cladding, even when the
portal frame had collapsed. This may be of interest if further research is to be done
on the behaviour of steel cladding in fire.
The vertical cladding on the side fagade did not sustain any damage. Similarly, the
cross bracing did not appeared to have deformed.
Overall, the failure of the portal frame was primarily due to the collapse of the
rafters. Higher temperatures and less stiffness at the base connection were the major
causes for the differences seen between this test and the first one.
88

Chapter 4: Fire Tests on a Scaled Portal Frame and Computer Modelling
4.4.5 Computer Analysis
VULCAN analysis was again brought into use for modelling of the third test. There
was little uncertainty regarding the base rotational stiffness for the test frame as it
must be very close to a pinned base due to the special arrangements made.
When a two-dimensional analysis was conducted, it was found that the computer
program predicted an earlier failure than happened in the test. The remaining factor
which was not modelled was the existence of secondary members, in particular the
Z-purlins which had a section depth of 120mm. Although the thickness of the
purlins was onlyl. 5mm, they can contribute to the vertical stiffness of the rafters.
A three-dimensional model was set up with purlins simply supported between the
adjacent portal frames and attached to the test frame. Figure 4.28 shows the set-up of
the model. The purlins were modelled with only two elements each since their
detailed behaviour was not the major concern.
Figure 4.28 Three-dimensional VULCAN model on the third test
The results from the computer analyses were plotted against temperature together
with the experimental results. Figure 4.29,4.30 and 4.31 show the comparisons; the
reference temperature is that of the hottest part of the steel. It can be seen from the
graphs that three-dimensional analysis, including the purlins, predicted the failure
temperature more accurately than the two-dimensional modelling. This again
demonstrates that the purlins were beneficial in resisting fire collapse of the tested
portal frame structures.
Figure 4.32 shows the predicted shape of the test frame just before failure, using an
enlarged vertical displacement scale
89

Chapter 4: Fire Tests on a Scaled Portal Frame and Computer Modelling
Apparently the VULCAN analysis was terminated once the snap-through failure took
place, and hence large-displacement movement after failure could not be followed.
However, the deflection shown is indeed very similar to the deformation of the portal
frame in the test, with the plastic hinge locations matching up with the deformed
shape seen in Figure 4.27.
The horizontal displacement predicted by VULCAN was marginally greater than the
experimental results. The rationalisation of this may be that the cross bracing and
sheeting rails (Z-purlins) attached to the columns were providing additional
horizontal restraint which has not been modelled to the column movement.
Furthermore, these secondary elements were attached to the adjacent frames which
remained relatively cool during the test.
Given the minor uncertainty about the effect of the secondary elements, the
VULCAN prediction was considered satisfactory in analysing this structural system.
50
E E
50
E 4)
-100 24 a
-150
-200
-2-Dimensinal analysis
3-Dimensional Analysis with Purlins
-Experimental Results
Temperature ('C)
Figure 4.29 Vertical displacement at apex
90

Chapter 4: Fire Tests on a Scaled Portal Frame and Computer Modelling
0
30
20
10
0 E E -10
-20- E 30
CL 40-
-50
-60
-701
-M A
200 400 600 Temperature ('C)
800
Figure 4.30 Horizontal displacement at right eaves
-Experimental Results
-2-Dimensional Analysis
3-Dimensional Analysis with Purlins
Temperature (OC)
Figure 4.31 Horizontal displacement at left eaves
1000 1200
1000 0
91

Chapter 4: Fire Tests on a Scaled Portal Frame and Computer Modelling
Figure 4.32 Deflected shape predicted by VULCAN (3-dimensional view)
4.5 Further Discussion
One of the issues highlighted by the three fire tests conducted at Buxton is the effect
of the secondary elements in fire. These may be insignificant and negligible in the
context of ambient-temperature behaviour, but their influence is certainly greater at
elevated temperature.
However, this observation may be over-optimistic given that there are two major
differences in these secondary elements in the test compared with full-scale
structures::
1. The sizes of the secondary elements were relatively large compared to the rafters
size in the test frame.
2. The immediately adjacent portal frames remained relatively cool in the test,
which provided the necessary supports to the purlins, both vertically and horizontally.
Because of the very local heating, unless there is a total bum-out of the entire portal
frame structure, there will always be some cooler portal frames which can provide
extra strength to the hotter ones. A total flashover within a large compartment is
however rarely seen, statistic figures and discussions 12,54.55,56 are available for further
investigation.
92

Chapter 4: Fire Tests on a Scaled Portal Frame and Computer Modelling
There are new recommendations in the latest edition of Approved Document B57
calling for restrictions on compartment size in retail warehouses. The maximum 2
compartment size allowed without providing sprinklers has been reduced to 2000m
In these tests, the effect of unheated portal frames adjacent to the fire compartment
could significantly add stability to the heated frames.
4.6 Conclusion
Three comprehensive fire tests were conducted on the scaled portal frame structure at Buxton. The results and observations have been presented, along with a comparison
against displacements given by the VULCAN finite element model. The analytical
results are close to the experimental data taken from the tests, which provides
confidence in using VULCAN to analyse portal frames. Parametric studies were
therefore planned to investigate further their behaviour at elevated temperatures
using VULCAN.
The results and post-test investigations have been described and their significance
has been discussed, including the effect of base rotational stiffness, the lateral
buckling of rafters, rotation of rafters and the effect of the secondary elements.
Having seen no collapse mechanism in the first two tests, significant alterations were
made to the set-up of the third test, which led to a total collapse of the test frame.
The third test was the most significant, yielding some valuable information.
The failure mode of the portal frame in the third test was examined, and the evidence
suggested that a combined mechanism had formed, leading to failure. Further
investigation will be conducted within the parametric studies.
In general the tests were successful, with no major faults encountered, despite the
complication of recording data, setting up the correct loading and creating the
intended fire scenarios.
93

Chapter 5: Parametric Studies I -Two Dimensional Analysis
5 Parametric Studies 1 -Two Dimensional Analysis
Much of the work illustrated in the previous chapters has demonstrated that the finite
element model VULCAN can be used to predict the behaviour of steel portal frames
in fire with reasonable accuracy. Further understanding of portal frame behaviour
can be gained by investigating various factors that affect the failure in a fire. Such
investigations can be conducted by using VULCAN to analyse series of portal frames,
changing the desired factor only in each study so that the resulting effect can be
clearly detected and discussed. Such analyses are known as parametric studies.
The major benefit of parametric studies is to avoid conducting large numbers of
experiments which can be difficult to control and highly expensive. More detailed
studies can also be done by concentrating on just one area at a time. The studies will
concentrate on pitched-roof portal frames, as these are the most common form of
modem construction for single storey warehouses.
In order to simplify the studies and minimise the computer run time, two-dimensional
portal frames are initially defined and analysed, investigating the effect of load ratio,
span and height of the portal frames, heating profiles in real fires, horizontal wind forces, base-rigidity and the angle of the pitched roof Out-of-plane failure and the interaction between adjacent portal frames are not considered. The frame is allowed
to deflect out of its plane but no external out-of-plane forces (transverse load) are included in the analyses. The pinned column bases, where applicable, are only
allowed to rotate in-plane.
The failure point of the portal frame is defined as the point where an uncontrollably large displacement occurs in a relatively small temperature increment, causing a snap-
through of the rafters. The analyses do not continue to model the post-snap-through
phase, even if stability is regained later by other means.
The results and discussions are presented in this chapter. They are then related to
another series of parametric studies presented in Chapter 6, where three-dimensional
portal frames are analysed.
94

Chapter 5: Parametric Studies I -Two Dimensional Analysis
5.1 The Effect of Load Ratio
The effect of vertical load on the behaviour of plane portal frames in fire is
investigated in this section. The vertical load is applied as a uniformly distributed
load on the roof, defined using a load ratio -the ratio of applied load to the ultimate load capacity of the portal frame. A typical pitched roof portal frame, which spans 30m with column height of 7m is defined and is then designed to resist typical loading. The height of the apex is Ilm, which results a rafter inclination of 14.91.
Haunches have not been included in the design since they do not influence the overall behaviour of the portal frame (plastic hinges will form at the ends of the haunches
instead of the nearest point to the eaves).
Plastic analysis and design are used to determine the section sizes of the rafters and
columns, and pinned bases are assumed during the analysis. Figure 5.1 summarises
the layout of the portal frame used for the parametric studies.
Uniform Distributed Load n1yYYYYYYYY-[YYY-Yy-YYY-
-4. 40.00 14.9*
Rafter Size 457xl9lx89 UB
70'00
Column Size 533x2lOx92 UB
-30000 H Figure 5.1 Parametric Studies - Load Ratios
Once the geometry of the problem had been set up within VULCAN, different levels
of vertical loading were then applied to the rafter, varying the load ratio from 0.1 to
0.8. A very small horizontal force was used to avoid the possibility of bifurcation
buckling.
95

Chapter 5., Parametric Studies I -Two Dimensional Analysis
In order to investigate the effect of load ratio, the fire scenario remains identical in
each analysis. The chosen fire scenario, based on the most common cases, included
the whole rafter being heated uniformly but the column remaining cold. This simply
represents a fire within a large warehouse where the pitched roof provides a heat and
smoke reservoir, and hence increases in temperature, whereas the columns remain
relatively cold below the smoke zone.
When the portal frame warehouse is close to a boundary, and the boundary distance
does not provide sufficient separation from adjacent buildings, the cladding is
required to have a minimum of 60 minutes' fire resistance. This results in a
requirement for the columns which support the cladding to have adequate fire
resistance. Therefore the column temperatures will be relatively low compared to
those of the rafters.
The results from this study are plotted in Figure 5.2, in terms of the vertical
displacement at the apex. The apex initially deflects upwards due to the thermal
expansion of the rafter and the restraint to this expansion from the columns; when the
steel properties begin to reduce significantly as temperature increases, the rafters
become softer until the point where snap-through takes place, which has been defined
failure as by VULCAN. The failure temperature for a load ratio of 0.1 is about
8001C. This reduces steadily as the load level is increased, reaching 4000C at a load
ratio of 0.8.
The spread of the eaves, which is defined as the difference between the horizontal
displacements of the eaves, is plotted against temperature in Figure 5.3 for each load
case.
The plot of eaves spread indicates that the two eaves connection continuously deflect
further away from each other due to thermal expansion and rafter rotation, and
demonstrate a rotational failure of the frame (as described in the previous chapters) as
soon as the snap-through of the rafters takes place. The spread of eaves will remain
more or less constant if a sway failure occurs, in which both eaves move in the same
direction with about the same magnitude. The frames do not experience sway failure
at any load level in these analyses, even though pinned bases are assumed. The
significance of the base conditions will be explored in later sections.
96

Chapter 5: Parametric Studies I -Two Dimensional Anal. vsis
Temperature
0 100 800 900
Figure 5.2 Vertical Displacement at Apex
200 300 400 500 600
Temperature (OC) 700
Figure 5.3 Spread of Eaves
97

Chapter 5: Parametric Studies I -Two Dimensional Analysis
From the analysis, it is obvious that load ratio has a considerable impact on the failure
temperatures of portal frames; in this case there is approximately 400'C difference
between the highest and lowest failure temperature. However, as the portal frames
are usually designed to resist a combination of factored dead load, imposed snow load
and wind load, the higher load ratios can be discounted during a fire. Fire limit state design from BS 5950 Part 8 13 allows snow load to be discounted completely, wind load to be discounted completely if the column height is less than 8m, or a factor of 0.33 to be applied to it otherwise. Although the imposed load may be accounted for
in the ambient temperature design, it is likely that majority of such loads will not exist
at high temperatures.
Therefore, the range of practical load ratios in fire for a portal frame does not vary from 0.1 to 0.8, but falls in the region between 0.05 and 0.25. In this series of
parametric studies, the failure temperatures lie between 640'C and 8001C.
5.2 The Effect of Span and Column Height
The load ratio is found to have a significant influence on failure temperature from the
previous analyses on a single portal frame. Different geometries of frames are investigated in this section, looking at the influence of geometry on failure
temperatures.
A series of portal frames with various spans and column heights were designed using
plastic analysis and design. The other parameters of the portal frames, such as the heating profile and boundary conditions were kept constant in the analyses.
The first series of portal frames comprises 10 frames with a constant column height of 7m with overall spans of 15m, 20m, 25m, 30m, 35m, 40m, 50m, 60m, 70m and 80m.
They are designed to resist normal loading, i. e. a vertical factored load of 10.14 kN/m
on the rafter. A load ratio in fire of 0.2 was used for this series of analyses. Table 5.1
summarises the details of these frames.
The vertical displacements at the apex of each frame are plotted in Figure 5.4. Snap-
through failure is clearly detected, especially for the larger span portal frames. The
failure temperature of each frame lies close to 7001C, which indicates that the load
ratio of 0.2 dominates the failure temperatures. A larger variety of frame geometries is required to investigate this further.
98

Chapter 5: Parametric Studies I -Two Dimensional Anal. vsis
Span (M)
Column Section (Grade 43)
Rafter Section (Grade 43)
Roof Inclination
0.2 Load Ratio
(kN/m) 60 914x3O5x2Ol UB 914x3O5x2Ol UB 7.59' 2.51
50 838x292xl76 UB 762x267xl73 UB 9.090 2.67
40 6lOx3O5xl49 UB 6lOx229xl25 UB 11.31' 2.47
35 6lOx229xll3 UB 533x2lOxlO9 UB 12.88" 2.48
30 533x2lOx92 UB 457x 19 1 x89 UB 14.93' 2.42
25 457xl52x6O UB 457xl52x6O UB 17.74' 2.29
20 457xl52x52 UB 406xl4Ox46 UB 11.3 1 2.2) 3
15 305xlO2x33 UB 305xlO2x33 UB 14.93' 2.16
Table 5.1 Portal Frames with Fixed Column Height of 7m
Temp ('C)
Figure 5.4 Vertical Displacement at Apex - Variable Span
The next series of portal frames was designed to have a constant span of 30m but with
the column heights varying from 3m to 15m at one-metre intervals. A summary of
the frames is shown in Table 5.2.
99

Chapter 5: Parametric Studies I -Two Dimensional Anal. vsis
Height (M)
Column Section (Grade 43)
Rafter Section (Grade 43)
Roof Inclination
0.2 Load Ratio
(Min) 3 457x 19 1 x74 UB 457x 19 1 x74 UB 14.91 2.60
4 457x 19 1 x82 UB 457x 19 1 x82 UB 14.9' 2.6 0
5 457xl9lx82 UB 457x 19 1 x82 UB 14.9' 2.46
6 533x2 I Ox82 UB 533x2lOx82 UB 14.9' 2.61
8 533x2 I Ox82 UB 533x2lOx82 UB 14.90 2.49
9 533x2 I Ox82 UB 533x2 I Ox82 UB 14.9' 2.4 4
10 10 533x2 I Ox82 UB 533x2 I Ox82 UB 14.90 2.40
11
E
111 533x2 I Ox82 UB 533X21 OX82 UB 14.9' 2.38
12 533x2lOx82 UB 533X21OX82 UB 14.9' 2.34
13 533x2lOx82 UB 533x2lOx82 UB 14.9' 2.32
14 533x2lOx82 UB 533X2 I OX82 UB 14.9' 2.31
15 533x2lOx82 UB 533x2 I Ox82 UB 14.9' 2.29
Table 5.2 Portal Frames with Fixed Span of 30m
-3m 4m 5m
-6m g 7m
-8m -9m -lom --llm
12m 13M 14m 15m
Temp ("C)
Figure 5.5 Vertical Displacement of Apex - Variable Column Heights
100

Chapter 5: Parametric Studies I -Two Dimensional Anal. vsis
Figure 5.5 plots the results from the analyses, in terms of the vertical displacements at
the apex. Combining the results from the previous series of analyses, it is
demonstrated that the upward movement of the apex (before snap-through takes
place) is larger for the frames with higher span/height ratio. However, all the frames
fail at approximately 700'C, even though the span/height ratio varies frorn 2 to 12.
The failure mechanism is similar in all the frames, comprising a rotational movement
as described earlier.
Parametric Studies - Span and Column Height
Load Ratio = 0.2
Load Ratio = 0.4
Load Ratio = 0.5
Load Ratio = 0.7
4 No Combination of Analyses Conducted
Series I Constant Height of 7m
Span 15m - 80m
Series 2 Constant Span of 30m
Height 3m - 15m
Series 3 Constant Height of 4m
Span 12m - 36m
Series 4
Constant Span of 50m Height 6m - 16m
Figure 5.6 Parametric studies on Span and Column Height of Portal Frames
101

Chapter 5: Parametric Studies I -Two Dimensional Anat. vsis
I
For the third sefies of portal frames the column height was made constant at 4m and
the span was varied from 12m to 36m in 4m intervals. This was followed by a fourth
series of frames with constant span of 30m and column heights ranging from 6m to
16m in 2m intervals. Both series were again analysed at a load ratio of 0.2.
Similar findings to the earlier analyses were obtained from the third and fourth series
of parametric studies. The conclusion can almost be drawn that a portal frame with load ratio of 0.2 will have a critical temperature of approximately 700'C provided that
the rafter is heated and bases are pinned.
The whole set of analyses was repeated using different levels of loading. Figure 5.6
summarises the failure temperatures from these studies.
A total of 136 portal frame analyses were conducted within this investigation and all
showed the same failure mechanism. The failure temperature from each analysis is
plotted in Figure 5.7, against the span-to-height ratio of the portal frame.
750
c '5- 7(X) ý
650
6M
550
5M
450
Load Rati =(). -1 -*Jwý
9 o@O %0 ab
Load Ratio = 0.4 -: ), A 4L A& AA A AA
Load R-tiio = 0.5 -'w
wuppo ff 9h ma z[b
Load Ratio 46# 0.7
()
I II
m 13
.
Load Ratio Dim (m) 0 0.2 span 30 0 0.2 hi 7 0 0.2 ht 4
0.2 span 50 0.4 hi 4
A 0.4 span 50 N 0.5 span 30 13 0.5 ht 7 0 0.5 ht 4 D 0.5 span 50
0.7 span 30 0.7 hi 7 0.7 ht 4 0.7 span 50
13
4(X) 4 68
Span/Height Ratio
Figure 5.7 Failure Temperatures of Portal Frames
10 12
The failure temperatures at a given load level were very comparable. This illustrates
the consistency of failure temperatures being influenced by the load ratio but not by
the frame geometry. The scatter within a given load ratio increased as the load ratio increased. For the 0.7 load ratio, the difference between the highest and lowest failure
temperature is approximately 50'C.
102

Chapter 5: Parametric Studies I -Two Dimensional Anal. vsis
The range of failure temperatures from the analyses are plotted against load ratios in
Figure 5.8, and they are also compared against the limiting temperatures extracted from BS 5950: Part 8 13 and Eurocode 3 15
. The limiting temperature for the BS 5950
category 'Member in bending not supporting concrete slabs: protected member' can be seen to form an approximate lower bound for the analytical results.
The nature of the analyses, in which rafters are heated but the columns stay relatively
cold, has similarities with simple beams, except that rafters are inclined members. It
has been seem that the limiting temperature data given in the Codes can provide a
quick, approximate indication of the failure temperatures of portal frames given a
similar heating scheme.
750i
ý 700 u 0 2 650 a
8.600
550
500
4-501
400 0
BS5950 Urriting Temperature (beam not supporting concrete, unprotected member) lIx
BS59-50 Urniting Temperature (beam not supporting concrete, rn protected meml)er)
0.1 0.2 0.3 0.4 0.5 Load Rado
0.6
EC3, Class 1,2,3 secdons
0.7
Analysis
0.8 0.9
Figure 5.8 Failure temperatures for frames plotted against load ratio.
5.3 The Effect of Different Fire Scenarios
Analyses in the previous sections adopted the built-in assumption that the entire rafter is heated but the columns remain cold in a fire. A different fire scenario will inevitably create a different heating scheme for the portal frame. Especially in a
large warehouse building, a fire can be localised and only heat a portion of the
building. In a high rack-storage warehouse, a line fire across the building will lead to
either a relatively small section of the frame being heated or the entire frame
increasing in temperature.
103

Chapter 5: Parametric Studies I -Two Dimensional Anal. vsis
Figure 5.9 illustrates the different heating schemes considered in the next parametric
studies. Profile (a) represents the typical fire scenario used in the previous analyses,
where a combination of fire and smoke heat up the rafters. In the most severe fire
case of total bum-out of the entire storage accommodation, all the steel members will
be heated as shown in Profile (b). Profiles (c), (d), (e) and (f) consider localised fires
at different locations, i. e. near edges, mid-span and mid-rafters. These cases lead to
some localised heating of portions of the rafters.
As the portal frame is loaded vertically, the bending moment experienced by the
rafters will be negative (hogging) at the eaves, reducing gradually and changing to
positive (sagging) in the region of the apex. The maximum moment is expected to be
near to the eaves, and the mid-rafter zones are expected to experience least moment.
ooooýýýýý AkIl
Heating Profile (a) Heating Profile (b)
t9- Heating Profile (c) Heating Profile (d)
Heating Profile (e) Heating Profile (f)
Figure 5.9 Heating Profiles of Portal Frames in Various Fire Scenarios
The portal frame under investigation is 30m in span and 7m in height to the eaves (as
previously defined in Section 5.1 ). The analyses do not concentrate on the geometry
104

Chapter 5: Parametric Studies I -Two Dimensional Anal. vsis
of the frame but on the vertical load applied, given that the load ratio seems to be the
dominant factor affecting the frame behaviour.
Figures 5.10 and 5.11 show the results of the studies at load ratios 0.2 and 0.7
respectively. The vertical displacements at the apex are plotted against the steel
temperatures in the heated zone. Comparing the heating profiles (a) and (b) for which
the difference is the heating of the column, very similar behaviour is seen. This also
applies when comparing profiles (c) and (d). This indicates that the heating of
columns does not lead to very much worse or more critical failure behaviour of portal
frames, provided that the out-of-plane deformation is prevented since the analyses are
two-dimensional.
200
-*4 12bO 1460
-200 d
E E -400
E -600- (D
cc
cl- -800 -
-1000-
-1200 -
-1400 - Temp ('C)
heating prof i le (a) heating profile (b) heating profile (c) heating profile (d) heating profile (e) heating profile (f)
Figure 5.10 Apex Displacement for Various Fire Scenarios - Load Ratio 0.2
105

Chapter 5: Parametric Studies I -Two Dimensional Anal. ysis
100
-200
-400 ý
-600 ý
-800 ý
-1000 ý
-1200
200 300 400
Temp (*C)
500 600 700 800
-heating profile (a) heating profile (b) heating profile (c) heating profile (d) heating profile (a) heating profile (f)
Figure 5.11 Apex Displacement for Various Fire Scenarios - Load Ratio 0.7
It is shown from the results that the portal frame will fail at a lower temperature if the
whole of both rafter is heated, compared to a localised heating profile. The deflection
at the apex is also more severe due to the obvious snap-through failure of the rafters.
If the comparison is made between the locally heated frames only (heating profiles
(c), (d), (e) and (f)), the deformation of the portal frame, in terms of both failure
temperature and deflection, is more severe for heating profiles (c) and (d) compared to
(e) and (f). This is due to the higher moment experienced at the eaves, as discussed
earlier. Although the moment will be redistributed due to the change of geometry
while deforming, the bending moment diagram remains similar throughout the
temperature range. Therefore, the comer fire is always more severe than other
localised fires, and the introduction of haunches at the eaves will certainly enable the
formation of plastic hinges to be pushed further away from the eaves.
It should be noted that in a warehouse where skylights are provided, these tend to
open in the early stages of a fire and provide ventilation to the building. It is likely
that the hot smoke will escape through the skylight and only the top of the building
(near the apex) forms a reservoir. This tends to cause heating profile (e) to form and
this is likely to happen for most smouldering fires. However, It is not likely to be
critical for the structural behaviour of the portal frame.
106

Chapter 5: Parametric Studies I -Two Dimensional Analývsis
800-1
700
600 ý
9500 E M co
400 Co CP b- CL
(n 300
200 ý
100
Load Ratio = 0.1 Load Ratio = 0.2 Load Ratio = 0.3 Load Ratio= 0.4 Load Ratio = 0.5 Load Ratio = 0.6 Load Ratio = 0.7 Load Ratio = 0.8
0 100 200 300 400 500 600 700 800 900 Temp (*C)
Figure 5.12 Spread of Eaves for Heating Profile (a)
When the failure mode of the portal frame is investigated for each fire scenario, it is
found that sway failures do not take place. The plot of spread of eaves for the most
severe fire scenario (heating profile (a)) is shown in Figure 5.12; the eaves are found
to move further from each other as snap-though occurs, once again forming the
rotational failure mechanism.
5.4 The Effect of Wind (Horizontal) Load
In order to contain the fire within the building in which it originated, sway failure of
portal frames is not permitted. Sway failure is more likely to occur in the presence of
horizontal wind force. However, under the current BS 5950 Part 8 provisions, the fire
condition is considered as an accidental limit state. Therefore, it is considered
unlikely that a fire will coincide with the maximum design wind force. This allows
wind load to be omitted for buildings less than 8m, or wind load to be reduced by
two-third otherwise.
107

Chapter 5: Parametric Studies I -Two Dimensional Analysis
Considering a portal frame warehouse with frames spaced at 6m centres with the
typical portal frame dimensions of Section 5.1, the wind load was calculated using a
typical wind speed, wind speed factor and ground roughness. The most onerous case
of internal and external pressure coefficients was also adopted, in which both columns
are subject to a net wind pressure in the same direction. Figure 5.13 shows the values
of wind load, calculated without adopting the fire limit state partial safety factor of
0.33.
15m
wind
+4.50 kN/m 7 61
I
wind
+4.05 kN/m
Figure 5.13 Wind Load
Analyses were conducted using this wind load, varying the vertical load on the rafters.
The vertical load is represented as a load ratio for the portal frame, with a maximum
load ratio of 0.4 being used since it is not practical to have high vertical load for portal
frames in fire. The results from the analyses, expressed in terms of the spread of
eaves, are plotted in Figure 5.14. The analyses were repeated applying a wind load
with the recommended reduction factor of 0.33, and the results are plotted in Figure
5.15.
108

Chapter 5: Parametric Studies I -Two Dimensional Anal. vsis
800-
700 ý
600
E 500 - E «a 400 -
0300-
200 ý
100 ý
0
Vertical Load Ratio
-0.1 0.2 0.3 0.4
0 100 200 300 400 500 600 700 800 Temp (*C)
Figure 5.14 Spread of Eaves - Analyses with Full Wind Load
800
700 ý
600 ý
-g 500 E
400
300
200
100
0 0 100 200 300 400 500
Temp (*C)
600
Vertical Load Ratio
-0.1 -0.2
0.3
-- 0.4
700 800
Figure 5.15 Spread of Eaves - Analyses with 0.33 Wind Load Factor
From the plot of eaves spread, there is no evidence that the portal frames are subject
to sway failure. In fact, the horizontal distance between the eaves increases as the
portal frames approach failure, suggesting that the failure mode in wind conditions is
similar to that under purely vertical loading.
The introduction of reduced wind load makes little difference to the failure
temperatures of the portal frames, compared to the effect of vertical load. This again
demonstrates the dominant influence of the vertical load.
109

Chapter 5. ý Parametric Studies I -Two Dimensional Analysis
in the parametric studies, wind pressure has been applied only to the vertical faqade of
the portal frame building. If the roof is constructed with profiled steel sheeting, it is
reasonable to assume that it stays in place during the fire. Hence the wind will create
an internal uplift pressure, resulting in a reduction in vertical load on the rafters. Therefore, the vertical load ratio is expected to be even less than the normal loading at fire limit state, if wind forces are considered. Figure 5.16 demonstrates the effect of
wind load. For a typical portal portal frame with span larger than 30m, moment B is
always dominant compared to moment A. This results in less overturning moment at
the column base, and hence less likelihood of sway failure.
Wind force
=+ I M+(:! t1l)
Moment A Moment B
Figure 5.16 Wind Uplift effect on Portal Frame
However, if the recommendation from BS 5950 Part 8 is adopted, wind load cases are
only required to apply to buildings which have a height to eaves of more than 8m. If
pinned bases are adopted in the design of tall portal frames with column height larger
than 8m, it is often required to provide a bigger steel section to satisfy the horizontal
deflection criterion of the columns, due to the increased wind loading. Therefore, it is
often found that wind loading is the less onerous case in the fire limit state for typical
portal frame buildings. In consequence the lack of extensive research and reasoning
behind the 8m recommendation given in BS5950 Pt 8 does not necessarily lead to
major concern for portal frame buildings.
The purpose of these parametric studies is to investigate the likelihood of the
occurrence of sway failure of a portal frame. A particularly slender frame was
chosen, applying different levels of horizontal force combined with low vertical
loading. The span of the frame is 15m and the height to eaves is 7m, which results in
110

Chapter 5: Parametric Studies I -Two Dimensional Anal. vsis
a span/height ratio of 2.14. The frame is again designed using plastic analysis, and a
vertical load ratio of 0.2 is adopted. The horizontal load is added to the frame as a
percentage of the total vertical load, applied as a point load on one of the eaves. The
typical wind force for a portal frame is approximately 20% of the 0.2 load ratio
loading.
The results from the analysis are plotted in terms of the spread of the eaves in Figure
5.17. The results show a strong indication that the frame will have a rotational failure
at a low horizontal force (<50%). The final analysis shown is the case where 80% of
wind load is applied with half the vertical load (i. e. a vertical load ratio of 0.1). The
results indicate a sway failure in which the spread of eaves does not experience
4runaway'.
600
500
400
300 ý
200 ý
100 ý
Percentage of Horizontal Force to Vertical Load
-0.50% -20%
50% 70% 80% 800/6 (half vertical load)
100
-100
200 300 400
Temp (OC)
500 600 700 8
Figure 5.17 Spread of Eaves - The Effect of Horizontal Forces
Sway failure of a portal frame is theoretically possible . However, the analysis on the
last case was based on a slender frame with extremely high horizontal force and low
vertical load. This is not realistic for a portal frame building under normal
circumstances. With a higher vertical load combining a horizontal force at one side,
the P-8 will enable the column that resists the horizontal force to rotate more than the
other column, creating the rotational failure mode.
0
III

Chapter 5: Parametric Studies I -Two Dimensional AnalYsis
12000
10000
8000
'g 6000 E
4000
2000
0 2000 4000 6000 8000 10000 12000 14000 16000 18000
(MM)
Figure 5.18 Deflected Shape of Portal Frame, 80% Horizontal Load, 0.2 Vertical
Load ratio.
Figure 5.18 shows deflected shapes for one of the analyses, with 80% horizontal load
and 0.2 load ratio. The plot of spread for this particular analysis did not indicate a
clear non-sway failure mode until the end of the analysis. From the final deflected
shape, the left column has rotated slightly more than the fight column, which suggests
that the frame will eventually fail by the excessive rotation of the left column and the
fight eaves will be pulled inwards eventually. This is also evident from the plot of
spread from Figure 5.17, as the spread experiences "run-away" just before failure,
compared to the case with half vertical load (0.1 load ratio) which experiences sway
failure.
5.5 The effect of Base Rotational Stiffness
The analyses in the previous sections have adopted the assumption of pinned bases to
the columns of the portal frames. Although the same assumption is widely used by
engineers while designing portal frames, a connection with the column base plate
bolted down to the concrete foundation is the common practice in specifying the
details of these bases. These connections do not actually allow free rotation at the
base. In fact, it has been shown from research and experiments 58,59,60,61 that such
connections will provide significant rotational stiffness to the columns.
112

Chapter 5: Parametric Studies I -Two Dimensional Ana/Ysis
Jaspart and Vandegans 5.4 conducted a series of experiments on column bases with two
and four bolts, varying the axial load and base plate thickness. The rotational
stiffnesses found ranged between IX102 to IX104 kNnVrad.
Sensitivity of the portal frame behaviour to the base rotational stiffness is investigated
in the next series of analyses. A typical portal frame of 30m span and 7m column height was set up with spring elements at the bases of both columns. The rotational
stiffness of the spring is varied between I and Ix 109 kNm/rad, rather than the ideally
pinned and rigid connections predefined in the program. The vertical load on the
frame is 0.2 of the failure load, the entire rafters are assumed heated uniformly and
the columns remain relatively cool. Figure 5.19 plots the vertical displacements at the
apex against temperature for the various rotational stiffnesses.
600
4001
- 2001 E E
0 a (a -400-
-600-
-800-
-1000-
-1200-
-1400-
Rotational Stiffness in kNmm/rad
PINNED I. E+00 l. E+02 l. E+04 l. E+05 l. E+06 l. E+09 RIGID
Temp (OC)
Figure 5.19 Vertical Displacement at Apex - Effect of Base Rotational Stiffness
The analyses show that rotational stiffnesses up to IX102 kNm/rad do not affect the
portal frame behaviour as compared to "pinned", and a rotational stiffness of more
than IX106 kNm/rad can be considered as "figid". The portal frame behaviour is most
sensitive to stiffnesses between IX102 and IX105 kNm/rad.
When the rotational stiffness is low, the restraint to the column is low and the rafter
expansion causes the eaves to deflect outward. As the strength of rafters reduces at
higher temperatures, the rafters deflect downward until snap-through takes place.
When the column restraint is large due to higher rotational stiffness, the eaves can no
113

Chapter 5: Parametric Studies I -Two Dimensional Analysis
longer deflect outward as much, and instead the apex is pushed upward and the rafters
experience greater axial force. As the rafters reach the snap-through point, the loss of
stability happens more rapidly as the column restraint force contributes to the loss of
stability of the rafter.
In the case of VULCAN analysis, the program stops at the limit point where snap-
through starts, and is not able to predict the downward pattern. However, the pre- failure curve has clearly demonstrated the trend of the snap-through action.
The next series of parametric studies repeats the original study in Section 5.1 in which
the load ratios are varied, but the column bases are changed to semi-rigid connections
with rotational stiffness of lxlO4kNnVrad. It was shown from Figure 5.19 that this
stiffness lies almost in the middle of the range of behaviour between pinned and rigid bases.
Figure 5.20 and 5.21 show the vertical displacement at the apex and the spread of
eaves for this case. The shape of the curves is similar to the results from Section 5.1
(Figures 5.2 and 5.3) except that the numerical values of failure temperatures and displacements differ. The failure temperatures for the frames with semi-rigid bases
are higher, and the upward deflections at the apex are greater, with smaller values of
horizontal eaves spread. This is due to the restraint effect explained earlier.
From the vertical displacement plot of the 0.1 load ratio case, the first indication of
failure appears at approximately 800'C. This failure temperature is in line with the
other cases in this series of analysis. However, due to the semi-rigid pinned bases and
the low level of vertical load, the snap-through is not as dramatic as the other cases
and VULCAN has managed to bring the analysis to a further stage, which can not be
usually picked up by VULCAN. As temperature approaches 1000'C, the snap-
through is more dramatic and VULCAN can not follow the sudden vertical dive of the
apex. The three final solutions (indicated by the dots) of the analysis show the
evidence of this dive.
114

Chapter 5: Parametric Studies I -Two Dimensional Anal. vsis
400
200 ý
0 E
-200
E -400- cc
-600 -
_800 0) >
-1000
-1200
-1400
I Load Ratio
Temperature (OC)
12
-0.1 0.2
-0.3
-0.4 0.5
0.6
0.7
L-0-8
0
Figure 5.20 Vertical Displacement at Apex - Semi-Rigid Base with Various Load
-0.1 -0.2
0.3 0.4
-0.5 -0.6 -0.7
-0.8
0 200 1000 1200 400 600 800 Temperature ('C)
Ratios
Figure 5.21 Horizontal Spread of Eaves - Semi-Rigid Base with Various Load
Ratios
115

Chapter 5: Parametric Studies I -Two Dimensional Anal. vsis
Figure 5.22 compares the actual failure temperatures of the pinned and semi-rigid
cases, and although no clear trend is indicated, semi-rigid bases do clearly lead to an
average 10% improvement. However, the 22% improvement shown at 0.1 load level
could be due to the VULCAN analysis continuing beyond the normal first failure
stage.
1200
1000 ý
800-
600 ý
400 ý
200 -
x
I 16
-$-Failure Temp for pinned bases ('C) Failure Temp for Semi-Rigid Bases (oC) Actual Difference in IC Difference in%
w-. %0 %0
OX 00
25
ý 20
15 0
cc
lo ID 0.
0 0.1 0.2 0.3 0.4 0.5 0.6 0.7 0.8 0.9
Load Ratio
Figure 5.22 Comparison of failure temperatures with pinned and semi-rigid bases
0
Further analyses with semi-figid bases were conducted on various frame geometries
and similar findings were obtained.
It should be noted that the value of rotational stiffness chosen in the parametric
studies is the average stiffness on a normal connection. Various methods of 5" 61
determining the actual rotational stiffness can be found based on current research
However, the calculation for these stiffnesses would normally consider the interaction
between the steel and concrete foundation only. The interaction between the soil and
the foundation is little known. The fact that a relatively high factor of safety is often
adopted in a foundation design has led to difficulty in determining the overall
116

Chapter 5: Parametric Studies I -Two Dimensional Analysis
rotational stiffness of the complete base. Therefore, the assumption of a pinned
connection is considered always to be safe.
There is also very limited research and knowledge about the effect of elevated
temperature a the rotational stiffness of base connections. However, it is reasonable
to consider that the base connection would normally remain relatively cold in a fire
due to its position. If the temperature of the connection remains below 4000C, its
rotational stiffness may not be affected a great deal.
5.6 Conclusion
A range of parameters which affect the behaviour of portal frames have been
investigated, including the load ratio, span and height, heating profiles, horizontal
load and rotational stiffness at the bases. The studies involve two-dimensional
numerical analyses on the portal frames at elevated temperatures.
The load ratio was found to have the greatest effect on the failure temperature of the
frame. Frames with various geometries will fail at almost the same temperature
according to their load ratios. When the results are summarised, it is found that the
limiting temperatures for a particular category of beams from BS 5950 Pt. 8 can be
used as an approximation for determining the failure temperature.
The failure modes of portal frames in fire were investigated. It was found from the
analyses that none of the frames had a sway failure mode except one case in which
extremely high horizontal force and low span-height ratio was adopted. This case is
thought to be unrealistic and would not exist in practice. Therefore, wind loading
does not normally produce a critical case for portal frames in fire, in particular for
large-span frames. 4N
When the heating profile of the portal frame has been investigated, it was found that
the heating of columns does not affect the failure temperatures significantly. in the
event of a local fire, the heating scheme in which the eaves are heated was found to be
the most critical case.
The extra rotational stiffness of normally pinned bases is shown to be beneficial to the
failure temperature of the portal frame compared to the normal assumption of pinned bases. However the overall rotational stiffness, in particular the interaction between
the foundation and the soil, is little known and research on the effect of elevated
117

Chapter 5: Parametric Studies I -Two Dimensional Analysis
temperature on the connection is limited. Therefore, it is difficult to quantify the
actual benefit of the semi-rigid behaviour of the column base.
118

Chapter 6. - Parametric Studies 2- Three Dimensional Analysis
6 Parametric Studies 2- Three Dimensional AnalYsis
Following the series of 2-dimensional parametric studies on portal frame behaviour
in fire, it was Proposed to extend the analyses to 3-dimensional behaviour using the
finite element program VULCAN. In previous studies, a relatively small model with just one portal frame bay had been set up to model one of the scaled frame fire tests
at Buxton. It gave an indication of VULCAN's capability for the analyses. A more
complete 3-dimensional analysis is now attempted in this study. Inevitably the 3-
dimensional model will be much larger, and hence prolonged analysis time is
required. The details of the model will be described in the following Section 6.1.
6.1 The 3-Dimensional Model and Assumptions
It is necessary to include the secondary members within the 3-dimensional model,
and it is important how they are modelled. The major secondary members which
contribute to the portal frame behaviour are the Z-purlins found in most industrial
construction. The purlins are normally made of cold-formed galvanised steel, spaced
close to each other (typically 1.5 - 2.0 metres apart). They are designed to resist the
vertical load from roof and to restrain horizontal movement or minor-axis buckling
of the main portal frame rafters.
However, the purlins are weak in minor-axis buckling. Under fire conditions, they
are heated rapidly due to their minimal thickness and high HýA ratio. The bending
resistance in fire is therefore almost negligible, and the fire tests at Buxton have
given evidence of this. Nevertheless, the purlins were recognised to provide a certain
degree of restraint to the rafters, through their tension capacity as interconnecting
members.
Therefore although VULCAN analysis does not model the local behaviour of steel
members, (i. e. local buckling and twisting) this was not considered essential in fire.
In order to simulate the tension resistance of purlins, the Z-shape can be replaced by
the I-shape traditionally used in VULCAN, approximating the width of the
top/bottom flange as the width of the I member and adopting the same depth and
thickness throughout.
119

Chapter 6. - Parametric Studies 2- Three Dimensional Analysis
Figure 6.1 Simulation of Z-purlin in VULCAN
With such a thin and relatively deep section, the purlins are usually fixed to the roof
cladding and support the vertical load. The interlocking roof cladding, spanning between purlins, nevertheless provides lateral restraint so that they do not buckle
about the minor axis. This is particularly important in fire conditions because the
expansion within the heated purlins alone could cause minor-axis failures of the
sections in the early stages.
The potential problem was recognised when a preliminary VULCAN model was set
up while excluding the consideration of any roof cladding effect. The analyses could
not be extended to high temperatures because of the failure of purlins at an early
stage. The difficulty was overcome by subsequently including imaginary members
that connect the purlins together. These imaginary members span between purlins
and lie parallel to the portal rafters. They have minimal area and thickness (IOxIO
mm H section with Imm thickness) and only act in tension, simulating the effect of a
roof cladding restraint.
Figure 6.2 shows the set-up of the finite element model, including the mesh
representing the combination of purlins and roof cladding. The mesh enables the
simulation of an orthotropic surface with the primary vertical resistance coming from
the Z-purlins. The entire mesh will behave as a continuum and this is thought to be
close enough in representing the real structure. Since both the purlins and the
imaginary members are relatively small in section, the effects of connection on the
entire portal frame are negligible, and therefore spring elements were not introduced.
The figure shows that the model only consists of three portal frames. Although it is
not a full industrial warehouse shed, the model should be sufficient to generate
representative results for the studies. The model consists of 237 nodes and 350
elements. The computer time required for a single analysis was much longer than for
120

Chapter 6: Parametric Studies 2- Three Dimensional AnalYsis
a 2-dimensional analysis.
Figure 6.2 VULCAN Model of 3-Dimensioani Portal Frame Warehouse
6.1.1 3-Dimensional VULCAN Model
In order to start the investigation of the 3-dimensional behaviour, a typical industrial
portal frame layout was used. The span of the portal frames adopted is 30m and the
frame centres are spaced 6m apart. The height to eaves is 7m with the roof pitched at
14.90. The generic dimensions have often been adopted in the 2-dimensional
parametric studies conducted previously. The same section sizes were again adopted
and the assumption of no haunches remains.
It was decided to compare the 3-dimensional analysis with the previous -)- dimensional case as the basis of the studies. The basic model shown in Figure 6.2
was adopted and the details are presented in the following section.
6.2 Case 1- Entire Roof Heated
Using the model described previously, a fire scenario involving heating of the entire
roof member will be modelled in this section. The columns in this case are assumed
to be protected and remain relatively cool. A conservative assumption of pinned
bases is adopted so that like-against-like comparison to a 2-D analysis can be done.
A uniformly distributed load of 0.4 kN/M2 has been applied to the entire roof, spread
121

Chapter 6. - Parametric Studies 2- Three Dimensional Anal. vsis
evenly between nodes. The load is equivalent to a load ratio of 0.2 on the central
portal frame. Additional load has been applied to the portal frames at the two edges
so that all three frames experience the same load level of 0.2 of their ultimate
capacity. This is a typical load level encountered during the fire condition, after discounting the possibility of snow load.
122

Chapter 6. - Parametric Studies 2- Three Dimensional Analvsis

Chapter 6. - Parametric Studies 2- Three Dimensional Analysis
Figure 6.3 shows the deflected shape predicted by VULCAN analysis as temperature
increases, interpreted by the program SHOWGRID. The elements are plotted in red
and blue colours, representing heated and unheated members. The deflection has
been scaled five times to exaggerate the deformation of the structure.
At 200C the entire structure is hardly deflected and remains in almost the same shape
whilst temperature increases up to approximately 500"C. At this point the portal frames still show little sign of deformation, but the secondary elements, the purlins in
particular, have deflected significantly compared to the main frames. This agrees
with the observations from the experiments, where purlins lost strength much earlier
than the portal frame.
The secondary elements continue to lose strength as temperature increases, until at
6600C the roof behaves like a piece of paper hung on top of the portal frames. As
the roof becomes 'softer' in the fire, the portal frame begins to deflect, in exactly the
same mode as is predicted in the 2-dimensional analyses. The deflections of the
three portal frames are almost uniform and parallel to each other. The rafters
eventually deflect excessively, with the apex displacing rapidly in the vertical
direction and the 'snap-through' phenomenon is predicted at around 717"C.
From the deflected shape shown above, the VULCAN modelling is predicting
reasonably the portal frame behaviour in the 3-dimensional model. Using the mesh
system to represent the roof structure generated the expected deformation. The same
analysis was repeated with higher load intensity, equivalent to a load ratio of 0.5 on
the portal frames. The same deflected shape was predicted with a lower failure
temperature.
The vertical displacements at the apex predicted by these two analyses were plotted
against temperature, and comparisons were made to the previous 2-dimensional
analyses. The apex displacement of the 3-dimensional analysis was taken at the
middle point of the central frame. Figure 6.4 shows the comparisons.
It can be seen from the plot that there is little difference between the results from the
two- and three-dimensional analyses. They predicted almost exactly the same failure
temperatures and amounts of deflection. This is the expected result, because the
entire roof is heated and there should not be any extra strength gained from simply
modelling the structure in 3-dimensional mode. The secondary elements in this case
124

Chapter 6: Parametric Studies 2- Three Dimensional AnalYsis
were only providing lateral restraint to the main portal frames. The purlin spacing
has actually provided sufficient restraint to the rafters against buckling about the
minor axis. The imaginary members were providing exactly the same restraint to the
purlins as they would in reality, given the roof cladding interaction.
200
-------------- ---------- 500 600 "-, 700 8
-200 d E E
-400 E
-600- CL Ae 0 -ra -800 - .2 t 0 >
-1000
-1200 ý
-1400
Load Ratio 0.2 - 2D Analysis Load Ratio 0.2 - 3D Analysis Load Ratio 0.5 - 2D Analysis Load Ratio 0.5 - 3D Analysis
Temperature (OC)
Figure 6.4 Vertical displacement at apex - 2D vs. 3D analysis
0
However, the forces within the imaginary members are not comparable with a real
cladding. These members should not be used to represent the cladding without
further investigation into cladding behaviour. The fact that they were not heated in
the analysis simply assumes that the cladding is infinitely strong and will not split in
the fire condition. In reality, the roof cladding may fail due to high temperatures, or
may even fall off as the purlins deform excessively.
However, if the roof cladding fails in the event of a real fire, the portal frame may
benefit from this situation. The load level on the portal frame will further reduce by
losing the cladding self-weight and possibly a significant amount of services. The
steel temperatures are likely to reduce as additional ventilation becomes available
(assuming flashover has already taken place, as it would if the entire rafter is heated
to the failure temperature). On the other hand, the failure of cladding may increase
the life-safety risk of fire fighters, but whether or not the fire fighters remain in the
125

Chapter 6 Parametric Studies 2- Three Dimensional Analysis
building the post-flashover stage is questionable. The issue will be further discussed
later.
6.2.1 Further Analysis
The 3-dimensional analyses have demonstrated that portal frame behaviour can be
well represented by 2-dimensional modelling, provided that sufficient lateral restraint
is given to the rafters and a fire scenario with the entire roof heated is modelled.
Further analysis may be useful so that several major research issues can be further
investigated, including gaining a further understanding of the influence of secondary
elements on the modelling, and studying the effect of different fire scenarios on both
the portal frames and the roof mesh. Investigation of secondary element behaviour
will involve extensive research, both analytically and experimentally, on local effects
and possibly thin plate element behaviour at high temperatures. This is not covered
within the current research project.
It was therefore decided to extend the 3-dimensional parametric studies into
modelling different fire scenarios of local heating. The forces within the secondary
elements will be investigated as a preliminary study into the more complex territory
of cladding behaviour.
6.3 Case 2- Local Fire Scenarios 1
Using the same 3-dimensional model set up previously, this study will look at the
effect of the central portal frame being heated while the other two frames remain at
ambient temperature and provide additional support. The study will look at the
effect of unprotected columns and unheated purlins. A load ratio of 0.2 has been
adopted throughout. Figure 6.5 summarises the four cases analysed by VULCAN,
with red coloured elements representing the heated members. The cases are:
(a) All purlins heated, columns remain cold.
(b) All purlins heated, columns heated.
(c) Half of the purlins heated, columns remain cold
(d) Half of the purlins heated, columns heated.
126

Chapter 6: Parametric Studies 2- Three Dimensional AnalYsis
Figure 6.5 Local fire scenarios
All four cases were analysed with VULCAN and the deflected shape was generated
and inspected using SHOWGRID. A visual inspection identifies any errors created
during the modelling and assists in understanding the process of deformation. Figure
6.6 shows the deflected procedure predicted by the analysis for fire scenario (c), with
the displacement scaled by a factor of 5.
In fact, it was found that the portal frame behaviour in each fire scenario is always
dominated by expansion of the secondary elements at the initial heating stage, i. e.
prior to 600"C. The rafters then start to lose their strength, followed by more
rigorous deformation as temperature increases.
Although the final deformation shape at 880'C shown in Figure 6.6 does not clearly
indicate a snap-through failure of the heated portal frame, the plot of vertical
displacement at the apex shows the excessive vertical displacements with negligible
horizontal movement. The plot is shown in Figure 6.7 along with the results from
other fire scenarios, including Case I from Section 6.2 where the entire roof rafters
were heated.
127

Chapter 6: Parametric Studies 2- Three Dimensional Analysis
Figure 6.6 Deflected shape - fire scenario (c)
128

Chapter 6: Parametric Studies 2- Three Dimensional Anal. vsis
0
Steel Temperature (OC)
Figure 6.7 Vertical displacements at apex - Load ratio 0.2
The deflection plot shows that the heating of columns once again has little effect on
the overall behaviour of the portal frame, whether the purlins are heated fully or
partially. The major deformation always occurs at the rafters, especially with the low
load ratio and long-span portal frames.
However, the effects of the purlins are rather interesting. Comparing the results from
fire scenario (a) with Case I of the previous section, the effect of the adjacent cool
frames is minor and does not take place until the final stage before failure is about to
occur. With half the purlins remaining unheated in fire scenario (c), the heated portal
frame actually gains significant strength from the adjacent frames, through the purlin
sections. It is evident that additional strength was gained in this case, and the
VULCAN analysis was extended beyond 950'C, compared to the original 760'C,
with reduced vertical displacements.
Although the rate of displacement actually reduces towards the end of the analysis,
the termination point is thought to be tensile failure of the purlins, which will almost
certainly lead to an immediate failure of the heated portal frame. Numerical
instability is expected in this region where a large number of purlins may find their
failure points at the same time.
129

Chapter 6. - Parametric Studies 2- Three Dimensional Analysis
6.3.1 Internal Forces within Purlins
Having seen the effects of purlins on the portal frame behaviour in fire, it became of interest to investigate the internal forces generated during the heating phase. The
exercise is another major benefit of conducting parametric studies, which can not be
easily parallelled in fire tests.
it is generally agreed that the purlin section is rather weak in bending due to its
minimal thickness. It will therefore mainly contribute in tension, holding the heated
frame's separation from adjacent unheated ones, and axial forces are therefore the
main subject of this investigation.
Knowing that the axial force within a particular purlin section will be uniform throughout its length, the internal forces of purlins at various positions are plotted. Figure 6.8 and 6.9 plot the forces for fire scenarios (a) and (c) respectively, where the
purlin locations are indicated. Positive forces represent compression and vice versa.
Both plots show that the purlins initially resist compression forces during the
expansion of the purlins. The forces peak at different temperatures for each purlin location. The compressions then reduce to near zero or even drop into the tension
zone at some stage before failure at high temperatures. The variation of compression forces and their peaks are very much relevant to the movement of the heated portal frame.
It can be seen that the purlin connecting eaves of adjacent portal frames (member
261) displays the highest amount of compression. This is because the eaves have
more restraint to movement compared with the apex, where a relatively high amount
of upward deflection was detected due to expansion. Adding on to this is the effect
of the entire mesh interaction. The purlins are provided with restraint by the
members representing the cladding, from which only one-sided restraint is available for the purlins at the eaves. When sufficient deformation is gained within the purlin
connecting the eaves, the compression starts to reduce.
The force path for the purlin connecting the near apex (member 205) is rather different. There are minimal forces in the initial stage of heating because it was free
to expand due to the upward displacement of the apex. Compression only takes
place when the rate of deflection for the portal frame decreases. Eventually when the
i
130

Chapter 6: Parametric Studies 2- Three Dimensional Anal. vsis
snap-through of the portal frame takes place, the compression reduces to zero and
tension begins.
it is worth noticing that all purlins are resisting tension just before failure, although
the tension force is small, and this enables the portal frame to gain additional strength
from the adjacent frames as mentioned earlier.
90 -1
so ý
70 ý
60 ý
-10
-Mbr205 Mbr 221
----- Mbr229 Mbr245 Mbr 261
ft! mt mii Nka 100 200 300 400 500
Temperature (OC)
500 700 800
Figure 6.8 Axial forces within purlins - Fire Scenario (a)
Mbr205 Mbr 221 Mbr229 Mbr245 Mbr 261
200 400 500 goolr - 1000 1200 ý ---- I --
Figure 6.9 Axial forces within purlins - Fire Scenario (c)
131

Chapter 6. - Parametric Studies 2- Three Dimensional Anal. vsis
The purlins' internal forces for the two different fire scenarios show similar patterns. The forces are higher for fire scenario (a) due to the higher amount of expansion. Interestingly the purlins connecting eaves points dip down into the tension zone at
one stage in fire scenario (c) and have to resist a significant amount of tension. The
tension force peak remains more or less at the same ooint where the analysis for fire
scenario (a) terminates. This could be the main contribution of the unheated purlins
and the way in which the additional strength of the portal frame is gained. The eaves
are simply held back from moving inward when the snap-through of rafters is about
to take place.
Figure 6.10 shows the forces in the purlin connecting the adjacent eaves (Member
261) for the four fire scenarios analysed in for this study. Again the effect of the
heated columns is negligible. The peak of the compression forces for fire scenarios
(c) and (d) is approximately 200T, lagging behind due the extra strength gained
from the unheated purlins. The tension zone effect described earlier can be clearly
seen, and little additional strength was gained for cases (a) and (b) when the purlins
could resist little very tension (refer to Figure 6.7).
U 0 U.
-1
80
70
60 (d) WWI-, sma ---
50 (b)
40
30
20
10 (d)
)o 100 300 500 -10 -
-%A%
Temperature (OC)
Figure 6.10 Internal forces of member 261
0
132

Chapter 6. - Parametric Studies 2- Three Dimensional AnalYsis
6.4 Case 3- Local Fire Scenario 2
Figure 6.11 Case 3- Two bay heated
PF 3
133

Chapter 6: Parametric Studies 2- Three Dimensional Anal. vsis
200
0
This section describes the analysis conducted for the fire case where only two of the
portal frames are heated. The lateral movement of the heated portal frame will be the
main subject of the investigation. The same 3-dimensional model was again used for
the analysis, whilst the load was increased to a load ratio of 0.5. Figure 6.11 shows
the heating profile assumed and the deformation process of the portal frame
structure.
The deflections were again scaled five times to exaggerate the deformation of the
structure. The deformations of the two heated portal frames, PH and PF2, are
excessive while the unheated frame PF3 remains stable throughout the heating phase.
Although a snap-through failure seems to take place, PH has also rotated in plan
(laterally), being pulled in by the purlins and the unheated PF3. It is therefore of
interest to plot the displacements at the apex of PFI. This is shown in Figure 6.12, in
which the vertical displacement is compared against the 2-dimensional analysis.
Temperature (*C)
400 500
-200ý - --- -100-
400 ý
-600
-800
1000
1200
1400
1600 ý
IBM
600
j
Vertical displacement
Out-of-plane displacement
Vertical displacement from 2D analysis
Figure 6.12 Apex displacement of PF1
700
The plot shows that the failure temperature predicted for the 3-dimensional case is
similar to the 2-dimensional analysis. It is also obvious that a snap-through
phenomenon has occurred. However, the rate of the out-of-plane displacement also
indicates that the frame is about to be pulled over by the purlins (i. e. run-away of the
134

Chapter 6: Parametric Studies 2- Three Dimensional Anal, vsis
displacements). This is due to the rigid unheated frame at the far end. Such a
phenomenon was not noticed previously.
The phenomenon could be transient or could even exist within the analysis only. One may argue that the purlins are simply not strong enough to create such a failure.
in fact, the analytical assumption that the connections between purlins and rafters do
not fail in fire conditions may be too onerous and may be responsible for this
observation. Further research on this area is recommended.
6.5 Case 4- Local Fire Scenario 3
The final case analysed within this study is to look at a very small portion of the
portal frame structure heated due to a minor fire. The analysis is mainly done to
visually inspect the deformation and to demonstrate the capability of VULCAN in
the 3-dimensional analysis. Figure 6.13 shows the deformation sequence.
135

Chapter 6. - Parametric Studies 2- Three Dimensional AnalYsis
841'C
Figure 6.13 Case 4- Corner fire
It can be seen that the deformation is actually minor. The final failure temperature is
predicted to be 841'C, compared to 713'C from a 2-dimensional analysis. The
improved performance is again due to the unheated portions of the purlins. Apart
from this, the deformation pattern is similar to that from the 2-dimensional analysis.
6.6 Discussion and Conclusion
Although only four cases of fire scenarios are presented in this study, a lot of effort
has been expended in identifying the final shape of the model used, through a process
of trial and error. For example, there were a number of failures in reaching
reasonable analytical results before the introduction of the imaginary members
between purlins. The problem of numerical failure was also often encountered due
to the use of the slender section sizes while a high-temperature overall analysis was
desired. Using a lower temperature or a larger section for secondary elements are
simply unjustifiable.
For all the effort made to achieve the 3-dimensional analysis, one of the immediate
conclusions that can be made is that the 2-dimensional analysis is probably sufficient
for most analytical purposes, provided that the worst fire scenario of an entire heated
structure is to be considered. The inclusion of the secondary elements will only
improve the performance of portal frames in fire if the adjacent frames are not
heated.
136

Chapter 6 Parametric Studies 2- Three Dimensional Analysis
Although the internal forces within the purlins may not be quantified precisely within
the VULCAN analyses due to the assumptions of cormcctions and the imaginary
members, the plot actually gives a good indication of the actual reaction within the
secondary members. The purlin members that connect between eaves are thought to
be particularly significant as they restrain the eaves from moving inwards during the
phase of snap-through. This is evident from the plot of internal forces.
However, this can only happen if the purlins remain sufficiently strong to perform
this task in fire. This is rather unlikely given the thin section and high HýA ratio.
Eaves beams can often be incorporated within a high-bay portal frame structure to
support the cladding. They could be taken into account for this purpose.
The analyses within Section 6.3 demonstrate that the heating of columns has little
effect on the overall behaviour of portal frames. It is actually a common industrial
practice to fire-protect portal frame columns in boundary conditions. However,
VULCAN can not predict local buckling and twisting deformations. The local
deformation, if it takes place, may have some effect on the fire resisting
walls/claddings that the columns support. These walls/cladding are required to stay
in place for the designated period so that external spread of flame is prohibited.
Having said that a 2-dimensional analysis is probably sufficient if the worst fire
scenario is under consideration, it is often assumed the worst-case scenario is a fire
that heats up the entire roof, including the rafters and secondary elements. The
analysis in Section 6.4, where two of the three portal frames are heated, has
demonstrated that the effect of the heated frame may cause sideways overturning of
the heated frame. There is little evidence that this has ever taken place in reality but
it demonstrates the importance of considering various fire scenarios as potential
worst cases. A more sophisticated approach might be to consider developing fires
within a large portal frame warehouse where cooling and heating may happen at the
same time at different locations. This could have a detrimental effect on collapse if
the appropriate fire heating profile is adopted.
In conclusion, the 3-dimensional analyses conducted within the study may not
represent well the true interaction behaviour of the cladding and purlins in a real fire
situation. However the study has brought up several issues where further
investigation would seem useful. The analyses also complete the series of parametric
137

Chapter 6. - Parametric Studies 2- Three Dimensional Analysis
studies on portal frame behaviour in fire, as proposed within the research
programme.
138

Chapter 7. - Development of Simplified Estimation of Critical Temperaturesfor Portal Frames in Fire
7 Development of Simplified Estimation of Critical Temperatures
for Portal Frames in Fire
Much of portal frame behaviour in fire has been illustrated and discussed in the
previous chapters. The characteristic failure mode has been shown in experiments
and further explored in parametric studies. The introduction of the concept of "fire hinges" at the critical temperature has been discussed. The formation of fire hinges
is due to the reduced plastic moment capacity of the steel section at elevated temperature. It is recognised that the concept can be applied relatively quickly and
safely to estimate the critical temperatures of portal frames in fire.
Structures of this type are not usually required by legislation to have a minimum fire
resistance period. However, if a portal frame building has a separation from the
adjacent building which is less than required (depending on the size of the fagade),
the relevant external wall of the building is required to have sufficient fire resistance to prevent fire spread across the boundary17 - Hence the columns supporting the
external wall (the vertical cladding fagade) would require a fire resistance of 60
minutes and a moment-resisting foundation to resist the overturning moment
generated in fire. Alternatively, the entire portal frame can be designed for a fire
resistance of 60 minutes 2. In this case, the proposed estimation method is thought to be useful to enabled a practising engineer to estimate simply the limiting
temperatures of a portal frame or to check against the results generated by a
sophisticated computer program.
This chapter describes the simplified approach based on Plastic Theory, which
enables calculation of the failure temperatures of steel portal frames for different
load cases and at different load levels, by inserting fire hinges at appropriate locations. Different fire scenarios, including both localised and completely developed fires, are considered for a range of frame geometries. Particular attention is given to pitched-roof portal frames due to the popularity of this form of
construction.
The results from this simplified approach are compared against analytical results from the non-linear finite element program, VULCAN. Worked examples of the
simplified calculations will be shown.
139

Chapter 7. Development of Simplified Estimation of Critical Temperaturesfor Portal Frames in Fire
7.1 The Simplified Method
Since the mid-1950s portal frame design in the U. K. has been widely based on the
principles of Plastic Theory, using a balance of internal and external work for
strength calculation. Often these are designed as basic pitched-roof frames with
pinned column-bases, avoiding high foundation cost, as well as the complexity of
forn-dng a rigid base connection. Detailed illustrations of this design method can be
found in many standard teXtS20,24,62.
The simplified approach presented here simply follows the work balance procedure.
The frame eventually creates sufficient plastic hinges. as loads increase to form a
mechanism which may include pre-existing hinged connections. Given a compatible
set of small displacements of this mechanism caused by articulation of the hinges,
the work done by the external loads in displacing is balanced by the work done by
the internal plastic moments in rotation of their plastic hinges. The equilibrium work
balance equation can be expressed as:
I: Wj, 5j (External work done) = IMPOP (Internal work done) (7.1)
Once a failure mechanism has been identified, the appropriate failure load can be
found from equation (7-1). Finding the correct mechanism, which occurs at the
minimum value of this collapse load, involves testing all possible collapse
mechanisms of the portal frame.
The relationship does not change under fire conditions, and thus the work equation
will still be valid. However, the external work done is clearly dependent on the
loading in the fire limit state, which can be determined from codes of practice for
structural fire resistant design such as the British Standard BS5950 Part 8 13 . As
explained in the earlier chapters, the vertical dead load in fire is usually the dominant
external load, since design imposed loading is considerably reduced by the partial
safety factor for this accidental limit state.
The compatible internal work done is however induced by the forming of plastic hinges. Because of the elevated temperature, the yield stress of steel is reduced and
this results in a reduction of the plastic moment capacity of the steel section. Such
140

Chapter 7. - Development of Simplified Estimation of Critical Temperaturesfor Portal Frames in Fire
hinges are regarded as "fire hinges". By inserting these fire hinges into the portal
frame, the level of reduction in plastic moment capacity required in order to achieve
a failure mechanism at a given fire limit state load can be found. The strength
reduction factors of steel at elevated temperature are given in fire resistance codes 15
such as BS5950 Part 8 or the draft Eurocode EC3 Part 1.2 . Provided that the fire
hinges are assumed to form in steel members which are at the same temperatures, it
is possible to calculate the reduction factors required for the collapse mechanism to
form in fire. The steel temperature giving this reduction can be found, and this is the
failure temperature of the portal frame. If a fire resistance time is required, then the
relationship between atmosphere temperature and steel temperature can be modelled
simply using the incremental approaches given in Eurocode I Part 2.2 63 for either
exposed or passively protected steelwork. If the IS0834 64 standard fire curve is
assumed, as is conventional in fire testing of components, fire resistance times can be
interpolated.
7.2 Application of the Simplified Method
Since the simplified method is based on the concept of plastic analysis, the procedure is best illustrated by some examples. This section will demonstrate the application of
the simplified method described earlier to some typical portal frames. The initial
cases will consider a fire which heats up the entire rafter of a simple goal-post frame
and a pitched-roof frame. Further examination will consider its applicability to
localised heating of frames.
The results from these worked examples will be validated in the later sections.
7.2.1 Goal-Post Portal Frame - Entire Rafter Heated
A typical goal-post portal frame with pinned bases was set up as shown in Figure 7.1.
The loading has been simplified as point loads. For the given problem, there are only
two possible failure mechanisms at ambient temperature. When the entire rafter is
heated in fire, a similar mechanism is produced, in which fire hinges are positioned
at the rafters. The shapes of the failure modes, the "sway" and the "combined"
mechanisms, are shown in Figure 7.2.
141

Chapter 7: Development of Simplified Estimation of Critical Temperaturesfi)r Portal Frames in Fire
In the following calculations, the internal and external work done for cach
mechanism will be shown, in term of the reduction factor of the strength of steel at
elevated temperature, which is denoted as il.
Vertical Load, V
Horizontal -. - bý Loaci, H--pr
I
Heated Rafters
2L
T-, - --, -db- ,
Figure 7.1 Goal-Post Portal Frame with Rafters Heated
-k I
I
I
V///
Fire Hinge II
20 I
Figure 7.2 Failure Mechanisms - (Left) Combined Mechanism and (Right)
Sway Mechanism
I
I
-10.
I
I
I
W/I
Fire Hinge
----------- lp I: i re Hinge
I
FEN, ZUM, V/MI/INN/
Sway Mechanism
The external work done HLO
The internal work done i7M P (0 + 0)
where Mp is the plastic resistance moment of the rafter section at ambient
temperature, 17 is the strength reduction factor and 0 is the angle of rotation in
radians.
Equating the internal and external work and rearranging the equation,
Fire Hinoe
-I ? 20
V/1
142

Chapter 7 Development of Simplified Estimation of Critical Temperaturesfor Portal Frames in Fire
1= HL
2MP (7.2)
Cornhined Mechanism
The external work done = HLO + VLO
The internal work done = i7M p (20 + 20)
Equating internal and external work and rearranging the equation,
17 = (H + V)L (7.3)
I 4MP
By adopting some realistic numerical values, the limiting temperature of the frame
can be obtained:
If L--10m, H= lOkN and V= 30kN, and a section of 305xl65x4OUB Grade 43 is
used throughout, where Mp = 172kNm:
q=0.291 for the sway mechanism or
il = 0.581 for the combined mechanism.
Applying the concepts of plastic analysis, clearly the combined mechanism will be
the first failure mode. For the calculated reduction factor of 0.581, the limiting
temperature of the frame is 516'C. This is obtained from BS 5959 Pt 8 Table 1, in
which a 0.5% strain level is adopted. It is conservative to adopt this level of strain,
and the significance of adopting another strain level will be discussed later.
Using the same geometry and section but a different load pattern, in which H= IRN
and V=I OkN, results in:
0.436 for the sway mechanism or
0.363 for the combined mechanism.
In this case, the sway mode is the first failure mode, and this results
temperature of 575'C.
7.2.2 Goal-Post Portal Frame - Localised Heating Profile
in a critical
Considering a localised fire near to right-hand column of the portal frame, the right
eaves region now has the highest temperature, but the other parts of the frame will
143

Chapter 7. - Development of Simplified Estimation of Critical Temperaturesfor Portal Frames in Fire
stay relatively cool. As a result, a fire hinge will form near to the right eaves. In
order to create a failure mechanism the fourth hinge has to exist, and this will be a normal plastic hinge, assuming no significant loss of strength due to the localised fire. The failure once again employs the collapse mechanism shown in Figure 7.2. For the sway mechanism, one plastic hinge forms near to the left eaves and a fire
hinge forms near to the right eaves. In the case of a combined mechanism, the
plastic hinge will forrn near the mid-span of the rafter.
Using the same simplified approach:
Sway Mechanism
The external work done HLO
The internal work done i7MPO + MPO
Equating internal and external work and rearranging the equation,
17 = HL MP
Combined Mechanism
The external work done= HL 0+ VL 0
The internal work done = i7M p 20 +Mp 20
Equating internal and external work and rearranging the equation,
(H + V)L 2
77 M
2
(7.4)
(7.5)
Using the same frame geometry as in Section 7.2.1 with H=I OkN and V= 30kN:
q= -0.419 for sway mechanism or
q=0.163 for combined mechanism.
Since the sway mechanism produces a reduction factor of less than 0, this failure
mode will not exist. The combined mechanism gives a critical temperature of 720'C.
144

Chapter 7. Development of Simplified Estimation of Critical Temperaturesfor Portal Frames in Fire
7.2.3 Pitched-Roof Portal Frame - Entire Rafter Heated
In this section, the simplified method will be applied to determine the failure
temperatures for the common form of industrial pitched-roof portal frame with
pinned bases.
Under fire conditions the most common collapse mechanism for pitched-roof portal
frames has been found from previous parametric studies to be a rotational failure of
part of the roof section, which is also the usual failure mode under vertical roof load
at ambient temperature.
Considering a widespread fire which results in heating of the whole of a portal frame
the collapse mechanism is illustrated in Figure 7.3, with fire hinges forming at the
apex and eaves.
UDL on Rafter =w
Centre of Rotation.
.,; / II
10
.1 . 01 .//; %
Fire Hinge
I IP
L -L ýp
Figure 7.3 Failure mechanism and location of fire hinges - frame heated overall
The external work done weO
The internal work done Mp il(O +0+0+ 0)
where Mp is the plastic resistance moment of the rafter section at ambient
temperature, il is the reduction factor and 0=h, + 2h2 0.
h,
Equating internal and external work and rearranging the equation,
145

Chapter 7. - Development of Simplified Estimation of Critical Temperatures for Portal Frames in Fire
we
MP(3+ h, +2h2
h,
(7.6)
Using a portal frame of fairly practical dimensions, (h, = 7m, h2 =4m, L= 15m) and
loading, designed for ambient temperature limit states with dead, imposed and wind
loads, a realistic column section would be 533x2 I Ox92UB G43 and the rafter section
would be 457xl9lx89UB G43 without haunches. This is the same portal frame
previously designed for the parametric studies. An estimation of the vertical load at
the fire limit state using BS5950 partial safety factors would be 2.4kN/m.
Substituting these values into equation (7.6) gives il = 0.190, corresponding to a
BS5950 Pt8 failure temperature, at 0.5% strain, of 697'C.
A further check was performed to calculate the critical temperatures assuming other failure modes (i. e. the sway mechanism and the panel mechanism), and it was found
that the rotational mechanism is the first failure mode.
7.2.4 Pitched-Roof Portal Frame - Localised Heating Profile
Considering next a localised fire near to one of the portal frame columns, the eaves
region now has the highest temperature. The failure once again employs the
rotational collapse mechanism shown in Figure 7.3, with one plastic hinge forming
near to the apex and a fire hinge forming in the rafter near to the heated eaves. Using
the same simplified approach:
The external work done weO
The internal work done MP [0 + 770 + i7(o + 0)]
Equating the internal and external work as in the former example, the reduction
factor can be shown to be
77 =
we mp M
1+ h, +2h2
h, h1
(7.7)
146

Chapter 7. - Development of Simplified Estimation of Critical Temperaturesfor Portal Frames in Fire
Adopting the same portal frame parameter values as for the previous case, the
reduction factor value turns out to be negative. The significance of this will be
discussed in later sections. If a higher load level of 6kN/m is applied with the same
frame geometry, the calculated il value is 0.140 and the failure temperature is 7350C.
7.3 Validation of the Simplified Method
Although the concept behind the simplified method and its applicability are not
complicated, it is necessary to prove the validity of the technique. The portal frames
used in the worked examples are now set up and analysed with VULCAN so that the
results can be compared. More detailed validation has been performed on the
pitched-roof portal frame, including various load levels and geometries, since this
form of construction is the more common.
7.3.1 Goal-Post Portal Frame - Entire Rafters Heated
The individual goal-post portal frame used in Section 7.2.1 was set up and analysed,
and the results are compared against the results calculated by the simplified method.
Various load combinations have been analysed, and the cases are presented in Table
7.1.
Vertical Load (kN)
Horizontal Load (kN)
Simplified Method
Vulcan Analysis
Case 1 20 10 575'C 610*C
Case 2 30 10 516'C 555'C
Case 3 40 to 451'C 497C
Case 4 10 15 575'C 620'C
Table 7.1 Comparison of Critical Temperatures on Goal-Post Portal Frame - Entire Rafters Heated
Among these load combinations, Case 4 experiences a sway failure mode and the
others fail by the combined mechanism. It can be seen that the simplified method
produces conservative results compared to VULCAN. However the critical
temperatures given by BS5950 Pt8 are based on a strain level of 0.5%. When a
higher level of strain is adopted (i. e. 1% by interpolation and 1.5%) the calculated
147

Chapter 7. - Development of Simplified Estimation of Critical Temperaturesfor Portal Frames in Fire
results are much closer to the VULCAN analysis. These are summarised in Table
7.2.
Simplified Method, 0.5%
Strain
Simplified Method, 1.0%
Strain
Simplified Method, 1.5%
Strain
Vulcan Analysis
Case I 575C 5940C 6091C 6100C
Case 2 5160C 5400C 561 *C 555'C
Case 3 451'C 488'C 513*C 497'C
Case 4 575'C 594'C 6090C 6200C
Table 7.2
7.3.2 Goal-Post Portal Frame - Localised Heating Profile
A similar validation procedure has been conducted with the localised heating profile
on one of the eaves of the goal-post portal frame. The same portal frame and load
combinations were used, and the results are shown in Table 7.3.
Simplified Method, 0.5%
Strain
Simplified Method, 1.0%
Strain
Simplified Method, 1.5%
Strain
Vulcan Analysis
Case I 1055'C
Case 2 720'C 732'C 743'C 723'C
Case 3 568"C 588C 603"C 596"C
Case 4 OC
Negative reduction factor obtained which does not yield critical temperature.
Table 7.3 Comparison of Critical Temperatures on Goal-Post Portal Frame
Localised Heating Profile
Once again the results of Cases 2 and 3 compare well with the VULCAN analysis.
However, the calculations for Cases I and 4 produce negative results for the
reduction factors for both the sway and combined mechanisms. This indicates that,
even when the strength of the fire hinge drops to zero, this is not sufficient to
produce a failure mechanism. This will be discussed in detail later in Section 7.4.
148

Chapter 7 Development of Simplified Estimation of Critical Temperaturesfor Portal Frames in Fire
7.3.3 Pitched-Roof Portal Frame - Entire Rafters Heated
A series of VULCAN analyses were performed using the portal frame layout from
the worked examples in Section 7.2.3 (span 30m, column height 7m, eaves-to-apex height 4m), applying different load levels and obtaining the failure temperatures.
The load levels are presented in terms of their proportion of the failure load of the
frame at ambient temperature, known as the Load Ratio. The results are compared
against those calculated from the simplified approach in Table 7.4. Equation (7.6)
was adopted for the simplified approach calculation.
Load Ratio
Load (kN/m)
Simplified Method,
0.5%Strain
Simplified Method,
I. O%Strain
Simplified Method,
1.5%Strain
VULCAN Analysis
Case 5 0.1 1.21 778'C 794'C 818'C 803'C
Case 6 0.2 2.42 697'C 71PC 723*C 715'C
Case 7 0.3 3.62 642'C 656*C 669'C 664'C
Case 8 0.4 4.83 598T 615'C 629'C 620'C
Case 9 0.5 6.04 556'C 578'C 594*C 576T
Case 10 0.6 7.25 519'C 542T 563'C 532'C
Case 11 0.7 8.46 4760C 5070C 530'C 4890C
Case 12 0.8 9.60 421T 469'C 497'C 439'C
Table 7.4 Comparison of failure temperatures from VULCAN and simplified
approach - Pitched-Roof Frame with Entire Rafter Heated.
Once again it can be seen that the simplified approach compares well with the finite
element results. Further analyses were conducted to investigate the validity of the
proposed method with various frame geometries, changing the spans and heights.
The load has been maintained at a Load Ratio of 0.2. The cases and results are
summarised in Table 7.5.
It can be seen that the critical temperatures of the frames of different geometries fall
into the same region. This agrees with the finding from the previous parametric
studies, that portal frames with the same Load Ratio fail at similar temperatures, even
when the simplified approach is used. The simplified approach gives results close to
the VULCAN analysis, especially when the strength reduction is based on a strain
level of 1 . 0%.
149

Chapter 7 Development of Simplified Estimation of Critical Temperaturesfor Portal Frames in Fire
Span 2L (m)
Column Height hi (m)
Eaves to Apex h2 (m)
Simplified Method,
0.5% Strain
Simplified Method,
1.0% Strain
Simplified Method,
1.5% Strain
VULCAN Analysis
Case 13 20 7 4 708'C 721'C 7320C 7170C
Case 14 40 7 4 6980C 7120C 7240C 7110C
Case 15 60 7 4 6970C 7110C 7230C 700'C
Case 16 30 11 4 6920C 7040C 7170C 7060C
Case 17 30 15 4 6920C 703'C 7160C 703T
Case 18 8 4 0.8 691'C 703'C 7160C 7050C
Table 7.5 Comparison of failure temperatures from VULCAN and simplified
approach - Various Geometries.
Among all the cases in this section, the failure mechanism of the frame is the
rotational mode. It was recognised that sway failure rarely dominates in fire for
practical frames under realistic loading conditions. However, the simplified
approach can also be applied to predict a sway failure mechanism for pitched-roof
portal frames, by inserting the fire hinges near the two eaves. Consider the case
where a horizontal uniformly distributed load of 2.8kN/m is applied to each column
of a portal frame (similar frame geometry to that used in Table 7.4), but with no
vertical load. The horizontal load is a realistic wind load determined from BS6399
7.5 with the fire limit state load factors from BS5950 Pt8. This will force a sway
failure mechanism due to lack of the zero vertical load. The results are shown in
Table 7.6.
Horizontal Vertical Simplified Simplified Simplified VULCAN Load Load Method, Method, Method, Analysis
(kNIm) 0.5% Strain 1.0% Strain 1.5% Strain
Case 19 2.8 0 753 782 766 780'C
Table 7.6 Sway Mechanism for Pitched Roof Portal Frame.
7.3.4 Pitched-Roof Portal Frame - Localised Heating Profile
The final series of validations repeat the cases taken from Table 7.4 but with a
localised heating profile at one of the eaves. Equation (7.7) was applied for the
calculation using the simplified approach.
150

Chapter 7. - Development of Simplified Estimation of Critical Temperaturesfor Portal Frames in Fire
Load Ratio
Load (kN/m)
Simplified Method,
0.5% Strain
Simplified Method,
1.0% Strain
Simplified Method,
1.5% Strain
VULCAN Analysis
Case 5 0.1 1.21 Negative Negative Negative 1063'C
Case 6 0.2 2.42 Negative Negative Negative 860'C
Case 7 0.3 3.62 Negative Negative Negative 796'C
Case 8 0.4 4.83 Negative Negative Negative 749'C
Case 9 0.5 6.04 7341C 756'C 745'C 713*C
Case 10 0.6 7.25 635'C 661'C 648'C 650'C
Case 11 0.7 8.46 564'C 600'C 585'C 589'C
Case 12 0.8 9.60 502'C 5491C 527'C 526C
Table 7.7 Comparison of failure temperatures from VULCAN and simplified
approach - Pitched Roof Frame with Localised Heating Profile.
Similarly to the localised-heating cases from the goal-post portal frames, the lower
load levels give negative reduction factors. The other cases compare well with the
VULCAN analysis.
7.4 Discussion
It can be seen from the validation that the simplified approach generally produces
results close to the VULCAN analysis. It should be noted that the failure behaviour
predicted by VULCAN differs between one case and another. Figure 7.4 shows the
VULCAN predictions for the two different cases of the entire rafter heated and the
localised heating profile. It can be seen that the case where the entire rafter is heated
has a less sudden failure profile compared to the other case. As a result VULCAN
can follow the failure process up to high displacements.
The critical temperatures from VULCAN shown in all the validations within Section
7.3 are the final equilibrium points of the analysis, (i. e. Points 2 and 3 as shown in
Figure 7.1). However, the simplified method is based on a small-displacement
approach. This is likely to produce some discrepancies between failure temperatures
obtained from the two approaches.
151

Chapter T Development of Simplified Estimation of Critical Temperaturesfor Portal Frames in Fire
0
-200 ý
-400 d
-600 ý
-800 1
-1000 ý
-1200 Temp ('C)
500 600
Point 2
7 0
Point 3
Figure 7.4 Apex Vertical Displacement - Typical Failures Predicted by
VULCAN
7.4.1 Strain Level
According to BS5950 Pt8 "tiny non-composite inembers in bending which tire
unprotected, or protected with fire protection inaterials which have denionstrated
their ability to retnain intact, should not exceed a strain level of 1.5%. " It can be
seen from the validations that, if the reduction factors at 1.5% strain are adopted, the
results are always close to, or exceed, the temperatures predicted by VULCAN. If
the 0.5% strain level is considered, it always produces lower critical temperatures
compared to VULCAN. Therefore, it is reasonable to treat these as the upper and lower bounds of the critical temperatures.
Since there are other uncertainties within the frame and the fire conditions, it is
difficult to propose a single solution as a definitive failure temperature of the frame,
and the upper and lower bounds will provide the range for further comparisons.
7.4.2 Negative Reduction Factor
In some cases, especially for portal frames with localised heating profile and a low
level of loading, negative reduction factors were derived from the simplified
approach. This obviously does not lead to any critical temperature. In the localised
fire scenafio, after the formation of one fire hinge the low level of applied loading is
100 200 300 400
-Entire Rafter Heated
- Localised Heating Profile
152

Chapter 7. - Development of Simplified Estimation of Critical Temperaturesfor Portal Frames in Fire
not sufficient to cause the formation of a further, full-strength plastic hinge. A
failure mechanism cannot be achieved, even when the fire hinge strength drops to
zero. In such cases a VULCAN analysis continues until a much more localised hinge
pattern occurs causing run-away deformation.
In reality, it is not likely that a single spot within the frame will be heated up to a high temperature while the adjacent area remains unheated. It is reasonable to assess
the real fire hazard condition, to determine the next most likely position for the formation of fire hinges, and to calculate the critical temperature based on the new
mechanism. The simplified approach could be further developed to investigate this
specialised area. However, the usual worst case considered in practice will involve
the rafters being heated overall and the simplified approach is seen to be sufficient to
predict the critical temperatures.
7.4.3 Validity of the Concept of Fire Hinges
The typical pitched-roof frame with pinned bases requires two extra hinges to form a failure mechanism. For the rotational failure mode described to occur under fire
conditions, the two hinges will form near the apex and one of the eaves, and both of
these will be fire hinges in the case where the entire rafter is heated. If the concept of inserting fire hinges is valid, a different fire scenario, with only the locality of the
apex and one eaves connection heated, should produce a similar failure mechanism
and failure temperature identical to scenario where the entire rafter is heated.
These two heating scenarios were modelled on the same portal frame using VULCAN in order to verify this argument. The results of the analyses are shown in
Figure 7.5, in which the vertical displacements at the apex are plotted. The scenario
where the entire rafter is heated has a higher upward displacement before the snap-
through takes place, due to its greater expansion, and thus higher internal force.
However, the analyses show that both frames fail at the almost same temperature. In
other words, whether or not the central part of the individual rafter member is heated
has very little effect on the failure temperature.
153

Chapter T Development of Simplified Estimation of Critical Temperaturesfi)r Portal Frames in Fire
Temperature (OC)
Figure 7.5 Vertical Displacement at Apex
It can be concluded that, if the portal frames are heated locally at the critical points,
the failure temperature can be as low as in the worst fire case. If the critical points
are protected from heating, this will create a different failure mechanism and higher
critical temperature.
7.4.4 Practical Issues
While calculating the critical temperatures, the approach has ignored the use of
haunches at the eaves of the portal frame. Such frames should be capable of being
treated in the same way, but the position of one of the hinges is moved away from
the eaves to the haunch-end, both at ambient temperature and in the fire case.
if the failure temperatures shown in Table I are compared with the limiting
temperatures of isolated members given by Table 5 of BS5950 Pt8, it is seen that the
values for "members in bending not supporting a concrete slab" form a lower bound
to the critical temperatures of the portal frames in overall heating.
Although most practical portal frames are designed with pinned bases, the real base
connections and foundations actually provide some degree of rotational stiffness to
the column bases. Four holding-down bolts are normally used to secure such a base
to the foundation, and it is believed that this provides a certain amount of restraint
which enables portal frames to perform better in fire than their idealisation suggests.
154

Chapter 7. - Development of Simplified Estimation of Critical Temperatures for Portal Frames in Fire
VULCAN has also been used to study the effect of semi-rigid base connections, and it was found that critical temperatures of portal frames were increased significantly. This has not been considered in this proposed approach, but the current approach has
the advantage for design of giving more conservative results.
7.4.5 Benefits of the Simplified Approach
As has been mentioned, the practical Load Ratio of a typical portal frame at fire limit
state is normally approximately 0.2 or even less. Using the proposed simplified
approach, a practising engineer can estimate the critical temperatures of a particular frame. The critical temperature of such a frame is dominated by the load level, in
which case it is found to fail at a steel temperature in the region of 7000C.
if the portal frame is to be fire-protected, the thickness of the protection material
would normally be based on a critical temperature of 5500C. Knowing that the
critical temperature of the frame is actually around 7000C, the fire-protection
thickness can be reduced significantly. However, it is the fact that the portal frame
will only be required by regulation to achieve certain fire resistance when there is a boundary condition, and this requirement is usually 60 minutes 7.1
. The unprotected
steel temperature will be in excess of 9001C for 60 minutes exposure using the
Standard BS476 standard fire curve. Therefore, a structural fire engineering
approach is not likely to enable the total elimination of the fire protection
requirement.
7.5 Conclusion
An application of the normal principles of plastic analysis of portal frames has been
attempted here, with the variation that fire hinges, which have a reduced plastic
moment capacity, are introduced into the work-balance equation and the ultimate
goal is to estimate the critical steel temperature in fire. The calculated results have
been compared with VULCAN analyses, and the comparisons have shown that the
proposed method gives a reasonably good estimation of the failure temperatures,
particularly for the most usual and most critical fire scenario in which the frame is
heated overall.
In cases where a very localised part of a portal frame is subjected to fire the approach
has not predicted any failures at very low load levels. This is a relatively specialised
155

Chapter 7. - Development of Simplified Estimation of Critical Temperaturesfor Portal Frames in Fire
area, where the proposed approach could be further developed. However, for the
most usual fire case it provides a practical method of estimating critical steel
temperatures, and by further interpolation a method of estimating fire resistance
times in terms comparable to those used in design codes for isolated members.
The significance of the simplified approach has been discussed, and the approach
could potentially reduce the fire protection thickness required under the current
regulatory system.
156

Chapter 8. - Discussion
8 Discussion
The main purpose of this chapter is to present and discuss several issues in relation to
the behaviour of portal frames in fire, on which some investigation has been
conducted which has not been covered in the previous studies presented. These are
not directly in line with the studies of portal frame behaviour in fire but concem
other issues surrounding the topic. It is aimed firstly to review the main initial
purpose of the research project, and then to discuss the current guidance available for
designers.
One of the most significant recent developments in the use of fire engineering
approaches in design of buildings is to consider the concept of performance-based design. The latest EuroCode 63. includes the provision to assess realistic fire
temperatures likely to be encountered in a real building fire. This is known as the
Natural Fire Concept, and this section will discuss its implications for portal frame
structures.
8.1 Initial Research Objectives
The research project was supported by the Health and Safety Laboratories (HSL),
Buxton with the aim of investigating the behaviour of industrial warehouses in
response to internal fires of any size. HSL was particularly interested in the
structural behaviour and on how this affects the venting of smoke in the event of a
fire, especially on the occasions when highly toxic smoke is produced as a result of
the fire.
The research has been focused mainly on the behaviour of the main portal frames,
including the setting-up of experimental model and finite element analyses. It was
apparent that cladding behaviour in fire differs greatly from the main frame
behaviour, especially in the context of computer modelling. The detailed behaviour
of cladding cannot in fact be modelled by VULCAN, due to the beam-slab set-up of
the finite element program.
The cladding is very much, if not totally, dependent on its supporting purlins, and it
has been seen from the fire tests that the purlins are vulnerable in fire. The purlins
can buckle and twist in the early stages of a fire and this may result in the cladding
failing, or even falling off the building.
157

Chapter 8. - Discussion
Skylights are very often installed as part of industrial warehouse structures. The
skylight is normally made of PVC or a similar type of material which softens and
melts at relatively low temperatures, before any significant deformation of purlins
can take place.
It was evident from the parametric studies that, given the relatively low load levels at
the fire limit state, portal frames do not fail before the frame temperatures reach at least 6500C (see Figure 5.22). This includes the built-in assumption of pinned
column bases and could be rather conservative, even for the simple base connections
commonly adopted for portal frames. In the fire tests conducted at Buxton it was
quite difficult to create a collapse scenario for the portal frame model, and roof insulation had to be introduced in the final test to enable a high temperature to be
reached. It is almost certain that high ventilation will be available before any
structural collapse of main frames is seen. Similarly, any toxic smoke produced in a fully developed fire is unlikely to be contained within the warehouse structure
throughout the fire period.
The behaviour of purlins and cladding was briefly modelled within the 3-dimensional
parametric studies in Chapter 6. A mesh was created to represent the overall roof
structure, but distortion and failure of cladding can not be predicted. The
representation of cladding used was artificially assumed to be unheated to enable the
analyses to reach high temperatures. It seems likely that further investigations into
the precise behaviour of cladding will be complex because of a number of variables
which are unpredictable in nature, such as the fixings and the interlock of cladding of
various profiles under the influence of heating, in conjunction with applied load.
Much knowledge about portal frame behaviour was gained from the fire tests and
parametric studies. The common failure mode found throughout the research was
snap-through of the rafters. This has been very well predicted by the VULCAN
analyses, both in 2- and 3-dimensional parametric studies. However, the analyses
terminate immediately as the snap-through occurs. In the fire test conducted at
Buxton, in which snap-through was seen, the frame did not deflect further because
the additional loading barrels hanging from the rafters came into contact with the
ground and thus released the applied load. In future research it would be of interest
to track the deflection past the limit-point, although equilibrium paths then become
unstable. It is logical to predict that these will re-stabilise at higher deflection, and
158

Chapter 8., Discussion
this needs to be investigated if the problem of masonry wall collapse is to be properly investigated.
It has been assumed in industry that catenary action generated by the sagging rafters is sufficient to pull-in the portal frame columns, resulting in collapse of the entire
structure. This is the basic assumption within the SCI publication regarding portal frame behaviour in boundary conditions 9, which is commonly adopted throughout
the UK. Consequently further design consideration will have to be given to such behaviour.
However, the author has had numerous discussions with researchers and has scanned incident reports for the UK, as reported in "Fire Prevention" magazine, dating back
to 1990. There was little evidence from these searches that total collapse of an industrial portal frame, including column pull-in, is ever seen to happen. Qualitative
explanations can be given, and this subject will be discussed further in the following
sections.
With the studies conducted in this research programme it is possible to look into the
validity of the well-known SCI document mentioned above, and to relate this back to
the current UK Building Regulations requirements. The next section aims to review the document and discuss its implications.
8.2 Current Guidance Document
In order to prevent spread of flame from one building to another, it is required under the UK Building Regulations to design a fire-resisting fagade for buildings which are in "boundary conditions". These are defined as cases where the spatial separation is
insufficient to ensure that only low levels of radiation are received by the adjacent buildings. The fire-resisting fagade has to satisfy the requirements of insulation,
integrity and stability for the designated period of time.
Approved Document B: Fire Safey57 is used to interpret the fire safety requirements
of the Building Regulations 1991. For single-storey portal frame structures in
boundary conditions, it refers to the SCI publication9 for advice. The content of this
SCI publication has been mentioned previously in Section 1.3.1, in which a
simplified method has been described to calculate the base overturning moment in
fire conditions. Engineers either have to fire-protect the entire portal frame or to
159

Chapter 8: Discussion
design the foundation and base connections to resist such moments. The latter
solution is the more commonly adopted, and often results in much bigger foundations
being designed for portal frames in boundary conditions.
The simplified method has actually been derived from a basic mathematical model
which is also described in the SCI publication. The mathematical model assumed
that deformation of the portal frame in fire is symmetrical about the vertical line
through the apex, and takes into consideration the column movements, expansion and
the reduced moment capacity of the rafters. The assumed deflected shape is shown in
Figure 8.1, and this actually agrees with the deformation predicted by VULCAN in
the parametric studies.
I I
1 �I
I I I
Figure 8.1 Model for calculation of overturning moment
Using the same mathematical model, a spreadsheet can be created to calculate the
resulting overturning moment at the column bases. An investigation of the
relationships between the column rotation, rafter temperature and resultant
overturning moment has been conducted. The portal frame model designed for the
3-dimensional parametric studies has again been adopted for the investigation.
Assuming a constant rafter elongation of 2%, as suggested within the SCI guidance,
the resultant base overturning moment can be plotted against the amount of column
rotation at various rafter temperatures. The plot is shown in Figure 8.2 for a single-
bay portal frame without consideration of wind load. It can be seen that the
overturning moment reduces as the column rotates further. Similarly the overturning
moment is less for a reduced rafter temperature. A similar pattern of reduction of
moment can be found for all types of portal frames, including multi-bay frames and
cases where additional wind load is present.
160
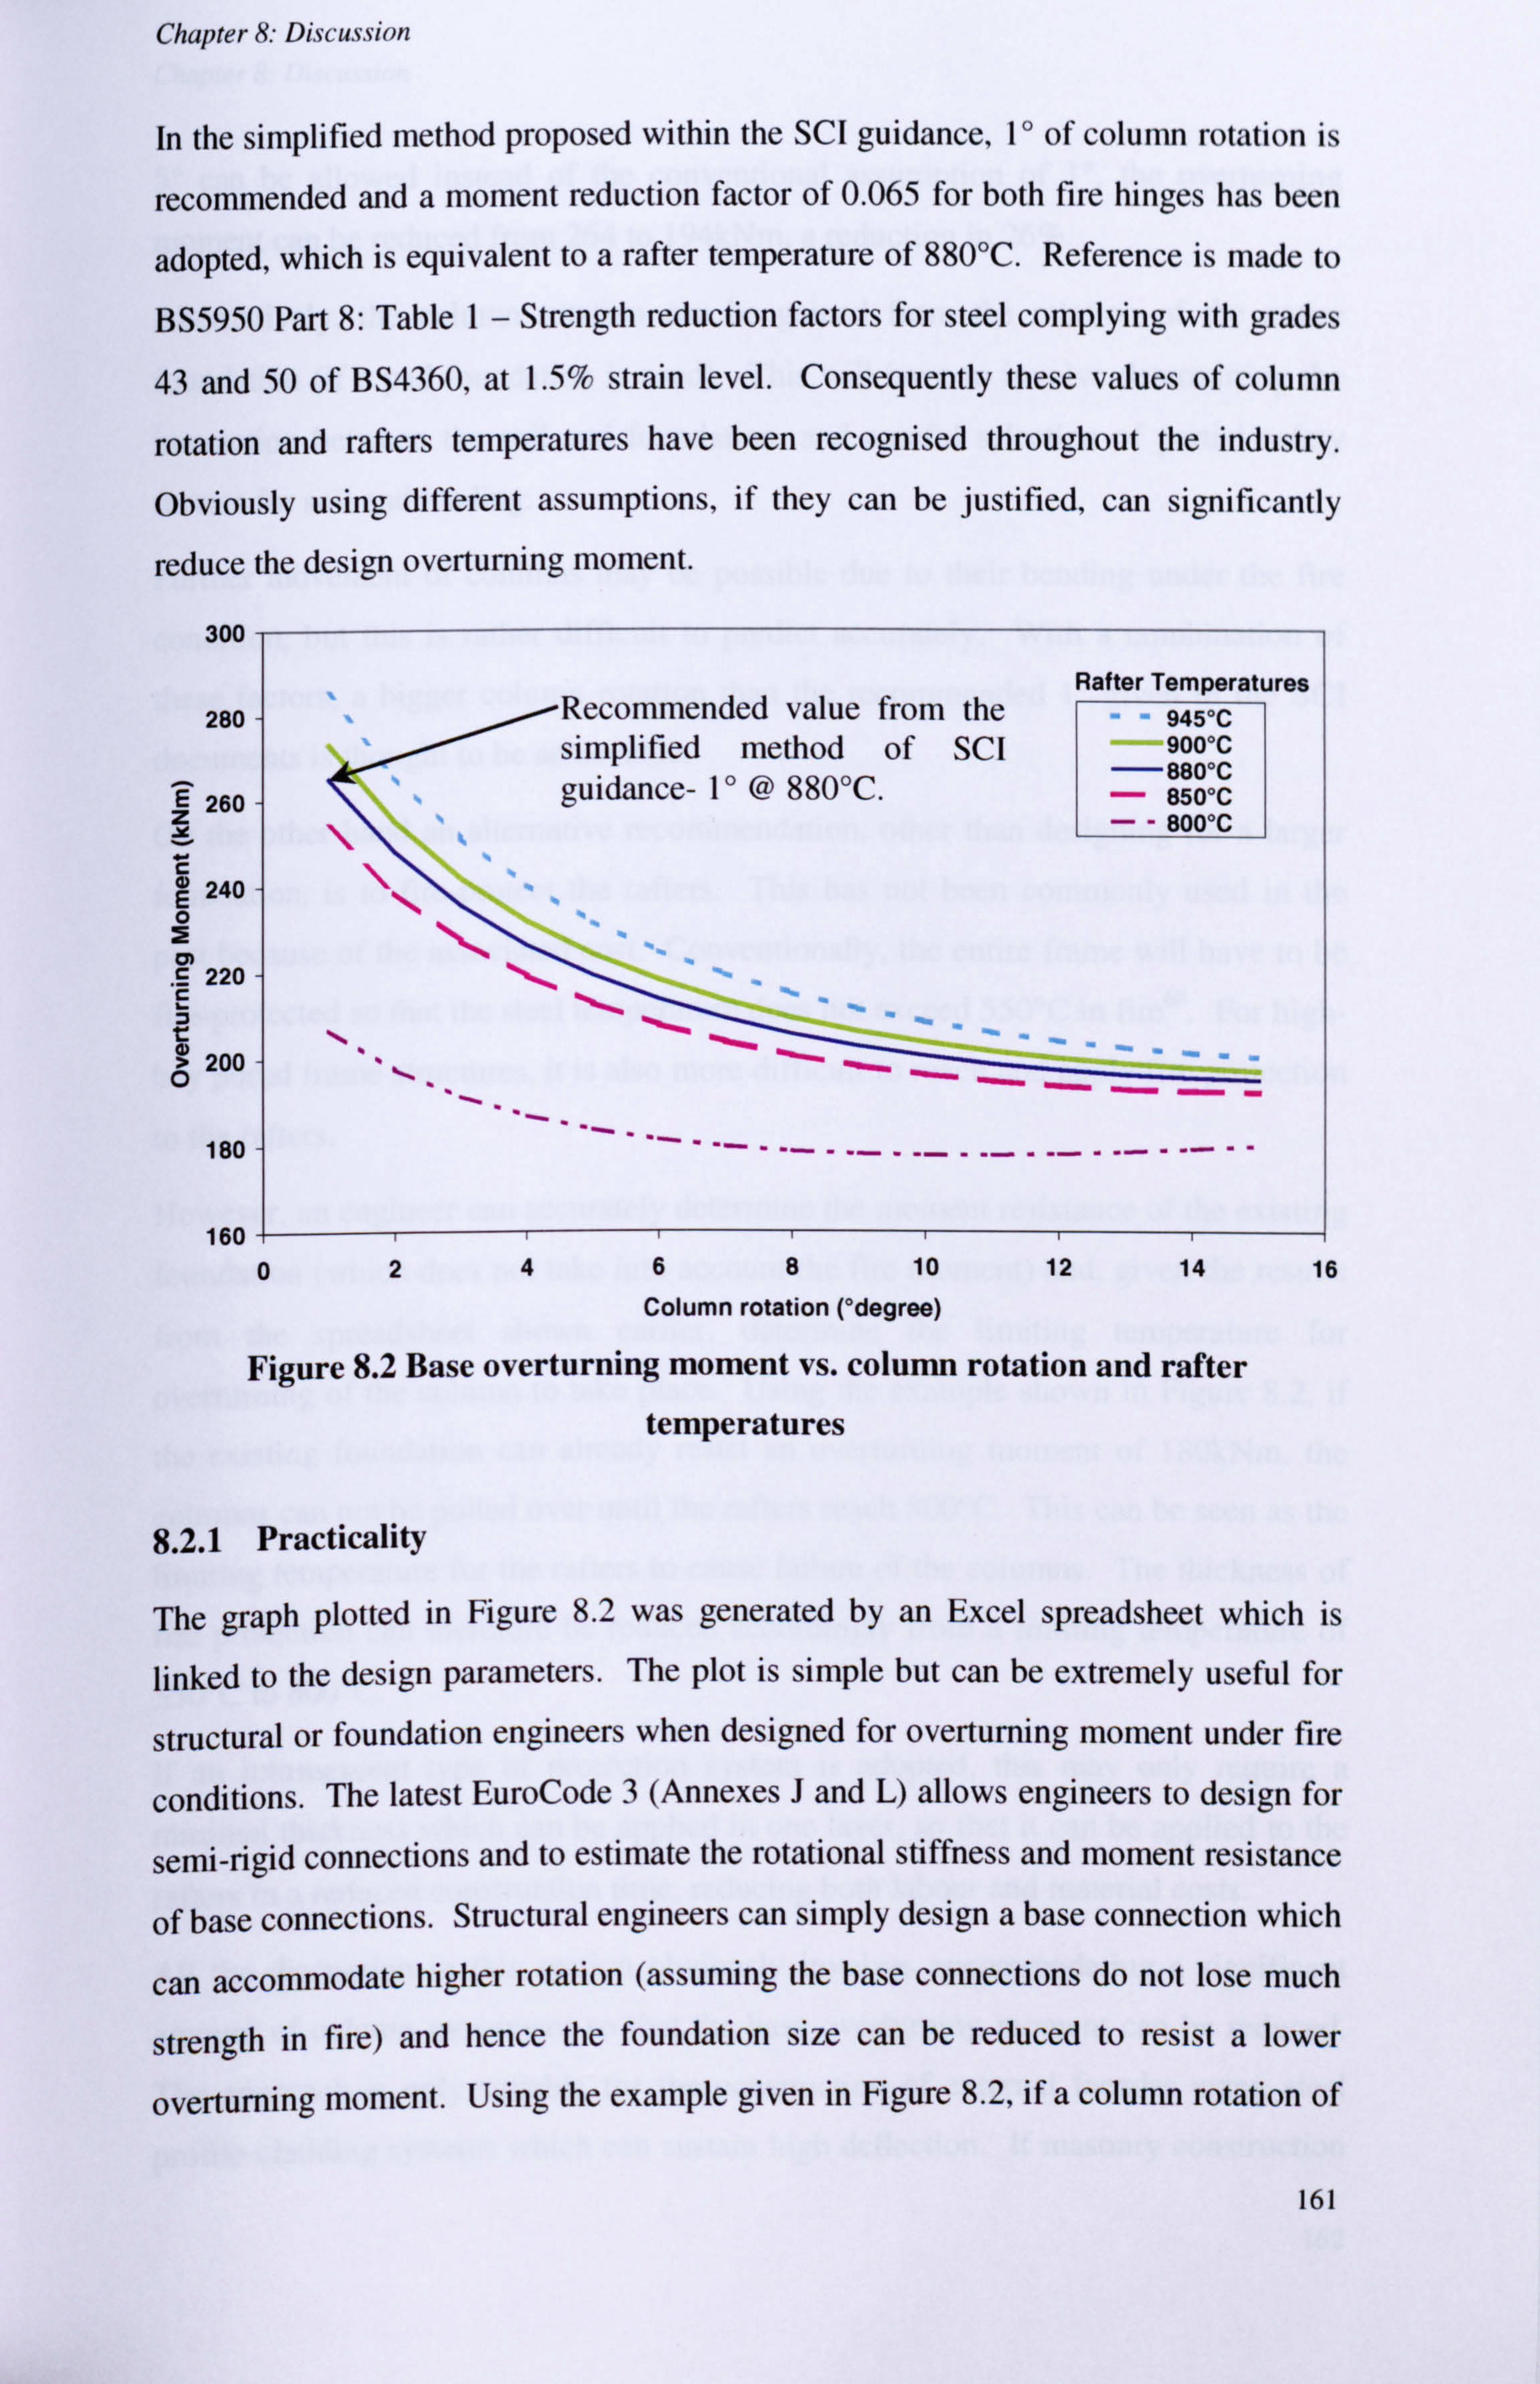
Chapter 8. - Discussion
in the simplified method proposed within the SCI guidance, I' of column rotation is
recommended and a moment reduction factor of 0.065 for both fire hinges has been
adopted, which is equivalent to a rafter temperature of 880'C. Reference is made to
BS5950 Part 8: Table I- Strength reduction factors for steel complying with grades
43 and 50 of BS4360, at 1.5% strain level. Consequently these values of column
rotation and rafters temperatures have been recognised throughout the industry.
Obviously using different assumptions, if they can be justified, can significantly
reduce the design overturning moment.
300 1
0 2 4
Recommended value from the simplified method of SCI guidance- V@ 880'C.
68 10 Column rotation (*degree)
Rafter Temperatures 945'C NOT NOT 850'C NOT
12 14
Figure 8.2 Base overturning moment vs. column rotation and rafter temperatures
8.2.1 Practicality
16
The graph plotted in Figure 8.2 was generated by an Excel spreadsheet which is
linked to the design parameters. The plot is simple but can be extremely useful for
structural or foundation engineers when designed for overturning moment under fire
conditions. The latest EuroCode 3 (Annexes J and L) allows engineers to design for
semi-rigid connections and to estimate the rotational stiffness and moment resistance
of base connections. Structural engineers can simply design a base connection which
can accommodate higher rotation (assuming the base connections do not lose much
strength in fire) and hence the foundation size can be reduced to resist a lower
overturning moment. Using the example given in Figure 8.2, if a column rotation of
161

Chapter 8. Discussion
50 can be allowed instead of the conventional assumption of 10, the overturning
moment can be reduced from 264 to 194kNm, a reduction in 26%.
Alternatively, the column rotation can be gained from the rotation of the entire
foundation (if a pad foundation is used). This will have to involve determining the
interaction between the soil and foundation, and careful selection of partial safety
factors for soil and loading.
Further movement of columns may be possible due to their bending under the fire
condition, but this is rather difficult to predict accurately. With a combination of
these factors, a bigger column rotation than the recommended P given in the SCI
documents is thought to be achievable.
On the other hand an alternative recommendation, other than designing for a larger
foundation, is to fire-protect the rafters. This has not been commonly used in the
past because of the associated cost. Conventionally, the entire frame will have to be
fi 68 fire-protected so that the steel temperature does not exceed 550'C in ire . For high-
bay portal frame structures, it is also more difficult to reach and apply fire protection
to the rafters.
However, an engineer can accurately determine the moment resistance of the existing foundation (which does not take into account the fire moment) and, given the results
from the spreadsheet shown earlier, determine the limiting temperature for
overturning of the column to take place. Using the example shown in Figure 8.2, if
the existing foundation can already resist an overturning moment of 180kNm, the
columns can not be pulled over until the rafters reach 800'C. This can be seen as the
limiting temperature for the rafters to cause failure of the columns. The thickness of
fire protection can therefore be reduced accordingly from a limiting temperature of
5500C to 8000C.
If an inturnescent type of protection system is adopted, this may only require a
minimal thickness which can be applied in one layer, so that it can be applied to the
rafters in a reduced construction time, reducing both labour and material costs.
All the discussion in this section obviously involves accommodating a significant
amount of column movement so that the base overturning moment can be reduced.
The approach is only suitable for the construction of external fagades using steel
profile cladding systems which can sustain high deflection. If masonry construction
162

Chapter 8. - Discussion
is used for the fagade, further consideration should be given to the stability of walls. This is complicated by the thermal behaviour of masonry walls and is not covered
within the scope of the present research.
The proposed approaches can however be validated with VULCAN analysis if the
finite element program can be improved to predict the post-snap-through phase of the
portal frame deflections.
8.2.2 Internal Fire Spread
The SCI guidance on portal frames in boundary conditions addresses the issue of fi external spread of flame. It is thought that consideration of internal ire spread,
which could be affected by portal frame behaviour, has somehow been overlooked. It is not unusual to construct a compartment wall within an industrial warehouse, to
separate different ownership or types of occupancy (e. g. inclusion of an office block
within a warehouse). Figure 8.3 shows some common systems for constructing
compartment walls.
Figure 8.3 Compartment walls - separation of different ownership (top) or types of occupancy (bottom)
163
Chapter 8. - Discussion
In these situations, the compartment walls will have to satisfy the same criteria of insulation, integrity and stability. Obviously if the rafters deflect excessively in the
vertical direction in fire conditions, the stability and integrity of walls can no longer
be maintained. The problem is often neglected, and simply enlarging the foundation
does not provide a solution.
A simple solution is to design the compartment wall to resist an extra point load.
This may not be easy when it comes to the assessing a realistic point load, and may
result in an unrealistically thick wall. Movement joints around the wall-to-rafter interaction is not possible because the vertical deflection could be massive when a
snap-through takes place.
Fire-protecting the rafters can be a possible solution, but again careful selection of a limiting temperature is necessary. Even with the conventional assumption of 550'C,
the rafters could have deflected significantly, both upwards during expansion and
downwards when they lose strength. Alternatively, it is possible to include
additional vertical props at the point of wall-to-rafter interaction to carry the
downward load from the rafter. Appropriate fire protection will have to be applied to
the props.
It seems that there is no easy design solution. More importantly this is a crucial issue
of which designers should be aware and take account.
8.3 Performance-based Design - Natural Fires
The concept of performance-based design for buildings under fire conditions has
been raised frequently both in academia and the construction industry, and this is
thought to be the future direction of fire engineering. Perfon-nance-based design will look at the real behaviour of structures under real fire conditions. This research has
already investigated the real structural behaviour of portal frames under fire
conditions, but real fire temperatures are rarely discussed.
When a prescriptive code specifies the requirement of fire resistance periods of the
order of 30,60,90 and 120 minutes, the gas temperatures are assumed uniform and
follow the furnace test temperatures which can be represented by the equation below.
The simple curve is known as the Standard Fire Curve from BS 476:
T= 20 + 345 log(8t + 1) (8.01)
164

Chapter 8. - Discussion
where,
T= Gas temperature in *C
t= Time in seconds
This Standard Fire Curve was specifically developed to represent fully-developed
room fires, and this may not represent a large warehouse fire. A typical industrial
warehouse will have a much higher ceiling and more free flow of internal air which
will produce fire temperatures very different from those in a small room fire.
A real fire, more commonly known as a natural fire, characteristic is mainly dependent on the following factors:
Fire load - amount and type.
Distribution of fire load.
Ventilation, e. g. size of windows etc.
Geometry of the structure - size and shape.
Thermal characteristics of the enclosure boundaries.
Other less important factors include the humidity of the atmosphere.
For an industrial warehouse, the fire load could range from medium to very high
density. Ventilation is even more difficult to predict. The opening of a skylight, if it
happens at an early stage, could introduce a large amount of ventilation, but
additional ventilation can be brought about by failure of roof cladding, which is less
easy to predict.
An approach to prediction of natural fire temperatures is available within EuroCode
163. The approach is only validated for relatively small compartment (i. e. a floor area
of500m 2 or less). It assumes that flashover takes place at the start of the calculation
and the entire compartment is a single temperature zone. An investigation of the
natural fire temperatures within a medium-sized industrial warehouse has been
conducted using the EuroCode I approach. Although the model is not validated for
such large compartment sizes, it is thought that it could provide indications of the
various influencing factors. The calculation procedure has been formulated into a
spreadsheet format for ease of use.
A compartment of 30m x 60m. x 9m height has been adopted, which can be
approximated to the 3-dimensional model set-up for the parametric studies.
165

Chapter 8. - Discussion
Ventilation of 10% and 20% of the floor area has been assumed in two separate
cases. In terms of fire load density, the draft British Standard DD240 provides
information for the storage purpose-group with a value of 18WMj/M2 , assuming an
80% fractile. An average fire load density for this purpose-group is 1180 Mj/1112.
This is considered a rather severe fire load as it is equivalent to 100kg of wood per
square metre. A reduced fire load Of 900Mj/M2 is considered in a separate
calculation. This is equivalent to the fire load level of a retail area, again assuming
an 80% fractile. The geometry of the structure and the material of the boundary
enclosures have been kept constant. The results of the calculations are plotted in
Figure 8.4.
1400 -- Natural Fire-1800MJ/m2-20% vent
Natural Fire-1 SOOMJ/m2-1 0% vent
0 60 mins
Time
90 mins
Figure 8.4 Natural fires vs. standard fire curve
30 mins 120 mins
it is worth mentioning that the natural fire scenario could well be very onerous
because it assumes that all the fire load is consumed simultaneously as soon as
sufficient ventilation is available. In reality, the fire will start locally and spread to
the entire warehouse. However, with such a massive floor area within the
warehouse, it is not impossible to have total bum-out in one localised area whilst the
fire is starting in another. Therefore it could be misleading to rule immediately that
natural fire temperatures are more severe than the standard fire curve.
In fact, the assumption of flashover within the entire warehouse is questionable.
Flashover often takes place in a small enclosure, but is rarely seen in a huge space.
166

Chapter 8. - Discussion
Flashover in a localised area within a warehouse is possible. With such intense local
heating, the roof cladding would fail and introduce extra ventilation and cooling to
the area. A more sophisticated natural fire model will be required for such
circumstances.
Despite all these provisions, the results for the natural fire calculation give a good indication of the effects of fire load and ventilation. With larger amounts of
ventilation available the fire would have grown faster and reached higher
temperatures. However, such a fire will bum out sooner and cool down quicker. With the same amount of ventilation a higher fire load density simply results in a longer and hotter fire.
The results shown are rather interesting if perfon-nance-based design is to be adopted. The 2-dimensional parametric studies suggest that the most common failure mode of
a portal frame under fire condition is the "combined" mechanism with the formation
of two fire hinges, one near to the apex and one near to the opposite eaves. In the
construction of typical portal frames for industrial warehouses, it is generally
economic to adopt a minimum span of 35-40m. This indicates the formation of two fire hinges which will be at least 17-20m apart.
One should question the probability of a series of portal frames being heated
uniformly across half the span to a high temperature. Any adjacent frames that are less intensely heated would no doubt provide additional strength to the vulnerable
ones and enable redistribution of loading. In fact, if a portal frame is to be heated to its failure temperature, the purlins and cladding are likely to have fallen off by this
stage, and the only load that the portal frame is likely to support is its self-weight.
This offers one qualitative explanation for the earlier situation where no total
collapse of the portal frame structure was seen. It is the author's opinion that
performance-based design, which includes a proper risk assessment, could lead to future solutions which disregard the possibility of portal frame rafters pulling over
the columns under fire conditions.
8.4 Conclusion
The previous studies have purely focused on the structural behaviour of portal frames
in fire. This discussion chapter offers a chance to divert attention to other areas of
167

Chapter 8., Discussion
consideration, and to enable the entire picture of "portal frames in fire" to be drawn.
One of the most important factors identified was the ventilation available in the event
of a fire.
Introduction of early ventilation to an industrial portal frame warehouse fire can lead
to diluted toxic smoke being released from a chemical fire. This was one of the main initial concerns for Health and Safety Laboratories. Besides, ventilation is the key
factor in allowing a faster bum-out and hence a more intense fire; this will also result in a faster rate of cooling within the fire compartment. With a large amount of
ventilation available, the rate of heating of the steel frames will be reduced and delay
the structural failure, if it is to take place.
Using the mathematical model described in the SCI guidance, it is found that
engineers can achieve a more economical design for portal frames with boundary
conditions, compared to simply following the guidance's recommendation. There is
however the issue of internal compartment walls which should be noted in design.
The concept of performance-based design has been discussed with the main
emphasis on natural fire calculations. This leads to consideration of risk assessment
(i. e. the probability for a total collapse of the portal frame structure to occur). The
main aims have been to provide some possible directions for future development of
the design of portal frames in boundary conditions.
168

Chapter 9: Conclusion
9 Conclusions
This research on portal frame behaviour in fire has been based on two main
foundations: the fire tests at Buxton and parametric studies using the finite element
program VULCAN. Subsequent development of the simplified calculation method
and other discussions have been elaborated and built from these grounds. This
chapter outlines the main conclusions drawn from the work and gives
recommendations for further research.
9.1 Fire Tests
A scaled model portal frame was designed and built at Buxton, for which the designated load level was made equivalent to a typical industrial frame at the fire limit state. Three major fire tests were conducted 'on the scale model. Several indicative tests on isolated cladding panels were conducted prior to these tests in
order to investigate test method and to establish correct use of instrumentation.
in the first two tests, the rafters were not heated to their collapse temperature. The
main reasons were the relatively large amount of ventilation which kept the steel
cool, and a lack of insulation to the roof sheeting. Lateral deformation was the most
obvious deformation observed after these tests. Significant measures were taken in
the third test, including insulating the roof of the model, in order to enable a collapse
mechanism to take place as a final stage in the testing programme. The heated frame
collapsed completely in this test, and a failure mechanism was formed.
Considerable understanding was gained from the post-fire investigations on the
deformed structure. The secondary elements, especially the Z-purlins which are used
to support the cladding, were initially thought to be weak, and deformed at an early
stage of any significant fire. In the third test, however, the purlins showed some
strength, in providing additional support to the heated rafters by acting in tension,
and also enabling some load to be distributed to the adjacent cool frames. This effect
was further demonstrated later in the three-dimensional parametric studies.
In all the fire tests, lateral deformation was observed in the rafters, in which a double
curvature was formed. This was again influenced by the restraint provided by the
purlins, and the curvature was markedly larger in the bottom flanges of the rafters
than in the top flanges, which were more directly restrained by the attached purlins. 169

Chapter 9. - Conclusion
Thus, it seems that lateral buckling failure of rafters under fire conditions can be
prevented by providing sufficient purlin restraints. Design checks can be made by
assuming the purlin-spacing as the effective length for minor-axis buckling to occur,
and the relative moment capacity of rafters can be calculated using the reduced
strength at designated temperatures.
The other significant observation from the fire tests was the typical collapse
mechanism of the portal frames. In the third test, the rotational stiffness of the
column base was set at an insignificant level, so that a pinned base could safely be
assumed. The collapse mode of the portal frame was found to be a combined
mechanism, similar to the failure mechanism at ambient temperature. This was
predicted by the VULCAN analysis, in which plastic hinges forming at high
temperature could be seen clearly, as well as from the deformed structure after the
test.
One of the main benefits of conducting real fire tests is that the data can be used to
calibrate the numerical results from computer modelling. With the steel
temperatures and displacements recorded during the tests, the numerical data was
compared against VULCAN analyses. It was found that VULCAN results compared
relatively well with the experimental data, especially for the third test where the
uncertainty about the column base stiffnesses had been eliminated. These
comparisons led to increased confidence in the use of VULCAN analysis in
modelling portal frame behaviour at elevated temperature. The subsequent part of the research relies heavily on the use of VULCAN to enable the proposed parametric
studies to be conducted, as well as in establishing the simple calculation method
presented in Chapter 7 for the prediction of portal frame failure temperatures in fire.
9.2 Parametric Studies
Initial studies were conducted to investigate the suitability of VULCAN analysis for
modelling portal frame performance in fire. A major effort was made to ensure that
the program could handle sloping members, to represent the inclined rafters of
typical portal frame warehouses.
The parametric studies were conducted in two separate stages, composed of two- and
three-dimensional analyses. The two-dimensional numerical model is relatively
170

Chapter 9: Conclusion
small, with less nodes and elements, and therefore a large number of analyses can be
conducted relatively quickly. A variety of influencing factors could therefore be
considered within the two-dimensional parametric studies, such as the load ratio, frame geometry, heating profiles, effect of horizontal load and base rotational
stiffness.
With the inclusion of secondary members in the three-dimensional modelling, each
model was significantly larger and each analysis was longer. The analysis can easily be subject to instability due to the very small section sizes used for the representation
of purlins and cladding elements. Therefore only a limited number of analyses were
conducted, and the main investigation concerned the effects of different fire
scenarios.
From the two-dimensional analyses it was found that a considerable majority of the failure modes induced under fire condition involved a combined mechanism. Sway
failure was only found in a series of analyses where the horizontal forces were dominant, with pinned bases assumed for the columns. The separate probabilities of the occurrence of fire and high wind, and the much lower probability of a
simultaneous occurrence of both, make such a case extremely unlikely. In more usual cases the combined mechanism will occur, regardless of vertical load levels
and frame geometries.
In order to mobilise the combined mechanism under fire conditions, two fire hinges
(plastic hinges with reduced moment capacity due to elevated temperature) are
required to form, near to the apex and eaves respectively. Once this has taken place
as the portal frame continues to heat up, the snap-through phenomenon will take
place and an additional fire hinge will form near to the other eaves. VULCAN
analysis terminates as soon as the snap-through occurs, since the apex deflects
downwards rapidly with a stiffness which becomes negative, and the solution
procedure can no longer handle such a response.
The dominant factor which influences the critical temperature at which snap-through
takes place is the load ratio of the rafters. Frames with various geometries were
found to have similar failure temperatures under the same load levels. In fact, the
limiting temperatures given in BS5950 Part 8 can be utilised as a reference for the
upper and lower bound of failure temperatures for portal frames, assuming that the
171

Chapter 9: Conclusion
entire rafter is heated up uniformly. This fire scenario was found to be the most
onerous heating profile. The heating of columns seems to have negligible effect on
the failure temperature. A local fire always causes the frame to fail at a higher
temperature, especially for a fire which only affects the mid-section of a rafter (i. e. the quarter-point of the entire span) or the region near to the apex.
The effect of rotational stiffness at the column bases is always a debatable issue.
Firstly, when a portal frame is designed to have pinned bases at ambient temperature,
the actual "pinned" connection often comprises four holding down bolts securing the
base plate to the concrete foundation. Such a connection detail was found to behave
more as a semi-rigid connection, with significant rotational stiffness, rather than as a
pinned connection. If the base connections of a portal frame remain relatively cool in fire, this will improve the failure temperature of the frame by up to 20% for cases
similar to those analysed within this research, depending on load levels and the
actual stiffnesses of the bases. However, it is normal practice to account for a worst-
case fire scenario, which often assumes that the connections are heated. Obviously
the rotational stiffness will reduce as the temperature of the connection increases. It
is questionable whether the base connections will be heated to the same temperature
as the rafters under any fire conditions, and logic suggests that they will actually
remain much cooler. VULCAN was subsequently developed to account for the
reduction of connection rotational stifffiess at elevated temperature in accordance
with the strength and stiffness reduction factors from EC3. This is described in
Chapter 2.
While setting up the three-dimensional model for the parametric studies, the
secondary roof elements were simulated with a mesh. The mesh was found to give
an acceptable representation of the purlins and roof cladding. However it cannot
represent any failure that is likely to occur, since local effects are not modelled
within VULCAN.
The benefits of having adjacent cool frames were again demonstrated in the analyses, in which the purlins acted in tension to hold up the highly deformed rafters. The
plots of internal forces within the mesh give further evidence for this argument.
However, if the worst fire scenario is assumed, in which the entire roof and all rafters
are heated uniformly to high temperature, the portal frame deflections and failure
172

Chapter 9: Conclusion
temperature are similar to the results from a two-dimensional analysis. In other
words, a two-dimensional analysis is probably sufficient for fires which engulf the
whole building. However, it is rather unlikely that a large portal frame warehouse will experience flashover throughout the entire compartment, and thus cause all the
rafters to heat up to the same temperature. It is beyond the scope of this research to investigate such issues, but it is part of the essential risk analysis which should eventually inform performance-based design codes for such structures.
9.3 Further Investigation
A simplified method has been developed to estimate the critical temperatures of
portal frames in fire, based on Plastic Theory and the insertion of fire hinges into the
frame. The results from the simplified method have been compared against the two-
dimensional VULCAN analysis and a good correlation was achieved. A lower-
bound solution can be calculated using an appropriate strain level. However, the
method sometimes does not produce an immediate result if a localised fire with low
load ratio is considered, and only one fire hinge is assumed. A different failure
mechanism has to be explored by inserting plastic or fire hinges at various positions. The process may have to be repeated many times before finding a true solution. The
simplified method can be useful for determining the limiting temperatures of portal frames, and can lead to a reduced fire protection requirement.
An attempt has been made to review the current guidance document for portal frames
in boundary conditions. The relationship between column rotation and overturning
moment was explored. Using design combinations of appropriate connection details
and frame limiting temperatures, the required measures to prevent total collapse of a
portal frame in fire could be reduced.
The significance of a real fire which occurs in a large portal frame warehouse was
also discussed. The high amount of ventilation which is usually present becomes a
very important factor, having effects on both steel temperatures and the movement of toxic smoke in the event of a fire. The behaviour of the secondary elements,
particularly cladding, in fire plays an important role in deciding how much
ventilation can be available.
173

Chapter 9: Conclusion
Performance-based design is becoming a global concept based on real (natural) fire
temperatures and structural response under such temperatures, incorporating a certain degree of risk assessment in generating partial safety factors. A real fire analysis
may be able to prove that flashover within the entire warehouse compartment is
unlikely, and therefore that some frames will remain cooler and provide the
additional support required to those in the immediate vicinity of the fire. With an
appropriate risk assessment, it is the author's opinion that such an approach can lead
to removal of the current measures required for portal frames in boundary conditions in the fire limit state.
9.4 Recommendations for Further Work
As a result of the work conducted during this project, there are several areas in which further research could lead to better understanding of the total structural response for
pitchcd-roof portal frames in fire.
The fire tests and numerical modelling of pitched-roof portal frames were both
terminated as soon as the snap-through of rafters took place. This is regarded as a
major structural failure and is usually the end-point for most structural analysis. However there is a possibility that portal frame can reach a second equilibrium state after snap-through and that total collapse may not occur. If such behaviour can be
proven, or even designed for, a huge saving could result from the omission of fire
protection or large foundations. Further development of VULCAN to predict such behaviour is essential, so that parametric studies can be conducted for various types
of frame. This may be possible by providing alternative solution procedures such as the Arc-Length Method, which are formulated to follow equilibrium paths through
regions of transient instability. Further testing of portal frames to include heating of
all frames to the post-snap-through phase will be beneficial for investigation and
validation of such upgrades to the program.
The assumption of pinned column bases is always conservative for portal frame
structures. Further understanding of the overall issue of base response characteristics
can replace the current conservatism, without losing any advantages to the portal frame behaviour in fire. Such studies should include investigation of the interaction
between the soil and the foundation, as well as the thermal response (i. e. the likely
174

Chapter 9: Conclusion
maximum temperature reached) of the base connection in a warehouse fire, and the
thermal degradation of the connection characteristics.
Further investigation on the behaviour of secondary members such as purlins and
cladding at elevated temperature are not possible using VULCAN, unless a way can be found of accounting for local effects such as flange and web buckling. The
prediction of local effects could also lead to investigation of the interaction between
columns and the wall cladding. Columns are required by the Building Regulations to
be protected if they are supporting the fire-resisting cladding. Local failures within
columns will undoubtedly jeopardise the integrity of the cladding which they
support.
Finally, it is necessary to take advantage of the global development of performance- based design, which often leads to the use of less onerous but more realistic fire
conditions. Structural behaviour has to be integrated within this approach to attain
the maximum benefits for an overall scheme.
9.5 Concluding Remarks
This research provides a comprehensive overview of pitched-roof portal frame
behaviour in fire, for which relatively little research has previously been carried out. The research has investigated a number of factors which affect the structural
response, and has suggested alternative approaches to improve its performance. Further research is necessary to provide better understanding and further benefits.
The finite element program VULCAN has proved to be a powerful tool for
modelling structural response at elevated temperatures. Such tools enable deeper
investigations than are possible using prescriptive or codified methods, and reduce
the need for conducting physical experiments. Further use of the program can
undoubtedly provide a valuable contribution to future research on the performance of
structures in fire, and in the development of more rational design processes.
175

References
Reference
1. Fire Prevention No. 180, "Roofing Fire Leads to Multi-million warehouse loss",
(June 1985).
2. Fire Prevention No. 181, "Toxic Chemicals Involved in Huge Warehouse Blaze",
(July/August 1985).
3. Fire Prevention No. 182, "Huge Loss in Computer Warehouse Blaze",
(September 1985).
4. Fire Prevention 252, "Serious Fires in Warehouses and Storage Premises during
1991", 'TPA case book of fires - Warehouse (page 46-54)", (September 1992).
5. Fire Prevention 265, "Casebook of Fires (page 34-40)", (December 1993).
6. Fire Prevention 279, "Warehouse (page 40-45)", (May 1995).
7. Fire Prevention 296, "Warehouse Blaze Destroys 15 House", (January/February
1997).
8. Department of the Environment and Welsh Office, "The Building Regulations
1991, Approved Document B: Fire Safety", (1992).
9. Newman, G. M., "Fire and steel construction: The Behaviour of Steel Portal
Frames in Boundary Conditions", The Steel Construction Institute, (1990).
10. Eurofer, "Steel and Fire Safety -A global approach", (1990).
11. British Standards Institution, "DD 240: Part 1, Code of Practise for the Application of Fire Safety Engineering Principles to Fire Safety in Buildings", (1997).
12. O'meagher, A. J.; Bennetts, I. D.; Dayawansa, P. H. & Thomas, I. R., "Design of 8Single Storey Industrial Buildings for Fire Resistnaces", Journal of the Australian Institute of Steel Construction, Vol 26, Number 2, May 1992.
13. British Standards Institution, "BS5950: Structural Use of Steelwork in Building,
Part 8: Code of Practice for Fire Resistant Design7', BSI, (1990).
14. British Standards Institution, "BS5950: Structural Use of Steelwork in Building,
Part 1: Code of Practice for Design in Simple and Continuous Construction",
BSI, (1992).
176

References
15. EuroCode 3, "Design of Steel Structures: Part 1.2 : General rules, Structural fire
design7', (1995).
16. Ramberg, W. & Osgood W., "Description of Stress-Strain Curves by Three
Parameters", National Advisory Committee for Aeronautics, Technical Note 902,
(1942)
17. Kirby, B. R., and Preston, R. R., "High Temperature Properties of Hot-rolled
Structural Steel for use in Fire Engineering Design Studies", Fire Safety Journal,
13, (1988), pp27-37.
18. Witterveen, J.; Twilt, L. & Bijlaard, F. S. K, "Theoretical and Experimental Analysis of Steel Structures at Elevated Temperatures", IABSE, 1 Oth Congress, Tokyo, Final Report, Zurich.
19. Najjar, S. R., "Three-Dimensional Anaysis of Steel Frames and Subframe in Fire", PhD Thesis, University of Sheffield, (1994)
20. Home, M. R. & Morris, L. J., "Plastic Design of Low-rise Frames", Granada
Publishing Limited, (1981)
21. Morris, L. J. & Plum, D. R., "Structural Steelwork Design to BS 5950", Longman
Scientific & Technical, (1988).
22. Nethercot, D. A., "Limit States Design of Structural Steelwork", Chapman &
Hall, (199 1).
23. Hockey, S. M.; Camp, P. I. & Deaves, D. M., "Behaviour of Warehouse Roofs in
Fire Situations PhaseI", WS Atkins Safety and Reliability, (1996).
24. Heyman, J., "Plastic Design of Structures, Vols. I& 2", Cambridge University
Press, (1969).
25. The Steel Construction Institute, "Steel Designers' Manual", Blackwell Science,
Fifth edition, (1994)
26. Hibbit, Karlsson and Sorensen Inc., "ABAQUS Finite Element Analysis
Programme", (1988).
27. Hibbitt, Karlsson and Sorensen, Inc., "ABAQUS manual. - Theory manual. - Version 4.8. ", (1989).
177

References
28. El-Zanaty, M. H.; Murrray D. W. & Bjorhovde, R., "Inelastic Behaviour of
Multistorey Steel Frames", PhD Thesis, Department of Civil Engineering,
University of Alberta, (1980).
29. EI-Rimawi, J. A., "The Behaviour of Flexural Members under Fire Conditions",
PhD Thesis, University of Sheffield, (1989).
30. Saab, H. A., "Non-Linear Finite Element Analysis of Steel Frames in Fire
Conditions", PhD Thesis, (1990).
3 1. Bailey, C. G., "Simulation of the Structural Behaviour of Steel-framed Buildings
in Fire", PhD Thesis, University of Sheffield, (1995).
32. Shepherd, P., "The performance in Fire of Restrained Columns in Steel-Frame
Construction", PhD Thesis, University of Sheffield, (1999).
33. Huang, Z., Burgess, I. W. & Plank, R. J., "Layered slab elements in the modelling
of composite frame behaviour in fire", Second International Conference on Concrete Under Severe Conditions, Troms6, (1998), pp785-794.
34. Huang, Z.., Burgess, I. W. & Plank, R. J., "Non-linear analysis of reinforced
concrete slabs subject to fire", A. C. I. Structural J., 96 (1), (1999), ppl27-135.
35. Huang, Z., Burgess, I. W. and Plank, R. J., 'The Influence of Shear Connectors on
the Behaviour of Composite Steel-Framed Buildings in Fire', J. Construct. Steel
Research, 51 (3), (1999) pp219-237.
36. Huang, Z., Burgess, I. W. and Plank, R. J., 'Effective Stiffness Modelling of Composite Concrete Slabs in Fire', Research Report DCSE/99/F/l, University of
Sheffield, (1999).
37. Allam, A. M., Green, M. G., Burgess, I. W. & Plank, R. J., "Fire engineering design
of steel framed structures - Integration of design and research", Second World
Conference on Structural Steel Design, San Sebastian, J Const. Steel Research,
46 (1-3), (1998), Paper No. 170.
38. Fahad, M. K., Allam, A. M., Liu, T. C. H., Burgess, I. W. and Plank, R. J., 'Effects
of Restraint on the Behaviour of Steel Frames in Fire', Paper 64, Eurosteel 99,
Prague.
178

References
39. Cai, J, Burgess, I. W. & Plank, R. J., "VULCAN Formulation for Asymmetric
Cross-section Beams", Research Report DCSE/99/F/2, University of Sheffield,
(1999).
40. Al Jabri, K., Lennon, T., Burgess, I. W. & Plank, R. J., "The behaviour of steel
and composite beam-column connections in fire", Second World Conference on Structural Steel Design, San Sebastian, J. Const. Steel Research, 46 (1-3), (1998),
Paper No. 180.
41. Al Jabri, K., Burgess, I. W., Lennon, T. & Plank, R. J., "The Performance of Frame Connections in Fire", Acta Polytechnica-Eurosteel '99, Vol. 39, No. 5, pp 65-76, (1999).
42. Bathe, K., "Finite Element Procedures in Engineering Analysis", Prenticeýflall
Inc., (1982).
43. Shepherd, P., "Appendix B ShowGrid Graphical Interface", PhD Thesis,
University of Sheffield, (1999)
44. Leston-Jones, L. C, "The Influence of Semi-Rigid Connections on the Performance of Steel Framed Structures in Fire", PhD Thesis, University of Sheffield, (1997)
45. Leston-Jones, L. C., Burgess, I. W., Lennon, T, Plank, R. J., "Elevated-temperature Moment-Rotation Tests on Steelwork Connections", Proc Instn Civ. Engrs Structs & Bldgs, 122, (1997) pp 410-419.
46. AI-Jabri, K, "The Behaviour of Steel and Composite Beam-to-column
Connections in Fire", PhD Thesis, University of Sheffield, (2000)
47. Lawson, R. M., "Behaviour of Steel Beam-to-column connections in fire. ", The
Structural Engineer, 1990,68 (14), pp. 263-271
48. Lawson, R. M., "Enhancement of Fire Resistance of Beams by Beam to Column
Connections", Technical Report, SCI Publication 086, (1990)
49. Crisfield, M. A., "Iterative Solution Procedures for Linear and Non-linear
Structural Analysis", Transport and Road Research Laboratory Report 900,
(1979)
179

References
50. Crisfield, M. A., "A Fast Incremental/Iterative Solution Procedure that Handles
'Snap-Through"', Computer & Structures, 13, (1981), pp55-62
5 1. Crisfield, M. A., "Variable Step Length for Non-linear Structural Analysis",
Transport and Road Research Laboratory Report 1049, (1979)
52. Wickstrom, U., "TASEF-2 -A Computer Program for Temperature Analysis of Structures, Exposed to Fire", Report No. 79-2, Department of Structural
Mechanics, Lund Institute of Technology, (1989)
53. Becker, J, Bizri, H. and Bresler, B., "FIRES-T -A Computer Program for the
Fire Response of Structures-Thermal", Report No. UCB FRG 71-1, Fire
Research Group, Structural Mechanics Department of Civil Engineering,
University of California, Berkeley, (1974)
54. Franssen J-M, Cadorin J-F, "Competitive steel buildings through natural fire
safety concept: Part 2- Work Group 1: Natural Fire Models", Profil Arbed
Centre de Recherches, (March 1999)
55. Twilt, L., Van Oerle, J., " Competitive steel buildings through natural fire safety
concept: Part 3- Work Group 3: Fire Characteristics for Use in a Natural Fire
Design of Building Structures" Profil Arbed Centre de Recherches, (March 1999)
56. Fontana, M., Fetz, C., "Competitive steel buildings through natural fire safety
concept: Part 4- Work Group 4: Statistic", Profil Arbed Centre de Recherches,
(March 1999)
57. The Building Regulations 1991, Approved Document B, "Fire Safety",
Department of the Environment, Transport and the Regions, (2000).
58. Wald, F., "Column Bases", Czech Technical University, (1995).
59. Wald, F. and Jaspart, J., "Stiffness Design of Column Bases", Journal of Constructional Steel Research, 46: 1-3, Paper 135, (1998).
60. ErmoPoulos, I and Stamatopoulos N., "Mathematical Modelling of Column Base
Plate Connections", Journal of Constructional Steel Research, Vol 36 No. 2, pp 79-100, (1996).
61. Jaspart, J. and Vandegans, D., "Application of the Component Method to
Column Bases", Journal of Constructional Steel Research 48, pp 89-106, (1998).
180

References
62. Home, M. R., "Plastic Theory of Structures", Pergamon Press Ltd., (1979).
63. Eurocode 1: "Basis of Design and Actions on Structures. Part 2.2: Actions on Structures Exposed to Fire", CEN, Brussels, (1993).
64. ISO 834, "Fire Resistance Tests - Elements of Building Construction7,
International Organisation for Standardisation, (1985).
65. British Standard Institute, "BS 6399: Loading for Buildings, Part 2: Code of Practice for Wind Loads", BSI , (1997).
66. Wong, S. Y., Burgess, I., Plank R. and Atkinson, G., "The Response of Industrial
Portal Frame Structures to Fire", Acta Polytechnica, Vol. 39, No. 5 (1999),
ppl69-181.
67. Wong, S. Y., Burgess, I. and Plank R., "Simplified Estimation of Critical
Temperatures of Portal frames in Fire", Paper 09.03, Steel Structures of the
2000's, (2000).
68. Association of Specialist Fire Protection Contractors and Manufacturers Limited
(ASFPCM); "Fire Protection for Structural Steel in Buildings"; 2d Edition - Revised; (1992)
181