department of biochemistry faculty of biological sciences ...
182
BIOACCUMULATION AND RISK ASSESSMENT OF BUTACHLOR IN THE SOIL ECOSYSTEM BY ENEFE NDIDI (PG/M.Sc/PhD/09/51051) DEPARTMENT OF BIOCHEMISTRY FACULTY OF BIOLOGICAL SCIENCES UNIVERSITY OF NIGERIA, NSUKKA JULY, 2015
-
Upload
khangminh22 -
Category
Documents
-
view
1 -
download
0
Transcript of department of biochemistry faculty of biological sciences ...

BIOACCUMULATION AND RISK ASSESSMENT OF BUTACHLOR IN THE SOIL ECOSYSTEM
BY
ENEFE NDIDI
(PG/M.Sc/PhD/09/51051)
DEPARTMENT OF BIOCHEMISTRY FACULTY OF BIOLOGICAL SCIENCES
UNIVERSITY OF NIGERIA, NSUKKA
JULY, 2015
i
BIOACCUMULATION AND RISK ASSESSMENT OF BUTACHLOR IN THE SOIL ECOSYSTEM
BY
ENEFE NDIDI
(PG/M.Sc/PhD/09/51051)
DEPARTMENT OF BIOCHEMISTRY
FACULTY OF BIOLOGICAL SCIENCES
UNIVERSITY OF NIGERIA,
NSUKKA
SUPERVISOR: PROF. I.N.E ONWURAH
JULY, 2015
ii
BIOACCUMULATION AND RISK ASSESSMENT OF BUTACHLOR IN THE SOIL ECOSYSTEM
A THESIS SUBMITTED IN PARTIAL FULFILLMENT OF THE REQUIREMENT FOR THE AWARD OF THE DEGREE IN DOCTOR OF PHILOSOPHY IN
ENVIRONMENTAL BIOCHEMISTRY (PhD), IN THE DEPARTMENT OF BIOCHEMISTRY, UNIVERSITY OF NIGERIA NSUKKA
BY
ENEFE NDIDI
(PG/MS.c/PhD/09/51051)
DEPARTMENT OF BIOCHEMISTRY, UNIVERSITY OF NIGERIA, NSUKKA.
SUPERVISOR: PROF. I.N.E ONWURAH
JULY, 2015

iii
CERTIFICATION
Enefe Ndidi, a post graduate student with registration number PG/M.Sc/PhD/09/51051 in the
Department of Biochemistry, Faculty of Biological sciences, University of Nigeria Nsukka, has
satisfactorily completed the requirements for the award of the degree of Doctor of Philosophy in
Environmental Biochemistry. The work embodied in this report is original and has not been
submitted in part or full for any other diploma or degree of this or in any other University.
---------------------------- ----------------------------- Prof I.N.E Onwurah Prof O.F.C Nwodo (Supervisor) (Head of Department)
------------------------------ External Examiner
iv
ACKNOWLEDGEMENTS
My utmost thanks go to the Almighty God for enabling me carry out this research work
successfully; for His immeasurable grace and provision all through the programme. I wish to acknowledge the immense contributions of my supervisor, Professor .I.N.E Onwurah; his
assistance, explanation, suggestions and encouragement helped me greatly in the completion of
this work. I am grateful to you, Sir.
My gratitude also goes to my lecturers and senior colleagues who contributed to the success of
this work, such personalities are; Professor O.F.C Nwodo, Head of Department of Biochemistry,
University of Nigeria Nsukka, Dr C.S Ubani, Dr Parker E. Joshua of the Department of
Biochemistry, University of Nigeria Nsukka; Professor Ajogi I.(In memory), Professor O.P.
Ajagbonna ., Dr O.K. Olabode ., Dr O.C Jegede., Dr (Mrs) .F. C. Nwinyi., Dr I. Casmir., Dr S.
Enem., Dr M. Onakpa., Dr F. Sanni., Mr I.Orokpo and Mr J. Fwangle, all of the Faculty of
Veterinary Medicine, University of Abuja.
My special appreciation goes to my parents Chief & Mrs D.O. Enefe and my sisters: Barrister
Kechim Mbaeyi, Ifaka Enefe, Capt. and Mrs Ifiok Eno for their support, encouragement and
prayers which were in no small measure throughout my study.
This work would have been impossible but for the assistance and support of persons whom I
acknowledge with profound gratitude; Dr A.T. Orishadipe and his team; Dr Stella Emmanuel
and Mr Bwai Macham David of the Advanced Chemistry Laboratory, Sheda Science and
Technology Complex (SHETSCO) Abuja; Mrs Vivian O. Osadebe and Mr C. Onu, of the
Department of Crop Science, UNN; Professor S.C. Udem and Dr R.I Onoja ., of the Faculty of
Veterinary Medicine UNN., Mr Austin Okorie, of the Department of Pharmacology ,UNN., Dr
(Mrs)Y. Akalusi and Dr L. Ikpa; of the Micro biology Unit of the Veterinary Research Institute
NVRI) Vom, Jos. Finally I wish to express my sincere gratitude to the University of
Abuja/TETFUND for their profound contributions to the funding of this research work.

v
DEDICATION
This research work is dedicated to the Almighty God, my loving Father and my Helper who made it possible.

vi
ABSTRACT
Bioaccumulation of butachlor in plants following its application in the farm against weeds was evaluated using Phaseolus vulgaris (bean plant). Also, the risk of the consumption of such plants with some amount of bioaccumulated butachlor by non-target humans was studied using rabbits as animal model. The field experiments were carried out by crop cultivation with the application of 4.0 liters per hectare (2.6 kg a.i/ha), 4.4 liters per hectare (2.9 kga.i/ha) and 5.0 liters per hectare (3.2 kg a.i/ha) concentrations of butachlor at pre-emergence of the bean plant and the leaves of the plant were analyzed for the presence of butachlor residues using GC-MS , the result gave 0.10, 0.13 and 0.20 ppm bioaccumulated butachlor respectively for the concentrations of the butachlor applied to the plots of land. For 28 days three replicate groups of rabbits (4 per group) were fed the leaves containing these different concentrations (0.10, 0.13 and 0.20 ppm) of butachlor while the control groups which were composed of three replicates, were fed the plants cultivated in plots not treated with the herbicide. The rabbits were allowed access to water ad libitum. At the end of this exposure period, significant increases (p < 0.05) were observed in Cytochrome P450 (CYP) protein and increases in Glutathione S-transferase (GST) activity of the post-mitochondria liver fractions which were observed for the groups of rabbits fed the leaves having butachlor at the concentrations of 0.13 and 0.20 ppm in a time- and concentration-dependent manner; The liver marker enzymes, aspartate aminotransferase and alkaline phosphatase (AST, ALP) activities increased significantly (p < 0.05) for the rabbits fed the leaves with butachlor concentrations of 0.13 and 0.20 ppm in a time and concentration dependent manner thus suggesting a possible body defiance mechanism for herbicide detoxification. There was fluctuations in the ALT activity, with a decrease observed in group 4 rabbits that consumed the highest concentrations. Histological sections of the liver tissues of the exposed rabbits thus revealed no pathological alterations on day 28. The pesticide biomarker enzyme results is an indicative of induction and animal exposure to xenobiotics. The two enzymes (CYP and GST) could however be overwhelmed when the concentration of the herbicide increase, or upon chronic exposure, resulting to toxicity. The study shows that the manufacturers’ recommended application rate for butachlor (2.6 kg a.i/ha) poses no health risk; however, the application rates above the recommended rate could pose some risk when butachlor bioaccumulates in edible plants that are consumed. Thus, this work underlines the importance of strict adherence to the manufacturers’ and regulatory bodies directives, in the application of this herbicide butachlor in the soil ecosystem.

vii
TABLE OF CONTENTS
Contents Pages Title Page - - - - - - - - - - i
Certification- - - - - - - - - - - iii Acknowledgements - - - - - - - - - iv
Dedication - - - - - - - - - - v Abstract - - - - - - - - - - vi
Table of Contents - - - - - - - - - vii List of Figures - - - - - - - - - xi
List of Tables - - - - - - - - - - xii List of Abbreviations - - - - - - - - - xiv
CHAPTER ONE: INTRODUCTION 1.1 Bioaccumulation of Herbicide - - - - - 3
1.2 Risk Assessment of Herbicide - - - - - 5 1.3 Bean Plant (Phaseolus vulgaris) - - - - - 6
1.4 Historical Use of Pesticide - - `- - - - 7 1.5 Classification of Pesticide - - - - - - 8
1.5.1 Classification of Herbicide - - - - - - 9 1.5.1.1 Classification based on Method of Application - - - 9
1.5.1.2 Classification based on the Type of Vegetation - - - 9 1.5.1.3 Classification based on Activity/Mode of Action - - - 9
1.5.1.4 Classification based on Chemical Nature/family - - - 10 1.6 Butachlor - - - - - - - 11
1.6.1 Physicochemical Properties of Butachlor- - - - - 12 1.6.2 Toxicity of Butachlor - - - - - - - 12
1.7 Mode of Action of Herbicides in Target Plants - - - 12 1.8 The Soil Ecosystem - - - - - - - 14
1.9 Fate of Herbicides in the Soil Ecosystem - - - - 18 1.9.1 Chemical and Photochemical Degradation - - - - 18

viii
1.9.2 Biological Degradation - - - - - - 21
1.10 Metabolism Herbicide in Plants - - - - - 24 1.11 Metabolism of Herbicide in Animals - - - - 28
1.11.1 Phase I - - - - - - - - - 29 1.11.2 Phase II - - - - - - - - 31 1.12 Metabolism of Butachlor in Animals - - - - - 32
1.13 Toxicity of Metabolites - - - - - - 34 1.14 Biomarkers of Pesticide (Herbicides) - - - - - 34
1.15 The Liver Marker Enzymes - - - - - - 35 1.15.1 Aspartate Transaminase - - - - - - 36
1.15.2 Alanine Transaminase - - - - - - - 36 1.15.3 Alkaline phosphatase - - - - - - - 36
1.16 Hepatotoxicity - - - - - - - - 36 1.17 Lipid Peroxidation - - - - - 37
1.18 Aim and Objectives of the Study - - - - - 38 1.18.1 Aim of the Study - - - - - - - 38
1.18.2 Specific objectives of the study - - - - 38
CHAPTER TWO: MATERIALS AND METHODS 2.1 Materials - - - - - - - - 39
2.1.1 Chemicals - - - - - - - - 39 2.1.2 Equipment/Glasswares - - - - - - 39
2.1.3 Plant Material - - - - - - - - 41 2.1.4 Experimental Animal - - - - - - - 41
2.1.5 Area of Study - - - - - - - - 41 2.2 Methods - - - - - - - - 41
2.2.1 Experimental Design - - - - - - - 41 2.2.2 Animal protocol - - - - - - - 44
2.2.3 Soil Analysis - - - - - - - - 44 2.2.4 Plant Extraction of Butachlor - - - - - - 44
2.2.5 Identification and Quantification of Butachlor (GC-MS) - - 45

ix
2.2.6 Determination of Bioaccumulation Factor - - - - 45
2.2.7 Determination of Hazard Quotient (HQ) and Health Risk Index (HRI) - 46 2.2.8 Preparation Post-Mitochondria Supernatant - - - - 46
2.2.9 Determination of Liver Total Cytochrome P450- - - - 46 2.2.10 Determination of liver Glutathione S-Transferase - - - 48 2.2.11 Assay of Serum ALT Activity - - - - - 49
2.2.12 Assay of Serum AST Activity - - - - - 50 2.2.13 Assay of Serum ALP Activity - - - - - 50
2.2.14 Determination of Liver Total Protein Concentration - - 51 2.2.15 Determination of Body Weight of Rabbits - - - - 52
2.2.16 Histological Evaluation of Liver Tissues of Rabbits - - - 52 2.3 Statistical Analysis - - - - - - - 52
CHAPTER THREE: RESULTS 3.1 Soil Analysis - - - - - - - - - 53 3.2 Chromatograms of Butachlor in Standard and Phaseolus vulgaris leaf extract - 53 3.2.2 Butachlor Concentration in Phaseolus vulgaris leaf extract - - - 67
3.2.3 Bioaccumulation Factor (BAF) - - - - - - 68
3.3 Pesticide Biomarkers - - - - - - - 71 3.3.1 Effect of Different Concentrations of Bio-accumulated Butachlor in Phaseolus vulgaris
leave on the Liver Total Cytochrome P450 (CYP) of Rabbits - - - 71
3.3.2 Effect of Different Concentrations of Bio-accumulated Butachlor in Phaseolus vulgaris Leave on the Liver of Glutathione S-transferase (GST) Rabbits- - - 73
3.4 Liver Marker Enzymes - - - - - - - 75
3.4.1 Effect of Different Concentrations of Bio-accumulated Butachlor in Phaseolus vulgaris Leaves on the Activity of Serum Aspartate Aminotransferase (AST) of Rabbits - 75
3.4.2 Effect of Different Concentrations of Bio-accumulated Butachlor in leaves of Phaseolus vulgaris on the Activity of Serum Alanine Aminotransferase (ALT) of Rabbits- 77
3.4.3 Effect of Different Concentrations of Bio-accumulated Butachlor in leaves of Phaseolus vulgaris on the Activity Serum Alkaline Phosphatase (ALP) in Rabbits- - -79

x
3.5 Effect of Different Concentrations of Bio-accumulated Butachlor in Leaves of Phaseolus vulgaris on Mean Body Weight of Rabbits - - - - - 81
3.6 Effect of Different Concentrations of Bio-accumulated Butachlor in the leaves of Phaseolus vulgaris on Liver Total Protein of Rabbit- - - - 83
3.7 Histolological Examination of liver tissues of rabbits indirectly exposed to butachlor herbicide - - - - - - - - - 85
CHAPTER FOUR : DISCUSSION 4.1 Discussion - - - - - - - - - 89
4.2 Conclusion - - - - - - - - - 99 4.3 Recommendation. - - - - - - - - 99
Reference - - - - - - - - - 101 Appendices - - - - - - - - - 122
xi
LIST OF FIGURES
Pages
Figures1a-b: Chemical Structure of Butachlor and its metabolite in Animals- - -11
Figure 2: Schematic of Fatty acid Synthesis and Elongation in Plants. - - - -13
Figure 3: General Pathway for Abiotic and Biotic Transformation of Pesticide - -24
Figure 4: General Pathway for Xenobiotic Metabolism in Animals - - - -29
Figure 5: Metabolism of Butachlor in Plants/Animals- - - - - -33
Figure 6: Black Beans seeds (Phaseolus vulgaris) - - - - - - -40
Figure 7: Butastar Commercial Formulation of Butachlor- - - - - -40
Figure 8a-d: Bean plant at two, four and six weeks after planting- - - - -42
Figure 9a-c: Chromatogram / MS of Butachlor standard 1 - - - - -55
Figure 10a-b: Chromatogram/MS of Butachlor standard 2- - - - - -57
Figure11a-c: Chromatogram/MS of Leaf extract (T3) - - - - - -59
Figure 12a-c: Chromatogram/MS of Leaf extract (T2) - - - - - -62
Figure 13a-c: Chromatogram/MS of Leaf extract (T1) - - - - - -64
Figure14: Chromatogram/MS of Control extract (T1) - - - - - -66

xii
LIST OF TABLES
Pages
Table 1: Soil Analysis - - - - - - - - -54
Table 2: Butachlor Herbicide Concentration in Phaseolus vulgaris leaf extract- - -68
Table 3: Bioaccumulation Factor (BAF) of Butachlor in bean plant leaves- - - -69
Table 4: Estimated Quantities of Butachlor Consumed (ppm) by Rabbits for the period of experiment. - - - - - - - - -70
Table 5a/b: Estimated Hazard Quotient and Health Risk Index for consumption of different concentrations of butachlor by an average body weight of 70kg- - - -71
Table 6: Liver Cytochrome P450 (CYP) levels of Liver of Rabbits exposed to different concentrations of bioaccumulated butachlor in the diet.- - -73
Table 7: Liver Glutathione S-transferase activity of Liver of Rabbits exposed to different concentrations of bioaccumulated butachlor in the diet. - - -75
Table 8: Serum AST activity of Rabbits exposed to different concentrations of bioaccumulated butachlor in the diet. - - - - - - -77 Table 9: Serum ALT activity of Rabbits exposed to different concentrations of
bioaccumulated butachlor in the diet. - - - - - - -79
Table 10: Serum ALP activity of Rabbits exposed to different concentrations of bioaccumulated butachlor in the diet. - - - - - - -81
Table 11: Body Weight of Rabbits exposed to different concentrations of bioaccumulated butachlor in the diet. - - - - - - -83
Table 12: Liver Total Protein of Rabbits exposed to different concentrations of bioaccumulated butachlor in the diet. - - - - - - -85
xiii
LIST OF PLATES Plate 1: A photomicrograph of liver sections from control (1) and experimental groups 2,3,4 at day 1- - - - - - - -- - - -- -87
Plate 2: A photomicrograph of liver sections from control (1) and experimental groups 2,3,4 at day 14 - - - - -- - - -- -88
plate 3: A photomicrograph of liver sections from control (1) and experimental groups 2,3,4 at day 28 - -- - - -- - - - -89

xiv
LIST OF ABBREVIATIONS
EPA -Environmental Protection Agency MRL -Maximum Residue Limit VLCFA -Very Long Chain Fatty Acid CYP -Cytochrome P450 GST -Glutathione S-transferase ADI -Acceptable Daily intake HRI -Health risk index HQ -Hazard Quotient RfD -Reference Dose of Contaminant FAO -Food and Agricultural Organisation POP -Persistent organic Pollutant BAF -Bioaccumulation Factor Kow -Octanol/Water Partition Coefficient Kd -Adsorption Coefficient a.i -active ingredient m.a.s.l -miles above sea level GC-MS -gas chromatography-mass spectrometry

1
CHAPTER ONE INTRODUCTION
One of the most important tasks of the economy of developing countries such as Nigeria is to
develop the agricultural sector so as to increase and generate employment, promote self-
sufficiency in food, improve the standard of living, increase gross domestic production and
contribute to general development. To attain food sufficiency, government encourages farmers
to use improved seeds, fertilizers, irrigation and pesticides; thus leading to a higher pesticide
usage, with many problems often associated, such as unsafe use, persistence in the
environment, toxicity to bees, fish and wild life, contamination of water sources, persistent
pesticide accumulating in food chain, negative impact on earth worms and other non-target
organisms being identified (Akinloye et al., 2011).
Pesticide is the term used for a broad range of chemicals and biologicals used for pest control.
The Environmental Protection Agency (EPA) defines a pesticide as any substance or mixture
of substances/chemicals intended to prevent, destroy, repel or mitigate pests (undesirable
animals and plants) (USEPA, 2006). Pesticide also includes plant growth regulators, defoliants
or desiccants (Hagtrum and Subramanyam, 2006). They are manufactured and used in most
countries around the world to protect agricultural, horticultural and forestry crops as well as
increasing their productivity. Pesticide types include: insecticides, herbicides, fungicides,
bactericides, rodenticide nematicides, etc (Ware and Whitacre, 2004). Herbicides are
agrochemicals used for controlling weeds in different crops and they are the most widely used
pesticides (Senseman, 2007).
The use of herbicides has increased worldwide over the years in other to secure food supply for
the teaming global population. In the tropical regions, Nigeria in particular, an intensive
practice has led to higher herbicide usage especially where agricultural labour is scarce or
expensive; herbicides save the farmer’s time by replacing laborious manual weed control.
Many farmers and extension agents lack the technical skills for proper and effective use of
pesticides, resulting to many unfortunate consequences which include; human and livestock
exposure to pesticide poisonings, crop injuries, and environmental pollution (Dugie et al.,

2
2008) Butachlor (N-butoxymethyl)-2-chloro-2’,6-diethylacetamide) is a member of the
chloroacetamide family of herbicides. It is a selective systemic herbicide manufactured by
Monsanto USA in 1970, for the pre-emergent control of annual grasses and certain broad leaf
weeds in rice, barley, wheat and some other leguminous crops (Yu et al., 2003). Butachlor is
the active ingredient of formulations sold under the trade name Machete (USA),
Butaforce/Butastar (Nigeria). It is thought to inhibit the synthesis of lipids, alcohols, fatty
acids, proteins, isoprenoid and flavonoids in non-target plants (Ecobichon, 2001; Heydens et
al., 2002; Gotz and Boger, 2004). Butachlor can degrade rapidly under optimal conditions but
in some soil that lack suitable microbial degraders, it may remain biologically active and
persist for a long time (Lin et al., 2000). The increased application of butachlor on rice ,tea,
wheat, beans and other crops, has been shown to exert detrimental effects on earthworms
(Muthukaruppan and Gunasekaran, 2010) and other non-target animals (Kumari et al., 2009;
Debnath et al., 2002). Studies show that it is a potential threat to agro-ecosystem and human
health through food chains (Tilak et al., 2007; Sinha, 1995). Ecotoxicological studies also
suggested that butachlor and their metabolites may be harmful (genotoxic, neurotoxic) to
aquatic invertebrates (Ateeq et al., 2002, 2006; Tilak et al., 2007; Yin et al., 2007), microbial
communities (Min et al., 2002; Debnath et al., 2002), and possibly being carcinogenic in
animals including apoptosis-resulting from DNA strand breaks and chromosomal aberrations
in cultured mammalian cells (Sinha et al., 1995; Panneerselvam et al., 1999; Geng et al.,
2005a). Butachlor as well as other members of the chloroacetanilide including acetochlor,
alachlor and metoalchlor have been shown to be mutagenic and carcinogenic in rats/mice upon
acute exposure and these have been thoroughly reviewed (USEPA, 1998; Dearfield et al.,
1999; Wilson and Takei, 1999). Butachlor contamination of 0.163ppb has been recorded in
groundwater collected from tube wells adjacent rice fields in Philippines (Natarajan, 1993).
Butachlor has been banned in some countries like Canada and Europe; and it is not been used
for rice cultivation in USA probably because of its toxicity, hydrophobicity, bioaccumulation
and its negative impact on wildlife and humans via the food chain (Kannan et al., 1996; WHO,
2010a). However it is in prevalent use in continents such as Latin America, Asia and Africa.
Many of the herbicides widely used in the 1960s and 1970s have been phased out and replaced
by the newer, safer and more potent herbicides discovered later. The use of some older

3
herbicides has also been restricted, reduced and even eliminated in view of environmental and
toxicological problems. Developing countries maintain that they cannot ban certain older
pesticides, for reasons of cost and/or efficacy. Thus the dilemma of cost/efficacy versus
ecological impacts, including long range impacts via atmospheric transport and access to
modern pesticide formulations at low cost remains a contentious global issue (Stephenson and
Solomon, 1993; FAO, 1995). According to the Stockholm Convention on Persistent Organic
Pollutants (POPs), nine of the twelve most dangerous POPs are pesticides. The POPs are
compounds that resist degradation and thus persist in the environment for longer periods. They
have the ability to bioaccumulate, biomagnify and bioconcentrate; hence they are poisonous to
non-target organisms (Stochlm, 2009). Persistence is usually described in terms of the half-life
(T ½) of a chemical in water, soil, sediment, or air. The T½ is the amount of time necessary for
a given amount of chemical released into the environment to decrease to one-half of its initial
value. Millions of tons of pesticides are applied annually, however less than 5% of these
products are estimated to reach the target organism, with the remainder being deposited on the
soil and non-target organism as well as moving into the atmosphere and water (Hamilton and
Crossley, 2004). The fate of an herbicide applied on the soil include: chemical and
photochemical degradation, microbial degradation, volatilization, runoff into water bodies,
leaching into groundwater, adsorption by soil particles and uptake by plants/animals which may
result to bioaccumulation. This is dependent on abiotic environmental conditions (temperature,
moisture, soil pH, etc) microbial or plant species (or both), pesticide characteristics (chemical
or physical-hydrophobicity, Kow, etc (Lyman, 1995; Schnoor, 1996).
1.1 Bioaccumulation of Herbicides When herbicides are applied, acceptable remainders of active substances (maximum residue
limit, MRL) can often be detected in cultivated plants depending on the physico-chemical
properties of the active substances of herbicides and ways of detoxification, some of these
pollutants tend to increase concentration while passing through organisms of higher trophic
levels, thus leading to a significant bioaccumulation in food chains (Allinson and Morita,
1995). Bioaccumulation is the process by which organisms accumulate chemicals such as
pesticides both directly from the abiotic environment (i.e., water, air, soil) and from dietary
sources (trophic transfer) (Baron, 1995). Studies have shown that herbicides or its metabolites
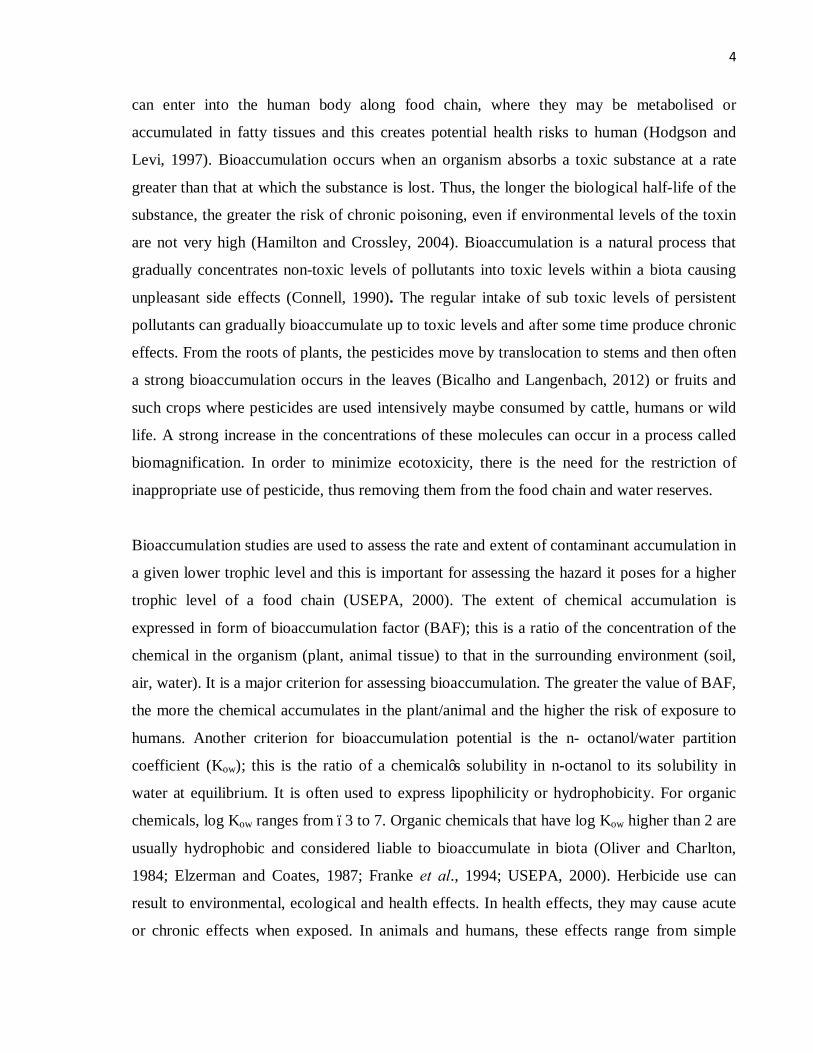
4
can enter into the human body along food chain, where they may be metabolised or
accumulated in fatty tissues and this creates potential health risks to human (Hodgson and
Levi, 1997). Bioaccumulation occurs when an organism absorbs a toxic substance at a rate
greater than that at which the substance is lost. Thus, the longer the biological half-life of the
substance, the greater the risk of chronic poisoning, even if environmental levels of the toxin
are not very high (Hamilton and Crossley, 2004). Bioaccumulation is a natural process that
gradually concentrates non-toxic levels of pollutants into toxic levels within a biota causing
unpleasant side effects (Connell, 1990). The regular intake of sub toxic levels of persistent
pollutants can gradually bioaccumulate up to toxic levels and after some time produce chronic
effects. From the roots of plants, the pesticides move by translocation to stems and then often
a strong bioaccumulation occurs in the leaves (Bicalho and Langenbach, 2012) or fruits and
such crops where pesticides are used intensively maybe consumed by cattle, humans or wild
life. A strong increase in the concentrations of these molecules can occur in a process called
biomagnification. In order to minimize ecotoxicity, there is the need for the restriction of
inappropriate use of pesticide, thus removing them from the food chain and water reserves.
Bioaccumulation studies are used to assess the rate and extent of contaminant accumulation in
a given lower trophic level and this is important for assessing the hazard it poses for a higher
trophic level of a food chain (USEPA, 2000). The extent of chemical accumulation is
expressed in form of bioaccumulation factor (BAF); this is a ratio of the concentration of the
chemical in the organism (plant, animal tissue) to that in the surrounding environment (soil,
air, water). It is a major criterion for assessing bioaccumulation. The greater the value of BAF,
the more the chemical accumulates in the plant/animal and the higher the risk of exposure to
humans. Another criterion for bioaccumulation potential is the n- octanol/water partition
coefficient (Kow); this is the ratio of a chemical’s solubility in n-octanol to its solubility in
water at equilibrium. It is often used to express lipophilicity or hydrophobicity. For organic
chemicals, log Kow ranges from –3 to 7. Organic chemicals that have log Kow higher than 2 are
usually hydrophobic and considered liable to bioaccumulate in biota (Oliver and Charlton,
1984; Elzerman and Coates, 1987; Franke et al., 1994; USEPA, 2000). Herbicide use can
result to environmental, ecological and health effects. In health effects, they may cause acute
or chronic effects when exposed. In animals and humans, these effects range from simple

5
irritation of the skin and eyes to more severe and chronic effects affecting the nervous system
(Gorell et al., 1998; Tanner et al., 2011; Mostafallou and Abdollahi, 2012), disruption of
hormonal functions causing reproductive problems (Bosveld et al., 1995; Bretveld et al.,
2006) ,carcinogenetic (Ou et al., 2000), teratogenic (Paganelli et al., 2010) genotoxic, or
result to mortality (Dieter et al., 1996).
1.2 Risk Assessment of Herbicides The analysis of herbicides and their residues had in the past aided objective re-evaluation and
reassessment of these substances on a benefit-risk analysis basis and their subsequent
withdrawal from use when found to be hazardous to human health and the environment
(Achudume, 2011). Risk assessment of chemicals is described as a process intended to
calculate or estimate the risk to a given target organism, system or (sub) population, including
identification of attendant uncertainties, following exposure to a particular chemical taking
into account the inherent characteristics of the agent of concern as well as the characteristics
of the specific target system (OECD, 2003). Risk Assessment is the central component of risk
analysis and provides a scientific basis for risk management decisions on measures that may
be needed to protect human health. It evaluates the possible danger in the consumption of
organic chemicals by animals and human. Risk is characterized by assessing the Hazard
Quotient (HQ) and the Health risk index (HRI). The HQ is a simple ratio of single exposure
and effect values and may be used to express hazard or relative safety (Gerba, 2010; Wang et
al., 2005). Assessments may be undertaken for acute (short term) or chronic (long term)
exposures, where acute exposure covers daily average and chronic if exposure is over the
entire lifetime.
In most countries, herbicides must be approved for sale and use by government agencies such
as Environmental Protection Agency (EPA) and the National Agency for Food and Drug
Administration (NAFDAC) under the Food Quality Protection in Nigeria. Pesticides are
regulated after complex studies (10 field trials or tests) to ensure that these products do not
pose adverse effects to humans or the environment. Standards are then set for the level of
pesticide residue that is allowed in or on crops (USEPA, 2000; Hamilton and Crossley, 2004).
Internationally, risk assessment of chemical substances present in or on food forms the core
work of Joint Food and Agricultural Organisation and the World Health Organisation

6
(FAO/WHO and Expert committee on Food Additives (JECFA). These organisations base
their evaluations on scientific principles and ensure consistency in their risk assessments
determination, Also the Codex Alimentarius Commission (established by FAO and WHO in
1962) together with the committee establishes maximum residue limits (MRL) for pesticide
residues, veterinary drug residues, contaminants and food additives in order to facilitate
international trade and protect the health of consumers (WHO/ FAO, 2010a). Each year,
140,000 tons of pesticides are sprayed onto crops in the European (EU) alone. Fruits and
vegetables are the crops mostly contaminated. According to data from the EU’s pesticides
action network in 2008, some 350 different pesticides were detected in food produced in the
EU. More than 5% of products contained pesticides at levels exceeding the EU maximum
permitted levels (Fenik et al., 2011). Scientific researchers have shown that several health
effects due to pesticides were apparent at much lower doses than the typical levels of pesticide
residues found in food (Nebeker et al., 1994; Walz, 2010). Studies have also been carried out
in some other countries and the detection of pesticides/residues in food and drinks were
reported; some of which are above or below the maximum residue limit (MRL), as stated by
the Codex Maximum Residue limits/Extraneaous Maximum Residue limit (MRL/EMRL)
(Tadeoa et al., 2000; Tseng et al, 2002,Sun et al., 2005; Chang et al., 2005; WHO/FAO,
2006; Darko and Acquaah, 2008; Qiu et al., 2010; Etonihu et al., 2011; Fenik et al., 2011).
1.3 Bean Plant (Phaseolus vulgaris) The bean plant is a herbaceous legume grown annually for its edible fruit, either the dry seed
or the unripe fruit, both of which are referred to as beans. It belongs to the family known as
leguminosae. It is a warm season growing legume that does better under subtropical and
temperate conditions. It requires a moderate well-distributed rainfall (300-400 mm per crop
cycle) with average temperatures range between 17.5°C and 27°C. The common bean grows
well on a large variety of soils with pH ranging from 4 to 9. It does better on well-drained,
sandy loam, silt loam or clay loam soils, rich in organic content. The duration of the cycle for
the common bean ranges from 60–90 days depending on the variety. The leaves of this
leguminous plant is also occasionally used as vegetable, the leaves and the straw can be used
for fodder and fed fresh to livestock. The creeping variety is cultivated around the warm
season (Ferreira et al., 1997). The black bean variety popularly called Akidi, is commonly
grown in the eastern part of Nigeria for its protein rich seed and edible leaves.

7
1.4 Historical Use of Herbicides. Long before 2000 BC, humans have utilized pesticides to protect their crops. The first known
pesticide is elemental sulfur dusting used in ancient summer about 450 years ago in ancient
Mesopotia. By the 15-19th century saw the use of toxic chemicals such as arsenic mercury,
lead to nicotine and other natural pesticides like pyrethrum which is derived from
chrysanthemums, and rotenone, which is derived from the roots of tropical vegetables in the
1950s (Miller, 2002). Paul Muller discovered that DDT was a very effective insecticide and
the organochlorines became dominant, however later replaced by the organophosphates and
carbamates by 1975. Herbicides became common in the 1940s–1950s led by the triazine and
other nitrogen-based compounds, carboxylic acids and glyphosate (Miller, 2002). The first
widely used herbicide was 2, 4–dichlorophenxyacetic acid (2, 4-DPNA) which was
commercialized by the paint company Sherwin–Williams. It is easy and inexpensive to
manufacture, kills many broad leaf plants, however, high doses of 2, 4-DPNA could be
harmful. The low cost of 2,4–DPNA led to continued usage today and it remains one of the
most commonly used herbicides in the world. Seventy-five percent of all pesticides in the
world are used by developed countries, but use in developing countries is increasing (Ritter,
2009). The triazine family of herbicides which include atriazine, was being discovered to be
the herbicide family of greatest concern regarding ground water contamination. Glyphosate
sold with a brand name Roundup was introduced in 1974 for non-selective weed control, and
it is now a major herbicide due to the development of crop plants resistant to it. In the 1970
the use of chemicals such as DDT and some organochlorines were banned Under the
Stockholm Convention on Persistent Organic pollutant, because of their long persistence in
the environment, although DDT is still been used in some developing nations to treat malaria
and tropical diseases (WHO, 1989). Today organochlorine pesticide levels are still detected
in fish from waterways (Chindah et al., 2004). World-wide, an estimated 2.3 billion kg of
1,600 different pesticides are applied yearly (Pimentel, 1995). In Europe, the total agricultural
use of pesticides is estimated to be 350 000 tons of active ingredients per year (Kreuger, 1999)
It has been established that pesticide application in Nigeria ranges from 125,000 to 130,000
metric tons yearly (Asogwa and Dongo, 2009). World Health Organisation maintained that an
estimated three (3) million farmers in developing countries experience acute poisoning from
8
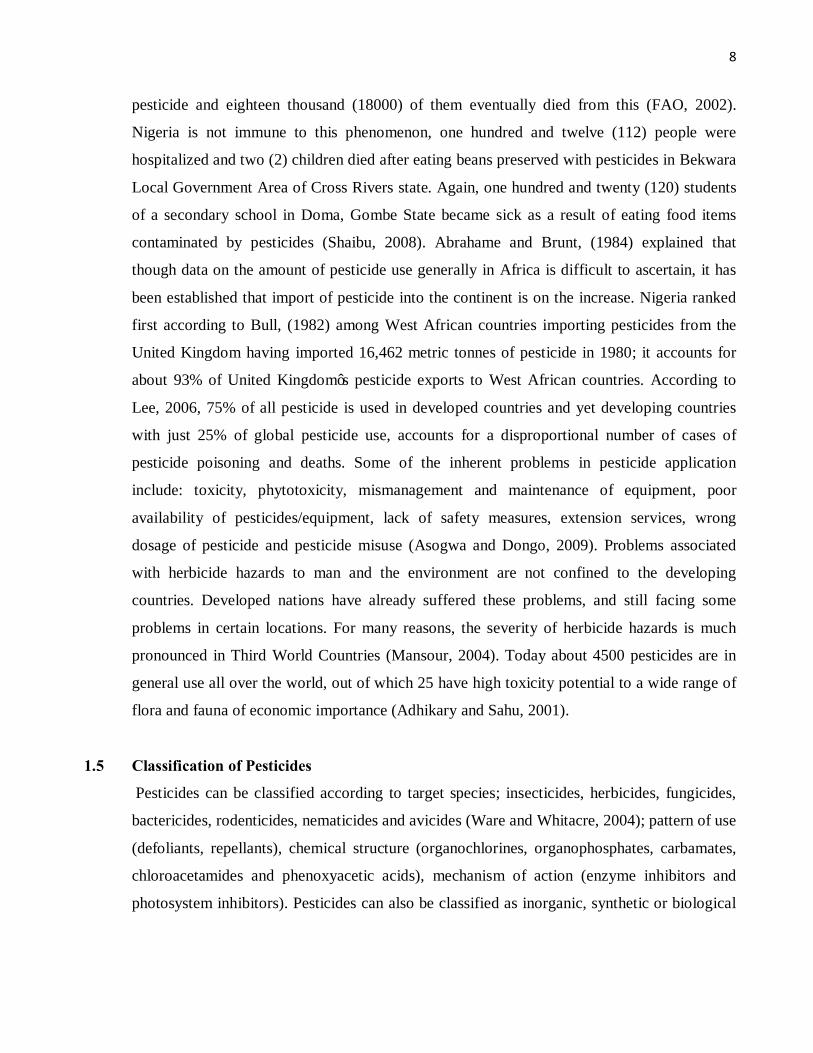
pesticide and eighteen thousand (18000) of them eventually died from this (FAO, 2002).
Nigeria is not immune to this phenomenon, one hundred and twelve (112) people were
hospitalized and two (2) children died after eating beans preserved with pesticides in Bekwara
Local Government Area of Cross Rivers state. Again, one hundred and twenty (120) students
of a secondary school in Doma, Gombe State became sick as a result of eating food items
contaminated by pesticides (Shaibu, 2008). Abrahame and Brunt, (1984) explained that
though data on the amount of pesticide use generally in Africa is difficult to ascertain, it has
been established that import of pesticide into the continent is on the increase. Nigeria ranked
first according to Bull, (1982) among West African countries importing pesticides from the
United Kingdom having imported 16,462 metric tonnes of pesticide in 1980; it accounts for
about 93% of United Kingdom’s pesticide exports to West African countries. According to
Lee, 2006, 75% of all pesticide is used in developed countries and yet developing countries
with just 25% of global pesticide use, accounts for a disproportional number of cases of
pesticide poisoning and deaths. Some of the inherent problems in pesticide application
include: toxicity, phytotoxicity, mismanagement and maintenance of equipment, poor
availability of pesticides/equipment, lack of safety measures, extension services, wrong
dosage of pesticide and pesticide misuse (Asogwa and Dongo, 2009). Problems associated
with herbicide hazards to man and the environment are not confined to the developing
countries. Developed nations have already suffered these problems, and still facing some
problems in certain locations. For many reasons, the severity of herbicide hazards is much
pronounced in Third World Countries (Mansour, 2004). Today about 4500 pesticides are in
general use all over the world, out of which 25 have high toxicity potential to a wide range of
flora and fauna of economic importance (Adhikary and Sahu, 2001).
1.5 Classification of Pesticides Pesticides can be classified according to target species; insecticides, herbicides, fungicides,
bactericides, rodenticides, nematicides and avicides (Ware and Whitacre, 2004); pattern of use
(defoliants, repellants), chemical structure (organochlorines, organophosphates, carbamates,
chloroacetamides and phenoxyacetic acids), mechanism of action (enzyme inhibitors and
photosystem inhibitors). Pesticides can also be classified as inorganic, synthetic or biological

9
(biopesticides). Biological biopesticides include microbial pesticides and biochemical
pesticides (Ware, 2000).
1.5.1 Classification of Herbicides Herbicides can be classified based on: (a) Method of application/use (b) Type of vegetation
controlled, (c) Mode of action/activity and (d) Chemical nature/family.
1.5.1.1 Classification based on Method of Application
They can be soil applied or foliar applied. Soil- applied herbicides are applied to the soil and
are taken up by the roots and/or hypocotyls of the target plant. There are two main types of
soil applied herbicides
a. Pre-plant incorporated herbicides which are applied prior to planting and mechanical
incorporation into the soil. They are mixed with the soil before seeding. This incorporation is
another way to prevent dissipation through photodecomposition and/or volatility.
b. Pre-emergent Herbicides are applied to the soil before the crop and weed emerges thus
preventing germination or early growth of weed seeds
Foliar applied herbicides 5are applied to plant foliage since they have foliar activity. Post
emergent herbicides are applied to the soil or foliage after the germination of crops and weeds
(Senseman, 2007).
1.5.1.2 Classification based on the Type of Vegetation:
Selectivity is the process by which a herbicide controls certain plants but leaves others
unharmed. Herbicides can be selective or non-selective i.e. the selective herbicides kill
specific targets (weeds) while leaving the desired crop relatively unharmed. Non selective
herbicide kill all type of plant material including target and non-target plants, when in contact,
hence they are commonly used for preparation of land, industrial sites, railways and waste
ground, forestry, wildlife habitat and pasture systems (Senseman, 2007).
1.5.1.3 Classification based on Activity/Mode of Action This refers to how they are translocated in plants.
a. Contact herbicides (non-systemic) destroy only the plant tissue in contact with the
chemical, they are fast acting herbicides however less effective on perennial plants which are
able to grow from rhizomes, roots or tubers.

10
b. Systemic herbicides (translocated): are translocated through the plant, either from
foliar application down to the roots or from soil application up to the leaves and stems. They
are capable of controlling perennial plants and may be slower acting but ultimately more
effective than contact herbicides (Rao, 2000).
1.5.1.4 Classification based on chemical nature/family
Herbicide may be divided into two groups – Inorganic and organic herbicide. The inorganic
herbicides are made up of inorganic compounds which include copper sulphate, sodium
arsenate, sulphur acid and sodium chlorate. They were used between 1896–1930s, however
organic herbicides dominate modern agriculture. The organic herbicides include; Phenoxy
carboxylic acid herbicides e.g. 2,4-dichlorophenoxyacetic acid, Triazines (atrazine)
Bipyridyliums (paraquat), Sulphonyl Ureas, Dinitroanilines and Chloroacetamides (butachlor)
(Rao, 2000). Chloroacetamides belong to a subgroup of the acetanilides or acetamides
(substituted acidamide), having a phenyl ring attached to the amide nitrogen. Some of the
members of the acetamides are applied post-emergence while others are pre-emergence; all
are effective on germinating weeds (shoot and root inhibitors). The herbicidal mode of action
is not totally understood, however, it is known that this class of herbicides inhibits
biosysnthesis of lipids, fatty acids, proteins, isoprenoids and flavonoid in plants (Heydens et
al., 2002). Studies showed that they cause herbicidal effect via conjugation of acetyl
coenzyme A and other sulfhydryl-containing enzymes with consequent inhibition of critical
function needed for the germination or survival of seedlings. The effective shelf-life of most
chloroacetamide is of the order of 6-12weeks. The members of the acetamides include;
alachlor, acetochlor, butachlor, metolachlor, propachlor and allidochlor.
1.6 Butachlor
1.6.1 Physicochemical Properties of Butachlor
Butachlor (N-butoxymethyl) -2-chloro-2’,6-diethylacetamide-C17 H26 NO2Cl) is an amber
coloured liquid with a faint sweet odour, with a molecular weight of 311.9g. The solubility of
butachlor in water is 20ppm at 25oC, it is semi-volatile and miscible with alcohol, ether, n-
hexane, acetone and benzene. The partition coefficient (1-octanol/water)Kow is3.16 X 1004

11
and logKow is 4.50 at pH 7, while the Koc is 700mL/g and the vapour pressure is 2.90×10⁻⁶
mmHg (=3.86×10⁻⁴ Pa) (25°C). The specific gravity /density is 1.076 (25oC) and it is not
hydrolyzable. The melting and boiling points are -0.55 and 156oC respectively. The half-life
in soil due to biodegradability (aerobic degradation) is 42 -70 days (6-10weeks) (Heydens et
al., 2002).The structure of butachlor and its metabolite-2,6 diethylacetamide are shown below
in figures 1a and b.
CH2CH3
N
CH2CH3COCH2Cl
CH2O(CH2)3CH3
a) Structure of Butachlor
b) Metabolite of butachlor in animal
Figure 1a: Chemical Structure of Butachlor b) Metabolite of butachlor in animal.
Butachlor was developed by Monsanto and commercialized as machete USA in 1970 for the
pre-emergent control of annual grasses and certain broad leaf weeds in rice, barley, wheat and
some other leguminous crops. It is the active ingredient of an emulsifiable concentrate sold
under the trade name Butastar and Butaforce in Nigeria. Butachlor is a selective systemic
herbicide, absorbed primarily by the germinating shoots and secondarily by the roots, with
translocation throughout the plant, giving higher concentrations in vegetative parts than in the
reproductive parts (Rao, 2000). It is known to inhibit cell division mainly by inhibiting lipid
and protein synthesis. It’s activity is dependent on water availability such as rainfall following
12
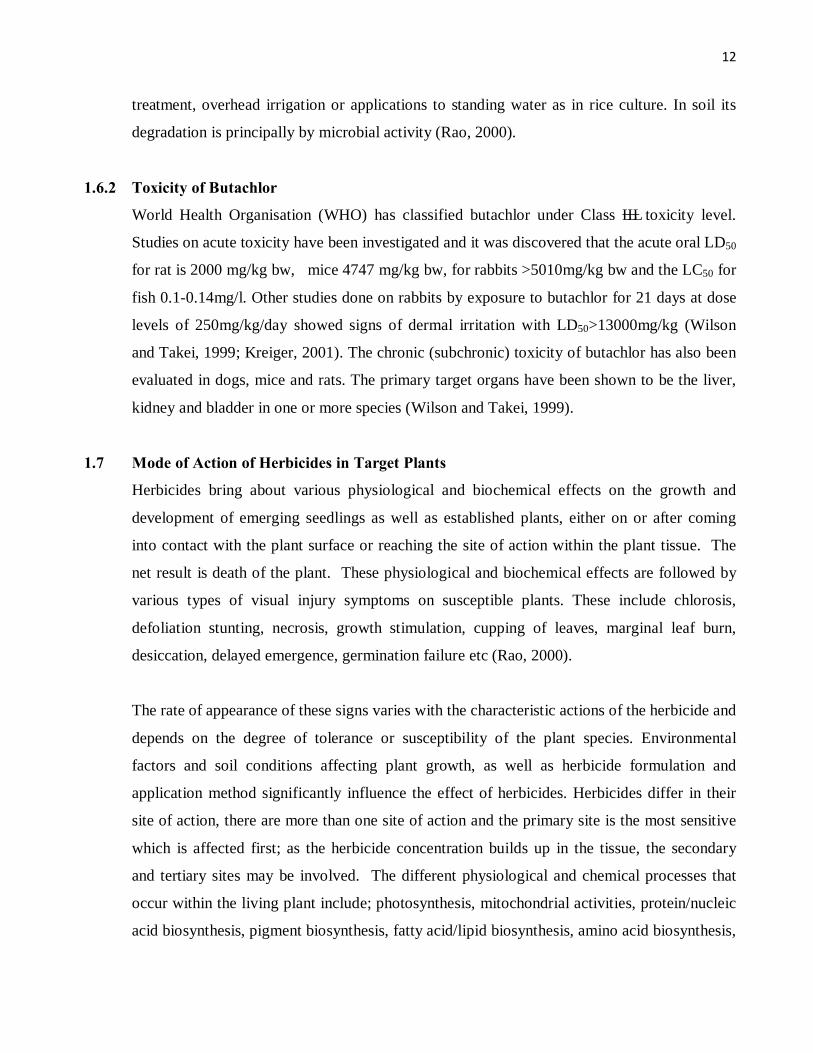
treatment, overhead irrigation or applications to standing water as in rice culture. In soil its
degradation is principally by microbial activity (Rao, 2000).
1.6.2 Toxicity of Butachlor
World Health Organisation (WHO) has classified butachlor under Class ΙΙΙ toxicity level.
Studies on acute toxicity have been investigated and it was discovered that the acute oral LD50
for rat is 2000 mg/kg bw, mice 4747 mg/kg bw, for rabbits >5010mg/kg bw and the LC50 for
fish 0.1-0.14mg/l. Other studies done on rabbits by exposure to butachlor for 21 days at dose
levels of 250mg/kg/day showed signs of dermal irritation with LD50>13000mg/kg (Wilson
and Takei, 1999; Kreiger, 2001). The chronic (subchronic) toxicity of butachlor has also been
evaluated in dogs, mice and rats. The primary target organs have been shown to be the liver,
kidney and bladder in one or more species (Wilson and Takei, 1999).
1.7 Mode of Action of Herbicides in Target Plants
Herbicides bring about various physiological and biochemical effects on the growth and
development of emerging seedlings as well as established plants, either on or after coming
into contact with the plant surface or reaching the site of action within the plant tissue. The
net result is death of the plant. These physiological and biochemical effects are followed by
various types of visual injury symptoms on susceptible plants. These include chlorosis,
defoliation stunting, necrosis, growth stimulation, cupping of leaves, marginal leaf burn,
desiccation, delayed emergence, germination failure etc (Rao, 2000).
The rate of appearance of these signs varies with the characteristic actions of the herbicide and
depends on the degree of tolerance or susceptibility of the plant species. Environmental
factors and soil conditions affecting plant growth, as well as herbicide formulation and
application method significantly influence the effect of herbicides. Herbicides differ in their
site of action, there are more than one site of action and the primary site is the most sensitive
which is affected first; as the herbicide concentration builds up in the tissue, the secondary
and tertiary sites may be involved. The different physiological and chemical processes that
occur within the living plant include; photosynthesis, mitochondrial activities, protein/nucleic
acid biosynthesis, pigment biosynthesis, fatty acid/lipid biosynthesis, amino acid biosynthesis,

13
hydrolytic enzyme activities, aromatic compound biosynthesis, etc. (Rao, 2000).Studies show
that butachlor acts by inhibiting the elongase responsible for the elongation of very long chain
fatty acids (VLCFA) and geranyl geranyl pyrophosphate cyclisation enzymes (Matthes et al.,
1998; Gotz and Boger, 2004). A majority of VLCFAs is located in the plasma membrane and
as cuticular and epicuticular waxes. When absent the membrane loses stability and becomes
leaky leading to death of the herbicide-treated plant (Matthes and Böger, 2002).
Fatty Acid Biosynthesis and Elongation
Figure 2. Simplified schematic of fatty acid synthesis and elongation in plants. Abbreviations: ACCase, acetyl-CoA carboxylase; ACP, acyl carrier protein; ACS, acetyl-CoA synthase; CoA, coenzyme A; dims, cyclohexanedione inhibitors; FAS, fatty acid synthase; fops, aryloxyphenoxy propionate inhibitors; PDC, pyruvate dehydrogenase complex. Source: Gronwald, (1991). Lipid biosynthesis inhibitors. Weed Sci. 39:435-449.

14
1.8 The Soil Ecosystem
The Soil is a complex ecosystem of many species including plants, fauna and microorganisms.
It is a variable mixture of mineral and organic materials with living, dead, decaying biologic
components, air and water (Tomaz, 2013). The fate of any herbicide depends on its properties,
environmental factors and the properties of the soils to which it is applied.
(i) Soil properties that affect the uptake of pesticide (herbicide) The uptake of a xenobiotic by the crop, following a pesticide treatment, depends on the degree
of exposure from both the roots and aerial parts of the plant. Pesticides on the surface of the
plant or in the soil will be subject to a range of environmental factors, e.g. photolysis and
microbial activity, which can result in degradation of the pesticide. These degradation
products and the parent pesticide are therefore available for absorption. A further factor
influencing the uptake of xenobiotics from the soil is the interaction of chemicals with the soil
(Hellstrom, 2004).
(a) Soil Adsorption This process takes place when pesticides sprayed on the soil surface adhere to the soil
particles and organic matter. Soil properties that affect herbicide adsorption are soil pH,
organic matter content, soil moisture, soil temperature and soil colloids (Rao, 2000). Soils
high in organic matter or clay are the most adsorptive. A pesticide that is adsorbed by the soil
is less likely to volatilize, leach or be broken down by microbes. However, it will move with
the soil if the soil is eroded. They are not strongly adsorbed to sandy soils. Herbicides are
adsorbed to soil colloids to varying degrees and the colloids have negatively charged sites to
which herbicides can be adsorbed. Adsorption reduces herbicide activity in soils because the
molecules adsorbed to the colloids may not be available for desorption. Desorbed or non-
sorbed molecules are bio-available and can move into the food chain or into ground water
(Kerle et al., 2007). Adsorption/Desorption are thus the key processes controlling herbicide
efficacy, dissipation and behavior in soil as well as the contamination of ground and surface–
waters. Absorption is the movement of pesticides into organisms (plants, animals) or
structures (wood). To be absorbed into the roots, the xenobiotic needs to be bioavailable or
present in the soil–water compartment, a function of the interactions of the chemical with soil

15
organic matter or clay particles. This interaction is measured as the adsorption coefficient, Kd
or Koc ; Koc is the tendency of herbicide sorption to organic carbon. Higher values (greater
than 1000) indicate a herbicide that is very strongly attached to soil and is less likely to move
unless soil erosion occurs. Lower values (less than 300-500) indicate herbicide that tends to
move with water and have the potential to leach or move with surface runoff (Monaco et al.,
2002; Connell, 1990). The Koc for butachlor is 700ml/g which indicates moderate soil sorption
as compared to trifluralin with Koc of 7000ml/g which strongly attaches to soil.
The uptake of compounds by the root is therefore a function of the soil adsorption coefficient
of the xenobiotic, the concentration gradient between the soil solution and that inside the root,
the octanol/water partition coefficient Kow (lipophilicity), degree of ionization, and on the
mass flow of water. The most important property is hydrophobicity, which usually is
expressed as the 1-octanol/water partition coefficient (Kow), or more often log Kow. This is the
ratio of a chemical’s solubility in n-octanol to its solubility in water at equilibrium (Bacci,
1994). Log Kow spans over a wide range for different organic compounds (Hellstrom, 2004). It
is an important basis for estimating bioaccumulation factor (BAF). The Kow also provides
information on how strongly organic and inorganic compounds are likely to bind to soil or
sediment particles, or to partition into lipid (octanol) versus aqueous phase liquids. Strong
binding indicates a high potential to persist and accumulate in soils and sediments;
soil/sediment binding also tends to be correlated with the potential to bio accumulate. Since
lipophilic substances with high octanol-water coefficient remain preferencially in soils and
with little bioavailability thus they have low bioaccumulation potential (Connell, 1990). More
hydrophobic compounds, having a higher Kow, are sorbed more strongly to organic particles in
the soil. Due to the solubility of 20ppm and high hydrophobicity of log kow 4.5 butachlor
presents high adsorption in soils with medium to high organic matter (Wang et al., 1999)
(b) Soil Organic Matter (SOM) Organic matter consists of decaying plant material. The content of organic carbon in soil is
one of the most important environmental factors influencing root-uptake of non-ionic organic
compounds from soil into roots. The higher the soil organic matter content, the greater the
soil’s ability to hold both water and adsorbed pesticides. To further describe the distribution of
a chemical in soil, the soil-water partition coefficient (Kd) is used. Kd is generally
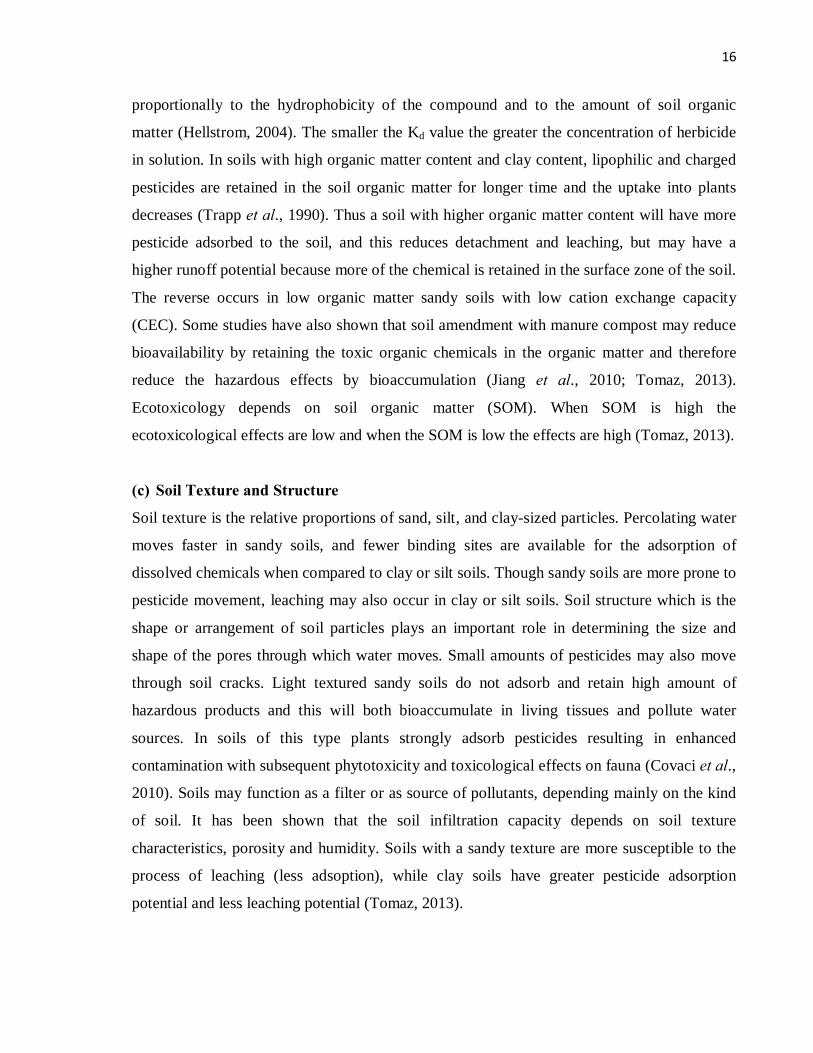
16
proportionally to the hydrophobicity of the compound and to the amount of soil organic
matter (Hellstrom, 2004). The smaller the Kd value the greater the concentration of herbicide
in solution. In soils with high organic matter content and clay content, lipophilic and charged
pesticides are retained in the soil organic matter for longer time and the uptake into plants
decreases (Trapp et al., 1990). Thus a soil with higher organic matter content will have more
pesticide adsorbed to the soil, and this reduces detachment and leaching, but may have a
higher runoff potential because more of the chemical is retained in the surface zone of the soil.
The reverse occurs in low organic matter sandy soils with low cation exchange capacity
(CEC). Some studies have also shown that soil amendment with manure compost may reduce
bioavailability by retaining the toxic organic chemicals in the organic matter and therefore
reduce the hazardous effects by bioaccumulation (Jiang et al., 2010; Tomaz, 2013).
Ecotoxicology depends on soil organic matter (SOM). When SOM is high the
ecotoxicological effects are low and when the SOM is low the effects are high (Tomaz, 2013).
(c) Soil Texture and Structure Soil texture is the relative proportions of sand, silt, and clay-sized particles. Percolating water
moves faster in sandy soils, and fewer binding sites are available for the adsorption of
dissolved chemicals when compared to clay or silt soils. Though sandy soils are more prone to
pesticide movement, leaching may also occur in clay or silt soils. Soil structure which is the
shape or arrangement of soil particles plays an important role in determining the size and
shape of the pores through which water moves. Small amounts of pesticides may also move
through soil cracks. Light textured sandy soils do not adsorb and retain high amount of
hazardous products and this will both bioaccumulate in living tissues and pollute water
sources. In soils of this type plants strongly adsorb pesticides resulting in enhanced
contamination with subsequent phytotoxicity and toxicological effects on fauna (Covaci et al.,
2010). Soils may function as a filter or as source of pollutants, depending mainly on the kind
of soil. It has been shown that the soil infiltration capacity depends on soil texture
characteristics, porosity and humidity. Soils with a sandy texture are more susceptible to the
process of leaching (less adsoption), while clay soils have greater pesticide adsorption
potential and less leaching potential (Tomaz, 2013).

17
(d) Soil pH Soil pH will affect the electrical charge of certain pesticides. The electrical charge will
determine the type and degree of adsorption. It also affects the ionic or molecular character of
the chemical, the ionic character and the cation exchange capacity (CEC) of the soil colloids,
as well as the activity of soil microorganisms (Rao, 2000). Non-ionic herbicides such as the
chloroacetamides do not react with water and do not carry any electrical charge, but they are
still affected by soil pH as they are polar in nature. Differences in the pH of the soil affect its
ability to adsorb and retain herbicide molecules, thereby affecting leaching of the herbicide
through the soil profile. Different herbicides respond differently to changes in soil pH and Soil
pH has been shown to affect the speed of degradation of chloracetamides. Liu et al. (2002)
reported that the greatest degradation of acetochlor took place under strong alkaline conditions
(pH 12) and was lower under acidic conditions (pH < 5). However, soil pH also affects
microbial degradation of the herbicide as it influences the microbial life in the soil. Microbe
numbers tend to increase in soils with a neutral pH, resulting in a faster loss of activity in
these soils due to greater microbial activity (Rao, 2000). Soil pH influences the growth of
microorganism, for instance bacteria and actinomyces are favored by soils having a medium
to high pH and their activity is reduced below pH 4.5. Hence the persistence, uptake as well as
bio-accumulation of butachlor are enhanced at low pH. Butachlor is easily hydrolysed at
alkaline pH and as such not effective in the soil with high pH since alkaline pH favours the
growth of microorganisms that enhance its degradation (WSSA, 2002).
(e) Soil Moisture Herbicide adsorption and phytotoxicity is very dependent on soil moisture, which is important
for herbicide movement, particularly the herbicide is moving through mass flow (Rao, 2000).
The amount of moisture in the soil affects the amount of the herbicide particles that can be
adsorbed by the soil, as these molecules tend to compete with water molecules for absorption
sites on mineral colloids. The space available for herbicides to go into solution also decreases
as soils dry out, as such less free herbicide is present in dry soils. Under dry conditions, plants
are therefore less likely to absorb toxic concentrations of herbicide (Rao, 2000). When soil
moisture is replenished, herbicide will desorb from the colloids and re-enter the soil solution.
18
1.9 Fate of Herbicides in Soil Ecosystem Most herbicides are applied as water based sprays using ground equipment or applied aerially
using helicopters or air plants. The ground equipment varies in design, it could be self-
propelled sprayers, towed handled, or horse drawn sprayers. The metabolic fate of herbicides
is dependent on abiotic environmental conditions (temperature, moisture, soil pH etc)
microbial or plant species (or both), herbicides characteristics (chemical or physical-
hydrophobicity, pKa, Kow, etc (Schnoor, 1996; Lyman, 1995). In the environment, organic
pollutants such as herbicides can be degraded by Abiotic: chemical (Sarmach and Sabadie,
2002), photochemical (Nelieu et al., 2001) or by Biotic/biological processes (van Eerd et al,
2003). Other ways by which herbicides can be removed from site of application via physical
processes include; surface run-offs from agricultural lands into streams or rivers, adsorption
by soil particles (Hamilton and Crossley, 2004). Degradation rates after release to the
environment vary widely between substances, with half-lives from minutes to many years.
Degradation rates and the half-lives of herbicides are specific for one location and season. The
following are ways of degradation of herbicides.
1.9.1 Chemical/Photochemical Degradation: These are abiotic processes that result in the
chemical or physical breakdown of the chemical components of the pesticides(herbicides)
leading to reactions such as oxidation, hydrolysis of the chemicals into ground water (leaching
into solution), reduction, photolysis and volatilization. Chemical decomposition of herbicides
in soils is affected by soil moisture, pH, herbicide adsorption, soil temperature and types of
ions that are present in the soil solution (Hamilton and Crossley, 2004)
(a) Photo decomposition: The molecules of some herbicides are unstable in light (ultraviolet)
thus they are readily degraded by light when left on soil surface for an extended period of
time. This process plays an important part of the degradation of pre-emergence herbicides.
Ultraviolet ion is absorbed by the molecules of these light sensitive herbicides and this
destabilizes the herbicide molecules, causing them to lose their herbicidal activity or become
more phytotoxic. At UV wavelengths reaching the earth’s surface, sunlight has sufficient
energy to cause direct photochemical reactions by rearranging or cleaving carbonyl double-
bonds, carbon–halogen, carbon–nitrogen, some carbon–carbon, and peroxide O–O bonds, but
not enough to cleave most carbon–oxygen or carbon–hydrogen bonds (Mill, 1993). Lyman
19
(1995) states that the end result of photolysis may include such reactions as dissociation or
fragmentation, rearrangement or isomerization, cyclization, photo-reduction by hydrogen-ion
extraction from other molecules, dimerization and related addition reactions, photoionization
and electron transfer reactions.
Photolysis is relatively insensitive to temperature and pH effects compared to hydrolysis
(Mill, 1993). However, as would be expected, photolysis is strongly affected by factors
influencing the spectral distribution, intensity and duration of sunlight. Such factors include
latitude, time and date, cloud cover, dust, etc. and the extent of absorption of UV–βradiation
by atmospheric ozone. Laboratory studies have generally found that direct or indirect
photolysis occurs more slowly on soil surfaces than in water. Only a thin layer of soil is either
reached directly by photons or indirectly by diffusion of reaction products such as singlet
oxygen. Hence, the extent to which photolysis occurs is affected by the amount of exposure of
the soil surface to sunlight and the amount of pesticide available at the soil surface. Once
incorporated into the soil by cultivation or leached in by rain or irrigation, a large proportion
of pesticide is likely to be unavailable for photolysis, unless returned to the surface by
volatilization (Hamilton and Crossley, 2004). The rate and extent of photochemical
degradation depends on the chemical nature of the compound, the wave length of light and the
presence of other chemicals (Stamgroom et al., 2000). The acetamides are slow to undergo
photolyzed reaction particularly under soil conditions. Photodecomposition of butachlor
involves debutoxymethylation, dechlorination followed by hydroxylation, O-dealkylation and
polymerization.The photodecomposed products include 2chloro-2, 6, diethyl acetanilide, 2
Hydroxy 2, 6 diethyl N-(butoxymethyl) acetamide and N-2’, 6’ – diethylphenyl 2, 3
dihydrosazole 4-one (Lin et al., 2000)
(b) Volatilization: Volatility is a physical process in a substance and involves a change from
a solid or liquid state to gaseous state. Soil applied herbicides compete with soil moisture for
sites on soil colloids. Herbicides molecules loosely held to soil colloids may be moved to the
soil surface with water by capillary action and lost to the atmosphere by volatilization. It is
highly dependent on the physical properties of the molecule; vapour pressure, octanol/water

20
partition coefficient, water solubility, adsorption coefficient, the type and condition of the
surface on which the herbicide is deposited (Hodgson and Goldstein, 2001; Mill, 1993).
(c) Hydrolysis: This refers to the cleavage of a bond and formation of a new bond with the
oxygen atom of water, i.e introducing HOH or OH into the molecule gives the generalization
that hydrolysis may be important in any molecule where alkyl, carbonyl or imino carbon
atoms are linked to halogen, oxygen or nitrogen atoms or groups through σ-bonds. Hydrolysis
may occur abiotically or biotically and this is a major means of chemical alteration in the
degradation pathways of many pesticides. Abiotic hydrolysis may be the principal means of
pesticide degradation where biological activity is low. These reactions may be strongly pH-
dependent, occurring in the presence of H2O, H3O+ and OH− to varying degrees (respectively,
neutral, acid and base hydrolysis), and related to the acid–base dissociation characteristics
(pKa) of the molecule. The rate of hydrolysis increases with increasing temperature, and may
be affected by other environmental factors, such as whether the pesticide is present in solution
or adsorbed to particles. In general, hydrolysis products are more polar than the molecules
from which they are derived and may be significantly more water soluble and less subject to
bioaccumulation (Holland and Sinclair, 2004).
(d) Solubility: This process shows the capacity of a pesticide or a chemical to dissolve in
water, Solubility is often expressed in milligrams per liter (mg/l) or parts per million (ppm).
Pesticides with high degree of solubility enjoy greater tendency to pass through the soil and
reach to groundwater. Others with solubility of less than 1.0 mg/l are normally strongly
adsorbed or attached to sediment and loss to surface waters via soil erosion and is of primary
environmental concern. Herbicides differ in their solubility in water; the greater the solubility
of an herbicide, the greater the amount of that herbicides that gets into soil water.
(e) Adsorption-desorption: Adsorption refers to the adhesion of pesticide molecules on
the surface of soils. This adhesion is the result of physical or chemical attraction between
substances. Desorption is the reverse of adsorption and it refers to the tendency of pesticide
molecules to separate or become detached from the surfaces of soils to which they are
attached. The adsorption of a herbicide into the soil (based on Kd or Koc) can result in a
reduced ability of microorganisms to break it down, as the herbicide is less readily available
21
(or accessible) in the soil solution. Thus the greater the adsorption the less degradation on the
herbicide (Rao, 2000)
(f) Leaching: Leaching refers to the downward movement of water and its dissolved
substances in the soil. It is a physical process by which a herbicide may be removed from the
soil profile. Leaching of herbicides is affected by the chemical properties of the herbicide, the
soil texture, solubility of the herbicide, adsorption of herbicide and by the amount of water
reaching the soil (Holland and Sinclair, 2004)
(g) Persistence Persistence is the property of pesticides, which determines how long they can survive in the
environment. The degree of persistence is determined by the length of time a pesticide can
remain in the environment and also its effective durability in combating the target pests.
Persistence can be expressed in terms of half-life, or the time required for one-half of the
pesticide to discompose to products or other molecule than the original pesticide. Pesticides
with long degradation half-lives will typically have greater annual pesticide losses in runoff
than pesticides with smaller half-lives due to the longer key period where significant amount
of pesticides and precipitation occur (Leonard, 1990). The persistence of butachlor in soils
depends on many factors like soil moisture, soil temperature, organic matter content and
microbial activity (Charkroaborty et al., 1990; Kerle et al., 2007).
1.9.2 Biological Degradation: Abiotic degradation processes may be significant in the dissipation
of pesticides from air, soil and water. However, in many cases pesticides or their initial
degradation products are relatively stable to abiotic degradation processes. Pesticide residues
may also reach environments where conditions are unfavorable for abiotic degradation to
occur (e.g. unsuitable pH for hydrolysis or protection from sunlight). Fortunately, biological
processes, primarily microbial metabolism, are often highly effective in assisting the
dissipation of pesticides once they reach the environment. It includes biotic processes such as
microbial or plant metabolism which is a major route of detoxification. However, herbicides
may be biologically unavailable because of compartmentalization which occurs as a result of
pesticide adsorption to soil and soil colloids without altering the chemical structure of the
original molecule (Holland and Sinclair, 2004).

22
(i) Microbial Degradation: Much microbial metabolism affecting herbicides in the
environment occurs through co-metabolism, i.e. metabolic reactions transform the herbicide
molecule incidentally, without the organism deriving energy or useful metabolites for cell
growth or division, or only using a portion of the molecule. Microbial activity may also lead
to polymerization involving pesticide or metabolite molecules, amide and ether hydrolysis
dealkylation, dehalogenation, hydroxylation of aromatic ring, oxidation and additions such as
acetylation or methylation, or conjugation with endogenous substrates such as glycosides or
amino acids. Changes to the original molecule through these processes may assist in
detoxification and elimination of the pesticide. Microbial Metabolism/cometabolism
(Aerobically or Anaerobically), takes place through enzymatically mediated oxidative or
reductive reactions or other degradative processes mediated by hydrolases, amidases etc.
Microorganisms such as bacteria, possess or use several enzymatic pathways including a
variety of xenobiotic metabolizing enzymes to protect themselves against the potentially toxic
effects of pesticides. The metabolic fate of xenobiotics (pesticides) involves two phase
metabolism including cytochrome P450 mediated- Phase I reactions (in some microorganism)
and the transferase-mediated conjugation reactions (Phase II) (Van Eerd et al,
2003).Metabolites formed by organisms initially taking up a pesticide may be amenable to
assimilation by other organisms, so enabling degradation to proceed (Holland and Sinclair,
2004). Microbial breakdown tends to increase when temperatures are warm, soil pH is
favourable, soil moisture and oxygen are adequate and soil fertility is good (Rao, 2000).
Butachlor is readily degraded by soil microbes. Under aerobic conditions the half-life of
butachlor ranges from 3-5 weeks under laboratory conditions. Under anaerobic conditions
degradation of butachlor in soil was accelerated (Roberts and Hutson, 1999). Studies have
shown that organic amendments hastened the degradation of butachlor due to the presence of
microbes (Prakash and Suseela, 2000).
(ii) Mineralization: This is the microbial conversion of an compound from an organic
form to an inorganic form as in pesticide degradation whereby it results to carbon dioxide,
ammonia or water as a terminal metabolite. Soil micro-organisms biotautilize the herbicide as
a source of carbon or other nutrients. Chemicals such as 2, 4-D are rapidly broken down in
the soil while others are less easily broken down e.g 2,4 5-T. Though, some others such as
23
atrazine are very persistent and are slowly broken down (Stephenson and Solomon, 1993).
Mineralization of pesticide molecules by microorganisms often occurs only slowly or to a
very limited extent, although the parent molecule may be significantly altered. Mineralization
may be indefinitely delayed by incorporation of residues into soil organic matter. Assimilation
of useful portions of the original molecule (e.g. as protein) may also delay release of carbon as
carbon dioxide(CO2), nitrogen as ammonia(NH3), etc., with those components again being
assimilated by higher organisms in the food chain and potentially being incorporated into
human foods without being completely mineralized. Residues of unchanged pesticide or
metabolites may persist and may accumulate with repeated use. The extent to which such
residues are bioavailable depends on their water solubility and the strength of adsorption or
binding to soil or sediment (Holland and Sinclair, 2004).
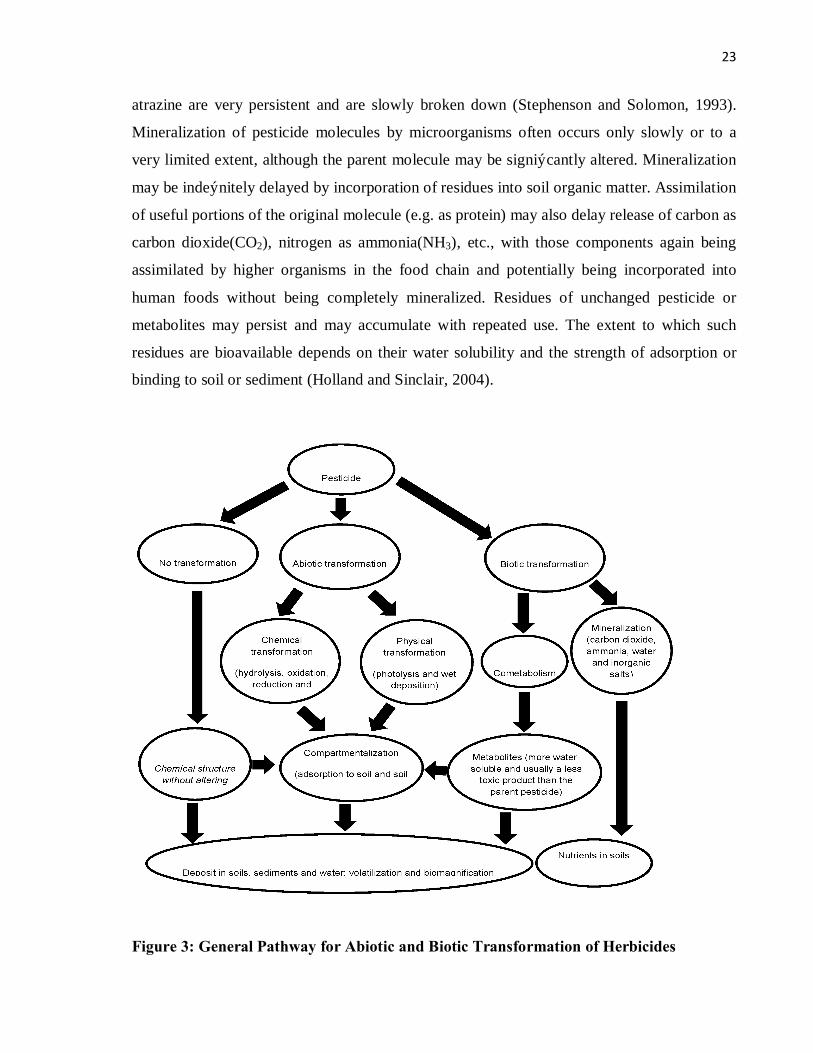
Figure 3: General Pathway for Abiotic and Biotic Transformation of Herbicides

24
1.10 Metabolism of Herbicides in Plants Non-target species may have one or a combination of responses to ultimately detoxify an
agrochemical. Development of a detoxification mechanism depends on three factors, concentration of
the herbicide present, environmental conditions and plant characteristics. Some non-target plants
growing on pesticide-polluted environments may experience local extinction due to non-tolerance
(Boutin et al, 2000). The qualitative and quantitative nature of residues in a biological system
following its exposure to a pesticide or its metabolites is a function of the following processes: • Absorption – movement across a biological cell wall or membrane
• Distribution – transport within the system
• Metabolism – biological or chemical modification of the pesticide
• Elimination – the pesticide or the products of metabolism are eliminated from active
cell processes.
(a) Absorption
Is the movement of xenobiotic across the membranes into the plant tissue. This includes
absorption from the site of exposure and subsequent absorption from the systemic circulation.
Xenobiotics can pass into and out of cells by passive diffusion or active transport mechanisms
(Sterling, 1994). It is concluded that weakly acidic herbicides can reach a higher concentration
in the cell than that on the outside due to ion trapping in the alkaline components of the cell.
The cytoplasm has a pH of approximately 7.5. Weakly basic herbicides are described as
accumulating in the more acidic cell compartments such as the vacuole, pH 5.5.
(b) Distribution The degree and manner in which a herbicide is taken up and distributed within the plant is
dependent on the physical and chemical properties of the herbicide. Plants take up pesticides
mainly through leaf surfaces, fruits and roots; once inside the plant, the pesticide can be
distributed within the plant either from cell to cell or via the vascular system. A pesticide
taken up by roots from the soil can take alternatively or simultaneously, two pathways to
reach the xylem vessels where it is moved to the top of the plant with the transpiration stream
in the xylem (1) the Apoplastic pathway (2) the Symplastic route.(Rao, 2000)
25
1. The Apoplastic System includes all the non-living portions of the plant cell walls and
xylem elements that form a water permeable continuum through which both short and long-
distance solute transport occurs and this is by mass flow and diffusion (passive transport).
The main function of the xylem is to transport water and dissolved solutes from the roots to
the foliage part of the plant. Some herbicides such as atrazine and diuron move mainly on the
apoplastic system. These herbicides are taken up by plant roots and move upwards in the
transpiration stream, leading to the accumulation of these herbicides in the leaf margins, and
as a result yellowing of these leaves. Herbicides that move mainly in the apoplast do not
accumulate in the growing points of plants or tissues of high metabolic activity (metabolic
sink) but may be adsorbed on the cellulose tissues of the cell wall (Rao, 2000).
2. The Symplastic System: This is the living plant tissue bounded by the plasmalemma and
connected via plasmodesmata. It is the continuum of interconnected protoplasm of living cells
of plant. It is a reactive environment that places chemicals in proximity to enzymes and other
reactants. Movement within the conductive portion of the symplast (Phloem) occurs by mass
flow and diffusion (active transport). Some herbicides appears to be restricted to either the
apoplastic (xylem) or symplastic (phloem) pathways while others termed ambimobile, move
in both domains. Non polar or less lipophilic herbicides take the apoplastic pathway and polar
or more lipophilic herbicides such as 2,4-D, glyphosate and paraquat tend to take the
symplastic pathway (Sterling, 1994). Herbicides that move in the symplastic are
characterized by a tendency to accumulate in the sinks of treated plants (i.e. growing points of
plants or tissues). They are generally inhibitors of metabolic activities directly associated
with growth (Rao, 2002)
(c) Metabolism In general plants have mechanisms for the degradation or sequestration of most pesticides.
These metabolic transformations, which include degradation and detoxification, occur in both
tolerant and susceptible plant species, but in the tolerant species they take place at a rate much
faster than herbicide accumulation and before the chemical can disrupt the metabolic
processes. In susceptible plants species, the herbicide undergo transformations in small
amounts and more slowly. Some herbicides undergo metabolic transformations that may
result in increased phytotoxicity (Rao, 2000). Most often, these biotransformation
mechanisms are independent of the mode of action and physiological lesions involved in the
26
pesticidal activity. However they relate to the functional or reactive groups or linkages in the
compound which are susceptible to enzymatic or chemical breakdown (Rao, 2000).
There is growing concern from ecological standpoint about the accumulation of herbicide
residue in plant either in the form of the parent compounds or their metabolites. The pathways
of metabolism depend on the balance of enzymes of various capabilities, present in different
plant species, and the chemical reactions that are possible. The rate of metabolic attack on a
pesticide by plants varies with the species type, the time of residence in or on the plants and
the degree of entry into the plants. With some major exceptions, microorganisms, insects,
plants and mammals metabolize foreign organic compounds by the same major pathways
(Hatzois, 1991). The processes in plants are in most cases slower than in animals however
most animals have better degrading, circulating and excreting systems than plants. Plants tend
to store pesticides and their metabolic products for longer periods and pesticide metabolism
generally results in detoxification but at times, the transformation products have equal if not
greater toxicity than the respective parent compound (van Eerd et al., 2003)
Plant metabolism can be divided into three phases; Transformation (Phase I), Conjugation
(Phase II), and Storage (Phase III) processes. The initial metabolic reactions (Phase I
reactions) are primarily catalyzed by cytochrome P450 enzymes by the generation of functional
groups (hydroxyl, carboxylic acid and amine groups) in the pesticide structure using different
transformational mechanism such as oxidation, reduction or hydrolysis to produce a more
water soluble and usually less toxic product than the parent (van Eerd et al., 2003).
The second phase involves the conjugation of a pesticide or pesticide metabolite from phase I,
to a sugar, amino acid, or glutathione which are soluble conjugates and increases the water
solubility thus reduces toxicity compared with the parent pesticide. The major plant products
involved in conjugation are glucose, malonic acid, amino acids and glutathione and the
conjugated products can be esters, amides, ethers, thioethers or glycosides. Glutathione
conjugation is an important phase II transformation in plants (Hatzios, 1991). In the presence
of the enzyme glutathione S-transferase, glutathione reacts within a range of substrates
including epoxides, aryl and alkyl halides, and other electrophilic compounds. Glutathione S-

27
transferases are homo or heterodimer, multifunctional enzymes located in the cytosol, which
catalyze the nucleophillic attack of the sulphur atom of GSH by the electrophilic centre of the
substrate (Armstrong, 1994). Glutathione S-transferases in plant were first studied because of
their ability to detoxify herbicides (Marrs, 1996) and GST based metabolism imparts
herbicide selectivity in several plant species The enzymatic conjugation of xenobiotics with
glutathione (GSH) via glutathione-S-transferase (GST) is more common than non-enzymatic,
however, the non-enzymatic conjugation has been shown to occur in metabolism of several
herbicides including triazines, acetamides and sulphonylureas in species where the GST
activity in plant was low (Tal et al., 1995). Phase II metabolites have little or no phytotoxicity
and may be stored in the vacuoles (Sanderman, 1992; Korte et al., 2000).
The third phase involves the conversion of phase II metabolites into secondary metabolites
which may also be non-toxic (Hatzios, 1991). It involves reactions such as hydroxylation,
alkylation, polymerization etc. Reactions of this third phase results in the formation of non-
extractable or bound residue. As in co-polymerisation of pesticides with lignin to form
insoluble structures (Skidmore et al., 1998). Three major pathways have been detected for
phase III reactions in plants; export into cell vacuoles, export into the intracellular space, and
deposition into lignin or other cell components (Roberts, 2000). The Phase III reaction is a
natural regulatory mechanism by which the plant decreases water solubility of their
pesticide/residue thereby reducing their reactivity and toxicity. It also reduces mobility of
pesticides in the plant symplast and allows their removal to vacuole apoplast or plant matrix.
Several enzymes have been detected in plants that were active against pesticides. Butachlor is
metabolized rapidly, primarily to polar water soluble metabolites. Its detoxification may
involve GSH or hGSH conjugation (Abass, 2010).
(d) Elimination Although, plants do not have a classical excretory system, they do effectively eliminate
xenobiotic compounds by removing them from active cell processes by storage in the cell
vacuole, which is a large fluid filled cavity within the cell bounded by a membrane called the
tonoplast, with the fluid containing sugars, salts, pigments and waste products dissolved in
water (Cole, 1994), or by reaction with the structural compartments of the plant, e.g. lignin
28
and cellulose, or by exudation from the roots into the soil (Walker et al., 1994), or through
volatilization. Pesticide residues eliminated from cell processes by reaction with lignin and
cellulose represent bound residues and require specific assessment of their relevance during
risk assessment.
1.11 Metabolism of Herbicide in Animals Animals that feed on plants may ingest one or more herbicide/residue produced in or on the
plant and this is subject to metabolism either by bacteria in the intestine or it is absorbed
alongside with that via the skin and respiratory tract and then transported to the liver; the liver
being the primary site of pesticide transformation for the purpose of facilitating clearance to
water–soluble products via detoxification. Some exogenous chemicals may be excreted
largely unchanged (original form), but most persistent environmental contaminants are highly
lipophilic and require metabolic conversion before elimination from the organism (Ahokas et
al., 1994). Xenobiotic biotransformation is the process by which lipophilic compounds (e.g
pesticides) are metabolised through enzymatic catalysis to hydrophilic metabolites that are
eliminated directly or after conjugation with endogenous cofactors via renal or biliay
excretions. (Oesh et al., 2000)
Without biotransformation, lipophilic xenobiotics would be excreted from the body so slowly
that they would eventually overwhelm and kill the organism (Parkinson, 2001). Nonetheless,
this change in chemical properties may also result in changes in their biological activity; in
some cases, biotransformation not only leads to inactivation of toxic compounds, but can also
result in more toxic carcinogenic products (Stegeman and Lech, 1991). Xenobiotics
metabolism is divided mainly into two phases: Phase I and II.
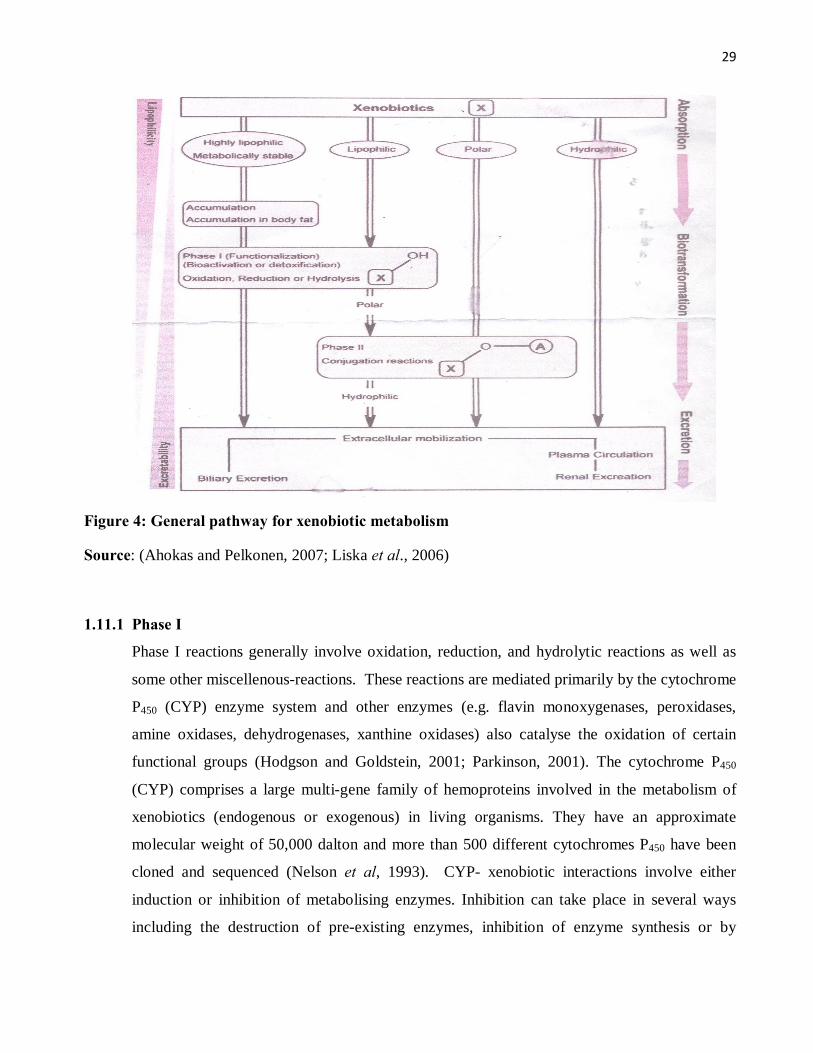
29
Figure 4: General pathway for xenobiotic metabolism
Source: (Ahokas and Pelkonen, 2007; Liska et al., 2006)
1.11.1 Phase I Phase I reactions generally involve oxidation, reduction, and hydrolytic reactions as well as
some other miscellenous-reactions. These reactions are mediated primarily by the cytochrome
P450 (CYP) enzyme system and other enzymes (e.g. flavin monoxygenases, peroxidases,
amine oxidases, dehydrogenases, xanthine oxidases) also catalyse the oxidation of certain
functional groups (Hodgson and Goldstein, 2001; Parkinson, 2001). The cytochrome P450
(CYP) comprises a large multi-gene family of hemoproteins involved in the metabolism of
xenobiotics (endogenous or exogenous) in living organisms. They have an approximate
molecular weight of 50,000 dalton and more than 500 different cytochromes P450 have been
cloned and sequenced (Nelson et al, 1993). CYP- xenobiotic interactions involve either
induction or inhibition of metabolising enzymes. Inhibition can take place in several ways
including the destruction of pre-existing enzymes, inhibition of enzyme synthesis or by
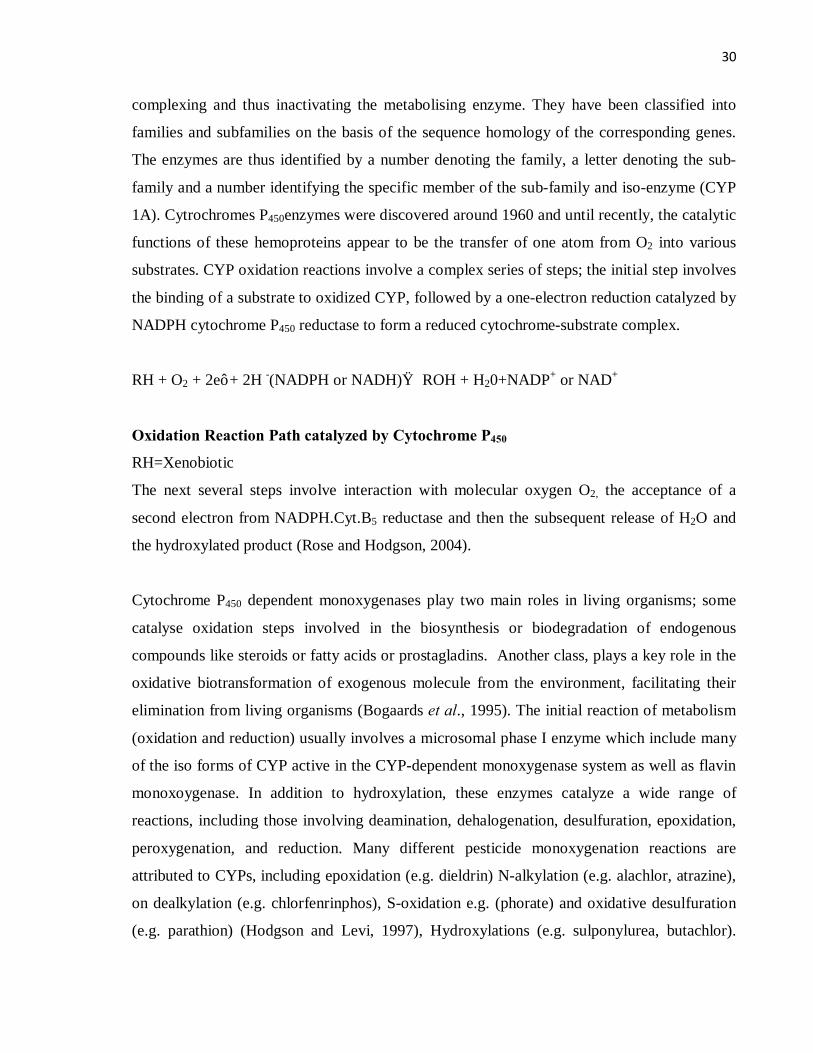
30
complexing and thus inactivating the metabolising enzyme. They have been classified into
families and subfamilies on the basis of the sequence homology of the corresponding genes.
The enzymes are thus identified by a number denoting the family, a letter denoting the sub-
family and a number identifying the specific member of the sub-family and iso-enzyme (CYP
1A). Cytrochromes P450enzymes were discovered around 1960 and until recently, the catalytic
functions of these hemoproteins appear to be the transfer of one atom from O2 into various
substrates. CYP oxidation reactions involve a complex series of steps; the initial step involves
the binding of a substrate to oxidized CYP, followed by a one-electron reduction catalyzed by
NADPH cytochrome P450 reductase to form a reduced cytochrome-substrate complex.
RH + O2 + 2e’ + 2H -(NADPH or NADH)→ ROH + H20+NADP+ or NAD+
Oxidation Reaction Path catalyzed by Cytochrome P450
RH=Xenobiotic
The next several steps involve interaction with molecular oxygen O2, the acceptance of a
second electron from NADPH.Cyt.B5 reductase and then the subsequent release of H2O and
the hydroxylated product (Rose and Hodgson, 2004).
Cytochrome P450 dependent monoxygenases play two main roles in living organisms; some
catalyse oxidation steps involved in the biosynthesis or biodegradation of endogenous
compounds like steroids or fatty acids or prostagladins. Another class, plays a key role in the
oxidative biotransformation of exogenous molecule from the environment, facilitating their
elimination from living organisms (Bogaards et al., 1995). The initial reaction of metabolism
(oxidation and reduction) usually involves a microsomal phase I enzyme which include many
of the iso forms of CYP active in the CYP-dependent monoxygenase system as well as flavin
monoxoygenase. In addition to hydroxylation, these enzymes catalyze a wide range of
reactions, including those involving deamination, dehalogenation, desulfuration, epoxidation,
peroxygenation, and reduction. Many different pesticide monoxygenation reactions are
attributed to CYPs, including epoxidation (e.g. dieldrin) N-alkylation (e.g. alachlor, atrazine),
on dealkylation (e.g. chlorfenrinphos), S-oxidation e.g. (phorate) and oxidative desulfuration
(e.g. parathion) (Hodgson and Levi, 1997), Hydroxylations (e.g. sulponylurea, butachlor).
31
CYPs are found in high concentrations in the liver, accounting for 1 to 2% mass of
hepatocytes (Lester et al., 1993) but are also present in a variety of other tissues including the
lung, kidney, the gastrointestinal tract, skin and brain (Husøy et al., 1994; Stegeman and
Hahn, 1994; Ortiz-Delgado et al., 2002).
1.11.2 Phase II
In phase II, the phase I products are not usually eliminated rapidly but undergo a subsequent
reaction in which endogenous substrates such as glucuronic acid, sulphuric acid, acetic acid or
amino acid combines with the new functional groups to form a highly polar conjugate to make
them more easily excreted. Some of the most prevalent reactions involved in phase II
reactions are sulfation, glucuronidation and glutathione conjugation (Rose and Hodgson,
2004). Glutathione S-transferase is important in the metabolism of organophosphorus
pesticides, halogenated herbicides such as the chloroacetanilides and chloro-S-triazines (Abel
et al., 2004b; Cho and Kong, 2007). The conjugation products are typically further
metabolized and in humans, excreted as urinary mercapturic acids. Interestingly, the addition
of GSH molecular weight of 307 to these 200- 300 molecular-weight xenobiotics creates a
product that exhibits a species-dependent disposition due to differences in size thresholds for
biliary transport in this range. In general these enzymatic reactions are beneficial in that they
help eliminate foreign compounds; however sometimes these enzymes transform an otherwise
harmless substance into a reactive form; a phenomenon known as metabolic activation.
Glutathione S-transferase, GST (E.C2.5.1.18) is a family of multi-functional proteins found at
relatively high concentrations in the mammalian liver as well as a wide variety of extra
hepatic tissues catalyzing the formation of conjugates between reduced glutathione (GSH) and
a wide variety of compounds including toxins, pesticides, and PAHs, etc (Eaton and Bammler,
1999; Halliwell and Gutteridge, 2007). The reaction between tripeptide glutathione and the
electrophilic centre of pollutants (xenobiotics) represent the main reaction of phase ΙΙ
detoxification. GSTs can catalyse neuclophilic aromatic substitutions, michael additions to
,β–unsaturated ketones and epoxide ring openings all of which result in the formation of
GSH conjugates and the reduction of hydroproxides, resulting in the formation of oxidized
glutathione (GSSG). GSH-conjugates are rarely excreted in the urine due to their high
molecular weight but could be eliminated in the bile. These conjugates could also be
32
metabolized further and excreted ultimately as mercapturic conjugates (Salinas and Wong,
1999; Sheehan et al., 2001)
R—X + Gluthathione Glutathione S-tranferase G—S—R + X---H
G—S—R + Acceptor γ glutamyl transferase Cysteinyl glycine—R + γGlutamyl acceptor
Cysteinyl glycine—R γ-glutamyl transpeptidase R—Cysteine + Glycine
R—Cysteine + Acetyl CoA N-acetyltransferase Mercapturic acid + Coenzyme A
Glutathione Conjugation of Xenobiotics and Mercapturic Acid Biosynthesis. R-X Substrate, G-S-R Glutathione Conjugate Source: Parkinson and Ogilvie (2009). In: Casarett & Doull’s Toxicology.
1.12 Metabolism of Butachlor in Animals
Metabolism of Butachlor in animals (rats) follow three major pathways
1) Cytochrome P450 mediated hydroxylation of the aromatic ring, its ethyl groups and the N-
buthoxymethylene group,oxidative removal and replacement of chlorine atom,N-dealkylation.
2) Cleavage of the amide bonds via aryl amidase to form 2, 6-diethylaniline which could be
further oxidized to 4-amino-3,5, diethyl phenol(liver)
3) Conjugation with glutathione followed by mercapturic metabolic pathway in the liver
(Singh et al., 1982; Ou and Lin, 1992).
Coleman et al. (2000) have also determined the metabolism of butachlor to 2 chloro N- 2,6-
diethylphenyl acetanilide (CDEPA) and 2,6-diethylaniline (DEA) both in rat and human liver.
Although the exact mechanism of carcinogenicity of butachlor is not known but the possible
mechanism involves the formation of a DNA-reactive metabolite, 2,6-diethybenzoquinone
imine (Ou et al., 2000). Prolonged exposure to butachlor has been found to be toxic to spotted
snakehead fish (Channa punctate), and accumulates through food chain (Tilak et al., 2007). It
has been reported to be neurotoxic to land snails,genotoxic to toads and frog tadpoles,

33
flounder and catfish (Ateeq et al., 2005; Geng et al., 2005a; Yin et al., 2007, 2008) and
causes DNA strand breaks and chromosomal abberrations in cultured mammamallian cells
(Sinha et al., 1995; Paneerselvam et al., 1999).
Figure 5: Metabolism of Butachlor in animals/plants (Singh et al., 1982)
2-----alcohol from oxidative dechlorination 13, 21---------methyl sulfones 3------Hydrolytic product of dealkylation and oxidation 11,19, 20- -----glucuronide sulfate conjugate 4------Oxanilic acid 18---------methyl sulfide 5 and 6-oxidation of butoxy moiety 14,15,16 and 17----mercapturic acids 7--------dechlorinated product 22 and 23-----sulfates from hydroxylation 9--------glutathione conjugate

34
1.13 Toxicity of Metabolites
In general, metabolites are less toxic than their parent compounds, because they are usually
more water-soluble and therefore, more rapidly excreted. There are notable exceptions for
which biotransformation results in an inherently more toxic product. Such reactions are
generally referred to as activation reactions. These reactive metabolites may combine
covalently with cellular constituents such as DNA, RNA, or protein; and carcinogenesis,
mutagenesis, and cellular necrosis are often attributable to such reactive metabolites
(Guengerich, 1992, 1993; Anders et al., 1992; Levi and Hodgson, 2001). Hollingworth et al.
(1995) reviewed reactive metabolites with particular reference to agrochemicals. The
metabolic production of a more toxic compound is sometimes called lethal synthesis to
emphasize that biotransformation in this instance is the source of danger. Of particular
concern has been the role of metabolic activation in the carcinogenic process, particularly in
the formation of DNA adducts by reactive metabolites. For example, monooxygenase
enzymes have been postulated to play a role in the metabolic activation of alachlor and
metolachlor (Feng et al., 1990; Jacobsen et al., 1991; Li et al., 1992).
1.14 Biomarkers of Pesticides in Animals/Plants/Soil. The need for early detection and assessment of the impacts of contamination in the aquatic
environment has led to the development of biomarkers (biological indicators) (Peakall, 1994).
A biomarker is generally used in a broad sense to include almost any measurement reflecting
an interaction between a biological system and a potential hazard, which may be chemical,
physical or biological (WHO, 1993). Biomarker can also be defined as a “change in a
biological response, ranging from molecular through cellular and physiological responses to
behavioural changes, which can be related to exposure to or toxic effects of environmental
chemicals (Peakall, 1994). Pesticide exposure in human can be measured in two ways, either
through direct monitoring by measuring biomarkers from individuals or by developing models
(plants, animals or micro-organisms) to assess exposure (Otitoju and Onwurah, 2007).

35
Biomarkers can be broadly divided into three main categories: exposure, effects, or
susceptibility. Selected biomarkers should indicate that the organism has been exposed to
pollutants (exposure biomarkers) and/or the magnitude of the organism’s response to the
pollutant (effect biomarkers or biomarkers of stress) (Cajaraville et al., 2000). A biomarker of
exposure consists of the measurement of a xenobiotic substance, a metabolite of a xenobiotic
substance, or an effect directly attributable to such a substance in an organism Biomarkers of
effect are alterations of physiology, biochemistry or behavior directly attributable to exposure
to a xenobiotic substance. Closely related to biomarkers of effect are biomarkers of
susceptibility, which indicate increased vulnerability of organisms to disease, physical attack
(such as low temperatures), or chemical attack from other toxicants. They serve as indicators
of a particular sensitivity of individuals to the effect of a xenobiotic or to the effects of a
group of such compounds. This can be genetic markers that include alterations in
chromosomal structure such as restriction fragment length polymorphism’s (RFLPs),
polymorphism of enzyme activities Furthermore, the criteria for any biomarkers, are that they
should be sensitive, reliable and easy to measure and that they should be related with the
“health” and “fitness” of the organisms (Stegeman et al., 1992). Pesticides have been shown
to be inducers or inhibitors of Cytochrome P450 and the mechanism of induction of CYP have
been demonstrated to be at either at the transcriptional or post transcriptional level (Bucheli
and Fent, 1995).
1.15 The Liver and Marker Enzymes The liver is the major organ involved in the biotransformation of xenobiotics which include
pesticides and as such it is rich in xenobiotic metabolizing enzymes which include
cytochrome P450 and glutathione S-transferase. The high level of oxidative metabolism in the
liver makes this organ a possible target for more toxic metabolic products activation when
detoxifying and protective mechanisms are overwhelmed (Murray et al., 1996). The liver is
also rich in aminotransaminases intracellularly since they are involved in the transfer of amino
groups between compounds (transamination reactions ). Changes in their activities reflect
changes in specific organ/tissue such as the liver (Marie, 1994). The liver enzymes AST and
ALT are usually low in the blood, so in most cases if liver cells are damaged, they may leak

36
into the plasma resulting to an increase in activity. Hence they are used as biomarkers of
injured hepatocytes, while alkaline phosphatase in some cases indicates bile duct epithelial
damage. These enzymes are commonly monitored clinically and in animal studies to detect
hepatotoxicity (Nelson and Cox, 2000).
1.15.1 Alanine amino transaminase (ALT) ALT is a cytosolic enzyme found predominantly in the liver but also smaller amounts in the
kidneys, heart, muscles, and pancreas. ALT catalyzes the reversible transamination of
oxaloacetate and L-alanine to L-glutamate and pyruvate. It is a more specific indicator of liver
damage than AST (Michel, 1998).
1.15.2 Aspartate amino transaminase (AST) AST is a cytosolic and mitochondrial enzyme found in the liver, heart, skeletal muscle,
kidneys, brain, and red blood cells. It catalyzes the reversible transamination of L-aspartate
and α-ketoglutarate to oxaloacetate and L-glutamate. Increase in AST however is not specific
for Liver damage since it is also found in other organs and tissues in high concentrations
(Murray et al., 1996)
1.15.3 Alkaline phosphatase (ALP) In Animals, alkaline phosphatase is present in all tissues throughout the entire body, but is
particularly concentrated in liver, bile duct, kidney, bone and the placenta. It catalyzes the
splitting of phosphoric acid from phosphoric esters. ALP is involved in the transport of
metabolites across cell membranes.It plays the role of phosphate metabolism and prevents the
external membrane from being damaged. ALP and ALT are used as markers for cell
membrane integrity (Murray et al., 1996)
1.16 Hepatotoxicity Chemically induced cell injury can be thought of as involving a series of events occurring in
the affected animal and often in the target organ itself. The events are as follows; (1)The
chemical agent is activated to form the initiating toxic agent, (2) the initiating toxic agent is
either detoxified or causes molecular changes in the cell,(3) the cell recovers or there are
irreversible changes,(3) irreversible changes may culminate in cell death.

37
When the concentration of the reactive metabolites exceeds the capacity of detoxification
systems, acute (necrosis) or chronic (mutagenesis, carcinogenesis and teratogenesis) toxicity
can occur. Thus anything that results in reduced biotransformation of a toxic metabolite to an
inactive metabolite or that increases the conversion of harmless xenobiotic to reactive
metabolite, increases the probability that a toxic response will occur (Hodgson and Levi,
1997).
1.17 Lipid Peroxidation
Lipid peroxidation is the metabolic process in which reactive oxygen specie (ROS) result in
the oxidative deterioration of lipids. Lipid peroxidation is a well-established mechanism of
cellular injury in both plants and animals, and is used as an indicator of oxidative stress in
cells and tissues (Gutteridge, 1995). Increased ROS production occurs in inflammation,
during radiation, or during metabolism of hormones, drugs and environmental toxins. This can
overwhelm endogenous protective antioxidant mechanisms and increase ROS-mediated
damage to membrane structure and function. Such ROS reactions can also lead to protein
damage, including DNA repair enzymes and polymerases, impairment, and production of
aldehyde by-products such as malondialdehyde (MDA) and 4-hydroxy-2-nonenal (HNE).
Lipid Peroxidation (MDA) and Antioxidants can be employed as biomarkers of tissue damage
(Gutteridge, 1995).
In Nigeria, studies have centered mainly on crude oil and petroleum products toxicity on
plants, aquatic organisms and animals (Omoregie et al., 1990; Chindah et al., 2001; Ubani et
al., 2012). Also studies on pesticide(herbicide) toxicity on aquatic animals (Chindah et al.,
2004; Nwani et al., 2013); however studies on the effects of pesticide(herbicide) exposure via
the food chain are scanty despite several decades of its introduction, the wide use and
magnitude. This research could give information on; (1) The possible bioaccumulation of this
herbicide in cultivated plants, (2) Whether the recommended/standard application rate as
stated by herbicide manufacturers, is safe and also (3) the effect of improper or excessive use
of this herbicide when applied.

38
1.18 Aim and Objectives of the Study
1.18.1 Aim of the Study The research work was aimed at assessing the possible bioaccumulation of butachlor/residues
in the leaves of an edible plant, (Phaseolus vulgaris) and assessment of it’s possible toxicity
in animal (rabbit) as indicative of its possible effect in man.
1.18.2 Specific Objectives of the study The study was carried out, following these specific objectives:
1) To cultivate the plant with the application of different concentrations of butachlor herbicide.
2) To assay for butachlor/residues and determine the bioaccumulation in the bean plant leaves.
3) To estimate the health risk index upon consumption of the butachlor herbicide//residue from
plant.
4) To assay the liver enzyme, total Cytochrome P450 as biomarker of exposure to pesticides
5) To assay the activity of the liver enzyme, Glutathione S-transferase as biomarker of exposure
to pesticides
6) To assay the activities of some liver marker enzymes (AST, ALP, ALT) in the rabbits.
7) To determine the histological evaluation of the liver tissues of the rabbit.

39
CHAPTER TWO MATERIALS AND METHODS
2.1 Materials
2.1.1 Chemicals
Acetone, n-hexane, anhydrous sodium sulphate, bovine serum albumin standard(BSA),
ethanol, potassium hydroxide, sucrose, hydrochloric acid, potassium chloride, copper sulphate
Folin ciocalteau, sodium hydrogen diphosphate, sodium phosphate, ethylenediamine tetracetic
acid, sodium chloride, formalin, haematoxylin and eosin stain, aspartate aminotransferase
(AST) randox kit, alanine aminotransferase (ALT) randox kit and alkaline phosphatase (ALP)
Quimca test kit, Butastar EC commercial formulation (50%w/v a.i.butachlor) manufactured
by Naintong Jiangchan Agrochemicals, China. Butachlor analytical standard 98.3% purity,
Reduced Glutathione and 1 chloro-2,4-dinitrobenzene solution (CDNB) were purchased from
Zayo-Sigma Aldrich, Total Cytochrome P450 Elisa kit by Antibodies Online, Germany. chromogenic substrate (phenolphthalein monophosphate) Colour Developer,Standard (30
U/L). Solution R1( Phosphate buffer,L-alanine and - oxoglutarate) Solution R2:2,4-
dinitrophenylhydrazine. Reagent1( Phosphate buffer,L-aspartate and oxoglutarate)Reagent 2(
2,4-dinitrophenylhydrazine). The Solutions for Protein Analysis include the following;
Solution 1:2% of Sodium carbonate (Na2CO3) in 1M Sodium hydroxide NaOH.2g Na2CO3 in
100ml 1M NaOH. Solution 2:0.5g CuSO4 in 1% of Na-K Tartrate Solution 3: 1ml of Sol.2 in
50ml Sol.1 Solution 4:1N Folin Ciocalteau (1:1dilution)
2.1.2 Equipment
Thermo Scientific Trace GC-MS Ultra, Cecil CE 7500-7000 series Aquarius UV-Vis
spectrophotometer, Centrifuge, pH meter, electrical weighing balance, mechanical scale,
rotary evaporator, microplate reader(450nm), refrigerator, freezer and incubator
2.1.3 Plant Material
The black bean (Phaseolus vulgaris) seeds popularly known as Akidi in Eastern Nigeria, were
obtained from the local market in Nsukka, cleaned, sundried and used throughout the study.
The picture of the seed is shown on page 40.

40
Figure 6: Black beans seeds (Phaseolus vulgaris): Akidi
Figure 7: Butastar commercial formulation of butachlor

41
2.1.4 Experimental Animals
Male rabbits (n=48) with average weight of 1.2kg- (Lop breed)were obtained from the Animal
House of the Department of Pharmacology, University of Nigeria, Nsukka. Growers marsh rabbit
feeds purchased from the local market in Nsukka.
2.1.5 Area of Study
The Field experiment was conducted at the Research Farm of the Department of Crop Science,
University of Nigeria, Nsukka for a period of 2months (May-July 2012). The Research farm is
located within the Nsukka Campus of the University and this lies within longitude 07o 29N
latitude 06 51E and 400miles above sea level (m.a.s.l). It is characterized by two peak rainfall
seasons.
2.2 Methods
2.2.1 Experimental Design
The study area had a 240m2 dimension and beds were constructed, each with a 10m2 dimensions
and a 0.5m distance maintained between the beds with a 1m furrow spacing. A plant spacing of
75cm between rows with a 50cm within rows was adopted for the bean plant (Dugjie et al., 2008).
Recommended application rate/dosage of herbicide at pre-emergence for bean is (4.0l/ha).
Butachlor at three different concentrations were applied to the plots at the pre-emergence stage;
T1-4.0 l/ha (2.6 kg a.i/ha), T2-4.4 l/ha (2.9 kg a.i/ha),T3-5.0 l/ha (3.2 kg a.i/ha). These
concentrations were adopted based on the pilot study that showed that the herbicide was
phytotoxic to the bean plant at certain concentrations.The bean seeds were planted and the
butachlor herbicide of different concentrations, applied at pre-emergence stage to crops and left to
grow for 5weeks. Concentrations of the standard application rate (T1-4.0l/ha) and different
application rates of herbicide (T2-4.4l/ha, T3- 5.0l/ha) were used on the crop separately. (The control
plot C did not receive herbicide application).
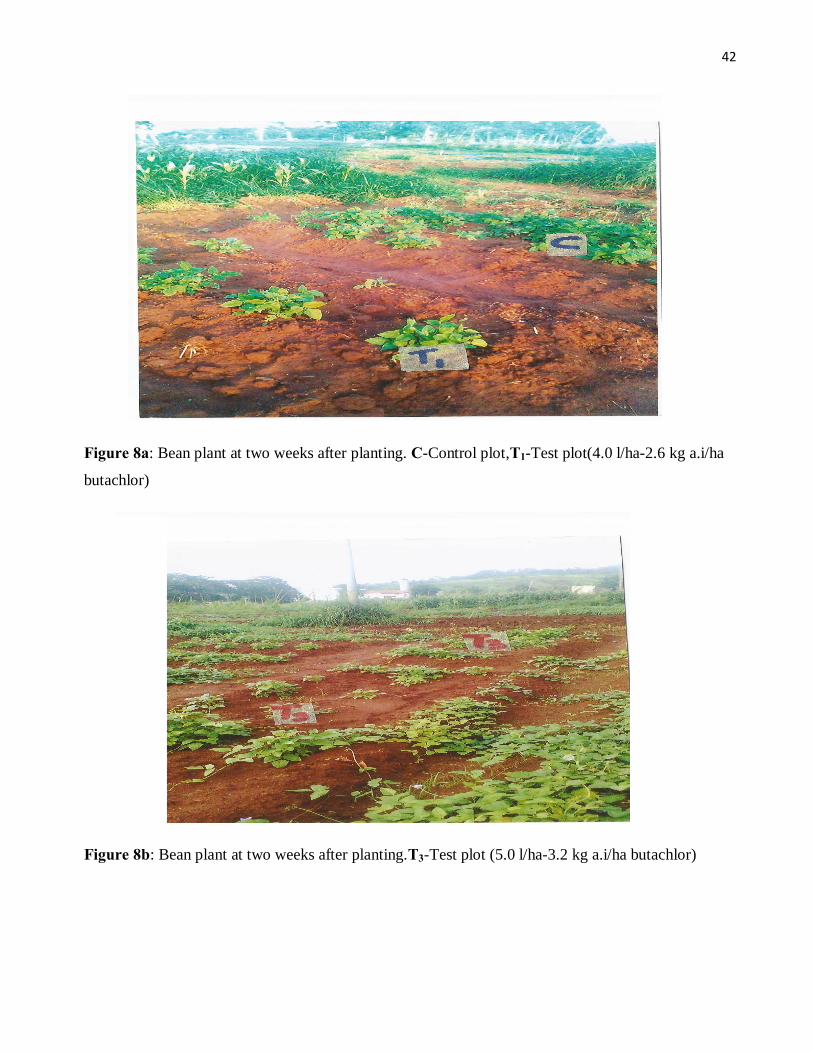
42
Figure 8a: Bean plant at two weeks after planting. C-Control plot,T1-Test plot(4.0 l/ha-2.6 kg a.i/ha
butachlor)
Figure 8b: Bean plant at two weeks after planting.T3-Test plot (5.0 l/ha-3.2 kg a.i/ha butachlor)

43
Figure 8c: Bean plant at four weeks after planting. T1-Test plot (4.0 l/ha-2.6 kg a.i/ha,T2-4.4 l/ha(2.9
kg a.i/ha), T3-Test plot(5.0 l/ha-3.2 kg a.i/ha butachlor
Figure 8d: Bean plant at six weeks after planting. T1-Test plot (4.0 l/ha-2.6 kg a.i/ha,T2-4.4 l/ha(2.9
kg a.i/ha)

44
2.2.2 Animal Protocol
The rabbits were kept in metabolic cages at the Animal House of the Department of Home
science and Dietetics UNN, to acclimatize for 7days prior to the commencement of the
experiment. They were maintained on a regular feed of grower’s marsh and water ad libitum.
The rabbits were divided into four (4) groups with three (3) subgroups each consisting of four
(4) rabbits. Group 1 served as the control group (with subgroups Days 1, 14, 28) all fed with
the plant cultivated without the application of butastar. Group 2 were animals fed with the
bean plant (leaves) cultivated with the application of 4.0 l/ha of the herbicide. Group 3 were
animals fed with the bean plant cultivated with the application of 4.4 l/ha of the herbicide,
while Group 4 were animals fed with the bean plants cultivated with the application of 5.0l/ha
of the herbicide. They were all fed with an average weight of 100g of the leaves per rabbit
twice daily (Iyeghe-Erakpotobor and Muhammad, 2008) and water ad libitum. Five milliliters
(5mls) of blood was collected from each animal via the jugular vein, on Days 1, 14 and 28 of
the experiment, into plain bottles for the enzyme assays. After days 1,14 and 28, the rabbits
were sacrificed by severing the jugular vein after light ether anaesthesia. Liver samples were
excised, washed and stored in 10% formal saline for histological examinations. Handling,
management and use of animals for experimentation were in conformity with laboratory
Animal Rights Regulation of the University of Nigeria, Nsukka.
2.2.3 Soil Analysis
Soil characterization was carried out in the Department of Soil Science UNN; by Bouyoucous
Hydrometer method (Bouyoucous, 1951). A known quantity of soil(100g) was collected from
a depth of 0-15cm.The physicochemical properties were analysed.
2.2.4 Plant Extraction of Butachlor Extraction of the herbicide from the bean plant leaves was carried out by solvent extraction
method using acetone/n-hexane. (1:1vol). Twenty grams(20g) of the bean plant leaves was
washed with deionized water, chopped and blended with 10ml deionized water, using a
national blender for 1min (4-5 cycles). A known quantity (100ml) of acetone and hexane was
added, shaken for 3mins and then filtered through a 10g anhydrous sodium sulphate in a
funnel. An additional 1:1vol of acetone and hexane were added to the residue, mixed

45
thoroughly and filtered again. Both filterates were mixed, centrifuged and the supernatant
removed and concentrated to 2ml using a rotary evaporator (Chang et al., 2005)
2.2.5 Identification and Quantification of Butachlor A stock solution (100 mg/l) was prepared with n-hexane, and working standard solutions with
concentration ranges of 0-2 mg/l (ppm) were prepared by dissolving in appropriate volume of
hexane. The herbicide/residue was determined using gas chromatography-mass spectrometry
(GC-MS).
A known volume of 1µl each of the six different concentrations of the standards and sample
were injected into the Thermo-Scientific Trace GC coupled to DSQ 11 mass spectrometer and
equipped with an AS 3000 auto sampler and a split/split–less injector. The column used was a
TR-5MS (30×0.25 mm i.d), 0.25m d.f coated with 5% diphenyl -95% polydimethyl siloxane
operated with the following oven temperature programme. Initial temp.:140oC, initial time:
1min, Increasing temp.: 8oC/min, Final temp, : 300oC held for 5mins, Injection temperature
and volume was 250oC and 1µl respectively, injection mode, mode, split/split 15:1 carrier gas:
Helium at 30cm/s linear velocity and inlet pressure 99.8KPa, detector temperature 280oC. The
components of the standard and sample were identified based on the basis of their retention
indices. Identification and confirmation was further done by comparison of their mass spectra
with published spectra (Adams, 1989) and those of reference compounds from library of
National Institute of Standard and Technology (NIST) database. Quantification of the sample
was done by comparison of the peak area and concentration to that of the analytical standards.
A plot of the peak areas versus concentration of the standards was made and from the linear
equations the unknown sample concentrations were then calculated (Chang et al., 2005).
2.2.6 Determination of Bioaccumulation Factor (BAF) The Bioaccumulation factor was calculated using the method of Connell (1990),as shown
below
BAF = gsurroundin in the mical)(Conc..cheAmount
system biologicalin mical)(Conc..cheAmount
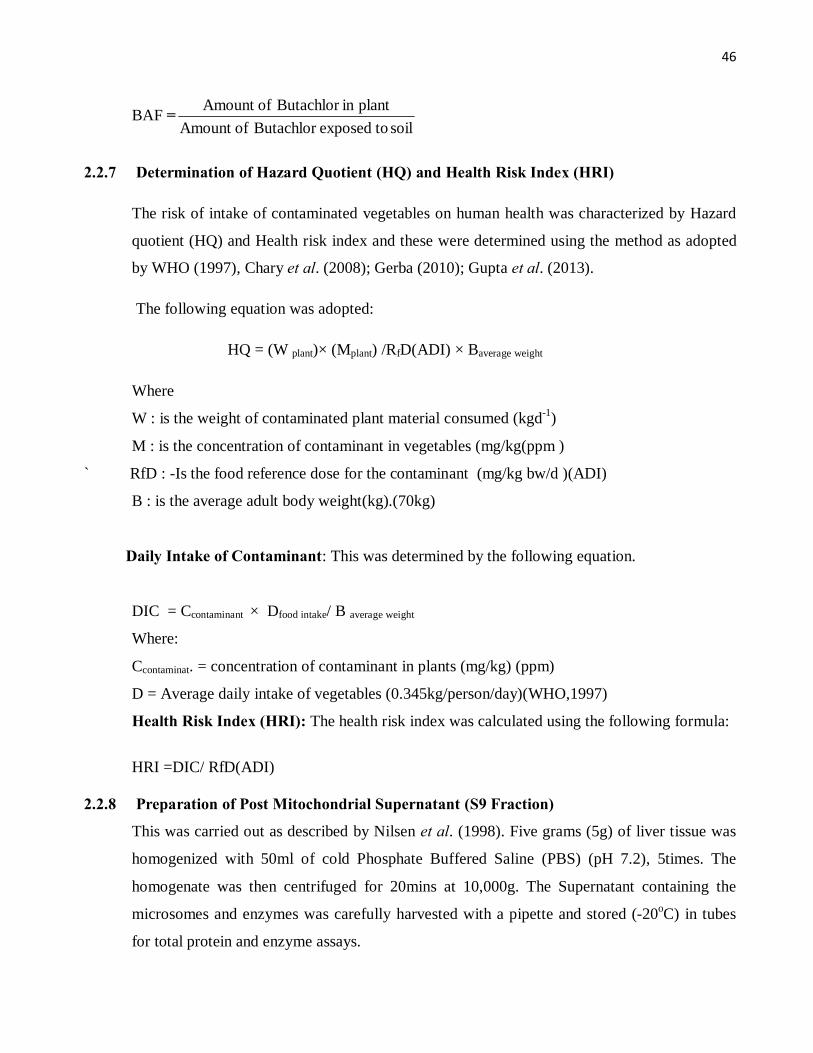
46
BAF =soil toexposedButachlor ofAmount
plantin Butachlor ofAmount
2.2.7 Determination of Hazard Quotient (HQ) and Health Risk Index (HRI)
The risk of intake of contaminated vegetables on human health was characterized by Hazard
quotient (HQ) and Health risk index and these were determined using the method as adopted
by WHO (1997), Chary et al. (2008); Gerba (2010); Gupta et al. (2013).
The following equation was adopted:
HQ = (W plant)× (Mplant) /RfD(ADI) × Baverage weight
Where
W : is the weight of contaminated plant material consumed (kgd-1)
M : is the concentration of contaminant in vegetables (mg/kg(ppm )
` RfD : -Is the food reference dose for the contaminant (mg/kg bw/d )(ADI)
B : is the average adult body weight(kg).(70kg)
Daily Intake of Contaminant: This was determined by the following equation.
DIC = Ccontaminant × Dfood intake/ B average weight
Where:
Ccontaminat. = concentration of contaminant in plants (mg/kg) (ppm)
D = Average daily intake of vegetables (0.345kg/person/day)(WHO,1997)
Health Risk Index (HRI): The health risk index was calculated using the following formula:
HRI =DIC/ RfD(ADI)
2.2.8 Preparation of Post Mitochondrial Supernatant (S9 Fraction) This was carried out as described by Nilsen et al. (1998). Five grams (5g) of liver tissue was
homogenized with 50ml of cold Phosphate Buffered Saline (PBS) (pH 7.2), 5times. The
homogenate was then centrifuged for 20mins at 10,000g. The Supernatant containing the
microsomes and enzymes was carefully harvested with a pipette and stored (-20oC) in tubes
for total protein and enzyme assays.

47
2.2.9 Determination of Liver Total Cytochrome P450 The liver enzyme cytochrome P450 (CYP) was assayed using a total cytochrome P450 ELISA
kit as described by Nilsen et al. (1998).
Principle of Assay It is a quantitative assay that employs the competitive enzyme immunoassay technique. The
microtiter plate in the kit has been pre-coated with an antibody specific for CYP. Standards
and samples are then added to the micro titer plate wells and CYP if present, will bind to the
antibody pre-coated wells. The horse radish peroxidase-conjugated to CYP is added to the
wells and further on the A and B substrate for the HRP added. The enzyme, HRP and
substrate were allowed to react over a short period of incubation, only those wells that contain
CYP and enzyme-conjugated will exhibit a change in colour to blue. The enzyme-substrate
reaction is terminated by the addition of a sulphuric acid solution and the colour changes from
blue to yellow, which is then measured spectrophotometrically at a wave length of 450nm
using a microplate reader. The intensity of the colour is inversely proportional to the
Cytochrome P450 concentration, since CYP from samples and CYP-HRP conjugate compete
for the anti-CYP antibody binding site, and since the number of site is limited, as more sites
are occupied by CYP from the sample, fewer sites are left to bind CYP-HRP conjugate.A
standard curve was plotted relating the intensity of the color (O.D) to the concentration of the
standards.
The post mitochondria supernatant (PMS) was used as the sample. Physiological saline was
used as dilution buffer (×10).The assay procedure was followed as stated by the manual in the
Kit
Reagent Preparation: All the kit components were brought to room temperature.
Procedure: The desired number of coated wells (48) was secured and100µl each of the six
standards and the diluted samples were added to the appropriate well in the antibody pre-
coated microtiter plate. A known quantity (100µl) of PBS (pH 7.2) was added in the blank
control well. Ten microliter (10 µl) of the balance solution was dispensed into the 100µl
specimens and mixed very well. Fifty microliter (50 µl) was then added to each well with the
exception of the blank and mixed very well. The Plate was covered and incubated for 1 hour
48
at 37oC. After the incubation, the microtiter plate was washed manually by aspirating the
contents of the plate into a sink, and washing with the wash solution. The wash solution was
prepared by diluting 10ml with 990 ml of distilled water. This was repeated four times (i.e. a
total of five washes). After washing, the plate was inverted and blot dried by hitting unto an
absorbent paper until no moisture appears. Fifty microliter (50 µl) of substrate A and 50 µl of
substrate B were added to each well including the blank control well, subsequently, the plate
was covered and incubated for 15mins at 37oC. Fifty microliter (50 µl) of the stop solution
was then added to each well and mixed very well. The optical density (O.D) was determined
immediately at 450 nm using the microplate reader. A standard curve was plotted with the
standard concentrations the O.D and the CYP concentration in each sample were then
interpolated from the standard curve.
2.2.10 Assay of Liver Glutathione S-transferase Activity
The catalytic activity of liver GST was measured spectrophotometrically at 340 nm by
modified method of Habig et al. (1974) with 1 chloro2-4 dinitrobenzene and GSH as
substrates.
Principle of Assay Glutathione-S-transferase catalyzes the conjugation of 1-chloro 2, 4 dinitrobenzene (CDNB)
and reduced glutathione to form a glutathione-conjugate. The increase in absorbance is
monitored spectrophotometrically at 340nm.
Procedure: A known quantity (2.7 ml) of phosphate buffer (pH 7.2) and 0.1ml each of
3.0mM chloro dinitrobenzene (CDNB) and 0.1M reduced glutathione were pipetted into test-
tubes, mixed and transferred into the cuvette of the spectrophotometer, then 0.1ml of the liver
PMS was added and mixed thoroughly by inversion and the change in absorbance was
monitored at 60secs interval for 180secs. The glutathione S-transferase activity was expressed
as U (nmole/min)/ml), where one unit of GST activity was calculated as nmol of 1 chloro 2-4-
dinitrobenzene conjugate formed per minute per ml enzyme.

49
Calculation:
3.0= total volume of of assay (millilitres)
Df= dilution factor (10)
9.6= Millimolar extinction coefficient of Glutathione -1-chloro-2,4-dinitro benzene
conjugate at 340nm
0.10= volume of enzyme used (millimeter)
2.2.11 Assay of Serum Alanine Aminotransferase (ALT) Activity
Liver marker enzymes such as alanine aminotransferase (ALT) and aspartate
aminotransferase (AST) activities were assayed by the method of Reitman and Frankel (1957)
using Randox test kit.
Principle of Assay
ALT catalyzes the reversible transamination of -oxaloacetate and L-alanine to L-glutamate
and pyruvate. The pyruvate reacts with 2,4-dinitrophenylhydrazinein the presence of NADH
to pyruvate hydrazone. ALT is measured spectrophotometrically at 546nm by monitoring the
concentration of pyruvate hydrazone formed with 2, 4dinitrophenylhydrazine.
-Oxaloacetate + L-alanine ALT/GPT→L-glutamate + pyruvate + 2,4 dinitrophenylhydrazine----
pyruvate hydrazine. To a known quantity (0.5 ml) of solution 1 of the randox test kit in tubes for samples and
reagent blank, 0.1 ml of the samples and distilled water were added accordingly, it was mixed
and incubated for 30 min in an incubator at 37oC. A 0.5 ml of solution 2 was then added to
tubes, mixed and allowed to stand for 20 mins at room temperature. A known quantity, 5 ml
of sodium hydroxide was the added to the tubes and mixed. The Absorbance of sample
(Asample) was read against the reagent blank after 5mins,using the UV spectrophotometer (546
nm).The activity of the ALT of the serum samples were read from the standard calibration
chart in international unit per litre (IU/L).

50
Calculation
ALT in Sample (IU/L) = Standard of Conc. standard Absorbancesample Absorbance
×
2.2.12 Assay of Serum Aspartate Aminotransferase (AST) Activity
Principle of Assay AST catalyzes the reversible transamination of L-aspartate and α-ketoglutarate to oxaloacetate
and L-glutamate. AST is measured spectrophotometrically at 546nm, by monitoring the
concentration of oxaloacetate hydrazine formed with 2,4-dinitrophenylhydrazine.
- ketoglutarate + L-aspartate AST/GOT L-glutamate + Oxaloacetate+ NADH + H+→2,4
dinitrophenylhydrazine →oxaloacetatehydrazine
Procedure To 0.5ml of Reagent 1 in tubes for samples and reagent blank, 0.1 ml of the samples and
distilled water were added accordingly, it was mixed and incubated for 30 minutes in an
incubator at 37oC. Solution 2 (0.5 ml) was then added to tubes ,mixed and allowed to stand
for 20 min at room temp. Sodium hydroxide (5ml) was the added to the tubes and mixed. The
Absorbance of sample (Asample) was read against the reagent blank at 546 nm after 5minutes,
using the UV spectrophotometer. The activity of the ALT of the serum samples were read
from the standard calibration chart in international unit per litre (IU/L).
Calculation:
AST in Sample (IU/L) = Standard of Conc.standard Absorbancesample Absorbance
×
2.2.13 Assay of Serum Alkaline Phosphatase (ALP) Activity
Alkaline phosphatase activity was assayed using the method of Klein et al. (1960) and
Quimica Clinica Applicada (QCA) test kit.

51
Principle of Assay Serum alkaline phosphatase hydrolyses a colourless substrate of phenolphthalein
monophosphate, producing a phosphoric acid and phenolphthalein which, at alkaline pH
turns into a pink colour, the concentration, an indication of the presence of alkaline
phosphatase and this can be spectrophotometrically measured.
Procedure To 1ml of the distilled water was added 1drop of substrate in tubes for samples and standard,
it was mixed and incubated at 37oC for 5 min. A quantity, 0.1ml of standard and sample were
then added, mixed and incubated at 37oC for 5 min, after which 5ml of colour developer was
added; The Absorbance of the samples and standard were read at 550 nm with the UV
Spectrophotometer. The activity of ALP was calculated using the formula on the test kit
manual.
Calculation:
130
standard of AbsorbanceSample of Absorbance
×
Where 30= standard solution of alkaline phosphatase in water
2.2.14 Determination of Liver Total Protein Concentration
Determination of liver total protein concentration was carried out by the method of modified
Lowry et al. (1951)
Principle of Assay Under alkaline conditions, the divalent copper ions form complex with peptide bonds in
which it is reduced to monovalent ions. Monovalent copper ions and aromatic protein residues
then react with Folin Ciocalteu reagent (a mixture of phosphotungstic acid and
phosphomolybdic acid) to produce a very unstable product that decomposes in alkaline to
molybdenum/tungsten blue (reduced folin reagent). The concentration of the reduced Folin is
measured spectrophotometrically at 750 nm. Thus the total concentration of protein in the
sample can be deduced from the concentration of aromatic residues that reduce the Folin
reagent.

52
Procedure
To a known quatity of 0.1ml of PMS in sample test tube, 5ml of solution 3 and incubated at
50oC for 5 mins; then cooled to room temperature. A 0.5 ml of solution 4 was then added,
mixed and incubated at room temperature for 30minutes. A protein standard bovine serum
albumin (BSA) 2mg/ml was used to prepare series of concentration ranges (0-2 mg/ml). The
Absorbances were read at 750 nm and a plot of the absorbances against concentrations gave
the standard curve; the unknown concentrations of protein in the PMS test samples were
calculated as follows;
Calculation:
Absorbance of standard
2.2.15 Determination of Mean Body Weight of Rabbits
Mean body weight were carried out with the use of a weighing balance. The rabbits were
weighed on the Days 1, 14 and 28
2.2.16 Histological Evaluation of Liver Tissues of Rabbits The histological evaluation was carried out as described by Bancroft et al., 1996. Tissue
specimen from the liver of the control and experimental animals were sectioned, fixed in 10%
buffered formalin and dehydrated in ascending grades of ethanol. Thereafter, the tissue
sections were cleared in chloroform overnight, infiltrated and embedded in molten paraffin
wax. The blocks were later trimmed and sectioned at 5—6µm thickness. The sections were
deparaffinized in xylene, taken to water, and subsequently stained with haematoxylin and
eosin (H & E). The stained slides were studied under a photomicroscope with a magnification
of × 400 (Bancroft et al, 1996).
2.3 Statistical Analysis The results were expressed as mean + S.D. Comparisons were made between control and
treatment groups and using one way and two-way analysis of variance (ANOVA) SPSS
version 17; and subjected to LSD post hoc test for multiple comparison. Duncan new multiple
range test was used to compare means. Values at p ˂ 0.05 were regarded as statistically
significant.
53
CHAPTER THREE
RESULTS
3.1 Soil Analysis The result of the soil analysis revealed that the textural class of the soil was observed to be
Sandy-Clay-Loam, with the percentages of particle size( total sand and clay), pH , organic
matter content, cation exchange capacity , carbon, nitrogen and phosphorus contents as shown
in Table 1 .
3.2 Chromatograms of Butachlor in the Standard and Phaseolus Vulgaris Leaf Extracts
The chromatograms of two of the six butachlor standards are shown in Figures 9-10. The gas
chromatography-mass spectrometry was able to detect the parent butachlor ion in the plant
extract. Figures 11 a, b and c show the test sample 3(T3), the chromatogram with a retention
time of 14.84minutes, the fragmentation pattern and the molecular structure of butachlor found
all the extract. Figures 12a and b show the chromatogram of the test sample 2(T2) with a
retention time at 14.86 minutes and the fragmentation pattern; and Figures 13 a and b show the
test sample 1 (T1), chromatogram with a retention time 14.53 minutes, the fragmentation
pattern. In the control sample, no butachlor/residue was detected as shown in figures 14 a and b.

54
Soil Analysis Result

55
Figure 9a: Chromatogram of butachlor standard 1, S1. It shows the relative abundance of the
butachlor ion and the total run time of 26minutes.The retention time (butachlor elution time) for S1
is 14.96minutes)
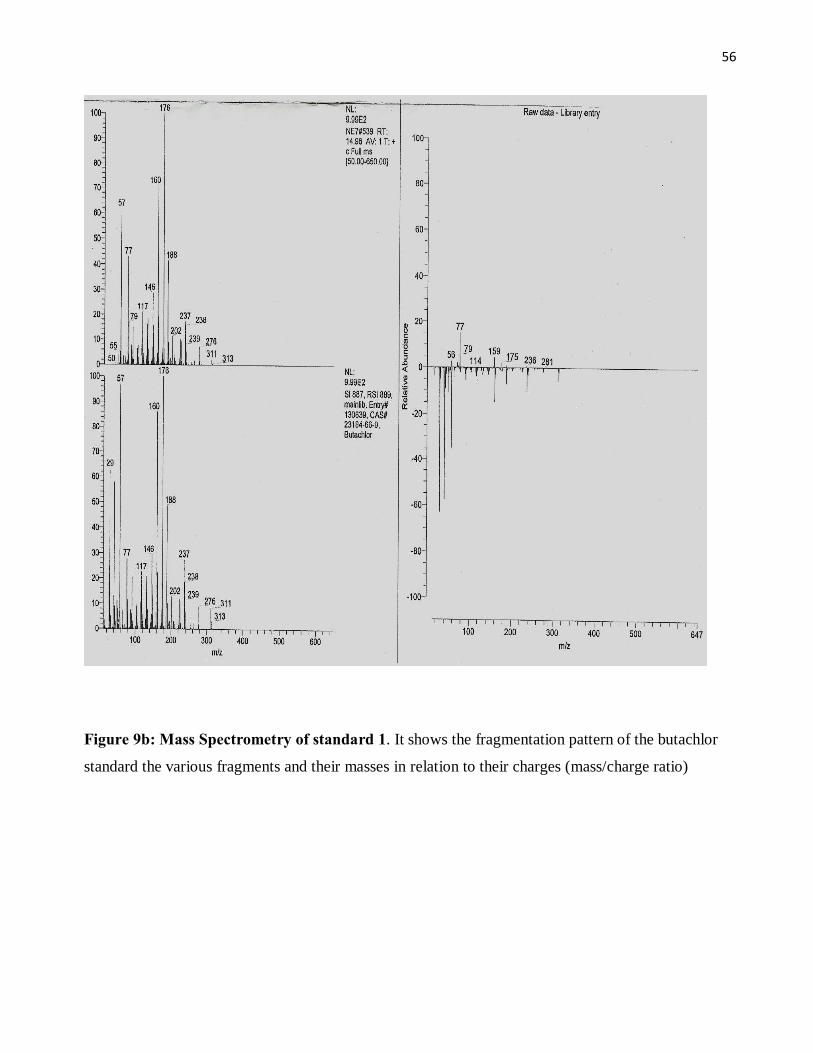
56
Figure 9b: Mass Spectrometry of standard 1. It shows the fragmentation pattern of the butachlor
standard the various fragments and their masses in relation to their charges (mass/charge ratio)

57
Figure 9c: Molecular structure of butachlor(S1). This was observed in all the butachlor standard

58
Figure 10a: Chromatogram of Butachlor standard. It shows the relative abundance of the
butachlor ion and the total run time of 26minutes.The retention time (butachlor elution time) for S2
is 14.86minutes.

59
Figure 10b: Mass Spectrum of Butachlor standard 2(S2): It shows the fragmentation pattern of the
butachlor standard the various fragments and their molecular masses in relation to their charges
(mass/charge ratio)
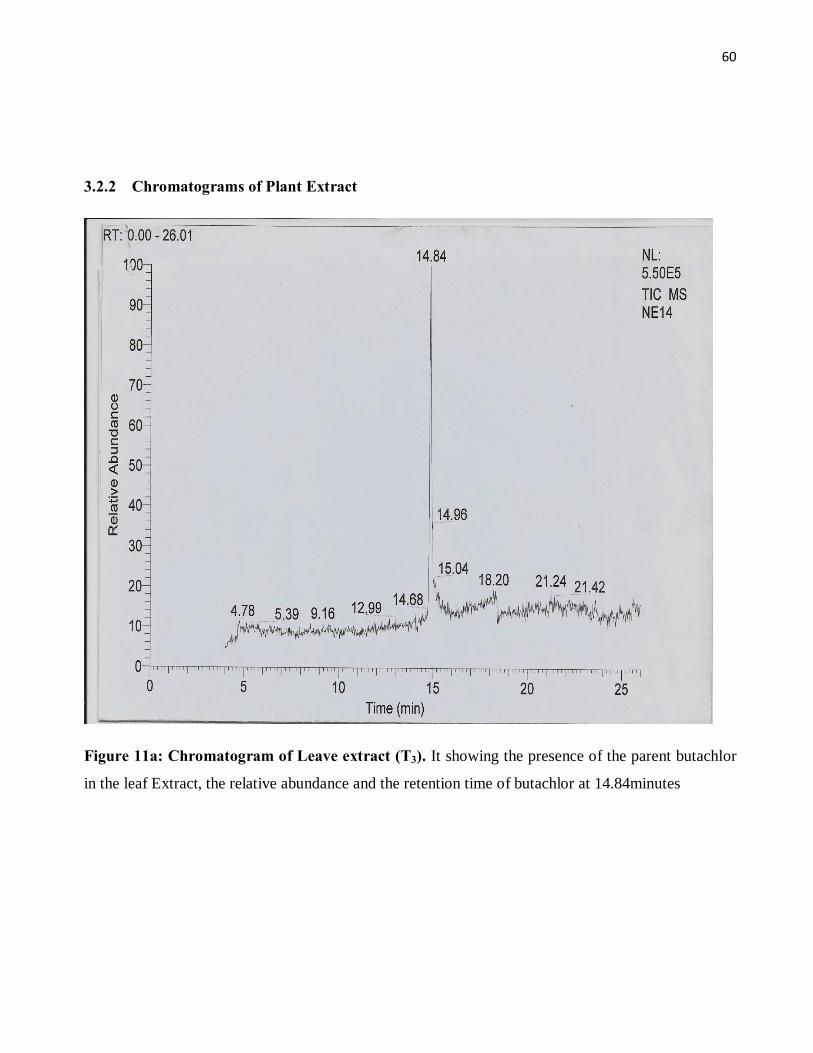
60
3.2.2 Chromatograms of Plant Extract
Figure 11a: Chromatogram of Leave extract (T3). It showing the presence of the parent butachlor
in the leaf Extract, the relative abundance and the retention time of butachlor at 14.84minutes

61
Figure 11b: Mass spectrum of (T3) . It shows the fragmentation pattern of the butachlor, the various
fragments and their molecular masses in relation to their charges (mass/charge ratio)

62
Figure 11c: Molecular structure of butachlor. This was identified in the Phaseolus vulgaris Leaf
extract (T3), also in the extract of T2 and T1

63
Figure 12a: Chromatogram of Leaf extract (T2): showing the presence of the parent butachlor in
the Phaseolus vulgaris leaf Extract, the relative abundance and the retention time of butachlor
14.86minutes

64
Figure 12b: Mass Spectrum of T2 It shows the fragmentation pattern of the butachlor, the various
fragments and their molecular masses in relation to their charges (mass/charge ratio)

65
Figure 13a: Chromatogram of leaf extracts T1, showing the presence of the parent butachlor in the
leaf Phaseolus vulgaris leaf extract, the relative abundance and the retention time of butachlor
14.53minutes

66
Figure 13b: Mass Spectrum of leaf extract (T1), showing the fragmentation pattern of the butachlor
the various fragments and their molecular masses in relation to their charges (mass/charge ratio)

67
Figure 14: Control samples of the Phaseolus vulgaris leaf extract- Butachlor was not detected at
the range of retention time in the standard (14.64-15.13minutes) Elution was not observed in the
chromatogram

68
3.2.2 Butachlor Concentration in Phaseolus vulgaris leaf extract
Table 2: Butachlor herbicide in Phaseolus vulgaris leaf extract
n=2, Mean + SD
p < 0.05 Significantly different ND-Not detected , a.i-active ingredient
Concentrations of Butachlor Applied on the various soil samples
Concentrations of Butachlor bioaccumulated in the leave extract (ppm)
Control
No butachlor applied
ND
(T3) 5.0l/ha(3.2kg a.i/ha)
0.20+0.014 C1
(T2)- 4.4l/ha(2.9kg a.i/ha) 0.13+0.00014 C2
(T1)- 4.0l/ha (2.6kg a.i/ha) 0.10+0.014 C3

69
3.2.2 Bioaccumulation Factor (BAF)
The BAF of butachlor in the plant is shown in Table 2. An increase was observed in the order:
T3>T2>T1
Table 3: Bioaccumulation factor (BAF) of butachlor in bean plant
Plots Amount of butachlor
Applied on the Soil (mg/m2)
Amount of butachlor
detected in bean Plant(mg/kg)
Bioaccumulation Factor (BAF) * 10-4
T1 260 0.10 3.8
T2 290 0.13 4.5
T3 320 0.20 6.3

70
Table 4: Estimated quantities of butachlor consumed (ppm) by the rabbits for the period of experiment
Concentrations consumed
Experimental Period (Days)
1 14 28
C1 (0.10 ppm) 1 14 28
C2 (0.13 ppm) 1.3 18.2 36
C3 (0.20 ppm) 2 28 56

71
Table 5a: Estimated Hazard Quotient and Health Risk Index for the consumption of different concentrations of butachlor from average weight of 0.200kg vegetable/day (As adopted in the experiment) by an average body weight of 70kg. Table 5b: Estimated Hazard Quotient and Health Risk Index for the consumption of different concentrations of butachlor from average weight of 0.345kg vegetable/day by an average body weight of 70kg.
Daily average weight of vegetable consumption= 0.345kg/person/day
Butachlor
Conc.
C1 (0.10 ppm) C2 (0.13 ppm) C3 (0.20 ppm)
Hazard Quotient
0.56 0.74 1.10
Health Risk Index
0.60 0.70 1.10
Butachlor Conc.
C1(0.10ppm)
C2(0.13ppm)
C3(0.20ppm)
Hazard Quotient
0.98 1.28 1.97
Health Risk Index
0.98 1.28 1.97

72
3.3 Pesticide Biomarkers
3.3.1 Effect of Different Concentrations of Bio-accumulated Butachlor in Phaseolus vulgaris leave on the Liver Total Cytochrome P450 (CYP) of Rabbits
Cytochrome P450 levels for the groups 2, 3, 4 and the control (group 1)are presented in Table
6. On day 1 of the experiment, there was no significant difference (p > 0.05) in the CYP levels
of group 2 compared with control. However, there was a reduction in the CYP level of group
3; (although, not significant (p > 0.05) and group 4 (significant p > 0.05) compared with the
control. There was no significant difference in the CYP level of group 2 on day 14. However
there was a reduction in groups 3 which was considered significant (p < 0.05) and group 4
which was considered not significant (p > 0.05) compared with the control. A significant
increase (p ˂ 0.05) was observed on day 28, after prolonged exposure in groups 3 and 4 when
compared with the control. The increase on day 28 was observed to be concentration
dependent, implying that with the consumption of the higher concentrations of the bio
accumulated butachlor the level of CYP increased (Table 6). Within group 2 there was an
increase on day 14 and 28 though it was not significant but within groups 3 and 4 there was
significant increase (p < 0.05) on the 14th and 28th day and this was observed to be
concentration and time-dependent; that is, as the days progressed, with increase in
consumption of bio accumulated butachlor, the CYP increased.

73
`Table 6: Liver total cytochrome P450 (CYP) levels of rabbits exposed to different concentrations of bio-accumulated butachlor in the leaves of Phaseolus vulgaris.
CYP (ng/ml)
Experimental period (Days)
Experimental groups 1 14 28
Group 1 (control) 10.98 ± 2.12ac 12.72 ± 1.31ac 11.80 ± 0.47ac
Group 2 (0.10ppm) 10.76± 0.97c 12.12 ± 1.39ac 12.30 ± 0.99a
Group 3 (0.13ppm) 8.77 ± 0.57b 9.99 ± 0.93b 14.41 ± 2.01cd
Group 4 (0.20ppm) 8.11 ± 0.61b 10.72 ± 0.65bc 16.16 ± 3.16d
Values expressed as mean ±SD, n= 4.
Mean values with different letters as superscript in the same column and row are considered significant (p < 0.05) while mean values with the same letters as superscripts are considered non-significant (p > 0.05).
Group1 (Control)- Animals fed with plants cultivated without the application of the Herbicide-0.00ppm
Group 2- (Animals fed with plants containing bio accumulated butachlor concentration of 0.10 ppm)
Group 3- (Animals fed with plants containing bio accumulated butachlor concentration of 0.13 ppm)
Group 4- (Animals fed with plants containing bioaccumulated butachlor concentration of 0.20 ppm)
74
3.3.2 Effect of Different Concentrations of Bio-accumulated Butachlor in Phaseolus vulgaris Leave on the Liver of Glutathione S-transferase (GST) Rabbits
The GST activity presented as mean ± SD for groups 2, 3, 4 and the control group (1) are in
Table 7. On day 1, there was a decrease in GST activity in group 2 when compared with the
control group, though not significant but there was significant decrease (p < 0.05) in groups 3
and 4 when compared to the control group 1. On day 14, there was no significant difference
between group2 and the control group, but there was a significant decrease (p < 0.05) in group
3 and a significant increase (p < 0.05) in group 4 when compared with the control group 1. On
the Day 28, there was also a significant increase (p < 0.05) in groups 2, 3 and 4 when
compared with the control group1, with the highest in group 4 (Table 6). In groups 3 and 4 a
similar trend could be observed, in that there was an initial decrease in GST on Day 1 of the
experiment and then on days 14 and 28 there was a consistent increase (p < 0.05) in the GST
activity.

75
Table 7: Liver glutathione S-transferase activity of rabbits exposed to different concentrations of bio-accumulated butachlor in the leaves of Phaseolus vulgaris.
GST activity(IU/ml enzyme)
Experimental period (Day)
Experimental groups 1 14 28
Group 1 (control) 2.43 ± 1.50ac 2.83 ± 0.57ab 2.33 ± 0.78a
Group 2 (0.10ppm) 2.18 ± 1.34a 2.03 ± 0.33ac 5.45 ± 0.86d
Group 3(0.13ppm) 1.03 ± 0.30ac 1.38 ± 0.43c 6.75 ± 2.82bd
Group 4( 0.20ppm) 0.86 ± 0.02c 3.95 ± 1.10d 8.10 ± 1.26b
Values expressed as mean ± SD, n= 4
Mean values with different letters as superscript in the same column and row are considered significant (p < 0.05) while mean values with the same letters as superscripts are considered non-significant (p > 0.05).

76
3.4 Liver Marker Enzymes
3.4.1 Effect of Different Concentrations of Bio-accumulated Butachlor in Phaseolus vulgaris Leaves on the Activity of Serum Aspartate Aminotransferase (AST) of Rabbits
The AST activity presented as mean ± SD for groups 2, 3 and 4 rabbits fed with 0.10, 0.13
and 0.20 ppm of bioaccumulated butachlor in the leaves and the control (group 1) are shown
in Table 8. On day 1 a significant increase (p ˂ 0.05) was observed in groups 3 and 4,
compared with the control (group 1). On days 14 and 28 there was also a significant increase
(p < 0.05) in the AST activities when groups 3 and 4 were compared with the control (group
1). The effect was observed to be concentration and time dependent. Within groups 2, 3 and 4
a similar trend was observed, in that the AST was consistently increasing (significant p <
0.05) as the days increased, with the highest in group 4 (day 28). Comparing across the groups
on the different days; in group 1 there was no significant differences observed within the
period of the experiment. Within group 2, there was significant increase observed in the AST
activities on day 28 compared with that of day 14. Within groups 3 and 4 a similar trend was
observed, in that the AST increased consistently as the days increased with the highest AST
activity observed in group 4 rabbits on day 28.

77
Table 8: Serum AST activity of rabbits exposed to different concentrations of bio accumulated butachlor in the leaves of Phaseolus vulgaris.
AST (IU/L)
Experimental period (Days)
1 14 28
Experimental groups
Group 1 (control) 36.25 ± 5.91a 36.00 ± 5.48a 45.00 ± 14.24a
Group 2(0.10ppm) 51.75 ± 7.81ab 53.75± 11.33b 98.00 ±16.87d
Group 3(0.13ppm) 64.25 ± 15.35b 98.25 ± 12.99bc 128.50 ± 38.31cd
Group 4(0.20ppm) 76.50 ± 9.68b 96.00 ± 11.92c 132.50 ± 13.87d
Values expressed as mean ±SD, n= 4
Mean values with different letters as superscript in the same column and row are considered significant (p < 0.05) while mean values with the same letters as superscripts are considered non-significant (p > 0.05).

78
3.4.2 Effect of Different Concentrations of Bio-accumulated Butachlor in leaves of Phaseolus
vulgaris on the Activity of Serum Alanine Aminotransferase (ALT) of Rabbits
The ALT activity presented as mean ± SD for groups 2, 3 and 4 rabbits fed with 0.10, 0.13
and 0.20 ppm of bioaccumulated butachlor in the leaves and the control (group 1) are shown
in Table 9. There was no significant difference (p > 0.05) in the ALT activity of all the groups
on day 1 of the experiment; though, there was a decrease (not significant) in group 4 when
compared with the control. On day 14, there was a significant increase at p < 0.05 level, in
group 3 when compared with the control, whereas for group 4 (highest herbicide
concentration) there was significant decrease (p < 0.05), when compared with the control. In
group 4 there was no significant difference when compared with the control but there was
decrease (significant p < 0.05) when compared with group 3 on day 28. A similar trend was
observed in within groups 2 and 3; an increase which was significant (p < 0.05) in group 3 on
day 14 and then a subsequent decrease on day 28. However group 4 was different especially
on day 14 in which there was a significant decrease when compared across the days and as
well as with the control.

79
Table 9: Serum ALT activity of rabbits exposed to different concentrations of bio accumulated butachlor in the leaves of Phaseolus vulgaris.
ALT (IU/L)
Experimental Period (Day)
1 14 28
Experimental groups
Group 1 (control) 24.50 ± 4.51a 26.50 ± 3.69a 24.00 ± 6.38a
Group 2(0.10ppm) 27.50 ± 5.26a 37.25 ± 13.69a 31.25 ± 12.18a
Group 3 (0.13ppm) 31.00 ± 6.06a 42.75 ± 6.96b 36.50 ± 5.57ab
Group 4(0.20ppm) 20.75 ± 6.95a 10.75 ± 1.71c 26.75 ± 3.78a
Values expressed as mean ±SD, n= 4
Mean values with different letters as superscript in the same column and row are considered significant (p < 0.05) while mean values with the same letters as superscripts are considered non-significant (p > 0.05).

80
3.4.3 Effect of Different Concentrations of Bio-accumulated Butachlor in leaves of Phaseolus
vulgaris on the Activity Serum Alkaline Phosphatase (ALP) in Rabbits
The ALT activity for groups 2, 3 and 4 rabbits administered 0.10, 0.13 and 0.20ppm of
butachlor and the control (group 1) are shown in Table 10.On day 1 there was no significant
differences in the ALP activities of groups 2, 3, and 4 when compared with the control
group1.However there was a decrease in group 2 and 3 which was not significant. On day 14,
there was significant increase (p ˂ 0.05) in all three groups (2, 3, 4) when compared with the
control group1. Likewise on day 28 there was a significant increase (p < 0.05) in ALP
activities of groups 3 and 4 (concentration and time dependent); with a significant decrease (p
> 0.05) in group 2, when compared with the control. In groups 3 and 4 a similar trend was
observed in that there was an increase on day 14 and then a non-significant decrease, on day
28(however still significantly increased when compared with the control. In group 2 a
significant increase in the ALP activity on day 14 was observed with a significant decrease (p
> 0.05) on day 28.

81
Table 10: Serum ALP activity of rabbits exposed to different concentrations of bio accumulated butachlor in the leaves of Phaseolus vulgaris.
ALP (IU/L)
Experimental Period (Days)
Experimental groups 1 14 28
Group 1 (control) 40.25 ± 11.11a 36.25 ± 6.55ab 44.00 ±12.99a
Group 2(0.10ppm) 32.25 ± 7.14ad 47.25 ± 11.0b 28.75 ± 2.50d
Group 3(0.13ppm) 34.00 ± 9.49a 68.25 ± 23.2b 58.25 ± 7.28c
Group 4(0.20ppm) 42.50 ± 12.82a 70.50 ± 12.6c 61.00 ± 8.76c
Values expressed as mean ±SD, n= 4
Mean values with different letters as superscript in the same column and row are considered significant (p < 0.05) while mean values with the same letters as superscripts are considered non-significant (p > 0.05).

82
3.5 Effect of Different Concentrations of Bio-accumulated Butachlor in Leaves of Phaseolus
vulgaris on Mean Body Weight of Rabbits
The mean body weights of the rabbits for groups 2, 3 and 4 and the control group 1 are shown
in Table 11. It was observed that there was no significant difference in the mean body weight
of the rabbits in groups 2, 3 and 4 when compared with the control group1 on days 1, 14 and
28; however it was observed that within each group, the body weight decreased slightly as in
Day 14 with a subsequent increase on Day 28.
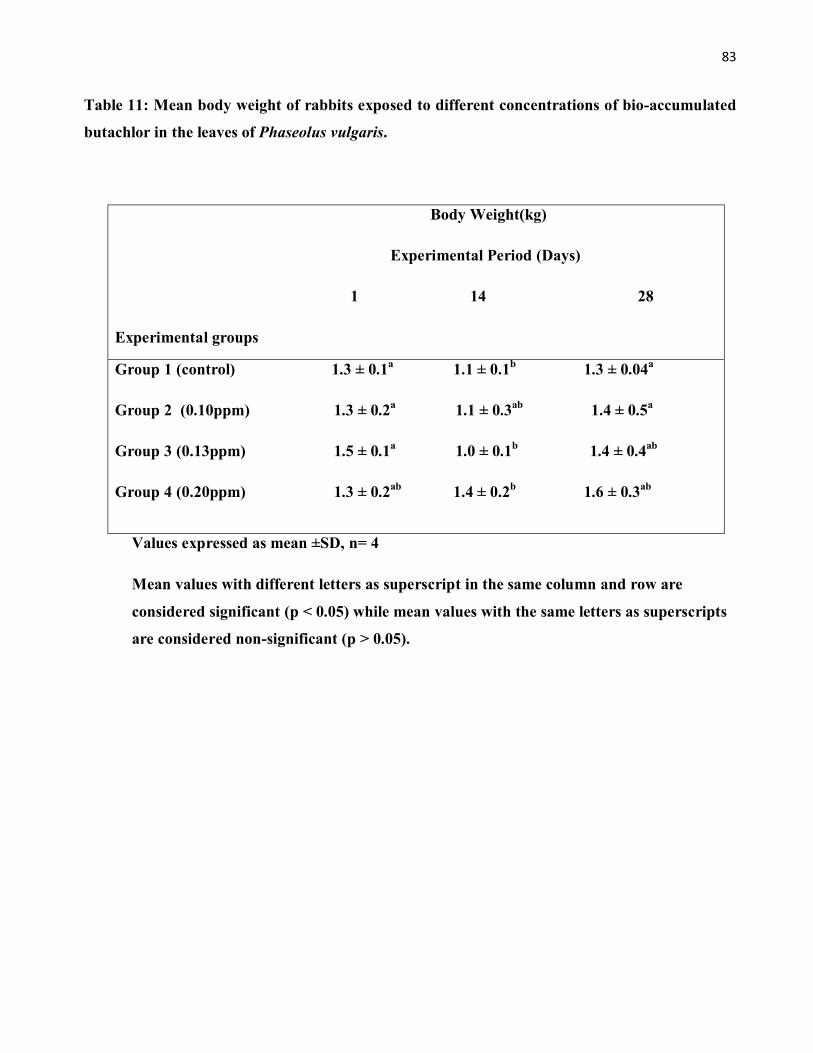
83
Table 11: Mean body weight of rabbits exposed to different concentrations of bio-accumulated butachlor in the leaves of Phaseolus vulgaris.
Body Weight(kg)
Experimental Period (Days)
1 14 28
Experimental groups
Group 1 (control) 1.3 ± 0.1a 1.1 ± 0.1b 1.3 ± 0.04a
Group 2 (0.10ppm) 1.3 ± 0.2a 1.1 ± 0.3ab 1.4 ± 0.5a
Group 3 (0.13ppm) 1.5 ± 0.1a 1.0 ± 0.1b 1.4 ± 0.4ab
Group 4 (0.20ppm) 1.3 ± 0.2ab 1.4 ± 0.2b 1.6 ± 0.3ab
Values expressed as mean ±SD, n= 4
Mean values with different letters as superscript in the same column and row are considered significant (p < 0.05) while mean values with the same letters as superscripts are considered non-significant (p > 0.05).

84
3.6 Effect of Different Concentrations of Bio-accumulated Butachlor in the leaves of Phaseolus vulgaris on Liver Total Protein of Rabbits
The results in Table 12 reveals that groups 2 and 3 when compared with the control group (1)
on day 1 were not significantly different (p > 0.05) However, a significant increase(p <
0.05)was observed in group 4 when compared with group 1 on day 1;also a non-significant
increase in group 3. There was a significant increase (p < 0.05) in group 2, 3 and 4 when
compared with the control on day 14. On day 28 there was no significant differences observed
in all test groups when compared with the control although a non-significant decrease was
observed. Comparing across on the different days, within each group, it was observed that the
protein concentration decreased slightly, as in Day 14 (significant in groups 1 and 4) with a
subsequent increase which was significant on Day 28.
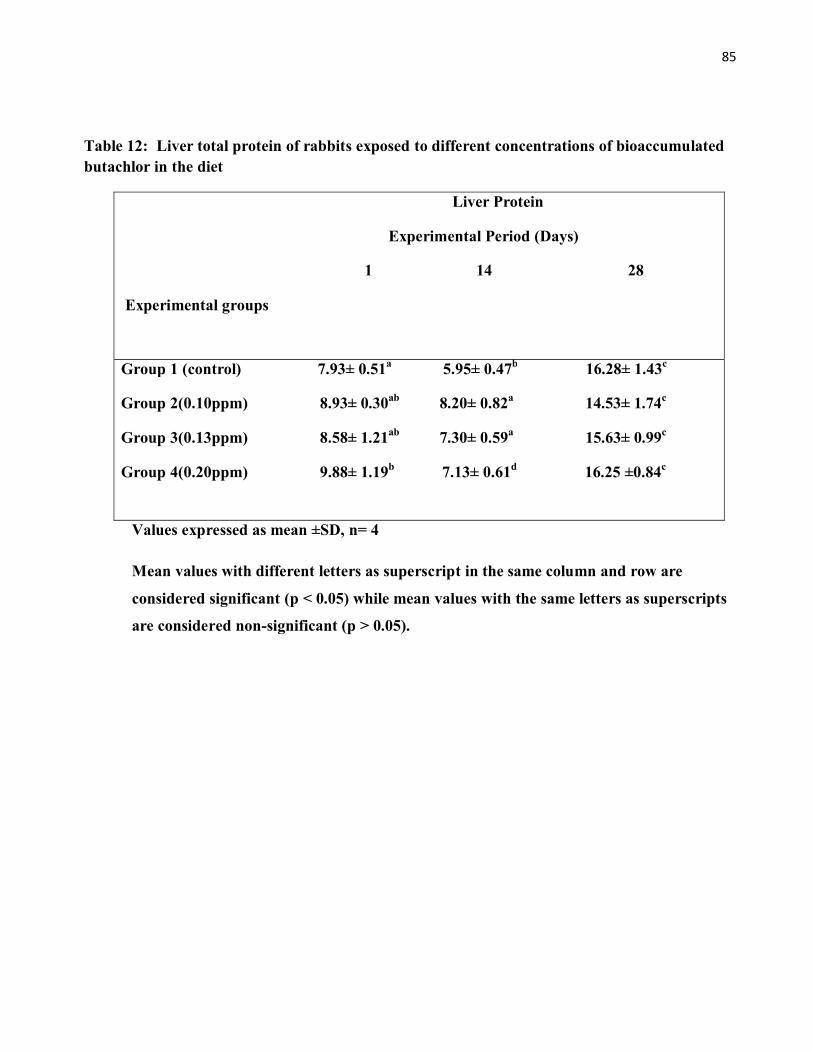
85
Table 12: Liver total protein of rabbits exposed to different concentrations of bioaccumulated butachlor in the diet
Liver Protein
Experimental Period (Days)
1 14 28
Experimental groups
Group 1 (control) 7.93± 0.51a 5.95± 0.47b 16.28± 1.43c
Group 2(0.10ppm) 8.93± 0.30ab 8.20± 0.82a 14.53± 1.74c
Group 3(0.13ppm) 8.58± 1.21ab 7.30± 0.59a 15.63± 0.99c
Group 4(0.20ppm) 9.88± 1.19b 7.13± 0.61d 16.25 ±0.84c
Values expressed as mean ±SD, n= 4
Mean values with different letters as superscript in the same column and row are considered significant (p < 0.05) while mean values with the same letters as superscripts are considered non-significant (p > 0.05).
Figures 16-18 shows the photomicrograpd groups 2,3 and 4 for the period of the exp

86
3.6 Histological Evaluation of Liver Tissue of Rabbits Indirectly Exposed to Butachlor Herbicide
Plates 1 – 3 show the photomicrographs of the liver sections of the control group (1) and the
groups 2, 3 and 4 fed with leaves containing 0.10, 0.13 and 0.20 ppm of butachlor respectively
for the period of the experiment. Liver histologic observations of the control group showed
normal histopathology which include; radially arranged hepatic cords around the central vein
separated from each other by sinusoids radiating from the central veins to the periphery of
liver lobules, no signs of nuclear fragmentation, no cytoplasmic vacuolization and no signs of
degeneration or necrosis were observed. (Figs 15-17). These normal features were also
observed in the liver tissues of the rabbits in groups 2, 3 and 4 fed with leaves containing the
three (3) different concentrations of the butachlor herbicide (C1, C2 and C3) on days 1, 14 and
28 of the experiment (Figs 15, 16 and 17 photomicrographs).
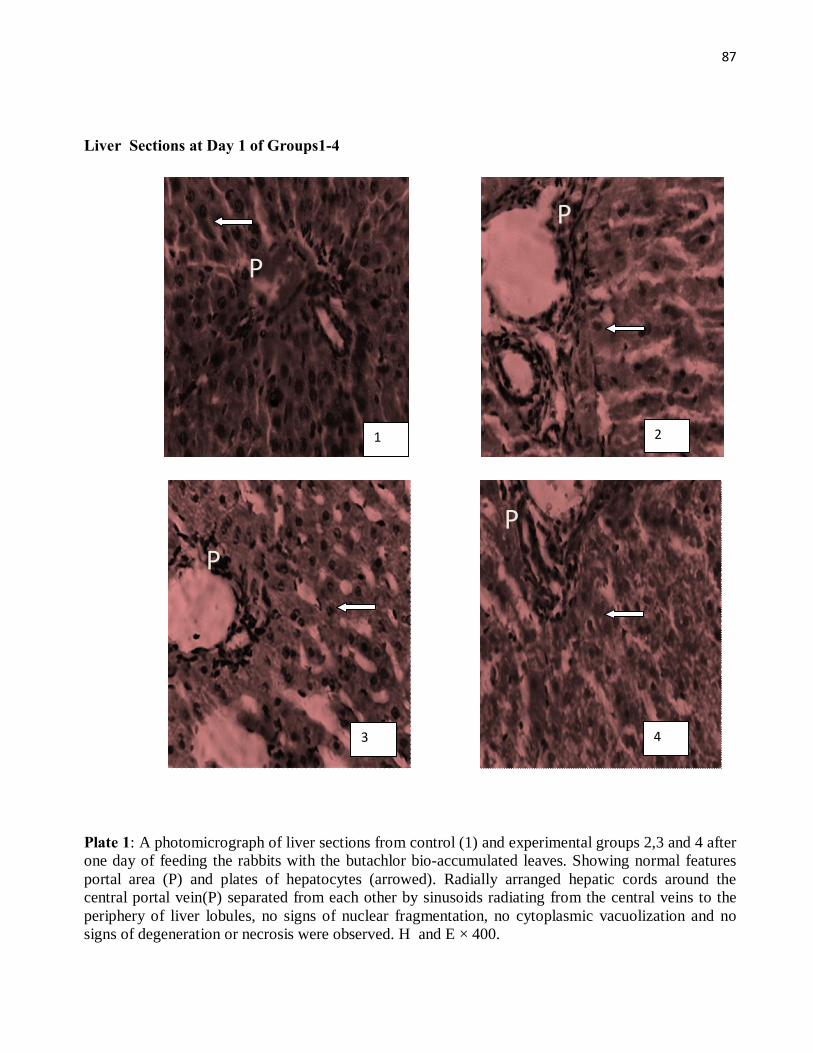
87
Liver Sections at Day 1 of Groups1-4
Plate 1: A photomicrograph of liver sections from control (1) and experimental groups 2,3 and 4 after one day of feeding the rabbits with the butachlor bio-accumulated leaves. Showing normal features portal area (P) and plates of hepatocytes (arrowed). Radially arranged hepatic cords around the central portal vein(P) separated from each other by sinusoids radiating from the central veins to the periphery of liver lobules, no signs of nuclear fragmentation, no cytoplasmic vacuolization and no signs of degeneration or necrosis were observed. H and E × 400.
1 2
3
P
P
P
4
P

88
Liver Sections at day14
Plate 2: A photomicrograph of liver sections from control (1) and experimental groups 2,3 and 4 after one day of feeding the rabbits with the butachlor bio-accumulated leaves. Showing normal features portal area (P) and plates of hepatocytes (arrowed). Radially arranged hepatic cords around the central portal vein(P) separated from each other by sinusoids radiating from the central veins to the periphery of liver lobules, no signs of nuclear fragmentation, no cytoplasmic vacuolization and no signs of degeneration or necrosis were observed. H and E × 400.
1 2
P
3 4
P P
P
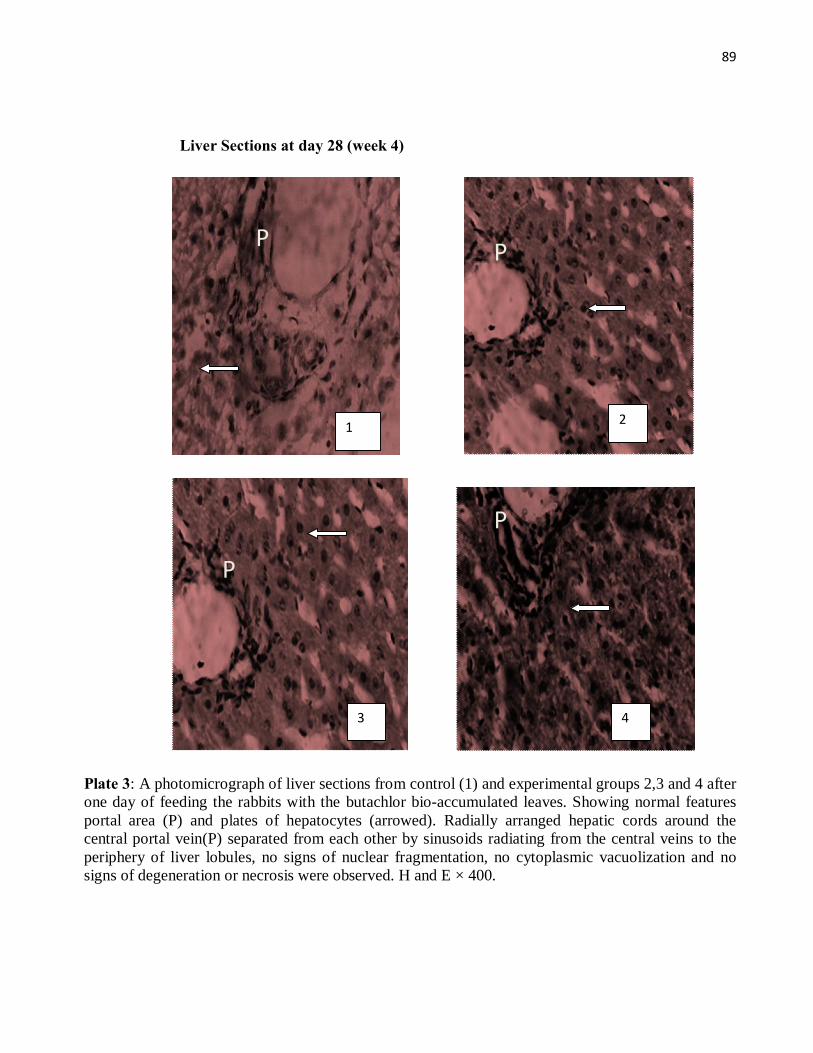
89
Liver Sections at day 28 (week 4)
Plate 3: A photomicrograph of liver sections from control (1) and experimental groups 2,3 and 4 after one day of feeding the rabbits with the butachlor bio-accumulated leaves. Showing normal features portal area (P) and plates of hepatocytes (arrowed). Radially arranged hepatic cords around the central portal vein(P) separated from each other by sinusoids radiating from the central veins to the periphery of liver lobules, no signs of nuclear fragmentation, no cytoplasmic vacuolization and no signs of degeneration or necrosis were observed. H and E × 400.
4
P
3
P
P
2 1
P

90
CHAPTER FOUR
DISCUSSION
The outcome of the soil analysis showed that the soil contain a very high percentage of sand (74%).
This could have enhanced the uptake of the herbicide by the plant; since herbicides are known to
adsorb less to sandy soil (Rao, 2000; Tomaz, 2013), resulting to a higher bioavailability of the
herbicide by the bean plant as observed in the present study. Also the low percentage of soil organic
matter may have also affected the herbicide uptake since there was less adsorption to soil and organic
matter, less microbial degradation, resulting to bioavailability of the herbicide in the soil-water
compartment and thus uptake and bioaccumulation. (Tomaz, 2013)
The sorption of herbicides by soil is important in determining their environmental fate, such as
bioavailability, toxicity, biodegradation, persistence, and leachability in soil. The adsorption
coefficient Koc, is the tendency of herbicide sorption to organic carbon in the soil. According to
Connell, (1990) higher values (greater than 1000) indicate a pesticide that is very strongly attached to
soil and is less likely to move unless soil erosion occurs. Lower values (less than 300-500) indicate
pesticides that tend to move with water and have the potential to leach or move with surface runoff.
From literatures it has been reported that the Koc of butachlor herbicide is about 700ml/g in soils
(Roberts et al., 1998; Connell, 1990). Thus it may be inferred that butachlor has a moderate soil
sorption and the tendency to move with water (bioavailable in the soil-water compartment), thus
uptake and bio accumulation in the plant is enhanced.
The soil pH was observed to be 5.4 which is towards acidic and thus less survival for microrganisms
that can degrade the herbicide. The octanol/water partition coefficient is a measure of a chemicals
affinity for the hydrophobic portion in soil. The n-octanol/water partition coefficient of butachlor has
been reported to be 3.16 ×10⁻⁴ and the Log Kow is 4.50(Roberts et al., 1998); the log kow of butachlor
could be said to be high, based on the fact that organic chemicals that have log Kow higher than 2 are
usually hydrophobic and considered liable to bio accumulate in biota. (Oliver and Charlton 1984;
Elzerman Studies have shown that the herbicide, butachlor persists in the aquatic system for a long
period of time hence its toxicity to aquatics (Tilak et al., 2007). Persistence of butachlor have also
been studied at two levels of application in different soils at three different sites under three moisture
regimes air-dry, field capacity and submergence (Prakash and Suseela, 2000). Soil properties that
91
may affect the uptake of herbicides by plant and thus bioaccumulation include: the soil texture and
shape, soil organic matter content, organic carbon, soil adsorption, soil pH and soil moisture (Coates,
1987; Franke et al., 1994).
The gas chromatography-mass spectrometry (GC-MS) analysis from this study, showed the presence
of the butachlor compound. The chromatographic profile of the analytical butachlor standards S1 and
S2 are shown in Figs 9-11; showing that the parent butachlor compound was eluted at that retention
time. The mass spectra in the standards showed the fragment 176 as the parent ion of butachlor,
indicating that the molecule is partly retained after an impart by an electron. The result showed the
chromatographic profile of the plant leaf extracts (T1-T3). Since the retention time and fragmentation
pattern are characteristic of a particular compound run under similar GC conditions, the standards
were used in the identification and quantification of butachlor in the Phaseolus vulgaris leaf extracts.
The GC-MS (Figs 11-13) result obtained showed the presence of the parent butachlor in the bean
plant leaves, with concentrations of C1 (0.10 ppm), C2 (0.13 ppm) and C3 (0.20 ppm), corresponding
to the plants cultivated with T1 (2.6 kg a.i/ha), T2 (2.9 kga.i/ha) and T3 (3.2 kg a.i/ha) respectively
after 6weeks of planting; whereas in the control plant cultivated without the application of the
herbicide, no butachlor was detected. Statistically, the result showed that butachlor concentration
increased significantly (p < 0.05) in C2 when compared with C1. Similarly, butachlor concentration
also increased significantly (p < 0.05) in C3 compared with C1. The plant cultivated with a
concentration of T1 (2.6kg a.i/ha), is the standard rate for butachlor in bean plant as recommended by
the manufacturers; and with this, there was an accumulation of 0.10ppm butachlor in the plant leaves.
At higher concentrations of T2 (2.9 kg a.i/ha) and T3 (3.2 kg a.i/ha), the butachlor accumulated was
observed to be higher (0.13 and 0.20 ppm respectively), giving a 30% and 100% increase from
0.10ppm concentration respectively. This implies increasing accumulation of butachlor as
concentration increases. Bioaccumulation of herbicides in vegetables have also been reported in the
research findings of Kaphalia et al. (1990); Tadeo et al. (2000); Anderson and Poulsen, 2001; Tseng
et al. (2002) ; Qiu et al. (2010) and Etonihu et al. (2011).
The herbicide levels determined in this study (0.13 and 0.20 ppm) when compared to some reports in
literatures on butachlor and other pesticide (herbicide) levels in vegetables/food, appeared to be
higher (Gorell et al., 1998; Jaga, 2003; Etinohu et al., 2011). Although, the level of butachlor at 0.1
92
ppm (mg/kg) is in agreement with the value of 0.1mg/kg pesticide level as observed by Olshan and
Daniels (1997)
The results showed the bioaccumulation factor (BAF) in the plant. Bioaccumulation factor expresses
the extent of chemical accumulation in the plant/animal. The BAF was observed to be increasing with
respect to increase in the concentration of the herbicide applied, in the following order T3>T2>T1.
This implies that the higher the amount of herbicide applied, the greater the bioaccumulation in the
plant leaves. It has been established that the greater the BAF, the greater the accumulation and the
greater the risk of pesticide(Van der Oost et al., 2003).
It was observed in the result that the estimated quantities of butachlor consumed in parts per million
by the exposed rabbits for the period of experiment increased, in the rabbit fed the butachlor
contaminated plant leaves, and this was in a concentration/time dependent manner. The risk in the
consumption of the bioaccumulated butachlor was assessed by determining the hazard quotient (HQ)
and Health Risk Index (HRI) for an average human body weight of 70 kg. It was observed that the
HRI upon consumption of an average weight of 0.200 kg vegetable containing bioaccumulated
butachlor of 0.10, 0.13 and 0.20 ppm was 0.57, 0.74 and 1.10 respectively over a lifetime. This
implies that there is no significant risk in the consumption of the first two concentrations but there is
significant risk upon the consumption of the latter concentration. It was also observed that the HRI
upon consumption of an average weight of 0.345 kg (WHO, 1997) vegetable containing
bioaccumulated butachlor of 0.10, 0.13 and 0.20 ppm was 0.98 1.28,1.97 respectively over a
lifetime. This implies that upon consumption of 0.10 ppm, there was no significant risk, while upon
the consumption of the two latter concentrations, there is significant risk. Based on the fact that when
HRI < 1 it indicates no significant risk over a lifetime of exposure, while HRI > 1 indicates a
significant risk upon exposure and the contaminant may produce an adverse effect (Gupta et al.,
2013; Chary et al., 2008; Gerba, 2010; USEPA, 2003).
Animals that feed on plants may ingest one or more pesticide/residue produced in or on the plant and
this is subject to metabolism either by bacteria in the intestine and external to the cells of the animal,
or it is absorbed alongside with that via the skin and respiratory tracts and then transported to the
liver. The liver is the primary site of xenobiotics bio-transformation (pesticides) for the purpose of
facilitating their clearance through excretion of water–soluble products via detoxification. The high
level of oxidative metabolism in the liver, makes this organ a possible target for more toxic

93
metabolites when detoxifying and protective mechanisms are overwhelmed (Hodgson and Levi,
1997). The liver is also rich in xenobiotic metabolizing enzymes which include cytochrome P450 and
glutathione S-transferase. Pesticides are known to be substrates for these enzymes as well as inducers
or inhibitors (Melancon, 1996).
Cytochrome P450 are enzymes involved in phase Ι metabolism of xenobiotics. In the result of the total
cytochrome P450 (CYP), there was a non-significant reduction observed in the levels of CYP in group
2. However, there was a significant (p < 0.05) reduction in CYP of group 3 and 4 rabbits when
compared with that of the control group, on day 1.This may be attributed to the presence of small
quantities of the butachlor (higher concentration) which was consumed from the plant on days 1 and
14, hence there was an immediate utilization of the detoxifying enzyme cytochrome P450 in the body
system of the rabbits causing a reduction, however, as the days went by, with more quantities of the
plant with higher butachlor concentration being consumed, there was an induction of
synthesis/production of the detoxifying enzyme, as could be observed by the increase (significant at p
˂ 0.05) on day 28, after prolonged exposure for groups 3 and 4, when compared with the control
(group1) on day 28 as well as within the group. The increase was be observed to be time-dependent.
The result obtained showed that a higher concentration of butachlor that bioaccumulated in plants
consumed in group 4 (0.20 ppm) resulted to an increase in the levels of liver CYP by 37% and also in
group 3 by 22% when compared to the control group (1); while in group 1 which contained no
herbicide, there was no induction and in group 2. There was little or no induction of CYP. Such was
also observed in an acute study by Pogrmic-Majkic et al. (2012), where there was a similar effect of
atrazine herbicide on the liver CYP however in this case, a higher concentration of atrazine increased
the levels of CYP by 56% when compared with the control. This result of CYP induction by
herbicide, is also in agreement with some other acute and chronic studies of direct exposure of fish
and rats to butachlor and atrazine (Islam et al., 2002; Farombi et al., 2008).
Glutathione S-transferases (GSTs) are ubiquitous multifunctional enzymes which play key role in
phase 2 of cellular detoxification especially xenobiotics such as pesticides (Ezemonye and Tongo,
2010). The major activity of GST is the conjugation of compounds with electrophilic centers to the
tripeptide glutathione (Oakley, 2011). The glutathione conjugates are metabolized further to
mecapturic acid and then excreted. A significant ( p > 0.05) reduction in GST activity was observed
in group 2 when compared with the control on day 1 of the experiment; likewise on the day 14; this

94
could be due to the fact that herbicide present for detoxification was in small quantities. However,
there was an increase on the day 28 but not as much as in group 3 and 4 which had higher
concentrations of the herbicide. In groups 3 and 4 a similar trend could be observed in that, there was
an initial decrease in GST activity, which was significant (p < 0.05) when compared with the control
on day 1 of the experiment, indicating a rapid utilization of the GST for detoxification of the
butachlor herbicide; and then on the days 14 and 28; there was a consistent and significant increase (p
< 0.05) in the GST activity. This is most likely due to the prolonged exposure to butachlor in groups 3
and 4 (higher concentrations), such that the enzyme was induced in other to cope with the
detoxification of the higher concentration of butachlor in the liver. The time-dependent increase in
GST as observed in the present study is in agreement with some other research findings involving a
direct exposure to butachlor in several fish species (Otto and Moon, 1996; Shalaby et al., 2007). Also,
an exposure to atrazine herbicide has been shown to cause the induction of GST in hepatic
microsomes and cytosol of Fisher rats (Islam et al., 2002). It is possible that an increase in the activity
of GST contributes to the elimination of reactive oxygen species, induced by the herbicide from the
cell (Jin et al., 2010). The increased GST activity also suggests that the enzyme may be responsible
for the conversion of butachlor to more hydrophilic metabolites which could increase its elimination
rate from the organism. However, it was also reported that in the absence of acetyl CoA, the GSH
conjugate was metabolized to butachlor cysteine conjugate (Ou and Lin, 1992). Farombi et al. (2008)
also observed a significant increase in the liver GST of fish exposed to butachlor concentrations of 1-
2.5 ppm; however, they observed a significant decrease in kidney GSTwith increased
malondialdehyde (MDA), an indication of increased lipid peroxidation, suggesting that the kidney
was subjective to severe oxidative toxicity during the exposure. In vitro incubation of liver and
kidney fractions with butachlor showed that butachlor was first bio transformed by conjugation with
GSH by the enzyme GST to form butachlor glutathione conjugate which was further transported to
the kidneys to form mercapturic acid by N- acetylation (Farombi et al., 2008). The GST result from
the present study however contravened the reduction in liver GST activity of birds exposed to
pesticide diet, as reported by Ezeji et al. (2012).
This study also evaluates the effect of butachlor on some liver marker enzymes and the hepatic tissue.
To determine the hepatotoxic effect on the liver, the analysis of serum constituents has proved to be a
useful tool in the detection and diagnosis of metabolic disturbances and disease incidence processes
(Aldrin et al., 1982; Tolba et al., 1997). Enzymes are protein catalysts present mostly in living cells

95
and are constantly and rapidly degraded although, renewed by new synthesis (Coles,1986). The
normal enzyme level in the serum is a reflection of a balance between their synthesis and release, as a
result of the different physiological processes in the body (Zilva and Pannall, 1984). Transamination
involving transaminases, represents one of the principal pathways for the synthesis and deamination
of amino acids, thereby allowing an interplay between carbohydrate, fat and protein metabolism
during fluctuating energy demands of the organism under various adaptive conditions; therefore
attention has been focused on the changes in the aminotransferases; AST and ALT promote
gluconeogenesis from amino acids and they relate changes in their activities to changes in specific
organs/tissues (Marie, 1994; Gabriel and George, 2005; Nelson and Cox, 2000). Liver cells are
particularly rich in transaminases because this organ is the major site for interconversion of food
stuff. AST and ALT are normally found in low concentrations in the blood, when liver cells are
damaged, tissues may leak them into the plasma causing an increase in activity, hence they are
frequently used to diagnose the sublethal/lethal damage to the liver (Jyothi and Narayan, 2000; Dutta
and Arends, 2003). ALT is localized primarily in the cytosol of hepatocytes and it is more sensitive
and specific in hepatocellular damage than AST (Marshall, 2000). An elevated level of AST is not
specific to liver damage hence it is of less diagnostic use to determine liver damage (Michel, 1998).
From this present study, it was observed that there was significant increase (p < 0.05) in the AST
activity of groups 3 and 4 rabbits when compared with the control group (1) as shown in Table 8, and
this signified that exposure of the rabbits to butachlor concentrations of 0.13ppm and 0.20 ppm in the
diet for the period of the experiment, affected the activity of this transaminase. Also, in the present
experiment, AST activity as observed in groups 2, 3 and 4 rabbits, showed a general trend to increase
during the exposure when compared to the control values in group 1; with the highest recorded in
group 4 at day 28. The increase was observed to be concentration and time dependent and this is in
agreement with a chronic study carried out with exposure of sublethal concentrations of butachlor on
Nile tilapia fish Orechromis niloticus (Abbas et al., 2007). Nwani et al. (2013) showed that butachlor
is toxic to fresh water fish Tilapia zilli upon acute exposure with a significant increase in AST
activity. In the present study, it may be implied that the significant increase in AST may be due to
leakage from the liver cells or may be due to leakage from another organ that was affected, since AST
could also be found in other organs such as the kidney and muscle. An increase in AST alone is
however not suggestive of liver damage, so other liver enzymes have to be considered to be
conclusive.
96
From literatures, it is known that elevated levels of liver AST and ALT may indicate the active
utilization of amino acids in energy yielding metabolic processes such as gluconeogenesis to produce
energy to cope with the stress of herbicide detoxification (Adams et al.,1996; Vani et al.,2012)
ALT is found predominantly in the liver but small amounts are found in the kidneys, heart, muscles
and pancreas, it is a more specific indicator of liver damage. The results of the ALT are presented in
Table 9. A similar trend was observed in the ALT activity within groups 2 and 3 during the
experiment. Within groups 2 and 3, there was an increase (significant in group3) on day 14 and then a
non-significant decrease on day 28 but in group 4, there was a significant decrease (p < 0.05) in the
ALT activity on the 14th day of the experiment, thus revealing a fluctuating activity. Salah El-deen
and Rogers (1991) observed a similar result and stated that this fluctuation in ALT activity may be
attributed to a number of factors such as leakage from liver and muscle into the blood, liver enzymes
inhibition by the effect of the pollutant and/or disturbances in Kreb’s cycle. Shalaby et al. (2007) also
showed a significant decrease in ALT on the day 30 of exposure of butachlor herbicide in fish and
this, they attributed to the inhibition of enzyme synthesis as a result of the toxic effect of the
herbicide. Some other studies also showed that toxicants can inhibit the activity or synthesis of
enzymes, resulting in decreased activities of the enzymes in the organs, however the mechanism is
not known (Nesckovic et al., 1996; Jung et al., 2003; Mousa ,2004; Ambali et al., 2010). Edori et al.
(2013) observed a significant decrease in ALT of fish exposed to high concentration of paraquat after
21 days. Abbas and Mahmoud (2003) however reported that AST and ALT showed fluctuated
activities in both acute and chronic exposure to thiobencarb (butachlor) in fish species. They pointed
out that toxicants act on carboxyl, amino, sulphydryl, phosphate and other similar groups of cell
components. They also further summarized the possible mode of action as: (1) disruption of the
enzyme system by blocking active sites; (2) formation of stable precipitates or chelation by essential
metabolites (3) immobilizing the catalytic decomposition of essential metabolites; (4) combination of
the substances with the cell membranes, thus affecting their permeability and (5) replacement of the
structurally or electrochemically important elements in the cell when they fail in function.
In the present study it was observed that there was a decrease in the ALT activity of group 4 rabbits
when compared to the control group (1) all through the experiment, especially on day 14 of the
experiment, there may be suppression/inhibition of ALT activity at the highest herbicide
concentration (0.20 ppm).

97
It was also observed that on day 28 there was significant decrease(p < 0.05) in the ALT activity of
groups 2 and 3 rabbits when compared to day 14 of the same groups; it could also be possible that
there may be an inhibition after prolonged exposure (28 days) to these concentrations of the
butachlor. However, in group 4 (0.20 ppm) in which there was greater induction for the detoxification
of the butachlor to result to reduced effect of the herbicide on the enzyme.
In animals, alkaline phosphatase is present in all tissues throughout the entire body, but is particularly
concentrated in the liver, bile duct, kidney and the bone. In groups 2, 3 and 4, a similar trend was
observed with the highest ALP activity on day 14 (Table 10) as in the case of groups 2 and 3 in ALT.
On day 1 there was no significant differences (p > 0.05) in the groups 2, 3 and 4 when compared with
the control group. On day 14, there was significant increase (p ˂ 0.05) in all three groups (2, 3 and 4)
when compared with the control group. However, on day 28, there was a decrease in the ALP activity
from day 14 in each group, however, for groups 3 and 4, the differences were still significantly
increased (p < 0.05) when compared with the control groups. This increase was observed to be
concentration and time dependent especially on day 14 of the experiment. An increase in ALP was
also observed in studies carried out by Shalaby et al. (2007). This fluctuation in ALP on the days 1,
14 and 28 may also be attributed to liver enzyme inhibition as observed of ALT activity or as result of
leakage from the liver due to slight injury.
From the result of liver enzymes in the present study, it could probably be that there was a profound
effect after 14 days of exposure of butachlor on the liver, to have resulted to the significant increase
in the AST and ALP activities in groups 2 and 3 rabbits, but however due to the increased/induced
levels of detoxifying enzymes (CYP and GST), there was increased detoxification of the butachlor, as
such reducing the effect of butachlor and resulting to a reduction in the effect on ALP and AST
activities as observed on day 28 of the experiment.
Liver histologic observations of the control group showed radially arranged hepatic cords around the
central vein which are separated from each other by sinusoids radiating (capillaries) from the central
veins to the periphery of liver lobules, no signs of nuclear fragmentation, no cytoplasmic
vacuolization, no signs of degeneration or necrosis were observed. These features were also observed
in the liver tissues of the rabbits in groups 2, 3 and 4 which were exposed to the three (3) different
concentrations of the butachlor herbicide (C1, C2, C3) on days 1, 14 and 28 of the experiment.

98
Histological sections of the liver of the exposed rabbits thus revealed no pathological alterations after
28 days of exposure to butachlor.
The liver enzyme AST and ALP increased upon exposure to the butachlor concentrations of 0.13 and
0.20 ppm. However the histological examination showed no visible pathological alterations. It is
possible that the architecture of the liver tissue was not affected at these concentrations, for the
duration of indirect exposure. The concentrations and duration of exposure to butachlor was not
sufficient to cause remarkable membrane damage in the liver cells. A study by Dwivedi et al, 2012.,
showed that butachlor induced dissipation of mitochondrial membrane DNA damage and necrosis in
human blood cells. Although the actual mechanism of butachlor in human is not known but if it is
similar to that observed in plant in affecting the cell membranes and with the findings of Dwivedi et
al., 2012; it could be possible that butachlor affects the cell membranes (especially the mitochondrial
membrane) thus slightly affecting the permeability resulting to significant increases in the activities
of AST (from the mitochondria) and ALP(in the membranes). However due to induced detoxifying
enzymes and short duration of exposure, the effect of the butachlor may have reduced. ALT and ALP
are indicators of membrane integrity. This could probably indicate that there was little or no
disruption of the liver tissues at the different concentrations. Hence there was no visible pathological
liver damage observed. In the present study, the increase in CYP and GST levels in the liver could
also indicate the accelerated metabolism of butachlor thus resulting to little or no effect of the
herbicide on the liver tissue for the period of the experiment as shown by the histopathology result.
Upon exposure to toxicants, the cellular component of the liver which seems to be affected most is
the cellular membrane. Toxicants have been observed to either have increased the cellular membrane
permeability thereby enhancing enzyme leaching or leaking out of the liver to the blood or may have
reduced the permeability, forcing the enzymes to accumulate in the cells (Gabriel et al., 2009;
Yousafzai and Shakoori, 2011). Assays on lipid peroxidation though was not undertaken in the
present study, would give a clue on the state of the cellular membrane in the liver; if there was a
disruption to cause a release of the intracellular enzymes into the blood or the extent of membrane
disintegration.
There was no significant difference (p > 0.05) in mean body weight of rabbits in groups 2, 3 and 4
when compared with the control group on all the days of the experiment; thus it can be inferred that
the butachlor herbicide had no significant effect on the mean body weight of the rabbits of groups 2, 3

99
and 4 when compared with the control group1. This result may also be explained that, there may be
no bioaccumulation of the herbicide in the animal tissue of the rabbits since bioaccumulation of
butachlor herbicide have been shown to influence the growth rate, muscle protein and body weight of
animals exposed to herbicides (Hodson et al., 1978). It was observed that within all the groups, the
mean body weight decreased slightly as observed on day 14, with a subsequent increase on day 28.
This could be attributed to the change in diet (growers marsh to bean leaves), since the animals may
be trying to adjust to the new diet and as such a reduction in food consumption resulting to a
reduction in mean body weight; then with a later acceptance of the new diet there was an increase in
consumption as well as the gain in body weight.
The result for the liver total protein is presented in table 12. There was no significant difference (p >
0.05) between groups 2, 3 when compared with the control group on day 1, but a significant increase
(p < 0.05) was observed between group 4 and group 1 on day 1. On day 14 there was a significant
increase (p < 0.05) in group 2 only when compared with the control group; however, there was a
significant decrease on day 28 in group 2 only. Within groups 3 and 4, it was observed that the
protein concentration decreased slightly, as in day 14 with a subsequent increase which was
significant on day 28; this could be a reflection of the increase in the CYP and GST enzymes as a
result of their induction in the liver. Butachlor has been shown to cause remarkable protein loss at
lethal as well as sublethal concentrations (Rajput et al., 2012). They attributed the decrease in protein
may be to the impairment of protein synthesis or increase in the rate of its degradation to amino acids.
This may be fed to TCA cycle through aminotransferase probably to cope with high energy demands
in order to meet the stress condition. The decrease in proteins might be due to their utilization in cell
repair and tissue organization with the formation of lipoproteins, which are important cellular
constituents of cell membranes and cell organelles present in cytoplasm (Harper, 1985). The decrease
in protein content as a result of toxicity stress has already being reported by Borah and Yadav (1995);
Muley et al. (2007); Singh and Bhati (1994). The decrease in liver protein during dimethoate
exposure may be due to increased catabolism and decreased anabolism of proteins (Khare and Singh,
2002). In the present study, this initial decrease in the liver total protein, could be attributed to the
initial decrease in the enzyme levels for detoxification (CYP and GST) as observed on days 1 and 14
in groups 2, 3 and 4 rabbits; since these enzymes are components of the total protein. However; upon
induction of the detoxifying enzymes, an increase was reflected in the total protein on day 28 of the
experiment.

100
This study showed that liver marker enzyme (AST, ALP) activities increased significantly (p < 0.05)
with exposure to 0.13 and 0.20 ppm butachlor concentrations; however, there may be an inhibition of
ALT activity at certain concentrations during the experiment and since ALT is more specific for liver
damage, this agrees with the fact that there was no observable adverse or pathological liver damage as
shown by the histopathology of the liver albeit, the indications of exposure to the herbicide by the
marker enzymes. The study also revealed that a subchronic exposure to 0.13 and 0.20 ppm
concentrations of butachlor in the diet led to a significant increase in the two pesticide biomarker
enzymes; Cytochrome P450 and glutathione S-transferase of the phases Ι and ΙΙ detoxification
reactions, in a concentration and time–dependent manner. From the above, it could therefore be
suggested that the enzyme detoxification mechanism; the induced cytochrome P450 and glutathione S-
transferase were able to detoxify the butachlor herbicide at the varied concentrations such that there
was no profound effect on the liver; hence the butachlor herbicide was not toxic to the liver of the
animals at these concentrations, when consumed in the diet for the period of the experiment.
However, the study show the possibility of a more toxic response upon chronic exposure to butachlor
when improperly applied.
4.2 Conclusion
The present study showed that there was bioaccumulation of butachlor in the bean plant, and this
increased with respect to the concentrations of butachlor applied to the soil. It also showed that the
manufacturers’ recommended application rate for butachlor (2.6 kg a.i/ha) posed no health risk,
however the application rates above the recommended rate could pose some risk when butachlor
bioaccumulates in edible plants that are consumed.
4.3 Suggestions for Further Studies
v It is recommended that further studies (chronic) be done; analysis of these enzymes as well as
histology on other organs such as kidney, muscle or bladder of animals, to determine the
toxicity of the butachlor herbicide.
v There is a need for regular testing and monitoring of herbicide residues in vegetables and
grains by pesticide regulatory bodies, to ascertain the maximum residue limits (MRL) are not
exceeded and to prevent their excessive build up in the food chain.

101
v It is recommended that farmers or agriculturalists adhere strictly to the manufacturers’ and
regulatory bodies in the application of this herbicide in the soil ecosystem, so as to reduce the
risk associated with herbicide/residue bioaccumulation in plant parts above the MRLs and
subsequent consumption by animals in the food chain. v There should be a health enlightenment programme to enlighten citizens including farmers on
the proper use of pesticides and the effects of pesticide residues in order to curb the potential
health risk to consumers.

102
REFERENCES
Abbas, H. H., Authman^Iman, M. M., Abumourad, M. K., and El- Badawi, A. A. (2007). Studies on the effect of Thiobencarb herbicide on some biological, physiological, biochemical, histological and genetic aspects of nile tilapia, Oreochromis niloticus. Egyptian Journal Aquatic Biology and Fishery, 11:123-150.
Abbas, H. H. H and Mahmoud, H.M. (2003). The toxicological effects of water pollution on the Nile tilapia fish (Oreochromis niloticus) collected from four sites along the River Nile. Egyptian Journal of Veterinary Medical Association, 63: 307-323.
Abass, K. M. (2010). Metabolism and interactions of pesticides in human and animal in vitro hepatic models. PhD dissertation. Acta Univ. Oul. D 1071.pp15-30
Abel, E. L., Opp, S. M., Verlinde, C. L., Bammler, T. K. and Eaton, D. L. (2004b). Characterization of atrazine biotransformation by human and murine glutathione S-transferases. Toxicological Science, 80: 230–238
Abrahame, T and Brunt, N. (1984). An investigation into pesticide imports, distribution and use in
Zambia with special emphasis on the role of multinational companies. Insect Science Application, 5: 157-173.
Achudume, A. C. Nwoha, P. C and Ibe, J. N. (2008) .Toxicity and Bioaccumulation of Insecticide
‘Raid’ in Wistar Rats, Environmental Toxicology, 24(4) :357-361.
Achudume, A. C. (2011). Analysis of Pesticide Raid® in Feed of Wistar Rat by High-Pressure Liquid Chromatography (HPLC). American Journal of Analytical Chemistry, 2: 32-36.s
Adams, R. P. (1989) Identification of Essential Oils by Ion Trap Mass Spectroscopy. Califonia Academic Press, Inc. San Diego. p 302.
Adams, S. M., Greeley, M. S., Lettew, M. S., Hinton, R. F and Saylor, C. F. (1996). Downstream gradient in bioindicator responses: point source contaminant effects on fish health. Canadian Journal of Fisheries and Aquatic Science, 53:2177-2187.
Adhikary, S. A and Sahu, J. K (2001). Internation of cyanobacteria of rice fields to agrochemicals. Algal Biotechnology.Ed.P.C.Trivedi, Point Publishers, Jaipur India. pp. 98-115
Ahokas, J. T. Holdway, D. A.; Brennan, S. E.; Goudey, R. W and Bibrowska, H. B. (1994) MFO activity I carp (cyprinus carpio) exposed to effluent. Environmental Toxicological Chemistry, 13:41-50.
Ahokas, J and Pelkonen, O. (2007). Pharmacokinetics: How Does The Body Handle Drugs? In
UNESCO (Ed) Pharmacology, Encyclopedia of Life Support Systems (EOLSS). Oxford, UNESCO Publishing-Eolss Publishers.
Ahrens, W. H. (1994). Herbicide Handbook: Weed Society Science of America, 9th Edn. Crest Hill
Publishers Ltd, Delhi. pp 39 – 49.
103
Akinloye, O. A., Adamson, I., Ademuyiwa, O and Arowolo, T. A. (2011). Paraquat toxicity and its mode of action in some commonly consumed vegetables in Abeokuta, Nigeria. International Journal of Plant Physiology and Biochemistry, 3(4): 75-82,
Akunyili, D. and Ivbijaro, M.F.A (2006) “Pesticide Regulations and Their Implementation in Nigeria”, In Ivbijaro, M. Akintola, FA,F. and Okechukwu R.U(Eds) 2006.Sustainable Environmental Management in Nigeria. Mattivi Production , Ibadan. pp. 187-210.
Aldrin, J.F. Messager, G.L. and Baudin L, F. (1982) La biochemie clinique en aquaculture. Interest et prespectives. Cnexo. Acres Colloq., 14:291-326.
Allinson, G. and Morita, M. (1995). Bioaccumulation and toxic effects of elevated levels of 3,3′,4,4′-tetrachloroazobenzene (33′44′-TCAB) towards aquatic organisms. In: A simple method for the rapid extraction, detection and determination of 33′44′TCAB in multiple biological samples. Chemosphere, 30(2): 215-221.
Ambali, S. F., Onukak, C., Idris, S. B., Yaqub, L. S., Aliyu, M. H and Kawu, M. (2010). Vitamin C attenuates short-term haematological and biochemical alterations induced by acute chlorpyrifos exposure in Wistar rats. Journal of Medicine and Medical Sciences, 1(10): 465-477.
Anders, M. W., Dekant, W., and Vamvakas, S. (1992). Glutathione-dependent toxicity. Xenobiotica, 22: 1135–1145.
Anderson, J. H and Poulsen ,M. E (2001). Results from monitoring pesticide residues in fruits and vegetables in the Danish market,1998-1999. Food Additive Contamination, 18: 906
Armstrong, R.N. (1994) GlutathioneS-transferases: structure and mechanism of anarche typical detoxication enzyme. Advanced Enzymology Related Areas Molecluar Biology, 69:1–44.
Asogwa, E.U and Dongo, L.N(2009). Problems associated with pesticide usage in Nigeria cocoa production ; A review. African Journal of Agricultural Research, 4(8):675-680
Ateeq, B., Abul Farah, M and Ahmad, W.(2005). Detection of DNA damage by alkaline single cell gel electrophoresis in 2,4-dichlorophenoxyacetic-acidand butachlor exposed erythrocytes of Clarias batrachus. Ecotoxicology and Environmental Safety, 62:348–354.
Ateeq, B., Abul Farah, M. and Ahmad, W. (2006). Evidence of apoptotic effects of 2, 4-D and butachlor on walking catfish, Clarias batrachus, by transmission electron microscopy and DNA degradation studies. Life Science, 78: 977–986.
Ateeq, B., Abdulfarah, M and Niamat, A.(2002) Induction of micronuclei and erythrocyte alterations in the catfish by 2,dichlorophenoxyacetiacidand butachlor. Mutation Research, 518:135-144.
Ayansina, A.D.V., Ogunshe, A.A.O and Fagade, O.E (2003). Environment impact assessment and
microbiology: An overview. Proc. Of 11th annual national conference of Environment and Behaviour Association of Nigeria (EBAN), pp. 26-27.
Bacci, E. (1994). Ecotoxicology of organic contaminants. Boca Raton, Lewis Publishers,Florida. p165

104
Balani, T., Agrawal, S and Thaker, A. M (2011). Hematological and biochemical changes due to short-term oral administration of imidacloprid. Toxicology International, 18(1): 2-4.
Bancroft, J. D., Stevens, A. and Turner, D. R. (1996). Theory and Practice of Histological Technique. 4th Edn. Ch.6 Churchill, Livingstone and New York. pp 99-112.
Baron, M. G. (1995) Bioaccumulation and bioconcentration in aquatic organisms. In Handbook of Ecotoxicology, D. J. Hoffman, B. A. Rattner, G. A. Burton Jr., and J. Cairns Jr., (Eds.) Boca Raton, FL: Lewis Publishers,Florida, pp. 652–666.
Bicalho, S. T. T and Langhenbach, T (2012).Distribution of the herbicide Atrazine in a microcosm
with riparian forest plants. Journal of Environmental Science and Health. Part B: 47(6):505-511
Bogaards, J. J. P., Van-Ommen, B., Wolf, C. R., and Van-Bladeren, P. J. (1995). Human cytochrome P450 enzyme selectivities in the oxidation of chlorinated benzenes. Toxicology and Applied Pharmacology, 132: 44–52.
Borah, S and Yadav, R. N. S. (1995) Alterations in the protein free amino acid, nucleic acids and carbohydrate contents of muscle and gill in rogor exposed freshwater fish Heteropneustes fossilis. Pollution Research, 14(1): 99-103.
Bosveld, T. A. C., Grandener, J., Murk, A. J., Brouwer, A., Van-Kampen, M., Evers, E. H. G and Van -Denberg, M. (1995). Effects of PCDDs,PCDFs and PCBs in common tern (Sterna hirundo) in estuarine and coastal colonies in the Netherlands and Belgium. Environmental Toxicology and Chemistry, 14(1):99-115.
Bounds, S. V. J and Hutson, R. (2000). The comparative metabolism of agrochemicals in plants and
mammals. In Metabolism of Agrochemicals in Plants, Roberts, T(Ed.), Wiley, Chichester, pp. 179–209.
Boutin, C., Lee, H-B., Peart, E. T., Batchelor, P. S and Maguire, R. J. (2000). Effects of the
sulfonylurea herbicide metsulfuron methyl on growth and reproduction of five wetland and terrestrial plant species. Environmental Toxicology and Chemistry, 19(10): 2532-2541.
Bouyoucous, G. J. (1951). A recalibration of the hygrometer for mechanical analysis of soils. Agronomy
Journal, 43: 434-438.
Bretveld, R. W., Thomas, G. M. G., Scheepers, P. T. J. , Zielhuis ,G A and Roeleveld, N. (2006) “Pesticide Exposure: The Hormonal Function of the Female Reproductive System Disrupted,” Reproductive Biology and Endocrinology, 4(30) : 1-4.
Bucheli, T .D and Fent, K. (1995). Induction of cytochrome P450 as a biomarker for environmental contamination in the aquatic ecosystems. Critical Review of Environmental Science Technology, 25:201-256
Bull, D (1982). A growing problem, pesticides and the third world poor. OXFAM, Oxford. CILSS (Institut du sahel)/ CEA (Nations unies). p180

105
Cajaraville, M .P, Bebianno, M. J, Blasco, J., Porte, J., Sarasquete, C and Viarengo, A. (2000). The
use of biomarkers to assess the impact of pollution in coastal environments of the Iberian Peninsula: A practical approach. Science Total Environment, 247: 201–212.
Carriger, J. F., Rand, G. M., Gardinali, P. R., Perry, W. B., Tompkins, M. S and Fernandez, A. M.
(2006) Pesticides of potential ecological concern in sediment from South Florida canals: an ecological risk prioritization for aquatic arthropods. Soil and Sediment Contamination, 15: 21–45.
Chang, J., Chen, T and Fang, T. J. (2005). Pesticide residue monitoring in marketed fresh vegetables
and fruits in Central Taiwan (1999-2004) and an introduction to the HACCP system. Journal of Food and Drug Analysis, 13: 368-376.
Charkroaborty, S. K., Das, S.K and Bhattacharya, A. K. (1990). Studies on the dissipation of butachlor residues under different soil types of West Bengal. Pestology, 14:16-20
Chary, S. N., Kamala C, T and Raj, D. S. S (2008). Assessing risk of heavy metals from consuming food grown on sewage irrigated soils and food chain transfer. Ecotoxicology and Environmental Safety, 69(3): 513-524.
Chindah, A. C., Braide S. A. and Nduaguibe, U.M. (2001).Tolerance of periwinkle (Tympanotonus
fuscatus Linne) and shrimp (Palemonetes africanus Balss) to wastewater from Bonny light crude oil tank farm. Polish Journal Environmental Protection and Natural Resources, 21/22: 61–72.
Chindah, A.C. Sikoki ,F.D and Vincent-Akpu, I.(2004). Toxicity of an Organophosphate Pesticide (chloropyrifos) on a common Niger Delta Wetland Fish-Tilapia guineensis (Blecker 1862). Journal of Applied Science and Environment, 8: 11-17.
Cho, H. Y., and Kong, K. H. (2007). Study on the biochemical characterization of herbicide detoxification enzyme, glutathione S-transferase. Biofactors, 30: 281–287
Cole, D. J. (1994). Detoxification and bioactivation of agrochemicals in plants. Pesticide Science, 42: 209–222.
Coles, E. H. (1986). Veterinary Clinical Pathology of Domestic Animals. 2nd Edn. Academic Press,
NewYork, pp 47-48
Coleman, S., Linderman, R., Hodgson, E., Rose, R. L. (2000). Comparative metabolism of chloroacetamide herbicides and selected metabolites in human and rat liver microsomes. Environmental Health Perspective, 108:1151–1157.
Connell, D. W. (1990). General characteristic of organic compound which exhibit bioaccumulation. In: Connell, D.W. Bioaccumulation of xenobiotic compounds. CRC Press. Boca Raton, pp47-57

106
Covaci, F. V., D’Have, A., Van De Brink, H., Blust, N. W and Bervoets, L. (2010). Accumulation of background levels of persistent organochlorine and organobromine pollutants through earthworm-hedgehog food chain. Environmental International, 36: 721-727.
Darko, G and Aquaah, S. O (2008). Levels of Organochlorine pesticides residues in dairy products in Kumasi, Ghana. Chemosphere, 71:294-298
Dearfield, K.L., McCarroll, N.E., Protzel, A., Stack, H.F., Jackson, M. A and Waters, M. D.(1999). A survey of EPA/OPP and open literature on selected pesticide chemicals.II. Mutagenicity and carcinogenicity of selected chloroacetanilides and related compounds. Mutation Research, 443: 183–221.
Debnath, A., Das, A.C and Mukherjere, D.(2002) Persistence and effect of butachlor and basalin on the activities of phosphate solubilizing microrganisms in wetland rice soil. Bulletin of Environmental Contamination and Toxicology, 68:766-770
Dieter, C.D., Duffy, W.G. and Flake, L. D. (1996) The effect of Phorate on wetland macroinvertebrate. Environmental toxicology and Chemistry, 15(3),308-321.
Dugje, I. Y., Omoigui, L.O., Ekeleme, F., Kamara, A.Y., Tegbaru, A., Teli, A. I and Onyibe, J. E. (2008). Guide to Safe and Effective use of Pesticide for Crop Production. IITA,Ibadan, Nigeria. pp 1-10.
Dutta, H. M and Arends, D. A .(2003). Effects of endosulfan on brain acetylcholinesterase activity
in Juvenile bluegill sunfish. Environmental Research, 91:157-162.
Eaton, D. L and Bammler, T. K (1999). Concise review of glutathione S-transferases and their significance to toxicology. Toxicological Sciences, 49:156-164
Ecobichon, D.J.( 2001). Toxic effects of pesticides. In: Klaassen, C.P. (Ed.), Casarett and Doull’s Toxicology: The Basic Science of Poisons. , 6th ed. Mc-Graw-Hill Medical Pub Division, New York, pp. 794–795.
Edori, O.S., Dibofori-Orji, A. N and Edori, E. S. (2013). Biochemical changes in plasma and liver of clarias Gariepinus exposed to paraquat, Journal of Pharmacy and Biological Sciences, 8(2):35-39
Elzerman, A. W and Coates, J. T. (1987). Hydrophobic organic compounds on sediments: Equlibria and kinetics of sorption. Sources and fates of aquatic pollutants. American Chemical Society pp263-285.
Etonihu, A. C., Aminu, B. A., Ambo, A. I and Etonihu, K. (2011) Iodine content and pesticide residues of some Nigerian food grains. Journal of Agricultural Science, 5 (1): 26 – 32
European Food Safety Authority (EFSA) (2010). 2008 Annual report on pesticide residues according
to article 32 of regulation (EC) No 396/2005. EFSA Journal, 8(7): 1646
Ezeji, E. U., Anyalogbu, E. A., Ezejiofor, T.N and Udensi, J. U. (2012) Determination of reduced glutathione and glutathione S-transferase of poultry birds exposed to permethrin insecticide. American Journal of Biochemistry, 2(3): 21-24.
107
Ezemonye, L and Tongo, I. (2010). Sublethal effects of endosulfan and diazinon pesticides on glutathione-S-transferase (GST) in various tissue of adult amphibian (Bufo regularis). Chemosphere, 81: 214-217.
Farombi, E. O., Ajimoko, Y. R and Adelowo, O. A. (2008). Effect of butachlor on antioxidant
enzyme status and lipid peroxidation in fresh water african catfish, (Clarias gariepinus). International Journal of Environmental Research and Public Health, 5(5): 423-427
Feng, P. C., Wilson, A. G., McClanahan, R. H., Patanella, J. E and Wratten, S. J. (1990). Metabolism of alachlor by rat and mouse liver and nasal turbinate tissues. Drug Metabolism Disposition, 18: 372–377.
Fenik, J., Tankiewicz, M and Biziuk, M. (2011). Properties and determination of pesticides in fruits and vegetables. Trends in Analytical Chemistry, 30(6):814-824.
Ferreira, W. M., Sartori, A. L., Santiago, G. S. and Veloso, J. A. F. (1997). Apparent digestibility of ramie hay (Boehmeria nivea, G.), pigeon pea hay (Cajanus cajan, L.), perennial soybean hay (Glycine wightii, V.) and bean husk (Phaseolus vulgaris, L.) on growing rabbits. Arquine Brazilian Medicine and Veterinary Zoo-technology, 49 (4): 465-472.
Food and Agriculture Organization of the United Nations (2002). International Code of Conduct on the Distribution and Use of Pesticides. Rome, FAO. http://www.fao.org/docrep/005/y4544e/y4544e00.htm
Food and Agriculture Organization of the United Nations (2003). Report of the Joint Meeting of the FAO Panel of Experts on Pesticide Residues in Food and the Environment and the WHO Core Assessment Group on Pesticide Residues Geneva, Switzerland. Rome, World Health Organization and Food and Agriculture Organization of the United Nations (FAO Plant Production and Protection Paper, No. 176). ftp://ftp.fao.org/docrep/fao/006/y5221E/y5221E00.pdf
Food and Agriculture Organization of the United Nations.(1995). Code of Conduct for Responsible Fisheries. Rome, FAO. 41. http://www.fao.org/docrep/005/v9878e/v9878e00.htm
Franke, C., Studinger, G., Berger, G., Bo¨hling, S., Bruckmann, U., Cohors-Fresenborg, D and Johncke, U. (1994). The assessment of bioaccumulation. Chemosphere, 29:1501-1514.
Gabriel, U. U and George, A. D. I. (2005). Plasma enzymes in C.gariepinus exposed to chronic levels of roundup(glyphosate). Environmental Ecology, 23:271-276.
Gabriel, U. U., Jack I. R., Edori, O. S and Egobueze, E. (2009). Electrolytes in selected tissues of Heterobranchus bidorsalis treated with sublethal levels of Cypermethrin. Ethiopian Journal of Environmental Studies and Management, 2(3):83-87
Geng, B. R., Yao, D and Xue, Q. Q. (2005a). Acute toxicity of the pesticide dichlorvos and the herbicide butachlor of tadpoles of four anuran species. Bulletin of Environmental Contamination Toxicology, 75: 343–349

108
Gerba, C. P. (2010). Structure of Risk Analysis In: Gerba Risk Assessment, Chp 14 Badri Dadi Publishers, Pakistan, p213
Gilden, R.C., Huffling, K and Sattler, B. (2010). "Pesticides and health risks". Journal of Obstetetrics Gynecology and Neonatal Nursing, 39 (1): 103–10
Gorell, J. M., Johnson, C. C., Rybicki, B. A, Peterson, E. L. and Richardson, R. J. (1998) "The risk of Parkinson's disease with exposure to pesticides, farming, well water, and rural living", Neurology, 50:1346-1350
Gotz, P and Boger, P.( 2004).The very long chain fatty acid synthase is inhibited by chloroacetamides. Zeitschrift Naturforsch, 59:549-553.
Gronwald, J.W (1991). Lipid biosynthesis inhibitors. Weed Science Society of America, 39 (3): 435-449.
Guengerich, F. P. (1992). Metabolic activation of carcinogens. Pharmacology Therapeutics, 54: 17–61.
Guengerich, F. P. (1993). Bioactivation and detoxication of toxic and carcinogenic chemical. Drug Metabolism and Disposition, 21: 1–6.
Guengerich, F.P (1990).Enzymatic oxidation of xenobiotic chemicals. Review of Biochemistry and Molecular Biology,25: 97-153
Gupt, R., P and Abu-Donia, M. B (1998) Cytochrome P450 enzymes in chickens: Characteristics and induction by xenobiotics. Comparative Biochemistry and Physiology, 12:173-183
Gupta, S., Jena, V., Jena, S., Davie, N., Matic, N., Radojevic, D and Solanki, J. S. (2013). Assessment of heavy metal contents of green leafy vegetables. Croatian Journal of Food Science Technology, 5(2):53-60
Gutteridge, J. M. C. (1995). Lipid peroxidation and antioxidants as biomarkers of tissue damage. Clinical Chemistry, 41(12):1819-1828
Habig, W. H., Pabst, M. J and Jakoby, W.B (1974) Glutathione S-transferases. First enzymatic step in mercapturic acid formation. Journal of Biological Chemistry, 249:7130-7139.
Hagtrum, D. W. and Subramanyam, B. H. (2006). Fundamentalof Stored-Product Entomology. American Association of Cereal Chemists International, St. Paul, Minnesota p 24.
Hall, J. C., Wickenden, J.S and Yau, K.Y.F (2001). Biochemical conjugation of pesticides in plants and microorganisms: an overview of similarities and divergences. pp 89–118 in J.C. Hall, R. E. Hoagland, and R. M. Zablotowicz, eds.Pesticide Biotransformation in Plants and Microorganisms: Similarities and Divergences. Washington, DC: American Chemical Society.
Halliwell, B and Gutterdige, J. M. C (2007). Free Radicals in Biology and Medicine. Oxford
University press, New York, pp85-100
109
Hamilton, D and Crossley, S. (2004). Pesticide Residues in Food and Drinking Water: Human Exposure and Risk John Wiley and sons Ltd. West Sussex England.pp4-10.
Harper A.H. (1985) Review of Biochemistry 20th Edn Lange medical Publication Co. California, p.1012.
Hatzios, K. K. (1991). Biotransformations of Herbicides in Higher Plants. In: Grover, R.; Cessna, A.J. (Edn). Environmental Chemistry of Herbicides. Boca Raton: CRC Press, pp141-185.
Hellstrom, A. (2004). Uptake of Organic Compounds. Department of Environmental Assessment. Swedish University of Agricultural Science. Uppsala.pp329-359.
Heydens, W. F., Lamb, I.C and Wilson, A.G. (2002). Chloracetanilides. In: Krieger, R. (Ed.),
Handbook of Pesticide Toxicology. , 2nd ed. Academic Press, San Diego, pp.1543–1558.
Hill, A. B., Jefferies, P. R., Quistad, G. B. and Casida, J. E. (1997). Dialkylquinoneimine metabolites of chloroacetanilide herbicides induce sister-chromatid exchanges in cultured human lymphocytes. Mutation Research, 395:159–171.
Hodgson, E and Levi, P . E. (1997). A Textbook on Modern Toxicology.2nd Edn Appleton and Lange, Stamford, CT pp.107-118
Hodgson, E and Goldstein, J. A (2001) Metabolism of toxicants: Phase I reactions and pharmacogenetics. In: Hodgson, E and Smart, R. C (Eds) Introduction to Biochemical Toxicology. Wiley, New York, pp. 45–84.
Hodson, P. V. Blunt, B. R and Spry, D. J. (1978a).Chronic Toxicity of waterborn and dietary lead to rainbow trout in lake Ontario water. Water Research Journal, 12(10): 869-878.
Holland, J and Sinclair, P. (2004). Environmental fate of pesticides and the consequences for residues
in food and drinking water, in: Pesticide Residues in Food and Drinking Water: Human Exposure and Risks, Hamilton D. and Crossley S. (Ed.), John Willey and Sons LTD, 0-471-48991-3, West Sussex, England. pp 27 – 62
Hollingworth, R. M., Kurihara, N., Miyamot, I., Otto, S and Paulson, G. D (1995). Detection and
significance of active metabolites of agrochemicals and related xenobiotics in animals. Pure and Applied Chemistry, 67: 1487-1532
Husøy, A. M., Myers, M. S., Willis, M. L., Collier, T. K., Celander, M and Goksøyr, A. (1994) Immunohistochemical localization of CYP1A and CYP3A-like isozymes in hepatic and extrahepatic tissues of Atlantic cod (Gadus morhua L.) a marine fish. Toxicology Applied Pharmacology, 129: 294–308
Islam, M.O., Hara, M and Miyake, J. (2002). Induction of p-glycoprotein, glutathione S-transferase
and cytochrome P450 in rat liver by atrazine. Environmental Toxicology and. Pharmacology, 12:1-6
Iyeghe-Erakpotobor, G. T and Muhammad, I. R. (2008). Intake of tropical grass, legume and legume-grass mixtures by rabbits. Tropical Grasslands, 42:112-119.
110
Jacobsen, N. E., Sanders, M., Toja, R. F and Casida, J. E. (1991). Alachlor and its analogues as metabolic progenitors of formaldehyde: fate of Nmethoxymethyl and other N-alkoxyalkyl substituents. Journal of Agriculture and Food Chemistry, 39:1342–1350.
Jaga, D. C (2003) Sources of exposure and public health implications of organophosphate pesticides. Journal of Pesticides, 14(3):171-185.
Jee, H. J. and Kang, C.J. (2005). Biochemical challenges of enzymatic defense system after phenanthrene exposure in olive flounder, Pralichthys olivaceus. Physiology Research, 54:585-591.
Jiang, L., Ma, L., Sui,Y., Han, S. Q., Wu, Z. Y., Feng, Y. X and Yang, H.(2010) Effect of manure compost on the herbicide prometryne bioavailability to wheat plants. Journal of Hazardous Materials, 184:337-344
Jin, Y., Zhang, X., Shu, L.,Chen, L., Sun,L., Qian, H., Liu, W and Fu, Z (2010).Oxidative stress response and gene expression with atrazine exposure in adult female zebra fish (Danio rerio). Chemosphere, 78:846–852.
Joseph, R. S. I. (1999). Metabolism of azoxystrobin in plants and animals, In: Pesticide Chemistry and Bioscience: The Food–Environment Challenge, Brooks, G. T. and Brooks, G. T. and Roberts, T. R. (Eds), The Royal Society of Chemistry, Cambridge, UK, pp. 265–278
Jung, S.H., Sim, D. S and Kim, Y (2003). Effects of formalin on haematological and blood chemistry
in olive flounder Paralichthys olivaceus. Aquatic Research, 34: 1269-1275.
Jyothi, B and Narayan, G. (2000). Pesticide induced alteration of non-protein nitrogenous constituents in the serum of a fresh water cat fish, Clarias batrachus (Linn). Indian Journal of Experimental Biology, 38: 1059-1061.
Kaneko, J.J., Harvey, T.W. and Brussel, M. L.(1997).Clinical Biochemistry of Domestic animals. Academic Press 5th Edn, Inc. SanDiego, London. International Journal of Veterinary Science, 5:117-138
Kannan, K., Corsolini, S., Focardi, S., Tanabe, S. and Tatsukawa, R. (1996) Accumulation pattern of butyltin compounds in dolphin, tuna, and shark collected from Italian coastal waters. Archives of Environmental Contamination and Toxicology, 31:19-23.
Kaphalia, B. S.,Takroo, R., Mehrotra,S., Nigam, U. and Seth, T. D. (1990). Organochlorine pesticide
residues in different Indian cereals, pulses, spices, vegetables, fruits, milk, butter heshi ghee and edible oils. Journal of Association of Analytical Chemist Int., 73:509-512
Kerle, E.A, Jenkins, J. J and Vogue, P. A (2007).Understanding pesticide persistence and mobility for groundwater and surface water protection. Oregon State Univ. Extension Service, EM8561-E
Khare, A and Singh, S . (2002). Impact of malathion on protein content in the freshwater fish Clarias
batrachus. Journal of Ecotoxicological and Environmental Monitoring, 12(2): 129-132

111
Klein, B., Read, P. A. and Babson, L. A. (1960). Rapid method for the quantitative determination of serum alkaline phosphatase. Clinical Chemistry, 6: 269-275.
Kolpin, D. W., Barbash, J. E and Gilliom, R. J (1998). Occurrence of pesticides in shallow groundwater of the United States: Initial results from the national water-quality assessment program. Environmental Science and Technology, 32: 558-566.
Korte, F., Kvesitadze, G., Ugrekhelidze, D., Gordeziani, M., Khatisashvili, G., Buadze, O.,
Zaalishvili, G. and Coulston, F. (2000). Organic toxicants and plants. Ecotoxicology and Environmental Safety, 47:1-26.
Krieger, R. (2001). Handbook of Pesticide Toxicology. Volume 2, 2nd Edn. Academic Press, San
Diego, California, p. 1550 Kreuger, J. (1999). Pesticides in the Environment - Atmospheric Deposition and Transport to Surface
Waters. Department of Soil Sciences, Swedish University of Agricultural Sciences. Uppsala p 207.
Ksheerasagar, R. L and Kaliwa, B. B. (2006). Histological and Biochemical Changes in the Liver of
Albino Mice on Exposure to Insecticide, Carbosulfan. Caspian Journal of Environmental. Science ,4(1): 67-70
Kuang, H., Hou, Y. X., Chu, X.G and Xu, C. L. (2006b). Simultaneous Determination of Phenoxyacid Herbicides in Soybean by Gas Chromatography-Mass Spectrometry. Chinese Journal of Analytical Chemistry, 34(12): 1733-1736.
Kumari, N., Narayan, O.P and Rai, L.C. s( 2009). Understanding butachlor toxicity in Aulosira fertilissima using physiological, biochemical and proteomic approaches. Chemosphere, 77: 1501–1507.
Lester, S. M., Braunbeck, T. A., Teh, S.J., Stegeman, J. J., Miller, M. R and Hinton, D. E (1993) Hepatic cellular distribution of cyto- crome P450 IA1 in rainbow trout (Oncorhynchus mykiss) an immunohisto- and cytochemicalstudy. Cancer Research, 53: 3700-370
Leonard, R. A. (1990). Movement of pesticides into surface waters. In: Cheng, H. H, Ed. Pesticides in
the soil environment: processes, impacts, and modeling. SSSA Book Series, Madison, Wisconsin. Soil Science Society of America, p. 303
Levi, P. E. and Hodgson, E. (2001).Reactive metabolites and toxicity. In “Introduction to
Biochemical Toxicology” (E. Hodgson and R. C.Smart, eds.) 3rd Edn. John Wiley & Sons, Inc, New York. pp. 199–220
Li, A. A., Asbury, K. J., Hopkins, W. E., Feng, P. C. C.and Wilson, A. G. E. (1992). Metabolism of alachlor by rat and monkey liver and nasal turbinate tissue. .Drug Metabolism and Disposition. 20(4): 616–61

112
Lin, Y. J . Lin C, Yeh., K. J and Lee., A. (2000). Photodegradation of the herbicides butachlor and ronstar using natural sunlight and diethylamine. Bulletin of Environmental Contamination and Toxicology, 64:780-785.
Liu, W., Fang, Z., Liu, H. and Yang, W. (2002b) Adsorption of chloroacetanilide herbicides on soil andits components. III. Influence of clay acidity, humic acid coating and herbicide structure on acetanilide herbicide adsorption on homoionic clays. Journal of Environmental Sciences, 14: 173-180.
Liska, D., Lyon, M and Jones, D.S (2006). Detoxification and biotransformational imbalances. Explore, 2(2): 122–140.
Lowry, O. H., Rosebrough, N. J. Farr, A. L and Randall, R. J (1951). Protein measurement with folin
phenol reagent. Journal of Biological Chemistry, 193:265-275.
Lyman, W. J. (1995). Transport and transformation processes, in Fundamentals of Aquatic Toxicology, Rand, G. M. (Ed.), 2nd Edn, Taylor and Francis, Washington DC, Ch. 15, pp. 449–492.
Mansour, S. A. (2004). Pesticide exposure-Egyptian scene. Toxicology, 7:91-115.
Mansuy, D. (1998).The great diversity of reactions catalyzed by Cytochrome P450.Comparative Biochemistry and Physiology,121: 5-14
Marie, M. A. S. (1994). Toxic effects of aluminium on blood parameters and liver function of the Nile catfish Clarias lazera. Journal of the Egyptian German Society of Zoology, 75: 279-294.
Marrs K. A (1996).The Functions and regulation glutathione in plants. Annual Review of Plant Physiology Plant Molecular Biology, 47: 127-158
Marrs, R. H and Frost, A. J. (1995). Minimising the effects of herbicide spray drift. Pesticide Outlook, 6(4): 28–31.
Marshall, W. J. (2000) Clinical chemistry, 4th Edn. Mosby Edinburg, London, NewYork. p362
Matthes, B. and Böger, P. (2002). Chloroacetamides affect the plasma membrane. Zeitschrift Naturforschung, 57c: 843-852
Matthes, B., Schmalfuß, J. and Böger P. (1998). Chloroaceteamide mode of action II: Inhibition of very-long chain fatty acid synthesis in higher plants. Zeitschrift Naturforschung, 53c: 1004-1011.
Melancon, M. J. (1996). Cytochrome P450 in avian species as a biomarker for environmental contaminant exposure and effect. In: Bengston, D.A Hensshel, D.S(eds) environmental toxicology and Risk assessment: Biomarkers and Risk Assessment, 5 : 95-108.
Michel, A., (1998) Tests of Liver use and misuse. Gastroenterology, 6:34-39
Mill, T. (1993). Environmental chemistry, in Ecological Risk Assessment, Suter, G.W.II (Ed.), Lewis Publishers, Boca Raton, Florida Ch. 4, pp. 91–127.

113
Miller, G. T (2002). Living in the Environment (12th Ed.). Belmont: Wadsworth/Thomson Learning.
pp417-445. Min, H., Ye, Y. F., Chen, Z. Y., Wu, W. X and Yufeng, D (2002). Effects of butachlor on microbial
populations and enzyme activities in paddy soil. Journal of Environmental Science and Health B 36:581-595.
Monaco, T. J., Weller, S. C and Ashton, F. M. (2002) Weedscience: Principles and Practice 4th Edn John Wiley and Sons Inc,New York.pp131-142.
Morrison, H. I, Wilkins, K., Semenciw, R., Mao, Y and Wigle, D. (1992)."Herbicides and Cancer". Journal of the National Cancer Institute, 84 (24): 1866–1874.
Mostafalou, S and Abdollahi M.(2012). Concerns of environmental persistence of pesticides and human chronic diseases. Clinical and Experimental Pharmacology, 2:1000-1108.
Mousa, H. A., Shalaby, A. M., Mamdouh, A. A and El Diane, T. (2007) Toxicological effect of
butataf herbicide on some physiological aspects and the reproductive performance of nile tilapia Oreochromis niloticus. Egyptian Journal of Aquatic Biology and Fishery, 11: 1110-6131
Mousa, M. A. (2004). Toxicological studies on the effect of machete herbicide on some fish species. Egyptian Journal of Applied Science, 19: 1-11
Muley, D. V., Karanjkar, D.M and Maske, S. V. (2007) Impact of industrial effluents on the biochemical composition of freshwater fish Labeo rohita. Journal Environmental Biology, 28(2): 245-249.
Murray, R. K., Granner, D. K., Mayes, P. A and Rodwell, V. W (1996). Harpers Biochemistry, 4th Edn Appleton and Lange, Stamford CT. pp
Muthukaruppan, G and Gunasekaran, P.(2010). Effect of butachlor herbicide on earthworm Eisenia fetida; its histology and perspicuity. Applied Environmental Soil Science, 10:1–4.
Natarajan, A. T. (1993). An overview of the results of testing of known or suspected aneugens using mammalian cells in vitro. Mutation Research, 287: 113-8.
Nebeker, V., Dunn, K. D., Griffis, W. L and Schu-ytema, G. S. (1994) “Effects of Dieldrin in Food on Growth and Bioaccumulation in Mallard Ducklings,” Archives of Environmental Contamination and Toxicology, 26:29-32.
Nelieu, S., F. Perreau, F., Bonnemoy, M., Ollitrault, D., Azam, L., Lagadic, J. B and Einhorn,J. (2001). Sunlight nitrate-inducedphotodegradation of chlorotoluron: evidence of the process in aquatic mesocosms. Environmental Science and Technology, 439: 3148-3154.
Nelson, D. R., Kamataki, T., Waxman, D. J., Guengerich, F. P., Estabrook, R. W., Feyereisen, R.,
Gonzales, F. J., Coon, M. J., Gunsalus, I. C., Gotoh, O., Okuda, K., and Nebert, D. W (1993). The P450 superfamilies: Update on new sequences, gene mapping, accession numbers, early trivial names of enzymes, and nomenclature. DNA Cell Biology, 12:1-51
114
Nelson, D. L and Cox, M. M. (2000). Lehninger Principles of Biochemistry 3rd Edn. Macmillian
Worth Publishers, New York. p540-550 Nesckovic, N. K., Poleksic, V., Elezovic, L., Karan, V and Budimir, M. (1996). Biochemical and
histopathological effects of glyphosate on carp; Cyprinus carpio L. Bulletin of Environmental Contamination and Toxicology, 56 (2): 295-302.
Nilsen, B. M., Berg, K and GoksØyr, A. (1998) Induction of cytochrome P450 in fish: A biomarker for environmental pollution. Methods in Molecular Biology, 107:423-438
Nwani, C. D., Okoh, F., Ama, U. I., Oji, U. O., Ogbonyealu, R.C and Ibiam, A. A. (2013). Acute toxicity of the chloro acetanilide herbicide butachlor and its effects on the behavior of the freshwater fish Tilapia zillii. African Journal of Biotechnology, 5:499-503.
Oakley, A. (2011). Glutathione transferases: A structural perspective. Drug Metabolism Review, 43(2): 138-151.
Oesch, F., Herrero, M. E., Hengstler, J. G., Lohmann, M and Arand, M. (2000). Metabolic detoxification: Implications for thresholds. Toxicological Pathology, 28(3): 382–387.
Oliver, G and Chalton, M. N. (1984). Chlorinated organic contaminated on settling particulates in Niagara River vicinity of lake Ontario. Environmental Science and Technology, 18: 903-905
Olshan, A. F and Daniels, J. L. (1997). Pesticide exposure and childhood cancer. Environmental Health Perspectives, 105(10):197-203
Omoregie, E., Ufodike, E. B. C. and Keke, I. R. (1990). Tissue chemistry of O. niloticus exposed to sublethal concentrations of Gammalin 20 and Actellic 25EC. Journal of Aquatic Science, 5:33-36.
Organisation for Economic Co-operation and Development ,OECD (2003). Descriptions of Selected
Key Generic Terms Used in Chemical Hazard/Risk Assessment. Joint Project with IPCS on the Harmonisation of Hazard/Risk Assessment Terminology, OECD Environment, Health as Safety Publications Series on Testing and Assessment, No 44.ENV/JM/MONO15 Paris. http://www.oecd.org/officialdocuments/publicdisplaydocumentpdf/?cote=ENV/JM/MONO%282003%2915&docLanguage=En
Ortiz-Delgado, J. B., Sarasquete, C., Behrens A., Gonzalez de Canales, M. L. and Segner, H. (2002).
Expression, cellular distribution and induction of cytochrome P4501A (CYP1A) in gilthead seabream, Sparus aurata, brain. Aquatic Toxicology, 60:269-83.
Otitoju, O and Onwurah, I. N. E (2007). Glutathione S-transferase (GST) activity as a biomarker in ecological assessment of Pesticide Contaminated Environment. African Journal of Biotechnology, 6(12):1455-1459.

115
Otto, D. M. E, and Moon, T.W (1996). Phase 1 and 11 enzymes and antioxidant responses in different tissues of brown bull heads from relatively polluted and non-polluted systems. Archives of Environmental Contamination and toxicology, 31: 141-147
Qiu, C., X., Liu, H., Ren, X and F. Jiang, 2010. Study on detection of organophosphorus pesticide residue in vegetables by enzyme inhibition method. Food Machinery, 26(2): 40- 42.
Ou, Y., Chung, P., Chang, Y., Ngo, F., Hsu, K and Chen, F. (2000). Butachlor, a suspected
carcinogen, alters growth and transformation characteristics of mouse liver cells. Chemical Research and Toxicology, 13: 1321-1325
Ou, Y. H and Lin, J. K. (1992). Biotransformation of butachlor through mercapturic acid pathway in rat tissue homogenates, Journal of Toxicology and Environmental Health, 35:19-22
Paganelli, A., Gnazzo, V., Acosta, H., Pez, S. L. L and Carrasco, A. E. (2010) “Glyphosate-Based Herbicides Produce Teratogenic. Effects on Vertebrates by Impairing Retinoic Acid Signaling,” Chemical Research in Toxicology, 23: 1586-1595.
Panneerselvam, N., Sinha, S and Shanmugam, G. (1999). Butachlor is cytotoxic and clastogenic and induces apoptosis in mammalian cells. Indian Journal of Experimental Biology, 37:888–892.
Parkinson, A. (2001). Biotransformation of Xenobiotics. In: Klaasen CD(Ed) Casarett & Doull's Toxicology: The Basic Science of Poisons, 6th Edn. McGraw-Hill Medical Publishers Division, New York ; London, pp 113–186
Parkinson A and Ogilvie B.W.(2009) Biotransformation of Xenobiotics. In Klaassen CD (ed) Casarett and Doull's toxicology . The Basic Science of poisons.7th Edn McGraw-Hill Medical Pub. Division. New York ; London, pp 161-180.
Peakall, D. B. (1994).Biomarkers: the way forward in environmental assessment. Toxicology and Ecotoxicological News, 1:55-60
Pelkonen, O., Turpeinen, M., Uusitalo, J., Rautio, A. and Raunio, H. (2005) Prediction of drug metabolism and interactions on the basis of in vitro investigations. Basic Clinical Pharmacology Toxicology, 96(3): 167–175.
Pimentel, D. (1995). “Amounts of pesticides reaching target pests: environmental impacts and
ethics.” Journal of Agricultural and Environmental Ethics, 8: 17-29.
Pogrmic-Majkic, K., Kaisarevic, S., Fa. S., Dakic, V., Glisic, V., Hrubik, J and Kovacevic, R. (2012). Atrazine effects on antioxidant status and xenobiotic metabolizing enzymes after oral administration in peripubertal male rat. Environmental Toxicology and Pharmacology, 34: 495–501
Prakash, N. B and Suseela, D. L. (2000). Persistence of Butachlor in soils under different moisture regimes. Journal of Indian Society Soil Science, 48: 249-322

116
Rahman, A., Tsurumi, S., Amakawa, T., Soga, K., Hoson, T., Goto, N. and Kamisaka, S. (2000) Involvement of ethylene and gibberellin signalings in Chromosaponin I-induced cell division and cell elongation in the roots of Arabidopsis seedlings. Plant Cell Physiology, 41 (1): 1-9.
Rajput,V., Singh,, S. K., Arpita, K. and Abhishek. (2012). Comparative toxicity of Butachlor,
Imidacloprid and Sodium fluoride on protein profile of the walking cat fish Clarias batrachus .Journal of Applied Pharmaceutical Science 2 (06): 121-124.
Rao, J. V. (2006). Biochemical alterations in euryhaline fish, Oreochromis mossambicus exposed to sub-lethal concentrations of an organophosphorus insecticide, monocrotophos. Chemosphere, 66:1814–1820.
Rao, V.S. (2000). Principle of Weed Science. 2nd Edn. Science Publisher, Enfield, Hampshire. pp 2-5 Reitman, S. and Frankel, S. (1957). A Colourimetric method for determination of serum glutamic
oxaloacetic acid and glutamic pyruvic transaminases. American Journal of Clinical Pathology, 28:56-62.
Ritter, W. F, Chirnside, A. E. M and Scarborough, R.W. (1996) Movement and degradation of triazines, alachlor, and metolachlor in sandy soils. Journal of Environmental Science and Health, 31: 2699–2721.
Roberts, T. R., Hutson, D. H, Lee P. W., Nicholls, P. H and Plimmer, J. R (1998). Metabolic Pathways of Agrochemicals, Part 1: Herbicides and Plant Growth Regulators. 1st Edn. The Royal Society of Chemistry, Cambridge, pp. 179–197.
Roberts, T and Hutson, D. (1999). Metabolic Pathways of Agrochemicals,Part2: Insecticides and Fungicides. Roberts, T. R. (Edn), The Royal Society of Chemistry, Cambridge, UK, pp. 265–278.
Roberts, T. (2000). Metabolism of Agrochemicals in Plants. John Wiley and sons Ltd, New York.
pp.107-154 Rose, R. L and Hodgson, E. (2004). Metabolism of Toxicants. In: Hodgson, E. (Ed) Text Book of
Modern Toxicology. Wiley, New York, pp 111–148.
Salah EI-Deen, M. A and Rogers, W. A. (1993). Changes in total protein and transaminases activity of grass carp exposed to diquat. Journal of Aquatic Animal Health, 5: 280-286.
Salinas, A.E and Wong, M.G. (1999). Glutathione S-transferase. AReview. Current Medicine Chemistry, 6: 279–309.
Sandermann, H. (1992). Higher plant metabolism; the ‘green liver’ concept, Pharmacogenetics, 4: 225–241.
Sarmach, A.K and Sabadie, J. (2002).Hydrolysis of sulfonylurea herbicides in soils and aqueous
solutions: A review. Journal of Agriculture and Food Chemistry, 50:6253–6265

117
Schnoor, J. L. (1996). Toxic Organic Chemicals, in Environmental modeling: fate and transport of pollutants in water, air and soil, Wiley, New York, Ch. 7, pp. 305–380.
Senseman, S. A. (2007). Herbicide Handbook. 9th Edn. Weed Science Society of America. Lawrence
Kansas, pp 76-78.
Shaibu, I. (2008) ‘NAFDAC bans 30 agrochemical products’ Vanguard, May 14, 2008. www.allafrica.com. Accessed on Wednesday, 24th August 2013
Shalaby, A. M., Mousa, H. A., Mamdouh, A. A. and El Diane, T. (2007). Toxicological effect of
butataf herbicide on some physiological aspects and the reproductive performance of nile tilapia Oreochromis niloticus. Egypt Journal Aquatic Biology and Fishery, 11: 1110-6131
Sheehan, D., Meade, G., Foley, V. M and Dowd, C. A. (2001). Structure, function and evolution of glutathione transferases: Implications for classification of non-mammalian members of an ancient enzyme family. Biochemistry Journal, 360:1-16
Singh, H., Brightwell, B. B and Oppenhuizen, M. E. (1982). The Metabolism of Butachlor in rats. Monsato Internal Report. MSL 2145.
Singh, S and Bhati, D. P. S. (1994). Evaluation of liver protein due to stress under 2,4-D. Intoxication in Channa punctatus (Bioch). Bulletin of Environmental Contamination Toxicology, 53: 149-152.
Sinha, S., Panneerselvam, N and Shanmugam, G. (1995). Genotoxicity of the herbicide Butachlor in cultured human lymphocytes. Mutation Research Genetic Toxicology, 344: 63–67
Skidmore, M. W., Paulson, G., Kuiper, H. A., Ohlin, B. and Reynolds, S. (1998). Bound xenobiotic residues in food commodities of plant and animal origin, Pure Applied Chemistry, sons Inc. New Jersey. p. 425.
Stamgroom, S. J., Collins, C. D and Lester, J. N. (2000). Abiotic behavior of organic
micropollutants in soils and the aquatic environment. A review: II. Biotransformation. Environmental Technology, 21: 865–882
Stegeman, J. J and Hahn, M. E. (1994). Biochemistry and molecular biology of monooxygenases: current perspectives on forms, functions, and regulation of cytochrome P450 in aquatic species. In Aquatic Toxicology (Ed.) D. C. Malins and G. K. Ostrander , Lewis Publishers. Boca Raton pp. 87-203.
Stegeman, J. J and Lech, J. J. (1991).Cytochrome P450 monooxygenase systems in aquatic species: carcinogen metabolism and biomarkers for carcinogen and pollutant exposure. Environmental Health Perspective, 90: 101–109.
Stegeman, J. J., Brouwer, M., Richard, T. D. G., Förlin, L., Fowler, B. A., Sanders, B. M and Van
Veld, P. A. (1992). Molecular responses to environmental contamination: enzyme and protein systems as indicators of chemical exposure and effect, In: Biomarkers: Biochemical, Physiological and Histological Markers of Anthropogenic Stress. Huggett, R. J., Kimerly, R.A., Jr. Mehrle, P.M., Bergman, H.L. (Eds.). Lewis Publishers Inc., Chelsea, pp. 235-335.

118
Stephenson, G.A. and Solomon, K.R. (1993) “Pesticides and the Environment”.Department of
Environmental Biology, University of Guelph, Ontario, Canada. Sterling, T. M. (1994). Mechanisms of herbicide absorption across plant membranes and
accumulation in plant cells.Weed Science, 42: 263-276. Stockholm Convention on Persistent Organic Pollutants.6thAnnual
Convention2009.www.en.wikipedia.org/wiki/Stockholm_Convention. Accessed on March 13 2013
Sun, F., Sue-Sun, W., Li, G and Chen, S. (2005). Multiresidue determination of pesticides in fishery products by a tandem solid-phase extraction technique. Journal of Food and Drug, 13:151-158
Tadeoa, J. L., Sanchez-Brunete, C., Perez, R. A and Fernandez, M. D. (2000). Analysis of herbicide residues in cereals, fruits and vegetable. Journal of Chromatography, 882:175-191
Tal, J. A., Hall, J. C and Stephenson G, R. (1995). Non enzymatic conjugation of fenoxaprop-ethyl with glutathione and cysteine in several grass species. Weed Research, 35:133-13.
Tilak, K. S., Veeraiah, K., Bhaskhara, T and Bucthtiram, M. S. (2007) Toxicity studies of Butachlor to the freshwater fish. Channa punctate. Journal of Environmental Biology, 28:485-487
Tolba, M. R., Mohammed, B. and Mohammed, A.(1997): Effect of some heavy metals on respiration, mean enzyme activity and total protein of the plumonate snails. Biomphalaria alexandria and Bulinus truncates. Journal of Egyptian German Society of. Zoology, 24: 17-35
Tomaz, L. (2013). Persistence and Bioaccumulation of Persistent Organic Pollutants (POPs). Applied Bioremediation - Active and Passive Approaches, 10: 307-331
Trapp, S., Mathies, M., Scheunert, I and Topp, E.M. (1990) Modeling the Bioconcentration of
organic chemicals in plants. Environmental Science and Technology, 24:1246-1252.
Tseng, S., Chang, P and Chou, S (2002). Determination of butachlor and pencycuron residues in vegetables and rice: Application of the macroporous diatomacious earth column. Journal of Food Drug Analysis, 10: 127-134.
Ubani, C. S., Oje, O.A. and Oge-Chukwu, I.(2012). Effects of excravos light crude oil on liver enzyme markers activity and malondialdehyde levels of rats. Journal of Environmental and Occupational Science, 1(3): 161-166.
United States Environmental Protection Agency (1998)“Guidelines for Ecological Risk Assessment” Rep.630/R-95/002,Office of Record Development, Washington D.C. http://www.epa.gov/risk _assessment/ecological-risk.htm. Accessed on 12 March 2013
United States Environmental Agency(1998) Alachlor 7508C) 738-R-98-020 Office of Prevention,
Pesticides Protection and Toxic Substances. http://www.epa.gov/oppsrrd1/REDs/0063.pdf. Accessed on 12 March 2013

119
United States Environmental Protection Agency.(2000). Methods for measuring the Toxicity and
Bioaccumulation of Sediment associated contaminants with fresh water invertebrates.2nd ed.EPA/600/R-99/064, Risk Assessment forum, USEPA ,Washington D.C. http://water.epa.gov/polwaste/sediments/cs/upload/freshmanual.pdf. Accessed on 12 March 2013
United States Environmental Protection Agency. Integrated Risk Information System .(IRIS)( 2003)
U.S. Environmetal Protection agency, Office of Research and Development.National Cancer for Environmental Assesssment. Washington D.C .www.epa.gov/iris.
United States Environmental Protection Agency (USEPA (2006). Diazinon Revised Risk Assessment. US Environmental Protection Agency Office of Pesticide Programs. http://www.epa.gov/pesticides/reregistration/REDs/diazinon_red.pdf.
Van der Oost, R., Beyer, J and Vermeleum, N. P. E (2003). Fish bioaccumulation and biomarkers in
environmental risk assessment: A review. Environmental Toxicology Pharmacology, 13: 57-149
Van Eerd, L. L., Hoagland, R. E., Zablotowicz, R. M and Hall J. C. (2003). Pesticide metabolism in plants and microorganisms. Weed Science, 5: 472-495.
Vani, T., Saharan, N., Roy, S. D., Ritesh, R. A. K. , P a l , G. M. Siddaiah, R. K. (2012).
Alteration in haematological and biochemical parameters of Catla catla exposed to sublethal concentrations of cypermethrin. Fish Physiology and Biochemistry, 38:1577-1584.
Walker, L. M., Hatzios, K. K and Wilson, H. P. (1994). Absorption,translocation and metabolism of
14C-thifensulfuron in soybean (Glycine max.), spurred anoda (Anodacristata) and velvetleaf (Abutilon theophrasti). Journal of Plant Growth, 13: 27–32.
Walz, E. (2010)“Glyphosate Resistance Threaten Roundup Hegemony. Nature Biotechnology, 28(6):
537-538.
Wang, K. J., Williams, C. X. and Wilson, G. M. (1995). A study of the mechanism of butachlor-associated gastric neoplasms in Sprague-Dawley rats. Experimental Toxicologic Pathology, 47(2-3): 107-16.
Wang, Y. R., Liu C.Y., Niu, L. B., Cai, C. X and Zhu, S. J. (1996) Phototransformation of butachlor in aquatic system and its fate in rice fields. Acta Scientiae Circumstantiae, 16:475-481
Wang, Q. Q., Yang, W. C and Lui, W. P. (1999). Adsoption of acetanilide herbicides on soils and its correlation with soil properties. Pesticide Science, 55:1103-1108
Wang, X. T., Xing, S. B and Tao, S. (2005). Health risks of heavy metals to the general public in
Tianjin, China via consumption of vegetables and fish. Total Environment, 350: 28-37.
120
Ware, G. W and Whitacre, D.M. (2004). The Pesticide Book. 6th Edn. Meister Media Worldwide, p 17.
Ware, G.W. (2000). The Pesticide Book. 5th Edn. Fresno, CA: Thompson Publications. Willoughby, Ohio. p 496.
Wilson, A. G. E and Takei, A. S. (1999). Summary of Toxicology Studies with Butachlor. Journal of Pesticide Science, 25:75-83
World Health Organisation (WHO) (1989). DDT and its derivatives- Environmental aspects. In “Environmetal Health Criteria839’’. World Health Organisation. Geneva. http://www.inchem.org/documents/ehc/ehc/ehc83.htm
World Health Organisation (WHO) (1990). Public health impact of pesticides used in agriculture. World Health Organization, Geneva: 88. www.nhmrc.gov.au/_files_nhmrc/publications/attachments/eh10.pdf
World Health Organization(WHO)(1993). Biomarkers and risk assessment: Concepts and Principles. Environmental health criteria 155, World Health Organization, Geneva, Switzerland. http://www.inchem.org/documents/ehc/ehc/ehc155.htm
World Health Organization(WHO) (1997). Guidelines for predicting dietary intake of pesticide
residues(revised) global environmental programme(GEMS/FoodI in collaboration with Codex committee on pesticide residues. Programme of Food Safety and Food Aid. 1-44 Geneva,Switzerland. www.osman.es/contenido/profesionales/pesticide_enFoodWHO.pdf.
World Health Organisation(WHO)(2000). The WHO recommended classification of pesticide by
Hazard and guidelines to classification. WHO, Geneva. www.who.int/ipcs/publications/pesticides_hazard_rev_3.pdf
WHO/FAO,(2006). Maximum residue limits for pesticides and veterinary drugs,Food and
Agricultural organization of the United Nation,World Health Organisation(WHO) Rome. http://www.fao.org/ag/AGP/AGPP/Pesticid/JMR.
WHO/FAO, (2010a). Pesticide residues in food – 2009- Evaluations – Part I: Residues. Joint Meeting of the FAO Panel of Experts on Pesticide Residues in Food and the Environment and the WHO Expert Group on Pesticide Residues. FAO Plant Production and Protection Paper 198, 2010. www.efsa.europa.eu/en/efsajournal/doc/1977.pdf
Weed Science Society of America. WSSA.( 2002). Herbicide Handbook. 8th ed. W. K. Vencill, Ed.
Lawrence, KS: Weed Science Society of America. p 493.
Yin, L. C., Guo, H. R., Zhang, S. C and Wang, J. (2007). Study on the acute toxoity and genotoxicity of the herbicide butachlor in flounder Paralichihys olivaceus, and flounder gill (FG) cells. Journal of Ocean Universe Quingdao, 37:167-171

121
Yin, X. H., Li, S. N., Zhang, L and Zhu, G. N. (2008). Evaluation of DNA damage in chinese toad (Bufo gargarizans) after in vivo exposure to sublethal concentration of four herbicides using the comet assay. Ecotoxicology, 17: 280–286.
Yu, Y. L., Chen, Y. X., Luo, Y. M., Pan, X. D., He, Y. F and Wong, M. H. (2003). Rapid degradation of butachlor in wheat rhizosphere soil. Chemosphere, 50: 771–774.
Yousafzai, M. A and Shakoori, A. R . (2011). Hepatic responses of a freshwater fish against aquatic
pollution. Pakistan Journal of Zoology, 43 (2): 209 221.
Zilva, J. F and Pannall, P. R. (1984) Clinical chemistry in Diagnosis and Treatment,4th Edn. Lloyd Medical Books Ltd London, p185.

54
Table 1: The physicochemical properties of the Soil sample from the field area
Text Class Particle Size % pH Value Organic Matter % Exchangeable Bases(me/S100g soil) Exch. acidity me/100g soil
P
(ppm)
Sandy Clay Loam
Clay Silt Fine sand
Coarse sand
H2O KCl C O.M N2 Na+ K+ Ca2+ Mg2+ CEC
Cmol/kg
Base Sat.%
H+ Avail Phos.
(SCL) 19.30± 2.30
7.00± 0.00
26.00±6.70
48.00± 4.40
5.40±0.40
5.00±0.10
1.08±0.10
1.86±0.18
0.116± 0.03
0.39±0.01
0.24±0.02
5.60±0.10
2.40±0.5
10.80±0.55
79.92±0.40
1.60±0. 40 28.60± 18.6
Values are Mean ± SD n=2

122
APPENDICES
APPENDIX I: Standard Curves
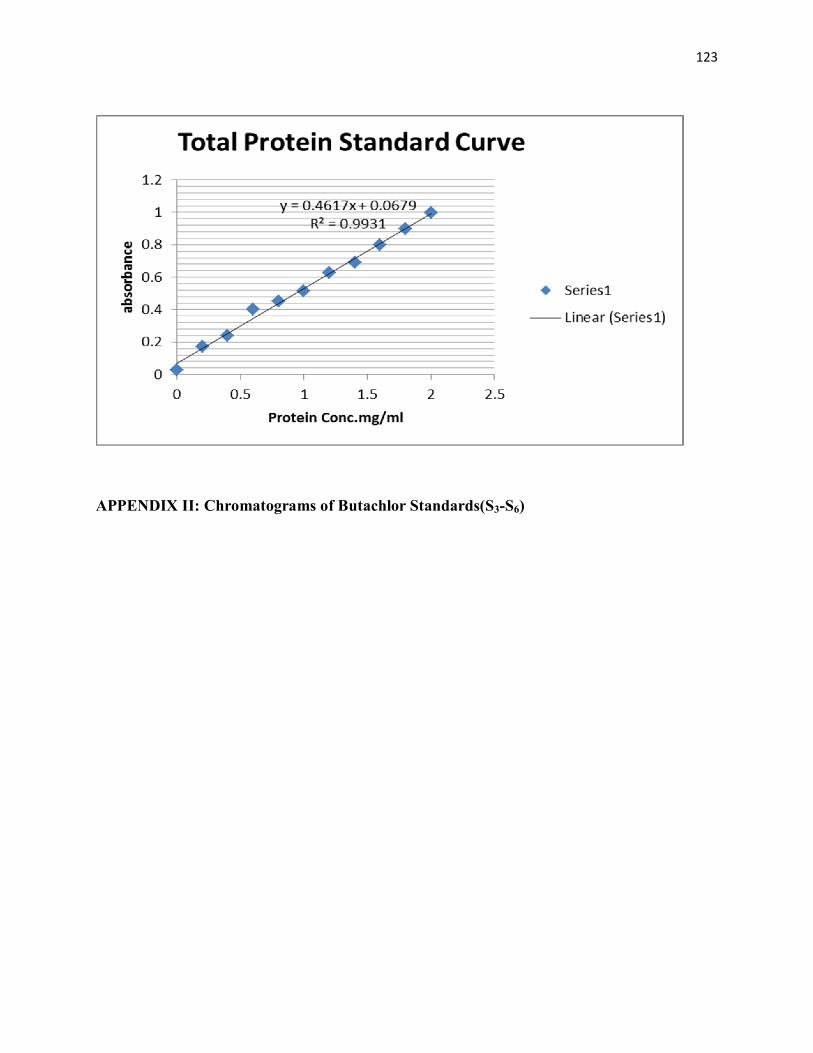
123
APPENDIX II: Chromatograms of Butachlor Standards(S3-S6)

124
Chromatogram/Mass spectrum of Butachlor standard (S3)

125
Chromatogram/Mass spectrum of Butachlor standard (S4)

126
Chromatogram/Mass spectrum of Butachlor standard (S6)

127
APPENDIX 111:Statistical Analysis for Results
There is statistical difference between the C1 and C2 at 0.05 level of significance also there is significance difference between C1 and C3 and there is statistical difference between C2 and C3 at 0.05 level of significance.
ONE WAY ANOVA
Butachlor in sample Statistical Analysis
at 0.05 significance level
Samples Conc. 1 Conc.2 MEANS std deviation C1 0.1 0.08 0.09 0.01414 C2 0.1275 0.1277 0.128 0.00014 C3 0.2 0.18 0.19 0.01414 MEANS 0.1425 0.1292 ANOVA
Sum of Squares df
Mean Square F Sig.
Between samples 0.01 2 0.005 38.267 0.007
Within samples 0.0004 3 0.0001 Total 0.011 5 POST HOC TEST Duncan
Subset for alpha = 0.05
SAM N 1 2 3 1 2 0.09 2 2 0.1276 3 2 0.19 Sig. 1 1 1 Means for groups in homogeneous subsets are displayed.

128
Oneway {Day 1}
Descriptives
N Mean Std. Deviation Std. Error 95% Confidence Interval for Mean Minimum Maximum
Lower Bound Upper Bound
Body Weight
Group 1=Normal Control 4 1.2750 .09574 .04787 1.1227 1.4273 1.20 1.40
Group 2=0.10 ppm of Herbicide 4 1.3125 .24622 .12311 .9207 1.7043 1.10 1.55
Group 3=0.13 ppm of Herbicide 4 1.4375 .17017 .08509 1.1667 1.7083 1.20 1.60
Group 4=0.20 ppm of Herbicide 4 1.4000 .24833 .12416 1.0049 1.7951 1.10 1.70
Total 16 1.3563 .19138 .04784 1.2543 1.4582 1.10 1.70
Total Protein
Group 1=Normal Control 4 7.9250 .51235 .25617 7.1097 8.7403 7.40 8.60
Group 2=0.10 ppm of Herbicide 4 8.9250 .29861 .14930 8.4498 9.4002 8.60 9.30
Group 3=0.13 ppm of Herbicide 4 8.5750 1.20934 .60467 6.6507 10.4993 7.50 9.90
Group 4=0.20 ppm of Herbicide 4 9.8750 1.19826 .59913 7.9683 11.7817 8.10 10.60
Total 16 8.8250 1.08597 .27149 8.2463 9.4037 7.40 10.60
AST
Group 1=Normal Control 4 36.7500 4.03113 2.01556 30.3356 43.1644 32.00 41.00
Group 2=0.10 ppm of Herbicide 4 51.7500 7.80491 3.90246 39.3306 64.1694 42.00 61.00
Group 3=0.13 ppm of Herbicide 4 64.2500 15.34872 7.67436 39.8268 88.6732 48.00 81.00
Group 4=0.20 ppm of Herbicide 4 76.5000 9.67815 4.83908 61.0999 91.9001 69.00 90.00
Total 16 57.3125 17.70016 4.42504 47.8807 66.7443 32.00 90.00
ALT
Group 1=Normal Control 4 24.5000 4.50925 2.25462 17.3248 31.6752 21.00 31.00
Group 2=0.10 ppm of Herbicide 4 27.5000 5.25991 2.62996 19.1303 35.8697 22.00 32.00
Group 3=0.13 ppm of Herbicide 4 31.0000 6.05530 3.02765 21.3647 40.6353 22.00 35.00

129
Group 4=0.20 ppm of Herbicide 4 20.7500 6.94622 3.47311 9.6970 31.8030 15.00 29.00
Total 16 25.9375 6.46497 1.61624 22.4926 29.3824 15.00 35.00
ALP
Group 1=Normal Control 4 40.2500 11.11680 5.55840 22.5607 57.9393 25.00 51.00
Group 2=0.10 ppm of Herbicide 4 32.2500 7.13559 3.56780 20.8957 43.6043 24.00 41.00
Group 3=0.13 ppm of Herbicide 4 34.0000 9.48683 4.74342 18.9043 49.0957 22.00 43.00
Group 4=0.20 ppm of Herbicide 4 42.5000 12.81926 6.40963 22.1017 62.8983 30.00 60.00
Total 16 37.2500 10.24695 2.56174 31.7898 42.7102 22.00 60.00
Cyt_P450
Group 1=Normal Control 4 10.9768 1.73524 .86762 8.2156 13.7379 8.57 12.61
Group 2=0.10 ppm of Herbicide 4 10.7605 .79543 .39771 9.4948 12.0262 9.90 11.82
Group 3=0.13 ppm of Herbicide 4 8.7741 .46249 .23125 8.0381 9.5100 8.12 9.14
Group 4=0.20 ppm of Herbicide 4 8.1052 .50128 .25064 7.3076 8.9029 7.56 8.77
Total 16 9.6541 1.56876 .39219 8.8182 10.4901 7.56 12.61
GST
Group 1=Normal Control 4 2.4250 1.49750 .74875 .0421 4.8079 .80 4.10
Group 2=0.10 ppm of Herbicide 4 2.1750 1.34009 .67004 .0426 4.3074 .70 3.50
Group 3=0.13 ppm of Herbicide 4 1.0250 .29861 .14930 .5498 1.5002 .70 1.40
Group 4=0.20 ppm of Herbicide 4 .2625 .22809 .11404 -.1004 .6254 .10 .60
Total 16 1.4719 1.28580 .32145 .7867 2.1570 .10 4.10
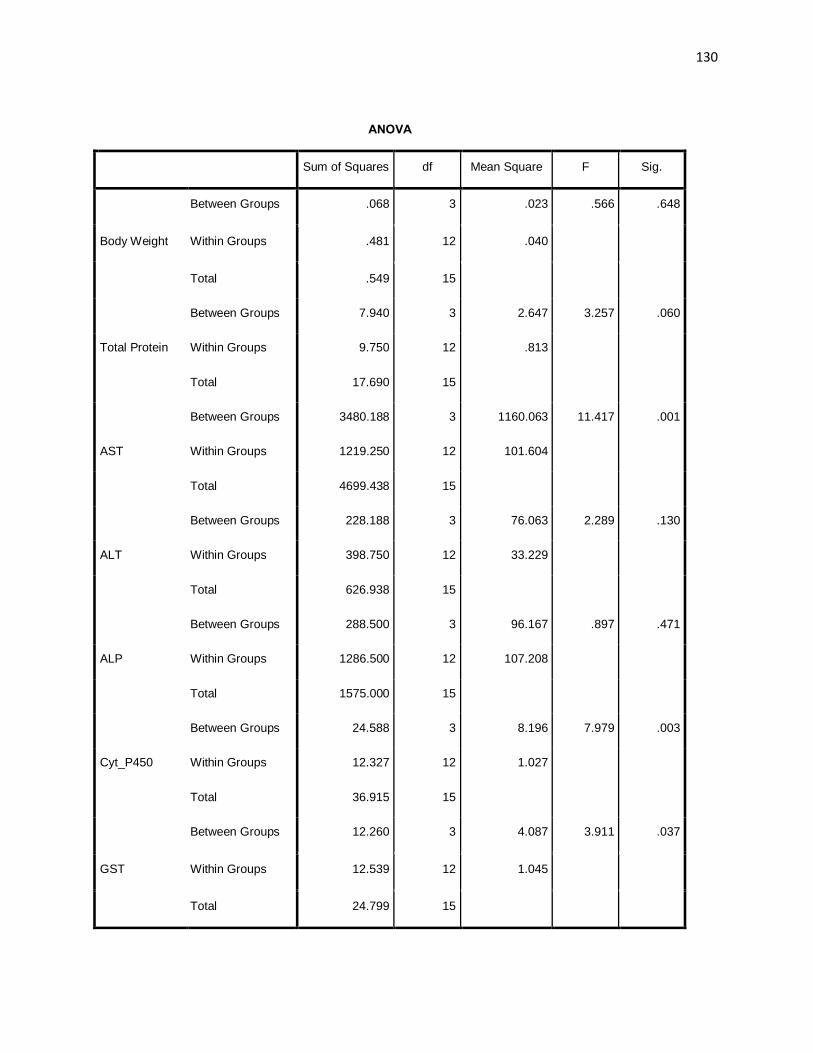
130
ANOVA
Sum of Squares df Mean Square F Sig.
Body Weight
Between Groups .068 3 .023 .566 .648
Within Groups .481 12 .040
Total .549 15
Total Protein
Between Groups 7.940 3 2.647 3.257 .060
Within Groups 9.750 12 .813
Total 17.690 15
AST
Between Groups 3480.188 3 1160.063 11.417 .001
Within Groups 1219.250 12 101.604
Total 4699.438 15
ALT
Between Groups 228.188 3 76.063 2.289 .130
Within Groups 398.750 12 33.229
Total 626.938 15
ALP
Between Groups 288.500 3 96.167 .897 .471
Within Groups 1286.500 12 107.208
Total 1575.000 15
Cyt_P450
Between Groups 24.588 3 8.196 7.979 .003
Within Groups 12.327 12 1.027
Total 36.915 15
GST
Between Groups 12.260 3 4.087 3.911 .037
Within Groups 12.539 12 1.045
Total 24.799 15

131
Post Hoc Tests
Multiple Comparisons
Dependent Variable (I) Groups (J) Groups Mean Difference
(I-J)
Std. Error Sig. 95% Confidence Interval
Lower Bound Upper Bound
Body Weight LSD
Group 1=Normal Control
Group 2=0.10 ppm of Herbicide -.03750 .14161 .796 -.3460 .2710
Group 3=0.13 ppm of Herbicide -.16250 .14161 .274 -.4710 .1460
Group 4=0.20 ppm of Herbicide -.12500 .14161 .395 -.4335 .1835
Group 2=0.10 ppm of Herbicide
Group 1=Normal Control .03750 .14161 .796 -.2710 .3460
Group 3=0.13 ppm of Herbicide -.12500 .14161 .395 -.4335 .1835
Group 4=0.20 ppm of Herbicide -.08750 .14161 .548 -.3960 .2210
Group 3=0.13 ppm of Herbicide
Group 1=Normal Control .16250 .14161 .274 -.1460 .4710
Group 2=0.10 ppm of Herbicide .12500 .14161 .395 -.1835 .4335
Group 4=0.20 ppm of Herbicide .03750 .14161 .796 -.2710 .3460
Group 4=0.20 ppm of Herbicide
Group 1=Normal Control .12500 .14161 .395 -.1835 .4335
Group 2=0.10 ppm of Herbicide .08750 .14161 .548 -.2210 .3960
Group 3=0.13 ppm of Herbicide -.03750 .14161 .796 -.3460 .2710
Total Protein LSD
Group 1=Normal Control
Group 2=0.10 ppm of Herbicide -1.00000 .63738 .143 -2.3887 .3887
Group 3=0.13 ppm of Herbicide -.65000 .63738 .328 -2.0387 .7387
Group 4=0.20 ppm of Herbicide -1.95000* .63738 .010 -3.3387 -.5613
Group 2=0.10 ppm of Herbicide
Group 1=Normal Control 1.00000 .63738 .143 -.3887 2.3887
Group 3=0.13 ppm of Herbicide .35000 .63738 .593 -1.0387 1.7387
Group 4=0.20 ppm of Herbicide -.95000 .63738 .162 -2.3387 .4387
Group 3=0.13 ppm of Herbicide Group 1=Normal Control .65000 .63738 .328 -.7387 2.0387

132
Group 2=0.10 ppm of Herbicide -.35000 .63738 .593 -1.7387 1.0387
Group 4=0.20 ppm of Herbicide -1.30000 .63738 .064 -2.6887 .0887
Group 4=0.20 ppm of Herbicide
Group 1=Normal Control 1.95000* .63738 .010 .5613 3.3387
Group 2=0.10 ppm of Herbicide .95000 .63738 .162 -.4387 2.3387
Group 3=0.13 ppm of Herbicide 1.30000 .63738 .064 -.0887 2.6887
AST LSD
Group 1=Normal Control
Group 2=0.10 ppm of Herbicide -15.00000 7.12756 .057 -30.5296 .5296
Group 3=0.13 ppm of Herbicide -27.50000* 7.12756 .002 -43.0296 -11.9704
Group 4=0.20 ppm of Herbicide -39.75000* 7.12756 .000 -55.2796 -24.2204
Group 2=0.10 ppm of Herbicide
Group 1=Normal Control 15.00000 7.12756 .057 -.5296 30.5296
Group 3=0.13 ppm of Herbicide -12.50000 7.12756 .105 -28.0296 3.0296
Group 4=0.20 ppm of Herbicide -24.75000* 7.12756 .005 -40.2796 -9.2204
Group 3=0.13 ppm of Herbicide
Group 1=Normal Control 27.50000* 7.12756 .002 11.9704 43.0296
Group 2=0.10 ppm of Herbicide 12.50000 7.12756 .105 -3.0296 28.0296
Group 4=0.20 ppm of Herbicide -12.25000 7.12756 .111 -27.7796 3.2796
Group 4=0.20 ppm of Herbicide
Group 1=Normal Control 39.75000* 7.12756 .000 24.2204 55.2796
Group 2=0.10 ppm of Herbicide 24.75000* 7.12756 .005 9.2204 40.2796
Group 3=0.13 ppm of Herbicide 12.25000 7.12756 .111 -3.2796 27.7796
ALT LSD
Group 1=Normal Control
Group 2=0.10 ppm of Herbicide -3.00000 4.07610 .476 -11.8811 5.8811
Group 3=0.13 ppm of Herbicide -6.50000 4.07610 .137 -15.3811 2.3811
Group 4=0.20 ppm of Herbicide 3.75000 4.07610 .376 -5.1311 12.6311
Group 2=0.10 ppm of Herbicide
Group 1=Normal Control 3.00000 4.07610 .476 -5.8811 11.8811
Group 3=0.13 ppm of Herbicide -3.50000 4.07610 .407 -12.3811 5.3811
Group 4=0.20 ppm of Herbicide 6.75000 4.07610 .124 -2.1311 15.6311
Group 3=0.13 ppm of Herbicide Group 1=Normal Control 6.50000 4.07610 .137 -2.3811 15.3811
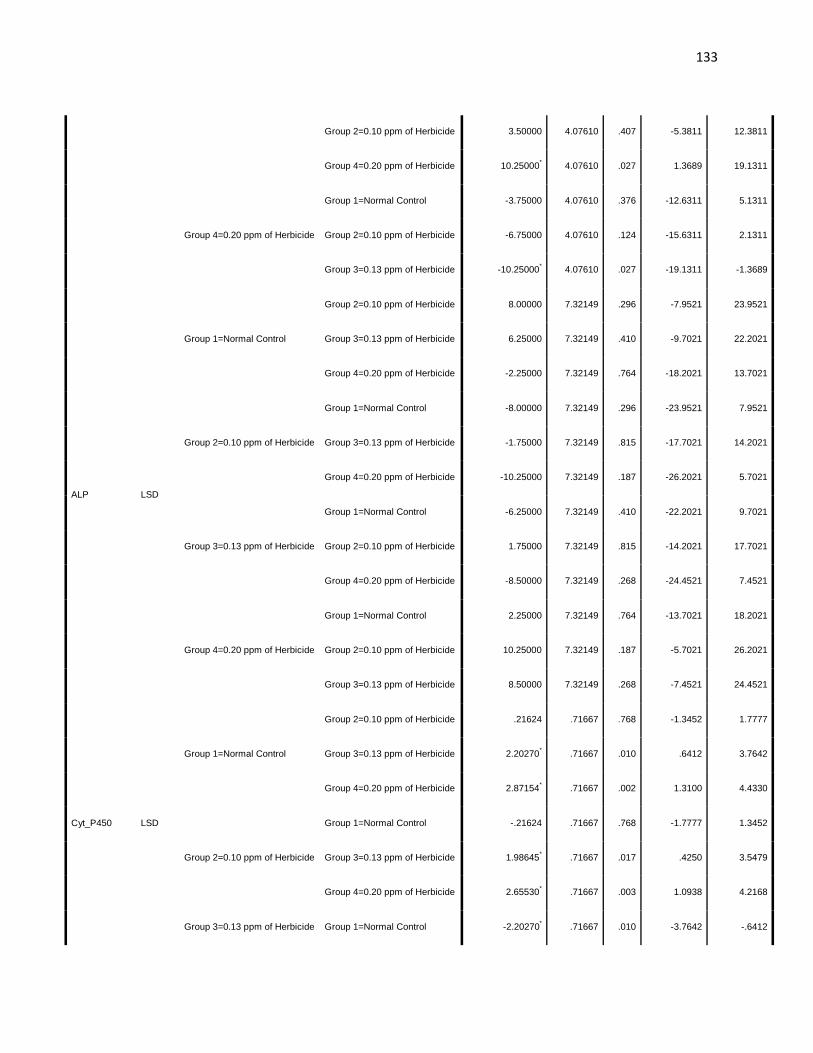
133
Group 2=0.10 ppm of Herbicide 3.50000 4.07610 .407 -5.3811 12.3811
Group 4=0.20 ppm of Herbicide 10.25000* 4.07610 .027 1.3689 19.1311
Group 4=0.20 ppm of Herbicide
Group 1=Normal Control -3.75000 4.07610 .376 -12.6311 5.1311
Group 2=0.10 ppm of Herbicide -6.75000 4.07610 .124 -15.6311 2.1311
Group 3=0.13 ppm of Herbicide -10.25000* 4.07610 .027 -19.1311 -1.3689
ALP LSD
Group 1=Normal Control
Group 2=0.10 ppm of Herbicide 8.00000 7.32149 .296 -7.9521 23.9521
Group 3=0.13 ppm of Herbicide 6.25000 7.32149 .410 -9.7021 22.2021
Group 4=0.20 ppm of Herbicide -2.25000 7.32149 .764 -18.2021 13.7021
Group 2=0.10 ppm of Herbicide
Group 1=Normal Control -8.00000 7.32149 .296 -23.9521 7.9521
Group 3=0.13 ppm of Herbicide -1.75000 7.32149 .815 -17.7021 14.2021
Group 4=0.20 ppm of Herbicide -10.25000 7.32149 .187 -26.2021 5.7021
Group 3=0.13 ppm of Herbicide
Group 1=Normal Control -6.25000 7.32149 .410 -22.2021 9.7021
Group 2=0.10 ppm of Herbicide 1.75000 7.32149 .815 -14.2021 17.7021
Group 4=0.20 ppm of Herbicide -8.50000 7.32149 .268 -24.4521 7.4521
Group 4=0.20 ppm of Herbicide
Group 1=Normal Control 2.25000 7.32149 .764 -13.7021 18.2021
Group 2=0.10 ppm of Herbicide 10.25000 7.32149 .187 -5.7021 26.2021
Group 3=0.13 ppm of Herbicide 8.50000 7.32149 .268 -7.4521 24.4521
Cyt_P450 LSD
Group 1=Normal Control
Group 2=0.10 ppm of Herbicide .21624 .71667 .768 -1.3452 1.7777
Group 3=0.13 ppm of Herbicide 2.20270* .71667 .010 .6412 3.7642
Group 4=0.20 ppm of Herbicide 2.87154* .71667 .002 1.3100 4.4330
Group 2=0.10 ppm of Herbicide
Group 1=Normal Control -.21624 .71667 .768 -1.7777 1.3452
Group 3=0.13 ppm of Herbicide 1.98645* .71667 .017 .4250 3.5479
Group 4=0.20 ppm of Herbicide 2.65530* .71667 .003 1.0938 4.2168
Group 3=0.13 ppm of Herbicide Group 1=Normal Control -2.20270* .71667 .010 -3.7642 -.6412
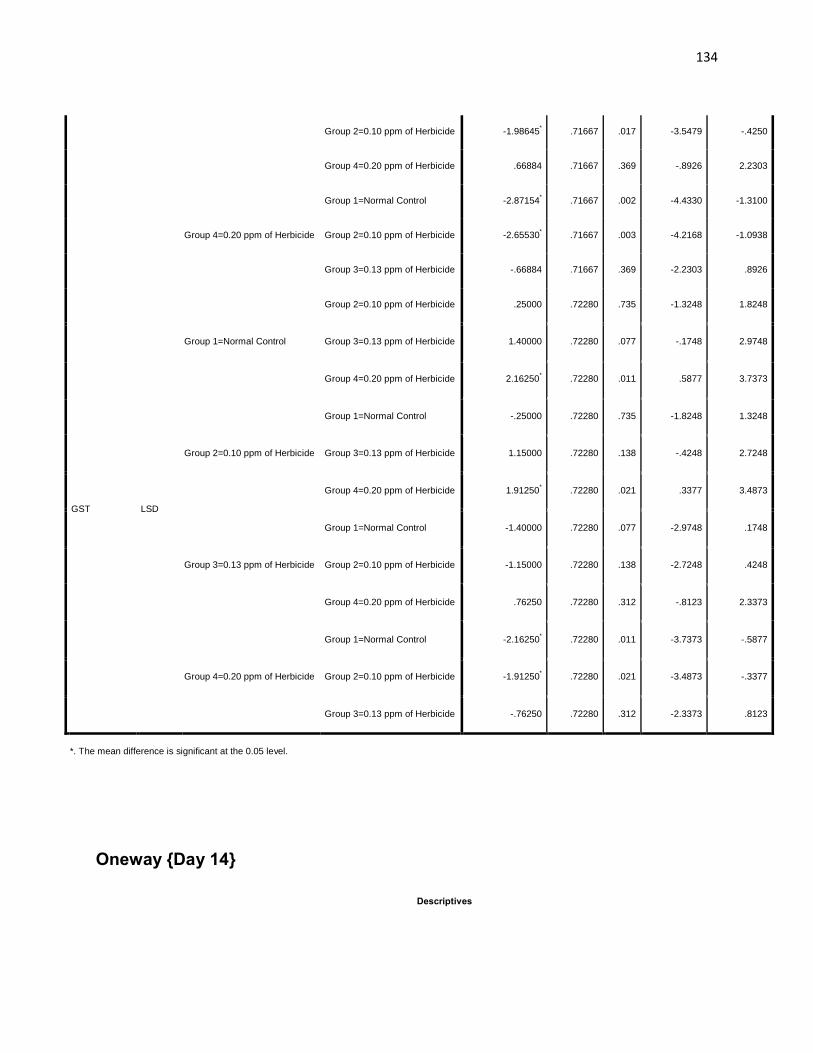
134
Group 2=0.10 ppm of Herbicide -1.98645* .71667 .017 -3.5479 -.4250
Group 4=0.20 ppm of Herbicide .66884 .71667 .369 -.8926 2.2303
Group 4=0.20 ppm of Herbicide
Group 1=Normal Control -2.87154* .71667 .002 -4.4330 -1.3100
Group 2=0.10 ppm of Herbicide -2.65530* .71667 .003 -4.2168 -1.0938
Group 3=0.13 ppm of Herbicide -.66884 .71667 .369 -2.2303 .8926
GST LSD
Group 1=Normal Control
Group 2=0.10 ppm of Herbicide .25000 .72280 .735 -1.3248 1.8248
Group 3=0.13 ppm of Herbicide 1.40000 .72280 .077 -.1748 2.9748
Group 4=0.20 ppm of Herbicide 2.16250* .72280 .011 .5877 3.7373
Group 2=0.10 ppm of Herbicide
Group 1=Normal Control -.25000 .72280 .735 -1.8248 1.3248
Group 3=0.13 ppm of Herbicide 1.15000 .72280 .138 -.4248 2.7248
Group 4=0.20 ppm of Herbicide 1.91250* .72280 .021 .3377 3.4873
Group 3=0.13 ppm of Herbicide
Group 1=Normal Control -1.40000 .72280 .077 -2.9748 .1748
Group 2=0.10 ppm of Herbicide -1.15000 .72280 .138 -2.7248 .4248
Group 4=0.20 ppm of Herbicide .76250 .72280 .312 -.8123 2.3373
Group 4=0.20 ppm of Herbicide
Group 1=Normal Control -2.16250* .72280 .011 -3.7373 -.5877
Group 2=0.10 ppm of Herbicide -1.91250* .72280 .021 -3.4873 -.3377
Group 3=0.13 ppm of Herbicide -.76250 .72280 .312 -2.3373 .8123
*. The mean difference is significant at the 0.05 level.
Oneway {Day 14}
Descriptives

135
N Mean Std.
Deviation
Std. Error 95% Confidence Interval for Mean Minimum Maximum
Lower Bound Upper Bound
Body Weight
Group 1=Normal Control 4 1.0750 .08660 .04330 .9372 1.2128 1.00 1.15
Group 2=0.10 ppm of Herbicide 4 1.0250 .12583 .06292 .8248 1.2252 .90 1.20
Group 3=0.13 ppm of Herbicide 4 1.0000 .14142 .07071 .7750 1.2250 .80 1.10
Group 4=0.20 ppm of Herbicide 4 1.2750 .08660 .04330 1.1372 1.4128 1.20 1.40
Total 16 1.0938 .15042 .03760 1.0136 1.1739 .80 1.40
Total Protein
Group 1=Normal Control 4 5.9500 .46547 .23274 5.2093 6.6907 5.30 6.40
Group 2=0.10 ppm of Herbicide 4 8.2000 .82057 .41028 6.8943 9.5057 7.40 9.30
Group 3=0.13 ppm of Herbicide 4 7.3000 .59442 .29721 6.3541 8.2459 6.60 8.00
Group 4=0.20 ppm of Herbicide 4 7.1750 .61305 .30653 6.1995 8.1505 6.40 7.80
Total 16 7.1563 1.00397 .25099 6.6213 7.6912 5.30 9.30
AST
Group 1=Normal Control 4 36.0000 5.47723 2.73861 27.2845 44.7155 30.00 42.00
Group 2=0.10 ppm of Herbicide 4 53.7500 11.32475 5.66238 35.7298 71.7702 44.00 70.00
Group 3=0.13 ppm of Herbicide 4 98.2500 12.99679 6.49840 77.5692 118.9308 87.00 115.00
Group 4=0.20 ppm of Herbicide 4 96.0000 11.91638 5.95819 77.0384 114.9616 86.00 113.00
Total 16 71.0000 29.40295 7.35074 55.3323 86.6677 30.00 115.00
ALT
Group 1=Normal Control 4 26.5000 3.69685 1.84842 20.6175 32.3825 21.00 29.00
Group 2=0.10 ppm of Herbicide 4 37.2500 13.69611 6.84805 15.4564 59.0436 21.00 54.00
Group 3=0.13 ppm of Herbicide 4 42.7500 6.94622 3.47311 31.6970 53.8030 37.00 51.00
Group 4=0.20 ppm of Herbicide 4 10.7500 1.70783 .85391 8.0325 13.4675 9.00 13.00
Total 16 29.3125 14.47167 3.61792 21.6011 37.0239 9.00 54.00
ALP Group 1=Normal Control 4 34.7500 5.43906 2.71953 26.0952 43.4048 29.00 42.00
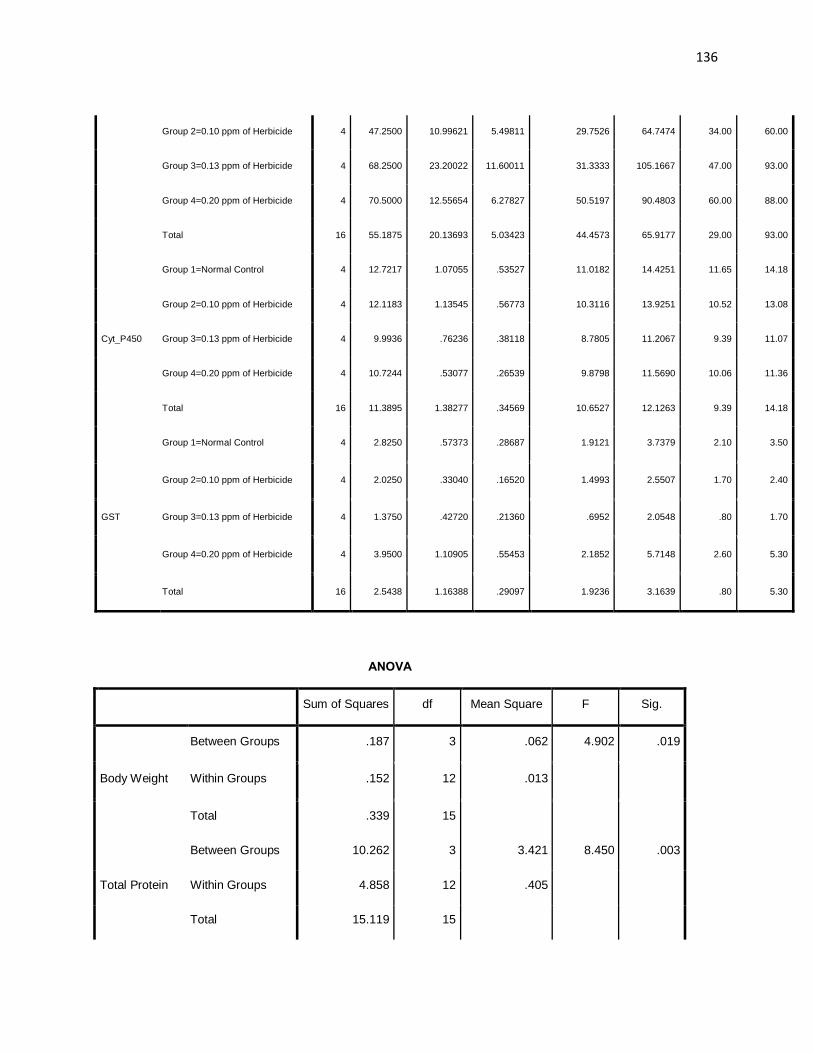
136
Group 2=0.10 ppm of Herbicide 4 47.2500 10.99621 5.49811 29.7526 64.7474 34.00 60.00
Group 3=0.13 ppm of Herbicide 4 68.2500 23.20022 11.60011 31.3333 105.1667 47.00 93.00
Group 4=0.20 ppm of Herbicide 4 70.5000 12.55654 6.27827 50.5197 90.4803 60.00 88.00
Total 16 55.1875 20.13693 5.03423 44.4573 65.9177 29.00 93.00
Cyt_P450
Group 1=Normal Control 4 12.7217 1.07055 .53527 11.0182 14.4251 11.65 14.18
Group 2=0.10 ppm of Herbicide 4 12.1183 1.13545 .56773 10.3116 13.9251 10.52 13.08
Group 3=0.13 ppm of Herbicide 4 9.9936 .76236 .38118 8.7805 11.2067 9.39 11.07
Group 4=0.20 ppm of Herbicide 4 10.7244 .53077 .26539 9.8798 11.5690 10.06 11.36
Total 16 11.3895 1.38277 .34569 10.6527 12.1263 9.39 14.18
GST
Group 1=Normal Control 4 2.8250 .57373 .28687 1.9121 3.7379 2.10 3.50
Group 2=0.10 ppm of Herbicide 4 2.0250 .33040 .16520 1.4993 2.5507 1.70 2.40
Group 3=0.13 ppm of Herbicide 4 1.3750 .42720 .21360 .6952 2.0548 .80 1.70
Group 4=0.20 ppm of Herbicide 4 3.9500 1.10905 .55453 2.1852 5.7148 2.60 5.30
Total 16 2.5438 1.16388 .29097 1.9236 3.1639 .80 5.30
ANOVA
Sum of Squares df Mean Square F Sig.
Body Weight
Between Groups .187 3 .062 4.902 .019
Within Groups .152 12 .013
Total .339 15
Total Protein
Between Groups 10.262 3 3.421 8.450 .003
Within Groups 4.858 12 .405
Total 15.119 15

137
AST
Between Groups 11560.500 3 3853.500 32.854 .000
Within Groups 1407.500 12 117.292
Total 12968.000 15
ALT
Between Groups 2384.188 3 794.729 12.594 .001
Within Groups 757.250 12 63.104
Total 3141.438 15
ALP
Between Groups 3543.188 3 1181.063 5.581 .012
Within Groups 2539.250 12 211.604
Total 6082.438 15
Cyt_P450
Between Groups 18.786 3 6.262 7.594 .004
Within Groups 9.895 12 .825
Total 28.681 15
GST
Between Groups 14.767 3 4.922 10.638 .001
Within Groups 5.552 12 .463
Total 20.319 15
Post Hoc Tests
Multiple Comparisons
Dependent Variable (I) Groups (J) Groups Mean Difference
(I-J)
Std. Error Sig. 95% Confidence Interval
Lower Bound Upper Bound
Body
Weight LSD Group 1=Normal Control
Group 2=0.10 ppm of Herbicide .05000 .07971 .542 -.1237 .2237
Group 3=0.13 ppm of Herbicide .07500 .07971 .365 -.0987 .2487
Group 4=0.20 ppm of Herbicide -.20000* .07971 .027 -.3737 -.0263

138
Group 2=0.10 ppm of Herbicide
Group 1=Normal Control -.05000 .07971 .542 -.2237 .1237
Group 3=0.13 ppm of Herbicide .02500 .07971 .759 -.1487 .1987
Group 4=0.20 ppm of Herbicide -.25000* .07971 .009 -.4237 -.0763
Group 3=0.13 ppm of Herbicide
Group 1=Normal Control -.07500 .07971 .365 -.2487 .0987
Group 2=0.10 ppm of Herbicide -.02500 .07971 .759 -.1987 .1487
Group 4=0.20 ppm of Herbicide -.27500* .07971 .005 -.4487 -.1013
Group 4=0.20 ppm of Herbicide
Group 1=Normal Control .20000* .07971 .027 .0263 .3737
Group 2=0.10 ppm of Herbicide .25000* .07971 .009 .0763 .4237
Group 3=0.13 ppm of Herbicide .27500* .07971 .005 .1013 .4487
Total
Protein LSD
Group 1=Normal Control
Group 2=0.10 ppm of Herbicide -2.25000* .44988 .000 -3.2302 -1.2698
Group 3=0.13 ppm of Herbicide -1.35000* .44988 .011 -2.3302 -.3698
Group 4=0.20 ppm of Herbicide -1.22500* .44988 .019 -2.2052 -.2448
Group 2=0.10 ppm of Herbicide
Group 1=Normal Control 2.25000* .44988 .000 1.2698 3.2302
Group 3=0.13 ppm of Herbicide .90000 .44988 .069 -.0802 1.8802
Group 4=0.20 ppm of Herbicide 1.02500* .44988 .042 .0448 2.0052
Group 3=0.13 ppm of Herbicide
Group 1=Normal Control 1.35000* .44988 .011 .3698 2.3302
Group 2=0.10 ppm of Herbicide -.90000 .44988 .069 -1.8802 .0802
Group 4=0.20 ppm of Herbicide .12500 .44988 .786 -.8552 1.1052
Group 4=0.20 ppm of Herbicide
Group 1=Normal Control 1.22500* .44988 .019 .2448 2.2052
Group 2=0.10 ppm of Herbicide -1.02500* .44988 .042 -2.0052 -.0448
Group 3=0.13 ppm of Herbicide -.12500 .44988 .786 -1.1052 .8552
AST LSD Group 1=Normal Control
Group 2=0.10 ppm of Herbicide -17.75000* 7.65806 .039 -34.4355 -1.0645
Group 3=0.13 ppm of Herbicide -62.25000* 7.65806 .000 -78.9355 -45.5645
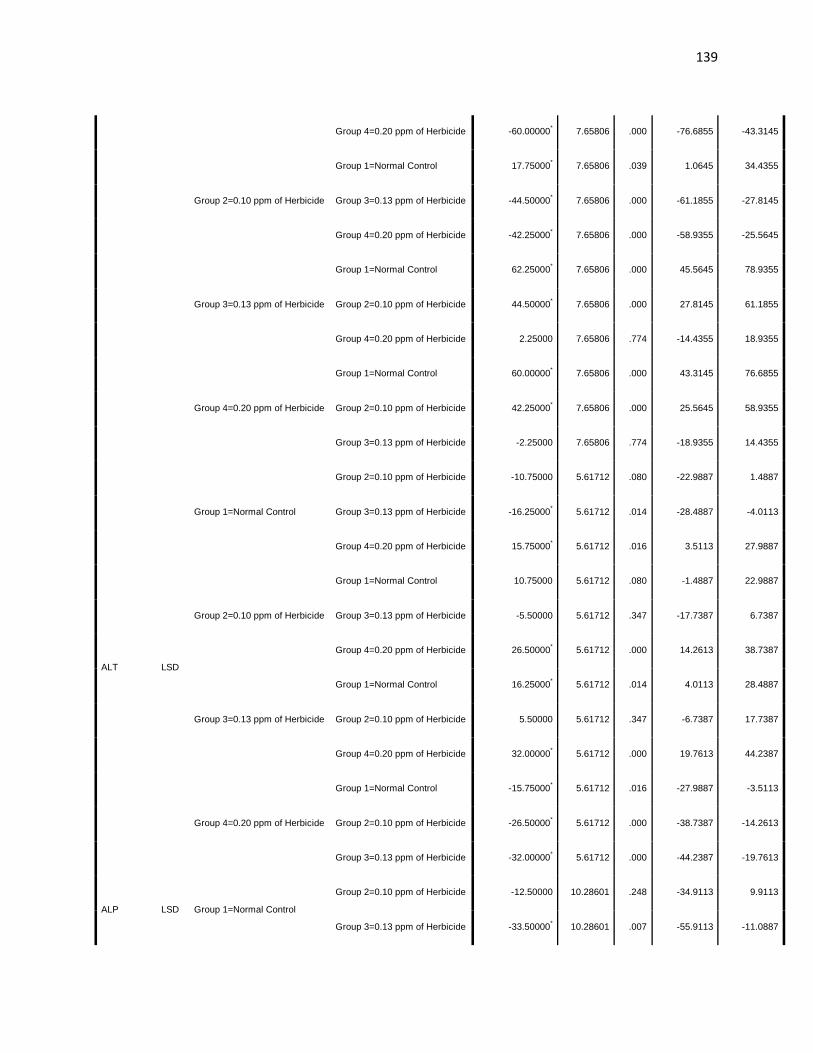
139
Group 4=0.20 ppm of Herbicide -60.00000* 7.65806 .000 -76.6855 -43.3145
Group 2=0.10 ppm of Herbicide
Group 1=Normal Control 17.75000* 7.65806 .039 1.0645 34.4355
Group 3=0.13 ppm of Herbicide -44.50000* 7.65806 .000 -61.1855 -27.8145
Group 4=0.20 ppm of Herbicide -42.25000* 7.65806 .000 -58.9355 -25.5645
Group 3=0.13 ppm of Herbicide
Group 1=Normal Control 62.25000* 7.65806 .000 45.5645 78.9355
Group 2=0.10 ppm of Herbicide 44.50000* 7.65806 .000 27.8145 61.1855
Group 4=0.20 ppm of Herbicide 2.25000 7.65806 .774 -14.4355 18.9355
Group 4=0.20 ppm of Herbicide
Group 1=Normal Control 60.00000* 7.65806 .000 43.3145 76.6855
Group 2=0.10 ppm of Herbicide 42.25000* 7.65806 .000 25.5645 58.9355
Group 3=0.13 ppm of Herbicide -2.25000 7.65806 .774 -18.9355 14.4355
ALT LSD
Group 1=Normal Control
Group 2=0.10 ppm of Herbicide -10.75000 5.61712 .080 -22.9887 1.4887
Group 3=0.13 ppm of Herbicide -16.25000* 5.61712 .014 -28.4887 -4.0113
Group 4=0.20 ppm of Herbicide 15.75000* 5.61712 .016 3.5113 27.9887
Group 2=0.10 ppm of Herbicide
Group 1=Normal Control 10.75000 5.61712 .080 -1.4887 22.9887
Group 3=0.13 ppm of Herbicide -5.50000 5.61712 .347 -17.7387 6.7387
Group 4=0.20 ppm of Herbicide 26.50000* 5.61712 .000 14.2613 38.7387
Group 3=0.13 ppm of Herbicide
Group 1=Normal Control 16.25000* 5.61712 .014 4.0113 28.4887
Group 2=0.10 ppm of Herbicide 5.50000 5.61712 .347 -6.7387 17.7387
Group 4=0.20 ppm of Herbicide 32.00000* 5.61712 .000 19.7613 44.2387
Group 4=0.20 ppm of Herbicide
Group 1=Normal Control -15.75000* 5.61712 .016 -27.9887 -3.5113
Group 2=0.10 ppm of Herbicide -26.50000* 5.61712 .000 -38.7387 -14.2613
Group 3=0.13 ppm of Herbicide -32.00000* 5.61712 .000 -44.2387 -19.7613
ALP LSD Group 1=Normal Control
Group 2=0.10 ppm of Herbicide -12.50000 10.28601 .248 -34.9113 9.9113
Group 3=0.13 ppm of Herbicide -33.50000* 10.28601 .007 -55.9113 -11.0887

140
Group 4=0.20 ppm of Herbicide -35.75000* 10.28601 .005 -58.1613 -13.3387
Group 2=0.10 ppm of Herbicide
Group 1=Normal Control 12.50000 10.28601 .248 -9.9113 34.9113
Group 3=0.13 ppm of Herbicide -21.00000 10.28601 .064 -43.4113 1.4113
Group 4=0.20 ppm of Herbicide -23.25000* 10.28601 .043 -45.6613 -.8387
Group 3=0.13 ppm of Herbicide
Group 1=Normal Control 33.50000* 10.28601 .007 11.0887 55.9113
Group 2=0.10 ppm of Herbicide 21.00000 10.28601 .064 -1.4113 43.4113
Group 4=0.20 ppm of Herbicide -2.25000 10.28601 .831 -24.6613 20.1613
Group 4=0.20 ppm of Herbicide
Group 1=Normal Control 35.75000* 10.28601 .005 13.3387 58.1613
Group 2=0.10 ppm of Herbicide 23.25000* 10.28601 .043 .8387 45.6613
Group 3=0.13 ppm of Herbicide 2.25000 10.28601 .831 -20.1613 24.6613
Cyt_P450 LSD
Group 1=Normal Control
Group 2=0.10 ppm of Herbicide .60334 .64209 .366 -.7957 2.0023
Group 3=0.13 ppm of Herbicide 2.72801* .64209 .001 1.3290 4.1270
Group 4=0.20 ppm of Herbicide 1.99724* .64209 .009 .5982 3.3962
Group 2=0.10 ppm of Herbicide
Group 1=Normal Control -.60334 .64209 .366 -2.0023 .7957
Group 3=0.13 ppm of Herbicide 2.12467* .64209 .006 .7257 3.5237
Group 4=0.20 ppm of Herbicide 1.39390 .64209 .051 -.0051 2.7929
Group 3=0.13 ppm of Herbicide
Group 1=Normal Control -2.72801* .64209 .001 -4.1270 -1.3290
Group 2=0.10 ppm of Herbicide -2.12467* .64209 .006 -3.5237 -.7257
Group 4=0.20 ppm of Herbicide -.73078 .64209 .277 -2.1298 .6682
Group 4=0.20 ppm of Herbicide
Group 1=Normal Control -1.99724* .64209 .009 -3.3962 -.5982
Group 2=0.10 ppm of Herbicide -1.39390 .64209 .051 -2.7929 .0051
Group 3=0.13 ppm of Herbicide .73078 .64209 .277 -.6682 2.1298
GST LSD Group 1=Normal Control
Group 2=0.10 ppm of Herbicide .80000 .48099 .122 -.2480 1.8480
Group 3=0.13 ppm of Herbicide 1.45000* .48099 .011 .4020 2.4980

141
Group 4=0.20 ppm of Herbicide -1.12500* .48099 .037 -2.1730 -.0770
Group 2=0.10 ppm of Herbicide
Group 1=Normal Control -.80000 .48099 .122 -1.8480 .2480
Group 3=0.13 ppm of Herbicide .65000 .48099 .202 -.3980 1.6980
Group 4=0.20 ppm of Herbicide -1.92500* .48099 .002 -2.9730 -.8770
Group 3=0.13 ppm of Herbicide
Group 1=Normal Control -1.45000* .48099 .011 -2.4980 -.4020
Group 2=0.10 ppm of Herbicide -.65000 .48099 .202 -1.6980 .3980
Group 4=0.20 ppm of Herbicide -2.57500* .48099 .000 -3.6230 -1.5270
Group 4=0.20 ppm of Herbicide
Group 1=Normal Control 1.12500* .48099 .037 .0770 2.1730
Group 2=0.10 ppm of Herbicide 1.92500* .48099 .002 .8770 2.9730
Group 3=0.13 ppm of Herbicide 2.57500* .48099 .000 1.5270 3.6230
*. The mean difference is significant at the 0.05 level.
Oneway {Day 3}
Descriptives
N Mean Std.
Deviation
Std. Error 95% Confidence Interval for Mean Minimum Maximum
Lower Bound Upper Bound
Body
Weight
Group 1=Normal Control 4 1.2625 .04787 .02394 1.1863 1.3387 1.20 1.30
Group 2=0.10 ppm of Herbicide 4 1.4375 .50229 .25114 .6383 2.2367 .70 1.80

142
Group 3=0.13 ppm of Herbicide 4 1.3500 .37859 .18930 .7476 1.9524 1.10 1.90
Group 4=0.20 ppm of Herbicide 4 1.5625 .34970 .17485 1.0060 2.1190 1.10 1.95
Total 16 1.4031 .34228 .08557 1.2207 1.5855 .70 1.95
Total
Protein
Group 1=Normal Control 4 16.2750 1.42916 .71458 14.0009 18.5491 15.30 18.40
Group 2=0.10 ppm of Herbicide 4 14.5250 1.73662 .86831 11.7617 17.2883 12.10 16.20
Group 3=0.13 ppm of Herbicide 4 15.6250 .99121 .49561 14.0478 17.2022 14.50 16.90
Group 4=0.20 ppm of Herbicide 4 16.2500 .84261 .42131 14.9092 17.5908 15.30 17.10
Total 16 15.6688 1.37391 .34348 14.9366 16.4009 12.10 18.40
AST
Group 1=Normal Control 4 35.0000 14.23610 7.11805 12.3472 57.6528 23.00 55.00
Group 2=0.10 ppm of Herbicide 4 98.0000 16.87207 8.43603 71.1528 124.8472 80.00 118.00
Group 3=0.13 ppm of Herbicide 4 128.5000 38.31014 19.15507 67.5400 189.4600 80.00 168.00
Group 4=0.20 ppm of Herbicide 4 132.5000 13.86843 6.93421 110.4322 154.5678 114.00 145.00
Total 16 98.5000 45.31078 11.32769 74.3556 122.6444 23.00 168.00
ALT
Group 1=Normal Control 4 24.0000 6.37704 3.18852 13.8527 34.1473 19.00 33.00
Group 2=0.10 ppm of Herbicide 4 31.2500 12.17580 6.08790 11.8756 50.6244 15.00 42.00
Group 3=0.13 ppm of Herbicide 4 36.5000 5.56776 2.78388 27.6404 45.3596 29.00 42.00
Group 4=0.20 ppm of Herbicide 4 26.7500 3.77492 1.88746 20.7433 32.7567 22.00 31.00
Total 16 29.6250 8.41328 2.10332 25.1419 34.1081 15.00 42.00
ALP
Group 1=Normal Control 4 44.0000 12.98717 6.49359 23.3345 64.6655 30.00 59.00
Group 2=0.10 ppm of Herbicide 4 28.7500 2.50000 1.25000 24.7719 32.7281 26.00 32.00
Group 3=0.13 ppm of Herbicide 4 58.2500 7.27438 3.63719 46.6748 69.8252 53.00 69.00
Group 4=0.20 ppm of Herbicide 4 61.0000 8.75595 4.37798 47.0673 74.9327 54.00 73.00
Total 16 48.0000 15.39697 3.84924 39.7955 56.2045 26.00 73.00
Cyt_P450 Group 1=Normal Control 4 11.7968 .38566 .19283 11.1832 12.4105 11.34 12.28
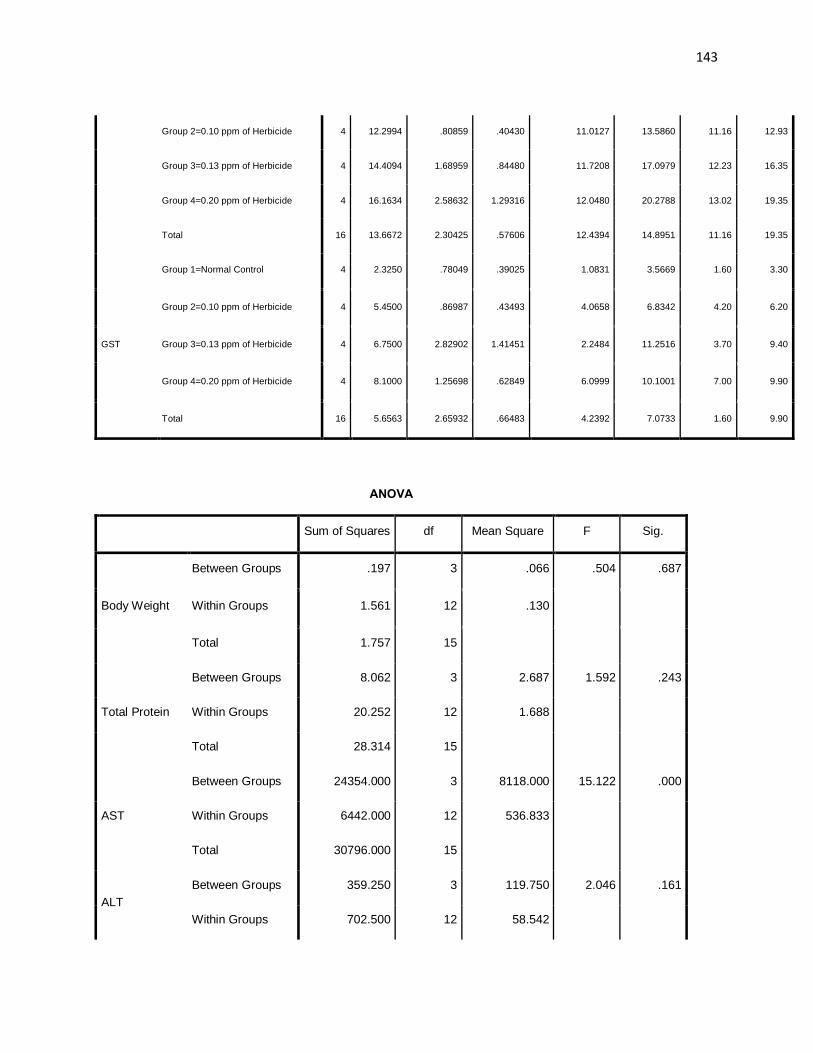
143
Group 2=0.10 ppm of Herbicide 4 12.2994 .80859 .40430 11.0127 13.5860 11.16 12.93
Group 3=0.13 ppm of Herbicide 4 14.4094 1.68959 .84480 11.7208 17.0979 12.23 16.35
Group 4=0.20 ppm of Herbicide 4 16.1634 2.58632 1.29316 12.0480 20.2788 13.02 19.35
Total 16 13.6672 2.30425 .57606 12.4394 14.8951 11.16 19.35
GST
Group 1=Normal Control 4 2.3250 .78049 .39025 1.0831 3.5669 1.60 3.30
Group 2=0.10 ppm of Herbicide 4 5.4500 .86987 .43493 4.0658 6.8342 4.20 6.20
Group 3=0.13 ppm of Herbicide 4 6.7500 2.82902 1.41451 2.2484 11.2516 3.70 9.40
Group 4=0.20 ppm of Herbicide 4 8.1000 1.25698 .62849 6.0999 10.1001 7.00 9.90
Total 16 5.6563 2.65932 .66483 4.2392 7.0733 1.60 9.90
ANOVA
Sum of Squares df Mean Square F Sig.
Body Weight
Between Groups .197 3 .066 .504 .687
Within Groups 1.561 12 .130
Total 1.757 15
Total Protein
Between Groups 8.062 3 2.687 1.592 .243
Within Groups 20.252 12 1.688
Total 28.314 15
AST
Between Groups 24354.000 3 8118.000 15.122 .000
Within Groups 6442.000 12 536.833
Total 30796.000 15
ALT Between Groups 359.250 3 119.750 2.046 .161
Within Groups 702.500 12 58.542

144
Total 1061.750 15
ALP
Between Groups 2642.500 3 880.833 11.571 .001
Within Groups 913.500 12 76.125
Total 3556.000 15
Cyt_P450
Between Groups 48.605 3 16.202 6.264 .008
Within Groups 31.039 12 2.587
Total 79.643 15
GST
Between Groups 73.232 3 24.411 8.918 .002
Within Groups 32.848 12 2.737
Total 106.079 15
Post Hoc Tests
Multiple Comparisons
Dependent Variable (I) Groups (J) Groups Mean
Difference (I-J)
Std. Error Sig. 95% Confidence Interval
Lower Bound Upper Bound
Body
Weight LSD
Group 1=Normal Control
Group 2=0.10 ppm of Herbicide -.17500 .25500 .506 -.7306 .3806
Group 3=0.13 ppm of Herbicide -.08750 .25500 .737 -.6431 .4681
Group 4=0.20 ppm of Herbicide -.30000 .25500 .262 -.8556 .2556
Group 2=0.10 ppm of Herbicide
Group 1=Normal Control .17500 .25500 .506 -.3806 .7306
Group 3=0.13 ppm of Herbicide .08750 .25500 .737 -.4681 .6431
Group 4=0.20 ppm of Herbicide -.12500 .25500 .633 -.6806 .4306
Group 3=0.13 ppm of Herbicide
Group 1=Normal Control .08750 .25500 .737 -.4681 .6431
Group 2=0.10 ppm of Herbicide -.08750 .25500 .737 -.6431 .4681
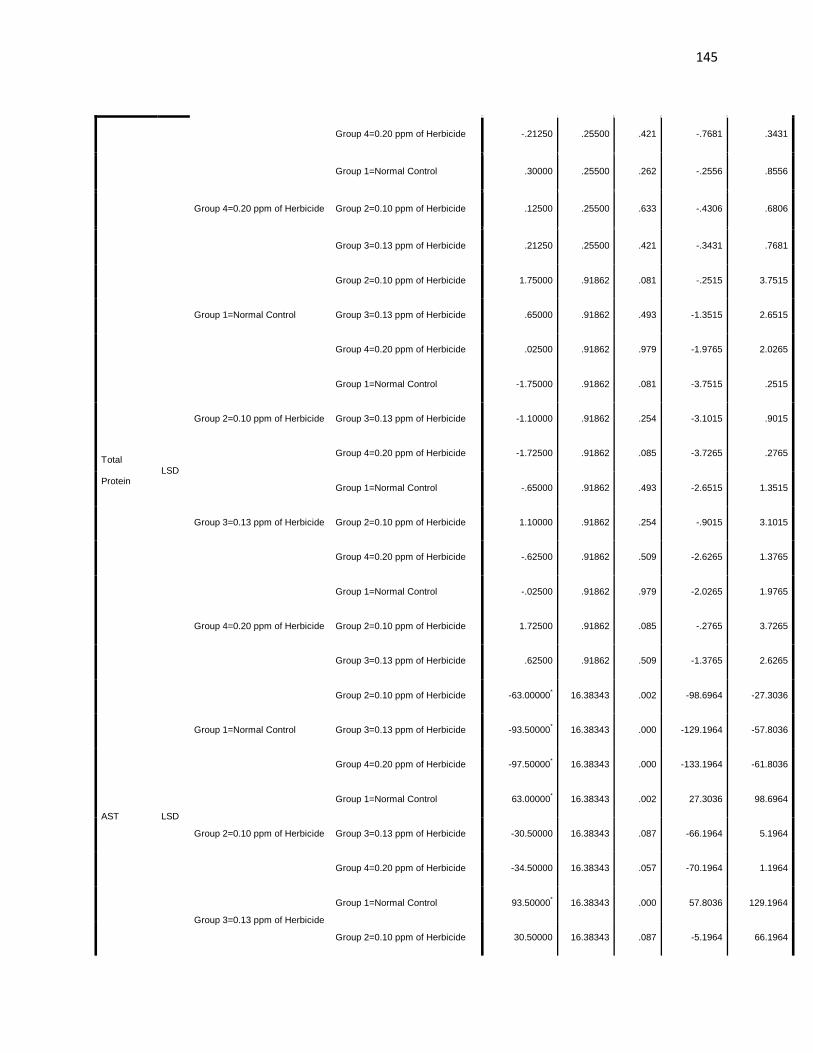
145
Group 4=0.20 ppm of Herbicide -.21250 .25500 .421 -.7681 .3431
Group 4=0.20 ppm of Herbicide
Group 1=Normal Control .30000 .25500 .262 -.2556 .8556
Group 2=0.10 ppm of Herbicide .12500 .25500 .633 -.4306 .6806
Group 3=0.13 ppm of Herbicide .21250 .25500 .421 -.3431 .7681
Total
Protein LSD
Group 1=Normal Control
Group 2=0.10 ppm of Herbicide 1.75000 .91862 .081 -.2515 3.7515
Group 3=0.13 ppm of Herbicide .65000 .91862 .493 -1.3515 2.6515
Group 4=0.20 ppm of Herbicide .02500 .91862 .979 -1.9765 2.0265
Group 2=0.10 ppm of Herbicide
Group 1=Normal Control -1.75000 .91862 .081 -3.7515 .2515
Group 3=0.13 ppm of Herbicide -1.10000 .91862 .254 -3.1015 .9015
Group 4=0.20 ppm of Herbicide -1.72500 .91862 .085 -3.7265 .2765
Group 3=0.13 ppm of Herbicide
Group 1=Normal Control -.65000 .91862 .493 -2.6515 1.3515
Group 2=0.10 ppm of Herbicide 1.10000 .91862 .254 -.9015 3.1015
Group 4=0.20 ppm of Herbicide -.62500 .91862 .509 -2.6265 1.3765
Group 4=0.20 ppm of Herbicide
Group 1=Normal Control -.02500 .91862 .979 -2.0265 1.9765
Group 2=0.10 ppm of Herbicide 1.72500 .91862 .085 -.2765 3.7265
Group 3=0.13 ppm of Herbicide .62500 .91862 .509 -1.3765 2.6265
AST LSD
Group 1=Normal Control
Group 2=0.10 ppm of Herbicide -63.00000* 16.38343 .002 -98.6964 -27.3036
Group 3=0.13 ppm of Herbicide -93.50000* 16.38343 .000 -129.1964 -57.8036
Group 4=0.20 ppm of Herbicide -97.50000* 16.38343 .000 -133.1964 -61.8036
Group 2=0.10 ppm of Herbicide
Group 1=Normal Control 63.00000* 16.38343 .002 27.3036 98.6964
Group 3=0.13 ppm of Herbicide -30.50000 16.38343 .087 -66.1964 5.1964
Group 4=0.20 ppm of Herbicide -34.50000 16.38343 .057 -70.1964 1.1964
Group 3=0.13 ppm of Herbicide
Group 1=Normal Control 93.50000* 16.38343 .000 57.8036 129.1964
Group 2=0.10 ppm of Herbicide 30.50000 16.38343 .087 -5.1964 66.1964

146
Group 4=0.20 ppm of Herbicide -4.00000 16.38343 .811 -39.6964 31.6964
Group 4=0.20 ppm of Herbicide
Group 1=Normal Control 97.50000* 16.38343 .000 61.8036 133.1964
Group 2=0.10 ppm of Herbicide 34.50000 16.38343 .057 -1.1964 70.1964
Group 3=0.13 ppm of Herbicide 4.00000 16.38343 .811 -31.6964 39.6964
ALT LSD
Group 1=Normal Control
Group 2=0.10 ppm of Herbicide -7.25000 5.41025 .205 -19.0379 4.5379
Group 3=0.13 ppm of Herbicide -12.50000* 5.41025 .039 -24.2879 -.7121
Group 4=0.20 ppm of Herbicide -2.75000 5.41025 .620 -14.5379 9.0379
Group 2=0.10 ppm of Herbicide
Group 1=Normal Control 7.25000 5.41025 .205 -4.5379 19.0379
Group 3=0.13 ppm of Herbicide -5.25000 5.41025 .351 -17.0379 6.5379
Group 4=0.20 ppm of Herbicide 4.50000 5.41025 .422 -7.2879 16.2879
Group 3=0.13 ppm of Herbicide
Group 1=Normal Control 12.50000* 5.41025 .039 .7121 24.2879
Group 2=0.10 ppm of Herbicide 5.25000 5.41025 .351 -6.5379 17.0379
Group 4=0.20 ppm of Herbicide 9.75000 5.41025 .097 -2.0379 21.5379
Group 4=0.20 ppm of Herbicide
Group 1=Normal Control 2.75000 5.41025 .620 -9.0379 14.5379
Group 2=0.10 ppm of Herbicide -4.50000 5.41025 .422 -16.2879 7.2879
Group 3=0.13 ppm of Herbicide -9.75000 5.41025 .097 -21.5379 2.0379
ALP LSD
Group 1=Normal Control
Group 2=0.10 ppm of Herbicide 15.25000* 6.16948 .029 1.8079 28.6921
Group 3=0.13 ppm of Herbicide -14.25000* 6.16948 .039 -27.6921 -.8079
Group 4=0.20 ppm of Herbicide -17.00000* 6.16948 .017 -30.4421 -3.5579
Group 2=0.10 ppm of Herbicide
Group 1=Normal Control -15.25000* 6.16948 .029 -28.6921 -1.8079
Group 3=0.13 ppm of Herbicide -29.50000* 6.16948 .000 -42.9421 -16.0579
Group 4=0.20 ppm of Herbicide -32.25000* 6.16948 .000 -45.6921 -18.8079
Group 3=0.13 ppm of Herbicide
Group 1=Normal Control 14.25000* 6.16948 .039 .8079 27.6921
Group 2=0.10 ppm of Herbicide 29.50000* 6.16948 .000 16.0579 42.9421
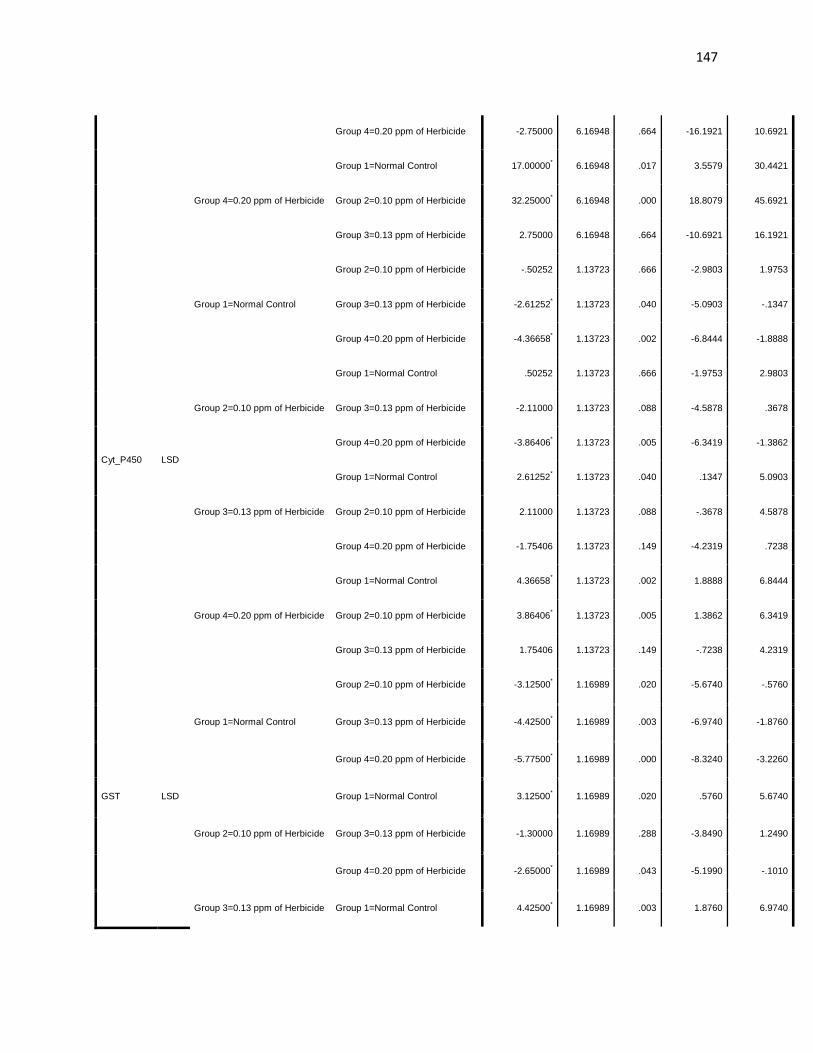
147
Group 4=0.20 ppm of Herbicide -2.75000 6.16948 .664 -16.1921 10.6921
Group 4=0.20 ppm of Herbicide
Group 1=Normal Control 17.00000* 6.16948 .017 3.5579 30.4421
Group 2=0.10 ppm of Herbicide 32.25000* 6.16948 .000 18.8079 45.6921
Group 3=0.13 ppm of Herbicide 2.75000 6.16948 .664 -10.6921 16.1921
Cyt_P450 LSD
Group 1=Normal Control
Group 2=0.10 ppm of Herbicide -.50252 1.13723 .666 -2.9803 1.9753
Group 3=0.13 ppm of Herbicide -2.61252* 1.13723 .040 -5.0903 -.1347
Group 4=0.20 ppm of Herbicide -4.36658* 1.13723 .002 -6.8444 -1.8888
Group 2=0.10 ppm of Herbicide
Group 1=Normal Control .50252 1.13723 .666 -1.9753 2.9803
Group 3=0.13 ppm of Herbicide -2.11000 1.13723 .088 -4.5878 .3678
Group 4=0.20 ppm of Herbicide -3.86406* 1.13723 .005 -6.3419 -1.3862
Group 3=0.13 ppm of Herbicide
Group 1=Normal Control 2.61252* 1.13723 .040 .1347 5.0903
Group 2=0.10 ppm of Herbicide 2.11000 1.13723 .088 -.3678 4.5878
Group 4=0.20 ppm of Herbicide -1.75406 1.13723 .149 -4.2319 .7238
Group 4=0.20 ppm of Herbicide
Group 1=Normal Control 4.36658* 1.13723 .002 1.8888 6.8444
Group 2=0.10 ppm of Herbicide 3.86406* 1.13723 .005 1.3862 6.3419
Group 3=0.13 ppm of Herbicide 1.75406 1.13723 .149 -.7238 4.2319
GST LSD
Group 1=Normal Control
Group 2=0.10 ppm of Herbicide -3.12500* 1.16989 .020 -5.6740 -.5760
Group 3=0.13 ppm of Herbicide -4.42500* 1.16989 .003 -6.9740 -1.8760
Group 4=0.20 ppm of Herbicide -5.77500* 1.16989 .000 -8.3240 -3.2260
Group 2=0.10 ppm of Herbicide
Group 1=Normal Control 3.12500* 1.16989 .020 .5760 5.6740
Group 3=0.13 ppm of Herbicide -1.30000 1.16989 .288 -3.8490 1.2490
Group 4=0.20 ppm of Herbicide -2.65000* 1.16989 .043 -5.1990 -.1010
Group 3=0.13 ppm of Herbicide Group 1=Normal Control 4.42500* 1.16989 .003 1.8760 6.9740

148
Group 2=0.10 ppm of Herbicide 1.30000 1.16989 .288 -1.2490 3.8490
Group 4=0.20 ppm of Herbicide -1.35000 1.16989 .271 -3.8990 1.1990
Group 4=0.20 ppm of Herbicide
Group 1=Normal Control 5.77500* 1.16989 .000 3.2260 8.3240
Group 2=0.10 ppm of Herbicide 2.65000* 1.16989 .043 .1010 5.1990
Group 3=0.13 ppm of Herbicide 1.35000 1.16989 .271 -1.1990 3.8990
*. The mean difference is significant at the 0.05 level.
Oneway {Group 1 = Normal Control}
Descriptives
N Mean Std. Deviation Std. Error 95% Confidence Interval for Mean Minimum Maximum
Lower Bound Upper Bound
Body Weight
Day 1 4 1.2750 .09574 .04787 1.1227 1.4273 1.20 1.40
Day 14 4 1.0750 .08660 .04330 .9372 1.2128 1.00 1.15
Day 28 4 1.2625 .04787 .02394 1.1863 1.3387 1.20 1.30
Total 12 1.2042 .11958 .03452 1.1282 1.2801 1.00 1.40
Total Protein
Day 1 4 7.9250 .51235 .25617 7.1097 8.7403 7.40 8.60
Day 14 4 5.9500 .46547 .23274 5.2093 6.6907 5.30 6.40
Day 28 4 16.2750 1.42916 .71458 14.0009 18.5491 15.30 18.40
Total 12 10.0500 4.74696 1.37033 7.0339 13.0661 5.30 18.40
AST
Day 1 4 36.7500 4.03113 2.01556 30.3356 43.1644 32.00 41.00
Day 14 4 36.0000 5.47723 2.73861 27.2845 44.7155 30.00 42.00
Day 28 4 35.0000 14.23610 7.11805 12.3472 57.6528 23.00 55.00

149
Total 12 35.9167 8.27327 2.38829 30.6601 41.1733 23.00 55.00
ALT
Day 1 4 24.5000 4.50925 2.25462 17.3248 31.6752 21.00 31.00
Day 14 4 26.5000 3.69685 1.84842 20.6175 32.3825 21.00 29.00
Day 28 4 24.0000 6.37704 3.18852 13.8527 34.1473 19.00 33.00
Total 12 25.0000 4.65149 1.34277 22.0446 27.9554 19.00 33.00
ALP
Day 1 4 40.2500 11.11680 5.55840 22.5607 57.9393 25.00 51.00
Day 14 4 34.7500 5.43906 2.71953 26.0952 43.4048 29.00 42.00
Day 28 4 44.0000 12.98717 6.49359 23.3345 64.6655 30.00 59.00
Total 12 39.6667 10.17424 2.93705 33.2023 46.1311 25.00 59.00
Cyt_P450
Day 1 4 10.9768 1.73524 .86762 8.2156 13.7379 8.57 12.61
Day 14 4 12.7217 1.07055 .53527 11.0182 14.4251 11.65 14.18
Day 28 4 11.7968 .38566 .19283 11.1832 12.4105 11.34 12.28
Total 12 11.8317 1.31475 .37954 10.9964 12.6671 8.57 14.18
GST
Day 1 4 2.4250 1.49750 .74875 .0421 4.8079 .80 4.10
Day 14 4 2.8250 .57373 .28687 1.9121 3.7379 2.10 3.50
Day 28 4 2.3250 .78049 .39025 1.0831 3.5669 1.60 3.30
Total 12 2.5250 .95834 .27665 1.9161 3.1339 .80 4.10
ANOVA
Sum of Squares df Mean Square F Sig.
Body Weight
Between Groups .100 2 .050 7.945 .010
Within Groups .057 9 .006
Total .157 11

150
Total Protein
Between Groups 240.305 2 120.152 142.944 .000
Within Groups 7.565 9 .841
Total 247.870 11
AST
Between Groups 6.167 2 3.083 .037 .964
Within Groups 746.750 9 82.972
Total 752.917 11
ALT
Between Groups 14.000 2 7.000 .281 .761
Within Groups 224.000 9 24.889
Total 238.000 11
ALP
Between Groups 173.167 2 86.583 .807 .476
Within Groups 965.500 9 107.278
Total 1138.667 11
Cyt_P450
Between Groups 6.097 2 3.048 2.124 .176
Within Groups 12.918 9 1.435
Total 19.014 11
GST
Between Groups .560 2 .280 .264 .774
Within Groups 9.542 9 1.060
Total 10.102 11
Post Hoc Tests
Multiple Comparisons
Dependent Variable (I) Days (J) Days Mean
Difference (I-J)
Std. Error Sig. 95% Confidence Interval
Lower Bound Upper Bound

151
Body Weight LSD
Day 1 Day 14 .20000* .05621 .006 .0728 .3272
Day 28 .01250 .05621 .829 -.1147 .1397
Day 14 Day 1 -.20000* .05621 .006 -.3272 -.0728
Day 28 -.18750* .05621 .009 -.3147 -.0603
Day 28 Day 1 -.01250 .05621 .829 -.1397 .1147
Day 14 .18750* .05621 .009 .0603 .3147
Total Protein LSD
Day 1 Day 14 1.97500* .64829 .014 .5085 3.4415
Day 28 -8.35000* .64829 .000 -9.8165 -6.8835
Day 14 Day 1 -1.97500* .64829 .014 -3.4415 -.5085
Day 28 -10.32500* .64829 .000 -11.7915 -8.8585
Day 28 Day 1 8.35000* .64829 .000 6.8835 9.8165
Day 14 10.32500* .64829 .000 8.8585 11.7915
AST LSD
Day 1 Day 14 .75000 6.44097 .910 -13.8205 15.3205
Day 28 1.75000 6.44097 .792 -12.8205 16.3205
Day 14 Day 1 -.75000 6.44097 .910 -15.3205 13.8205
Day 28 1.00000 6.44097 .880 -13.5705 15.5705
Day 28 Day 1 -1.75000 6.44097 .792 -16.3205 12.8205
Day 14 -1.00000 6.44097 .880 -15.5705 13.5705
ALT LSD
Day 1 Day 14 -2.00000 3.52767 .585 -9.9801 5.9801
Day 28 .50000 3.52767 .890 -7.4801 8.4801
Day 14 Day 1 2.00000 3.52767 .585 -5.9801 9.9801
Day 28 2.50000 3.52767 .496 -5.4801 10.4801
Day 28 Day 1 -.50000 3.52767 .890 -8.4801 7.4801
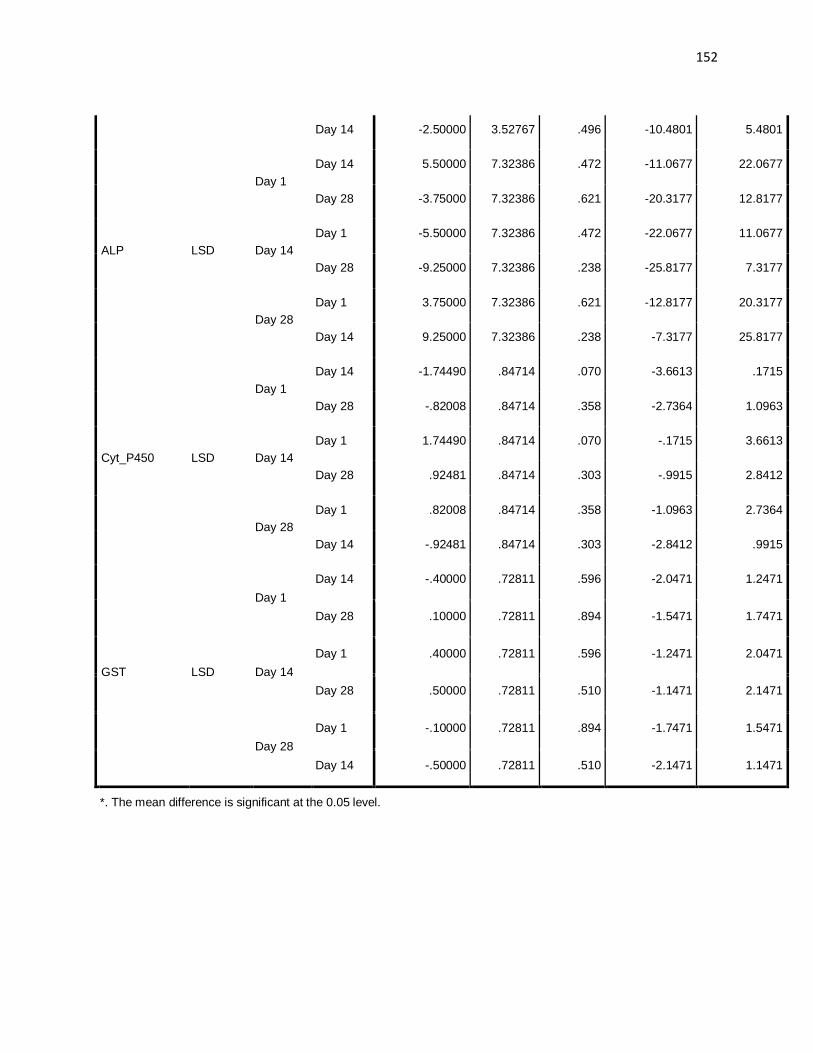
152
Day 14 -2.50000 3.52767 .496 -10.4801 5.4801
ALP LSD
Day 1 Day 14 5.50000 7.32386 .472 -11.0677 22.0677
Day 28 -3.75000 7.32386 .621 -20.3177 12.8177
Day 14 Day 1 -5.50000 7.32386 .472 -22.0677 11.0677
Day 28 -9.25000 7.32386 .238 -25.8177 7.3177
Day 28 Day 1 3.75000 7.32386 .621 -12.8177 20.3177
Day 14 9.25000 7.32386 .238 -7.3177 25.8177
Cyt_P450 LSD
Day 1 Day 14 -1.74490 .84714 .070 -3.6613 .1715
Day 28 -.82008 .84714 .358 -2.7364 1.0963
Day 14 Day 1 1.74490 .84714 .070 -.1715 3.6613
Day 28 .92481 .84714 .303 -.9915 2.8412
Day 28 Day 1 .82008 .84714 .358 -1.0963 2.7364
Day 14 -.92481 .84714 .303 -2.8412 .9915
GST LSD
Day 1 Day 14 -.40000 .72811 .596 -2.0471 1.2471
Day 28 .10000 .72811 .894 -1.5471 1.7471
Day 14 Day 1 .40000 .72811 .596 -1.2471 2.0471
Day 28 .50000 .72811 .510 -1.1471 2.1471
Day 28 Day 1 -.10000 .72811 .894 -1.7471 1.5471
Day 14 -.50000 .72811 .510 -2.1471 1.1471
*. The mean difference is significant at the 0.05 level.

153
Oneway {Group 2 = 0.10 ppm of Herbicide}
Descriptives
N Mean Std. Deviation Std. Error 95% Confidence Interval for Mean Minimum Maximum
Lower Bound Upper Bound
Body Weight
Day 1 4 1.3125 .24622 .12311 .9207 1.7043 1.10 1.55
Day 14 4 1.0250 .12583 .06292 .8248 1.2252 .90 1.20
Day 28 4 1.4375 .50229 .25114 .6383 2.2367 .70 1.80
Total 12 1.2583 .34957 .10091 1.0362 1.4804 .70 1.80
Total Protein
Day 1 4 8.9250 .29861 .14930 8.4498 9.4002 8.60 9.30
Day 14 4 8.2000 .82057 .41028 6.8943 9.5057 7.40 9.30
Day 28 4 14.5250 1.73662 .86831 11.7617 17.2883 12.10 16.20
Total 12 10.5500 3.12163 .90114 8.5666 12.5334 7.40 16.20
AST
Day 1 4 51.7500 7.80491 3.90246 39.3306 64.1694 42.00 61.00
Day 14 4 53.7500 11.32475 5.66238 35.7298 71.7702 44.00 70.00
Day 28 4 98.0000 16.87207 8.43603 71.1528 124.8472 80.00 118.00
Total 12 67.8333 25.02665 7.22457 51.9322 83.7345 42.00 118.00
ALT
Day 1 4 27.5000 5.25991 2.62996 19.1303 35.8697 22.00 32.00
Day 14 4 37.2500 13.69611 6.84805 15.4564 59.0436 21.00 54.00
Day 28 4 31.2500 12.17580 6.08790 11.8756 50.6244 15.00 42.00
Total 12 32.0000 10.80404 3.11886 25.1354 38.8646 15.00 54.00
ALP
Day 1 4 32.2500 7.13559 3.56780 20.8957 43.6043 24.00 41.00
Day 14 4 47.2500 10.99621 5.49811 29.7526 64.7474 34.00 60.00
Day 28 4 28.7500 2.50000 1.25000 24.7719 32.7281 26.00 32.00
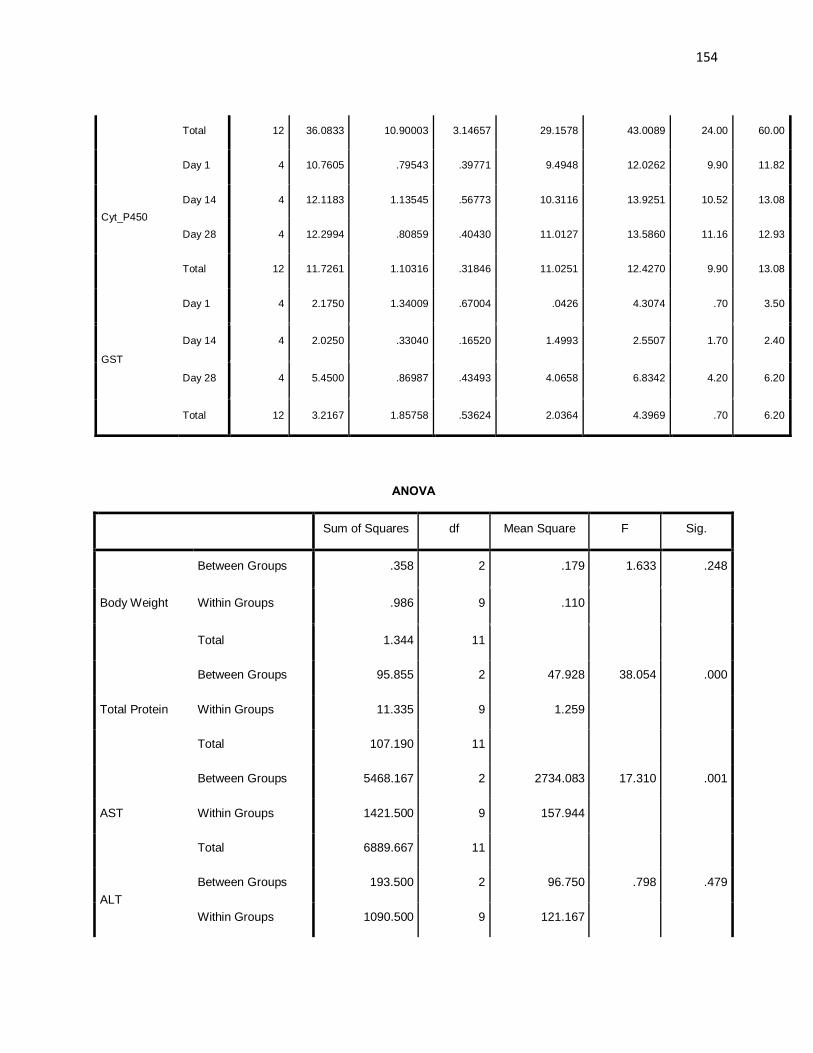
154
Total 12 36.0833 10.90003 3.14657 29.1578 43.0089 24.00 60.00
Cyt_P450
Day 1 4 10.7605 .79543 .39771 9.4948 12.0262 9.90 11.82
Day 14 4 12.1183 1.13545 .56773 10.3116 13.9251 10.52 13.08
Day 28 4 12.2994 .80859 .40430 11.0127 13.5860 11.16 12.93
Total 12 11.7261 1.10316 .31846 11.0251 12.4270 9.90 13.08
GST
Day 1 4 2.1750 1.34009 .67004 .0426 4.3074 .70 3.50
Day 14 4 2.0250 .33040 .16520 1.4993 2.5507 1.70 2.40
Day 28 4 5.4500 .86987 .43493 4.0658 6.8342 4.20 6.20
Total 12 3.2167 1.85758 .53624 2.0364 4.3969 .70 6.20
ANOVA
Sum of Squares df Mean Square F Sig.
Body Weight
Between Groups .358 2 .179 1.633 .248
Within Groups .986 9 .110
Total 1.344 11
Total Protein
Between Groups 95.855 2 47.928 38.054 .000
Within Groups 11.335 9 1.259
Total 107.190 11
AST
Between Groups 5468.167 2 2734.083 17.310 .001
Within Groups 1421.500 9 157.944
Total 6889.667 11
ALT Between Groups 193.500 2 96.750 .798 .479
Within Groups 1090.500 9 121.167

155
Total 1284.000 11
ALP
Between Groups 772.667 2 386.333 6.508 .018
Within Groups 534.250 9 59.361
Total 1306.917 11
Cyt_P450
Between Groups 5.659 2 2.830 3.296 .084
Within Groups 7.727 9 .859
Total 13.387 11
GST
Between Groups 29.972 2 14.986 16.891 .001
Within Groups 7.985 9 .887
Total 37.957 11
Post Hoc Tests
Multiple Comparisons
Dependent Variable (I) Days (J) Days Mean
Difference (I-J)
Std. Error Sig. 95% Confidence Interval
Lower Bound Upper Bound
Body Weight LSD
Day 1 Day 14 .28750 .23408 .251 -.2420 .8170
Day 28 -.12500 .23408 .606 -.6545 .4045
Day 14 Day 1 -.28750 .23408 .251 -.8170 .2420
Day 28 -.41250 .23408 .112 -.9420 .1170
Day 28 Day 1 .12500 .23408 .606 -.4045 .6545
Day 14 .41250 .23408 .112 -.1170 .9420
Total Protein LSD Day 1 Day 14 .72500 .79355 .385 -1.0701 2.5201
Day 28 -5.60000* .79355 .000 -7.3951 -3.8049

156
Day 14 Day 1 -.72500 .79355 .385 -2.5201 1.0701
Day 28 -6.32500* .79355 .000 -8.1201 -4.5299
Day 28 Day 1 5.60000* .79355 .000 3.8049 7.3951
Day 14 6.32500* .79355 .000 4.5299 8.1201
AST LSD
Day 1 Day 14 -2.00000 8.88663 .827 -22.1030 18.1030
Day 28 -46.25000* 8.88663 .001 -66.3530 -26.1470
Day 14 Day 1 2.00000 8.88663 .827 -18.1030 22.1030
Day 28 -44.25000* 8.88663 .001 -64.3530 -24.1470
Day 28 Day 1 46.25000* 8.88663 .001 26.1470 66.3530
Day 14 44.25000* 8.88663 .001 24.1470 64.3530
ALT LSD
Day 1 Day 14 -9.75000 7.78353 .242 -27.3576 7.8576
Day 28 -3.75000 7.78353 .641 -21.3576 13.8576
Day 14 Day 1 9.75000 7.78353 .242 -7.8576 27.3576
Day 28 6.00000 7.78353 .461 -11.6076 23.6076
Day 28 Day 1 3.75000 7.78353 .641 -13.8576 21.3576
Day 14 -6.00000 7.78353 .461 -23.6076 11.6076
ALP LSD
Day 1 Day 14 -15.00000* 5.44799 .022 -27.3242 -2.6758
Day 28 3.50000 5.44799 .537 -8.8242 15.8242
Day 14 Day 1 15.00000* 5.44799 .022 2.6758 27.3242
Day 28 18.50000* 5.44799 .008 6.1758 30.8242
Day 28 Day 1 -3.50000 5.44799 .537 -15.8242 8.8242
Day 14 -18.50000* 5.44799 .008 -30.8242 -6.1758
Cyt_P450 LSD Day 1 Day 14 -1.35780 .65521 .068 -2.8400 .1244
Day 28 -1.53885* .65521 .043 -3.0210 -.0567
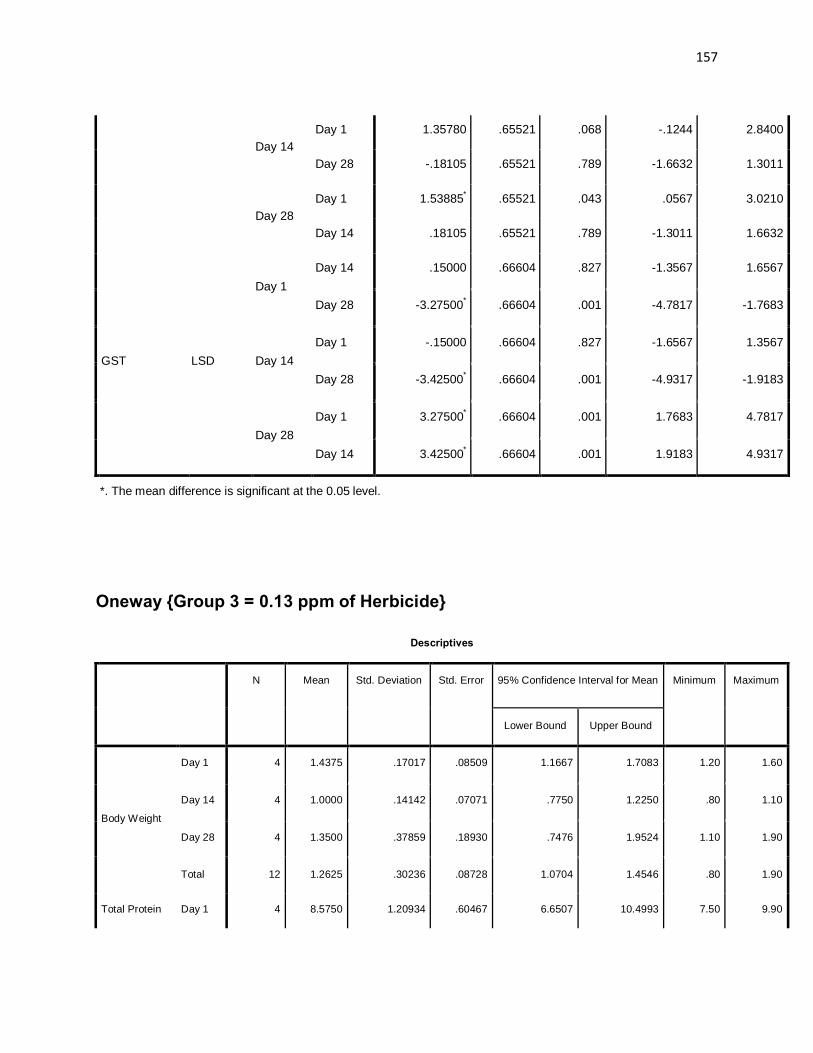
157
Day 14 Day 1 1.35780 .65521 .068 -.1244 2.8400
Day 28 -.18105 .65521 .789 -1.6632 1.3011
Day 28 Day 1 1.53885* .65521 .043 .0567 3.0210
Day 14 .18105 .65521 .789 -1.3011 1.6632
GST LSD
Day 1 Day 14 .15000 .66604 .827 -1.3567 1.6567
Day 28 -3.27500* .66604 .001 -4.7817 -1.7683
Day 14 Day 1 -.15000 .66604 .827 -1.6567 1.3567
Day 28 -3.42500* .66604 .001 -4.9317 -1.9183
Day 28 Day 1 3.27500* .66604 .001 1.7683 4.7817
Day 14 3.42500* .66604 .001 1.9183 4.9317
*. The mean difference is significant at the 0.05 level.
Oneway {Group 3 = 0.13 ppm of Herbicide}
Descriptives
N Mean Std. Deviation Std. Error 95% Confidence Interval for Mean Minimum Maximum
Lower Bound Upper Bound
Body Weight
Day 1 4 1.4375 .17017 .08509 1.1667 1.7083 1.20 1.60
Day 14 4 1.0000 .14142 .07071 .7750 1.2250 .80 1.10
Day 28 4 1.3500 .37859 .18930 .7476 1.9524 1.10 1.90
Total 12 1.2625 .30236 .08728 1.0704 1.4546 .80 1.90
Total Protein Day 1 4 8.5750 1.20934 .60467 6.6507 10.4993 7.50 9.90
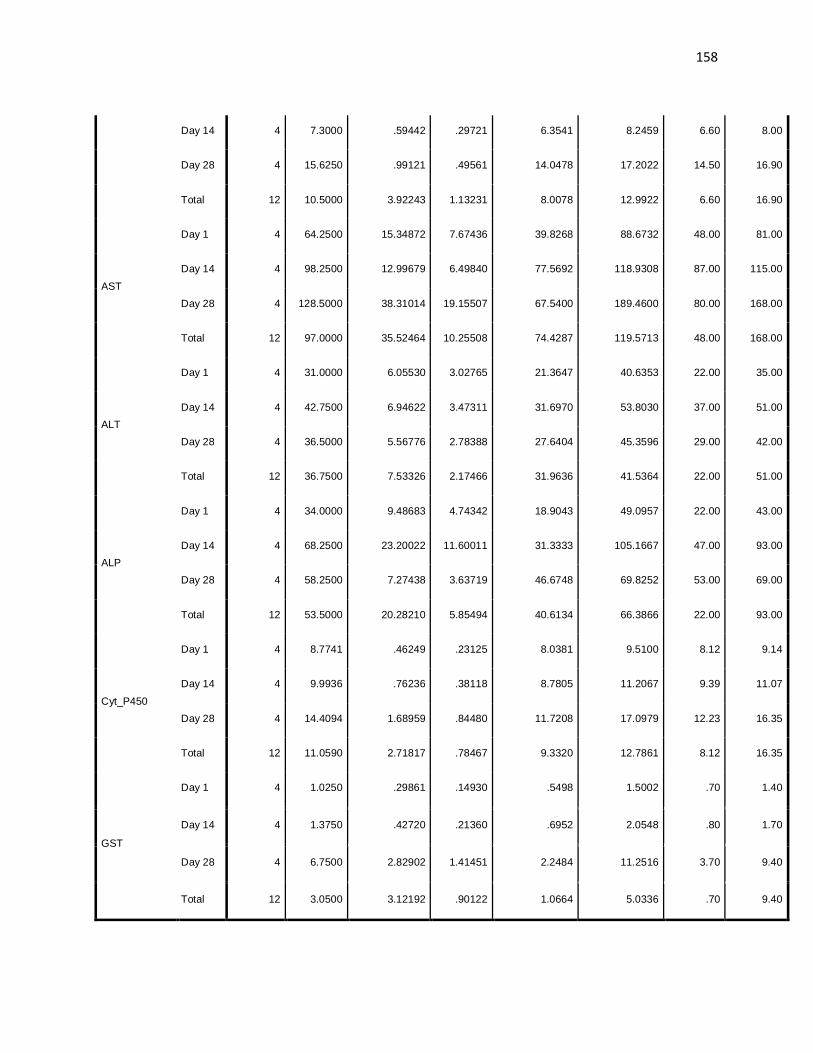
158
Day 14 4 7.3000 .59442 .29721 6.3541 8.2459 6.60 8.00
Day 28 4 15.6250 .99121 .49561 14.0478 17.2022 14.50 16.90
Total 12 10.5000 3.92243 1.13231 8.0078 12.9922 6.60 16.90
AST
Day 1 4 64.2500 15.34872 7.67436 39.8268 88.6732 48.00 81.00
Day 14 4 98.2500 12.99679 6.49840 77.5692 118.9308 87.00 115.00
Day 28 4 128.5000 38.31014 19.15507 67.5400 189.4600 80.00 168.00
Total 12 97.0000 35.52464 10.25508 74.4287 119.5713 48.00 168.00
ALT
Day 1 4 31.0000 6.05530 3.02765 21.3647 40.6353 22.00 35.00
Day 14 4 42.7500 6.94622 3.47311 31.6970 53.8030 37.00 51.00
Day 28 4 36.5000 5.56776 2.78388 27.6404 45.3596 29.00 42.00
Total 12 36.7500 7.53326 2.17466 31.9636 41.5364 22.00 51.00
ALP
Day 1 4 34.0000 9.48683 4.74342 18.9043 49.0957 22.00 43.00
Day 14 4 68.2500 23.20022 11.60011 31.3333 105.1667 47.00 93.00
Day 28 4 58.2500 7.27438 3.63719 46.6748 69.8252 53.00 69.00
Total 12 53.5000 20.28210 5.85494 40.6134 66.3866 22.00 93.00
Cyt_P450
Day 1 4 8.7741 .46249 .23125 8.0381 9.5100 8.12 9.14
Day 14 4 9.9936 .76236 .38118 8.7805 11.2067 9.39 11.07
Day 28 4 14.4094 1.68959 .84480 11.7208 17.0979 12.23 16.35
Total 12 11.0590 2.71817 .78467 9.3320 12.7861 8.12 16.35
GST
Day 1 4 1.0250 .29861 .14930 .5498 1.5002 .70 1.40
Day 14 4 1.3750 .42720 .21360 .6952 2.0548 .80 1.70
Day 28 4 6.7500 2.82902 1.41451 2.2484 11.2516 3.70 9.40
Total 12 3.0500 3.12192 .90122 1.0664 5.0336 .70 9.40
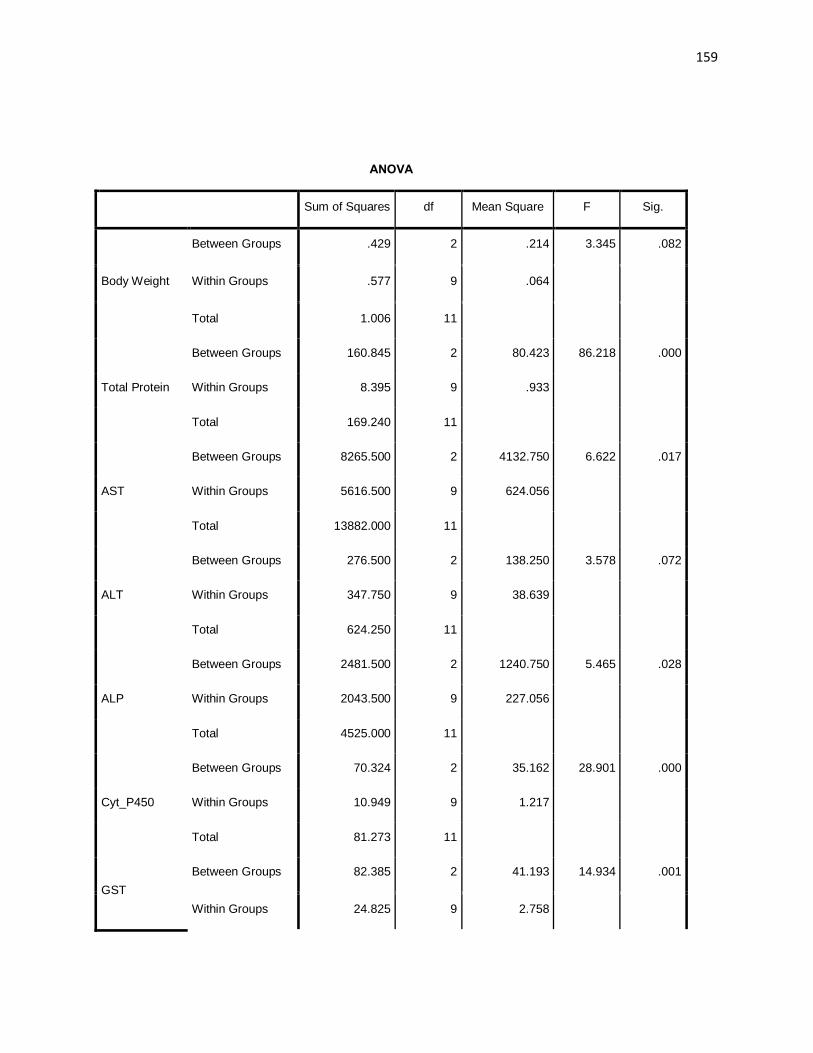
159
ANOVA
Sum of Squares df Mean Square F Sig.
Body Weight
Between Groups .429 2 .214 3.345 .082
Within Groups .577 9 .064
Total 1.006 11
Total Protein
Between Groups 160.845 2 80.423 86.218 .000
Within Groups 8.395 9 .933
Total 169.240 11
AST
Between Groups 8265.500 2 4132.750 6.622 .017
Within Groups 5616.500 9 624.056
Total 13882.000 11
ALT
Between Groups 276.500 2 138.250 3.578 .072
Within Groups 347.750 9 38.639
Total 624.250 11
ALP
Between Groups 2481.500 2 1240.750 5.465 .028
Within Groups 2043.500 9 227.056
Total 4525.000 11
Cyt_P450
Between Groups 70.324 2 35.162 28.901 .000
Within Groups 10.949 9 1.217
Total 81.273 11
GST Between Groups 82.385 2 41.193 14.934 .001
Within Groups 24.825 9 2.758
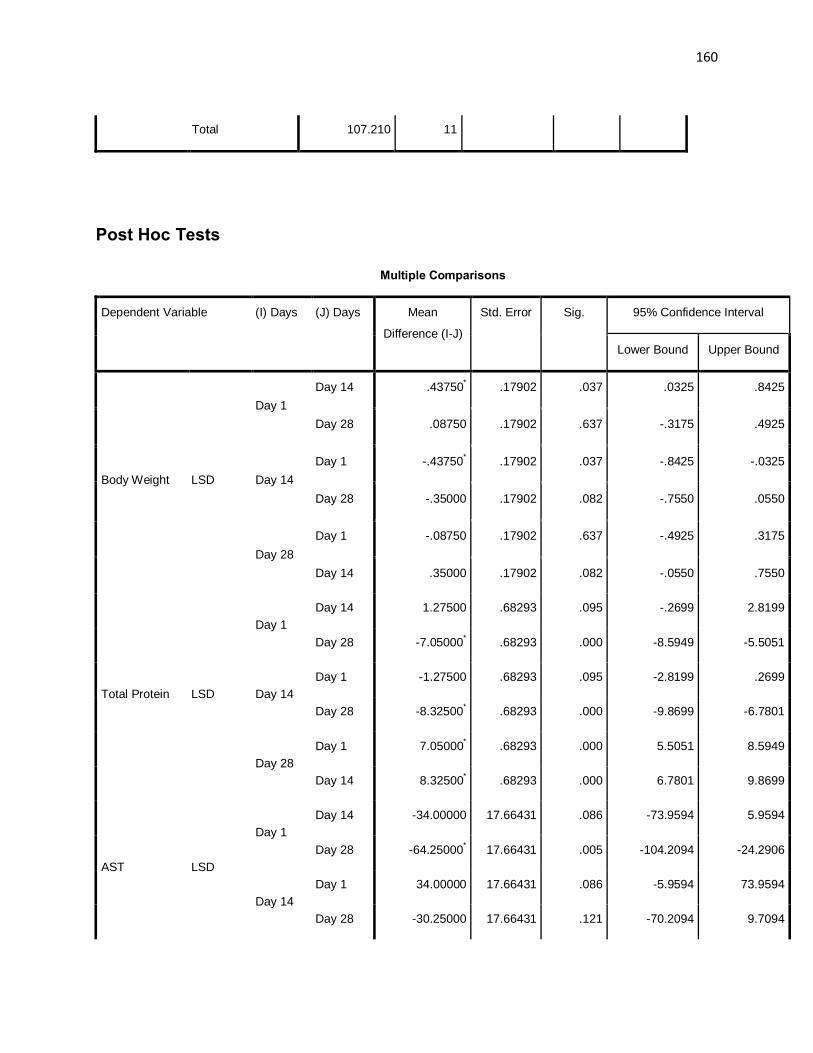
160
Total 107.210 11
Post Hoc Tests
Multiple Comparisons
Dependent Variable (I) Days (J) Days Mean
Difference (I-J)
Std. Error Sig. 95% Confidence Interval
Lower Bound Upper Bound
Body Weight LSD
Day 1 Day 14 .43750* .17902 .037 .0325 .8425
Day 28 .08750 .17902 .637 -.3175 .4925
Day 14 Day 1 -.43750* .17902 .037 -.8425 -.0325
Day 28 -.35000 .17902 .082 -.7550 .0550
Day 28 Day 1 -.08750 .17902 .637 -.4925 .3175
Day 14 .35000 .17902 .082 -.0550 .7550
Total Protein LSD
Day 1 Day 14 1.27500 .68293 .095 -.2699 2.8199
Day 28 -7.05000* .68293 .000 -8.5949 -5.5051
Day 14 Day 1 -1.27500 .68293 .095 -2.8199 .2699
Day 28 -8.32500* .68293 .000 -9.8699 -6.7801
Day 28 Day 1 7.05000* .68293 .000 5.5051 8.5949
Day 14 8.32500* .68293 .000 6.7801 9.8699
AST LSD
Day 1 Day 14 -34.00000 17.66431 .086 -73.9594 5.9594
Day 28 -64.25000* 17.66431 .005 -104.2094 -24.2906
Day 14 Day 1 34.00000 17.66431 .086 -5.9594 73.9594
Day 28 -30.25000 17.66431 .121 -70.2094 9.7094

161
Day 28 Day 1 64.25000* 17.66431 .005 24.2906 104.2094
Day 14 30.25000 17.66431 .121 -9.7094 70.2094
ALT LSD
Day 1 Day 14 -11.75000* 4.39539 .025 -21.6931 -1.8069
Day 28 -5.50000 4.39539 .242 -15.4431 4.4431
Day 14 Day 1 11.75000* 4.39539 .025 1.8069 21.6931
Day 28 6.25000 4.39539 .189 -3.6931 16.1931
Day 28 Day 1 5.50000 4.39539 .242 -4.4431 15.4431
Day 14 -6.25000 4.39539 .189 -16.1931 3.6931
ALP LSD
Day 1 Day 14 -34.25000* 10.65494 .011 -58.3532 -10.1468
Day 28 -24.25000* 10.65494 .049 -48.3532 -.1468
Day 14 Day 1 34.25000* 10.65494 .011 10.1468 58.3532
Day 28 10.00000 10.65494 .372 -14.1032 34.1032
Day 28 Day 1 24.25000* 10.65494 .049 .1468 48.3532
Day 14 -10.00000 10.65494 .372 -34.1032 14.1032
Cyt_P450 LSD
Day 1 Day 14 -1.21958 .77994 .152 -2.9839 .5448
Day 28 -5.63531* .77994 .000 -7.3997 -3.8710
Day 14 Day 1 1.21958 .77994 .152 -.5448 2.9839
Day 28 -4.41572* .77994 .000 -6.1801 -2.6514
Day 28 Day 1 5.63531* .77994 .000 3.8710 7.3997
Day 14 4.41572* .77994 .000 2.6514 6.1801
GST LSD
Day 1 Day 14 -.35000 1.17438 .772 -3.0066 2.3066
Day 28 -5.72500* 1.17438 .001 -8.3816 -3.0684
Day 14 Day 1 .35000 1.17438 .772 -2.3066 3.0066
Day 28 -5.37500* 1.17438 .001 -8.0316 -2.7184

162
Day 28 Day 1 5.72500* 1.17438 .001 3.0684 8.3816
Day 14 5.37500* 1.17438 .001 2.7184 8.0316
*. The mean difference is significant at the 0.05 level.
Oneway {Group 4 = 0.20 pp of Herbicide}
Descriptives
N Mean Std. Deviation Std. Error 95% Confidence Interval for Mean Minimum Maximum
Lower Bound Upper Bound
Body Weight
Day 1 4 1.4000 .24833 .12416 1.0049 1.7951 1.10 1.70
Day 14 4 1.2750 .08660 .04330 1.1372 1.4128 1.20 1.40
Day 28 4 1.5625 .34970 .17485 1.0060 2.1190 1.10 1.95
Total 12 1.4125 .25948 .07491 1.2476 1.5774 1.10 1.95
Total Protein
Day 1 4 9.8750 1.19826 .59913 7.9683 11.7817 8.10 10.60
Day 14 4 7.1750 .61305 .30653 6.1995 8.1505 6.40 7.80
Day 28 4 16.2500 .84261 .42131 14.9092 17.5908 15.30 17.10
Total 12 11.1000 4.05956 1.17189 8.5207 13.6793 6.40 17.10
AST
Day 1 4 76.5000 9.67815 4.83908 61.0999 91.9001 69.00 90.00
Day 14 4 96.0000 11.91638 5.95819 77.0384 114.9616 86.00 113.00
Day 28 4 132.5000 13.86843 6.93421 110.4322 154.5678 114.00 145.00
Total 12 101.6667 26.54099 7.66172 84.8033 118.5300 69.00 145.00
ALT Day 1 4 20.7500 6.94622 3.47311 9.6970 31.8030 15.00 29.00

163
Day 14 4 10.7500 1.70783 .85391 8.0325 13.4675 9.00 13.00
Day 28 4 26.7500 3.77492 1.88746 20.7433 32.7567 22.00 31.00
Total 12 19.4167 8.08431 2.33374 14.2801 24.5532 9.00 31.00
ALP
Day 1 4 42.5000 12.81926 6.40963 22.1017 62.8983 30.00 60.00
Day 14 4 70.5000 12.55654 6.27827 50.5197 90.4803 60.00 88.00
Day 28 4 61.0000 8.75595 4.37798 47.0673 74.9327 54.00 73.00
Total 12 58.0000 16.00568 4.62044 47.8305 68.1695 30.00 88.00
Cyt_P450
Day 1 4 8.1052 .50128 .25064 7.3076 8.9029 7.56 8.77
Day 14 4 10.7244 .53077 .26539 9.8798 11.5690 10.06 11.36
Day 28 4 16.1634 2.58632 1.29316 12.0480 20.2788 13.02 19.35
Total 12 11.6643 3.77596 1.09002 9.2652 14.0635 7.56 19.35
GST
Day 1 4 .2625 .22809 .11404 -.1004 .6254 .10 .60
Day 14 4 3.9500 1.10905 .55453 2.1852 5.7148 2.60 5.30
Day 28 4 8.1000 1.25698 .62849 6.0999 10.1001 7.00 9.90
Total 12 4.1042 3.45861 .99841 1.9067 6.3017 .10 9.90
ANOVA
Sum of Squares df Mean Square F Sig.
Body Weight
Between Groups .166 2 .083 1.303 .319
Within Groups .574 9 .064
Total .741 11
Total Protein Between Groups 173.715 2 86.857 103.333 .000
Within Groups 7.565 9 .841

164
Total 181.280 11
AST
Between Groups 6464.667 2 3232.333 22.657 .000
Within Groups 1284.000 9 142.667
Total 7748.667 11
ALT
Between Groups 522.667 2 261.333 11.985 .003
Within Groups 196.250 9 21.806
Total 718.917 11
ALP
Between Groups 1622.000 2 811.000 6.103 .021
Within Groups 1196.000 9 132.889
Total 2818.000 11
Cyt_P450
Between Groups 135.170 2 67.585 28.075 .000
Within Groups 21.666 9 2.407
Total 156.836 11
GST
Between Groups 122.995 2 61.498 64.462 .000
Within Groups 8.586 9 .954
Total 131.581 11
Post Hoc Tests Multiple Comparisons
Dependent Variable (I) Days (J) Days Mean Std. Error Sig. 95% Confidence Interval
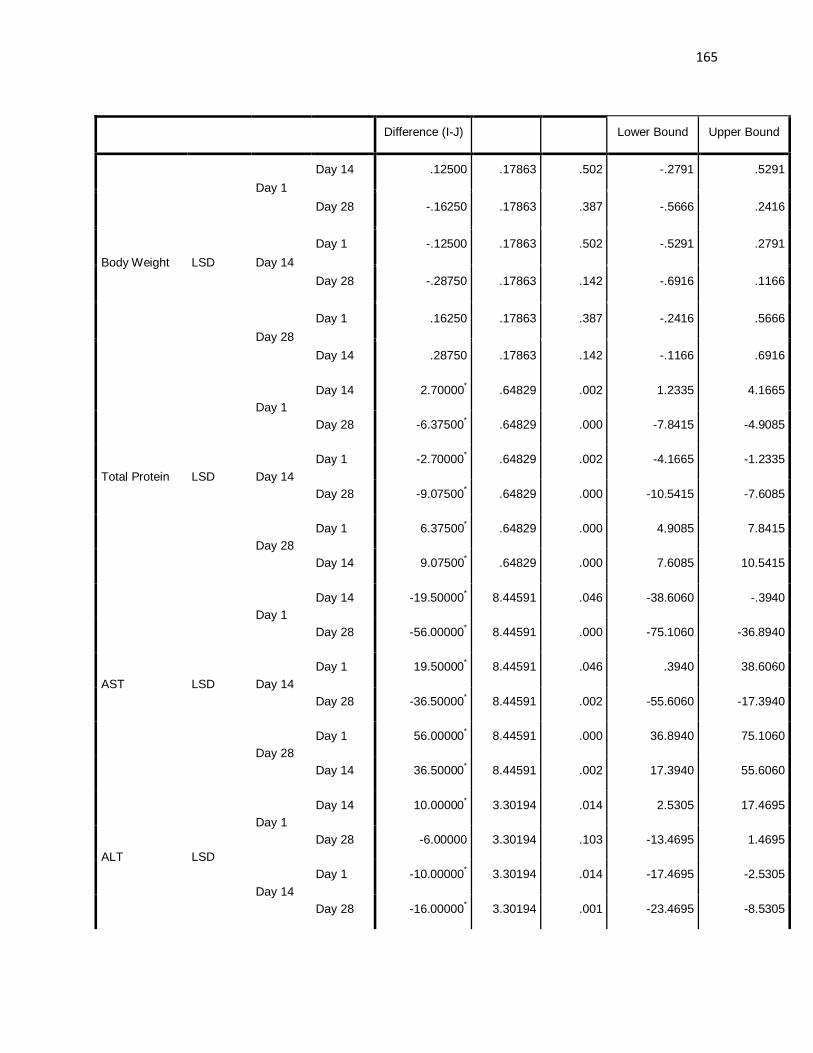
165
Difference (I-J) Lower Bound Upper Bound
Body Weight LSD
Day 1 Day 14 .12500 .17863 .502 -.2791 .5291
Day 28 -.16250 .17863 .387 -.5666 .2416
Day 14 Day 1 -.12500 .17863 .502 -.5291 .2791
Day 28 -.28750 .17863 .142 -.6916 .1166
Day 28 Day 1 .16250 .17863 .387 -.2416 .5666
Day 14 .28750 .17863 .142 -.1166 .6916
Total Protein LSD
Day 1 Day 14 2.70000* .64829 .002 1.2335 4.1665
Day 28 -6.37500* .64829 .000 -7.8415 -4.9085
Day 14 Day 1 -2.70000* .64829 .002 -4.1665 -1.2335
Day 28 -9.07500* .64829 .000 -10.5415 -7.6085
Day 28 Day 1 6.37500* .64829 .000 4.9085 7.8415
Day 14 9.07500* .64829 .000 7.6085 10.5415
AST LSD
Day 1 Day 14 -19.50000* 8.44591 .046 -38.6060 -.3940
Day 28 -56.00000* 8.44591 .000 -75.1060 -36.8940
Day 14 Day 1 19.50000* 8.44591 .046 .3940 38.6060
Day 28 -36.50000* 8.44591 .002 -55.6060 -17.3940
Day 28 Day 1 56.00000* 8.44591 .000 36.8940 75.1060
Day 14 36.50000* 8.44591 .002 17.3940 55.6060
ALT LSD
Day 1 Day 14 10.00000* 3.30194 .014 2.5305 17.4695
Day 28 -6.00000 3.30194 .103 -13.4695 1.4695
Day 14 Day 1 -10.00000* 3.30194 .014 -17.4695 -2.5305
Day 28 -16.00000* 3.30194 .001 -23.4695 -8.5305

166
Day 28 Day 1 6.00000 3.30194 .103 -1.4695 13.4695
Day 14 16.00000* 3.30194 .001 8.5305 23.4695
ALP LSD
Day 1 Day 14 -28.00000* 8.15135 .007 -46.4396 -9.5604
Day 28 -18.50000* 8.15135 .049 -36.9396 -.0604
Day 14 Day 1 28.00000* 8.15135 .007 9.5604 46.4396
Day 28 9.50000 8.15135 .274 -8.9396 27.9396
Day 28 Day 1 18.50000* 8.15135 .049 .0604 36.9396
Day 14 -9.50000 8.15135 .274 -27.9396 8.9396
Cyt_P450 LSD
Day 1 Day 14 -2.61920* 1.09712 .041 -5.1011 -.1373
Day 28 -8.05820* 1.09712 .000 -10.5401 -5.5763
Day 14 Day 1 2.61920* 1.09712 .041 .1373 5.1011
Day 28 -5.43900* 1.09712 .001 -7.9209 -2.9571
Day 28 Day 1 8.05820* 1.09712 .000 5.5763 10.5401
Day 14 5.43900* 1.09712 .001 2.9571 7.9209
GST LSD
Day 1 Day 14 -3.68750* .69065 .000 -5.2499 -2.1251
Day 28 -7.83750* .69065 .000 -9.3999 -6.2751
Day 14 Day 1 3.68750* .69065 .000 2.1251 5.2499
Day 28 -4.15000* .69065 .000 -5.7124 -2.5876
Day 28 Day 1 7.83750* .69065 .000 6.2751 9.3999
Day 14 4.15000* .69065 .000 2.5876 5.7124
*. The mean difference is significant at the 0.05 level.