Demographic consequences of rapid climate change and ...
177
ISBN 978-82-326-4660-9 (printed ver.) ISBN 978-82-326-4661-6 (electronic ver.) ISSN 1503-8181 Doctoral theses at NTNU, 2020:156 Kate Layton-Matthews Demographic consequences of rapid climate change and density dependence in migratory Arctic geese Doctoral thesis Doctoral theses at NTNU, 2020:156 Kate Layton-Matthews NTNU Norwegian University of Science and Technology Thesis for the Degree of Philosophiae Doctor Faculty of Natural Sciences Department of Biology
-
Upload
khangminh22 -
Category
Documents
-
view
0 -
download
0
Transcript of Demographic consequences of rapid climate change and ...

ISBN 978-82-326-4660-9 (printed ver.)ISBN 978-82-326-4661-6 (electronic ver.)
ISSN 1503-8181
Doctoral theses at NTNU, 2020:156
Kate Layton-Matthews
Demographic consequences ofrapid climate change anddensity dependence inmigratory Arctic geese
Doc
tora
l the
sis
Doctoral theses at N
TNU
, 2020:156Kate Layton-M
atthews
NTN
UN
orw
egia
n U
nive
rsity
of S
cien
ce a
nd T
echn
olog
yTh
esis
for t
he D
egre
e of
Philo
soph
iae
Doc
tor
Facu
lty o
f Nat
ural
Sci
ence
sD
epar
tmen
t of B
iolo
gy
Thesis for the Degree of Philosophiae Doctor
Trondheim, May 2020
Norwegian University of Science and TechnologyFaculty of Natural SciencesDepartment of Biology
Kate Layton-Matthews
Demographic consequences ofrapid climate change anddensity dependence inmigratory Arctic geese

NTNUNorwegian University of Science and Technology
Thesis for the Degree of Philosophiae Doctor
Faculty of Natural SciencesDepartment of Biology
© Kate Layton-Matthews
ISBN 978-82-326-4660-9 (printed ver.)ISBN 978-82-326-4661-6 (electronic ver.)ISSN 1503-8181
Doctoral theses at NTNU, 2020:156
Printed by NTNU Grafisk senter

…
Meanwhile the wild geese, high in the clean blue air,
are heading home again.
Whoever you are, no matter how lonely,
the world offers itself to your imagination,
calls to you like the wild geese, harsh and exciting –
over and over announcing your place
in the family of things.
Mary Oliver, Wild Geese
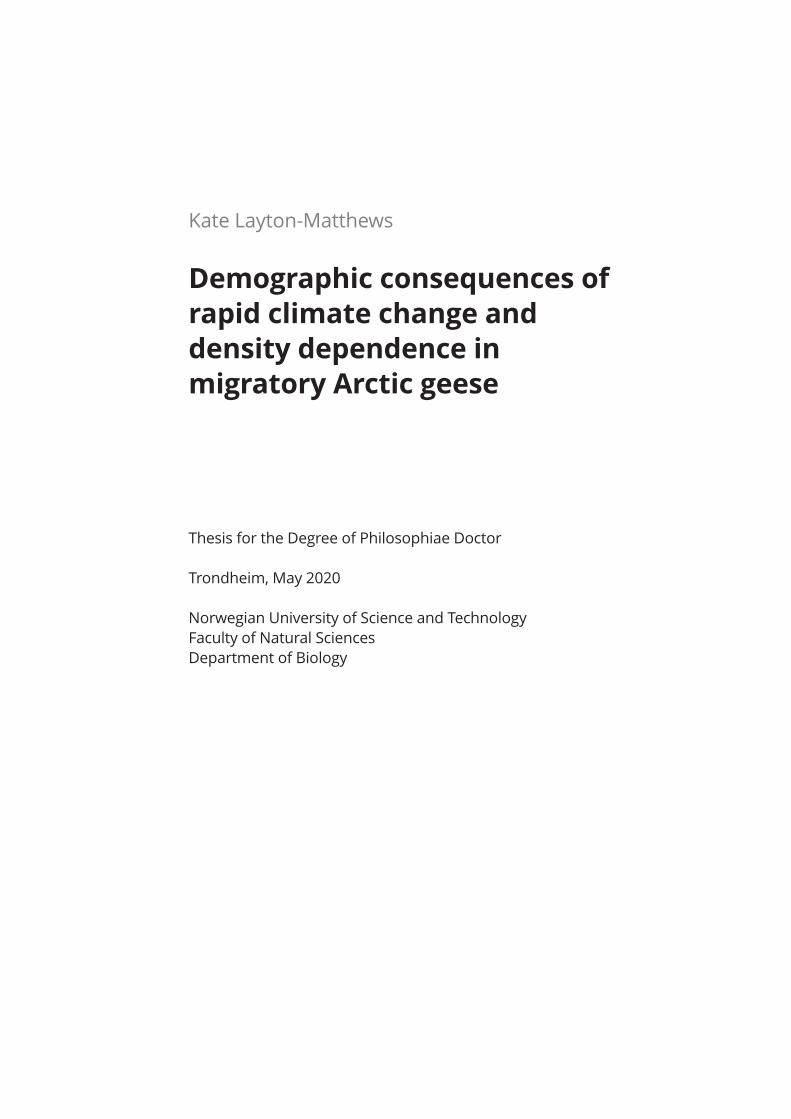
A barnacle goose family feeding on the tundra at
Ny-Ålesund, Svalbard (©Jasper Doest).

Acknowledgements
It was a big decision moving to a country I had hardly visited and a city I had never heard of. But the risk
paid off. The first week I arrived I met our Svalbard team - Bart, Mathilde, Brage and Vidar - and was
whisked off to Mathilde’s cabin and I already started feeling at home. In the last four years, I realised that
the group at CBD is really something special. Especially the PhD(+) gang where I have found so many good
friends rather than just colleagues. A huge thanks to all you guys for uncountable skiing and climbing trips,
meet-ups, parties, cave raves, dinners and the rest…
To Vidar and Brage – for being exceptional supervisors, not just with all of the academic support (which I
would have been lost without) but the ‘real life’ support too. To Maarten, you are an inspiring person,
thanks for your genuine curiosity and enthusiasm in all things. Susanne, my bachelor’s supervisor, for being
the first person to tell me I should consider ecology and to Arpat, my master’s supervisor, you were/are a
huge inspiration and gave me the best possible career start.
Takk til Marta, Hanne og Mari - I was supposed to be helping you guys but in the end you were all a huge
support for me. To Mum for saying I’ll be the next David Attenborough (you never know…) and Dad for
much-needed advice at times. To friends from home for supporting me even though I left London almost
10 years ago…and for the amazing people I have met along the way in Manchester and Zürich, during
fieldwork in Sweden and Svalbard, and on adventures further afield, I am extremely privileged to have met
so many inspirational people from different walks of life.
Table of contents
List of papers ..................................................................................................................................................... 5
Synopsis
1| Summary ......................................................................................................................................... 6
2| Introduction .................................................................................................................................... 8
Arctic climate change .............................................................................................................. 8
Population responses to climate change ........................................................................... 9
3| Thesis objectives ......................................................................................................................... 11
4| Methods ........................................................................................................................................ 13
Study system ........................................................................................................................... 13
Data collection ........................................................................................................................ 14
Integrated population models............................................................................................. 15
Path analysis............................................................................................................................ 15
E-SURGE ................................................................................................................................... 15
Integral projection models ................................................................................................... 16
5| Results and discussion .............................................................................................................. 17
6| Conclusions and prospects ....................................................................................................... 22
7| References .................................................................................................................................... 24
Papers I–IV

5
List of papers
I. Layton-Matthews K, Loonen MJJE, Hansen BB, Coste FD, Sæther B-E, Grøtan V (2019) Density-
dependent population dynamics of a high Arctic capital breeder, the barnacle goose. Journal of
Animal Ecology. doi: 10.1111/1365-2656.13001
II. Layton-Matthews K, Hansen BB, Grøtan V, Fuglei E, Loonen MJJE (2019) Contrasting consequences
of climate change for migratory geese: predation, density dependence and carryover effects offset
benefits of high-arctic warming. Global Change Biology. doi: 10.1111/gcb.14773
III. Fjelldal MA*, Layton-Matthews K*, Lee AM, Grøtan V, Loonen MJJE, Hansen BB (2020) High-arctic
family planning: earlier spring onset advances age at first reproduction in barnacle geese. In press,
Biology Letters. doi: 10.1098/rsbl.2020.0075
IV. Layton-Matthews K, Grøtan V, Hansen BB, Loonen MJJE, Fuglei E, Childs DZ. Environmental change
reduces body mass, but not population growth, in an Arctic herbivore. Manuscript.
Declaration of contributions
Paper I: KLM, BBH and VG designed the study. MJJEL collected goose data. KLM analysed the data with
input from VG and CFDC. KLM wrote the manuscript, which was reviewed and commented on by BES, BBH,
MJJEL and VG.
Paper II: KLM designed the study with input from MJJEL, BBH and VG. MJJEL provided goose data and EF
provided fox data. KLM analysed the data with input from BBH, MJJEL and VG. KLM wrote the manuscript,
which was reviewed and commented on by all co-authors.
Paper III: KLM, BBH and VG designed the study. MJJEL provided the data. MAF analysed the data, with
input from AML and KLM. KLM and MAF wrote the manuscript, which was reviewed and commented on by
all co-authors. MAF and KLM contributed equally to the study and are both co-first authors (*).
Paper IV: KLM and DZC designed the study, with input from BBH and VG. MJJEL provided goose data and
EF provided fox data. KLM analysed the data, with input from DZC. KLM wrote the manuscript, which was
reviewed and commented by all co-authors.
6
1| Summary
Climate change effects are being felt across
ecological levels and most strongly in the Arctic.
Scaling up from effects on demographic rates to
the population-level, and even community-level,
is a daunting task. This is particularly the case for
migratory species that experience different
climate and density regimes over their annual
cycle. However, increasingly sophisticated
statistical tools provide us with the means to do
so. In this thesis, I used state-of-the-art analytical
approaches to provide a mechanistic and holistic
understanding of the impacts of climate change
and density dependence on the population
dynamics of a migratory Arctic herbivore, the
barnacle goose (Branta leucopsis). The study
population of barnacle geese breeds in high-
arctic Svalbard but spends the winter at Solway
Firth, UK, with a spring stopover on mainland
Norway. I investigated the dynamics of a local
population breeding on western Svalbard, close
to the settlement of Ny-Ålesund, using 28 years
of individual-based data. In paper I, I used an
integrated population model to quantify density-
dependent effects on vital rates in this
population, following their colonisation of new
breeding grounds in a period of overall
population increase. Local density regulation at
the breeding grounds reduced population
growth through negative effects on reproduction.
This led to density-dependent changes in vital
rate contributions to the population growth rate.
These results provided empirical evidence that
the population dynamics of capital breeders may
be more reproduction driven. In paper II, I
disentangled climate, density and trophic-
interaction effects on population dynamics,
considering the annual cycle of barnacle geese,
i.e., breeding and non-breeding season effects on
vital rates. Climate change in Svalbard positively
affected egg production and hatching success
through rapid advancement of spring onset.
However, this was offset by reduced pre-fledging
survival due to increasing predation by Arctic
foxes, an indirect consequence of climate change
linked with changes in abundance of
overwintering herbivores. In this way, climate
effects on one population can cascade
throughout a community. Climate and density
also influenced reproduction and survival during
the non-breeding season, via carryover effects.
Overall, counteracting density, carryover and
(direct and indirect) climate effects stabilised
breeding population size. In paper III, I analysed
variation in an important life-history trait: age at
first reproduction (AFR). As established in paper
II, advancing spring onset increased the
probability of females producing goslings in
general, but importantly, this effect was stronger
for first-time than experienced breeders. The two-
week advance in spring phenology led to an
earlier AFR, by more than doubling the
proportion of two-year-olds reproducing (one-
year-olds do not reproduce). How the effects of
environmental change on such demographic
rates are coupled to traits reflecting body
condition is important to understand and predict
population growth. Body mass is a key fitness-
related trait for herbivores and fluctuates with
resources, which are highly variable in the Arctic.
Consequently, coupled trait-demography
responses may be important in Arctic herbivores,
particularly geese, where body mass has declined
in response to habitat degradation. In paper IV, I
quantified population-dynamic consequences of
changes in body mass in barnacle geese. Despite
a 10% decline in body mass, and positive effects
of mass on survival and reproduction, this did not
translate into trait-mediated effects on
7
population growth. Consequently, the population
dynamics of Arctic geese, and possibly other
Arctic herbivores, may be more resilient to
changing body condition than expected. In this
thesis, I highlight the sensitivity, but also
resilience, of an Arctic herbivore population to
climate change, and other sources of
environmental change, and the complex
mechanisms by which effects of climate change
are translated into changes in population
dynamics and abundance. The dynamics of this
population were predominantly driven by
variation in reproduction, which is the
demographic rate most affected by climate
change, directly and indirectly.
However, mechanisms buffering population
dynamics against environmental variation were
also evident, such as the lack of demographic
effects of declining body condition on the
population growth rate. Overall, this work
illustrates that a holistic approach, jointly
modelling vital rates and the mechanisms for how
they influence population dynamics, are
necessary to understand effects of e.g. climate
change.
8
2| Introduction
Arctic climate change
Global warming is occurring at an unprecedented
rate, with severe and diverse effects around the
world (Easterling et al. 2000; IPCC 2014). Global
mean temperatures are estimated to rise by 2.6–
4.8°C by the end of the century (compared to
1986–2005), under current emissions scenarios
(Collins et al. 2013). The consequences are hard
to ignore, with increasing frequencies of extreme
events and dramatic shifts in weather systems
(Rahmstorf & Coumou 2011). Warming is
occurring most rapidly at the poles, as a result of
Arctic amplification (Curry et al. 1995; Serreze &
Barry 2011). Consequently, Arctic species are
particularly at risk from climate change, and the
effects are already disrupting biotic and abiotic
processes (Post et al. 2009; Høye et al. 2013).
Arctic migrants also have the additional
challenge that climate change is occurring at
different speeds across their flyway (Robinson et
al. 2009), and they may not be able to adjust
their migratory cues to track climate change
(Both & Visser 2001).
The timing of snowmelt has advanced
substantially and is considered a prevailing
indicator of climate change in the Arctic (Foster
1989). This has serious, and complex,
consequences for Arctic herbivores, who are
strongly dependent on the short snow-free
season for their survival and reproduction.
Advancing spring onset may be beneficial for
some herbivores, through earlier vegetation
growth onset, i.e., food availability (Karlsen et al.
2014). However, it can also lead to problems of
mismatched food-web interactions, i.e., if they
cannot align their phenology to match the
phenology of their food source (Lameris et al.
2018; Nolet et al. 2019). Evidence suggests that
Arctic warming is potentially increasing
vegetation productivity, although a general
cross-species consensus is lacking (Elmendorf et
al. 2012; Piao et al. 2019). Increased food
availability in summer should benefit herbivores
by increasing their body condition, which is
fundamental for successful reproduction and
survival (Festa-Bianchet et al. 1997; 1998; Post
& Stenseth 1999). The capital-income breeding
dichotomy separates species relying on body
stores accumulated earlier in the annual cycle to
initiate reproduction (capital breeders), from
species investing in offspring using resources
directly at the breeding grounds (income
breeders) (Drent & Daan 1980; Stearns 1992;
Jönsson 1997). Capital breeding is a strategy to
cope with unpredictable conditions, allowing
some independence from environmental
variation and is therefore a common strategy at
high latitudes (Jönsson 1997; Varpe et al. 2009).
Consequently, capital breeding is characteristic of
several Arctic herbivores (greater snow goose,
Chen c. atlantica, Gauthier et al. 2003; e.g.,
muskox, Ovibos moschatus, Kerby & Post 2013).
Capital breeding is therefore an important
consideration when studying the effects of
climate change, since not only environmental
conditions during the breeding season are
relevant for breeding success.
Signatures of climate change are clearly
apparent in the Arctic; for instance, diminishing
sea ice extent (Post et al. 2013), changes in
snowpack characteristics (Peeters et al. 2019),
vegetation productivity and phenology
(Elmendorf et al. 2012) as well as increasing
frequencies of extreme events (Fischer & Knutti
2015; Diffenbaugh et al. 2017). A
comprehensive assessment of its implications for
the persistence of Arctic populations is
fundamental to understand their sensitivity to
future warming. This is relevant for vulnerable
9
(e.g., reindeer, polar bear), but also thriving (e.g.,
Arctic geese), species, to inform both
conservation and management decisions (IUCN,
2019).
Population responses to climate change
A complete understanding of demographic
responses to climate change is necessary to
predict population persistence into the future
(Jenouvrier et al. 2009; Paniw et al. 2019).
Population dynamics are influenced by density-
dependent and environmental processes, which
affect species’ reproduction and survival (Turchin
1995; Lande et al. 2003). Assessing population
responses to environmental factors requires an
understanding of intrinsic processes, i.e., density
regulation, life history and age structure (Benton
et al. 2006; Vindenes et al. 2011; Abadi et al.
2012). In fact, not accounting for the structure
and intrinsic properties of a population can lead
to false inferences about underlying processes
affecting fluctuations in population size (Stenseth
1999; Lande et al. 2006).
Demographic analyses aim to identify
relationships between the environment and vital
rates, which determine (variation in) population
size. Across Arctic species, effects of climate
change on reproduction and survival are, in
several cases, well-documented (Forchhammer et
al. 2008; Post et al. 2009). A warming Arctic can
benefit reproduction, through earlier sea ice
retreat (Gaston et al. 2005), snow melt (Cooper
et al. 2011) and an advanced, longer growing
season in terrestrial (Karlsen et al. 2014) and
marine (Søreide et al. 2010) systems. However,
negative effects of trophic mismatch on
reproduction have also been documented, where
species cannot advance their reproductive timing
enough to follow advancing food peaks (Søreide
et al. 2010; Jensen et al. 2014). Furthermore,
retreating sea ice has had negative implications
for reproduction and survival of marine predators
such as polar bears (Molnár et al. 2010), and
terrestrial herbivores may suffer from increased
frequency of winter icing events (Hansen et al.
2019).
There are several pathways by which
climate change can lead to population-dynamic
consequences, not only through direct effects on
demographic rates. Carryover effects occur when
conditions in one season affect individual fitness
in a later season (Norris 2005). Carryover effects
on reproduction and survival are particularly
relevant for migratory species, which utilise
several locations over their annual cycle (Norris
2005; Inger et al. 2010; Sedinger et al. 2011).
However, modelling climate effects on
reproduction and survival, over an entire annual
cycle, presents a challenge (Sedinger &
Alisauskas 2014). Furthermore, populations are
connected by interspecific interactions.
Consequently, climate change can affect entire
communities through these interactions, across
trophic levels (Dunne et al. 2002; Ims & Fuglei
2005). Trophic interactions play an important
role in Arctic systems (Gauthier et al. 2004;
Morrissette et al. 2010; Ims et al. 2013b) and
present a mechanism by which ecosystem
responses to climate change can occur.
Furthermore, Arctic trophic systems have been
more severely, and rapidly, perturbed than in
other ecosystems (Ims & Fuglei 2005; Post et al.
2009). Changes in bottom-up producers affect
higher levels in the food chain, while changes in
predation pressure act as ‘top-down’ controls
(Ims et al. 2013b; Legagneux et al. 2014).
Ignoring these trophic interactions can lead to
false conclusions, when predicting population,
and also community, persistence under future
climate change (Gunn & Skogland 1997; Ims &
Fuglei 2005). Climate change is also affecting

10
phenotypic trait distributions (e.g. Parmesan
2006; Jiguet et al. 2007). Fitness-related traits
are closely associated with individual
reproduction and survival. Therefore, changes in
life-history traits and fitness-related phenotypic
traits can ultimately scale up to influence
population size (Ozgul et al. 2009; 2010).
However, determining the mechanisms behind
population-dynamic responses requires an
understanding of demography-trait associations
and how they, in turn, are influenced by climate
change (Pelletier et al. 2007; McLean et al.
2020).
11
3| Thesis objectives
In this thesis, I aim to improve our understanding
of how climate change has, through different
mechanisms, affected the population dynamics of
a migratory Arctic herbivore. This required
disentangling the complex mechanisms behind,
potentially age- and vital rate-specific,
demographic responses, such as density
dependence, direct and indirect effects of climate
change, food-web interactions, and changes in
trait dynamics. I studied the population dynamics
of barnacle geese (Branta leucopsis), breeding in
high Arctic Svalbard, using almost 30 years of
individual-based data.
I had three overarching questions, which I
answered with four papers:
1. How do density-dependent processes impact
the dynamics and trajectories of a colonising
population (papers I, II, III)?
Population size fluctuations are influenced by
density-dependent and -independent processes
(Lande et al. 2003). Density regulation may be a
particularly relevant process in rapidly increasing
(e.g., colonising) populations as vital rates can
change substantially as population sizes grow
towards (and often overshoot) the carrying
capacity. However, density dependence can take
several forms, depending on which, potentially
age-specific, vital rates are affected, and can
differ according to species’ life history (Fowler
1987; Lande et al. 2002). In paper I, I aimed to
explore how density-dependent processes acted
to regulate the size of this study population and
to what extent observed patterns of density
regulation could be explained by the life history
characteristics of barnacle geese. In paper II, I
looked more in-depth into the life-history stages
of barnacle geese, to tease apart different
density-dependent versus density-independent
processes. By knowing at what stage these
effects occur, I aimed to gain a more mechanistic
understanding of how they affect demographic
rates. In paper III, I asked whether density-
dependent processes not only influence vital
rates directly, but also important life-history traits
such as the age at first reproduction in barnacle
geese.
2. How has climate change directly or indirectly
influenced population dynamics, and through
which vital rates (paper II)?
Quantifying effects of climate change on
demographic rates is key to predicting
population persistence in the future (Jenouvrier
2013). In paper II, I explored the potential
mechanisms by which rapid climate change in the
Arctic is affecting the population dynamics of
arctic geese. Specifically, I asked how weather,
population density and trophic interactions
influence reproduction and survival in the study
population. I looked across the annual cycle,
including both the breeding and non-breeding
season, since environmental processes in one
season can have carry-over effects on later
seasons (Inger et al. 2010; Sedinger et al. 2011).
3. To what extent have key fitness-related traits
been affected by climate/environmental
change, and how do they contribute to
variation in the population growth rate
(papers III, IV)?
Not only climate change but also other sources
of environmental change have altered phenotypic
trait distributions, as well as the dynamics of
natural populations (Parmesan 2006; Jenouvrier

12
et al. 2009). In paper III, I investigated how
advancing spring onset at the arctic breeding
grounds influences age at first reproduction.
Coupled changes in traits and demographic rates
can occur when both respond to variation in
weather or density (Parmesan 2006; Ozgul et al.
2010).
Body mass is an important fitness-related trait in
Arctic herbivores, and, across Arctic goose
species, has been undergoing a decline due to
habitat degradation. In paper IV, I aimed to
quantify the importance of body mass-mediated
effects on the dynamics of the study population
and therefore how much the decline in body mass
has influenced their population growth.
13
4| Methods
Study system
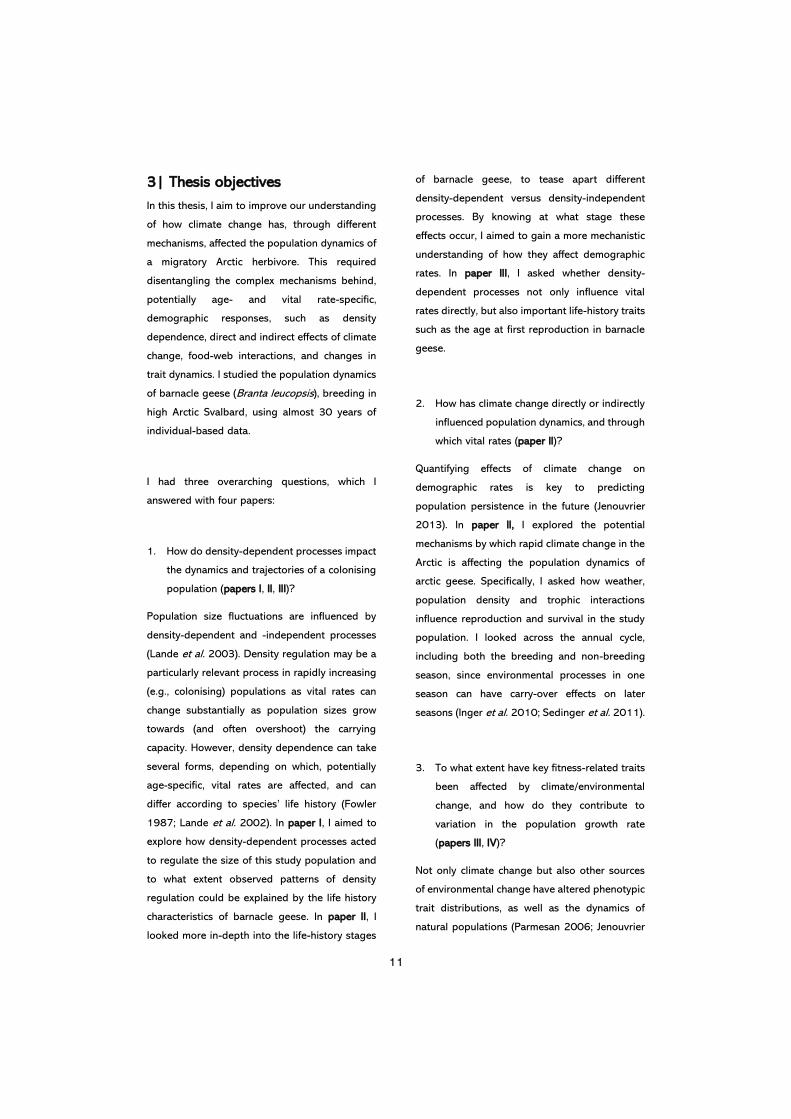
Barnacle geese (Figure 1) are long-lived (up to
28 years) migratory birds, utilising distinct areas
for breeding and overwintering, often with
multiple stopovers during their seasonal
migration. They are monogamous and are
sexually mature from two years of age, laying one
clutch per season with 3–5 eggs on average
(Black et al. 2014). Barnacle geese are partial
capital breeders, investing 23–88% of body
stores acquired further south in egg production
(Hahn et al., 2011).
Figure 1. A gaggle of geese waiting to receive leg rings
for later re-identification (Ronald Cornelissen).
Arctic barnacle geese exist in three
geographically distinct breeding populations; the
Greenland, Russian and Svalbard populations.
Numbers were severely depleted in the 1950s,
due to excessive hunting pressure. The combined
alleviation from hunting since the 1950s and the
transition to agricultural lands at overwintering
grounds has led to a dramatic, and sustained,
increase (Fox & Abraham 2017; Fox & Madsen
2017). By the 1980s, the total number across
the three flyways was approximately 112,000
(Madsen 1991), and by 2010 had reached over
one million individuals (Fox & Leafloor 2018,
BirdLife International 2004). The Svalbard
population alone had an estimated population
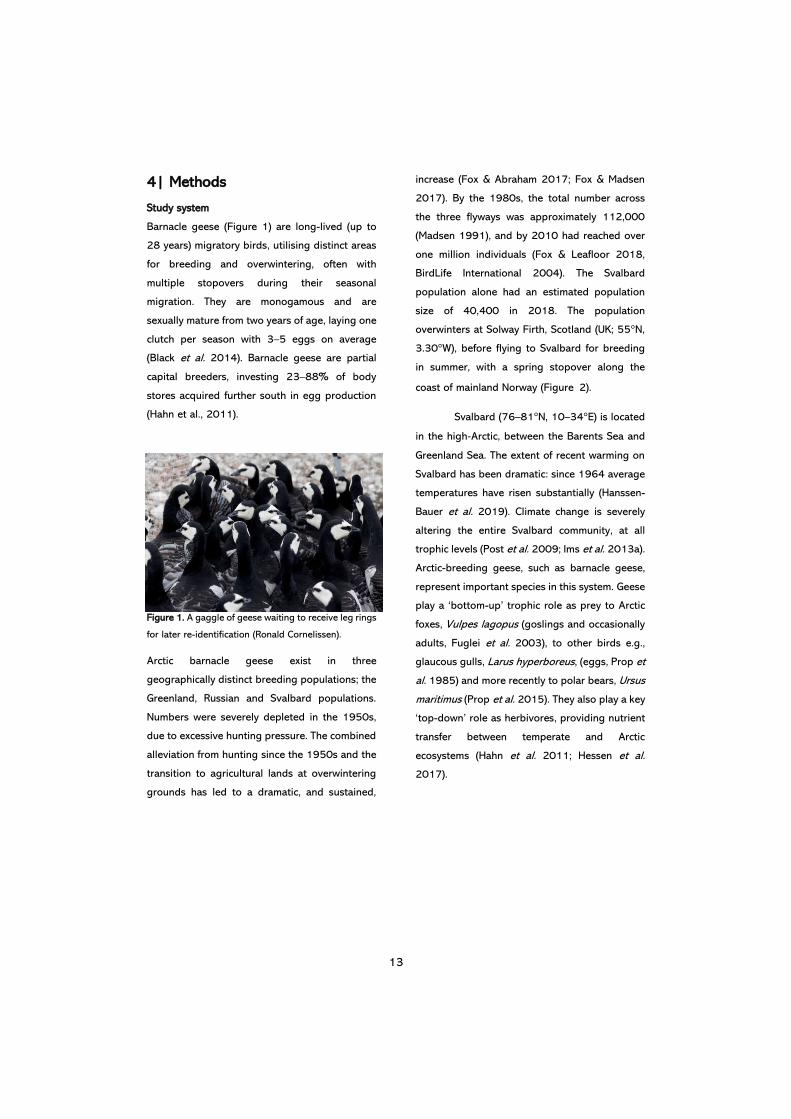
size of 40,400 in 2018. The population
overwinters at Solway Firth, Scotland (UK; 55°N,
3.30°W), before flying to Svalbard for breeding
in summer, with a spring stopover along the
coast of mainland Norway (Figure 2).
Svalbard (76–81°N, 10–34°E) is located
in the high‐Arctic, between the Barents Sea and
Greenland Sea. The extent of recent warming on
Svalbard has been dramatic: since 1964 average
temperatures have risen substantially (Hanssen-
Bauer et al. 2019). Climate change is severely
altering the entire Svalbard community, at all
trophic levels (Post et al. 2009; Ims et al. 2013a).
Arctic-breeding geese, such as barnacle geese,
represent important species in this system. Geese
play a ‘bottom-up’ trophic role as prey to Arctic
foxes, Vulpes lagopus (goslings and occasionally
adults, Fuglei et al. 2003), to other birds e.g.,
glaucous gulls, Larus hyperboreus, (eggs, Prop et
al. 1985) and more recently to polar bears, Ursus
maritimus (Prop et al. 2015). They also play a key
‘top-down’ role as herbivores, providing nutrient
transfer between temperate and Arctic
ecosystems (Hahn et al. 2011; Hessen et al.
2017).
14
Figure 2. Migration route and timing of key life-history events for Svalbard barnacle geese. Barnacle geese overwinter
at Solway Firth, UK (blue), before travelling to western Svalbard for breeding (pink) via a stopover on the coast of
mainland Norway (green). The timing of migrations and reproductive events are shown in the outer circle.
Data collection
The work in this thesis is largely based on 28
years of individual-based data (1990-2017) from
a population of Svalbard barnacle geese,
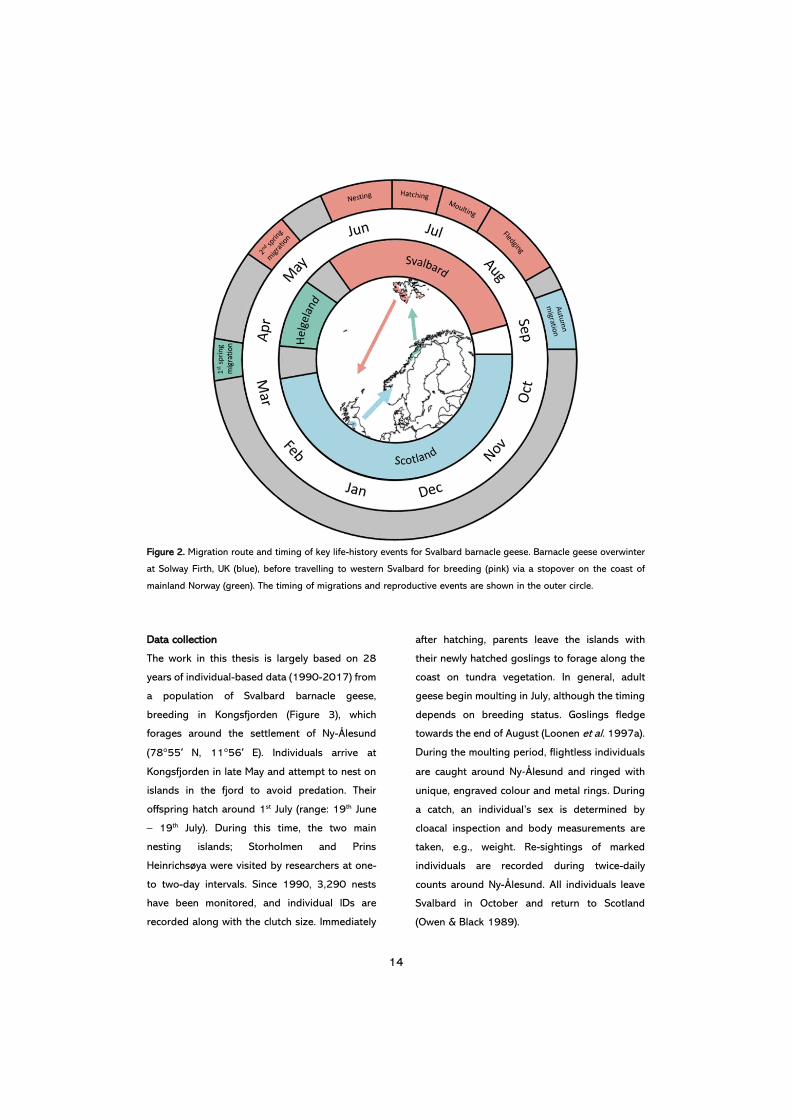
breeding in Kongsfjorden (Figure 3), which
forages around the settlement of Ny-Ålesund
(78°55′ N, 11°56′ E). Individuals arrive at
Kongsfjorden in late May and attempt to nest on
islands in the fjord to avoid predation. Their
offspring hatch around 1st July (range: 19th June
– 19th July). During this time, the two main
nesting islands; Storholmen and Prins
Heinrichsøya were visited by researchers at one-
to two-day intervals. Since 1990, 3,290 nests
have been monitored, and individual IDs are
recorded along with the clutch size. Immediately
after hatching, parents leave the islands with
their newly hatched goslings to forage along the
coast on tundra vegetation. In general, adult
geese begin moulting in July, although the timing
depends on breeding status. Goslings fledge
towards the end of August (Loonen et al. 1997a).
During the moulting period, flightless individuals
are caught around Ny‐Ålesund and ringed with
unique, engraved colour and metal rings. During
a catch, an individual’s sex is determined by
cloacal inspection and body measurements are
taken, e.g., weight. Re-sightings of marked
individuals are recorded during twice-daily
counts around Ny-Ålesund. All individuals leave
Svalbard in October and return to Scotland
(Owen & Black 1989).
15
Figure 3. The study system at Kongsfjorden, western
Svalbard. Arrows indicate the location of Ny-Ålesund
and the two monitored nesting islands.
Integrated population models
Integrated population models (IPoMs) provide a
framework to analyse demographic and count
data in a unified way. IPoMs combine multiple
data sources in one model, allowing for
information flow among demographic processes
(Schaub & Abadi 2011; Abadi et al. 2012).
Combining demographic and count data, allows
us to account for multiple sources of uncertainty,
improve the accuracy of parameter estimation
and estimate unknown parameters. IPoMs are
generally implemented in a Bayesian framework,
which inherently provides an efficient way to link
process and observation models. In paper I, we
constructed an IPoM, to estimate age class-
specific demographic rates and numbers. The
model estimated the number of individuals (N ) at
year t+1 in three age classes, by jointly
estimating; survival (ϕ) of the fledgling (f),
yearling (y) and adult classes (ad), the probability
of a female producing fledglings (R) and fledged
brood size (fec), at year t.
Nft+1 ~ Poisson(Rt+1 fect+1(Nyt
ϕyt
+ Nadtϕ
adt)/2)
Nyt+1
~ Binomial(ϕft, Nft)
Nadt+1 ~ Binomial(ϕyt
, Nyt) + Binomial(ϕ
adt, Nadt
)
Path analysis
Path analysis is a statistical approach to test
multivariate hypotheses of associations among
variables (Shipley 2000). Confirmatory path
analyses are extensions of structural equation
modelling, which allow for hierarchical structures
in the data, e.g., random effects (Shipley 2009).
In paper II, we performed such an analysis to
identify the main environmental effects of several
reproductive stages in barnacle geese. We
constructed a path diagram to test for links
between covariates and responses variables, and
dependencies among responses. Proposed
independence relationships were tested using d-
separation tests. Each test gives the necessary
conditions for two variables to be independent,
conditional on another set variables. The overall
fit of the path diagram was confirmed using a
Fisher’s C test (Shipley 2009).
E-SURGE
The multi-event program E-SURGE (Multi-Event
SURvival Generalized Estimation) incorporates
uncertainties in both state (e.g., breeding status,
sex, age) and detection uncertainty (Choquet et
al. 2009), by considering them as a hidden
Markov process. In paper III, we used this
framework to estimate probabilities of
reproducing for the first time. Multi-event models
separate states, representing the ‘true’
reproductive status of an individual in a given
year, which are not necessarily observable, and
events, i.e., the observed state of an individual.
We modelled four states; pre-breeder, non-
breeder, breeder and dead. ‘Pre-breeder’ was any
individual breeding at year t that had never bred
previously (i.e., first-time breeders), ‘non-breeder’
was an individual not breeding at t but that had
bred in a previous year, ‘breeder’ was a female
that produced at least one gosling at t and which
had previously bred, and ‘dead’ includes both
dead and permanently emigrated individuals.
Three events were considered: ‘not seen, ‘seen as
breeder’ and ‘seen but not breeding’, which were
associated with certain states.

16
Integral projection models
Integral projection models (IPrMs) provide a
framework to study coupled trait-population-
dynamic responses to environmental change
(Ellner et al. 2016). In paper IV, we constructed
an IPrM, structured by age class and body mass,
combining information on variation in mass and
vital rates and their respective environmental- or
density- dependencies, underpinned by time-
varying regression parameters (Rees & Ellner
2009). We constructed a density-independent,
stochastic IPrM (Rees & Ellner 2009; Ellner et al.
2016) describing the temporal dynamics of
population size and the distribution of body mass
(z) of fledglings (fl) and adults (ad). Fad(t)
(z', z) is
the fecundity kernel describing production of
mass z’ fledglings by females of mass z, based on
adult (ad) survival (φ) and reproductive (R, fec)
rates:
Fad(z', z)= φ(t)(z, ad)R
(t+1)(z)fec
(t+1)C0
t+1(z')/2.
Pfl,ad(t)
are survival-growth kernels describing how
individuals of mass z at time t, survive (φ) and
grow (G) to reach mass z’ at time t+1:
Pa(t)
(z', z)= φ(t)(z, a)G(t)
(z', z).
The structure of the IPrM was, where U and L
were the upper and lower integration limits,
respectively:
nfl(z', t+1) = ∫ Fad(t)
(z', z)nad(z, t)dz𝑈
L
nad(z', t+1) = ∫ Pad(t)
(z', z)nad(z, t)dz +𝑈
L
∫ Pfl(t)
(z', z)nfl(z, t)dz. 𝑈
L
Matrix population analysis
Population projection matrices are a common
tool to analyse population dynamics, providing
useful metrics such as the population growth rate
(λ) and sensitivities of λ to changes in underlying
demographic rates (Caswell 2000, 2001).
Prospective perturbation analysis measures the
absolute (sensitivity) or proportional (elasticity)
change in the population growth rate, given a
change in a matrix element or vital rate (Caswell
2000). Retrospective perturbation analyses,
commonly known as life-table response
experiments (LTRE), can be used to calculate the
‘realised’ contribution of a vital rate to λ,
accounting for realised variation in that vital rate
as well as the sensitivity (Caswell 1989).
Populations are constantly being perturbed by
short-term, temporal variation in the environment
(Bierzychudek 1999; Clutton–Brock & Coulson
2002) however. Transient population dynamics
are therefore being used increasingly frequently
to capture the consequences of this short-term
variation in population dynamics (Hastings 2004;
Koons et al. 2005; Ezard et al. 2010). Transient-
LTREs partition variance in the realised
population growth rate, λt, into contributions
from demographic rates. In doing so, it allows us
to incorporate effects of transient variation in the
population structure or trait distributions (Rees &
Ellner 2009). In paper I, we calculated elasticities
(prospective) and contributions (retrospective) of
a density-dependent matrix, comparing both
asymptotic and transient LTRE analyses, based
on Koons et al. (2016) and Caswell (2007). In
paper II, we quantified the contributions of
climate, density and trophic interactions to the
asymptotic population growth rate using an
LTRE. In paper IV, we applied a transient-LTRE to
the IPrM, structured by age class and body mass,
to partition variance in the realised population
growth rate into direct and delayed (i.e., changes
in the body mass distribution or age structure)
parameter contributions (Maldonado‐Chaparro et
al. 2018).

17
5| Results and discussion
1. How do density-dependent processes impact
the dynamics and trajectories of a colonising
population (papers I, II, III)?
In paper I, we showed that local density
regulation at the breeding grounds reduced
population growth through negative effects on
reproduction but did not explain substantial
temporal variation in fledgling or adult
overwinter survival. Elasticities to vital rates
changed as the population size approached
carrying capacity: the influence of reproductive
rates and early-life survival on the population
growth rate declined, while the influence of adult
survival on λ increased. The pattern of density
dependence in this population of barnacle geese
differed from that of income-breeding birds,
where density regulation mainly occurs through
effects on early-life survival (Sæther et al. 2016).
This highlighted how the population dynamics of
capital breeders such as barnacle geese may be
more reproduction-driven than in income
breeders. This was supported by later papers (II
and IV), that despite adult survival being highly
influential on the population size, in reality,
variation in reproduction was by far the largest
contributor to fluctuations in population size.
This is a commonly observed pattern in long-
lived species, where vital rates that are influential
on the population growth rate generally exhibit
less variability, i.e., demographic buffering
hypothesis (Gaillard & Yoccoz 2003; Koons et al.
2014). I then wanted to tease apart in more
detail, the underlying causes of variation in vital
rates and the contributions to population
dynamics. For further mechanistic insights into
the density-dependent processes (paper II),
reproduction was separated into several stages,
indicating that pre-fledging brood size was the
reproductive stage affected the most by density-
dependent processes, i.e., most affected by
competition for food resources (Larsson &
Forslund 1994; Loonen et al. 1997b). However,
we found evidence for density‐dependent effects
across the annual cycle: total flyway population
size negatively affected survival and egg
production, via carryover effects. Particularly in
the case of long-lived species, reproductive
success can be age-dependent, as has been
shown in barnacle geese (Forslund & Larsson
1992). Although reproductive success per se was
not found to be age-dependent here, in paper III,
we found that younger, more inexperienced
adults were more affected by density-dependent
processes, regarding when they produced
goslings for the first time. Age and body size are
both determinants of social status in barnacle
geese (Stahl et al. 2001). Therefore, at high
densities (i.e., greater competition) younger
individuals of lower social status are forced to
utilise nest-sites of poorer quality, with less food
available (Prop & Deerenberg 1991; Stahl et al.
2001).
2. How has climate change directly or indirectly
influenced population dynamics, and through
which vital rates (paper II)?
Accounting for density-dependent processes, we
showed in paper II, that recent climate change in
Svalbard enhanced egg production and hatching
success through positive effects of advanced
spring onset (snow melt) and warmer summers
(i.e. earlier vegetation green‐up) respectively.
However, there was a strong temporal decline
over the course of the study in fledging
probability due to increased local abundance of
the Arctic fox, the main predator. Increasing
Arctic fox abundance is in part an indirect result
of climate change. Svalbard reindeer abundance

18
fluctuates dramatically in accordance with winter-
icing events, which are associated with climate
warming (Hansen et al. 2019). Both increased
reindeer overall abundance and population
crashes can boost carcass availability for Arctic
foxes, improving their reproduction and,
possibly, winter survival (Fuglei et al. 2003;
Hansen et al. 2013), with negative consequences
for goose reproduction. This highlights how
climate change effects can influence a
population’s demographic rates through top-
down food-web interactions. The Svalbard
system is, however, largely bottom-up regulated
(Ims et al. 2013c). Consequently, changes in
vegetation have important consequences for the
reproduction and survival of Arctic herbivores,
such as reindeer and geese. On the other hand,
grazing by Arctic herbivores has, in turn, altered
vegetation communities (Van der Wal et al. 2001;
2006; Hansen et al. 2007). Therefore, climate
change effects on one species can occur by both
bottom-up and top-down trophic interactions,
potentially affecting an entire Arctic community
(Post et al. 2009). However, it is not only
processes during the breeding season that
influence migratory species, like barnacle geese
(Kery et al. 2006; Marra et al. 2015). Barnacle
geese can also be affected by conditions at lower
latitudes. We found that weather during the non‐
breeding season (UK and mainland Norway)
influenced population growth, through positive
effects of winter temperature on adult survival
and carryover effects of spring rainfall (stopover
site) on egg production. Overall, this combination
of density-dependent processes, direct and
indirect climate change effects, and carryover
effects appeared to stabilise local population
size.
Although dramatic warming of the Arctic,
specifically advancing spring onset, has the
potential to benefit the reproductive success of
arctic-breeding geese, we have shown that
counteracting effects have ultimately led to the
breeding population size neither increasing nor
decreasing. Furthermore, geese can only benefit
from advancing onset if they can adjust their
migration phenology sufficiently, and some
studies have indicated that this is not the case in
other populations of barnacle geese (Lameris et
al. 2018; Nolet et al. 2019). Importantly, our
results also highlight the influence of
environmental conditions during the non-
breeding season. Although there was no positive
trend in winter temperature over the study
period, even a small warming trend in the future
would benefit survival, although the positive
consequences for population trajectories could,
in turn, be curbed by density regulation at the
overwintering grounds. This work therefore
emphasises how gaining a mechanistic
understanding of the different processes
influencing a population’s vital rates is
fundamental to accurately predicting future
population sizes, and therefore implementing
appropriate management strategies.
3. To what extent have key fitness-related traits
been affected by climate/environmental
change, and how do they contribute to
variation in the population growth rate
(papers III, IV)?
In paper III, we identified climate and density
effects on the probability of producing goslings
for the first time. Delayed spring onset negatively
affected reproduction probability overall but
influenced first-time breeders more strongly than
experienced breeders. These results demonstrate
the importance of using multi-event models to
estimate uncertain states, since a far larger

19
proportion of 2-year-olds were estimated to have
produced goslings in the population than were
actually observed. Spring onset has advanced by
two weeks over the study period as a
consequence of climate change, leading to a
doubling in the proportion of 2-year-olds
reproducing and thereby likely an earlier age at
first reproduction. This highlights how Arctic
climate change can strongly influence important
life-history traits, with potentially positive
implications for the population dynamics of
barnacle geese. However, reproducing at an
earlier age may also induce costs later in life since
age at first reproduction represents a trade-off
between current reproductive investment versus
future reproduction or survival (Stearns 1989).
To understand mechanistically how
changes in environmental conditions can
ultimately affect population size, it is important
to consider potential trait-mediated pathways.
Such mechanisms can occur when both traits and
vital rates respond to environmental fluctuations
(Parmesan 2006; Ozgul et al. 2009; 2010). In
paper IV, the goal was therefore to assess
changes in body mass over time, and the
importance of body mass-mediated effects for
the population dynamics and population growth
of my barnacle goose study population. Density-
dependent processes influenced first-year body
mass, particularly at high Arctic fox abundance,
likely restricting the ability of the geese to utilise
all available foraging areas (Loonen et al. 1998).
Fledgling body mass had, in turn, a strong
positive effect on first-year survival, but body
mass in adults had little effect on survival. Body
mass has declined dramatically in several Arctic
goose species and across populations (Cooke et
al. 1995; Loonen et al. 1997b; Larsson et al.
1998). Population expansion has led to
widespread degradation of Arctic breeding
grounds, reducing food availability and,
consequently, body mass. Despite a 10% decline
in cohort body mass (1980-2017) in this study
population, and positive effects of body mass on
reproduction and survival, changes in body mass
had negligible effects on the population growth
rate (λ). This can be explained by the fact that,
achieving body mass-mediated effects on λ
requires three conditions to be met. Namely, (1)
body mass must fluctuate in the relevant age-
specific life-history stage, (2) the demographic
rate must be sensitive to body mass changes and
(3) population growth must be sensitive to the
varying demographic rate. Since all three
conditions were not met for any of the age-
specific demographic rates - e.g., (1) body mass
of fledglings varied inter-annually, (2) fledgling
survival is positively affected by body mass, but
(3) λ was insensitive to fledgling survival. The
demographic buffering hypothesis states that
variation in λ reduces fitness (Tuljapurkar 1982),
which should, therefore, result in selection for
reduced variation in population size (Gaillard &
Yoccoz 2003; Jongejans et al. 2010). Similarly,
the population growth rate may also be buffered
against variation in important fitness-related
traits such as body condition. Paper IV (as well as
paper I) highlights the reproduction-driven
dynamics of arctic geese, and that reproduction
is the demographic rate where climate change is
having the most impact. While these results
support papers II and III, in that advancing spring
onset benefits reproduction, in paper III we also
show that heavier individuals were more likely to
produce fledglings than lighter ones, but only
under poor spring breeding conditions (i.e.,
delayed spring onset). Accumulating fat reserves
is beneficial under harsh conditions, but as spring
advances with climate change, we could expect
relaxed selection on body mass if individuals gain
a survival advantage by requiring fewer fat

20
reserves for migration (Davies et al. 1988;
Larsson et al. 1998). Overall, the results from
papers III and IV, illustrate the importance of
studying life-history and fitness-related traits, as
pathways by which climate change can influence
population dynamics. In doing so, we have
identified mechanisms by which this population
is buffered against variation in such traits.
This has implications for the resilience of Arctic
geese, and possibly other Arctic herbivores, to
environmental change, as changes in body
condition, and other fitness-related traits, may
have more limited population-dynamic
consequences than we might expect (McLean et
al. 2020).

21
Fig
ure
4. Sum
mary
of th
e m
ain
fin
din
gs.
Usi
ng fig
ure
s fr
om
the four
papers
, I sh
ow
how
I h
ave
captu
red t
he e
ffect
s of cl
imate
change: as
effect
s of (1
) th
e d
ate
of sp
ring o
nse
t (o
rdin
al
day)
on c
lutc
h s
ize a
nd the (re
pro
duct
ion) pro
bability
of pro
duci
ng g
osl
ings
and (2) of A
rctic
fox
abundance
on the p
robability
of fledgin
g (in
creasi
ng A
rctic
fox
abundance
is
an indirect
clim
ate
change e
ffect
). I h
ave a
lso c
aptu
red e
ffect
s of densi
ty d
ependence
, both
at th
e o
verw
inte
ring g
rounds
(Nsc
otland) on c
lutc
h s
ize a
nd s
urv
ival, a
nd a
t th
e b
reedin
g g
rounds
(Nsv
alb
ard)
on t
he p
opula
tion g
row
th r
ate
(th
rough e
ffect
s on g
osl
ing b
rood s
ize). T
his
fig
ure
als
o illust
rate
s th
e r
esu
lts
that
body
mass
affect
s su
rviv
al and r
epro
duct
ion –
and a
lso h
ow
clim
ate
change influence
s re
pro
duct
ion -
but
effect
s of decl
inin
g b
ody
mass
did
not
scale
up t
o influence
the p
opula
tion g
row
th r
ate
.
22
6| Conclusions and prospects
By accounting for important trophic interactions,
this thesis has disentangled the mechanisms by
which climate change and density dependence
affect the population dynamics of a key Arctic
migrant, the barnacle goose. This work
emphasises the importance of taking holistic
approaches to demographic modelling, to study
the consequences of climate change. Only by
considering all the components of a population’s
dynamics; density dependence, temporal
(co)variation in vital rates, indirect climate effects
as well as important trophic interactions, can we
paint an accurate picture of how populations are
responding to climate change and, importantly,
their persistence into the future (Reed et al.
2013). Furthermore, I show that considering the
spatial heterogeneity in climate change,
demographic models of migratory species need
to consider their entire annual cycle. Although
climate change is occurring most rapidly in the
Arctic, and its effects have largely been on
breeding success, I have shown that future
changes in winter temperature in the UK could
increase their overwinter survival, with potentially
substantial population-dynamic consequences.
Overall, these results document the
sensitivity of barnacle goose population
dynamics to recent climate change, largely
through effects on their reproduction. However,
this work has also stressed the capacity of Arctic
geese to cope with rapid environmental change,
e.g., the buffering of effects of changes in body
condition. While climate warming may pose some
benefits for this species, and potentially other
Arctic herbivores, by capturing the impacts of key
trophic interactions, we showed that these
benefits are offset by counteracting effects.
Furthermore, the extent to which positive climate
change effects could be offset by a mismatch
between the timing of the geese
arriving/breeding and the onset of the plant
growing season, in the future remains uncertain.
Different breeding populations of barnacle geese
may not all react in the same way either (Lameris
et al. 2017) and, hence, the consequences of
trophic mismatch on reproduction success may
differ among populations (Nolet et al. 2019).
Although my approaches were applied on a
particularly high-quality, long-term dataset, with
access to local time-series on environmental
variables and key interacting species, similar data
series do exist for other breeding populations of
barnacle geese as well, and also for other Arctic
goose species. The combination of state-of-the-
art analytical methods used in this thesis could
serve as a framework for assessing, for example,
the importance of spatial heterogeneity in
responses to climate change, and its net impacts.
While environmental/climate change may
not have had substantial, negative consequences
for this population, as of yet, accurately
predicting Arctic goose persistence is still
extremely pressing right now. Management of
Arctic geese is currently a topic of major interest,
with large-scale hunting already re-started in
some populations of barnacle, and other goose,
species (Jensen et al. 2018). This holistic
understanding of how climate change is affecting
the population dynamics of barnacle geese
should be incorporated in management planning,
to prevent the risk of overharvesting in a species
that is sensitive to climate change and has
previously reached critically low numbers. Some
of the results from this thesis have already been
included into management recommendations for
barnacle geese (Huysentruyt et al. 2020) and a
report on climate change impacts on Arctic
ecosystems, through food-web interactions
(Pedersen et al. 2019). This demonstrates that

23
such demographic, mechanistically founded work
is critical both to ensure that populations are
managed sustainably and with regard to future
climate, and environmental, change. With this
thesis, I have also highlighted the importance of
taking a community perspective when predicting
the consequences of climate change for Arctic
populations, accounting for key species
interactions. The entire Arctic community is now
undergoing extremely rapid change, as a result
of strong warming, and more emphasis should be
placed on multi-species analysis to understand
how climate change is affecting entire
communities in concert (Ims et al. 2013a).
24
7| References
Abadi, F., Gimenez, O., Jakober, H., Stauber, W., Arlettaz, R. & Schaub, M. (2012). Estimating the strength
of density dependence in the presence of observation errors using integrated population
models. Ecological Modelling, 242, 1-9.
Benton, T.G., Plaistow, S.J. & Coulson, T.N. (2006). Complex population dynamics and complex causation:
devils, details and demography. Proceedings of the Royal Society B: Biological Sciences, 273,
1173-1181.
Bierzychudek, P. (1999). Looking backwards: assessing the projections of a transition matrix model.
Ecological Applications, 9, 1278-1287.
Black, J.M., Prop, J. & Larsson, K. (2014). Survival and reproduction. In: The barnacle goose (ed. Martin, J).
Bloomsbury Publishing London, UK, pp. 159 - 172.
Both, C. & Visser, M.E. (2001). Adjustment to climate change is constrained by arrival date in a long-
distance migrant bird. Nature, 411, 296.
Caswell, H. (1989). Analysis of life table response experiments I. Decomposition of effects on population
growth rate. Ecological Modelling, 46, 221-237.
Caswell, H. (2000). Prospective and retrospective perturbation analyses: their roles in conservation
biology. Ecology, 81, 619-627.
Caswell, H. (2001). Matrix population models. Sinauer Associates Inc., Sunderland, USA.
Caswell, H. (2007). Sensitivity analysis of transient population dynamics. Ecology letters, 10, 1-15.
Choquet, R., Rouan, L. & Pradel, R. (2009). Program E-SURGE: a software application for fitting multievent
models. In: Modeling demographic processes in marked populations. Springer New York, USA,
pp. 845-865.
Clutton–Brock, T. & Coulson, T. (2002). Comparative ungulate dynamics: the devil is in the detail.
Philosophical Transactions of the Royal Society of London. Series B: Biological Sciences, 357,
1285-1298.
Collins, M., Knutti, R., Arblaster, J., Dufresne, J.-L., Fichefet, T., Friedlingstein, P. et al. (2013). Long-term
climate change: projections, commitments and irreversibility. In: Climate Change 2013-The
Physical Science Basis: Contribution of Working Group I to the Fifth Assessment Report of the
Intergovernmental Panel on Climate Change. Cambridge University Press Cambridge, UK, pp.
1029-1136.
Cooke, F., Rockwell, R.F. & Lank, D.B. (1995). Body size. In: The Snow Geese of La Pérouse Bay (ed.
Perrins, CM). Oxford University Press Oxford, UK, pp. 248-258.
Cooper, E.J., Dullinger, S. & Semenchuk, P. (2011). Late snowmelt delays plant development and results
in lower reproductive success in the High Arctic. Plant science, 180, 157-167.
Curry, J.A., Schramm, J.L. & Ebert, E.E. (1995). Sea ice-albedo climate feedback mechanism. Journal of
Climate, 8, 240-247.
Davies, J.C., Rockwell, R. & Cooke, F. (1988). Body-size variation and fitness components in Lesser Snow
Geese (Chen caerulescens caerulescens). The Auk, 105, 639-648.

25
Diffenbaugh, N.S., Singh, D., Mankin, J.S., Horton, D.E., Swain, D.L., Touma, D. et al. (2017). Quantifying
the influence of global warming on unprecedented extreme climate events. Proceedings of the
National Academy of Sciences, 114, 4881-4886.
Drent, R. & Daan, S. (1980). The prudent parent: energetic adjustments in avian breeding. Ardea, 55,
225-252.
Dunne, J.A., Williams, R.J. & Martinez, N.D. (2002). Food-web structure and network theory: the role of
connectance and size. Proceedings of the National Academy of Sciences, 99, 12917-12922.
Easterling, D.R., Meehl, G.A., Parmesan, C., Changnon, S.A., Karl, T.R. & Mearns, L.O. (2000). Climate
extremes: observations, modeling, and impacts. Science, 289, 2068-2074.
Ellner, S.P., Childs, D.Z. & Rees, M. (2016). Data-driven modelling of structured populations. Springer,
Basel, Switzerland.
Elmendorf, S.C., Henry, G.H., Hollister, R.D., Björk, R.G., Bjorkman, A.D., Callaghan, T.V. et al. (2012).
Global assessment of experimental climate warming on tundra vegetation: heterogeneity over
space and time. Ecology letters, 15, 164-175.
Ezard, T.H., Bullock, J.M., Dalgleish, H.J., Millon, A., Pelletier, F., Ozgul, A. et al. (2010). Matrix models for
a changeable world: the importance of transient dynamics in population management. Journal of
Applied Ecology, 47, 515-523.
Festa-Bianchet, M., Gaillard, J.-M. & Jorgenson, J.T. (1998). Mass-and density-dependent reproductive
success and reproductive costs in a capital breeder. The American Naturalist, 152, 367-379.
Festa-Bianchet, M., Jorgenson, J.T., Bérubé, C.H., Portier, C. & Wishart, W.D. (1997). Body mass and
survival of bighorn sheep. Canadian Journal of Zoology, 75, 1372-1379.
Fischer, E.M. & Knutti, R. (2015). Anthropogenic contribution to global occurrence of heavy-precipitation
and high-temperature extremes. Nature Climate Change, 5, 560-564.
Forchhammer, M.C., Schmidt, N.M., Høye, T.T., Berg, T.B., Hendrichsen, D.K. & Post, E. (2008). Population
dynamical responses to climate change. Advances in Ecological Research, 40, 391-419.
Forslund, P. & Larsson, K. (1992). Age-related reproductive success in the barnacle goose. Journal of
Animal Ecology, 61, 195-204.
Foster, J. (1989). The significance of the date of snow disappearance on the Arctic tundra as a possible
indicator of climate change. Arctic and Alpine Research, 21, 60-70.
Fowler, C.W. (1987). A review of density dependence in populations of large mammals. In: Current
mammalogy. Springer Boston, USA, pp. 401-441.
Fox, A.D. & Abraham, K.F. (2017). Why geese benefit from the transition from natural vegetation to
agriculture. Ambio, 46, 188-197.
Fox, A.D. & Madsen, J. (2017). Threatened species to super-abundance: The unexpected international
implications of successful goose conservation. Ambio, 46, 179-187.
Fuglei, E., Øritsland, N.A. & Prestrud, P. (2003). Local variation in arctic fox abundance on Svalbard,
Norway. Polar Biology, 26, 93-98.
Gaillard, J.-M. & Yoccoz, N.G. (2003). Temporal variation in survival of mammals: a case of environmental
canalization? Ecology, 84, 3294-3306.
26
Gaston, A.J., Gilchrist, H.G. & Hipfner, J.M. (2005). Climate change, ice conditions and reproduction in an
Arctic nesting marine bird: Brunnich's guillemot (Uria lomvia L.). Journal of Animal Ecology, 74,
832-841.
Gauthier, G., Bêty, J., Giroux, J.-F. & Rochefort, L. (2004). Trophic interactions in a high arctic snow goose
colony. Integrative comparative biology, 44, 119-129.
Gauthier, G., Bêty, J. & Hobson, K.A. (2003). Are greater snow geese capital breeders? New evidence
from a stable‐isotope model. Ecology, 84, 3250-3264.
Gunn, A. & Skogland, T. (1997). Responses of caribou and reindeer to global warming. In: Global change
and arctic terrestrial ecosystems. Springer New York, USA, pp. 189-200.
Hahn, S., Loonen, M.J.J.E. & Klaassen, M. (2011). The reliance on distant resources for egg formation in
high Arctic breeding barnacle geese Branta leucopsis. Journal of Avian Biology, 42, 159-168.
Hansen, B.B., Gamelon, M., Albon, S.D., Lee, A.M., Stien, A., Irvine, R.J. et al. (2019). More frequent
extreme climate events stabilize reindeer population dynamics. Nature communications, 10,
1616.
Hansen, B.B., Grøtan, V., Aanes, R., Sæther, B.-E., Stien, A., Fuglei, E. et al. (2013). Climate events
synchronize the dynamics of a resident vertebrate community in the high Arctic. Science, 339,
313-315.
Hansen, B.B., Henriksen, S., Aanes, R. & Sæther, B.-E. (2007). Ungulate impact on vegetation in a two-
level trophic system. Polar Biology, 30, 549-558.
Hanssen-Bauer, I., Førland, E.J., Hisdal, H., Mayer, S., Sandø, A.B. & Sorteberg, A. (2019). Climate in
Svalbard 2100 – a knowledge base for climate adaptation. In: NCCS report. Norwegian
Environment Agency (Miljødirektoratet) Norway.
Hastings, A. (2004). Transients: the key to long-term ecological understanding? Trends in Ecology &
Evolution, 19, 39-45.
Hessen, D.O., Tombre, I.M., van Geest, G. & Alfsnes, K. (2017). Global change and ecosystem connectivity:
How geese link fields of central Europe to eutrophication of Arctic freshwaters. Ambio, 46, 40-
47.
Huysentruyt, F., Verschelde, P., Van Daele, T., Casaer, J., Neukermans, A. & Adriaens, T. (2020).
Management options for a resident Barnacle Goose (Branta leucopsis) population in Flander. In:
Reports of the Research Institute for Nature and Forest 2020 (1). Research Institute for Nature
and Forest Brussels, Belgium.
Høye, T.T., Post, E., Schmidt, N.M., Trøjelsgaard, K. & Forchhammer, M.C. (2013). Shorter flowering
seasons and declining abundance of flower visitors in a warmer Arctic. Nature Climate Change, 3,
759.
Ims, R., Ehrich, D., Forbes, B., Huntley, B., Walker, D. & Wookey, P.A. (2013a). Arctic Biodiversity
Assessment. Status and trends in Arctic biodiversity.: Terrestrial Ecosystems.–Chapter 12. In:
Arctic Biodiversity Assessment. Status and trends in Arctic biodiversity. Conservation of Arctic
Flora and Fauna (CAFF) Norway, p. 384.
Ims, R.A. & Fuglei, E. (2005). Trophic interaction cycles in tundra ecosystems and the impact of climate
change. Bioscience, 55, 311-322.

27
Ims, R.A., Henden, J.-A., Thingnes, A.V. & Killengreen, S.T. (2013b). Indirect food web interactions
mediated by predator–rodent dynamics: relative roles of lemmings and voles. Biology letters, 9,
20130802.
Ims, R.A., Jepsen, J.U., Stien, A. & Yoccoz, N.G. (2013c). Science plan for COAT: climate-ecological
observatory for Arctic Tundra. In: Fram Centre Report Series 1. Fram Centre Norway, p. 177.
Inger, R., Harrison, X.A., Ruxton, G.D., Newton, J., Colhoun, K., Gudmundsson, G.A. et al. (2010). Carry‐
over effects reveal reproductive costs in a long‐distance migrant. Journal of Animal Ecology, 79,
974-982.
IPCC (2014). Climate Change 2013: The physical science basis: Working group I contribution to the fifth
assessment report of the Intergovernmental Panel on Climate Change. Cambridge University
Press, Cambridge, UK.
Jenouvrier, S. (2013). Impacts of climate change on avian populations. Global Change Biology, 19, 2036-
2057.
Jenouvrier, S., Caswell, H., Barbraud, C., Holland, M., Strœve, J. & Weimerskirch, H. (2009). Demographic
models and IPCC climate projections predict the decline of an emperor penguin population.
Proceedings of the National Academy of Sciences, 106, 1844-1847.
Jensen, G.H., Madsen, J., Johnson, F.A. & Tamstorf, M.P. (2014). Snow conditions as an estimator of the
breeding output in high-Arctic pink-footed geese Anser brachyrhynchus. Polar Biology, 37, 1-14.
Jensen, G.H., Madsen, J., Nagy, S. & Lewis, M. (2018). AEWA international single species management
plan for the barnacle goose (Branta leucopsis): Russia/Germany & Netherlands population, East
Greenland/Scotland & Ireland population, Svalbard/South-west Scotland population. AEWA
Technical Series No. 70 Bonn, Germany.
Jiguet, F., Gadot, A.S., Julliard, R., Newson, S.E. & Couvet, D. (2007). Climate envelope, life history traits
and the resilience of birds facing global change. Global Change Biology, 13, 1672-1684.
Jongejans, E., De Kroon, H., Tuljapurkar, S. & Shea, K. (2010). Plant populations track rather than buffer
climate fluctuations. Ecology Letters, 13, 736-743.
Jönsson, K.I. (1997). Capital and income breeding as alternative tactics of resource use in reproduction.
Oikos, 78, 57-66.
Karlsen, S.R., Elvebakk, A., Høgda, K.A. & Grydeland, T. (2014). Spatial and temporal variability in the
onset of the growing season on Svalbard, Arctic Norway—measured by MODIS-NDVI satellite
data. Remote Sensing, 6, 8088-8106.
Kerby, J. & Post, E. (2013). Capital and income breeding traits differentiate trophic match–mismatch
dynamics in large herbivores. Philosophical Transactions of the Royal Society B: Biological
Sciences, 368, 20120484.
Kery, M., Madsen, J. & Lebreton, J.D. (2006). Survival of Svalbard pink‐footed geese Anser
brachyrhynchus in relation to winter climate, density and land‐use. Journal of Animal Ecology,
75, 1172-1181.
Koons, D.N., Grand, J.B., Zinner, B. & Rockwell, R.F. (2005). Transient population dynamics: relations to
life history and initial population state. Ecological modelling, 185, 283-297.
Koons, D.N., Gunnarsson, G., Schmutz, J.M. & Rotella, J.J. (2014). Drivers of waterfowl population
dynamics: from teal to swans. Wildfowl, 4, 169–191.
28
Koons, D.N., Iles, D.T., Schaub, M. & Caswell, H. (2016). A life‐history perspective on the demographic
drivers of structured population dynamics in changing environments. Ecology letters, 19, 1023-
1031.
Lameris, T.K., Scholten, I., Bauer, S., Cobben, M.M., Ens, B.J. & Nolet, B.A. (2017). Potential for an Arctic‐
breeding migratory bird to adjust spring migration phenology to Arctic amplification. Global
Change Biology, 23, 4058-4067.
Lameris, T.K., van der Jeugd, H.P., Eichhorn, G., Dokter, A.M., Bouten, W., Boom, M.P. et al. (2018). Arctic
geese tune migration to a warming climate but still suffer from a phenological mismatch. Current
Biology, 28, 2467-2473.
Lande, R., Engen, S. & Saether, B.-E. (2003). Stochastic population dynamics in ecology and conservation.
Oxford University Press, Oxford, UK.
Lande, R., Engen, S., Sæther, B.-E. & Coulson, T. (2006). Estimating density dependence from time series
of population age structure. The American Naturalist, 168, 76-87.
Lande, R., Engen, S., Sæther, B.-E., Filli, F., Matthysen, E. & Weimerskirch, H. (2002). Estimating density
dependence from population time series using demographic theory and life-history data. The
American Naturalist, 159, 321-337.
Larsson, K. & Forslund, P. (1994). Population dynamics of the barnacle goose Branta leucopsis in the
Baltic area: density-dependent effects on reproduction. Journal of Animal Ecology, 63, 954-962.
Larsson, K., Van der Jeugd, H.P., Van der Veen, I.T. & Forslund, P. (1998). Body size declines despite
positive directional selection on heritable size traits in a barnacle goose population. Evolution,
52, 1169-1184.
Legagneux, P., Gauthier, G., Lecomte, N., Schmidt, N.M., Reid, D., Cadieux, M. et al. (2014). Arctic
ecosystem structure and functioning shaped by climate and herbivore body size. Nature Climate
Change, 4, 379-383.
Loonen, M., Larsson, K., Van der Veen, I. & Forslund, P. (1997a). Goose Breeding Ecology: Overcoming
Successive Hurdles to Raise Goslings. University of Groningen Groningen, the Netherlands, pp.
136-153.
Loonen, M.J.J.E., Oosterbeek, K. & Drent, R. (1997b). Variation in growth of young and adult size in
barnacle geese Branta leucopsis: evidence for density dependence. Ardea, 85, 177-192.
Loonen, M.J.J.E., Tombre, I.M. & Mehlum, F. (1998). Development of an arctic barnacle goose colony:
interactions between density and predation. Norsk Polarinstitutt Skrifter, 200, 67-80.
Maldonado‐Chaparro, A.A., Blumstein, D.T., Armitage, K.B. & Childs, D.Z. (2018). Transient LTRE analysis
reveals the demographic and trait‐mediated processes that buffer population growth. Ecology
letters, 21, 1693-1703.
Marra, P.P., Studds, C.E., Wilson, S., Sillett, T.S., Sherry, T.W. & Holmes, R.T. (2015). Non-breeding season
habitat quality mediates the strength of density-dependence for a migratory bird. Proceedings of
the Royal Society B: Biological Sciences, 282, 20150624.
McLean, N.M., van der Jeugd, H.P., Van Turnhout, C.A., Lefcheck, J.S. & Van de Pol, M. (2020). Reduced
avian body condition due to global warming has little reproductive or population consequences.
Oikos.

29
Molnár, P.K., Derocher, A.E., Thiemann, G.W. & Lewis, M.A. (2010). Predicting survival, reproduction and
abundance of polar bears under climate change. Biological Conservation, 143, 1612-1622.
Morrissette, M., Bêty, J., Gauthier, G., Reed, A. & Lefebvre, J. (2010). Climate, trophic interactions, density
dependence and carry‐over effects on the population productivity of a migratory Arctic
herbivorous bird. Oikos, 119, 1181-1191.
Nolet, B.A., Schreven, K.H., Boom, M.P. & Lameris, T.K. (2019). Contrasting effects of the onset of spring
on reproductive success of Arctic-nesting geese. The Auk, 137.
Norris, D.R. (2005). Carry‐over effects and habitat quality in migratory populations. Oikos, 109, 178-
186.
Owen, M. & Black, J.M. (1989). Factors affecting the survival of Barnacle Geese on migration from the
breeding grounds. Journal of Animal Ecology, 58, 603-617.
Ozgul, A., Childs, D.Z., Oli, M.K., Armitage, K.B., Blumstein, D.T., Olson, L.E. et al. (2010). Coupled
dynamics of body mass and population growth in response to environmental change. Nature,
466, 482.
Ozgul, A., Tuljapurkar, S., Benton, T.G., Pemberton, J.M., Clutton-Brock, T.H. & Coulson, T. (2009). The
Dynamics of Phenotypic Change and the Shrinking Sheep of St. Kilda. Science, 325, 464-467.
Paniw, M., James, T., Archer, C.R., Roemer, G., Levin, S., Compagnoni, A. et al. (2019). Global analysis
reveals complex demographic responses of mammals to climate change. bioRxiv.
Parmesan, C. (2006). Ecological and evolutionary responses to recent climate change. Annu. Rev. Ecol.
Evol. Syst., 37, 637-669.
Pedersen, Å.Ø., Stien, J., Albon, S., Fuglei, E., Isaksen, K., Liston, G. et al. (2019). Climate-Ecological
Observatory for Arctic Tundra (COAT). In: SESS Report 2019. Norwegian Polar Institute Tromsø,
Norway.
Peeters, B., Pedersen, Å.Ø., Loe, L.E., Isaksen, K., Veiberg, V., Stien, A. et al. (2019). Spatiotemporal
patterns of rain-on-snow and basal ice in high Arctic Svalbard: detection of a climate-cryosphere
regime shift. Environmental Research Letters, 14, 015002.
Pelletier, F., Clutton-Brock, T., Pemberton, J., Tuljapurkar, S. & Coulson, T. (2007). The evolutionary
demography of ecological change: linking trait variation and population growth. Science, 315,
1571-1574.
Piao, S., Wang, X., Park, T., Chen, C., Lian, X., He, Y. et al. (2019). Characteristics, drivers and feedbacks of
global greening. Nature Reviews Earth & Environment, 1, 1-14.
Post, E., Bhatt, U.S., Bitz, C.M., Brodie, J.F., Fulton, T.L., Hebblewhite, M. et al. (2013). Ecological
consequences of sea-ice decline. Science, 341, 519-524.
Post, E., Forchhammer, M.C., Bret-Harte, M.S., Callaghan, T.V., Christensen, T.R., Elberling, B. et al. (2009).
Ecological dynamics across the Arctic associated with recent climate change. Science, 325,
1355-1358.
Post, E. & Stenseth, N.C. (1999). Climatic variability, plant phenology, and northern ungulates. Ecology,
80, 1322-1339.
Prop, J., Aars, J., Bårdsen, B.-J., Hanssen, S.A., Bech, C., Bourgeon, S. et al. (2015). Climate change and
the increasing impact of polar bears on bird populations. Frontiers in Ecology and Evolution, 3.
30
Prop, J. & Deerenberg, C. (1991). Spring staging in brent geese Branta bernicla: feeding constraints and
the impact of diet on the accumulation of body reserves. Oecologia, 87, 19-28.
Prop, J., Eerden, M.R. & Drent, R.H. (1985). Reproductive success of the barnacle goose Branta leucopsis
in relation to food exploitation on the breeding grounds, western Spitsbergen. Norsk
Polarinstitutt Skrifter, 181, 87-117.
Rahmstorf, S. & Coumou, D. (2011). Increase of extreme events in a warming world. Proceedings of the
National Academy of Sciences, 108, 17905-17909.
Reed, T.E., Grøtan, V., Jenouvrier, S., Sæther, B.-E. & Visser, M.E. (2013). Population growth in a wild bird
is buffered against phenological mismatch. Science, 340, 488-491.
Rees, M. & Ellner, S.P. (2009). Integral projection models for populations in temporally varying
environments. Ecological Monographs, 79, 575-594.
Robinson, R.A., Crick, H.Q., Learmonth, J.A., Maclean, I., Thomas, C.D., Bairlein, F. et al. (2009). Travelling
through a warming world: climate change and migratory species. Endangered Species Research,
7, 87-99.
Schaub, M. & Abadi, F. (2011). Integrated population models: a novel analysis framework for deeper
insights into population dynamics. Journal of Ornithology, 152, 227-237.
Sedinger, J.S. & Alisauskas, R.T. (2014). Cross-seasonal effects and the dynamics of waterfowl
populations. Wildfowl, 277–304.
Sedinger, J.S., Schamber, J.L., Ward, D.H., Nicolai, C.A. & Conant, B. (2011). Carryover effects associated
with winter location affect fitness, social status, and population dynamics in a long-distance
migrant. The American Naturalist, 178, E110-E123.
Serreze, M.C. & Barry, R.G. (2011). Processes and impacts of Arctic amplification: A research synthesis.
Global Planetary Change, 77, 85-96.
Shipley, B. (2000). A new inferential test for path models based on directed acyclic graphs. Structural
Equation Modeling, 7, 206-218.
Shipley, B. (2009). Confirmatory path analysis in a generalized multilevel context. Ecology, 90, 363-368.
Stahl, J., Tolsma, P.H., Loonen, M.J.J.E. & Drent, R.H. (2001). Subordinates explore but dominants profit:
resource competition in high Arctic barnacle goose flocks. Animal Behaviour, 61, 257-264.
Stearns, S.C. (1989). Trade-offs in life-history evolution. Functional ecology, 3, 259-268.
Stearns, S.C. (1992). The evolution of life histories. Oxford University Press, Oxford, UK.
Stenseth, C.N. (1999). Population cycles in voles and lemmings: density dependence and phase
dependence in a stochastic world. Oikos, 427-461.
Sæther, B.-E., Grøtan, V., Engen, S., Coulson, T., Grant, P.R., Visser, M.E. et al. (2016). Demographic
routes to variability and regulation in bird populations. Nature Communications, 7.
Søreide, J.E., Leu, E., Berge, J., Graeve, M. & Falk‐Petersen, S. (2010). Timing of blooms, algal food quality
and Calanus glacialis reproduction and growth in a changing Arctic. Global change biology, 16,
3154-3163.
Tuljapurkar, S.D. (1982). Population dynamics in variable environments. III. Evolutionary dynamics of r-
selection. Theoretical Population Biology, 21, 141-165.

31
Turchin, P. (1995). Population regulation: old arguments and a new synthesis. In: Population Dynamics:
New Approaches and Synthesis (eds. Cappuccino, N & Price, PW). Academic Press Cambridge,
USA, pp. 19-40.
Van der Wal, R. (2006). Do herbivores cause habitat degradation or vegetation state transition? Evidence
from the tundra. Oikos, 114, 177-186.
Van der Wal, R., van Lieshout, S.M. & Loonen, M.J. (2001). Herbivore impact on moss depth, soil
temperature and arctic plant growth. Polar Biology, 24, 29-32.
Varpe, Ø., Jørgensen, C., Tarling, G.A. & Fiksen, Ø. (2009). The adaptive value of energy storage and
capital breeding in seasonal environments. Oikos, 118, 363-370.
Vindenes, Y., Engen, S. & Sæther, B.-E. (2011). Integral projection models for finite populations in a
stochastic environment. Ecology, 92, 1146-1156.


Paper I

J Anim Ecol. 2019;00:1–11. wileyonlinelibrary.com/journal/jane | 1© 2019 The Authors. Journal of Animal Ecology © 2019 British Ecological Society
Received: 1 November 2018 | Accepted: 30 March 2019
DOI: 10.1111/1365-2656.13001
R E S E A R C H A R T I C L E
Density-dependent population dynamics of a high Arctic capital breeder, the barnacle goose
Kate Layton-Matthews 1 | Maarten J. J. E. Loonen 2 | Brage Bremset Hansen 1 | Christophe F. D. Coste 1 | Bernt-Erik Sæther 1 | Vidar Grøtan 1
1 Centre for Biodiversity Dynamics, Department of Biology , Norwegian University of Science and Technology , Trondheim , Norway
2 Arctic Centre , University of Groningen , Groningen , The Netherlands
Correspondence Kate Layton-Matthews Email: [email protected]
Funding information The Netherlands Arctic and Polar Program ; NWO ; Ministry of Foreign Affairs, European Union supported FP7-project FRAGILE ; University of Groningen ; Research Council of Norway , Grant/Award Number: 223257 , 244647 , 273451 and 276080
Handling Editor: David N Koons
Abstract 1 . Density regulation of the population growth rate occurs through negative feed-
backs on underlying vital rates, in response to increasing population size. Here, we examine in a capital breeder how vital rates of different life-history stages, their elasticities and population growth rates are affected by changes in popula-tion size.
2 . We developed an integrated population model for a local population of Svalbard barnacle geese, Branta leucopsis, using counts, reproductive data and individual-based mark–recapture data (1990–2017) to model age class-specific survival, re-production and number of individuals. Based on these estimates, we quantified the changes in demographic structure and the effect of population size on age class-specific vital rates and elasticities, as well as the population growth rate.
3 . Local density regulation at the breeding grounds acted to reduce population growth through negative effects on reproduction; however, population size could not explain substantial variation in survival rates, although there was some sup-port for density-dependent first-year survival.
4 . With the use of prospective perturbation analysis of the density-dependent pro-jection matrix, we show that the elasticities to different vital rates changed as population size increased. As population size approached carrying capacity, the influence of reproductive rates and early-life survival on the population growth rate was reduced, whereas the influence of adult survival increased. A retrospec-tive perturbation analysis revealed that density dependence resulted in a positive contribution of reproductive rates, and a negative contribution of the numbers of individuals in the adult age class, to the realised population growth rate.
5 . The patterns of density dependence in this population of barnacle geese were different from those recorded in income breeding birds, where density regula-tion mainly occurs through an effect on early-life survival. This indicates that the population dynamics of capital breeders, such as the barnacle goose, are likely to be more reproduction-driven than is the case for income breeders.
K E Y W O R D S
barnacle geese , capital breeder , density dependence , integrated population model , perturbation analysis , population dynamics
2 | Journal of Animal Ecology LAYTON-MATTHEWS ET AL.
1 | INTRODUC TION
Population dynamics are determined by a combination of density de-pendence and environmental stochasticity, acting through an influ-ence on species’ vital rates (Lande, Engen, & Saether, 2003 ; Turchin, 1995 ), thereby controlling the underlying mechanisms regulating and limiting population growth (Grant & Benton, 2000 ; Ricklefs, 1983 ). Consequently, density dependence has received much attention as a fundamental mechanism driving population dynamics (Lande et al., 2002 ; Ricklefs, 2000 ). Gaining a mechanistic understanding of how density dependence drives population fluctuations requires a consid-eration of demographic structure (Coulson et al., 2001 ; Lande et al., 2002 ). For long-lived species, the mechanisms through which den-sity dependence acts are often largely determined by age-specific variation in life history (Fowler, 1981 ; Lande et al., 2002 ). For exam-ple, younger age classes may be more vulnerable to density-depen-dent effects (Gaillard & Yoccoz, 2003 ). Alternatively, older breeding individuals may be more resource demanding and hence can suffer more from resource competition (Gaillard, Festa-Bianchet, & Yoccoz, 1998 ; Lok, Overdijk, Tinbergen, & Piersma, 2013 ). Ignoring this vari-ation among age classes in their response to density can ultimately bias inferences about underlying processes affecting fluctuations in population size (Gamelon et al., 2016 ).
Accurately estimating the strength of density dependence therefore requires long time series of high-quality demographic data (Both, Visser, & Verboven, 1999 ; Coulson et al., 2001 ) as well as a robust modelling approach to analyse them, accounting for all potential sources of error (Freckleton, Watkinson, Green, & Sutherland, 2006 ; Shenk, White, & Burnham, 1998 ). A challenge in studies of population dynamics is access to data covering a suf-ficiently wide range of population sizes for obtaining unbiased es-timates of density-dependent effects (Brook & Bradshaw, 2006 ). Populations establishing themselves in new areas represent a unique opportunity for analysing density-dependent processes (Nicoll, Jones, & Norris, 2003 ; Redfield, 1973 ). However, exam-ples are few, since long-term studies tend to focus on well-estab-lished populations. Here, we take the rare advantage of analysing the dynamics of a high Arctic barnacle goose, Branta leucopsis , population that colonised Kongsfjorden, Svalbard, in the 1980s (Loonen, Tombre, & Mehlum, 1998 ; Owen, 1984 ). Barnacle geese are predominantly capital breeders, partly due to the unpredict-ability of environmental conditions at the high Arctic breeding grounds. Although the “degree of capital breeding” can vary, de-pending on environmental conditions (Hobson, Sharp, Jefferies, Rockwell, & Abraham, 2011 ), they utilise resources accumulated during the spring migration to initiate breeding (Hahn, Loonen, & Klaassen, 2011 ). The inter-annual environmental stochasticity in the high Arctic can lead to resource competition and potentially strong density-dependent effects (Bruggeman, Swem, Andersen, Kennedy, & Nigro, 2015 ).
In a comparative study of age-structured density-dependent ef-fects in other bird species, Sæther et al. ( 2016 ) revealed a remark-ably simple pattern. They found that density dependence mainly
acted through an influence on survival, especially during the first year. Furthermore, the relative influence of survival rates of older in-dividuals on the population growth rate, expressed by the elasticity (Caswell, 2001 ), increased when population size approached carry-ing capacity. However, the generality of these findings still remains uncertain because all species included in the analyses can be char-acterised as income breeders to varying degrees (Durant, Massemin, Thouzeau, & Handrich, 2000 ; Meijer & Drent, 1999 ), where energy required for reproduction is acquired at the breeding grounds (Drent & Daan, 1980 ).
We examine how variation in population size affects different vital rates of the capital breeding barnacle geese. This high Arctic mi-grant must bring sufficient amounts of endogenous reserves to the breeding grounds to meet the energetic requirements for egg laying and incubation (Hahn et al., 2011 ). Using 28 years (1990–2017) of population counts and individual-based mark–recapture data from a local population in Svalbard, we develop an integrated population model (IPM (Abadi, Gimenez, Arlettaz, & Schaub, 2010 ; Schaub & Abadi, 2011 )) to investigate patterns of density regulation and changes in demographic rates and age structure. By parameterising a post-breeding, age-structured population projection matrix, we quantify the elasticities of the population growth rate to density-dependent demographic rates across a range of population sizes, using a prospective perturbation analysis (Caswell, 2001 ). We also quantify the contributions of vital rates and population structure to the realised population growth rate, using a transient retrospective perturbation analysis (Caswell, 2007 ; Koons, Iles, Schaub, & Caswell, 2016 ).
2 | MATERIAL S AND METHODS
2.1 | Study species and site
The study population of barnacle geese breed and rear their young in Kongsfjorden, Svalbard, close to the settlement of Ny-Ålesund (78°55 ' N, 11°56 ' S). They are long-lived birds (up to 28 years) and form monogamous breeding pairs. During the summer breeding season (May to September), they breed on islands in the fjord and rear their young along the coastline later in the season. Successful breeding pairs lay a single clutch of three to five eggs on average during June and offspring fledge in August (Owen & Black, 1989 ). The total flyway Svalbard population winters at Solway Firth, UK, and migrates to breeding sites across Svalbard in summer, via spring staging areas along the coast of mainland Norway.
2.2 | Data collection
Following their colonisation in the 1980s, a local mark–recapture programme was initiated in 1990 where individuals are caught and marked with unique colour bands and metal identification rings. Sex is determined by cloacal inspection and behavioural observa-tions (Loonen, Oosterbeek, & Drent, 1997 ). Although fledglings are clearly distinguishable from older birds, thereafter the difference is
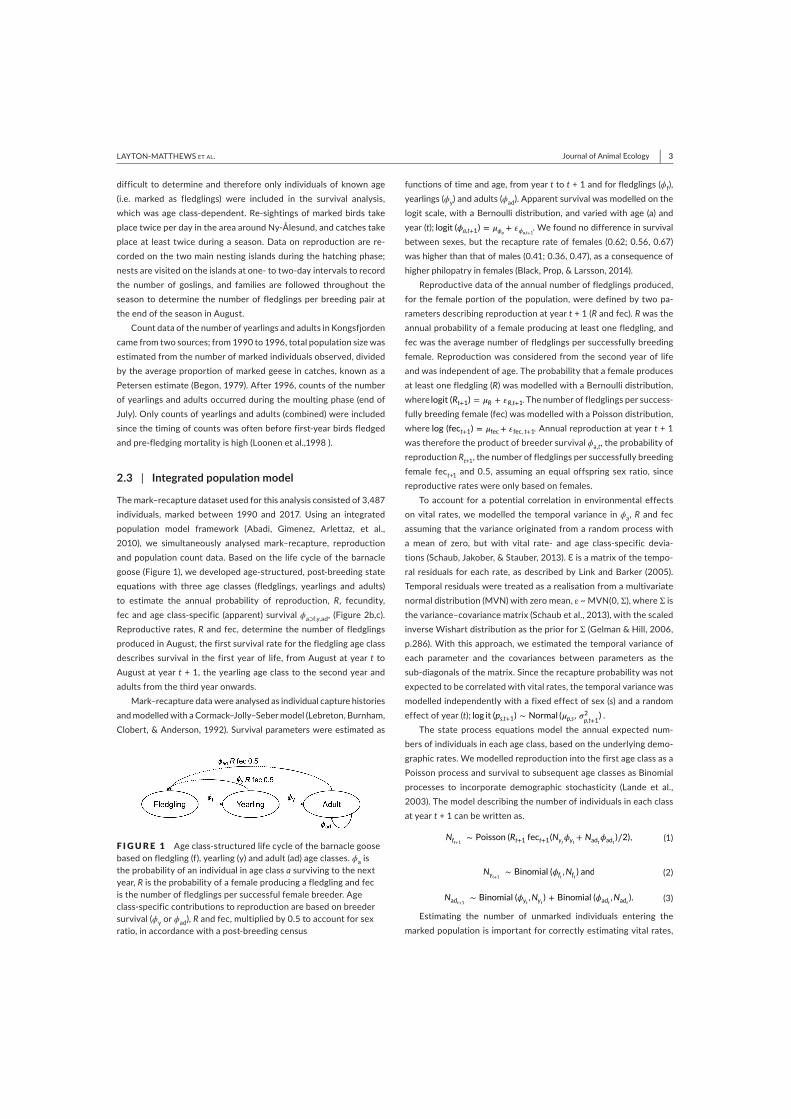
| 3Journal of Animal EcologyLAYTON-MATTHEWS ET AL.
difficult to determine and therefore only individuals of known age (i.e. marked as fledglings) were included in the survival analysis, which was age class-dependent. Re-sightings of marked birds take place twice per day in the area around Ny-Ålesund, and catches take place at least twice during a season. Data on reproduction are re-corded on the two main nesting islands during the hatching phase; nests are visited on the islands at one- to two-day intervals to record the number of goslings, and families are followed throughout the season to determine the number of fledglings per breeding pair at the end of the season in August.
Count data of the number of yearlings and adults in Kongsfjorden came from two sources; from 1990 to 1996, total population size was estimated from the number of marked individuals observed, divided by the average proportion of marked geese in catches, known as a Petersen estimate (Begon, 1979 ). After 1996, counts of the number of yearlings and adults occurred during the moulting phase (end of July). Only counts of yearlings and adults (combined) were included since the timing of counts was often before first-year birds fledged and pre-fledging mortality is high (Loonen et al., 1998 ).
2.3 | Integrated population model
The mark–recapture dataset used for this analysis consisted of 3,487 individuals, marked between 1990 and 2017. Using an integrated population model framework (Abadi, Gimenez, Arlettaz, et al., 2010 ), we simultaneously analysed mark–recapture, reproduction and population count data. Based on the life cycle of the barnacle goose (Figure 1 ), we developed age-structured, post-breeding state equations with three age classes (fledglings, yearlings and adults) to estimate the annual probability of reproduction, R , fecundity, fec and age class-specific (apparent) survival ϕ a⊃f,y,ad , (Figure 2 b,c). Reproductive rates, R and fec, determine the number of fledglings produced in August, the first survival rate for the fledgling age class describes survival in the first year of life, from August at year t to August at year t + 1, the yearling age class to the second year and adults from the third year onwards.
Mark–recapture data were analysed as individual capture histories and modelled with a Cormack–Jolly–Seber model (Lebreton, Burnham, Clobert, & Anderson, 1992 ). Survival parameters were estimated as
functions of time and age, from year t to t + 1 and for fledglings ( ϕ f ), yearlings ( ϕ y ) and adults ( ϕ ad ). Apparent survival was modelled on the logit scale, with a Bernoulli distribution, and varied with age (a) and year ( t ); logit (𝜙a,t+1) = 𝜇𝜙a
+ 𝜀𝜙a,t+1 . We found no difference in survival
between sexes, but the recapture rate of females (0.62; 0.56, 0.67) was higher than that of males (0.41; 0.36, 0.47), as a consequence of higher philopatry in females (Black, Prop, & Larsson, 2014 ).
Reproductive data of the annual number of fledglings produced, for the female portion of the population, were defined by two pa-rameters describing reproduction at year t + 1 ( R and fec). R was the annual probability of a female producing at least one fledgling, and fec was the average number of fledglings per successfully breeding female. Reproduction was considered from the second year of life and was independent of age. The probability that a female produces at least one fledgling ( R ) was modelled with a Bernoulli distribution, where logit (Rt+1) = 𝜇R + 𝜀R,t+1 . The number of fledglings per success-fully breeding female (fec) was modelled with a Poisson distribution, where log (fect+1) = 𝜇fec+ 𝜀fec, t+1 . Annual reproduction at year t + 1 was therefore the product of breeder survival ϕ a, t , the probability of reproduction R t +1 , the number of fledglings per successfully breeding female fec t +1 and 0.5, assuming an equal offspring sex ratio, since reproductive rates were only based on females.
To account for a potential correlation in environmental effects on vital rates, we modelled the temporal variance in ϕ a , R and fec assuming that the variance originated from a random process with a mean of zero, but with vital rate- and age class-specific devia-tions (Schaub, Jakober, & Stauber, 2013 ). Ɛ is a matrix of the tempo-ral residuals for each rate, as described by Link and Barker ( 2005 ). Temporal residuals were treated as a realisation from a multivariate normal distribution (MVN) with zero mean, ε ~ MVN(0, Σ), where Σ is the variance–covariance matrix (Schaub et al., 2013 ), with the scaled inverse Wishart distribution as the prior for Σ (Gelman & Hill, 2006 , p.286). With this approach, we estimated the temporal variance of each parameter and the covariances between parameters as the sub-diagonals of the matrix. Since the recapture probability was not expected to be correlated with vital rates, the temporal variance was modelled independently with a fixed effect of sex ( s ) and a random effect of year ( t ); log it (ps,t+1) ∼ Normal (𝜇p,s, 𝜎
2p,t+1
) . The state process equations model the annual expected num-
bers of individuals in each age class, based on the underlying demo-graphic rates. We modelled reproduction into the first age class as a Poisson process and survival to subsequent age classes as Binomial processes to incorporate demographic stochasticity (Lande et al., 2003 ). The model describing the number of individuals in each class at year t + 1 can be written as.
Estimating the number of unmarked individuals entering the marked population is important for correctly estimating vital rates,
( 1 ) Nft+1∼ Poisson (Rt+1 fect+1(Nyt
𝜙yt+ Nadt
𝜙adt)∕2),
( 2 ) Nyt+1∼ Binomial (𝜙ft
,Nft) and
( 3 ) Nadt+1∼ Binomial (𝜙yt
,Nyt) + Binomial (𝜙adt
,Nadt).
F I G U R E 1 Age class-structured life cycle of the barnacle goose based on fledgling (f), yearling (y) and adult (ad) age classes. ϕ a is the probability of an individual in age class a surviving to the next year, R is the probability of a female producing a fledgling and fec is the number of fledglings per successful female breeder. Age class-specific contributions to reproduction are based on breeder survival ( ϕ y or ϕ ad ), R and fec, multiplied by 0.5 to account for sex ratio, in accordance with a post-breeding census
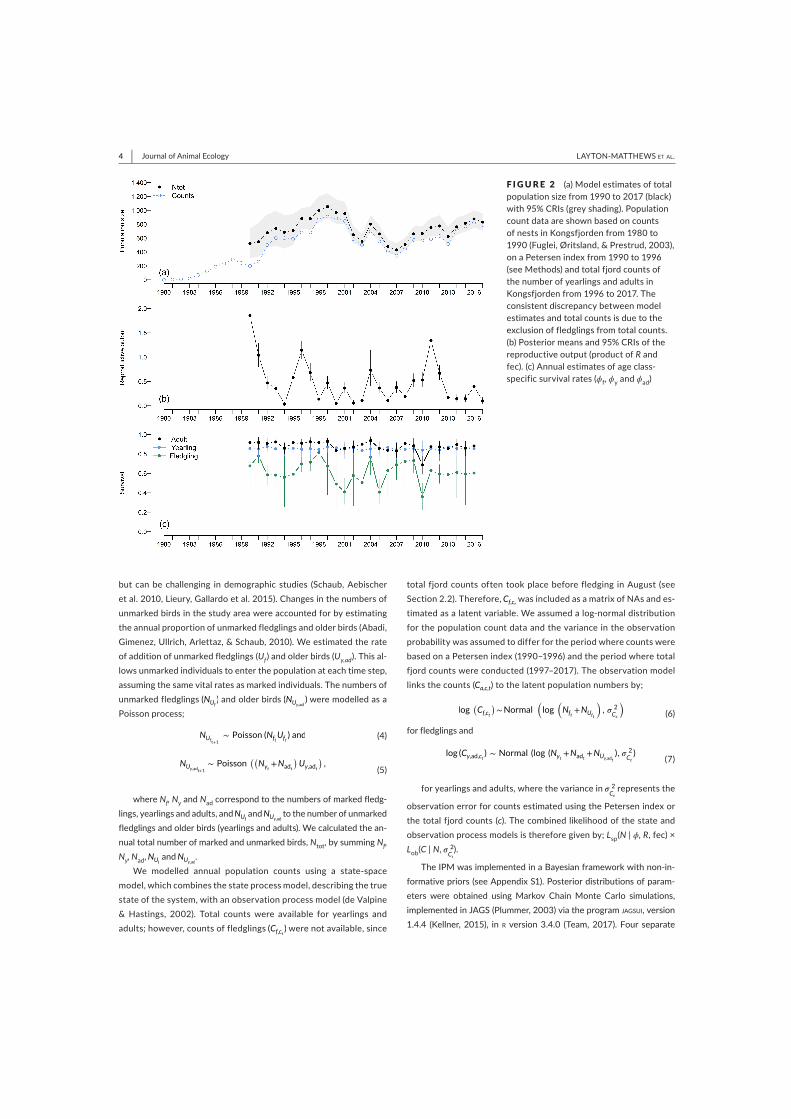
4 | Journal of Animal Ecology LAYTON-MATTHEWS ET AL.
but can be challenging in demographic studies (Schaub, Aebischer et al. 2010 , Lieury, Gallardo et al. 2015 ). Changes in the numbers of unmarked birds in the study area were accounted for by estimating the annual proportion of unmarked fledglings and older birds (Abadi, Gimenez, Ullrich, Arlettaz, & Schaub, 2010 ). We estimated the rate of addition of unmarked fledglings ( U f ) and older birds ( U y,ad ). This al-lows unmarked individuals to enter the population at each time step, assuming the same vital rates as marked individuals. The numbers of unmarked fledglings (NUf
) and older birds (NUy,ad) were modelled as a
Poisson process;
where N f , N y and N ad correspond to the numbers of marked fledg-
lings, yearlings and adults, and NUf and NUy,ad
to the number of unmarked fledglings and older birds (yearlings and adults). We calculated the an-nual total number of marked and unmarked birds, N tot , by summing N f , N y , N ad , NUf
and NUy,ad .
We modelled annual population counts using a state-space model, which combines the state process model, describing the true state of the system, with an observation process model (de Valpine & Hastings, 2002 ). Total counts were available for yearlings and adults; however, counts of fledglings (Cf,ct
) were not available, since
total fjord counts often took place before fledging in August (see Section 2.2). Therefore, Cf,ct
was included as a matrix of NAs and es-timated as a latent variable. We assumed a log-normal distribution for the population count data and the variance in the observation probability was assumed to differ for the period where counts were based on a Petersen index (1990–1996) and the period where total fjord counts were conducted (1997–2017). The observation model links the counts ( Ca,c,t ) to the latent population numbers by;
for fledglings and
for yearlings and adults, where the variance in 𝜎 2
Cc
represents the
observation error for counts estimated using the Petersen index or the total fjord counts ( c ). The combined likelihood of the state and observation process models is therefore given by; L sp ( N | ϕ , R , fec) × L ob ( C | N , 𝜎 2
Cc
).
The IPM was implemented in a Bayesian framework with non-in-formative priors (see Appendix S1 ). Posterior distributions of param-eters were obtained using Markov Chain Monte Carlo simulations, implemented in JAGS (Plummer, 2003 ) via the program JAGSUI , version 1.4.4 (Kellner, 2015 ), in R version 3.4.0 (Team, 2017 ). Four separate
( 4 ) NUft+1
∼ Poisson (NftUft
) and
( 5 ) NUy,adt+1
∼ Poisson((Nyt
+Nadt
)Uy,adt
),
( 6 ) log(Cf,ct
)∼Normal
(log
(Nft
+NUft
), 𝜎 2
Cc
)
( 7 ) log (Cy,ad,ct
) ∼ Normal (log (Nyt+Nadt
+NUy,adt
), 𝜎 2Cc
)
F I G U R E 2 (a) Model estimates of total population size from 1990 to 2017 (black) with 95% CRIs (grey shading). Population count data are shown based on counts of nests in Kongsfjorden from 1980 to 1990 (Fuglei, Øritsland, & Prestrud, 2003 ), on a Petersen index from 1990 to 1996 (see Methods) and total fjord counts of the number of yearlings and adults in Kongsfjorden from 1996 to 2017. The consistent discrepancy between model estimates and total counts is due to the exclusion of fledglings from total counts. (b) Posterior means and 95% CRIs of the reproductive output (product of R and fec). (c) Annual estimates of age class-specific survival rates ( ϕ f , ϕ y and ϕ ad )
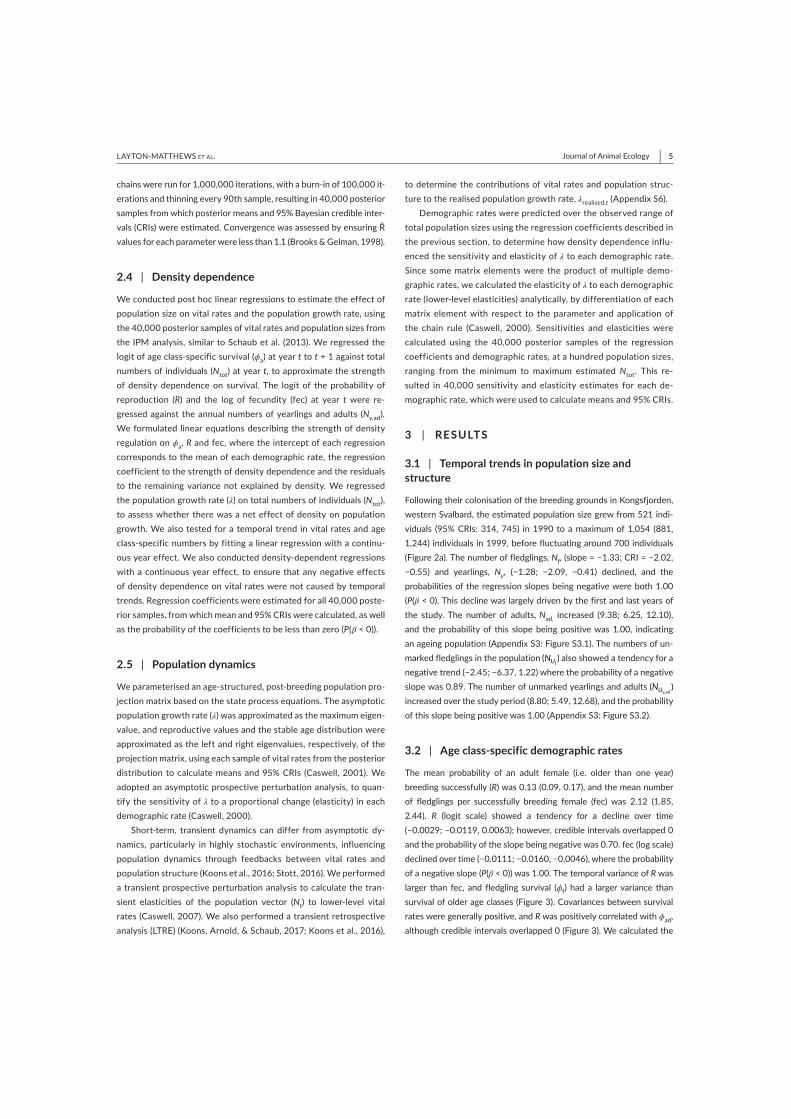
| 5Journal of Animal EcologyLAYTON-MATTHEWS ET AL.
chains were run for 1,000,000 iterations, with a burn-in of 100,000 it-erations and thinning every 90th sample, resulting in 40,000 posterior samples from which posterior means and 95% Bayesian credible inter-vals (CRIs) were estimated. Convergence was assessed by ensuring Ȓ values for each parameter were less than 1.1 (Brooks & Gelman, 1998 ).
2.4 | Density dependence
We conducted post hoc linear regressions to estimate the effect of population size on vital rates and the population growth rate, using the 40,000 posterior samples of vital rates and population sizes from the IPM analysis, similar to Schaub et al. ( 2013 ). We regressed the logit of age class-specific survival ( ϕ a ) at year t to t + 1 against total numbers of individuals ( N tot ) at year t, to approximate the strength of density dependence on survival . The logit of the probability of reproduction ( R ) and the log of fecundity (fec) at year t were re-gressed against the annual numbers of yearlings and adults ( N y ,ad ) . We formulated linear equations describing the strength of density regulation on ϕ a , R and fec, where the intercept of each regression corresponds to the mean of each demographic rate, the regression coefficient to the strength of density dependence and the residuals to the remaining variance not explained by density . We regressed the population growth rate ( λ ) on total numbers of individuals ( N tot ), to assess whether there was a net effect of density on population growth. We also tested for a temporal trend in vital rates and age class-specific numbers by fitting a linear regression with a continu-ous year effect. We also conducted density-dependent regressions with a continuous year effect, to ensure that any negative effects of density dependence on vital rates were not caused by temporal trends. Regression coefficients were estimated for all 40,000 poste-rior samples, from which mean and 95% CRIs were calculated, as well as the probability of the coefficients to be less than zero ( P ( β < 0)).
2.5 | Population dynamics
We parameterised an age-structured, post-breeding population pro-jection matrix based on the state process equations. The asymptotic population growth rate ( λ ) was approximated as the maximum eigen-value, and reproductive values and the stable age distribution were approximated as the left and right eigenvalues, respectively, of the projection matrix, using each sample of vital rates from the posterior distribution to calculate means and 95% CRIs (Caswell, 2001 ). We adopted an asymptotic prospective perturbation analysis, to quan-tify the sensitivity of λ to a proportional change (elasticity) in each demographic rate (Caswell, 2000 ).
Short-term, transient dynamics can differ from asymptotic dy-namics, particularly in highly stochastic environments, influencing population dynamics through feedbacks between vital rates and population structure (Koons et al., 2016 ; Stott, 2016 ). We performed a transient prospective perturbation analysis to calculate the tran-sient elasticities of the population vector ( N t ) to lower-level vital rates (Caswell, 2007 ). We also performed a transient retrospective analysis (LTRE) (Koons, Arnold, & Schaub, 2017 ; Koons et al., 2016 ),
to determine the contributions of vital rates and population struc-ture to the realised population growth rate, λ realised, t (Appendix S6 ).
Demographic rates were predicted over the observed range of total population sizes using the regression coefficients described in the previous section, to determine how density dependence influ-enced the sensitivity and elasticity of λ to each demographic rate. Since some matrix elements were the product of multiple demo-graphic rates, we calculated the elasticity of λ to each demographic rate (lower-level elasticities) analytically, by differentiation of each matrix element with respect to the parameter and application of the chain rule (Caswell, 2000 ). Sensitivities and elasticities were calculated using the 40,000 posterior samples of the regression coefficients and demographic rates, at a hundred population sizes, ranging from the minimum to maximum estimated N tot . This re-sulted in 40,000 sensitivity and elasticity estimates for each de-mographic rate, which were used to calculate means and 95% CRIs.
3 | RESULTS
3.1 | Temporal trends in population size and structure
Following their colonisation of the breeding grounds in Kongsfjorden, western Svalbard, the estimated population size grew from 521 indi-viduals (95% CRIs: 314, 745) in 1990 to a maximum of 1,054 (881, 1,244) individuals in 1999, before fluctuating around 700 individuals (Figure 2 a). The number of fledglings, N f , (slope = −1.33; CRI = −2.02, −0.55) and yearlings, N y , (−1.28; −2.09, −0.41) declined, and the probabilities of the regression slopes being negative were both 1.00 ( P ( β < 0). This decline was largely driven by the first and last years of the study. The number of adults, N ad, increased (9.38; 6.25, 12.10), and the probability of this slope being positive was 1.00, indicating an ageing population (Appendix S3 : Figure S3.1). The numbers of un-marked fledglings in the population (NUf
) also showed a tendency for a negative trend (−2.45; −6.37, 1.22) where the probability of a negative slope was 0.89. The number of unmarked yearlings and adults (NUy,ad
) increased over the study period (8.80; 5.49, 12.68), and the probability of this slope being positive was 1.00 (Appendix S3 : Figure S3.2).
3.2 | Age class-specific demographic rates
The mean probability of an adult female (i.e. older than one year) breeding successfully ( R ) was 0.13 (0.09, 0.17), and the mean number of fledglings per successfully breeding female (fec) was 2.12 (1.85, 2.44). R (logit scale) showed a tendency for a decline over time (−0.0029; −0.0119, 0.0063); however, credible intervals overlapped 0 and the probability of the slope being negative was 0.70. fec (log scale) declined over time (−0.0111; −0.0160, −0.0046), where the probability of a negative slope ( P ( β < 0)) was 1.00. The temporal variance of R was larger than fec, and fledgling survival ( ϕ f ) had a larger variance than survival of older age classes (Figure 3 ). Covariances between survival rates were generally positive, and R was positively correlated with ϕ ad , although credible intervals overlapped 0 (Figure 3 ). We calculated the
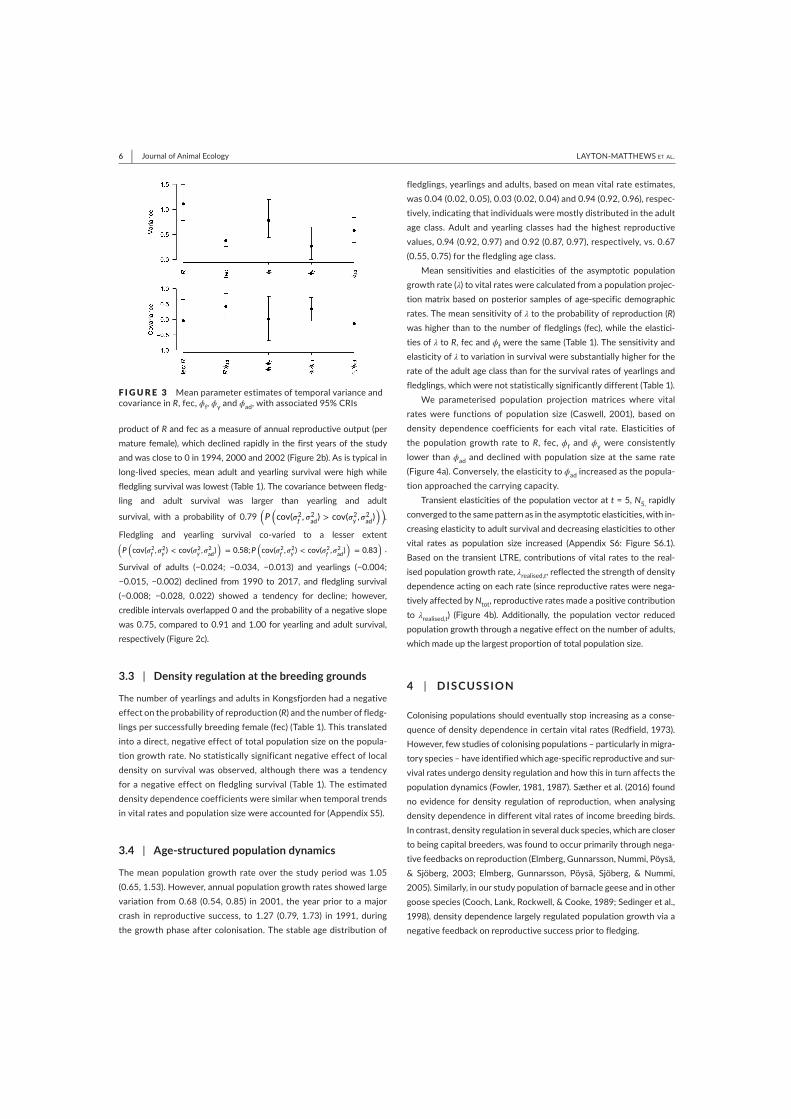
6 | Journal of Animal Ecology LAYTON-MATTHEWS ET AL.
product of R and fec as a measure of annual reproductive output (per mature female), which declined rapidly in the first years of the study and was close to 0 in 1994, 2000 and 2002 (Figure 2 b). As is typical in long-lived species, mean adult and yearling survival were high while fledgling survival was lowest (Table 1 ). The covariance between fledg-ling and adult survival was larger than yearling and adult
survival, with a probability of 0.79 (P(cov(𝜎2
f, 𝜎2
ad) > cov(𝜎2
y,𝜎2
ad)))
.
Fledgling and yearling survival co-varied to a lesser extent (P(cov(𝜎2
f,𝜎2
y) < cov(𝜎2
y,𝜎2
ad))
= 0.58;P(cov(𝜎2
f,𝜎2
y) < cov(𝜎2
f,𝜎2
ad))
= 0.83)
.
Survival of adults (−0.024; −0.034, −0.013) and yearlings (−0.004; −0.015, −0.002) declined from 1990 to 2017, and fledgling survival (−0.008; −0.028, 0.022) showed a tendency for decline; however, credible intervals overlapped 0 and the probability of a negative slope was 0.75, compared to 0.91 and 1.00 for yearling and adult survival, respectively (Figure 2 c).
3.3 | Density regulation at the breeding grounds
The number of yearlings and adults in Kongsfjorden had a negative effect on the probability of reproduction ( R ) and the number of fledg-lings per successfully breeding female (fec) (Table 1 ). This translated into a direct, negative effect of total population size on the popula-tion growth rate. No statistically significant negative effect of local density on survival was observed, although there was a tendency for a negative effect on fledgling survival (Table 1 ). The estimated density dependence coefficients were similar when temporal trends in vital rates and population size were accounted for (Appendix S5 ).
3.4 | Age-structured population dynamics
The mean population growth rate over the study period was 1.05 (0.65, 1.53). However, annual population growth rates showed large variation from 0.68 (0.54, 0.85) in 2001, the year prior to a major crash in reproductive success, to 1.27 (0.79, 1.73) in 1991, during the growth phase after colonisation. The stable age distribution of
fledglings, yearlings and adults, based on mean vital rate estimates, was 0.04 (0.02, 0.05), 0.03 (0.02, 0.04) and 0.94 (0.92, 0.96), respec-tively, indicating that individuals were mostly distributed in the adult age class. Adult and yearling classes had the highest reproductive values, 0.94 (0.92, 0.97) and 0.92 (0.87, 0.97), respectively, vs. 0.67 (0.55, 0.75) for the fledgling age class.
Mean sensitivities and elasticities of the asymptotic population growth rate ( λ ) to vital rates were calculated from a population projec-tion matrix based on posterior samples of age-specific demographic rates. The mean sensitivity of λ to the probability of reproduction ( R ) was higher than to the number of fledglings (fec), while the elastici-ties of λ to R , fec and ϕ f were the same (Table 1 ). The sensitivity and elasticity of λ to variation in survival were substantially higher for the rate of the adult age class than for the survival rates of yearlings and fledglings, which were not statistically significantly different (Table 1 ).
We parameterised population projection matrices where vital rates were functions of population size (Caswell, 2001 ), based on density dependence coefficients for each vital rate. Elasticities of the population growth rate to R , fec, ϕ f and ϕ y were consistently lower than ϕ ad and declined with population size at the same rate (Figure 4 a). Conversely, the elasticity to ϕ ad increased as the popula-tion approached the carrying capacity.
Transient elasticities of the population vector at t = 5, N 5, rapidly converged to the same pattern as in the asymptotic elasticities, with in-creasing elasticity to adult survival and decreasing elasticities to other vital rates as population size increased (Appendix S6 : Figure S6.1). Based on the transient LTRE, contributions of vital rates to the real-ised population growth rate, λ realised, t , reflected the strength of density dependence acting on each rate (since reproductive rates were nega-tively affected by N tot , reproductive rates made a positive contribution to λ realised, t ) (Figure 4 b). Additionally, the population vector reduced population growth through a negative effect on the number of adults, which made up the largest proportion of total population size.
4 | DISCUSSION
Colonising populations should eventually stop increasing as a conse-quence of density dependence in certain vital rates (Redfield, 1973 ). However, few studies of colonising populations – particularly in migra-tory species – have identified which age-specific reproductive and sur-vival rates undergo density regulation and how this in turn affects the population dynamics (Fowler, 1981 , 1987 ). Sæther et al. ( 2016 ) found no evidence for density regulation of reproduction, when analysing density dependence in different vital rates of income breeding birds. In contrast, density regulation in several duck species, which are closer to being capital breeders, was found to occur primarily through nega-tive feedbacks on reproduction (Elmberg, Gunnarsson, Nummi, Pöysä, & Sjöberg, 2003 ; Elmberg, Gunnarsson, Pöysä, Sjöberg, & Nummi, 2005 ). Similarly, in our study population of barnacle geese and in other goose species (Cooch, Lank, Rockwell, & Cooke, 1989 ; Sedinger et al., 1998 ), density dependence largely regulated population growth via a negative feedback on reproductive success prior to fledging.
F I G U R E 3 Mean parameter estimates of temporal variance and covariance in R , fec, ϕ f , ϕ y and ϕ ad , with associated 95% CRIs
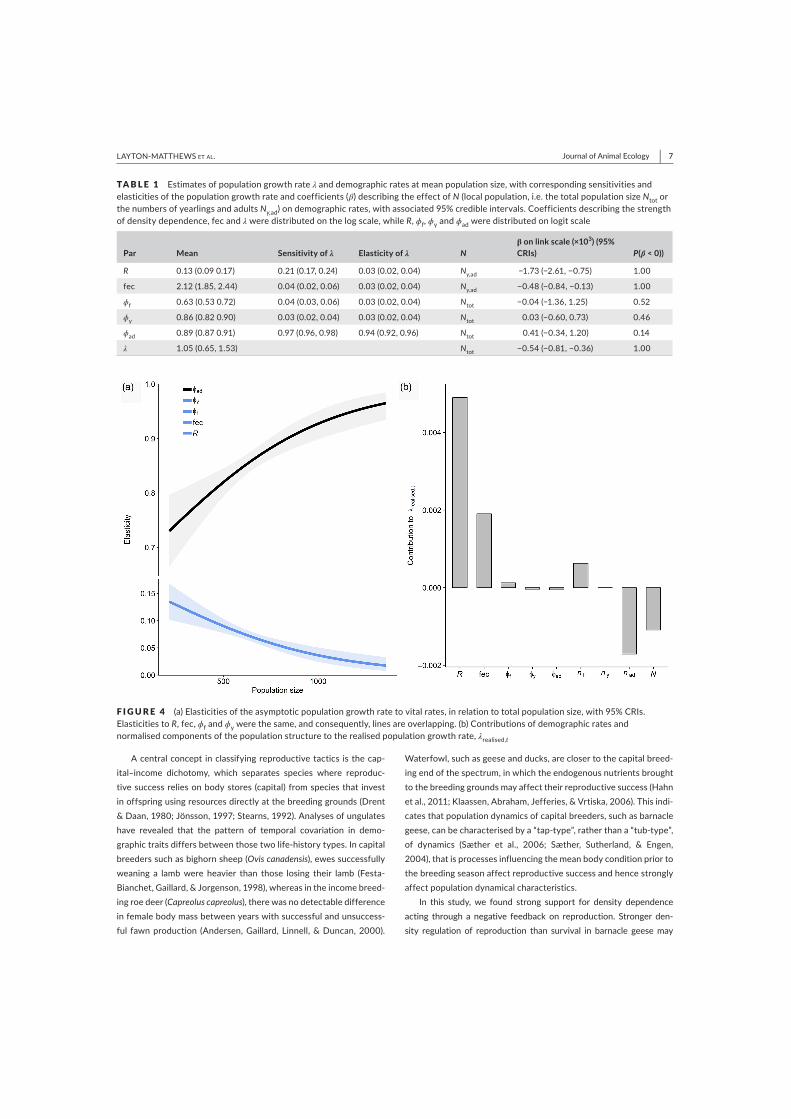
| 7Journal of Animal EcologyLAYTON-MATTHEWS ET AL.
A central concept in classifying reproductive tactics is the cap-ital–income dichotomy, which separates species where reproduc-tive success relies on body stores (capital) from species that invest in offspring using resources directly at the breeding grounds (Drent & Daan, 1980 ; Jönsson, 1997 ; Stearns, 1992 ). Analyses of ungulates have revealed that the pattern of temporal covariation in demo-graphic traits differs between those two life-history types. In capital breeders such as bighorn sheep ( Ovis canadensis ), ewes successfully weaning a lamb were heavier than those losing their lamb (Festa-Bianchet, Gaillard, & Jorgenson, 1998 ), whereas in the income breed-ing roe deer ( Capreolus capreolus ), there was no detectable difference in female body mass between years with successful and unsuccess-ful fawn production (Andersen, Gaillard, Linnell, & Duncan, 2000 ).
Waterfowl, such as geese and ducks, are closer to the capital breed-ing end of the spectrum, in which the endogenous nutrients brought to the breeding grounds may affect their reproductive success (Hahn et al., 2011 ; Klaassen, Abraham, Jefferies, & Vrtiska, 2006 ). This indi-cates that population dynamics of capital breeders, such as barnacle geese, can be characterised by a “tap-type”, rather than a “tub-type”, of dynamics (Sæther et al., 2006 ; Sæther, Sutherland, & Engen, 2004 ), that is processes influencing the mean body condition prior to the breeding season affect reproductive success and hence strongly affect population dynamical characteristics.
In this study, we found strong support for density dependence acting through a negative feedback on reproduction. Stronger den-sity regulation of reproduction than survival in barnacle geese may
TA B L E 1 Estimates of population growth rate λ and demographic rates at mean population size, with corresponding sensitivities and elasticities of the population growth rate and coefficients ( β ) describing the effect of N (local population, i.e. the total population size N tot or the numbers of yearlings and adults N y ,ad ) on demographic rates, with associated 95% credible intervals. Coefficients describing the strength of density dependence, fec and λ were distributed on the log scale, while R , ϕ f , ϕ y and ϕ ad were distributed on logit scale
Par Mean Sensitivity of λ Elasticity of λ N β on link scale (×10 3 ) (95% CRIs) P ( β < 0))
R 0.13 (0.09 0.17) 0.21 (0.17, 0.24) 0.03 (0.02, 0.04) N y, ad −1.73 (−2.61, −0.75) 1.00
fec 2.12 (1.85, 2.44) 0.04 (0.02, 0.06) 0.03 (0.02, 0.04) N y, ad −0.48 (−0.84, −0.13) 1.00
ϕ f 0.63 (0.53 0.72) 0.04 (0.03, 0.06) 0.03 (0.02, 0.04) N tot −0.04 (−1.36, 1.25) 0.52
ϕ y 0.86 (0.82 0.90) 0.03 (0.02, 0.04) 0.03 (0.02, 0.04) N tot 0.03 (−0.60, 0.73) 0.46
ϕ ad 0.89 (0.87 0.91) 0.97 (0.96, 0.98) 0.94 (0.92, 0.96) N tot 0.41 (−0.34, 1.20) 0.14
λ 1.05 (0.65, 1.53) N tot −0.54 (−0.81, −0.36) 1.00
F I G U R E 4 (a) Elasticities of the asymptotic population growth rate to vital rates, in relation to total population size, with 95% CRIs. Elasticities to R , fec, ϕ f and ϕ y were the same, and consequently, lines are overlapping. (b) Contributions of demographic rates and normalised components of the population structure to the realised population growth rate, λ realised, t

8 | Journal of Animal Ecology LAYTON-MATTHEWS ET AL.
therefore be explained by their status as capital breeders, with pro-cesses during the breeding season making a larger contribution to population dynamics. In contrast, Sæther et al. ( 2016 ) found that annual variation in population growth rates of income breeding bird species was mainly explained by temporal variation in survival. In ad-dition, barnacle geese are also nidifugous (i.e. offspring leave the nest shortly after hatching and receive minimal parental care thereafter) in contrast to altricial species, where offspring hatch in an undevel-oped state (Lack, 1968 ). Sæther, Ringsby, and Røskaft ( 1996 ) proposed that factors affecting the population dynamics of nidifugous species would occur during the breeding season, but would occur during the non-breeding season in altricial species. Consequently, the vulnerabil-ity of barnacle goose young to fluctuations in the availability of food resources may be greater than in altricial species. In support of this, the majority of species included in the analysis of Sæther et al. ( 2016 ) were altricial birds. Furthermore, studies have shown that herbivores in particular are strongly affected by environmental stochasticity and density dependence, which often acts through density regulation of reproduction since the temporal variance in adult survival is limited (Gaillard et al., 1998 ; Gaillard, Festa-Bianchet, Yoccoz, Loison, & Toigo, 2000 ; Sæther, 1997 ). This pattern may therefore be especially clear in herbivores since their body condition is strongly dependent on the amount of food available prior to or during a season. In our study, pop-ulation density influenced both the probability of reproduction and the number of fledglings, conditional on successful reproduction. Such density effects may be attributed to competition for food resources prior to the breeding season, with consequent carry-over effects on reproduction (Sedinger, Schamber, Ward, Nicolai, & Conant, 2011 ). Additionally, density-dependent reproduction is likely also explained by competition for nest sites and/or food resources during the brood rearing phase, where increased food competition at the breeding grounds has been linked to higher pre-fledging mortality in barnacle geese (Larsson & Forslund, 1994 ; Loonen et al., 1997 ). Finally, the num-ber of Arctic foxes in Kongsfjorden has increased in parallel with goose numbers, affecting reproduction directly through predation but also indirectly by limiting available foraging area and exacerbating resource competition (Loonen et al., 1998 ).
In this population, survival appeared to be density-independent after the first year of life. Food conditions can influence both reproduc-tion and survival in high Arctic geese through effects on body condi-tion (Newton, 1977 ), which is a known determinant of survival in geese, since fat build-up is paramount to successful migration (Loonen et al., 1997 ; Newton, 1977 ). Both reproduction and survival showed a ten-dency for decline over the study period. Vital rates are typically high during the growing phase of a colonising population (Redfield, 1973 ), and this decline could be attributed to gradual habitat deterioration at the breeding grounds (Kuijper, Ubels, & Loonen, 2009 ) or by processes at other migratory stages. The continued increase in the total Svalbard flyway population, which convenes at the wintering grounds, may po-tentially also explain the decline in survival rates. No evidence of this was found when regressing age-specific survival rates against annual total population size, accounting for a linear temporal trend. However, we cannot rule out that this substantial linear increase in the Svalbard
flyway population is, at least in part, responsible for the concomitant de-cline observed in local survival rates. When the year 1990 was removed from the analysis of density dependence (Appendix S5 .2), we did find some support for density-regulated fledgling survival ( P ( β < 0)) = 0.93), potentially caused by post-fledging mortality during the first migration attempt, for example driven by food availability at the breeding grounds (Owen & Black, 1989 ). Similarly, in lesser snow geese, deteriorating food conditions was the main driver of increased first-year mortality (Francis, Richards, Cooke, & Rockwell, 1992 ). Therefore, density de-pendence may also act on fledgling survival by determining their first migration success, through limited resources at the breeding grounds. Deteriorating conditions and increased competition could also increase the amount of permanent emigration to other breeding grounds (caus-ing a decline in apparent survival), rather than direct mortality, but we could not differentiate between these processes in the survival analysis.
Similar to Sæther et al. ( 2016 ), the elasticity of the population growth rate to adult survival increased as the population approached its carrying capacity. At small population sizes, the relative influence of reproductive rates and early-life survival on λ was high, but it declined with increasing population size. This is in agreement with Lack ' s hypothesis ( 1954 ; 1966) that, when a population is far from its carrying capacity, the system is driven by reproduction to a greater extent. However, Lack ( 1966 ) also argued that variation in reproduc-tion should be largely independent of density, whereas in our study, population reproduction was strongly density-dependent. This dis-cordance could stem from the aforementioned differences between income and capital breeders, which may alter the critical annual phase driving population dynamics (Sæther et al., 2004 ; Vander Werf, 1992 ). Thus, our analysis follows what would be predicted by Lack ' s hypothesis ( 1954 ) that, although reproductive rates vary as a density-dependent consequence of fluctuations in resources during the breeding season, the dynamics are still strongly influenced by adult survival as the population approaches its carrying capacity.
The elasticities of the population growth rate to demographic rates were typical for a long-lived species, where elasticities to reproductive rates and early-life survival are lower than to adult survival (Gaillard et al., 1998 ; Gaillard & Yoccoz, 2003 ). Survival often increases with age during the first few years of life in long-lived species, and such a pattern has also been observed for reproduction in geese (Rockwell, Cooch, Thompson, & Cooke, 1993 ). However, reproductive rates could not be modelled as age dependent in our study. Reproductive output also varied greatly among years in this barnacle goose population. This is a common pattern observed in several species of waterfowl, where elasticities to survival are high and reproduction tends to be more labile to environmental variation, allowing reproductive rates to contribute more to population dynamics (Koons, Gunnarsson, Schmutz, & Rotella, 2014 ). We have shown that in addition to the effects of environmental variation, the variability in reproductive rates can also be caused by density-dependent feedbacks. The large contribution of reproductive rates to population dynamics is also expected for long-lived birds with high survival rates and long life spans where, despite the low elastic-ity of λ to reproductive rates, their variance allows them to contribute substantially to realised population growth (Cooch, Rockwell, & Brault,
| 9Journal of Animal EcologyLAYTON-MATTHEWS ET AL.
2001 ; Koons et al., 2014 ). The inter-annual variation was greater in the probability of producing a fledgling than in the number of fledglings per successful breeder, possibly since weather conditions influence initial nest success to a greater extent than the actual number of young (Prop & de Vries, 1993 ). Transient analysis can potentially reveal much about population dynamics in such variable environments (Ezard et al., 2010 ; Koons et al., 2017 , 2016 ). In this case, the similarities between transient vs. asymptotic elasticities and contributions may be attributable to (a) the fact that vital rates were predicted deterministically as functions of vital rate-specific density dependence and (b) that this population reached the carrying capacity so quickly. Consequently, transient dy-namics rapidly resembled asymptotic dynamics.
Understanding how density dependence influences the population dynamics and population trajectories of local populations colonising high Arctic breeding grounds is essential for their management and conservation, locally and internationally. This study gives insight into the dynamics behind the rapid expansion of migratory birds across the Arctic, currently a topic of management interest (AEWA, 2018 ; Trinder, 2014 ). These findings appear to oppose a recent study of the total fly-way population of Svalbard barnacle geese at the wintering grounds, where no evidence of density regulation was observed (Trinder, 2014 ). Such a disparity can occur because density dependence in the total fly-way population is concealed by range expansion on Svalbard, that is is only observable at a local scale. However, the limits of future range expansion are difficult to predict as climate change alters the area of suitable habitat for geese in the Arctic (Jensen et al., 2008 ; Post et al., 2009 ). The discrepancy between local and total Svalbard population dynamics indicates that, by ignoring local patterns, managers may miss changes occurring in Arctic migrant goose populations. Local density regulation can be seen as an early warning signal for future limitation of total flyway populations, when range expansion is no longer possible. We emphasise the need for a greater focus on local population dynam-ics and the suitability of remaining habitat at the high Arctic breeding grounds, especially when the re-introduction of hunting of migratory geese wintering in Europe is being called into question (AEWA, 2018 ).
ACKNOWLEDG EMENTS
We thank University of Groningen scientists, students and volunteers who helped collecting and processing this data. K.L.M. acknowledges the late R.H. Drent, who guided the project in the first six years. The Netherlands Arctic and Polar Program, NWO and the Ministry of Foreign Affairs, European Union supported FP7-project FRAGILE and the University of Groningen provided funding. This study was supported by the Research Council of Norway (projects 223257, 244647, 273451 and 276080).
AUTHORS’ CONTRIBUTIONS
K.L.M., B.B.H. and V.G. conceived the ideas and designed the meth-odology; M.L. collected the data; K.L.M., V.G. and C.C. analysed the data; and K.L.M., B.B.H. and B.E.S. led the writing of the manuscript. All authors contributed critically to the drafts and gave final approval for publication.
DATA ACCE SSIBILIT Y
R code for fitting the integrated population model and data are avail-able from the Dryad Digital Repository: https ://doi.org/10.5061/dryad.200pk95 (Layton-Matthews, Loonen, Hansen, Coste, Sæther, & Grøtan, 2019 ).
ORCID
Kate Layton-Matthews https://orcid.org/0000-0001-5275-1218
R E FE R E N C E S
Abadi , F. , Gimenez , O. , Arlettaz , R. , & Schaub , M. ( 2010 ). An assess-ment of integrated population models: Bias, accuracy, and violation of the assumption of independence . Ecology , 91 , 7 – 14 . https ://doi.org/10.1890/08-2235.1
Abadi , F. , Gimenez , O. , Ullrich , B. , Arlettaz , R. , & Schaub , M. ( 2010 ). Estimation of immigration rate using integrated population models . Journal of Applied Ecology , 47 , 393 – 400 . https ://doi.org/10.1111/j.1365-2664.2010.01789.x
AEWA ( 2018 ). Third meeting of the AEWA European goose management group international working group .
Andersen , R. , Gaillard , J. M. , Linnell , J. D. , & Duncan , P. ( 2000 ). Factors affecting maternal care in an income breeder, the European roe deer . Journal of Animal Ecology , 69 , 672 – 682 . https ://doi.org/10.1046/j.1365-2656.2000.00425.x
Begon , M. ( 1979 ). Investigating animal abundance: Capture-recapture for biologists . London, UK : Edward Arnold (Publishers) Ltd .
Black , J. M. , Prop , J. , & Larsson , K. ( 2014 ). Survival and reproduction . In The barnacle goose (pp. 159 – 172 ). London, UK : Bloomsbury Publishing .
Both , C. , Visser , M. E. , & Verboven , N. ( 1999 ). Density–dependent recruit-ment rates in great tits: The importance of being heavier . Proceedings of the Royal Society of London B: Biological Sciences , 266 , 465 – 469 .
Brook , B. W. , & Bradshaw , C. J. ( 2006 ). Strength of evidence for density depen-dence in abundance time series of 1198 species . Ecology , 87 , 1445 – 1451 . https ://doi.org/10.1890/0012-9658(2006)87[1445:SOEFD D]2.0.CO;2
Brooks , S. P. , & Gelman , A. ( 1998 ). General methods for monitoring convergence of iterative simulations . Journal of Computational and Graphical Statistics , 7 , 434 – 455 .
Bruggeman , J. E. , Swem , T. , Andersen , D. E. , Kennedy , P. L. , & Nigro , D. ( 2015 ). Dynamics of a recovering Arctic bird population: The impor-tance of climate, density dependence, and site quality . Ecological Applications , 25 , 1932 – 1943 . https ://doi.org/10.1890/14-1591.1
Caswell , H. ( 2000 ). Prospective and retrospective perturbation analyses: Their roles in conservation biology . Ecology , 81 , 619 – 627 . https ://doi.org/10.1890/0012-9658(2000)081[0619:PARPA T]2.0.CO;2
Caswell , H. ( 2001 ). Matrix population models . Sunderland, MA : Wiley Online Library .
Caswell , H. ( 2007 ). Sensitivity analysis of transient population dy-namics . Ecology Letters , 10 , 1 – 15 . https ://doi.org/10.1111/j.1461-0248.2006.01001.x
Cooch , E. , Lank , D. , Rockwell , R. , & Cooke , F. ( 1989 ). Long-term decline in fecundity in a Snow Goose population: Evidence for density de-pendence? Journal of Animal Ecology , 58 , 711 – 726 . https ://doi.org/10.2307/4858
Cooch , E. , Rockwell , R. F. , & Brault , S. J. E. M. ( 2001 ). Retrospective analysis of demographic responses to environmental change: A lesser snow goose example . Ecological Monographs , 71 , 377 – 400 . https ://doi.org/10.1890/0012-9615(2001)071[0377:RAODR T]2.0.CO;2

10 | Journal of Animal Ecology LAYTON-MATTHEWS ET AL.
Coulson , T. , Catchpole , E. A. , Albon , S. D. , Morgan , B. J. , Pemberton , J. , Clutton-Brock , T. H. , … Grenfell , B. ( 2001 ). Age, sex, density, winter weather, and population crashes in Soay sheep . Science , 292 , 1528 – 1531 . https ://doi.org/10.1126/scien ce.292.5521.1528
de Valpine , P. , & Hastings , A. ( 2002 ). Fitting population models incor-porating process noise and observation error . Ecological Monographs , 72 , 57 – 76 . https ://doi.org/10.1890/0012-9615(2002)072[0057:FP-MIP N]2.0.CO;2
Drent , R. , & Daan , S. ( 1980 ). The prudent parent: Energetic adjustments in avian breeding . Ardea , 68 , 225 – 252 .
Durant , J. , Massemin , S. , Thouzeau , C. , & Handrich , Y. ( 2000 ). Body reserves and nutritional needs during laying preparation in barn owls . Journal of Comparative Physiology B , 170 , 253 – 260 . https ://doi.org/10.1007/s0036 00050283
Elmberg , J. , Gunnarsson , G. , Nummi , P. , Pöysä , H. , & Sjöberg , K. ( 2003 ). Density dependent breeding success in mallards . The third North American Duck Symposium, California, USA .
Elmberg , J. , Gunnarsson , G. , Pöysä , H. , Sjöberg , K. , & Nummi , P. J. O. ( 2005 ). Within-season sequential density dependence reg-ulates breeding success in mallards Anas platyrhynchos . Oikos , 108 , 582 – 590 .
Ezard , T. H. , Bullock , J. M. , Dalgleish , H. J. , Millon , A. , Pelletier , F. , Ozgul , A. , & Koons , D. N. ( 2010 ). Matrix models for a change-able world: The importance of transient dynamics in population management . Journal of Applied Ecology , 47 , 515 – 523 . https ://doi.org/10.1111/j.1365-2664.2010.01801.x
Festa-Bianchet , M. , Gaillard , J.-M. , & Jorgenson , J. T. ( 1998 ). Mass-and density-dependent reproductive success and reproductive costs in a capital breeder . The American Naturalist , 152 , 367 – 379 .
Fowler , C. W. ( 1981 ). Density dependence as related to life history strat-egy . Ecology , 62 , 602 – 610 . https ://doi.org/10.2307/1937727
Fowler , C. W. ( 1987 ). A review of density dependence in populations of large mammals . In H. H. Genoways (Ed.), Current mammalogy (pp. 401 – 441 ). Boston, MA : Springer .
Francis , C. M. , Richards , M. H. , Cooke , F. , & Rockwell , R. F. ( 1992 ). Long-term changes in survival rates of lesser snow geese . Ecology , 73 , 1346 – 1362 . https ://doi.org/10.2307/1940681
Freckleton , R. P. , Watkinson , A. R. , Green , R. E. , & Sutherland , W. J. ( 2006 ). Census error and the detection of density dependence . Journal of Animal Ecology , 75 , 837 – 851 . https ://doi.org/10.1111/j.1365-2656.2006.01121.x
Fuglei , E. , Øritsland , N. A. , & Prestrud , P. ( 2003 ). Local variation in arctic fox abundance on Svalbard, Norway . Polar Biology , 26 , 93 – 98 .
Gaillard , J.-M. , Festa-Bianchet , M. , & Yoccoz , N. G. ( 1998 ). Population dynamics of large herbivores: Variable recruitment with constant adult survival . Trends in Ecology & Evolution , 13 , 58 – 63 . https ://doi.org/10.1016/S0169-5347(97)01237-8
Gaillard , J.-M. , Festa-Bianchet , M. , Yoccoz , N. , Loison , A. , & Toigo , C. ( 2000 ). Temporal variation in fitness components and population dy-namics of large herbivores . Annual Review of Ecology and Systematics , 31 , 367 – 393 . https ://doi.org/10.1146/annur ev.ecols ys.31.1.367
Gaillard , J.-M. , & Yoccoz , N. G. ( 2003 ). Temporal variation in survival of mammals: A case of environmental canalization? Ecology , 84 , 3294 – 3306 . https ://doi.org/10.1890/02-0409
Gamelon , M. , Grøtan , V. , Engen , S. , Bjørkvoll , E. , Visser , M. E. , & Sæther , B. E. ( 2016 ). Density dependence in an age-structured population of great tits: Identifying the critical age classes . Ecology , 97 , 2479 – 2490 . https ://doi.org/10.1002/ecy.1442
Gelman , A. , & Hill , J. ( 2006 ). Causal inference using multilevel models . In R. M. Alvarez N. L. Beck L. L. Wu (Ed.), Data analysis using regres-sion and multilevel/hierarchical models (pp. 503 – 512 ). Cambridge, UK : Cambridge University Press .
Grant , A. , & Benton , T. G. ( 2000 ). Elasticity analysis for density-depen-dent populations in stochastic environments . Ecology , 81 , 680 – 693 . https ://doi.org/10.1890/0012-9658(2000)081[0680:EAFDD P]2.0.CO;2
Hahn , S. , Loonen , M. J. , & Klaassen , M. ( 2011 ). The reliance on distant resources for egg formation in high Arctic breeding barnacle geese Branta leucopsis . Journal of Avian Biology , 42 , 159 – 168 . https ://doi.org/10.1111/j.1600-048X.2010.05189.x
Hobson , K. A. , Sharp , C. M. , Jefferies , R. L. , Rockwell , R. F. , & Abraham , K. F. ( 2011 ). Nutrient allocation strategies to eggs by Lesser Snow Geese ( Chen caerulescens ) at a sub-Arctic colony . The Auk , 128 , 156 – 165 .
Jensen , R. A. , Madsen , J. , O'Connell , M. , Wisz , M. S. , Tømmervik , H. , & Mehlum , F. ( 2008 ). Prediction of the distribution of Arctic-nesting pink-footed geese under a warmer climate scenario . Global Change Biology , 14 , 1 – 10 .
Jönsson , K. I. , & Jonsson , K. I. ( 1997 ). Capital and income breeding as alternative tactics of resource use in reproduction . Oikos , 78 , 57 – 66 . https ://doi.org/10.2307/3545800
Kellner , K. ( 2015 ). jagsUI: A wrapper around rjags to streamline JAGS analyses .
Klaassen , M. , Abraham , K. F. , Jefferies , R. L. , & Vrtiska , M. ( 2006 ). Factors affecting the site of investment, and the reliance on savings for arctic breeders: The capital–income dichotomy revisited . Ardea , 94 , 371 – 384 .
Koons , D. N. , Arnold , T. W. , & Schaub , M. ( 2017 ). Understanding the demographic drivers of realized population growth rates . Ecological Applications , 27 , 2102 – 2115 . https ://doi.org/10.1002/eap.1594
Koons , D. N. , Gunnarsson , G. , Schmutz , J. M. , & Rotella , J. J. ( 2014 ). Drivers of waterfowl population dynamics: From teal to swans . Wildfowl , 4 , 169 – 191 .
Koons , D. N. , Iles , D. T. , Schaub , M. , & Caswell , H. ( 2016 ). A life-history perspective on the demographic drivers of structured population dynamics in changing environments . Ecology Letters , 19 , 1023 – 1031 . https ://doi.org/10.1111/ele.12628
Kuijper , D. P. J. , Ubels , R. , & Loonen , M. ( 2009 ). Density-dependent switches in diet: A likely mechanism for negative feedbacks on goose population increase? Polar Biology , 32 , 1789 . https ://doi.org/10.1007/s00300-009-0678-2
Lack , D. ( 1954 ). The natural regulation of animal numbers . Oxford, UK : The Clarendon Press .
Lack , D. ( 1966 ). Population studies of birds . Oxford, UK : Clarendon P . Lack , D. ( 1968 ). Ecological adaptations for breeding in birds . London, UK :
Methuen . Lande , R. , Engen , S. , & Saether , B.-E. ( 2003 ). Stochastic population dynam-
ics in ecology and conservation . Oxford, UK : Oxford University Press . Lande , R. , Engen , S. , Sæther , B.-E. , Filli , F. , Matthysen , E. , & Weimerskirch ,
H. ( 2002 ). Estimating density dependence from population time se-ries using demographic theory and life-history data . The American Naturalist , 159 , 321 – 337 .
Larsson , K. , & Forslund , P. ( 1994 ). Population dynamics of the barnacle goose Branta leucopsis in the Baltic area: Density-dependent effects on reproduction . Journal of Animal Ecology , 63 , 954 – 962 . https ://doi.org/10.2307/5272
Layton-Matthews , K. , Loonen , M. J. J. E. , Hansen , B. B. , Sæther , B.-E. , Coste , C. F. D. , & Grøtan , V. ( 2019 ). Data from: Density-dependent population dynamics of a high Arctic capital breeder, the bar-nacle goose . Dryad Digital Repository . https ://doi.org/10.5061/dryad.200pk95 .
Link , W. A. , & Barker , R. J. ( 2005 ). Modeling association among demo-graphic parameters in analysis of open population capture–recapture data . Biometrics , 61 , 46 – 54 .
Lebreton , J.-D. , Burnham , K. P. , Clobert , J. , & Anderson , D. R. ( 1992 ). Modeling survival and testing biological hypotheses using marked animals: A unified approach with case studies . Ecological Monographs , 62 , 67 – 118 . https ://doi.org/10.2307/2937171
Lieury , N. , Gallardo , M. , Ponchon , C. , Besnard , A. , & Millon , A. ( 2015 ). Relative contribution of local demography and immigration in the recovery of a geographically-isolated population of the endangered Egyptian vulture . Biological Conservation , 191 , 349 – 356 .
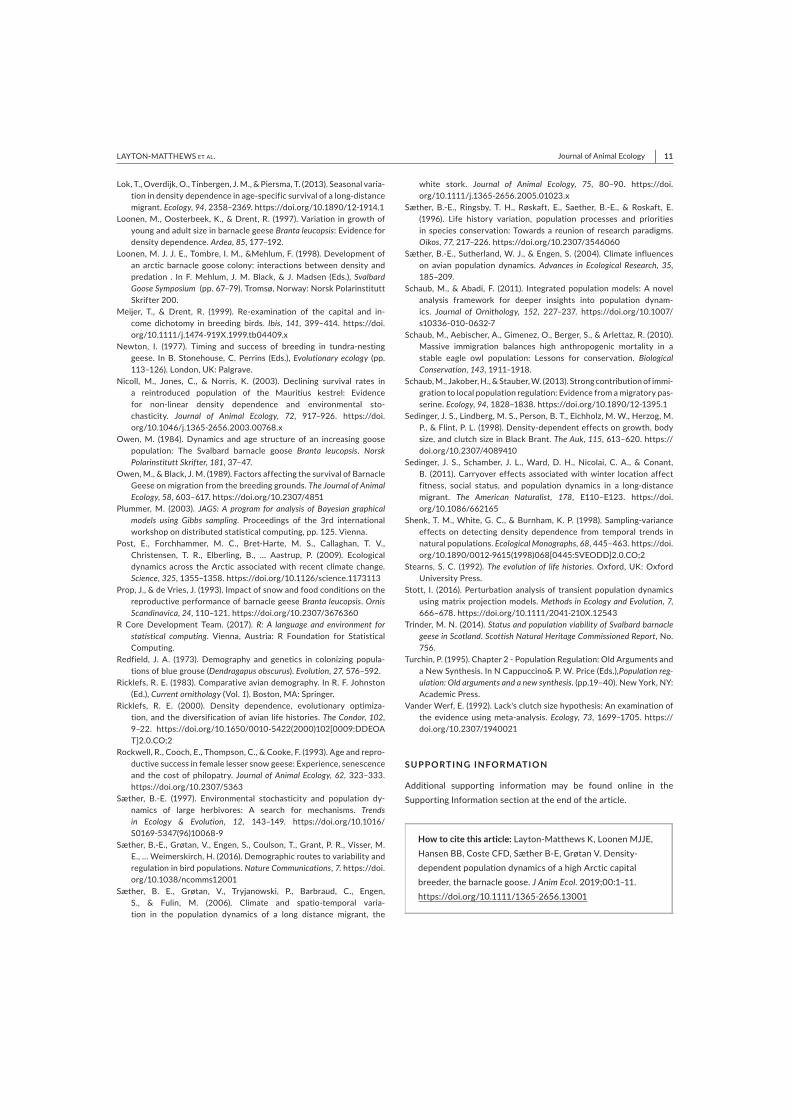
| 11Journal of Animal EcologyLAYTON-MATTHEWS ET AL.
Lok , T. , Overdijk , O. , Tinbergen , J. M. , & Piersma , T. ( 2013 ). Seasonal varia-tion in density dependence in age-specific survival of a long-distance migrant . Ecology , 94 , 2358 – 2369 . https ://doi.org/10.1890/12-1914.1
Loonen , M. , Oosterbeek , K. , & Drent , R. ( 1997 ). Variation in growth of young and adult size in barnacle geese Branta leucopsis : Evidence for density dependence . Ardea , 85 , 177 – 192 .
Loonen , M. J. J. E. , Tombre , I. M. , & Mehlum , F. ( 1998 ). Development of an arctic barnacle goose colony: interactions between density and predation . In F. Mehlum , J. M. Black , & J. Madsen (Eds.), Svalbard Goose Symposium (pp. 67 – 79 ). Tromsø, Norway : Norsk Polarinstitutt Skrifter 200 .
Meijer , T. , & Drent , R. ( 1999 ). Re-examination of the capital and in-come dichotomy in breeding birds . Ibis , 141 , 399 – 414 . https ://doi.org/10.1111/j.1474-919X.1999.tb044 09.x
Newton , I. ( 1977 ). Timing and success of breeding in tundra-nesting geese . In B. Stonehouse , C. Perrins (Eds.), Evolutionary ecology (pp. 113 – 126 ). London, UK : Palgrave .
Nicoll , M. , Jones , C. , & Norris , K. ( 2003 ). Declining survival rates in a reintroduced population of the Mauritius kestrel: Evidence for non-linear density dependence and environmental sto-chasticity . Journal of Animal Ecology , 72 , 917 – 926 . https ://doi.org/10.1046/j.1365-2656.2003.00768.x
Owen , M. ( 1984 ). Dynamics and age structure of an increasing goose population: The Svalbard barnacle goose Branta leucopsis . Norsk Polarinstitutt Skrifter , 181 , 37 – 47 .
Owen , M. , & Black , J. M. ( 1989 ). Factors affecting the survival of Barnacle Geese on migration from the breeding grounds . The Journal of Animal Ecology , 58 , 603 – 617 . https ://doi.org/10.2307/4851
Plummer , M. ( 2003 ). JAGS: A program for analysis of Bayesian graphical models using Gibbs sampling . Proceedings of the 3rd international workshop on distributed statistical computing, pp. 125. Vienna.
Post , E. , Forchhammer , M. C. , Bret-Harte , M. S. , Callaghan , T. V. , Christensen , T. R. , Elberling , B. , … Aastrup , P. ( 2009 ). Ecological dynamics across the Arctic associated with recent climate change . Science , 325 , 1355 – 1358 . https ://doi.org/10.1126/scien ce.1173113
Prop , J. , & de Vries , J. ( 1993 ). Impact of snow and food conditions on the reproductive performance of barnacle geese Branta leucopsis . Ornis Scandinavica , 24 , 110 – 121 . https ://doi.org/10.2307/3676360
R Core Development Team . ( 2017 ). R: A language and environment for statistical computing . Vienna, Austria : R Foundation for Statistical Computing .
Redfield , J. A. ( 1973 ). Demography and genetics in colonizing popula-tions of blue grouse ( Dendragapus obscurus ) . Evolution , 27 , 576 – 592 .
Ricklefs , R. E. ( 1983 ). Comparative avian demography . In R. F. Johnston (Ed.), Current ornithology (Vol. 1 ). Boston, MA : Springer .
Ricklefs , R. E. ( 2000 ). Density dependence, evolutionary optimiza-tion, and the diversification of avian life histories . The Condor , 102 , 9 – 22 . https ://doi.org/10.1650/0010-5422(2000)102[0009:DDEOA T]2.0.CO;2
Rockwell , R. , Cooch , E. , Thompson , C. , & Cooke , F. ( 1993 ). Age and repro-ductive success in female lesser snow geese: Experience, senescence and the cost of philopatry . Journal of Animal Ecology , 62 , 323 – 333 . https ://doi.org/10.2307/5363
Sæther , B.-E. ( 1997 ). Environmental stochasticity and population dy-namics of large herbivores: A search for mechanisms . Trends in Ecology & Evolution , 12 , 143 – 149 . https ://doi.org/10.1016/S0169-5347(96)10068-9
Sæther , B.-E. , Grøtan , V. , Engen , S. , Coulson , T. , Grant , P. R. , Visser , M. E. , … Weimerskirch , H. ( 2016 ). Demographic routes to variability and regulation in bird populations . Nature Communications , 7 . https ://doi.org/10.1038/ncomm s12001
Sæther , B. E. , Grøtan , V. , Tryjanowski , P. , Barbraud , C. , Engen , S. , & Fulin , M. ( 2006 ). Climate and spatio-temporal varia-tion in the population dynamics of a long distance migrant, the
white stork . Journal of Animal Ecology , 75 , 80 – 90 . https ://doi.org/10.1111/j.1365-2656.2005.01023.x
Sæther , B.-E. , Ringsby , T. H. , Røskaft , E. , Saether , B.-E. , & Roskaft , E. ( 1996 ). Life history variation, population processes and priorities in species conservation: Towards a reunion of research paradigms . Oikos , 77 , 217 – 226 . https ://doi.org/10.2307/3546060
Sæther , B.-E. , Sutherland , W. J. , & Engen , S. ( 2004 ). Climate influences on avian population dynamics . Advances in Ecological Research , 35 , 185 – 209 .
Schaub , M. , & Abadi , F. ( 2011 ). Integrated population models: A novel analysis framework for deeper insights into population dynam-ics . Journal of Ornithology , 152 , 227 – 237 . https ://doi.org/10.1007/s10336-010-0632-7
Schaub , M. , Aebischer , A. , Gimenez , O. , Berger , S. , & Arlettaz , R. ( 2010 ). Massive immigration balances high anthropogenic mortality in a stable eagle owl population: Lessons for conservation . Biological Conservation , 143 , 1911 – 1918 .
Schaub , M. , Jakober , H. , & Stauber , W. ( 2013 ). Strong contribution of immi-gration to local population regulation: Evidence from a migratory pas-serine . Ecology , 94 , 1828 – 1838 . https ://doi.org/10.1890/12-1395.1
Sedinger , J. S. , Lindberg , M. S. , Person , B. T. , Eichholz , M. W. , Herzog , M. P. , & Flint , P. L. ( 1998 ). Density-dependent effects on growth, body size, and clutch size in Black Brant . The Auk , 115 , 613 – 620 . https ://doi.org/10.2307/4089410
Sedinger , J. S. , Schamber , J. L. , Ward , D. H. , Nicolai , C. A. , & Conant , B. ( 2011 ). Carryover effects associated with winter location affect fitness, social status, and population dynamics in a long-distance migrant . The American Naturalist , 178 , E110 – E123 . https ://doi.org/10.1086/662165
Shenk , T. M. , White , G. C. , & Burnham , K. P. ( 1998 ). Sampling-variance effects on detecting density dependence from temporal trends in natural populations . Ecological Monographs , 68 , 445 – 463 . https ://doi.org/10.1890/0012-9615(1998)068[0445:SVEOD D]2.0.CO;2
Stearns , S. C. ( 1992 ). The evolution of life histories . Oxford, UK : Oxford University Press .
Stott , I. ( 2016 ). Perturbation analysis of transient population dynamics using matrix projection models . Methods in Ecology and Evolution , 7 , 666 – 678 . https ://doi.org/10.1111/2041-210X.12543
Trinder , M. N. ( 2014 ). Status and population viability of Svalbard barnacle geese in Scotland . Scottish Natural Heritage Commissioned Report , No. 756.
Turchin , P. ( 1995 ). Chapter 2 - Population Regulation: Old Arguments and a New Synthesis . In N Cappuccino & P. W. Price (Eds.), Population reg-ulation: Old arguments and a new synthesis. (pp. 19 – 40 ). New York, NY: Academic Press.
Vander Werf , E. ( 1992 ). Lack's clutch size hypothesis: An examination of the evidence using meta-analysis . Ecology , 73 , 1699 – 1705 . https ://doi.org/10.2307/1940021
SUPPORTING INFORMATION
Additional supporting information may be found online in the Supporting Information section at the end of the article.
How to cite this article: Layton-Matthews K , Loonen MJJE , Hansen BB , Coste CFD , Sæther B-E , Grøtan V . Density-dependent population dynamics of a high Arctic capital breeder, the barnacle goose . J Anim Ecol . 2019 ; 00 : 1 – 11 . https ://doi.org/10.1111/1365-2656.13001

1
Supporting information: 1
‘Density-dependent population dynamics of a high Arctic capital breeder, the barnacle 2
goose’ 3
Kate Layton-Matthews, Maarten J. J. E. Loonen, Brage Bremset Hansen, Christophe F. D. Coste, Bernt-Erik 4
Sæther and Vidar Grøtan 5
6
Appendix S1. Prior distributions for integrated population model parameters of barnacle geese. The 7
distributions are given the following abbreviations; Normal distribution (N), Uniform distribution (U) 8
and Wishart distribution (W). 9
10
Parameter Prior distribution
Mean demographic rates
μR U(-5,5)
μfec U(-5,3)
μϕ U(-5,5)
Uf U(0,1)
Uy,ad U(0,1)
Mean recapture probability
μp U(-5,5)
Temporal variability
Σ W(I, 7)-1 (I=6x6 identity matrix)
σp U(0, 10)
σC U(0, 100)
Initial population sizes (numbers are rounded and truncated to positive values)
Nf N(100,1000)
Ny N(100,1000)
Nad N(100,1000)
Nunmf N(100,1000)
Nunmy&ad N(100,1000)
2
Appendix S2. Counts of the total population of Svalbard barnacle geese 11
The total wintering population has been increasing close to exponentially since the implementation of 12
hunting bans in the 1950s. In a recent study of the total population at Solway Firth, UK, Trinder (2014) 13
found no evidence of density-dependent effects on vital rates or the population growth rate. 14
15
16
17
18
19
20
21
22
23
Figure S2. Annual population size for the total Svalbard barnacle goose population at the wintering 24
grounds, obtained from Trinder (2014). 25

3
Appendix S3. Estimated annual age class proportions of barnacle geese. 26
27
Figure S3.1. Annual proportions of the estimated numbers of fledglings (Nf + NUf), yearlings (Ny) and 28
adults (Nad + NUy,ad). 29
Figure S3.2. Annual proportions of the estimated numbers of fledglings (Nf), yearlings (Ny) and adults 30
(Nad) during 1990-2017 with unmarked fledglings (NUf ) and unmarked yearlings and adults (N
Uy,ad) 31
shown separately. 32
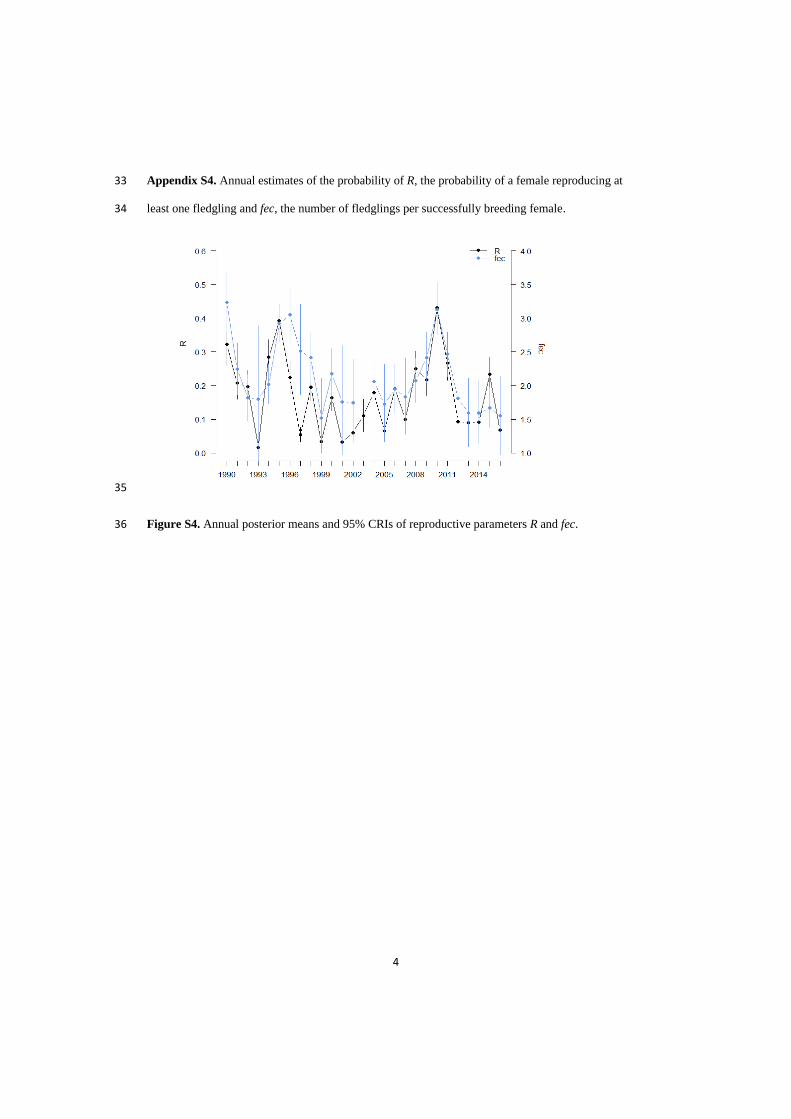
4
Appendix S4. Annual estimates of the probability of R, the probability of a female reproducing at 33
least one fledgling and fec, the number of fledglings per successfully breeding female. 34
35
Figure S4. Annual posterior means and 95% CRIs of reproductive parameters R and fec. 36

5
Appendix S5: Estimating the strength of density dependence, accounting for a temporal trend 37
To ensure that a negative density-dependent feedback was not attributed to what was in fact a spurious 38
effect of temporal trends, we regressed vital rates against estimates of population size (as described in 39
Methods: Density dependence) and included a continuous year effect, to remove any monotonic change 40
(Table S5.1). Additionally, to ensure that density dependence was also not only driven by the steep 41
decline from 1990 to 1991, density dependence regressions were performed only including the years 42
1991–2017 (Table S5.2). Estimates are shown with associated 95% credible intervals and coefficients 43
describing the strength of density dependence, fec and λ were distributed on the log scale, while R, ϕf, 44
ϕy and ϕad were distributed on logit scale. 45
Table S5.1 Estimates of coefficients (β) describing the effect of N, i.e. the total population size or the 46
numbers of yearlings and adults, on demographic rates, accounting for a temporal trend (i.e. linear year 47
effect). 48
49
50
51
52
53
54
55
Table S5.2 Estimates of coefficients (β) describing the effect of N, i.e. the total population size or the 56
numbers of yearlings and adults from 1991-2017 (i.e. 1990 was not included). 57
58
Parameter N β on link scale (x103) (95% CRIs) P(β< 0))
R Ny,ad -1.77 (-2.68, -0.76) 1.00
fec Ny,ad -0.41 (-0.79, -0.05) 1.00
ϕf Ntot -0.06 (-1.43, 1.26) 0.53
ϕy Ntot 0.03 (-0.60, 0.76) 0.46
ϕad Ntot 0.40 (-0.30, 1.13) 0.12
λ Ntot -0.47 (-0.66, 0.22) 1.00
Parameter N β on link scale (x103) (95% CRIs) P(β< 0))
R Ny,ad -2.05 (-3.05, -1.02) 1.00
fec Ny,ad -0.24 (-0.68, 0.16) 0.88
ϕf Ntot -0.95 (-2.42, 0.36) 0.93
ϕy Ntot 0.10 (-0.63, 1.06) 0.40
ϕad Ntot -0.32 (-1.13, 0.37) 0.81
λ Ntot -0.47 (-0.66, 0.22) 1.00

6
Appendix S6: A comparison of transient and asymptotic prospective and retrospective 59
perturbation analyses 60
Appendix 6.1: Prospective perturbation analysis 61
We performed a prospective perturbation analysis of transient population dynamics using matrix 62
calculus, based on the methods developed by Caswell (2007) and also described in Ezard et al. (2010). 63
The sensitivity of total population size (Nt) at time t, to lower-level vital rates contained in θ, was 64
calculated as; 65
∂N(t)
∂θT =cT ∂n(t)
∂θT , eqn S1 66
where c is a vector of 1s for each age class and n is the number of individuals in each component of the 67
population vector at time t. The elasticities of Nt to changes in θ, were then calculated as; 68
θ
Nt
∂Nt
∂θT . eqn S2 69
We show the sensitivities and elasticities of the asymptotic population growth rate, λ, and the population 70
vector at t =5, N5 to lower-level vital rates, as functions of increasing population size (figure S1). We 71
chose t = 5 as the transient time period, since it reflected a time window of sufficient population growth 72
in the study population. Sensitivities and elasticities of λ and N5 were very similar; where elasticities to 73
adult survival increased but elasticities to all other rates decreased with population size (figure S1). 74
Appendix 6.2 Retrospective perturbation analysis (LTRE) 75
We performed a retrospective perturbation analysis, namely a life-table response experiment (LTRE), 76
to calculate the contributions of density-dependent vital rates and components of the population 77
structure, to transient and asymptotic dynamics, based on methods developed by Caswell (2007) and 78
Koons et al. (2016) (see also Koons, Arnold and Schaub (2017)). Vital rates and the numbers of 79
individuals in each age class were predicted using linear regressions, with total population size as an 80
explanatory variable (see Methods: Density dependence). The numbers of yearlings declined, while the 81
numbers of fledglings and adults increased with population size. 82
For the transient analysis, we decomposed the realised population growth rate (λrealised,t) into 83
contributions of vital rates and population structure. We implemented a transient LTRE to decompose 84
the variance in λrealised,t, into contributions from the variance in lower-level vital rates and components 85
of the population structure (nf,t, ny,t and nad,t,); 86
contributionθvar(λrealised,t) ≈ ∑ cov(θi,t,j θj,t)
∂λt
∂θi,t
∂λt
∂θj,t , eqn S3 87
where θ also includes nt. Contrary to Koons et al. (2016), we used non-normalised values for the 88
components of the population vector, rather than forcing them to sum to one. This was more applicable 89

7
to study the consequences of density dependence for population dynamics, by allowing actual rather 90
than relative numbers in the population vector to influence vital rates and the population growth rate. 91
Lower-level vital rates contained in the time-varying matrix, At, and components of the total population 92
vector, 𝐍t, were included in a vector, Θ, and we calculated the sensitivity of λrealised,t to changes in each 93
parameter. Using these sensitivities and covariances among all elements of Θ, we obtained a first-order 94
approximation of the variance in λrealised,t, where sensitivities were calculated at the means of predicted 95
vital rates and components of 𝐍t. The contribution of the variance in each element of Θ was calculated 96
by summing over the covariances (Horvitz, Schemske & Caswell 1997). We also decomposed the 97
variance in the asymptotic population growth rate, λt, into contributions of the variance in vital rates by 98
the same approach as the transient analysis (asymptotic LTRE). 99
Contributions of vital rates to the asymptotic growth rate (λ) and realised growth rate (λrealised,t) showed 100
a similar pattern although the scale of these contributions differed (figure S2),. The contribution of vital 101
rates to λ (and λrealised,t) reflected the strength of density dependence on each rate, where negative density 102
dependence resulted in a positive contribution of the reproductive components and fledgling survival 103
(R and fec, and ϕf) since population growth rates also declined as population size increased. Yearling 104
and adult survival (ϕy and ϕad) negatively contributed to λ and λrealised,t, due to the lack of density 105
dependence on these rates. The total population vector (Nt) had a negative contribution to λrealised,t 106
through the adult component nad, since adults largely made up the population and therefore contribute 107
most to density dependence. nf contributed positively, likely through its dependency on reproductive 108
parameters at each time step. ny had little effect on the λrealised,t due to its low sensitivity and low numbers 109
in the population. 110
Transience is a burgeoning field in population dynamics (Caswell 2007; Koons et al. 2016; Koons, 111
Arnold & Schaub 2017), and its potential importance in addition to conventional, asymptotic 112
approaches has received a lot of attention in recent years (Ezard et al. 2010; Stott 2016; Maldonado‐113
Chaparro et al. 2018). Transient analysis can be applied in several ways, through perturbation of matrix 114
elements and/or the population structure and time variance can be incorporated in multiple ways (Stott 115
2016). Many approaches, such as that of Koons et al. (2016), which we applied for this study, are 116
focused on including stochasticity in vital rates and the population structure, within a fixed matrix 117
design. Therefore, incorporating density dependence, rather than only environmental stochasticity, may 118
require some alterations to this approach since interpretation of the contributions of the population 119
structure is not very intuitive in this framework. For instance, Caswell and Takada (2004) showed that 120
elasticity analysis is more relevant when investigating the effects of environmental changes, given 121
density-dependent vital rates, and so elasticity analysis of density-dependent matrices could be 122
incorporated into this existing transient framework. 123
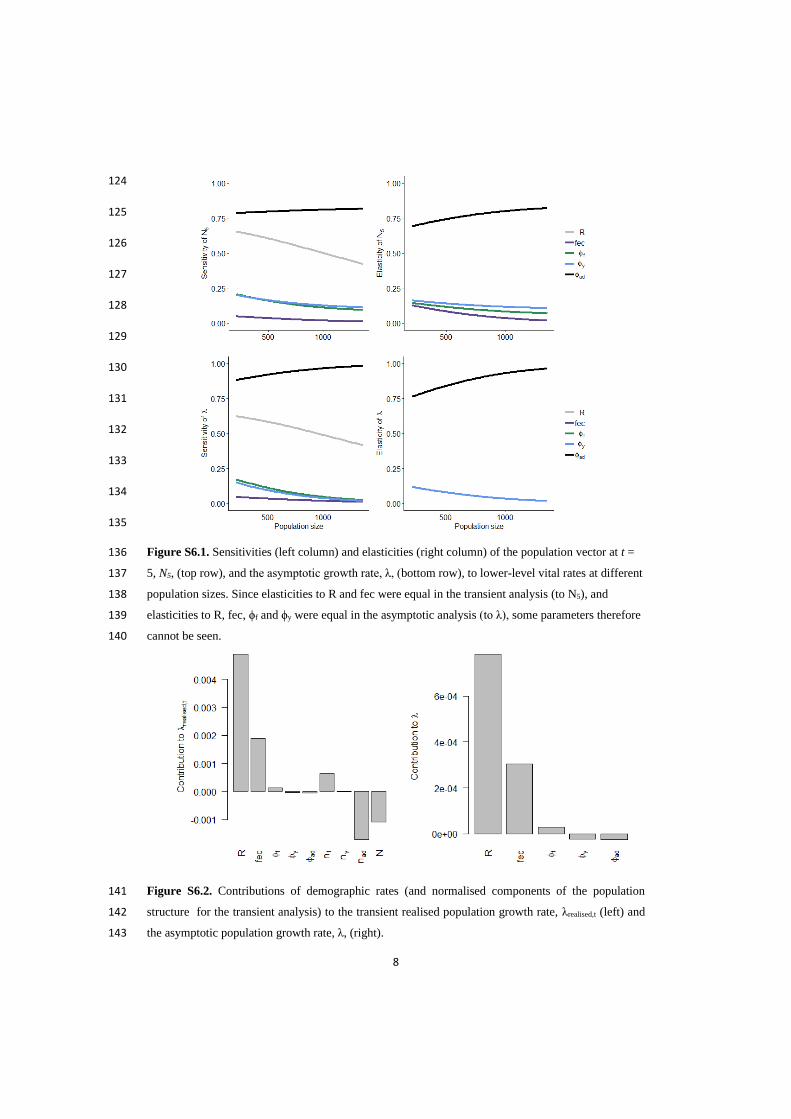
8
124
125
126
127
128
129
130
131
132
133
134
135
Figure S6.1. Sensitivities (left column) and elasticities (right column) of the population vector at t = 136
5, N5, (top row), and the asymptotic growth rate, λ, (bottom row), to lower-level vital rates at different 137
population sizes. Since elasticities to R and fec were equal in the transient analysis (to N5), and 138
elasticities to R, fec, ϕf and ϕy were equal in the asymptotic analysis (to λ), some parameters therefore 139
cannot be seen. 140
Figure S6.2. Contributions of demographic rates (and normalised components of the population 141
structure for the transient analysis) to the transient realised population growth rate, λrealised,t (left) and 142
the asymptotic population growth rate, λ, (right). 143
9
References 144
Caswell, H. (2007) Sensitivity analysis of transient population dynamics. Ecology letters, 10, 1-15. 145
Caswell, H. & Takada, T. (2004) Elasticity analysis of density-dependent matrix population models: 146
the invasion exponent and its substitutes. Theoretical Population Biology, 65, 401-411. 147
Ezard, T.H., Bullock, J.M., Dalgleish, H.J., Millon, A., Pelletier, F., Ozgul, A. & Koons, D.N. (2010) 148
Matrix models for a changeable world: the importance of transient dynamics in population 149
management. Journal of Applied Ecology, 47, 515-523. 150
Horvitz, C., Schemske, D.W. & Caswell, H. (1997) The relative “importance” of life-history stages to 151
population growth: prospective and retrospective analyses. Structured-population models in 152
marine, terrestrial, and freshwater systems, pp. 247-271. Springer. 153
Koons, D.N., Arnold, T.W. & Schaub, M. (2017) Understanding the demographic drivers of realized 154
population growth rates. Ecological Applications, 27, 2102-2115. 155
Koons, D.N., Iles, D.T., Schaub, M. & Caswell, H. (2016) A life‐history perspective on the 156
demographic drivers of structured population dynamics in changing environments. Ecology 157
letters, 19, 1023-1031. 158
Maldonado‐Chaparro, A.A., Blumstein, D.T., Armitage, K.B. & Childs, D.Z. (2018) Transient LTRE 159
analysis reveals the demographic and trait‐mediated processes that buffer population growth. 160
Ecology letters, 21, 1693-1703. 161
Stott, I. (2016) Perturbation analysis of transient population dynamics using matrix projection models. 162
Methods in Ecology and Evolution, 7, 666-678. 163
Trinder, M.N. (2014) Status and population viability of Svalbard barnacle geese in Scotland. Scottish 164
Natural Heritage Commissioned Report, No.756. 165
166

Appendix 7: Integrated population model for the barnacle goose
Kate Layton-Matthews
29 April 2019
Model structure
3 age classes (fledgling, yearling & adult).
Reproduction possible from second year of life.
Post-breeding census.
All rates are time-dependent, survival is age dependent and recapture is sex dependent.
Data
1) Population counts: countsT = annual counts of (1) fledglings (NAs) and (2) yearling and adults2) Reproduction:
nbf = annual number of femalesnfem = annual number of femalesJ = annual number of fledglings per breeding female
3) CH = mark-recapture data (individual capture histories)4) age_mat = matrix of ages (1-3) with the same dimensions as mark-recapture data5) f = indicator variable of an individual’s first capture6) sex = indicator variable for sex of indivual
Functions used to run the IPM
Functions to create a matrix with information about the latent state z, and a matrix of initial values forlatent state z (Kery & Schaub, 2012).
# Latent state (between two "1" the individual has survived -> 1)known.state.cjs <- function(ch){
state <- chfor (i in 1:dim(ch)[1]){
n1 <- min(which(ch[i,]==1))n2 <- max(which(ch[i,]==1))state[i,n1:n2] <- 1state[i,n1] <- NA
}state[state==0] <- NAreturn(state)
}
# Function to create a matrix of initial values for latent state zcjs.init.z <- function(ch,f){
for (i in 1:dim(CH)[1]){if (sum(ch[i,])==1) nextn2 <- max(which(ch[i,]==1))ch[i,f[i]:n2] <- NA
}for (i in 1:dim(CH)[1]){
1

ch[i,1:f[i]] <- NA}return(ch)
}
Model definition
sink("IPM_branta.txt")cat("
model{
#********************************# 1: Priors and constraints#*******************************
# Recapturefor (g in 1:2){
for (t in 1:(n.occasions-1)){p[g,t] <- 1 / (1 + exp(-(mean.p[g] + epsilon.p[t])))
} #tmean.p[g] ~ dunif(-5,5) # prior for mean, sex-specific recapture rate
} #gfor (t in 1:(n.occasions-1)){epsilon.p[t] ~ dnorm(0,tau.p)} #tsigma.p ~ dunif(0,10)tau.p <- pow(sigma.p,-2)sigma2.p <- pow(sigma.p, 2)
# Survivalfor (u in 1:3){
for (t in 1:(n.occasions-1)){s[u,t] <- 1 / (1 + exp(-(mu.s[u] + epsilon[t,u])))
} #t} #u
for (u in 1:3){mu.s[u] ~ dunif(-5,5)} #u # prior for mean age-specific survival rates
## Vital rate priorsxi.1 ~ dunif(0,10)xi.2 ~ dunif(0,10)xi.3 ~ dunif(0,10)xi.4 ~ dunif(0,10)xi.5 ~ dunif(0,10)for (t in 1:(n.occasions-1)){
eps.raw[t,1:5] ~ dmnorm(zeros[], tau.raw[,])epsilon[t,1] <- xi.1 * eps.raw[t,1]epsilon[t,2] <- xi.2 * eps.raw[t,2]epsilon[t,3] <- xi.3 * eps.raw[t,3]epsilon[t,4] <- xi.4 * eps.raw[t,4]epsilon[t,5] <- xi.5 * eps.raw[t,5]
} #t
tau.raw[1:5,1:5] ~ dwish(W[,], 6)sigma.raw[1:5,1:5] <- inverse(tau.raw[,])
2
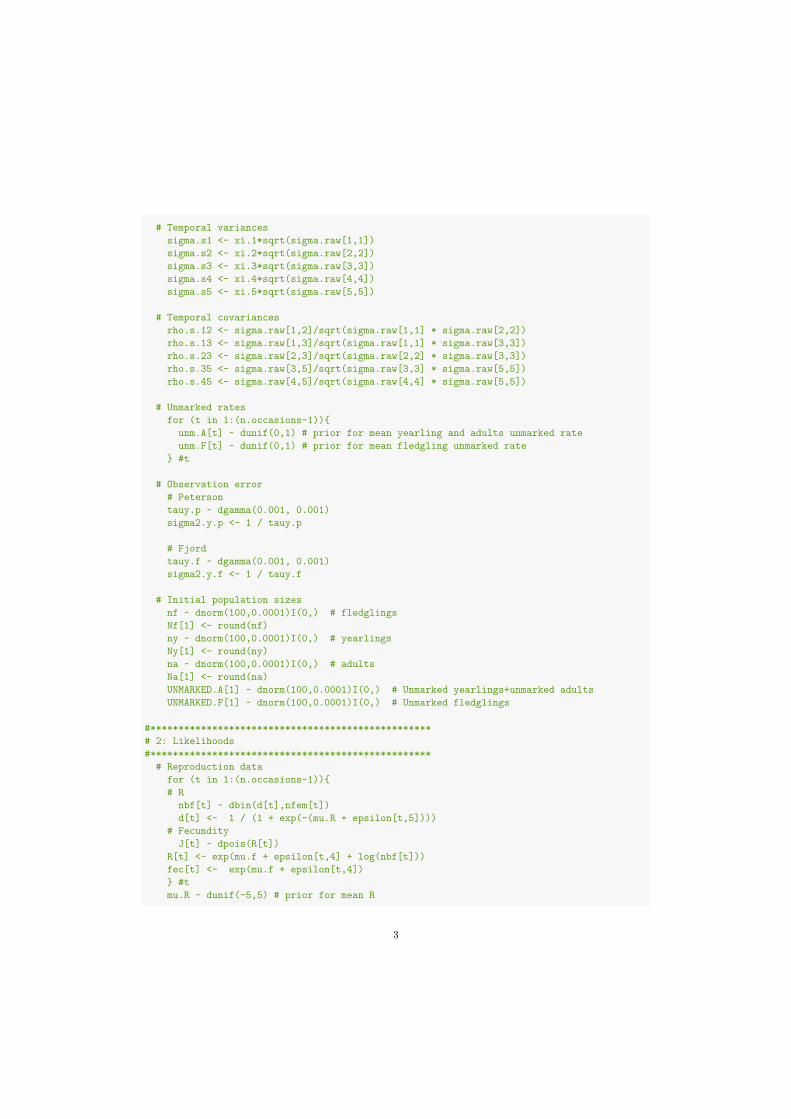
# Temporal variancessigma.s1 <- xi.1*sqrt(sigma.raw[1,1])sigma.s2 <- xi.2*sqrt(sigma.raw[2,2])sigma.s3 <- xi.3*sqrt(sigma.raw[3,3])sigma.s4 <- xi.4*sqrt(sigma.raw[4,4])sigma.s5 <- xi.5*sqrt(sigma.raw[5,5])
# Temporal covariancesrho.s.12 <- sigma.raw[1,2]/sqrt(sigma.raw[1,1] * sigma.raw[2,2])rho.s.13 <- sigma.raw[1,3]/sqrt(sigma.raw[1,1] * sigma.raw[3,3])rho.s.23 <- sigma.raw[2,3]/sqrt(sigma.raw[2,2] * sigma.raw[3,3])rho.s.35 <- sigma.raw[3,5]/sqrt(sigma.raw[3,3] * sigma.raw[5,5])rho.s.45 <- sigma.raw[4,5]/sqrt(sigma.raw[4,4] * sigma.raw[5,5])
# Unmarked ratesfor (t in 1:(n.occasions-1)){
unm.A[t] ~ dunif(0,1) # prior for mean yearling and adults unmarked rateunm.F[t] ~ dunif(0,1) # prior for mean fledgling unmarked rate
} #t
# Observation error# Petersontauy.p ~ dgamma(0.001, 0.001)sigma2.y.p <- 1 / tauy.p
# Fjordtauy.f ~ dgamma(0.001, 0.001)sigma2.y.f <- 1 / tauy.f
# Initial population sizesnf ~ dnorm(100,0.0001)I(0,) # fledglingsNf[1] <- round(nf)ny ~ dnorm(100,0.0001)I(0,) # yearlingsNy[1] <- round(ny)na ~ dnorm(100,0.0001)I(0,) # adultsNa[1] <- round(na)UNMARKED.A[1] ~ dnorm(100,0.0001)I(0,) # Unmarked yearlings+unmarked adultsUNMARKED.F[1] ~ dnorm(100,0.0001)I(0,) # Unmarked fledglings
#**************************************************# 2: Likelihoods#**************************************************
# Reproduction datafor (t in 1:(n.occasions-1)){# R
nbf[t] ~ dbin(d[t],nfem[t])d[t] <- 1 / (1 + exp(-(mu.R + epsilon[t,5])))
# FecundityJ[t] ~ dpois(R[t])
R[t] <- exp(mu.f + epsilon[t,4] + log(nbf[t]))fec[t] <- exp(mu.f + epsilon[t,4])} #tmu.R ~ dunif(-5,5) # prior for mean R
3
mu.f ~ dunif(-5,3) # prior for mean fec
# Capture-recapture datafor (i in 1:nind){
z[i,f[i]] <- 1for (t in (f[i]+1):n.occasions){
# State processz[i,t] ~ dbern(mu1[i,t])mu1[i,t] <- s[x1[i,t-1],t-1] * z[i,t-1]
# Observation processy[i,t] ~ dbern(mu2[i,t])mu2[i,t] <- p[sex[i],t-1] * z[i,t]
}#t}#i
# Population count data# System processfor (t in 2:n.occasions){
Nf.temp[t] <- (s[2,t-1]*fec[t-1]*0.5*d[t-1]*Ny[t-1]) +(s[3,t-1]*fec[t-1]*0.5*d[t-1]*Na[t-1])
Nf[t] ~ dpois(Nf.temp[t])Ny[t] ~ dbin(s[1,t-1],Nf[t-1])mean2[t] ~ dbin(s[2,t-1],Ny[t-1])mean3[t] ~ dbin(s[3,t-1],Na[t-1])Na[t] <- mean2[t] + mean3[t]UNMARKED.A[t] <- Ntot.A[t-1]*unm.A[t-1]UNMARKED.F[t] <- Ntot.F[t-1]*unm.F[t-1]
} #t
for (t in 1:n.occasions){Ntot.A[t]<- Ny[t]+ Na[t] + UNMARKED.A[t]Ntot.F[t] <- Nf[t] + UNMARKED.F[t]Ntot[t] <- Ntot.A[t] + Ntot.F[t]log.Ntot.A[t] <- log(Ntot.A[t])
}
# Observation process# Petersons indexfor (t in 1:6){counts[t,1] ~ dlnorm(log.Ntot.A[t],tauy.p)counts[t,2] ~ dnorm(Ntot.F[t],tauy.p)}
# Fjord countsfor (t in 7:n.occasions){counts[t,1] ~ dlnorm(log.Ntot.A[t],tauy.f)counts[t,2] ~ dnorm(Ntot.F[t],tauy.f)}
}",fill = TRUE)
sink()
4

Bundle data
data <- list(y = CH, nbf=nbf, nfem=nfem, J=nfled, W=diag(5),zeros=rep(0.0,5),counts = as.matrix(countsT), f = f, nind = dim(CH)[1],n.occasions = dim(CH)[2], z = known.state.cjs(CH), x1 = age_mat, sex=fs)
Initial values
inits <- function(){list(z=cjs.init.z(CH, f), mu.s=runif(3,0,1), mu.d=runif(1,0,1),mu.f=runif(1,0,1), mean.p=runif(2,0,1), sigma.p=runif(1,0,5), sigma.y=runif(1,0,10), tauy.f=runif(1,0,5), tauy.p=runif(1,0,5))}
Parameters monitored
parameters <- c("sigma2.y.p","sigma2.y.f","s","mu.s","mu.d","mu.f","d","fec","p","mean.p","sigma.s1","sigma.s2","sigma.s3","sigma.s4","sigma.s5","sigma2.p","rho.s.12","rho.s.13","rho.s.23","rho.s.45","rho.s.35","Nf", "Ny", "Na","Ntot","unm.F","unm.A","UNMARKED.A","UNMARKED.F")
Model
ipm.mod <- jags(model.file ='IPM_branta.txt',data = data, parameters.to.save = parameters,inits = inits,n.chains = 4, n.iter = 1000000, n.burnin = 100000,n.thin = 90, parallel=TRUE)
Model output
print(ipm.mod, digits=3)
5
Model inputs and settings (for jagsUI)


Paper II


Glob Change Biol. 2019;00:1–16. | 1wileyonlinelibrary.com/journal/gcb
Received:26February2019 | Accepted:11July2019DOI: 10.1111/gcb.14773
P R I M A R Y R E S E A R C H A R T I C L E
Contrasting consequences of climate change for migratory geese: Predation, density dependence and carryover effects offset benefits of high‐arctic warming
Kate Layton‐Matthews1 | Brage Bremset Hansen1 | Vidar Grøtan1 | Eva Fuglei2 | Maarten J. J. E. Loonen3
ThisisanopenaccessarticleunderthetermsoftheCreativeCommonsAttributionLicense,whichpermitsuse,distributionandreproductioninanymedium,providedtheoriginalworkisproperlycited.©2019TheAuthors.Global Change BiologypublishedbyJohnWiley&SonsLtd
1CentreforBiodiversityDynamics,DepartmentofBiology,NorwegianUniversityofScienceandTechnology,Trondheim,Norway2NorwegianPolarInstitute,Tromsø,Norway3ArcticCentre,UniversityofGroningen,Groningen,TheNetherlands
CorrespondenceKateLayton‐Matthews,CentreforBiodiversityDynamics,DepartmentofBiology,NorwegianUniversityofScienceandTechnology,Trondheim,Norway.Email:[email protected]
Funding informationResearchCouncilofNorway,Grant/AwardNumber:276080,244647,273451and223257;NederlandseOrganisatievoorWetenschappelijkOnderzoek;EU;OrganizationforScientificResearchNWO;MinistryofForeignAffairs;BIRDHEALTH,Grant/AwardNumber:851.40.071;GeeseonArcticTundra,Grant/AwardNumber:866.12.407;NorwegianPolarInstitute;UniversityofGroningen
AbstractClimatechangeismostrapidintheArctic,posingbothbenefitsandchallengesformigratory herbivores. However, population‐dynamic responses to climate changeare generally difficult to predict, due to concurrent changes in other trophic lev‐els.Migratory species are also exposed to contrasting climate trends and densityregimesovertheannualcycle.Thus,determininghowclimatechangeimpactstheirpopulationdynamicsrequiresanunderstandingofhowweatherdirectlyorindirectly(through trophic interactions and carryover effects) affects reproduction and sur‐vival acrossmigratory stages,whileaccounting fordensitydependence.Here,weanalysetheoverallimplicationsofclimatechangeforalocalnon‐huntedpopulationofhigh‐arcticSvalbardbarnaclegeese,Branta leucopsis,using28yearsofindividual‐baseddata.Byidentifyingthemaindriversofreproductivestages(eggproduction,hatchingandfledging)andage‐specificsurvival rates,wequantifytheir impactonpopulationgrowth.RecentclimatechangeinSvalbardenhancedeggproductionandhatchingsuccessthroughpositiveeffectsofadvancedspringonset(snowmelt)andwarmersummers(i.e.earliervegetationgreen‐up)respectively.Contrastingly,there wasastrong temporaldecline in fledgingprobabilitydue to increased localabun‐danceoftheArcticfox,themainpredator.Whileweatherduringthenon‐breeding season influenced geese through a positive effect of temperature (UK winteringgrounds)onadultsurvivalandapositivecarryovereffectofrainfall (springstopo‐versiteinNorway)oneggproduction,thesecovariatesshowednotemporaltrends.However,density‐dependenteffectsoccurredthroughouttheannualcycle,andthesteadily increasingtotalflywaypopulationsizecausednegativetrendsinoverwin‐tersurvivalandcarryovereffectsoneggproduction.Thecombinationofdensity‐ dependent processes and direct and indirect climate change effects across lifehistorystagesappearedtostabilizelocalpopulationsize.Ourstudyemphasizestheneedforholisticapproacheswhenstudyingpopulation‐dynamicresponsestoglobalchangeinmigratoryspecies.

2 | LAYTON‐MATTHEWS ET AL.
1 | INTRODUC TION
TheclimateischangingmostrapidlyintheArctic,asaconsequenceof Arctic amplification (Arft et al., 1999; Serreze & Barry, 2011).Climate change has disrupted abiotic and biotic processes (Høye,Post,Schmidt,Trøjelsgaard,&Forchhammer,2013;Postetal.,2009)andtherebythepopulationdynamicsofmanyspecies,throughal‐teredsnowpackcharacteristics (Hansenetal.,2019),phenologicalmismatch(Clausen&Clausen,2013;Doiron,Gauthier,&Lévesque,2015;Post&Forchhammer,2008)andchanges invegetationpro‐ductivity (‘Arctic greening’) and structure (e.g. Fauchald, Park,Tømmervik,Myneni,&Hausner,2017).
Earliersnowmelthas longbeenrecognizedasoneof thepre‐vailingindicatorsofArcticclimatechange(Foster,1989).Thesnow‐freeseason,andthusthegrowingseason,isextremelyshortathighlatitudes. Earlier snow melt may therefore benefit Arctic wildlifepopulations(Gareth,2004)andespeciallyherbivores.Warmertem‐peraturesandadvancingspringshave increasedplantproductivity(Bjorkman, Elmendorf, Beamish, Vellend, & Henry, 2015; Jensen etal.,2008),providingmorefoodforbothresidentandmigratoryherbivores (Hill & Henry, 2011; Van der Wal & Stien, 2014) andpotentially increasing reproduction, survival and, in turn, popu‐lation sizes. Positive trends associated with climate change havebeenobserved in someArcticherbivorepopulations (Albonetal.,2017;Forchhammeretal.,2008;Morrissette,Bêty,Gauthier,Reed,& Lefebvre, 2010). However, there has been little evidence for ageneral patternof increase (Post et al., 2009). Thismaybepartlyexplainedbynegativeeffectsof‘trophicmismatch’(i.e.poortimingofreproductioninrelationtoresourcepeaks),limitingthepotentialbenefits of earlier andwarmer springs (Clausen&Clausen, 2013;Doironetal.,2015;Sainoetal.,2011), aswell aschangingwinterconditions (Forchhammer, Post, Stenseth, & Boertmann, 2002;Hansenetal.,2019,2013;Kohler&Aanes,2004). Inaddition,cli‐matechangeeffectsmaybe indirect throughother species in theArcticcommunity,acrosstrophiclevels(Forchhammeretal.,2008;Hansenetal.,2013;Postetal.,2009),causingchangesin‘bottom‐up’and‘top‐down’processes(Forchhammeretal.,2002;Gauthier,Bêty,Giroux,&Rochefort,2004).Arcticherbivorepopulationsareoftenstronglyinfluencedbybottom‐upprocesses(i.e.foodresourceavail‐ability;Barrioetal.,2016).FluctuationsinArcticfox,Vulpes lagopus,abundancealsohasdistincttop‐downeffectsonpopulationdynam‐ics,affectingreproductivesuccess ingeese (Gauthieretal.,2004;Loonen, Tombre, & Mehlum, 1998) and survival in voles (Ehrich etal.,2017)andlemmings(Angerbjorn,Tannerfeldt,&Erlinge,1999).
The Arctic is the breeding grounds for many migratory spe‐cies (Dickey, Gauthier, & Cadieuz, 2008). Long‐distance migrants(suchasthosebreedinginthehighArctic)occupywidelyseparated
habitatsacrosstheannualcycleandarethereforeexposedtodiffer‐entclimateregimesandtrends,andalsopotentiallycontrastingden‐sity‐dependent effects (Both, Bouwhuis, Lessells,&Visser, 2006;Hüppop &Winkel, 2006; van Oudenhove, Gauthier, & Lebreton,2014).Thetimespentonmigrationoftenaccountsforalargepro‐portionoftheannualcycleandindividualsaredependentonfoodresources at each migratory stage. Therefore, climate‐inducedchanges inplantproductivityand the timingof theplantgrowingseasoncanbeamajorsourceofmortality (Newton,2006,2007).Consequently,migrantsmay be particularly vulnerable to climatechange(Robinsonetal.,2009),aspossiblyreflectedinthedecliningtrendsreportedforseverallong‐distancemigrantpopulations(Bothetal.,2006).However,predictingtheirpopulationresponsestocli‐mate change clearly dependsonunderstanding how climate—andotherdrivers—affectsvitalratesateachstageoftheannualcycle.ReproductivesuccessinArcticnestinggeeseislargelydeterminedbyweatherconditionsduringthebreedingseason(Bêty,Gauthier,&Giroux,2003;Madsenetal.,2007;Prop&deVries,1993),butconditions earlier in the annual cycle may also affect individualsat later stages via carryover effects. Especially in capital breed‐ers,nutrientsaccumulatedpriortothebreedingseasondeterminebodyconditionandtherebyaffectreproduction(Ingeretal.,2010;Sedinger,Schamber,Ward,Nicolai,&Conant,2011).Carryoveref‐fectscancontributesubstantiallytoreproductivesuccessandthuspopulationdynamicsinArcticgoosepopulations(Marra,Hobson,&Holmes,1998;Norris,2005).
Theextenttowhichclimatechangeaffectspopulationdynam‐ics alsodependsona species' lifehistory (Sætheret al., 2013). Inlong‐livedspeciessuchasgeese,populationgrowth isoftenmoresensitive tovariation in survival than reproduction.Consequently,reproductionmaybemoresusceptibletoenvironmentalvariability(Gaillard&Yoccoz,2003;Morris&Doak,2004)andthereforecli‐mate change (Koons,Gunnarsson, Schmutz,&Rotella, 2014). It isalsocrucialtoaccountforintrinsicregulationofpopulationdynam‐icsthroughdensitydependencewhenstudyingtheeffectsofenvi‐ronmental variation (Sæther et al., 2006). Total flyway populationsizes have been steadily increasing inmost EuropeanArctic‐nest‐inggoosepopulations,largelyduetohuntingbanssincethe1950s(Fox & Madsen, 2017) and shifts in agriculture (Fox & Abraham,2017). This increase has resulted in range expansion across theArctic (Kondratyev, Zaynagutdinova, & Kruckenberg, 2013;Owen& Norderhaug, 1977). While local density‐dependent effects onreproduction have been found in some populations (Bruggeman,Swem,Andersen,Kennedy,&Nigro, 2015;Ebbinge,Heesterbeek,Ens,&Goedhart,2002;Layton‐Matthewsetal.,2019),densityde‐pendencemayalsobeexpectedtoaffectsurvivalatotherstagesintheannualcycle(Frederiksen&Bregnballe,2000).
K E Y W O R D S
Arcticamplification,Arcticgeese,barnaclegoose,carryovereffects,climatechange,migration,populationdynamics,trophicinteractions

| 3LAYTON‐MATTHEWS ET AL.
Arcticnestinggeeseplayakeytrophicrolebothasherbivores(Bazely& Jefferies,1989;Fujita&Kameda,2016) andprey (Bêty,Gauthier, Korpimäki, & Giroux, 2002), providing nutrient trans‐fer within and between temperate and Arctic ecosystems (Hahn,Loonen,&Klaassen,2011;Hessen,Tombre,vanGeest,&Alfsnes,2017). Substantial differences in local population trends of geeseattheirArcticbreedinggroundshavebeenreported(Jensenetal.,2008;Lamerisetal.,2018;Morrissetteetal.,2010).Disentanglingthedriversofthesetrends iskeytoapredictiveunderstandingoffuture climate change implications. Besides the potential issue ofmismatch in migratory timing with peak food abundance (Dickey etal.,2008;Kölzschetal.,2015;Lamerisetal.,2017),futureclimatechange will likely disrupt other processes affecting reproductionandsurvival,forinstancethroughtrophicinteractions(Ims,Jepsen,Stien,&Yoccoz,2013).Here,weassessthecontributionsofclimate,trophicinteractionsanddensitydependencetopopulationdynam‐ics of a local, non‐hunted population of Svalbard barnacle geese,Branta leucopsis. Using individual‐based mark–recapture data, wedeterminethemaindriversofeachreproductivestage(egglaying,hatching and fledging) and age class‐specific survival, across theirannual cycle.Wequantify the contributionsofdirect and indirectdrivers to population growth using a retrospective perturbationanalysisandinvestigatehowtemporaltrendsinenvironmentalvari‐ablesinfluencepopulationgrowth.
2 | MATERIAL S AND METHODS
2.1 | Study population
TheSvalbardbarnaclegoosepopulationoverwintersatSolwayFirth,Scotland(UK;55°N,3.30°W),beforeflyingtoSvalbardforbreedinginsummer,withaspringstopoveratHelgelandonthecoastofmain‐landnorthernNorway(65°45′N,12°E;Figure1).Barnaclegeeseareclose to thecapitalendof thecapital–incomebreedingspectrum,investing between 23% and 88% of body stores acquired furthersouth ineggproduction (Hahnetal.,2011).Westudiedapopula‐tionbreedingclosetothesettlementofNy‐Ålesund,northwesternSvalbard (78°55′N, 11°56′E) that arrives in lateMay andnests onislandsinthefjord(Kongsfjorden).Hatchingoccursaroundthe1July(range:19June–19July)andafterhatching,familiesleavethenest‐ing islands to forage along the coast.Offspring fledge at the endofAugustandindividualsleavethebreedinggroundsinSeptember(Figure 1). Barnacle geese typically begin breeding as 2 year olds(Forslund&Larsson,1992;Owen,1980).
2.2 | Data collection
Individualmark–recapturedatafrombothsexeswerecollectedfromthenestingislandsandcoastalareaaroundNy‐Ålesund(seeSection2.2).Usingthesedata,weassessedtheeffectsofclimate,populationsizeandpredation(seeSection2.3)onthreestagesofreproduction(egglaying,hatchingandfledging),aswellasonapparentsurvivaloffledglings(0yearold)andadults(1–28yearsold).Weidentifiedthe
bestmodelswith covariatesof reproductionusing apath analysisframeworkandmodelselection(seeSection2.4)anddeterminedthebest‐fittingsurvivalmodelusingmodelselection(seeSection2.5). We developed a population matrix projection model using thebest‐fitting models of vital rates, to quantify the contribution ofcovariatestopopulationgrowthusingaretrospectiveperturbationanalysis(seeSection2.6).
The study area consists of two nesting islands, StorholmenandPrinsHeinrichsøya, and the area close to the settlement ofNy‐Ålesund, where goose families forage on tundra vegetation.Theanalysiswasconductedon individual‐baseddata from1990to2017(ringingofindividualsbeganin1989).Threethousandtwohundredandninetynestsweremonitoredover this28yearpe‐riod. The islandswere visited at 1 or 2 day intervals during thenestingperiod.Femaleswithaclutch(n=5,828)wereidentifiedand the clutch size (maximumnumberof eggs per nest)was re‐corded (n=2,111).Dataonclutchsizewerenotrecorded in theyears1994,1997,2000,2002and2004asthe islandswerenotvisited.
Over the study period, 3,487 individuals (goslings and olderbirds)havebeencaughtaroundNy‐Ålesundandringedwithunique,engravedcolourandmetalrings,duringthemoultingphaseinJulyandearlyAugust.Duringacatch,sexwasdeterminedbycloacalin‐spection.Duringthebrood‐rearingphaseinJuly–August,twice‐dailyring readings took place andwhether a female had any offspring
F I G U R E 1 MigrationrouteandtimingofkeyeventsforSvalbardbarnaclegeese.BarnaclegeeseoverwinteratSolwayFirth,Scotland(blue),beforetravellingtowesternSvalbardforbreeding(pink)viaastopoveronthecoastofmainlandNorway(green).Thetimingofmigrationsandreproductiveevents(nesting,hatching,moultingandfledging)areshownintheoutercircle(NB:failedbreederscanmoultearlierthanshownhere)
4 | LAYTON‐MATTHEWS ET AL.
(n=5,872)andthenumberofgoslingsassociatedwiththeparentwas recorded (n=2,799).Themaximumnumberoffledgedgoslingsper femalewas recorded inmid‐August (n=1,976).Observationaldataformodellinghatchingandfledgingwerenotrecordedfortheyear 2004. Annual sample sizes for each parameter are shown inAppendixS1.
2.3 | Covariates
Weincludedcovariatesdescribingpopulationsize,weatherandpre‐dationthatcouldaffectreproductiveandsurvivalratesoverthean‐nualcycle,fortheyears1990–2017.
2.3.1 | Scotland: Wintering grounds
For the wintering period in Scotland, mean daily minimum andmaximumtemperatureandprecipitationdataweretakenfromtheEskdalemuirweatherstation(55°39′N,3°21′W),40kmfromSolwayFirth,providedbytheUKMeteorologicalOffice(metoffice.gov.uk,2018). Annual averages were calculated for the period October–March (Tscot,min, Tscot,max, Pscot; minimum and maximum tempera‐tureswereusedsincemeantemperaturevalueswerenotavailable).Svalbard flyway population size (Nscot), recorded at the winteringgrounds in Scotland (Trinder, 2014;WWT,2017),was included todetermine whether density‐dependent effects at the winteringgrounds,viaflywaypopulationsize,affectedsurvival.
2.3.2 | Helgeland: Spring stopover site
ForthespringstopoversiteatHelgeland,dailymeantemperatureandprecipitationvalues for theperiodApril–MaywerebasedondatafromtheVegaweatherstation(65°38′N,11°52′E),withinthespringrangeofbarnaclegeese.AnnualmeansfortheperiodApril–Maywerecalculatedfromthedailydata(Thelg,am,Phelg,am).Wealsotestedforaneffectofthesumofpositivetemperaturesabove6°C(Thelgsum6), sincenetgrassgrowth ispositiveabove this threshold(Prop,Black,Shimmings,&Owen,1998).DatawereobtainedfromtheNorwegianMeteorologicalInstitute(eklima.met.no,2018).
2.3.3 | Svalbard: Breeding grounds
Covariates describing initial conditions at the breeding grounds(Ny‐Ålesund, Svalbard) included cumulated snowfall fromNovembertoApril(snowsval;seePeetersetal.,2019)anddateofspring onset (range: 13May–21 June). Spring onset (SOsval) de‐scribesthedate (Julianday)atwhichthe10daysmootheddailytemperaturecrossed0°Candremainedabovethisthresholdforatleast10days(LeMoullec,Buchwal,vanderWal,Sandal,&Hansen,2019).Dailymeantemperatureandprecipitationdatawereusedtocalculateaveragesformid‐Junetomid‐July(Tsval,jj,Psval,jj)andmid‐Julytomid‐August(Tsval,ja,Psval,ja).Thesecovariatesmayinfluenceconditionsduringhatchingand fledgingsincemeantemperatureisagoodpredictorofplantphenology,whilevariation inrainfall
relatestoplantgrowingconditions(Jia,Epstein,&Walker,2009;Prop&Black,1998),potentiallyexplainingvariationinreproduc‐tionvia indirecteffectson food resourceavailability.DataweretakenfromthemannedNy‐Ålesundweatherstation,operatedbytheNorwegianMeteorologicalInstitute.AnnualestimatesofadultnumbersinthestudypopulationaroundNy‐Ålesund(i.e.asubsetofthetotalSvalbardbreedingpopulation)wereincluded(Nsval,ad),totestfordensity‐dependenteffects(seeLayton‐Matthewsetal.,2019fordetails).TheArcticfoxisthemainpredatorofeggsandgoslings, but also adults (Eide, Stien,Prestrud,Yoccoz,&Fuglei,2012;Fuglei,Øritsland,&Prestrud,2003;Pedersenetal.,2018).Consequently,goslingsurvivalcanbestrongly influencedby foxpredation(Loonenetal.,1998;Morrissetteetal.,2010).Weuseda measure of Arctic fox predation (foxsval) around Ny‐Ålesund,based on annual records of the proportion of known den siteswithpupproductionduringthesummerperiodfrom1993to2017(theannualArcticfoxmonitoringprogramoftheNorwegianPolarInstitute).Weassumedalinearincreasefromzerodenswithpupsin1990to1993,sincedatawerenotavailablefor1991and1992(Fugleietal.,2003).
Inaposthocanalysis,weinvestigatedthecorrelationsbetweenclimatevariables included inthebest‐fittingreproductivemodelsand variables describing the timing of snow melt, the timing ofplantgrowthonsetandplantproductivity.Toassesswhethertheestimated springonset date (SOsval)was a goodproxy for timingofsnowmelt(i.e.whennestsitesbecomeavailable),weregressedSOsvalagainstameasureofthetimingofsnowmeltatNy‐Ålesundfortheyears1993–2016(Maturilli,Herber,&König‐Langlo,2015).We regressed Tsval,jj against ameasure of the onset of the plantgrowingseason,definedasthemean(Julian)datewhenthepixel‐specific Normalized Difference Vegetation Index (NDVI) valuesexceeded70%ofmid‐summerNDVI (Karlsen,Anderson,VanderWal, & Hansen, 2018; Karlsen, Elvebakk, Høgda, & Grydeland,2014),whichwasavailablefortheyears2000–2014.Psval,ja was re‐gressedagainstaveragestandingcropofPoa arctica,animportantfoodsource forbarnaclegeese (i.e. aproxy for foodavailability).Repeated measurements were taken between July and Augustfromexclosures (topreventgrazing), aspartofa long‐termplantexperimentatNy‐Ålesundfortheyears2004–2016(AppendixS2).
2.4 | Reproduction
Reproductionwasmodelledinthreestagestoinvestigatethestep‐wisemechanismsdeterminingrecruitmentoffledglings.Egglaying(C and E) was based on data from the nesting islands and (post‐)hatching(H and G)andfledging(F)werebasedondatafromringedindividualsaroundNy‐Ålesund.
Two variables were used to describe the egg laying phase,C and E,whereCistheproportionofnestingfemalesobservedwitha clutch, and E is the number of eggs per clutch. To estimateC,dataonwhether a femalewasobservedwith at least oneegg inthenest(0/1)werefittedasabinomiallydistributedresponsevari‐able.ToestimateE,dataonthenumberofeggsperclutch(range:

| 5LAYTON‐MATTHEWS ET AL.
1–9)were fitted as a normally distributed response variable. Thevariables H and Gquantifiedtheaveragegoslingproductionperfe‐male breeder. H,hatchingsuccess, is theestimatedproportionoffemaleswithatleastonegoslingaroundNy‐Ålesund.Observationdatawere fittedusingabinomialdistribution for the response.G istheexpectednumberofgoslingspersuccessfulfemaleanddataweremodelledwithaPoissondistribution(notethat‘hatching’re‐fers to the firstobservationof a femalewithgoslingswhen theyreturnfromthenestingislands).Fdescribestheproportionofgos‐lingsfledginganddataweremodelledwithabinomialdistribution.Allmodelswerefittedas(generalized)linearmixed‐effectsmodels,withfemaleIDandyearasrandomeffectsinadditiontootherco‐variates.Allmodelswerefittedusingcanonicallinkfunctions.Sincereproductivesuccessinbarnaclegeesehasbeenshowntoincreaseuntilage5(Black,Prop,&Larsson,2014;Forslund&Larsson,1992),wetestedforage(class)effectsinaninitialanalysis.Webeganwithamodelwithfiveageclasses(wherethefifthclassincludesindivid‐uals≥5yearsold)andprogressivelyreducedthenumberofclasses.Akaike's information criterion adjusted for small sample sizes(AICc)wasusedtoidentifythebest‐fittingagemodel(Burnham&Anderson,2002).
Covariates included in the candidate model set of egg laying (C and E)includedTscot,min,Tscot,max,Pscot and NscotinScotland,Thelg,am,Phelg,am and Thelgsum6atHelgeland(i.e.carryovereffects)andSOsval,snowsval and Nsval,adonSvalbard.Thecandidatemodelsetofhatch‐ing (H and G) includedTsval,jj,Psval,jj, foxsval and Nsval,adandthecan‐didatemodel setof fledglingprobability (F) includedTsval,ja,Psval,ja,foxsval and Nsval,ad.
Confirmatorypathanalysis (Shipley,2000,2009)wasusedtoidentifytheimportant intrinsicandextrinsicdriversofreproduc‐tion.We constructed a pathdiagramwith all proposed linksbe‐tweencovariatesandresponsevariablesandtestedtheproposedindependence relationships among variables using d‐separationtests (Appendix S3; Shipley, 2009, 2016). To account for depen‐denciesamong reproductive stages, the responsevariableE was entered as a predictor in the models of the later reproductivestagesH and G,andGwas included inthemodelofF (AppendixS4.1). Best‐fitting models for each of the five reproductive pa‐rameterswereidentifiedseparately(C,E,H,G and F).Toevaluatethebest‐fittingmodelofreproductionwithcovariates,werankedmodelsaccordingtotheirAICcandalsoexaminedwhethertheyex‐plainedasignificantamountofdeviancebyperformingananalysisofdevianceusingthepackage‘afex’(Singmann,Bolker,&Westfall,2015).
Means and 95% confidence intervals were calculated for allcovariateeffects in thebest‐fittingmodelsofeach responsevari‐able.(Generalized)linearmixed‐effectsmodelsweremodelledinR,version3.5.0(RCoreTeam,2018)usingthepackage‘lme4’(Bates,Mächler,Bolker,&Walker,2014),andd‐separationtestswereper‐formedusing ‘piecewiseSEM’ (Lefcheck,2016).Allcovariateswerestandardized, including reproductive parameterswhen entered asexplanatoryvariables.
2.5 | Survival
We estimated age‐specific, apparent (we could not distinguish be‐tweenmortality andpermanent emigration) survival rates basedonmark–recapturedatafromNy‐Ålesund.Survivalrateswereestimatedwith a Cormack–Jolly–Seber framework, in the RMark interface(Laake,2013)forprogramMARK(White&Burnham,1999).Survivalrateswere modelled for two age classes, fledglings (ϕf) and adults(ϕad),whereadisapooledageclassfrom1to28years(i.e.maximumobservedage)old.Survival rateswerenot found tobesexspecific.Detectionprobabilitywasmodelledassex,butnotage,specificsincefemale philopatry is often higher thanmale philopatry (Black et al.,2014)andnoeffectofagewas found inapreviousanalysisof thisstudy population (Layton‐Matthews et al., 2019). Accordingly, thisanalysisalsoshowedthatdetectionprobabilitieswerehigherforfe‐males (mean:0.62;95%confidence interval:0.60,0.65) thanmales(0.55;0.54,0.56).SurvivalwasmodelledfromAugust(i.e.atthetimeoffledgling)untilAugustthefollowingyear.Basedonasurvivalmodelwithtwoageclasses,ϕf and ϕad,wedevelopedacandidatemodelsetwithallcombinationsofstandardizedcovariatesfromthewinterandspringlocations(seeSection2.3)thatwerenothighlycorrelated.
Covariates from thewintering grounds and the spring stopoversitewere included in thecandidatemodel setof survival (AppendixS4.2),sincesubstantialnaturalmortalityoccursduringmigrationandparticularly the autumnmigrationwhen individuals flydirectly fromSvalbard toScotland (Owen&Black,1989,1991b). Summer condi‐tionslikelyinfluencebodyconditionandmortalityduringtheautumnmigration, however, sincewewere not able to distinguish seasonalsurvivalrates,onlycovariatesfromlaterstagesintheannualcycle(i.e.thewinteringgroundsandspringstopoversite)wereincluded.Arcticfoxabundance(foxsval)wasincludedasapotentialcauseofmortalityduringthesummerpriortothecensus.Todeterminethebest‐fittingadditivemodelofsurvivalwithcovariates,wefirstrankedmodelsac‐cordingtoAICcandthenperformedananalysisofdevianceinprogramMARK.Afteridentifyingthebestadditivemodel,wedeterminedthebestmodelwithinteractioneffectsbetweenageclassandcovariatesusingthesameapproach.
Toinvestigatethepotentialinfluenceofclimatechangeonrepro‐ductionandsurvival,wetestedfortemporaltrendsintheestimatedvital rate parameters and covariates from the best‐approximatingmodels,byfittinglinearregressionswithacontinuousyeareffectasanexplanatoryvariable.
2.6 | Population dynamics
Weconstructed a 2 × 2 population projectionmatrix, basedon apost‐breedingcensus,correspondingtothefledglingandadultageclasses. Inaccordancewithapost‐breedingcensus,recruitmentoffledglingsincludedadult(i.e.breeder)survival,ϕad,sincetheymustsurvivealmostafullyearbeforereproducing.Thetopleftmatrixele‐mentiszerosince1yearoldbirdsgenerallydonotreproduce.ThereproductiveratesH(whichwasnolongerconditionalonC and E),G and Fweredividedby2tocalculatethenumberoffledglingsper

6 | LAYTON‐MATTHEWS ET AL.
female.C and Ewerenotincluded,sincethiswouldinflatereproduc‐tiverates(bothE and Haretheexpectednumberofoffspringperfemaleatdifferentstagesofthereproductivecycle).Consequently,covariatesinfluencingC and EwereincludedaseffectsonHinstead.Theresultingpopulationprojectionmatrixwas
Wecalculatedtheasymptoticpopulationgrowthrate(λ)asthedominanteigenvalueofthepopulationprojectionmatrix,calculatedatthemeanvalueofcovariatesincludedinthebest‐fittingmodels.Weaccountedforuncertaintyinmodelregressioncoefficientsbyassumingthatregressioncoefficientsarisefromamultivariatenormaldistribution,wheretheco‐efficientsandvariance–covariancematrixfromeachmodelprovidedthemeansandvariance–covariancematrix(Gelman&Hill,2006).Vitalrateswerepredictedusingtheregressioncoefficientssampled10,000timesfrom the multivariate normal distribution. Population matrices wereconstructedwitheachsampleofvitalratestocalculatethemeanpop‐ulationgrowthratewith95%confidenceintervals.Usingthisapproach,wedeterminedthechangeinλwhenvitalratesinthepopulationmatrixwerepredictedata lowvalueofacovariate (5thquantile)andahighvalue(95thquantile).Thisdifferenceinλwasdecomposedintovitalratecontributionsusingalifetableresponseexperiment(LTRE),acommonretrospectiveperturbationanalysis(Caswell,1989;Horvitz,Schemske,& Caswell, 1997). The contribution of a covariatewas calculated astheproductof(a)thedifferenceintheaffectedvitalratebetweenthetwomatrices(5thvs.95th);and(b)thesensitivityofλtothatvitalrate.Sensitivitieswerecalculatedanalyticallyusingthechainrule (Caswell,2001).AnalysisoftheprojectionmatrixwasconductedinRusingourowncodeandthe‘popbio’package(Stubben&Milligan,2007).
3 | RESULTS
3.1 | Reproduction
Thebest‐fittingpathmodelforreproductionincludeddependenciesamongreproductivephases (i.e.egg laying,hatchingandfledging),
as well as effects of population size, climate, predation and car‐ryovereffectsfromthespringstopoversiteandwinteringgrounds(Figure 2). None of the response variables were found to be agedependent.
The model of clutch success (C) with the lowest AICc included dateofspringonset(SOsval),wherealateronsethadanegativeeffect(Figure2).ThismodelalsoincludedpositivecarryovereffectsoftheaveragemaximumdailytemperaturefromOctobertoMarch(Tscot,max)atthewinteringgrounds inScotlandandmeanApril–Mayprecipita‐tionatthespringstopoversiteatHelgeland(Phelg,am;AppendixS5.1.1).However,thedifferencebetweenthelowestAICcmodelandonewithonlySOsval was negligible (ΔAICc=0.35).Tscot,max and Phelg,am were only presentinfiveandfourofthetopninemodels,respectively,anddidnotexplainasignificantamountofvariance,basedontheanalysisofdeviance(AppendixS5.2).However,thedifferenceinAICcwithSOsval andthenullmodelwasgreaterthan2(ΔAICc=2.40).Therefore,thebest‐approximatingmodelofConlyincludedaneffectofSOsval.
Themodelofclutchsize(E)withthelowestAICc also included a negativeeffectofSOsval,anegativecarryovereffectofpopulationsizeatthewinteringgrounds(Nscot)andapositiveeffectofPhelg,am (AppendixS5.1.2;Figure3a–c). SOsval and Phelg,amwerepresent inall nine of the top models and explained a significant amount ofvariation(AppendixS5.2).Nscotwaspresent ineightofnineofthetopmodelsandexplainedasignificantamountofdeviance(p=.03).ThedifferenceinthelowestAICcmodelandamodelwithoutNscot was1.64,andsothebest‐approximatingmodelofEincludedSOsval,Phelg,am and Nscot.
ThelowestAICcmodelofhatchingsuccess(H)includedpositiveeffectsofclutchsize(E),whichwaspresentinalltop10models,andmid‐June tomid‐July temperature (Tsval,jj; Figure3d).Although thenextbestmodel (ΔAICc=1.04)only includedaneffectofE,Tsval,jj waspresentinfouroffivetopmodelsandtheamountofvarianceitexplainedwasclosetobeingsignificantatthe.05level(p=.08).AnegativeeffectofNsval,adwasonlyincludedin40%ofthetopninemodels(AppendixS5.1.3)andsothebest‐approximatingmodelofH included E and Tsval,jj.
ThelowestAICcmodelofthenumberofgoslings(G)includedapositiveeffectofEandweaknegativeeffectsofNsval,adandfoxsval.
⎡⎢⎢⎣
0(�휙ad ×H×G× F)
2
�휙f �휙ad
⎤⎥⎥⎦.
F I G U R E 2 Best‐fittingpathmodeldiagramforthereproductivestages,withstandardizedslopecoefficientsandassociated95%confidenceintervalsinbrackets

| 7LAYTON‐MATTHEWS ET AL.
Ewasconsistentlypresentinall10ofthetop‐rankingmodels,whileNsval,adwaspresentin60%andfoxsvalin70%(AppendixS5.1.4).BothNsval,adandfoxsvalwerecloseto,butnot,significantatthe.05level(PNsval,ad = 0.07; Pfoxsval=0.08).AweakpositiveeffectofTsval,jj and a weaknegativeeffectofPsval,jjwerebothpresentin40%ofthetop10models.SinceNsval,adandfoxsvalwerebothconsistentlypresentinthetopmodelsandclosetobeingsignificant,weconsideredthebest‐approximatingmodelofGtoincludeE,Nsval,adandfoxsval.
ThelowestAICcmodeloffledgingprobability(F)includednega‐tiveeffectsofG,foxsval(Figure3e)andmid‐Julytomid‐Augustpre‐cipitationonSvalbard (Psval,ja;AppendixS5.1.5).G was included in alleight top‐rankingmodels, foxsvalwas included insevenofeightand theamountofvariancebothcovariatesexplainedwassignifi‐cant(p<.01).Althoughthesecond‐bestmodeldidnotincludePsval,ja (ΔAICc=1.29)andPsval,jadidnotexplainasignificantamountofvari‐ationatthe.05significancelevel(p=.07),thisvariablewasincludedinthreeoffourtop‐rankedmodelswithaconsistentlystrongneg‐ative effect.Consequently,we considered the best‐approximatingmodelofFtoincludeG,foxsval and Psval,ja.
TherewasastrongpositivecorrelationbetweenSOsvalandthetim‐ingofsnowmelt,wherethestandardizedcorrelationcoefficientwas0.65(0.24,1.07) (R2=0.31),andanegativecorrelationbetweenmid‐Junetomid‐July temperature (Tsval,jj) andthedateofplantgrowthonset (−0.78;
−1.15, −0.41; R2 = 0.61). Tsval,jj was also strongly negatively correlated(−0.89;−1.06,−0.72)withthedateatwhichtemperaturesumonSvalbardreached180°C(plantgrowingdegree‐days,GDD)(VanWijketal.,2012).Therewasalsoanegativecorrelation(−0.64;−1.06,−0.21;R2=0.49)be‐tweenmid‐Julytomid‐Augustprecipitationandthestandingcropofthegrass P. arctica,animportantfoodspeciesforbarnaclegeese(AppendixS2).
3.2 | Survival
Apparentsurvivalwaslowerforfledglings(0.62;confidenceinter‐val:0.59,0.65)thanforadults(0.83;0.80,0.84).Thebest‐fittingmodel of survival included a positive effect of minimumwintertemperatureinScotland(Tscot,min)andanegativeeffectofflywaypopulationsizeinScotland(Nscot;Figure4a),aswellasweaknega‐tiveeffectsoffoxabundanceatNy‐Ålesund(foxsval)andprecipita‐tionatHelgeland(Phelg,aprmay)andapositiveeffectofthesumofpositivetemperaturesabove6°CatHelgeland(Thelg,sum6;AppendixS5.3). However, only Tscot,min and Nscot explained a significantamountofvariancebasedontheanalysisofdeviance (AppendixS5.4).Amodelwithan interactioneffectbetweenageclassandNscotwasabetterfitthanthebestadditivemodel(ΔAICc=4.18)since Nscot had amore negative effect on adults than fledglings(Figure4b;AppendixS5.5).
F I G U R E 3 Modelpredictionswith95%confidenceintervals,describing(a,b)thecarryovereffectsof(a)flywaypopulationsizeinScotland(Nscot)and(b)springprecipitationatHelgeland(Phelg,am),and(c–e)thedirecteffectsof(c)theonsetofspring(SOsval)attheSvalbardbreedinggroundsonclutchsize(E),(d)summertemperatureonSvalbard(Tsval,jj)onhatchingsuccess(H)and(e)foxabundance(foxsval)onfledgingprobability(F).Datadistributionsareshownonthex‐axisasrugs
F I G U R E 4 Modelpredictionswith95%confidenceintervalsdescribingtheeffectof(a)Scotlandwintertemperature(Tscot,min)and(b)totalflywaypopulationsize(Nscot)onthesurvivalrateoffledglings(ϕf)andadults(ϕad).Datadistributionsareshownonthex‐axisas rugs
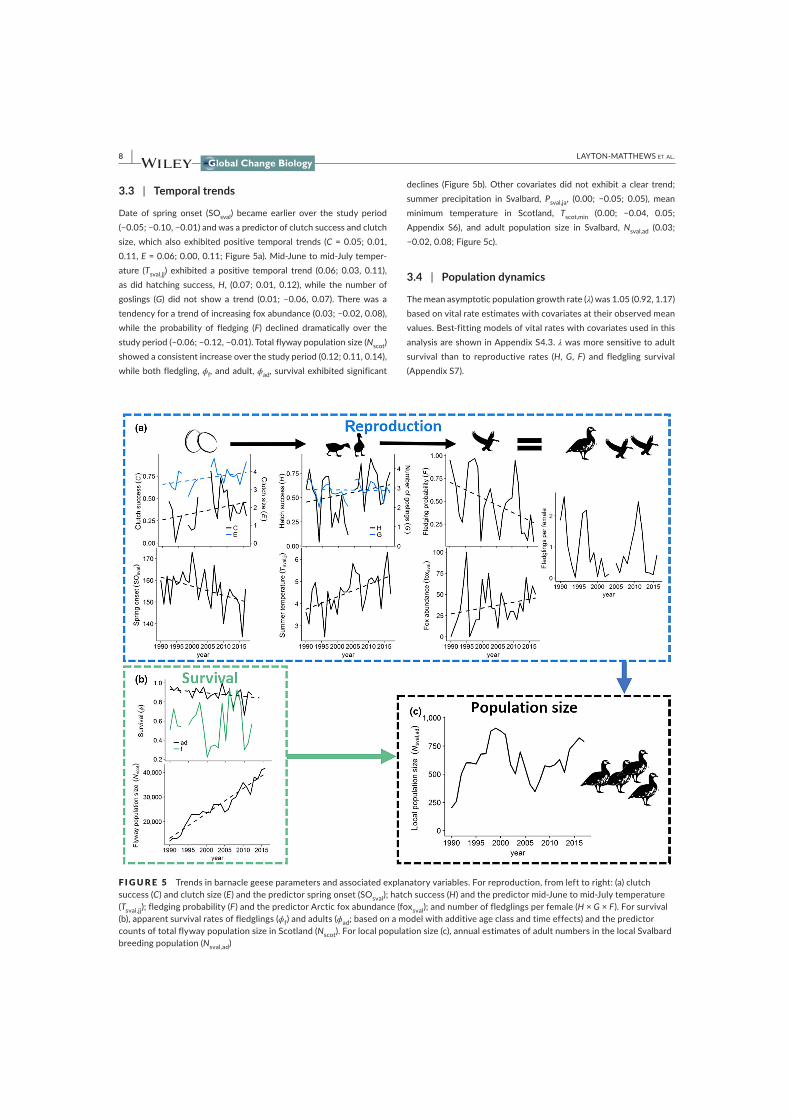
8 | LAYTON‐MATTHEWS ET AL.
3.3 | Temporal trends
Date of spring onset (SOsval) became earlier over the study period(−0.05;−0.10,−0.01)andwasapredictorofclutchsuccessandclutchsize,whichalsoexhibitedpositive temporal trends (C=0.05;0.01,0.11,E=0.06;0.00,0.11;Figure5a).Mid‐Junetomid‐Julytemper‐ature (Tsval,jj) exhibited a positive temporal trend (0.06; 0.03, 0.11),as didhatching success,H, (0.07;0.01, 0.12),while thenumberofgoslings (G) did not show a trend (0.01; −0.06, 0.07).Therewas atendencyforatrendofincreasingfoxabundance(0.03;−0.02,0.08),while the probability of fledging (F) declined dramatically over thestudyperiod(−0.06;−0.12,−0.01).Totalflywaypopulationsize(Nscot)showedaconsistentincreaseoverthestudyperiod(0.12;0.11,0.14),whilebothfledgling,ϕf,andadult,ϕad,survivalexhibitedsignificant
declines (Figure5b).Other covariatesdidnotexhibit a clear trend;summer precipitation in Svalbard, Psval,ja, (0.00; −0.05; 0.05), meanminimum temperature in Scotland, Tscot,min (0.00; −0.04, 0.05;Appendix S6), and adult population size in Svalbard,Nsval,ad (0.03; −0.02,0.08;Figure5c).
3.4 | Population dynamics
Themeanasymptoticpopulationgrowthrate(λ)was1.05(0.92,1.17)basedonvitalrateestimateswithcovariatesattheirobservedmeanvalues.Best‐fittingmodelsofvitalrateswithcovariatesusedinthisanalysisareshowninAppendixS4.3.λwasmoresensitivetoadultsurvival than to reproductive rates (H,G,F) and fledgling survival(AppendixS7).
F I G U R E 5 Trendsinbarnaclegeeseparametersandassociatedexplanatoryvariables.Forreproduction,fromlefttoright:(a)clutchsuccess (C)andclutchsize(E)andthepredictorspringonset(SOsval);hatchsuccess(H)andthepredictormid‐Junetomid‐Julytemperature(Tsval,jj);fledgingprobability(F)andthepredictorArcticfoxabundance(foxsval);andnumberoffledglingsperfemale(H×G×F).Forsurvival(b),apparentsurvivalratesoffledglings(ϕf)andadults(ϕad;basedonamodelwithadditiveageclassandtimeeffects)andthepredictorcountsoftotalflywaypopulationsizeinScotland(Nscot).Forlocalpopulationsize(c),annualestimatesofadultnumbersinthelocalSvalbardbreedingpopulation(Nsval,ad)
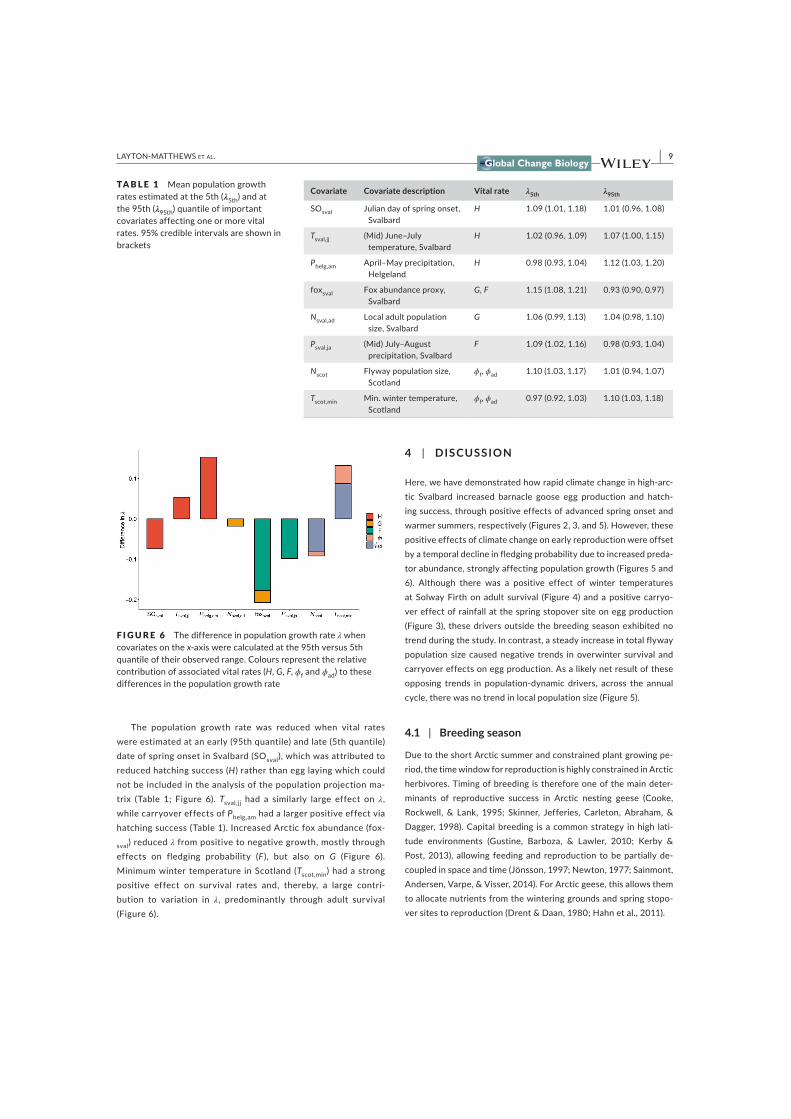
| 9LAYTON‐MATTHEWS ET AL.
The population growth rate was reduced when vital rateswereestimatedatanearly(95thquantile)andlate(5thquantile)dateofspringonsetinSvalbard(SOsval),whichwasattributedtoreducedhatchingsuccess(H)ratherthanegglayingwhichcouldnotbeincludedintheanalysisofthepopulationprojectionma‐trix (Table 1; Figure 6). Tsval,jj had a similarly large effect on λ,whilecarryovereffectsofPhelg,amhadalargerpositiveeffectviahatchingsuccess(Table1).IncreasedArcticfoxabundance(fox‐
sval)reducedλfrompositivetonegativegrowth,mostlythrougheffects on fledging probability (F), but also on G (Figure 6).Minimumwintertemperature inScotland(Tscot,min)hadastrongpositive effect on survival rates and, thereby, a large contri‐bution to variation in λ, predominantly through adult survival (Figure6).
4 | DISCUSSION
Here,wehavedemonstratedhowrapidclimatechangeinhigh‐arc‐tic Svalbard increased barnacle goose egg production and hatch‐ingsuccess,throughpositiveeffectsofadvancedspringonsetandwarmersummers,respectively(Figures2,3,and5).However,thesepositiveeffectsofclimatechangeonearlyreproductionwereoffsetbyatemporaldeclineinfledgingprobabilityduetoincreasedpreda‐torabundance,stronglyaffectingpopulationgrowth(Figures5and6). Although there was a positive effect of winter temperaturesatSolwayFirthonadult survival (Figure4) andapositivecarryo‐vereffectofrainfallatthespringstopoversiteoneggproduction(Figure3), thesedriversoutsidethebreedingseasonexhibitednotrendduringthestudy.Incontrast,asteadyincreaseintotalflywaypopulationsizecausednegative trends inoverwinter survivalandcarryovereffectsoneggproduction.Asalikelynetresultoftheseopposing trends in population‐dynamic drivers, across the annualcycle,therewasnotrendinlocalpopulationsize(Figure5).
4.1 | Breeding season
DuetotheshortArcticsummerandconstrainedplantgrowingpe‐riod,thetimewindowforreproductionishighlyconstrainedinArcticherbivores.Timingofbreedingisthereforeoneofthemaindeter‐minants of reproductive success in Arctic nesting geese (Cooke,Rockwell, & Lank, 1995; Skinner, Jefferies, Carleton, Abraham, &Dagger,1998).Capitalbreeding isacommonstrategy inhigh lati‐tude environments (Gustine, Barboza, & Lawler, 2010; Kerby &Post,2013),allowing feedingand reproduction tobepartiallyde‐coupledinspaceandtime(Jönsson,1997;Newton,1977;Sainmont,Andersen,Varpe,&Visser,2014).ForArcticgeese,thisallowsthemtoallocatenutrientsfromthewinteringgroundsandspringstopo‐versitestoreproduction(Drent&Daan,1980;Hahnetal.,2011).
Covariate Covariate description Vital rate λ5th λ95th
SOsval Juliandayofspringonset,Svalbard
H 1.09(1.01,1.18) 1.01(0.96,1.08)
Tsval,jj (Mid)June–July temperature,Svalbard
H 1.02(0.96,1.09) 1.07(1.00,1.15)
Phelg,am April–Mayprecipitation,Helgeland
H 0.98(0.93,1.04) 1.12(1.03,1.20)
foxsval Foxabundanceproxy,Svalbard
G, F 1.15(1.08,1.21) 0.93(0.90,0.97)
Nsval,ad Localadultpopulationsize,Svalbard
G 1.06(0.99,1.13) 1.04(0.98,1.10)
Psval,ja (Mid)July–August precipitation,Svalbard
F 1.09(1.02,1.16) 0.98(0.93,1.04)
Nscot Flywaypopulationsize,Scotland
ϕf,ϕad 1.10(1.03,1.17) 1.01(0.94,1.07)
Tscot,min Min.wintertemperature,Scotland
ϕf,ϕad 0.97(0.92,1.03) 1.10(1.03,1.18)
TA B L E 1 Meanpopulationgrowthratesestimatedatthe5th(λ5th)andatthe95th(λ95th)quantileofimportantcovariatesaffectingoneormorevitalrates.95%credibleintervalsareshowninbrackets
F I G U R E 6 Thedifferenceinpopulationgrowthrateλ when covariatesonthex‐axiswerecalculatedatthe95thversus5thquantileoftheirobservedrange.Coloursrepresenttherelativecontributionofassociatedvitalrates(H,G,F,ϕf and ϕad)tothesedifferencesinthepopulationgrowthrate
10 | LAYTON‐MATTHEWS ET AL.
Inthisstudy,clutchsuccessandclutchsizewerenegativelyaf‐fected by the date of spring snowmelt. The timing of snowmeltlargely dictateswhen individuals can start breeding and is an im‐portantdeterminantofbreedingsuccessinArcticgeese(i.e.greatersnow geese, Chen caerulescens, Reed, Gauthier, & Giroux, 2004;pink‐footedgeese,Anser brachyrhynchus,Madsenetal.,2007;pale‐belliedbrentgeese,Branta bernicla hrota,Barry,1962).Laterspringonset also reduced clutch sizes, likely since individuals that delaynestinguseretainedreservesfortheirownmaintenanceinsteadofforeggproduction(Davies&Cooke,1983;Ryder,1970).
Long‐distance migrants occupy several spatially distinct loca‐tionswithcontrastinghabitats,andindividualscanthereforebeaf‐fectedbymultipleclimateanddensityregimesacrosstheirannualcycle(Norris&Taylor,2005).Consequently,thecombinationofre‐productiveandmigratorystrategiescan result ina largecontribu‐tionofcarryovereffectstopopulationdynamics(Ingeretal.,2010;Morrissetteetal.,2010). Inourstudypopulation,springprecipita‐tionhadapositiveeffect,andoverwinteringpopulationsizehadanegativeeffect,onclutchsize.AlthoughfoodresourcesatthespringstopoversiteonmainlandNorwayaregenerallyabundantduetoapredominanceofagriculturalland,arainierspringispossiblyassoci‐atedwithimprovedfoodqualitysinceitslowsdowntheplantgrow‐ingseason, resulting inhigher leafproteincontent (Bø&Hjeljord,1991;Doiron,Gauthier,&Lévesque,2014;Jonasson,Bryant,ChapinIII,&Andersson,1986).This, inturn,improvesbodyconditionandenergy stores in herbivores (Mysterud, Langvatn, Yoccoz, & Chr,2001;Ydenberg&Prins,1981).
In many northern herbivores, spring plant phenology controlsthe timing of reproduction and therefore reproductive success(Langvatn, Albon, Burkey, & Clutton‐Brock, 1996; Post, Bøving,Pedersen,&MacArthur,2003;Sedinger&Raveling,1986).Warmersummer temperatureswerenegatively correlatedwith thedateofplantgrowthonsetandincreasedhatchingsuccessinthisbarnaclegoosepopulation.Similareffectsofthetimingofplantgrowthonsethave been found in other goose populations (Cooke et al., 1995;Prop&deVries,1993).Warmertemperaturesadvancethetimingofplantavailabilityandcanenhanceplantproductivity(Jiaetal.,2009)which, at such high latitudes, does not necessarilymean a strongreductioninforagequality.Fornestinggeese,thiscanreducetheirforagingtimeawayfromthenest,increasinghatchingsuccess(Blacketal.,2014;Greve,Elvebakk,&Gabrielsen,1998;Prop&deVries,1993).Insupportofourfindings,severalbreedingpopulationsofwa‐terfowl(includingbarnaclegeese)inZackenberg,easternGreenland,sufferedalmostcompletebreedingfailurebecauseofextremelylatesnowmeltandonsetofplantgrowth in2018(JannikHansen,per‐sonalcommunication).
Inhighlyseasonalenvironmentssuchas thehighArctic, thedy‐namicsofherbivorepopulationsarestronglylinkedtoseasonality inresource availability since their body condition, and thus reproduc‐tivesuccess, isdependentonwhenvegetationisavailable(Albonetal.,2017;Douhardetal.,2013;Langvatnetal.,1996;Sæther,1997).Manyspeciesofherbivores,andespeciallywaterfowlsuchasgeese,areprecocial,thatis,offspringleavethenestearlyandinarelatively
developedstate.Goslingsarelargelydependentontheirownresourceacquisitionandarevulnerabletofluctuationsinfood(vegetation)re‐sources(Lindholm,Gauthier,&Desrochers,1994;Loonen,Bruinzeel,Black,&Drent,1999).Plantproductivityhasbeenidentifiedasakeydriverofgoslinggrowthratesinseveralspeciesandlimitedfoodsup‐ply increases pre‐fledgingmortality (Lindholm et al., 1994; Loonen,Oosterbeek, & Drent, 1997; Williams, Cooch, Jefferies, & Cooke,1993). Increasedprecipitationduringthepeakplantgrowingseasonhad a negative effect on fledging success in this study population.Themechanismsbehindthisremainuncertainbutcouldberelatedtocloudcloverandgenerallypoorerplantgrowingconditions,reducingthestandingcropofanimportantfoodsource,thegrassP. arctica.
However,theseeffectsofweatherinearlyreproductivephaseswere largely offset by predation of goslings. Predation by Arcticfoxesisthemaintop‐downregulatorofreproductioninmanyArcticnestinggoosepopulations,causingannual fluctuations ineggpro‐ductivityandgoslingsurvival(Bêtyetal.,2002;Gauthieretal.,2004;Loonenetal.,1998;Samelius&Alisauskas,2000).Inourstudypop‐ulation,thebrood‐rearingphaseiswhenoffspringaremostvulnera‐bletopredation(Loonenetal.,1998)andincreasedlocalabundanceofArcticfoxesovertimehadadramaticnegativeeffectongoslingsurvival(i.e.fledgingsuccess).
PreviousstudiesofArcticgeesehaveindicateddensity‐depen‐denteffectsduringthebreedingseason(Cooch,Lank,Rockwell,&Cooke, 1989; Larsson & Forslund, 1994; Layton‐Matthews et al.,2019),throughcompetitionforfood(e.g.Larsson&Forslund,1994;Loonen et al., 1997) and nesting sites (Ebbinge et al., 2002). Thisstudylendssomesupportforfoodcompetitionasthemaindriver,sincethenumberofgoslingsperparent(i.e.familysize)hadaneg‐ativeeffectontheproportionfledging.Barnaclegeeseprovidepa‐rental care through vigilance andwarming, and this parental caredecreaseswithincreasingfamilysize(Forslund,1993),whichwouldthenappearas‘negativedensitydependence’.
4.2 | Non‐breeding season
Both weather and density‐dependent effects at the winteringgroundscausedannualvariationinsurvival.Winterconditionsin‐fluencebodyconditioninArcticherbivoresviaeffectsonresourceavailability(Albonetal.,2017;Guillemain,Elmberg,Arzel,Johnson,&Simon,2008;Miller&Barry,2009).Effectsofvaryingoverwinterresourcesare lesswelldocumented formigratoryherbivoresbutcouldbeimportantintermsofdirectmortalityaswellascarryovereffectslaterintheannualcycle.InArcticgeese,bodyreservesarefundamental forsurvivingmigration (Klaassenetal.,2014;Owen&Black, 1989, 1991b; Prop&Black, 1998).Higher average dailyminimumtemperatureinScotlandduringwinterincreasedsurvivalratesofbothfledglingsandadults, increasingpopulationgrowth.Poor weather conditions at the wintering grounds have beenshown to reduce overwintering survival in other goose species(Kery,Madsen,&Lebreton,2006;Owen&Black,1991b;Schaub,Kania, & Köppen, 2005). Severe winters, with extended periodsbelowfreezing,reduceplantavailabilityandproductivitythrough

| 11LAYTON‐MATTHEWS ET AL.
frostdamageandincreasedsnowcover(Fox,Elmberg,Tombre,&Hessel, 2017). Barnacle geese are probablymost food limited inmid‐winter, resulting in reducedbodyconditionuntil initiationofplantproductivityinFebruary–March,priortothespringmigrationfromScotland(Owen,Wells,&Black,1992).Alargeproportionofnaturalmortalityalsolikelyoccursduringautumnmigration(Owen,1982;Owen&Black,1991a).However,inanEast‐Atlanticpopula‐tionofpale‐belliedbrentgeese,survivalwasalsoextremelylowinseverewinterswithfooddepletion(Clausen,Frederiksen,Percival,Anderson,&Denny, 2001) and in thePacific black brant,Branta bernicla,mortality largely occurred during late spring due to dis‐ease,predationandstarvation(Ward,Rexstad,Sedinger,Lindberg,&Dawe, 1997). Thus, although themechanisms and timing vary,environmental conditions during the non‐breeding season seemanimportantsourceofnaturalmortalityandcarryovereffectsonreproduction.
DespitethedramaticincreasesinArcticgoosepopulationsglob‐ally,therehasbeenlittleevidenceofdensityregulationthroughfly‐waypopulationsatthewinteringgrounds(Keryetal.,2006;Larsson&Forslund,1994;Trinder,2014).Thisislikelyexplainedbycontin‐ued rangeexpansion in theArctic, aswell as temperatewinteringgrounds (Fox et al., 2010), and improved food quality due to thetransition to agricultural land (Fox&Abraham, 2017),which havefacilitated this continued growth. However, we observed a nega‐tiveeffectof the total flywaypopulationonannual survival ratesandacarryovereffectonclutchsize.Consequently,densitydepen‐dencemayhavebeguntoplayanincreasingroleinregulatinggoosepopulationgrowth,although itseffectsareonlyapparent in local,well‐establishedpopulationsbutnotattheflywaypopulationlevel(Layton‐Matthews et al., 2019; Trinder, 2014). Survival estimatesfrompopulationsat thewinteringgroundsare inflatedby individ‐ualsfromnewlycolonizedareasintheArctic,whereresourcesaretemporarilyinexcess.Thus,despitetheincreaseincarryingcapacity(VanEerden,1996),density‐dependentprocessesat thewinteringgroundsmay have important implications for futuremanagementof Arctic goose populations. Flyway population size affected sur‐vivalmore in adults than fledglings,whose autumnmigration is amorelikelycauseofmortality(Owen&Black,1989).However,thestrength of the density dependence found here should be inter‐pretedwithcaution,asremovalofthetrendfromNscot(i.e.account‐ingforincreasesincarryingcapacity)reduceditseffectonsurvivalrates(to−0.04;−0.11,−0.01).
4.3 | Net implications of climate change
The dramatic warming of the Arctic (Stocker et al., 2014) has re‐sultedinanearliersnow‐freetundra,advancedplantphenologyandincreased productivity.We show that this has benefitted barnaclegeese intheearlyreproductivestagesby increasingclutchsuccess,clutch size and hatching success over time. However, the poten‐tial benefits of advanced phenology likely depend on the capacityofArctic geese to align theirmigratory cues (Lameris et al., 2017),therebyavoidingtrophicmismatch.InsomeArcticspecies,migratory
strategiesarerelativelydynamic(Clausen,Madsen,Cottaar,Kuijken,&Verscheure,2018;Eichhorn,Drent,Stahl,Leito,&Alerstam,2009;Lameris et al., 2017); however,migration timing is at least partiallyfixed(Kölzschetal.,2015;Lamerisetal.,2018;VanderJeugdetal.,2009). The reliability of resources at spring stopover siteswill alsodeterminetheirabilitytorespondtofuturechange(Foxetal.,2014;Prop,Black,&Shimmings,2003).Furthermore,althoughthetimingofspringonsetandvegetationgreen‐upcontributedsubstantiallytovariationinpopulationgrowth(i.e.theretrospectiveanalysis),sodidachangeinpredationpressurefromArcticfoxes.Consequently,thepotentialbenefitsofanadvancingandwarmingArcticforearlyrepro‐ductivestagesareoffsetby indirectclimatechangeeffects limitinglaterreproductivestages.Thetendencyforincreasingfoxnumbers,whichislikelythemainexplanationfortheobservedstrongdeclineinfledgingprobability,seemsmainlyaresultoftheirruptivepopula‐tionofreindeer(Rangifer tarandus platyrhynchus)inthisarea,followingtheirreintroduction(Aanes,Sæther,&Øritsland,2000;Fugleietal.,2003). Reindeer carcasses represent an important food source forArctic foxes inwinterandspring.Highcarcassavailability in spring(e.g.followingharshwinters)alsoboostsfoxpupproduction(Hansenetal.,2013).SincetheabundanceofSvalbardreindeerisgenerallyin‐creasingbecauseofclimatewarming(e.g.Albonetal.,2017),anover‐allhigherfoxdensitymaybelikelyinthefuture.Thiswouldrestrictgrowth in goosepopulationsdirectly though thepredationof eggsandjuveniles(McDonald,Roth,&Baldwin,2017)andpotentiallyin‐directlybyincreasingdensity‐dependenteffectsthroughareductionintheavailableforagingareaforgeese(Loonenetal.,1998).Asteadyincrease inbreedingpopulationsofgeese ingeneral is likelyhavinga furtherpositive effect on foxpupoverwinter survival (Imset al.,2013).Additionally,recentlyincreasingnumbersofpolarbears,Ursus maritimus, ‘stranded’ by the lossof sea ice, have resulted in severedeclines inhatchingsuccess insomebreedingpopulationsofgeeseonSvalbard(Propetal.,2015).Thus,increasedpredationpressurebyArcticfoxesandpolarbears—thatis,indirectclimatechangeeffects—maycounteract thebenefitsofclimatewarming forearlystagesofreproduction,contributingtothelackofapositivetrendinlocalpop‐ulationsize.
Notemporaltrendwasobservedinwinterclimate inScotland.Nevertheless,moderatelywarmerandwetterwintersarepredictedforScotlandunderfutureglobalwarming,withfewerfrostdaysandanearliergrowingseason(Jacobetal.,2014;Jenkins,Perry,&Prior,2009).Accordingtoourresults,thiswouldreducegoosemortalitywitha largeeffecton localpopulationgrowth.However, thecon‐sequencesofwarmerwintersforplantproductivity,andthereforebarnaclegeese,arestilluncertain(Crawford,1997;Kreyling,2010).
Inconclusion,currentandnear‐futureclimatechangeinvolvescontrastingtrendsin importantenvironmentaldriversacrossmi‐gratory stages and therefore does not necessarily pose a nega‐tiveoutlookforArcticgeese.Earlierspringsandwarmersummersappear beneficial for reproduction in populations where indi‐viduals can sufficiently adjust their phenology (but see Lameris etal.,2018), andevena slight futurewarming trendat thewin‐tering grounds may increase survival. However, extrapolation
12 | LAYTON‐MATTHEWS ET AL.
to future levels ofwarming is problematic (Bilt et al., 2019) andchangesoccurring furtherup the foodwebmaycounteractbot‐tom‐upbenefitsofArcticwarming.Additionally,andimportantly,our results indicate thatdensity regulationbothat thebreedinggrounds in Svalbard and, especially, at thewintering grounds intheUnitedKingdom,willacttocurbpopulationgrowthcausedbyclimatechange.
ACKNOWLEDG EMENTS
We thank the large team of scientists, students and volunteersfrom the University of Groningen, who helped collecting andprocessing the data. Permissions by the Governor of Svalbard,theBird RingingCentre, Stavanger, theAnimal ExperimentationBoard of Norway (FOTS) and the UK Wildfowl and WetlandsTrustmadethefieldworkpossible.WethankSteinRune‐KarlsenatNorut,Tromsø for kindlyproviding theonsetofplantgrowthtime series for Ny‐Ålesund (Appendix S2) andMari Aas Fjelldalfor advice on themanuscript. TheNetherlandsArctic andPolarProgram,managedbytheNetherlandsOrganizationforScientificResearchNWO, and theMinistry of ForeignAffairs via supporttotheNetherlandsArcticStation,andtheprojectsBIRDHEALTH(851.40.071) andGeeseonArcticTundra (866.12.407) providedfunding for data collection inNy‐Ålesund. TheNorwegianPolarInstituteprovided funding for the annual den sitemonitoringofarctic fox.TheEuropeanUnion supportedFP7‐projectFRAGILEandtheUniversityofGroningengaveadditionalsupport.ThisworkwassupportedbytheResearchCouncilofNorway (FRIMEDBIOgrant number 276080, KLIMAFORSK 244647 and 273451 andCentreofExcellence223257).
ORCID
Kate Layton‐Matthews https://orcid.org/0000‐0001‐5275‐1218
Brage Bremset Hansen https://orcid.org/0000‐0001‐8763‐4361
R E FE R E N C E S
Aanes, R., Sæther, B. E.,&Øritsland,N.A. (2000). Fluctuations of anintroducedpopulationofSvalbardreindeer:Theeffectsofdensitydependenceandclimaticvariation.Ecography,23(4),437–443.https://doi.org/10.1034/j.1600‐0587.2000.230406.x
Albon,S.D.,Irvine,R.J.,Halvorsen,O.,Langvatn,R.,Loe,L.E.,Ropstad,E.,…Duff, E. I. (2017). Contrasting effects of summer andwinterwarmingonbodymassexplainpopulationdynamicsinafood‐limitedArctic herbivore.Global Change Biology,23(4), 1374–1389. https://doi.org/10.1111/gcb.13435
Angerbjorn,A.,Tannerfeldt,M.,&Erlinge,S.(1999).Predator–preyrela‐tionships:Arcticfoxesandlemmings.Journal of Animal Ecology,68(1),34–49.https://doi.org/10.1046/j.1365‐2656.1999.00258.x
Arft, A., Walker, M., Gurevitch, J., Alatalo, J., Bret‐Harte, M., Dale,M., … Wookey, P.A. (1999). Responses of tundra plants to ex‐perimental warming: Meta‐analysis of the international tundraexperiment. Ecological Monographs, 69(4), 491–511. https://doi.org/10.2307/2657227
Barrio, I. C., Bueno, C. G., Gartzia, M., Soininen, E. M., Christie, K.S., Speed, J. D., …Horstkotte, T. (2016). Biotic interactionsme‐diatepatternsofherbivorediversity in theArctic.Global Ecology and Biogeography, 25(9), 1108–1118. https://doi.org/10.1111/geb.12470
Barry,T.W. (1962).Effectof late seasonsonAtlanticBrant reproduc‐tion. The Journal of Wildlife Management, 26(1), 19–26. https://doi.org/10.2307/3798163
Bates, D., Mächler, M., Bolker, B., & Walker, S. (2014). Fitting linearmixed‐effectsmodelsusinglme4.Rpackageversion1.1‐10.Journal of Statistical Software,67(1),1–48.
Bazely,D.,&Jefferies,R.(1989).Leafandshootdemographyofanarcticstoloniferousgrass,Puccinellia phryganodes, inresponsetograzing.Journal of Ecology,77,811–822.https://doi.org/10.2307/2260987
Bêty,J.,Gauthier,G.,&Giroux,J.‐F.(2003).Bodycondition,migration,andtimingofreproductioninsnowgeese:Atestofthecondition‐de‐pendentmodelofoptimalclutchsize.The American Naturalist,162(1),110–121.https://doi.org/10.1086/375680
Bêty, J.,Gauthier,G., Korpimäki, E.,&Giroux, J. (2002). Shared pred‐atorsand indirect trophic interactions: Lemmingcyclesandarctic‐nesting geese. Journal of Animal Ecology, 71(1), 88–98. https://doi.org/10.1046/j.0021‐8790.2001.00581.x
Bilt,W.,Bakke,J.,Smedsrud,L.,Sund,M.,Schuler,T.,Westermann,S.,…Sorteberg,A.(2019).ClimateinSvalbard2100–Aknowledgebaseforclimateadaptation.TechnicalreportfromNorwegianCentreforClimateServicesReports(1/2019).
Bjorkman,A.D.,Elmendorf,S.C.,Beamish,A.L.,Vellend,M.,&Henry,G.H. (2015).Contrastingeffectsofwarmingand increased snow‐fall on Arctic tundra plant phenology over the past two decades.Global Change Biology,21(12),4651–4661.https://doi.org/10.1111/gcb.13051
Black, J.M., Prop, J.,& Larsson,K. (2014). Survival and reproduction.In J. Martin (Ed.), The barnacle goose (pp. 159–172). London, UK:BloomsburyPublishing.
Bø,S.,&Hjeljord,O.(1991).Docontinentalmooserangesimproveduringcloudy summers? Canadian Journal of Zoology, 69(7), 1875–1879.https://doi.org/10.1139/z91‐260
Both,C.,Bouwhuis,S.,Lessells,C.,&Visser,M.E.(2006).Climatechangeand population declines in a long‐distancemigratory bird.Nature,441(7089),81–83.https://doi.org/10.1038/nature04539
Bruggeman,J.E.,Swem,T.,Andersen,D.E.,Kennedy,P.L.,&Nigro,D.(2015).DynamicsofarecoveringArcticbirdpopulation:Theimpor‐tance of climate, density dependence, and site quality. Ecological Applications,25(7),1932–1943.https://doi.org/10.1890/14‐1591.1
Burnham,K.P.,&Anderson,D.R.(2002).Model selection and multimodel inference: A practical information‐theoretic approach.NewYork,NY:Springer.
Caswell, H. (1989). Analysis of life table response experiments I.Decompositionofeffectsonpopulationgrowthrate.Ecological Modelling,46(3–4),221–237.https://doi.org/10.1016/0304‐3800(89)90019‐7
Caswell,H. (2001).Matrix population models. Sunderland,MA: SinauerAssociatesInc.
Clausen,K.K.,&Clausen,P.(2013).EarlierArcticspringscausepheno‐logicalmismatchinlong‐distancemigrants.Oecologia,173(3),1101–1112.https://doi.org/10.1007/s00442‐013‐2681‐0
Clausen,K.K.,Madsen,J.,Cottaar,F.,Kuijken,E.,&Verscheure,C.(2018).Highlydynamicwinteringstrategiesinmigratorygeese:Copingwithenvironmental change. Global Change Biology, 24(7), 3214–3225.https://doi.org/10.1111/gcb.14061
Clausen, P., Frederiksen, M., Percival, S., Anderson, G., & Denny, M.(2001). Seasonal and annual survival of East‐Atlantic Pale‐belliedBrent Geese Branta hrota assessed by capture‐recapture analysis.Ardea,89(specialissue),101–112.
Cooch, E., Lank, D., Rockwell, R., & Cooke, F. (1989). Long‐term de‐cline in fecundity in a Snow Goose population: Evidence for

| 13LAYTON‐MATTHEWS ET AL.
densitydependence?Journal of Animal Ecology,711–726.https://doi.org/10.2307/4858
Cooke,F.,Rockwell,R.F.,&Lank,D.B.(1995).Thetimingofreproduc‐tion.InC.M.Perrins(Ed.),The snow geese of La Pérouse Bay(pp.189–212).Oxford,UK:OxfordUniversityPress.
Crawford, R. (1997). Oceanicity and the ecological disadvantages ofwarmwinters.Botanical Journal of Scotland,49(2),205–221.https://doi.org/10.1080/03746609708684867
Davies, J.C.,&Cooke, F. (1983).Annual nesting productivity in snowgeese: Prairie droughts and arctic springs. The Journal of Wildlife Management,47(2),291–296.https://doi.org/10.2307/3808501
Dickey,M.H.,Gauthier,G.,&Cadieuz,M.C.(2008).Climaticeffectsonthebreedingphenologyandreproductivesuccessofanarctic‐nest‐inggoosespecies.Global Change Biology,14(9),1973–1985.https://doi.org/10.1111/j.1365‐2486.2008.01622.x
Doiron,M.,Gauthier,G.,&Lévesque,E.(2014).Effectsofexperimentalwarmingonnitrogenconcentrationandbiomassofforageplantsforanarcticherbivore.Journal of Ecology,102(2),508–517.https://doi.org/10.1111/1365‐2745.12213
Doiron,M.,Gauthier,G.,&Lévesque,E.(2015).TrophicmismatchanditseffectsonthegrowthofyounginanArcticherbivore.Global Change Biology,21(12),4364–4376.https://doi.org/10.1111/gcb.13057
Douhard, M., Gaillard, J.‐M., Delorme, D., Capron, G., Duncan, P.,Klein, F., & Bonenfant, C. (2013). Variation in adult bodymass ofroe deer: Early environmental conditions influence early and latebody growth of females. Ecology, 94(8), 1805–1814. https://doi.org/10.1890/13‐0034.1
Drent,R.,&Daan,S.(1980).Theprudentparent:Energeticadjustmentsin avian breeding. Ardea,55(1–2),225–252.https://doi.org/10.5253/arde.v68.p225
Ebbinge, B. S., Heesterbeek, J., Ens, B. J., & Goedhart, P.W. (2002).Densitydependentpopulationlimitationindark‐belliedbrentgeeseBranta b. bernicla. Avian Science,2(2),63–75.
Ehrich, D., Cerezo, M., Rodnikova, A. Y., Sokolova, N. A., Fuglei, E.,Shtro,V.G.,&Sokolov,A.A. (2017).VoleabundanceandreindeercarcassesdeterminebreedingactivityofArctic foxes in lowArcticYamal, Russia. BMC Ecology, 17(1), 32. https://doi.org/10.1186/s12898‐017‐0142‐z
Eichhorn, G., Drent, R. H., Stahl, J., Leito, A., & Alerstam, T.(2009). Skipping the Baltic: The emergence of a dichotomyof alternative spring migration strategies in Russian barna‐cle geese. Journal of Animal Ecology, 78(1), 63–72. https://doi.org/10.1111/j.1365‐2656.2008.01485.x
Eide, N. E., Stien, A., Prestrud, P., Yoccoz, N. G., & Fuglei, E. (2012).Reproductiveresponsestospatialandtemporalpreyavailability inacoastalArcticfoxpopulation.Journal of Animal Ecology,81(3),640–648.https://doi.org/10.1111/j.1365‐2656.2011.01936.x
Fauchald,P.,Park,T.,Tømmervik,H.,Myneni,R.,&Hausner,V.H.(2017).Arctic greening fromwarmingpromotesdeclines in cariboupopu‐lations.Science Advances,3(4), e1601365. https://doi.org/10.1126/sciadv.1601365
Forchhammer, M. C., Post, E., Stenseth, N. C., & Boertmann, D. M.(2002).Long‐termresponsesinarcticungulatedynamicstochangesinclimaticandtrophicprocesses.Population Ecology,44(2),113–120.https://doi.org/10.1007/s101440200013
Forchhammer,M.C.,Schmidt,N.M.,Høye,T.T.,Berg,T.B.,Hendrichsen,D.K.,&Post,E.(2008).Populationdynamicalresponsestoclimatechange. Advances in Ecological Research, 40, 391–419. https://doi.org/10.1016/S0065‐2504(07)00017‐7
Forslund,P.(1993).Vigilanceinrelationtobroodsizeandpredatorabun‐danceinthebarnaclegoose,Branta leucopsis. Animal Behaviour,45(5),965–973.https://doi.org/10.1006/anbe.1993.1115
Forslund,P.,&Larsson,K. (1992).Age‐related reproductivesuccess inthebarnaclegoose.Journal of Animal Ecology,61,195–204.https://doi.org/10.2307/5522
Foster,J.(1989).ThesignificanceofthedateofsnowdisappearanceontheArctictundraasapossibleindicatorofclimatechange.Arctic and Alpine Research,21(1),60–70.https://doi.org/10.2307/1551517
Fox,A.D.,&Abraham,K.F.(2017).Whygeesebenefitfromthetransi‐tion fromnatural vegetation to agriculture.Ambio,46(2), 188–197.https://doi.org/10.1007/s13280‐016‐0879‐1
Fox,A.D.,Ebbinge,B.S.,Mitchell,C.,Heinicke,T.,Aarvak,T.,Colhoun,K.,…Koffijberg, K. (2010). Current estimates of goose populationsizes inwestern Europe, a gap analysis and assessment of trends.Ornis Svecica,20,115–127.https://doi.org/10.34080/os.v20.19922
Fox,A.D., Elmberg, J., Tombre, I.M.,&Hessel, R. (2017).Agricultureandherbivorouswaterfowl:Areviewofthescientificbasis for im‐provedmanagement.Biological Reviews,92(2),854–877.https://doi.org/10.1111/brv.12258
Fox, A. D., & Madsen, J. (2017). Threatened species to super‐abun‐dance: The unexpected international implications of successfulgooseconservation.Ambio,46(2),179–187.https://doi.org/10.1007/s13280‐016‐0878‐2
Fox,A.D.,Weegman,M.D.,Bearhop,S.,Hilton,G.M.,Griffin,L.,Stroud,D.A.,&Walsh,A.(2014).Climatechangeandcontrastingplasticityintimingofatwo‐stepmigrationepisodeofanArctic‐nestingavianherbivore. Current Zoology,60(2),233–242.https://doi.org/10.1093/czoolo/60.2.233
Frederiksen,M., & Bregnballe, T. (2000). Evidence for density‐depen‐dentsurvivalinadultcormorantsfromacombinedanalysisofrecov‐eriesandresightings.Journal of Animal Ecology,69(5),737–752.https://doi.org/10.1046/j.1365‐2656.2000.00435.x
Fuglei,E.,Øritsland,N.A.,&Prestrud,P.(2003).Localvariationinarc‐ticfoxabundanceonSvalbard,Norway.Polar Biology,26(2),93–98.https://doi.org/10.1007/s00300‐002‐0458‐8
Fujita,M.,&Kameda,K.O.(2016).Nutrientdynamicsandnutrientcy‐clingbybirds.InÇ.H.Sekercioglu,D.G.Wenny,&C.J.Whelan(Eds.),Why birds matter: Avian ecological function: Nutrient dynamics and nu‐trient cycling by birds (pp. 271–291). Chicago, IL: TheUniversity ofChicagoPress.
Gaillard, J.‐M., & Yoccoz, N. G. (2003). Temporal variation in survivalofmammals:Acaseofenvironmentalcanalization?Ecology,84(12),3294–3306.https://doi.org/10.1890/02‐0409
Gareth,K.(2004).PredictingimpactsofArcticclimatechange:Pastles‐sonsandfuturechallenges.Ecological Research,19(1),65–74.https://doi.org/10.1111/j.1440‐1703.2003.00609.x
Gauthier,G.,Bêty,J.,Giroux,J.‐F.,&Rochefort,L.(2004).Trophicinter‐actions inahigharctic snowgoosecolony. Integrative Comparative Biology,44(2),119–129.https://doi.org/10.1093/icb/44.2.119
Gelman,A.,&Hill, J. (2006).Causal inferenceusingmultilevelmodels.In Data analysis using regression and multilevel/hierarchical models(pp.503–512).Cambridge,UK:CambridgeUniversityPress.
Greve, I. A., Elvebakk, A., & Gabrielsen, G.W. (1998). Vegetation ex‐ploitation by barnacle geeseBranta leucopsis during incubation onSvalbard.Polar Research,17(1),1–14.https://doi.org/10.3402/polar.v17i1.6603
Guillemain,M.,Elmberg,J.,Arzel,C.,Johnson,A.R.,&Simon,G.(2008).Theincome–capitalbreedingdichotomyrevisited:Latewinterbodycondition is relatedtobreedingsuccess inan incomebreeder. Ibis,150(1),172–176.https://doi.org/10.1111/j.1474‐919x.2007.00700.x
Gustine,D.D.,Barboza,P.S.,&Lawler,J.P. (2010).Dynamicsofbodyproteinand the implications for reproduction incaptivemuskoxen(Ovibos moschatus) duringwinter.Physiological Biochemical Zoology,83(4),687–697.https://doi.org/10.1086/652729
Hahn,S.,Loonen,M.J.,&Klaassen,M. (2011).TherelianceondistantresourcesforeggformationinhighArcticbreedingbarnaclegeeseBranta leucopsis. Journal of Avian Biology,42(2),159–168.https://doi.org/10.1111/j.1600‐048x.2010.05189.x
Hansen,B.B.,Gamelon,M.,Albon,S.D.,Lee,A.M.,Stien,A.,Irvine,R.J.,…Veiberg,V.(2019).Morefrequentextremeclimateeventsstabilize

14 | LAYTON‐MATTHEWS ET AL.
reindeerpopulationdynamics.Nature Communications,10(1),1616.https://doi.org/10.1038/s41467‐019‐09332‐5
Hansen,B.B.,Grøtan,V.,Aanes,R.,Sæther,B.‐E.,Stien,A.,Fuglei,E.,…Pedersen,Å.Ø.(2013).ClimateeventssynchronizethedynamicsofaresidentvertebratecommunityinthehighArctic.Science,339(6117),313–315.https://doi.org/10.1126/science.1226766
Hessen,D.O.,Tombre,I.M.,vanGeest,G.,&Alfsnes,K.(2017).Globalchangeandecosystemconnectivity:HowgeeselinkfieldsofcentralEuropetoeutrophicationofArcticfreshwaters.Ambio,46(1),40–47.https://doi.org/10.1007/s13280‐016‐0802‐9
Hill,G.B.,&Henry,G.H. (2011).ResponsesofHighArcticwetsedgetundratoclimatewarmingsince1980.Global Change Biology,17(1),276–287.https://doi.org/10.1111/j.1365‐2486.2010.02244.x
Horvitz, C., Schemske, D.W., & Caswell, H. (1997). The relative “im‐portance” of life‐history stages to population growth: Prospectiveand retrospective analyses. In S. Tuljapurkar & H. Caswell (Eds.),Structured‐population models in marine, terrestrial, and freshwater sys‐tems(pp.247–271).Boston,MA:Springer.
Høye,T.T.,Post,E.,Schmidt,N.M.,Trøjelsgaard,K.,&Forchhammer,M.C.(2013).ShorterfloweringseasonsanddecliningabundanceofflowervisitorsinawarmerArctic.Nature Climate Change,3(8),759–763.https://doi.org/10.1038/nclimate1909
Hüppop,O.,&Winkel,W. (2006).Climatechangeandtimingofspringmigrationinthelong‐distancemigrantFicedula hypoleuca incentralEurope:Theroleofspatiallydifferenttemperaturechangesalongmi‐gration routes.Journal of Ornithology,147(2),344–353.https://doi.org/10.1007/s10336‐005‐0049‐x
Ims,R.A., Jepsen, J.U.,Stien,A.,&Yoccoz,N.G. (2013).Science plan for COAT: Climate‐ecological observatory for Arctic Tundra. Tromsø,Norway:FramCentre.
Inger, R., Harrison, X. A., Ruxton, G. D., Newton, J., Colhoun,K., Gudmundsson, G. A., … Bearhop, S. (2010). Carry‐overeffects reveal reproductive costs in a long‐distance mi‐grant. Journal of Animal Ecology, 79(5), 974–982. https://doi.org/10.1111/j.1365‐2656.2010.01712.x
Jacob,D.,Petersen,J.,Eggert,B.,Alias,A.,Christensen,O.B.,Bouwer,L.M.,…Georgievski,G.(2014).EURO‐CORDEX:Newhigh‐resolutionclimatechangeprojections forEuropean impact research.Regional Environmental Change,14(2),563–578.
Jenkins, G., Perry,M., & Prior,M. (2009).UKCIP08: The climate of the United Kingdom and recent trends. Exeter, UK: Met Office HadleyCentre.
Jensen, R. A., Madsen, J., O'Connell, M., Wisz, M. S., Tømmervik,H., & Mehlum, F. (2008). Prediction of the distribution ofArctic‐nesting pink‐footed geese under a warmer climatescenario. Global Change Biology, 14(1), 1–10. https://doi.org/10.1111/j.1365‐2486.2007.01461.x
Jia,G.J.,Epstein,H.E.,&Walker,D.A.(2009).VegetationgreeningintheCanadianArcticrelatedtodecadalwarming.Journal of Environmental Monitoring,11(12),2231–2238.https://doi.org/10.1039/b911677j
Jonasson,S.,Bryant,J.P.,Chapin,F.S.III,&Andersson,M.(1986).Plantphenols and nutrients in relation to variations in climate and ro‐dentgrazing.The American Naturalist,128(3),394–408.https://doi.org/10.1086/284570
Jönsson,K.I.(1997).Capitalandincomebreedingasalternativetacticsof resource use in reproduction. Oikos, 78(1), 57–66. https://doi.org/10.2307/3545800
Karlsen,S.R.,Anderson,H.B.,VanderWal,R.,&Hansen,B.B.(2018).A newNDVImeasure that overcomes data sparsity in cloud‐cov‐eredregionspredictsannualvariationinground‐basedestimatesofhigharcticplantproductivity.Environmental Research Letters,13(2),025011.https://doi.org/10.1088/1748‐9326/aa9f75
Karlsen,S.R.,Elvebakk,A.,Høgda,K.A.,&Grydeland,T.(2014).Spatialand temporal variability in the onset of the growing season onSvalbard,ArcticNorway–MeasuredbyMODIS‐NDVIsatellitedata.
Remote Sensing, 6(9), 8088–8106. https://doi.org/10.3390/rs6098088
Kerby, J., & Post, E. (2013). Capital and incomebreeding traits differ‐entiate trophic match–mismatch dynamics in large herbivores.Philosophical Transactions of the Royal Society B: Biological Sciences,368(1624),20120484.https://doi.org/10.1098/rstb.2012.0484
Kery,M.,Madsen,J.,&Lebreton,J.D.(2006).SurvivalofSvalbardpink‐footedgeeseAnser brachyrhynchusinrelationtowinterclimate,den‐sityandland‐use.Journal of Animal Ecology,75(5),1172–1181.https://doi.org/10.1111/j.1365‐2656.2006.01140.x
Klaassen,R.H.,Hake,M.,Strandberg,R.,Koks,B.J.,Trierweiler,C.,Exo,K.M.,…Alerstam,T.(2014).Whenandwheredoesmortalityoccurinmigratory birds?Direct evidence from long‐term satellite track‐ingofraptors.Journal of Animal Ecology,83(1),176–184.https://doi.org/10.1111/1365‐2656.12135
Kohler,J.,&Aanes,R.(2004).Effectofwintersnowandground‐icingonaSvalbardreindeerpopulation:Resultsofasimplesnowpackmodel.Arctic, Antarctic and Alpine Research, 36(3), 333–341. https://doi.org/10.1657/1523‐0430(2004)036[0333:eowsag]2.0.co;2
Kölzsch,A.,Bauer, S., deBoer,R.,Griffin, L.,Cabot,D., Exo,K.M.,…Nolet,B.A.(2015).Forecastingspringfromafar?Timingofmigrationandpredictabilityofphenologyalongdifferentmigrationroutesofan avian herbivore. Journal of Animal Ecology,84(1),272–283.https://doi.org/10.1111/1365‐2656.12281
Kondratyev,A.,Zaynagutdinova,E.,&Kruckenberg,H.(2013).Barnaclegoose Branta leucopsisabundanceonKolguevIsland–Currentstatusandhistoryofpopulationgrowth.Wildfowl,63(63),56–71.
Koons, D. N., Gunnarsson, G., Schmutz, J. M., &Rotella, J. J. (2014).Drivers of waterfowl population dynamics: From teal to swans.Wildfowl,4(specialissue),169–191.
Kreyling,J. (2010).Winterclimatechange:Acriticalfactorfortemper‐atevegetationperformance.Ecology,91(7),1939–1948.https://doi.org/10.1890/09‐1160.1
Laake, J. L. (2013). RMark: An R interface for analysis of capture‐recap‐ture data with MARK.Seattle,WA:AlaskaFisheriesScienceCenter,NationalMarineFisheriesService,NOAA.
Lameris,T.K.,Scholten,I.,Bauer,S.,Cobben,M.M.,Ens,B.J.,&Nolet,B.A.(2017).PotentialforanArctic‐breedingmigratorybirdtoadjustspring migration phenology to Arctic amplification.Global Change Biology,23(10),4058–4067.https://doi.org/10.1111/gcb.13684
Lameris,T.K.,vanderJeugd,H.P.,Eichhorn,G.,Dokter,A.M.,Bouten,W.,Boom,M.P.,…Nolet,B.A.(2018).Arcticgeesetunemigrationtoawarmingclimatebutstillsufferfromaphenologicalmismatch.Current Biology, 28(15), 2467–2473.e64. https://doi.org/10.1016/j.cub.2018.05.077
Langvatn,R.,Albon,S.,Burkey,T.,&Clutton‐Brock,T. (1996).Climate,plantphenologyandvariationinageoffirstreproductioninatem‐perateherbivore.Journal of Animal Ecology,65,653–670.https://doi.org/10.2307/5744
Larsson,K.,&Forslund,P.(1994).Populationdynamicsofthebarnaclegoose Branta leucopsisintheBalticarea:Density‐dependenteffectsonreproduction.Journal of Animal Ecology,63,954–962.https://doi.org/10.2307/5272
Layton‐Matthews, K., Loonen, M. J. E., Hansen, B. B., Saether, B.‐E.,Coste,C.F.D.,&Grøtan,V. (2019).Density‐dependentpopulationdynamicsofahighArcticcapitalbreeder,thebarnaclegoose.Journal of Animal Ecology.https://doi.org/10.1111/1365‐2656.13001
LeMoullec,M.,Buchwal,A., vanderWal,R.,Sandal, L.,&Hansen,B.B.(2019).Annualringgrowthofawidespreadhigharcticshrubre‐flectspastfluctuationsincommunity‐levelplantbiomass.Journal of Ecology,107(1),436–451.https://doi.org/10.1111/1365‐2745.13036
Lefcheck, J. S. (2016). piecewiseSEM: Piecewise structural equa‐tion modelling in R for ecology, evolution, and systematics.Methods in Ecology and Evolution, 7(5), 573–579. https://doi.org/10.1111/2041‐210x.12512

| 15LAYTON‐MATTHEWS ET AL.
Lindholm,A.,Gauthier,G.,&Desrochers,A.(1994).Effectsofhatchdateand food supplyongoslinggrowth in arctic‐nestingGreaterSnowGeese.Condor,96(4),898–908.https://doi.org/10.2307/1369100
Loonen,M.J.J.E.,Bruinzeel,L.W.,Black,J.M.,&Drent,R.H.(1999).Thebenefitof largebroods inbarnaclegeese:Astudyusingnatu‐ralandexperimentalmanipulations.Journal of Animal Ecology,68(4),753–768.https://doi.org/10.1046/j.1365‐2656.1999.00325.x
Loonen,M.J.J.E.,Oosterbeek,K.,&Drent,R.(1997).VariationingrowthofyoungandadultsizeinbarnaclegeeseBranta leucopsis: Evidence fordensitydependence.Ardea,85(2),177–192.
Loonen,M.J.J.E.,Tombre,I.M.,&Mehlum,F.(1998).Developmentofanarcticbarnaclegoosecolony: Interactionsbetweendensityandpredation.Norsk Polarinstitutt Skrifter,200,67–80.
Madsen, J., Tamstorf,M.,Klaassen,M., Eide,N.,Glahder,C., Rigét, F.,…Cottaar,F. (2007).Effectsofsnowcoveron the timingandsuc‐cessofreproductioninhigh‐Arcticpink‐footedgeeseAnser brachy‐rhynchus. Polar Biology,30(11),1363–1372.https://doi.org/10.1007/s00300‐007‐0296‐9
Marra,P.P.,Hobson,K.A.,&Holmes,R.T. (1998).Linkingwinterandsummereventsinamigratorybirdbyusingstable‐carbonisotopes.Science, 282(5395), 1884–1886. https://doi.org/10.1126/science.282.5395.1884
Maturilli,M.,Herber,A.,&König‐Langlo,G.(2015).Surfaceradiationcli‐matologyforNy‐Ålesund,Svalbard(78.9°N),basicobservationsfortrenddetection.Theoretical and Applied Climatology,120(1),331–339.https://doi.org/10.1007/s00704‐014‐1173‐4
McDonald,R.S.,Roth,J.D.,&Baldwin,F.B.(2017).GoosepersistenceinfallstronglyinfluencesArcticfoxdiet,butnotreproductivesuc‐cess,inthesouthernArctic.Polar Research,36(sup1),5.https://doi.org/10.1080/17518369.2017.1324652
Miller, F. L., & Barry, S. J. (2009). Long‐term control of Peary caribounumbers by unpredictable, exceptionally severe snow or ice con‐ditions in anon‐equilibriumgrazing system.Arctic,62(2),175–189.https://doi.org/10.14430/arctic130
Morris,W. F., &Doak,D. F. (2004). Buffering of life histories againstenvironmental stochasticity: Accounting for a spurious correla‐tionbetween thevariabilitiesofvital ratesand their contributionsto fitness. The American Naturalist, 163(4), 579–590. https://doi.org/10.1086/382550
Morrissette,M.,Bêty, J.,Gauthier,G., Reed,A.,& Lefebvre, J. (2010).Climate, trophic interactions, density dependence and carry‐over effects on the population productivity of a migratoryArctic herbivorous bird. Oikos, 119(7), 1181–1191. https://doi.org/10.1111/j.1600‐0706.2009.18079.x
Mysterud,A.,Langvatn,R.,Yoccoz,N.G.,&Chr,N.(2001).Plantphenol‐ogy,migrationandgeographicalvariationinbodyweightofalargeher‐bivore:Theeffectofavariabletopography.Journal of Animal Ecology,915–923.https://doi.org/10.1046/j.0021‐8790.2001.00559.x
Newton, I. (1977). Timing and success of breeding in tundra‐nestinggeese.InB.Stonehouse&C.Perrins(Eds.),Evolutionary ecology(pp.113–126).London,UK:MacmillanEducationUK.
Newton,I.(2006).Canconditionsexperiencedduringmigrationlimitthepopulation levels of birds? Journal of Ornithology,147(2), 146–166.https://doi.org/10.1007/s10336‐006‐0058‐4
Newton,I.(2007).Weather‐relatedmass‐mortalityeventsinmigrants.Ibis,149(3),453–467.https://doi.org/10.1111/j.1474‐919x.2007.00704.x
Norris, D. R. (2005). Carry‐over effects and habitat quality in mi‐gratory populations. Oikos, 109(1), 178–186. https://doi.org/10.1111/j.0030‐1299.2005.13671.x
Norris, D. R., & Taylor, C.M. (2005). Predicting the consequences ofcarry‐over effects for migratory populations. Biology Letters, 2(1),148–151.https://doi.org/10.1098/rsbl.2005.0397
Owen,M. (1980).Wild geese of the world: Their life history and ecology. London,UK:BTBatsfordLimited.
Owen,M.(1982).PopulationdynamicsofSvalbardbarnaclegeese1970–1980. The rate, pattern and causes ofmortality as determined byindividualmarking.Aquila,89,229–247.
Owen,M.,&Black,J.M.(1989).FactorsaffectingthesurvivalofBarnacleGeeseonmigrationfromthebreedinggrounds.The Journal of Animal Ecology,58(2),603–617.https://doi.org/10.2307/4851
Owen,M.,&Black,J.(1991a).Theimportanceofmigrationmortalityinnon‐passerinebirds.InC.Perrins,J.‐D.Lebreton,&G.Horins(Eds.),Bird population studies: Relevance to conservation and management (pp.360–372).NewYork,NY:OxfordUniversityPress.
Owen,M.,&Black,J.M.(1991b).Anoteonmigrationmortalityanditssignificanceingoosepopulationdynamics.Ardea,79,195–196.
Owen,M.,&Norderhaug,M. (1977).PopulationdynamicsofBarnacleGeese Branta leucopsis breeding in Svalbard, 1948–1976. Ornis Scandinavica,8,161–174.https://doi.org/10.2307/3676101
Owen,M.,Wells, R. L., &Black, J.M. (1992). Energy budgets ofwin‐teringbarnaclegeese:Theeffectsofdecliningfoodresources.Ornis Scandinavica,23(4),451–458.https://doi.org/10.2307/3676676
Pedersen,Å.Ø.,Stien,J.,Eidesen,P.B.,Ims,R.A.,Jepsen,J.U.,Stien,A.,…Fuglei,E. (2018).Highgooseabundance reducesnestpredationriskinasimplerodent‐freehigh‐Arcticecosystem.Polar Biology,41,619–627.https://doi.org/10.1007/s00300‐017‐2223‐z
Peeters,B.,Pedersen,Å.Ø.,Loe,L.E.,Isaksen,K.,Veiberg,V.,Stien,A.,…Hansen,B.B.(2019).Spatiotemporalpatternsofrain‐on‐snowandbasaliceinhighArcticSvalbard:Detectionofaclimate‐cryosphereregimeshift.Environmental Research Letters,14(1),015002.https://doi.org/10.1088/1748‐9326/aaefb3
Post,E.,Bøving,P.S.,Pedersen,C.,&MacArthur,M.A.(2003).Synchronybetween caribou calving and plant phenology in depredated andnon‐depredated populations. Canadian Journal of Zoology, 81(10),1709–1714.https://doi.org/10.1139/z03‐172
Post, E., & Forchhammer, M. C. (2008). Climate change reduces re‐productive success of an Arctic herbivore through trophic mis‐match. Philosophical Transactions of the Royal Society of London B: Biological Sciences,363(1501),2367–2373.https://doi.org/10.1098/rstb.2007.2207
Post, E., Forchhammer, M. C., Bret‐Harte, M. S., Callaghan, T. V.,Christensen, T. R., Elberling, B., … Høye, T. T. (2009). Ecologicaldynamics across theArctic associatedwith recent climate change.Science, 325(5946), 1355–1358. https://doi.org/10.1126/science. 1173113
Prop,J.,Aars,J.,Bårdsen,B.‐J.,Hanssen,S.A.,Bech,C.,Bourgeon,S.,…Noreen,E.(2015).Climatechangeandtheincreasingimpactofpolarbears on bird populations.Frontiers in Ecology and Evolution,3(33).https://doi.org/10.3389/fevo.2015.00033
Prop,J.,&Black,J.M.(1998).Foodintake,bodyreservesandreproduc‐tive successofbarnaclegeeseBranta leucopsis staging indifferenthabitats.Norsk Polarinstitutt Skrifter,200,175–194.
Prop, J., Black, J.M., & Shimmings, P. (2003). Travel schedules to thehigh arctic: Barnacle geese trade‐off the timing ofmigrationwithaccumulation of fat deposits.Oikos, 103(2), 403–414. https://doi.org/10.1034/j.1600‐0706.2003.12042.x
Prop,J.,Black,J.M.,Shimmings,P.,&Owen,M.(1998).ThespringrangeofbarnaclegeeseBranta leucopsisinrelationtochangesinlandman‐agementandclimate.Biological Conservation,86(3),339–346.https://doi.org/10.1016/s0006‐3207(98)00029‐9
Prop,J.,&deVries,J.(1993).ImpactofsnowandfoodconditionsonthereproductiveperformanceofbarnaclegeeseBranta leucopsis. Ornis Scandinavica,24(2),110–121.https://doi.org/10.2307/3676360
RCoreTeam.(2018).R: A language and environment for statistical comput‐ing.Vienna,Austria:RFoundationforStatisticalComputing.
Reed,E.T.,Gauthier,G.,&Giroux,J.‐F.(2004).Effectsofspringcondi‐tionsonbreedingpropensityofgreatersnowgoosefemales.Animal Biodiversity and Conservation,27(1),35–46.

16 | LAYTON‐MATTHEWS ET AL.
Robinson,R.A.,Crick,H.Q.,Learmonth,J.A.,Maclean, I.,Thomas,C.D.,Bairlein,F.,…Godley,B.J.(2009).Travellingthroughawarmingworld: Climate change and migratory species. Endangered Species Research,7(2),87–99.https://doi.org/10.3354/esr00095
Ryder,J.P.(1970).ApossiblefactorintheevolutionofclutchsizeinRoss'Goose.Wilson Bull,82(1),5–13.
Sæther, B.‐E. (1997). Environmental stochasticity and population dy‐namics of large herbivores: A search for mechanisms. Trends in Ecology & Evolution, 12(4), 143–149. https://doi.org/10.1016/S0169‐5347(96)10068‐9
Sæther,B.‐E.,Coulson,T.,Grøtan,V.,Engen,S.,Altwegg,R.,Armitage,K.B.,…Dobson,F.S.(2013).Howlifehistoryinfluencespopulationdy‐namicsinfluctuatingenvironments.The American Naturalist,182(6),743–759.https://doi.org/10.1086/673497
Sæther, B. E., Grøtan, V., Tryjanowski, P., Barbraud, C., Engen, S.,& Fulin, M. (2006). Climate and spatio‐temporal variation inthe population dynamics of a long distance migrant, the whitestork. Journal of Animal Ecology, 75(1), 80–90. https://doi.org/10.1111/j.1365‐2656.2005.01023.x
Sainmont,J.,Andersen,K.H.,Varpe,Ø.,&Visser,A.W.(2014).Capitalversus income breeding in a seasonal environment. The American Naturalist,184(4),466–476.https://doi.org/10.1086/677926
Saino, N., Ambrosini, R., Rubolini, D., vonHardenberg, J., Provenzale,A., Hüppop, K., … Sokolov, L. (2011). Climate warming, ecologi‐cal mismatch at arrival and population decline in migratory birds.Proceedings of the Royal Society B: Biological Sciences,278,835–842.https://doi.org/10.1098/rspb.2010.1778
Samelius,G.,&Alisauskas,R.T.(2000).Foragingpatternsofarcticfoxesat a large arctic goose colony. Arctic, 53(3), 279–288. https://doi.org/10.14430/arctic858
Schaub,M.,Kania,W.,&Köppen,U.(2005).Variationofprimaryproduc‐tionduringwinter inducessynchrony insurvivalrates inmigratorywhite storksCiconia ciconia. Journal of Animal Ecology,74(4), 656–666.https://doi.org/10.1111/j.1365‐2656.2005.00961.x
Sedinger, J. S., & Raveling,D.G. (1986). Timing of nesting by CanadaGeese in relation to the phenology and availability of their foodplants. Journal of Animal Ecology, 55(3), 1083–1102. https://doi.org/10.2307/4435
Sedinger, J. S., Schamber, J. L.,Ward, D.H., Nicolai, C. A., & Conant,B. (2011).Carryovereffectsassociatedwithwinter locationaffectfitness, social status, and population dynamics in a long‐distancemigrant. The American Naturalist, 178(5), E110–E123. https://doi.org/10.1086/662165
Serreze,M.C.,&Barry,R.G. (2011).Processes and impactsofArcticamplification:Aresearchsynthesis.Global Planetary Change,77(1–2),85–96.https://doi.org/10.1016/j.gloplacha.2011.03.004
Shipley,B. (2000).Anew inferential test forpathmodelsbasedondi‐rected acyclic graphs. Structural Equation Modeling,7(2), 206–218.https://doi.org/10.1207/s15328007sem0702_4
Shipley,B.(2009).Confirmatorypathanalysisinageneralizedmultilevelcontext.Ecology,90(2),363–368.https://doi.org/10.1890/08‐1034.1
Shipley,B.(2016).Cause and correlation in biology: A user's guide to path analysis, structural equations and causal inference with R.Cambridge,UK:CambridgeUniversityPress.
Singmann,H.,Bolker,B.,&Westfall, J. (2015). afex:Analysisof facto‐rial experiments.Rpackage version0.15‐2.Retrieved fromhttp://CRAN.R‐project.org/package=afex
Skinner, W., Jefferies, R., Carleton, T., Abraham, R. R., & Dagger, K.(1998).Predictionofreproductivesuccessandfailureinlessersnowgeesebasedonearlyseasonclimaticvariables.Global Change Biology,4(1),3–16.https://doi.org/10.1046/j.1365‐2486.1998.00097.x
Stocker, T. F., Qin, D., Plattner, G.‐K., Tignor, M. M. B., Allen, S. K.,Boschung, J., … Midgley, P. M. (2014). IPCC 2013: Climate change
2013: The physical science basis: Working Group I contribution to the fifth assessment report of the Intergovernmental Panel on Climate Change.Cambridge,UK:CambridgeUniversityPress.
Stubben,C.,&Milligan,B.(2007).EstimatingandanalyzingdemographicmodelsusingthepopbiopackageinR.Journal of Statistical Software,22(11),1–23.https://doi.org/10.18637/jss.v022.i11
Trinder,M.N.(2014).StatusandpopulationviabilityofSvalbardbarna‐clegeeseinScotland.Scottish Natural Heritage Commissioned Report No.756.ScottishNaturalHeritage,Inverness,UK.
Van der Jeugd, H. P., Eichhorn, G., Litvin, K. E., Stahl, J., Larsson,K.,VanDerGraaf,A. J.,&Drent, R.H. (2009).Keeping upwithearly springs: Rapid range expansion in an avian herbivore in‐curs a mismatch between reproductive timing and food sup‐ply. Global Change Biology, 15(5), 1057–1071. https://doi.org/10.1111/j.1365‐2486.2008.01804.x
VanderWal,R.,&Stien,A.(2014).High‐arcticplantslikeithot:Along‐term investigation of between‐year variability in plant biomass.Ecology,95(12),3414–3427.https://doi.org/10.1890/14‐0533.1
VanEerden,M.(1996).TheresponseofAnatidaetochangesinagricul‐turalpractice:Long‐termshiftsinthecarryingcapacityofwinteringwaterfowl.Gibier Faune Sauvage,13,681–706.
vanOudenhove, L.,Gauthier,G.,& Lebreton, J.D. (2014). Year‐roundeffectsof climateondemographicparametersofanarctic‐nestinggoosespecies.Journal of Animal Ecology,83(6),1322–1333.https://doi.org/10.1111/1365‐2656.12230
VanWijk,R.E.,Kölzsch,A.,Kruckenberg,H.,Ebbinge,B.S.,Müskens,G.J.,&Nolet,B.A.(2012).Individuallytrackedgeesefollowpeaksof temperature accelerationduring springmigration.Oikos,121(5),655–664.https://doi.org/10.1111/j.1600‐0706.2011.20083.x
Ward, D. H., Rexstad, E. A., Sedinger, J. S., Lindberg,M. S., & Dawe,N. K. (1997). Seasonal and annual survival of adult Pacific brant.The Journal of Wildlife Management, 61(3), 773–781. https://doi.org/10.2307/3802184
White, G. C., & Burnham, K. P. (1999). ProgramMARK: Survival esti‐mation from populations of marked animals. Bird Study, 46(sup1),S120–S139.https://doi.org/10.1080/00063659909477239
Williams,T.,Cooch,E.,Jefferies,R.,&Cooke,F. (1993).Environmentaldegradation,foodlimitationandreproductiveoutput:Juvenilesur‐vival in lesser snow geese. Journal of Animal Ecology,62(4),766–777.https://doi.org/10.2307/5395
WWT. (2017).WWT Svalbard Barnacle Goose. Latest results.Retrievedfrom http://monitoring.wwt.org.uk/our‐work/goose‐swan‐monitor‐ing‐programme/species‐accounts/svalbard‐barnacle‐goose/
Ydenberg,R.C.,&Prins,H.H.T.(1981).SpringgrazingandmanipulationoffoodqualitybyBarnacleGeese.Journal of Applied Ecology,18(2),443–453.https://doi.org/10.2307/2402405
SUPPORTING INFORMATION
Additional supporting information may be found online in theSupportingInformationsectionattheendofthearticle.
How to cite this article:Layton‐MatthewsK,HansenBB,GrøtanV,FugleiE,LoonenMJJE.Contrastingconsequencesofclimatechangeformigratorygeese:Predation,densitydependenceandcarryovereffectsoffsetbenefitsofhigh‐arcticwarming.Glob Change Biol. 2019;00:1–16. https://doi.org/10.1111/gcb.14773

Supporting information:
‘Contrasting consequences of climate change for migratory geese: predation, density
dependence and carryover effects offset benefits of high‐arctic warming’
Kate Layton‐Matthews, Brage Bremset Hansen, Vidar Grøtan, Eva Fuglei and Maarten J. J. E. Loonen
Appendix 1. Sample sizes for estimated reproduction and survival parameters.
Table S1.
Appendix 2. Predictions of post-hoc linear regressions between environmental variables
Figure S2.
Appendix 3. D-separation tests and Fisher’s C test for confirmatory path analysis
Table S3. Tests of conditional independence
Appendix 4. Hypothesised diagrams of the reproductive path model
Figure S4.1. Hypothesised path model for reproduction
Figure S4.2. Illustration of hypothesised covariate effects on survival
Table S4.3. Vital rates models used in population projection matrix
Appendix 5. Model selection tables
5.1. Reproduction: AIC-based approach
Table S5.1.1. C (clutch success)
Table S5.1.2. E (clutch size)
Table S5.1.3. H (hatching success)
Table S5.1.4. G (number of goslings)
Table S5.1.5. F (fledging probability)
5.2. Analysis of deviance for reproduction
Table S5.2.
5.3. Survival: AIC-based approach
Table S5.3. AICc-based model selection for additive survival model
5.4. Analysis of deviance for survival
Table S5.4.
S5.5. Post-hoc selection for survival model with interactions
Table S5.5.
Appendix 6. Time series of environmental covariates
Figure S6.
Appendix 7. Sensitivities of the asymptotic population growth rate
Figure S7.
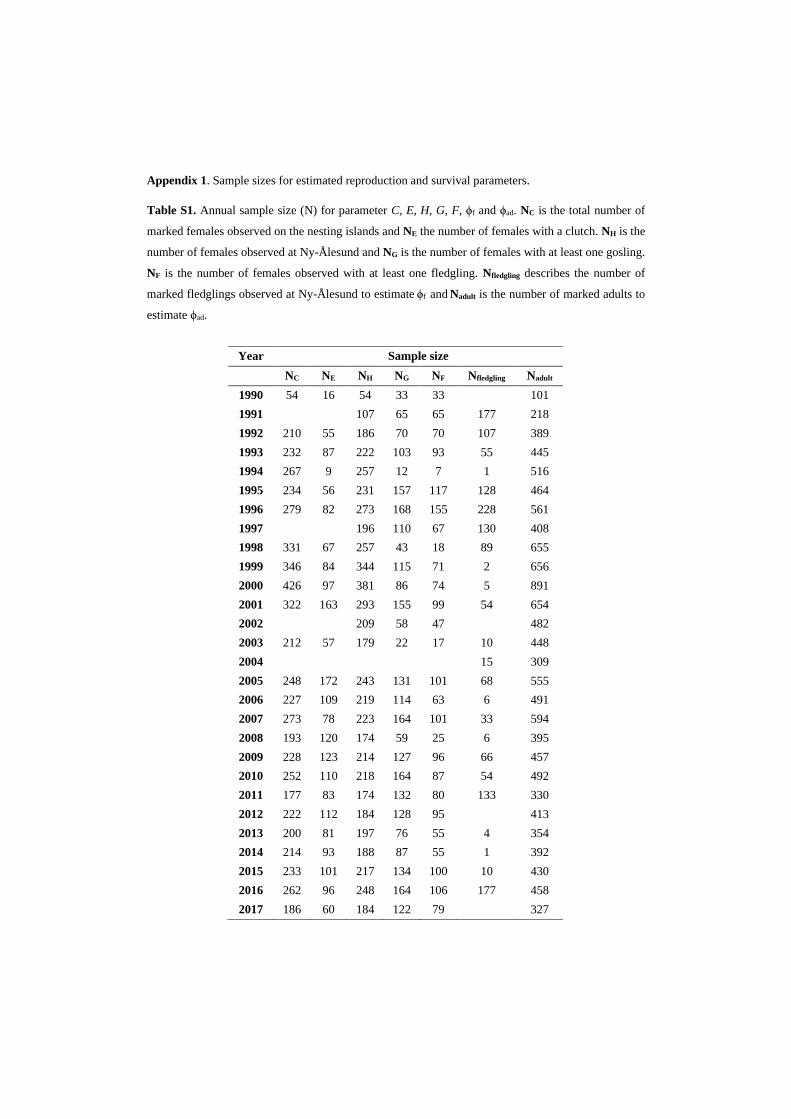
Appendix 1. Sample sizes for estimated reproduction and survival parameters.
Table S1. Annual sample size (N) for parameter C, E, H, G, F, ϕf and ϕad. NC is the total number of
marked females observed on the nesting islands and NE the number of females with a clutch. NH is the
number of females observed at Ny-Ålesund and NG is the number of females with at least one gosling.
NF is the number of females observed with at least one fledgling. Nfledgling describes the number of
marked fledglings observed at Ny-Ålesund to estimate ϕf and Nadult is the number of marked adults to
estimate ϕad.
Year Sample size
NC NE NH NG NF Nfledgling Nadult
1990 54 16 54 33 33 101
1991 107 65 65 177 218
1992 210 55 186 70 70 107 389
1993 232 87 222 103 93 55 445
1994 267 9 257 12 7 1 516
1995 234 56 231 157 117 128 464
1996 279 82 273 168 155 228 561
1997 196 110 67 130 408
1998 331 67 257 43 18 89 655
1999 346 84 344 115 71 2 656
2000 426 97 381 86 74 5 891
2001 322 163 293 155 99 54 654
2002 209 58 47 482
2003 212 57 179 22 17 10 448
2004 15 309
2005 248 172 243 131 101 68 555
2006 227 109 219 114 63 6 491
2007 273 78 223 164 101 33 594
2008 193 120 174 59 25 6 395
2009 228 123 214 127 96 66 457
2010 252 110 218 164 87 54 492
2011 177 83 174 132 80 133 330
2012 222 112 184 128 95 413
2013 200 81 197 76 55 4 354
2014 214 93 188 87 55 1 392
2015 233 101 217 134 100 10 430
2016 262 96 248 164 106 177 458
2017 186 60 184 122 79 327

Appendix 2. Predictions of post-hoc linear regressions between environmental variables
The estimated correlation between (a) spring onset date and timing of snowmelt, (b) mid-June to mid-
July temperature and onset of plant growth and (c) mid-July to mid-August precipitation and biomass
of P. arctica. Timing of snow-melt at Ny-Ålesund was measured using satellite data (Maturilli, Herber
& König-Langlo 2015). The measure of the onset of the plant growing season was defined as the mean
(Julian) date when the pixel-specific Normalized Difference Vegetation Index (NDVI) values exceeded
70% of mid-summer NDVI. NDVI values were calculated from MODIS Terra data for a polygon of
size 2.3 km close to Ny-Ålesund, which were available from Karlsen et al. (2014; 2018). The measure
of average standing crop of P. arctica was taken from a long-term experiment at Ny-Ålesund.
Measurements were taken during July to August from exclosures (to prevent grazing), the leaf length
of four individual shoots was measured at five-day intervals, at ten exclosures, and standing crop was
calculated as the average sum of leaf lengths per shoot (mm/shoot) over the growing season (Krikke
2014).
Figure S2. Predicted correlations between (a) timing of snow-melt and spring onset (b) onset of plant
growth and temperature mid-June to mid-July, Tsval,jj, and (c) mid-July to mid-August precipitation,
Psval,ja, and biomass of P. arctica (i.e. average standing crop), shown as slopes with 95% confidence
intervals estimated used the delta method (Powell 2007) with the data distribution.
(a) (b) (c)

References
Karlsen, S.R., Anderson, H.B., Van der Wal, R. & Hansen, B.B. (2018) A new NDVI measure that
overcomes data sparsity in cloud-covered regions predicts annual variation in ground-based estimates
of high arctic plant productivity. Environmental Research Letters, 13, 025011.
Karlsen, S.R., Elvebakk, A., Høgda, K.A. & Grydeland, T. (2014) Spatial and temporal variability in
the onset of the growing season on Svalbard, Arctic Norway—measured by MODIS-NDVI satellite
data. Remote Sensing, 6, 8088-8106.
Krikke, M. (2014) Are foraging conditions deteriorating on a goose grazed tundra on Spitsbergen?
Masters Thesis, University of Groningen.
Maturilli, M., Herber, A. & König-Langlo, G. (2015) Surface radiation climatology for Ny-Ålesund,
Svalbard (78.9° N), basic observations for trend detection. Theoretical and Applied Climatology, 120,
331-339.
Powell, L.A. (2007) Approximating variance of demographic parameters using the delta method: a
reference for avian biologists. The Condor, 109, 949-954.
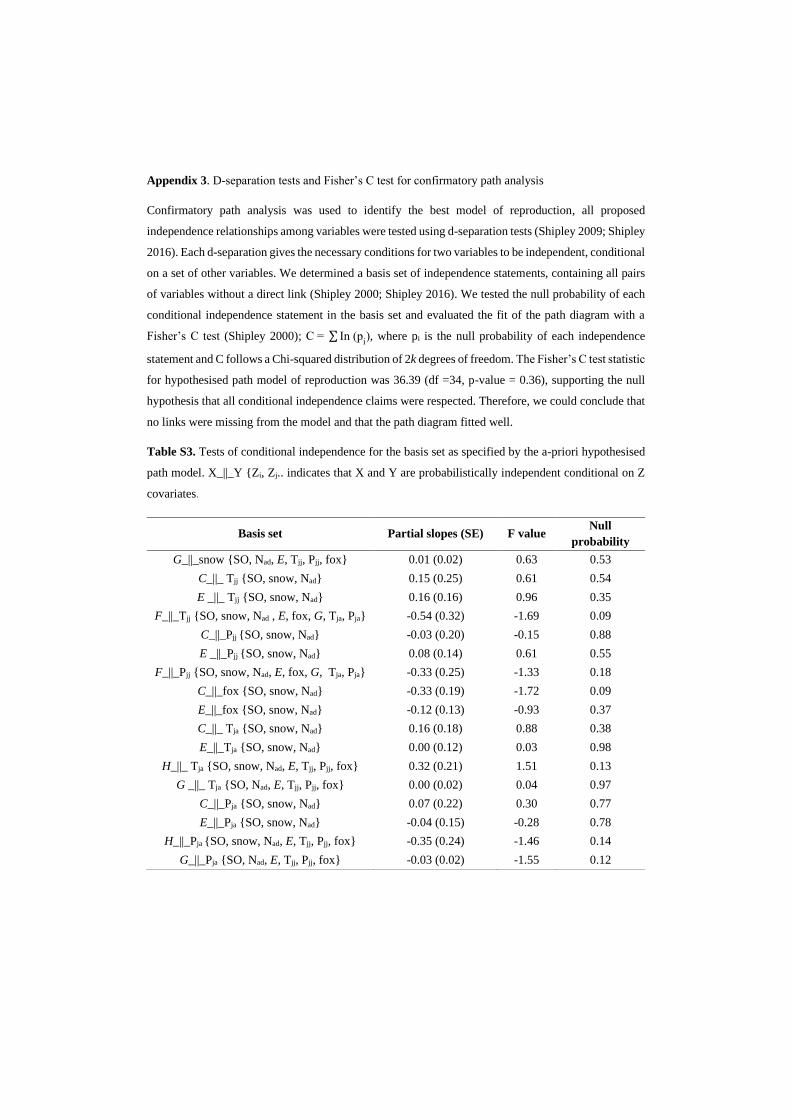
Appendix 3. D-separation tests and Fisher’s C test for confirmatory path analysis
Confirmatory path analysis was used to identify the best model of reproduction, all proposed
independence relationships among variables were tested using d-separation tests (Shipley 2009; Shipley
2016). Each d-separation gives the necessary conditions for two variables to be independent, conditional
on a set of other variables. We determined a basis set of independence statements, containing all pairs
of variables without a direct link (Shipley 2000; Shipley 2016). We tested the null probability of each
conditional independence statement in the basis set and evaluated the fit of the path diagram with a
Fisher’s C test (Shipley 2000); C = ∑ In (pi), where pi is the null probability of each independence
statement and C follows a Chi-squared distribution of 2k degrees of freedom. The Fisher’s C test statistic
for hypothesised path model of reproduction was 36.39 (df =34, p-value = 0.36), supporting the null
hypothesis that all conditional independence claims were respected. Therefore, we could conclude that
no links were missing from the model and that the path diagram fitted well.
Table S3. Tests of conditional independence for the basis set as specified by the a-priori hypothesised
path model. X_||_Y {Zi, Zj.. indicates that X and Y are probabilistically independent conditional on Z
covariates.
Basis set Partial slopes (SE) F value Null
probability
G_||_snow {SO, Nad, E, Tjj, Pjj, fox} 0.01 (0.02) 0.63 0.53
C_||_ Tjj {SO, snow, Nad} 0.15 (0.25) 0.61 0.54
E _||_ Tjj {SO, snow, Nad} 0.16 (0.16) 0.96 0.35
F_||_Tjj {SO, snow, Nad , E, fox, G, Tja, Pja} -0.54 (0.32) -1.69 0.09
C_||_Pjj {SO, snow, Nad} -0.03 (0.20) -0.15 0.88
E _||_Pjj {SO, snow, Nad} 0.08 (0.14) 0.61 0.55
F_||_Pjj {SO, snow, Nad, E, fox, G, Tja, Pja} -0.33 (0.25) -1.33 0.18
C_||_fox {SO, snow, Nad} -0.33 (0.19) -1.72 0.09
E_||_fox {SO, snow, Nad} -0.12 (0.13) -0.93 0.37
C_||_ Tja {SO, snow, Nad} 0.16 (0.18) 0.88 0.38
E_||_Tja {SO, snow, Nad} 0.00 (0.12) 0.03 0.98
H_||_ Tja {SO, snow, Nad, E, Tjj, Pjj, fox} 0.32 (0.21) 1.51 0.13
G _||_ Tja {SO, Nad, E, Tjj, Pjj, fox} 0.00 (0.02) 0.04 0.97
C_||_Pja {SO, snow, Nad} 0.07 (0.22) 0.30 0.77
E_||_Pja {SO, snow, Nad} -0.04 (0.15) -0.28 0.78
H_||_Pja {SO, snow, Nad, E, Tjj, Pjj, fox} -0.35 (0.24) -1.46 0.14
G_||_Pja {SO, Nad, E, Tjj, Pjj, fox} -0.03 (0.02) -1.55 0.12

References
Shipley, B. (2000) A new inferential test for path models based on directed acyclic graphs. Structural
Equation Modeling, 7, 206-218.
Shipley, B. (2009) Confirmatory path analysis in a generalized multilevel context. Ecology, 90, 363-
368.
Shipley, B. (2016) Cause and correlation in biology: a user's guide to path analysis, structural equations
and causal inference with R. Cambridge University Press.

Appendix 4. Hypothesised diagrams of the reproductive path model (included the 5 response variables;
C, E, H, G and F) and survival (ϕf and ϕad) models, including all potential covariates. Candidate model
sets were constructed for each response variable, with all possible combinations of covariates, and an
AIC-model selection approach was used to select the best-approximating model.
Figure S4.1. Hypothesised path model for reproduction with proposed links between covariates, from
which a candidate model set was constructed (N.B. only one arrow is shown here for dependent
parameters (i.e. C and E; H and G)).
Figure S4.2. Illustration of hypothesised covariate effects on survival over the annual cycle (i.e.
Scotland, Helgeland and Svalbard). All possible combinations of these covariates were included in the
candidate model set and compared using AICc and analysis of deviance.

Table S4.3. Models of vital rates including covariates used in population projection matrix analysis.
Parameters describing the egg-laying phase (C and E) are not included, since this would inflate
reproductive rates as both E and H are the expected number of offspring per female at different stages
of the reproductive cycle.
Par Model with slope coefficients and 95% confidence intervals
H -0.15(-0.48,0.18) + -0.39(-0.79,-0.01)SOsval + 0.63(0.30,0.95)Phelg,am + 0.22(-
0.18,0.61)Tsval,jj
G 1.03(1.00,1.07) + -0.03(-0.07,-0.01)foxsval + -0.03(-0.07,-0.01)Nsval,ad
F 0.03(-0.52, 0.58) + -0.17(-0.25,-0.09)G + -1.23(-1.77,-0.69)foxsval + -0.54(-1.12, 0.04)Psval,ja
ϕf,ad 0.46(0.32,0.60) + 1.56(1.41,1.71)agead + 0.25(0.19,0.31)Tscot,min + -0.058(-0.21, 0.09)Nscot
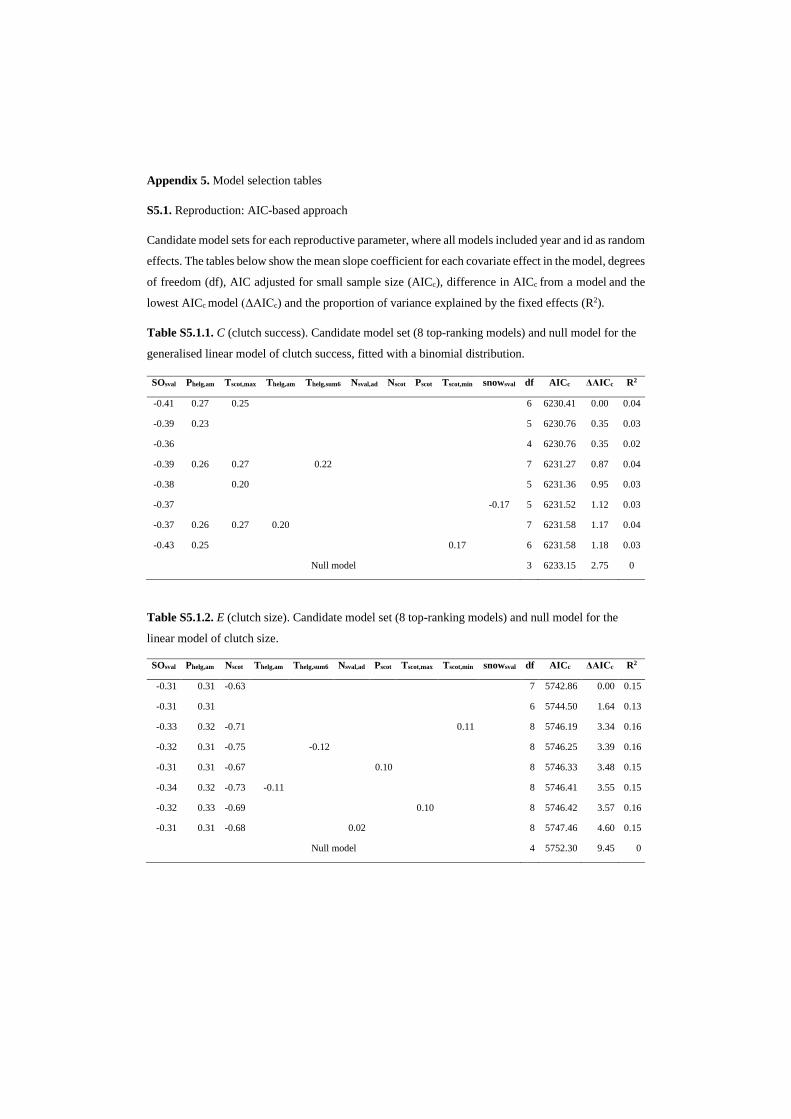
Appendix 5. Model selection tables
S5.1. Reproduction: AIC-based approach
Candidate model sets for each reproductive parameter, where all models included year and id as random
effects. The tables below show the mean slope coefficient for each covariate effect in the model, degrees
of freedom (df), AIC adjusted for small sample size (AICc), difference in AICc from a model and the
lowest AICc model (ΔAICc) and the proportion of variance explained by the fixed effects (R2).
Table S5.1.1. C (clutch success). Candidate model set (8 top-ranking models) and null model for the
generalised linear model of clutch success, fitted with a binomial distribution.
SOsval Phelg,am Tscot,max Thelg,am Thelg,sum6 Nsval,ad Nscot Pscot Tscot,min snowsval df AICc ΔAICc R2
-0.41 0.27 0.25 6 6230.41 0.00 0.04
-0.39 0.23 5 6230.76 0.35 0.03
-0.36 4 6230.76 0.35 0.02
-0.39 0.26 0.27 0.22 7 6231.27 0.87 0.04
-0.38 0.20 5 6231.36 0.95 0.03
-0.37 -0.17 5 6231.52 1.12 0.03
-0.37 0.26 0.27 0.20 7 6231.58 1.17 0.04
-0.43 0.25 0.17 6 6231.58 1.18 0.03
Null model 3 6233.15 2.75 0
Table S5.1.2. E (clutch size). Candidate model set (8 top-ranking models) and null model for the
linear model of clutch size.
SOsval Phelg,am Nscot Thelg,am Thelg,sum6 Nsval,ad Pscot Tscot,max Tscot,min snowsval df AICc ΔAICc R2
-0.31 0.31 -0.63 7 5742.86 0.00 0.15
-0.31 0.31 6 5744.50 1.64 0.13
-0.33 0.32 -0.71 0.11 8 5746.19 3.34 0.16
-0.32 0.31 -0.75 -0.12 8 5746.25 3.39 0.16
-0.31 0.31 -0.67 0.10 8 5746.33 3.48 0.15
-0.34 0.32 -0.73 -0.11 8 5746.41 3.55 0.15
-0.32 0.33 -0.69 0.10 8 5746.42 3.57 0.16
-0.31 0.31 -0.68 0.02 8 5747.46 4.60 0.15
Null model 4 5752.30 9.45 0

Table S5.1.3. H (hatching success). Candidate model set (10 top-ranking models) and null model for
generalised linear model of hatching success, fitted with a binomial distribution.
Parameter df AICc ΔAICc R2
E Tsval,jj Nsval,ad foxsval Psval,jj
0.56 0.37 5 6216.50 0.00 0.10
0.56 4 6217.53 1.04 0.06
0.56 0.36 -0.10 6 6218.29 1.80 0.11
0.56 0.37 -0.05 6 6218.44 1.95 0.10
0.56 0.37 -0.00 6 6218.50 2.00 0.10
0.56 -0.13 5 6219.19 2.70 0.07
0.56 0.11 5 6219.26 2.77 0.06
0.56 -0.02 5 6219.53 3.04 0.06
0.56 0.37 -0.11 -0.04 7 6220.27 3.77 0.06
0.56 0.37 -0.09 -0.03 7 6220.28 3.79 0.11
Null model 3 6444.26 227.76 0
Table S5.1.4. G (number of goslings). Candidate model set (10 top-ranking models) and null model for
generalised linear model of the number of goslings, fitted with a Poisson distribution.
Parameter df AICc ΔAICc R2
E Nsval,ad foxsval Psval,jj Tsval,jj
0.08 -0.03 -0.03 6 8928.01 0.00 0.04
0.08 -0.03 -0.03 0.02 7 8928.19 0.18 0.04
0.08 -0.04 0.03 6 8928.82 0.81 0.04
0.09 -0.04 5 8929.15 1.14 0.03
0.08 -0.04 5 8929.23 1.23 0.03
0.08 -0.04 -0.03 -0.01 7 8929.79 1.78 0.04
0.08 -0.04 0.02 6 8930.10 2.09 0.03
0.08 -0.04 -0.00 0.03 7 8930.78 2.77 0.04
0.09 -0.04 -0.01 6 8931.04 3.03 0.03
0.08 -0.04 0.01 6 8931.14 3.13 0.04
Null model 3 8990.28 62.27 0
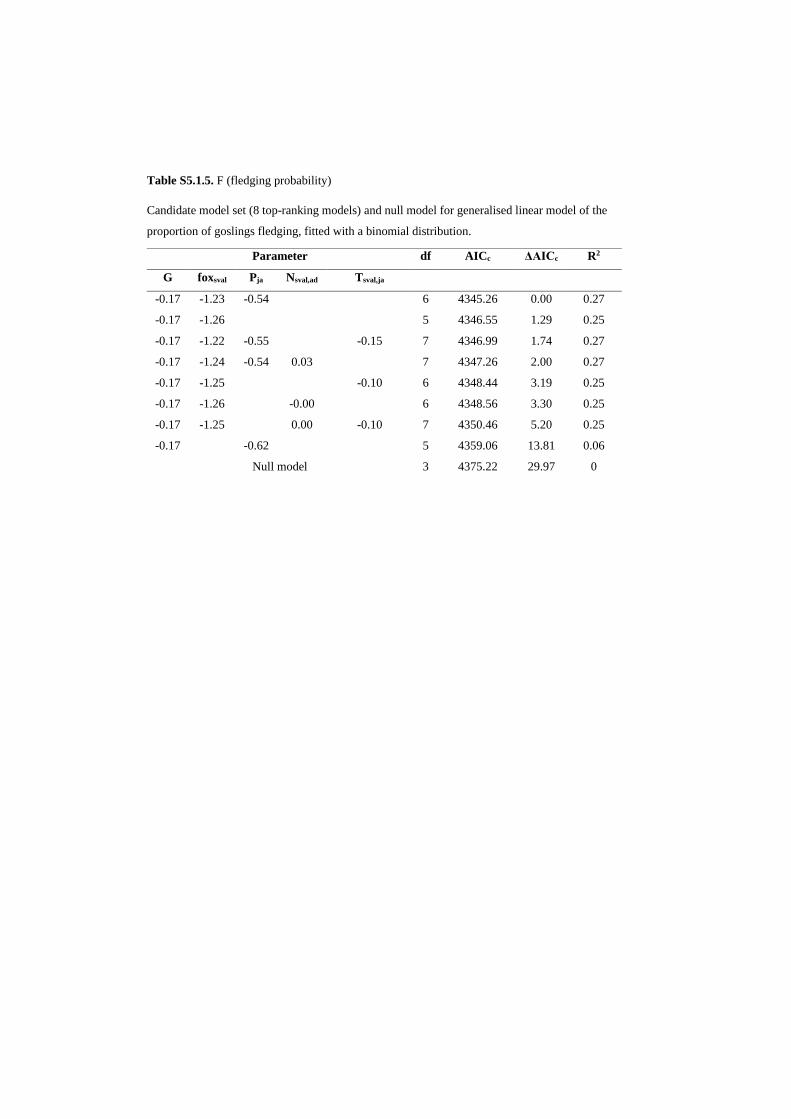
Table S5.1.5. F (fledging probability)
Candidate model set (8 top-ranking models) and null model for generalised linear model of the
proportion of goslings fledging, fitted with a binomial distribution.
Parameter df AICc ΔAICc R2
G foxsval Pja Nsval,ad Tsval,ja
-0.17 -1.23 -0.54 6 4345.26 0.00 0.27
-0.17 -1.26 5 4346.55 1.29 0.25
-0.17 -1.22 -0.55 -0.15 7 4346.99 1.74 0.27
-0.17 -1.24 -0.54 0.03 7 4347.26 2.00 0.27
-0.17 -1.25 -0.10 6 4348.44 3.19 0.25
-0.17 -1.26 -0.00 6 4348.56 3.30 0.25
-0.17 -1.25 0.00 -0.10 7 4350.46 5.20 0.25
-0.17 -0.62 5 4359.06 13.81 0.06
Null model 3 4375.22 29.97 0
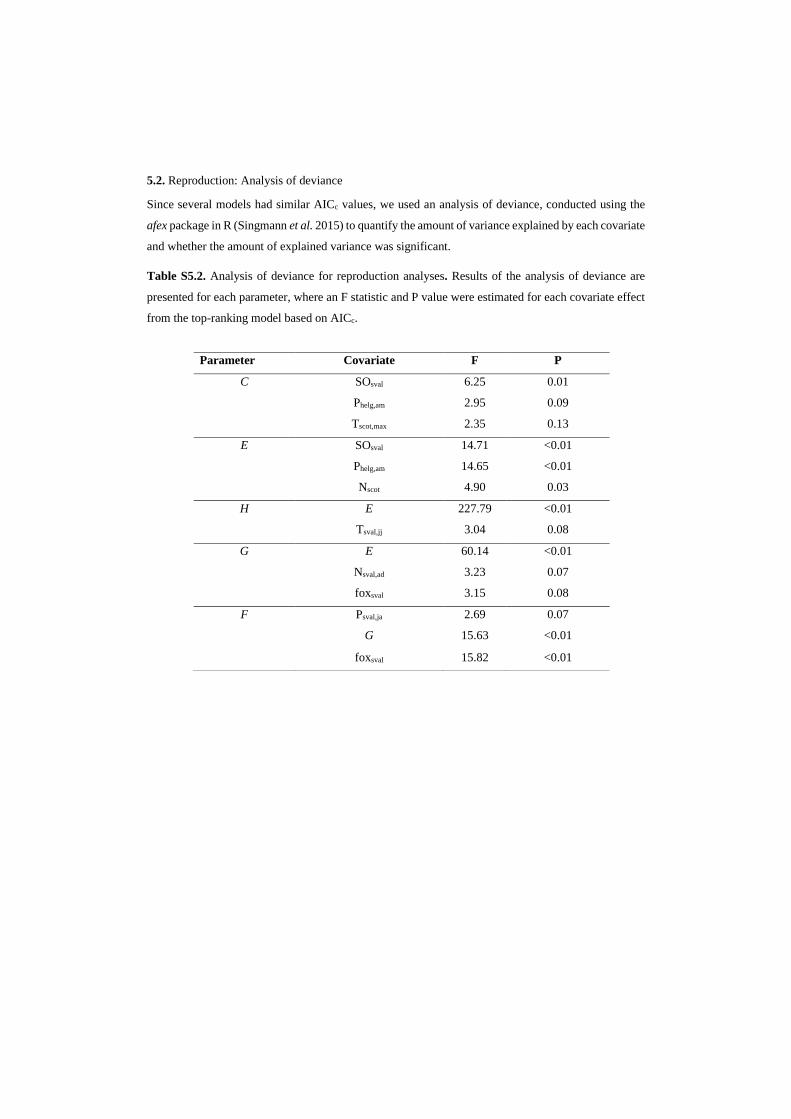
5.2. Reproduction: Analysis of deviance
Since several models had similar AICc values, we used an analysis of deviance, conducted using the
afex package in R (Singmann et al. 2015) to quantify the amount of variance explained by each covariate
and whether the amount of explained variance was significant.
Table S5.2. Analysis of deviance for reproduction analyses. Results of the analysis of deviance are
presented for each parameter, where an F statistic and P value were estimated for each covariate effect
from the top-ranking model based on AICc.
Parameter Covariate F P
C SOsval 6.25 0.01
Phelg,am 2.95 0.09
Tscot,max 2.35 0.13
E SOsval 14.71 <0.01
Phelg,am 14.65 <0.01
Nscot 4.90 0.03
H E 227.79 <0.01
Tsval,jj 3.04 0.08
G E 60.14 <0.01
Nsval,ad 3.23 0.07
foxsval 3.15 0.08
F Psval,ja 2.69 0.07
G 15.63 <0.01
foxsval 15.82 <0.01

S5.3. Survival: AICc-based approach
Table S5.3. AICc-based model selection for survival. Candidate model set (8 top-ranking models) and
null model of apparent survival rates (all models include age class). The number of parameters for the
simplest model of survival (i.e. with only age class as a predictor/null model) was 2 (par: intercept =1,
age = 1).
S5.4. Survival: Analysis of deviance
Since several models had similar AICc values we also performed an analysis of deviance, using the
program MARK (ANODEV), to confirm that the covariates from the lowest AICc models explained
significant variation.
Parameter npar AICc ΔAICc R2
Tscot,min Nscot Phelg,am Thelg,sum6 foxsval Pscot
0.29 -0.28 -0.14 0.09 -0.16
7 34452.41 0.00 0.58
0.27 -0.25 -0.15
-0.15
6 34457.07 4.65 0.56
0.24 -0.27
0.10 -0.13 0.09 7 34463.19 10.78 0.55
0.26 -0.26
0.10 -0.08
6 34464.07 11.66 0.54
0.29 -0.25 -0.10 0.07
-0.08 7 34464.57 12.16 0.54
0.26 -0.25 -0.06 0.07
6 34465.59 13.18 0.53
0.28 -0.23 -0.11
-0.08 6 34467.01 14.60 0.53
0.26 -0.25
0.08
5 34467.35 14.94 0.52
0.25 -0.24 -0.07
5 34467.82 15.41 0.52
0.26 -0.25
0.08
-0.01 6 34469.24 16.83 0.52
0.23 -0.25
-0.11 0.08 6 34469.45 17.04 0.52
0.25 -0.24
-0.06
5 34469.92 17.51 0.51
0.24 -0.23
4 34471.15 18.74 0.50
Null model 2 34624.81 172.4

Table S5.4. Analysis of deviance for survival analysis. Results are presented as an R2 equivalent
representing the variance explained by each term, calculated by (σ2unconstrained time dependent –
σ2covariate)/σ2
unconstrained time dependent (Grosbois et al. 2008), with the associated P-value (P).
S5.5 Survival: post-hoc analysis of age-specific covariate effects on survival rates
The best additive model of survival (based on an AICc-model selection and analysis of deviance
approach) included additive effects of Tscot,min and Nscot. We tested whether the effect of Tscot,min and Nscot
differed between age classes (i.e. for fledglings or adults), using an AICc-based approach.
Table S5.5. Post-hoc AICc-based model selection for the best-fitting survival model with interactions
between age classes and covariates. The number of parameters modelled (npar), AICc, ΔAICc from
lowest-ranking model and the percentage of annual variation in apparent survival explained by the
model terms (R2) are shown.
References
Singmann, H., Bolker, B., Westfall, J., Højsgaard, S. & Fox, J. (2015) Package ‘afex’ for R: Analysis
of Factorial Experiments.
Grosbois, V., Gimenez, O., Gaillard, J.M., Pradel, R., Barbraud, C., Clobert, J., Møller, A. &
Weimerskirch, H. (2008) Assessing the impact of climate variation on survival in vertebrate
populations. Biological Reviews, 83, 357-399.
Covariate R2 P
Tscot,min 0.32 <0.01
Nscot 0.31 <0.01
foxsval 0.04 0.32
Thelg,sum6 0.04 0.38
Phelg,am 0.00 0.82
Parameter npar AICc ΔAICc R2
Tscot,min Nscot age class: Tscot,min age class:Nscot
0.25 -0.06 -0.21 5 34466.96 0.00 0.52
0.22 -0.08 0.04 -0.19 6 34468.71 1.75 0.52
0.15 -0.24 0.11 5 34470.74 3.78 0.51
0.27 -0.13 4 34471.15 4.18 0.50
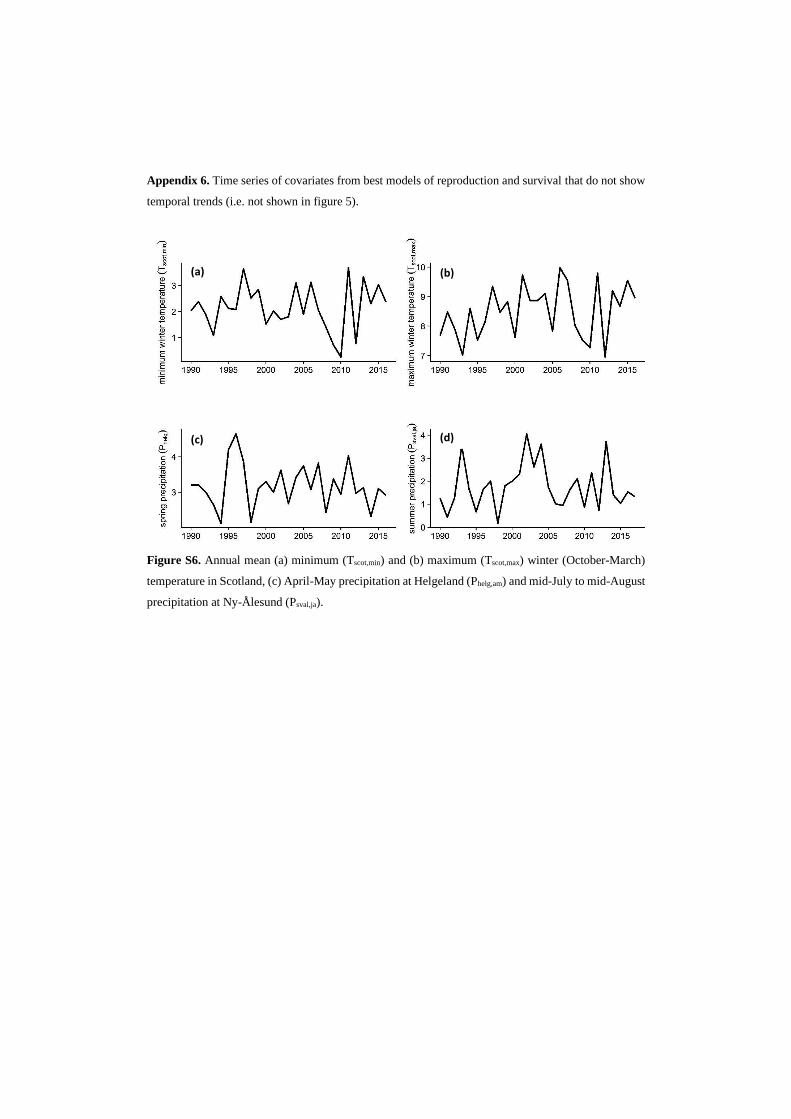
Appendix 6. Time series of covariates from best models of reproduction and survival that do not show
temporal trends (i.e. not shown in figure 5).
Figure S6. Annual mean (a) minimum (Tscot,min) and (b) maximum (Tscot,max) winter (October-March)
temperature in Scotland, (c) April-May precipitation at Helgeland (Phelg,am) and mid-July to mid-August
precipitation at Ny-Ålesund (Psval,ja).
(a) (b)
ΔA
(c) (d)
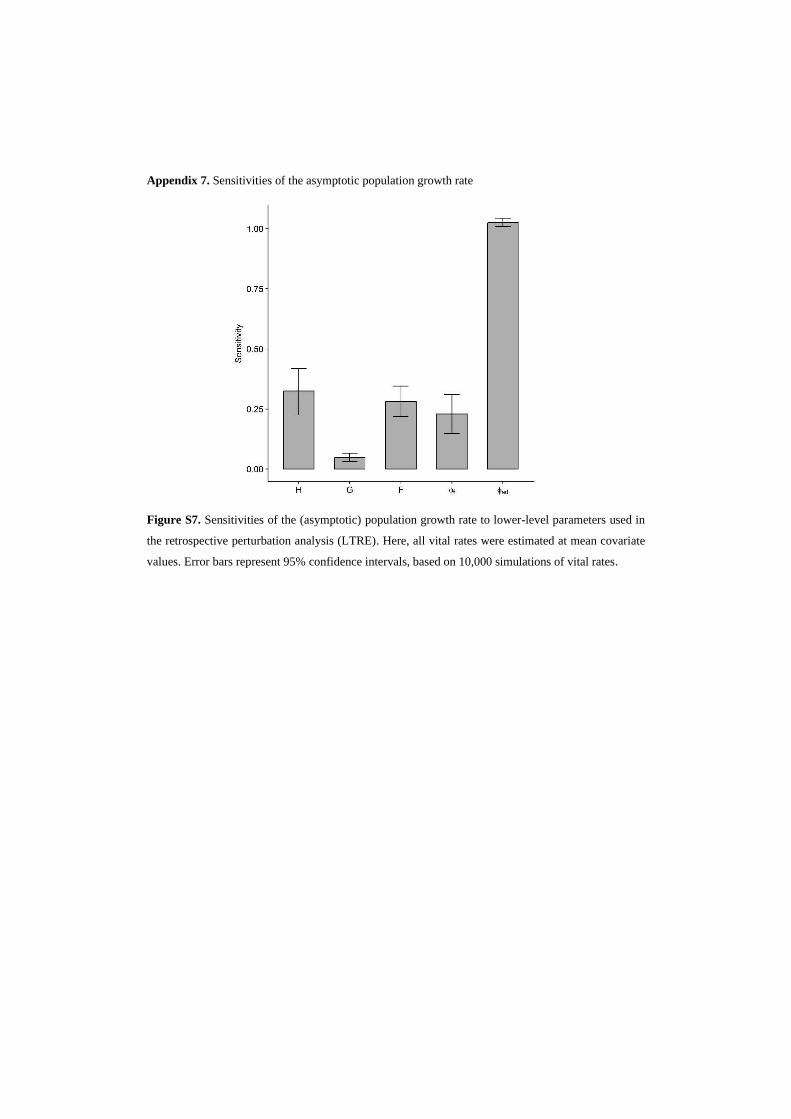
Appendix 7. Sensitivities of the asymptotic population growth rate
Figure S7. Sensitivities of the (asymptotic) population growth rate to lower-level parameters used in
the retrospective perturbation analysis (LTRE). Here, all vital rates were estimated at mean covariate
values. Error bars represent 95% confidence intervals, based on 10,000 simulations of vital rates.

Paper III


High-arctic family planning: earlier spring onset advances age at 1
first reproduction in barnacle geese 2
3 4 Mari Aas Fjelldal1*, Kate Layton-Matthews1*, Aline Magdalena Lee1, Vidar Grøtan1, Maarten J.J.E. 5 Loonen2 & Brage Bremset Hansen1 6 7
1. Centre for Biodiversity Dynamics, Department of Biology, Norwegian University of Science and 8 Technology (NTNU), 7491 Trondheim, Norway 9
2. Arctic Centre, University of Groningen, 9700 AB Groningen, The Netherlands 10
11
Keywords: population ecology, age at first reproduction, arctic, climate change, multi-event, state 12 uncertainty 13
14
Corresponding author: [email protected] 15
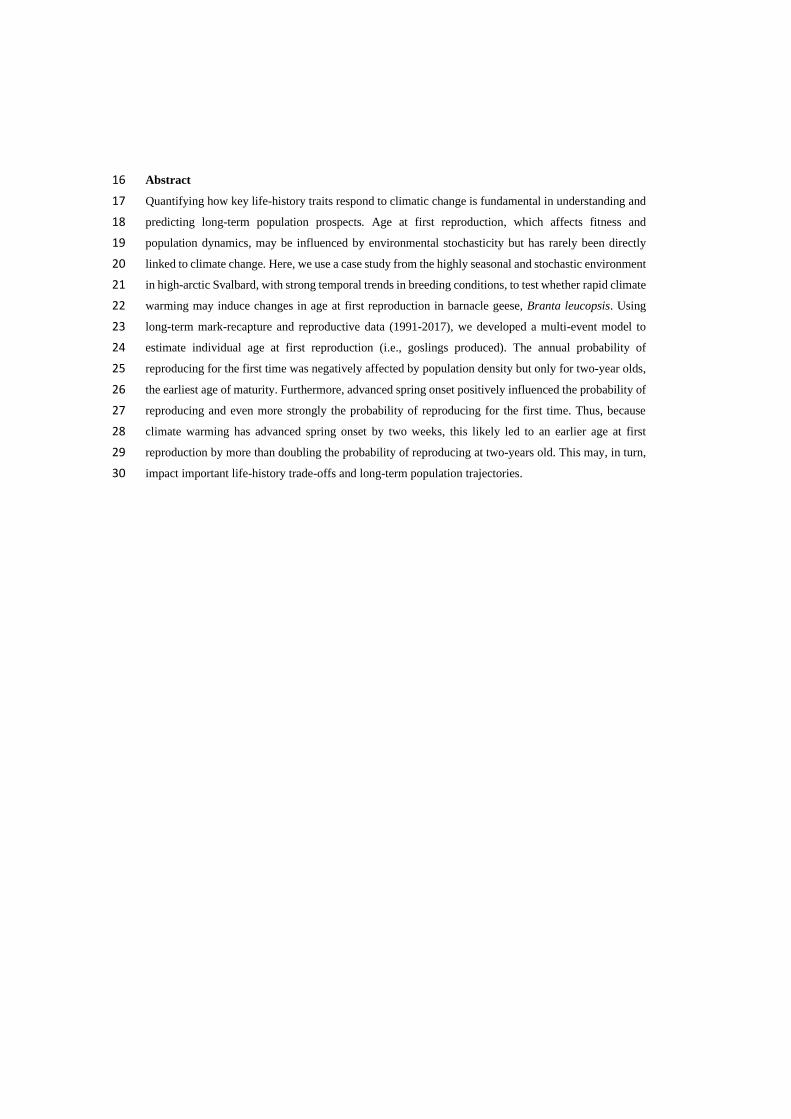
Abstract 16
Quantifying how key life-history traits respond to climatic change is fundamental in understanding and 17
predicting long-term population prospects. Age at first reproduction, which affects fitness and 18
population dynamics, may be influenced by environmental stochasticity but has rarely been directly 19
linked to climate change. Here, we use a case study from the highly seasonal and stochastic environment 20
in high-arctic Svalbard, with strong temporal trends in breeding conditions, to test whether rapid climate 21
warming may induce changes in age at first reproduction in barnacle geese, Branta leucopsis. Using 22
long-term mark-recapture and reproductive data (1991-2017), we developed a multi-event model to 23
estimate individual age at first reproduction (i.e., goslings produced). The annual probability of 24
reproducing for the first time was negatively affected by population density but only for two-year olds, 25
the earliest age of maturity. Furthermore, advanced spring onset positively influenced the probability of 26
reproducing and even more strongly the probability of reproducing for the first time. Thus, because 27
climate warming has advanced spring onset by two weeks, this likely led to an earlier age at first 28
reproduction by more than doubling the probability of reproducing at two-years old. This may, in turn, 29
impact important life-history trade-offs and long-term population trajectories. 30
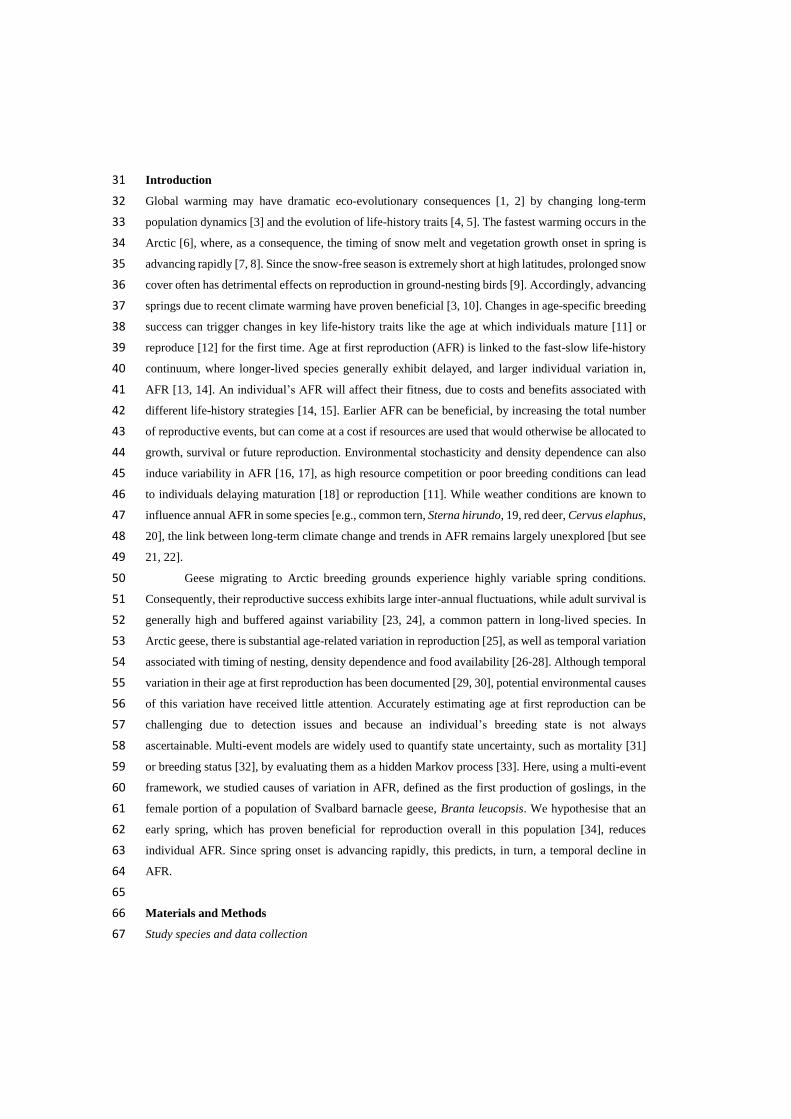
Introduction 31
Global warming may have dramatic eco-evolutionary consequences [1, 2] by changing long-term 32
population dynamics [3] and the evolution of life-history traits [4, 5]. The fastest warming occurs in the 33
Arctic [6], where, as a consequence, the timing of snow melt and vegetation growth onset in spring is 34
advancing rapidly [7, 8]. Since the snow-free season is extremely short at high latitudes, prolonged snow 35
cover often has detrimental effects on reproduction in ground-nesting birds [9]. Accordingly, advancing 36
springs due to recent climate warming have proven beneficial [3, 10]. Changes in age-specific breeding 37
success can trigger changes in key life-history traits like the age at which individuals mature [11] or 38
reproduce [12] for the first time. Age at first reproduction (AFR) is linked to the fast-slow life-history 39
continuum, where longer-lived species generally exhibit delayed, and larger individual variation in, 40
AFR [13, 14]. An individual’s AFR will affect their fitness, due to costs and benefits associated with 41
different life-history strategies [14, 15]. Earlier AFR can be beneficial, by increasing the total number 42
of reproductive events, but can come at a cost if resources are used that would otherwise be allocated to 43
growth, survival or future reproduction. Environmental stochasticity and density dependence can also 44
induce variability in AFR [16, 17], as high resource competition or poor breeding conditions can lead 45
to individuals delaying maturation [18] or reproduction [11]. While weather conditions are known to 46
influence annual AFR in some species [e.g., common tern, Sterna hirundo, 19, red deer, Cervus elaphus, 47
20], the link between long-term climate change and trends in AFR remains largely unexplored [but see 48
21, 22]. 49
Geese migrating to Arctic breeding grounds experience highly variable spring conditions. 50
Consequently, their reproductive success exhibits large inter-annual fluctuations, while adult survival is 51
generally high and buffered against variability [23, 24], a common pattern in long-lived species. In 52
Arctic geese, there is substantial age-related variation in reproduction [25], as well as temporal variation 53
associated with timing of nesting, density dependence and food availability [26-28]. Although temporal 54
variation in their age at first reproduction has been documented [29, 30], potential environmental causes 55
of this variation have received little attention. Accurately estimating age at first reproduction can be 56
challenging due to detection issues and because an individual’s breeding state is not always 57
ascertainable. Multi-event models are widely used to quantify state uncertainty, such as mortality [31] 58
or breeding status [32], by evaluating them as a hidden Markov process [33]. Here, using a multi-event 59
framework, we studied causes of variation in AFR, defined as the first production of goslings, in the 60
female portion of a population of Svalbard barnacle geese, Branta leucopsis. We hypothesise that an 61
early spring, which has proven beneficial for reproduction overall in this population [34], reduces 62
individual AFR. Since spring onset is advancing rapidly, this predicts, in turn, a temporal decline in 63
AFR. 64
65
Materials and Methods 66
Study species and data collection 67

Our study population of breeding barnacle geese is located around Ny-Ålesund (Kongsfjorden), 68
Svalbard (78.9°N, 11.9°E). The Svalbard flyway population overwinters at Solway Firth, UK (55°N, 69
3.30°W), then travels north in spring with a stop-over along mainland Norway before arriving at the 70
Svalbard breeding grounds. Barnacle geese are long-lived (up to 28 years old) and become sexually 71
mature at two years of age [25, 35]. They are partial capital breeders, utilising reserves acquired at 72
wintering and stopover sites earlier in the annual cycle to initiate reproduction [36, 37]. Over a 26-year 73
period (1991 - 2017), 480 female goslings were caught at Ny‐Ålesund and ringed with unique colour 74
and metal bands during moulting (July/August). Geese nest on islands during May-June. After hatching, 75
families return to Ny-Ålesund to forage, where ringed adults and associated goslings are recorded, 76
resulting in 3006 individual observations used to model AFR (appendix 1a). Males were excluded from 77
the dataset due to lower recapture rates [35]. Date of spring onset (SO) and adult population density 78
(POP) were included as time-varying covariates. Accumulated winter snowfall [38] was included 79
initially, but showed no evidence of an effect. SO is the (ordinal) day when the 10-day smoothed daily 80
temperature crosses 0°C and remains above for at least 10 days [39] and has been shown to affect egg 81
production [34]. POP is an annual estimate of adult numbers in the study population, which negatively 82
affects gosling production and fledgling recruitment [34, 40]. 83
84 Statistical analysis 85
Mark-recapture data were used to estimate age at first reproduction (AFR), where reproduction is 86
defined as a female producing goslings (recorded at the foraging grounds, see appendix 1a). Data 87
consisted of individual capture histories of female barnacle geese, recorded as observed with at least 88
one gosling, observed without goslings, or not observed, in a given year. A multi-event model, run in 89
program E-SURGE [Multi-Event SURvival Generalized Estimation; version 2.1.4, 41], was used to 90
separate states, representing the ‘true’ reproductive status of an individual in a given year, and events, 91
i.e., the observed state of an individual. We modelled four states, pre-breeder (PB), non-breeder (NB), 92
breeder (B) and dead (†). PB was any individual not breeding at year t that had never bred previously. 93
NB included individuals not breeding at year t but that had bred in a previous year. B was any female 94
that produced at least one gosling at year t and † includes dead and permanently emigrated individuals. 95
Three events were considered: ‘not seen’, ‘seen as breeder’ and ‘seen as non-breeder’. Only individuals 96
in the B state could give rise to a ‘seen as breeder’ event, whereas both PB and NB states contributed to 97
‘seen but not breeding’ events, and individuals in all three states could be recorded in a ‘not seen’ event 98
(figure 1). See table 1 for definitions. 99
Goodness-of-fit (GOF) tests on a simplified, multi-state dataset (n = 687, four states: PB, B, 100
NB, not observed) in program U-CARE [version 2.3.4, 41] indicated transience, which was accounted 101
for by modelling age-dependent apparent survival, and trap-history-dependent recapture, which was not 102
considered problematic for this analysis (see appendix 1b for details). Details on model implementation 103
are found in appendix 1c. 104
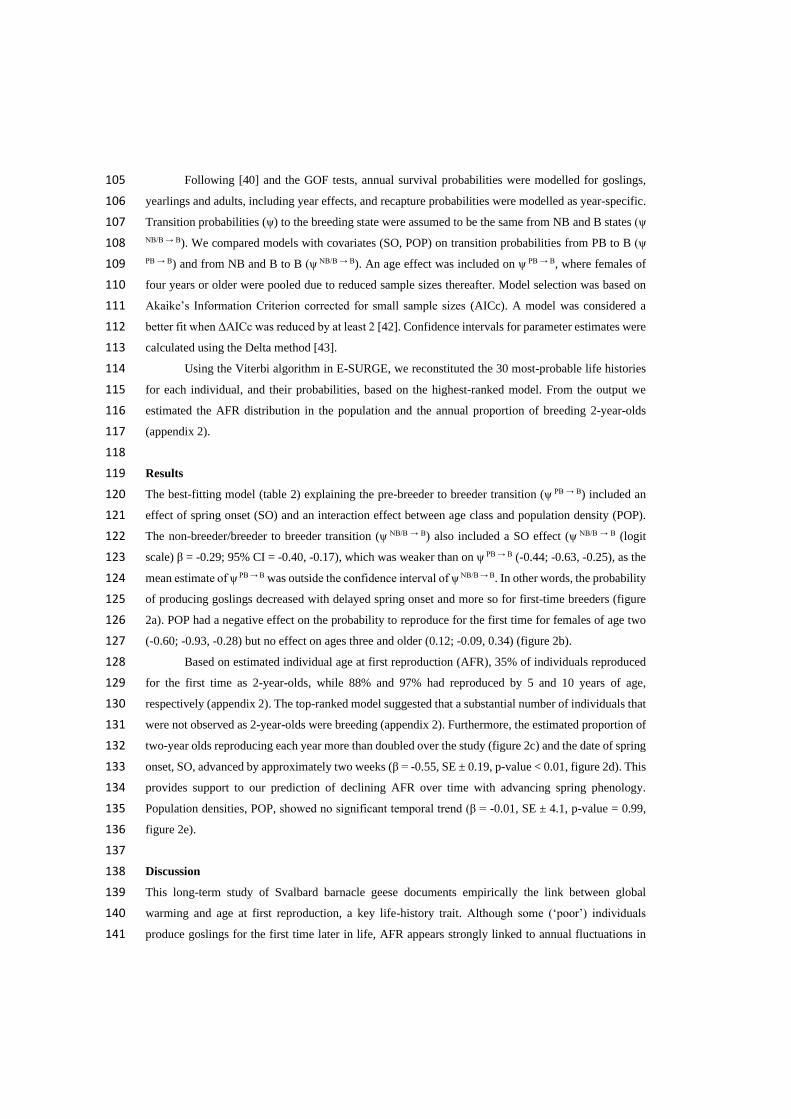
Following [40] and the GOF tests, annual survival probabilities were modelled for goslings, 105
yearlings and adults, including year effects, and recapture probabilities were modelled as year-specific. 106
Transition probabilities (ψ) to the breeding state were assumed to be the same from NB and B states (ψ 107 NB/B → B). We compared models with covariates (SO, POP) on transition probabilities from PB to B (ψ 108
PB → B) and from NB and B to B (ψ NB/B → B). An age effect was included on ψ PB → B, where females of 109
four years or older were pooled due to reduced sample sizes thereafter. Model selection was based on 110
Akaike’s Information Criterion corrected for small sample sizes (AICc). A model was considered a 111
better fit when ΔAICc was reduced by at least 2 [42]. Confidence intervals for parameter estimates were 112
calculated using the Delta method [43]. 113
Using the Viterbi algorithm in E-SURGE, we reconstituted the 30 most-probable life histories 114
for each individual, and their probabilities, based on the highest-ranked model. From the output we 115
estimated the AFR distribution in the population and the annual proportion of breeding 2-year-olds 116
(appendix 2). 117
118
Results 119
The best-fitting model (table 2) explaining the pre-breeder to breeder transition (ψ PB → B) included an 120
effect of spring onset (SO) and an interaction effect between age class and population density (POP). 121
The non-breeder/breeder to breeder transition (ψ NB/B → B) also included a SO effect (ψ NB/B → B (logit 122
scale) β = -0.29; 95% CI = -0.40, -0.17), which was weaker than on ψ PB → B (-0.44; -0.63, -0.25), as the 123
mean estimate of ψ PB → B was outside the confidence interval of ψ NB/B → B. In other words, the probability 124
of producing goslings decreased with delayed spring onset and more so for first-time breeders (figure 125
2a). POP had a negative effect on the probability to reproduce for the first time for females of age two 126
(-0.60; -0.93, -0.28) but no effect on ages three and older (0.12; -0.09, 0.34) (figure 2b). 127
Based on estimated individual age at first reproduction (AFR), 35% of individuals reproduced 128
for the first time as 2-year-olds, while 88% and 97% had reproduced by 5 and 10 years of age, 129
respectively (appendix 2). The top-ranked model suggested that a substantial number of individuals that 130
were not observed as 2-year-olds were breeding (appendix 2). Furthermore, the estimated proportion of 131
two-year olds reproducing each year more than doubled over the study (figure 2c) and the date of spring 132
onset, SO, advanced by approximately two weeks (β = -0.55, SE ± 0.19, p-value < 0.01, figure 2d). This 133
provides support to our prediction of declining AFR over time with advancing spring phenology. 134
Population densities, POP, showed no significant temporal trend (β = -0.01, SE ± 4.1, p-value = 0.99, 135
figure 2e). 136
137
Discussion 138
This long-term study of Svalbard barnacle geese documents empirically the link between global 139
warming and age at first reproduction, a key life-history trait. Although some (‘poor’) individuals 140
produce goslings for the first time later in life, AFR appears strongly linked to annual fluctuations in 141
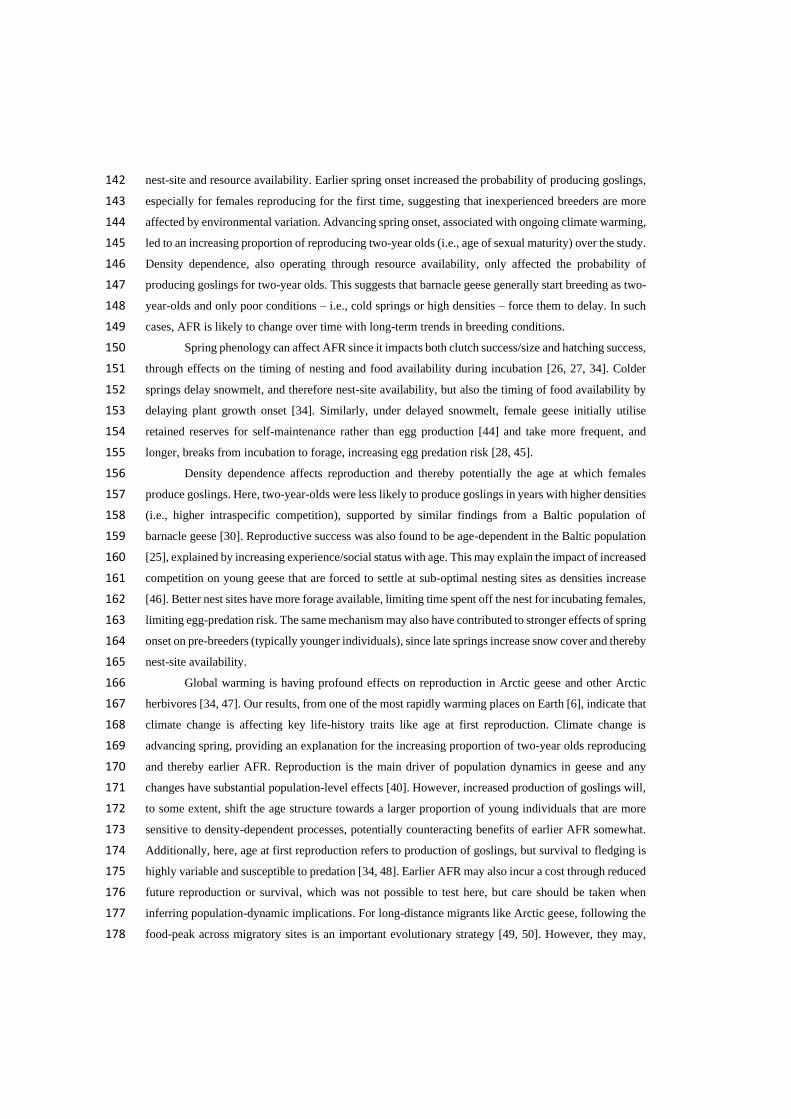
nest-site and resource availability. Earlier spring onset increased the probability of producing goslings, 142
especially for females reproducing for the first time, suggesting that inexperienced breeders are more 143
affected by environmental variation. Advancing spring onset, associated with ongoing climate warming, 144
led to an increasing proportion of reproducing two-year olds (i.e., age of sexual maturity) over the study. 145
Density dependence, also operating through resource availability, only affected the probability of 146
producing goslings for two-year olds. This suggests that barnacle geese generally start breeding as two-147
year-olds and only poor conditions – i.e., cold springs or high densities – force them to delay. In such 148
cases, AFR is likely to change over time with long-term trends in breeding conditions. 149
Spring phenology can affect AFR since it impacts both clutch success/size and hatching success, 150
through effects on the timing of nesting and food availability during incubation [26, 27, 34]. Colder 151
springs delay snowmelt, and therefore nest-site availability, but also the timing of food availability by 152
delaying plant growth onset [34]. Similarly, under delayed snowmelt, female geese initially utilise 153
retained reserves for self-maintenance rather than egg production [44] and take more frequent, and 154
longer, breaks from incubation to forage, increasing egg predation risk [28, 45]. 155
Density dependence affects reproduction and thereby potentially the age at which females 156
produce goslings. Here, two-year-olds were less likely to produce goslings in years with higher densities 157
(i.e., higher intraspecific competition), supported by similar findings from a Baltic population of 158
barnacle geese [30]. Reproductive success was also found to be age-dependent in the Baltic population 159
[25], explained by increasing experience/social status with age. This may explain the impact of increased 160
competition on young geese that are forced to settle at sub-optimal nesting sites as densities increase 161
[46]. Better nest sites have more forage available, limiting time spent off the nest for incubating females, 162
limiting egg-predation risk. The same mechanism may also have contributed to stronger effects of spring 163
onset on pre-breeders (typically younger individuals), since late springs increase snow cover and thereby 164
nest-site availability. 165
Global warming is having profound effects on reproduction in Arctic geese and other Arctic 166
herbivores [34, 47]. Our results, from one of the most rapidly warming places on Earth [6], indicate that 167
climate change is affecting key life-history traits like age at first reproduction. Climate change is 168
advancing spring, providing an explanation for the increasing proportion of two-year olds reproducing 169
and thereby earlier AFR. Reproduction is the main driver of population dynamics in geese and any 170
changes have substantial population-level effects [40]. However, increased production of goslings will, 171
to some extent, shift the age structure towards a larger proportion of young individuals that are more 172
sensitive to density-dependent processes, potentially counteracting benefits of earlier AFR somewhat. 173
Additionally, here, age at first reproduction refers to production of goslings, but survival to fledging is 174
highly variable and susceptible to predation [34, 48]. Earlier AFR may also incur a cost through reduced 175
future reproduction or survival, which was not possible to test here, but care should be taken when 176
inferring population-dynamic implications. For long-distance migrants like Arctic geese, following the 177
food-peak across migratory sites is an important evolutionary strategy [49, 50]. However, they may, 178

eventually, be unable to keep up with fast-changing spring conditions [51], leading to phenological 179
mismatch in food-web interactions [52, 53], with potentially negative reproductive consequences [54]. 180
Nevertheless, this population shows no current indication of mismatch effects [34]. On the contrary, 181
Arctic climate change appears to allow for higher gosling production and earlier age at first 182
reproduction, which may have positive consequences for population persistence. 183
184
Acknowledgements 185
NWO, Ministry of Foreign Affairs, BIRDHEALTH (851.40.071), Geese on Arctic Tundra 186
(866.12.407), EU FP7‐project FRAGILE and University of Groningen provided funding for data 187
collection. Research Council of Norway (FRIMEDBIO 276080, KLIMAFORSK 244647 and 273451, 188
Centre of Excellence 223257 and AFG 269961) supported this work. We thank scientists, students and 189
volunteers for data collection and processing. Permissions from Governor of Svalbard, Bird Ringing 190
Centre (Stavanger), FOTS and UK WWT made fieldwork possible. 191
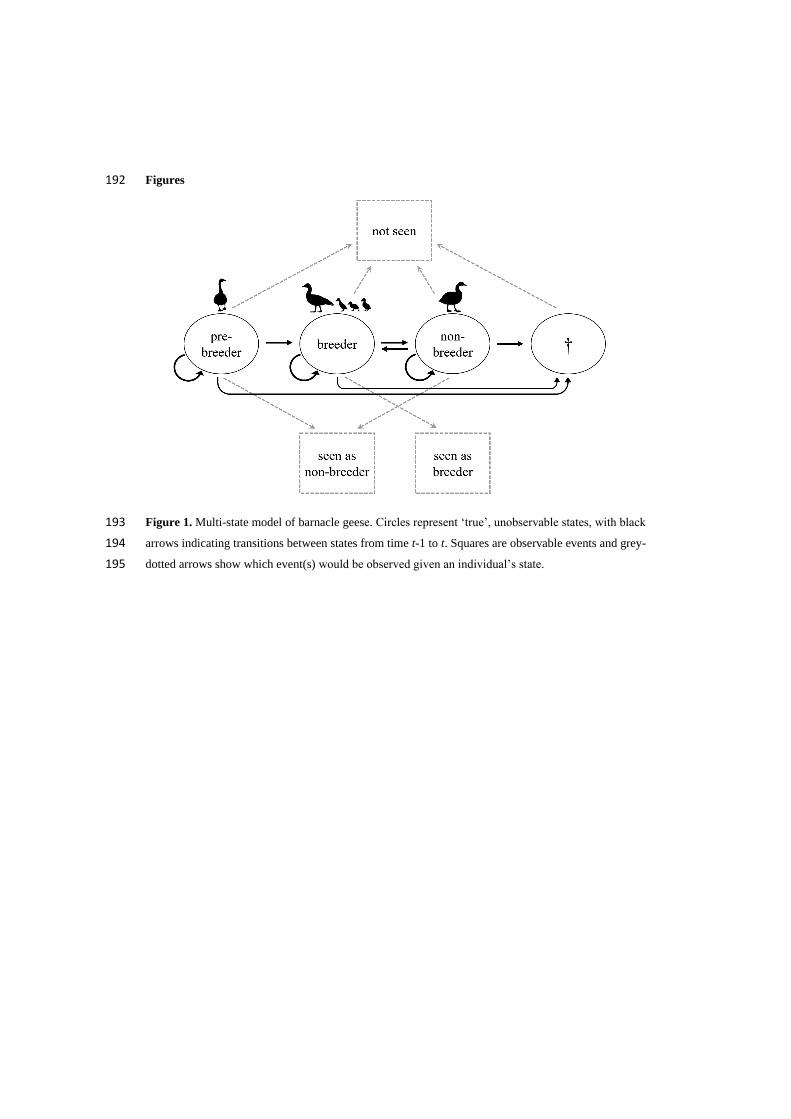
Figures 192
Figure 1. Multi-state model of barnacle geese. Circles represent ‘true’, unobservable states, with black 193
arrows indicating transitions between states from time t-1 to t. Squares are observable events and grey-194
dotted arrows show which event(s) would be observed given an individual’s state. 195

196
197
Figure 2. (a) Effect of spring onset date, SO, on reproduction probability of first-time (pre-breeders, 198
PB) and experienced (non-breeders or breeders, NB/B) mothers. (b) Population density, POP, effects on 199
age classes 2 and 3+ in PB. Annual (c) estimated proportion of 2-year-olds reproducing, (d) SO and (e) 200
POP. Dashed lines indicate (c) trend towards an increasing proportion of 2-year-old individuals 201
reproducing for the first time, estimated with E-SURGE (see Methods), and (d) advancing spring 202
phenology. 203

Table 1. Explanations of terminology. 204
205 Terminology Meaning Definition
AFR Age at first
reproduction
The age at which a female first produces goslings that
survive to the foraging area (around Ny-Ålesund).
State True annual state PB, B, NB and †. Not always observable. An individual
without goslings may be PB or NB, depending on its
reproduction history.
Transition Shift between states
from year t-1 to year
t
Transition probability from any (living) state at t-1 (i.e., B,
PB, NB) to state B at year t represents the breeding
probability at year t.
Event Annual observed
reproductive situation
Events include seen as a breeder (i.e., with goslings), non-
breeder and not observed.
PB Pre-breeder State of females that have yet to produce goslings for the
first time. Note: reproduction probability of PB refers to
individuals in PB at t-1 that transitioned into B at t.
B Breeder State of birds producing one or more goslings in a given
year.
NB Non-breeder State of birds not producing goslings during breeding
season but having bred previously.
† Dead State dead includes dead and permanently emigrated
individuals.
SO Spring onset date (Ordinal) day when 10-day smoothed daily temperature
crosses 0°C and remains above for at least 10 days
POP Population density Annual estimated number of adults in the study population
at Ny-Ålesund
206
207
Table 2. Ten highest-ranked models of transition probabilities for PB and NB/B to B. k = number of 208
parameters for transition estimations, excluding survival and recapture (k = 54). 209
210
Rank Model ψPB→B Model ψB/NB→B k AICc ΔAICc
1 age2-3+ × POP + SO SO 6 9760.9 0
2 age2-3+ × POP + SO SO + POP 7 9762.1 1.2
3 age2-4+ × POP + SO SO 7 9762.4 1.5
4 age2-3+ × POP age2-4+ × SO SO 9 9763.4 2.5
5 age2-4+ × POP + SO SO + POP 8 9763.5 2.6
6 age2-3+ × POP age2-3+ × SO SO 8 9764.9 4.0
7 SO SO 4 9773.3 12.4
8 SO + POP SO 5 9773.5 12.6
9 age2-4+ × SO + POP SO 7 9774.3 13.4
10 SO SO + POP 5 9774.6 13.7
References 211
[1] Parmesan, C. 2006 Ecological and evolutionary responses to recent climate change. Annu. Rev. Ecol. 212 Evol. Syst. 37, 637-669. 213
[2] Walther, G.-R., Post, E., Convey, P., Menzel, A., Parmesan, C., Beebee, T.J., Fromentin, J.-M., 214 Hoegh-Guldberg, O. & Bairlein, F. 2002 Ecological responses to recent climate change. Nature 416, 215 389. 216
[3] Post, E., Forchhammer, M.C., Bret-Harte, M.S., Callaghan, T.V., Christensen, T.R., Elberling, B., 217 Fox, A.D., Gilg, O., Hik, D.S. & Høye, T.T. 2009 Ecological dynamics across the Arctic associated with 218 recent climate change. Science 325, 1355-1358. 219
[4] Winkler, D.W., Dunn, P.O. & McCulloch, C.E. 2002 Predicting the effects of climate change on 220 avian life-history traits. Proceedings of the National Academy of Sciences 99, 13595-13599. 221
[5] Parmesan, C. 2007 Influences of species, latitudes and methodologies on estimates of phenological 222 response to global warming. Global Change Biology 13, 1860-1872. 223
[6] Serreze, M.C. & Barry, R.G. 2011 Processes and impacts of Arctic amplification: A research 224 synthesis. Global Planetary Change 77, 85-96. 225
[7] Foster, J. 1989 The significance of the date of snow disappearance on the Arctic tundra as a possible 226 indicator of climate change. Arctic and Alpine Research 21, 60-70. 227
[8] Bjorkman, A.D., Elmendorf, S.C., Beamish, A.L., Vellend, M. & Henry, G.H. 2015 Contrasting 228 effects of warming and increased snowfall on Arctic tundra plant phenology over the past two decades. 229 Global Change Biology 21, 4651-4661. 230
[9] Meltofte, H., Høye, T.T. & Schmidt, N.M. 2008 Effects of food availability, snow and predation on 231 breeding performance of waders at Zackenberg. Advances in Ecological Research 40, 325-343. 232
[10] Gareth, K. 2004 Predicting impacts of Arctic climate change: past lessons and future challenges. 233 Ecological Research 19, 65-74. 234
[11] Sæther, B.-E. & Heim, M. 1993 Ecological correlates of individual variation in age at maturity in 235 female moose (Alces alces): the effects of environmental variability. Journal of Animal Ecology 62, 236 482-489. 237
[12] Martin, K. 1995 Patterns and mechanisms for age-dependent reproduction and survival in birds. 238 American Zoologist 35, 340-348. 239
[13] Charlesworth, B. 1994 Evolution in age-structured populations. Cambridge, UK, Cambridge 240 University Press. 241
[14] Stearns, S.C. 1992 The evolution of life histories. Oxford, UK, Oxford University Press. 242
[15] Cole, L.C. 1954 The population consequences of life history phenomena. The Quarterly Review of 243 Biology 29, 103-137. 244
[16] Grøtan, V., Sæther, B.-E., Lillegård, M., Solberg, E.J. & Engen, S. 2009 Geographical variation in 245 the influence of density dependence and climate on the recruitment of Norwegian moose. Oecologia 246 161, 685-695. 247
[17] Sand, H. 1996 Life history patterns in female moose (Alces alces): the relationship between age, 248 body size, fecundity and environmental conditions. Oecologia 106, 212-220. 249
[18] Boertje, R.D., Frye, G.G. & Young Jr, D.D. 2019 Lifetime, known‐age moose reproduction in a 250 nutritionally stressed population. The Journal of Wildlife Management 83, 610-626. 251
[19] Becker, P.H., Dittmann, T., Ludwigs, J.-D., Limmer, B., Ludwig, S.C., Bauch, C., Braasch, A. & 252 Wendeln, H. 2008 Timing of initial arrival at the breeding site predicts age at first reproduction in a 253 long-lived migratory bird. Proceedings of the National Academy of Sciences 105, 12349-12352. 254
[20] Langvatn, R., Albon, S., Burkey, T. & Clutton-Brock, T. 1996 Climate, plant phenology and 255 variation in age of first reproduction in a temperate herbivore. Journal of Animal Ecology 65, 653-670. 256
[21] Jonsson, N. & Jonsson, B. 2004 Size and age of maturity of Atlantic salmon correlate with the 257 North Atlantic Oscillation Index (NAOI). Journal of Fish Biology 64, 241-247. 258
[22] Mangel, M. 1994 Climate change and salmonid life history variation. Deep Sea Research Part II: 259 Topical Studies in Oceanography 41, 75-106. 260
[23] Clausen, P., Frederiksen, M., Percival, S., Anderson, G. & Denny, M. 2001 Seasonal and annual 261 survival of East-Atlantic Pale-bellied Brent Geese Branta hrota assessed by capture-recapture analysis. 262 Ardea 89, 101-112. 263
[24] Kery, M., Madsen, J. & Lebreton, J.D. 2006 Survival of Svalbard pink‐footed geese Anser 264 brachyrhynchus in relation to winter climate, density and land‐use. Journal of Animal Ecology 75, 1172-265 1181. 266
[25] Forslund, P. & Larsson, K. 1992 Age-related reproductive success in the barnacle goose. Journal 267 of Animal Ecology 61, 195-204. 268
[26] Dickey, M.H., Gauthier, G. & Cadieuz, M.C. 2008 Climatic effects on the breeding phenology and 269 reproductive success of an arctic‐nesting goose species. Global Change Biology 14, 1973-1985. 270
[27] Madsen, J., Tamstorf, M., Klaassen, M., Eide, N., Glahder, C., Rigét, F., Nyegaard, H. & Cottaar, 271 F. 2007 Effects of snow cover on the timing and success of reproduction in high-Arctic pink-footed 272 geese Anser brachyrhynchus. Polar Biology 30, 1363-1372. 273
[28] Prop, J. & de Vries, J. 1993 Impact of snow and food conditions on the reproductive performance 274 of barnacle geese Branta leucopsis. Ornis Scandinavica 24, 110-121. 275
[29] Rockwell, R., Cooch, E., Thompson, C. & Cooke, F. 1993 Age and reproductive success in female 276 lesser snow geese: experience, senescence and the cost of philopatry. Journal of Animal Ecology 62, 277 323-333. 278
[30] van der Jeugd, H. & Larsson, K. 1999 Life-history Decisions in a Changing Environment: a Long-279 term Study of a Temperate Barnacle Goose Population [PhD Thesis]. Uppsala, Sweden, University of 280 Uppsala. 281
[31] Fernández-Chacón, A., Moland, E., Espeland, S.H., Kleiven, A.R. & Olsen, E.M. 2016 Causes of 282 mortality in depleted populations of Atlantic cod estimated from multi-event modelling of mark–283 recapture and recovery data. Canadian Journal of Fisheries and Aquatic Sciences 74, 116-126. 284
[32] Cayuela, H., Besnard, A., Bonnaire, E., Perret, H., Rivoalen, J., Miaud, C. & Joly, P. 2014 To breed 285 or not to breed: past reproductive status and environmental cues drive current breeding decisions in a 286 long-lived amphibian. Oecologia 176, 107-116. 287
[33] Pradel, R. 2005 Multievent: an extension of multistate capture–recapture models to uncertain states. 288 Biometrics 61, 442-447. 289

[34] Layton-Matthews, K., Hansen, B.B., Grøtan, V., Fuglei, E. & Loonen, M.J.J.E. 2019 Contrasting 290 consequences of climate change for migratory geese: predation, density dependence and carryover 291 effects offset benefits of high-arctic warming. Global Change Biology 26, 642-657. 292
[35] Black, J.M., Prop, J. & Larsson, K. 2014 Survival and reproduction. In The barnacle goose (ed. J. 293 Martin), pp. 159 - 172. London, UK, Bloomsbury Publishing. 294
[36] Hahn, S., Loonen, M.J.J.E. & Klaassen, M. 2011 The reliance on distant resources for egg 295 formation in high Arctic breeding barnacle geese Branta leucopsis. Journal of Avian Biology 42, 159-296 168. 297
[37] Jönsson, K.I. 1997 Capital and income breeding as alternative tactics of resource use in 298 reproduction. Oikos 78, 57-66. 299
[38] Peeters, B., Pedersen, Å.Ø., Loe, L.E., Isaksen, K., Veiberg, V., Stien, A., Kohler, J., Gallet, J.-C., 300 Aanes, R. & Hansen, B.B. 2019 Spatiotemporal patterns of rain-on-snow and basal ice in high Arctic 301 Svalbard: detection of a climate-cryosphere regime shift. Environmental Research Letters 14, 015002. 302
[39] Le Moullec, M., Buchwal, A., van der Wal, R., Sandal, L. & Hansen, B.B. 2019 Annual ring growth 303 of a widespread high arctic shrub reflects past fluctuations in community‐level plant biomass. Journal 304 of Ecology 107, 436-451. 305
[40] Layton-Matthews, K., Loonen, M.J.J.E., Hansen, B.B., Saether, B.-E., Coste, C.F.D. & Grøtan, V. 306 2019 Density-dependent population dynamics of a high Arctic capital breeder, the barnacle goose 307 Journal of Animal Ecology 88, 1191-1201. 308
[41] Choquet, R., Rouan, L. & Pradel, R. 2009 Program E-SURGE: a software application for fitting 309 multievent models. In Modeling demographic processes in marked populations, pp. 845-865. New 310 York, USA, Springer. 311
[42] Burnham, K.P. & Anderson, D.R. 2002 Model selection and multimodel inference: a practical 312 information-theoretic approach. New York, USA, Springer. 313
[43] Powell, L.A. 2007 Approximating variance of demographic parameters using the delta method: a 314 reference for avian biologists. The Condor 109, 949-954. 315
[44] Ryder, J.P. 1970 A possible factor in the evolution of clutch size in Ross' Goose. Wilson Bulletin 316 82, 5-13. 317
[45] Greve, I.A., Elvebakk, A. & Gabrielsen, G.W. 1998 Vegetation exploitation by barnacle geese 318 Branta leucopsis during incubation on Svalbard. Polar Research 17, 1-14. 319
[46] Stahl, J., Tolsma, P.H., Loonen, M.J.J.E. & Drent, R.H. 2001 Subordinates explore but dominants 320 profit: resource competition in high Arctic barnacle goose flocks. Animal Behaviour 61, 257-264. 321
[47] Nolet, B.A., Schreven, K.H., Boom, M.P. & Lameris, T.K. 2019 Contrasting effects of the onset of 322 spring on reproductive success of Arctic-nesting geese. The Auk 137. 323
[48] Loonen, M.J.J.E., Tombre, I.M. & Mehlum, F. 1998 Development of an arctic barnacle goose 324 colony: interactions between density and predation. Norsk Polarinstitutt Skrifter 200, 67-80. 325
[49] Drent, R.H., Eichhorn, G., Flagstad, A., Van der Graaf, A., Litvin, K. & Stahl, J. 2007 Migratory 326 connectivity in Arctic geese: spring stopovers are the weak links in meeting targets for breeding. Journal 327 of ornithology 148, 501-514. 328

[50] Van der Graaf, A., Stahl, J., Klimkowska, A., Bakker, J.P. & Drent, R.H. 2006 Surfing on a green 329 wave-how plant growth drives spring migration in the Barnacle Goose Branta leucopsis. Ardea 94, 567. 330
[51] Lameris, T.K., van der Jeugd, H.P., Eichhorn, G., Dokter, A.M., Bouten, W., Boom, M.P., Litvin, 331 K.E., Ens, B.J. & Nolet, B.A. 2018 Arctic geese tune migration to a warming climate but still suffer 332 from a phenological mismatch. Current Biology 28, 2467-2473. 333
[52] Clausen, K.K. & Clausen, P. 2013 Earlier Arctic springs cause phenological mismatch in long-334 distance migrants. Oecologia 173, 1101-1112. 335
[53] Doiron, M., Gauthier, G. & Lévesque, E. 2015 Trophic mismatch and its effects on the growth of 336 young in an Arctic herbivore. Global Change Biology 21, 4364-4376. 337
[54] Lameris, T.K., Scholten, I., Bauer, S., Cobben, M.M., Ens, B.J. & Nolet, B.A. 2017 Potential for 338 an Arctic‐breeding migratory bird to adjust spring migration phenology to Arctic amplification. Global 339 Change Biology 23, 4058-4067. 340
[55] Fjelldal, M.A., Layton-Matthews, K., Lee, A.M., Grøtan, V., Loonen, M.J.J.E. & Hansen, B.B. 341 2020 Individual histories of female barnacle geese. Dryad, Dataset (doi:10.5061/dryad.wdbrv15jz). 342 343

Supporting information: 1
‘High-arctic family planning: earlier spring onset advances age at first reproduction in 2
barnacle geese’ 3
Mari Aas Fjelldal, Kate Layton-Matthews, Aline Magdalena Lee, Vidar Grøtan, Maarten J.J.E. Loonen and Brage 4 Bremset Hansen 5 6
Appendix 1. Additional fieldwork details, GOF tests and E-SURGE implementation 7
Appendix 1a. Further details of data collected and study system. 8
Each year, geese arrived at the breeding grounds during May to nest on islands in Kongsfjorden. 9
Goslings hatched around 1st July (range = 19th June to 19th July). Straight after, individuals with newly 10
hatched goslings returned to the coastline to forage around the settlement of Ny-Ålesund. From the 11
beginning of June to the end of August, twice-daily observations were made of individuals and their 12
offspring (goslings) in the study area (around Ny-Ålesund), registering the parental ID (i.e., ringed 13
individuals) and their associated number of goslings. Since parents immediately leave the nesting islands 14
after hatching with their offspring and moved to the foraging grounds, we used these observations of 15
families in the foraging area to determine whether a female had produced goslings (i.e., they would be 16
allocated the ‘seen as breeder’ event). On average, goslings were 3.65 (standard deviation = 2.23) days 17
old when first observed. If a female was never observed with goslings during the breeding season then 18
they would be allocated the ‘seen as non-breeder’ event. If a female was never observed during the 19
breeding season a given year then she would be allocated the ‘not seen event’. Recorded breeder events 20
therefore do not capture females that produce eggs but lose their clutch before arriving at the foraging 21
grounds. These females would be allocated the ‘seen as non-breeder’ event, given that none of their 22
produced offspring that survived until the first recordings at the foraging grounds. 23
24
Appendix 1b. Results from Goodness-of-fit tests 25
The Goodness-of-fit test showed significance for transience in the data (p < 0.001), meaning that newly 26
recruited individuals were less likely to be recaptured than individuals with an already established 27
capture history. Because all individuals were marked as goslings in this study, this indicated a difference 28
in apparent survival rates between goslings and adults, as new individuals (goslings) were less likely to 29
be recaptured than individuals with an established recapture history (adults). This was accounted for in 30
the models by adding age-dependent apparent survival. The Goodness-of-fit tests also gave a significant 31
result for trap-history-dependent recapture (p < 0.001). This could be explained by the study system, as 32
barnacle geese showed high fidelity to their breeding and foraging sites. Females using the Ny-Ålesund 33
area for foraging, after leaving the nesting islands, were likely to come back to this site year after year 34
increasing the probability of being recaptured and thus leading to the detection of “trap-happy” 35
individuals. This study consequently analysed data on a non-random sampled population. However, this 36
should not affect the measures of external forces on AFR. 37
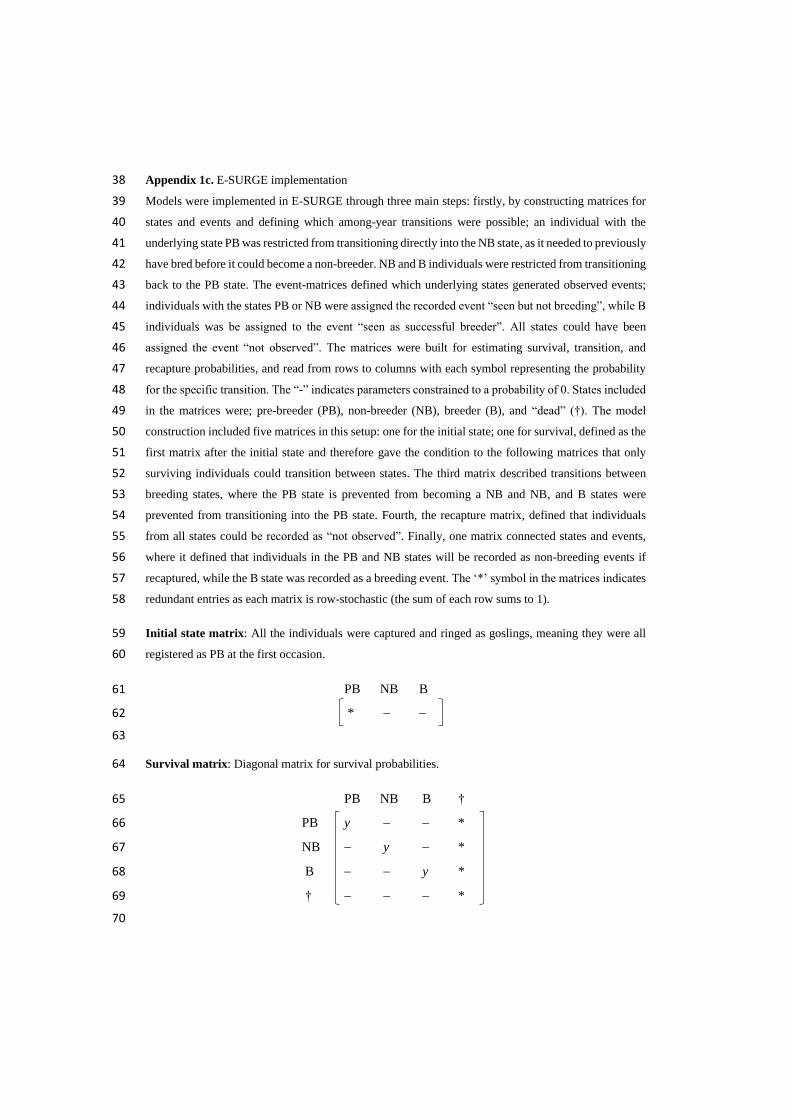
Appendix 1c. E-SURGE implementation 38
Models were implemented in E-SURGE through three main steps: firstly, by constructing matrices for 39
states and events and defining which among-year transitions were possible; an individual with the 40
underlying state PB was restricted from transitioning directly into the NB state, as it needed to previously 41
have bred before it could become a non-breeder. NB and B individuals were restricted from transitioning 42
back to the PB state. The event-matrices defined which underlying states generated observed events; 43
individuals with the states PB or NB were assigned the recorded event “seen but not breeding”, while B 44
individuals was be assigned to the event “seen as successful breeder”. All states could have been 45
assigned the event “not observed”. The matrices were built for estimating survival, transition, and 46
recapture probabilities, and read from rows to columns with each symbol representing the probability 47
for the specific transition. The “-” indicates parameters constrained to a probability of 0. States included 48
in the matrices were; pre-breeder (PB), non-breeder (NB), breeder (B), and “dead” (†). The model 49
construction included five matrices in this setup: one for the initial state; one for survival, defined as the 50
first matrix after the initial state and therefore gave the condition to the following matrices that only 51
surviving individuals could transition between states. The third matrix described transitions between 52
breeding states, where the PB state is prevented from becoming a NB and NB, and B states were 53
prevented from transitioning into the PB state. Fourth, the recapture matrix, defined that individuals 54
from all states could be recorded as “not observed”. Finally, one matrix connected states and events, 55
where it defined that individuals in the PB and NB states will be recorded as non-breeding events if 56
recaptured, while the B state was recorded as a breeding event. The ‘*’ symbol in the matrices indicates 57
redundant entries as each matrix is row-stochastic (the sum of each row sums to 1). 58
Initial state matrix: All the individuals were captured and ringed as goslings, meaning they were all 59
registered as PB at the first occasion. 60
PB NB B 61
* − − 62
63
Survival matrix: Diagonal matrix for survival probabilities. 64
PB NB B † 65
PB y − − * 66
NB − y − * 67
B − − y * 68
† − − − * 69
70
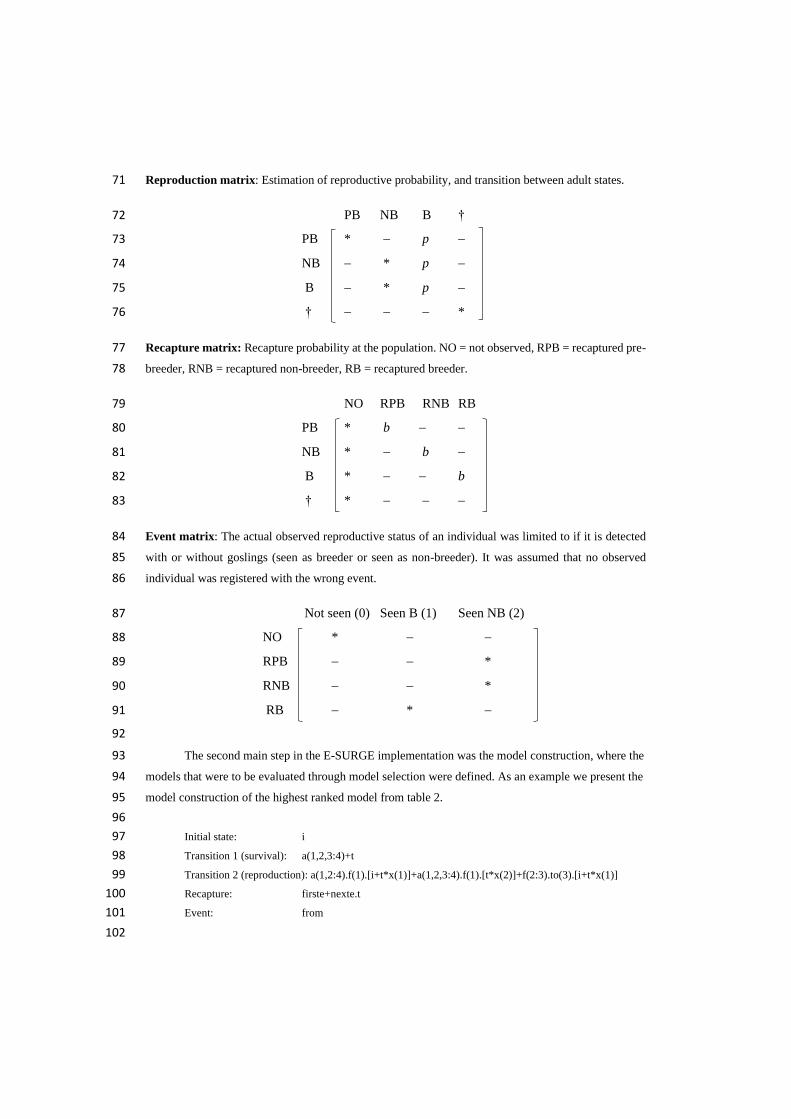
Reproduction matrix: Estimation of reproductive probability, and transition between adult states. 71
PB NB B † 72
PB * − p − 73
NB − * p − 74
B − * p − 75
† − − − * 76
Recapture matrix: Recapture probability at the population. NO = not observed, RPB = recaptured pre-77
breeder, RNB = recaptured non-breeder, RB = recaptured breeder. 78
NO RPB RNB RB 79
PB * b − − 80
NB * − b − 81
B * − − b 82
† * − − − 83
Event matrix: The actual observed reproductive status of an individual was limited to if it is detected 84
with or without goslings (seen as breeder or seen as non-breeder). It was assumed that no observed 85
individual was registered with the wrong event. 86
Not seen (0) Seen B (1) Seen NB (2) 87
NO * − − 88
RPB − − * 89
RNB − − * 90
RB − * − 91
92
The second main step in the E-SURGE implementation was the model construction, where the 93
models that were to be evaluated through model selection were defined. As an example we present the 94
model construction of the highest ranked model from table 2. 95
96
Initial state: i 97
Transition 1 (survival): a(1,2,3:4)+t 98
Transition 2 (reproduction): a(1,2:4).f(1).[i+t*x(1)]+a(1,2,3:4).f(1).[t*x(2)]+f(2:3).to(3).[i+t*x(1)] 99
Recapture: firste+nexte.t 100
Event: from 101
102

In the third step, known probabilities were specified, including the capture probability for the 103
first occasion (i.e. the gosling stage), which was fixed to one, and the breeding probability for yearlings, 104
which was fixed at zero. 105
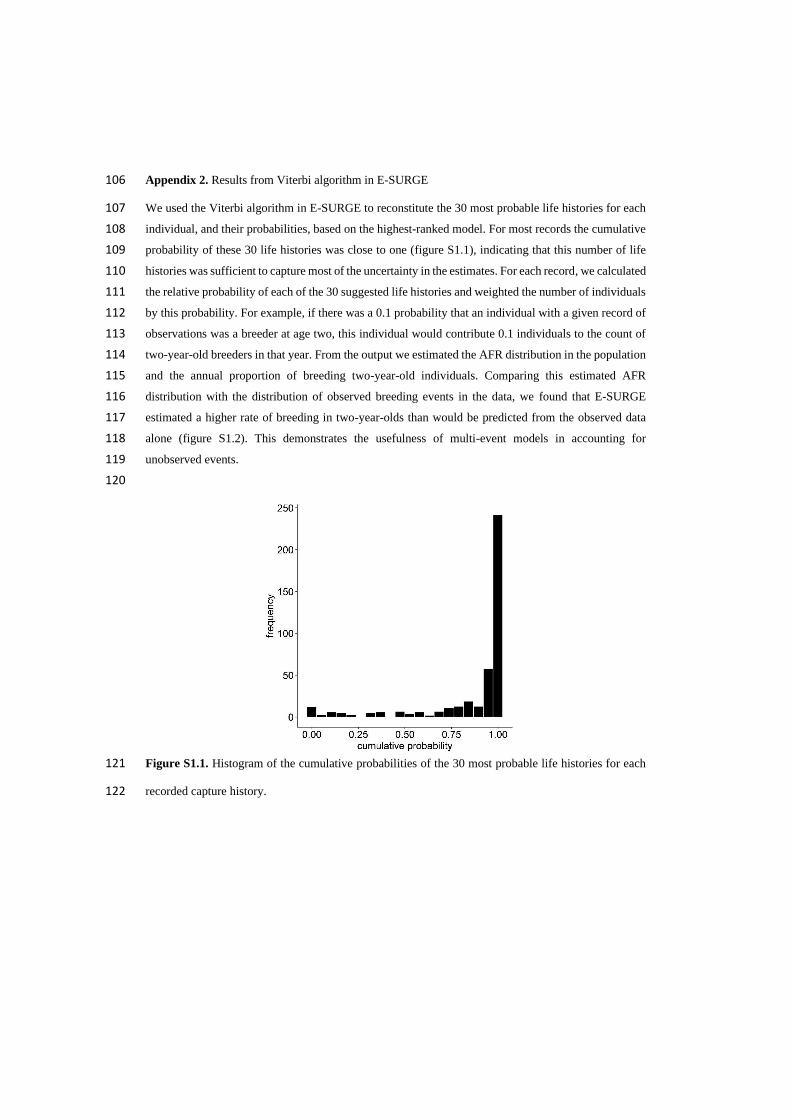
Appendix 2. Results from Viterbi algorithm in E-SURGE 106
We used the Viterbi algorithm in E-SURGE to reconstitute the 30 most probable life histories for each 107
individual, and their probabilities, based on the highest-ranked model. For most records the cumulative 108
probability of these 30 life histories was close to one (figure S1.1), indicating that this number of life 109
histories was sufficient to capture most of the uncertainty in the estimates. For each record, we calculated 110
the relative probability of each of the 30 suggested life histories and weighted the number of individuals 111
by this probability. For example, if there was a 0.1 probability that an individual with a given record of 112
observations was a breeder at age two, this individual would contribute 0.1 individuals to the count of 113
two-year-old breeders in that year. From the output we estimated the AFR distribution in the population 114
and the annual proportion of breeding two-year-old individuals. Comparing this estimated AFR 115
distribution with the distribution of observed breeding events in the data, we found that E-SURGE 116
estimated a higher rate of breeding in two-year-olds than would be predicted from the observed data 117
alone (figure S1.2). This demonstrates the usefulness of multi-event models in accounting for 118
unobserved events. 119
120
Figure S1.1. Histogram of the cumulative probabilities of the 30 most probable life histories for each 121
recorded capture history. 122
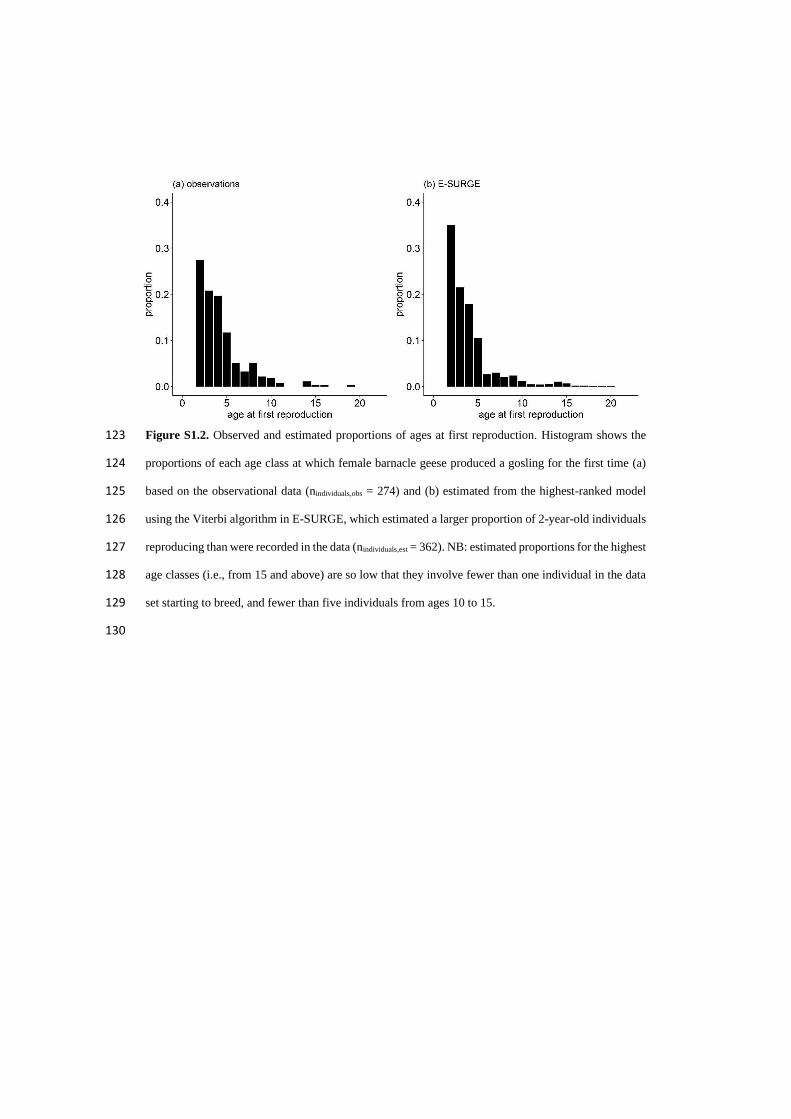
Figure S1.2. Observed and estimated proportions of ages at first reproduction. Histogram shows the 123
proportions of each age class at which female barnacle geese produced a gosling for the first time (a) 124
based on the observational data (nindividuals,obs = 274) and (b) estimated from the highest-ranked model 125
using the Viterbi algorithm in E-SURGE, which estimated a larger proportion of 2-year-old individuals 126
reproducing than were recorded in the data (nindividuals,est = 362). NB: estimated proportions for the highest 127
age classes (i.e., from 15 and above) are so low that they involve fewer than one individual in the data 128
set starting to breed, and fewer than five individuals from ages 10 to 15. 129
130


Paper IV


1
Environmental change reduces body mass, but not population growth, in an Arctic 1
herbivore 2
3
Kate Layton-Matthews1, Vidar Grøtan1, Brage B. Hansen1, Maarten J. J. E. Loonen2, Eva Fuglei3, Dylan 4
Z. Childs4 5
6
1Centre for Biodiversity Dynamics, Department of Biology, Norwegian University of Science and 7
Technology, Trondheim, Norway 8
2Arctic Centre, University of Groningen, Groningen, the Netherlands 9
3Norwegian Polar Institute, Tromsø, Norway 10
4Department of Animal and Plant Sciences, University of Sheffield, Sheffield, UK 11
12
Corresponding author: 13
Kate Layton-Matthews 14
+47 941 565 75 15
17
18
19
20
21
Key words 22
Arctic, climate change, population dynamics, barnacle goose, trait-mediated and modified effects, integral 23
projection models, life table response experiments, transient LTRE 24

2
Abstract 25
Environmental change influences fitness-related traits and demographic rates, which are often linked to 26
resource-driven variation in body mass in herbivores. Coupled body mass-demographic responses may 27
therefore be important for herbivore population dynamics in fluctuating environments, such as the Arctic. 28
We apply a transient Life-Table Response Experiment (‘transient-LTRE’) to demographic data from 29
Svalbard barnacle geese (Branta leucopsis), to quantify their population-dynamic responses to changes in 30
body mass. We partitioned contributions from direct demographic and body mass-mediated processes to 31
variation in population growth. Despite a 10% decline in body mass (1980-2017) and positive effects of 32
mass on reproduction and fledgling survival, this had negligible population-dynamic consequences. 33
Population growth rates were mainly reproduction-driven, in part through positive responses to rapid 34
advances in spring phenology. The virtual lack of body mass-mediated effects indicates that herbivore 35
population dynamics may be more resilient to changing body condition than expected, with implications 36
for their persistence under environmental change. 37
3
Introduction 38
Fluctuations in fitness-related traits and population size are jointly affected by environmental stochasticity 39
and density dependence (Lande et al. 2003; Sæther et al. 2016). Body condition, measured as proxies such 40
as body mass or mass/tarsus ratio (Schamber et al. 2009), is a key fitness-related trait, reflecting energy 41
reserves available to survive, grow and reproduce (Labocha & Hayes 2012). Individual body condition is 42
constantly responding to weather and density-dependent processes, as they influence food availability and 43
energy expenditure (Sæther 1997; Parker et al. 2009). Particularly in herbivores, this can have direct effects 44
on reproduction and survival (Festa-Bianchet et al. 1997; Sæther 1997; Post & Stenseth 1999). Short-term 45
effects of weather and density can also lead to cohort effects on body mass, with lasting impacts on 46
reproduction (Albon et al. 1987; Choudhury et al. 1996) and population size (Beckerman et al. 2002). 47
Simultaneous changes in body mass and vital rates occur when both respond to variation in weather or 48
density (Parmesan 2006). This coupling can have complex population-dynamic consequences (Post et al. 49
1997; Ozgul et al. 2010). Associating changes in fitness-related traits with variation in population growth 50
is challenging when environment-trait-demography associations vary temporally (e.g., seasonally, Paniw 51
et al. 2019b) or among life-history components (e.g., Douhard et al. 2013). 52
Arctic environments are highly seasonal and stochastic. Consequently, Arctic herbivores are exposed 53
to variable weather conditions, causing fluctuations in their body mass and population size (Forchhammer 54
et al. 2002; Couturier et al. 2008; Albon et al. 2017). Weather patterns are now being affected by climate 55
change (Scheffer et al. 2001), which is occurring most rapidly in the Arctic (Serreze & Barry 2011). Climate 56
change effects on body condition (Albon et al. 2017), reproduction (Post & Forchhammer 2008; Layton-57
Matthews et al. 2019a), survival (Hansen et al. 2014), and population size (Forchhammer et al. 2002; 58
Hansen et al. 2019) have been documented in resident and migratory Arctic herbivores. The mechanism by 59
which body mass influences environment-demography relationships can take two forms: through trait-60
mediating (Ozgul et al. 2010; Plard et al. 2015; Albon et al. 2017) or trait-modifying effects (Herfindal et 61
al. 2006; Harrison et al. 2013). A trait acts as a mediator when it explains a relationship between 62
environmental conditions and vital rates, e.g., temperature affects body mass, which in turn affects survival, 63

4
whereas a modifying effect requires a body mass-temperature interaction effect on survival. Since body 64
mass is so influential on the life-history processes of Arctic herbivores, we may expect responses in the 65
population growth rate to changes in this trait (Albon et al. 2017). However, for trait (i.e., body mass)-66
mediated effects on population growth to arise, three conditions must be met. Firstly, body mass must 67
fluctuate at the relevant life-history stage for a given, potentially age-specific, demographic rate. Secondly, 68
the demographic rate must be sensitive to changes in mass. Thirdly, the population growth rate must, in 69
turn, be sensitive to variation in the demographic rate (Gaillard & Yoccoz 2003). If a condition is not met, 70
then no pathway exists for trait variation to lead to variation in population growth. 71
Populations are constantly being perturbed by short-term, temporal variation in the environment 72
(Bierzychudek 1999; Clutton–Brock & Coulson 2002). This can lead to ‘transient population dynamics’ 73
(Hastings 2004; Koons et al. 2005; Ezard et al. 2010), as fluctuating environments cause changes in the 74
underlying population structure (e.g., age structure, Koons et al. 2016) or trait distributions (e.g., body 75
mass, Ozgul et al. 2010). Changes in population structure can have delayed, transient effects on future 76
population growth, especially when there is substantial variation in the vital rates of different classes of 77
individuals (Beckerman et al. 2002; De Roos et al. 2003). For instance, if poor conditions reduce cohort 78
body mass, vital rates can be affected for several subsequent years through delayed effects, mediated by 79
early-life body mass (e.g., Albon et al. 1987). Recent extensions of matrix (MPM) and integral (IPM) 80
projection models have attempted to quantify population-dynamic consequences of such delayed or 81
‘lagged’ effects (Koons et al. 2005; Lande et al. 2006; Kuss et al. 2008). Transient life-table response 82
experiments (transient-LTREs) partition variance in the realised population growth rate into contributions 83
from underlying demographic rates. Transient-LTREs can be used to decompose contributions from 84
temporal variation in vital rates and population structure/trait distributions (e.g., cohort effects), thereby 85
explicitly incorporating past environments through lagged parameter effects (Maldonado‐Chaparro et al. 86
2018). Here, we investigated the consequences of changes in body mass - through trait-mediated processes 87
- for the population dynamics of Svalbard barnacle geese, Branta leucopsis. We analysed individual female 88
mark-recapture and body mass data spanning 28 years. We quantified environmental and density effects on 89
5
survival, reproduction, growth, and fledging body mass and used these regression models to construct an 90
environmentally-driven, stochastic integral projection model (Rees & Ellner 2009; Metcalf et al. 2015). 91
Using a recently developed transient-LTRE, we decomposed variation in the realised population growth 92
rate (λt) into vital rate contributions through demographic and trait-mediated pathways, separated into direct 93
and delayed effects. Variation in λt was largely reproduction-driven, through direct and delayed effects (i.e., 94
changes in age structure), while body mass-mediated pathways contributed negligibly to population growth. 95
We further decomposed vital rate contributions into variation from modelled covariates and unexplained 96
variation (i.e., random effects). Variation in λt through the reproduction probability could be, in part, 97
explained by the timing of spring onset at the breeding grounds, while variation through adult survival was 98
partially explained by overwinter temperature and population density. 99
100
Methods 101
Study species 102
Arctic geese are migratory capital breeders, relying, to some extent, on accumulated body reserves for 103
reproduction (Jönsson 1997; Hahn et al. 2011). Therefore, an individual’s condition prior to the breeding 104
season affects their reproductive success (Ankney & MacInnes 1978; Ebbinge & Spaans 1995; Prop & 105
Black 1998). Svalbard barnacle geese overwinter in Scotland, UK (55° N, 3.30° W). They fly to Svalbard 106
for breeding in summer, stopping over in spring along the coast of mainland Norway. The study population 107
breeds close to Ny-Ålesund, western Spitsbergen (78°55’ N, 11°56’ E). Geese arrive at the end of May and 108
nest on islands in the fjord, Kongsfjorden. Hatching occurs from late June. Families leave the nesting islands 109
to forage thereafter, until offspring fledge at the end of August and geese migrate back to Scotland by 110
October. 111
112
Demographic data 113
All analyses were female based. Over the main study period (i.e. the mark-recapture period; 1990-2017), a 114
total of 1669 females were caught in July-August and ringed with unique colour and metal identification 115

6
bands. Recapture data were based on daily observations of ringed individuals around Ny-Ålesund during 116
the entire foraging period from late June to August (nobs = 7280). Some years were missing recapture or 117
body mass data (see Appendix 1 for annual sample sizes). Reproduction was assessed based on observations 118
of sexually mature adults with offspring at the beginning of August, i.e., when goslings fledge. Individuals 119
ringed in their first year of life were recorded as ‘fledglings’ (fl) and older individuals as ‘adults’ (ad) - a 120
pooled class of up to 28-year-old individuals. Body mass was also measured during a catch (nmeasurements: fl 121
= 696, ad = 2108). We analysed body mass rather than other indices of body condition, since body mass is 122
a reliable measure of condition in geese (Schmutz 1993; Lindholm et al. 1994). We also tested for a 123
temporal trend in cohort body mass (1980-2017), by fitting a linear regression with year as an explanatory 124
variable. 125
126
Analytical approach 127
First, we fitted (generalised) linear mixed-effects models ((G)LMMs) to describe fledgling mass (C0), 128
growth (i.e., change in mass from t to t+1, G), overwinter survival (ϕ) and reproduction: the probability of 129
reproducing (R) and fledged brood size (fec). For each regression model, we quantified effects of age class, 130
body mass and covariates, using model selection. Based on the best-approximating models, we constructed 131
an IPM to model temporal dynamics of population size and body mass distribution. We decomposed 132
variation in the population growth rate (λt), using a transient-LTRE, into direct effects of demographic rates 133
versus indirect effects through fluctuations in age class-structure and body mass distribution. Contributions 134
to variation in λt were further decomposed into variation from modelled covariates versus random effects. 135
136
Regression models 137
We fitted a model to fledgling body mass data with an LMM, to model the mean and distribution of 138
fledgling masses, C0, including catch date as a predictor since gosling growth increased linearly over the 139
season (Appendix 2). We also fitted an LMM to body mass data of both age classes, describing mass-140
dependent growth between years (e.g., due to ontogeny and phenotypic plasticity, G), with fledgling body 141

7
masses adjusted for catch date. Reproduction and mark-recapture data were modelled with GLMMs. To 142
estimate apparent survival (ϕ), mark-recapture data were modelled with a Cormack-Jolly-Seber framework 143
using the RMark interface (Laake 2013) for program MARK (White & Burnham 1999). Reproduction was 144
modelled as two response parameters. R describes the annual reproduction probability i.e., whether or not 145
a female had at least one fledgling (0/1), which was fitted as a binomial response. Fledged brood size, fec, 146
describes the number of fledglings per mother and was fitted as a Poisson response. Only observations from 147
2-year-olds onwards (i.e., the age of sexual maturity, Owen 1980; Forslund & Larsson 1992; Fjelldal et al. 148
in press) were included in the reproductive models, and the model of fec only included successfully 149
reproducing individuals (R = 1). All (G)LMM’s using the lme4 package (Bates et al. 2015) and were fitted 150
with year as a random effect. 151
We identified effects of age class, body mass, density and external covariates (see below, 152
Covariates) on C0, G, R, fec and ϕ, using Akaike’s Information Criterion corrected for small sample sizes 153
(AICc, Burnham & Anderson 2002) to identify the most parsimonious model. Note that body mass was de-154
trended for model selection of G and C0, to avoid spurious correlations caused by declining trends. A set of 155
candidate models were fitted for each rate including all possible subsets of covariates and interactions 156
between age class, body mass and covariates (global models are shown in Appendix 3, Table S1). If two or 157
more models had ΔAICc < 2, the one with least parameters was selected as the most parsimonious. For 158
survival, AICc-based model selection was performed in RMark, but the final model was fitted in a Bayesian 159
framework to model age class-, and year-, specific random effects. Markov Chain Monte Carlo (MCMC) 160
simulations were implemented in JAGS via the rjags package (Plummer 2013), assuming that annual 161
variation in survival originated from a random process with zero mean and age class-specific deviations 162
(see Schaub et al. 2013; Layton-Matthews et al. 2019b for details). All priors were non-informative. 163
Missing body mass observations were imputed by drawing from a normal distribution, where priors were 164
set for the age-specific mean body mass and variance (Gimenez et al. 2006). 165
166
Covariates 167
8
Covariates reflecting weather, population density over the annual cycle, and predator abundance effects on 168
barnacle goose demography (Layton-Matthews et al. 2019a) were included in the regression models of 169
reproduction (R, fec), survival (ϕ), growth (G) and fledgling mass (C0). From the overwintering grounds at 170
Solway Firth, Scotland (win, i.e., winter: Octobert –Marcht+1), we included annual mean winter temperature 171
(Twin) and total flyway population counts (Nwin). From the spring staging grounds at Helgeland, (spr, i.e., 172
spring: April-May), we included spring precipitation (Pspr) using data from the Vega weather station (65°38′ 173
N, 11°52′ E). Climate covariates from the breeding grounds in Svalbard (sum, i.e., summer) included the 174
date of spring onset, SOsum, which is the ordinal day when the 10-day smoothed daily temperature crossed 175
0°C and remained above for at least 10 days (Le Moullec et al. 2019), temperature (mid-June to mid-July, 176
Tsum) and precipitation (mid-July to mid-August, Psum). Estimates adult population size in Kongsfjorden 177
(Nsum, Layton-Matthews et al. 2019b), were also included, as well as an index of Arctic fox (Vulpes lagopus) 178
abundance (foxsum), i.e. the proportion of occupied known dens, since predation by Arctic foxes has been 179
shown to influence gosling survival (Fuglei et al. 2003; Layton-Matthews et al. 2019a). More details on 180
covariates can be found in Layton-Matthews et al. (2019a). 181
182
Stochastic integral projection model 183
We constructed a stochastic integral projection model, describing the temporal dynamics of population size 184
(n) and body mass distribution (z) of the fledgling (fl) and adult (ad) age classes, following the life cycle in 185
Figure 1. The growth kernel, G(t)(z’, z), describes the probability density function of body masses z′ in 186
August in year t+1 of an individual of body mass z in year t. Annual age-class specific survival, ϕ(t)
(z, a), 187
describes the probability of an individual, of age class a (fl or ad) and body mass z at year t, surviving to 188
year t+1. Pad(t)
(z', z) and Pfl(t)
(z', z) represent survival-growth kernels for adults and fledglings, respectively, 189
describing how individuals of mass z at time t, survive and grow to reach mass z’ at t+1, given by: 190
Pa(t)(z', z) = ϕ
(t)(z, a) G(t)
(z', z) for a = fledgling or adults (1) 191

9
Annual probability of reproduction, R(t+1)
(z), describes the probability of a >1-year-old female of 192
mass z producing at least one fledgling at t+1, given she survives. Fledged brood size, fec(t+1), describes the 193
number of fledglings per mother at t+1, conditional on reproduction. Fledgling (body) mass kernel, 194
C0(t+1)
(z'), describes the probability distribution of fledgling masses in August at t+1. This was assumed to 195
be independent of mother body mass, since a pedigree was not available. This is likely a fair assumption, 196
as offspring mass has not been linked to mother body mass but rather to structural size (e.g., head size, 197
Larsson et al. 1998). Fad(t)
(z', z) is the reproduction kernel, describing the number of fledglings of mass z’ 198
that adults of mass z can contribute to the population at year t+1, given by; 199
Fad(z', z)= ϕ
(t)(z, ad) R
(t+1)(z) fec(t+1) C0
(t+1)(z') /2 (2) 200
Reproduction was divided by 2 since the model was female based. The structure of the IPM was: 201
nfl(z', t+1) = ∫ Fad
(t)(z', z)nad(z, t)dz
𝑈
𝐿 (3) 202
nad(z', t+1) = ∫ Pad
(t)(z', z)nad(z, t)dz +
𝑈
𝐿 ∫ Pfl(t)
(z', z)nfl(z, t)dz 𝑈
𝐿 (4) 203
We numerically integrated the IPM using the ‘midpoint rule’ (Easterling et al. 2000) with lower 204
(L) and upper (U) integration limits of body mass 400 and 2500 grams (g), to avoid eviction of individuals 205
from the model. The IPM assumed density-independent population growth, since density effects were either 206
weak or exhibited strong linear trends that would restrict the model unrealistically. Stochastic population 207
dynamics were simulated over 100,000 years using a two-step MCMC resampling approach (Metcalf et al. 208
2015). For each year, a set of environmental/density covariate values was sampled from 28 observations in 209
this study (1990-2017). For the functions - C0, G, R, fec, ϕfl and ϕad, - values were sampled from their 210
respective distributions (i.e., distribution sampling, Metcalf et al. 2015). We used estimates of intercept and 211
yearly random effects to calculate the corresponding variance-covariance matrix and sampled parameter 212
sets assuming a multivariate normal distribution (Gelman & Hill 2006), to account for potential correlations 213
(Compagnoni et al. 2016). Trends in demographic rates, growth or fledgling mass were captured by the 214

10
random effects. Transition kernels for each annual projection were constructed by combining both sets of 215
sampled parameters to calculate a realised intercept for each function. 216
217
Transient life table response experiment 218
We used an extension of the Monte Carlo random LTRE, introduced by Rees and Ellner (2009), to 219
incorporate transient fluctuations in age class-structure and body mass distribution (Maldonado‐Chaparro 220
et al. 2018). Rather than assuming the population was always close to its stable structure, i.e., focusing on 221
the yearly asymptotic growth rates (λ̃𝑡), we decomposed variance in the realised population growth rate at 222
time t (λ𝑡). We also included ‘lagged’ parameter effects in the model of λ𝑡, to quantify delayed effects of 223
parameters, θi,t (i.e., parameter i at time t), acting through changes in age structure or body mass distribution. 224
Variance decompositions of λ𝑡 were modelled assuming either linear (linear model, LM) or non-linear 225
(generalised additive model, GAM) dependencies of λ𝑡. Following Maldonado‐Chaparro et al. (2018), we 226
decomposed variance in log(λ𝑡). We compared the R2 of LMs and GAMs and incorporated delayed effects 227
with increasing numbers of year lags. We also tested whether interaction effects between parameters (or, in 228
the case of the GAM models, pairwise smooths) contributed to substantial variation in log(λ𝑡). We 229
considered a model of log(λ𝑡) to be a better fit when the amount of variance explained increased by at least 230
1% (Maldonado‐Chaparro et al. 2018). 231
Vital rate contributions were further separated out into variation from covariates included in the 232
underlying regressions versus random effects (i.e., unexplained variation). In this case, (net) contributions 233
of covariates to λ𝑡 depended on; temporal covariances among covariates, their effect size on θi,t and the 234
sensitivity of λ𝑡 to θi,t. We assumed linear dependencies of λ𝑡 on θi,t for the environmental decomposition 235
(see Maldonado‐Chaparro et al. 2018). In the IPM, trait-mediated effects could contribute to intercept 236
variation in each function (e.g., G or ϕ), while trait-modified effects would cause variation in the slope 237
describing the relationship between body mass and each function. Consequently, we decomposed variation 238

11
in log(λ𝑡) at three hierarchical levels: (1) overall contributions from C0, G, R, fec and ϕ, (2) modelled 239
environment versus random effects and (3) slope versus intercept variation. 240
241
Results 242
Body mass and life history processes 243
The best model of overwinter survival (ϕ) included the interaction effect between age class and body mass, 244
with a much stronger positive effect on fledglings (Figure 1a), and additive effects of overwintering 245
population size (Nwin, negative effect) and winter temperature (Twin, positive effect) (Table 1). The best-246
approximating growth model (G), estimating body mass at year t+1, only included a positive effect of mass 247
at time t (Figure 1b). The best-approximating model of the reproductive probability (R, i.e., of an adult 248
female producing fledglings) suggested a positive effect of spring precipitation (Pspr) and a negative effect 249
of date of spring onset (SOsum), and an interaction effect between mother body mass and SOsum, with a 250
strong, positive body mass effect in late springs and no effect when spring onset was early (Figure 1c-e). 251
For fledged brood size (fec), model selection suggested negative effects of Arctic fox abundance (foxsum) 252
and summer precipitation (Psum), while the best-approximating model of fledgling mass (C0) included an 253
interaction effect of foxsum and adult population density at the breeding grounds (Nsum), where the latter 254
tended to have a negative effect at high fox abundance, and not at low fox abundance (Figure 1f-h). Further 255
description of the best-fitting models and model selection (Tables S2.1-2.5) can be found in Appendix 3. 256
Over the study period, average cohort body mass declined significantly (slope = -8.3 g per cohort, 257
SE = 0.8 g, p<0.001). Inter-annual changes in body mass were relatively small for adults, but larger for 258
fledgling body mass (Figure 2). 259
260
Transient LTRE 261
The mean stochastic population growth rate λ̂𝑡was 1.07 (confidence interval: 0.77, 1.59) (calculated from 262
100,000 simulations, Appendix 4, Figure S1), which was similar to the observed growth rate (1.05; 0.65, 263
1.53). The stable body mass-age class distribution reflected the bimodal distribution of the fledgling and 264

12
adult masses (Appendix 4, Figure S2). 94% of the variation in λt was explained by main effects of the 265
functions including a one-year time lag, with the transient linear LTRE (LM-LTRE), which increased to 266
98% with a generalised additive model (GAM-LTRE). The only pairwise smooth (i.e., interaction between 267
parameters) explaining more than 1% variance was between the intercept and slope terms of the probability 268
of reproducing (R) - since SOsum was present as a predictor in both parameters. Parameter effects with more 269
than a one-year lag explained a negligible amount of variance in λt (<1%). 270
Sensitivity surfaces were estimated using the GAM-LTRE for log(λt), illustrating the influence of 271
each function through direct (Figure 3a) and delayed effects (Figure 3b). The direct effect of variation 272
occurring through the reproduction probability (R) was larger than survival (ϕ) or fledged brood size (fec). 273
λt was sensitive to variation through survival rates, especially adult survival (Figure 3a). Note that direct 274
effects of variation through changes in growth and fledgling mass are not included in Figure 3a since a 275
change in body mass can only affect λ the next year (i.e., through delayed effects). The population growth 276
rate was insensitive to delayed effects (Figure 3b) through G and C0 (i.e., trait-mediated effects). The 277
sensitivity of λt to delayed effects (i.e., at t-1) through R and fec reflects how increased reproduction in a 278
given year has a negative impact the following year, via a shift in the age structure towards a larger 279
proportion of non-reproductive individuals. 280
Vital rate contributions from variances and covariances in log(λt), separating variance explained by 281
covariates versus the random effects, suggested large contribution from variation in the reproductive 282
probability (R) (Figure 4). R contributed 69% through direct effects and 12% through delayed effects (i.e., 283
changes in age structure). The remaining ~20% was largely explained by direct and delayed contributions 284
from variation in adult survival (ϕad, total contribution = 6%), fledged brood size (fec, 6%), and fledgling 285
survival (ϕfl, 2%). Changes in body mass acting through the fledgling mass and growth functions (i.e., trait-286
mediated effects) made negligible contributions to variance in log(λt) (0.04% through G and 0.5% through 287
C0). Reproduction (R, fec) were negatively correlated with adult survival (ϕad), resulting in a total 288
contribution of -7% to log(λt), i.e., if ϕad is high in a given year R will therefore be lower, reducing variation 289

13
in population growth overall. Both reproductive (R and fec) and survival parameters (ϕfl and ϕad) covaried 290
positively, and both covariations contributed ca. 3% to log(λt). 291
58% of the variation in log(λt) acting through the reproductive rate (R) could be attributed to 292
modelled covariates (Figure 4). Precipitation at the spring stopover site (Pspr) contributed to 26% of the 293
variation, while date of spring onset at the breeding grounds (SOsum) contributed 16% through intercept and 294
slope variance. 59% of the variation in log(λt) that was attributed to adult survival (ϕad) was explained by 295
temperature (Twin) and population size (Nwin) at the wintering grounds, which accounted for 1% and 2% of 296
the overall variation in log(λt). In contrast, less than 1% of the variation in fledgling survival could be 297
attributed to Twin or Nwin. However, modelled Twin and Nwin explained 95% of the positive covariation 298
between fledgling and adult survival, which led to a small positive contribution to variation in log(λt) of ca. 299
1% (Figure 4). Finally, 65% of the variation in fledged offspring brood size (fec) was explained by Arctic 300
fox abundance and summer precipitation, which contributed 3% each to the variation in log(λt). 301
302
Discussion 303
Coupled body mass-demography responses to environmental change can be key to understand and predict 304
short- and long-term population dynamics, especially in herbivores. Here, we explored population-dynamic 305
responses to declining body mass in a breeding population of Arctic geese, using recently developed 306
transient-LTRE methodology. Body mass at the fledging stage was density-dependent, supporting the 307
hypothesis that this body mass decline, which has been observed in several Arctic goose populations, is 308
caused by declining resource availability at the breeding grounds. Surprisingly, the dynamics of our study 309
population appeared buffered against such a decline in body mass, in spite of the clear influence of this 310
proxy for body condition on reproduction and survival. Instead, variation in population growth rates was 311
largely explained by direct and delayed effects through reproduction per se, partly caused by variation in 312
spring phenology at the breeding grounds. 313
314
Population-growth responses to declining body mass 315
14
The dramatic rise in goose numbers, caused by hunting bans in the 1950s and agricultural change at the 316
wintering grounds, has led to population expansion across the Arctic (Fox & Abraham 2017; Fox & Madsen 317
2017). Density-dependent processes associated with overgrazing by geese have degraded the breeding 318
grounds, resulting in declining cohort body size and mass in barnacle geese (Loonen et al. 1997; Larsson 319
et al. 1998) and other goose species (Cooch et al. 1991b; Reed & Plante 1997). This was supported by a 320
negative relationship between fledgling mass and adult population size found in this study, yet only evident 321
at high abundance of the Arctic fox, the main predator of the goslings and, occasionally, adults (Fuglei et 322
al. 2003). Arctic foxes seem to limit goose numbers through lethal effects on fledged brood size (fec) and 323
non-lethal effects on fledgling mass, probably restricting the ability to utilise all available foraging areas 324
(Loonen et al. 1998). 325
Despite the substantial decline in cohort body mass, between-year fluctuations in adult body mass were 326
small (<100 g/year). Fledgling body mass exhibited more inter-annual variation, a result of strong resource-327
dependence during gosling growth (Cooch et al. 1991a; Lindholm et al. 1994). Body mass, in turn, 328
positively influenced survival and reproduction. The reserves that first-year-geese accumulate at the 329
breeding grounds are known to affect survival during migration (Owen & Black 1989; Menu et al. 2005), 330
which in our study population was reflected in the remarkably strong positive effect of body mass on 331
fledgling survival to the next summer. Adult survival, however, was largely unaffected by body mass and 332
varied less from year to year. 333
Several recent studies have stressed the potential importance of coupled trait-demography responses in 334
predicting herbivore population persistence under environmental change (Ozgul et al. 2009; 2010; Albon 335
et al. 2017). However, there is contrasting evidence that body condition contributes very little as a pathway 336
for environmental conditions to influence population dynamics (McLean et al. 2020). Here, despite a strong 337
negative temporal trend in body mass and positive effects of body mass on vital rates, there was little 338
evidence of trait-mediated effects in our study population of barnacle geese. This can be explained by the 339
fact that all three conditions required for trait-mediated pathways to arise were not met for any of the age 340
class-specific demographic rates (summarised in Table 2). More specifically, although post-fledgling 341
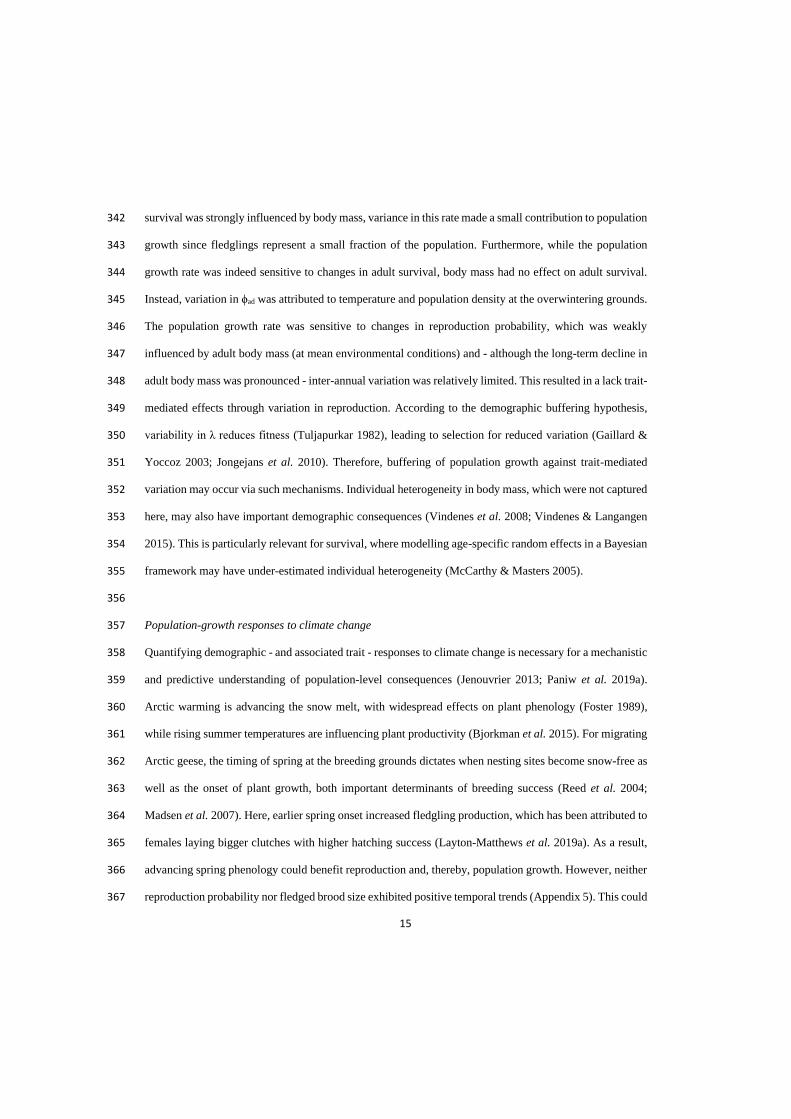
15
survival was strongly influenced by body mass, variance in this rate made a small contribution to population 342
growth since fledglings represent a small fraction of the population. Furthermore, while the population 343
growth rate was indeed sensitive to changes in adult survival, body mass had no effect on adult survival. 344
Instead, variation in ϕad was attributed to temperature and population density at the overwintering grounds. 345
The population growth rate was sensitive to changes in reproduction probability, which was weakly 346
influenced by adult body mass (at mean environmental conditions) and - although the long-term decline in 347
adult body mass was pronounced - inter-annual variation was relatively limited. This resulted in a lack trait-348
mediated effects through variation in reproduction. According to the demographic buffering hypothesis, 349
variability in λ reduces fitness (Tuljapurkar 1982), leading to selection for reduced variation (Gaillard & 350
Yoccoz 2003; Jongejans et al. 2010). Therefore, buffering of population growth against trait-mediated 351
variation may occur via such mechanisms. Individual heterogeneity in body mass, which were not captured 352
here, may also have important demographic consequences (Vindenes et al. 2008; Vindenes & Langangen 353
2015). This is particularly relevant for survival, where modelling age-specific random effects in a Bayesian 354
framework may have under-estimated individual heterogeneity (McCarthy & Masters 2005). 355
356
Population-growth responses to climate change 357
Quantifying demographic - and associated trait - responses to climate change is necessary for a mechanistic 358
and predictive understanding of population-level consequences (Jenouvrier 2013; Paniw et al. 2019a). 359
Arctic warming is advancing the snow melt, with widespread effects on plant phenology (Foster 1989), 360
while rising summer temperatures are influencing plant productivity (Bjorkman et al. 2015). For migrating 361
Arctic geese, the timing of spring at the breeding grounds dictates when nesting sites become snow-free as 362
well as the onset of plant growth, both important determinants of breeding success (Reed et al. 2004; 363
Madsen et al. 2007). Here, earlier spring onset increased fledgling production, which has been attributed to 364
females laying bigger clutches with higher hatching success (Layton-Matthews et al. 2019a). As a result, 365
advancing spring phenology could benefit reproduction and, thereby, population growth. However, neither 366
reproduction probability nor fledged brood size exhibited positive temporal trends (Appendix 5). This could 367

16
be explained by contrasting (direct or indirect) climate change effects, since the number of Arctic foxes – 368
and gosling predation rates – are generally increasing (Layton-Matthews et al. 2019a; unpublished data, E. 369
Fuglei). 370
In capital breeders, such as the barnacle goose, accumulating body stores is beneficial in 371
unpredictable environments, and this strategy is often associated with higher latitudes, e.g., the Arctic 372
(Varpe et al. 2009; Sainmont et al. 2014). Storing resources along their flyway allows geese to initiate 373
reproduction without immediate access to food (Klaassen et al. 2017). Consequently, several stages of their 374
reproduction are dependent on fat reserves (Bêty et al. 2003; Guillemain et al. 2008; Aubry et al. 2013), 375
illustrated here by the positive relationship between body mass and the probability of producing fledglings. 376
However, our results also show that benefits of heavier mass depend on spring phenology. Heavier 377
individuals were more likely to reproduce than lighter ones under poor (delayed) spring conditions, since 378
they have more ‘capital’ to initiate reproduction. However, in earlier springs, possibly with an excess of 379
nesting sites and food resources, benefits of accumulating fat reserves were reduced, and the influence of 380
body mass on reproduction was weaker. Further advanced springs due to continued climate change could 381
therefore tip the balance in favour of accumulating fewer resources for reproduction, potentially relaxing 382
selection on body mass if individuals gain a survival advantage by requiring fewer fat reserves for migration 383
(Larsson et al. 1998). Overall, population dynamics of Arctic geese appear to be largely unaffected by the 384
substantial decline in body mass, with important implications for the resilience of Arctic herbivores to 385
future environmental change. This work emphasises the importance of holistic approaches, that fully 386
capture environment-trait-demography relationships. While we are observing changes in phenotypic trait 387
distributions in response to environmental change - particularly in light of climate change (Parmesan 2006) 388
- we cannot assume that this will have consequences for population persistence. Therefore, mechanistic 389
pathways from trait variation to population-growth variation should be fully explored. 390
391
392
393

17
Acknowledgements 394
We thank Stefan JG Vriend for comments on the manuscript and scientists, students and volunteers for data 395
collection. Funding for data collection was provided by; NWO, Ministry of Foreign Affairs, 396
BIRDHEALTH (851.40.071), Geese on Arctic Tundra (866.12.407), EU FP7‐project FRAGILE and 397
University of Groningen. The Research Council of Norway supported this work (FRIMEDBIO project 398
276080, Centres of Excellence 223257, Arctic Field Grant 282619). 399

18
Tables 400
Table 1. Linear predictors for best-approximating regression models of each function, with mean parameter 401
estimates, used to parameterise the integral projection model (IPM). a is a dummy variable equal to 0 for 402
fledglings (fl) and 1 for adults (ad), and z refers to body mass and catch refers to catch date. 403
404
IPM function Model Best-fitting regression model
Survival logit(ϕfl,ad) -2.67 + 4.32a + 0.004z -0.003a:z + 0.22Twin -0.21Nwin
Growth G 648.50 + 0.60z
Fledgling body mass C0 -3357.40 + 19.46catch -2.37foxsum -46.30Nsum -7.70foxsum:Nsum
Reproductive rate logit(R) -3.76 + 0.002z + 0.86Pspr -3.52SOsum + 0.002z:SOsum
Fledged brood size log(fec) 0.77 – 0.16foxsum – 0.10Psum

19
Table 2. Summary of which conditions for body mass-mediated effects on the population growth rate (for 405
each demographic rate) that were met or not (✓ = condition met). 406
Condition Fledgling
survival (ϕfl)
Adult
survival (ϕad)
Probability of
reproducing
(R)
Fledged brood
size (fec)
Body mass fluctuates at the
relevant stage ✓
Demographic rate sensitive
to body mass change ✓ ✓
λ sensitive to variation in
demographic rate ✓ ✓ ✓

20
Figures 407
Figure 1. Life cycle of barnacle geese based on a post-breeding census (i.e., breeding occurs just before a 408
census). Individuals in age class a must survive with a mass-dependent probability (ϕ(z, a)) and grow to the 409
next year (G(z*, z)) in order to reproduce (R(z), fec) and contribute fledglings of mass (C0(z’)) to the 410
population. Model predictions of body mass effects at t on; (a) fledgling (ϕfl) and adult (ϕad) survival, (b) 411
mass at t+1, reproduction probability (R) of adult females at the (c) 20th quantile, (d) mean and (e) 80th 412
quantile of the date of spring onset (SOsum). Effects of adult population size at Ny-Ålesund (Nsum) on 413
fledgling mass (C0) at the (f) 20th, (g) mean and (h) 80th quantile of Arctic fox abundance (foxsum). 414

21
Figure 2. Temporal trends in average cohort adult (black, 1980-2016) and annual fledgling (grey, 1991-415
2016) body mass, slope (bold line) with 95% confidence intervals (shading) were calculated based on a 416
linear regression. 417
418
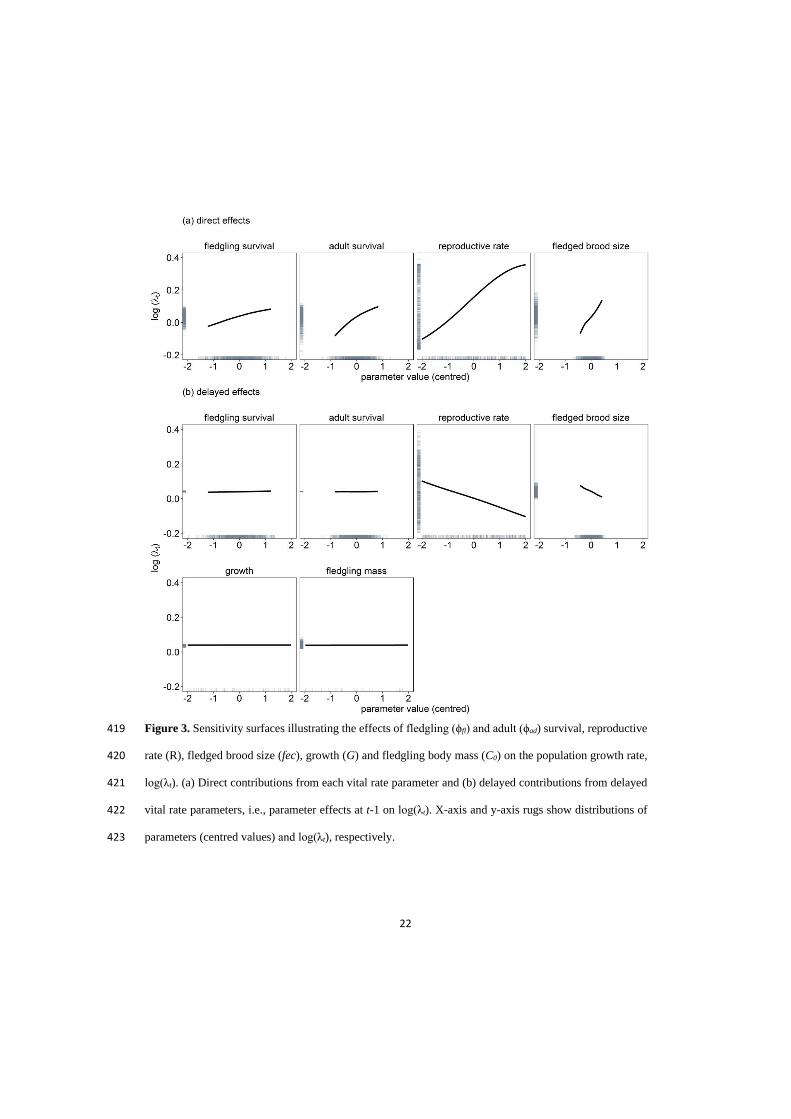
22
Figure 3. Sensitivity surfaces illustrating the effects of fledgling (ϕfl) and adult (ϕad) survival, reproductive 419
rate (R), fledged brood size (fec), growth (G) and fledgling body mass (C0) on the population growth rate, 420
log(λt). (a) Direct contributions from each vital rate parameter and (b) delayed contributions from delayed 421
vital rate parameters, i.e., parameter effects at t-1 on log(λt). X-axis and y-axis rugs show distributions of 422
parameters (centred values) and log(λt), respectively. 423
23
Figure 4. Percentage contributions of the five largest demographic contributions to variance in the 424
population growth rate, log(λt). Contributions were decomposed into direct and delayed (in brackets) 425
variances and covariances. Colours represent contributions from modelled covariates versus unexplained 426
variation (random effects). 427

24
References 428
Albon, S., Clutton-Brock, T. & Guinness, F. (1987). Early development and population dynamics in red 429
deer. II. Density-independent effects and cohort variation. The Journal of Animal Ecology, 69-81. 430
Albon, S.D., Irvine, R.J., Halvorsen, O., Langvatn, R., Loe, L.E., Ropstad, E. et al. (2017). Contrasting 431
effects of summer and winter warming on body mass explain population dynamics in a food‐432
limited Arctic herbivore. Global Change Biology, 23, 1374-1389. 433
Ankney, C.D. & MacInnes, C.D. (1978). Nutrient reserves and reproductive performance of female 434
Lesser Snow Geese. The Auk, 459-471. 435
Aubry, L.M., Rockwell, R.F., Cooch, E.G., Brook, R.W., Mulder, C.P. & Koons, D.N. (2013). Climate 436
change, phenology, and habitat degradation: drivers of gosling body condition and juvenile 437
survival in lesser snow geese. Global Change Biology, 19, 149-160. 438
Bates, D., Machler, M., Bolker, B.M. & Walker, S.C. (2015). Fitting Linear Mixed-Effects Models Using 439
lme4. Journal of Statistical Software, 67, 1-48. 440
Beckerman, A., Benton, T.G., Ranta, E., Kaitala, V. & Lundberg, P. (2002). Population dynamic 441
consequences of delayed life-history effects. Trends in Ecology & Evolution, 17, 263-269. 442
Bêty, J., Gauthier, G. & Giroux, J.-F. (2003). Body condition, migration, and timing of reproduction in 443
snow geese: a test of the condition-dependent model of optimal clutch size. The American 444
Naturalist, 162, 110-121. 445
Bierzychudek, P. (1999). Looking backwards: assessing the projections of a transition matrix model. 446
Ecological Applications, 9, 1278-1287. 447
Bjorkman, A.D., Elmendorf, S.C., Beamish, A.L., Vellend, M. & Henry, G.H. (2015). Contrasting effects 448
of warming and increased snowfall on Arctic tundra plant phenology over the past two decades. 449
Global Change Biology, 21, 4651-4661. 450
Burnham, K.P. & Anderson, D.R. (2002). Model Selection and Multimodel Inference: A Practical 451
Information-Theoretic Approach. 2nd edn. Springer Science & Business Media, New York, USA. 452
Choudhury, S., Black, J.M. & Owen, M. (1996). Body size, fitness and compatibility in barnacle geese 453
Branta leucopsis. Ibis, 138, 700-709. 454
Clutton–Brock, T. & Coulson, T. (2002). Comparative ungulate dynamics: the devil is in the detail. 455
Philosophical Transactions of the Royal Society of London. Series B: Biological Sciences, 357, 456
1285-1298. 457
Compagnoni, A., Bibian, A.J., Ochocki, B.M., Rogers, H.S., Schultz, E.L., Sneck, M.E. et al. (2016). The 458
effect of demographic correlations on the stochastic population dynamics of perennial plants. 459
Ecological Monographs, 86, 480-494. 460
25
Cooch, E., Lank, D., Dzubin, A., Rockwell, R. & Cooke, F. (1991a). Body size variation in lesser snow 461
geese: environmental plasticity in gosling growth rates. Ecology, 72, 503-512. 462
Cooch, E., Lank, D., Rockwell, R. & Cooke, F. (1991b). Long-term decline in body size in a snow goose 463
population: evidence of environmental degradation? The Journal of Animal Ecology, 483-496. 464
Couturier, S., Cote, S.D., Huot, J. & Otto, R.D. (2008). Body-condition dynamics in a northern ungulate 465
gaining fat in winter. Canadian Journal of Zoology, 87, 367-378. 466
De Roos, A.M., Persson, L. & McCauley, E. (2003). The influence of size‐dependent life‐history traits on 467
the structure and dynamics of populations and communities. Ecology Letters, 6, 473-487. 468
Douhard, M., Gaillard, J.-M., Delorme, D., Capron, G., Duncan, P., Klein, F. et al. (2013). Variation in 469
adult body mass of roe deer: early environmental conditions influence early and late body growth 470
of females. Ecology, 94, 1805-1814. 471
Easterling, M.R., Ellner, S.P. & Dixon, P.M. (2000). Size-specific sensitivity: applying a new structured 472
population model. Ecology, 81, 694-708. 473
Ebbinge, B.S. & Spaans, B. (1995). The importance of body reserves accumulated in spring staging areas 474
in the temperate zone for breeding in dark-bellied brent geese Branta b. bernicla in the high 475
Arctic. Journal of Avian Biology, 105-113. 476
Ezard, T.H., Bullock, J.M., Dalgleish, H.J., Millon, A., Pelletier, F., Ozgul, A. et al. (2010). Matrix 477
models for a changeable world: the importance of transient dynamics in population management. 478
Journal of Applied Ecology, 47, 515-523. 479
Festa-Bianchet, M., Jorgenson, J.T., Bérubé, C.H., Portier, C. & Wishart, W.D. (1997). Body mass and 480
survival of bighorn sheep. Canadian Journal of Zoology, 75, 1372-1379. 481
Fjelldal, M.A., Layton-Matthews, K., Lee, A.M., Grøtan, V., Loonen, M.J.J.E. & Hansen, B.B. (in press). 482
High-arctic family planning: earlier spring onset advances age at first reproduction in barnacle 483
geese. Biology letters. 484
Forchhammer, M.C., Post, E., Stenseth, N.C. & Boertmann, D.M. (2002). Long‐term responses in arctic 485
ungulate dynamics to changes in climatic and trophic processes. Population Ecology, 44, 113-486
120. 487
Forslund, P. & Larsson, K. (1992). Age-related reproductive success in the barnacle goose. Journal of 488
Animal Ecology, 61, 195-204. 489
Foster, J. (1989). The significance of the date of snow disappearance on the Arctic tundra as a possible 490
indicator of climate change. Arctic and Alpine Research, 21, 60-70. 491
Fox, A.D. & Abraham, K.F. (2017). Why geese benefit from the transition from natural vegetation to 492
agriculture. Ambio, 46, 188-197. 493
26
Fox, A.D. & Madsen, J. (2017). Threatened species to super-abundance: The unexpected international 494
implications of successful goose conservation. Ambio, 46, 179-187. 495
Fuglei, E., Øritsland, N.A. & Prestrud, P. (2003). Local variation in arctic fox abundance on Svalbard, 496
Norway. Polar Biology, 26, 93-98. 497
Gaillard, J.-M. & Yoccoz, N.G. (2003). Temporal variation in survival of mammals: a case of 498
environmental canalization? Ecology, 84, 3294-3306. 499
Gelman, A. & Hill, J. (2006). Causal inference using multilevel models. In: Data analysis using 500
regression and multilevel/hierarchical models. Cambridge University Press Cambridge, UK, pp. 501
503-512. 502
Gimenez, O., Covas, R., Brown, C.R., Anderson, M.D., Brown, M.B. & Lenormand, T. (2006). 503
Nonparametric estimation of natural selection on a quantitative trait using mark‐recapture data. 504
Evolution, 60, 460-466. 505
Guillemain, M., Elmberg, J., Arzel, C., Johnson, A.R. & Simon, G. (2008). The income–capital breeding 506
dichotomy revisited: late winter body condition is related to breeding success in an income 507
breeder. Ibis, 150, 172-176. 508
Hahn, S., Loonen, M.J.J.E. & Klaassen, M. (2011). The reliance on distant resources for egg formation in 509
high Arctic breeding barnacle geese Branta leucopsis. Journal of Avian Biology, 42, 159-168. 510
Hansen, B.B., Gamelon, M., Albon, S.D., Lee, A.M., Stien, A., Irvine, R.J. et al. (2019). More frequent 511
extreme climate events stabilize reindeer population dynamics. Nature communications, 10, 1616. 512
Hansen, B.B., Isaksen, K., Benestad, R.E., Kohler, J., Pedersen, Å.Ø., Loe, L.E. et al. (2014). Warmer 513
and wetter winters: characteristics and implications of an extreme weather event in the High 514
Arctic. Environmental Research Letters, 9, 114021. 515
Harrison, X.A., Hodgson, D.J., Inger, R., Colhoun, K., Gudmundsson, G.A., McElwaine, G. et al. (2013). 516
Environmental conditions during breeding modify the strength of mass-dependent carry-over 517
effects in a migratory bird. PloS one, 8, e77783. 518
Hastings, A. (2004). Transients: the key to long-term ecological understanding? Trends in Ecology & 519
Evolution, 19, 39-45. 520
Herfindal, I., Sæther, B.E., Solberg, E.J., Andersen, R. & Høgda, K.A. (2006). Population characteristics 521
predict responses in moose body mass to temporal variation in the environment. Journal of 522
Animal Ecology, 75, 1110-1118. 523
Jenouvrier, S. (2013). Impacts of climate change on avian populations. Global Change Biology, 19, 2036-524
2057. 525
Jongejans, E., De Kroon, H., Tuljapurkar, S. & Shea, K. (2010). Plant populations track rather than buffer 526
climate fluctuations. Ecology Letters, 13, 736-743. 527

27
Jönsson, K.I. (1997). Capital and income breeding as alternative tactics of resource use in reproduction. 528
Oikos, 78, 57-66. 529
Klaassen, M., Hahn, S., Korthals, H. & Madsen, J. (2017). Eggs brought in from afar: Svalbard‐breeding 530
pink‐footed geese can fly their eggs across the Barents Sea. Journal of Avian Biology, 48, 173-531
179. 532
Koons, D.N., Grand, J.B., Zinner, B. & Rockwell, R.F. (2005). Transient population dynamics: relations 533
to life history and initial population state. Ecological modelling, 185, 283-297. 534
Koons, D.N., Iles, D.T., Schaub, M. & Caswell, H. (2016). A life‐history perspective on the demographic 535
drivers of structured population dynamics in changing environments. Ecology letters, 19, 1023-536
1031. 537
Kuss, P., Rees, M., Ægisdóttir, H.H., Ellner, S.P. & Stöcklin, J. (2008). Evolutionary demography of 538
long‐lived monocarpic perennials: a time‐lagged integral projection model. Journal of Ecology, 539
96, 821-832. 540
Laake, J.L. (2013). RMark: an R interface for analysis of capture-recapture data with MARK. In: AFSC 541
Processed Report 2013-01. Alaska Fisheries Science Center, National Marine Fisheries Service, 542
NOAA Seattle, Washington, USA. 543
Labocha, M.K. & Hayes, J.P. (2012). Morphometric indices of body condition in birds: a review. Journal 544
of Ornithology, 153, 1-22. 545
Lande, R., Engen, S. & Saether, B.-E. (2003). Stochastic population dynamics in ecology and 546
conservation. Oxford University Press, Oxford. 547
Lande, R., Engen, S., Sæther, B.-E. & Coulson, T. (2006). Estimating density dependence from time 548
series of population age structure. The American Naturalist, 168, 76-87. 549
Larsson, K., Van der Jeugd, H.P., Van der Veen, I.T. & Forslund, P. (1998). Body size declines despite 550
positive directional selection on heritable size traits in a barnacle goose population. Evolution, 52, 551
1169-1184. 552
Layton-Matthews, K., Hansen, B.B., Grøtan, V., Fuglei, E. & Loonen, M.J.J.E. (2019a). Contrasting 553
consequences of climate change for migratory geese: predation, density dependence and 554
carryover effects offset benefits of high-arctic warming. Global Change Biology, 26, 642-657. 555
Layton-Matthews, K., Loonen, M.J.J.E., Hansen, B.B., Saether, B.-E., Coste, C.F.D. & Grøtan, V. 556
(2019b). Density-dependent population dynamics of a high Arctic capital breeder, the barnacle 557
goose Journal of Animal Ecology, 88, 1191-1201. 558
Le Moullec, M., Buchwal, A., van der Wal, R., Sandal, L. & Hansen, B.B. (2019). Annual ring growth of 559
a widespread high arctic shrub reflects past fluctuations in community‐level plant biomass. 560
Journal of Ecology, 107, 436-451. 561

28
Lindholm, A., Gauthier, G. & Desrochers, A. (1994). Effects of hatch date and food supply on gosling 562
growth in arctic-nesting Greater Snow Geese. Condor, 96, 898-908. 563
Loonen, M.J.J.E., Oosterbeek, K. & Drent, R. (1997). Variation in growth of young and adult size in 564
barnacle geese Branta leucopsis: evidence for density dependence. Ardea, 85, 177-192. 565
Loonen, M.J.J.E., Tombre, I.M. & Mehlum, F. (1998). Development of an arctic barnacle goose colony: 566
interactions between density and predation. Norsk Polarinstitutt Skrifter, 200, 67-80. 567
Madsen, J., Tamstorf, M., Klaassen, M., Eide, N., Glahder, C., Rigét, F. et al. (2007). Effects of snow 568
cover on the timing and success of reproduction in high-Arctic pink-footed geese Anser 569
brachyrhynchus. Polar Biology, 30, 1363-1372. 570
Maldonado‐Chaparro, A.A., Blumstein, D.T., Armitage, K.B. & Childs, D.Z. (2018). Transient LTRE 571
analysis reveals the demographic and trait‐mediated processes that buffer population growth. 572
Ecology letters, 21, 1693-1703. 573
McCarthy, M.A. & Masters, P. (2005). Profiting from prior information in Bayesian analyses of 574
ecological data. Journal of Applied Ecology, 42, 1012-1019. 575
McLean, N.M., van der Jeugd, H.P., Van Turnhout, C.A., Lefcheck, J.S. & Van de Pol, M. (2020). 576
Reduced avian body condition due to global warming has little reproductive or population 577
consequences. Oikos. 578
Menu, S., Gauthier, G. & Reed, A. (2005). Survival of young greater snow geese (Chen caerulescens 579
atlantica) during fall migration. The Auk, 122, 479-496. 580
Metcalf, C.J.E., Ellner, S.P., Childs, D.Z., Salguero‐Gómez, R., Merow, C., McMahon, S.M. et al. 581
(2015). Statistical modelling of annual variation for inference on stochastic population dynamics 582
using Integral Projection Models. Methods in Ecology and Evolution, 6, 1007-1017. 583
Owen, M. (1980). Wild geese of the world: their life history and ecology. BT Batsford Limited, London. 584
Owen, M. & Black, J.M. (1989). Factors affecting the survival of Barnacle Geese on migration from the 585
breeding grounds. Journal of Animal Ecology, 58, 603-617. 586
Ozgul, A., Childs, D.Z., Oli, M.K., Armitage, K.B., Blumstein, D.T., Olson, L.E. et al. (2010). Coupled 587
dynamics of body mass and population growth in response to environmental change. Nature, 466, 588
482. 589
Ozgul, A., Tuljapurkar, S., Benton, T.G., Pemberton, J.M., Clutton-Brock, T.H. & Coulson, T. (2009). 590
The Dynamics of Phenotypic Change and the Shrinking Sheep of St. Kilda. Science, 325, 464-591
467. 592
Paniw, M., James, T., Archer, C.R., Roemer, G., Levin, S., Compagnoni, A. et al. (2019a). Global 593
analysis reveals complex demographic responses of mammals to climate change. bioRxiv. 594

29
Paniw, M., Maag, N., Cozzi, G., Clutton-Brock, T. & Ozgul, A. (2019b). Life history responses of 595
meerkats to seasonal changes in extreme environments. Science, 363, 631-635. 596
Parker, K.L., Barboza, P.S. & Gillingham, M.P. (2009). Nutrition integrates environmental responses of 597
ungulates. Functional ecology, 23, 57-69. 598
Parmesan, C. (2006). Ecological and evolutionary responses to recent climate change. Annu. Rev. Ecol. 599
Evol. Syst., 37, 637-669. 600
Plard, F., Gaillard, J.-M., Coulson, T., Hewison, A.M., Douhard, M., Klein, F. et al. (2015). The influence 601
of birth date via body mass on individual fitness in a long‐lived mammal. Ecology, 96, 1516-602
1528. 603
Plummer, M. (2013). rjags: Bayesian graphical models using MCMC. R package version, 3. 604
Post, E. & Forchhammer, M.C. (2008). Climate change reduces reproductive success of an Arctic 605
herbivore through trophic mismatch. Philosophical Transactions of the Royal Society of London 606
B: Biological Sciences, 363, 2367-2373. 607
Post, E. & Stenseth, N.C. (1999). Climatic variability, plant phenology, and northern ungulates. Ecology, 608
80, 1322-1339. 609
Post, E., Stenseth, N.C., Langvatn, R. & Fromentin, J.-M. (1997). Global climate change and phenotypic 610
variation among red deer cohorts. Proceedings of the Royal Society of London. Series B: 611
Biological Sciences, 264, 1317-1324. 612
Prop, J. & Black, J.M. (1998). Food intake, body reserves and reproductive success of barnacle geese 613
Branta leucopsis staging in different habitats. Norsk Polarinstitutt Skrifter, 200, 175-194. 614
Reed, A. & Plante, N. (1997). Decline in body mass, size, and condition of greater snow geese, 1975-94. 615
The Journal of wildlife management, 413-419. 616
Reed, E.T., Gauthier, G. & Giroux, J.-F. (2004). Effects of spring conditions on breeding propensity of 617
greater snow goose females. Animal Biodiversity and Conservation, 27, 35-46. 618
Rees, M. & Ellner, S.P. (2009). Integral projection models for populations in temporally varying 619
environments. Ecological Monographs, 79, 575-594. 620
Sainmont, J., Andersen, K.H., Varpe, Ø. & Visser, A.W. (2014). Capital versus income breeding in a 621
seasonal environment. The American Naturalist, 184, 466-476. 622
Schamber, J.L., Esler, D. & Flint, P.L. (2009). Evaluating the validity of using unverified indices of body 623
condition. Journal of Avian Biology, 40, 49-56. 624
Schaub, M., Jakober, H. & Stauber, W. (2013). Strong contribution of immigration to local population 625
regulation: evidence from a migratory passerine. Ecology, 94, 1828-1838. 626
Scheffer, M., Straile, D., van Nes, E.H. & Hosper, H. (2001). Climatic warming causes regime shifts in 627
lake food webs. Limnology and Oceanography, 46, 1780-1783. 628

30
Schmutz, J.A. (1993). Survival and pre-fledging body mass in juvenile Emperor Geese. The Condor, 95, 629
222-225. 630
Serreze, M.C. & Barry, R.G. (2011). Processes and impacts of Arctic amplification: A research synthesis. 631
Global Planetary Change, 77, 85-96. 632
Sæther, B.-E. (1997). Environmental stochasticity and population dynamics of large herbivores: a search 633
for mechanisms. Trends in Ecology and Evolution, 12, 143-149. 634
Sæther, B.-E., Visser, M.E., Grøtan, V. & Engen, S. (2016). Evidence for r-and K-selection in a wild bird 635
population: a reciprocal link between ecology and evolution. Proceedings of the Royal Society B: 636
Biological Sciences, 283, 20152411. 637
Tuljapurkar, S.D. (1982). Population dynamics in variable environments. III. Evolutionary dynamics of r-638
selection. Theoretical Population Biology, 21, 141-165. 639
Varpe, Ø., Jørgensen, C., Tarling, G.A. & Fiksen, Ø. (2009). The adaptive value of energy storage and 640
capital breeding in seasonal environments. Oikos, 118, 363-370. 641
Vindenes, Y., Engen, S. & Sæther, B.-E. (2008). Individual heterogeneity in vital parameters and 642
demographic stochasticity. The American Naturalist, 171, 455-467. 643
Vindenes, Y. & Langangen, Ø. (2015). Individual heterogeneity in life histories and eco‐evolutionary 644
dynamics. Ecology letters, 18, 417-432. 645
White, G.C. & Burnham, K.P. (1999). Program MARK: survival estimation from populations of marked 646
animals. Bird study, 46, S120-S139. 647
648

Supporting information:
‘Environmental change reduces body mass, but not population growth, in an Arctic
herbivore’
Kate Layton-Matthews, Vidar Grøtan, Brage B. Hansen, Maarten J. J. E. Loonen, Eva Fuglei, Dylan Z. Childs
Appendix 1. Sample sizes of data used in regression models.
Table S1. Annual sample sizes used to estimate; G, ϕfl, ϕad, R, fec, and C0. Sample size for G is the
number of observations of individuals (fledglings and adults) where body mass was measured at year t
and t+1. For survival, this was the number of observations, per year, for fledglings (ϕfl) and adults (ϕad).
For R, the sample size refers to the yearly number of observations of adult females that survived from
t-1 to t, in order to reproduce. For fec, only successful mothers were included (i.e., R = 1) in the sample
size. The sample size for C0 is the annual number of records of fledging body mass.
year growth
(G)
fledgling
survival
(ϕfl)
adult
survival
(ϕad)
reproduction
probability (R)
fledged
brood size
(fec)
fledgling
mass
(C0)
1990 - - 101 - - -
1991 115 177 218 94 41 164
1992 92 105 391 89 22 105
1993 60 55 445 175 36 55
1994 34 1 516 295 2 1
1995 84 128 464 366 61 128
1996 46 247 564 345 112 228
1997 50 130 408 321 46 129
1998 50 88 657 269 15 87
1999 56 2 656 365 46 -
2000 24 5 891 508 12 5
2001 3 54 654 538 50 51
2002 24 - 482 490 6 -
2003 80 9 449 360 6 9
2004 83 15 383 - - 15
2005 25 65 558 209 22 65
2006 30 4 493 415 12 -
2007 15 33 595 371 41 33
2008 16 8 398 346 13 8
2009 27 66 458 284 50 64
2010 2 55 492 318 48 52
2011 8 132 330 275 52 -
2012 23 25 415 274 62 132
2013 39 17 401 301 15 25
2014 32 13 403 247 11 17
2015 19 23 438 334 14 13
2016 - 9 489 320 49 22
2017 - - - 256 11 -
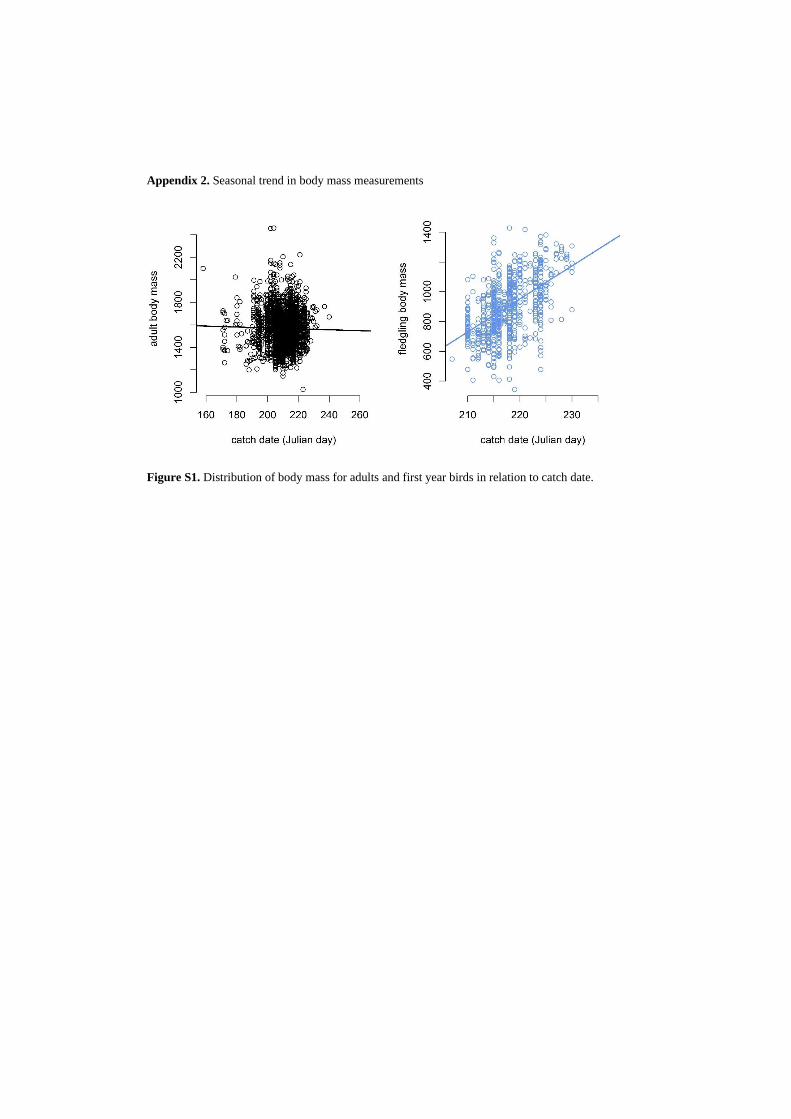
Appendix 2. Seasonal trend in body mass measurements
Figure S1. Distribution of body mass for adults and first year birds in relation to catch date.

Appendix 3. Model selection
Table S1. Global models for each response variable.
Summary of candidate models of parameters
The best-fitting model of fledgling mass (C0) included additive and interaction effects between Arctic
fox abundance, foxsum, and population density, Nsum, (Table S2.1). Nsum had a negative effect on fledgling
mass, which was stronger with increasing fox abundance. The best-fitting growth model, estimating
body mass at time t+1 included positive effects of mass at time t spring precipitation at Helgeland (Pspr)
and age class. However, a model without age class and Pspr was within 2 ΔAICc (Table S2.2) and so a
simpler model including only mass was the most parsimonious. The best-fitting model of the
reproductive rate, R, (i.e., probability of an adult female producing fledglings) included positive effects
of mother mass and Pspr (Table S2.3). This model also included a negative effect of date of spring onset,
SOsum and an interaction between mass and SOsum, where the effect of mass increased with delayed
spring onset. The second best-fitting model (1.57 ΔAICc) included negative fox and summer
precipitation effects but not SOsum. The most parsimonious model of fec (i.e., number of fledged
offspring per mother) included negative effects of fox abundance and summer precipitation, Psum (Table
S2.4). The best-fitting model of survival included additive effects of age class, body mass,
overwintering population size (Nwin) and winter temperature (Twin), as well as age class-mass and mass-
Nwin interaction effects. However, a model without a body mass-Nwin interaction was considered the
most parsimonious since it was within 2 ΔAICc (Table S2.5).
Parameter Abbreviation Global model
Growth G
age class × body mass +
Nsum + foxsum + SOsum + Psum + Tsum +
Pspr + Nwin + Twin
Survival ϕ
age class × body mass ×
(foxsum + Pspr + Nwin + Twin)
Reproductive
probability R
age class × body mass × (Nsum + foxsum + SOsum
+ Psum + Tsum + Pspr + Nwin + Twin)
Fledged brood
size fec
age class × body mass × (Nsum + foxsum + SOsum
+ Psum + Tsum + Pspr + Nwin + Twin)
Fledgling mass C0 Nsum + foxsum + SOsum + Psum + Tsum
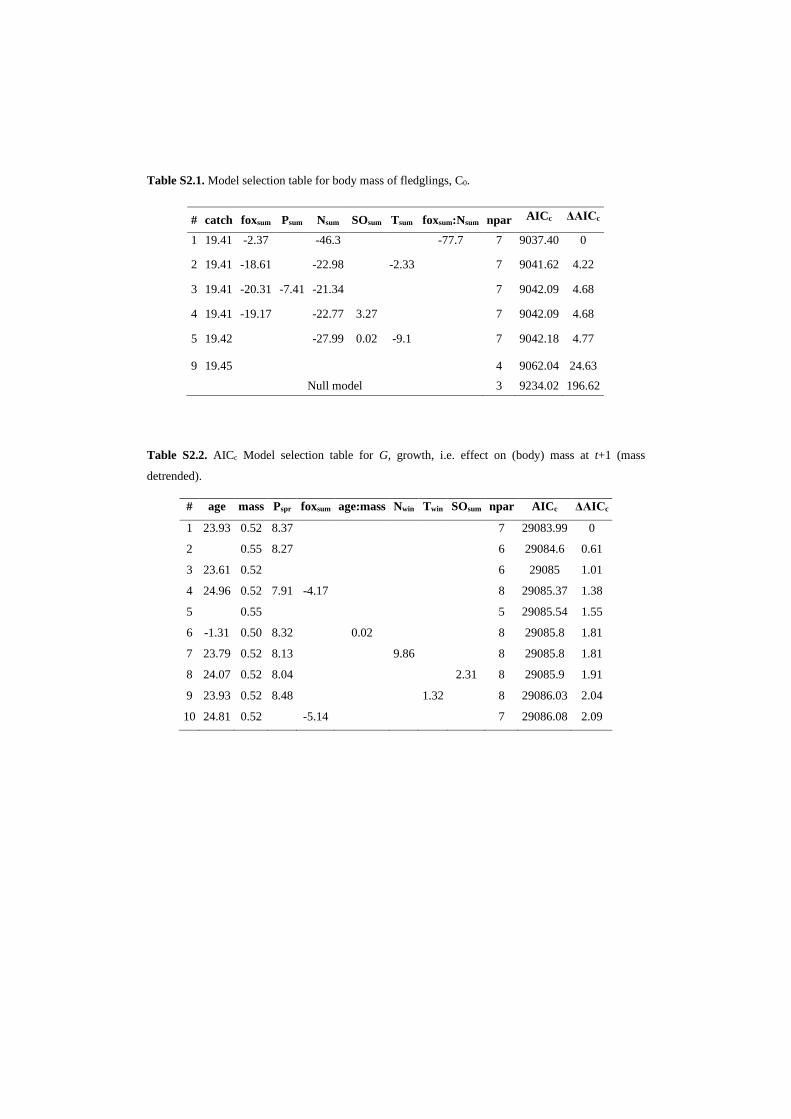
Table S2.1. Model selection table for body mass of fledglings, C0.
Table S2.2. AICc Model selection table for G, growth, i.e. effect on (body) mass at t+1 (mass
detrended).
# age mass Pspr foxsum age:mass Nwin Twin SOsum npar AICc ΔAICc
1 23.93 0.52 8.37 7 29083.99 0
2 0.55 8.27 6 29084.6 0.61
3 23.61 0.52 6 29085 1.01
4 24.96 0.52 7.91 -4.17 8 29085.37 1.38
5 0.55 5 29085.54 1.55
6 -1.31 0.50 8.32 0.02 8 29085.8 1.81
7 23.79 0.52 8.13 9.86 8 29085.8 1.81
8 24.07 0.52 8.04 2.31 8 29085.9 1.91
9 23.93 0.52 8.48 1.32 8 29086.03 2.04
10 24.81 0.52 -5.14 7 29086.08 2.09
# catch foxsum Psum Nsum SOsum Tsum foxsum:Nsum npar AICc ΔAICc
1 19.41 -2.37 -46.3 -77.7 7 9037.40 0
2 19.41 -18.61 -22.98 -2.33 7 9041.62 4.22
3 19.41 -20.31 -7.41 -21.34 7 9042.09 4.68
4 19.41 -19.17 -22.77 3.27 7 9042.09 4.68
5 19.42 -27.99 0.02 -9.1 7 9042.18 4.77
9 19.45 4 9062.04 24.63
Null model 3 9234.02 196.62

Table S2.3. Model selection table for R, probability of a female producing a fledgling.
Table S2.4. Model selection table for fec, fledged brood size
# mass foxsum Pspr Psum SOsum mass:SOsum npar AICc ΔAICc
1 0.002
0.86
-3.52 0.002 7 1049.25 0.00
2 0.002 -0.62 0.74 -0.58
7 1050.82 1.57
3 0.002 -0.61 0.80
-0.48
7 1051.70 2.44
4 0.002 -0.74
-3.43 0.002 7 1051.87 2.62
5
-0.64 0.85 -0.60 -0.48
7 1052.37 3.11
6 0.002
0.89 -0.58 -0.48
7 1052.79 3.53
7 0.002 -0.65 0.73
6 1052.82 3.57
9
-0.65 0.77 -0.61
6 1053.76 4.50
0.002 4 1059.78 10.53
Null model 3 1063.44 14.19
# foxsum Psum Pspr Nwin npar AICc ΔAICc
1 -0.16 -0.10
4 2146.80 0.93
2 -0.15 0.07
4 2148.20 2.30
3 -0.15
3 2148.60 2.69
4 -0.15
-0.06 4 2149.20 3.32
Null model 2 2154.99 9.09

Table. S2.5 Survival, ϕ, model selection table: mass = body mass, age = age class (fledgling or adult).
# age mass age:
mass Nwin Twin
mass:
Nwin
mass:
Twin
age:
Nwin
age:
Tsum
age:mass
:Nwin
age:mass
:Twin npar AICc ΔAICc
1 4.09 0.004 -0.003 0.05 0.24 -0.0002 7 16624.65 0.00
2 4.06 0.004 -0.003 0.01 0.007 -0.0002 0.0002 8 16624.83 0.18
3 4.17 0.004 -0.003 -0.24 -0.05 0.0002 7 16625.36 0.71
4 4.04 0.004 -0.003 0.16 0.23 -0.0004,
-0.0003 8 16626.07 1.42
6 4.22 0.004 -0.003 -0.24 0.23 6 16626.24 1.59
7 4.16 0.004 -0.0033 -0.24 -0.04 0.0002,
0.0002 8 16627.37 2.72
8 4.20 0.004 -0.003 -0.24 0.15 0.10 7 16627.38 2.73
11 4.21 0.004 -0.003 -0.2 0.24 -0.041 7 16628.13 3.48
12 4.20 0.004 -0.003 -0.24 0.15 -0.003 0.10 8 16629.39 4.74
1.00 0.0005 3 16738.98 114.33
1.32 2 16759.70 135.05

Appendix 4. Simulation of stochastic IPM
Figure S1. Stochastic growth rate, λt, distribution from 100,000 simulations.
Figure S2. Estimated stable state distribution for (body) mass, z. Continuous line: estimated stable
distribution of the integral projection model. Histogram: observed mass distribution.

Appendix 5. Annual parameter estimates based on regression models.
Figure S1. Annual parameter estimates based on regression models of survival of fledglings (ϕfl)and
adults (ϕad), growth (G), reproduction probability (R), fledged brood size (fec) and fledgling mass (C0),
estimated at mean (age-specific) body mass and covariate values. Black line illustrates the temporal
trend for each rate/transition, with 95% confidence intervals, estimated with a linear model.

Doctoral theses in Biology
Norwegian University of Science and Technology Department of Biology
Year Name Degree Title
1974 Tor-Henning Iversen Dr. philos Botany
The roles of statholiths, auxin transport, and auxin metabolism in root gravitropism
1978 Tore Slagsvold Dr. philos Zoology
Breeding events of birds in relation to spring temperature and environmental phenology
1978 Egil Sakshaug Dr. philos Botany
The influence of environmental factors on the chemical composition of cultivated and natural populations of marine phytoplankton
1980 Arnfinn Langeland Dr. philos Zoology
Interaction between fish and zooplankton populations and their effects on the material utilization in a freshwater lake
1980 Helge Reinertsen Dr. philos Botany
The effect of lake fertilization on the dynamics and stability of a limnetic ecosystem with special reference to the phytoplankton
1982 Gunn Mari Olsen Dr. scient Botany
Gravitropism in roots of Pisum sativum and Arabidopsis thaliana
1982 Dag Dolmen Dr. philos Zoology
Life aspects of two sympartic species of newts (Triturus, Amphibia) in Norway, with special emphasis on their ecological niche segregation
1984 Eivin Røskaft Dr. philos Zoology
Sociobiological studies of the rook Corvus frugilegus
1984 Anne Margrethe Cameron
Dr. scient Botany
Effects of alcohol inhalation on levels of circulating testosterone, follicle stimulating hormone and luteinzing hormone in male mature rats
1984 Asbjørn Magne Nilsen
Dr. scient Botany
Alveolar macrophages from expectorates – Biological monitoring of workers exposed to occupational air pollution. An evaluation of the AM-test
1985 Jarle Mork Dr. philos Zoology
Biochemical genetic studies in fish
1985 John Solem Dr. philos Zoology
Taxonomy, distribution and ecology of caddisflies (Trichoptera) in the Dovrefjell mountains
1985 Randi E. Reinertsen Dr. philos Zoology
Energy strategies in the cold: Metabolic and thermoregulatory adaptations in small northern birds
1986 Bernt-Erik Sæther Dr. philos Zoology
Ecological and evolutionary basis for variation in reproductive traits of some vertebrates: A comparative approach
1986 Torleif Holthe Dr. philos Zoology
Evolution, systematics, nomenclature, and zoogeography in the polychaete orders Oweniimorpha and Terebellomorpha, with special reference to the Arctic and Scandinavian fauna
1987 Helene Lampe Dr. scient Zoology
The function of bird song in mate attraction and territorial defence, and the importance of song repertoires
1987 Olav Hogstad Dr. philos Zoology
Winter survival strategies of the Willow tit Parus montanus
1987 Jarle Inge Holten Dr. philos Botany
Autecological investigations along a coust-inland transect at Nord-Møre, Central Norway
1987 Rita Kumar Dr. scient Botany
Somaclonal variation in plants regenerated from cell cultures of Nicotiana sanderae and Chrysanthemum morifolium
1987 Bjørn Åge Tømmerås Dr. scient Zoology
Olfaction in bark beetle communities: Interspecific interactions in regulation of colonization density, predator - prey relationship and host attraction
1988 Hans Christian Pedersen
Dr. philos Zoology
Reproductive behaviour in willow ptarmigan with special emphasis on territoriality and parental care
1988 Tor G. Heggberget Dr. philos Zoology
Reproduction in Atlantic Salmon (Salmo salar): Aspects of spawning, incubation, early life history and population structure
1988 Marianne V. Nielsen Dr. scient Zoology
The effects of selected environmental factors on carbon allocation/growth of larval and juvenile mussels (Mytilus edulis)
1988 Ole Kristian Berg Dr. scient Zoology
The formation of landlocked Atlantic salmon (Salmo salar L.)
1989 John W. Jensen Dr. philos Zoology
Crustacean plankton and fish during the first decade of the manmade Nesjø reservoir, with special emphasis on the effects of gill nets and salmonid growth
1989 Helga J. Vivås Dr. scient Zoology
Theoretical models of activity pattern and optimal foraging: Predictions for the Moose Alces alces
1989 Reidar Andersen Dr. scient Zoology
Interactions between a generalist herbivore, the moose Alces alces, and its winter food resources: a study of behavioural variation
1989 Kurt Ingar Draget Dr. scient Botany
Alginate gel media for plant tissue culture
1990 Bengt Finstad Dr. scient Zoology
Osmotic and ionic regulation in Atlantic salmon, rainbow trout and Arctic charr: Effect of temperature, salinity and season
1990 Hege Johannesen Dr. scient Zoology
Respiration and temperature regulation in birds with special emphasis on the oxygen extraction by the lung
1990 Åse Krøkje Dr. scient Botany
The mutagenic load from air pollution at two work-places with PAH-exposure measured with Ames Salmonella/microsome test
1990 Arne Johan Jensen Dr. philos Zoology
Effects of water temperature on early life history, juvenile growth and prespawning migrations of Atlantic salmon (Salmo salar) and brown trout (Salmo trutta): A summary of studies in Norwegian streams
1990 Tor Jørgen Almaas Dr. scient Zoology
Pheromone reception in moths: Response characteristics of olfactory receptor neurons to intra- and interspecific chemical cues
1990 Magne Husby Dr. scient Zoology
Breeding strategies in birds: Experiments with the Magpie Pica pica
1991 Tor Kvam Dr. scient Zoology
Population biology of the European lynx (Lynx lynx) in Norway
1991 Jan Henning L'Abêe Lund
Dr. philos Zoology
Reproductive biology in freshwater fish, brown trout Salmo trutta and roach Rutilus rutilus in particular
1991 Asbjørn Moen Dr. philos Botany
The plant cover of the boreal uplands of Central Norway. I. Vegetation ecology of Sølendet nature reserve; haymaking fens and birch woodlands
1991 Else Marie Løbersli Dr. scient Botany
Soil acidification and metal uptake in plants
1991 Trond Nordtug Dr. scient Zoology
Reflectometric studies of photomechanical adaptation in superposition eyes of arthropods
1991 Thyra Solem Dr. scient Botany
Age, origin and development of blanket mires in Central Norway

1991 Odd Terje Sandlund Dr. philos Zoology
The dynamics of habitat use in the salmonid genera Coregonus and Salvelinus: Ontogenic niche shifts and polymorphism
1991 Nina Jonsson Dr. philos Zoology
Aspects of migration and spawning in salmonids
1991 Atle Bones Dr. scient Botany
Compartmentation and molecular properties of thioglucoside glucohydrolase (myrosinase)
1992 Torgrim Breiehagen Dr. scient Zoology
Mating behaviour and evolutionary aspects of the breeding system of two bird species: the Temminck's stint and the Pied flycatcher
1992 Anne Kjersti Bakken Dr. scient Botany
The influence of photoperiod on nitrate assimilation and nitrogen status in timothy (Phleum pratense L.)
1992 Tycho Anker-Nilssen Dr. scient Zoology
Food supply as a determinant of reproduction and population development in Norwegian Puffins Fratercula arctica
1992 Bjørn Munro Jenssen Dr. philos Zoology
Thermoregulation in aquatic birds in air and water: With special emphasis on the effects of crude oil, chemically treated oil and cleaning on the thermal balance of ducks
1992 Arne Vollan Aarset Dr. philos Zoology
The ecophysiology of under-ice fauna: Osmotic regulation, low temperature tolerance and metabolism in polar crustaceans.
1993 Geir Slupphaug Dr. scient Botany
Regulation and expression of uracil-DNA glycosylase and O6-methylguanine-DNA methyltransferase in mammalian cells
1993 Tor Fredrik Næsje Dr. scient Zoology
Habitat shifts in coregonids.
1993 Yngvar Asbjørn Olsen
Dr. scient Zoology
Cortisol dynamics in Atlantic salmon, Salmo salar L.: Basal and stressor-induced variations in plasma levels and some secondary effects.
1993 Bård Pedersen Dr. scient Botany
Theoretical studies of life history evolution in modular and clonal organisms
1993 Ole Petter Thangstad Dr. scient Botany
Molecular studies of myrosinase in Brassicaceae
1993 Thrine L. M. Heggberget
Dr. scient Zoology
Reproductive strategy and feeding ecology of the Eurasian otter Lutra lutra.
1993 Kjetil Bevanger Dr. scient Zoology
Avian interactions with utility structures, a biological approach.
1993 Kåre Haugan Dr. scient Botany
Mutations in the replication control gene trfA of the broad host-range plasmid RK2
1994 Peder Fiske Dr. scient Zoology
Sexual selection in the lekking great snipe (Gallinago media): Male mating success and female behaviour at the lek
1994 Kjell Inge Reitan Dr. scient Botany
Nutritional effects of algae in first-feeding of marine fish larvae
1994 Nils Røv Dr. scient Zoology
Breeding distribution, population status and regulation of breeding numbers in the northeast-Atlantic Great Cormorant Phalacrocorax carbo carbo
1994 Annette-Susanne Hoepfner
Dr. scient Botany
Tissue culture techniques in propagation and breeding of Red Raspberry (Rubus idaeus L.)
1994 Inga Elise Bruteig Dr. scient Botany
Distribution, ecology and biomonitoring studies of epiphytic lichens on conifers
1994 Geir Johnsen Dr. scient Botany
Light harvesting and utilization in marine phytoplankton: Species-specific and photoadaptive responses
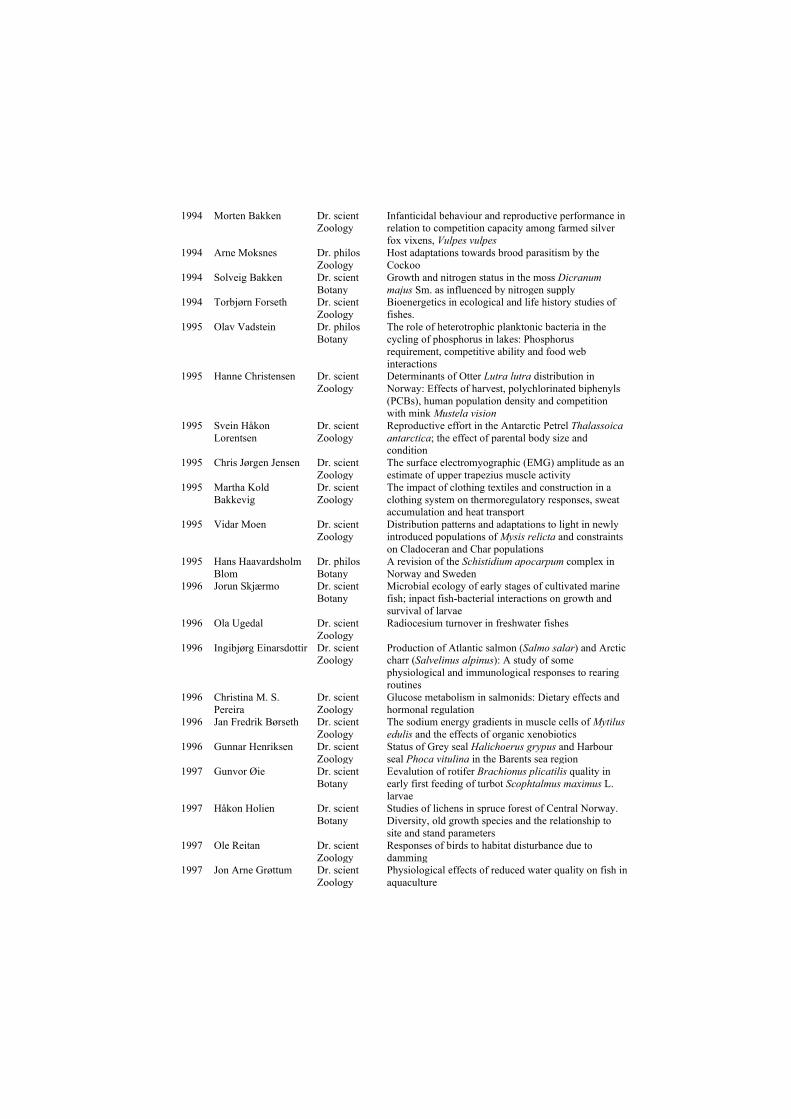
1994 Morten Bakken Dr. scient Zoology
Infanticidal behaviour and reproductive performance in relation to competition capacity among farmed silver fox vixens, Vulpes vulpes
1994 Arne Moksnes Dr. philos Zoology
Host adaptations towards brood parasitism by the Cockoo
1994 Solveig Bakken Dr. scient Botany
Growth and nitrogen status in the moss Dicranum majus Sm. as influenced by nitrogen supply
1994 Torbjørn Forseth Dr. scient Zoology
Bioenergetics in ecological and life history studies of fishes.
1995 Olav Vadstein Dr. philos Botany
The role of heterotrophic planktonic bacteria in the cycling of phosphorus in lakes: Phosphorus requirement, competitive ability and food web interactions
1995 Hanne Christensen Dr. scient Zoology
Determinants of Otter Lutra lutra distribution in Norway: Effects of harvest, polychlorinated biphenyls (PCBs), human population density and competition with mink Mustela vision
1995 Svein Håkon Lorentsen
Dr. scient Zoology
Reproductive effort in the Antarctic Petrel Thalassoica antarctica; the effect of parental body size and condition
1995 Chris Jørgen Jensen Dr. scient Zoology
The surface electromyographic (EMG) amplitude as an estimate of upper trapezius muscle activity
1995 Martha Kold Bakkevig
Dr. scient Zoology
The impact of clothing textiles and construction in a clothing system on thermoregulatory responses, sweat accumulation and heat transport
1995 Vidar Moen Dr. scient Zoology
Distribution patterns and adaptations to light in newly introduced populations of Mysis relicta and constraints on Cladoceran and Char populations
1995 Hans Haavardsholm Blom
Dr. philos Botany
A revision of the Schistidium apocarpum complex in Norway and Sweden
1996 Jorun Skjærmo Dr. scient Botany
Microbial ecology of early stages of cultivated marine fish; inpact fish-bacterial interactions on growth and survival of larvae
1996 Ola Ugedal Dr. scient Zoology
Radiocesium turnover in freshwater fishes
1996 Ingibjørg Einarsdottir Dr. scient Zoology
Production of Atlantic salmon (Salmo salar) and Arctic charr (Salvelinus alpinus): A study of some physiological and immunological responses to rearing routines
1996 Christina M. S. Pereira
Dr. scient Zoology
Glucose metabolism in salmonids: Dietary effects and hormonal regulation
1996 Jan Fredrik Børseth Dr. scient Zoology
The sodium energy gradients in muscle cells of Mytilus edulis and the effects of organic xenobiotics
1996 Gunnar Henriksen Dr. scient Zoology
Status of Grey seal Halichoerus grypus and Harbour seal Phoca vitulina in the Barents sea region
1997 Gunvor Øie Dr. scient Botany
Eevalution of rotifer Brachionus plicatilis quality in early first feeding of turbot Scophtalmus maximus L. larvae
1997 Håkon Holien Dr. scient Botany
Studies of lichens in spruce forest of Central Norway. Diversity, old growth species and the relationship to site and stand parameters
1997 Ole Reitan Dr. scient Zoology
Responses of birds to habitat disturbance due to damming
1997 Jon Arne Grøttum Dr. scient Zoology
Physiological effects of reduced water quality on fish in aquaculture

1997 Per Gustav Thingstad Dr. scient Zoology
Birds as indicators for studying natural and human-induced variations in the environment, with special emphasis on the suitability of the Pied Flycatcher
1997 Torgeir Nygård Dr. scient Zoology
Temporal and spatial trends of pollutants in birds in Norway: Birds of prey and Willow Grouse used as
1997 Signe Nybø Dr. scient Zoology
Impacts of long-range transported air pollution on birds with particular reference to the dipper Cinclus cinclus in southern Norway
1997 Atle Wibe Dr. scient Zoology
Identification of conifer volatiles detected by receptor neurons in the pine weevil (Hylobius abietis), analysed by gas chromatography linked to electrophysiology and to mass spectrometry
1997 Rolv Lundheim Dr. scient Zoology
Adaptive and incidental biological ice nucleators
1997 Arild Magne Landa Dr. scient Zoology
Wolverines in Scandinavia: ecology, sheep depredation and conservation
1997 Kåre Magne Nielsen Dr. scient Botany
An evolution of possible horizontal gene transfer from plants to sail bacteria by studies of natural transformation in Acinetobacter calcoacetius
1997 Jarle Tufto Dr. scient Zoology
Gene flow and genetic drift in geographically structured populations: Ecological, population genetic, and statistical models
1997 Trygve Hesthagen Dr. philos Zoology
Population responses of Arctic charr (Salvelinus alpinus (L.)) and brown trout (Salmo trutta L.) to acidification in Norwegian inland waters
1997 Trygve Sigholt Dr. philos Zoology
Control of Parr-smolt transformation and seawater tolerance in farmed Atlantic Salmon (Salmo salar) Effects of photoperiod, temperature, gradual seawater acclimation, NaCl and betaine in the diet
1997 Jan Østnes Dr. scient Zoology
Cold sensation in adult and neonate birds
1998 Seethaledsumy Visvalingam
Dr. scient Botany
Influence of environmental factors on myrosinases and myrosinase-binding proteins
1998 Thor Harald Ringsby Dr. scient Zoology
Variation in space and time: The biology of a House sparrow metapopulation
1998 Erling Johan Solberg Dr. scient Zoology
Variation in population dynamics and life history in a Norwegian moose (Alces alces) population: consequences of harvesting in a variable environment
1998 Sigurd Mjøen Saastad
Dr. scient Botany
Species delimitation and phylogenetic relationships between the Sphagnum recurvum complex (Bryophyta): genetic variation and phenotypic plasticity
1998 Bjarte Mortensen Dr. scient Botany
Metabolism of volatile organic chemicals (VOCs) in a head liver S9 vial equilibration system in vitro
1998 Gunnar Austrheim Dr. scient Botany
Plant biodiversity and land use in subalpine grasslands. – A conservation biological approach
1998 Bente Gunnveig Berg Dr. scient Zoology
Encoding of pheromone information in two related moth species
1999 Kristian Overskaug Dr. scient Zoology
Behavioural and morphological characteristics in Northern Tawny Owls Strix aluco: An intra- and interspecific comparative approach
1999 Hans Kristen Stenøien
Dr. scient Botany
Genetic studies of evolutionary processes in various populations of nonvascular plants (mosses, liverworts and hornworts)
1999 Trond Arnesen Dr. scient Botany
Vegetation dynamics following trampling and burning in the outlying haylands at Sølendet, Central Norway

1999 Ingvar Stenberg Dr. scient Zoology
Habitat selection, reproduction and survival in the White-backed Woodpecker Dendrocopos leucotos
1999 Stein Olle Johansen Dr. scient Botany
A study of driftwood dispersal to the Nordic Seas by dendrochronology and wood anatomical analysis
1999 Trina Falck Galloway Dr. scient Zoology
Muscle development and growth in early life stages of the Atlantic cod (Gadus morhua L.) and Halibut (Hippoglossus hippoglossus L.)
1999 Marianne Giæver Dr. scient Zoology
Population genetic studies in three gadoid species: blue whiting (Micromisistius poutassou), haddock (Melanogrammus aeglefinus) and cod (Gadus morhua) in the North-East Atlantic
1999 Hans Martin Hanslin Dr. scient Botany
The impact of environmental conditions of density dependent performance in the boreal forest bryophytes Dicranum majus, Hylocomium splendens, Plagiochila asplenigides, Ptilium crista-castrensis and Rhytidiadelphus lokeus
1999 Ingrid Bysveen Mjølnerød
Dr. scient Zoology
Aspects of population genetics, behaviour and performance of wild and farmed Atlantic salmon (Salmo salar) revealed by molecular genetic techniques
1999 Else Berit Skagen Dr. scient Botany
The early regeneration process in protoplasts from Brassica napus hypocotyls cultivated under various g-forces
1999 Stein-Are Sæther Dr. philos Zoology
Mate choice, competition for mates, and conflicts of interest in the Lekking Great Snipe
1999 Katrine Wangen Rustad
Dr. scient Zoology
Modulation of glutamatergic neurotransmission related to cognitive dysfunctions and Alzheimer’s disease
1999 Per Terje Smiseth Dr. scient Zoology
Social evolution in monogamous families:
1999 Gunnbjørn Bremset Dr. scient Zoology
Young Atlantic salmon (Salmo salar L.) and Brown trout (Salmo trutta L.) inhabiting the deep pool habitat, with special reference to their habitat use, habitat preferences and competitive interactions
1999 Frode Ødegaard Dr. scient Zoology
Host specificity as a parameter in estimates of arthropod species richness
1999 Sonja Andersen Dr. scient Zoology
Expressional and functional analyses of human, secretory phospholipase A2
2000 Ingrid Salvesen Dr. scient Botany
Microbial ecology in early stages of marine fish: Development and evaluation of methods for microbial management in intensive larviculture
2000 Ingar Jostein Øien Dr. scient Zoology
The Cuckoo (Cuculus canorus) and its host: adaptions and counteradaptions in a coevolutionary arms race
2000 Pavlos Makridis Dr. scient Botany
Methods for the microbial control of live food used for the rearing of marine fish larvae
2000 Sigbjørn Stokke Dr. scient Zoology
Sexual segregation in the African elephant (Loxodonta africana)
2000 Odd A. Gulseth Dr. philos Zoology
Seawater tolerance, migratory behaviour and growth of Charr, (Salvelinus alpinus), with emphasis on the high Arctic Dieset charr on Spitsbergen, Svalbard
2000 Pål A. Olsvik Dr. scient Zoology
Biochemical impacts of Cd, Cu and Zn on brown trout (Salmo trutta) in two mining-contaminated rivers in Central Norway
2000 Sigurd Einum Dr. scient Zoology
Maternal effects in fish: Implications for the evolution of breeding time and egg size
2001 Jan Ove Evjemo Dr. scient Zoology
Production and nutritional adaptation of the brine shrimp Artemia sp. as live food organism for larvae of marine cold water fish species

2001 Olga Hilmo Dr. scient Botany
Lichen response to environmental changes in the managed boreal forest systems
2001 Ingebrigt Uglem Dr. scient Zoology
Male dimorphism and reproductive biology in corkwing wrasse (Symphodus melops L.)
2001 Bård Gunnar Stokke Dr. scient Zoology
Coevolutionary adaptations in avian brood parasites and their hosts
2002 Ronny Aanes Dr. scient Zoology
Spatio-temporal dynamics in Svalbard reindeer (Rangifer tarandus platyrhynchus)
2002 Mariann Sandsund Dr. scient Zoology
Exercise- and cold-induced asthma. Respiratory and thermoregulatory responses
2002 Dag-Inge Øien Dr. scient Botany
Dynamics of plant communities and populations in boreal vegetation influenced by scything at Sølendet, Central Norway
2002 Frank Rosell Dr. scient Zoology
The function of scent marking in beaver (Castor fiber)
2002 Janne Østvang Dr. scient Botany
The Role and Regulation of Phospholipase A2 in Monocytes During Atherosclerosis Development
2002 Terje Thun Dr. philos Biology
Dendrochronological constructions of Norwegian conifer chronologies providing dating of historical material
2002 Birgit Hafjeld Borgen Dr. scient Biology
Functional analysis of plant idioblasts (Myrosin cells) and their role in defense, development and growth
2002 Bård Øyvind Solberg Dr. scient Biology
Effects of climatic change on the growth of dominating tree species along major environmental gradients
2002 Per Winge Dr. scient Biology
The evolution of small GTP binding proteins in cellular organisms. Studies of RAC GTPases in Arabidopsis thaliana and the Ral GTPase from Drosophila melanogaster
2002 Henrik Jensen Dr. scient Biology
Causes and consequences of individual variation in fitness-related traits in house sparrows
2003 Jens Rohloff Dr. philos Biology
Cultivation of herbs and medicinal plants in Norway – Essential oil production and quality control
2003 Åsa Maria O. Espmark Wibe
Dr. scient Biology
Behavioural effects of environmental pollution in threespine stickleback Gasterosteus aculeatur L.
2003 Dagmar Hagen Dr. scient Biology
Assisted recovery of disturbed arctic and alpine vegetation – an integrated approach
2003 Bjørn Dahle Dr. scient Biology
Reproductive strategies in Scandinavian brown bears
2003 Cyril Lebogang Taolo
Dr. scient Biology
Population ecology, seasonal movement and habitat use of the African buffalo (Syncerus caffer) in Chobe National Park, Botswana
2003 Marit Stranden Dr. scient Biology
Olfactory receptor neurones specified for the same odorants in three related Heliothine species (Helicoverpa armigera, Helicoverpa assulta and Heliothis virescens)
2003 Kristian Hassel Dr. scient Biology
Life history characteristics and genetic variation in an expanding species, Pogonatum dentatum
2003 David Alexander Rae Dr. scient Biology
Plant- and invertebrate-community responses to species interaction and microclimatic gradients in alpine and Artic environments
2003 Åsa A Borg Dr. scient Biology
Sex roles and reproductive behaviour in gobies and guppies: a female perspective
2003 Eldar Åsgard Bendiksen
Dr. scient Biology
Environmental effects on lipid nutrition of farmed Atlantic salmon (Salmo salar L.) parr and smolt
2004 Torkild Bakken Dr. scient Biology
A revision of Nereidinae (Polychaeta, Nereididae)
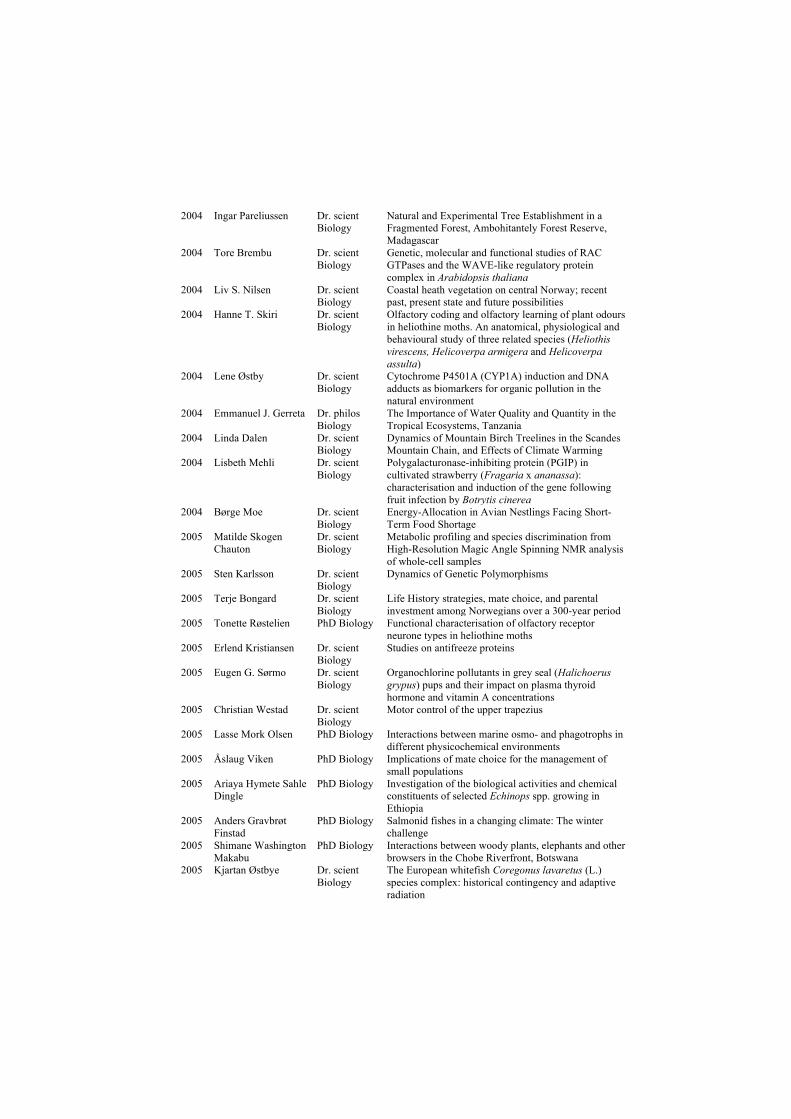
2004 Ingar Pareliussen Dr. scient Biology
Natural and Experimental Tree Establishment in a Fragmented Forest, Ambohitantely Forest Reserve, Madagascar
2004 Tore Brembu Dr. scient Biology
Genetic, molecular and functional studies of RAC GTPases and the WAVE-like regulatory protein complex in Arabidopsis thaliana
2004 Liv S. Nilsen Dr. scient Biology
Coastal heath vegetation on central Norway; recent past, present state and future possibilities
2004 Hanne T. Skiri Dr. scient Biology
Olfactory coding and olfactory learning of plant odours in heliothine moths. An anatomical, physiological and behavioural study of three related species (Heliothis virescens, Helicoverpa armigera and Helicoverpa assulta)
2004 Lene Østby Dr. scient Biology
Cytochrome P4501A (CYP1A) induction and DNA adducts as biomarkers for organic pollution in the natural environment
2004 Emmanuel J. Gerreta Dr. philos Biology
The Importance of Water Quality and Quantity in the Tropical Ecosystems, Tanzania
2004 Linda Dalen Dr. scient Biology
Dynamics of Mountain Birch Treelines in the Scandes Mountain Chain, and Effects of Climate Warming
2004 Lisbeth Mehli Dr. scient Biology
Polygalacturonase-inhibiting protein (PGIP) in cultivated strawberry (Fragaria x ananassa): characterisation and induction of the gene following fruit infection by Botrytis cinerea
2004 Børge Moe Dr. scient Biology
Energy-Allocation in Avian Nestlings Facing Short-Term Food Shortage
2005 Matilde Skogen Chauton
Dr. scient Biology
Metabolic profiling and species discrimination from High-Resolution Magic Angle Spinning NMR analysis of whole-cell samples
2005 Sten Karlsson Dr. scient Biology
Dynamics of Genetic Polymorphisms
2005 Terje Bongard Dr. scient Biology
Life History strategies, mate choice, and parental investment among Norwegians over a 300-year period
2005 Tonette Røstelien PhD Biology Functional characterisation of olfactory receptor neurone types in heliothine moths
2005 Erlend Kristiansen Dr. scient Biology
Studies on antifreeze proteins
2005 Eugen G. Sørmo Dr. scient Biology
Organochlorine pollutants in grey seal (Halichoerus grypus) pups and their impact on plasma thyroid hormone and vitamin A concentrations
2005 Christian Westad Dr. scient Biology
Motor control of the upper trapezius
2005 Lasse Mork Olsen PhD Biology Interactions between marine osmo- and phagotrophs in different physicochemical environments
2005 Åslaug Viken PhD Biology Implications of mate choice for the management of small populations
2005 Ariaya Hymete Sahle Dingle
PhD Biology Investigation of the biological activities and chemical constituents of selected Echinops spp. growing in Ethiopia
2005 Anders Gravbrøt Finstad
PhD Biology Salmonid fishes in a changing climate: The winter challenge
2005 Shimane Washington Makabu
PhD Biology Interactions between woody plants, elephants and other browsers in the Chobe Riverfront, Botswana
2005 Kjartan Østbye Dr. scient Biology
The European whitefish Coregonus lavaretus (L.) species complex: historical contingency and adaptive radiation
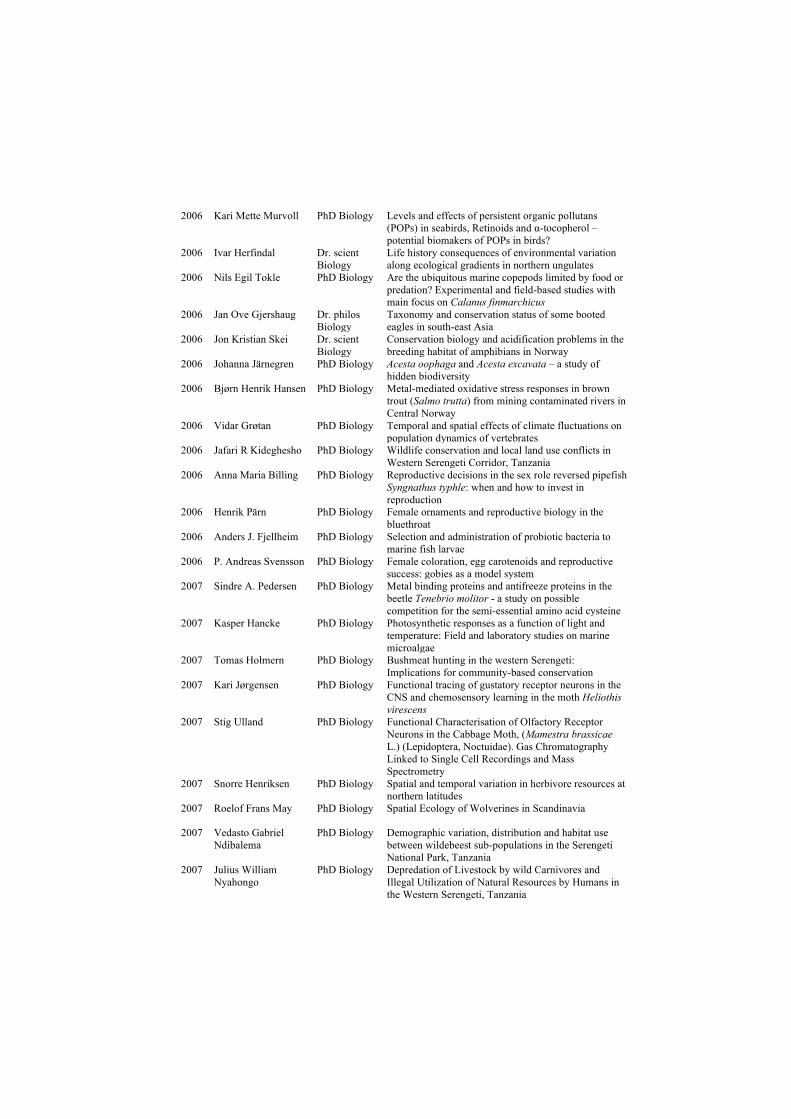
2006 Kari Mette Murvoll PhD Biology Levels and effects of persistent organic pollutans (POPs) in seabirds, Retinoids and α-tocopherol – potential biomakers of POPs in birds?
2006 Ivar Herfindal Dr. scient Biology
Life history consequences of environmental variation along ecological gradients in northern ungulates
2006 Nils Egil Tokle PhD Biology Are the ubiquitous marine copepods limited by food or predation? Experimental and field-based studies with main focus on Calanus finmarchicus
2006 Jan Ove Gjershaug Dr. philos Biology
Taxonomy and conservation status of some booted eagles in south-east Asia
2006 Jon Kristian Skei Dr. scient Biology
Conservation biology and acidification problems in the breeding habitat of amphibians in Norway
2006 Johanna Järnegren PhD Biology Acesta oophaga and Acesta excavata – a study of hidden biodiversity
2006 Bjørn Henrik Hansen PhD Biology Metal-mediated oxidative stress responses in brown trout (Salmo trutta) from mining contaminated rivers in Central Norway
2006 Vidar Grøtan PhD Biology Temporal and spatial effects of climate fluctuations on population dynamics of vertebrates
2006 Jafari R Kideghesho PhD Biology Wildlife conservation and local land use conflicts in Western Serengeti Corridor, Tanzania
2006 Anna Maria Billing PhD Biology Reproductive decisions in the sex role reversed pipefish Syngnathus typhle: when and how to invest in reproduction
2006 Henrik Pärn PhD Biology Female ornaments and reproductive biology in the bluethroat
2006 Anders J. Fjellheim PhD Biology Selection and administration of probiotic bacteria to marine fish larvae
2006 P. Andreas Svensson PhD Biology Female coloration, egg carotenoids and reproductive success: gobies as a model system
2007 Sindre A. Pedersen PhD Biology Metal binding proteins and antifreeze proteins in the beetle Tenebrio molitor - a study on possible competition for the semi-essential amino acid cysteine
2007 Kasper Hancke PhD Biology Photosynthetic responses as a function of light and temperature: Field and laboratory studies on marine microalgae
2007 Tomas Holmern PhD Biology Bushmeat hunting in the western Serengeti: Implications for community-based conservation
2007 Kari Jørgensen PhD Biology Functional tracing of gustatory receptor neurons in the CNS and chemosensory learning in the moth Heliothis virescens
2007 Stig Ulland PhD Biology Functional Characterisation of Olfactory Receptor Neurons in the Cabbage Moth, (Mamestra brassicae L.) (Lepidoptera, Noctuidae). Gas Chromatography Linked to Single Cell Recordings and Mass Spectrometry
2007 Snorre Henriksen PhD Biology Spatial and temporal variation in herbivore resources at northern latitudes
2007 Roelof Frans May PhD Biology Spatial Ecology of Wolverines in Scandinavia
2007 Vedasto Gabriel Ndibalema
PhD Biology Demographic variation, distribution and habitat use between wildebeest sub-populations in the Serengeti National Park, Tanzania
2007 Julius William Nyahongo
PhD Biology Depredation of Livestock by wild Carnivores and Illegal Utilization of Natural Resources by Humans in the Western Serengeti, Tanzania

2007 Shombe Ntaraluka Hassan
PhD Biology Effects of fire on large herbivores and their forage resources in Serengeti, Tanzania
2007 Per-Arvid Wold PhD Biology Functional development and response to dietary treatment in larval Atlantic cod (Gadus morhua L.) Focus on formulated diets and early weaning
2007 Anne Skjetne Mortensen
PhD Biology Toxicogenomics of Aryl Hydrocarbon- and Estrogen Receptor Interactions in Fish: Mechanisms and Profiling of Gene Expression Patterns in Chemical Mixture Exposure Scenarios
2008 Brage Bremset Hansen
PhD Biology The Svalbard reindeer (Rangifer tarandus platyrhynchus) and its food base: plant-herbivore interactions in a high-arctic ecosystem
2008 Jiska van Dijk PhD Biology Wolverine foraging strategies in a multiple-use landscape
2008 Flora John Magige PhD Biology The ecology and behaviour of the Masai Ostrich (Struthio camelus massaicus) in the Serengeti Ecosystem, Tanzania
2008 Bernt Rønning PhD Biology Sources of inter- and intra-individual variation in basal metabolic rate in the zebra finch, Taeniopygia guttata
2008 Sølvi Wehn PhD Biology Biodiversity dynamics in semi-natural mountain landscapes - A study of consequences of changed agricultural practices in Eastern Jotunheimen
2008 Trond Moxness Kortner
PhD Biology The Role of Androgens on previtellogenic oocyte growth in Atlantic cod (Gadus morhua): Identification and patterns of differentially expressed genes in relation to Stereological Evaluations
2008 Katarina Mariann Jørgensen
Dr. scient Biology
The role of platelet activating factor in activation of growth arrested keratinocytes and re-epithelialisation
2008 Tommy Jørstad PhD Biology Statistical Modelling of Gene Expression Data
2008 Anna Kusnierczyk PhD Biology Arabidopsis thaliana Responses to Aphid Infestation
2008 Jussi Evertsen PhD Biology Herbivore sacoglossans with photosynthetic chloroplasts
2008 John Eilif Hermansen PhD Biology Mediating ecological interests between locals and globals by means of indicators. A study attributed to the asymmetry between stakeholders of tropical forest at Mt. Kilimanjaro, Tanzania
2008 Ragnhild Lyngved PhD Biology Somatic embryogenesis in Cyclamen persicum. Biological investigations and educational aspects of cloning
2008 Line Elisabeth Sundt-Hansen
PhD Biology Cost of rapid growth in salmonid fishes
2008 Line Johansen PhD Biology Exploring factors underlying fluctuations in white clover populations – clonal growth, population structure and spatial distribution
2009 Astrid Jullumstrø Feuerherm
PhD Biology Elucidation of molecular mechanisms for pro-inflammatory phospholipase A2 in chronic disease
2009 Pål Kvello PhD Biology Neurons forming the network involved in gustatory coding and learning in the moth Heliothis virescens: Physiological and morphological characterisation, and integration into a standard brain atlas
2009 Trygve Devold Kjellsen
PhD Biology Extreme Frost Tolerance in Boreal Conifers
2009 Johan Reinert Vikan PhD Biology Coevolutionary interactions between common cuckoos Cuculus canorus and Fringilla finches
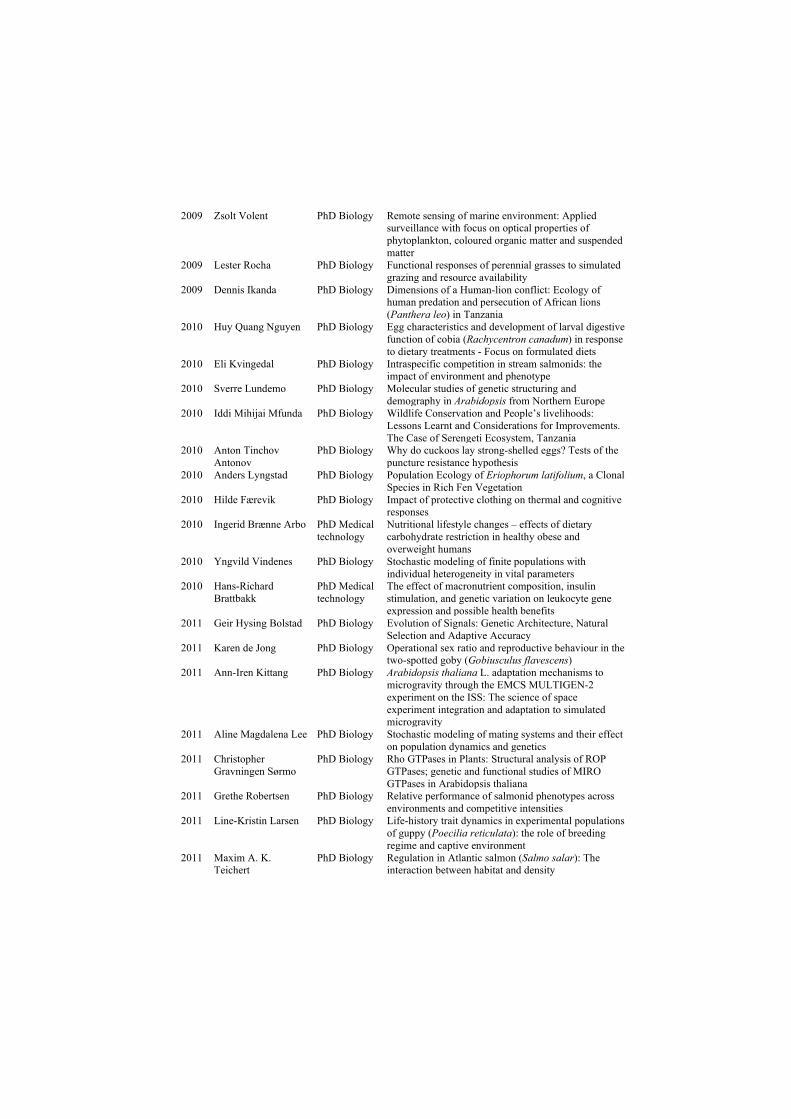
2009 Zsolt Volent PhD Biology Remote sensing of marine environment: Applied surveillance with focus on optical properties of phytoplankton, coloured organic matter and suspended matter
2009 Lester Rocha PhD Biology Functional responses of perennial grasses to simulated grazing and resource availability
2009 Dennis Ikanda PhD Biology Dimensions of a Human-lion conflict: Ecology of human predation and persecution of African lions (Panthera leo) in Tanzania
2010 Huy Quang Nguyen PhD Biology Egg characteristics and development of larval digestive function of cobia (Rachycentron canadum) in response to dietary treatments - Focus on formulated diets
2010 Eli Kvingedal PhD Biology Intraspecific competition in stream salmonids: the impact of environment and phenotype
2010 Sverre Lundemo PhD Biology Molecular studies of genetic structuring and demography in Arabidopsis from Northern Europe
2010 Iddi Mihijai Mfunda PhD Biology Wildlife Conservation and People’s livelihoods: Lessons Learnt and Considerations for Improvements. The Case of Serengeti Ecosystem, Tanzania
2010 Anton Tinchov Antonov
PhD Biology Why do cuckoos lay strong-shelled eggs? Tests of the puncture resistance hypothesis
2010 Anders Lyngstad PhD Biology Population Ecology of Eriophorum latifolium, a Clonal Species in Rich Fen Vegetation
2010 Hilde Færevik PhD Biology Impact of protective clothing on thermal and cognitive responses
2010 Ingerid Brænne Arbo PhD Medical technology
Nutritional lifestyle changes – effects of dietary carbohydrate restriction in healthy obese and overweight humans
2010 Yngvild Vindenes PhD Biology Stochastic modeling of finite populations with individual heterogeneity in vital parameters
2010 Hans-Richard Brattbakk
PhD Medical technology
The effect of macronutrient composition, insulin stimulation, and genetic variation on leukocyte gene expression and possible health benefits
2011 Geir Hysing Bolstad PhD Biology Evolution of Signals: Genetic Architecture, Natural Selection and Adaptive Accuracy
2011 Karen de Jong PhD Biology Operational sex ratio and reproductive behaviour in the two-spotted goby (Gobiusculus flavescens)
2011 Ann-Iren Kittang PhD Biology Arabidopsis thaliana L. adaptation mechanisms to microgravity through the EMCS MULTIGEN-2 experiment on the ISS: The science of space experiment integration and adaptation to simulated microgravity
2011 Aline Magdalena Lee PhD Biology Stochastic modeling of mating systems and their effect on population dynamics and genetics
2011 Christopher Gravningen Sørmo
PhD Biology Rho GTPases in Plants: Structural analysis of ROP GTPases; genetic and functional studies of MIRO GTPases in Arabidopsis thaliana
2011 Grethe Robertsen PhD Biology Relative performance of salmonid phenotypes across environments and competitive intensities
2011 Line-Kristin Larsen PhD Biology Life-history trait dynamics in experimental populations of guppy (Poecilia reticulata): the role of breeding regime and captive environment
2011 Maxim A. K. Teichert
PhD Biology Regulation in Atlantic salmon (Salmo salar): The interaction between habitat and density

2011 Torunn Beate Hancke PhD Biology Use of Pulse Amplitude Modulated (PAM) Fluorescence and Bio-optics for Assessing Microalgal Photosynthesis and Physiology
2011 Sajeda Begum PhD Biology Brood Parasitism in Asian Cuckoos: Different Aspects of Interactions between Cuckoos and their Hosts in Bangladesh
2011 Kari J. K. Attramadal PhD Biology Water treatment as an approach to increase microbial control in the culture of cold water marine larvae
2011 Camilla Kalvatn Egset
PhD Biology The Evolvability of Static Allometry: A Case Study
2011 AHM Raihan Sarker PhD Biology Conflict over the conservation of the Asian elephant (Elephas maximus) in Bangladesh
2011 Gro Dehli Villanger PhD Biology Effects of complex organohalogen contaminant mixtures on thyroid hormone homeostasis in selected arctic marine mammals
2011 Kari Bjørneraas PhD Biology Spatiotemporal variation in resource utilisation by a large herbivore, the moose
2011 John Odden PhD Biology The ecology of a conflict: Eurasian lynx depredation on domestic sheep
2011 Simen Pedersen PhD Biology Effects of native and introduced cervids on small mammals and birds
2011 Mohsen Falahati-Anbaran
PhD Biology Evolutionary consequences of seed banks and seed dispersal in Arabidopsis
2012 Jakob Hønborg Hansen
PhD Biology Shift work in the offshore vessel fleet: circadian rhythms and cognitive performance
2012 Elin Noreen PhD Biology Consequences of diet quality and age on life-history traits in a small passerine bird
2012 Irja Ida Ratikainen PhD Biology Foraging in a variable world: adaptations to stochasticity
2012 Aleksander Handå PhD Biology Cultivation of mussels (Mytilus edulis): Feed requirements, storage and integration with salmon (Salmo salar) farming
2012 Morten Kraabøl PhD Biology Reproductive and migratory challenges inflicted on migrant brown trout (Salmo trutta L.) in a heavily modified river
2012 Jisca Huisman PhD Biology Gene flow and natural selection in Atlantic salmon
2012 Maria Bergvik PhD Biology Lipid and astaxanthin contents and biochemical post-harvest stability in Calanus finmarchicus
2012 Bjarte Bye Løfaldli PhD Biology Functional and morphological characterization of central olfactory neurons in the model insect Heliothis virescens.
2012 Karen Marie Hammer
PhD Biology Acid-base regulation and metabolite responses in shallow- and deep-living marine invertebrates during environmental hypercapnia
2012 Øystein Nordrum Wiggen
PhD Biology Optimal performance in the cold
2012 Robert Dominikus Fyumagwa
Dr. Philos Biology
Anthropogenic and natural influence on disease prevalence at the human –livestock-wildlife interface in the Serengeti ecosystem, Tanzania
2012 Jenny Bytingsvik PhD Biology Organohalogenated contaminants (OHCs) in polar bear mother-cub pairs from Svalbard, Norway. Maternal transfer, exposure assessment and thyroid hormone disruptive effects in polar bear cubs
2012 Christer Moe Rolandsen
PhD Biology The ecological significance of space use and movement patterns of moose in a variable environment
2012 Erlend Kjeldsberg Hovland
PhD Biology Bio-optics and Ecology in Emiliania huxleyi Blooms: Field and Remote Sensing Studies in Norwegian Waters
2012 Lise Cats Myhre PhD Biology Effects of the social and physical environment on mating behaviour in a marine fish
2012 Tonje Aronsen PhD Biology Demographic, environmental and evolutionary aspects of sexual selection
2012 Bin Liu PhD Biology Molecular genetic investigation of cell separation and cell death regulation in Arabidopsis thaliana
2013 Jørgen Rosvold PhD Biology Ungulates in a dynamic and increasingly human dominated landscape – A millennia-scale perspective
2013 Pankaj Barah PhD Biology Integrated Systems Approaches to Study Plant Stress Responses
2013 Marit Linnerud PhD Biology Patterns in spatial and temporal variation in population abundances of vertebrates
2013 Xinxin Wang PhD Biology Integrated multi-trophic aquaculture driven by nutrient wastes released from Atlantic salmon (Salmo salar) farming
2013 Ingrid Ertshus Mathisen
PhD Biology Structure, dynamics, and regeneration capacity at the sub-arctic forest-tundra ecotone of northern Norway and Kola Peninsula, NW Russia
2013 Anders Foldvik PhD Biology Spatial distributions and productivity in salmonid populations
2013 Anna Marie Holand PhD Biology Statistical methods for estimating intra- and inter-population variation in genetic diversity
2013 Anna Solvang Båtnes PhD Biology Light in the dark – the role of irradiance in the high Arctic marine ecosystem during polar night
2013 Sebastian Wacker PhD Biology The dynamics of sexual selection: effects of OSR, density and resource competition in a fish
2013 Cecilie Miljeteig PhD Biology Phototaxis in Calanus finmarchicus – light sensitivity and the influence of energy reserves and oil exposure
2013 Ane Kjersti Vie PhD Biology Molecular and functional characterisation of the IDA family of signalling peptides in Arabidopsis thaliana
2013 Marianne Nymark PhD Biology Light responses in the marine diatom Phaeodactylum tricornutum
2014 Jannik Schultner PhD Biology Resource Allocation under Stress - Mechanisms and Strategies in a Long-Lived Bird
2014 Craig Ryan Jackson PhD Biology Factors influencing African wild dog (Lycaon pictus) habitat selection and ranging behaviour: conservation and management implications
2014 Aravind Venkatesan PhD Biology Application of Semantic Web Technology to establish knowledge management and discovery in the Life Sciences
2014 Kristin Collier Valle PhD Biology Photoacclimation mechanisms and light responses in marine micro- and macroalgae
2014 Michael Puffer PhD Biology Effects of rapidly fluctuating water levels on juvenile Atlantic salmon (Salmo salar L.)
2014 Gundula S. Bartzke PhD Biology Effects of power lines on moose (Alces alces) habitat selection, movements and feeding activity
2014 Eirin Marie Bjørkvoll PhD Biology Life-history variation and stochastic population dynamics in vertebrates
2014 Håkon Holand PhD Biology The parasite Syngamus trachea in a metapopulation of house sparrows
2014 Randi Magnus Sommerfelt
PhD Biology Molecular mechanisms of inflammation – a central role for cytosolic phospholiphase A2
2014 Espen Lie Dahl PhD Biology Population demographics in white-tailed eagle at an on-shore wind farm area in coastal Norway
2014 Anders Øverby PhD Biology Functional analysis of the action of plant isothiocyanates: cellular mechanisms and in vivo role in plants, and anticancer activity
2014 Kamal Prasad Acharya
PhD Biology Invasive species: Genetics, characteristics and trait variation along a latitudinal gradient.
2014 Ida Beathe Øverjordet
PhD Biology Element accumulation and oxidative stress variables in Arctic pelagic food chains: Calanus, little auks (Alle alle) and black-legged kittiwakes (Rissa tridactyla)
2014 Kristin Møller Gabrielsen
PhD Biology Target tissue toxicity of the thyroid hormone system in two species of arctic mammals carrying high loads of organohalogen contaminants
2015 Gine Roll Skjervø Dr. philos Biology
Testing behavioral ecology models with historical individual-based human demographic data from Norway
2015 Nils Erik Gustaf Forsberg
PhD Biology Spatial and Temporal Genetic Structure in Landrace Cereals
2015 Leila Alipanah PhD Biology Integrated analyses of nitrogen and phosphorus deprivation in the diatoms Phaeodactylum tricornutum and Seminavis robusta
2015 Javad Najafi PhD Biology Molecular investigation of signaling components in sugar sensing and defense in Arabidopsis thaliana
2015 Bjørnar Sporsheim PhD Biology Quantitative confocal laser scanning microscopy: optimization of in vivo and in vitro analysis of intracellular transport
2015 Magni Olsen Kyrkjeeide
PhD Biology Genetic variation and structure in peatmosses (Sphagnum)
2015 Keshuai Li PhD Biology Phospholipids in Atlantic cod (Gadus morhua L.) larvae rearing: Incorporation of DHA in live feed and larval phospholipids and the metabolic capabilities of larvae for the de novo synthesis
2015 Ingvild Fladvad Størdal
PhD Biology The role of the copepod Calanus finmarchicus in affecting the fate of marine oil spills
2016 Thomas Kvalnes PhD Biology Evolution by natural selection in age-structured populations in fluctuating environments
2016 Øystein Leiknes PhD Biology The effect of nutrition on important life-history traits in the marine copepod Calanus finmarchicus
2016 Johan Henrik Hårdensson Berntsen
PhD Biology Individual variation in survival: The effect of incubation temperature on the rate of physiological ageing in a small passerine bird
2016 Marianne Opsahl Olufsen
PhD Biology Multiple environmental stressors: Biological interactions between parameters of climate change and perfluorinated alkyl substances in fish
2016 Rebekka Varne PhD Biology Tracing the fate of escaped cod (Gadus morhua L.) in a Norwegian fjord system
2016 Anette Antonsen Fenstad
PhD Biology Pollutant Levels, Antioxidants and Potential Genotoxic Effects in Incubating Female Common Eiders (Somateria mollissima)
2016 Wilfred Njama Marealle
PhD Biology Ecology, Behaviour and Conservation Status of Masai Giraffe (Giraffa camelopardalis tippelskirchi) in Tanzania
2016 Ingunn Nilssen PhD Biology Integrated Enviromental Mapping and Monitoring: A Methodological approach for end users.
2017
Konika Chawla PhD Biology Discovering, analysing and taking care of knowledge.
2017 Øystein Hjorthol Opedal
PhD Biology The Evolution of Herkogamy: Pollinator Reliability, Natural Selection, and Trait Evolvability.
2017 Ane Marlene Myhre PhD Biology Effective size of density dependent populations in fluctuating environments
2017 Emmanuel Hosiana Masenga
PhD Biology Behavioural Ecology of Free-ranging and Reintroduced African Wild Dog (Lycaon pictus) Packs in the Serengeti Ecosystem, Tanzania
2017
Xiaolong Lin PhD Biology Systematics and evolutionary history of Tanytarsus van der Wulp, 1874 (Diptera: Chironomidae)
2017 Emmanuel Clamsen Mmassy
PhD Biology Ecology and Conservation Challenges of the Kori bustard in the Serengeti National Park
2017 Richard Daniel Lyamuya
PhD Biology Depredation of Livestock by Wild Carnivores in the Eastern Serengeti Ecosystem, Tanzania
2017 Katrin Hoydal PhD Biology Levels and endocrine disruptive effects of legacy POPs and their metabolites in long-finned pilot whales of the Faroe Islands
2017 Berit Glomstad PhD Biology Adsorption of phenanthrene to carbon nanotubes and its influence on phenanthrene bioavailability/toxicity in aquatic organism
2017 Øystein Nordeide Kielland
PhD Biology Sources of variation in metabolism of an aquatic ectotherm
2017 Narjes Yousefi PhD Biology Genetic divergence and speciation in northern peatmosses (Sphagnum)
2018 Signe Christensen-Dalgaard
PhD Biology Drivers of seabird spatial ecology - implications for development of offshore wind-power in Norway
2018 Janos Urbancsok PhD Biology Endogenous biological effects induced by externally supplemented glucosinolate hydrolysis products (GHPs) on Arabidopsis thaliana
2018 Alice Mühlroth PhD Biology The influence of phosphate depletion on lipid metabolism of microalgae
2018 Franco Peniel Mbise PhD Biology Human-Carnivore Coexistence and Conflict in the Eastern Serengeti, Tanzania
2018 Stine Svalheim Markussen
PhD Biology Causes and consequences of intersexual life history variation in a harvested herbivore population
2018 Mia Vedel Sørensen PhD Biology Carbon budget consequences of deciduous shrub expansion in alpine tundra ecosystems
2018 Hanna Maria Kauko PhD Biology Light response and acclimation of microalgae in a changing Arctic
2018 Erlend I. F. Fossen PhD Biology Trait evolvability: effects of thermal plasticity and genetic correlations among traits
2019 Peter Sjolte Ranke PhD Biology Demographic and genetic and consequences of dispersal in house sparrows
2019 Mathilde Le Moullec PhD Biology Spatiotemporal variation in abundance of key tundra species: from local heterogeneity to large-scale synchrony
2019 Endre Grüner Ofstad PhD Biology Causes and consequences of variation in resource use and social structure in ungulates
2019 Yang Jin PhD Biology Development of lipid metabolism in early life stage of Atlantic salmon (Salmo salar)
2019 Elena Albertsen PhD Biology Evolution of floral traits: from ecological contex to functional integration
2019
Mominul Islam Nahid
PhD Biology
Interaction between two Asian cuckoos and their hosts in Bangladesh
2019
2019
2019
2019
2019
2019
2019
2019
2019
2019
2020
2020
2020
Knut Jørgen Egelie Thomas Ray Haaland Kwaslema Malle Hariohay Mari Engvig Løseth Joseph Mbyati Mukeka Helene Løvstrand Svarva Nathalie Briels Anders L.Kolstad Bart Peeters Alex Kojo Datsomor Ingun Næve Rachael Morgan Mahsa Jalili
Phd Biology Phd Biology Phd Biology Phd Biology Phd Biology Phd Biology Phd Biology Phd Biology Phd Biology Phd Biology Phd Biology Phd Biology Phd Biology
Management of intellectual property in university-industry collaborations – public access to and control of knowledge Adaptive responses to enviromental stochasticity on different evolutionary time-scales Human wildlife interactions in the Ruaha-Rungwa Ecosystem, Central Tanzania Exposure and effects of emerging and legacy organic pollutants in white-tailed eagle (Haliaeetis albicilla) nestlings Human-Wildlife Conflicts and Compensation for Losses in Kenya: Dynamics, Characteristics and Correlates Dendroclimatology in southern Norway: tree rings, demography and climate Exposure and effects of legacy and emerging organic pollutants in developing birds – Laboratory and field studies Moose browsing effects on boreal production forests – implications for ecosystems and human society Population dynamics under climate change ad harvesting: Results from the high Arctic Svalbard reindeer The molecular basis of long chain polyunsaturated fatty acid (LC-PUFA) biosynthesis in Atlantic salmon (Salmo salar L): In vivo functions, functional redundancy and transcriptional regulation of LC-PUFA biosynthetic enzymes Development of non-invasive methods using ultrasound technology in monitoring of Atlantic salmon (Salmo Salar) production and reproduction Physiological plasticity and evolution of thermal performance in zebrafish Effects of different dietary ingredients on the immune responses and antioxidant status in Atlantic salmon (Salmo salar L.): possible nutriomics approaches