Demand for Grants 2020-21 Analysis - PRS India
12
Gayatri Mann [email protected] February 12, 2020 PRS Legislative Research Institute for Policy Research Studies 3 rd Floor, Gandharva Mahavidyalaya 212, Deen Dayal Upadhyaya Marg New Delhi – 110002 Tel: (011) 2323 4801, 4343 4035; www.prsindia.org Demand for Grants 2020-21 Analysis Human Resource Development The Ministry of Human Resource Development consists of two departments: (i) school education and literacy, and (ii) higher education. In 2020- 21, the Ministry has been allocated Rs 99,312 crore, the sixth highest allocation among all Ministries. The allocation constitutes 3% of the central government’s estimated expenditure for 2020-21. This note presents the trends in expenditure, and discusses some of the issues related to the education sector. The Department of School Education and Literacy under the Ministry is broadly responsible for education imparted between the ages of six to 18 years, i.e., school education. Under the Right to Education (RTE) Act, 2009 the government is mandated to provide elementary education to all children between six to 14 years of age. Secondary education is imparted between classes nine to 12 for children between 14-18 years of age. In 2020-21, this Department has been allocated Rs 59,845 crore, accounting for 60% of the Ministry’s total allocation. The Department of Higher Education is responsible for higher education, and training for students above 18 years of age. Higher education includes undergraduate and postgraduate courses, doctoral degrees, and certificates following the completion of 12 years of schooling or equivalent. In 2020-21, the Department has been allocated Rs 39,467 crore, accounting for 40% of the Ministry’s total allocation. Overview of finances Budget Estimates 2020-21 The Ministry has been allocated Rs 99,312 crore in 2020-21. This is a 4.7% increase over the revised estimate of 2019-20. 1 Table 1: Budget allocations for the MHRD (2020-21) (in Rs crore) Department Actuals 2018-19 RE 2019-20 BE 2020-21 % chang e (RE to BE) School Education & Literacy 48,441 56,537 59,845 5.9% Higher Education 31,904 38,317 39,467 3.0% Total 80,345 94,854 99,312 4.7% Note: BE – Budget Estimate; RE – Revised Estimates. Sources: Expenditure Budget, Ministry of Human Resource Development, 2020-21; PRS. Table 2 depicts the major heads under which the Ministry spends its funds (as a percentage of its total allocation). In 2020-21, expenditure on centrally sponsored schemes (Samagra Shiksha and Mid-Day Meal Programme in Schools) constitute 50% of the estimated spending of the Ministry. This is followed by expenditure towards autonomous bodies such as the Kendriya Vidyalaya Sangathan (9%) and grants to central universities (8%). Table 2: Top expenditure heads for the Ministry (2020-21) (in %) Expenditure head Allocation (%) Samagra Shiksha 39% Mid-Day Meal Programme 11% Autonomous Bodies 9% Grants to Central Universities 8% IITs 7% UGC and AICTE 5% Others 20% Total 100% Note: Autonomous Bodies include Kendriya Vidyalaya and Sangathan, Navodaya Vidyalaya Samiti. ‘Others’ includes other schemes and programmes under the Ministry each with an allocation of less than 5% of the total expenditure. Sources: Expenditure Budget, Vol. 2, Ministry of Human Resource Development, 2020-21; PRS. Budget speech highlights 2019-20 A new National Education Policy will be released. The new Policy proposes major changes in both school education and higher education. To ensure greater inflow of finance in education, steps will be taken to enable sourcing external commercial borrowings and Foreign Direct Investment in India. About 150 higher educational institutions will start apprenticeship embedded degree and diploma courses by March 2021. As part of the ‘Study in India’ which focuses on bringing foreign students to study in Indian higher educational institutions, the government will hold Ind- SAT in Asian and African countries.
-
Upload
khangminh22 -
Category
Documents
-
view
4 -
download
0
Transcript of Demand for Grants 2020-21 Analysis - PRS India

Gayatri Mann [email protected] February 12, 2020
PRS Legislative Research Institute for Policy Research Studies
3rd Floor, Gandharva Mahavidyalaya 212, Deen Dayal Upadhyaya Marg New Delhi – 110002
Tel: (011) 2323 4801, 4343 4035; www.prsindia.org
Demand for Grants 2020-21 Analysis
Human Resource Development The Ministry of Human Resource Development
consists of two departments: (i) school education
and literacy, and (ii) higher education. In 2020-
21, the Ministry has been allocated Rs 99,312
crore, the sixth highest allocation among all
Ministries. The allocation constitutes 3% of the
central government’s estimated expenditure for
2020-21. This note presents the trends in
expenditure, and discusses some of the issues
related to the education sector.
The Department of School Education and
Literacy under the Ministry is broadly responsible
for education imparted between the ages of six to
18 years, i.e., school education. Under the Right
to Education (RTE) Act, 2009 the government is
mandated to provide elementary education to all
children between six to 14 years of age.
Secondary education is imparted between classes
nine to 12 for children between 14-18 years of age.
In 2020-21, this Department has been allocated Rs
59,845 crore, accounting for 60% of the Ministry’s
total allocation.
The Department of Higher Education is
responsible for higher education, and training for
students above 18 years of age. Higher education
includes undergraduate and postgraduate courses,
doctoral degrees, and certificates following the
completion of 12 years of schooling or equivalent.
In 2020-21, the Department has been allocated Rs
39,467 crore, accounting for 40% of the Ministry’s
total allocation.
Overview of finances
Budget Estimates 2020-21
The Ministry has been allocated Rs 99,312 crore
in 2020-21. This is a 4.7% increase over the
revised estimate of 2019-20.1
Table 1: Budget allocations for the MHRD
(2020-21) (in Rs crore)
Department Actuals 2018-19
RE 2019-20
BE 2020-21
% change (RE to BE)
School Education & Literacy
48,441 56,537 59,845 5.9%
Higher Education
31,904 38,317 39,467 3.0%
Total 80,345 94,854 99,312 4.7% Note: BE – Budget Estimate; RE – Revised Estimates. Sources: Expenditure Budget, Ministry of Human Resource
Development, 2020-21; PRS.
Table 2 depicts the major heads under which the
Ministry spends its funds (as a percentage of its
total allocation). In 2020-21, expenditure on
centrally sponsored schemes (Samagra Shiksha
and Mid-Day Meal Programme in Schools)
constitute 50% of the estimated spending of the
Ministry. This is followed by expenditure towards
autonomous bodies such as the Kendriya
Vidyalaya Sangathan (9%) and grants to central
universities (8%).
Table 2: Top expenditure heads for the
Ministry (2020-21) (in %)
Expenditure head Allocation (%)
Samagra Shiksha 39%
Mid-Day Meal Programme 11%
Autonomous Bodies 9%
Grants to Central Universities 8%
IITs 7%
UGC and AICTE 5%
Others 20%
Total 100%
Note: Autonomous Bodies include Kendriya Vidyalaya and
Sangathan, Navodaya Vidyalaya Samiti.
‘Others’ includes other schemes and programmes under the
Ministry each with an allocation of less than 5% of the total
expenditure. Sources: Expenditure Budget, Vol. 2, Ministry of Human
Resource Development, 2020-21; PRS.
Budget speech highlights 2019-20
A new National Education Policy will be released. The new Policy proposes major changes in both school education and higher education.
To ensure greater inflow of finance in education, steps will be taken to enable sourcing external commercial borrowings and Foreign Direct Investment in India.
About 150 higher educational institutions will start apprenticeship embedded degree and diploma courses by March 2021.
As part of the ‘Study in India’ which focuses on bringing foreign students to study in Indian higher educational institutions, the government will hold Ind-SAT in Asian and African countries.

Demand for Grants 2020-21 Analysis: Human Resource Development PRS Legislative Research
February 12, 2020 - 2 -
Department of School Education and
Literacy
In 2020-21, the Department has been allocated Rs
59,845 crore, a 5.9% increase over the revised
estimates of 2019-20.1 Figure 1 shows the
allocation of the Department of School Education
and Literacy over the past 10 years (2010-20).
Figure 1: Allocation to Department of School
Education and Literacy (2010-20) (in Rs crore)
Note: Revised estimates have been used for 2019-20 and
Budget estimates for 2020-21.
Sources: Union Budgets, 2010-20; PRS.
Note that in 2015-16, the allocation was reduced
by 9%. Since then, the allocation has been on an
upward trajectory. Between 2010-11 and 2020-21,
allocation to the Department has grown at an
average annual rate of 5%. Table 3 compares
actual allocation of the Department with the
budget estimates. The utilisation in the last three
years has been over 97% of the budget estimates.
Table 3: Comparison of budget estimates and
the actual expenditure (2010-19) (in Rs crore)
Year Budget
estimate Actuals
Actuals/BE (%)
2010-11 33,214 36,433 110%
2011-12 41,451 40,641 98%
2012-13 48,781 45,631 94%
2013-14 52,701 46,856 89%
2014-15 55,115 45,722 83%
2015-16 42,220 41,800 99%
2016-17 43,554 42,989 99%
2017-18 46,356 46,600 101%
2018-19 50,000 48,441 97%
2019-20 56,537 56,537* *100%
Note: BE – Budget Estimate. *Revised Estimate Sources: Union Budgets, 2012-20; PRS.
Table 4 presents the details of the Department’s
allocation in 2020-21. In July 2018, the Ministry
launched the ‘Samagra Shiksha’ scheme, which
subsumed three schemes, namely: (i) Sarva
Shiksha Abhiyan (class 1-8), (ii) Rashtriya
Madhyamik Shiksha Abhiyan (class 9-12), and
(iii) Teacher Education.
In 2020-21, expenditure on centrally sponsored
schemes (Samagra Shiksha and Mid-Day Meal
Programme in Schools) constitute 87% of the
estimated spending of the Department of School
Education and Literacy.
Table 4: Allocation to the Department of
School Education and Literacy in 2020-21 (in
Rs crore)
Major Head 2018-
19 Actuals
2019-20 RE
2020-21 BE
% change (RE to
BE)
National Education Mission
29,437 36,292 38,861 7.1%
Samagra Shiksha
36,274 38,751 6.8%
Sarva Shiksha Abhiyan
25,616
Rashtriya Madhyamik Shiksha Abhiyan
3,399
Teachers Training and Adult Education
422 18 110 514.5%
National Programme of Mid-Day Meal in Schools
9,514 9,912 11,000 11.0%
Autonomous bodies
8,588 9,754 9,205 -5.6%
Scholarships 484 423 483 14.2%
Others 418 155 297 91.3%
Total 48,441 56,537 59,845 5.9% Note: BE – Budget Estimate; RE – Revised Estimates.
Sources: Expenditure Budget, Ministry of Human Resource
Development, Union Budget 2020-21; PRS.
Samagra Shiksha has been allocated Rs
38,751 crore in 2020-21. This is an increase
of 6.8% from the revised estimates of 2019-
20. Note that, Teacher Training and Adult
Education (subsumed under Samagra
Shiksha) has been allocated Rs 110 crore in
2020-21. This is an increase of 515% from
the revised estimates of 2019-20. However,
the Department had budgeted to spend Rs 125
crore in 2019-20 which was revised down to
Rs 18 crore.
Mid-Day Meal Scheme (MDMS):
Expenditure on Mid-Day Meal Scheme
-20%
-10%
0%
10%
20%
30%
40%
50%
60%
-
10,000
20,000
30,000
40,000
50,000
60,000
70,000
2010
-11
2011
-12
2012
-13
2013
-14
2014
-15
2015
-16
2016
-17
2017
-18
2018
-19
2019
-20
2020
-21
Department of school education and literacy
% change
Demand for Grants 2020-21 Analysis: Human Resource Development PRS Legislative Research
February 12, 2020 - 3 -
(MDMS) increased by about 11% in 2020-21
from the revised estimates of 2019-20. The
MDMS targets children in the same age
group as covered by the SSA (6 to 14 years).
Autonomous bodies: Autonomous bodies
like the National Council of Educational
Research and Training, and Kendriya
Vidyalaya Sangathan saw a decrease in their
allocation by 5.6% (from the revised estimates
of last year) and were allocated Rs 9,205 crore
in 2020-21.
Scholarships: Scholarships saw an increase
of 14.2% in its allocation in 2020-21.
Scholarships provided by the Ministry include
provisions of Rs 6,000 per year to one lakh
meritorious students of economically weaker
sections. The aim is to reduce drop-out of
students in class eight and encourage them to
continue schooling till class 12.
Issues in school education
Enrolment, transition and dropout rates
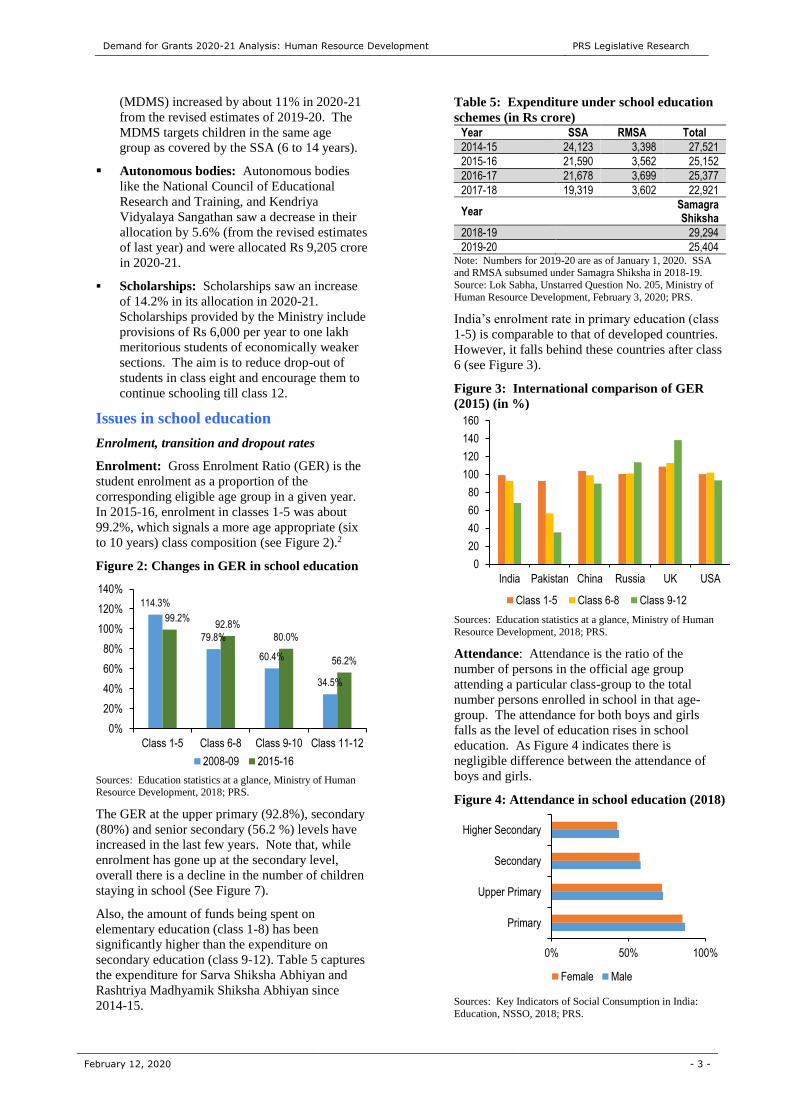
Enrolment: Gross Enrolment Ratio (GER) is the
student enrolment as a proportion of the
corresponding eligible age group in a given year.
In 2015-16, enrolment in classes 1-5 was about
99.2%, which signals a more age appropriate (six
to 10 years) class composition (see Figure 2).2
Figure 2: Changes in GER in school education
Sources: Education statistics at a glance, Ministry of Human Resource Development, 2018; PRS.
The GER at the upper primary (92.8%), secondary
(80%) and senior secondary (56.2 %) levels have
increased in the last few years. Note that, while
enrolment has gone up at the secondary level,
overall there is a decline in the number of children
staying in school (See Figure 7).
Also, the amount of funds being spent on
elementary education (class 1-8) has been
significantly higher than the expenditure on
secondary education (class 9-12). Table 5 captures
the expenditure for Sarva Shiksha Abhiyan and
Rashtriya Madhyamik Shiksha Abhiyan since
2014-15.
Table 5: Expenditure under school education
schemes (in Rs crore)
Year SSA RMSA Total
2014-15 24,123 3,398 27,521
2015-16 21,590 3,562 25,152
2016-17 21,678 3,699 25,377
2017-18 19,319 3,602 22,921
Year Samagra
Shiksha
2018-19 29,294
2019-20 25,404 Note: Numbers for 2019-20 are as of January 1, 2020. SSA and RMSA subsumed under Samagra Shiksha in 2018-19.
Source: Lok Sabha, Unstarred Question No. 205, Ministry of
Human Resource Development, February 3, 2020; PRS.
India’s enrolment rate in primary education (class
1-5) is comparable to that of developed countries.
However, it falls behind these countries after class
6 (see Figure 3).
Figure 3: International comparison of GER
(2015) (in %)
Sources: Education statistics at a glance, Ministry of Human
Resource Development, 2018; PRS.
Attendance: Attendance is the ratio of the
number of persons in the official age group
attending a particular class-group to the total
number persons enrolled in school in that age-
group. The attendance for both boys and girls
falls as the level of education rises in school
education. As Figure 4 indicates there is
negligible difference between the attendance of
boys and girls.
Figure 4: Attendance in school education (2018)
Sources: Key Indicators of Social Consumption in India:
Education, NSSO, 2018; PRS.
114.3%
79.8%
60.4%
34.5%
99.2%92.8%
80.0%
56.2%
0%
20%
40%
60%
80%
100%
120%
140%
Class 1-5 Class 6-8 Class 9-10 Class 11-12
2008-09 2015-16
0
20
40
60
80
100
120
140
160
India Pakistan China Russia UK USA
Class 1-5 Class 6-8 Class 9-12
0% 50% 100%
Primary
Upper Primary
Secondary
Higher Secondary
Female Male

Demand for Grants 2020-21 Analysis: Human Resource Development PRS Legislative Research
February 12, 2020 - 4 -
Transition and dropouts: The dropout rate
peaks at the secondary level (class 9-10) at 17%
as compared to 4% in elementary school (class 1-
8) and 2% in upper secondary school (class 11-
12) (see Figure 5). This is also reflected in the
transition rates in school education where the
lowest transition rate is at the secondary level
(class 10 to 11) at 66%. Note that a transition rate
below 100% indicates that the students are held
back or have dropped out of school.
Figure 5: Dropout rate in school education
(2014-15) (%)
Sources: Education statistics at a glance, Ministry of Human
Resource Development, 2016; PRS.
According to NSSO data (2018), the key reasons
for females dropping out is to engage in domestic
activities (30%), lack of interest in education
(15%), and marriage (13%). On the other hand,
the key reasons for males dropping out is to
engage in economic activities (37%), financial
constraints (24%), and lack of interest in
education (19%).3
Till 2019, under the RTE Act, a child could not
be expelled or detained until the completion of
elementary education (until class 8). However,
RTE Act was amended in 2019 to remove the
provision related to no-detention to address low
learning outcomes. Note that, the Draft National
Education Policy (2019) recommends that the
amendments to the RTE Act on continuous and
comprehensive evaluation and the no detention
policy must be reviewed. It states that there
should be no detention of children till class eight.
Instead, schools must ensure that children are
achieving age appropriate learning levels.4
Quality of learning
Elementary education: Over the years, expert
committees have made some adverse observations
regarding the learning outcomes of children. The
Central Advisory Board on Education (CABE,
2014), National Achievement Survey (2012 and
2017), and the Economic Survey (2016-17)
observed declining learning levels in elementary
education even after the implementation of the
RTE Act.5,6,7,8
As per the Annual Status of Education Report,
between 2014 to 2018, there has been a gradual
improvement in both basic literacy and numeracy
for class three students but still only 25% of them
are at grade level (ability to read and do basic
operations like subtraction of class two level).
The report also shows that one out of four children
leaving class eight are without basic reading skills
(ability to read at least at class two level).9
Under the RTE Act, children are enrolled in the
class that corresponds to their age, irrespective of
their learning levels. This results in a situation
where in the same class, depending on when they
are enrolled in school, children may have different
learning requirements. It has been recommended
that special training be organised and is of flexible
duration to enable the child to be at par with other
children and to ensure his integration with the
class.10 Note that, the RTE Rules were amended
in February 2017 to include class-wise, subject-
wise learning outcomes till class eight.11
Secondary education: In the National
Achievement Survey (2015) for class 10, in the
English subject, 24% students were in the range of
0-35% score and 61% students were in the range
of 36-50% score. Further, 35% students were in
0-35% scores, and 49% students were in the range
of 36-50% scores in Mathematics.12
Nature of assessment: Under the RTE Act, the
Continuous and Comprehensive Evaluation (CCE)
method is used for evaluating learning levels in
elementary education. It includes paper-pencil
tests, drawing and reading pictures, and expressing
orally, and is different than the traditional system
of examinations. However, CCE has not been
adequately implemented or monitored.5 It has
been recommended that proper design of
assessment and using this information can help
improve the quality and innovation in terms of
teaching and learning.13
Note that the RTE Act 2009 has been amended
state that a regular examination will be held in
class 5 and class 8 at the end of every academic
year. If a child fails the exam, he will be given
additional instruction, and take a re-examination.
If he fails in the re-examination, the relevant
central or state government may decide to allow
schools to detain the child.
The Draft National Education Policy (2019) noted
that the current education system solely focuses on
rote learning of facts and procedures. Hence, it
recommends that the curriculum load in each
subject should be reduced to its essential core
content. This would make space for holistic,
discussion and analysis-based learning.4
Other issues
Teachers related issues: Experts have identified
various issues with regard to the role of teachers to
address the challenges confronting elementary
education.4,14,10 These include: (i) low teacher
4% 4%
17%
2%
0%
10%
20%
Primary(class 1-5)
Upper Primary(class 6-8)
Secondary(class 9-10)
UpperSecondary
(class 11-12)

Demand for Grants 2020-21 Analysis: Human Resource Development PRS Legislative Research
February 12, 2020 - 5 -
accountability and appraisal, (ii) poor quality of
the content of teacher-education and changes
required in the curriculum of B. Ed and D. Ed
courses, (iii) need for continuous in-service
teacher training and upgradation of skill set, (iv)
inadequate pupil teacher ratio and deployment of
teachers for non-educational purposes, (v) teacher
vacancies, and (vi) excessive recruitment of
contract/para teachers.
In 2017, nine lakh posts of teachers were vacant in
elementary schools.15 Further, more than one lakh
teacher posts were vacant in secondary schools.
The draft National Education Policy (2019)
recommends that teachers should be deployed with
a particular school complex (comprising one
secondary school and all the public schools in its
neighbourhood) for at least five to seven years.
Further, teachers should not be allowed to
participate in any non-teaching activities (such as
cooking mid-day meals or participating in
vaccination campaigns) during school hours that
could affect their teaching capacities.
For teacher training, the draft Policy recommends
that existing B.Ed. programme be replaced by a
four-year integrated B.Ed. programme that
combines high-quality content, pedagogy, and
practical training. An integrated continuous
professional development will also be developed
for all subjects. Teachers will be required to
complete a minimum of 50 hours of continuous
professional development training every year.
The Right to Education Act, 2009 (RTE Act):
Currently, the RTE Act provides for free and
compulsory education to all children from the age
of six to 14 years. The draft National Education
Policy (2019) recommended extending the ambit
of the RTE Act to include early childhood
education and secondary school education.
School accountability: In 2014, CABE
recommended introducing a performance
management system for all teachers, school
leaders, and department officials, with
performance measures linked with student
learning outcomes.5 Such measures of school
accountability exist in other countries. For
example, in the United States, under the No Child
Left Behind Act, schools are required to do annual
assessment of learning outcomes in reading and
mathematics for students from classes 3 to 8. If
the school fails to achieve minimum test scores
then the consequences include removal of teachers
or the headmaster from service, school
restructuring or closure, and an option for students
to transfer to another school.16
Department of Higher Education
The Department of Higher Education has been
allocated Rs 39,467 crore in 2020-21, a 3%
increase over the revised estimate of 2019-20.
Figure 6 depicts the allocation to the Department
of Higher Education since 2010-11.
Expenditure on education by the centre and the
states as a proportion of the Gross Domestic
Product (GDP) has been around 3% between
2014-15 to 2018-19.17 Out of this figure, roughly
1% is spent on higher education in India.
Figure 6: Allocation to the Department of
Higher Education (2010-20) (in Rs crore)
Note: Revised estimates have been used for 2019-20 and
budget estimates for 2020-21.
Sources: Union Budgets, 2008-20; PRS.
Table 6 indicates the actual allocation of the
Department compared to the budget estimates of
that year. The utilisation has been over 90% of the
budget estimates in the last three years as seen in
the table. In 2016-17 and 2017-18, the
Department exceeded its budget estimates, i.e.,
crossed 100% utilisation.
Table 6: Comparison of budget estimates and
the actual expenditure (2010-19) (in Rs crore)
Year Budget
Estimate Actuals Actuals/BE (%)
2010-11 16,690 15,472 93%
2011-12 21,912 19,505 89%
2012-13 25,275 20,423 81%
2013-14 26,750 24,465 91%
2014-15 27,656 23,152 84%
2015-16 26,855 25,439 95%
2016-17 28,840 29,026 101%
2017-18 33,330 33,614 101%
2018-19 35,010 31,904 91%
2019-20 38,317 38,317* 100%
Note: BE – Budget Estimate. *Revised Estimate
Sources: Union Budgets, 2010-20 PRS.
-10%
0%
10%
20%
30%
-
10,000
20,000
30,000
40,000
50,000
2010
-11
2011
-12
2012
-13
2013
-14
2014
-15
2015
-16
2016
-17
2017
-18
2018
-19
2019
-20
2020
-21
Department of higher education % change
Demand for Grants 2020-21 Analysis: Human Resource Development PRS Legislative Research
February 12, 2020 - 6 -
Table 7 provides the major heads of financial
allocation under the Department for 2020-21.
Table 7: Allocation to the Department of
Higher Education in 2020-21 (in Rs crore)
Major Heads 2018-19 Actuals
2019-20 RE
2020-21 BE
% change (RE to
BE)
Grants to Central Universities
6,599 8,287 7,643 -8%
IITs 5,590 6,560 7,332 12%
UGC and AICTE 5,114 4,857 5,109 5%
NITs 3,389 3,547 3,885 10%
Student Financial Aid
1,897 2,321 2,316 0%
Higher Education Financing Agency (HEFA)
2,263 2,100 2,200 5%
Improvement in salary of teachers
469 1,800 1,900 6%
IISERs 620 841 896 7%
IIMs 351 501 476 -5%
Digital India-e-learning
455 541 444 -18%
World Class Institutions
127 325 400 23%
IIITs 428 375 393 5%
Research and Innovation
205 340 307 -10%
Rashtriya Uchhatar Shiksha Abhiyan (RUSA)
1,393 1,380 300 -78%
Others 3,005 4,543 5,864 29%
Grand Total 31,904 38,317 39,467 3% Sources: Expenditure Budget, Vol. 2, Ministry of Human Resource Development, Union Budget 2020-21; PRS.
Key allocation trends are as follows:
About 51% of the Department’s expenditure
has been allocated to central universities (as
grants), IITs, and statutory and regulatory
bodies (University Grants Commission
(UGC) and All India Council for Technical
Education (AICTE)).
The bulk of the enrolment in higher education
is handled by state universities and their
affiliated colleges. However, these state
universities receive small amounts of grants
from the Union Budget. Nearly 65% of the
UGC’s budget is utilised by the central
universities and their colleges while state
universities and their affiliated colleges get
only the remaining 35%.18 The Standing
Committee on Human Resource Development
(2016) recommended that the mobilisation of
funds in state universities should be explored
through other means such as endowments, and
contributions from industry and alumni.18
The Higher Education Financing Agency
(HEFA) has been allocated Rs 2,200 crore for
2020-21, a 5% decrease over the revised
estimates of 2019-20. HEFA is tasked with
the creation of high quality infrastructure in
premier educational institutions. All the
centrally funded higher educational
institutions are eligible for joining as
members of the HEFA.19 Note that HEFA is
jointly promoted by Canara Bank and the
Ministry of Human Resource Development
with an authorised capital of Rs 10,000 crore.
HEFA has been tasked to mobilise one lakh
crore rupees to meet the infrastructure needs
of higher educational institutions by 2022. So
far, the HEFA has approved 75 projects of
higher and medical educational institutions
amounting to Rs 25,565 crore.20
Allocation to World Class Institutions in
2020-21 is Rs 400 crore, an increase of 23%
from the revised estimates of 2019-20. The
government has selected ten private
institutions and eight public institutions as
institutes of eminence.21 These institutions
will have greater autonomy in admitting
foreign students, fixing fees, and recruiting
foreign faculty. Further, each public
institution declared as an institute of eminence
will get financial assistance of up to Rs 1,000
crore over the period of five years.
The funding allocation for Rashtriya Uchchtar
Shiksha Abhiyan (RUSA) has significantly
decreased by 78% at Rs 300 crore (from the
2019-20 revised estimates). RUSA aims to
improve the overall quality of existing state
higher educational institutions by ensuring
conformity to prescribed norms and standards.
Note that, in 2018, the Union Cabinet
approved the continuation of the scheme till
March 31, 2020.
Issues in the higher education sector
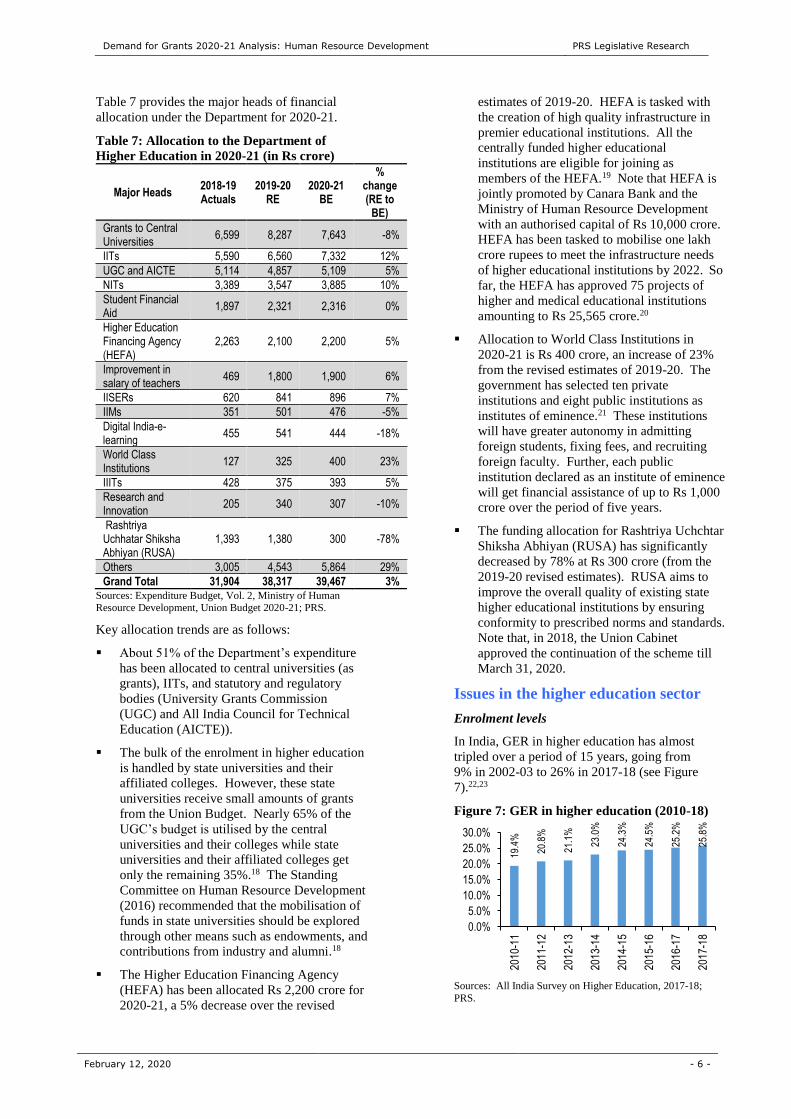
Enrolment levels
In India, GER in higher education has almost
tripled over a period of 15 years, going from
9% in 2002-03 to 26% in 2017-18 (see Figure
7).22,23
Figure 7: GER in higher education (2010-18)
Sources: All India Survey on Higher Education, 2017-18;
PRS.
19.4
%
20.8
%
21.1
%
23.0
%
24.3
%
24.5
%
25.2
%
25.8
%
0.0%
5.0%
10.0%
15.0%
20.0%
25.0%
30.0%
2010
-11
2011
-12
2012
-13
2013
-14
2014
-15
2015
-16
2016
-17
2017
-18

Demand for Grants 2020-21 Analysis: Human Resource Development PRS Legislative Research
February 12, 2020 - 7 -
A GER of 26% implies that 26% of people in
the target age-group are enrolled in
universities. The GER for higher education in
India is fairly low compared to other countries
such as the UK and USA (Figure 8). The Draft
National Education Policy (2019) states that it
aims to increase GER to 50% by 2035.4
Figure 8: International comparison of GER in
higher education (in %) (2018)
Sources: Education Statistics at a Glance, Ministry of Human
Resource Development, 2018; PRS.
Student enrolment is highest at the UG level
(79.2%) followed by PG (11.2%). The recent
AISHE 2017-18 report reveals that student
enrolment decreases as one goes further higher
from the undergraduate level of education.23
Regulatory issues in higher education
Over the years, several expert bodies such as the
National Knowledge Commission (2009), the
Yashpal Committee (2010), and the Committee for
Evolution of the New Education Policy (2016)
have suggested measures to reform higher
education to address issues related to access,
quality, funding and governance.24,25,26 Noting
that the current system is overregulated but under
governed, they recommended consolidating all
existing regulators under an independent
regulator. This body was envisaged to perform its
regulatory functions without interfering with the
academic and institutional autonomy of higher
educational institutions.4
The Draft National Education Policy (2019)
proposed setting up of the National Higher
Education Regulatory Authority (NHERA).4 This
independent authority would replace the existing
individual regulators in higher education,
including professional and vocational education.
This implies that the role of all professional
councils such as the Bar Council of India would be
limited to setting standards for professional
practice. UGC’s role would be limited to
providing grants to higher education institutions.
Note that the government had released the draft
Higher Education Commission of India (Repeal of
University Grants Commission Act) Bill, 2018 in
June 2018. It seeks to replace the UGC and set up
a Higher Education Commission.27
Quality standards in higher education
Currently, there are two accrediting institutions –
(i) the National Board of Accreditation (NBA)
established by AICTE, and (i) the National
Assessment and Accreditation Council (NAAC)
established by UGC. In terms of the quality of
universities, out of 323 universities accredited by
the NAAC in the most recent cycle, only 23
universities have been given an ‘A+’ grade.28
The Standing Committee on Human Resource
Development (2016) noted that accreditation of
higher educational institutions needs to be at core
of the regulatory arrangement in higher education.
Credit rating agencies, reputed industry
associations, and professional bodies should be
encouraged to rate Indian universities and
institutions.29
The Draft National Education Policy (2019)
recommended separating NAAC from the UGC
into an independent and autonomous body.4 In its
new role, NAAC will function as the top level
accreditor, and will issue licenses to different
accreditation institutions, who will assess higher
educational institutions once every five to seven
years. All existing higher education institutions
should be accredited by 2030.
Private sector and profit motive in higher
education
A UGC report in 2012 noted that the distribution
of public and private institutions in India is
skewed. This is because enrolment in public
universities is largely concentrated in conventional
disciplines (arts and sciences) whereas in private
institutions, more students are enrolled in market-
driven disciplines (engineering, management,
etc.).30 Thus, with a rise in private universities,
there is a mismatch of the demand and supply of
subject disciplines in the private sector education.
The National Knowledge Commission noted that
while private investment is high in the disciplines
of engineering, medicine and management;
majority of enrolment is still taking place in the
traditional disciplines like arts.25 The Yashpal
Committee further noted have stated that the
private sector should not confine itself to the
commercially viable sectors such as management,
accountancy, and medicine as this leads to the
responsibility of the government to maximise
enrolment in general subjects.24
Fee Structure
The Standing Committee on Human Resource
Development (2011) has been observed that many
85.880.4
56.5
43.4
25.8
9.9
0
20
40
60
80
100
USA Russia UK China India Pakistan

Demand for Grants 2020-21 Analysis: Human Resource Development PRS Legislative Research
February 12, 2020 - 8 -
private institutions of higher education charge
exorbitant fees. 31 In the absence of well-defined
norms, fees charged by such universities have
remained high. UGC regulates fees for courses
offered in deemed universities, to an extent. They
state that the fees charged shall be directly linked
to the cost of running the course and the institution
shall ensure non-commercialisation of education.
In 2002, the Supreme Court ruled that the fees
charged by private unaided educational institutes
could be regulated.32 Also, while banning
capitation fee (fees exceeding the tuition fee), it
allowed institutes to charge a reasonable surplus.
AICTE had constituted a Committee in 2014
under Justice Srikrishna to recommend the fee to
be charged by the private technical educational
institutes in the country.33 The Committee
recommended the maximum tuition and
development fee to be charged.
Teacher related issues
According to UGC, out of the total teaching posts
of 17,425 in various UGC funded Central
Universities, 6,141 (35%) teaching posts are lying
vacant.34 Further, in 20 Indian Institute of
1 Expenditure Budget, Vol. 2, Union Budget 2020-21,
https://www.indiabudget.gov.in/doc/eb/sbe58.pdf; https://www.indiabudget.gov.in/doc/eb/sbe59.pdf. 2 Educational Statistics at a Glance 2018, Ministry of Human
Resource Development,
https://mhrd.gov.in/sites/upload_files/mhrd/files/statistics-new/ESAG-2018.pdf. 3 Key Indicators of Household Social Consumption on
Education in India, NSS 75th Round, June 2018, Ministry of
Statistics and Programme Implementation, http://www.mospi.gov.in/sites/default/files/publication_reports/
KI_Education_75th_Final.pdf. 4 “Draft National Education Policy”, Ministry of Human
Resource Development, May 31, 2019, https://mhrd.gov.in/sites/upload_files/mhrd/files/Draft_NEP_2
019_EN_Revised.pdf . 5. “Report of CABE Sub Committee on Assessment on
implementation of CCE and no detention provision”, 2015, Ministry of Human Resource
Development, http://mhrd.gov.in/sites/upload_files/mhrd/files/
document-reports/AssmntCCE.pdf. 6 A summary of India’s National Achievement Survey, Class VIII, 2012, National Council of Educational Research and
Training,
http://mhrd.gov.in/sites/upload_files/mhrd/files/upload_document/11-March-National-Summary-Report-NAS-Class-VIII.pdf. 7 National Achievement Survey 2017, Dashboard,
http://nas.schooleduinfo.in/dashboard/nas_ncert#/. 8 Economic Survey, 2016-17, http://indiabudget.nic.in/es2016-
17/echapter_vol2.pdf. 9 Economic Survey, 2018-19, Ministry of Finance,
https://www.indiabudget.gov.in/economicsurvey/doc/vol2chapter/echap10_vol2.pdf. 10 “Report to the People on Education”, 2011-12, Ministry of Human Resource Development,
http://mhrd.gov.in/sites/upload_files/mhrd/files/document-
reports/RPE_2011-12.pdf. 11 The RTE (Amendment) Rules, 2017, Ministry of Human Resource Development,
Management (IIMs), out of the 1,004 total
sanctioned teaching posts, 253 posts are lying
vacant;35 and in 7 IISERs and IISc, Bangalore, the
total number of sanctioned teaching posts is 1,117
and 153 are lying vacant.36
The Standing Committee on Human Resource
Development (2017) reasoned that this could be
due to two reasons: (i) young students don’t find
the teaching profession attractive; or (ii) the
recruitment process is long and involves too many
procedural formalities.18
The Draft National Educational Policy (2019)
observed that poor service conditions and heavy
teaching loads at higher education institutions
have resulted in low faculty motivation.4 Further,
lack of autonomy and no clear career progression
system are also major impediments to faculty
motivation. It recommended development of a
Continuous Professional Development programme
and introduction of a permanent employment
(tenure) track system for faculty in all higher
education institutions by 2030. Further, a
desirable student-teacher ratio of not more than
30:1 must be ensured.
https://mhrd.gov.in/sites/upload_files/mhrd/files/upload_document/RTE_Amendment_2017.pdf. 12 National Achievement Survey (2015), Class X, National
Council of Educational Research and Training,
http://www.ncert.nic.in/departments/nie/esd/pdf/NASSummary.pdf. 13 World Development Report, 2018, World Bank,
http://www.worldbank.org/en/publication/wdr2018. 14 “Implementation of Right of Children to Free and
Compulsory Education (RTE) Act, 2009”, Comptroller and Auditor General of India, July 21, 2017,
http://www.cag.gov.in/content/report-no23-2017-compliance-
audit-union-government-implementation-right-children-free-and. 15 Lok Sabha, Unstarred Question No. 76, Ministry of Human
Resource Development, February 3, 2020,
http://164.100.24.220/loksabhaquestions/annex/173/AU76.pdf. 16 K-12 Education: Highlights of the No Child Left Behind Act
of 2001, Library of Congress. Congressional Research Service, February 28, 2005,
https://digital.library.unt.edu/ark:/67531/metadc824710/m1/1/. 17 ‘Social Infrastructure, Employment, and Human Development’, Chapter 10, Economic Survey, 2019-20,
Ministry of Finance,
https://www.indiabudget.gov.in/economicsurvey/doc/vol2chapt
er/echap10_vol2.pdf. 18 “Report no. 284: Issues and Challenges before the Higher
Educational Sector in India”, Standing Committee on on
Human Resource Development, December 14, 2016, http://164.100.47.5/newcommittee/reports/EnglishCommittees/
Committee%20on%20HRD/284.pdf. 19 “Cabinet approves establishment of Higher Education
Financing Agency for creating capital assets in higher educational institutions”, Press Information Bureau, Cabinet,
September 12, 2016. 20 Year End Revie 2019- Ministry of Human Resource
Development Press Information Bureau, January 6, 2020. 21 Lok Sabha, Unstarred Q No. 44, Ministry of Human
Resource Development, Answered on November 18, 2019,
http://loksabhaph.nic.in/Questions/QResult15.aspx?qref=6362&lsno=17.

22 All India Survey on Higher Education, 2014-15, Ministry of Human Resource and Development, Department of Higher Education,
http://aishe.nic.in/aishe/viewDocument.action?documentId=206. 23 All India Survey on Higher Education, 2017-18, Ministry of Human Resource and Development, Department of Higher Education,
http://aishe.nic.in/aishe/viewDocument.action?documentId=245. 24 “ Report of the Committee to Advise on Renovation and Rejuvenation of Higher Education”, 2009, http://mhrd.gov.in/sites/upload_files/mhrd/files/document-reports/YPC-Report.pdf. 25 “Report to the Nation: 2006-2009”, National Knowledge Commission, March 2009, http://www.aicte-india.org/downloads/nkc.pdf. 26 Report of the Committee on the Evolution of the New Education Policy, Ministry of Human Resource Development, March 30, 2016,
http://www.prsindia.org/uploads/media/Report%20Summaries/Committee%20Report%20for%20Evolution%20of%20the%20New
%20Education%20Policy.pdf. 27 The Draft Higher Education Commission (Repeal of the University Grants Commission Act, 1956) Bill, 2018,
http://mhrd.gov.in/sites/upload_files/mhrd/files/HE_CoI_India_2018_act.pdf 28 Accreditation Status, National Accreditation and Assessment Council, http://web5.kar.nic.in/naac_ec/NAAC_accreditlist_pdf.aspx. 29 Report no. 284: Issues and Challenges before the Higher Educational Sector in India”, Standing Committee on Human Resource
Development, December 14, 2016, http://164.100.47.5/newcommittee/reports/EnglishCommittees/Committee%20on%20HRD/284.pdf. 30 “Inclusive and Qualitative Expansion of Higher Education 2012-17”, University Grants Commission, November 2011,
http://www.ugc.ac.in/ugcpdf/740315_12FYP.pdf. 31 “236th Report on the Prohibition of Unfair Practices in Technical Educational Institutions, Medical Educational Institutions and
Universities Bill, 2010”, Standing Committee on Human Resource Development, May 30, 2011. 32 TMA Pai Foundation vs. State of Karnataka & Ors [(1994)2SCC195]. 33 Report of the National Fee Committee constituted by AICTE, April 17, 2015, AICTE, https://www.aicte-
india.org/downloads/Justice%20B.%20N.%20Srikrishna%20Committee%20Report.pdf. 34 Lok Sabha, Starred Question No. 127, Vacant Faculty Positions in CUs, Ministry of Human Resource Development, February 4, 2019 35 Lok Sabha unstarred question No. 1900, Ministry of Human Resource Development, July 2018,
http://164.100.24.220/loksabhaquestions/annex/15/AU1900.pdf 36 Starred question no. 33, Ministry of Human Resource Development, Lok Sabha, February 2, 2018,
http://164.100.47.190/loksabhaquestions/annex/14/AS33.pdf.
DISCLAIMER: This document is being furnished to you for your information. You may choose to reproduce or redistribute this report for non-commercial purposes in part or in full to any other person with due acknowledgement of PRS Legislative Research (“PRS”). The
opinions expressed herein are entirely those of the author(s). PRS makes every effort to use reliable and comprehensive information, but
PRS does not represent that the contents of the report are accurate or complete. PRS is an independent, not-for-profit group. This document has been prepared without regard to the objectives or opinions of those who may receive it.

Demand for Grants 2020-21 Analysis: Human Resource Development PRS Legislative Research
February 12, 2020 - 10 -
Annexure
Union Budget, 2020-21
Table 1: Allocations to the Ministry of Human Resource Development for 2020-21 (in Rs crore)
Major Heads 2018-19 Actuals
2019-20 Budgeted
2019-20 Revised
Change between BE 2019-20 and RE 2019-20
2020-21 Budgeted
Change between RE 2019-20 and BE 2020-21
Department of School Education and Literacy
48,441 56,537 56,537 16.7% 59,845 5.9%
Scholarships 484 468 423 -12.6% 483 14.2%
Autonomous bodies 8,588 8,440 9,754 13.6% 9,205 -5.6%
National Education Mission 29,437 36,447 36,292 23.3% 38,861 7.1%
Samagra Shiksha 36,322 36,274 38,751 6.8%
Sarva Shiksha Abhiyan 25,616 -100.0%
Rashtriya Madhyamik Shiksha Abhiyan
3,399 -100.0%
Teachers Training and Adult Education
422 125 18 -95.8% 110 514.5%
National Programme of Mid-Day Meal in Schools
9,514 11,000 9,912 4.2% 11,000 11.0%
Others 418 181 155 -62.8% 297 91.3%
Department of Higher Education 31,904 38,317 38,317 20.1% 39,467 3.0%
Higher Education Financing Agency (HEFA)
2,263 2,100 2,100 -7.2% 2,200 4.8%
Student Financial Aid 1,897 2,306 2,321 22.4% 2,316 -0.2%
Digital India-e-learning 336 456 511 52.1% 579 13.3%
Research and Innovation 205 609 340 65.7% 307 -9.5%
Statutory and regulatory bodies (UGC and AICTE)
5,114 5,059 4,857 -5.0% 5,109 5.2%
Grants to Central Universities 6,599 6,843 8,287 25.6% 7,643 -7.8%
Indian Institutes of Technology 5,590 6,410 6,560 17.4% 7,332 11.8%
Indian Institutes of Management 351 446 501 42.8% 476 -4.9%
National Institutes of Technology 3,389 3,787 3,547 4.7% 3,885 9.5%
Indian Institute of Science, Education and Research (IISERs)
620 899 841 35.6% 896 6.5%
Indian Institutes of Information Technology(IIITs)
428 375 375 -12.5% 393 5.0%
Rashtriya Uchhatar Shiksha Abhiyan (RUSA)
1,393 2,100 1,380 -0.9% 300 -78.3%
Improvement in Salary Scale of University and College Teachers
469.17 2000 1800 283.7% 1,900 5.6%
World Class Institutions 127 400 325 -18.0% 400 23.0%
Others 3,005 4,405 4,543 3.1% 5,864 29.1%
Total 80,345 94,854 94,854 18.1% 99,312 4.7%
Sources: Demand for Grants, Ministry of Human Resource Development, Union Budget, 2020-21; PRS.

Demand for Grants 2020-21 Analysis: Human Resource Development PRS Legislative Research
February 12, 2020 - 11 -
Indicators on school and higher education
Table 2: Enrolment in education in 2016-17 (as a percentage of respective population)
State/ UT
GER in Elementary Education (Classes 1-8)
GER in Secondary Education
(Classes 9-12) GER in Higher
Education (Beyond class 12)
Primary Upper
Primary Total
Elementary Secondary
Higher Secondary
Andhra Pradesh 82.8 82.1 82.5 76.3 60.6 32.4
Arunachal Pradesh 106.2 119.9 110.4 85.9 51.2 29.7
Assam 107.4 96.7 103.7 78.6 39.7 18.7
Bihar 98.1 103.9 99.9 76.7 28.8 13.6
Chhattisgarh 97.1 100.8 98.5 87.7 54.5 18.6
Goa 101.3 97.1 99.7 99.3 78.7 30.1
Gujarat 95.0 97.2 95.8 74.5 43.2 20.4
Haryana 93.9 94.4 94.1 86.3 60.8 29.2
Himachal Pradesh 97.9 103.0 99.8 103.9 92.0 39.6
Jammu & Kashmir 77.1 66.2 73.0 61.7 52.9 30.9
Jharkhand 96.6 91.8 95.0 63.5 37.1 19.1
Karnataka 103.7 2.9 99.7 84.4 41.9 28.8
Kerala 95.1 93.6 94.6 99.4 79.4 37.0
Madhya Pradesh 92.1 89.7 91.3 80.2 47.1 21.5
Manipur 120.6 119.3 120.2 86.5 64.4 33.7
Maharashtra 97.5 98.7 97.9 91.7 70.7 32.0
Meghalaya 129.1 128.0 128.8 83.3 40.6 25.8
Mizoram 115.7 127.5 119.3 95.9 54.6 25.7
Nagaland 81.7 90.4 84.4 61.8 36.3 18.7
Odisha 100.2 94.6 98.1 79.9 40.1 22.1
Punjab 99.3 97.7 98.7 87.1 72.2 29.5
Rajasthan 97.8 92.0 95.8 76.6 60.3 23.0
Sikkim 92.0 136.8 106.9 112.0 64.2 53.9
Tamil Nadu 102.0 93.4 98.6 93.9 83.7 49.0
Telangana 98.6 86.9 94.1 81.8 50.6 36.2
Tripura 102.4 126.4 110.0 112.3 41.9 19.2
Uttar Pradesh 87.2 72.7 82.1 67.8 59.0 25.8
Uttarakhand 96.4 86.7 92.7 84.4 77.1 39.1
West Bengal 96.3 96.3 96.3 78.6 50.9 19.3
Andaman & Nicobar Islands 86.9 83.1 85.4 84.1 72.8 23.2
Chandigarh 80.1 95.6 85.8 89.7 83.2 50.6
Dadra & Nagar Haveli 82.9 91.6 86.0 91.2 51.8 9.3
Daman & Diu 84.0 81.1 82.9 73.3 34.6 5.5
Delhi 109.2 129.0 115.9 114.4 74.2 46.3
Lakshadweep 70.0 81.4 79.8 105.7 97.9 7.4
Puducherry 85.6 84.8 85.3 87.5 74.2 46.4
India 95.1 90.7 93.6 79.4 55.4 26.3
Note: Enrolment rate can exceed 100% due to early or late school entrance and grade repetition, or for example, children not in the 6-14 age
group still being enrolled in elementary school. Data for higher education is of 2018.
Sources: Flash Statistics, DISE 2016-17; AISHE 2018-19, Ministry of Human Resource Development; PRS.

Demand for Grants 2020-21 Analysis: Human Resource Development PRS Legislative Research
February 12, 2020 - 12 -
Table 3: Pupil Teacher Ratio (2015-16)
State/UT
Management Type (in %) (2016-17) Pupil Teacher Ratio (2015-16)
Private schools
Government schools
Others Primary
(Classes 1-5)
Upper Primary
(Classes 6-8)
Secondary (Classes 9-
10)
Higher secondary
(Classes 11-12)
Higher (Beyond class 12)
Andhra Pradesh 26.4 72.6 0.89 21 16 20 71 18
Arunachal Pradesh
13.6 85.2 1.08 12 7 22 37 31
Assam 13.7 74.2 12.07 21 13 14 20 31
Bihar 5.4 88.1 6.38 36 24 66 59 61
Chhattisgarh 12.5 57.7 2.49 20 17 33 27 28
Goa 34.7 56.2 - 20 16 13 18 16
Gujarat 34.9 65.9 0.01 19 13 34 29 26
Haryana 32.3 63.5 4.12 20 13 15 15 26
Himachal Pradesh 14.9 85.07 0.01 12 10 18 14 27
Jammu & Kashmir 18.3 81.6 0.01 9 6 15 29 35
Jharkhand 5.4 83.8 10.75 27 19 62 78 60
Karnataka 34.3 65.5 0.07 19 13 16 30 15
Kerala 61.1 29.5 9.28 18 14 17 21 18
Madhya Pradesh 18.4 80.4 1.11 20 18 39 38 33
Maharashtra 37.5 61.7 0.64 24 17 23 44 27
Manipur 30.8 66.7 2.43 12 8 12 19 22
Meghalaya 44.8 53.6 1.52 21 13 12 21 26
Mizoram 31.8 66.7 1.44 14 6 9 15 18
Nagaland 25.9 74.0 - 10 6 15 21 19
Odisha 14.2 82.3 3.61 17 14 20 45 27
Punjab 25.9 71.0 3.07 18 12 16 26 18
Rajasthan 32.3 63.8 2.52 17 10 21 32 29
Sikkim 33.6 66.3 - 5 5 17 15 27
Tamil Nadu 33.2 66.0 0.7 18 15 21 25 17
Telangana 30.9 68.2 0.88 23 15 22 47 18
Tripura 7.08 88.8 4.07 10 8 28 11 33
Uttar Pradesh 34.4 66.4 4.03 39 31 56 97 46
Uttarakhand 10.1 86.2 3.56 18 17 16 25 27
West Bengal 10.7 86.0 3.14 25 27 39 57 35
Andaman & Nicobar Islands
17.1 83.0 - 8 6 14 16 25
Chandigarh 39.8 57.7 2.49 13 9 13 28 28
Dadra & Nagar Haveli
12.3 86.7 0.86 17 13 30 30 29
Daman & Diu 17.1 82.0 - 26 14 17 13 14
Delhi 51.3 48.7 - 24 17 30 21 52
Lakshadweep - 100.0 - 7 7 7 12 12
Puducherry 42.4 57.5 - 14 9 11 17 13
India 25.2 71.7 3.04 23 17 27 37 26 Note: Government schools consist of schools run by department of education, tribal/social welfare department, local body, other
government and central government. Private schools consist of private aided and private unaided schools, ‘Others’ comprises Madrasas and
unrecognised schools. Type of management of schools is for 2016-17. Pupil teacher ratio is for 2015-16, except for higher education which is for 2018-19.
Sources: Flash Statistics, U-DISE 2016-17; AISHE 2018-19, Educational Statistics at a Glance 2018; Ministry of Human Resource
Development; PRS