Delineation of Physiological, Agronomic and Genetic ... - MDPI

HYDROLOGICAL PROCESSESHydrol. Process. (2012)Published online in Wiley Online Library(wileyonlinelibrary.com) DOI: 10.1002/hyp.9354
Delineation of saltwater intrusion zones using the time domainelectromagnetic method: the Nabeul–Hammamet coastal
aquifer case study (NE Tunisia)
Fatma Trabelsi,1* Abdallah Ben Mammou,1 Jamila Tarhouni,2 Carlo Piga3 and Gaetano Ranieri31 Faculty of Sciences of Tunis, Mineral Resources and Environment Laboratory, Department of Geology, University Tunis El Manar, 2092 Tunis El
Manar, Tunisia2 National Institute of Agronomy of Tunisia (INAT), Sciences and Technology of Water Laboratory, Department of Rural Engineering, University 7
November, 43 Avenue Charles Nicolle, 1082 Tunis, Tunisia3 Faculty of Engineering of Cagliari, Geophysics Laboratory, Department of Territorial Engineering, University of Cagliari, P.zza d’Armi 16, 09123,
Cagliari, Italy
*CMiUnE-m
Co
Abstract:
The time domain electromagnetic method (TDEM) is applied to monitor, to delineate and to map the saltwater intrusion zones inthe Mediterranean Plio-Quaternary aquifer. Forty-two TDEM soundings were carried out in the coastal plain of Nabeul–Hammamet region (NE Tunisia). TDEM resistivity data were correlated with the existing borehole logging data to assign them toa particular lithology and to provide information about the position of the freshwater–seawater transition zone. The geoelectricsections showing the vertical configuration of seawater intrusion, with the brackish-salty-saturated zones, have a resistivityranging from ~0.1 to 5 Ω�m and are detected at a depth lower than 1.5 m. The salinized zones are located at Nabeul (Sidi Moussa,Sidi El Mahrsi, Al Gasba and Mrazgua) and at Hammamet (Touristic zone of Hammamet north and south, Baraket Essahel) andreached a distance of 4 km from the coastline, indicating a severe state for the aquifer in these zones. These TDEM results areconfirmed by the increase of chloride concentration content in the analysed water samples of monitoring wells. Moreover, in thenortheastern part, the presence of a saltwater front located far from the coast and along the NW–SE major surface fault can beexplained by two hypothesis: (i) this fault seems to provide a conduit for seawater to move readily towards the water wells and(ii) the clay and gypsum infiltration of marine Messinian deposits through the fault plane leads to low resistivities. Finally, itcomes out from this study that TDEM survey has successfully depicted salinized zones of this coastal aquifer. Copyright © 2012John Wiley & Sons, Ltd.
KEY WORDS TDEM; saltwater intrusion; Plio-Quaternary aquifer; Nabeul–Hammamet; Tunisia
Received 10 March 2011; Accepted 20 April 2012
INTRODUCTION
Groundwater is a vital resource for socioeconomicdevelopment in coastal areas worldwide. The waterdemands of these areas have increased during the lastdecades because of rapid urbanization, accelerated tourismdevelopment, agricultural activities and a continuouspopulation growth (Xue et al., 1993). Water needs aremainly covered by groundwater abstracted from theaquifers via numerous wells and boreholes. As a result, anegative water balance is established in coastal aquifersystems, triggering seawater intrusion. It occurs when thesea, with interesting permeable rocks (for porosity orfractures), creates an interface below freshwaters accord-ing to density contrast and aquifer geometry. Therefore,pinpointing the interface position as precisely as possibleis extremely important. The most direct method fordetermining the location of the saline wedge is to measure
orrespondence to: Fatma Trabelsi, Faculty of Sciences of Tunis,neral Resources and Environment Laboratory, Department of Geology,iversity Tunis El Manar, 2092 Tunis El Manar, Tunisia.ail: [email protected]
pyright © 2012 John Wiley & Sons, Ltd.
water conductivity at different depths until an abruptvariation in salinity is detected (Duque et al., 2008).However, in detrital coastal aquifers, freshwater is usuallyencountered at shallow depths, and most water monitoringwells and boreholes are often too shallow to intersect theinterface. Test boreholes are drilled to monitor the advanceof the saline wedge, which is prohibitively costly becausespecial drilling techniques must be used due to the lack ofcohesion in the detrital sediments of these aquifers.Contrariwise, geophysical techniques offer a suitablemethod for determining the location of the freshwater–seawater interface because costs are reduced and results aregood. Moreover, these methods also provide complemen-tary information on the characteristics of the interface andthe sediments forming the aquifer.The evaluation of seawater intrusion has been dealt
with through a variety of geophysical techniques forwhich it would be useful to know the subsurfaceresistivity to estimate the saline water intrusion, andgeoelectric and geoelectromagnetic techniques are theleading ones (Goldman and Neubauer, 1994, Kafri andGoldman, 2005). These techniques are particularlyefficient in the exploration of saline groundwater due

F. TRABELSI ET AL.
to the close relation between salinity and electricalresistivity/conductivity measurements. It helps in under-standing spatial relations between fresh, brackish andsaline water, which commonly coexist in coastalaquifers. The large differences between the resistivityof saltwater-saturated zones and the freshwater-saturatedzones have been used by several investigations todetermine the saltwater intrusion in many coastal areas(Hodlur et al., 2010; Van Dam and Meulenkamp 1967;De Breuk and De Moor 1969; Zohdy 1969; Sabet, 1975;Ginsberg and Levanton 1976; Urish and Frohlich 1990;and Frohlich et al., 1994).In most cases, the application of the geophysical
methods has focused on studying the geometrical featuresof the target (e.g. the depth to freshwater–saline ground-water interface). This problem was successfully treated byall relevant methods. Direct current (DC) electricalimaging is one of the most efficient and powerful techniqueto map freshwater–saltwater interfaces. Many geoelectricalsurveys based on the one-dimensional (1D) verticalelectrical sounding (VES) were performed in differentcoastal areas around the world (e.g. Urish and Frohlich1990; Ebraheem et al., 1997; Nowroozi et al., 1999;Choudhury and Saha 2004). Also, many studies based onthe two-dimensional (2D) ERT technique are also reported(Nassir et al., 2000; Wilson et al., 2005; Sherif et al.,2006).Moreover, the time domain electromagnetic method(TDEM) has been used successfully in hydrogeologicalsurveys, geologicalmapping applications, aquifer structuredelineation and contamination (Raiche, 1984, Hoekstraand Bloom, 1986, Goldman et al., 1991). The method hasbeen extensively applied in studies of seawater intrusionand soil and groundwater salinization. Paine (2003) usedtime domain and frequency domain electromagnetictechniques to outline zones affected by soil salinizationand to estimate the total subsurface chloride mass. In aseries of articles, Goldman et al. (1991), Kafri et al. (1997),Yechieli et al. (2001) and Kafri and Goldman (2005)present the application of the TDEM method to mapand delineate seawater intrusion phenomena in theMediterranean and Dead Sea coastal aquifers. Neverthe-less, the TDEM was particularly accurate and efficient indetecting seawater intrusion because of its highestsensitivity to electrically conductive targets, best verticaland lateral resolutions and highest depth-to-array sizecharacteristics compared with the rest of geophysicaltechniques (Fitterman and Stewart, 1986; Kafri andGoldman, 2005).However, this case study demonstrates the use of
TDEM survey correlated with borehole geophysicallogging data to detect and monitor saltwater intrusion inthe typical Mediterranean coastal aquifer. Indeed, thenortheastern coast of Tunisia is both threatened byseawater intrusion and seepage of pollutants that aredegrading the groundwater quality (Paniconi et al.,2001; Kouzana et al., 2009; Kerrou et al., 2010).However, the case study chosen is the Nabeul–Hammamet (NH) area, located in the northeastern ofTunisia, in the eastern part of the Cap Bon peninsula
Copyright © 2012 John Wiley & Sons, Ltd.
(Figure 1). It encompasses an area of approximately330 km2, 27 km in length and from approximately 6 to18 km in width, bordered by the Korba region in theeast, the Bouficha area in the west, the Grombalia zonein the north and the Mediterranean Sea along the south(Figure 1). The study area is characterized by a semiaridclimate with an average annual precipitation of 456(1997–2009) and an annual mean evaporation intensityof 1189 mm (1985–2004). The region is heavilypopulated and is considered an interesting area bothfor its tourist attractions as well as its significant urban,agricultural and industrial activities.The steady increase in water consumption has severely
depleted the shallow aquifer, reduced water levels, led tosaltwater encroachment and dewatered some areas of thiscoastal plain. To face this threat, several measures weretaken by the Tunisian state, such as prohibiting theconstruction of new wells (the region has been declared aprotected area since 1941), developing alternativesources of freshwater, building dams and water bypassesfrom the north of the country, distributing efficientirrigation systems and reusing treated waste water forartificial recharge of the aquifer (e.g. Oued Souhil pilotstation).Furthermore, this report focuses to more precisely
define the position of the freshwater–seawater transitionzones, to locate the extent of salinized zones and to mapthe shallow aquifer of NH coastal aquifer system.
Geological setting
The coastal plain of NH is located in the western coast ofthe Sicilian Strait (Elmejdoub and Jedoui, 2009). It has avery complex geological structure and variable outcrop-ping with lateral and vertical facies variation due to poly-directional syn-sedimentary faults. The oldest outcrops areallotted to the lower Eocene, whereas the most recent areallotted to old and recent Quaternary (Ben Salem, 1992)(Figures 1 and 2). This coastal area is bounded by a groupof steep relieves; Mounts Batin, Al Hshish and Hammametin the northeast; Mounts El Guedim, El Mhissa and ElMenchar in the northwest; and Quaternary marine plat-forms in the south. The first elevated mountains make amonocline structure (Ben Salem, 1992) occupied bydetrital deposits of upper Miocene (Colleuil, 1976) andtransgressive marine sediments of Pliocene. The latter wereunconformably deposited on the folded and erodedformations of Miocene, and the lower Miocene, Oligoceneand upper Eocene deposits outcrop along the western partof the basin (Burollet, 1956; Blondel, 1991). Throughoutthe middle part is shown a NW–SE-directed structure thatcorresponds to Grombalia graben covered by Quaternarysediments (Castany, 1948) and giving the area a synclinalshape bordered by major faults towards the northwest (BenAyed, 1986; Chihi, 1995; Turki, 1985). The southern partof the area is mainly constituted by quaternary deposits,which are usually composed of two units: the lower unit ofmarine facies, corresponding to the sandy limestone of theTyrrhenian transgression, and the upper unit, mainly
Hydrol. Process. (2012)DOI: 10.1002/hyp
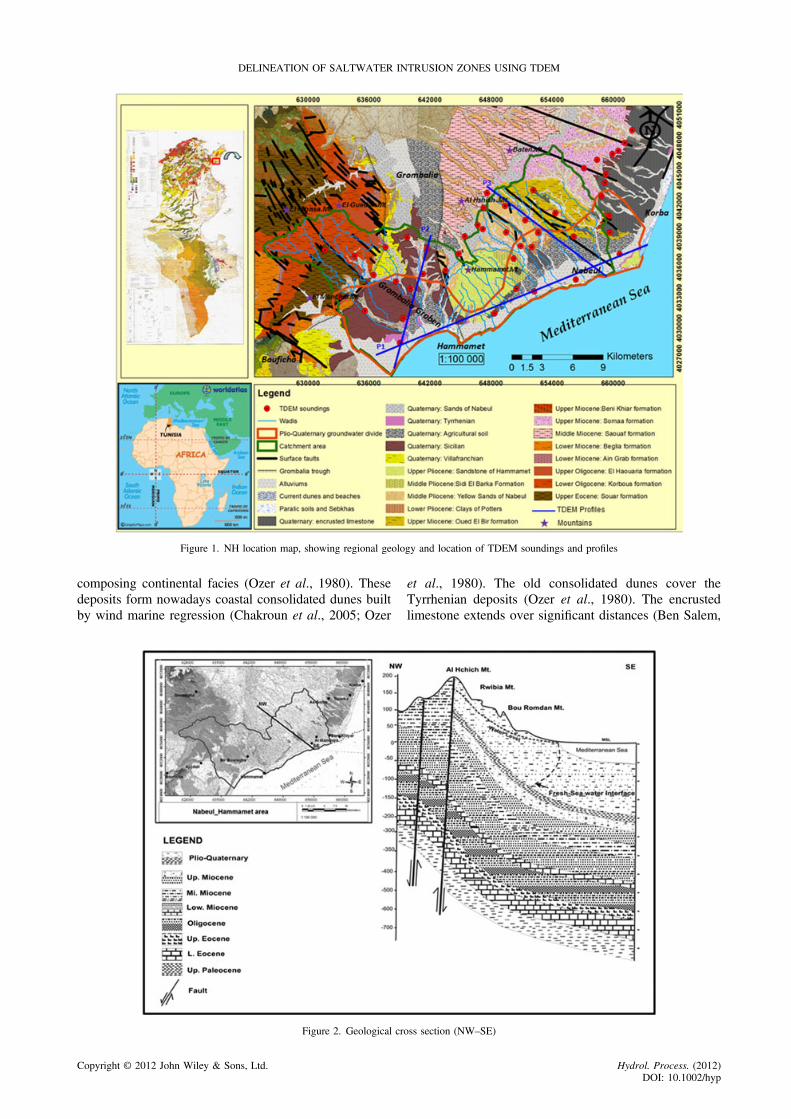
Figure 1. NH location map, showing regional geology and location of TDEM soundings and profiles
DELINEATION OF SALTWATER INTRUSION ZONES USING TDEM
composing continental facies (Ozer et al., 1980). Thesedeposits form nowadays coastal consolidated dunes builtby wind marine regression (Chakroun et al., 2005; Ozer
Figure 2. Geological cr
Copyright © 2012 John Wiley & Sons, Ltd.
et al., 1980). The old consolidated dunes cover theTyrrhenian deposits (Ozer et al., 1980). The encrustedlimestone extends over significant distances (Ben Salem,
oss section (NW–SE)
Hydrol. Process. (2012)DOI: 10.1002/hyp

F. TRABELSI ET AL.
1992). Finally, The Holocene deposits form the recentalluvia of rivers (wadis), current dunes and beaches. Thesealluvial deposits, often terraced, are characterized bydifferent permeability degrees by the grain size and agenerally medium–high pollution vulnerability.
Figure 3. Hydrogeological chart of the Plio-Quaternary reservoir
Hydrogeological setting
From a hydrological point of view, the surface drainagenetwork in NH catchment area is very dense (Figure 4) andis constituted by several nonperennial wadis, in which themost important are Oued Souhil and Oued El Kebir in theeast and Oued el Batin and Oued Sidi Hammed in thewest. This hydrological network supplies a multilayeraquifer system in which the recharge by surface waterbodies is quantified approximately 11.18 Mm3/year(DWR, 2005). In addition, this aquifer system is beingrecharged through the excess of surface irrigation waterand water leaks from the Medjerda open channel, theartificial recharge of the groundwater level by reuse oftreated waste water (at Oued Souhil pilot station) and theinteraquifer flow. Then, it is discharged through outflowinto the drainage system, direct abstraction, evapotrans-piration, interaquifer flow of groundwater processes,groundwater returning flow to the wadis and drains andextraction by wells. In the NH aquifer system, it is possibleto distinguish four principal geostructural complexes,characterized by hydrogeological heterogeneity: the Plio-Quaternary aquifer, the Miocene aquifer, the Oligoceneaquifer and the Eocene aquifer (Trabelsi et al., 2011).Nevertheless, the most important regional shallow aquiferin NH is the Plio-Quaternary reservoir, which is thepurpose of this study (Figures 2 and 3). The quaternaryunits Alluviums, Old soil, Sicilian, Tyrrhenianand Villafranchian form together a discontinuoussemiunconfined multilayer aquifer interconnected bysandy clay aquitards. In the upper part of the catchmentarea, the Quaternary aquifer is unconfined and ishydraulically connected to the hydrological network,whereas the aquifer turns into a multilayered systemdownstream as the intercalations of clay are gettingthicker. Hydraulic gradient, hydraulic conductivity andtransmissivity present a large range of variation because ofchanges in grain size and local increases of clay content,which vary in thickness and are laterally discontinuous.Therefore, the Pliocene aquifer flows between the sandysandstone deposits of ‘Sandstone of Hammamet’ forma-tion and ‘Yellow Sands of Nabeul’ formation. The firstunit aquifer is found in the Hammamet region and isthicker in the north than that in the south, approximately20 to 200 m. In the southwestern riverside of Oued Souhilto the north of Hammamet, the second Pliocene aquifer isunconfined, with 60 to 140 m of thickness, and turns intomultilayer towards the southern part. The bedrock of thePlio-Quaternary reservoir is constituted by the Plioceneclayey deposits (the Potters clay and/or Sidi El Barkaformations), which separate this groundwater reservoirfrom the underling confined aquifers of the Miocene,Oligocene and Eocene deposits.
Copyright © 2012 John Wiley & Sons, Ltd.
The piezometric map (2006) (Figure 4) of the shallowwater table shows that groundwater flows converge fromnorthwest to southeast and from the northeast towards theMediterranean Sea, which constitute the natural dischargearea. This highlights the recharge of the unconfinedaquifer in the foot of the mountains. In addition, this mapshows a multidirectional flow mainly oriented to thepiezometric depressions, locally reaching levels of �5 m.These depressions are located in the western part at thesouth of Hammamet and in the eastern part at the ElMaamoura region.
METHODOLOGY
The principal methodology adopted in this article is theuse of TDEM survey to detect salinized zones and tomonitor seawater intrusion. Nevertheless, with referenceto different workers who have attempted the study ofseawater intrusion by geophysical methods (Ginsbergand Levanton, 1976; Goldman et al., 1991; Paine, 2003;Kafri and Goldman, 2005; Duque et al., 2008; Hodluret al., 2010), the intrusion phenomena and the back-ground resistivity picture make the interpretation of theresistivity data very difficult. The more challenging partof the interpretation is the attempt to link the low-resistivity zones to possible seawater intrusion. The porefluid, which can be a mixture of freshwater and seawaterwith varying proportion, will be embedded in the pores ofthe host rock, which will have different resistivitycorresponding to the mineral composition. In the study
Hydrol. Process. (2012)DOI: 10.1002/hyp

Figure 4. Piezometric map of the shallow aquifer (May, 2006)
DELINEATION OF SALTWATER INTRUSION ZONES USING TDEM
area, the clayey sand forms the principal host rock, and theseawater and the freshwater are embedded in the pores.Then, the presence of dispersed or interbeded clay willsuppress the bulk resistivity of the aquifer. The interpre-tation was performed on the basis that the very lowresistivity images could be attributed to the seawaterintrusion or clay. Hence, it will be misleading to attemptan interpretation totally based only on the TDEM results.The wireline logging data of boreholes are used to help, toassess the quality of the TDEM soundings and to identifylithological formations in the stratigraphic column. Inaddition, the concentration values of chloride from thewater samples of boreholes, located near the TDEMsoundings, have been used to verify the relationshipbetween the lithological units and the measured resistivity.
TDEM survey
The TDEM method has been used in environmentaland hydrogeologic studies, but its main requirement is theability to accurately detect the freshwater–saline waterinterface and to determine the bulk resistivity of theaquifer below the interface (Kafri and Goldman, 2005).This method was routinely used to detect the intrudingsaline water bodies during the last 20 years.A detailed description of the method is given by
Danielsen et al. (2003) and belongs to the category ofcontrolled source EM methods. The TDEM methodmakes use of a DC transmitted into the transmitter looplying on the ground. The current creates a primary,stationary magnetic field. The DC is switched off, whichinduces an eddy current system in the ground. Because ofthe ohmic resistance of the subsurface, the current systemwill decay and further induce a secondary magnetic fieldthat is measured in an induction coil (the receiver coil).
Copyright © 2012 John Wiley & Sons, Ltd.
The decay rate of the electromagnetic field depends on theresistivity distribution of the subsurface. The field decayis slower in a conductive medium than in a resistivemedium. The importance of the TDEM method lies on themeasurement time of the transient response. As alreadymentioned, the induced voltage at Rx (receiver) loop ismeasured after the Tx (transmitter) loop was turned off,which means that we measure a secondary response in theabsence of the primary field. This approach producesresults less sensitive to errors of Tx/Rx geometry. There isno need for complicated tools to separate the primarysignal, and the Tx/Rx separation has a small effect in theexploration depth (contrary to conventional controlledsource methods). These features produce results with thehighest lateral resolution. Consequently, the TDEMmethod has an excellent depth resolution of conductivelayers, whereas the resolution of resistive layers is limited(Christensen and Sørensen 1998). TDEM soundings areusually made with loop size ranging between 25 and 300m, depending on the exploration target. The penetrationdepth is dependent on the magnetic moment of theequipment (i.e. transmitter loop size and number of turnsand the transmitted current), the resistivity of the groundand the magnitude of electromagnetic background noise(Macnae et al., 1984; McCracken et al., 1986).The advantages of TDEM are the good sensitivity to
conductive formations, the depth of investigation that isgreater than the transmitter loop side length, the bestlateral and vertical resolution with regard to highlyconductive targets (Kaufman and Keller, 1983) and theconvenience of not requiring any galvanic contact withthe ground. The main disadvantages are poor sensitivityto resistive formations and shallow near surface layers(Figure 5; Everett and Meju 2005; Ernstson and Kirsch2006a).
Hydrol. Process. (2012)DOI: 10.1002/hyp

Figure 5. Physical principle of the TDEM. A stationary current flowing inthe transmitting loop creates a primary magnetic field. After this current isshut off, a secondary current is induced in the subsurface, which creates
secondary magnetic field, measured in the receiving coil
F. TRABELSI ET AL.
TDEM data acquisition and processing
The TDEM sounding technology enables to conductsubsurface soundings to a depth of 300 m, depending onthe frequency used (lower frequencies sense deeper intothe ground) and the geological formation (deeper for afreshwater-saturated zone than for a seawater intrudedzone). In this work, the measurements were made with aTEM FAST 48 battery-powered transmitter (4–16 ms),connected to a single-turn, ungrounded and insulatedcable in the form of a square loop with sides of between25 and 300 m. This instrument was used because of thefollowing characteristics: precision, ease of handling andrapidity of acquisition. However, 42 TDEM soundinglocations (Figure 1) were occupied with the coincidentloop configuration (50� 50- and 100� 100-m squareloops at 50- and 100-m spacing, respectively) aligned ona rectangular grid. Two approaches were adopted forselecting sounding locations and surveying strategy:(i) potential sounding locations were first selected basedon site size, and selected sites had to be large enough toaccommodate the 50-m2 transmitter loop geometriesproposed; and (ii) the locations that were sufficientlylarge for conducting a TDEM survey were then evaluatedon the basis of accessibility (road access and ownerpermission) and proximity to cultural features such aspower lines and metallic water distribution pipelines thatmay distort the electromagnetic fields and bias theinterpretation.Indeed, the voltage/time transients were recorded and
transformed to resistivity versus time. After the acquisi-tion, the TDEM collected data were edited, smoothed,analysed and processed using the TEM-Researchersoftware (Fainberg, 1999). Although, numerous measure-ments and studies (e.g. Goldman, 1988; Paine, 2003)
Copyright © 2012 John Wiley & Sons, Ltd.
correlated TDEM resistivities with groundwater salinities.These studies have shown that in most cases, the portionsof the aquifer saturated with seawater have resistivityvalues within a range of 1 to 3 Ω�m. The portions of theaquifer saturated with brackish waters (transition ormixing zone) exhibit resistivities between 3 and 10Ω�m, and fresh groundwater bodies show higher resistiv-ities. Observations from all around the world show similarresistivity values for saline water–saturated rocks, andmost important, they also show that almost anylithologies, whether freshwater saturated or dry, exhibitmuch higher resistivities (Palacky, 1987). This factenables the delineation of seawater intrusion along thelength of a coastal aquifer (Goldman et al., 1991) and isused, in this study, as a guideline for the interpretation ofvertical resistivity logs, 2D geoelectric sections and depthslices (resistivity maps).
Borehole data
The borehole logging data are used to calibrate theprocessed data of TDEM soundings and to identify thelithological formations. Borehole logging is the process ofmeasuring the physical, chemical and structural propertiesof penetrated geological formations usually using loggingtools that are lowered into a borehole on a wireline cable.Geophysical downhole logging is an important and strongtool in hydrogeology, for example, for constructingregional or local geological models of groundwaterreservoirs and for evaluation of borehole condition andwater-producing fractures at a detailed scale. Boreholelogging is the most certain and exact way to locatelithology changes; hence, geophysical logging is impor-tant in combination with, for example, seismic investiga-tions and other surface geophysical measurements(vertical electrical sounding, TDEM, etc.) for geologicalmodelling. Further, it is very important in combinationwith groundwater sampling from, for example, monitoringwells when delineating saltwater intrusion or pollutionplumes. The application of geophysical well loggingmethods have been dealt with by several publications overthe last several years: hydrogeological investigations(Repsold 1989, Mares et al., 1994, Jorgensen & Petricola1995, Kobr et al., 2005), coastal aquifers and freshwater–saltwater boundaries (Buckley et al., 2001, Hwang et al.,2004).In this study, various wireline logging data of 160 water
boreholes are provided by the local groundwater manage-ment authority (CRDA Nabeul). These borehole dataincluding radioactivity logging (natural gamma, gamma–gamma) and electrical logging (Self Potential (SP), ElectricLog (EL) and Microlog (ML)) were used for analyzinghydrogeological characteristics, identifying the type oflithological formation, calibrating the TDEM processeddata and finally interpreting the 2D geoelectrical section.The TDEM soundings were conducted wherever possibleat a maximum distance of 1 km of existing waterboreholes, allowing the correlation of TDEM resistivitylog with borehole logging.
Hydrol. Process. (2012)DOI: 10.1002/hyp

DELINEATION OF SALTWATER INTRUSION ZONES USING TDEM
However, the passive radioactivity measurements(Meyers, 1992) allow to distinguish between sand andclay layers and to estimate the clay content. The electricalwell logs, such as a self-potential tool (SP) and aresistivity log (electric log EL and microlog ML), areused in open holes to determine the electrical resistivity ofthe rock, which together with other physical parameterscan be used to derive a lithological log for the borehole(Maute 1992, Spies 1996).
RESULTS: INTERPRETATION
One-dimensional interpretation
A variety of TDEM data interpretation techniques havebeen proposed. These include the imaging techniques(Keller and Frischknecht, 1966; Ranieri, 2000), conduct-ive finite plate models (Keating and Crossley, 1990;Nabighian, 1979) and inversion methods that use 1Dhorizontal layered earth model (Christensen, 1995;Constable, 1987; Goldman, 1988; Raiche, 1984). Despitethe popularity of TDEMmethod, which is typically appliedfrom either ground-based or airborne platforms, TDEMdata have mainly been interpreted using 1D layered earthmodels. There are two main reasons for this: (i) thesubsurface can be conceptualized as a layered structure inmany cases and (ii) the fully 3D forward simulation ofthe TDEM signal propagation is computationallychallenging and CPU time intensive. In contrast, 1Dlayered earth TDEM forward modelling can be performedsemianalytically using integral transforms and digitalfiltering (Gottwein et al., 2010).The voltage/time transients were transformed to
resistivity/time and inverted into 1D layered models(Fainberg, 1999). Smooth models were produced using amodified Occam inversion (Constable et al., 1987). Noconstraints (on depths or resistivities) were applied to anyof the layered models. The depth of the regional waterlevel and the freshwater lens thickness known from apreexisting water supply borehole are provided on thebasis of the starting model.Nevertheless, an example of a 1D interpretation of
TDEM sounding is given in Figures 6a and 6b. Figure 6ashows that the field raw data were edited (e.g. first pointswere excluded from the curve for further analysis) andsmoothed before the modelling. The TEM-Researchersoftware provides two ways of processing the TDEMsounding: transformation and inversion. Figure 6bshows the transformation resistivity (Res (h)), which isthe distribution of specific resistivity versus apparentdepth (smooth curve) and the model after 1D inversion(piecewise uniform diagram).The interpretation of resistivity vertical log reveals that
most of the sites that yield sounding curves show amonotonic decrease in apparent resistivity with time.Such curve behaviour undoubtedly proves the presence ofa low-resistivity layer in the base of the section. At somesites, it was necessary to include a thin layer of very lowresistivity within the top resistive layer to be consistent
Copyright © 2012 John Wiley & Sons, Ltd.
with the data. However, the quantitative interpretation ofTDEM measurements is hampered by the equivalenceproblem, which means that several different layeredmodels may give practically the same resistivity curve. Tochoose the model that best represents actual subsurfaceconditions, supplementary data such as borehole loggingare used. Consequently, a correlation between TDEMresistivity logs and borehole logging was established.Moreover, TDEM method is most effective when theresistivity data can be calibrated with the analytic resultsof water samples from monitoring wells and boreholes. Inthis study, chloride concentration data are correlated withTDEM resistivity measurements.Indeed, Figure 7 shows the correlation between theTDEM
resistivity logs (T35 and T16) and the wireline logging(Gamma-Ray (GR), Self Potential (SP) and Electricalresistivity) of two boreholes (IRH 12500 and IRH 12545).These are located near Hammamet (Figure 7a) and Nabeul(Dar Chaabene) (Figure 7b) and at approximately 850 m and2 km from the coast, respectively. Figure 7a shows thatbelow the surface soil layer, gamma counts range between 10and 50 cps, indicating predominantly sands and sandstonesaround the borehole (Keys 1997). Electrical resistivity valuesrange from approximately 0 to 30 Ω�m, and the TDEMresistivity values range between 0.1 and 6 Ω�m. In theunsaturated zone (0–10 m), gamma counts range fromslightly higher than 20 to 40 cps over a range of electricalresistivity values between 23 and 28 Ω�m and TDEMresistivity values approximately 1 to 6Ω�m. The abrupt shiftin both electrical and TDEM resistivity curves at the watertable (�10.5 m) is immediately apparent. The apparentnegative correlation between gamma cps and resistivityvalues was shown in the saturated zone (10–37 m), wheregamma counts range from 10 to 40 cps over a range ofelectrical resistivity values approximately 15 to 20 Ω�m andTDEM resistivity values between 0.1 and 2 Ω�m. Inaddition, the relatively sharp decrease in resistivity in bothelectrical and TDEM resistivity logging at the depth (�40 m)mentions a relative transition zone. In addition, clayey sandand sandy silt sequences were identified on the basis of anoticeable increase in gamma count, which persist verticallyat a depth greater than 50 to 100m. The presence of dispersedor interbeded clay will suppress the bulk resistivity of theaquifer. The relatively high GR count in the borehole logreflects the clay-rich nature of the aquifer in this area. Low-resistivity measurements on both the TDEM sounding andthe electrical log represent the combined effects of claycontent and high salinity conditions within the NH aquifer atthis station. Moreover, the analytic result of the water sampleof this borehole shows a chloride concentration value of1075 mg/l, which support the hypothesis of contaminationby seawater intrusion.Therefore, in the borehole IRH 12545, the presence of
saline/or brackish water in sand (25–30 m) sedimentsaround and in the borehole is obvious. The GR, electricaland TDEM resistivity log curves indicate lower valuesranging between 20 and 30 cps, between 20 and 40 Ω�mand between 3 and 10 Ω�m, respectively. This persistedfor the lower part (32–100 m) of the main aquifer at this
Hydrol. Process. (2012)DOI: 10.1002/hyp

Figure 6. Example of a real field sounding curve with inversion results of the formation resistivity profile
F. TRABELSI ET AL.
site. Thus, the upper 30 m of the main aquifer (10–30 mbelow surface) contains freshwater. A sudden significantfall in both the electrical and the TDEM resistivity logs isobserved at a depth of approximately 32 m. This mayindicate a transition zone of freshwater–seawater inter-face. Also, the chloride content of analysed water sampleis of approximately 877 mg/l.
Figure 7. Correlation between TDEM resistivity logs
Copyright © 2012 John Wiley & Sons, Ltd.
Finally, the transition zone separating freshwater andseawater is recognizable between 30 and 35 m depth inFigure 7a and between 25 and 30 m depth in Figure 7b.However, the correlation between wireline logging data
of coastal neighbouring boreholes (IRH 13208, IRH11644, IRH 11736, IRH 12500, IRH 13242 and IRH12545), TDEM logs and lithologic columns was con-
and borehole logging data (GR, SP and resistivity)
Hydrol. Process. (2012)DOI: 10.1002/hyp

DELINEATION OF SALTWATER INTRUSION ZONES USING TDEM
ducted to show the freshwater–seawater transition zone.In the following parts, 2D geoelectrical sections weremade to support this interpretation (Figure 8).
Two-dimensional geoelectrical sections
The geoelectric sections were established on the basisof the TDEM soundings interpreted with the assumptionof a 1D structure and correlated with the borehole loggingdata. These cross sections were drawn using the results ofinterpretation with a minimum number of layers. All themeasured stations are processed and plotted along profilesto show the resistivity distribution with depth anddistance, to define the geometry of the aquifer, to identifythe structures and to map the transition zone offreshwater–seawater and saltwater wedge.Figure 9 shows a west–east, dip-parallel profile 1 (P1)
(Figure 1), comprising seven TDEM soundings, startingfrom sounding T31 on the far west end to sounding T16on the far east end of the profile, which extends toapproximately 39 km. This coastal geoelectrical sectionhighlights the presence of three water zones (Figure 9).Near the surface interval, a high-resistivity zone of 10 to31 Ω�m and a thickness range between 36 and 72 mappear, indicative of freshwater zone (A). The lithologynature of this zone is clayey sand with encrustedlimestone grounds, which constitute the accumulationzone of water and a preferred path of water draining. Thesecond water zone has a resistivity and thickness thatranged between 3 and 10 Ω�m and between 34 and 57 m,respectively, characterized by sandy clay and sandydeposits and can be classed as brackish water zone (B).The third water zone (C) of clayey sand and sandysediments has a low-resistivity layer with 1 to 3 Ω�m andcould be attributed to saline water zone. It is noticeablethat the freshwater–seawater interface is clearly indicatedon this cross section. The rise almost to the surface ofseawater intrusion is clearly showing in TDEM soundings
Figure 8. Cross section of correlation between borehol
Copyright © 2012 John Wiley & Sons, Ltd.
T8, T31, T35 and T36. Finally, it shows at the deeperportion of the section, a very low resistivity zone (D) with0.1 to 1 Ω�m due to high salinity conditions. By contrast,any hydro-lithostratigraphic detail is almost completelymasked in this interval of depth, where low-resistivity,highly saline aquifers are difficult to distinguish fromintervening clays. However, the salinity of groundwater isusually the predominant influence on TDEM resistivitymeasurements (Goldman et al., 1991); thus, TDEMrecords do not always lend themselves well to lithostrati-graphic correlation. In the shallower part of a TDEMprofile, the distinctions can be often shown between thehigh resistivity of freshwater aquifers and the lowresistivity of clays in the intervening confining beds.To show the continuity of the seawater intrusion, a
NE–SW geoelectrical section (Figure 10) was constructedfrom a transversal profile (P2) (Figure 1), crossing thequaternary deposits of Grombalia Graben. This comprisesfive TDEM soundings, starting from sounding T20 on thefar northeast end to sounding T31 on the far southwestend of the profile, which extends to approximately 12 km.This cross section shows a relatively high-resistivity zoneof 10 to 32 Ω�m with a thickness range between 55 and 90m, which gets shallower southward and disappears nearthe coast. This zone is constituted by clayey sandinterceded with bedded clay and considered as freshwaterzone (zone A). There is also a relatively mediumresistivity shallow layer with 3 to 10 Ω�m and thicknessapproximately 20 to 76 m, attributed to clayey sandstoneand sandy sediments saturated with brackish water(zone B). Also in greater depth, a high-resistivity layerranging from 12 to 32 Ω�m appears (zone E). However,because of the lack of hydro-lithostratigraphic data in thisportion of section, this resistivity can be explained by theexistence of deeper confined aquifer formations orresistive deposits. Although towards the coast, it showsthe Quaternary alluvium deposits saturated with salty
e logging data, TDEM logs and lithological columns
Hydrol. Process. (2012)DOI: 10.1002/hyp

Figure 9. Geoelectrical section (P1)
F. TRABELSI ET AL.
water with a resistivity range of 0.1 to 3 Ω�m (zone D).Hence, this section illustrates the appearance of animportant salinized zone in the coast of Hammamet Sud.Figure 11 shows the geoelectrical section constructed
from the profile (P3) (Figure 1) perpendicular to the coastand parallel to NW–SE major fault (Ben Salem andColleuil, 1991). It comprises six TDEM soundings,starting from sounding T4 on the far northwest end tosounding T8 on the far southeast end, which extends toapproximately 18 km. From the northwestern side, it showsa surface horizon made of sandy deposits (upper Pliocene)characterized by medium resistivities (10–27 Ω�m). Thisstratum is saturated with more or less freshwater (zone A).Towards the coast, this horizon passes laterally to sandydeposits of the Quaternary alluvium saturated withbrackish to salty water (zone B), with a resistivity rangingbetween 3 and 10 Ω�m. Therefore, a low-resistivity zone(3–5Ω�m) rich in clay and marl (zone C) may contain salts
Figure 10. Geoelect
Copyright © 2012 John Wiley & Sons, Ltd.
washed from the surface and concentrated at greater depth.This zone can constitute the substratum of the aquiferformation and then shows a very low resistivity zonetowards the coast (0.1–3 Ω�m) (zone D), extending fromfew metres to a depth greater than 150 m. This zone can beattributed to seawater intrusion zone. Also, there is in adeeper section a very high resistivity layer of approxi-mately 30 to 90Ω�mwith thickness upper than 100 m, richin sand, sand with marl and sand with limestone which. Inaddition, because of the lack of hydrostratigraphic details,this zone may present freshwater aquifer formations orresistive deposits.This low- to high-resistivity variation of freshwater
zone can be explained by the lateral effect of the citedfault, although the resistivity within a fracture zone is ingeneral lower than the resistivity of the host rock.The low-resistivity most probably reflects the changesassociated with fault zones (e.g. shearing, shale smearing,
rical section (P2)
Hydrol. Process. (2012)DOI: 10.1002/hyp

Figure 11. Geoelectrical section (P3)
DELINEATION OF SALTWATER INTRUSION ZONES USING TDEM
clay and loam infiltration, fracture filling and washed saltsfrom surface water flooding) (Ernstson and Kirsch,2006b). Consequently, we assume that in the nearsurface, the resistivity of freshwater might be affectedby the extension of NW–SE fault crossing the WadiAmroun. Also, it could be due to saturated shale or low-resistivity minerals like gypsum or clay minerals that fillthe fault plane running perpendicular to the coast. Itshould be noted that the Messinian outcropping (Oued ElBir formation) is close to this area (Colleuil, 1976;Fournié, 1978; Bismuth, 1984; Bédir et al., 1996 andMoissette et al., 2010). In addition, this cross fault can bea conduit for seawater (zone D) to move readily towardsthe water wells.
Apparent iso-resistivity maps
Apparent iso-resistivity maps at different depths. On thebasis of the previous TDEM interpretation, six compliedmaps were constructed at different depths (10, 20, 40, 50,65 and 100 m) (Figure 12), derived from the Occamsmooth-type interpretation of each TDEM sounding. Atthe depth of 10 m (Figure 12a), relatively high-resistivitymaterials may represent deposits of sand and gravel withfreshwater at some sites. The relatively low-resistivityzones could be attributed to surface clay and siltsediments. At the coastal part, it corresponds to saltywater associated with clays and silt close to the coastalarea. At the depth of 20 (Figure 12b), there is relativelyhigh-resistivity zone, both at the centre of the valley ofOued El Msan in the east and Oued Lassoued-El Baten inthe west. Most probably, these zones represent freshwatercoming from Jebel al Rwibia (NE) and Jebel Ech-Chagchag (NW) foothills, respectively, following thedrainage pattern of the flood direction, which starts fromthe northeast and the northwest ends towards the sea(south). The conductive zones at the shallow layerscontinue and expand with depth. An important conductivezone is close from major faults shown in the geologic map(Figure 1). This low-resistivity expansion reflects thechanges associated with fault zone. At a greater depth(40 and 100 m; Figures 12c–12f), there is a very low
Copyright © 2012 John Wiley & Sons, Ltd.
resistivity at the southwestern part of the study area, inHammamet South, which starts to show up at 30 m depth.This low resistivity could be attributed to seawaterintrusion that might be associated with clays and silt,whereas the high-resistivity values at the northeastern partcould be attributed to freshwater zone. However, there isa well-defined boundary between conductive and resistivezones that almost divides the study area into three zones.Both the southern and the northwestern zones have lowresistivity, which are attributed to the presence of claysand silt of Plio-Quaternary and Oligo-Eocene deposits,respectively, whereas the northeastern zone has arelatively high resistivity from the conglomerates andthe sandstones of Miocene deposits. For all maps, theresistivity values less than 3 Ω�m were attributed to low-permeability materials such as clayey sediments orsediments with a high percentage of clay saturated withsalty water. Materials with interpreted resistivity of 5 to10 Ω�m probably represent sediments with low percent-age of clay and with brackish water. Finally, materialswith an interpreted resistivity range of 20 to 85 Ω�mprobably represent sediments with greater amounts ofsand and gravel and freshwater saturated.
Apparent iso-resistivity and iso-depth maps of the salinizedzone. The map of iso-resistivity surfaces may estimate thelocation and the depth of salty water zone. The iso-resistivity map of the salinized zone (Figure 13a) showstwo low-resistivity lobes in the southeastern part of thearea. The first lobe is just located at El Mammoura zone,measuring a distance at least of 1.5 km. In the north ofNabeul (Dar Chaabene), a second lobe is shown, reaching5 km far from the coast and indicating the advance ofseawater intrusion towards inland. This saltwater en-croachment can be probably facilitated by the majorsurface fault. In addition, between Nabeul and Al Mrazgaareas, two great extension lobes are shown, which reach adistance approximately 3 km from the coast. Also, in thetouristic zone of the north of Hammamet, the seawaterintrusion zone reaches a distance approximately 2 km ofthe current coast. Throughout the study area, the south of
Hydrol. Process. (2012)DOI: 10.1002/hyp

Figure 12. Apparent iso-resistivity maps at (a) 10, (b) 20, (c) 40, (d) 50, (f) 90 and (g) 100 m depth derived from TDEM inversion of smooth models
F. TRABELSI ET AL.
Hammamet represents the most contaminated zone byseawater intrusion, which can be explained by theupconing of saltwater that may be occurring to excessivewithdrawals from local supply wells. Some small zoneswith relatively high resistivities located along the coastare the consequence of the direct rainwater infiltrationthrough the sandy coastal recent dunes or the Plioceneformation lens (sand and sandstone of Hammamet). In thenorthwestern part, it shows a great extension of low-resistivity lobe. The groundwater in this zone is saturatedwith more or less salty to brackish water. This salinizationis probably due to the two sources other than seawaterintrusion. The first is probably due to the Quaternary(Villafranchian) outcropping rich of clayey sandstonedeposits. The second is the effect of the stagnant waters ofa hill reservoir (Laziar-Sidi Jedidi) and four hill dams(Guettar, Moussa Chem, Lassoued and Chagcheg) on thegroundwater quality.Thus, the iso-depth map of the salinized zones
(Figure 13b) shows that the freshwater–seawater transi-tion zone reaches shallow levels in Nabeul (Dar Chaabeneand Sidi El Mehrzi) and Hammamet (the north and southTouristic zone and Bareket Essahel) with 3.5 to 30 mdepth. The seawater encroachment occupies a surfacerelatively limited, but in south Hammamet, the surface
Copyright © 2012 John Wiley & Sons, Ltd.
occupied by the rise of seawater intrusion is relativelymore significant.Furthermore, the compilation of the spatial distribution
of chloride concentration (Figure 14) and the TDEM iso-resistivity map of the salinized zone (Figure 13a) formtogether a good agreement for the presence of salinizedzones in the cited localities of NH area.On the one hand, far to the coastline (in Bir Bouragba
locality), two water samples of shallow wells indicate achloride content of approximately 78 mg/l and coincidewith the TDEM resistivity range between 25 and 40 Ω�m.On the other hand, near the coastline (in the south ofHammamet), TDEM sounding has recorded a very lowresistivity of 3.9Ω�mwhile the chloride content value is of2275 mg/l. Also, near the zone of Nabeul–Sidi el Mahrsi,TDEM resistivity is of 5.37 Ω�m, corresponding to highchloride concentrations of approximately 1927.65 mg/l.
Three-dimensional plume
On the basis of the inversion solution of allgeoelectromagnetic field data, a 3D model of the spatialdistribution of formation resistivities was developed forthe area. It is performed using the EnvironmentalVisualisation Software data representation. The program
Hydrol. Process. (2012)DOI: 10.1002/hyp

Figure 13. (a) Iso-resistivity map of the salinized zone. (b) Iso-depth map of the salinized zone
Figure 14. Spatial distribution of chloride concentration evaluated by a hydrogeochemical analysed in the unconfined aquifer of NH
DELINEATION OF SALTWATER INTRUSION ZONES USING TDEM
Copyright © 2012 John Wiley & Sons, Ltd. Hydrol. Process. (2012)DOI: 10.1002/hyp

F. TRABELSI ET AL.
is able to extract data from the entire volume investigated(i.e. resistivities higher, lower than fixed value) andreconstruct the plume or the extension of a layer using 3Dinterpolation. They revealed a spatial variability of thefreshwater–seawater interface with elevation. Figure 15represents a 3D plume with the formation resistivitybetween 1 and 5 Ω�m representing a brackish-salty water–saturated zone. However, in the NH coastal plain, closerto Nabeul (Sidi El Mahrzi, El Gasba) and to Hammamet(north and south of touristic zone), a seawater intrusioncan be observed. However, towards the inland area, thelow-resistivity lobes detected in the western part and tothe northward can be attributed to the salty clay nature ofthe shallow aquifer in these zones.Furthermore, a small lobe with low resistivity is
visualized in the eastern part. It reflects the changesassociated with fault zones and probably due to low-resistivity minerals like gypsum or clay minerals thatfill the fault plane. The 3D model obtained for the NHbasin confirms the previous results deduced from 2Dgeoelectrical section and iso-resistivity surface maps.
DISCUSSION
The analysis of the previously indicated results revealsdifferent interpretations and assumptions; for example,the coastal geoelectrical section (P2) (Figure 10) showsthe distribution of different water types (saline, brackishand fresh). This is consistent with the concept of theclassical seawater intrusion phenomenon, described in thecoastal zones in which the saltwater wedge is orientedbecause the coast moves towards the inland with asuccession of saline, brackish and freshwater. Thisconventional configuration of seawater intrusion is notconsistently observed in some zones. Different TDEMsoundings have shown the presence of saline or brackishwater in remote areas of the coast. In the northeasternpart, at Dar Chaabene north, the interface of fresh andseawater reached a depth of 22 m in the TDEM sounding(T13), 5 km far from the coast. Towards the south west,precisely at Bareket Essahel, the brackish water reached
Figure 15. Three-dimensional model of resistivity layer ranging between1 and 5 Ω�m
Copyright © 2012 John Wiley & Sons, Ltd.
23 m in TDEM sounding (T28) and located more than 3.5km far from the coast.These TDEM geophysical results are confirmed by the
analysis of chloride concentration in the available shallowwells and boreholes in this area (Figure 14). At the northof Nabeul (Dar Chaabene) and Hammamet (BareketEssahel), the water sample analyses of two shallowwells situated near TDEM sounding locations recordeda chloride concentration of approximately 1690 and2297 mg/l, respectively.Near the coastal zone, the absence of salty-brackish
water until at least 10.5 m depth is recorded in TDEMsounding (T33) close to the coast, whereas the presenceof saline water at 1.5m depth is recorded in anotherTDEM sounding (T35). This distribution cannot beexplained alone with seawater intrusion concept. Thevalues of chloride concentration in the water samples, oftwo shallow wells situated at proximity of the previouslycited TDEM soundings, reach 110 and 1927mg/l,respectively.This study highlights the heterogeneity and complexity
of the distribution of freshwater–seawater interface in NHcoastal area. The ‘sawtooth’ distribution of fresh, brackishand salty waters, regardless of the depth of shallow wellor borehole, is at odds with the concept of seawaterintrusion. However, in the classic model of seawaterwedges, several geological sources can affect coastalgroundwater quality (Custodio, 1997; Barlow, 2003).These sources include the following: (i) the migration ofsubsurface saline water through faults, fractures orpermeable geologic units where driven by gravity orfluid pressure; (ii) the entrapped fossil seawater in theunflushed parts of an aquifer, in which such water waseither trapped in sedimentary formations when they weredeposited (connate water) or flowed into the formationsduring periods of relatively high sea levels when seawaterflooded low-lying coastal areas; and (iii) the dissolutionof evaporitic deposits such as halite (rock salt), anhydriteand gypsum (Barlow, 2003).Moreover, the interpretation of TDEM geoelectrical
sections and iso-resistivity maps allows us to confirm thepresence of major normal fault-directed NW–SE crossingthe eastern part of the study area (Ben Salem, 1992) andto identify new faults overlain by Plio-Quaternarydeposits. This major fault was created during a tectonicactivity from the Pliocene to the present and wasinterpreted as being responsible for a considerabledisplacement of a major part of quaternary deposits(Castany, 1948; Chihi, 1995; Ben Salem, 1992). How-ever, the geoelectrical section P3 (Figure 11) shows thatin both zones of Dar Chaabene north and El Maamoura,low-resistivity anomalies have been visualized andaligned along the southern extension of the cited majorfault located near the coast. The TDEM sounding (T13)carried out in the north of Dar Chaabene presents aresistivity of 12.43 Ω�m at 12.25 m depth. The TDEMsounding (T16) localized in the El Maamoura zonereveals a resistivity of 11 Ω�m at 11.5 m depth. On theother side, the TDEM sounding (T14) located in the
Hydrol. Process. (2012)DOI: 10.1002/hyp

DELINEATION OF SALTWATER INTRUSION ZONES USING TDEM
northern part of this fault shows that the ground issaturated with freshwater up to at least 64 m and with aresistivity of 46.53 Ω�m. In addition, the presence ofbrackish water in this area is confirmed by the high valueof chloride concentration, where the values of 2297 and878 mg/l are recorded in the two shallow wells of DarChaabene north and El Maamoura, respectively. Twohypotheses can be conducted on the origin of these low-resistivity and brackish waters detected in this eastern partof study area. First, the low-resistivity is due to openwater-filled fissures; the resistivity within a fault orfracture zone is in general lower than the resistivity of thehard rock. Clay and silt infiltration through the fault planeand fractures leads to low resistivities but on the otherhand strongly reduces hydraulic conductivities (Ernstsonand Kirsch, 2006b). Consequently, the origin of salty-brackish water of Dar Chaabene north is the marineMessinian deposits (upper Miocene) of Oued el Birformation trapped in the open fissures of this major fault.These deposits consist of sands, sandstones, clays andgypsum (Moissette et al., 2010). The seawater invasioninterests permeable rocks for fractures. Hence, the secondhypothesis is that the cited major fault seems to make therock very permeable perpendicular to the coastline and toprovide a conduit for seawater to move readily towardsthe wells. In the western part, two TDEM soundings (T29and T30) are localized at 6 and 9 km, respectively, farfrom the coast and on Villafranchian Quaternary deposits.These TDEM soundings show the resistivity of approxi-mately 9.78 and 7.39 Ω�m at depths lower than 21.5 and116.5 m, respectively. The water samples of two shallowwater wells situated at close of these TDEM soundingsshow values of chloride concentrations at 113.6 and195.25 mg/l, respectively. This leads to the assumptionthat the recorded low resistivity is probably due to anothersource than seawater intrusion. It is probably attributiveof the lithological nature of clayey sandstone shallowaquifer in this area.
CONCLUSION
The stratigraphic section of the coastal plain of NHregion consists of a complex blend of several lithologies,which are heterogeneous aquifers of sand and limestonecontaining highly variable amounts of both dispersed andinterbeded clays and/or separated by sandy clay confin-ing beds. Hence, the freshwater zone containing a highpercentage of clays has lower apparent resistivity thanclean sand or limestone aquifer. Both clay and saline porefluids can suppress the bulk resistivity of aquifer, and theunknotting of the two signals is one of the morechallenging aspects of interpreting data from a TDEMsounding. This problem is best resolved in this study bythe correlation of TDEM resistivity logs with boreholelogging data, which are also calibrated with the chloridecontent results of water samples from neighbouringboreholes and shallow wells. Also, 2D geoelectricalsections, both iso-resistivity and iso-depth maps of
Copyright © 2012 John Wiley & Sons, Ltd.
salinized zone, 3D plume and distribution of chlorideconcentration map were established. All results werecompiled, interpreted with a thorough understandingof the local and regional geological settings andprovided additional information on the regional hydro-lithostratigraphic data of the Plio-Quaternary aquifer ofNH, especially on the distribution of freshwater–seawatertransition zone. Therefore, the salinized zones aredetected closer to the Nabeul region (Sidi Moussa, SidiEl Mahrsi, Al Gasba and Mrazgua) and the Hammametregion (Touristic zone of Hammamet north, BaraketEssahel and Hammamet Sud).The vertical transition from fresh to salty conditions
may not be abrupt but can occur over a fairly broad depthrange of several metres to tens of metres. The TDEMresistivity values within a transition zone may range from~1 to 5 Ω�m, depending on the chloride concentration, theclay content, the porosity and the presence of otherdissolved solids.In this study, different hypotheses were proposed to
explain the relationship between the litho-structuralcontext and the water salinization of NH aquifer. Theseawater intrusion is directly dependent on the geometry,geology and hydrodynamic characteristics of the NHaquifer, as reflected by its heterogeneous nature. Further-more, this study points out the juxtaposition of deepsaline intrusions, demonstrating that the concept of ahomogeneous wedge-shaped body parallel to the seashorecan no longer be used to describe the NH aquifer. Indeed,TDEM profiling provided additional information on therelation between tectonic events and saline waterintrusion. Saltwater seems to follow preferential intrusiondirections corresponding to fault rather than the classicmodel of a salt wedge. These results suggest thehypothesis that the seawater intrusion relates to thetectonic configuration of the aquifer. The presence of aseawater front located far from the coast, as indicated byTDEM soundings, could be explained by the geologicalhistory of the NH area. Finally, seawater intrusion andsaltwater transport phenomena typically produce electric-al conductivity contrasts in the subsurface. Results of thisstudy reveal that TDEM method is powerful tool to mapthese contrasts, to detect freshwater–seawater transitionzone and to monitor hydrogeology conditions in thecomplex and heterogeneous geological setting of coastalgroundwater environments.
ACKNOWLEDGEMENTS
This work was conducted as part of cooperative researchstudies between the Faculty of Engineering of Cagliari inItaly and the National Institute of Agronomy (INAT) inframework of Interlink project of Italian Ministry ofResearch, coordinated by Prof. Gaetano Ranieri. Specialthanks are due to the local groundwater managementauthority (CRDA Nabeul) for providing hydrogeologicaldata. We are grateful to the Geophysics laboratory at theFaculty of Engineering at University of Cagliari who
Hydrol. Process. (2012)DOI: 10.1002/hyp

F. TRABELSI ET AL.
provided significant logistic and financial support. Sincerethanks are also due to the anonymous reviewers for theirhelpful comments and suggestions, which improved thequality of this manuscript.
REFERENCES
Barlow PM. 2003. Ground Water in Freshwater-Saltwater Environmentsof the Atlantic Coast. U.S. Geological Survey, Reston, Virginia.Circular 1262: 121.
Bédir M, Tlig S, Bobier C, Aissaoui N. 1996. Sequence stratigraphy, basindynamics and petroleum geology of the Miocene from Eastern Tunisia.Am Assoc Petrol Geol Bull 80(1): 63–81.
Ben Ayed N. 1986. Evolution tectonique de l’avant pays de la chaînealpine de Tunisie du début du Mésozoïque à l’Actuel, Thèse Sciences,Université Paris Sud: Orsay, France; pp 327.
Ben Salem H, Colleuil B. 1991. Carte géologique de la Tunisie à l’échelle1/ 50.000, Feuille de Nabeul n� 30.
Ben Salem H. 1992. Contribution à la connaissance de la géologie du CapBon: Stratigraphie, Tectonique et Sédimentologie. Thèse 3ème cycleFaculté des Sciences de Tunis, Université de Tunis II: pp 144.
Bismuth H. 1984. Les unités lithostratigraphiques du Miocène en Tunisieorientale. Société des Sciences de la Terre de Tunisie, Tunis, p. 3.
Blondel T. 1991. Les séries à tendance régressive marine du Miocèneinférieur à moyen en Tunisie centrale, Thèse ès-Sciences Gèologiques:Université de Genève; pp 487.
Buckley DK, Hinsby K, Manzano M. 2001. Application of geophysicalborehole logging techniques to examine coastal aquifer. Palaeohy-drogeology. In Palaeowaters in coastal Europe. Evolution ofgroundwater since the late Pleistocene, Vol. 189, Edmunds WM,Milne CJ (eds). Geological Society: London, Special Publication;251–270.
Burollet PF. 1956. Contribution à l’étude stratigraphique de la Tunisiecentrale. Annales Mines et Géologie Tunis 18: 195–203.
Castany G. 1948. Les fossés d’effondrement de Tunisie. Ann. Min.Geol. Tunis, p 3.
Chakroun A, Zaghbib-Turki D, Moigne AM, De Lumley H. 2005.Découverte d’une faune de mammifère du Pléisticène supérieur dansla grotte d’El Geffel (Cap-Bon, Tunisie). CR Palevol 4: 317–325.
Chihi L. 1995. Les fossés néogènes à quaternaire de la Tunisie et de la merpélagienne: une étude structurale et une signification dans le cadregéodynamique de la Méditerranée centrale. Thèse de Doctorat èsSciences Géologiques. Univ de Tunis II. Fac Sc Tunis, pp 324.
Choudhury K, Saha DK. 2004. Integrated geophysical and chemical studyof saline water intrusion. Ground Water 42(5): 671–677.
Christensen NB. 1995. 1D imaging of central loop transient electromag-netic soundings. J Environ Eng Geophys 53–66.
Christensen NB, Sørensen KI. 1998. Surface and borehole electric andelectromagnetic methods for hydrogeophysical investigations.European Journal of Environmental and Engineering Geophysics3(1): 75–90.
Colleuil B. 1976. Etude stratigraphique et néotectonique des formationsnéogènes et quaternaires de la région Nabeul–Hammamet (Cap Bon,Tunisie). Mémoire de D.E.S, pp 94.
Constable S, Parker R, Constable C. 1987. Occam’s inversion. A practicalalgorithm for generating smooth models from electromagnetic soundingdata. Geophysics 52(3): 289–300.
Custodio E. 1997. Detection, chap. 2 in Seawater intrusion in coastalaquifers—Guidelines for study, monitoring and control: Rome, Italy,Food and Agriculture Organization of the United Nations. WaterReports 11: 6–22.
Danielsen JE, Auken E, Jorgensen F, Søndergaard VH, Sørensen KI.2003. The application of the transient electromagnetic method inhydrogeophysical surveys. Journal of Applied Geophysics 53: 181–198.
De Breuk W, De Moor G. 1969. The water table aquifer in the easterncoastal area of Belgium. Bull. Assoc. Sci. Hydro 14: 137–155.
Duque C, Calvache M, Pedrera A, Martı´n-Rosales W, Lo´pez-ChicanoM. 2008. Combined time domain electromagnetic soundings andgravimetry to determine marine intrusion in a detrital coastal aquifer(Southern Spain). Journal of Hydrology 349: 536–547.
DWR, District of the Water Resources of Nabeul. 2005. Annuaired’exploitation des nappes phréatiques.
Ebraheem AAM, Senosy MM, Dahab KA. 1997. Geoelectrical andhydrogeochemical studies for delineating ground-water contamination
Copyright © 2012 John Wiley & Sons, Ltd.
due to salt-water intrusion in the northern part of the Nile Delta, Egypt.Ground Water 35(2): 216–222.
Elmejdoub N, Jedoui Y. 2009. Pleistocene raised marine deposits of theCap Bon peninsula (N-E Tunisia): records of sea-level highstands,climatic changes and coastal uplift. Geomorphology 112:179–189.
Ernstson K, Kirsch R. 2006a. The transient electromagnetic methods. InGroundwater geophysics: a tool for hydrogeology, Krisch R (ed).Springer: Berlin; 179–226.
Ernstson K, Kirsch R. 2006b. Aquifer structures: fracture zones and caves.In Groundwater geophysics: a tool for hydrogeology, Krisch R (ed).Springer: Berlin; 447–474.
Everett M, Meju M. 2005. Near surface controlled-source electromagneticinduction: background and recent advances. In Hydrogeophysics, RubinY, Hubbard S (eds). Springer: The Netherlands.
Fainberg E. 1999. TEM FAST 48 manual. Applied ElectromagneticResearch (AEMR): the Netherlands.
Fitterman DV, Stewart MT. 1986. Transient electromagnetic soundingsfor groundwater. Geophysics 51: 995–1006.
Fournié D. 1978. Nomenclature lithostratigraphique des séries du Crétacésupérieur au Tertiaire de Tunisie. Bull. Centr. Rech. Explor. Prod. Elf-Aquitaine 2: 97–114.
Frohlich RK, Urish DW, Fuller J, Reilly MO. 1994. Use of geoelectricalmethod in groundwater pollution surveys in a coastal environment.Journal of Applied Geophysics 32: 139–154.
Ginsberg A, Levanton A. 1976. Determination of saltwater interfaceby electrical resistivity sounding. Hydrological Science Bulletin 21:561–568.
Goldman M. 1988. Transient electromagnetic inversion based on anapproximate solution to the forward problem. Geophysics 53: 118–128.
Goldman M, Gilad D, Ronen A, Melloul A. 1991. Mapping of seawaterintrusion into the coastal aquifer of Israel by the time domainelectromagnetic method. Geoexploration 28: 153–174.
Goldman M, Neubauer F. 1994. Groundwater exploration using integratedgeophysical techniques. Surveys in Geophysics 15: 331–361.
Gottwein PB, Gondwe BN, Christiansen L, Herckenrath D, Kgotlhang L,Zimmermann S. 2010. Hydrogeophysical exploration of three-dimensionalsalinity anomalies with the time-domain electromagnetic method (TDEM).Journal of Hydrology 380: 318–329.
Hodlur GK, Dhakate R, Sirisha T, Panaskar DB. 2010. Resolution offreshwater and saline water aquifers by composite geophysical dataanalysis methods. Hydrological Sciences Journal 55(3): 414–434.
Hoekstra P, Bloom M. 1986. Case histories of time domainelectromagnetic soundings in environmental geophysics. In Geotech-nical and Environmental Geophysics, vol. 2, Ward S (ed). SEG:Tulsa, OK; 1–15.
Hwang S, Shin J, Park I, Lee S. 2004. Assessment of seawaterintrusion using geophysical well logging and electrical soundings ina coastal aquifer. Youngkwang-gun, Korea. Exploration Geophysics35: 99–104.
Jorgensen DG, Petricola M. 1995. Research borehole geophysicallogging in determining geohydrologic properties. Ground Water33(4): 589–596.
Kafri U, Goldman M, Lang B. 1997. Detection of subsurface brines,freshwater bodies and the interface configuration in between by theTime Domain Electromagnetic (TDEM) method in the Dead Sea rift,Israel. J. Env. Geol 31: 42–49.
Kafri U, Goldman M. 2005. The use of time domain electromagneticmethod to delineate saline groundwater in granular and carbonateaquifers and to evaluate their porosity. Journal of Applied Geophysics57: 167–178.
Kaufman AA, Keller GV. 1983. Frequency and Transient Soundings.Elsevier: Amsterdam.
Keating PB, Crossley DJ. 1990. The inversion of time-domain electromag-netic data using the finite plate model. Geophysics 55: 705–711.
Keller GV, Frischknecht FC. 1966. Electrical Methods in GeophysicalProspecting. Pergamon: NY.
Kerrou J, Renard P, Tarhouni J. 2010. Status of the Korba groundwaterresources (Tunisia): observations and three-dimensional modelling ofseawater intrusion Hydrogeology Journal 18: 1173–1190.
Keys WS. 1997. A practical guide to borehole geophysics inenvironmental investigations. Lewis Publishers: Boca Raton, Florida.
Kobr M, Mares S, Paillet F. 2005. Geophysical well logging—Boreholegeophysics for hydrogeological studies: Principles and applications. InHydrogeophysics, Rubin Y, Hubbard SS (eds). Springer: Amsterdam;291–331.
Kouzana L, Ben Mammou A, Sfar Felfoul M. 2009. Seawater intrusionand associated processes: case of the Korba aquifer (Cap-Bon, Tunisia).CR Geosci 341: 21–35.
Hydrol. Process. (2012)DOI: 10.1002/hyp

DELINEATION OF SALTWATER INTRUSION ZONES USING TDEM
Macnae JC, Lamontagne Y, West GF. 1984. Noise processing techniquesfor time domain EM systems. Geophysics 49: 934– 948.
Mares S, Zboril A, Kelly WE. 1994. Logging for the determination ofaquifer hydraulic properties. The Log Analyst 35(6): 28–36.
Maute RE. 1992. Electrical logging: State-of-theart. The Log Analyst33(3): 206–227.
McCracken KG, Oristaglio ML, Hohmann GW. 1986. The minimization ofnoise in electromagnetic exploration systems. Geophysics 51: 819–832.
Meyers GD. 1992. A Review of Nuclear Logging. The Log Analyst 33(3):228–238.
Moissette P, Cornée JJ, Mannaï-Tayech B, Rabhi M, André JP,Koskeridou E, Méon H. 2010. The western edge of the MediterraneanPelagian Platform: A Messinian mixed siliciclastic–carbonate ramp innorthern Tunisia. Palaeogeography Palaeoclimatology Palaeoecology285: 85–103.
Nabighian MN. 1979. Quasistatic transcient response of a conductinghalfspace. An approximate representation. Geophysics 44: 1700–1705.
Nassir ASS, Loke MH, Lee CY, Nawawi MNM. 2000. Salt–waterintrusion mapping by geoelectrical imaging surveys. GeophysicalProspecting 48: 647–661.
Nowroozi AA, Horrocks SB, Henderson P. 1999. Saltwater intrusion intofreshwater aquifer in the eastern shore of Virginia: A reconnaissanceelectrical resistivity survey. Journal of Applied Geophysics 42: 1–22.
Ozer A, Pskoff R, Sanlaville P, Ulzega A. 1980. Essai de corrélation duPléistocène supérieur de la Sardaigne et de la Tunisie. CR Acad. Sci.Paris, Ser D 291: 801–804.
Paine JG. 2003. Determining salinization extent, identifying salinity sources,and estimating chloride mass using surface, borehole, and airborneelectromagnetic inductionmethods.Water Resources Research 39(3): 1–10.
Palacky GI. 1987. Resistivity characteristics of geological targets. InElectromagnetic Methods in Applied Geophysics-Theory, Nabighian, M(ed). Society of Exploration Geophysicists: Tulsa, OK; 53–129.
Paniconi C, Khlaifi I, Lecca G, Giacomelli A, Tarhouni J. 2001. Modelingand analysis of seawater intrusion in the coastal aquifer of easternCap-Bon, Tunisia. Transport Porous Med 43: 3–28.
Raiche AP. 1984. The effect of ramp function turn-off on the TEMresponse of a layered ground. Exploration Geophysics 15: 37–41.
Ranieri G. 2000. Tem Fast: a useful tool for hydrogeologists andenvironmental engineers. Annali di Geofisica 43(6): 1147–1158.
Copyright © 2012 John Wiley & Sons, Ltd.
Repsold H. 1989. Well Logging in Groundwater Development.International Contributions to Hydrogeology, vol. 9. InternationalAssociation of Hydrogeologists, Verlag Heinz Heise: Hannover;136 p.
Sabet MA. 1975. Vertical electrical resistivity sounding locategroundwater resources: a feasibility study. Virginia PolytechnicalInstitute. Water Resources Bulletin 73: 63.
Sherif M, El Mahmoudi A, Garamoon H, Kacimov A, Akram S,Ebraheem A, Shetty A. 2006. Geoelectrical and hydrogeochemicalstudies for delineating seawater intrusion in the outlet of Wadi Ham,UAE. Environmental Geology 49: 536–551.
Spies BR. 1996. Electrical and electromagnetic borehole measurements.Surveys in Geophysics 17: 517 –556.
Trabelsi F, Tarhouni J, Ben Mammou A, Ranieri G. 2011. GIS-basedsubsurface databases and 3-D geological modelling as a tool for the set-up of hydrogeological framework: Nabeul–Hammamet coastal aquifercase study (Northeast Tunisia). Environ Earth Sci DOI: 10.1007/s12665-011-1416-y.
Turki MM. 1985. Poly cinématique et contrôle sédimentaire associé sur lacicatrice de Zahouan-Nebhana. Thèse d’Etat, Faculté des sciences deTunis.
Urish DW, Frohlich RK. 1990. Surface electrical resistivity in coastalgroundwater exploration. Geoexploration 26: 267–289.
Van Dam JC, Meulenkamp, JJ. 1967. Some results of the geo-electricalresistivity method in groundwater investigations in The Netherlands.Geogphysical Prospecting 15(1): 92–115.
Wilson SR, Ingham M, McConchie JA. 2005. The applicability of theearth resistivity methods for saline interface definition. Journal ofHydrology 316: 301–312.
Xue Y, Wu J, Lui P, Wang J, Jiang Q, Shi H. 1993. Sea-water intrusion inthe coastal area of the Laizhou Bay, China: 1. Distribution of seawaterintrusion and its hydrochemical characteristics. Ground Water 31(4):532–537.
Yechieli Y, Kafri U, Goldman M, Voss CI. 2001. Factors controlling theconfiguration of the fresh–saline water interface in the Dead Sea coastalaquifers. Hydrogeology Journal 9:367–377.
Zohdy AAR. 1969. The use of Schlumberger and equatorial soundingson ground water investigations near El Paso, TX. Geophysics 34:713–728.
Hydrol. Process. (2012)DOI: 10.1002/hyp
Copyright © 2022 FDOKUMEN