Regional Pro-Poor Growth and Convergence in Tunisia
21
Regional Pro-Poor Growth and Convergence in Tunisia Ghazi BOULILA 1 Chaker Gabsi 2 and Mohamed TRABELSI 34 1 Ecole Supérieure des Sciences Economiques et Commerciales (ESSEC), 4 Rue Abou Zakaria El Hafsi 1089 Montfleury, Tunis - Tunisia, Email: [email protected] . 2 Faculté des Sciences Economiques et de Gestion de Tunis, E-mail : chaker_gabsi @yahoo.fr . 3 Institut des Hautes Etudes commerciales de Carthage (IHEC), 2016 Carthage Présidence Tunis - Tunisie, Tel: 216 71 775 94, Fax: 216 71 775 944, Email: [email protected] . Corresponding author. 4 This paper is a short version of the FEMISE report on the research project « Analyse de l’impact de la croissance sur la pauvreté et identification des stratégies de croissance bénéfique aux pauvres (pro-poor growth strategies). Etude des cas pour six pays partenaires méditerranéens : Egypte, Israël, Liban, Maroc, Tunisie et Turquie (Projet FEMISE IV N°. FEM31- 06R). This FEMISE research contract is being achieved with the Centre d’Etudes en Macroéconomie et Finance Inetrnationale (CEMAFI), Université de Nice, France. We wish to thank, also, Claude Berthomieu, Valérie Béranger, Sami Bibi, Jefferey Nugent and Jackeline Wahba and all the participants at the 15 th annual confrence of the Economic Research Forum (ERF) (Cairo, Egypt, 23-25 November 2008) and at the 4 th international colloque « les Objectifs du Millénaire pour le développement (OMD), Progrès et Perspectives : Le cas des Pays Maghrébins » (Hammamet, Tunisie, 18-20 Juin 2008), for helpful comments and suggestions. Special thanks go to the ERF for financial support. Any remaining errors are the sole responsibility of the authors.
-
Upload
independent -
Category
Documents
-
view
3 -
download
0
Transcript of Regional Pro-Poor Growth and Convergence in Tunisia
Regional Pro-Poor Growth and
Convergence in Tunisia
Ghazi BOULILA 1 Chaker Gabsi 2 and Mohamed TRABELSI 34
1 Ecole Supérieure des Sciences Economiques et Commerciales (ESSEC), 4 Rue Abou Zakaria El Hafsi 1089 Montfleury, Tunis - Tunisia, Email: [email protected].
2 Faculté des Sciences Economiques et de Gestion de Tunis, E-mail : chaker_gabsi @yahoo.fr.
3 Institut des Hautes Etudes commerciales de Carthage (IHEC), 2016 Carthage Présidence Tunis - Tunisie, Tel: 216 71 775 94, Fax: 216 71 775 944, Email: [email protected]. Corresponding author.
4 This paper is a short version of the FEMISE report on the research project « Analyse de l’impact de la croissance sur la pauvreté et identification des stratégies de croissance bénéfique aux pauvres (pro-poor growth strategies). Etude des cas pour six pays partenaires méditerranéens : Egypte, Israël, Liban, Maroc, Tunisie et Turquie (Projet FEMISE IV N°. FEM31- 06R). This FEMISE research contract is being achieved with the Centre d’Etudes en Macroéconomie et Finance Inetrnationale (CEMAFI), Université de Nice, France. We wish to thank, also, Claude Berthomieu, Valérie Béranger, Sami Bibi, Jefferey Nugent and Jackeline Wahba and all the participants at the 15th annual confrence of the Economic Research Forum (ERF) (Cairo, Egypt, 23-25 November 2008) and at the 4th international colloque « les Objectifs du Millénaire pour le développement (OMD), Progrès et Perspectives : Le cas des Pays Maghrébins » (Hammamet, Tunisie, 18-20 Juin 2008), for helpful comments and suggestions. Special thanks go to the ERF for financial support. Any remaining errors are the sole responsibility of the authors.

Abstract
This paper studies the evolution of total and regional poverty in Tunisia using the Growth Incidence Curve (GIC)
approach based on individual consumption and education level from the household consumption surveys and
other official publications during the period 1990-1995. Three main results are found, first, growth is pro-poor in
Tunisia and poor households have benefited from growth in the whole country as well as many different
governorates. Moreover, poverty reduction is accounted for mainly by a redistribution effect in the whole
country. Second, the empirical analysis tends to confirm the existence of conditional and unconditional
convergence in terms of poverty between regions where poor governorates tends to grow more rapidly (with a
high pro-poor growth) and to catch up rich ones.

1. Introduction
Since achieving independence, Tunisia has chosen deliberately a development strategy based
simultaneously on growth promotion and poverty alleviation. As a consequence, poverty has
fallen dramatically, largely due to growth achievements which have provided jobs and
resources for the government to spend on equity and poor households. Continued progress on
poverty alleviation will nonetheless present some challenges. Poverty reduction becomes
more difficult as poverty levels approach the core poor, at the very bottom of expenditure
distribution. Moreover, continued poverty reduction requires an adequate system for
monitoring poverty developments and identifying the key target groups for public policy as
they evolve.
In recent years, the term “pro-poor growth” has become pervasive in the discussions of
development policies. However, despite the large use of this term there is no much consensus
on the strict meaning of pro-poor growth5. In fact, economic growth is seen as pro-poor
according to Kakwani and Pernia (2000) if poverty is reduced by the change in income
distribution. Ravallion and chen (2003) adopted a more broader definition where growth is pro-
poor if the poverty measure decreases.
The aim of the paper is to see if growth has been pro-poor in Tunisia either for the whole
country or its different governorates during the period 1990-1995. For pro-poor growth we
adopt the definition developed by Ravallion and Chen (2003) and we apply the growth
incidence curve (GIC) approach. The GIC measures the rate of growth in consumption
between two points in time at each percentile of the expenditures distribution and it is
estimated using household expenditures micro data. The rate of pro-poor growth (RPPG) is
thus the average growth in consumption over the population up to the headcount index.
The GICs are estimated for the whole country, different governorates as well as urban and
rural areas during the period 1990-1995. The data is extracted from Household Consumption
Surveys (HCS) carried out by the ”Institut National de la Statistique” (INS). Other data is also
provided by different issues of other official publications (Budget de l’Etat, Rapport de la
Banque Centrale (BCT), Caisse Nationale de Sécurité Sociale (CNSS) and Commissariat de
Développement Régional). The Datt and Ravallion’s decomposition of changes in the
5The objective of pro-poor growth measures is to see if poor households benefit from economic growth. The Pro-poor growth is defined with two approaches. First, the Absolute pro-poor growth studies if poor individuals have increased their income independently from the evolution of inequalities. Second, the relative pro-poor growth studies if poor households benefit more from growth than rich ones which tends to reduce inequalities.

headcount index is also simulated for the different regions of the country. It enables to
determine growth and redistribution effects after a change in poverty.
We develop also in this paper a convergence analysis in terms of poverty to check if a poor
governorate (having a high poverty rate) tends to grow more rapidly (with a high pro-poor
growth) than a rich governorate in a way that the poor region will catch up the poverty rate of
rich one. This is similar to the concept of β-convergence developed by Barro and Sala-I-
Martin (1990) in the case of GDP per capita convergence across countries.
Three main results are found in this paper are; first, growth is pro-poor in the whole country
as well as many governorates. This outcome means that poor households have benefited from
growth more than other components of the society. Moreover, poverty reduction is accounted
for mainly by a redistribution effect in the whole country. Second, the empirical analysis tends
to confirm the existence of conditional and unconditional convergence in terms of poverty
between regions where poor governorates tends to grow more rapidly (with a high pro-poor
growth) and to catch up rich ones. This result means that economic growth has provided also
resources for the public treasury which has permitted to create jobs, to find sufficient
resources to make social transfers and to invest in public infrastructure in poor governorates.
The remaining of the paper is organised as follows: Section 2 reviews growth and poverty
trends in Tunisia. Section 3 presents the growth incidence curve and pro-poor growth rates.
In section 4 we present the headcount index decomposition in the whole country, urban and
rural areas and governorates. Section 5 discusses the convergence in terms of growth between
poor and rich governorates. Finally, section 6 concludes the paper with some policy
recommendations.
2. Growth and Poverty in Tunisia
At the early sixties, Tunisia was a poor country with a low income per capita. However, due
to growth performances during the following decades, the average rate of GDP is close to 5%
over the period 1960-2000. However, the growth path was not stable because of local and
international exogenous chocks and switches in implemented economic policies of the
government. The economy has benefitted from favourable oil shocks during the seventies
which gave the country large financial resources due to a sharp rise in oil prices. These
resources provide to the state large possibilities to grant large fiscal incentives and subsidies
to private and public enterprises.

The eighties decade was featured by a slowdown in economic growth especially during the
first half due to political instability and bad economic management. During 1980-1990, the
average rate of growth of GDP was more than 3%. However, the worsening economic
conditions in 1986 pushed the government to adopt structural reforms of the economy. These
reforms took few years before providing their beneficial effects. Indeed, the cost of
macroeconomic stabilization and structural adjustment was small since economic growth
declined from 3,7 % in the first half of eighties to 3 % in the second half.
The first half of the nineties, corresponding to the period of poverty analysis in this paper, was
featured by a recovery of the economy despite some climate difficulties in the agricultural
sector. The GDP per capita rose by about 1,2 % during the period 1990-1995. The second half
of the nineties (1996-2000) saw a rapid growth in income per capita, spurred by exports, and
the average rate reached more than 4% per annum, which is the highest rate since the
seventies.
These growth achievements over the last four decades have entailed a significant reduction in
the incidence of poverty. The growth strategy has targeted, among other things, a substantial
decrease in poverty through an active participation in the labor market (mainly labor intensive
industries with a substantial female participation and export oriented manufacturing) and an
improvement in education quality and productive assets accumulation. In addition, public
authorities have implemented social policies6 that have been efficient in reducing poverty.
The average rate of public expenditures (with respect to total current receipts) destined to
fight poverty is close to 15 % during the period 1973-1996 and the rate of social transfers (%
of GDP) is close to 20 % in 1995. As a consequence, poverty has declined substantially7 from
more than 30 % in the mid-sixties to about 4 % in 2000.
3. The pro-poor growth rates (RPPG) and monetary growth incidence
curve (MGIC)
The growth incidence curve (GIC) has been proposed by Ravallion and Chen (2003). It is
estimated on the basis of household expenditures micro data, and it measures the rate of
growth in consumption between two points in time for each percentile of the expenditures
distribution. Ravallion and Chen (2003) define the rate of pro-poor growth (RPPG) as
follows:
6 Such as ” Fighting underdevelopment program” , (1956-1972) and ”the rural development program”, (1973-1983) and other special programs (The national solidarity fund (1993) and national solidarity bank (1998)). 7 The time comparisons are made with caution because of the nature and quality of household expenditures surveys.
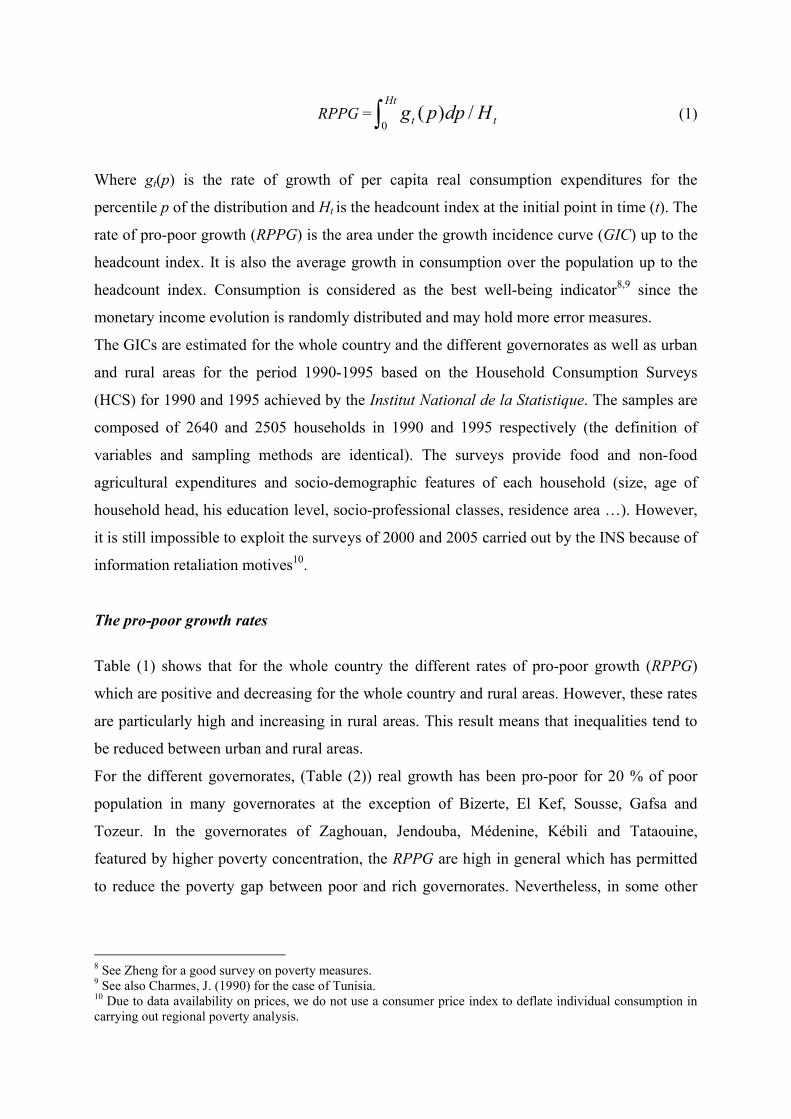
RPPG =0
( ) /Ht
t tg p dp H (1)
Where gt(p) is the rate of growth of per capita real consumption expenditures for the
percentile p of the distribution and Ht is the headcount index at the initial point in time (t). The
rate of pro-poor growth (RPPG) is the area under the growth incidence curve (GIC) up to the
headcount index. It is also the average growth in consumption over the population up to the
headcount index. Consumption is considered as the best well-being indicator8,9 since the
monetary income evolution is randomly distributed and may hold more error measures.
The GICs are estimated for the whole country and the different governorates as well as urban
and rural areas for the period 1990-1995 based on the Household Consumption Surveys
(HCS) for 1990 and 1995 achieved by the Institut National de la Statistique. The samples are
composed of 2640 and 2505 households in 1990 and 1995 respectively (the definition of
variables and sampling methods are identical). The surveys provide food and non-food
agricultural expenditures and socio-demographic features of each household (size, age of
household head, his education level, socio-professional classes, residence area …). However,
it is still impossible to exploit the surveys of 2000 and 2005 carried out by the INS because of
information retaliation motives10.
The pro-poor growth rates
Table (1) shows that for the whole country the different rates of pro-poor growth (RPPG)
which are positive and decreasing for the whole country and rural areas. However, these rates
are particularly high and increasing in rural areas. This result means that inequalities tend to
be reduced between urban and rural areas.
For the different governorates, (Table (2)) real growth has been pro-poor for 20 % of poor
population in many governorates at the exception of Bizerte, El Kef, Sousse, Gafsa and
Tozeur. In the governorates of Zaghouan, Jendouba, Médenine, Kébili and Tataouine,
featured by higher poverty concentration, the RPPG are high in general which has permitted
to reduce the poverty gap between poor and rich governorates. Nevertheless, in some other
8 See Zheng for a good survey on poverty measures.9 See also Charmes, J. (1990) for the case of Tunisia. 10 Due to data availability on prices, we do not use a consumer price index to deflate individual consumption in carrying out regional poverty analysis.

governorates even with high poverty rates, the RPPG are weak and even negative which has
extended the poverty gap.
In addition, the rich governorates with a lesser poverty concentration like Ariana, Bizerte,
Sousse and Sfax have also weak and negative rates. However, the exception is for Monastir
and Mahdia considered as relatively rich with low poverty concentration they have recorded
the highest (RPPG) which has permitted to improve their ranking with respect to other
governorates. This performance of these governorates is accounted for mainly by the
development of textile industries considered as intensive in female labor force.
The different results of pro-poor growth rates in the governorates show that regional poverty11
is more concentrated in the North West, Center West and South West. In Table (3), the
poverty incidence has decreased in the different regions of the country but with non linear and
heterogeneous proportions. The North West and Center West regions have known a dramatic
decline in poverty during the period 1980-1995, whereas it remained stable in the South West.
Moreover, the metropolitan area of Tunis has the lowest poverty incidence with a headcount
of only 1%.
These results show that we have convergence en terms of poverty between governorates
where those with high poverty concentration converges toward those with weak poverty
concentration. This fact, may explain the reduced inequalities between the different regions of
the country.
The Growth incidence curves (GICs)
Figures (1), (2) and (3) in the appendix display the GICs for the whole country and for urban
and rural sectors. Indeed, in Figure (1) the GIC is a decreasing function featured by high
growth rates of the first percentiles of the population12. The growth rate remains positive until
the last percentile which means that the different income groups of the population have
benefitted from growth at the exception the income group relative to rich persons.
11
At the regional level, Tunisia is divided into six regions which are North East (NE), North West (NW), Center
East (CE), Center West (CW), South East (SE) and South West (SO). Each region contains the following
governorates : North East (NE) : Tunis, Ariana, Ben Arous, Nabeul and Bizerte; North West (NW) : Béja,
Jendouba, Le Kef, Siliana and Zaghouan; Center West (CW): Kairouan, Kasserine, Sidi Bouzid and Gafsa;
Center East (CE): Sousse, Monastir, Mahdia and Sfax;
South West (SW): Tozeur, Kebili, Tataouine, Gafsa and Tataouine;
South East (SE): Gabes, Medenine.12 These results are the same as in Ayadi et al. (2004).

Accordingly, growth has not only been pro-poor according to absolute poverty definition, but
also it has been featured by substantial decrease in social inequalities.
The monetary growth incidence curve for urban areas (figure (2)) is on line with the results of
pro-poor growth for the whole country. The rate of growth is positive until the 8th percentile.
The curve is decreasing for poor households yet it is increasing between the 2nd and 4th
percentiles and regains its decreasing slope after. Growth is therefore pro-poor in the urban
areas and poor households have highly benefitted from real growth and wealth distribution (at
the same time). The households of 2nd, 3rd and 4th percentiles have certainly benefitted from
growth (positive rate of growth) but have experienced more unequal distribution of income
(decreasing slope).
In rural areas (figure (3)), real growth is pro-poor in absolute terms since the rate of growth is
positive for the different income groups. However, the slope is fluctuating which means that
poor households have benefitted from real growth but the wealth distribution is varying
according to the level of consumption with weak amplitude. This fact may be accounted for
by income fluctuations in agricultural activities. The evolution of growth rates in the whole
country between the percentiles is important with respect to urban and rural areas. The result
may be explained by migration income transfers from urban to rural areas.
The growth incidence curves (GICs) for the different governorates (Figures (4) to (23) in the
appendix) show that real growth is pro-poor in relative and absolute terms in the governates of
Tunis, Zaghouan, Mahdia and Gabès. However, in the governorates of Ben Arous, Béja,
Siliana, Nabeul, Jandouba, Kébili, Médenine, Tataouine and Monastir, growth is only pro-
poor in absolute terms (positive rate of growth). For the governorate of Ariana which belongs
to the greater Tunis area, real growth is pro-poor (weak percentiles) but is not in favour of
rich households (higher percentiles). Inversely, In Sousse, Tozeur and Gafsa, growth has not
been in favour of poor households but their situation has deteriorated less than wealthy
persons.
Real growth is found to be only pro-poor households in the governates of Bizerte and EL Kef
and neutral (neither pro-poor nor pro-rich households) in the governorate of Sfax, since the
rate of growth of consumption is fluctuating around zero.
4. Decomposition of Changes in the headcount Index
Datt and Ravallion (1992) have proposed a decomposition of changes in the headcount index
in three components. First, a growth component which measures the change in poverty if the
Lorenz curve has not been modified (constant redistribution). Second, a redistribution

component which evaluates the change in poverty due to a shift of the Lorenz curve (Average
constant income). Third, a residual component which measures the interaction between
growth and redistribution effects. The Datt and Ravallion’s decomposition enables to
determine growth and redistribution effects after a change in poverty. The individual
expenditures are deflated by the consumer price index.
For the whole country as well as urban and rural areas (Table (4)) poverty has declined and
the correlation between redistribution and poverty reduction is confirmed. In addition, poverty
reduction is accounted for mainly by the redistribution effect at urban and national levels13
and growth and redistribution effect in rural areas.
At a regional level (Table (5)), the poverty variation decomposition reveals that poverty has
increased in Tunis, Bizerte, El Kef, Sousse, Gafsa and especially Tozeur. In this latter
governorate, the rise in poverty rate is explained by the weakness of the redistribution effect
which has not compensated the positive growth effect. However, in the governorates of
Zaghouan and Jandouba poverty has declined significantly because of the growth effect. In
the governorates of Ariana, Sfax and Gabès, the decline in poverty is due to the redistribution
effect which is more important than the growth effect. Finally, the decrease in poverty in
Zaghouan, Siliana, Monastir, Mahdia and Médenine is accounted for simultaneously by
growth and redistribution effects.
In 1995, the agricultural activity has seen a sharp decrease in production mainly in
governorates where the principal activity is based on cereals which influenced poverty.
However, the income redistribution has paid off the poverty incidence with transfers of
national and international migration and antipoverty policies.
5. Regional Poverty convergence
The convergence analysis developed in the paper is based on the intuition that a poor
governorate (having a high poverty rate) tends to grow more rapidly (with a highly pro-poor
growth) than a rich governorate in a way that the poor region will catch up the poverty rate of
rich one. This is similar to the concept of β-convergence developed by Barro and Sala-I-
Martin (1991, 1992) in the case of GDP per capita convergence across countries.
5.1. Absolute or non conditional convergence
13 This result may explain how the average rate of growth of GDP per capita during the period 1990-1995 is pro-poor.

We have absolute β-convergence when it depends only on initial conditions. In this case
testing convergence is carried out by estimating the relationship between pro-poor growth rate
and the initial poverty rate14 and the estimated equation is the following one:
PPGR i, 1995-1990 = a + b PRi, 1990 + i (2)
Where PPGR is pro-poor growth rate, PR is the poverty rate, ε is the error term and finally a
and b are parameters. A positive estimated coefficient b implies the convergence between
governorates in terms of poverty: those which start with high initial poverty rates tend to have
high pro-poor growth. When b is equal to unity (b =1) we have a perfect convergence.
However, we have divergence between governorates en terms of poverty when b is negative.
Two pro-poor growth rates are introduced in the empirical investigation: the pro-poor growth
rates of the two first percentiles (PPGR20) (20% of very poor population) and the average
pro-poor growth rate (APPGR). The different estimates with these dependant variables are
presented in Table (9).
The first estimation of equation (2) in Table (6) seem to indicate the existence of an imperfect
convergence between governorates en terms of poverty since the coefficient of poverty rate is
positive and significant at a 5 % risk level. The result means that poor governorates have
benefitted from growth more than rich ones. The second regression in Table (6) where the
average pro-poor growth rate is the dependant variable is similar to the precedent one and
tends to confirm the regional convergence hypothesis too. The coefficient associated to the
initial poverty rate is weak but positive (0,302) and significant at the 99 % confidence level.
Figure 37 shows that the initial poverty rate is positively correlated with the average growth
rate.
5.2. Conditional Convergence
The conditional convergence depends on the features of each governorate. Among the local
factors having potential incidence on pro-poor growth that should be taken into consideration
in testing conditional convergence we have human resources, infrastructure, the number of
created companies, regional policies, transfer of funds from urban areas, unemployment and
fiscal advantages offered by poor governorates.
14
We use the same intuition as Mankiw, Romer and Weil (1992).

To test the conditional β-convergence hypothesis we use the same specification as in equation
(2) augmented with other determinants of pro-poor growth as follows:
PPGR i, 1995-1990 = a + b PRi,1990 +cXi + i (3)
Where Xi represents a vector of variables influencing pro-poor growth (human capital,
investment rate, public infrastructure, social expenditures to fight poverty …). However
because of the lack of data in some governorates, we use the enrolment rate for students
whose age is ranging between 6 and 14 years as a proxy of human capital. As a measure of
public infrastructure we use the power connection rate (the average for 1990-1995) and the
drinking water connection rate (the average for 1990-1995)15. We introduce also in the Xi
vector a Dummy variable that reflects the sample heterogeneity that takes the value of 1 in
rich coastal governorates and 0 in governorates inside the country.
Table (7) displays the output of the different OLS regressions16 of equation 3. These
estimations tend to confirm the existence of conditional β-convergence between governorates
in terms of poverty, since the coefficient of initial poverty rate is significant at the 1 % risk
level. This result means that poor governorates have more benefitted from growth than rich
ones. The estimated value of β is higher than in the case of absolute convergence (0,8 with
respect to 0,25). This fact may be accounted for by the determinants of pro-poor growth
introduced which have permitted to differentiate governorates having different development
levels.
The rest of the variables reflecting the effect of education policy and public infrastructure
enter with significant coefficients in the dynamic process of conditional convergence. The
coefficient of enrolment rate is positive and significant which means that education raises
growth and diminishes poverty. Likewise, the coefficients of public infrastructure, as proxied
by power connection rate and drinking water connection rate, are positive and significant
which tends to confirm the role of public policy in reducing poverty.
Finally, the dummy variable, introduced to take into account the heterogeneity between rich
coastal governorates and those inside the country, enters also with a positive and significant
coefficient at the 5 % level. This result means that coastal governorates are likely to
contribute to pro-poor growth more than the other ones.
15 Migration is not present as a determinant of pro-poor growth because it is not reported in the surveys of 1990 and 1995. 16 We are constrained to achieve regressions with a low number of observations (19) due to data limitations.

6. Conclusion et Policy recommandations
During the last four decades, Tunisia achieved a good growth performance which entailed a
significant reduction in poverty. In this paper we have shown that, first, growth has been
essential for poverty reduction of households in the whole country as well as in many regions
and governorates. Second, the empirical analysis tends to confirm the existence of conditional
and unconditional convergence in terms of poverty between regions where poor governorates
tends to grow more rapidly (with a high pro-poor growth) and to catch up rich ones.
However, in spite of these achievements, the Government is called to maintain its
commitment to fight poverty. This can be made through the development of labour intensive
industries, services and public infrastructure in urban as well as in rural areas. The poverty
reduction effort needs also the strengthening of social policies and public programs destined
to help needy families. Finally, easing official migration to European countries is likely to
reduce poverty17 through an agreement on services liberalization and labor mobility with EU.
External migration has been for a long time an important factor in reducing poverty through
easing pressure on local job market and income transfers and remittances.
However, other challenges lie ahead especially with rapid transformations of the international
environment (dismantling of the Multi Fibre Agreement, rise in the prices of energy, cereals,
broadening Europe). The explosion of oil and cereal prices has increased the amount of
subsidies destined to help poor households which may represent a threat for social policies to
fight poverty.
17 See Adams and Page (2003) for more details on the relationship between migration, remittances and poverty.
Appendices
Appendix (1): Tables
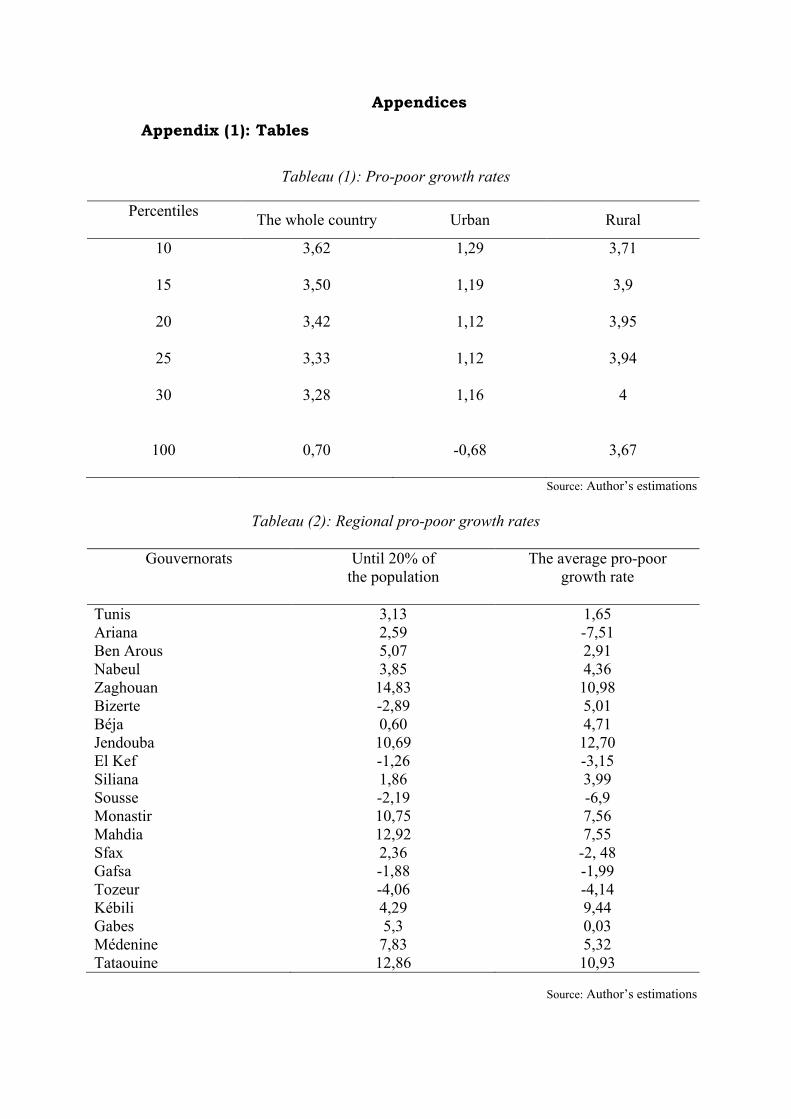
Tableau (1): Pro-poor growth rates
PercentilesThe whole country Urban Rural
10 3,62 1,29 3,71
15 3,50 1,19 3,9
20 3,42 1,12 3,95
25 3,33 1,12 3,94
30 3,28 1,16 4
100 0,70 -0,68 3,67
Source: Author’s estimations
Tableau (2): Regional pro-poor growth rates
Gouvernorats Until 20% of the population
The average pro-poor growth rate
TunisArianaBen ArousNabeulZaghouanBizerteBéjaJendoubaEl KefSilianaSousseMonastirMahdiaSfaxGafsaTozeurKébiliGabesMédenineTataouine
3,132,595,073,8514,83-2,890,6010,69-1,261,86-2,1910,7512,922,36-1,88-4,064,295,37,8312,86
1,65-7,512,914,3610,985,014,7112,70-3,153,99-6,97,567,55
-2, 48-1,99-4,149,440,035,3210,93
Source: Author’s estimations

Table (3): the poverty incidence in Tunisia, regional index 1980-2000
1980 1985 1990 1995
Greater Tunis 4.3 2.3 2.1
2.4
North East 15.6 8.9 5.9 6.3
North West 30.1 17.9 14.3 11.1
CenterWest 33.8 18 12.5 20
CenterEast 16.5 6.2 3.9 3.5
South West 13 6.7 8.8 8.2
South East 15.7 12.1 3.1 10.5
The whole country 20.1 9.6 6.7 8.1
Source : Household consumer surveys (1980-1995) from the Institut National de la Statistique
Tableau (4): Poverty variation decomposition between 1990 and 1995
The whole country
Urbain area Rural area
Poverty rate variation
Growth
Redistribution
Residue
-0,041
-0,009
-0,037
0,004
-0,009
0,003
-0,013
0,002
-0,07
-0,067
-0,01
-0,007
Source: Author’s estimations based on Datt and Ravallion (1992)

Table (5) : Decomposition of Changes in the headcount index at a regional level, 1990-1995
Gouvernorats Poverty rate Variation
Growth Redistribution Residue
TunisArianaBen ArousNabeulZagouhanBizerteBéjaJendoubaEl KefSilianaSousseMonastirMahdiaSfaxGafsaTozeurKébiliGabèsMédenineTataouine
0,001-0,026-0,011-0,026-0,3030,019-0,056-0,2350,015-0,0710,030-0,019-0,094-0,0080,0170,076-0,058-0,039-0,143-0,163
-0,0030,131-0,021-0,024-0,295-0,042-0,104-0,2500,034-0,1130,073-0,010-0,0560,0330,0000,031-0,0940,000-0,107-0,139
0,001-0,0520,0290,021-0,1220,0920,0420,053-0,021-0,006-0,004-0,005-0,075-0,039-0,019-0,0130,085-0,039-0,0450,091
0,003-0,105-0,019-0,0230,115-0,0320,006-0,0380,0010,048-0,039-0,0050,038-0,0020,0360,058-0,0490,0000,009-0,115
Source: Author’s estimations based on Datt-Ravallion (1992)
Table (6) : Non-conditionnel convergence in poverty
Equations
(1)
(PPGR20)
(2)
(APPGR)
Constant 1.468(0.89)*
-0.289(-0.16)
PRi,19900.243(2.43)
0.302(3.53)
R squared 0.21 0.30
* t statistics between parentheses

Table 7: Determinants of pro-poor growth rates
Equations (1) (2) (3) (4)
Constant-3.17
(-1.52)-7. 20
(-2.38)**
- 7.80
(-2.70)***
-7.68
(-2.61)**
Intial poverty rate (PR90) 0.38
(4.45)***
0.64
(5.24)***
0.84
(5.89)***
0.87
(6.55)***
Dummy region 4.66
(2.46)*
3.55
(1.72)***
4.68
(2.47)**
4.79
(2.47)**
Initial schooling rate 6-14 (ts 90) 0.80
(2.27)**
0 .33
(0.86)
0.26
(0.66)
Power connection rate (PCR) 0.46
(4.12)***
0.42
(3.72)***
Drinking water connection rate able
(DWCR)
0.09
(1.83)*
R² 0.55 0.55 0.72 0.74
Observations 19 19 19 19
*, ** and *** means that the coeficient is significat at 10%, 5% et 1% respectively. t-Statistics between brackets. The dependant variable is the pro-poor growth rate of 20 % poor population.

Appendix (2) : The growth incidence curves (GICs)
Figure (1): GIC, national level (1990-1995) Figure (2): GIC, urban area 1990-1995
-20
24
Med
ian s
plin
e/G
rowt
h ra
te in
mea
n
0 20 40 60 80 100Percentiles
Median spline Growth rate in mean
-8-6
-4-2
02
Med
ian
splin
e/G
row
th ra
te in
mea
n
0 20 40 60 80 100Percentiles
Median spline Growth rate in mean
Figure (3): GIC, rural area 1990-1995
12
34
5M
edian
splin
e/Gr
owth
rate
in m
ean
0 20 40 60 80 100Percentiles
Median spline Growth rate in mean
The growth incidence curves in the Governorates
Figure 4 : GIC, Governorate of Tunis Figure 5 : GIC, Ariana 1990-1995
-10
-50
5M
edia
n sp
line/
Gro
wth
rat
e in
mea
n
0 20 40 60 80 100Percentiles
Median spline Growth rate in mean
-20
-15
-10
-50
5M
edia
n sp
line/
Gro
wth
rat
e in
mea
n
0 20 40 60 80 100Percentiles
Median spline Growth rate in mean
Figure 6 : GIC, Ben Arous,1990-1995 Figure 7 : GIC, Nabeul 1990-1995
-10
-50
510
Med
ian
splin
e/G
rowt
h ra
te in
mea
n
0 20 40 60 80 100Percentiles
Median spline Growth rate in mean
24
68
10M
edia
n sp
line/
Gro
wth
rate
in m
ean
0 20 40 60 80 100Percentiles
Median spline Growth rate in mean

Figure 8 : GIC, Zaghouan (1990-1995) Figure 9 : GIC, Bizerte (1990-1995)
-10
010
20M
edia
n sp
line/
Gro
wth
rate
in m
ean
0 20 40 60 80 100Percentiles
Median spline Growth rate in mean
-10
010
2030
Med
ian
splin
e/G
rowt
h ra
te in
mea
n
0 20 40 60 80 100Percentiles
Median spline Growth rate in mean
Figure 10 : GIC, Beja (1990-1995) Figure 11 : GIC, Jandouba (1990-1995)
-50
510
Med
ian
splin
e/G
rowt
h ra
te in
mea
n
0 20 40 60 80 100Percentiles
Median spline Growth rate in mean
1012
1416
18M
edia
n sp
line/
Gro
wth
rate
in m
ean
0 20 40 60 80 100Percentiles
Median spline Growth rate in mean
Figure 12 : GIC, El Kef (1990-1995) Figure 13 : GIC, Siliana (1990-1995)
-30
-20
-10
010
20M
edia
n sp
line/
Gro
wth
rate
in m
ean
0 20 40 60 80 100Percentiles
Median spline Growth rate in mean
-10
-50
510
Med
ian
splin
e/G
rowt
h ra
te in
mea
n
0 20 40 60 80 100Percentiles
Median spline Growth rate in mean
Figure 14 : GIC, Sousse (1990-1995) Figure 15 : GIC, Monastir (1990-1995)
-10
-8-6
-4-2
0M
edia
n sp
line/
Gro
wth
rat
e in
mea
n
0 20 40 60 80 100Percentiles
Median spline Growth rate in mean
05
101
5M
edia
n s
plin
e/G
row
th r
ate
in m
ean
0 20 40 60 80 100Percentiles
Median spline Growth rate in mean
Figure 16 : GIC, Mahdia (1990-1995) Figure 17 : GIC, Sfax (1990-1995)

05
1015
20M
edia
n sp
line/
Gro
wth
rat
e in
mea
n
0 20 40 60 80 100Percentiles
Median spline Growth rate in mean
-10
-50
51
01
5M
ed
ian
spl
ine/
Gro
wth
ra
te in
me
an
0 20 40 60 80 100Percentiles
Median spline Growth rate in mean
Figure 18 : GIC, Gafsa (1990-1995) Figure 19 : GIC, Tozeur (1990-1995)
-4-2
02
4M
ed
ian
sp
line
/Gro
wth
ra
te in
me
an
0 20 40 60 80 100Percentiles
Median spline Growth rate in mean
-15
-10
-50
5M
ed
ian
sp
line
/Gro
wth
ra
te in
me
an
0 20 40 60 80 100Percentiles
Median spline Growth rate in mean
Figure 20 : GIC, Kebili (1990-1995) Figure 21 : GIC, Gabes (1990-1995)
05
1015
2025
Med
ian
splin
e/G
row
th ra
te in
mea
n
0 20 40 60 80 100Percentiles
Median spline Growth rate in mean
-10
-50
510
15M
edia
n sp
line/
Gro
wth
rate
in m
ean
0 20 40 60 80 100Percentiles
Median spline Growth rate in mean
Figure 22 : GIC, Médenine (1990-1995) Figure 23 : GIC, Tataouine (1990-1995)
02
46
810
Med
ian
splin
e/G
row
th ra
te in
mea
n
0 20 40 60 80 100Percentiles
Median spline Growth rate in mean
510
1520
25M
edia
n sp
line/
Gro
wth
rat
e in
mea
n
0 20 40 60 80 100Percentiles
Median spline Growth rate in mean

REFERENCES
Adams, Richard H. and Page John, (2003), “International Migration, Remittances and Poverty in Developing Countries”, World Bank Research Working Paper n 3179, December.
Ayadi, M., Boulila, G., Lahouel, M. H. et Ph. Montigny (2004) ”Pro-poor Growth in Tunisia", The World Bank.
Barro, Robert and Xavier Sala-I-Martin (1991), “Convergence Across States and Regions”, Brookings Papers on Economic Activity, n 1: 107-182.
Barro, Robert and Xavier Sala-I-Martin (1992), “Convergence”, Journal of political Economy, 100(2): 223-251.
Charmes, J. (1990) « Mesurer la pauvreté, identifier les groupes vulnérables : enquêtes et méthodes utilisées en Tunisie » STATECO, N° 63, INSEE, p. 57-83.
Datt, G., and M. Ravallion, (1992), ”Growth and redistribution components of changes in poverty measures: A decomposition with applications to Brazil and India in the 1980s”, Journal of Development Economics 38 (2): 275–295.
Institut National de la Statistique (1980), Enquête Nationale sur le Budget et la Consommation des Ménages.
Institut National de la Statistique (1985), Enquête Nationale sur le Budget et la Consommation des Ménages.
Institut National de la Statistique (1990), Enquête Nationale sur le Budget et la Consommation des Ménages.
Institut National de la Statistique (1995), Enquête Nationale sur le Budget et la Consommation des Ménages.
Kakwani and Pernia (2000), "What is Pro-poor Growth?", Asian Development Review, Volume 18. Manila.
Mankiw, Gregory N; David Romer et David N. weil, 1992), ’’ A Contribution to the Empirics of Economic Growth ’’, Quarterly Journal of Economics, 107(May): 407-437.
Ravallion, Martin and Chen, Shaohua, “Measuring Pro-poor Growth”, Economic Letters78(1), 2003.
World Bank, Republic of Tunisia, (1995), “Poverty Alleviation, Preserving Progress whilePreparing the Future”, Middle East and North Africa (MENA) Region, Report n° 13993-TUN. World Bank.

World Bank, Republic of Tunisia, (2003), “Poverty Update”, MENA region, World Bank, August.
Zheng, B. (1997) “Aggregate Poverty Measures”, Journal of Economic Surveys Vol.11, n° 2,
pp. 123-162.