Delineating the Boundaries of Qualitative Game Theory: A Case Study of an Antebellum Industrial...
29
Delineating the Boundaries of Qualitative Game Theory: A Case Study of an Antebellum Industrial Homestead Site Lindsey E. Cochran, University of West Florida Abstract: The Simpson Lot of Arcadia Mill is an antebellum industrial homestead site in Northwest Florida that was inhabited by five population groups—none of which left particularly discernible material traces. Visual based analyses using GPR results, 3-D GIS artifact density maps, and Google SketchUp ultimately served as the foundation for the game theory interpretation to determine social dynamics of the site. A multi-scalar data network identified the living quarters of two female overseers at an antebellum textile mill; although specific information about their lifestyle remains unseen, this previously untested approach successfully analyzes enigmatic and faint patterns in the material record.
Transcript of Delineating the Boundaries of Qualitative Game Theory: A Case Study of an Antebellum Industrial...

Delineating the Boundaries of Qualitative Game Theory:
A Case Study of an Antebellum Industrial Homestead Site
Lindsey E. Cochran, University of West Florida
Abstract:
The Simpson Lot of Arcadia Mill is an antebellum industrial homestead site in Northwest Florida
that was inhabited by five population groups—none of which left particularly discernible
material traces. Visual based analyses using GPR results, 3-D GIS artifact density maps, and
Google SketchUp ultimately served as the foundation for the game theory interpretation to
determine social dynamics of the site. A multi-scalar data network identified the living quarters
of two female overseers at an antebellum textile mill; although specific information about their
lifestyle remains unseen, this previously untested approach successfully analyzes enigmatic and
faint patterns in the material record.

1
Cochran SEAC Paper, 2013
In the summer of 2012, a UWF field school undertook excavations on the 3.1 acre
Simpson Lot at Arcadia Mill, 8SR384, an antebellum industrial site in Milton, Florida (Figures
1-2). Sawmill co-owner Ezekiel E. Simpson resided just south of the operational facilities’ area
in a Louisiana style mansion on top of a terrace that overlooked the saw and textile mills.
Alongside his home was a small cottage built on brick piers, shown in Figure 3, that was
presumably contemporaneous with the main house. This paper seeks to build upon previous
research of the Arcadia community (Beck and Lees 2008; Little et al. 1989; Phillips 1993, 1998;
Rucker 1988, 1990a, 1990b) to determine who was living in this smaller yet significant structure,
as results could help to facilitate future researchers’ understanding of slave-dependent societies
in the Gulf South region. This research has two objectives. The first, of course, is to attempt to
explain what happened at the site, and when. The second is to test if game theory, the study of
strategic and dynamic interactions, can be successfully applied in archaeological research.
The Simpson Lot is like many archaeological sites: it has been reused and repurposed
throughout its history. Due to dynamic post-depositional events, much of the existing material
culture was recycled or discarded by each subsequent population occupying or using the lot.
Even though Arcadia Mill was only functional for a short 38 years and was largely abandoned
after 1855, the Simpson Lot was subject to at least three additional occupations. As could be
expected with this level of contextual diversity coupled with dynamic site formation processes,
excavations yielded few diagnostic artifacts and only one sealed feature. Additionally, the main
house burned down in a fire, destroying the bulk of the known site-specific documents
concerning the lot (The Milton Gazette 1935; Kranc 2012). There is, however, an excellent oral
history record, and our neighbors at the site were gracious with sharing their recollections.

2
Cochran SEAC Paper, 2013
Game theory has been called the Theory of Everything Social (Varofakis 2008:1255),
akin to physicists’ prestigious and enigmatic Theory of Everything, made of quantum worlds and
string theories. The title “Game Theory” is a bit of a misnomer, as it is a compilation of many
theories with many ways to actually “play” the game (von Neumann 1928, 1928a; von Neumann
and Morganstern 1944). The basic parameters of these games (discussed below) can be met by
typical archaeological projects.
It has yet to be widely proven, however, if game theory be used to address questions in
the historic realm and to determine why people made certain decisions. Can game theory be
applied retroactively to “predict,” with confidence, what actions created the material record--
when and by whom-- in situations where that material evidence is incomplete or missing
altogether? Modern day applications of game theory are excellent ways to predict, with great
confidence, why certain decisions are made. If we can successfully determine why historical
figures made specific decisions, then it may be possible to construct a series of hypotheses
concerning what materials would have been used and where. Using strict game theory, in the
sense of quantitative dilemmas and matrices, was too rigid to account for the uncertainty inherent
in anthropological questions. If this research were to apply quantities to each possible variable in
this test of the Simpson Lot, much of the essence of the data would be lost: materials are very
multi-faceted and cannot be easily quantified in only one meaningful dimension.
Each game is composed of four elements: the players, which are said to be inherently
rational beings; the types of information, be it perfect or imperfect, complete or incomplete, and
if all players know the same kind of information; the actions and strategies undertaken by each
player; and finally, the outcome of each game or set of games. There are a few standard ways to
display all of this information, the most common being a payoff matrix. This research, however,

3
Cochran SEAC Paper, 2013
will employ a state vector game, also called a game against nature, or SONAT, in which the state
of affairs between two or more people, populations, or situations are listed. A SONAT vector
does not seek to find a state of equilibrium like many standard payoff matrices. Rather, this test
asks a series of questions about broad variables or attributes that can be answered with whatever
datasets are available (Gecil and Anderson 2010). Each test yields a list of plausible scenarios
that fit, to varying degrees, a suite of local, regional, and national historical trends, patterns,
information, and histories. To describe these principles and as a preview of analyses to come, a
SONAT vector diagram seeks to determine why Spaniard Juan de la Rua sold the original
Arcadia milling parcel and instead took up brickmaking in the 1820s (Figure 4).
The first step of a State Vector Game is to determine what “States” to test. In this game,
de la Rua is “playing” against six variables that determine if brickmaking or milling would be the
most profitable choice. A series of variables to test are listed, limited to those with sufficient data
to properly test both parties. Variables and attributes are short, simple phrases that can be further
defined according to the State that is being tested. Then, each State addresses what is listed, one
by one, essentially, “filling in the blank,” or “solving for X”.
Researchers at Monticello have used game theory with good results--most successfully in
studies of commodity exchanges, oftentimes paired with signaling theory or evolutionary game
theory (Neiman 2008). One advantage these researchers enjoy is a very complete material and
documentary record. Excavations and historical research of the Simpson Lot did not return a
robust network of data, so I engineered an alternative set of game theory methods.
To do so, I undertook a three tiered methodology: (1) use inter-disciplinary techniques to
complete a survey of the Simpson Lot; (2) analyze the recovered data using standard
archaeological techniques combined with GIS models and geophysical evidence; and (3)

4
Cochran SEAC Paper, 2013
interpret those results using a game theory approach. Each dataset in this study builds upon the
information in the previous: historical and archaeological data are input into GIS maps, that are
then used to identify Target Zones and unanswered questions that can be addressed in game
theory tests.
This methodology differs from others in that it is based on SONAT vectors. This is the
first test of this method in anthropological studies, and seeks to reorganize data based upon an in-
depth construction of historical contexts and reevaluation of associations between material
culture, rather than conducting game theory tests that are based upon numerical matrices that are
very common in modern day economic applications. Game theory is typically used to determine
which option is best for the players involved, seeking to influence future decisions. Instead, this
application tests if game theory can be used to determine why past decisions were made.
The creation and occupation of Arcadia Mill and the Simpson Lot span seven major
historical eras. Each of these had major regional and local impacts that would have almost
positively been reflected in material refuse at the sites. Since this is the first intensive research
project at the Simpson Lot, much of the archaeological research was devoted to mapping the site
and determining its spatial and temporal parameters. Overall goals for the excavation phase were
to complete a systematic survey across the 3.1 acre land tract; execute a series of geophysical
tests and ground-truth those results; and finally, excavate larger test units in areas with high
artifact concentrations and potential to answer questions about the chronology and use of the
Simpson Lot.
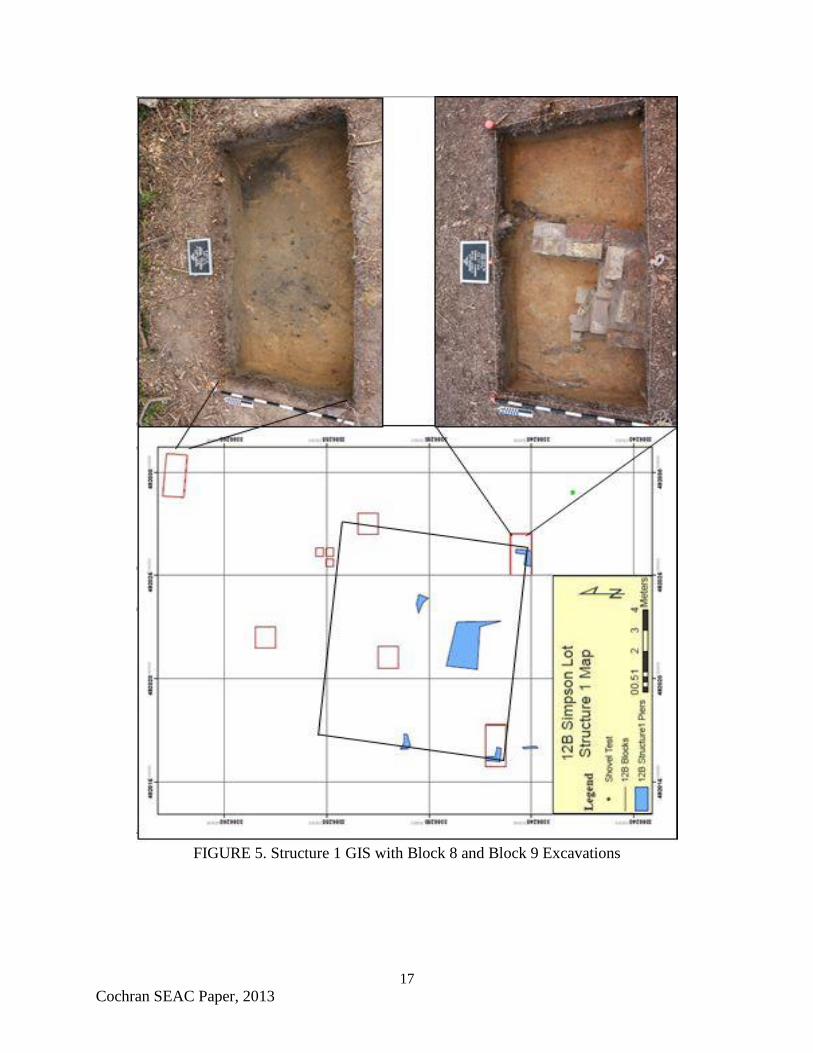
There are three “Target Zones” used to interpret the site: (1) an unidentified cottage
(Structure 1, Figure 5); (2) the site of a former water tower (Structure 2, Figure 6); and (3) the
foundations of the Big House (Structure 3, Figure 7). All three structures are oriented 11 degrees

5
Cochran SEAC Paper, 2013
east of north, implying some degree of contemporaneity as the earliest could have served as a
visual cue during the construction of the rest. Historic photographs were recovered for two of the
three buildings—the Big House and the cottage. The water tower at Simpson’s Bagdad Land and
Lumber Company was photographed in 1917 (Figure 8). Similar foundation configurations,
likely with contemporaneous construction dates and common ownership lead me to assume the
Bagdad tower resembled the one that once stood at the Simpson Lot.
The results from the shovel test survey revealed the location of three general areas that
may represent the expansion and subsequent collapse of several occupations on the site.
Materials were analyzed using a slightly modified Southian typology (South 1972, 1977),
concentrating on ceramics, glass, and functional artifact groups—all of which were categorized
in the lab according to standard UWF lab methods (Lloyd 2001) (Figures 9-13). Ceramics
recovered were quite diverse. Most of the assemblage, nearly eighty-two percent (81.2%)
consists of refined earthenwares, nearly three-quarters of which was whiteware.
Almost half of the entire assemblage consists of glass artifacts. Many of these (87.2%)
were too small to identify or lacking in diagnostic features, and were labeled as “indeterminate”
or “other”. Identifiable glass artifacts were as diverse as the ceramics. Datable decorations,
colors, and uses span the history of the Simpson Lot, although nearly all were recovered in
mixed contexts.
Next, a series of three geophysical techniques assisted in the identification of the shape of
Structure 1 and the location of auxiliary features or piers. We used ground penetrating radar,
electric resistivity, and gradiometry, but were only able to get results from the first technique due
to corrupt data and hardware issues. Three grids were surveyed (Figure 14), totaling 36m2.
Results were not groundtruthed over Grids A and B. The following radargram, in Figure 15,

6
Cochran SEAC Paper, 2013
shows two cultural anomalies interpreted to be (1) a pipe and possible cistern or sewage tank and
(2) debris from the southeast corner pier of Structure 1.
The area of Grid C was the primary target of geophysical investigations as three brick
piers were visible on the surface (Figure 16). It was not initially apparent that Structure 1 was the
same building as shown in the historic photograph previously referenced. Although no refuse pits
were identified, a virtual field of cultural material and debris approximately 12-by-12 meters was
identified through the GPR testing. All cultural anomalies in Grid C were grountruthed after the
geophysical survey was completed.
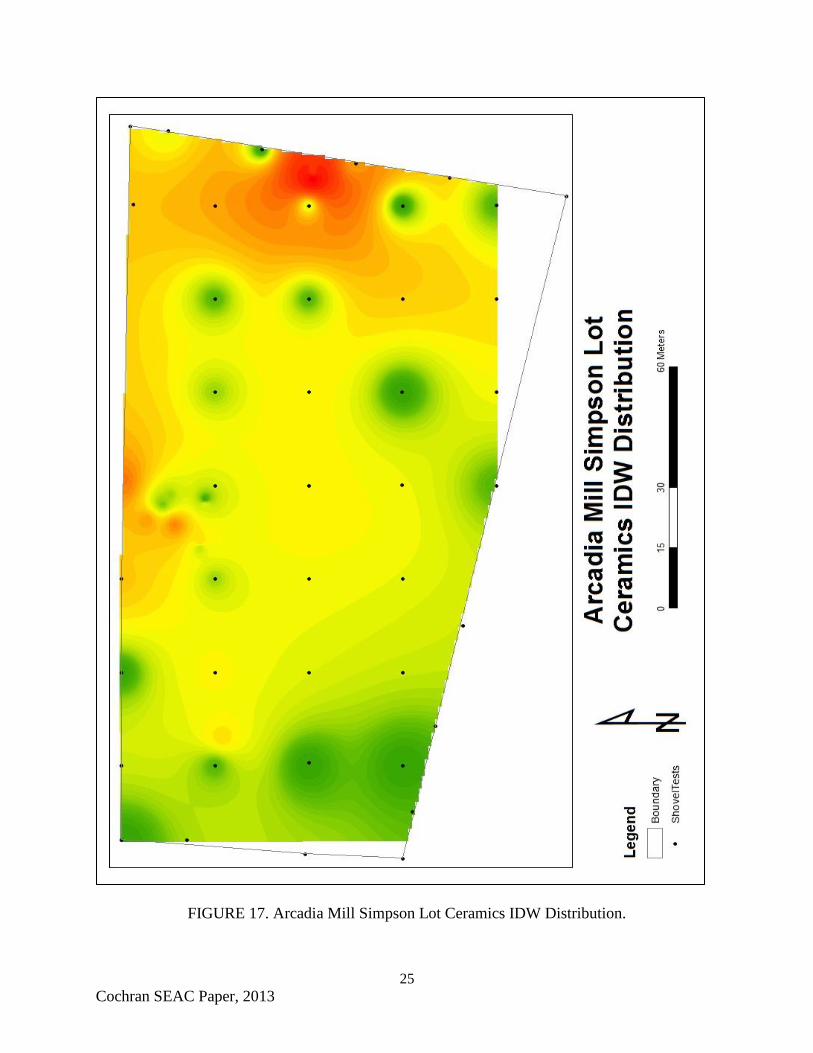
The following artifact density maps were created in ArcGIS from an Access database.
These maps delineate the spatial and temporal boundaries of the site. I selected an inverse
distance (IDW) interpolation method, which uses an algorithm to interpret unexcavated areas in a
grid according to the weighted values of known points at varying distances from grid nodes. Four
comparative artifact density maps were used to guide my interpretation of the placement of
structures on site as well as the extent and state of the material debris around each major area of
use.
The first map shows the overall ceramic assemblage with concentrations around the
eastern side of the site, and moving around towards the northern central portion of the site
(Figure 17). The comparison between cut and wire nails (Figures 18-19) is one of the most
telling figures about the temporal associations of structures on the Simpson Lot. The material
debris field from each structure has an almost perfect inverse correlation, meaning that we found
artifacts where the structures were not and no artifacts where the structures were. Additionally,
most of the cut nails were recovered around Structure 1, while most wire nails were around

7
Cochran SEAC Paper, 2013
Structure 3. This final image, is a map the full cultural material density, sorted by count, and
successfully delineates the expected material refuse field for all three structures (Figure 20).
Game theory methods are implemented because of a lack of substantial quantitatively
derivable data and the subsequent difficulties of using standard statistical techniques to
accurately test ideas about the site, and to look for patterns in the data. The State Against Nature
vector diagram begins by identifying four variables that can be addressed with the data at hand
on the Simpson Lot. The variables can be addressed or tempered with regional or local patterns,
generally following the “activity systems” model outlined by Rapoport (1993:13). Then, each
potential answer to the question or “state of affairs” will attempt to address the set of variables
by comparing what information and data are available to the individual constraints of each game.
This process will be repeated for each potential state of affairs.
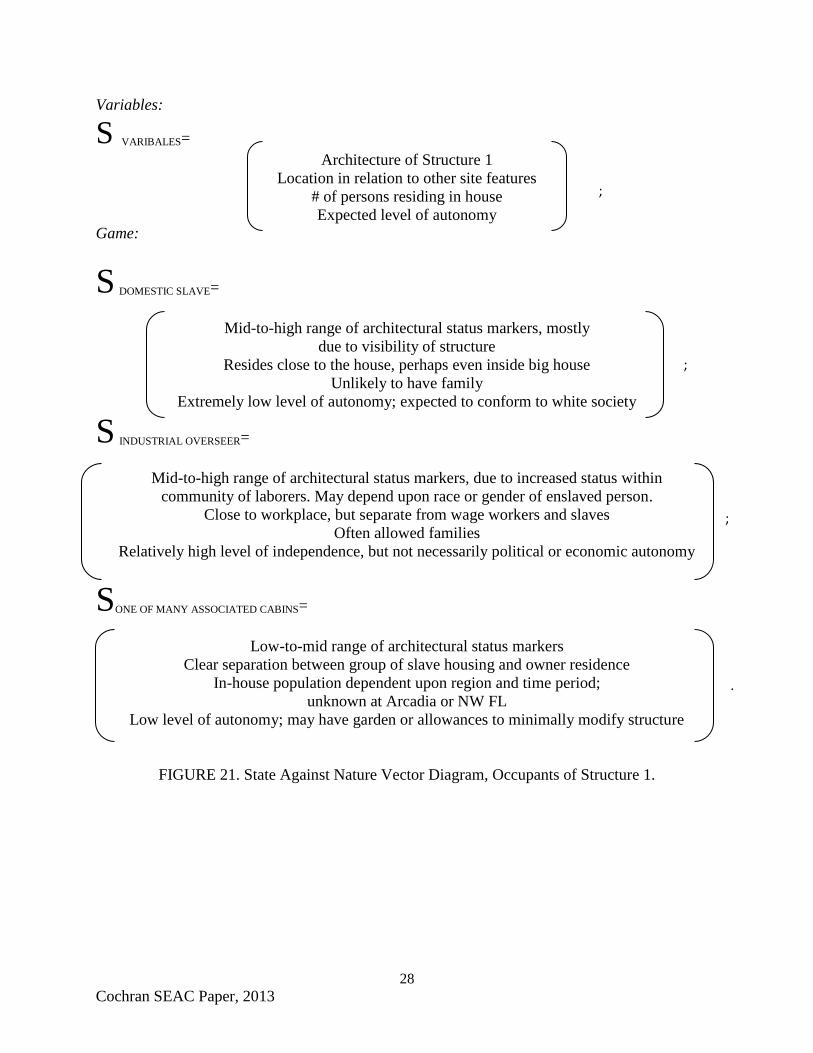
Instead, State Against Nature diagrams will identify the game to be played by using a
series of testable variables that are necessarily tempered with regional or local historical and
archaeological landscape patterns since site-specific data is largely absent. In this game theory
SONAT diagram about the Simpson Lot (Figure 21), the variables include the architecture of
Structure 1, the location of the structure in relation to other features on the site like the Big
House and well, the number of people residing in Structure 1, and finally, expected levels of
autonomy. Next, three “States” are identified using site-specific data. Potential populations that
could have lived in Structure 1 are then listed, and more specific attributes that address each
overall variable are listed. Historical, archaeological, and remote sensing data have alluded to the
possibility that the antebellum resident(s) of Structure 1 could be: (1) a domestic slave serving
inhabitants in the Simpson Big House; (2) the female overseers of the antebellum industrial

8
Cochran SEAC Paper, 2013
sawmill at Arcadia Mill; or (3) Structure 1 could be part of a line of slave cabins in which the
female textile workers resided.
As shown in the SONAT diagram, the first possible occupant (or “State”) of Structure 1
was a domestic slave. This person, typically a female, would have likely been materially
represented by a mid-to high range of architectural materials, such as brick piers and “comfort”
architectural amenities like a fireplace, or perhaps storage areas like a root cellar (Genovese
1968; Singleton 1992; 1995). Locally, the contrast between ironstone and brick building
materials at Area A and the Simpson Lot, respectively, is an excellent status marker. Residential
structures in Area A, where the Arcadia Mill working population resided, were built on ironstone
piers, a sturdy and readily available material at Arcadia Mill. Finally, the common requirement
of domestic slaves to care for the plantation owners’ family often necessitates a close spatial
relationship between slave and owner (Joseph 1993:57-73; Galle 2010:19-43).
The next potential occupant, an overseer to the late textile mill slaves, would have a
similar set of architectural status markers as the domestic slave. This degree of difference, of
course, would be partially dependent upon the race or gender of both the overseer and workers.
The location of the domicile would be dependent upon the responsibilities of the overseer. If s/he
was to supervise the slaves only at the industrial operations at Arcadia sawmill, then there is a
chance that the location of the living quarters is further from the location of the slaves’
residences. Further, there is a greater chance that the overseers are allowed to bring families with
them than slaves being allowed to stay with their families. There was a relatively high level of
autonomy for overseers across the southeast, especially compared to slaves in the later periods of
antebellum south (Genovese 1968).

9
Cochran SEAC Paper, 2013
The third possible occupant, another class of slave, might have been housed in a series of
small domiciles reportedly located near the Big House. A clear separation exists between slave
and overseer style housing, and an even bigger difference exists between a “field slave” or
domestic slave domiciles, particularly architectural materials and spatial patterning. Finally, they
likely have low levels of personal and group autonomy, but were often allowed small garden
plots (Heath and Bennett 2000:41-42). Evidence for this might include areas with negative
archaeological evidence of use spaces adjacent to structures (Mintz 1974:231-232).
My analysis of the SONAT exercise leads me to hypothesize that female overseers
inhabited Structure 1 during the antebellum era. The architecture of Structure 1, in that it is
supported by bricks rather than ironstone, the relative closeness between Structure 1 and the Big
House, and the probable duplex configuration of the semi-autonomous house are all reflective of
probable characteristics of a house belonging to plantation overseers, and similarly, of overseers
to industrial operations.
The analysis of the Simpson Lot according to a game theory framework did not generate
any new hypotheses that were not able to be gleaned from the previously known historical
contexts. It did, however, facilitate pattern recognition by requiring the analyst to clearly deduce
what patterns or traces of peoples and cultures could exist. The appeal of a game theory approach
was its potential to overcome the nearly complete deconstruction of every element of the site by
the succeeding occupant. It is difficult, though, in antebellum enslaved communities or those of
low-wage workers because material “markers” are quite varied, and often indistinct. However, in
this and in other cases, employing a game theoretic approach enables the objective questioning
of the material culture and existing historical documentation as well as to generate hypotheses
concerning data that have not yet been found. Sometimes, deconstructing all evidence and

10
Cochran SEAC Paper, 2013
recompiling it in another often less obvious and less intuitive manner brings about opportunities
to realize what specific data are missing from the network. This came into play at the Simpson
Lot with the hypothesis of the purpose of Structure 1.
Game theory was found to be most useful as a methodological tool, not as a theory or
mathematical model that can generate new information. The problem with trying to examine
historical processes in this manner is that all new information or conclusions are necessarily
circular—unless the test is engineered to have “0” or “1” binary style answers. Game theoretic
methods “forces” one to contextualize the issues from the era(s) in question in order to more
rigorously examine what would have been the optimal choice(s) for the players. It is a more
robust analysis than many because it doesn’t rely on a priori understandings of artifact markers
or analogy.
I propose that game theory has potential applications in archaeology if SONAT vectors
are used to influence research design. This method can be evaluated by playing the State Against
Nature game before investigations of the remainder of the Simpson Lot are undertaken. The
results can help inform what patterns or data may be present and should be used to guide field
methodologies to increase the likelihood of important information being recovered.
Game theory methods enhance our understanding of ephemeral sites like the Simpson Lot
by deconstructing and reorganizing data to incorporate broader, and perhaps better understood
historical or contextual patterns, and then predicting possible site-specific activities that
produced the material outcome recovered through excavations. Although more research is
necessary, the use of game theory methods has inspired a different hypothesis about the site’s
structure and lifeways of the inhabitants than originally deduced from standard methods, and is
thus an invaluable tool.

11
Cochran SEAC Paper, 2013
CITATIONS
Beck, Monica L. and William B. Lees
2009 “As happy and contented with their vocation:” Shame and Pride Surrounding the
Industrial Slaves of the Arcadia Cotton Mill. Paper presented at the 20th
Conference on
Historical and Underwater Archaeology, Toronto, Ontario, Canada.
Galle, Jillian
2010 Costly Signatling and Gendered Social Strategies Among Slaces in the Eighteenth-
Century Chesapeake: An Archaeological Perspective. American Antiquity 75(1):19-43.
Gecil, Ilhamkubilay and Patrick L. Anderson
2010 Applied Game Theory and Strategic Behavior. CRC Press, Taylor and Francis Group:
Boca Raton.
Heath, Barbara A. and Amber Bennett
2000 “The little Spots allow’d them”: The Archaeological Study of African-American Yards.
Historical Archaeology 34(2):38-55.
Joseph, J.W.
1993 White Columns and Black Hands: Class and Classification in the Plantation Ideology of
the Georgia and South Carolina Lowcountry. Historical Archaeology 27(3):57-73.
Kranc, Suzanne Simpson Ripley
N.P. The Simpson Family at Arcadia. 2012.
Little, Keith J., Caleb Curren and Lee McKenzie
1989 Arcadia: An Archaeological Evaluation of a Nineteenth-Century Industrial Complex,
Santa Rosa County, Florida. The University of West Florida, Archaeology Institute,
Report of Investigations 21.
Lloyd, Janet
2001 Laboratory Procedures and Artifact Classification Manual. Manuscript on file at the
University of West Florida Archaeology Institute.
Mintz, Sidney
1974 Caribbean Transformations. Johns Hopkins University Press. Baltimore, MD
Neiman, Fraser D.
2008 The Lost World of Monticello: An Evolutionary Perspective. Journal of Anthropological
Research 64(2):161-193.
12
Cochran SEAC Paper, 2013
Neumann, Jon von
1928 On the Theory of Games of Strategy in Contributions to the Theory of Games edited by
A.W. Tucker and R.D. Luce. 1959. Princeton University Press, Princeton.
1928a Sur la theorie des jeux. Comptes Rendus de l’Academie des Sciences 186(25).
Neumann, Jon von and Oskar Morganstern
1944 Theory of Games and Economic Behavior. Princeton University Press: Princeton.
Phillips, John C.
1993 Arcadia: An Early 19th Century Water-Powered Industrial Complex In Northwest
Florida. The University of West Florida, Archaeology Institute, Report of
Investigations 44.
1998 Flood Thy Neighbor: Colonial and American Water-Powered Mills in West Florida.
Gulf South Historical Review 14:143-162.
Rapoport, Amos
1993 Systems of Activities and Systems of Settings. In Domestic architecture and the Use of
Space, an Interdisciplinary Cross-Cultural Study, Susan Kent, editor, pp. 9-20.
Cambridge University Press: Cambridge.
Rucker, Brian
1988 Arcadia and Bagdad: Industrial Parks of Antebellum Florida. The Florida Historical
Quarterly 67(2):147-165.
1990a Blackwater and Yellow Pine: The Development of Santa Rosa County, 1821-1865.
Ph.D. dissertation, Florida State University.
1990b The Origins and Development of Arcadia and Bagdad. Manuscript on file at the
University of West Florida, Archaeology Institute.
Singleton, Theresa A.
1992 Preface to African-American Gardens and Yards in the Rural South, by Richard
Westmacott. University of Tennessee Press: Knoxville.
1995 The Archaeology of Slavery in North America. Annual Review of Anthropology 24:119-
140.
South, Stanley
1972 “ The Conference on Historic Site Archaeology Papers 1972—Volume 7”. Conference on
Historic Site Archaeology Papers. Book 8. http”//scholarcommons.sc.edu/archanth_
historic_site_arch_conf_papers/8. Accessed 19 August 2013.
1977 Method and Theory in Historical Archaeology. Clinton Corners, NY: Percheron Press.
The Milton Gazette
7 March 1935 Fire Destroys Arcadia, Home of C.H. Simpson: Santa Rosa Landmark is
Consumed by Flames Friday. In Santa Rosa Historical Society, Inc. Newsletter 30(4):1-2
6 June 1935 C.H. Simpson’s New Residence Most Completed: Attractive Bungalow Taking
Place of Home Burned. In Santa Rosa Historical Society, Inc. Newsletter 30(4):2

13
Cochran SEAC Paper, 2013
Varofakis, Yanis
2008 Game Theory: Can it Unify the Social Sciences? Organization Studies 29:1255.

14
Cochran SEAC Paper, 2013
FIGURES
FIGURE 1. Arcadia Mill Simpson Lot Site Boundary.
FIGURE 2. Simpson Lot Site Plan.

15
Cochran SEAC Paper, 2013
FIGURE 3. Structure 1, Simpson Lot

16
Cochran SEAC Paper, 2013
Variables:
Source of income
Labor force
Proximity to an economic core
Investment risk
Potential for political advancement
Safety
Game:
Sell land, timber, ironstone
Unstable labor due to Indian threat
Approximately twenty miles from economic core
High economic risk; uncertain revenue potential; high startup cost
Unknown potential for political advancement
Very unsafe
Sell bricks
Stable Spanish labor force
Approximately five miles from economic core
No economic risk; company already established and thriving
High potential for political advancement
Very safe
FIGURE 4. SONAT Vector, Juan de la Rua in 1819
SMILLLING=
S VARIABLES=
SBRICK=
17
Cochran SEAC Paper, 2013
FIGURE 5. Structure 1 GIS with Block 8 and Block 9 Excavations

18
Cochran SEAC Paper, 2013
FIGURE 6. Structure 2 Extant Foundations
FIGURE 7. East side of E.E. Simpson Residence

19
Cochran SEAC Paper, 2013
FIGURE 8. Water Tower at Bagdad Land and Lumber Company, Taken in 1917 (photo courtesy
of Florida Digital Archives).
FIGURE 9. Top Row (L-R): Blue Shell-Edged Whiteware; Sponged Whiteware; Blue Transfer-
Printed Whiteware; Gilded Whiteware; Middle Row (L-R): Red Transfer Print Whiteware;
Brown Transfer-Print Whiteware; Broad Floral Hand-Painted Whiteware; Annularware; Bottom
Row (L-R): Hand-Painted Whiteware Rim.

20
Cochran SEAC Paper, 2013
FIGURE 10. J. Noriega brick, Structure 2
FIGURE 11. Sample of Arms Artifacts. Top: Lead Bullets, Middle: (L-R) Lead Shot and Sprue,
Bottom: (L-R) Brass Bullet Casings.

21
Cochran SEAC Paper, 2013
FIGURE 12. Sample of Clothing Artifacts. Top Row- Two Iron Buttons, Brass Button; Bottom
Row- Prosser Porcelain Button, Glass Button Fragment.
FIGURE 13. Plastic toy wheel; porcelain doll head fragments; red plastic toy wheel; glass
marbles.

22
Cochran SEAC Paper, 2013
FIGURE 14. Geophysical Grid Layout.

23
Cochran SEAC Paper, 2013
FIGURE 15. Grid A and Grid B GPR Radargrams, 0-253 cmbs.

24
Cochran SEAC Paper, 2013
FIGURE 16. Grid C GPR Radargram, 0-161 cmbs.
25
Cochran SEAC Paper, 2013
FIGURE 17. Arcadia Mill Simpson Lot Ceramics IDW Distribution.

26
Cochran SEAC Paper, 2013
FIGURE 18. Arcadia Mill Simpson Lot Cut Nail IDW Distribution.
FIGURE 19. Arcadia Mill Simpson Lot Machine Made (Wire) Nail IDW Distribution.

27
Cochran SEAC Paper, 2013
FIGURE 20. Arcadia Mill Simpson Lot All Artifacts, IDW Distribution.
28
Cochran SEAC Paper, 2013
Variables:
S VARIBALES=
Architecture of Structure 1
Location in relation to other site features
# of persons residing in house
Expected level of autonomy
Game:
S DOMESTIC SLAVE=
Mid-to-high range of architectural status markers, mostly
due to visibility of structure
Resides close to the house, perhaps even inside big house
Unlikely to have family
Extremely low level of autonomy; expected to conform to white society
S INDUSTRIAL OVERSEER=
Mid-to-high range of architectural status markers, due to increased status within
community of laborers. May depend upon race or gender of enslaved person.
Close to workplace, but separate from wage workers and slaves
Often allowed families
Relatively high level of independence, but not necessarily political or economic autonomy
SONE OF MANY ASSOCIATED CABINS=
Low-to-mid range of architectural status markers
Clear separation between group of slave housing and owner residence
In-house population dependent upon region and time period;
unknown at Arcadia or NW FL
Low level of autonomy; may have garden or allowances to minimally modify structure
FIGURE 21. State Against Nature Vector Diagram, Occupants of Structure 1.
;
;
;
;
.