Organizer Induction Determines Left–Right Asymmetry in Xenopus
Upload
independentCategory
view
0download
0
www.elsevier.com/locate/ydbioDevelopmental Biology 271 (2004) 498–516
Genomes & Developmental Control
Defining a large set of full-length clones from a
Xenopus tropicalis EST project$
Michael J. Gilchrist,a,* Aaron M. Zorn,b Jana Voigt,a,c James C. Smith,a,d
Nancy Papalopulu,a,c,* and Enrique Amayaa,d,*
aWellcome Trust/Cancer Research UK Gurdon Institute, Cambridge CB21QR, UKbDivision of Developmental Biology, Cincinnati Children’s Hospital Research Foundation, Cincinnati, OH 45229-3039, USA
cDepartment of Anatomy, University of Cambridge, Cambridge, UKdDepartment of Zoology, University of Cambridge, Cambridge, UK
Received for publication 5 February 2004, revised 7 April 2004, accepted 7 April 2004
Available online 7 June 2004
Abstract
Amphibian embryos from the genus Xenopus are among the best species for understanding early vertebrate development and for studying
basic cell biological processes. Xenopus, and in particular the diploid Xenopus tropicalis, is also ideal for functional genomics. Understanding
the behavior of genes in this accessible model system will have a significant and beneficial impact on the understanding of similar genes in
other vertebrate systems. Here we describe the analysis of 219,270 X. tropicalis expressed sequence tags (ESTs) from four early
developmental stages. From these, we have deduced a set of unique expressed sequences comprising approximately 20,000 clusters and
16,000 singletons. Furthermore, we developed a computational method to identify clones that contain the complete coding sequence and
describe the creation for the first time of a set of approximately 7000 such clones, the full-length (FL) clone set. The entire EST set is cloned
in a eukaryotic expression vector and is flanked by bacteriophage promoters for in vitro transcription, allowing functional experiments to be
carried out without further subcloning. We have created a publicly available database containing the FL clone set and related clustering data
(http://www.gurdon.cam.ac.uk/informatics/Xenopus.html) and we make the FL clone set publicly available as a resource to accelerate the
process of gene discovery and function in this model organism. The creation of the unique set of expressed sequences and the FL clone set
pave the way toward a large-scale systematic analysis of gene sequence, gene expression, and gene function in this vertebrate species.
D 2004 Elsevier Inc. All rights reserved.
Keywords: Xenopus tropicalis; Expressed sequence tags; EST; Functional genomics; Full-length clones
Introduction given species is a non-redundant collection of mRNA tran-
Whole genome sequences are now available for several
organisms, including human, mouse, Drosophila, Fugu, and
Caenorhabditis, and for these and many more species there
are large, publicly available collections of expressed se-
quence tags (ESTs). Scientists are now faced with the
challenge of extracting information from these sequence
resources to support and accelerate their understanding of
gene function. One of the more valuable resources for any
0012-1606/$ - see front matter D 2004 Elsevier Inc. All rights reserved.
doi:10.1016/j.ydbio.2004.04.023
$ Supplementary data associated with this article can be found in the
online version at doi: 10.1016/j.ydbio.2004.04.023.
* Corresponding authors. Fax: +1-11-44-1223-334-089.
E-mail addresses: [email protected] (M.J. Gilchrist),
[email protected] (N. Papalopulu), [email protected].
ac.uk (E. Amaya).
scripts from expressed genes, both as a data resource and as
physical reagents, such as full-length (FL) cDNA clones and
micro-arrays. Here we describe the completion of the first
phase of the construction of such a resource in an amphibian
vertebrate system, Xenopus.
Amphibian embryos from the genus Xenopus are among
the best systems for understanding early vertebrate develop-
ment and for studying basic cell biological processes. Con-
tributions from Xenopus have yielded important insights into
problems as diverse as axis determination, embryonic induc-
tion, morphogenesis, developmental hematopoiesis, gene
regulation, chromosome structure and regulation, translation-
al regulation, cell cycle control, and signal transduction.
Xenopus embryos are ideally suited for elucidating the
functions of genes active in early development. For instance,
it is easy to study the expression pattern of a given gene in

M.J. Gilchrist et al. / Developmental Biology 271 (2004) 498–516 499
either the whole embryo or in isolated tissues; or, in more
direct assays of gene activity, one can manipulate the expres-
sion of genes bymicro-injecting in vitro-transcribed RNAs or
by generating transgenic embryos (reviewed in Sive et al.,
2000). The function of genes can be blocked by injecting
dominant-negative constructs or by injecting antisense mor-
pholino oligonucleotides (MO) against the translational start
or splice junctions of the gene of interest (Amaya et al., 1991;
Heasman, 2002; Kenwrick et al., 2004; Nutt et al., 2001).
In frog embryos, these assays of gene expression and gene
function can be adapted to large-scale screens. For gene
expression, both microarrays and whole mount in situ hy-
bridization screens have been employed (Altmann et al.,
2001; Gawantka et al., 1998; Munoz-Sanjuan et al., 2002).
For gain of function screens, pools of in vitro-transcribed
RNA can be injected into frog embryos that are then screened
for a desired activity. Once a desired activity is observed, the
complexity of the RNA pools is decreased until a single
active clone is obtained. Using such methods, several devel-
opmentally important genes have been identified (for exam-
ples, see (Glinka et al., 1998; Grammer et al., 2000; Lustig et
al., 1996; Salic et al., 1997; Smith and Harland, 1991, 1992).
A pilot morpholino screen has shown that loss of function
screens are also possible (Kenwrick et al., 2004).
To date, these gain of function screens, expression screens,
and microarrays in Xenopus have mostly been based on
randomly selected sets of clones from nonnormalized cDNA
libraries, entailing redundant analysis of multiple copies of
highly expressed sequences, non-coding sequences, and
common library contaminants. To embark on more effective
large-scale functional genomics studies in Xenopus, we
initiated an EST project in Xenopus tropicalis in collabora-
tion with the Wellcome Trust Sanger Institute (http://
www.sanger.ac.uk/Projects/X_tropicalis/) with the primary
aim of identifying a unique expressed sequence set and a
set of non-redundant full-length clones for use in micro-
arrays, large scale expression screens, and gain or loss of
function studies. This project forms the basis of the work
described here.
We chose to pursue this work in X. tropicalis because,
unlike the more commonly used Xenopus laevis, it is
diploid and therefore the number of genes to characterize
is about half those needed for a comparable project in
X. laevis (Blackshear et al., 2001). In addition, a simpler
genome greatly facilitates sequence assembly, making
X. tropicalis the species of choice for whole genome
sequencing, which is currently underway at the Joint
Genome Institute (Klein et al., 2002). Finally, loss of
function studies in X. laevis are complicated by the redun-
dancy introduced by its allotetraploid genome. For this
reason, X. tropicalis has emerged as the preferred species
for conventional genetic approaches as well as for gene
inactivation studies using morpholino antisense oligonu-
cleotides (Amaya et al., 1998; Carruthers et al., 2003;
Hirsch et al., 2002; Kenwrick et al., 2004; Khokha et al.,
2002; Nutt et al., 2001).
Similar projects to collect and characterize non-redundant
sets of full-length clones are well under way in other
organisms, notably the Drosophila Gene Collection (Staple-
ton et al., 2002), the Mammalian Gene Collection (human
and mouse) (Strausberg et al., 2002), and the FANTOM
project in mouse (Carninci et al., 2003). These projects and
the computational tools they have developed rely to some
extent on a largely sequenced and well-annotated genome,
including a large predicted gene set. This sort of information
is not currently available for Xenopus. We have therefore
developed methods that rely exclusively on EST data in the
species under study while taking full advantage of the huge
number of experimentally characterized or predicted proteins
in other species.
In the first instance, the X. tropicalis EST project has
focused on early stages of embryonic development, where the
Xenopus system has been most effectively exploited. In
contrast, the equivalent stages of mammalian development
are comparatively inaccessible. In this paper, we describe the
production of non-normalized cDNA libraries representing
egg, gastrula, neurula, and tadpole stages of development,
and the subsequent reduction of 196,166 ESTs from these
libraries to a set of 35,567 unique expressed sequences
(clusters and singletons). We further describe computational
methods to isolate from this set those sequences which are
likely to contain a start of translation, and identify the
corresponding clones most likely to contain the full coding
sequence of the gene concerned. In this manner, we have
identified approximately 7000 putative full-length clones that
have been rearrayed into a compact set and are available
through a clone distribution service. Our choice of initial
cloning vector will enable these to be used directly in gene
function experiments.
The computational methods also identify putative splice
variants and single nucleotide polymorphisms (SNPs), both
of which may have an impact on the design of gain and loss of
function experiments. Awebsite has been created to provide
access to these data, and both the unique expressed sequence
set and the FL set are available to the community. We
anticipate that this data set will become a useful resource for
the development of functional genomics inXenopus. Because
of the high degree of similarity between X. laevis and X.
tropicalis, we also expect that many of the reagents produced
for X. tropicalis will function satisfactorily in the other
species, further extending the effective scope of this work.
Terminology
The EST clustering process (described below) generates
clusters that contain more than one matching EST, and
singletons, which are ESTs that do not cluster with any other
EST. Each cluster has a consensus sequence associated with it
and each singleton has its own sequence. In this paper, we
will use the term unique expressed sequence to refer to both
the cluster consensus sequences and the singleton sequences,
so the term set of unique expressed sequences is short-hand
M.J. Gilchrist et al. / Developmental Biology 271 (2004) 498–516500
for the complete set of cluster consensus and singleton
sequences.
cDNA clones ideally contain the whole mRNA transcript.
In practice, however, many clones contain partial copies of
the transcript being truncated at either the 5V end or the 3V end.In this paper, we will refer to full-length clones, meaning
clones where the reverse transcription process has gone at
least as far as the initiator ATG codon, although not neces-
sarily including all the 5V UTR; and complete coding
sequence clones, meaning those which include at least the
whole translated part of theRNAmessagewithout necessarily
including all of either the 5V or 3V UTRs. In a similar way, we
will also refer to full-length sequences, clusters, or singletons
involving at least one EST from a full-length clone.
Materials and methods
cDNA library construction and sequencing
Total RNA was isolated from X. tropicalis eggs and
embryos using standard LiCl/Urea extraction methods.
Poly-A+ mRNA was selected on oligo-dT cellulose
columns. First-strand cDNA was synthesized using an
oligo-dT–NotI primer with Super Script MMLV Reverse
transcriptase (BRL/GIBCO). Second-strand synthesis was
performed with a mixture of DNA polymerase I, Escherichia
coli ligase, and RNAse H, essentially as described (Sambrook
et al., 1989). The ends of the cDNA were polished with T4
DNA polymerase and ligated with EcoRI–SmaI adaptors
(Clontech). The cDNA was then digested with NotI, size
selected by column chromatography, and fractions with an
average size of 1 kb or greater were ligated into the EcoRI–
NotI sites of pCS107 (a modified version of pCS2+; (Gram-
mer et al., 2000)). The ligation was transformed into either
Xl1blue or DH10B cells with approximately 4 million orig-
inal recombinants for each library, approximately 55,000 of
which were robotically arrayed into 384-well plates. The
gastrula and neurula libraries were arrayed at the RZPD,
Germany (http://www.rzpd.de), and the egg and tadpole
libraries were arrayed at the MRC Geneservice, UK (http://
www.hgmp.mrc.ac.uk/geneservice). Based on 40 randomly
picked clones from each library, the average insert size was
approximately 1.2 kb and ranged from0.5 to 4 kb. Sequencing
from the 5V end was obtained by using standard SP6 primers
and from the 3V end using standard T7 primer. The cloneswere
sequenced at the Wellcome Trust Sanger Institute (http://
www.sanger.ac.uk/Projects/X_tropicalis/) and the sequences
deposited in the EMBL database (http://www.ebi.ac.uk/
embl/). The EST clones can be ordered from the MRC
Geneservice (http://www.hgmp.mrc.ac.uk/geneservice).
EST clustering
The EST clustering method used in this work was specif-
ically designed to overcome some types of mis-clustering
observed using other clustering methods, such as (1) over-
clustering caused by chimeric or fusion ESTs and (2) under-
clustering caused by separation of very similar but noniden-
tical transcript sequences, such as alternatively spliced
variants, into different clusters. (1) Over-clustering caused
by chimeric ESTs: chimeric ESTs typically contain random
joins between RNA from different genes (or other contami-
nants), and under single linkage rules (if sequence A belongs
with sequence B, and B belongs with C, then A belongs with
C), an amalgamation of ESTs from different genes into a
single cluster can occur. Because of its random nature, over-
clustering caused by chimeric clones can be neutralized by
requiring a strict double-linkage rule, that is, an ESTcan only
be added to a cluster if it joins to at least two existing ESTs at
the same relative position. (2) Under-clustering is minimized
by allowing similar ESTs to cluster together even if they have
regions where they are quite different. These are usually
alternately spliced transcripts, but may also be un edited or
mis-edited RNAs or significantly polymorphic sequences
from different strains.
ESTs were first tested for contaminants and repeat sequen-
ces. After removing any short residual stretches of linker
sequence at either end, they were searched using BLASTn
(Altschul et al., 1990, 1997) against a series of databases:
Xenopus ribosomal and mitochondrial sequences, known
vector sequences, repeat sequences from RepBase (Jurka,
2001), repeat sequences from Xenopus (Nicolas Pollet, per-
sonal communication), and a simple poly-A template. Sig-
nificant alignments (E-value V 10�20) were recorded in the
database as coordinates along the length of the EST. ESTs
with z40% of their lengths identified in this manner (i.e.,
mostly contaminant) were discarded. In the remaining ESTs,
identified regions z80 nucleotides were ‘masked’ using
lowercase characters (with a minimum alignment of 100
nucleotides used for clustering, shorter masks would be
unlikely to have any beneficial effect). ESTs <100 nucleo-
tides in length were also discarded as too short.
Clustering and alignment were done in three stages
Stage 1: alignment discovery. Alignments were looked for
between all possible pairs of ESTs using BLASTn in ungap-
ped mode with a reduced mismatch penalty of �1 and a
maximum E-value of 10�40. These values were arrived at by
close observation of several trial runs. The reduced mismatch
penalty extended the alignments in a few (marginal) cases,
while the E-value was chosen to limit the BLAST output to
alignments better than approximately 95% identity and 100
nucleotides, taking the size of the EST database into account.
The best alignment for each pair, of at least 100 nucleotides,
was recorded in the database.
Stage 2: cluster building. Initial EST clusters are built and
aligned in a single-pass process starting from a seed EST, and
adding ESTs with alignments of at least 100 nucleotides at
99% minimum identity over at least 50% of their length in
several rounds until no more are added to that cluster. After

w, local cluster width number of ESTs present at a given position
along a cluster
c, codon count number of ESTs containing a given codon at a
given position
p, codon percentage = (c/w)100
M.J. Gilchrist et al. / Developmental Biology 271 (2004) 498–516 501
the second EST is added, all subsequent ESTs added must
align at the same position with at least two ESTs already in the
cluster, that is, double linkage. A new cluster is then started
with the next unused seed EST and so on. Most ESTs are
clustered in this first pass; but the process is rerun at slightly
lower stringency (pass 2: dropping the 50% length limit but
with a 200 nucleotide minimum, pass 3: 100 nucleotide
minimum, pass 4: 100 nucleotide minimum at 95%minimum
identity and allowing single linkage) to produce a few more
clusters. Pass 4 is run at single linkage to allow the formation
of a few clusters that may not be able to form under more
stringent conditions; most of the ESTs have been clustered by
this point and the chances of problems with chimeras are
correspondingly low. Between passes 3 and 4, ESTs with
alignments of at least 100 nucleotides at 95% identity are
added as ‘guest’ members of clusters to which they best join,
although they are not used in consensus building. This allows
us to account for more ESTs without introducing an artifi-
cially high number of singletons or being unable to account
for clones that are known to have been available. They are,
however, hidden in the default cluster views from the data-
base, but can be revealed as an option and recognized by the
word ‘‘add’’ on the left of the EST (see legend to Fig. 1). As
most of the clusters are built at 99% identity between ESTs,
we expect paralogs greater than approximately 2% diver-
gence to be successfully distinguished.
Stage 3: cluster joining. Consensus sequences are built for
each cluster, and then a similar process repeats stages 1 and 2
but using the consensus sequences in place of ESTs and
relaxing the double linkage rule to single. Consensus sequen-
ces are built for any amalgamated clusters.
Clone end pair annotation is not used to build clusters as
it is considered quite unreliable. It is, however, used later in
the full-length clone picking stage to look for 3V ends of
open reading frames, usually in long genes, which are not
connected to their 5V ends.Consensus sequences were also built with a novel
method. This was designed to maximize the contiguity
of consensus sequence in relation to the ESTs. It divides
the aligned ESTs into 12-mers along the length of the
cluster, counts the different 12-mers at each position, and
then builds the consensus from the most common 12-mers.
SNPs and other sequence variants are deduced from a
comparison of the most common with the second most
common 12-mer. This is essential for indicating the
presence of splice variants or other non-SNP sequence
variants, which can be built up quite successfully from a
sequence of the second most common 12-mers. It also
allows some close (in the same 12-mer) pairs of SNPs to
be easily called in the correct haplotypes. To allow for
sequencing artefacts (typically miscalled bases), features
were not reported unless they occurred in at least 3% and
at least 5% for SNPs, and 3% and at least 10% for
variants of aligned sequences, as otherwise they were
deemed more likely to have arisen from sequencing errors.
Frame-shifts introduced by small sequencing errors (usu-
ally near the ends of ESTs) have little effect on the
consensus. The 12-mers of the affected EST in the
frame-shifted region will be different from the most
common 12-mers, and so will be discarded. This method
of constructing a consensus can be more efficient than
using a gapped multiple alignment, when another set of
decisions needs to be made about which gaps to close up
and which to leave open.
BLAST searching
All singletons and cluster consensus sequences were
compared with the non-redundant protein database from
NCBI using NCBI’s standalone BLAST (Altschul et al.,
1990, 1997). Hits with E-value >10�3 were discarded. In
place of NCBI’s SEG filtering for low complexity regions,
we used lowercase filtering based on masks (as described
above) of at least 40 nucleotides. We retained the single
best hit for each organism on a list containing human
(Homo sapiens) and the major model organisms [Mus
musculus, X. tropicalis, X. laevis, Drosophila melanogaster,
Danio rerio, Gallus gallus, Caenorhabditis elegans, Sac-
charomyces cerevisiae, E. coli], plus the single best hit for
up to five other organisms if better than those on the list.
For retained hits, the position of the start methionine of the
matched database protein relative to the query sequence
was calculated and stored in the database.
Counting translation control codons
Translation control codons (ATG, TAA, TAG, TGA)
were identified in each frame for all ESTs to find starts of
translation and open reading frames, and recorded in the
database. For clusters, given the relative alignment of each
EST within the cluster and small sequence variation be-
tween the ESTs, it was then possible to establish which
translation control codons were present in all or most of the
ESTs at any given position along the cluster. To help
establish the positions of reliable translation control codons
for the cluster as a whole, the following values were
defined:
A series of summary translation control codons was
defined for each cluster where either c > 1 and p z 20%,
or c = 1 and p z 50%, and recorded in the database.
As a general rule when using translation control codons
to determine full-length status, and so forth, we required
codons to be present in at least 50% of the ESTs at the
given position along the cluster.

Fig. 1. The graphical display of ESTs and related data in the database. A typical cluster is shown as displayed on the website. Arrows point to the features of the display, as indicated. In addition, the following
aspects of the display should be noted: the clone name corresponding to each EST is given on the left. In addition, there is a cluster name shown on the top left (e.g., Xt3.1-TEgg010o13.3). The ESTs are ordered
according to the position of their 5V end. Above the aligned ESTs, the protein BLAST hits are displayed in blue–green with the identity of the protein, the species from which the protein originates, and the BLAST
hit E-value. In addition, the position of the protein BLAST hit corresponds to the relative position of the hit within the ESTs. Therefore, if the ‘‘P’’ in PROTEIN === of a particular BLAST hit matches with an ATG
on the EST, then there is exact correspondence between the initiation ATG of the EST and the initiation methionine of the protein in the BLAST hit. ‘‘FL component score’’ refers to the criteria of FL evaluation
(see text for details). Abbreviations and other symbols: SNP, single nucleotide polymorphism; ===, protein alignment from BLAST hit reported in this region; —, extrapolated protein alignment, BLAST hit not
reported in this region. The alignment ends when the sequences no longer align or where the consensus sequence ends. The meaning of the designations displayed to the left of the cluster name is as follows: the
code F4A (etc.) indicates the selection mode for the FL clone (see text for full list of such abbreviations); seed, EST by which clustering was initiated; bld, EST added to cluster during normal cluster building; add,
EST added as ‘‘guest’’ or ‘‘temporary’’ member at low confidence after normal cluster building was finished; 3, where present, indicates that this 5V EST has the matching 3V EST in the same cluster. Confidence
scores from 0% to 99%.
M.J.
Gilch
ristet
al./Develo
pmentalBiology271(2004)498–516
502

ental
Open reading frames
Open reading frames were identified in each possible
translation frame for clusters and singletons as extending
from an ATG, preceded by either an in-frame STOP codon
(one of TAA, TAG, TGA) or the start of the sequence, to the
next in-frame STOP codon. Those ORFs where an in-frame
STOP codon preceded the ATG were marked as having a
good start. A minimum ORF length of 54 nucleotides was
used to allow identification of genes with small open reading
framers (smORFs, (Kessler et al., 2003). The three longest
ORFs for each cluster were stored in the database. For a
singleton, only the one longest ORF having a good start in
each frame was recorded. The sequence around each start
ATG was analyzed for the Kozak consensus sequence
(Kozak, 1991), scoring 1 for an A or G at position �4 and
1 for a G at position +3, and 0 otherwise.
Identifying ATG and STOP codons to use for this process
in clusters was complicated by minor sequence variation
between ESTs and the presence of splice variants and other
features. The codon counting method described above was
used with the addition of the concept of a local bundle of
ESTs: a local bundle is a subset of the ESTs in a cluster all of
which contain the same control codon at the same relative
position. The cluster was traversed from 5V to 3V starting withthe first codon where c > 1, and looking for each nearest next
codon where cz 1 and pz 50% (STOP) or p > 50% (ATG); c
and p were evaluated both for the local bundle from the
previous codon and for the cluster as a whole. In the case that
the nearest next codon was from the whole cluster and not
shared by the local bundle, then the ORF was artificially
‘broken’ with a STOP codon, unless the next codon was
beyond the 3V end of any of the local bundle of ESTs. ORFs
were then identified from the sequence of STOPs and ATGs
as described above.
Selection of random subsets of sequences for visual
full-length classification
To provide a standard against which a computational
system could be assessed, we visually classified a randomly
selected subset of clusters and singletons according to
whether they appeared to be full-length or not. The visual
display we used showed all the aligned ESTs in a cluster
with translation control codons, open reading frames, and
protein alignments from BLASTx hits (with organism, E-
value, and description) superimposed. Summary translation
control codons (see above) as well as those in individual
ESTs and consensus sequences were shown. Clusters (or
singletons) were presented in a list ordered by the least
significant digits of their internal database ID (effectively
randomized) and were classified in the order they were
presented. Each cluster or singleton had to be put into one
of four categories (described in Results), and none were
passed over. Classification data were stored in the database
for later use.
M.J. Gilchrist et al. / Developm
The full-length scoring expert system
The main steps in the operation of the computational
full-length scoring expert system are outlined below. For a
more complete mathematical treatment, see Supplementary
Materials.
Input data for each cluster or singleton were position,
translation frame, and codon count for each summary ATG
codon (see above) identified in the cluster (or all ATGs in a
singleton), start position, translation frame and length of all
open reading frames where an in-frame STOP codon pre-
cedes the ATG, and the top BLASTx hits for up to 10 different
organisms.
Three component scores are calculated for each sequence
using different indicators of being full-length, and these are
then combined to give a single expert score for each
sequence. The steps in the process are:
1. Discard any sequences where the start methionines of the
majority of good BLASTx hits are significantly 5V of thestart of the sequence.
2. Discard any ATGs <54 nucleotides before a STOP codon.
3. Calculate three component scores on arbitrary scales
using three different algorithms, taking care to match the
translation frame of codons, open reading frames, and
BLASTx hits.
(i) Score BLH/OVR for BLASTx hits overlapping an
open reading frame with an upstream STOP codon.
(ii) Score ORF/LNG for a long (at least 500 nucleotides)
open reading frame with an upstream STOP codon.
(iii) Score BLH/ATG for BLASTx hits with start
methionines highly coincident with an ATG.
4. Calculate optimal weightings to combine the component
scores by reference to the subset of visually classified
sequences.
5. Add up the weighted component scores to give the overall
expert score for each sequence and store this value in the
database, along with the position of the ATG judged likely
to be the start of translation for use in the clone picking
stage.
Elucidating the relationship between expert scores and
confidence score
Confidence score is defined as the percentage of sequen-
ces from a group (either clusters or singletons) with a given
expert score (see above) that would be expected to be full
length upon further inspection. To derive a standard curve to
convert expert scores to confidence scores, all the sequences
with an expert score >0 were ranked according to their score
and divided up into consecutive groups of 500. Clusters and
singletons were treated separately. A graph was plotted of the
percentage of all those visually classified in a given group
which were classified as ‘certainly full-length’ against log10of the average expert score for the group. The algebraic form
of this curve was restricted by the requirement for the
Biology 271 (2004) 498–516 503

M.J. Gilchrist et al. / Developmental Biology 271 (2004) 498–516504
confidence level to be asymptotic to 100% and 0% at very
large and very small scores, respectively. A simple reasonable
function that gave this was:
confidence score ¼100ð1þ sign½logðexpert scoreÞ � S�
�f1� e�absð½logðexpert scoreÞ�S�=CÞgÞ=2;
where the sign() function is �1 for values <0 and +1 for
values >0, log() is log10, abs() is the absolute value ignoring
sign.
Values of the constants S (shift) and C (curvature) were
determined by trial and error for the two sets of sequences.
The data were plotted via a spreadsheet, the conversion
function curve was superimposed, and values of S and C
adjusted to give the apparent best fit between the data and
the curve. We considered this to be sufficiently accurate
given the approximate nature of both the data and the
relationship between the curve and the data. The values
were S = 1.3 and C = 0.5 for clusters, and S = 2.4 and C =
0.4 for singletons.
Picking full-length clones
We used a further computational method to pick a set of
representative full-length clones, one for each cluster or
singleton in the set of unique expressed sequences which
had an expert system full-length score >0. We wished to
maximize the chance of obtaining the full coding sequence,
minimize the length of 5V UTR and were indifferent to the
amount of 3V UTR included. The process was simple for
singletons. Essentially each singleton was picked, as there
was no other choice.
For clusters, all clones with 5V ESTs containing the ATG
identified as the start of translation were noted, and then
within these we searched for clones that also contained an
indication of the end of the coding region. The end of the
coding region was found either explicitly, by identifying an
in-frame STOP codon within a few nucleotides of the end of a
reported BLASTalignment (code letter ‘B’); or implicitly, by
identifying a terminating polyadenylation signal (code letter
‘A’). Both 5V and 3V ESTs for a given clone were inspected,
clone-end pair data being already stored in the database.
Depending on where the end of translation was located in
relation to the 5V EST containing the ATG, a ‘confidence
value’ of 5 down to 1 was given:
Table 1
Numbers of ESTs sequenced by library and direction of sequencing
Library EST sequence end
5V 3V
Egg 48,672 21,851
Gastrula 50,148 20,635
Neurula 49,846 20,418
Tadpole 4617 3083
5 in same EST
4 in paired 3V EST in same cluster
3 in paired 3V EST in a different cluster
2 in paired 3V EST which has not been clustered
1 in same or paired 3V EST with poly-A stretch
(z24 nt) but no polyadenylation signal
If there was no indication of the end of the coding region,
a confidence value = 0 was given and code letter = ‘0’. For
each cluster, the clone with the highest confidence value was
picked, if there was more than one at that value, the one with
the shortest length of 5V UTR was picked. The picked clone
was then marked in the database with the code ‘F’ +
confidence value + code letter, for example, F4B, or F00
in the worst case and so forth.
Polyadenylation signals were found by analyzing ESTs
for poly-A stretches preceded within 50 nucleotides by one
of the 10 most common polyadenylation signals (AATAAA
and so forth; Beaudoing et al., 2000).
Results
Sequencing, clustering, and identification of a unique
expressed sequence set
Four early stage X. tropicalis oligo-dT-primed cDNA
libraries were constructed and 55,000 clones from each
were arrayed, replicated, and sequenced (see Materials and
methods) as part of an ongoing EST project (http://
www.sanger.ac.uk/Projects/X_tropicalis/). The libraries
were made from eggs, gastrula (stage 10–13), and neurula
(stage 14–20), embryos, and tadpoles (stage 35–40), and
were named TEgg, TGas, TNeu, and TTpA, respectively.
The libraries were constructed in a vector (CS107, Gram-
mer et al., 2000), which facilitates their immediate use for
functional experiments. Approximately 220,000 ESTs were
sequenced (see Table 1), and the sequences made available
in public data repositories (http://www.ebi.ac.uk/embl/).
After discarding contaminated low quality sequences, the
remaining 196,166 ESTs were collapsed into a set of
35,477 unique expressed sequences (see Materials and
methods) of which 19,700 were clusters and 15,747 were
singletons (Table 2).
Consensus sequences and annotation
A consensus sequence was produced for each cluster
(see Materials and methods). Then the set of unique
expressed sequences, that is, cluster consensus and single-
ton sequences, was compared with the non-redundant
protein database at NCBI by BLASTx. The search was
done in such a manner as to include Homo sapiens and any
of the major model organisms (see Materials and methods).
The best result from each organism was kept and used to
provide an indication of the identity of each consensus and

Category Description
3 almost certainly full length
2 ‘probably full length’
1 ‘probably not full length’
0 almost certainly not full length
Table 2
Clustering statistics
EST analysis Total ESTs sequenced 219,270
Discarded low quality 23,228
ESTs used for clustering 196,042
Clustering results Unique expressed sequences 35,477
Clusters 19,700
Singletons 15,747
ESTs in clusters 180,295
Cluster size distribution Clusters of 2 ESTs 6777
Clusters of 3 ESTs 3486
Clusters of 4–10 ESTs 6084
Clusters of 11–100 ESTs 3144
Clusters of 101–1000 ESTs 207
Clusters of >1001 ESTs 2
M.J. Gilchrist et al. / Developmental
singleton sequence (Fig. 1 and database http://www.gurdon.
cam.ac.uk/informatics/Xenopus.html). A large number of
unique expressed sequences (8789 out of 19,700 clusters
and 9662 out of 15,747 singletons) had no BLASTx hits,
even down to E-values of 10�3. The most probable reasons
for this observation are that these sequences contain only
untranslated regions (UTRs), they represent non-coding
RNAs, or they derive from contaminant genomic DNA.
An interesting possibility, however, is that some of the
sequences represent genes that lack homologs in other
species. We found that 178 of the cluster consensus
sequences and 17 of the singleton sequences did not have
a BLAST hit but had an open reading frame of at least 500
nucleotides. These may represent novel genes that are
either specific for Xenopus or which have escaped detection
in other species because they are rapidly evolving or
expressed at very low levels. An example of a X. tropicalis
gene with no apparent homologues in higher vertebrates,
which was found to be involved in head development, has
been identified recently in an antisense morpholino oligo-
nucleotide screen (Kenwrick et al., 2004).
The full-length clone set
A subset of clones from oligo-dT-primed cDNA
libraries, on which the EST-based clusters and singletons
described here are based, will have the complete coding
sequence for the protein product they encode. These clones
are valuable research tools. For some experiments, such as
the design of antisense morpholinos to the start of transla-
tion, one only requires to know the sequence around the start
of translation, whereas for other experiments, it is important
to have a clone containing the full coding sequence of the
gene. We therefore wished to pick a representative full-
length clone for each member of our set of unique expressed
sequences where this was possible (not all clusters and
singletons are full length). To this end, we devised methods
to identify all full-length clusters and singletons and then to
select a representative clone from each to generate a non-
redundant set of full-length clones. Our aims were to identify
as many unique full-length clones as possible.
Looking for starts of translation
Visual classification of full-length sequences. During the
course of this project, we built a visual interface to display
the EST alignments of the clusters, including possible start
and stop codons (ATG for start; and TAA, TAG and TGA
for stops) with predicted open reading frames and
BLASTx alignments (Fig. 1 and database http://www.
gurdon.cam.ac.uk/informatics/Xenopus.html). Looking at
several clusters and singletons showed us that it was
possible to classify most of them as full length, or not
full length, simply by inspection (Fig. 2). The main
indicators were (i) finding an obvious start of an open
reading frame (ATG preceded by an in-frame STOP
codon) where some or all of the open reading frame gave
a BLASTx match with a protein from the public databases
or (ii) finding an obvious start (ATG preceded by an in-
frame STOP codon) where the open reading frame was
sufficiently long to make it unlikely to have arisen by
chance (ATG and STOP codons are present in non-coding
sequence); or (iii) finding an ATG in the same frame as a
BLASTx hit and more or less coincident with the initiator
methionine of one or more matched proteins from different
organisms aligned according to the BLAST coordinates.
Often, all the indicators were combined. For the clusters, it
was clear that one only trusted codons that were present in
the majority of EST sequences at any given position.
Although most of the clusters we inspected were either
clearly full-length (Fig. 2A) or clearly not full-length (Fig.
2D), there were also a smaller number of indeterminate cases
(Figs. 2B and C). We formalized this process with the
following four-point scale (Fig. 2):
Biology 271 (2004) 498–516 505
We used this system to classify a randomly selected
subset of clusters and singletons, approximately 1000 of
each type. The set of visually classified sequences and
their scores can be inspected in the database (http://
www.gurdon.cam.ac.uk/informatics/Xenopus.html, see
Fig. 1 for key to the display). This visual classification
was used for validation and fine tuning of the computa-
tional method that was developed and applied to the
whole set of unique expressed sequences (see below).
Computational expert system for full-length scoring. It
was not practical to classify all approximately 35,000
clusters and singletons by inspection; therefore, a computa-
tional expert system was built that could be applied rapidly
and systematically at the required scale. The expert system
was a computer program designed to simulate our approach

Fig. 2. Categories of the visually classified clusters. Visually classified clusters fall into four categories according to the certainty by which they were deemed to
be full length. The clusters are shown essentially as they are displayed in the website, except that they have been clipped on the 3V end so that the most relevant
information on the 5V end can be easily seen. A full explanation of the features of the display is shown in Fig. 1. Panel A shows a cluster that was visually
classified as ‘certainly full-length’ (category 3). This cluster represents the X. tropicalis ortholog of the proto-oncogene YES. Note that there are five high
quality BLAST hits, ranging from human to zebrafish with complete correspondence of the initiation methionine of all the proteins with an ATG on two of the
ESTs. This ATG has a good Kozak consensus and is preceded by an in-frame STOP codon. Panel B shows a cluster that was visually classified as ‘probably
full-length’ (category 2). This cluster has several BLAST hits to genes from different species but without a clear correspondence between each other over the
position of the start methionine. In addition, the BLAST scores are only moderately good. The start methionine of most of the BLAST hits is near the position
of an ATG in the cluster, but there is another ATG further 5V that could also be the start ATG for the X. tropicalis gene. Even though there is no STOP codon
preceding this ATG, this cluster is ‘probably full-length’, but according to our criteria, it is not ‘certainly full-length’. Panel C shows a cluster that was visually
classified as ‘probably not full-length’ (category 1). This cluster contains many moderately good BLAST hits, but they all extend 5V to the most clearly
identifiable open reading frame of the cluster (purple box), therefore this cluster is ‘probably not full-length’. Panel D shows a cluster (doubleton) that was
visually classified as ‘certainly not full-length’ (category 0). This cluster has many BLAST hits, but they all extend well upstream of the 5V end of the longest
EST.
M.J. Gilchrist et al. / Developmental Biology 271 (2004) 498–516506
to visual classification. It combined information about
possible starts of translation and open reading frames with
protein BLAST alignments to give a score indicating the
approximate likelihood that any given cluster, or singleton,
was full length. Details are given in Materials and methods
and Supplementary Materials, but we include a rationale of

Fig. 3. The components used by the computational FL expert system. The three components shown in this figure were used by the computational expert system
to calculate an FL score for each unique expressed sequence that would reflect the likelihood of it containing the initiator ATG. (i) BLH/OVR: STOP codon
followed by ATG and at least 54 nucleotides of open reading frame with reported BLASTx protein alignment(s) overlapping the open reading frame. (ii) ORF/
LNG: STOP codon followed by ATG and at least 500 nucleotides of open reading frame. (iii) BLH/ATG: predicted start methionine of reported BLASTx
protein alignment(s) near an ATG.
M.J. Gilchrist et al. / Developmental Biology 271 (2004) 498–516 507

M.J. Gilchrist et al. / Developmental Biology 271 (2004) 498–516508

M.J. Gilchrist et al. / Developmental Biology 271 (2004) 498–516 509
the method here. Clusters and singletons were treated
separately because of the difference in reliability between
consensus and single-read sequences.
The general strategy was to identify correct translation
frames in the cluster consensus sequences (or singletons)
from the protein BLAST hits, and then ascertain whether the
first ATG in the corresponding open reading frame could be
confirmed as the start methionine; either from the existence
of an upstream in-frame STOP codon or because a clear
majority of aligned BLAST hit proteins had their start
methionine more or less exactly coincident with the ATG,
indicating a highly conserved start of translation. A special
case was allowed for long open reading frames with an
upstream in-frame STOP even in the absence of a positive
BLAST indication. The scoring system that was developed
preferentially rewarded quality of BLAST hit (E-value), the
number of BLAST hits from different organisms pointing to
the same ATG, Xenopus BLAST hits, length of open
reading frame, and degree of confidence in the consensus
sequence at the position of both the ATG and any upstream
STOP codon. The output of this process was a single value
expert score for each sequence; the higher the score the
more likely the sequence was to be full-length.
There were three different scoring algorithms, one for
each of the indicators described above (Fig. 3): (i) open
reading frame with upstream in-frame STOP codon and
BLAST hit (BLH/ORF; Fig. 3A), (ii) long open reading
frame with upstream in-frame STOP codon (ORF/LNG;
Fig. 3B), and (iii) ATG coincident with start methionine of
similar protein (BLH/ATG; Fig. 3C). Each algorithm gave a
score from zero upwards on an open-ended, arbitrary, whole
number scale, with zero indicating no evidence of being
full-length and greater evidence giving higher scores. Of the
19,700 clusters, 5134 (26%) were given a full-length score
by at least one algorithm and 1705 were scored by all three.
The figures for the 15,747 singletons were 2119 (13%) and
200, respectively.
Adding the three scores together for each sequence
should give a total indication of the approximate likelihood
of being full-length, that is, the higher the total, the greater
the likelihood. Although we did not require a theoretical
statistical validation of the results, we did want some
significant reassurance that the expert system score was
effective in sorting full-length from non-full-length sequen-
ces. This was provided by our ‘gold standard’, the subset of
sequences that had been visually classified, independently
of the scoring by the expert system. We compared the visual
classifications with their ranking according to their expert
system score (Fig. 4). It is clear that the expert system ranks
nearly all the full-length sequences ahead of the non-full-
length ones (compare columns A and C in Fig. 4). Out of the
Fig. 4. Graphical illustration of the relationship between full-length classification
clusters and 1000 singletons, each one pixel height horizontal line represents one it
by visual classification category. Column B: unordered. Column C: ranked by exp
weighted using visual classification data to maximize separation of category 3.
1005 visually classified clusters, 196 were categorized
‘certainly full-length’ and of these only 1 (0.5%) failed to
be given a score by the expert system; and of the 675
categorized ‘certainly not full-length’, only 6 (0.9%) were
given a score. Of the 134 remaining clusters that were
classified in the less clear ‘probably’ categories, 64 (48%)
were given an expert score, much as one might expect; but
between these two categories, most of these scored sequen-
ces (53/64) were in the ‘probably full-length’ rather than the
‘probably not full-length’ category, which was reassuring.
We suspected that a better correspondence could be
achieved by adjusting the relative weights of the three
expert system scores in the total score. This was done using
the visually classified subset, by finding the weight for each
algorithm’s score that produced the lowest mean ranking of
‘certainly full-length’ category sequences when ranked
(highest score = lowest rank) according to the sum of the
weighted expert system scores. This is described in more
detail in the Supplementary Materials. The difference
caused by applying the weighting can be clearly seen in
Fig. 4 (by comparing columns C and D). The effect is
noticeably more marked for singletons than clusters, prob-
ably because of the relatively poor predictive power of open
reading frames in singletons. This is because singletons
contain less depth of sequence information, so sequencing
errors are not recognized as such, relative to consensus
sequence assembled from many ESTs. The weights applied
to the different component scores for clusters and singletons
are given in Table 3.
If we make the further assumption that, on average, any
sequences with the same expert system score as one of the
visually classified ones is similarly likely to be full-length,
we can then extract some useful data about the whole set of
sequences. Table 4 contains data derived from this assump-
tion, and using it we can convert the expert scores, which
are on an arbitrary scale, to a more intuitive percentage
confidence score; where 100% would indicate that a ran-
domly selected sequence with this score would almost
certainly be full-length, and 0% that it almost certainly
would not be. To further clarify, if we were to take a random
group of sequences with a 50% confidence score, we would
expect to find, on inspection, that half the group would be
obviously full-length and the other half would be either
ambiguous or obviously not full-length. This is primarily
useful when selecting many full-length sequences for ex-
perimental purposes and one wishes to reduce the number of
possibly unproductive inputs. It is not intended to help
evaluate individual sequences on inspection. Data to create
a conversion graph between expert score and confidence
score were derived by ranking all the sequences that got an
expert score >0 (separating clusters and singletons) accord-
by visual inspection and the computational expert system. Data for 1000
em, and is colored according to its visual classification. Column A: grouped
ert system, unweighted scores. Column D: ranked by expert system, scores

Table 3
Optimized weights applied to the component scores making up the total
full-length expert score for both clusters and singletons
Component score Optimized weights for scores
Clusters Singletons
BLH/OVR 1.00 0.12
ORF/LNG 0.25 0.25
BLH/ATG 1.00 2.00
M.J. Gilchrist et al. / Developmental Biology 271 (2004) 498–516510
ing to their score and dividing them up into consecutive
groups of 500 (Table 4). The group size was a trade-off
between the number of data points in the graph and the
number of values (visually classified sequences in the
group) that were used to provide a data point. For each
group, we determined the percentage of all those in the
group that was classified as being either ‘certainly full-
length’ or ‘probably full-length’. For example, in the top
500 clusters, which had an average expert score of 1247.82,
all 34 (100%) of the visually classified clusters within this
group had been scored as ‘certainly full-length’. In the next
group of 500, which had an average expert score of 517.65,
21/22 (95%) of the visually classified clusters within this
group had been scored as ‘certainly full length’. The
remaining one had been classified as ‘probably full-length’.
At lower expert scores, for example, the group of 500
between 4001 and 4500, which had an average expert score
of 8.24, 14/28 (50%) of the visually classified clusters in this
group had been scored as ‘certainly full-length’. Plotting
these data for all the groups enabled us to establish an
Table 4
Clusters and singletons with expert score >0 ranked according to expert score an
Rank by expert score Average expert score Total number visually
From Toclassified in each group
Clusters
1 500 1247.82 34
501 1000 517.65 22
1001 1500 311.39 22
1501 2000 200.42 20
2001 2500 127.04 32
2501 3000 79.97 27
3001 3500 43.95 28
3501 4000 20.60 25
4001 4500 8.24 28
4501 5000 2.42 22
5001 5134 0.56 5
5134
Singletons
1 500 716.47 48
501 1000 129.92 37
1001 1500 35.27 41
1501 2000 11.07 45
2001 2119 2.54 9
2119
Average score and numbers of visually classified sequences, total and in categori
groups.
approximate relationship (see Materials and methods) be-
tween the expert score and the confidence score (Fig. 5). The
resultant confidence scores are indicated in the database (Fig.
1), as they are more useful than the arbitrary expert scores.
We can also use the data in Table 4 to estimate upper and
lower limits for the proportion of sequences that will actually
turn out to be full-length using different cut-off values of the
expert score to select groups of sequences. If we selected all
5134 clusters with an expert score >0.0, then we would
expect (approximately) 3709 to be ‘certainly full-length’
and a further 1048 to be ‘probably full-length’ (using the
totals in the extrapolated columns in Table 4 for these
categories). Discounting the small proportion of the rest that
might be full length, we can therefore reasonably expect
between 72% and 92% of the sequences actually to be full
length. If instead we only selected the top scoring 4000, the
numbers are 3437 and 463, respectively, giving lower and
upper limits of 86% and 97%. So while one might tolerate a
relatively high false-positive rate in some large-scale experi-
mental approaches, for example, a large-scale gain-of-func-
tion screen using injection of in vitro-transcribed RNAs from
pools, one could be more selective for other applications.
Picking full-length clones
Not only had our expert system given us a score indicating
the likelihood of a sequence being full-length, but it had also
suggested which ATGmarked the start of translation. Picking
a full-length clone was then, at some level, as simple as
picking a clone whose 5V EST contained the given ATG.
d put into groups of 500
‘Certainly FL’, category 3 ‘Probably FL’, category 2
Visually
classified
in group
% Extrapolated
number
in group
Visually
classified
in group
% Extrapolated
number
in group
34 100 500 0 0 0
21 95 477 1 4 22
22 100 500 0 0 0
18 90 450 1 5 25
25 78 390 6 18 93
23 85 425 4 14 74
21 75 375 5 17 89
16 64 320 8 32 160
14 50 250 12 42 214
1 4 22 14 63 318
0 0 0 2 40 53
3709 1048
40 83 416 6 12 62
11 29 148 12 32 162
2 4 24 6 14 73
0 0 0 2 4 22
0 0 0 0 0 0
588 319
es, calculated for each group; and data used to extrapolate values to whole

Fig. 5. Modeling the relationship between confidence score and expert
score, plotted from data in Table 4. Sequences were ranked according to
expert system full-length score, divided into consecutive groups of 500,
confidence score estimated in each group by extrapolation from the data for
the visually classified sequences, and expert score averaged over the group
(data are in columns 6 and 3, respectively of Table 4). A standard curve was
fitted to the results and is used to convert expert scores to confidence
scores.
Fig. 7. Composition of the set of FL clusters. For each of the 5134 full-
length clusters, the species of the top blast hit was noted. Because few
genes have been described in X. tropicalis, only 1% of the FL clusters had
its top BLASTx hit from this species. Most genes within the full-length
clone set have not been previously identified in Xenopus. Thirty percent of
the FL clusters had it closest match to genes from X. laevis, while 69% of
the clusters matched most closely to genes from other species.
M.J. Gilchrist et al. / Developmental Biology 271 (2004) 498–516 511
Several issues complicate this choice, however, of which the
most important is the possibility of internal priming (between
the poly-T primer and an A-rich stretch of sequence that is not
the poly-A tail) during cDNA construction, leading to
Fig. 6. Plot of average full-length confidence score against cluster size. Average c
Two groups: all clusters (19,700) and clusters with non-zero FL score (5134). Data
is shown in red. Data points for clusters with non-zero FL scores are shown in b
truncated clones missing part of the 3V end of the mRNA.
This is hard to quantify, as it is very sequence specific;
however, we saw enough examples of it to wish to take pains
to avoid internally truncated clones where possible. Other
considerations were the desirability of excluding 5V untrans-
onfidence score calculated at each cluster size (number of ESTs in cluster).
points for all clusters are shown in red triangles and the corresponding curve
lue circles and the corresponding curve is shown in blue.

M.J. Gilchrist et al. / Developmental512
lated regions (UTRs) because they may contain translation
suppression signals (Meijer et al., 2000; van der Velden and
Thomas, 1999; van der Velden et al., 2000) that could
influence translational efficiency in gain of function screens.
We chose to prioritize capture of the full coding sequence
and, when possible, minimize the length of 5V UTR.Our clone-picking strategy was for all clusters giving a
full-length score, identify all those clones whose 5V ESTscontained the designated ATG, and therefore at least the
start of the coding sequence. These clones were then
evaluated to see if their ESTs contained evidence for the
end of the coding sequence, which could be either a STOP
codon closely following the end of the reported BLAST
alignments (in the same frame) or a polyadenylation signal
followed by some evidence of a poly-A tail (or clustered
alongside such an EST). We also included a preference for
3V ESTs in the same cluster as the originating 5V ESTs. Andthen, all other things being equal, we selected the clone
with the shortest 5V UTR. The process is described in more
detail in Materials and methods.
In this way, we generated two lists of full-length
clones: 5076 originating in clusters and 1893 from the
set of singletons. (The discrepancy between the 5076 and
the 5134 that achieved a full-length expert score >0 arose
because we only considered 5V ESTs for clone selection,
and there were a small number (58) of possibly full-
length clusters which only contained 3V ESTs.) These are
available in the database and are indicated in cluster views
and so forth (http://www.gurdon.cam.ac.uk/informatics/
Xenopus.html). We have also physically rearrayed most
of these from the full set of library clones to give a set of
eighteen 384-well plates containing 6912 putative full-
length clones (we excluded the 47 lowest scoring single-
ton clones to fill a whole number of plates). Single clones
or the whole set are available from the MRC Geneservice
(http://www.hgmp.mrc.ac.uk/geneservice) on a cost re-
covery basis. In the future, it may be useful to rearray
the full-length clone set in order of confidence score.
These reagents make an important contribution to the
collection of resources for the rapidly growing field of
Xenopus genomics, especially as the clones, once
obtained, may be used directly in many experiments, for
example, gain of function screens, without the need for
subcloning.
Fig. 8. Clusters containing splice variants and single nucleotide polymorphisms (SN
splice variants, each containing a different start of translation. This cluster represen
as Apod, BRAT, and Xombi). Clusters containing variants are flagged by having th
given in green letters above the ESTs corresponding to the region containing the v
an ATG that is common in all the lower ESTs (green arrow). Also note that all thes
by green line on the left). In contrast, the ESTs containing the other variant (upper
the left). According to BLASTx data, this variant would be expected to start transla
containing another in-frame ATG highlighted by the red arrow. Panel B shows a
translation. This cluster represents the X. tropicalis ortholog of adaptor protein co
having the word ‘‘SNP’’ written in brown on the upper left (see also Fig. 1). The po
nucleotide preceded or followed by dash lines in brown (i.e., —C—) is seen. No
initiator ATG, there are two single nucleotide polymorphisms (boxed in yellow)
nucleotide is either G or T.
Relation between number of ESTs in a cluster and
full-length score
We wished to gain some insight into whether the number
of ESTs in a cluster (cluster size) has any relationship with
the likelihood of it being full length. This may have some
bearing on library sequencing strategy, where one may
consider a trade-off between sequencing a few libraries from
different stages or tissues in depth, thus getting more EST per
gene versus sequencing many libraries more shallowly to
sample a potentially larger number of genes. Fig. 6 is a plot
of the average FL confidence score for all clusters of a given
size against cluster size. Considering all clusters (red tri-
angles), there is a clear correlation between cluster size and
confidence score, indicating that smaller clusters were less
likely to be full length. Considering only those clusters with
a non-zero FL score (blue circles), the dependence on cluster
size is less obvious, while still being apparent at relatively
small sizes (approximately 10 or less). This is probably
caused in part by the difficulty of cloning long genes, as
reverse transcription is prone to fail part-way through copy-
ing long RNAs, leading to incomplete 5V ends. However,even if cloning was perfect, we would still expect half the
clusters derived from long RNAs not to be full length, as the
3V ESTs would not overlap the 5V ESTs, leading to two
clusters per gene; and only one of these would be scored as
full length.
In this project, we have sequenced a relatively small
number of libraries at significant depth (approximately
50,000 clones per library), and this appears to have been a
reasonable strategy for maximizing the number of full-length
transcripts.
Analysis of the FL clone set
We used the top BLASTx hit to gain some information
about the composition of the FL clone set. Only 1% of
clones in the FL set from the clusters had its best blast hit in
X. tropicalis, reflecting the recent introduction of X. tropi-
calis as an experimental model system. The percentage of
clones that were most similar to a X. laevis genes was 30%,
while the majority of the clones were most similar to genes
identified in mouse, humans, or other organism (chick,
zebrafish, rat, and so forth; Fig. 7). Based on this, we
estimate that the majority of the clones in this FL set
represent genes that had not previously been identified in
Biology 271 (2004) 498–516
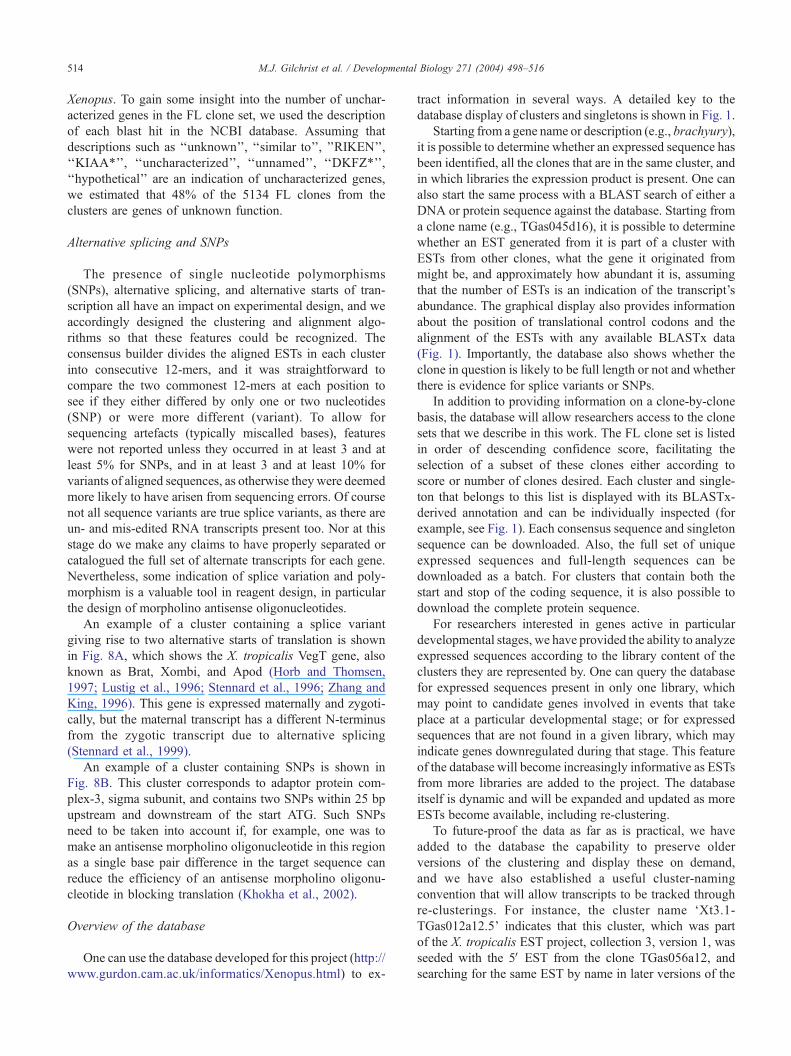
Ps) around the starts of translation. Panel A shows a cluster containing two
ts the X. tropicalis ortholog of the T-box containing gene VegT (also known
e word ‘‘variant’’ written in green on the upper left. The variant sequence is
ariant sequence. Note that the variant sequence lies over a region containing
e ESTs come from either the gastrula or neurula libraries (ESTs highlighted
ESTs) are mainly from the egg library (ESTs highlighted by the red line on
tion at the ATG highlighted by the blue arrow. However, there are two ESTs
cluster containing two single nucleotide polymorphisms around the start of
mplex-3, sigma subunit. Clusters containing SNPs are easily recognized by
sition of the SNPs is identified by scanning above the EST sequences until a
te that 19 nucleotides before the initiator ATG and 10 nucleotides after the
. At position � 19, the nucleotide is either T or C. At position + 10, the

M.J. Gilchrist et al. / Developmental Biology 271 (2004) 498–516 513
M.J. Gilchrist et al. / Developmental Biology 271 (2004) 498–516514
Xenopus. To gain some insight into the number of unchar-
acterized genes in the FL clone set, we used the description
of each blast hit in the NCBI database. Assuming that
descriptions such as ‘‘unknown’’, ‘‘similar to’’, ’’RIKEN’’,
‘‘KIAA*’’, ‘‘uncharacterized’’, ‘‘unnamed’’, ‘‘DKFZ*’’,
‘‘hypothetical’’ are an indication of uncharacterized genes,
we estimated that 48% of the 5134 FL clones from the
clusters are genes of unknown function.
Alternative splicing and SNPs
The presence of single nucleotide polymorphisms
(SNPs), alternative splicing, and alternative starts of tran-
scription all have an impact on experimental design, and we
accordingly designed the clustering and alignment algo-
rithms so that these features could be recognized. The
consensus builder divides the aligned ESTs in each cluster
into consecutive 12-mers, and it was straightforward to
compare the two commonest 12-mers at each position to
see if they either differed by only one or two nucleotides
(SNP) or were more different (variant). To allow for
sequencing artefacts (typically miscalled bases), features
were not reported unless they occurred in at least 3 and at
least 5% for SNPs, and in at least 3 and at least 10% for
variants of aligned sequences, as otherwise they were deemed
more likely to have arisen from sequencing errors. Of course
not all sequence variants are true splice variants, as there are
un- and mis-edited RNA transcripts present too. Nor at this
stage do we make any claims to have properly separated or
catalogued the full set of alternate transcripts for each gene.
Nevertheless, some indication of splice variation and poly-
morphism is a valuable tool in reagent design, in particular
the design of morpholino antisense oligonucleotides.
An example of a cluster containing a splice variant
giving rise to two alternative starts of translation is shown
in Fig. 8A, which shows the X. tropicalis VegT gene, also
known as Brat, Xombi, and Apod (Horb and Thomsen,
1997; Lustig et al., 1996; Stennard et al., 1996; Zhang and
King, 1996). This gene is expressed maternally and zygoti-
cally, but the maternal transcript has a different N-terminus
from the zygotic transcript due to alternative splicing
(Stennard et al., 1999).
An example of a cluster containing SNPs is shown in
Fig. 8B. This cluster corresponds to adaptor protein com-
plex-3, sigma subunit, and contains two SNPs within 25 bp
upstream and downstream of the start ATG. Such SNPs
need to be taken into account if, for example, one was to
make an antisense morpholino oligonucleotide in this region
as a single base pair difference in the target sequence can
reduce the efficiency of an antisense morpholino oligonu-
cleotide in blocking translation (Khokha et al., 2002).
Overview of the database
One can use the database developed for this project (http://
www.gurdon.cam.ac.uk/informatics/Xenopus.html) to ex-
tract information in several ways. A detailed key to the
database display of clusters and singletons is shown in Fig. 1.
Starting from a gene name or description (e.g., brachyury),
it is possible to determine whether an expressed sequence has
been identified, all the clones that are in the same cluster, and
in which libraries the expression product is present. One can
also start the same process with a BLAST search of either a
DNA or protein sequence against the database. Starting from
a clone name (e.g., TGas045d16), it is possible to determine
whether an EST generated from it is part of a cluster with
ESTs from other clones, what the gene it originated from
might be, and approximately how abundant it is, assuming
that the number of ESTs is an indication of the transcript’s
abundance. The graphical display also provides information
about the position of translational control codons and the
alignment of the ESTs with any available BLASTx data
(Fig. 1). Importantly, the database also shows whether the
clone in question is likely to be full length or not and whether
there is evidence for splice variants or SNPs.
In addition to providing information on a clone-by-clone
basis, the database will allow researchers access to the clone
sets that we describe in this work. The FL clone set is listed
in order of descending confidence score, facilitating the
selection of a subset of these clones either according to
score or number of clones desired. Each cluster and single-
ton that belongs to this list is displayed with its BLASTx-
derived annotation and can be individually inspected (for
example, see Fig. 1). Each consensus sequence and singleton
sequence can be downloaded. Also, the full set of unique
expressed sequences and full-length sequences can be
downloaded as a batch. For clusters that contain both the
start and stop of the coding sequence, it is also possible to
download the complete protein sequence.
For researchers interested in genes active in particular
developmental stages, we have provided the ability to analyze
expressed sequences according to the library content of the
clusters they are represented by. One can query the database
for expressed sequences present in only one library, which
may point to candidate genes involved in events that take
place at a particular developmental stage; or for expressed
sequences that are not found in a given library, which may
indicate genes downregulated during that stage. This feature
of the database will become increasingly informative as ESTs
from more libraries are added to the project. The database
itself is dynamic and will be expanded and updated as more
ESTs become available, including re-clustering.
To future-proof the data as far as is practical, we have
added to the database the capability to preserve older
versions of the clustering and display these on demand,
and we have also established a useful cluster-naming
convention that will allow transcripts to be tracked through
re-clusterings. For instance, the cluster name ‘Xt3.1-
TGas012a12.5’ indicates that this cluster, which was part
of the X. tropicalis EST project, collection 3, version 1, was
seeded with the 5V EST from the clone TGas056a12, and
searching for the same EST by name in later versions of the

M.J. Gilchrist et al. / Developmental Biology 271 (2004) 498–516 515
database should arrive at the new cluster representing the
same transcript.
Discussion
Xenopus provides an excellent system for large-scale
functional genomic approaches. Our aim in this work was
to take advantage of a large-scale EST project in X.
tropicalis to maximize the potential and efficiency of such
approaches in the future. This was done both by reducing
redundancy (inherent in cDNA libraries) and by careful
analysis for features indicating the presence of full-length
coding sequences. The initial collection of 219,270 ESTs
was reduced to a set of 35,477 unique expressed sequences
within which we identified 7253 putative full-length
sequences. From the full-length sequences, we selected
and have physically re-arrayed 6912 representative clones
(some clusters did not contain a suitable 5V EST). Thesevarious-derived subsets are suited for different experimental
purposes, which we will discuss below, either as physical
reagents or as data for further reagent design.
The 35,477 unique expressed sequence set will improve
the effectiveness of gene expression screens in Xenopus,
either in microarray experiments or large scale in situ
hybridizations, which up till now have relied on partially
redundant, random sets of gene transcripts (Altmann et al.,
2001; Gawantka et al., 1998; Munoz-Sanjuan et al., 2002).
Although there will still be a small amount of redundancy in
the data (e.g., when 5V and 3V ESTs from long transcripts
form non-overlapping clusters), having most genes repre-
sented only once will significantly increase efficiency and
coverage. Both microarray analysis and large scale in situ
hybridization screens can be easily performed in Xenopus
because its external development facilitates the collection of
tissues and embryos in large numbers. In situ hybridization
analyses will be further facilitated by the choice of cloning
vector for this EST project, which allows RNA probes to be
generated in vitro without further subcloning, which will
also benefit other RNA-based experiments.
The smaller set of putative full-length sequences can be
used for experimental analysis of gene function, for in-
stance, in loss of function experiments by injection of
antisense MOs to block the start of translation, or in gain
of function screens through overexpression of RNA by
injection. It is in this context that the full-length confidence
levels described above may be most useful. For example,
antisense morpholino oligonucleotide experiments are both
relatively expensive and acutely sensitive to correct identi-
fication of the start of translation (an antisense morpholino
oligonucleotide designed to the wrong ATG will almost
certainly not block translation), whereas RNA injection
overexpression experiments are both cheaper and may still
produce a useful result from a slightly truncated protein (i.e.,
if the first ATG in the cDNA is not actually the start of
translation of the endogenous protein). One might therefore
choose to do antisense morpholino oligonucleotide experi-
ments with a smaller number of high confidence full-length
sequences, and not the full set. The confidence scores are
available to users in the database and may be used as an aid
to interpreting individual sequences or customizing the
selection of groups of sequences for screens.
An illustrative example of the importance of reducing
redundancy can be seen in the overexpression screen that is
done by pooling clones and injecting the consequent mixed
RNAs. By reducing the number of clones to be screened
from >200,000 to <10,000, one can then afford to reduce the
pool size, that is, the number of clones initially tested
together in one sample, resulting in an increase in the
sensitivity with which phenotypes are uncovered [Voigt
and Papalopulu, unpublished observations].
In conclusion, this EST resource and the FL set will
enable researchers to initiate a systematic and large-scale
analysis of gene expression and gene function in a verte-
brate model system focused on early embryo development.
Acknowledgments
We would like to thank Aaron Mackey for advice on
BLAST search strategy for model organisms, Simon J.
Poulton and Brian J. McCabe for advice on statistical
analysis of full-length data, Nicolas Pollet for providing
unpublished data on sequence masking, Richard Harland for
donating the pCS107 plasmid, Mustafa Khokha for useful
discussions, and Karin Schmitt and Kathy Hartley for
comments on the manuscript. We are grateful to John
Gurdon for his input in initiating the collaboration with the
Wellcome Trust Sanger Institute. We thank our colleagues at
the Wellcome Trust Sanger Institute, Jane Rogers for
undertaking the X. tropicalis EST sequencing project and
comments on the manuscript, Jennifer Ashurst and Michael
Croning for their input in EST processing and comments on
the manuscript, and Elizabeth Huckle and Ruth Taylor for
sequencing. We also thank Nigel Garret for constructing the
tadpole library. Thanks also to Sun Microsystems and the
staff at the Cambridge-Cranfield High Performance Com-
puting Facility for advice and access to the SunFire F15K
node-based Galaxy-class supercomputer on which the
BLASTx searches were run. This work was funded by the
Wellcome Trust. AMZ is supported by NIH grant HD 42572,
NP and EA are Wellcome Trust Senior Research Fellows.
References
Altmann, C.R., Bell, E., Sczyrba, A., Pun, J., Bekiranov, S., Gaasterland,
T., Brivanlou, A.H., 2001. Microarray-based analysis of early develop-
ment in Xenopus laevis. Dev. Biol. 236, 64–75.
Altschul, S.F., Gish, W., Miller, W., Myers, E.W., Lipman, D.J., 1990.
Basic local alignment search tool. J. Mol. Biol. 215, 403–410.
Altschul, S.F., Madden, T.L., Schaffer, A.A., Zhang, J., Zhang, Z., Miller,
W., Lipman, D.J., 1997. Gapped BLAST and PSI-BLAST: a new gen-
eration of protein database search programs. Nucleic Acids Res. 25,
3389–3402.

M.J. Gilchrist et al. / Developmental Biology 271 (2004) 498–516516
Amaya, E., Musci, T.J., Kirschner, M.W., 1991. Expression of a dominant
negative mutant of the FGF receptor disrupts mesoderm formation in
Xenopus embryos. Cell 66, 257–270.
Amaya, E., Offield, M.F., Grainger, R.M., 1998. Frog genetics: Xenopus
tropicalis jumps into the future. Trends Genet. 14, 253–255.
Beaudoing, E., Freier, S., Wyatt, J.R., Claverie, J.M., Gautheret, D., 2000.
Patterns of variant polyadenylation signal usage in human genes.
Genome Res. 10, 1001–1010.
Blackshear, P.J., Lai, W.S., Thorn, J.M., Kennington, E.A., Staffa, N.G.,
Moore, D.T., Bouffard, G.G., Beckstrom-Sternberg, S.M., Touchman,
J.W., Bonaldo, M.F., Soares, M.B., 2001. The NIEHS Xenopus
maternal EST project: interim analysis of the first 13,879 ESTs from un-
fertilized eggs. Gene 267, 71–87.
Carninci, P., Waki, K., Shiraki, T., Konno, H., Shibata, K., Itoh, M.,
Aizawa, K., Arakawa, T., Ishii, Y., Sasaki, D., Bono, H., Kondo, S.,
Sugahara, Y., Saito, R., Osato, N., Fukuda, S., Sato, K., Watahiki, A.,
Hirozane-Kishikawa, T., Nakamura, M., Shibata, Y., Yasunishi, A.,
Kikuchi, N., Yoshiki, A., Kusakabe, M., Gustincich, S., Beisel, K.,
Pavan, W., Aidinis, V., Nakagawara, A., Held, W.A., Iwata, H., Kono,
T., Nakauchi, H., Lyons, P., Wells, C., Hume, D.A., Fagiolini, M.,
Hensch, T.K., Brinkmeier, M., Camper, S., Hirota, J., Mombaerts, P.,
Muramatsu, M., Okazaki, Y., Kawai, J., Hayashizaki, Y., 2003. Target-
ing a complex transcriptome: the construction of the mouse full-length
cDNA encyclopedia. Genome Res. 13, 1273–1289.
Carruthers, S., Mason, J., Papalopulu, N., 2003. Depletion of the cell-cycle
inhibitor p27(Xic1) impairs neuronal differentiation and increases the
number of ElrC(+) progenitor cells in Xenopus tropicalis. Mech. Dev.
120, 607–616.
Gawantka, V., Pollet, N., Delius, H., Vingron, M., Pfister, R., Nitsch, R.,
Blumenstock, C., Niehrs, C., 1998. Gene expression screening in Xen-
opus identifies molecular pathways, predicts gene function and provides
a global view of embryonic patterning. Mech. Dev. 77, 95–141.
Glinka, A., Wu, W., Delius, H., Monaghan, A.P., Blumenstock, C., Niehrs,
C., 1998. Dickkopf-1 is a member of a new family of secreted proteins
and functions in head induction. Nature 391, 357–362.
Grammer, T.C., Liu, K.J., Mariani, F.V., Harland, R.M., 2000. Use of large-
scale expression cloning screens in the Xenopus laevis tadpole to
identify gene function. Dev. Biol. 228, 197–210.
Heasman, J., 2002. Morpholino oligos: making sense of antisense?
Dev. Biol. 243, 209–214.
Hirsch,N., Zimmerman, L.B., Grainger, R.M., 2002.Xenopus, the next gene-
ration: X. tropicalis genetics and genomics. Dev. Dyn. 225, 422–433.
Horb, M.E., Thomsen, G.H., 1997. A vegetally localized T-box tran-
scription factor in Xenopus eggs specifies mesoderm and endoderm
and is essential for embryonic mesoderm formation. Development
124, 1689–1698.
Jurka, J., 2001. Repbase update: a database and an electronic journal of
repetitive elements. Trends Genet. 16, 418–420.
Kenwrick, S., Amaya, E., Papalopulu, N., 2004. A pilot morpholino screen
in Xenopus tropicalis identifies a novel gene involved in head deve-
lopment. Dev. Dyn. 229, 289–299.
Kessler, M.M., Zeng, Q., Hogan, S., Cook, R., Morales, A.J., Cottarel, G.,
2003. Systematic discovery of new genes in the Saccharomyces
cerevisiae genome. Genome Res. 13, 264–271.
Khokha, M.K., Chung, C., Bustamante, E.L., Gaw, L.W., Trott, K.A.,
Yeh, J., Lim, N., Lin, J.C., Taverner, N., Amaya, E., Papalopulu,
N., Smith, J.C., Zorn, A.M., Harland, R.M., Grammer, T.C., 2002.
Technique and probes for the study of Xenopus tropicalis deve-
lopment. Dev. Dyn. 225, 499–510.
Klein, S.L., Strausberg, R.L., Wagner, L., Pontius, J., Clifton, S.W.,
Richardson, P., 2002. Genetic and genomic tools for Xenopus research:
the NIH Xenopus initiative. Dev. Dyn. 225, 384–391.
Kozak, M., 1991. An analysis of vertebrate mRNA sequences: intimations
of translational control. J. Cell Biol. 115, 887–903.
Lustig, K.D., Kroll, K.L., Sun, E.E., Kirschner, M.W., 1996. Expression
cloning of a Xenopus T-related gene (Xombi) involved in mesodermal
patterning and blastopore lip formation. Development 122, 4001–4012.
Meijer, H.A., Dictus, W.J., Keuning, E.D., Thomas, A.A., 2000. Transla-
tional control of the Xenopus laevis connexin-41 5V-untranslatedregion by three upstream open reading frames. J. Biol. Chem. 275,
30787–30793.
Munoz-Sanjuan, I., Bell, E., Altmann, C.R., Vonica, A., Brivanlou, A.H.,
2002. Gene profiling during neural induction in Xenopus laevis: regu-
lation of BMP signaling by post-transcriptional mechanisms and TAB3,
a novel TAK1-binding protein. Development 129, 5529–5540.
Nutt, S.L., Bronchain, O.J., Hartley, K.O., Amaya, E., 2001. Comparison
of morpholino based translational inhibition during the development of
Xenopus laevis and Xenopus tropicalis. Genesis 30, 110–113.
Salic, A.N., Kroll, K.L., Evans, L.M., Kirschner, M.W., 1997. Sizzled: a
secreted Xwnt8 antagonist expressed in the ventral marginal zone of
Xenopus embryos. Development 124, 4739–4748.
Sambrook, J., Fritsch, E.F., Maniatis, T., 1989. Molecular Cloning: A
Laboratory Manual, second ed. Cold Spring Harbor Laboratory Press,
Cold Spring Harbor, NY.
Sive, H.L., Grainger, R.M., Harland, R.M., 2000. Early Development of
Xenopus laevis: A Laboratory Manual. Cold Spring Harbor Laboratory
Press, Cold Spring Harbor, NY.
Smith, W.C., Harland, R.M., 1991. Injected Xwnt-8 RNA acts early in
Xenopus embryos to promote formation of a vegetal dorsalizing center.
Cell 67, 753–765.
Smith, W.C., Harland, R.M., 1992. Expression cloning of noggin, a new
dorsalising factor localised to the Spemann organiser in Xenopus em-
bryos. Cell 70, 829–840.
Stapleton, M., Liao, G., Brokstein, P., Hong, L., Carninci, P., Shiraki, T.,
Hayashizaki, Y., Champe, M., Pacleb, J., Wan, K., Yu, C., Carlson, J.,
George, R., Celniker, S., Rubin, G.M., 2002. The Drosophila gene
collection: identification of putative full-length cDNAs for 70% of
D. melanogaster genes. Genome Res. 12, 1294–1300.
Stennard, F., Carnac, G., Gurdon, J.B., 1996. The Xenopus T-box gene,
Antipodean, encodes a vegetally localised maternal mRNA and can
trigger mesoderm formation. Development 122, 4179–4188.
Stennard, F., Zorn, A.M., Ryan, K., Garrett, N., Gurdon, J.B., 1999.
Differential expression of VegT and Antipodean protein isoforms in
Xenopus. Mech. Dev. 86, 87–98.
Strausberg, R.L., Feingold, E.A., Grouse, L.H., Derge, J.G., Klausner, R.D.,
Collins, F.S., Wagner, L., Shenmen, C.M., Schuler, G.D., Altschul, S.F.,
Zeeberg, B., Buetow, K.H., Schaefer, C.F., Bhat, N.K., Hopkins, R.F.,
Jordan, H., Moore, T., Max, S.I., Wang, J., Hsieh, F., Diatchenko, L.,
Marusina, K., Farmer, A.A., Rubin, G.M., Hong, L., Stapleton, M.,
Soares, M.B., Bonaldo, M.F., Casavant, T.L., Scheetz, T.E., Brownstein,
M.J., Usdin, T.B., Toshiyuki, S., Carninci, P., Prange, C., Raha, S.S.,
Loquellano, N.A., Peters, G.J., Abramson, R.D., Mullahy, S.J., Bosak,
S.A., McEwan, P.J., McKernan, K.J., Malek, J.A., Gunaratne, P.H.,
Richards, S., Worley, K.C., Hale, S., Garcia, A.M., Gay, L.J., Hulyk,
S.W., Villalon, D.K., Muzny, D.M., Sodergren, E.J., Lu, X., Gibbs, R.A.,
Fahey, J., Helton, E., Ketteman, M., Madan, A., Rodrigues, S., Sanchez,
A., Whiting, M., Young, A.C., Shevchenko, Y., Bouffard, G.G., Blakes-
ley, R.W., Touchman, J.W., Green, E.D., Dickson, M.C., Rodriguez,
A.C., Grimwood, J., Schmutz, J., Myers, R.M., Butterfield, Y.S., Krzy-
winski, M.I., Skalska, U., Smailus, D.E., Schnerch, A., Schein, J.E.,
Jones, S.J., Marra, M.A., 2002. Generation and initial analysis of more
than 15,000 full-length human and mouse cDNA sequences. Proc. Natl.
Acad. Sci. U. S. A. 99, 16899–16903.
van der Velden, A.W., Thomas, A.A., 1999. The role of the 5V untranslatedregion of an mRNA in translation regulation during development. Int. J.
Biochem. Cell Biol. 31, 87–106.
van der Velden, A.W., Los, A., Voorma, H.O., Thomas, A.A., 2000.
Sequence and translation initiation properties of the Xenopus TGFbeta5,
PDGF-A, and PDGF-alpha receptor 5V untranslated regions. Int. J.
Dev. Biol. 44, 851–859.
Zhang, J., King, M.L., 1996. Xenopus VegT RNA is localized to the
vegetal cortex during oogenesis and encodes a novel T-box transcrip-
tion factor involved in mesodermal patterning. Development 122,
4119–4129.
Copyright © 2022 FDOKUMEN