Uptake of phenol from aqueous solution by burned water hyacinth

RESEARCH ARTICLE
Kinetics of phenol biodegradation at high concentrationby a metabolically versatile isolated yeast Candida tropicalisPHB5
Bikram Basak & Biswanath Bhunia & Subhasish Dutta &
Samayita Chakraborty & Apurba Dey
Received: 25 May 2013 /Accepted: 23 July 2013# Springer-Verlag Berlin Heidelberg 2013
Abstract A highly tolerant phenol-degrading yeast strainPHB5 was isolated from wastewater effluent of a coke ovenplant and identified as Candida tropicalis based on phyloge-netic analysis. Biodegradation experiments with C. tropicalisPHB5 showed that the strain was able to utilize 99.4 % of2,400 mg l−1 phenol as sole source of carbon and energy within48 h. Strain PHB5 was also observed to grow on 18 variousaromatic hydrocarbons. Haldane model was used to fit theexponential growth data and the following kinetic parame-ters were obtained: μmax=0.3407 h−1, KS=15.81 mg l−1,Ki=169.0 mg l−1 (R2=0.9886). The true specific growth rate,calculated from μmax, was 0.2113. A volumetric phenol degra-dation rate (Vmax) was calculated by fitting the phenol consump-tion data with Gompertz model and specific degradation rate (q)was calculated fromVmax. The q values were fittedwith Haldanemodel, yielding following parameters: qmax=0.2766 g g−1 h−1,KS′=2.819 mg l−1, Ki′=2,093 (R
2=0.8176). The yield factor(YX/S) varied between 0.185 to 0.96 g g−1 for different initialphenol concentrations. Phenol degradation by the strainproceeded through a pathway involving production of interme-diates such as catechol and cis,cis-muconic acid which wereidentified by enzymatic assays and HPLC analysis.
Keywords Candida tropicalis . Phenol biodegradation .
Growth kinetics . Haldanemodel . Degradation .
Ortho- pathway
Nomenclature
K Fitting parameter for Gompertz equation (per hour)Kd Endogenous coefficient (per hour)KS, Ki Half saturation coefficient and inhibition coeffi-
cient applied to growth rate (milligram per liter)KS′, Ki′ Half saturation coefficient and inhibition coeffi-
cient applied to specific degradation rate(milligram per liter)
M Cell maintenance coefficientq Specific degradation rate (gram per gram per hour)qmax Maximum specific degradation rate (gram per
gram per hour)Si, S Initial phenol concentration (milligram per liter),
phenol concentration (milligram per liter)S′ Consumed phenol (milligram per liter)Sm Phenol concentration at which μ=μmax
Sm′ Phenol concentration at which q=qmax
tm Time of maximum volumetric phenol degradationrate
Vmax Maximum volumetric phenol degradation rate(milligram per liter per hour)
X0, X Initial biomass concentration (milligram per liter),biomass concentration (milligram per liter)
X′ Biomass concentration at tYX/S Growth yield coefficient (gram per gram)YP/S Product yield coefficient (milligram per gram)
Greek symbols
α, β Fitting parameters of the Gompertz equation(milligram per liter)
Responsible editor: Robert Duran
Electronic supplementary material The online version of this article(doi:10.1007/s11356-013-2040-z) contains supplementary material,which is available to authorized users.
B. Basak : S. Dutta : S. Chakraborty :A. Dey (*)Department of Biotechnology, National Institute of TechnologyDurgapur, Mahatma Gandhi Avenue, Durgapur 713209, Indiae-mail: [email protected]
A. Deye-mail: [email protected]
B. BhuniaDepartment of Bio Engineering, National Institute of TechnologyAgartala, Tripura 799055, India
Environ Sci Pollut ResDOI 10.1007/s11356-013-2040-z

μ Specific growth rate (per hour)μmax Maximum specific growth rate in Haldane's
model (per hour)μ*max True maximum specific growth rate (per hour)
Introduction
Phenol is one of the major organic pollutants in wastewaterfrom various phenol-laden industries such as coking, coalrefining, petrochemicals, plastic, pharmaceutical industries,etc. (Liu et al. 2009; Kumar et al. 2013). Phenol-containingeffluents from these industries are potentially toxic, and ifdischarged untreated it can pose critical health hazard to plantsas well as other organisms (Yan et al. 2005). Therefore, it is ofutmost practical significance to reduce the phenol level inindustrial effluents to a tolerant level before its discharge intothe environment (Gianfreda et al. 2006).
The effectiveness, economical, and environmental conve-nience of biological treatment over the physical and chemicaltreatment of phenol-containing wastewater has been widelystudied in the last two decades (Christen et al. 2012; Banerjeeand Ghoshal 2010a). However, because of the inhibitoryeffects of phenol on microorganisms, biological treatment ofphenol-containing wastewater has been facing up the chal-lenge (Liu et al. 2011; Jiang et al. 2007a). There are reportsthat describe the degradation of phenol at concentration from500 to 2,000 mg l−1 by different microorganisms (Essam et al.2010; Christen et al. 2012; Arutchelvan et al. 2006; Wanget al. 2010; Geng et al. 2006). However, concentration ofphenol can reach up to 6.8 g l−1 in some industrial wastewater,while according to European Union recommendation, theupper limits of phenol concentration in potable water andwastewater effluent are 0.5 μg l−1 and 0.5 mg l−1, respectively(Christen et al. 2012; Busca et al. 2008). Hence, to removehigher level of phenol from industrial effluents, it is especiallyimportant to isolate and screen for appropriate microorganismthat can tolerate as well as effectively degrade phenol atrelatively high concentration.
Phenol-degrading microorganisms have been studied toshow substrate inhibition at high phenol concentration, anddynamics of microbial growth on this substrate has beendescribed by different substrate inhibitionmodels. The growthkinetic parameters such as maximum specific cell growth rate(μmax), substrate affinity constant (KS), and substrate inhibitionconstant (Ki) specify the efficiency of biodegradation processand vary over a wide range depending upon the microorgan-ism and culture conditions (Banerjee and Ghoshal 2010a).Getting better insights about the kinetic behavior of a micro-organism growing on high concentration of phenol as solesource of carbon and energy is a prerequisite as each microor-ganism has its unique growth dynamics which can foretelldegradative capability of that particular microorganism. As
described in literature, phenol degradation by microorganismscan follow either ortho- or meta- pathway. Ortho- pathwayinvolves production of intermediates such as catechol, cis,cis-muconic acid, while meta- pathway involves ring cleavage ofcatechol to form 2-hydroxymuconic semialdehyde (2-HMSA)(Banerjee andGhoshal 2010b). Depending upon the metabolicpathway employed by the organism to degrade the substrateand consequently the intermediates generated, the situationand composition of wastewater also vary. Therefore, it isimportant to know about the pathway and intermediates ofphenol degradation.
In this study, we have described phenol degradation by ahighly tolerant andmetabolically versatile yeast strainCandidatropicalis PHB5. This strain was able to grow on phenol andmetabolize this substrate at a maximum concentration of2,400 mg l−1. Different mathematical models were used todetermine the growth kinetics parameters (μmax, KS, Ki) andspecific phenol degradation rate (q) for this organism grown inbatch cultures. Since phenol-containing wastewater usuallycontains other related organic toxicants, such as chlorophenols,m-cresol, and other aromatic hydrocarbons, degradative versa-tility of this strain was evaluated by detecting growth anddegradation in the presence of different other toxicants as solecarbon source. To the best of our knowledge, the literaturelacks kinetic data for phenol biodegradation at concentration ashigh as 2,400 mg l−1 by a strain which is capable of degrading18 various toxic substances. We have also determined thekinetics of phenol degradation pathway and we have identifiedsome of the metabolites produced during the degradationprocess.
Materials and methods
Culture medium and growth condition
An inorganic medium, supplemented with trace element so-lution, was used for isolation and biodegradation study and itscomposition was as follows (in gram per liter): NH4NO3 0.5,MgSO4·7H2O 0.2, K2HPO4 0.5, KH2PO4 0.5, andCaCl2·2H2O 0.02. The trace element solution was added tothe inorganic medium at 10 ml l−1 and contained (in gram perliter) FeSO4·7H2O 0.3, MnSO4·H2O 0.05, CoCl2·6H2O 0.1,Na2MoO4·2H2O 0.034, ZnSO4 0.04, and CuSO4·5H2O 0.05(Basak et al. 2013b). Phenol at required concentration servedas sole source of carbon and energy. Chemicals used were ofanalytical and HPLC grade and were purchased from SigmaAldrich (USA), Himedia (India), and Merck (India). Waterused for the HPLC analysis was prepared by Ultrapure WaterSystem (Arium® 611UF, Sartorius, Germany). The initial pHof themediumwasmaintained at 6 and the working volume ofmedium was 50 ml in 250 ml Erlenmeyer flask in all exper-iments. The microorganism was maintained by routine
Environ Sci Pollut Res

bimonthly transfer under aseptic conditions to an inorganicmedium provided with phenol (at concentration 2,400 mg l−1)as sole source of carbon and energy and stored at 4 °C afterincubation at 30 °C for 48 h.
Isolation and screening of phenol-degrading strain
Five milliter of sample (wastewater effluent of a coke ovenplant in steel industry, Durgapur, India) was added to 250 mlErlenmeyer flask containing 50 ml of inorganic mediumsupplemented with 500 mg l−1 phenol and incubated at 30 °Cin New Brunswick Innova® 42 incubator shaker at 120 rpm for120 h. After incubation, 5 ml of culture was added to 50 ml offresh medium with same concentration of phenol. The opticaldensity of the culture broth at 600 nm (OD600) was periodicallymonitored and once microbial growth was established(OD600≈0.9 to 1.0) it was considered to be used as inoculumfor next inoculation. From then on, the culture was transferredsuccessively to fresh inorganic media using the same growthconditions at each transfer, except that the phenol concentrationincreased stepwise, varying from 500 to 2,000 mg l−1 at500 mg l−1 interval and then from 2,000 to 2,400 mg l−1 at100 mg l−1 interval. The transfer was repeated three times ateach concentration of phenol. After acclimatization for about2 months, the enriched culture obtained was duly plated onsolid inorganic medium supplemented with 2,400 mg l−1 phe-nol. Colonies appeared were purified and each separated colo-ny was further screened for best phenol degradation capabilityand strain PHB5 was selected for further study.
Identification and characterization of strain
The pure culture of isolated strain PHB5 was sent to MerckMillipore, India, for identification based on sequences of 18SrRNA gene (partial) and internal transcribed spacer (ITS) 1 and2. The 18S rRNA gene is highly conserved and was used forthe phylogenetic analysis of higher taxonomic levels, whereasthe highly variable ITS region was used to differentiate thestrain at lower taxonomic levels. The genomic DNA wasextracted and the 18S rRNA gene and the ITS regions wereamplified by PCR using the following primers: forward 5′GGA AGTAAA AGT CGTAAC AAG G 3′ and reverse: 5′GGTCCGTGTTTCAAGACGG 3′. The obtained sequencewas submitted to NCBI GenBank database and a similaritysearch was carried out using online BLAST program (http://www.ncbi.nlm.nih.gov/). Amaximum likelihood phylogenetictree was generated and evolutionary distance bootstrap valueswere determined by Jukes–Cantor model of neighbor-joiningmethod in MEGA 4.
Morphological examination was done using scanning elec-tron microscopy according to Yu et al. (2007). Biochemicaltests were performed using HicandidaTM Identification Kit(Himedia, India) according to the manufacturer's instruction.
The Biochemical tests included detection of urease enzymeand sugar assimilation test. The positive tests were confirmedby color changes in the identification kit. The presence ofoxidase was determined using Himedia DD018 Oxidase discs(Himedia, India). Catalase activity was tested according toZilouei et al. (2006).
Characterization of metabolic versatility
The metabolic versatility of the strain was evaluated by inoc-ulating the strain into inorganic medium supplemented withdifferent organic compounds as sole source of carbon andenergy. All the compounds (Table 1) were sterilized by mem-brane filtration technique. Syringe filtration unit was usedwith 25-mm-diameter membrane filter for the filtration. Thecompounds which were polar and water soluble (such as 4-chlorophenol, 3-chlorophenol, 2,4-dichlorophenol, 2,4,6-trichlorophenol, 4-nitrophenol, m-cresol, o-cresol, catechol,resorcinol) were dissolved in distilled water to prepare stocksolution of desired concentration and then sterilized by filtra-tion using 25-mm-diameter hydrophilic membrane filter(Durapore 22μ, Catalogue # GVWP02500, Millipore). Thecompounds which were nonpolar and solid (naphthalene,anthracene, phenanthrene, pyrene) were dissolved in acetoneor methanol to prepare stock solution of desired concentrationand then sterilized by filtration using 25-mm-diameter hydro-phobic membrane filter (Fluoropore 22μ, Catalogue #FGLP02500, Millipore). The nonpolar liquid aromatic com-pounds were directly filtered through the aforementionedhydrophobic membrane filter. The organic compounds(Table 1) were supplied under sterile condition at concentra-tion of 50–500 mg l−1 in 250 ml Erlenmeyer flasks containinginorganic medium. Each flask was then inoculated with 5 mlof cells (OD600≈0.2) that were grown previously on inorganicmedium supplemented with phenol (sole source of carbon andenergy), thereby making the final medium volume 50 ml.Prior to inoculation, the cells previously grown were washedtwice with distilled water to remove traces of phenol and thenresuspended in distilled water to make cell suspension ofOD600≈0.2. Flasks that were inoculated, but not supplied withany organic substrate, were taken as negative control. Growthwas considered positive if the optical density of the cultures at600 nm was above 0.2. The residual concentrations of thesecompounds were measured by HPLC and spectrophotometricanalysis after incubation of 48 h.
Kinetics of cell growth and phenol biodegradation
We have presumed that aeration provided oxygen levels atsufficient concentration and does not limit growth. Hence,the influence of oxygen was not considered and it wasassumed that the growth and phenol degradation rate of
Environ Sci Pollut Res
PHB5 strain was only inhibited by substrate concentrationat given initial pH, temperature, and aeration rate (Wanget al. 2010).
Kinetics of cell growth in a batch reactor may be describedas :
dX
dt¼ μX−KdX ð1Þ
Kd can be assumed to be negligible during exponentialgrowth. Hence, Eq. (1) can be written as:
dX
dt¼ μX ð2Þ
μ ¼ 1
X
dX
dtð3Þ
The Haldane's kinetic model [Eq. (4)] has been frequentlyused to describe growth rates of microorganisms on inhibitorysubstrates such as phenol (Monteiro et al. 2000; Yan et al.2005; Wang et al. 2010; Kumar et al. 2005).
μ ¼ μmaxS
KS þ S þ S2.K i
� � ð4Þ
Different other substrate inhibition models were also usedto determine various kinetic parameters viz, Aiba model,Edward's model, Yano model, etc. The equations of thesemodels used are as follows:
Aiba model
μ ¼ μmaxS
KS þ Sexp −S�
K i
� �ð5Þ
Edward's model
μ ¼ μmaxS
S þ KS þ S2.
K i
� �1þ S
�KS
� � ð6Þ
Yano model
μ ¼ μmaxS
S þ KS þ S2.
K i
� �1þ S
�K
� � ð7Þ
The kinetic parameters of growth of the strain were calcu-lated from experimental data from Eq. (8).
The substrate utilization kinetics is given by:
dS
dt¼ −
1
YX =S
dX
dt−
1
YP=S
dP
dt−MX ð8Þ
A carbon substrate is used to form cell material and meta-bolic products as well as used for maintenance of the cell.However, in the present scenario, the substrate used for prod-uct formation and cell maintenance is assumed to be
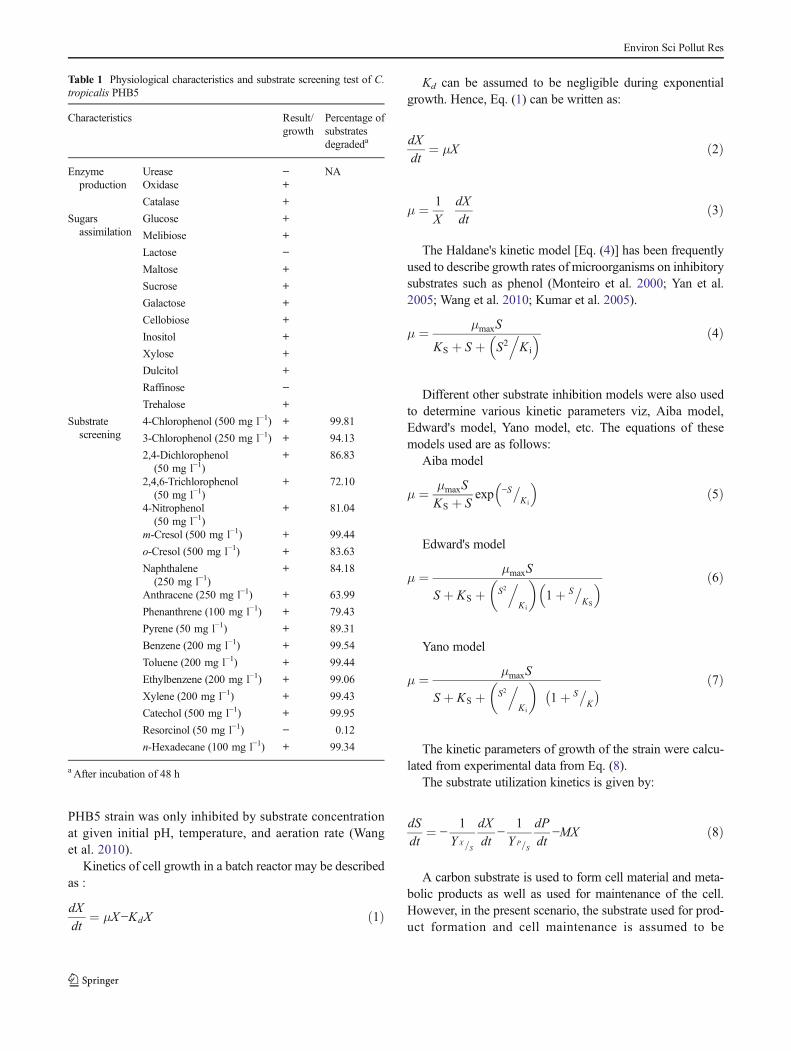
Table 1 Physiological characteristics and substrate screening test of C.tropicalis PHB5
Characteristics Result/growth
Percentage ofsubstratesdegradeda
Enzymeproduction
Urease − NAOxidase +
Catalase +
Sugarsassimilation
Glucose +
Melibiose +
Lactose −Maltose +
Sucrose +
Galactose +
Cellobiose +
Inositol +
Xylose +
Dulcitol +
Raffinose −Trehalose +
Substratescreening
4-Chlorophenol (500 mg l−1) + 99.81
3-Chlorophenol (250 mg l−1) + 94.13
2,4-Dichlorophenol(50 mg l−1)
+ 86.83
2,4,6-Trichlorophenol(50 mg l−1)
+ 72.10
4-Nitrophenol(50 mg l−1)
+ 81.04
m-Cresol (500 mg l−1) + 99.44
o-Cresol (500 mg l−1) + 83.63
Naphthalene(250 mg l−1)
+ 84.18
Anthracene (250 mg l−1) + 63.99
Phenanthrene (100 mg l−1) + 79.43
Pyrene (50 mg l−1) + 89.31
Benzene (200 mg l−1) + 99.54
Toluene (200 mg l−1) + 99.44
Ethylbenzene (200 mg l−1) + 99.06
Xylene (200 mg l−1) + 99.43
Catechol (500 mg l−1) + 99.95
Resorcinol (50 mg l−1) − 0.12
n-Hexadecane (100 mg l−1) + 99.34
a After incubation of 48 h
Environ Sci Pollut Res

negligible. Similar assumption was also made by Kumar et al.(2005). Therefore, Eq. (8) can be reduced to:
dS
dt¼ −
1
YX =S
dX
dtð9Þ
now, YX/S is the ratio of cell mass growth and substrateconcentration used for cell growth. YX/S can be expressed as:
YX =S¼ −
dX
dSð10Þ
YX/S was calculated from experimental data using theEq. (11).
YX =S¼ X−X 0
Si−Sð11Þ
In most of the works reported, there is confusion betweenμmax which is one of the fitting parameters and derived fromkinetic models for growth, mistakenly considered as maxi-mum specific growth rate, and the true specific growth rate(μ*max) (Christen et al. 2012; Shareefdeen et al. 1993). Whendμ/dS=0, μmax occurs at:
Sm ¼ffiffiffiffiffiffiffiffiffiffiffiKSK i
pð12Þ
Replacing Sm in Eq. (4), we obtain:
μ*max ¼ μmax
1þ 2ffiffiffiffiffiffiffiffiffiffiffiKSK i
p ð13Þ
(Christen et al. 2012)To calculate the specific degradation rate (q), the phenol
consumption data were fitted into the integrated Gompertzequation (Acuna et al. 1999; Christen et al. 2012).
S0 ¼ α exp −β exp −ktmð Þ½ � ð14Þ
The maximum volumetric degradation rate is calculated asfollows:
Vmax ¼ 0:368α k ð15Þ
For each Si, the corresponding time (tm) for Vmax is calcu-lated as:
tm ¼ lnβk
ð16Þ
For a given Si, the corresponding X′ for tm is directlydetermined from the growth curve where growth data was
fitted to Gompertz model (Fig. 1a). The specific degradationrate (q) is then calculated as:
q ¼ Vmax
X 0 ð17Þ
Haldane's model was used to calculate q, KS′, Ki′, Sm′, andqmax and true q*max was then calculated according to Eqs. (12)and (13). GraphPad Prism 5 software, based on Windows 7,was used to run all the regression analysis.
Inocula of 5 mlwere taken from cultures of late exponentialgrowth and transferred into 250 ml Erlenmeyer flask contain-ing 45 ml of sterilized inorganic media supplemented with500–2,400 mg l−1 phenol. All flasks were then incubated at30 °C in New Brunswick Innova® 42 incubator shaker at120 rpm. Samples were withdrawn at designated intervalsin aseptic condition to determine cell growth and residualphenol concentration. All the experiments were performedin triplicate.
Analytical procedures
Cell concentration was measured as cell dry weight methodand expressed in gram per liter. Four milliliters of theculture samples was taken in 15-ml centrifuge tube andcentrifuged at 15,000×g for 10 min at 4 °C. The cell pelletsharvested were washed with distilled water and dried at105 °C to a constant weight for 48 h in a hot air oven andwas used for growth study. The supernatant was filteredthrough 0.22-μmmembrane filter (Millipore, India) and thefiltrate was analyzed for determination of residual phenolconcentration by HPLC (WatersTM 600, USA) equipped withUV/visible detector and a C18 hypersil column (4.6mm×250-mm; particle size 5 μm) with a mobile phase of acetonitrile(70 %)/water (30 %) at a flow rate of 1 ml/min. An aliquot of20 μl of the filtrate was injected and analyzed using the UV/visible detector (WatersTM 2489) at wavelength of 270 nm(λmax for phenol≈270 nm).
Determination of intermediates of phenol degradationpathway
Enzymatic assay and HPLC analysis were carried out to deter-mine the possible phenol metabolic pathway of C. tropicalisPHB5. To detect intermediates of the pathway by enzymaticassay, the cultures were taken periodically and centrifuged at15,000×g and 4 °C. The cell pellet was washed with 50 mMphosphate buffer (KH2PO4/K2HPO4, pH 7.0) and resuspendedin the same buffer. Then, the cells were disrupted using asonicator (Sartorius LABSONIC® M, Germany) to preparethe crude extract. The crude extract was centrifuged at
Environ Sci Pollut Res

15,000×g and 4 °C to remove the cell debris. The reactionmixture of catechol was prepared in same phosphate bufferaccording to Banerjee and Ghoshal (2010b). The cell extractwas added to it and formation of the reaction products ofcatechol 2,3-dioxygenase and catechol 1,2-dioxygenase(HMSA and cis,cis-muconic acid) was detected spectrophoto-metrically (Rayleigh 2601, China) at 375 and 260 nm, respec-tively (Neumann et al. 2004). In the cell free supernatants, theintermediate products of degradation pathway were also ana-lyzed and quantified by comparing with standards using HPLCas described in our recent work (Basak et al. 2013a).
Results and discussion
Isolation and characterization of phenol-degrading strain
Ayeast strain PHB5 was successfully isolated from effluent ofa coking wastewater treatment plant. The 18S rRNA and ITSregion sequences of PHB5 strain were found to be 1,103 bpand were submitted to NCBI Genbank database under acces-sion number JN542555. A maximum likelihood phyloge-netic tree was generated (see supplementary data). Thestrain PHB5 was found to be phylogenetically closely related
Fig. 1 a Time course of growthand phenol consumption by C.tropicalis PHB5 at initial phenolconcentration 2,400 g l−1; brelationships between specificgrowth rates (μ) and initialsubstrate concentration (Si) andbetween specific degradationrates (q) and Si. Haldane modelwas fitted to the experimentalvalues of μ and q
Environ Sci Pollut Res

to C. tropicalis strain KB-41 (GenBank accession number:FJ947158) and C. tropicalis strain XJ-5 (GenBank accessionnumber: JQ686913), showing >99 % sequence identity.Therefore, the isolated yeast was designated as C. tropicalisPHB5.
Scanning electron micrographs revealed strain PHB5 wasaround 4.5 μm in length and was present singly or in cluster(see supplementary data). The cells were ovate or elliptical inshape and the colonies appeared creamy white and non-glistening with rough edge. The complete details of biochem-ical and physiological characteristics are given in Table 1. C.tropicalis and other species of Candida are well known for itsability to degrade phenol and chlorophenols at high concen-tration (Yan et al. 2005; Basak et al. 2013a; Jiang et al. 2007b;Jiang et al. 2007c; Tsai et al. 2005). Although the ability of C.tropicalis to tolerate and mineralize different other aromaticcompounds like benzene, toluene, ethylbenzene, xylene; poly-cyclic aromatic hydrocarbons; and substituted aromatics(chlorophenols, nitrophenols, etc.) have been reported sepa-rately (Jiang et al. 2010; Ahmed and Song 2011; Das andChandran 2011; Krastanov et al. 2013), to best of our knowl-edge, strain PHB5 is the first isolate to be reported as capableof metabolizing phenol as well as 18 different aromatic com-pounds (including phenol) (Table 1). This metabolic versatil-ity makes C. tropicalis PHB5 an excellent candidate for thebiotreatment of industrial wastewater contaminated with dif-ferent types of pollutants.
Kinetic studies of growth and phenol biodegradation
Growth and biodegradation studies were carried out under pa-rameters that were optimized in our previous work (Basak et al.2013b). Time courses of growth and phenol consumption wereplotted in Fig. 1a. Gompertz sigmoidal function was used to fitthe growth and phenol consumption data of the strain(Zwietering et al. 1990). Under optimized condition, C.tropicalis PHB5 was able to grow on 2,400 mg l−1 phenol and
could metabolize 99.4 % of this substrate within 48 h. Figure 1ashows that there was lag phase of about 18 h, indicating sub-strate inhibition on the cells. However, phenol was depletedquickly as cell growth increased at the log phase. This result isin conjunction with the previous reports of Yan et al. wheredegradation of 2,000 mg l−1 phenol within 66 h with a lag phaseof about 24 h (Yan et al. 2005) and 2,600 mg l−1 phenol within70 h with lag phase of 16 h (Jiang et al. 2007b) has beenreported.
To study the effect of Si on μ, μ for each Si of phenol wascalculated using Eq. (3)whileXwas obtained at different intervalof incubation period. The Haldane's model fitted well with theexperimental values of μ obtained for each Si (Fig. 1b), since acorrelation coefficient (R2) of 0.9886 was found. The values ofμmax,KS, and Ki were found to be 0.3407 h
−1, 15.81 mg l−1, and169 mg l−1, respectively. Sm of 51.69 mg l−1 and μ*max of0.2113 h−1 were calculated with Eqs. (12) and (13), respectively.The values of Sm and μ*max found match with those observed inFig 1b. Since Sm is the concentration of phenol where μ*maxoccurs, it can be considered as the value below which growth islimited by substrate concentration and above which growth isincreasingly inhibited by higher substrate concentration. Severalsubstrate inhibition kinetic models were used to fit the experi-mental data and compared in this work (Eqs. (5), (6), (7))(Table 2). The (R2) values obtainedwith differentmodels suggestthat all model fitted the experimental data well (Table 2).However, we selected Haldane model to compare the kineticdata of the studied strainwith that of different organisms found inliterature. When we calculated the value of μmax for strain PHB5and compared with values reported in literature, we observedthat the value of μmax was fairly high among those obtained forstrains capable of degrading phenol above concentration of2,000 mg l−1 (Table 3). When we compared Sm and μmax valuefound with the studied strain with that of reported in literature, itwas found that these values were in quite lower and uppermiddle range, respectively. However, this shortcoming iscircumvented by the strain's ability to tolerate and degrade
Table 2 Kinetic parameters for phenol biodegradation by C. tropicalis PHB5 obtained by different models
Mathematical model Parameters obtained for specific growth rate (μ) Parameters obtained for specific degradation rate (q)
μmax KS Ki μ*max R2 qmax KS′ Ki′ q*max R2
Haldane model: μ ¼ μmaxS
KSþSþ S2=K i
� � 0.3407 15.81 169.0 0.2113 0.9886 0.2766 2.819 2,093 0.257 0.8176
Aiba model: μ ¼ μmaxSKSþS exp
−S�K i
� �0.2254 0.0015 3.343 0.2162 0.9846 0.27 0.0003 2.357 0.2636 0.8403
Edward model: μ ¼ μmaxS
SþKSþ S2=Ki
� �1þS=KS
� � 0.1953 0.5935 5248 0.1948 0.9883 0.2454 0.6489 7.28×10⁶ 0.2452 0.8483
Yano model: μ ¼ μmaxS
SþKSþ S2=Ki
� �1þS=Kð Þ
0.2364 4.890 644.7 0.2013 0.9949 0.2671 2.165 3,369 0.2542 0.8399
Environ Sci Pollut Res

phenol at high concentration as well as its ability to degradedifferent types of toxicants.
In most of the articles in literature, there is a discrepancybetween the graphical determinations of μmax and the calcu-lated value of μmax (Christen et al. 2012; Khleifat 2006; Yanet al. 2005). Therefore, we followed the difference betweenμmax and μ*max reported by Shareefdeen et al. (1993) to findout the true maximum specific growth rate (μ*max) (Eq. (13)).μ*max values of strain PHB5 and other organisms are presentedin Table 3. We found that the values reported for μmax wereoverestimated with respect to μ*max. In some cases, it hasbeen found to be overestimated by tenfold (Table 3) (Genget al. 2006). We have also found an overestimation of Smwhen we calculated Sm (Table 3) according to Eq. (12)using KS and Ki given by Khleifat (Khleifat 2006) anddetermined it graphically from the plot presented in thatarticle (Khleifat 2006).
The KS value obtained in this study was comparativelylarger than that of previously reported for C. tropicalis (Yanet al. 2005; Jiang et al. 2007b), indicating that strain PHB5was half saturated by phenol at relatively higher concentra-tions. Although the Ki value for this strain is relatively medi-ocre, this combination of KS and Ki suggests that C. tropicalisPHB5 is able to grow on phenol-containing wastewaterswithin a wide range of concentrations in comparison to othermicroorganisms grown on phenol.
In order to calculate the specific degradation rate (q) foreach Si, the phenol consumption data for each Si was fitted intoGompertz model (R2>0.98). Equations (15) and (16) wereapplied to determine parameters (Vmax, tm) used for calculat-ing q (Eq. (17)) by using different coefficients obtained (α, β,
k; Eq. (14)) when Gompertz model was used for modeling thephenol consumption data for each Si (Table 4). Then, for eachSi, X′ (Table 4) was obtained from the corresponding tm inFig 1a. Adav et al. (2007) reported that Vmax was independentof Si probably because they used aerobic granules for phenoldegradation where microbial population remained constantthroughout the process. However, in our study, we foundVmax to be a function of Si, since biomass also increased withincreasing substrate concentration up to the maximum leveltolerated and phenol degradation is accompanied by growth of
Table 3 Different parameters (μmax, KS, Ki) for Haldane equation and calculated parameters (Sm, μ*max) of various microorganisms grown on phenol
Microorganisms Sia (mg l-1) μmax (h
−1) KS (mg l−1) Ki (mg l−1) Smb (mg l−1) μ*max
c (h−1) References
Alcaligenes faecalis 1,600 0.15 2.22 245.37 23.33 0.126 Jiang et al. (2007a)
Bacillus cereusMTCC 9817 <2,000 0.4396 129.4 637.8 287.28 0.2312 Banerjee and Ghoshal(2010b)
Ewingella americana 1,000 0.29 5.16 1,033.7 73.0 0.254 Khleifat (2006)
Pseudomonas putida DSM 548 100 0.436 6.19 54.1 18.3 0.26 Monteiro et al. (2000)
Sulfolobus solfataricus 98/2 745 0.094 77.7 319.4 157.5 0.047 Christen et al. (2012)
Candida tropicalis 2,000 0.48 11.7 207.9 49.31 0.325 Yan et al. (2005)
Paecilomyces variotii JH6 1,800 0.312 130.4 200 161.493 0.119315 Wang et al. (2010)
Bacillus brevis 1,750 0.026–0.078 2.2–29.3 868–2,434 43.69–267.05 0.023–0.063 Arutchelvan et al. (2006)
Acinetobacter sp. 1,000 0.28 1,167 58.5 261.28 0.028 Liu et al. (2009)
Candida albicans TL3 2,400 0.66 160 3,760 775.62 0.467 Tsai et al. (2005)
Candida tropicalis mutatedstrain CTM 2
2,600 0.54 6.7 234 39.59 0.403 (Jiang et al. 2007a, b, c)
Candida tropicalis PHB5 2,400 0.3407 15.81 169 51.69 0.2113 This study
aMaximum valueb Calculated according to Eq. (12)c Calculated according to Eq. (13)
Table 4 Kinetic parameters (Vmax, tm, and X) used for determination ofspecific degradation rate (q), obtained with the Gompertz model forphenol consumption by C. tropicalis PHB5 grown at different initialphenol concentration (Si)
Si (mg l−1) Vmaxa (mg l−1 h−1) tm
b (h) X′c (mg l−1) R2
155 29.82 2.44 322 0.9987
366 51.91 4.11 333.1 0.9909
453 42.17 3.84 330 0.9962
803 59.47 8.83 362 0.9994
1,197 68.84 3.9 331 0.9896
1,472 78.41 10.91 380 0.9853
1,610 76.74 12.34 391 0.9866
2,200 95.52 16.68 430 0.9816
2,349 110.36 12.04 390 0.9952
2,380 101.03 15.97 428 0.9937
a Calculated according to Eq. (15)b Calculated according to Eq. (16)c Read from Fig. 1a
Environ Sci Pollut Res

the organism. This observation is also in accordance withother reports (Christen et al. 2012).
The values of q, obtained for each Si, were fitted intoHaldane model (R2=0.8176) and the pattern of q vs. Si showedsubstrate inhibition characteristic (Fig. 1b). As for μ, qwas alsorestrained by high concentrations of phenol and thus the rela-tionship between q and Si was also satisfactorily described bydifferent substrate inhibition models (Table 2), as reported inother works (Yan et al. 2005; Bai et al. 2007; Jia et al. 2006). Aqmax value of 0.2766 g g
−1 h−1 was found using Haldane modeland true specific degradation rate (q*max) of 0.257 g g−1 h−1
was calculated according to Eq. (13). Fitting parameters(KS, Ki, KS′, and Ki′) for different models determined arepresented in Table 2. Sm′ for q was also calculated usingEq. (12) and its value was found to be 76.81 mg l−1. Sm andSm′ values as well as Fig 1b show that μmax and qmax occurredat low initial phenol concentrations (Si) and upon further in-crease of Si, μmax and qmax values significantly decreased. Asfor μmax in case of Haldane model, although qmax is also quitelow, inhibition coefficient (Ki′) value for phenol degradationrate (Table 2) is relatively higher which implies that degrada-tion rate can be less inhibited at higher concentrations. Thus,despite the display of a mediocre μmax and qmax values, Ki′foretells the ability of C. tropicalis PHB5 in terms of phenoldegradation in long range of concentrations.
The yield coefficient (YX/S) was estimated by plotting thebiomass yield against phenol consumed (S′), as previouslyestimated by Eq. (11). An YX/S varying between 0.185 and0.96 g g−1 was found for different phenol concentration up to2,000 mg l−1 (Fig. 2). It is evident from Fig. 2 that YX/S valuewas maximal at low Si and minimal at highest Si used in therange, with a considerable decrease noticed beyond Si of700 mg l−1. This type of phenomenon of decreasing YX/S withincreasing phenol concentration (Si) in the inhibitory rangewas also reported (Christen et al. 2012; Li et al. 2010) and can
be attributed to the fact that beyond inhibitory substrate con-centration energy required by the organisms to overcome theinhibitory effects of phenol is maximum. The amount ofsubstrate consumed and converted to energy for cell mainte-nance increases as μ decreases, while the amount of substrateassimilated into biomass decreases as μ decreases with in-creasing Si (Wang et al. 2010). The maximum value of YX/S(0.96) was found at very low phenol concentration (20 mg l−1)(Fig. 2) and this relatively high value of YX/Smay be attributedto the higher metabolic efficiency of C. tropicalis PHB5 (Liet al. 2010; Adav et al. 2007). This finding is consistent withAdav et al. (2007) and Wang and Loh (1999) who have alsoreported high YX/S values of 0.823 and 0.94 g g
−1, respectively.
Intermediates of phenol degradation pathway
To determine the possible phenol degradation pathway involvedin C. tropicalis PHB5, enzymatic assays were carried out fordetection of products of catechol 2,3-dioxygenase and catechol1,2-dioxygenase. The absence of catechol 2,3-dioxygenase ac-tivity was confirmed, since absorbance at 375 nm due to theformation of 2-HMSAwas absent. This finding suggested thatC. tropicalis PHB5 did not metabolize phenol through meta-cleavage pathway (Banerjee and Ghoshal 2010b) However, thepresence of absorbance at 260 nm indicated the possible forma-tion of cis,cis-muconic acid due to the activity of catechol 1,2-dioxygenase and ensuing ortho-cleavage pathway. During phe-nol degradation by C. tropicalis PHB5, HPLC analysis ofculture supernatant taken from batch system containing variousconcentration of phenol revealed the presence of catechol andcis,cis-muconic acid as intermediates. These two major metab-olites produced from phenol were identified on the basis of theirHPLC retention time (see supplementary data) when comparedwith that of the standards as described in our previous work(Basak et al. 2013a). HPLC elution profile of these two inter-mediates of phenol degradative pathway was recorded for sam-ple taken after 30 h incubation of the medium. In addition, theformation of another product was also observed in HPLC chro-matogram (see supplementary data). Although this product(peak 01 in HPLC chromatogram) was not identified, it couldbe assumed to be any other intermediates of the ortho-cleavagepathway such as muconolactone or 3-oxoadipic acid. Figure 3represents the kinetics of products accumulation and decompo-sition during growth of C. tropicalis PHB5 on phenol. It can beseen in Fig. 3 that catechol was formed at the earlier stage ofreaction, followed by formation of cis,cis-muconic acid peakedat relatively later stage of the biodegradation as phenol concen-tration decreased. Similar trends were also found in our previousstudy (Basak et al. 2013a) with 4-chlorophenol and by Chunget al. (2003) working with phenol-Pseudomonas putida system.
The results of enzymatic assay and HPLC revealed that C.tropicalis PHB5 could metabolize phenol via ortho-cleavagepathway. Cis,cis-muconic acid is the gateway intermediate for
Fig. 2 Relationship between growth yield (YX/S) and initial phenol con-centrations (Si)
Environ Sci Pollut Res

this pathway which is converted to muconolactone and sub-sequently leads to the formation of succinyl-CoA and acetyl-CoA. This postulated ortho-cleavage pathway for phenoldegradation by C. tropicalis PHB5 could be similar to onereported on other C. tropicalis strains by Bastos et al. (2000).Further investigation on characterization of other intermediatemetabolites may provide real insight.
Conclusion
The present study mainly focused on the kinetics of growthand biodegradation and determination of phenol metabolicpathway employed by the isolated C. tropicalis PHB5.Strain PHB5 was capable of growing on various monocyclicand polycyclic aromatic hydrocarbons. In particular, it wasable to tolerate and consume phenol as sole source ofcarbon and energy up to concentration of 2,400 mg l−1 and itsgrowth kinetics using phenol as a sole carbon source waswell characterized by Haldane model (μmax=0.3407 h−1,KS=15.81 mg l−1, Ki=169.0 mg l−1, R2=0.9886). Most re-ports in the literatures wrongly interpreted the fitting parame-ter of Haldane model μmax as true specific growth rate(μ*max). This confusion overestimates the μmax, while μ*max
must be calculated as described in “Kinetics of cell growth andphenol biodegradation” section of this paper. This is of prac-tical significance if subsequent application of a strain inbioremediation of a toxicant is intended. The relation-ship between specific degradation rate (q) and initial phenolconcentration (Si) was also described by Haldane model(qmax=0.2766 g g−1 h−1, KS′=2.819 mg l−1, Ki′=2,093 mg l−1,R2=0.8176) and found to be subject to substrate inhibition.
Depending on degradation pathway of a toxicant and con-sequent production of intermediates, the circumstances andcomposition of wastewater being treated can also vary.Therefore, the present study revealed the production of a keyintermediate of ortho-cleavage pathway, indicating involve-ment of this pathway in phenol biodegradation.
Finally, the relatively high values of various kineticparameters indicate the capability of C. tropicalis PHB5to degrade phenol at relatively high concentration andpossibility of potential application of the whole cell forbioremediation of phenol-contaminated wastewater. Theability of this strain to utilize various other aromaticcompounds confirms its potential as versatile and effi-cient microorganism for application when aromatic mix-tures have to be treated.
References
AcunaME, Perez F, Auria R, Revah S (1999)Microbiological and kineticaspects of a biofilter for the removal of toluene from waste gases.Biotechnol Bioeng 63(2):175–184. doi:10.1002/(SICI)1097-0290(19990420)63:2<175::AID-BIT6>3.0.CO;2-G
Adav SS, Chen MY, Lee DJ, Ren NQ (2007) Degradation of phenol byaerobic granules and isolated yeast Candida tropicalis. BiotechnolBioeng 96(5):844–852. doi:10.1002/bit.21148
Ahmed Z, Song J (2011) Removal of gaseous toluene using immobilizedCandida tropicalis in a fluidized bed bioreactor. 3 Biotech 1(2):111–116
Arutchelvan V, Kanakasabai V, Elangovan R, Nagarajan S,Muralikrishnan V (2006) Kinetics of high strength phenol degrada-tion using Bacillus brevis. J Hazard Mater 129(1–3):216–222.doi:10.1016/j.jhazmat.2005.08.040
Fig. 3 Time course ofintermediate metabolitesaccumulation and decompositionduring phenol degradation by C.tropicalis PHB5
Environ Sci Pollut Res

Bai J, Wen J-P, Li H-M, Jiang Y (2007) Kinetic modeling of growth andbiodegradation of phenol and m-cresol using Alcaligenes faecalis.Process Biochem 42:510–517
Banerjee A, Ghoshal AK (2010a) Isolation and characterization of hyperphenol tolerant Bacillus sp. from oil refinery and exploration sites. JHazard Mater 176(1–3):85–91
Banerjee A, Ghoshal AK (2010b) Phenol degradation by Bacillus cereus:pathway and kinetic modeling. Bioresour Technol 101(14):5501–5507
Basak B, Bhunia B, Dutta S, Dey A (2013a) Enhanced biodegradation of4-chlorophenol by Candida tropicalis PHB5 via optimization ofphysicochemical parameters using Taguchi orthogonal array ap-proach. Int Biodeterior Biodegrad 78:17–23
Basak B, Bhunia B, Mukherjee S, Dey A (2013b) Optimization ofphysicochemical parameters for phenol biodegradation byCandida tropicalis PHB5 using Taguchi methodology. DesalinWater Treat. doi:10.1080/19443994.2013.770638
Bastos AER, Tornisielo VL, Nozawa SR, Trevors JT, Rossi A (2000)Phenol metabolism by two microorganisms isolated fromAmazonian forest soil samples. J Ind Microbiol Biotechnol24:403–409
Busca G, Berardinelli S, Resini C, Arrighi L (2008) Technologies for theremoval of phenol from fluid streams: a short review of recentdevelopments. J Hazard Mater 160(2–3):265–288
Christen P, Vega A, Casalot L, Simon G, Auria R (2012) Kinetics ofaerobic phenol biodegradation by the acidophilic and hyperthermo-philic archaeon Sulfolobus solfataricus 98/2. Biochem Eng J 62:56–61
Chung T-P, Tseng H-Y, Juang R-S (2003) Mass transfer effect andintermediate detection for phenol degradation in immobilizedPseudomonas putida systems. Process Biochem 38:1497–1507
Das N, Chandran P (2011) Microbial degradation of petroleum hydrocar-bon contaminants: an overview. Biotechnol Res Int 2011:941810.doi:10.4061/2011/941810
Essam T, Amin MA, El Tayeb O, Mattiasson B, Guieysse B (2010)Kinetics and metabolic versatility of highly tolerant phenol degradingAlcaligenes strain TW1. J Hazard Mater 173(1–3):783–788
Geng A, Soh AE, Lim CJ, Loke LC (2006) Isolation and characterizationof a phenol-degrading bacterium from an industrial activated sludge.Appl Microbiol Biotechnol 71(5):728–735. doi:10.1007/s00253-005-0199-z
Gianfreda L, Iamarino G, Scelza R, Rao MA (2006) Oxidative catalystsfor the transformation of phenolic pollutants: a brief review. BiocatalBiotransform 24:177–187
Jia X, Wen J, Jiang Y, Bai J, Cheng X, Zheng Y (2006) Modeling forbatch phenol biodegradation with immobilized Alcaligenes faecalis.AIChE J 52:1294–1303
Jiang Y, Wen J, Bai J, Jia X, Hu Z (2007a) Biodegradation of phenol athigh initial concentration by Alcaligenes faecalis. J Hazard Mater147(1–2):672–676. doi:10.1016/j.jhazmat.2007.05.031
Jiang Y, Wen J, Jia X, Caiyin Q, Hu Z (2007b) Mutation of Candidatropicalis by irradiation with a He-Ne laser to increase its ability todegrade phenol. Appl Environ Microbiol 73(1):226–231. doi:10.1128/AEM.00677-06
Jiang Y, Wen J, Lan L, Hu Z (2007c) Biodegradation of phenol and 4-chlorophenol by the yeast Candida tropicalis. Biodegradation18(6):719–729. doi:10.1007/s10532-007-9100-3
Jiang Y, Cai X, Wu D, Ren N (2010) Biodegradation of phenol and m-cresol by mutated Candida tropicalis. J Environ Sci (China)22(4):621–626
Khleifat KM (2006) Biodegradation of phenol by Ewingella americana:effect of carbon starvation and some growth conditions. ProcessBiochem 41:2010–2016
Krastanov A, Alexieva Z, Yemendzhiev H (2013) Microbial degradationof phenol and phenolic derivatives. Eng Life Sci 13:76–87
Kumar A, Kumar S, Kumar S (2005) Biodegradation kinetics of phenoland catechol usingPseudomonas putidaMTCC1194. BiochemEngJ 22:151–159
Kumar A, Bhunia B, Dasgupta D, Mandal T, Dey A, Datta S,Bhattacharya P (2013) Optimization of culture condition for growthand phenol degradation by Alcaligenes faecalis JF339228 usingTaguchi methodology. Desalin Water Treat 51:3153–3163
Li Y, Li J, Wang C, Wang P (2010) Growth kinetics and phenol biodeg-radation of psychrotrophic Pseudomonas putida LY1. BioresourTechnol 101(17):6740–6744
Liu YJ, Zhang AN, Wang XC (2009) Biodegradation of phenol by usingfree and immobilized cells of Acinetobacter sp. XA05 andSphingomonas sp. FG03. Biochem Eng J 44:187–192
Liu H, Yu QJ, Wang G, Ye F, Cong Y (2011) Biodegradation of phenol athigh concentration by a novel yeast Trichosporon montevideensePHE1. Process Biochem 46:1678–1681
Monteiro AA, Boaventura RA, Rodrigues AE (2000) Phenol biodegra-dation by Pseudomonas putida DSM 548 in a batch reactor.Biochem Eng J 6(1):45–49
Neumann G, Teras R, Monson L, Kivisaar M, Schauer F, Heipieper HJ(2004) Simultaneous degradation of atrazine and phenol byPseudomonas sp. strain ADP: effects of toxicity and adaptation.Appl Environ Microbiol 70(4):1907–1912
Shareefdeen Z, Baltzis BC, Oh YS, Bartha R (1993) Biofiltration ofmethanol vapor. Biotechnol Bioeng 41(5):512–524. doi:10.1002/bit.260410503
Tsai SC, Tsai LD, Li YK (2005) An isolated Candida albicans TL3capable of degrading phenol at large concentration. BiosciBiotechnol Biochem 69(12):2358–2367
Wang S-J, Loh K-C (1999) Modeling the role of metabolic intermediatesin kinetics of phenol biodegradation. Enzyme Microb Technol25:177–184
Wang L, Li Y, Yu P, Xie Z, Luo Y, Lin Y (2010) Biodegradation of phenolat high concentration by a novel fungal strain Paecilomyces variotiiJH6. J Hazard Mater 183(1–3):366–371
Yan J, Jianping W, Hongmei L, Suliang Y, Zongding H (2005) Thebiodegradation of phenol at high initial concentration by the yeastCandida tropicalis. Biochem Eng J 24:243–247
Yu J, Zhang X, Tan T (2007) An novel immobilization method ofSaccharomyces cerevisiae to sorghumbagasse for ethanol production.J Biotechnol 129(3):415–420. doi:10.1016/j.jbiotec.2007.01.039
Zilouei H, Soares A, Murto M, Guieysse B, Mattiasson B (2006)Influence of temperature on process efficiency and microbial com-munity response during the biological removal of chlorophenols in apacked-bed bioreactor. Appl Microbiol Biotechnol 72(3):591–599.doi:10.1007/s00253-005-0296-z
Zwietering MH, Jongenburger I, Rombouts FM, van 't Riet K (1990)Modeling of the bacterial growth curve. Appl Environ Microbiol56(6):1875–1881
Environ Sci Pollut Res
Copyright © 2022 FDOKUMEN