Deep Neural Networks and Tabular Data: A Survey - arXiv
20
SUBMITTED TO THE IEEE, FEBRUARY 2022 1 Deep Neural Networks and Tabular Data: A Survey Vadim Borisov, Tobias Leemann, Kathrin Seßler, Johannes Haug, Martin Pawelczyk and Gjergji Kasneci Abstract—Heterogeneous tabular data are the most commonly used form of data and are essential for numerous critical and computationally demanding applications. On homogeneous data sets, deep neural networks have repeatedly shown excellent per- formance and have therefore been widely adopted. However, their application to modeling tabular data (inference or generation) remains highly challenging. This work provides an overview of state of the art deep learning methods for tabular data. We start by categorizing them into three groups: data transformations, specialized architectures, and regularization models. We then provide a comprehensive overview of the main approaches in each group. A discussion of deep learning approaches for generating tabular data is complemented by strategies for explaining deep models on tabular data. Our primary contribution is to address the main research streams and existing methodologies in this area, while highlighting relevant challenges and open research questions. We also provide an empirical comparison of traditional machine learning methods with deep learning approaches on real tabular data sets of different sizes and with different learning objectives. Our results indicate that algorithms based on gradient- boosted tree ensembles still outperform the deep learning models. To the best of our knowledge, this is the first in-depth look at deep learning approaches for tabular data. This work can serve as a valuable starting point and guide for researchers and practitioners interested in deep learning with tabular data. Index Terms—Deep neural networks, Tabular data, Heteroge- neous data, Discrete data, Tabular data generation, Probabilistic modeling, Survey I. I NTRODUCTION The success of deep neural networks — particularly those based on convolutions, recurrent deep learning mechanisms [1], or transformer networks [2] - has been accelerated through affordable computational and storage resources and the availability of large, labeled data sets [3], [4]. Although deep learning methods perform outstandingly well for classification or data generation tasks on homogeneous data (e.g., image, audio, and text data), tabular data still pose a challenge to these models [5]–[7]. Kadra et al. called the tabular data sets the last “unconquered castle” for deep neural network models [8]. Tabular data – in contrast to image or language data – are heterogeneous, leading to dense numerical and sparse categorical features. Furthermore, the correlation among the features is weaker than the spatial or semantic relationship All authors are with the Data Science and Analytics Research group at the University of T ¨ ubingen, 72070 T ¨ ubingen, Germany. Gjergji Kasneci is also affiliated with Schufa Holding AG, 65201 Wiesbaden, Germany. Corresponding authors: [email protected] [email protected] © 2022 IEEE. Personal use of this material is permitted. Permission from IEEE must be obtained for all other uses, in any current or future media, including reprinting/republishing this material for advertising or promotional purposes, creating new collective works, for resale or redistribution to servers or lists, or reuse of any copyrighted component of this work in other works. in images or speech data. Variables can be correlated or independent, and the features have no positional information. Hence, it is necessary to discover and exploit correlation without relying on spatial information [9]. Heterogeneous data are the most commonly used form of data [7], and it is ubiquitous in many crucial applications, such as medical diagnosis based on patient history [10]–[12], predictive analytics for financial applications (e.g., risk analysis, estimation of creditworthiness, the recommendation of invest- ment strategies, and portfolio management) [13], click-through rate (CTR) prediction [14], user recommendation systems [15], customer churn prediction [16], [17], cybersecurity [18], fraud detection [19], identity protection [20], psychology [21], delay estimations [22], anomaly detection [23], and so forth. In all these applications, a boost in predictive performance and robustness may have considerable benefits for both end users and companies that provide such solutions. Simultaneously, this requires handling many data-related pitfalls, such as noise, impreciseness, different attribute types and value ranges, or the non-availability of values. Meanwhile, deep neural networks offer multiple advantages over traditional machine learning methods. They are highly flexible [24] and allow for efficient and iterative training. Deep neural networks are particularly valuable for AutoML [25]– [30]. Tabular data generation is possible using deep neural networks and can, for instance, help mitigate class imbalance problems [31]. Finally, neural networks can be deployed for multimodal learning problems where tabular data can be one of many input modalities [27], [32]–[35], for tabular data distillation [36], [37], for federated learning [38], and in many more scenarios. As the data collection step, especially for heterogeneous data, is costly and time-consuming, there are many approaches for synthetic tabular data generation. However, modeling the probability distribution of rows in tabular data and generating realistic synthetic data are challenging since heterogeneous tabular data typically includes a mix of discrete and continuous variables. Continuous variables may have multiple modes, whereas discrete columns are often imbalanced. All these pitfalls in combination with missing, noisy, or unbounded values make the issue of tabular data generation quite complex, even for modern deep generative architectures. We discuss the state-of-the-art approaches for tabular data generation in Section V. Another important aspect is the interpretation of deep neural networks on tabular data [39]. Many popular approaches for the interpretation of deep neural networks stem from the computer vision domain, where a pixel group is highlighted, creating a so-called saliency map. Nevertheless, for tabular data sets, highlighting a variable relationship is also essential. arXiv:2110.01889v2 [cs.LG] 21 Feb 2022
-
Upload
khangminh22 -
Category
Documents
-
view
3 -
download
0
Transcript of Deep Neural Networks and Tabular Data: A Survey - arXiv

SUBMITTED TO THE IEEE, FEBRUARY 2022 1
Deep Neural Networks and Tabular Data: A SurveyVadim Borisov, Tobias Leemann, Kathrin Seßler, Johannes Haug,
Martin Pawelczyk and Gjergji Kasneci
Abstract—Heterogeneous tabular data are the most commonlyused form of data and are essential for numerous critical andcomputationally demanding applications. On homogeneous datasets, deep neural networks have repeatedly shown excellent per-formance and have therefore been widely adopted. However, theirapplication to modeling tabular data (inference or generation)remains highly challenging. This work provides an overview ofstate of the art deep learning methods for tabular data. We startby categorizing them into three groups: data transformations,specialized architectures, and regularization models. We thenprovide a comprehensive overview of the main approaches in eachgroup. A discussion of deep learning approaches for generatingtabular data is complemented by strategies for explaining deepmodels on tabular data. Our primary contribution is to addressthe main research streams and existing methodologies in thisarea, while highlighting relevant challenges and open researchquestions. We also provide an empirical comparison of traditionalmachine learning methods with deep learning approaches on realtabular data sets of different sizes and with different learningobjectives. Our results indicate that algorithms based on gradient-boosted tree ensembles still outperform the deep learning models.To the best of our knowledge, this is the first in-depth lookat deep learning approaches for tabular data. This work canserve as a valuable starting point and guide for researchers andpractitioners interested in deep learning with tabular data.
Index Terms—Deep neural networks, Tabular data, Heteroge-neous data, Discrete data, Tabular data generation, Probabilisticmodeling, Survey
I. INTRODUCTION
The success of deep neural networks — particularly thosebased on convolutions, recurrent deep learning mechanisms[1], or transformer networks [2] - has been acceleratedthrough affordable computational and storage resources and theavailability of large, labeled data sets [3], [4]. Although deeplearning methods perform outstandingly well for classificationor data generation tasks on homogeneous data (e.g., image,audio, and text data), tabular data still pose a challenge to thesemodels [5]–[7]. Kadra et al. called the tabular data sets thelast “unconquered castle” for deep neural network models [8].
Tabular data – in contrast to image or language data –are heterogeneous, leading to dense numerical and sparsecategorical features. Furthermore, the correlation among thefeatures is weaker than the spatial or semantic relationship
All authors are with the Data Science and Analytics Research group at theUniversity of Tubingen, 72070 Tubingen, Germany. Gjergji Kasneci is alsoaffiliated with Schufa Holding AG, 65201 Wiesbaden, Germany.Corresponding authors:[email protected]@uni-tuebingen.de© 2022 IEEE. Personal use of this material is permitted. Permission fromIEEE must be obtained for all other uses, in any current or future media,including reprinting/republishing this material for advertising or promotionalpurposes, creating new collective works, for resale or redistribution to serversor lists, or reuse of any copyrighted component of this work in other works.
in images or speech data. Variables can be correlated orindependent, and the features have no positional information.Hence, it is necessary to discover and exploit correlationwithout relying on spatial information [9].
Heterogeneous data are the most commonly used form ofdata [7], and it is ubiquitous in many crucial applications,such as medical diagnosis based on patient history [10]–[12],predictive analytics for financial applications (e.g., risk analysis,estimation of creditworthiness, the recommendation of invest-ment strategies, and portfolio management) [13], click-throughrate (CTR) prediction [14], user recommendation systems [15],customer churn prediction [16], [17], cybersecurity [18], frauddetection [19], identity protection [20], psychology [21], delayestimations [22], anomaly detection [23], and so forth. Inall these applications, a boost in predictive performance androbustness may have considerable benefits for both end usersand companies that provide such solutions. Simultaneously,this requires handling many data-related pitfalls, such as noise,impreciseness, different attribute types and value ranges, or thenon-availability of values.
Meanwhile, deep neural networks offer multiple advantagesover traditional machine learning methods. They are highlyflexible [24] and allow for efficient and iterative training. Deepneural networks are particularly valuable for AutoML [25]–[30]. Tabular data generation is possible using deep neuralnetworks and can, for instance, help mitigate class imbalanceproblems [31]. Finally, neural networks can be deployed formultimodal learning problems where tabular data can be oneof many input modalities [27], [32]–[35], for tabular datadistillation [36], [37], for federated learning [38], and in manymore scenarios.
As the data collection step, especially for heterogeneousdata, is costly and time-consuming, there are many approachesfor synthetic tabular data generation. However, modeling theprobability distribution of rows in tabular data and generatingrealistic synthetic data are challenging since heterogeneoustabular data typically includes a mix of discrete and continuousvariables. Continuous variables may have multiple modes,whereas discrete columns are often imbalanced. All thesepitfalls in combination with missing, noisy, or unboundedvalues make the issue of tabular data generation quite complex,even for modern deep generative architectures. We discussthe state-of-the-art approaches for tabular data generation inSection V.
Another important aspect is the interpretation of deep neuralnetworks on tabular data [39]. Many popular approaches forthe interpretation of deep neural networks stem from thecomputer vision domain, where a pixel group is highlighted,creating a so-called saliency map. Nevertheless, for tabulardata sets, highlighting a variable relationship is also essential.
arX
iv:2
110.
0188
9v2
[cs
.LG
] 2
1 Fe
b 20
22

SUBMITTED TO THE IEEE, FEBRUARY 2022 2
Many existing methods – especially those based on attentionmechanisms [2] – offer a highlighting of relationships by designand their attention maps can be easily visualized.
The aims of this survey are to provide1) a thorough review of existing scientific literature on deep
learning for tabular data2) a taxonomic categorization of the available approaches
for classification and regression tasks on heterogeneoustabular data
3) a presentation of the state of the art as well as an outlookon promising paths towards tabular data generation
4) an overview of existing explanation approaches for deepmodels for tabular data
5) an extensive empirical comparison of traditional machinelearning methods and deep learning models on multiplereal-world heterogeneous tabular data sets
6) a discussion on the main reasons for the limited successof deep learning on tabular data.
7) a list of open challenges related to deep learning fortabular data.
Thus, data science practitioners and researchers will be ableto quickly identify promising starting points and guidance forthe use cases or research questions at hand.
The remainder of the survey is organized as follows:Section II discusses the related work. To introduce the Readerto the field, in Section III we provide the used formalism, abrief outline of the domain’s history, list the main challengesthat are typically encountered, and propose a unified taxonomyof possible approaches to deep learning with tabular data.Section IV covers the main methods for modeling tabular datausing the deep neural networks in detail. Section V presents anoverview on tabular data generation using deep neural networks.An overview of explanation mechanisms for deep models fortabular data is presented in Section VI. In Section VIII, wesummarize the state of the field and give future perspectives. Welist open research questions before concluding in Section IX.
To help improve the survey, please do not hesitate to sendcorrections and suggestions to corresponding authors.
II. RELATED WORK
To the best of our knowledge, there is no study dedicatedexclusively to the application of deep neural networks totabular data, spanning the areas of supervised and unsupervisedlearning and data synthesis. Prior works cover some of theseaspects, but none of them systematically discusses the existingapproaches in the broadness of this survey. We also couldnot find any work that reviews state-of-the-art approaches forsynthesizing tabular data using deep neural networks.
However, there are some works that cover parts of the domain.There is a comprehensive analysis of common approaches forcategorical data encoding as a preprocessing step for deepneural networks by the authors of [40]. The survey’s authorscompared existing methods for categorical data encodingon various tabular data sets and different deep learningarchitectures. We also discuss the key categorical data encodingmethods in Section IV-A1.
the authors of [41] empirically evaluated a large number ofstate-of-the-art deep learning approaches for tabular data on a
wide range of data sets. Interestingly, the authors demonstratedthat a tuned deep neural network model with the ResNet-likearchitecture [42] shows comparable performance to some state-of-the-art deep learning approaches for tabular data.
Recently, the authors of [7] published a study on severaldifferent deep models for tabular data including TabNet [5],NODE [6], Net-DNF [43]. Additionally, they compared thedeep learning approaches to the gradient boosting decisiontree algorithm regarding the accuracy, training effort, inferenceefficiency, and also hyperparameter optimization time. Theyobserved that the deep models had the best results on the datasets used in their original paper, however, no deep model couldexceed the others in general. They were challenged by thegradient boosting decision trees, which was why the authorsconcluded that efficient tabular data modeling using deep neuralnetworks is still an open question. With our survey, we aimto provide the background necessary for future work on thisquestion.
A quantitative study by the authors of [44] analyzed therobustness of neural networks also considering different state-of-the-art regularization techniques. To fool a prediction model,tabular data can be corrupted, and adversarial examples canbe produced. Using this data, it is possible to mislead frauddetection models as well as humans as shown by the authorsof [19]. Before using deep learning models for tabular data ina critical environment, one should be aware of the possiblesusceptibility to attacks.
Finally, a recent survey by the authors of [45] summarizesexplanation techniques in the context of tabular data. Hence,we do not provide a detailed discussion of explainable machinelearning for tabular data in this paper. However, for the sake ofcompleteness, we highlight some of the most relevant worksin Section VI.
III. TABULAR DATA AND DEEP NEURAL NETWORKS
A. Definitions
In this section, we give definitions for central terms usedin this work. We also provide references for a more detailedexplanation of the methods.
One important concept in this survey is the one of (deep)neural networks. In most passages of this work we use thisconcept as a synonym for feed-forward networks, as describedby [4], and name the concrete model whenever we deviatefrom this concept.
A deep neural network defines a mapping f
y = f(x) ≈ f(x;W ), (1)
that learns the value of the parameters W (the “weights” of aneural network) that results in the best approximation of f . Thenetwork is called feed-forward if the input information flows inone direction to the output without any feedback connections.
This survey has a focus on heterogeneous data, whichdistinguishes itself from homogeneous data modalities, such asimages, audio, or text data, by containing a variety of attributetypes, such as continuous or discrete numerical attributes fromdifferent distributions (e.g., binary values, ordinal values, high-cardinality categorical values). According to Lane’s definition

SUBMITTED TO THE IEEE, FEBRUARY 2022 3
Fig. 1: Unified taxonomy of deep neural network models forheterogeneous tabular data.
[46], categorical variables are qualitative values. They ”do notimply a numerical ordering”, unlike quantitative values, whichare “measured in terms of numbers”. Also, there is a limitedunique set of values a categorical variable can take. Examplesof categorical variables in a tabular data set are gender, user id,product type, topic.
Tabular data (sometimes structured data in the literature) isa subcategory of the heterogeneous data format, that usually ispresented in a table [47] with data points as rows and featuresas columns. Hence, for the scope of this work, we also define atabular data set as a table which contains n numerical columns{N1, . . . , Nn} and c categorical columns {C1, . . . , Cc}. Allcolumns are random variables following a joint distributionP(N1:n, C1:c). Each data point can be understood as a row inthe table, or – taking a probabilistic view – as a sample fromthe unknown joint distribution. When working with tabulardata we have limited prior knowledge regarding the structureand relationships between its features. Tabular data are widelyused in practical machine learning and data science.
B. Brief History of Deep Learning on Tabular Data
Tabular data are the oldest form of data. Before digitalcollection of text, images, and sound was possible, almostall data were tabular. Therefore, it was the target of earlymachine learning research. However, deep neural networksbecame popular in the digital age and were further developed
with a focus on homogeneous data. In recent years, varioussupervised, self-supervised, and semi-supervised deep learningapproaches have been proposed that explicitly address the issueof tabular data modeling again. Early works mostly focusedon data transformation techniques for preprocessing [48]–[50],which are still important today [40].
A huge stimulus was the rise of e-commerce, whichdemanded novel solutions, especially in advertising [14],[51]. These tasks required fast and accurate estimation onheterogeneous data sets with many categorical variables, forwhich the traditional machine learning approaches are not wellsuited (e.g., categorical features that have high cardinality canlead to very sparse high-dimensional feature vectors and non-robust models). As a result, researchers and data scientistsstarted looking for more flexible solutions, e.g., based on deepneural networks, that are able to capture complex non-lineardependencies in the data.
In particular, the click-through rate prediction problem hasreceived a lot of attention [14], [52], [53]. A large variety ofapproaches were proposed, most of them relying on specializedneural network architectures for heterogeneous tabular data.The most important methods for click-through rate estimationare included in our survey.
A newer line of research evolved based on idea thatregularization may improve the performance of deep neuralnetworks on tabular data [8]. The idea was sparked by theauthors of [54], leading to an intensification of research onregularization approaches.
Due to the tremendous success of attention-based approachessuch as transformers on textual [55] and visual data [56], [57],researchers have started applying attention-based methods andself-supervised learning techniques to tabular data recently.After the first and the most influential work by the authorsof [5] raised the reasearch interest, transformers are quicklygaining popularity, especially for large tabular data sets.
C. Challenges of Learning With Tabular Data
As mentioned above, deep neural networks are usuallyinferior to more traditional (e.g. linear or tree-based) machinelearning methods when dealing with tabular data. However, itis often unclear why deep learning cannot achieve the samelevel of predictive quality as in other domains such as imageclassification and natural language processing. In the following,we identify and discuss four possible reasons: noitemsep
1) Inappropriate Training Data: The data quality is acommon issue for real-world tabular data sets. They ofteninclude missing values [58], extreme data (outliers) [23],erroneous or inconsistent data [59], and have small overallsize relative to the high-dimensional feature vectorsgenerated from the data [60]. Also, due to the expensivenature of data collection, tabular data are frequently class-imbalanced.
2) Missing or Complex Irregular Spatial Dependencies:There is often no spatial correlation between the variablesin tabular data sets [61], or the dependencies betweenfeatures are rather complex and irregular. Thus, the induc-tive biases used in popular models for homogeneous data,

SUBMITTED TO THE IEEE, FEBRUARY 2022 4
such as convolutional neural networks, are unsuitable formodeling this data type [43], [62], [63].
3) Extensive Preprocessing: One of the main challengeswhen working with tabular data is how to handlecategorical features [40]. In most cases, the first step isto convert the categories into a numerical representation,for example, using a simple one-hot or ordinal encodingscheme. However, as categorical features may be verysparse (a problem known as curse of dimensionality), thiscan lead to a very sparse feature matrix (using the one-hotencoding scheme) or a synthetic alignment of unorderedvalues (using the ordinal encoding scheme). the authorsof [40] have analyzed different embedding techniques forcategorical variables. Dealing with categorical features isalso one of the main aspects we discuss in Section IV.Applications that work with homogeneous data haveeffectively used data augmentation [64], transfer learning[65] and test-time augmentation [66]. For heterogeneoustabular data, these techniques are often difficult to apply.However, some frameworks for learning with tabulardata, such as VIME [67] and SAINT [9], use dataaugmentation strategies in the embedding space.Lastly, note that we often lose information with respect tothe original data when applying preprocessing methodsfor deep neural networks, leading to a reduction inpredictive performance [68].
4) Model Sensitivity: Deep neural networks can be ex-tremely fragile to tiny perturbations of the input data[69], [70]. The smallest possible change of a categorical(or binary) feature might already have a large impacton the prediction. This is usually less problematic forhomogeneous (continuous) data sets.In contrast to deep neural networks, decision-tree algo-rithms can handle perturbations exceptionally well byselecting a feature and threshold value and ”ignoring”the rest of the data sample. As a consequence of theirextreme sensitivity, artificial neural network models havehigh curvature decision boundaries [71], [72], whereasdecision tree-based algorithms can learn hyperplane-likeboundaries. In order to reduce the input-related sensitivityof deep neural networks, some approaches propose toapply strong regularization to learning parameters [8],[54]. We discuss these methods in Section IV-C in moredetail.Finally, deep neural networks usually have an excessivenumber of hyperparameters [4], where traditional ma-chine learning approaches on tabular data (e.g., decision-tree-based models, support-vector machines [73]) typ-ically have significantly fewer hyperparameters. As aconsequence, the tuning time for deep learning models isvastly higher than that of decision tree-based approaches.In addition, neural networks tend to be sensitive to thechoice of hyperparameters (e.g. learning rate, number ofhidden layers or activation function). In general, fewerhyperparameters are preferable to reduce the risk of non-robust predictions.
D. Unified Taxonomy
In this section, we introduce a taxonomy of approaches, thatallows for a unifying view of the field. We observed that theworks we encountered while preparing this survey fall intothree main categories: data transformation methods, specializedarchitectures, and regularization models. The unified taxonomyof deep learning for tabular data methods is shown in Fig. 1.
The methods in the first group transform categorical andnumerical data, thus a deep neural network model is ableto better extract the information signal. These methods donot require new architectures or adapting the existing dataprocessing pipeline. Nevertheless, the transformation stepcomes at the cost of an increased preprocessing time. Thismight be an issue for high-load systems [74], in the caseof categorical variables with high cardinality and growingdata set size. We can further subdivide this field into Single-Dimensional Encodings, which are employed to transform eachfeature independently or Multi-Dimensional Encodings, whichare used to map an entire data record to another representation.
The biggest share of works investigates specialized archi-tectures and suggests that a different deep neural networkarchitecture is required for tabular data. Two types of architec-tures are of particular importance: hybrid models fuse classicalmachine learning approaches (e.g., decision trees) with neuralnetworks, while transformer-based models rely on the attentionmechanism.
Lastly, the group of regularization models claims that oneof the main reasons for the moderate performance of deeplearning models on tabular is their extreme non-linearity andmodel complexity. Therefore, strong regularization schemesare proposed as a solution. They are mainly implemented inthe form of special-purpose loss functions.
We believe our taxonomy may help practitioners find themethods of choice, that can be easily integrated into theirexisting tool chain. For instance, the data transformations canresult in performance improvements while maintaining thecurrent model architecture. With specialized architectures, thedata preprocessing pipeline can be kept intact.
IV. DEEP NEURAL NETWORKS FOR TABULAR DATA
In this section, we discuss the use of deep neural networkson tabular data for classification or regression tasks accordingto the taxonomy presented in the previous section.
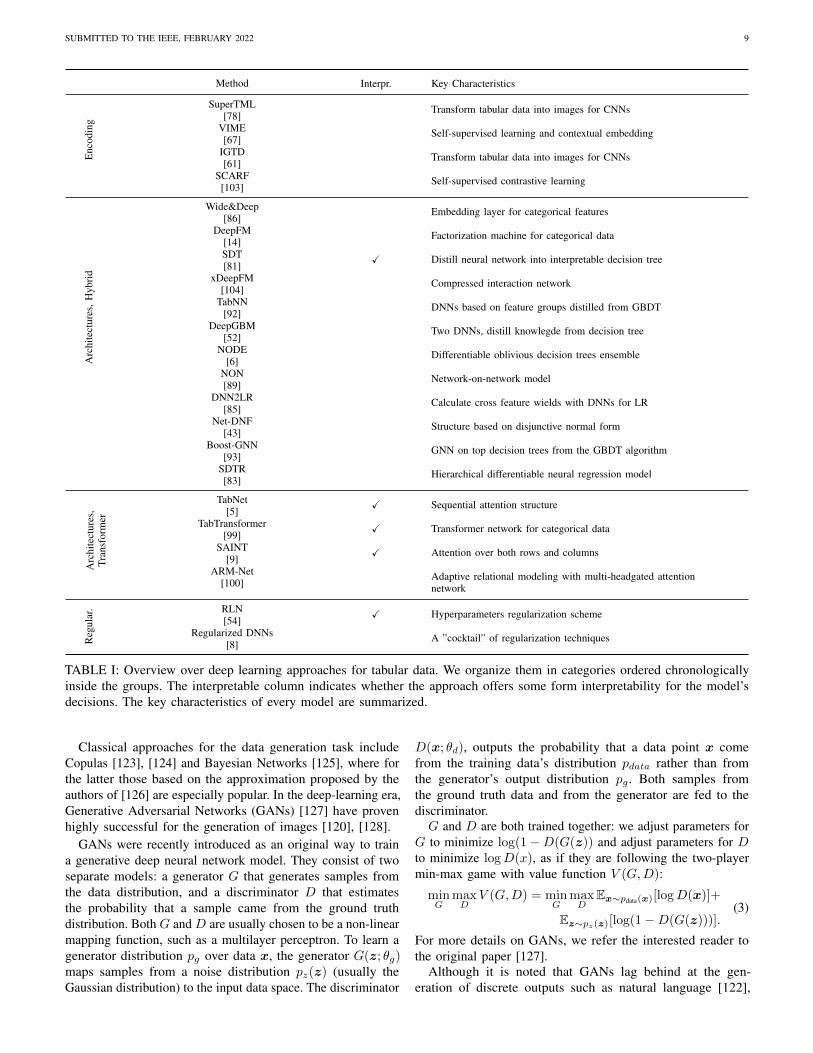
We provide an overview of existing deep learning approachesin this area of research in Table I and discuss the threemethodological categories in detail: data transformation meth-ods (Subsection IV-A), architecture-based methods (SubsectionIV-B1), and regularization-based models (Subsection IV-C).
A. Data Transformation Methods
Most traditional approaches for deep neural networks ontabular data fall into this group. Interestingly, data preprocessingplays a relatively minor role in computer vision, even thoughthe field is currently dominated by deep learning solutions. [4].There are many different possibilities to transform tabular data,and each may have an impact on the learning results [40].

SUBMITTED TO THE IEEE, FEBRUARY 2022 5
1) Single-Dimensional Encoding: One of the critical obsta-cles for deep learning with tabular data are categorical variables.Since neural networks only accept real number vectors as input,these values must be transformed before a model can use them.Therefore, approaches from this group try to encode categoricalvariables in a way suitable for deep learning models.
As [40] state in their survey, approaches in this group, aredivided into deterministic techniques, which can be used beforetraining the model, and more complicated automatic techniquesthat are part of the model architecture. There are many waysfor deterministic data encoding, so we restrict ourselves to themost common ones without the claim of completeness.
The most simple data encoding technique might be ordi-nal or label encoding. Every category is just mapped to adiscrete numeric value, e.g., {‘‘Apple’’, ‘‘Banana’’}are encoded as {0, 1}. Unfortunately, this method introducesan artificial order to previously unordered categories. Anotherstraightforward method that does not include any order isthe one-hot encoding. One column for each unique categoryis added to the data. Only the column corresponding to theobserved category is assigned the value one, with the othervalues being zero. In our example, ‘‘Apple’’ could beencoded as (1,0) and ‘‘Banana’’ as (0,1). Having adiverse set of categories in the data, this method, of course,can lead to high-dimensional sparse feature vectors (and the“curse of dimensionality” problem).
Binary encoding limits the number of new columns bytransforming the qualitative data into a numerical representation(as the label encoding does) and using the binary format ofthe number. Again the digits are split into different columns,but there are only log(c) new columns if c is the number ofunique categorical values. If we extend our example to threefruits, e.g., {‘‘Apple’’, ‘‘Banana’’, ‘‘Pear’’}, weonly need two columns to represent them: (01), (10),(11).
One approach that needs no extra columns and does notinclude any artificial order is the so-called leave-one-outencoding. It is based on the target encoding technique proposedin the work by [75], where every category is replaced with themean of the target variable of that category. The leave-one-outencoding excludes the current row when computing the meanof the target variable to avoid overfitting. This approach isquite generic and is also used in the CatBoost framework [76],a state-of-the-art machine learning library for heterogeneoustabular data based on the gradient boosting algorithm [77].
A different strategy is hash-based encoding. Every categoryis transformed into a fixed-size value via a deterministic hashfunction. The output size is not directly dependent on thenumber of input categories but can be chosen manually.
2) Multi-Dimensional Encoding: One way of applying anautomatic encoding is used by the VIME approach [67]. Theauthors propose a self- and semi-supervised deep learningframework for tabular data that trains an encoder in a self-supervised fashion by using two pretext tasks. Those tasksthat are independent from the concrete downstream task whichthe predictor has to solve. The first task of VIME is calledmask vector estimation; its goal is to determine which valuesin a sample are corrupted. The second task, i.e., feature vector
estimation, is to recover the original values of the sample.The encoder itself is a simple multilayer perceptron. Thisautomatic encoding makes use of the fact that there is oftenmuch more unlabeled than labeled data. The encoder learns howto construct an informative homogeneous representation of theraw input data. In the semi-supervised step, a predictive model(which is also a deep neural network model) is trained, usingthe labeled and unlabeled data transformed by the encoder. Forthe latter, a novel data augmentation method is used, corruptingone (unlabeled) data point multiple times with different masks.On the predictions from all augmented samples from oneoriginal data point, a consistency loss Lu can be computed thatrewards similar outputs. Combined with a supervised loss Ls
from the labeled data, the predictive model minimizes the finalloss L = Ls+β ·Lu. To summarize, the VIME network trainsan encoder, which is responsible to transform the categorical(and also numerical) features into a new homogeneous andinformative representation. This transformed feature vector isused as an input to the predictive model. For the encoderitself, the categorical data can be transformed by a simpleone-hot-encoding and binary encoding.
Another stream of research aims at transforming the tabularinput into a more homogeneous format. Since the revivalof deep learning, convolutional neural networks have showntremendous success in computer vision tasks. Therefore, thework by [78] proposed the SuperTML method, which is adata conversion technique for tabular data into visual dataformat(2-d matrices), i.e., an equivalent to black-and-whiteimages.
The image generator for tabular data (IGTD) by [61] followsan idea similar to SuperTML. The IGTD framework convertstabular data into images to make use of classical convolutionalarchitectures. As convolutional neural networks rely on spatialdependencies, the transformation into images is optimizedby minimizing the difference between the feature distanceranking of the tabular data and the pixel distance ranking ofthe generated image. Every feature corresponds to one pixel,which leads to compact images with similar features close atneighboring pixels. Thus, IGDTs can be used in the absence ofdomain knowledge. The authors show relatively solid results fordata with strong feature relationships but the method may failif the features are independent or feature similarities can notcharacterize the relationships. In their experiments, the authorsused only gene expression profiles and molecular descriptorsof drugs as data. This kind of data may lead to a favorableinductive bias, so the general viability of the approach remainsunclear.
B. Specialized Architectures
Specialized architectures form the largest group of ap-proaches for deep tabular data learning. Hence, in this group,the focus is on the development and investigation of noveldeep neural network architectures designed specifically forheterogeneous tabular data. Guided by the types of availablemodels, we divide this group into two sub-groups: Hybridmodels (presented in IV-B1) and transformer-based models(discussed in IV-B2).

SUBMITTED TO THE IEEE, FEBRUARY 2022 6
1) Hybrid Models: Most approaches for deep neural net-works on tabular data are hybrid models. They transform thedata and fuse successful classical machine learning approaches,often decision trees, with neural networks. We distinguishbetween fully differentiable models, that can be differentiatedw.r.t. all their parameters and partly differentiable models.
Fully differentiable ModelsThe fully differentiable models in this category offer a
valuable property: They permit end-to-end deep learning fortraining and inference by means of gradient descent optimizers.Thus, they allow for highly efficient implementations in moderndeep learning frameworks that exploit GPU or TPU accelerationthroughout the code.
the authors of [6] propose an ensemble of differentiableoblivious decision trees [79] – the NODE framework fordeep learning on tabular data. Oblivious decision trees usethe same splitting function for all nodes on the same leveland can therefore be easily parallelized. NODE generalizesthe successful CatBoost [76] framework. To make the wholearchitecture fully differentiable and benefit from end-to-endoptimization, NODE utilizes the entmax transformation [80]and soft splits. In their experiments, the NODE frameworkoutperforms XGBoost and other GBDT models on many datasets. As NODE is based on decision tree ensembles, thereis no preprocessing or transformation of the categorical datanecessary. Decision trees are known to handle discrete featureswell. In the official implementation strings are converted tointegers using the leave-one-out encoding scheme. The NODEframework is widely used and provides a sound implementationthat can be readily deployed.
the authors of [81] contributed another model relying onsoft decision trees (SDT) to make neural networks moreinterpretable. They investigated training a deep neural networkfirst, before using a mixture of its outputs and the ground truthlabels to train the SDT model in a second step. This also allowsfor semi-supervised learning with unlabeled samples that arelabeled by the deep neural network and used to train a morerobust decision tree along with the labeled data. The authorsshowed that training a neural model first increases accuracyover SDTs that are directly learned from the data. However,their distilled trees still exhibit a performance gap to the neuralnetworks that were fitted in the initial step. Nevertheless, themodel itself shows a clear relationship among different classesin a hierarchical fashion. It groups different categorical valuesbased on the common patterns, e.g., the digits 8 and 9 fromthe MNIST data set [82]. To summarize, the proposed methodallows for high interpretability and efficient inference, at thecost of slightly reduced accuracy.
The follow-up work [83] extended this line of research toheterogeneous tabular data and regression tasks and presentsthe soft decision tree regressor (SDTR) framework. The SDTRis a neural network which tries to imitate a binary decision.Therefore all neurons, like all nodes in a tree, get the same inputfrom the data instead of the output from previous layers. In thecase of deep networks, the SDTR could not beat other state-of-the-art models, but it has shown good result in a low-memorysetting, where single tree models and shallow architectureswere compared.
An interesting idea was introduced by [43]. Their Net-DNFtakes into account that every decision tree is merely a form ofa Boolean formula, more precisely a disjunctive normal form.They use this inductive bias to design the architecture of aneural network, which is able to imitate the characteristics ofthe gradient boosting decision trees algorithm. The resultingNet-DNF was tested for classification tasks on data sets withno missing values, where it showed results that are comparableto those of XGBoost [84]. Not mentioned, however, is how tohandle high-cardinality categorical data, as the used data setscontained mostly numerical and few binary features.
Linear models (e.g., linear and logistic regression) provideglobal interpretability but are inferior to complex deep neuralnetworks. Usually, handcrafted feature engineering is requiredto improve the accuracy of linear models. [85] use a deepneural network to combine the features in a possibly non-linearway; the resulting combination then serves as input to the linearmodel. This enhances the simple model while still providinginterpretability.
The work by the authors of [86] proposes a hybrid architec-ture that consists of linear and deep neural network models -Wide&Deep. A linear model that takes single features and awide selection of hand-crafted logical expressions on featuresas an input is enhanced by a deep neural network to improve thegeneralization capabilities. Additionally, Wide&Deep learns ann-dimensional embedding vector for each categorical feature.All embeddings are concatenated resulting in a dense vectorused as input to the neural network. The final prediction canbe understood as a sum of both models. A similar work fromthe authors of [87] proposes an embedding using deep neuralnetworks for categorical variables.
Another contribution to the realm of Wide&Deep models isDeepFM the authors of [14]. The authors demonstrate that itis possible to replace the hand-crafted feature transformationswith learned Factorization Machines (FMs) [88], leading toan improvement of the overall performance. The FM is anextension of a linear model designed to capture interactionsbetween features within high-dimensional and sparse dataefficiently. Similar to the original Wide&Deep model, DeepFMalso relies on the same embedding vectors for its “wide”and “deep” parts. In contrast to the original Wide&Deepmodel, however, DeepFM alleviates the need for manual featureengineering.
Lastly, Network-on-Network (NON) [89] is a classificationmodel for tabular data, which focuses on capturing the intra-feature information efficiently. It consists of three components:a field-wise network consisting of one unique deep neuralnetwork for every column to capture the column-specificinformation, an across-field-network, which chooses the optimaloperations based on the data set, and an operation fusionnetwork, connecting the chosen operations allowing for non-linearities. As the optimal operations for the specific data areselected, the performance is considerably better than that ofother deep learning models. However, the authors did notinclude decision trees in their baselines, the current state-of-the-art models on tabular data. Also, training as many neuralnetworks as columns and selecting the operations on the flymay lead to a long computation time.

SUBMITTED TO THE IEEE, FEBRUARY 2022 7
Partly differentiable ModelsThis subgroup of hybrid models aims at combining non-
differentiable approaches with deep neural networks. Usuallymodels from this group utilize decision trees for the non-differentiable part.
The DeepGBM model [52] combines the flexibility of deepneural networks with the preprocessing capabilities of gradientboosting decision trees. DeepGBM consists of two neuralnetworks - CatNN and GBDT2NN. While CatNN is specializedto handle sparse categorical features, GBDT2NN is specializedto deal with dense numerical features.
In the preprocessing step for the CatNN network, thecategorical data are transformed via an ordinal encoding (toconvert the potential strings into integers), and the numericalfeatures are discretized, as this network is specialized forcategorical data. The GBDT2NN network distills the knowledgeabout the underlying data set from a model based on gradientboosting decision trees by accessing the leaf indices of thedecision trees. This embedding based on decision tree leaveswas first proposed by [90] for the random forest algorithm.Later, the same knowledge distillation strategy has been adoptedfor gradient boosting decision trees [91].
Using the proposed combination of two deep neural networks,DeepGBM has a strong learning capacity for both categoricaland numerical features. Unique about the network is that theauthors explicitly implemented and tested the online predictionperformance, where DeepGBM significantly outperforms gradi-ent boosting decision trees. On the downside, the leaf indicescan be seen as meta categorical features since we cannondirectly compare these numbers. Also, it is not clear how otherdata-related issues, such as missing values, different scaling ofnumeric features, and noise, influence the predictions producedby the models.
The TabNN architecture, introduced by [92], is based on twoprinciples: explicitly leveraging expressive feature combinationsand reducing model complexity. It distills the knowledge fromgradient boosting decision trees to retrieve feature groups, itclusters them and then constructs the neural network based onthose feature combinations. Also structural knowledge fromthe trees is transferred to provide an effective initialization.However, the construction of the network already takes differentextensive computation steps (where one is only a heuristicto avoid an NP-hard problem). Furthermore, in light of theconstruction challenges and since an implementation of TabNNwas not provided, the practical use of the network seemslimited.
In similar spirit to DeepGBM and TabNN, the workfrom [93] proposes using gradient boosting decision trees forthe data prepossessing step. The authors show that a decisiontree structure has the form of a directed graph. Thus, theproposed framework exploits the topology information from thedecision trees using graph neural networks [94]. The resultingarchitecture is coined Boosted Graph Neural Network (BGNN).In multiple experiments, BGNN demonstrates that the proposedarchitecture is superior to existing solid competitors in termsof predictive performance and training time.
2) Transformer-based Models: Transformer-based ap-proaches form another subgroup of model-based deep neural
methods for tabular data. Inspired by the recent explosive in-terest in transformer-based methods and their successes on textand visual data [57], [95], researchers and practitioners haveproposed multiple approaches using deep attention mechanisms[2] for heterogeneous tabular data.
TabNet [5] is one of the first transformer-based modelsfor tabular data. Similar to a decision tree, the TabNetarchitecture comprises multiple subnetworks that are processedin a sequential hierarchical manner. According to [5], eachsubnetwork corresponds to one particular decision step. Totrain TabNet, each decision step (subnetwork) receives thecurrent data batch as input. TabNet aggregates the outputs ofall decision steps to obtain the final prediction. At each decisionstep, TabNet first applies a sparse feature mask [96] to performsoft instance-wise feature selection. [5] claim that the featureselection can save valuable resources, as the network may focuson the most important features. The feature mask of a decisionstep is trained using attentive information from the previousdecision step. To this end, a feature transformer module decideswhich features should be passed to the next decision step andwhich features should be used to obtain the output at the currentdecision step. Some layers of the feature transformers are sharedacross all decision steps. The obtained feature masks correspondto local feature weights and can also be combined into a globalimportance score. Accordingly, TabNet is one of the few deepneural networks that offers different levels of interpretabilityby design. Indeed, experiments show that each decision stepof TabNet tends to focus on a particular subdomain of thelearning problem (i.e., one particular subset of features). Thisbehaviour is similar to convolutional neural networks. TabNetalso provides a decoder module that is able to preprocessinput data (e.g., replace missing values) in an unsupervisedway. Accordingly, TabNet can be used in a two-stage self-supervised learning procedure, which improves the overallpredictive quality. Recently, TabNet has also been investigatedin the context of fair machine learning [97], [98].
One supervised and semi-supervised approach is introducedby [99]. Their TabTransformer architecture uses self-attention-based transformers to map the categorical features into acontextual embedding. This embedding is more robust tomissing or noisy data and enables interpretability. The embed-ded categorical features are then together with the numericalones fed into a simple multilayer perceptron. If, in addition,there is an extra amount of unlabeled data, unsupervisedpre-training can improve the results, using masked languagemodeling or replace token detection. Extensive experimentsshow that TabTransformer matches the performance of tree-based ensemble techniques, showing success also when dealingwith missing or noisy data. The TabTransformer network putsa significant focus on the categorical features. It transformsthe embedding of those features into a contextual embeddingwhich is then used as input for the multilayer perceptron. Thisembedding is implemented by different multi-head attention-based transformers, which are optimized during training.
ARM-net, introduced by [100], is an adaptive neural networkfor relation modeling tailored for tabular data. The key idea ofthe ARM-net framework is to model feature interactions withcombined features (feature crosses) selectively and dynamically

SUBMITTED TO THE IEEE, FEBRUARY 2022 8
by first transforming the input features into exponential spaceand then determining the interaction order and interactionweights adaptively for each feature cross. Furthermore, theauthors propose a novel sparse attention mechanism to generatethe interaction weights given the input data dynamically. Thus,users can explicitly model feature crosses of arbitrary orderswith noisy features filtered selectively.
SAINT (Self-Attention and Intersample Attention Trans-former) [9] is a hybrid attention approach, combining self-attention [2] with inter-sample attention over multiple rows.When handling missing or noisy data, this mechanism allowsthe model to borrow the corresponding information fromsimilar samples, which improves the model’s robustness. Thetechnique is reminiscent of nearest-neighbor classification. Inaddition, all features are embedded into a combined denselatent vector, enhancing existing correlations between valuesfrom one data point. To exploit the presence of unlabeled data,a self-supervised contrastive pre-training can further improvethe result, minimizing the distance between two views of thesame sample and maximizing the distance between differentones. Similar to the VIME framework (Section IV-A1), SAINTuses CutMix [101] to augment samples in the input space anduses mixup [102] in the embedding space. Attention-basedarchitectures offer mechanisms for interpretability, which is anessential advantage over many hybrid models. Figure 2 showsattention maps on the MNIST [82] and volkert [29] data sets,which can be found using different attention mechanisms.
C. Regularization Models
The third group of approaches argues that extreme flexibilityof deep learning models for tabular data is one of themain learning obstacles and strong regularization of learnedparameters may improve the overall performance.
One of the first methods in this category was the Regular-ization Learning Network (RLN) proposed by the authors of[54], which uses a learned regularization scheme. The mainidea is to apply trainable regularization coefficients λi to eachsingle weight wi in a neural network and, by this, lower thehigh sensitivity:
LC (Z,W, λ) = L (Z,W ) +
n∑i=1
exp (λi) · ‖wi‖ , (2)
where Z = {(xm, ym)}Mm=1 are the training samples, L is theclassification loss given the model with weights, W = {wi}ni=1.The norm, ‖·‖, can be chosen according to use-case-specificsparsity requirements, and the λi, i.e., the regularization coeffi-cients, are learned for each weight wi. To efficiently determinethe corresponding coefficients, the authors propose a novelloss function termed “Counterfactual Loss”, LC (Z,W, λ). Theregularization coefficients lead to a very sparse network, whichalso provides the importance of the remaining input features.
In their experiments, RLNs outperform deep neural networksand obtain results comparable to those of the gradient boostingdecision trees algorithm, but they used only one data setwith mainly numerical data to compare the models. The RLNpaper does not address the issues of categorical data. For theexperiments and the example implementation data sets with
age
workclass
fnlw
gted
ucation
education
-num
marital-status
occupation
relationship
race
sex
capital-gain
capital-loss
hours-per-w
eek
native-cou
ntry
samples(oneper
line)
(a) TabNet attributions
age
workclass
fnlw
gted
ucation
education
-num
marital-status
occupation
relationship
race
sex
capital-gain
capital-loss
hours-per-w
eek
native-cou
ntry
samples(oneper
line)
(b) KernelSHAP attributions
Fig. 2: Interpretable learning with the TabNet [5] architecture.We compare the attributions provided by the model for a samplefrom the UCI Adult data set with those provided by the gametheoretic KernelSHAP framework [109].
exclusively numerical data (except for gender attribute) wereused. A similar idea is proposed in [105], where regularizationcoefficients are learned only in the first layer with a goal toextract feature importance.
[8] state that simple multilayer perceptrons can outperformstate-of-the-art algorithms on tabular data if deep learningnetworks are properly regularized. The authors of the workpropose a ”cocktail” of regularization with thirteen differenttechniques that are applied jointly. From those, the optimalsubset and their subsidiary hyperparameters are selected. Theydemonstrate in extensive experiments that the ”cocktails” regu-larization can not only improve the performance of multilayerperceptrons, but these simple models also outperform tree-based architectures. On the downside, the extensive per-dataset regularization and hyperparameter optimization take muchmore computation time than the gradient boosting decisiontrees algorithm.
There are several other works [106]–[108] showing thatstrong regularization of deep neural networks is beneficial fortabular data.
V. TABULAR DATA GENERATION
For many applications, the generation of realistic tabular datais fundamental. These include data augmentation [110] withdata imputation (the filling of missing values values) [111],[112] and rebalancing [113]–[116] in particular. Another highlyrelevant topic is privacy-aware machine learning [117]–[119]where generated data can be used to overcome privacy concerns.
A. Methods
While the generation of images and text is highly ex-plored [120]–[122], generating synthetic tabular data is stilla challenge. The mixed structure of discrete and continuousfeatures along with their different value distributions has to bemanaged.
SUBMITTED TO THE IEEE, FEBRUARY 2022 9
Method Interpr. Key CharacteristicsE
ncod
ing
SuperTML[78]
Transform tabular data into images for CNNs
VIME[67]
Self-supervised learning and contextual embedding
IGTD[61]
Transform tabular data into images for CNNs
SCARF[103]
Self-supervised contrastive learning
Arc
hite
ctur
es,H
ybri
d
Wide&Deep[86]
Embedding layer for categorical features
DeepFM[14]
Factorization machine for categorical data
SDT[81]
X Distill neural network into interpretable decision tree
xDeepFM[104]
Compressed interaction network
TabNN[92]
DNNs based on feature groups distilled from GBDT
DeepGBM[52]
Two DNNs, distill knowlegde from decision tree
NODE[6]
Differentiable oblivious decision trees ensemble
NON[89]
Network-on-network model
DNN2LR[85]
Calculate cross feature wields with DNNs for LR
Net-DNF[43]
Structure based on disjunctive normal form
Boost-GNN[93]
GNN on top decision trees from the GBDT algorithm
SDTR[83]
Hierarchical differentiable neural regression model
Arc
hite
ctur
es,
Tran
sfor
mer
TabNet[5]
X Sequential attention structure
TabTransformer[99]
X Transformer network for categorical data
SAINT[9]
X Attention over both rows and columns
ARM-Net[100]
Adaptive relational modeling with multi-headgated attentionnetwork
Reg
ular
. RLN[54]
X Hyperparameters regularization scheme
Regularized DNNs[8]
A ”cocktail” of regularization techniques
TABLE I: Overview over deep learning approaches for tabular data. We organize them in categories ordered chronologicallyinside the groups. The interpretable column indicates whether the approach offers some form interpretability for the model’sdecisions. The key characteristics of every model are summarized.
Classical approaches for the data generation task includeCopulas [123], [124] and Bayesian Networks [125], where forthe latter those based on the approximation proposed by theauthors of [126] are especially popular. In the deep-learning era,Generative Adversarial Networks (GANs) [127] have provenhighly successful for the generation of images [120], [128].
GANs were recently introduced as an original way to traina generative deep neural network model. They consist of twoseparate models: a generator G that generates samples fromthe data distribution, and a discriminator D that estimatesthe probability that a sample came from the ground truthdistribution. Both G and D are usually chosen to be a non-linearmapping function, such as a multilayer perceptron. To learn agenerator distribution pg over data x, the generator G(z; θg)maps samples from a noise distribution pz(z) (usually theGaussian distribution) to the input data space. The discriminator
D(x; θd), outputs the probability that a data point x comefrom the training data’s distribution pdata rather than fromthe generator’s output distribution pg. Both samples fromthe ground truth data and from the generator are fed to thediscriminator.G and D are both trained together: we adjust parameters for
G to minimize log(1−D(G(z)) and adjust parameters for Dto minimize logD(x), as if they are following the two-playermin-max game with value function V (G,D):
minG
maxD
V (G,D) = minG
maxD
Ex∼pdata(x)[logD(x)]+
Ez∼pz(z)[log(1−D(G(z)))].(3)
For more details on GANs, we refer the interested reader tothe original paper [127].
Although it is noted that GANs lag behind at the gen-eration of discrete outputs such as natural language [122],

SUBMITTED TO THE IEEE, FEBRUARY 2022 10
Discriminator D
Loss L(real or fake)
Condition: xc = v z ~ N(0,1)
sample column c
sample value v for xc
data setConditionalGenerator
G
generated recordrecord with xc = v
retrieve
only used in training
Fig. 3: Overview of the CTGAN model. A condition is sampledfirst and passed to the conditional generator G along with arandom input z. The generated sample is opposed to a randomlypicked example from the data set that also fulfills the conditionand assessed by the conditional discriminator D. This approachallows to preserve dependency relations. Adapted from [136].
they are frequently chosen for the tabular data generationtask. Vanilla GANs or derivates such as the WassersteinGAN (WGAN) [129], WGAN with gradient penalty (WGAN-GP) [130], Cramer GAN [131] or the Boundary seekingGAN [132] which is specifically designed with discrete data inmind are common in the literature. Also, VeeGAN [133] is fre-quently used for tabular data. Apart from GANs, autoencoders– in particular Variational Autoencoders (VAEs) proposed bythe authors of [134] – are investigated [135], [136].
We provide an overview of tabular generation approaches,that use deep learning techniques in Table II. Note that dueto the sheer number of approaches, we list only the mostinfluential works that address the problem of data generationand focus on tabular data in particular. Also, we exclude worksthat are targeted towards highly domain-specific tasks. Anextensive review of existing approaches can also be foundin [113].
In the following section, we will briefly discuss the mostrelevant approaches, that helped shape the domain. MedGANby [117] was one of the first works and provides a deep learningmodel to generate patient records. As all the features there arediscrete, this model can not be easily transferred to generaltabular data. The table-GAN approach by [137] adapts DeepConvolutional GAN for tabular data. Specifically, the featuresfrom one record are converted into a matrix, so that theycan be processed by convolutional filters of a convolutionalneural network. However, it remains unclear to which extentthe inductive bias used for images is suitable for tabular data.
A holistic approach by the authors of [136] focuses on thecorrelation between the features of one data point. The authorsfirst propose the mode-specific normalization technique for data
preprocessing, that allows to transform non-Gaussian distribu-tions in the continuous columns. They express numeric valuesin terms of a mixture component number and the deviationfrom that component’s center. This allows to represent multi-modal skewed distributions. Their generative solution, coinedCTGAN, uses the conditional GAN architecture depicted inFig. 3 to enforce the learning of proper conditional distributionsfor each column. To obtain categorical values and to allow forbackpropagation in the presence of categorical values, the so-called gumbel-softmax trick [138] is utilized. The authorsalso propose a model based on Variational Autoencoders,named TVAE (for Tabular Variational Autoencoder), that evenoutperforms the GAN approach. Both approaches can beconsidered state-of-the-art.
While GANs and VAEs are prevalent, other recently pro-posed architectures include machine-learned Causal Mod-els [139] and Invertible Flows [119]. When privacy is themain factor of concern, models such as PATE-GAN [140]provide generative models with certain differential privacyguarantees. Although very interesting and relevant for practicalapplications, such privacy guarantees and related federatedlearning approaches with tabular data are outside the scope ofthis review.
Fan et al. [118] compare a variety of different GANarchitectures for tabular data synthesis and recommend usinga simple, fully-connected architecture with a vanilla GAN losswith minor changes to prevent mode-collapse. They also usethe normalization proposed by [136]. In their experiments, theWasserstein GAN loss or the use of convolutional architectureson tabular data does boost the generative performance.
B. Assessing Generative Quality
To assess the quality of the generated data, several per-formance measures are used. The most common approachis to define a proxy classification task and train one modelfor it on the real training set and another on the artificiallygenerated data set. With a highly capable generator, thepredictive performance of the artificial-data model on thereal-data test set should be almost on par with its real-datacounterpart. This measure is often referred to as machinelearning efficacy and used in [117], [136], [141]. In non-obvious classification tasks, an arbitrary feature can be usedas a label and predicted [117], [142], [143]. Another approachis to visually inspect the modeled distributions per-feature,e.g., the cumulative distribution functions [110] or comparethe expected values in scatter plots [117], [142]. A morequantitative approach is the use of statistical tests, such asthe Kolmogorov-Smirnov test [146], to assess the distributionaldifference [143]. On synthetic data sets, the output distributioncan be compared to the ground truth, e.g. in terms of log-likelihood [136], [139]. Because overfitted models can alsoobtain good scores, [136] propose evaluating the likelihood ofa test set under an estimate of the GAN’s output distribution.Especially in a privacy-preserving context, the distribution ofthe Distance to Closest Record (DCR) can be calculated andcompared to the respective distances on the test set [137].

SUBMITTED TO THE IEEE, FEBRUARY 2022 11
Method Based upon Application
medGAN [117] Autoencoder+GAN Medical Records
TableGAN [137] DCGAN General
Mottini et al. [141] Cramer GAN Passenger Records
Camino et al. [142] medGAN, ARAE General
medBGAN, medWGAN [143] WGAN-GP,Boundary seeking GAN Medical Records
ITS-GAN [110] GAN with AEfor constraints General
CTGAN, TVAE [136] Wasserstein GAN, VAE General
actGAN [115] WGAN-GP Health Data
VAEM [135] VAE (Hierarchical) General
OVAE [144] Oblivious VAE General
TAEI [116] AE+SMOTE (inmultiple setups) General
Causal-TGAN [145] Causal-Model, WGAN-GP General
Copula-Flow [119] Invertible Flows General
TABLE II: Generation of tabular data using deep neural network models (in chronological order).
VI. EXPLANATION MECHANISMS FOR DEEP LEARNINGWITH TABULAR DATA
Explainable machine learning is concerned with the problemof providing explanations for complex machine learning models.Towards this goal, various streams of research follow differentexplainability paradigms which can roughly be categorizedinto feature highlighting and counterfactual explanations [147],[148].
A. Feature Highlighting Explanations
Local input attribution techniques seek to explain thebehaviour of machine learning models instance by instance.Those methods aim to understand how all inputs available tothe model are being used to arrive at a certain prediction. Somepopular approaches for model explanations aim at constructingclassification models that are explainable by design [149]–[151].This is often achieved by enforcing the deep neural networkmodel to be locally linear. Moreover, if the model’s parametersare known and can be accessed, then the explanation techniquecan use these parameters to generate the model explanation.For such settings, relevance-propagation-based methods, e.g.,[152], [153], and gradient-based approaches, e.g., [154]–[156],have been suggested. In cases where the parameters of theneural network cannot be accessed, model-agnostic approachescan prove useful. This group of approaches seeks to explain amodel’s behavior locally by applying surrogate models [109],[157]–[160], which are interpretable by design and are used toexplain individual predictions of black-box machine learningmodels. In order to test the performance of these black-boxexplanations techniques, the authors of [161] suggest a pythonbased benchmarking library.
B. Counterfactual Explanations
From the perspective of algorithmic recourse, the mainpurpose of counterfactual explanations is to suggest constructive
interventions to the input of a deep neural network so that theoutput changes to the advantage of an end user. By emphasizingboth the feature importance and the recommendation aspect,counterfactual explanation methods can be further divided intotwo different groups: independence-based and dependence-based and approaches.
In the class of independence-based methods, where the inputfeatures of the predictive model are assumed to be independent,some approaches use combinatorial solvers to generate recoursein the presence of feasibility constraints [162]–[165]. Anotherline of research deploys gradient-based optimization to find low-cost counterfactual explanations in the presence of feasibilityand diversity constraints [166]–[168]. The main problem withthese approaches is that they abstract from input correlations.
To alleviate this problem, researchers have suggested buildingrecourse suggestions on generative models [169]–[174]. Themain idea is to change the geometry of the intervention spaceto a lower dimensional latent space, which encodes differentfactors of variation while capturing input dependencies. Tothis end, these methods primarily use (tabular data) variationalautoencoders [134], [175]. In particular, the authors of [172]demonstrate how to encode various feasibility constraints intosuch models.
For a more fine-grained overview over the literature oncounterfactual explanations we refer the interested reader tothe most recent surveys [176], [177]. Finally, the authors of[178] have implemented an open-source python library whichprovides support for many of the aforementioned counterfactualexplanation models.
VII. EXPERIMENTS
Although several experimental studies have been publishedin recent years [7], [8], an exhaustive comparison betweenexisting deep learning approaches for heterogeneous tabulardata is still missing. For example, important aspects of deep

SUBMITTED TO THE IEEE, FEBRUARY 2022 12
Adult California CovertypeIncome Housing
Samples 32.561 20.640 581.012Num. features 6 8 52Cat. features 8 0 2Task Classification Regression ClassificationClasses 2 - 7
TABLE III: Main properties of the real-world heterogeneoustabular data sets used in this survey.
learning models, such as training and inference time, modelsize, and interpretability, are not discussed.
To fill this gap, we present an extensive empirical comparisonof machine and deep learning methods on real-world datasets with varying characteristics in this section. We discussthe data set choice (VII-A), the results (VII-B), and presenta comparison of the training and inference time for all themachine learning models considered in this survey (VII-C).We also discuss the size of deep learning models. Lastly, tothe best of our knowledge, we present the first comparison ofexplainable deep learning methods for tabular data (VII-D). Werelease the full source code of our experiments for maximumtransparency1.
A. Data Sets
In the computer vision field, there are many standard data setsfor the evaluation of new deep learning architectures availablesuch as MNIST [82], CIFAR [179], and ImageNet [180]. Onthe contrary, there are no established standard heterogeneousdata sets.
We deliberately select data sets with different characteristics,such as data domain (finance, e-commerce, geography), numberof categorical variables, and the sample size (small to large).Furthermore, most of the selected data sets were previouslyfeatured in multiple studies.
The first data set of our study is the Adult Income data set[181]. It includes basic information about individuals such as:age, gender, education, etc. The target variable is binary; itrepresents high and low income.
We further use the California Housing data set [182], whichcontains information about a number of properties. The target(regression) is to estimate price of the corresponding home.
The Covertype data set [181] is multi-classification data setwhich holds cartographic information about land cells (e.g.,elevation, slope). The goal is to predict which one out of sevenforest cover types is present in the cell.
The fundamental characteristics of the selected data sets aresummarized in Table V.
B. Open Performance Benchmark on Tabular Data
1) Hyperparameter Selection: In order to do a fair evaluationwe use the Optuna library [191] with 100 iterations for eachmodel to tune hyperparameters. Each hyperparameter configu-ration was cross-validated with five folds. The hyperparameterranges used are publicly available online along with our code.
1Open benchmarking on tabular data for machine learning models:https://github.com/kathrinse/TabSurvey.
We laid out the search space based on the information givenin the corresponding papers and recommendations from theframework’s authors.
2) Data Preprocessing: We prepossessed the data in thesame way for every machine learning model by applying zero-mean, unit-variance normalization to the numerical featuresand an ordinal encoding to the categorical ones. The missingvalues were substituted with zeros for the linear regression andmodels based on pure neural networks since these methodscannot accept them otherwise. We also one-hot-encoded thecategorical values for deep learning models since decisiontree-based models are able to handle categorical data directly.
3) Reproducibility: For maximum reproducibility, we utilizea docker container [192] to run all our experiments. Weunderline again that our full code is publicly released so thatthe experiments can be replicated and be used as a solidbenchmark for novel methods. We also hope that the datascience community will extend the existed the number ofevaluation.
4) Results: The results of our experiments are shown inTable IV. They draw a different picture than many recentresearch papers may suggest: The best scores are still obtainedby boosted decision tree ensembles, in particular LightGBM.Also XGBoost and CatBoost outperform all Deep Learning-based approaches on the three data sets that were used inour experiments. Our results are consistent with the inferiorperformance of deep learning approaches in comparison toapproaches based on decision tree ensembles observed invarious kaggle competitions on tabular data. Most of thewinning models are based on the gradient boosting decisiontrees [193].
Considering only deep learning approaches, we observe thatDeepFM and SAINT provided strong results. Although theywere still not able to beat the tree ensembles, on the largerCovertype data set, we observed that the performance of SAINTwas almost on par with that of CatBoost and superior to thatof LightGBM. We hypothesize that deep learning models mayhave an advantage for even larger data sets which are, however,rare in the context of tabular data.
10−2 10−1 100 101 102
Training time
0.81
0.82
0.83
0.84
0.85
0.86
0.87
Acc
urac
y
Linear Model
KNN
Decision Tree
Random Forest
XGBoost CatBoost
MLP
TabNet
VIMETabTransformer
Model Trees
NODE
DeepGBM
RLN
DNFNetSTG
NAM
DeepFM SAINT
Fig. 4: Training time benchmark on the Adult data set. Thecircle size reflects the accuracy standard deviation.

SUBMITTED TO THE IEEE, FEBRUARY 2022 13
Adult California Housing Covertype
Accuracy ↑ AUC (x100) ↑ MSE ↓ Accuracy ↑
Linear Model 82.5±0.2 85.4±0.2 0.528±0.008 72.4±0.0KNN [183] 83.2±0.2 87.5±0.2 0.421±0.009 70.2±0.1Decision Tree [184] 85.3±0.2 89.8±0.1 0.404±0.007 79.1±0.0Random Forest [185] 86.1±0.2 91.7±0.2 0.272±0.006 78.1±0.1XGBoost [84] 87.3±0.2 92.8±0.1 0.206±0.005 97.3±0.0LightGBM [186] 87.4±0.2 92.9±0.1 0.195±0.005 93.5±0.0CatBoost [76] 87.2±0.2 92.8±0.1 0.196±0.004 96.4±0.0Model Trees [187] 85.0±0.2 90.4±0.1 0.385±0.019 -
MLP [188] 84.8±0.1 90.3±0.2 0.263±0.008 91.0±0.4DeepFM [14] 86.1±0.2 91.7±0.1 0.260±0.006 -
DeepGBM [52] 84.6±0.3 90.8±0.1 0.856±0.065 -
RLN [54] 81.0±1.6 75.9±8.2 0.348±0.013 77.2±1.5TabNet [5] 85.4±0.2 91.1±0.1 0.346±0.007 88.6±0.3VIME [67] 84.8±0.2 90.5±0.2 0.270±0.007 90.9±0.1TabTransformer [99] 85.2±0.2 90.6±0.2 0.451±0.014 76.5±0.3NODE [6] 85.6±0.3 91.1±0.2 0.276±0.005 87.7±0.2DNFNet [43] 85.7±0.2 91.3±0.1 - 94.2±0.1STG [189] 85.4±0.1 90.9±0.1 0.285±0.006 81.8±0.3NAM [190] 83.4±0.1 86.6±0.1 0.725±0.022 -
SAINT [9] 86.1±0.3 91.6±0.2 0.226±0.004 96.3±0.1
TABLE IV: Open performance benchmark results based on (stratified) 5-fold cross-validation. We use the same fold splittingstrategy for every data set. The mean and standard deviation values are reported for each baseline model. Missing resultsindicate that the corresponding model could not be applied to the task type (regression or multi-class classification).
10−2 10−1 100 101
Inference time
0.81
0.82
0.83
0.84
0.85
0.86
0.87
Acc
urac
y
Linear Model
KNN
Decision Tree
Random ForestXGBoost
LightGBMCatBoost
MLPTabNet
VIME
TabTransformer
Model Trees
NODE
DeepGBM
RLN
DNFNetSTG
NAM
DeepFM SAINT
Fig. 5: Inference time benchmark on the Adult data set. Thecircle size reflects the accuracy standard deviation.
C. Run Time Comparison
We also analyse the training and inference time of thebaseline models in comparison to their performance. We plotthe time-performance characteristic for the models in Fig. 4and Fig. 5. Models with optimal training-time-to performancecharacteristics (there is no model with better lower training timefor a given performance) include the Linear Model, the DecisionTree, the Random Forest and XGBoost. For the inference-timeto performance ratio, Decision Trees, DeepFM, CatBoost and
101 102 103 104
Model size (Number trainable parameters)
0.81
0.82
0.83
0.84
0.85
0.86
Acc
urac
y
MLP
TabNet
VIME
TabTransformerNODE
DeepGBM
RLN
DNFNet
STG
NAM
DeepFM SAINT
Fig. 6: A size comparison of deep learning models on theAdult data set. The circle size reflects standard deviation.
LightGBM have optimal characteristics.
D. Interpretability Assessment
As opposed to the pure on-task performance, interpretabilityof the models is becoming an increasingly important character-istic. Therefore, we end this section with a distinct assessmentof the interpretability properties claimed by some methods.Admittedly, explanations can be provided in very differentformats, which may each have their own use-cases. Hence, we

SUBMITTED TO THE IEEE, FEBRUARY 2022 14
can only consider explanations that have a common form. In thiswork, we chose feature attributions as the explanation formatbecause they are the prevalent form of post-hoc explainabilityfor the models considered in this work. Remarkably, the modelsthat build on the transformer architecture (Section IV-B2) oftenclaim some extent of interpretability through the attention maps[9]. To verify this hypothesis and assess the attribution providedby some of the frameworks in practice, we run an ablation testwith the features that were attributed the highest importanceover all samples. Furthermore, due to the lack of ground truthattribution values, we compare individual attributions to thewell-known KernelSHAP values [109].
Evaluation of the quality of feature attribution is known tobe a non-trivial problem [194]. We measure the fidelity [195]of the attributions by successively removing the features thathave the highest mean importance assigned by the models fromthe data set (Most Relevant First, MoRF). We then retrain themodel to evade distribution shift due to imputation. A quickdrop in predictive accuracy indicates that the most importantfeatures were successfully removed. We do the same for theinverse order, Least Relevant First (LeRF), which removesthe features deemed unimportant. In this case, the accuracyshould stay high as long as possible. For the attention mapsof TabTransformer and SAINT, we either use the sum overthe entire columns of the intra-feature attention maps as animportance estimate or only take the diagonal (feature self-attentions) as attributions.
The obtained curves are visualized in Fig. 7. For the MoRForder, TabNet and TabTransformer with the diagonal of theattention head as attributions see to perform best. For LeRF,TabNet is the only significantly better method than the others.For TabTransformer, taking the diagonal of the attention matrixseems to increase the performance, whereas for SAINT, thereis almost no difference. We additionally compare the attributionvalues obtained to values from the KernelSHAP attributionmethod. Unfortunately, there are no ground truth attributionsto compare with. However, the SHAP framework has a solidgrounding in game theory and is widely deployed [45]. Weonly compare the absolute values of the attributions, as theattention maps are constrained to be positive. As a measureof agreement, we compute the Spearman Rank Correlationbetween the attributions by the SHAP framework and thetabular data models. The correlation we observe is surprisinglylow across all models, and sometimes it is even negative, whichmeans that a higher SHAP attribution will probably result in alower attribution by the model.
In these two simple benchmarks, the transformer modelswere not able to produce convincing feature attributions out-of-the-box. We come to the conclusion that more profoundbenchmarks of the claimed interpretability characteristics andtheir usefulness in practice are necessary.
VIII. DISCUSSION AND FUTURE PROSPECTS
In this section, we summarize our findings and discusscurrent and future trends in deep learning approaches for tabulardata (Section VIII-A). Moreover, we identify several openresearch questions that could be tackled to advance the fieldof tabular deep neural networks (Section VIII-B).
0 4 8 12
No. features removed
random
full
Accuracy
SAINT
SAINT, diag. attn.
TabNet
TabTransformer, diag. attn.
TabTransformer
(a) Most Relevant First (MoRF)
0 4 8 12
No. features removed
random
full
Accuracy
SAINT
SAINT, diag. attn.
TabNet
TabTransformer, diag. attn.
TabTransformer
(b) Least Relevant First (LeRF)
Fig. 7: Resulting curves of the global attribution benchmarkfor feature attributions (15 runs on Adult). Standard errors areindicated by the shaded area. For the MoRF order, an earlydrop in accuracy is desirable, while for LeRF, the accuracyshould stay as high as possible.
Model, attention used Spearman Corr.
TabTransformer, columnw. attention -0.01 ± 0.008TabTransformer, diag. attention 0.00 ± 0.010TabNet 0.07 ± 0.009SAINT, columnw. attention -0.04 ± 0.007SAINT, diag. attention 0.01 ± 0.007
TABLE V: Spearman rank correlation of the provided attribu-tion with KernelSHAP values as ground truth. Results werecomputed on 750 random samples from the Adult data set.
A. Summary and Trends
Decision Tree Ensembles are still State of the Art. Ina fair comparison on multiple data sets, we demonstratedthat models based on tree-ensembles, such as XGBoost,LightGBM, and CatBoost, still outperform the deep learningmodels on the three data sets that we considered and comewith the additional advantage of significantly less trainingtime. Even though it has been six years since the XGBoostpublication [84] and over twenty years since the publishing oforiginal gradient boosting paper [77], we can state that despitemuch research effort in deep learning, the state of the art fortabular data has remained unchanged. We, therefore, thinkthat a fundamental reorientation of the domain is necessary.The question of whether there is a benefit to be gained byusing deep learning with tabular data remains unanswered.Instead of proposing more and more complex models, takinga step back and focusing, e.g., on information-preservingrepresentation mechanisms for deep learning with tabular datamay be beneficial.

SUBMITTED TO THE IEEE, FEBRUARY 2022 15
Unified Benchmarking. Furthermore, our results highlightthe need for unified benchmarks. There is no consensus inthe machine learning community on how to make a fair andefficient comparison. the authors of [8] use about 40 differenttabular data sets for assessing the predictive performanceof machine learning algorithms. the authors of [7] showthat the choice of benchmarking data sets can have a non-negligible impact on the performance assessment. While wechose common data sets with varying characteristics for ourexperiments, a different choice of data sets or hyperparametersuch as the encoding use (e.g., use one-hot encoding) may leadto a different outcome. Because of the excessive number ofdata sets, there is a necessity for a standardized benchmarkingprocedure, which allows to identify significant progress withrespect to the state of the art. Therefore with this work wepropose an open benchmark for deep learning models on tabulardata. For tabular data generation tasks, the authors of [136]propose a sound evaluation framework with artificial and real-world data sets (Sec. V-B), but researchers need to agree oncommon benchmarks in this subdomain as well.
Tabular Data Preprocessing. Many of the challenges fordeep neural networks on tabular data are related to theheterogeneity of the data (e.g., categorical and sparse values).Therefore, some deep learning solutions transform them into ahomogeneous representation more suitable to neural networks.While the additional overhead is small, such transforms canboost performance considerably and should thus be among thefirst strategies applied in real-world scenarios.
Architectures for Deep Learning on Tabular Data.Architecture-wise, there has been a clear trend towardstransformer-based solutions (Section IV-B2) in recent years.These approaches offer multiple advantages over standard neu-ral network architectures, for instance, learning with attentionover both categorical and numerical features. Moreover, self-supervised or unsupervised pre-training that leverages unlabeledtabular data to train parts of the deep learning model is gainingpopularity, not only among transformer-based approaches.
Performance-wise, multiple independent evaluations demon-strate that deep neural network methods from the hybrid(Sec. IV-B1) and transformers-based (Sec. IV-B2) groupsexhibit superior predictive performance compared to plain deepneural networks on various data sets [9], [41], [52], [92]. Thisunderlines the importance of special-purpose architectures fortabular data.
Regularization Models for Tabular Data. It has also beenshown that regularization reduces the hypersensitivity of deepneural network models and improves the overall performance[8], [54]. We believe that regularization is one of the crucialaspects for a more robust and accurate performance of deepneural networks on tabular data and is gaining momentum.
Deep Generative Models for Tabular Data. Powerfultabular data generation is essential for the development of high-quality models, particularly in a privacy context. With suitabledata generators at hand, developers can use large, synthetic,and yet realistic data sets to develop better models, while notbeing subject to privacy concerns [140]. Unfortunately, thegeneration task is as hard as inference in predictive models,so progress in both areas will likely go hand in hand.
Interpretable Deep Learning Models for Tabular Data.Interpretability is undoubtedly desirable, particularly for tabulardata models frequently applied to personal data, e.g., inhealthcare and finance. An increasing number of approachesoffer it out-of-the-box, but most current deep neural networkmodels are still mainly concerned with the optimization ofa chosen error metric. Interpretable deep tabular learningis essential for understanding model decisions and results,especially for life-critical applications. Model explanations canbe used to identify and mitigate potential bias or eliminateunfair discrimination against certain groups [196].
Learning From Evolving Data Streams. Many modernapplications are subject to continuously evolving data streams,e.g., social media, online retail, or healthcare. Streaming dataare usually heterogeneous and potentially unlimited. Therefore,observations must be processed in a single pass and cannotbe stored. Indeed, online learning models can only access afraction of the data at each time step. Furthermore, they haveto deal with limited resources and shifting data distributions(i.e., concept drift). Hence, hyperparameter optimization andmodel selection, as typically involved in deep learning, areusually not feasible in a data stream. For this reason, despitethe success of deep learning in other domains, less complexmethods such as incremental decision trees [197], [198] areoften preferred in online learning applications.
B. Open Research QuestionsSeveral open problems need to be addressed in future
research. In this section, we will list those we deem fundamentalto the domain.
Information-theoretic Analysis of Encodings. Encodingmethods are highly popular when dealing with tabular data.However, the majority of data preprocessing approaches fordeep neural networks are lossy in terms of information content.Therefore, it is challenging to achieve an efficient, almostlossless transformation of heterogeneous tabular data intohomogeneous data. Nevertheless, the information-theoretic viewon these transformations remains to be investigated in detailand could shed light on the underlying mechanisms.
Computational Efficiency in Hybrid Models. The workby the authors of [7] suggests that the combination of agradient boosting decision tree and deep neural networks mayimprove the predictive performance of a machine learningsystem. However, it also leads to growing complexity. Trainingor inference times, which far exceed those of classical machinelearning approaches, are a recurring problem developing hybridmodels. We conclude that the integration of state-of-the-art approaches from classical machine learning and deeplearning has not been conclusively resolved yet and futurework should be conducted on how to mitigate the trade-offbetween predictive performance and computational complexity.
Spezialized Regularizations. We applaud recent research onregularization methods, in which we see a promising directionthat necessitates further exploration. In particular, whethercontext- and architecture-specific regularizations for tabulardata can be found, remains an open question. Additionally, itis relevant to explore the theoretical constraints that governthe success of regularization on tabular data more profoundly.

SUBMITTED TO THE IEEE, FEBRUARY 2022 16
Novel Processes for Tabular Data Generation. For tabulardata generation, modified Generative Adversarial Networksand Variational Autoencoders are prevalent. However, themodeling of dependencies and categorical distributions remainsthe key challenge. Novel architectures in this area, such asdiffusion models, have not been adapted to the domain oftabular data. Furthermore, the definition of an entirely newgenerative process particularly focused on tabular data mightbe worth investigating.
Interpretablity. Going forward, counterfactual explanationsfor deep tabular learning can be used to improve the perceivedfairness in human-AI interaction scenarios and to enable per-sonalized decision-making [177]. However, the heterogeneityof tabular data poses problems for counterfactual explanationmethods to be reliably deployed in practice. Devising tech-niques aimed at effectively handling heterogeneous tabular datain the presence of feasibility constraints is still an unsolvedtask [178].
Transfer of Deep Learning Methods to Data Streams.Recent work shows that some of the limitations of neuralnetworks in an evolving data stream can be overcome [24],[199]. Conversely, changes in the parameters of a neuralnetwork may be effectively used to weigh the importanceof input features over time [200] or to detect concept drift[201]. Accordingly, we argue that deep learning for streamingdata – in particular strategies for dealing with evolving andheterogeneous tabular data – should receive more attention inthe future.
Transfer Learning for Tabular Data. Reusing knowledgegained solving one problem and applying it to a different taskis the research problem addressed by transfer learning. Whiletransfer learning is successfully used in computer vision andnatural language processing applications [65], there are noefficient and generally accepted ways to do transfer learningfor tabular data. Hence, a general research question can be howto share knowledge between multiple (related) tabular data setsefficiently.
Data Augmentation for Tabular Data. Data augmentationhas proven highly effective to prevent overfitting, especiallyin computer vision [202]. While some data augmentationtechniques for tabular data exist, e.g., SMOTE-NC [203],simple models fail to capture the dependency structure of thedata. Therefore, generating additional samples in a continuouslatent space is a promising direction. This was investigated bythe authors of [116] for minority oversampling. Nevertheless,the reported improvements are only marginal. Thus, future workis required to find simple, yet effective random transformationsto enhance tabular training sets.
Self-supervised Learning. Large-scale labeled data areusually required to train deep neural networks, however, thedata labeling is an expensive task. To avoid this expensivestep, self-supervised methods propose to learn general featurerepresentations from available unlabeled data. These methodshave shown astonishing results in computer vision and naturallanguage processing [204], [205]. Only a few recent works inthis direction [67], [103], [206] deal with heterogeneous data.Hence, novel self-supervised learning approaches dedicated totabular data might be worth investigating.
IX. CONCLUSION
This survey is the first work to systematically explore deepneural network approaches for heterogeneous tabular data. Inthis context, we highlighted the main challenges and researchadvances in modeling, explaining, and generating aspects oftabular data and provided empirical evidence that decisiontree ensembles still represent the state of the art for learningwith tabular data. We also introduced a unified taxonomy thatcategorizes deep learning approaches for tabular data into threebranches: data encoding methods, specialized architecturesmodels, and regularization models. We believe our taxonomywill help catalog future research and better understand andaddress the remaining challenges in applying deep learning totabular data. We hope it will help researchers and practitionersto find the most appropriate strategies and methods for theirapplications.
Additionally, we also conducted a fair evaluation of the state-of-the-art deep learning approaches on multiple real-world datasets. Deep neural network-based methods for heterogeneoustabular data are still inferior to machine learning methodsbased on decision tress ensembles. Furthermore, we assessedexplanation properties of deep learning models with the self-attention mechanism. Although the TabNet model showspromising explanation explanatory capabilities, inconsistenciesbetween the explanations of deep learning methods remain anopen issue.
Due to the importance of tabular data to industry andacademia, new ideas in this area are in high demand andcan have a significant impact. With this review, we hope toprovide interested readers with the references and insights theyneed to address open challenges and advance the field moreeffectively.
REFERENCES
[1] S. Hochreiter and J. Schmidhuber, “Long short-term memory,” Neuralcomputation, vol. 9, no. 8, pp. 1735–1780, 1997.
[2] A. Vaswani, N. Shazeer, N. Parmar, J. Uszkoreit, L. Jones, A. N. Gomez,Ł. Kaiser, and I. Polosukhin, “Attention is all you need,” in Advancesin neural information processing systems, 2017, pp. 5998–6008.
[3] J. Schmidhuber, “Deep learning in neural networks: An overview,”Neural networks, vol. 61, pp. 85–117, 2015.
[4] I. Goodfellow, Y. Bengio, and A. Courville, Deep learning. MIT press,2016.
[5] S. O. Arik and T. Pfister, “TabNet: Attentive interpretable tabularlearning,” 2019.
[6] S. Popov, S. Morozov, and A. Babenko, “Neural oblivious decisionensembles for deep learning on tabular data,” 2019.
[7] R. Shwartz-Ziv and A. Armon, “Tabular Data: Deep Learning is NotAll You Need,” 2021.
[8] A. Kadra, M. Lindauer, F. Hutter, and J. Grabocka, “Regularization isall you Need: Simple Neural Nets can Excel on Tabular Data,” 2021.
[9] G. Somepalli, M. Goldblum, A. Schwarzschild, C. B. Bruss, andT. Goldstein, “SAINT: Improved neural networks for tabular data viarow attention and contrastive pre-training,” 2021.
[10] D. Ulmer, L. Meijerink, and G. Cina, “Trust issues: Uncertaintyestimation does not enable reliable ood detection on medical tabulardata,” in Machine Learning for Health. PMLR, 2020, pp. 341–354.
[11] S. Somani, A. J. Russak, F. Richter, S. Zhao, A. Vaid, F. Chaudhry, J. K.De Freitas, N. Naik, R. Miotto, G. N. Nadkarni et al., “Deep learningand the electrocardiogram: review of the current state-of-the-art,” 2021.
[12] V. Borisov, E. Kasneci, and G. Kasneci, “Robust cognitive load detectionfrom wrist-band sensors,” Computers in Human Behavior Reports, vol. 4,p. 100116, 2021.
[13] J. M. Clements, D. Xu, N. Yousefi, and D. Efimov, “Sequential deeplearning for credit risk monitoring with tabular financial data,” 2020.

SUBMITTED TO THE IEEE, FEBRUARY 2022 17
[14] H. Guo, R. Tang, Y. Ye, Z. Li, and X. He, “Deepfm: a factorization-machine based neural network for ctr prediction,” 2017.
[15] S. Zhang, L. Yao, A. Sun, and Y. Tay, “Deep learning based recom-mender system: A survey and new perspectives,” ACM ComputingSurveys (CSUR), vol. 52, no. 1, pp. 1–38, 2019.
[16] M. Ahmed, H. Afzal, A. Majeed, and B. Khan, “A survey of evolution inpredictive models and impacting factors in customer churn,” Advancesin Data Science and Adaptive Analysis, vol. 9, no. 03, p. 1750007,2017.
[17] Q. Tang, G. Xia, X. Zhang, and F. Long, “A customer churn predictionmodel based on xgboost and mlp,” in 2020 International Conferenceon Computer Engineering and Application (ICCEA). IEEE, 2020, pp.608–612.
[18] A. L. Buczak and E. Guven, “A survey of data mining and machinelearning methods for cyber security intrusion detection,” IEEE Commu-nications surveys & tutorials, vol. 18, no. 2, pp. 1153–1176, 2015.
[19] F. Cartella, O. Anunciacao, Y. Funabiki, D. Yamaguchi, T. Akishita,and O. Elshocht, “Adversarial attacks for tabular data: application tofraud detection and imbalanced data,” CEUR Workshop Proceedings,vol. 2808, 2021.
[20] B. Liu, M. Ding, S. Shaham, W. Rahayu, F. Farokhi, and Z. Lin,“When machine learning meets privacy: A survey and outlook,” ACMComputing Surveys (CSUR), vol. 54, no. 2, pp. 1–36, 2021.
[21] C. J. Urban and K. M. Gates, “Deep learning: A primer for psycholo-gists.” Psychological Methods, 2021.
[22] M. Shoman, A. Aboah, and Y. Adu-Gyamfi, “Deep learning frameworkfor predicting bus delays on multiple routes using heterogenous datasets,”Journal of Big Data Analytics in Transportation, vol. 2, no. 3, pp. 275–290, 2020.
[23] G. Pang, C. Shen, L. Cao, and A. V. D. Hengel, “Deep learning foranomaly detection: A review,” ACM Computing Surveys (CSUR), vol. 54,no. 2, pp. 1–38, 2021.
[24] D. Sahoo, Q. Pham, J. Lu, and S. C. Hoi, “Online deep learning:Learning deep neural networks on the fly,” 2017.
[25] X. He, K. Zhao, and X. Chu, “AutoML: A survey of the state-of-the-art,”Knowledge-Based Systems, vol. 212, p. 106622, 2021.
[26] M. Artzi, E. Redmard, O. Tzemach, J. Zeltser, O. Gropper, J. Roth,B. Shofty, D. A. Kozyrev, S. Constantini, and L. Ben-Sira, “Classificationof pediatric posterior fossa tumors using convolutional neural networkand tabular data,” IEEE Access, vol. 9, pp. 91 966–91 973, 2021.
[27] X. Shi, J. Mueller, N. Erickson, M. Li, and A. Smola, “MultimodalAutoML on structured tables with text fields,” in 8th ICML Workshopon Automated Machine Learning (AutoML), 2021.
[28] R. Fakoor, J. W. Mueller, N. Erickson, P. Chaudhari, and A. J. Smola,“Fast, accurate, and simple models for tabular data via augmenteddistillation,” Advances in Neural Information Processing Systems,vol. 33, 2020.
[29] P. Gijsbers, E. LeDell, J. Thomas, S. Poirier, B. Bischl, and J. Van-schoren, “An open source AutoML benchmark,” 2019.
[30] P. Yin, G. Neubig, W.-t. Yih, and S. Riedel, “TaBERT: Pretraining forjoint understanding of textual and tabular data,” 2020.
[31] Z. Wang, Q. She, and T. E. Ward, “Generative adversarial networks incomputer vision: A survey and taxonomy,” 2019.
[32] T. Baltrusaitis, C. Ahuja, and L.-P. Morency, “Multimodal machinelearning: A survey and taxonomy,” IEEE transactions on pattern analysisand machine intelligence, vol. 41, no. 2, pp. 423–443, 2018.
[33] D. Lichtenwalter, P. Burggraf, J. Wagner, and T. Weißer, “Deepmultimodal learning for manufacturing problem solving,” ProcediaCIRP, vol. 99, pp. 615–620, 2021.
[34] S. Polsterl, T. N. Wolf, and C. Wachinger, “Combining 3d image andtabular data via the dynamic affine feature map transform,” 2021.
[35] D. d. B. Soares, F. Andrieux, B. Hell, J. Lenhardt, J. Badosa, S. Gavoille,S. Gaiffas, and E. Bacry, “Predicting the solar potential of rooftopsusing image segmentation and structured data,” 2021.
[36] D. Medvedev and A. D’yakonov, “New properties of the data distillationmethod when working with tabular data,” 2020.
[37] J. Li, Y. Li, X. Xiang, S.-T. Xia, S. Dong, and Y. Cai, “Tnt: Aninterpretable tree-network-tree learning framework using knowledgedistillation,” Entropy, vol. 22, no. 11, p. 1203, 2020.
[38] D. Roschewitz, M.-A. Hartley, L. Corinzia, and M. Jaggi, “Ifedavg:Interpretable data-interoperability for federated learning,” 2021.
[39] B. I. Grisci, M. J. Krause, and M. Dorn, “Relevance aggregationfor neural networks interpretability and knowledge discovery ontabular data,” Information Sciences, vol. 559, pp. 111–129, 2021.[Online]. Available: https://www.sciencedirect.com/science/article/pii/S0020025521000906
[40] J. T. Hancock and T. M. Khoshgoftaar, “Survey on categorical data forneural networks,” Journal of Big Data, vol. 7, pp. 1–41, 2020.
[41] Y. Gorishniy, I. Rubachev, V. Khrulkov, and A. Babenko, “Revisitingdeep learning models for tabular data,” 2021.
[42] K. He, X. Zhang, S. Ren, and J. Sun, “Deep residual learning for imagerecognition,” in Proceedings of the IEEE conference on computer visionand pattern recognition, 2016, pp. 770–778.
[43] L. Katzir, G. Elidan, and R. El-Yaniv, “Net-DNF: Effective deepmodeling of tabular data,” in International Conference on LearningRepresentations, 2021.
[44] K. Gupta, B. Pesquet-Popescu, F. Kaakai, and J.-C. Pesquet, “Aquantitative analysis of the robustness of neural networks for tabulardata,” in ICASSP 2021 - 2021 IEEE International Conference onAcoustics, Speech and Signal Processing (ICASSP), 2021, pp. 8057–8061.
[45] M. Sahakyan, Z. Aung, and T. Rahwan, “Explainable artificial intelli-gence for tabular data: A survey,” IEEE Access, 2021.
[46] R. U. David M. Lane, Introduction to Statistics. David Lane, 2003.[47] M. W. Cvitkovic et al., “Deep learning in unconventional domains,”
Ph.D. dissertation, California Institute of Technology, 2020.[48] C. L. Giles, C. B. Miller, D. Chen, H.-H. Chen, G.-Z. Sun, and Y.-C.
Lee, “Learning and extracting finite state automata with second-orderrecurrent neural networks,” Neural Computation, vol. 4, no. 3, pp.393–405, 1992.
[49] B. G. Horne and C. L. Giles, “An experimental comparison of recurrentneural networks,” Advances in neural information processing systems,pp. 697–704, 1995.
[50] L. Willenborg and T. De Waal, Statistical disclosure control in practice.Springer Science & Business Media, 1996, vol. 111.
[51] M. Richardson, E. Dominowska, and R. Ragno, “Predicting clicks:estimating the click-through rate for new ads,” in Proceedings of the16th international conference on World Wide Web, 2007, pp. 521–530.
[52] G. Ke, Z. Xu, J. Zhang, J. Bian, and T.-Y. Liu, “Deepgbm: A deeplearning framework distilled by gbdt for online prediction tasks,” inProceedings of the 25th ACM SIGKDD International Conference onKnowledge Discovery & Data Mining, 2019, pp. 384–394.
[53] Z. Wang, Q. She, and J. Zhang, “Masknet: Introducing feature-wisemultiplication to ctr ranking models by instance-guided mask,” 2021.
[54] I. Shavitt and E. Segal, “Regularization learning networks: deep learningfor tabular datasets,” in Advances in Neural Information ProcessingSystems, 2018, pp. 1379–1389.
[55] T. B. Brown, B. Mann, N. Ryder, M. Subbiah, J. Kaplan, P. Dhariwal,A. Neelakantan, P. Shyam, G. Sastry, A. Askell et al., “Language modelsare few-shot learners,” 2020.
[56] A. Dosovitskiy, L. Beyer, A. Kolesnikov, D. Weissenborn, X. Zhai,T. Unterthiner, M. Dehghani, M. Minderer, G. Heigold, S. Gelly,J. Uszkoreit, and N. Houlsby, “An image is worth 16x16 words: Trans-formers for image recognition at scale,” in International Conference onLearning Representations, 2021.
[57] S. Khan, M. Naseer, M. Hayat, S. W. Zamir, F. S. Khan, and M. Shah,“Transformers in vision: A survey,” 2021.
[58] A. Sanchez-Morales, J.-L. Sancho-Gomez, J.-A. Martınez-Garcıa, andA. R. Figueiras-Vidal, “Improving deep learning performance withmissing values via deletion and compensation,” Neural Computing andApplications, vol. 32, no. 17, pp. 13 233–13 244, 2020.
[59] A. F. Karr, A. P. Sanil, and D. L. Banks, “Data quality: A statisticalperspective,” Statistical Methodology, vol. 3, no. 2, pp. 137–173, 2006.
[60] L. Xu and K. Veeramachaneni, “Synthesizing Tabular Data usingGenerative Adversarial Networks,” 2018.
[61] Y. Zhu, T. Brettin, F. Xia, A. Partin, M. Shukla, H. Yoo, Y. A. Evrard,J. H. Doroshow, and R. L. Stevens, “Converting tabular data into imagesfor deep learning with convolutional neural networks,” Scientific Reports,vol. 11, no. 1, pp. 1–11, 2021.
[62] N. Rahaman, A. Baratin, D. Arpit, F. Draxler, M. Lin, F. Hamprecht,Y. Bengio, and A. Courville, “On the spectral bias of neural networks,”in International Conference on Machine Learning. PMLR, 2019, pp.5301–5310.
[63] B. R. Mitchell et al., “The spatial inductive bias of deep learning,” Ph.D.dissertation, Johns Hopkins University, 2017.
[64] L. Perez and J. Wang, “The effectiveness of data augmentation in imageclassification using deep learning,” 2017.
[65] C. Tan, F. Sun, T. Kong, W. Zhang, C. Yang, and C. Liu, “A survey ondeep transfer learning,” in International conference on artificial neuralnetworks. Springer, 2018, pp. 270–279.
[66] D. Shanmugam, D. Blalock, G. Balakrishnan, and J. Guttag, “Whenand why test-time augmentation works,” 2020.

SUBMITTED TO THE IEEE, FEBRUARY 2022 18
[67] J. Yoon, Y. Zhang, J. Jordon, and M. van der Schaar, “Vime: Extendingthe success of self-and semi-supervised learning to tabular domaindim,”Advances in Neural Information Processing Systems, vol. 33, 2020.
[68] E. Fitkov-Norris, S. Vahid, and C. Hand, “Evaluating the impact ofcategorical data encoding and scaling on neural network classificationperformance: the case of repeat consumption of identical cultural goods,”in International Conference on Engineering Applications of NeuralNetworks. Springer, 2012, pp. 343–352.
[69] C. Szegedy, W. Zaremba, I. Sutskever, J. Bruna, D. Erhan, I. Goodfellow,and R. Fergus, “Intriguing properties of neural networks,” 2013.
[70] E. Levy, Y. Mathov, Z. Katzir, A. Shabtai, and Y. Elovici, “Notall datasets are born equal: On heterogeneous data and adversarialexamples,” 2020.
[71] B. Poole, S. Lahiri, M. Raghu, J. Sohl-Dickstein, and S. Ganguli,“Exponential expressivity in deep neural networks through transientchaos,” Advances in neural information processing systems, vol. 29, pp.3360–3368, 2016.
[72] A. Achille, G. Paolini, and S. Soatto, “Where is the information in adeep neural network?” 2019.
[73] C. Cortes and V. Vapnik, “Support-vector networks,” Machine learning,vol. 20, no. 3, pp. 273–297, 1995.
[74] D. Baylor, E. Breck, H.-T. Cheng, N. Fiedel, C. Y. Foo, Z. Haque,S. Haykal, M. Ispir, V. Jain, L. Koc et al., “TFX: A tensorflow-basedproduction-scale machine learning platform,” in Proceedings of the 23rdACM SIGKDD International Conference on Knowledge Discovery andData Mining, 2017, pp. 1387–1395.
[75] D. Micci-Barreca, “A preprocessing scheme for high-cardinality cate-gorical attributes in classification and prediction problems,” SIGKDDExplor., vol. 3, pp. 27–32, 2001.
[76] L. Prokhorenkova, G. Gusev, A. Vorobev, A. V. Dorogush, and A. Gulin,“Catboost: unbiased boosting with categorical features,” in Advances inneural information processing systems, 2018, pp. 6638–6648.
[77] J. H. Friedman, “Stochastic gradient boosting,” Computational statistics& data analysis, vol. 38, no. 4, pp. 367–378, 2002.
[78] B. Sun, L. Yang, W. Zhang, M. Lin, P. Dong, C. Young, and J. Dong,“Supertml: Two-dimensional word embedding for the precognition onstructured tabular data,” in Proceedings of the IEEE/CVF Conferenceon Computer Vision and Pattern Recognition Workshops, 2019, pp. 0–0.
[79] P. Langley and S. Sage, “Oblivious decision trees and abstract cases,”in Working notes of the AAAI-94 workshop on case-based reasoning.Seattle, WA, 1994, pp. 113–117.
[80] B. Peters, V. Niculae, and A. F. Martins, “Sparse sequence-to-sequencemodels,” 2019.
[81] N. Frosst and G. Hinton, “Distilling a neural network into a soft decisiontree,” 2017.
[82] Y. LeCun and C. Cortes, “MNIST handwritten digit database,” 2010.[Online]. Available: http://yann.lecun.com/exdb/mnist/
[83] H. Luo, F. Cheng, H. Yu, and Y. Yi, “SDTR: Soft Decision TreeRegressor for Tabular Data,” IEEE Access, vol. 9, pp. 55 999–56 011,2021.
[84] T. Chen and C. Guestrin, “Xgboost: A scalable tree boosting system,”in Proceedings of the 22nd ACM SIGKDD International Conferenceon Knowledge Discovery and Data Mining (KDD), 2016, pp. 785–794.
[85] Z. Liu, Q. Liu, H. Zhang, and Y. Chen, “Dnn2lr: Interpretation-inspiredfeature crossing for real-world tabular data,” 2020.
[86] H.-T. Cheng, L. Koc, J. Harmsen, T. Shaked, T. Chandra, H. Aradhye,G. Anderson, G. Corrado, W. Chai, M. Ispir et al., “Wide & deeplearning for recommender systems,” in Proceedings of the 1st workshopon deep learning for recommender systems, 2016, pp. 7–10.
[87] C. Guo and F. Berkhahn, “Entity embeddings of categorical variables,”2016.
[88] S. Rendle, “Factorization machines,” in 2010 IEEE Internationalconference on data mining. IEEE, 2010, pp. 995–1000.
[89] Y. Luo, H. Zhou, W.-W. Tu, Y. Chen, W. Dai, and Q. Yang, “Networkon network for tabular data classification in real-world applications,”in Proceedings of the 43rd International ACM SIGIR Conference onResearch and Development in Information Retrieval, 2020, pp. 2317–2326.
[90] F. Moosmann, B. Triggs, and F. Jurie, “Fast discriminative visualcodebooks using randomized clustering forests,” in Twentieth AnnualConference on Neural Information Processing Systems (NIPS’06). MITPress, 2006, pp. 985–992.
[91] X. He, J. Pan, O. Jin, T. Xu, B. Liu, T. Xu, Y. Shi, A. Atallah,R. Herbrich, S. Bowers et al., “Practical lessons from predictingclicks on ads at facebook,” in Proceedings of the Eighth InternationalWorkshop on Data Mining for Online Advertising, 2014, pp. 1–9.
[92] G. Ke, J. Zhang, Z. Xu, J. Bian, and T.-Y. Liu, “TabNN: A universalneural network solution for tabular data,” 2018. [Online]. Available:https://openreview.net/forum?id=r1eJssCqY7
[93] S. Ivanov and L. Prokhorenkova, “Boost then Convolve: GradientBoosting Meets Graph Neural Networks,” 2021.
[94] F. Scarselli, M. Gori, A. C. Tsoi, M. Hagenbuchner, and G. Monfardini,“The graph neural network model,” IEEE transactions on neuralnetworks, vol. 20, no. 1, pp. 61–80, 2008.
[95] C. Wang, M. Li, and A. J. Smola, “Language models with transformers,”2019.
[96] A. F. T. Martins and R. F. Astudillo, “From softmax to sparsemax: Asparse model of attention and multi-label classification,” 2016.
[97] S. Boughorbel, F. Jarray, and A. Kadri, “Fairness in tabnet modelby disentangled representation for the prediction of hospital no-show,”2021.
[98] N. Mehrabi, F. Morstatter, N. Saxena, K. Lerman, and A. Galstyan,“A survey on bias and fairness in machine learning,” ACM ComputingSurveys (CSUR), vol. 54, no. 6, pp. 1–35, 2021.
[99] X. Huang, A. Khetan, M. Cvitkovic, and Z. Karnin, “TabTransformer:Tabular Data Modeling Using Contextual Embeddings,” 2020.
[100] S. Cai, K. Zheng, G. Chen, H. Jagadish, B. C. Ooi, and M. Zhang,“Arm-net: Adaptive relation modeling network for structured data,” inProceedings of the 2021 International Conference on Management ofData, 2021, pp. 207–220.
[101] S. Yun, D. Han, S. J. Oh, S. Chun, J. Choe, and Y. Yoo, “Cutmix:Regularization strategy to train strong classifiers with localizablefeatures,” in Proceedings of the IEEE/CVF International Conferenceon Computer Vision, 2019, pp. 6023–6032.
[102] H. Zhang, M. Cisse, Y. N. Dauphin, and D. Lopez-Paz, “mixup: Beyondempirical risk minimization,” 2017.
[103] D. Bahri, H. Jiang, Y. Tay, and D. Metzler, “SCARF: Self-supervisedcontrastive learning using random feature corruption,” 2021.
[104] J. Lian, X. Zhou, F. Zhang, Z. Chen, X. Xie, and G. Sun, “xdeepfm:Combining explicit and implicit feature interactions for recommendersystems,” in Proceedings of the 24th ACM SIGKDD InternationalConference on Knowledge Discovery & Data Mining, 2018, pp. 1754–1763.
[105] V. Borisov, J. Haug, and G. Kasneci, “CancelOut: A layer for featureselection in deep neural networks,” in International Conference onArtificial Neural Networks. Springer, 2019, pp. 72–83.
[106] G. Valdes, W. Arbelo, Y. Interian, and J. H. Friedman, “Lockout: Sparseregularization of neural networks,” 2021.
[107] J. Fiedler, “Simple modifications to improve tabular neural networks,”2021.
[108] K. Lounici, K. Meziani, and B. Riu, “Muddling label regularization:Deep learning for tabular datasets,” arXiv preprint arXiv:2106.04462,2021.
[109] S. Lundberg and S.-I. Lee, “A unified approach to interpreting modelpredictions,” NeurIPS, 2017.
[110] H. Chen, S. Jajodia, J. Liu, N. Park, V. Sokolov, and V. Subrahmanian,“Faketables: Using gans to generate functional dependency preservingtables with bounded real data.” in IJCAI, 2019, pp. 2074–2080.
[111] L. Gondara and K. Wang, “Mida: Multiple imputation using denoisingautoencoders,” in Pacific-Asia conference on knowledge discovery anddata mining. Springer, 2018, pp. 260–272.
[112] R. D. Camino, C. Hammerschmidt et al., “Working with deep generativemodels and tabular data imputation,” ICML 2020 Artemiss Workshop,2020.
[113] J. Engelmann and S. Lessmann, “Conditional wasserstein gan-basedoversampling of tabular data for imbalanced learning,” Expert Systemswith Applications, vol. 174, p. 114582, 2021.
[114] M. Quintana and C. Miller, “Towards class-balancing human comfortdatasets with gans,” in Proceedings of the 6th ACM InternationalConference on Systems for Energy-Efficient Buildings, Cities, andTransportation, 2019, pp. 391–392.
[115] A. Koivu, M. Sairanen, A. Airola, and T. Pahikkala, “Synthetic minorityoversampling of vital statistics data with generative adversarial networks,”Journal of the American Medical Informatics Association, vol. 27, no. 11,pp. 1667–1674, 2020.
[116] S. Darabi and Y. Elor, “Synthesising multi-modal minority samples fortabular data,” 2021.
[117] E. Choi, S. Biswal, B. Malin, J. Duke, W. F. Stewart, and J. Sun,“Generating Multi-label Discrete Patient Records using GenerativeAdversarial Networks,” Machine learning for healthcare conference,pp. 286–305, 2017.

SUBMITTED TO THE IEEE, FEBRUARY 2022 19
[118] J. Fan, J. Chen, T. Liu, Y. Shen, G. Li, and X. Du, “Relationaldata synthesis using generative adversarial networks: A design spaceexploration,” Proc. VLDB Endow., vol. 13, no. 12, p. 1962–1975, Jul.2020.
[119] S. Kamthe, S. Assefa, and M. Deisenroth, “Copula flows for syntheticdata generation,” 2021.
[120] T. Karras, S. Laine, M. Aittala, J. Hellsten, J. Lehtinen, and T. Aila,“Analyzing and improving the image quality of stylegan,” in Proceed-ings of the IEEE/CVF Conference on Computer Vision and PatternRecognition, 2020, pp. 8110–8119.
[121] K. Lin, D. Li, X. He, Z. Zhang, and M.-T. Sun, “Adversarial rankingfor language generation,” Advances in Neural Information ProcessingSystems, 2017.
[122] S. Subramanian, S. Rajeswar, F. Dutil, C. Pal, and A. Courville,“Adversarial generation of natural language,” in Proceedings of the2nd Workshop on Representation Learning for NLP, 2017, pp. 241–251.
[123] N. Patki, R. Wedge, and K. Veeramachaneni, “The synthetic data vault,”in 2016 IEEE International Conference on Data Science and AdvancedAnalytics (DSAA). IEEE, 2016, pp. 399–410.
[124] Z. Li, Y. Zhao, and J. Fu, “Sync: A copula based framework for gener-ating synthetic data from aggregated sources,” in 2020 InternationalConference on Data Mining Workshops (ICDMW). IEEE, 2020, pp.571–578.
[125] J. Zhang, G. Cormode, C. M. Procopiuc, D. Srivastava, and X. Xiao,“Privbayes: Private data release via bayesian networks,” ACM Transac-tions on Database Systems (TODS), vol. 42, no. 4, pp. 1–41, 2017.
[126] C. Chow and C. Liu, “Approximating discrete probability distributionswith dependence trees,” IEEE transactions on Information Theory,vol. 14, no. 3, pp. 462–467, 1968.
[127] I. J. Goodfellow, J. Pouget-Abadie, M. Mirza, B. Xu, D. Warde-Farley,S. Ozair, A. Courville, and Y. Bengio, “Generative adversarial networks,”2014.
[128] A. Radford, L. Metz, and S. Chintala, “Unsupervised representationlearning with deep convolutional generative adversarial networks,” in4th International Conference on Learning Representations, ICLR 2016,2016.
[129] M. Arjovsky, S. Chintala, and L. Bottou, “Wasserstein generativeadversarial networks,” in International conference on machine learning.PMLR, 2017, pp. 214–223.
[130] I. Gulrajani, F. Ahmed, M. Arjovsky, V. Dumoulin, and A. Courville,“Improved training of wasserstein gans,” in Proceedings of the 31stInternational Conference on Neural Information Processing Systems,2017, pp. 5769–5779.
[131] M. G. Bellemare, I. Danihelka, W. Dabney, S. Mohamed, B. Lakshmi-narayanan, S. Hoyer, and R. Munos, “The cramer distance as a solutionto biased wasserstein gradients,” 2017.
[132] R. D. Hjelm, A. P. Jacob, T. Che, A. Trischler, K. Cho, and Y. Ben-gio, “Boundary-seeking generative adversarial networks,” InternationalConference on Learning Representations, 2018.
[133] A. Srivastava, L. Valkov, C. Russell, M. U. Gutmann, and C. Sutton,“Veegan: Reducing mode collapse in gans using implicit variationallearning,” in Proceedings of the 31st International Conference on NeuralInformation Processing Systems, 2017, pp. 3310–3320.
[134] D. P. Kingma and M. Welling, “Auto-encoding variational bayes,” 2ndInternational Conference on Learning Representations, ICLR 2014 -Conference Track Proceedings, no. Ml, pp. 1–14, 2014.
[135] C. Ma, S. Tschiatschek, R. Turner, J. M. Hernandez-Lobato, andC. Zhang, “Vaem: a deep generative model for heterogeneous mixedtype data,” Advances in Neural Information Processing Systems, vol. 33,2020.
[136] L. Xu, M. Skoularidou, A. Cuesta-Infante, and K. Veeramachaneni,“Modeling tabular data using conditional GAN,” Advances in NeuralInformation Processing Systems, vol. 32, no. NeurIPS, 2019.
[137] N. Park, M. Mohammadi, K. Gorde, S. Jajodia, H. Park, and Y. Kim,“Data synthesis based on generative adversarial networks,” Proceedingsof the VLDB Endowment, vol. 11, no. 10, pp. 1071–1083, 2018.
[138] E. Jang, S. Gu, and B. Poole, “Categorical reparameterization withgumbel-softmax,” in International Conference on Learning Representa-tions, 2017.
[139] B. Wen, L. O. Colon, K. Subbalakshmi, and R. Chandramouli, “Causal-TGAN: Generating tabular data using causal generative adversarialnetworks,” 2021.
[140] J. Jordon, J. Yoon, and M. Van Der Schaar, “Pate-gan: Generatingsynthetic data with differential privacy guarantees,” in Internationalconference on learning representations, 2018.
[141] A. Mottini, A. Lheritier, and R. Acuna-Agost, “Airline Passenger NameRecord Generation using Generative Adversarial Networks,” 2018.
[142] R. Camino, C. Hammerschmidt, and R. State, “Generating multi-categorical samples with generative adversarial networks,” ICML work-shop on Theoretical Foundations and Applications of Deep GenerativeModels, 2018.
[143] M. K. Baowaly, C. C. Lin, C. L. Liu, and K. T. Chen, “Synthesiz-ing electronic health records using improved generative adversarialnetworks,” Journal of the American Medical Informatics Association,vol. 26, no. 3, pp. 228–241, 2019.
[144] L. V. H. Vardhan and S. Kok, “Generating privacy-preserving synthetictabular data using oblivious variational autoencoders,” in Proceedingsof the Workshop on Economics of Privacy and Data Labor at the 37th International Conference on Machine Learning, 2020.
[145] Z. Zhao, A. Kunar, H. Van der Scheer, R. Birke, and L. Y. Chen,“Ctab-gan: Effective table data synthesizing,” 2021.
[146] F. J. Massey Jr, “The kolmogorov-smirnov test for goodness of fit,”Journal of the American statistical Association, vol. 46, no. 253, pp.68–78, 1951.
[147] R. Guidotti, A. Monreale, S. Ruggieri, F. Turini, F. Giannotti, andD. Pedreschi, “A survey of methods for explaining black box models,”ACM Comput. Surv., vol. 51, no. 5, 2018.
[148] K. Gade, S. C. Geyik, K. Kenthapadi, V. Mithal, and A. Taly,“Explainable ai in industry,” in Proceedings of the ACM SIGKDDInternational Conference on Knowledge Discovery and Data Mining(KDD), 2019.
[149] Y. Lou, R. Caruana, and J. Gehrke, “Intelligible models for classificationand regression,” in Proceedings of the ACM SIGKDD InternationalConference on Knowledge Discovery and Data Mining (KDD), 2012.
[150] D. Alvarez-Melis and T. S. Jaakkola, “Towards robust interpretabilitywith self-explaining neural networks,” NeurIPS, 2018.
[151] D. Wang, Q. Yang, A. Abdul, and B. Y. Lim, “Designing theory-drivenuser-centric explainable ai,” in CHI, 2019.
[152] S. Bach, A. Binder, G. Montavon, F. Klauschen, K.-R. Muller,and W. Samek, “On pixel-wise explanations for non-linear classifierdecisions by layer-wise relevance propagation,” PloS one, vol. 10, no. 7,p. e0130140, 2015.
[153] G. Montavon, A. Binder, S. Lapuschkin, W. Samek, and K.-R. Muller,“Layer-wise relevance propagation: an overview,” Explainable AI:interpreting, explaining and visualizing deep learning, pp. 193–209,2019.
[154] G. Kasneci and T. Gottron, “Licon: A linear weighting scheme for thecontribution ofinput variables in deep artificial neural networks,” inCIKM, 2016.
[155] M. Sundararajan, A. Taly, and Q. Yan, “Axiomatic attribution for deepnetworks,” in International Conference on Machine Learning. PMLR,2017, pp. 3319–3328.
[156] A. Chattopadhay, A. Sarkar, P. Howlader, and V. N. Balasubrama-nian, “Grad-cam++: Generalized gradient-based visual explanations fordeep convolutional networks,” in 2018 IEEE Winter Conference onApplications of Computer Vision (WACV). IEEE, 2018.
[157] M. T. Ribeiro, S. Singh, and C. Guestrin, “” why should i trust you?”explaining the predictions of any classifier,” in Proceedings of the 22ndACM SIGKDD international conference on knowledge discovery anddata mining, 2016, pp. 1135–1144.
[158] ——, “Anchors: High-precision model-agnostic explanations,” in AAAI,2018.
[159] S. M. Lundberg, G. Erion, H. Chen, A. DeGrave, J. M. Prutkin,B. Nair, R. Katz, J. Himmelfarb, N. Bansal, and S.-I. Lee, “Fromlocal explanations to global understanding with explainable ai for trees,”Nature machine intelligence, 2020.
[160] J. Haug, S. Zurn, P. El-Jiz, and G. Kasneci, “On baselines for localfeature attributions,” 2021.
[161] Y. Liu, S. Khandagale, C. White, and W. Neiswanger, “Syntheticbenchmarks for scientific research in explainable machine learning,”2021.
[162] B. Ustun, A. Spangher, and Y. Liu, “Actionable recourse in linearclassification,” in (FAT*), 2019.
[163] C. Russell, “Efficient search for diverse coherent explanations,” in(FAT*), 2019.
[164] K. Rawal and H. Lakkaraju, “Beyond individualized recourse: Inter-pretable and interactive summaries of actionable recourses,” in NeurIPS,2020.
[165] A.-H. Karimi, G. Barthe, B. Balle, and I. Valera, “Model-agnosticcounterfactual explanations for consequential decisions,” in AISTATS,2020.
[166] A. Dhurandhar, P.-Y. Chen, R. Luss, C.-C. Tu, P. Ting, K. Shanmugam,and P. Das, “Explanations based on the missing: Towards contrastive ex-

SUBMITTED TO THE IEEE, FEBRUARY 2022 20
planations with pertinent negatives,” in Advances in Neural InformationProcessing Systems (NeurIPS), 2018.
[167] B. Mittelstadt, C. Russell, and S. Wachter, “Explaining explanations inai,” in Proceedings of the conference on fairness, accountability, andtransparency, 2019.
[168] R. K. Mothilal, A. Sharma, and C. Tan, “Explaining machine learningclassifiers through diverse counterfactual explanations,” in FAT*, 2020.
[169] M. Pawelczyk, K. Broelemann, and G. Kasneci, “Learning model-agnostic counterfactual explanations for tabular data,” in The WebConference 2020 (WWW). ACM, 2020.
[170] M. Downs, J. L. Chu, Y. Yacoby, F. Doshi-Velez, and W. Pan, “Cruds:Counterfactual recourse using disentangled subspaces,” ICML Workshopon Human Interpretability in Machine Learning (WHI 2020), 2020.
[171] S. Joshi, O. Koyejo, W. Vijitbenjaronk, B. Kim, and J. Ghosh, “Towardsrealistic individual recourse and actionable explanations in black-boxdecision making systems,” arXiv preprint arXiv:1907.09615, 2019.
[172] D. Mahajan, C. Tan, and A. Sharma, “Preserving causal constraintsin counterfactual explanations for machine learning classifiers,” arXivpreprint arXiv:1912.03277, 2019.
[173] M. Pawelczyk, K. Broelemann, and G. Kasneci, “On counterfactualexplanations under predictive multiplicity,” in UAI. PMLR, 2020.
[174] J. Antoran, U. Bhatt, T. Adel, A. Weller, and J. M. Hernandez-Lobato,“Getting a clue: A method for explaining uncertainty estimates,” ICLR,2021.
[175] A. Nazabal, P. M. Olmos, Z. Ghahramani, and I. Valera, “Handlingincomplete heterogeneous data using vaes,” Pattern Recognition, 2020.
[176] A.-H. Karimi, G. Barthe, B. Scholkopf, and I. Valera, “A survey ofalgorithmic recourse: definitions, formulations, solutions, and prospects,”arXiv preprint arXiv:2010.04050, 2020.
[177] S. Verma, J. Dickerson, and K. Hines, “Counterfactual explanations formachine learning: A review,” 2020.
[178] M. Pawelczyk, S. Bielawski, J. van den Heuvel, T. Richter, andG. Kasneci, “Carla: A python library to benchmark algorithmic recourseand counterfactual explanation algorithms,” 2021.
[179] A. Krizhevsky, “Learning multiple layers of features from tiny images,”2009.
[180] J. Deng, W. Dong, R. Socher, L.-J. Li, K. Li, and L. Fei-Fei, “Imagenet:A large-scale hierarchical image database,” in 2009 IEEE conferenceon computer vision and pattern recognition. Ieee, 2009, pp. 248–255.
[181] D. Dua and C. Graff, “UCI machine learning repository,” 2017.[Online]. Available: http://archive.ics.uci.edu/ml
[182] R. K. Pace and R. Barry, “Sparse spatial autoregressions,” Statistics &Probability Letters, vol. 33, no. 3, pp. 291–297, 1997.
[183] E. Fix, Discriminatory analysis: nonparametric discrimination, consis-tency properties. USAF school of Aviation Medicine, 1951.
[184] L. Breiman, J. H. Friedman, R. A. Olshen, and C. J. Stone, Classificationand regression trees. Routledge, 2017.
[185] L. Breiman, “Random forests,” Machine learning, vol. 45, no. 1, pp.5–32, 2001.
[186] G. Ke, Q. Meng, T. Finley, T. Wang, W. Chen, W. Ma, Q. Ye, andT.-Y. Liu, “Lightgbm: A highly efficient gradient boosting decisiontree,” in Advances in neural information processing systems, 2017, pp.3146–3154.
[187] K. Broelemann and G. Kasneci, “A gradient-based split criterion forhighly accurate and transparent model trees,” in IJCAI, 2019.
[188] W. S. McCulloch and W. Pitts, “A logical calculus of the ideas immanentin nervous activity,” The bulletin of mathematical biophysics, vol. 5,no. 4, pp. 115–133, 1943.
[189] Y. Yamada, O. Lindenbaum, S. Negahban, and Y. Kluger, “Featureselection using stochastic gates,” in Proceedings of Machine Learningand Systems 2020, 2020, pp. 8952–8963.
[190] R. Agarwal, N. Frosst, X. Zhang, R. Caruana, and G. E. Hinton, “Neuraladditive models: Interpretable machine learning with neural nets,” arXivpreprint arXiv:2004.13912, 2020.
[191] T. Akiba, S. Sano, T. Yanase, T. Ohta, and M. Koyama, “Optuna: A next-generation hyperparameter optimization framework,” in Proceedingsof the 25rd ACM SIGKDD International Conference on KnowledgeDiscovery and Data Mining, 2019.
[192] D. Merkel, “Docker: lightweight linux containers for consistent de-velopment and deployment,” Linux journal, vol. 2014, no. 239, p. 2,2014.
[193] C. S. Bojer and J. P. Meldgaard, “Kaggle forecasting competitions: Anoverlooked learning opportunity,” International Journal of Forecasting,vol. 37, no. 2, pp. 587–603, 2021.
[194] Y. Rong, T. Leemann, V. Borisov, G. Kasneci, and E. Kasneci,“Evaluating feature attribution: An information-theoretic perspective,”arXiv preprint arXiv:2202.00449, 2022.
[195] R. Tomsett, D. Harborne, S. Chakraborty, P. Gurram, and A. Preece,“Sanity checks for saliency metrics,” in Proceedings of the AAAIConference on Artificial Intelligence, vol. 34, no. 04, 2020, pp. 6021–6029.
[196] E. Ntoutsi, P. Fafalios, U. Gadiraju, V. Iosifidis, W. Nejdl, M.-E. Vidal,S. Ruggieri, F. Turini, S. Papadopoulos, E. Krasanakis et al., “Biasin data-driven artificial intelligence systems—an introductory survey,”Wiley Interdisciplinary Reviews: Data Mining and Knowledge Discovery,vol. 10, no. 3, p. e1356, 2020.
[197] P. Domingos and G. Hulten, “Mining high-speed data streams,” inProceedings of the sixth ACM SIGKDD international conference onKnowledge discovery and data mining, 2000, pp. 71–80.
[198] C. Manapragada, G. I. Webb, and M. Salehi, “Extremely fast decisiontree,” in Proceedings of the 24th ACM SIGKDD International Confer-ence on Knowledge Discovery & Data Mining, 2018, pp. 1953–1962.
[199] P. Duda, M. Jaworski, A. Cader, and L. Wang, “On training deep neuralnetworks using a streaming approach,” Journal of Artificial Intelligenceand Soft Computing Research, vol. 10, 2020.
[200] J. Haug, M. Pawelczyk, K. Broelemann, and G. Kasneci, “Leveragingmodel inherent variable importance for stable online feature selection,”in Proceedings of the 26th ACM SIGKDD International Conference onKnowledge Discovery & Data Mining, 2020, pp. 1478–1502.
[201] J. Haug and G. Kasneci, “Learning parameter distributions to detectconcept drift in data streams,” in 2020 25th International Conferenceon Pattern Recognition (ICPR). IEEE, 2021, pp. 9452–9459.
[202] C. Shorten and T. M. Khoshgoftaar, “A survey on image dataaugmentation for deep learning,” Journal of Big Data, vol. 6, no. 1, pp.1–48, 2019.
[203] N. V. Chawla, K. W. Bowyer, L. O. Hall, and W. P. Kegelmeyer,“Smote: synthetic minority over-sampling technique,” Journal of artificialintelligence research, vol. 16, pp. 321–357, 2002.
[204] L. Jing and Y. Tian, “Self-supervised visual feature learning with deepneural networks: A survey,” IEEE transactions on pattern analysis andmachine intelligence, 2020.
[205] X. Liu, F. Zhang, Z. Hou, L. Mian, Z. Wang, J. Zhang, and J. Tang,“Self-supervised learning: Generative or contrastive,” IEEE Transactionson Knowledge and Data Engineering, 2021.
[206] T. Ucar, E. Hajiramezanali, and L. Edwards, “Subtab: Subsetting featuresof tabular data for self-supervised representation learning,” Advancesin Neural Information Processing Systems, vol. 34, 2021.