Huntingtin inclusions do not deplete polyglutamine-containing transcription factors in HD mice
Upload
independentCategory
view
0download
0
and Subramaniam GaneshParihar, Vibha Dwivedi, Subhash C. Lakhotia Amit Kumar, Pankaj Kumar Singh, Rashmi exon1 protein fragmentfrom cytotoxicity mediated by huntingtin Decreased O-linked GlcNAcylation protectsMolecular Bases of Disease:
published online March 19, 2014J. Biol. Chem.
10.1074/jbc.M114.553321Access the most updated version of this article at doi:
.JBC Affinity SitesFind articles, minireviews, Reflections and Classics on similar topics on the
Alerts:
When a correction for this article is posted•
When this article is cited•
to choose from all of JBC's e-mail alertsClick here
http://www.jbc.org/content/early/2014/03/19/jbc.M114.553321.full.html#ref-list-1
This article cites 0 references, 0 of which can be accessed free at
by guest on March 20, 2014
http://ww
w.jbc.org/
Dow
nloaded from
by guest on March 20, 2014
http://ww
w.jbc.org/
Dow
nloaded from
Decreasing O-linked GlcNAcylation increases basal autophagic flux
1
Decreased O-linked GlcNAcylation Protects from Cytotoxicity Mediated by Huntingtin Exon1 Protein Fragment*
Amit Kumar1,3,4, Pankaj Kumar Singh1,3,5 Rashmi Parihar1,3, Vibha Dwivedi2,3, Subhash C.
Lakhotia2 and Subramaniam Ganesh1,6
From the 1Department of Biological Sciences and Bioengineering, Indian Institute of Technology, Kanpur, India;
2Cytogenetics Laboratory, Department of Zoology, Banaras Hindu University, Varanasi, India
3These authors contributed equally and should be considered as joint first authors
Running Title: Decreasing O-linked GlcNAcylation increases basal autophagic flux 6To whom correspondence should be addressed: Subramaniam Ganesh, Department of Biological Sciences and Bioengineering, Indian Institute of Technology, Kanpur 208016, India; Tel (+91) 512 259 4040; Fax (+91) 512 259 4010; Email: [email protected] Key words: O-GlcNAcylation; Autophagy; Huntington’s disease
Background: Earlier reports indicate that O-GlcNAcylation might be protective in neurodegenerative disorders.
Results: Suppressing O-GlcNAcylation modulates autophagy to enhance the viability of neuronal cells expressing cytotoxic mutant huntingtin exon 1 protein (mHtt).
Conclusion: O-GlcNAcylation regulates the clearance of mHtt by modulating the fusion of autophagosomes with lysosomes.
Significance: This regulatory mechanism emerges as a novel therapeutic strategy for Huntington’s disease.
ABSTRACT
O-GlcNAcylation is an important post-translational modification of proteins and is known to regulate a number of pathways involved in cellular homeostasis. This involves dynamic and reversible modification of serine/threonine residues of different cellular proteins catalyzed by O-linked N-acetylglucosaminyltransferase (OGT) and O-linked N-acetylglucosaminidase (OGA) in antagonistic manner. We report here that decreasing O-
GlcNAcylation enhances viability of neuronal cells expressing polyglutamine expanded huntingtin exon 1 protein fragment (mHtt). We further show that O-GlcNAcylation regulates the basal autophagic process and that suppression of O-GlcNAcylation significantly increases autophagic flux by enhancing the fusion of autophagosome with lysosome. This regulation considerably reduces toxic mHtt aggregates in eye imaginal discs, and partially restores rhabdomere morphology and vision in a fly model for Huntington’s disease. The present study is significant in unravelling O-GlcNAcylation-dependent regulation of autophagic process in mediating mHtt toxicity. Therefore, targeting autophagic process through the suppression of O-GlcNAcylation may prove to be an important therapeutic target in Huntington disease.
INTRODUCTION O-GlcNAcylation is a glucose dependent post-translational modification (PTM). When glucose enters the cell, approximately 5% of it enters into the
http://www.jbc.org/cgi/doi/10.1074/jbc.M114.553321The latest version is at JBC Papers in Press. Published on March 19, 2014 as Manuscript M114.553321
Copyright 2014 by The American Society for Biochemistry and Molecular Biology, Inc.
by guest on March 20, 2014
http://ww
w.jbc.org/
Dow
nloaded from
Decreasing O-linked GlcNAcylation increases basal autophagic flux
2
Hexosamine biosynthetic pathway (HBP) through a series of metabolic transformation and finally gets transformed into uridine 5’-diphospho-N-acetyl glucosamine (UDP-GlcNAc) (1). This final product of HBP, amongst other functions, acts as a substrate of O-linked GlcNAcylation and is utilized by two antagonistic enzymes, O-linked N-acetylglucosaminyltransferase (OGT) and O-linked N-acetylglucosaminidase (OGA), which regulate the dynamic modification of different nucleo-cytoplasmic proteins. OGT catalyzes the addition of a single GlcNAc moiety to serine and/or threonine sites of various proteins while OGA removes the same (2). O-GlcNAcylation has been shown to regulate many vital biological processes such as replication, transcription, translation, stress response, nutrient response, unfolded protein response, and intra-cellular protein trafficking (3-5). It is also emerging as an important regulatory mechanism in a number of complex diseases such as diabetes, cancer, cardiovascular diseases, and in ageing (5). OGT activity has been reported to be about 10 times more enriched in brain as compared to other tissues like liver, muscle, adipose and heart (6) and has been shown to glycosylate many proteins linked to neurodegenerative diseases such as, amyloid precursor protein, β amyloid associated protein (7), microtubule associated tau protein (8), synapsin (9) and neurofilament proteins (10). Recently, OGT was reported to play a protective role in Alzheimer’s disease (11) and is speculated to be protective in other neurodegenerative disorders such as Huntington’s disease, Parkinson’s disease and Amyotrophic Lateral Sclerosis (ALS).
Huntington’s disease is a neurodegenerative disorder characterized by the formation of intracellular aggregates of mutant huntingtin (mHtt) (12, 13). The normal huntingtin gene codes for the huntingtin protein, which usually has up to 34 glutamine coding (CAG)
repeat (12, 13). The huntingtin protein having up to 34 glutamine repeats represents a normal functional protein, while expansion of CAG repeats coding for >40 glutamine as a repeat track results in a dominant mutation, as a consequence of which the mutant Htt loses its proper folding state, tends to aggregate and becomes cytotoxic (12, 13). The wild-type huntingtin protein plays important roles in normal functioning of brain such as vesicular transport, neuronal gene transcription, BDNF production (14), and may also function as an anti-apoptotic protein (15). The mHtt aggregates interfere with normal synaptic transmission (16), impair axonal transport of mitochondria (17), sequester crucial transcription factors (18) and hamper their functioning.
O-GlcNAcylation is a nutrient sensitive protein modification. With the emerging understanding of the important roles of O-GlcNAcylation in various neurodegenerative disorders along with reports about glucose-dependent regulation of protein clearance machineries (19, 20) and that of protein aggregation mediated toxicity (21, 22), we aimed to explore the role of this glucose-dependent post-translational modification in the regulation of mHtt-mediated toxicity and its clearance. We report here that suppression of O-GlcNAcylation increases basal autophagy flux by enhancing autophagosome-lysosome fusion and helps in the clearance of toxic aggregates of mutant huntingtin exon 1 coded protein, thereby increasing survival and suppressing the degenerative phenotypes in cellular and Huntington fly models, respectively.
EXPERIMENTAL PROCEDURES
Reagents and antibodies − Cell culture media and drugs (Azaserine, Glucosamine, 3-Methyladenine, and Bafilomycin A1) were purchased from Sigma Aldrich Pvt. Ltd., India. Polyfect transfection reagent was from QIAGEN India Pvt. Ltd., India.
by guest on March 20, 2014
http://ww
w.jbc.org/
Dow
nloaded from
Decreasing O-linked GlcNAcylation increases basal autophagic flux
3
Antibodies were procured from following sources: Anti-LC3 and Anti-Myc for immunostaining (Cell Signaling Technology, USA); Anti-p62 (Enzo Life Sciences, USA); Anti-GFP and Anti-Myc for immunoblots (Roche, India); Anti-HA (used in experiments done in Neuro2A cell) (Sigma-Aldrich Pvt. Limited, India), Anti-O-GlcNAc and Anti-γ-tubulin (Sigma-Aldrich Pvt. Limited, India). Rabbit polyclonal anti-haemagglutinin (used in experiments with Drosophila) (Santa Cruz, USA), Secondary antibodies were procured from Jackson ImmunoResearch Inc., USA, except Anti-rabbit conjugated with Cy3 (Sigma-Aldrich, India) and Alex-Fluor 488 (Molecular Probes, USA).
Expression constructs − Mammalian expression constructs were obtained from following sources: The GFP-tagged truncated Huntingtin Q97 expression vector was generously provided by Dr Lawrence Marsh (University of California, Irvine, CA, USA). Plasmid coding for OGA (Myc-tagged) was a kind gift from Dr John A Hannover (NIDDK, National Institutes of Health, USA), the HA-tagged-OGT was gifted by Dr Gerald W. Hart (Johns Hopkins University School of Medicine, Baltimore, USA), the mRFP-GFP-LC3 construct was gifted by Dr T. Yoshimori (National Institute for Basic Biology, Okazaki, Japan), and construct coding for the mutant form of α-synuclein as GFP fusion was a gift from Dr. Peter Lansbury (Harvard Medical School, USA).
Cell culture, treatment and transfection − The experiments were conducted in the murine neuroblastoma cell line Neuro2A under normal glucose conditions (25 mM). Neuro2A cells were grown in Dulbecco’s modified Eagle’s medium (Sigma-Aldrich Pvt. Limited, India) supplemented with 10% (v/v) fetal calf serum, 100 U/ml penicillin and 100 µg/ml streptomycin. The cells were treated with 40 µM azaserine (inhibitor of O-GlcNAcylation), 10 mM glucosamine (inducer of O-
GlcNAcylation), 100 nM Bafilomycin A1 (inhibitor of the fusion of autophagosomes with lysosomes) and 10 mM 3-Methyladenine (3MA; an inhibitor of autophagosome formation). The cells were transiently transfected with expression constructs at around 50% of confluence using PolyFect Transfection Reagent (QIAGEN India Pvt. Ltd) as recommended by the manufacturer. Under these conditions the transfection efficiency was consistent and around 70% as assessed by microscopic observation of the fluorescence positive cells transiently expressing the GFP-tagged protein. In all the experiments, the cells were harvested at 36 hrs post-transfection and wherever required, treatment with the pharmacological agents was given for the last 12 hrs unless stated otherwise.
Fly stocks and rearing condition − All fly stocks were maintained under un-crowded condition at 240C±10C. For each experiment, regular or azaserine (250µg/ml) supplemented food was prepared from the same batch. Using the w1118; UAS-httex1p Q93/CyO (20) and w1118; GMR-GAL4 (21) fly stocks, appropriate genetic crosses were set to obtain w1118; UAS-httex1p Q93/GMR-GAL4 (GMR-GAL4>UAS-httex1p) progeny. The GMR-GAL4 driver targets expression of the UAS-httex1pQ93 transgene in developing eye discs (23) and thereby induce retinal neurodegeneration (24). In some cases, Oregon R+ stock was used as wild type. Freshly hatched larvae for a given experiment were derived from a common pool of eggs of the desired genotype and reared in parallel on regular or azaserine supplemented food.
We also reared larvae on food supplemented with glucosamine (1 mg/ml, 10 mg/ml or 25 mg/ml). However, in each case, all the larvae died before reaching 3rd instar stage and therefore, no further studies on the effect of glucosamine on polyglutamine (polyQ) degeneration in the fly model could be carried out.
by guest on March 20, 2014
http://ww
w.jbc.org/
Dow
nloaded from
Decreasing O-linked GlcNAcylation increases basal autophagic flux
4
Immunostaining − Cells on coverslip were fixed with 4% paraformaldehyde in 1X PBS for 20 minutes followed by permeabilization for 5 minutes in 1X PBS with 0.05% Triton X-100. The expression of Myc-OGA and HA-OGT was checked by probing with Anti-Myc or Anti-HA antibodies followed by FITC or TRITC conjugated secondary antibodies, respectively. Nuclei were counterstained with 10µM 4’,6-diamidino-2-phenylindole (DAPI). Images were obtained with a Nikon (Japan) Eclipse 80i fluorescence microscope using a 10X or 40X objective lens.
Eye discs from wandering late third instar GMR-GAL4>UAS-httex1p Q93 larvae reared on normal or azaserine supplemented food were dissected and immunostained as described previously (25) with the anti-HA (1:80 dilution, Santa-Cruze). Chromatin was counterstained with DAPI. Immuno-fluorescence stained eye discs were examined with a Zeiss LSM 510 Meta confocal microscope using appropriate lasers, dichroics and filters.
Cell death assay − For the MTT assay cells were treated with azaserine or glucosamine for 12 hrs or transfected for 36 hrs and thereafter, cells were incubated with 0.5 mg/ml MTT (thiazolyl blue tetrazolium bromide) (Sigma-Aldrich Pvt. Limited, India) and chased for 2 hrs. After removal of the medium, cells were incubated with DMSO (100%) for 10 min to dissolve formazon crystals. The change in optical density was recorded through spectrophotometer at λ570nm against background reading at λ650nm. Alternatively, treated or transfected cells were fixed, permeabilized and stained with DAPI as mentioned for immunostaining, and the apoptotic nuclei were scored in a blinded fashion as reported earlier (26).
Quantification of LC3-positive cytoplasmic puncta - Cells transiently expressing the tandem mRFP-GFP-LC3 construct were
fixed, and the fluorescence images of about 50 cells for each set were examined using a Zeiss AxioImager 2 microscope outfitted with an ApoTome accessory. The green, red and yellow puncta in the captured images were quantified using the Colocalization Macro in ImageJ software, as described (27)
Immunoblotting − Protein samples were resolved on 6-12% SDS-PAGE as required and transferred to nitrocellulose membrane (MDI, India). Thereafter, the membranes were blocked with either 5% non-fat dry milk powder or 5% BSA in 1X TBST and probed sequentially with the desired primary and secondary antibodies at their recommended dilutions followed by detection with a chemiluminescent detection kit (Supersignal West PICO, Pierce, USA).
Filter-trap assay − The filter-trap assay was carried out essentially as described by Juenemann et al. (28). Briefly, the pellet fraction of the cell lysate was suspended in the benzonase buffer (1 mM MgCl2, 50 mM Tris/HCl pH 8.0), and treated with a RNAse/DNAse cocktail (50 U each; Fermentas) and incubated for 1 hr at 37oC. The reaction was arrested with the addition of 2x termination buffer (40 mM EDTA, 4 % SDS, 100 mM DTT), and 50 μg of the sample was mixed in 2% SDS buffer (2 % SDS, 150 mM NaCl, 10 mM Tris/HCl pH 8.0) and filtered through a 0.2 μm pore size cellulose acetate membrane (GE Healthcare Life Sciences, USA) using a slot blot apparatus (Bio-Rad Indian Pvt. Ltd., India). The filter membrane was used for immunodetection as described for the immunoblot.
Proteasome activity assays - Cells, that were either transfected or treated with indicated drugs (12 h), were harvested in lysis buffer (1x PBS, 0.1% Triton X100, 0.5% NP40) and the cleared lysate was used for the proteasome activity assay using a fluorogenic proteasome substrate (Suc-Leu-Leu-Val-Tyr-AMC;
by guest on March 20, 2014
http://ww
w.jbc.org/
Dow
nloaded from
Decreasing O-linked GlcNAcylation increases basal autophagic flux
5
Calbiochem). Briefly, 10 µg of protein for each sample was incubated in a reaction buffer and the generation of fluorescent signal was measured using a spectrofluorometer (Parkin Elmer) as recommended by the manufacturer. Reactions in the presence of the proteasomal blocker, MG132, served as control.
Pseudopupil Analysis − Heads of 1 day old GMR-GAL4>UAS-httex1p Q93 flies, reared since the 1st instar larval stage on normal or azaserine supplemented food were decapitated and the arrangement of photoreceptor rhabdomeres in the ommatidia of compound eyes was visualized by the pseudopupil technique (29) using 63X (NA= 1.4) oil objective on a Nikon E800 microscope and the images were recorded with a Nikon DXM 1200 digital camera. The total number of flies observed for each group was 50.
Phototaxis Assay − Phototaxis of adult flies was assayed using a Y maze consisting of a Y shaped glass tube of 12 mm internal diameter and 30 cm length of each arm. Twenty replicates, each with 10 flies, were carried out for each feeding regime and age of flies. Wild type Oregon R+ flies were used as positive control. The same sets of flies were used for phototaxis assay on days 0, 5, 10 and 15.
Statistical analysis − Sigma Plot 11.0 software was used for statistical analysis. For cell biology assays, data were analyzed by two-tailed, unpaired Student’s t-test. For assays involving flies, one-way ANOVA was performed for comparison between the control and formulation-fed samples. Pooled data are expressed as mean ± S.E. of means of the different replicates of the experiment.
RESULTS
Global suppression of O-linked glycosylation reduces the aggregation propensity and cytotoxicity of mutant Huntingtin in a cellular model − Based on
the previous findings (21, 22), we were interested in exploring the role of O- GlcNAcylation in suppressing the cytotoxicity caused by aggregate-prone proteins. For this, we used a mammalian expression construct that codes for the OGT or OGA, the two proteins which work antagonistically to regulate the O-linked protein glycosylation. Transient expression of OGT in the murine neurobalstoma cell line Neuro2A resulted in increased global O-GlcNAcylation while overexpression of OGA led to a reduction in global O-GlcNAcylation (Fig. 1A). To check if O-GlcNAcylation could alter the aggregate forming propensity of mutant huntingtin, we co-expressed OGA or OGT with an expression construct coding for the amino terminal huntingtin protein having 97 polyglutamine repeat tagged with green fluorescence protein (mHtt-Q97-GFP) in Neuro2A. Cells that expressed only the mHtt-Q97-GFP served as control (co-transfected with the empty vector pcDNA). As shown in Fig. 1B and 1D, co-expression of OGA resulted in a significant reduction in the number of transfected cells showing the mHtt-Q97-GFP-positive aggregates as compared to the control cells that were co-transfected with the empty vector, pcDNA. On the other hand, OGT co-expression resulted in a higher proportion of cells with the mHtt-Q97-GFP aggregates (Fig. 1B and 1D). Co-expression of OGA or OGT did not affect the transfection efficiency of the mHtt-Q97-GFP coding construct (see the inlet Fig. 1D). Similarly, there was no significant difference in cell survival when OGA or OGT was expressed alone as compared to cells that were transfected with an empty vector (Fig. 1C). To test further whether the reduction in the global O-GlcNAcylation helps the cell to reduce the aggregation of mHtt-Q97-GFP, we evaluated the total and SDS-insoluble forms of mHtt-Q97-GFP by immunoblot and the filter-trap assay, respectively (Fig. 2A). Consistent with our observations on mHtt aggregates in situ, co-expression of
by guest on March 20, 2014
http://ww
w.jbc.org/
Dow
nloaded from
Decreasing O-linked GlcNAcylation increases basal autophagic flux
6
OGA led to a significant reduction in the level of SDS-insoluble form of mHtt-Q97-GFP when compared with that in cells co-expressing OGT or only the mHtt-Q97-GFP (pcDNA control; Fig. 2A). Co-expression of OGA or OGT did not show significant change in the total level of mHtt-Q97-GFP in the immunoblots (Fig. 2A). We also found that co-expression of OGA, but not of OGT, resulted in a significant reduction in mHtt-Q97-GFP-mediated cell death, as measured by MTT assay (Fig. 2B), and also by scoring apoptotic nuclei (Fig. 2D). To check whether the protective effect of OGA was limited to mtHtt-Q97-GFP, or whether OGA can ameliorate the toxicity of other disease associated cytotoxic proteins, we expressed Parkinson’s disease associated α-synuclein mutant A30P protein (26) either alone or along with OGA or OGT and measured the cell viability by MTT assays as well as by counting the apoptotic nuclei. As shown in Fig. 2C and 2E, OGA, but not OGT, was able to confer protection against the toxicity of the A30P mutant, suggesting that the OGA-mediated protective response could be a generic effect of O-GlcNAcylation, and is not specific to mtHtt-Q97-GFP. Taken together, our results suggest a causal role for O-GlcNAcylation in modulating the level of insoluble, aggregated mutant huntingtin and its cytotoxicity.
Inhibition of O-GlcNAcylation enhances autophagy − Our next aim was to identify the mechanism by which suppression of O-GlcNAcylation reduces the level of cytotoxic insoluble form of mHtt-Q97-GFP. Since autophagic process is known to clear the aggregated proteins (30, 31), we were interested in testing the impact of O-GlcNAcylation in basal autophagic process. For this, Neuro2a cells were transfected with the expression construct coding for OGT or OGA or with an empty vector (pcDNA control). At 36 hrs post-transfection, the cells were harvested and levels of two autophagic marker proteins,
LC3 and p62, were evaluated. As shown in Fig. 3A, transient overexpression of OGA led to a reduction in the level of both p62 and LC3II, suggesting that suppression of O-GlcNAcylation resulted in an enhanced autophagic flux. To further confirm that the observed effect is indeed because of the changes in global O-GlcNAcylation, we examined the autophagic process after treating the cells with, azaserine, which inhibits glutamine fructose-6-phosphate amidotransferase, one of the key enzymes of hexosamine biosynthesis pathway and thereby inhibits O-GlcNAcylation (32, 33). As shown in Fig. 3B, treatment of Neuro2A cells with azaserine for 12 hrs resulted in a significant reduction in global O-GlcNAcylation levels. As was observed for OGA expression, azaserine also led to a reduction in the level of the autophagic markers LC3II and p62 (Fig. 3C), confirming that a reduction in the cellular O-GlcNAcylation level correlates with increased levels of basal autophagic flux. To further confirm that the observed effect of azaserine on autophagic process is indeed through O-GlcNAcylation process, we treated cells both with azaserine and glucosamine and looked at the level of LC3II and p62. Glucosamine is known to rescue the effect of azaserine on O-GlcNAcylation process hence the double treatment should rescue the effect of azaserine on the autophagic process (Fig. 3B). As shown in Fig. 3C, azaserine-glucosamine treatment increased the level of LC3II and p62 as compared to only azaserine treatment, confirming that the level of autophagic induction inversely correlate with O-GlcNAcylation level.
Our next aim was to identify the key step through which the O-GlcNAcylation regulates the autophagic process. The reduction in the level of the autophagy marker LC3II upon depletion of glycosylation may be because either (i) the autophagosome formation is inhibited (inhibition of autophagy initiation), or (ii) enhanced degradation of LC3II (increased
by guest on March 20, 2014
http://ww
w.jbc.org/
Dow
nloaded from
Decreasing O-linked GlcNAcylation increases basal autophagic flux
7
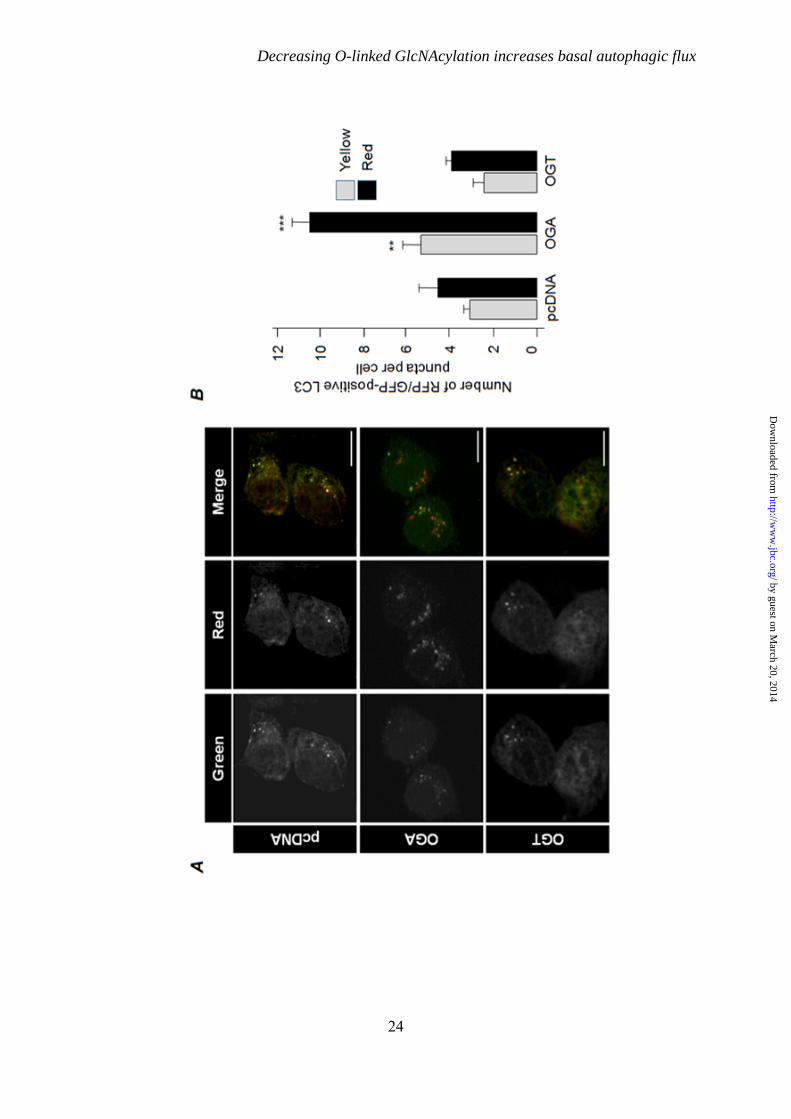
autophagic flux) via lysosome since LC3 itself is an autophagy substrate (34). Our observation that the cellular level of another autophagic substrate, p62, was also at lower levels upon OGA overexpression suggests that the second possibility is more likely. Therefore, we checked whether inhibition of fusion of autophagosome with the lysosome would rescue the level of LC3II and p62. For this, the cells were transfected with expression construct coding for OGA of OGT and then were treated with bafilomycin A1 (BafA1), an inhibitor of autophagosome lysosome fusion (34) for 12 hrs and the cellular level of LC3II and p62 was evaluated. As shown in Fig. 4A, we found that the BafA1-mediated inhibition of autophagosome-lysosome fusion led to an increase in the level of both LC3II and p62 even in those cells that overexpressed OGA or OGT. Very similar observations were made when the glycosylation was inhibited by azaserine treatment (Fig. 4B). To further confirm that suppression of O-GlcNAcylation indeed increases the autophagy flux, we utilized the tandem mRFP-GFP-LC3 expression construct whose expression product is known to show difference in pH sensitivity and has been widely used to monitor the autophagic process (35). For this the Neuro2A cells were transiently transfected with the mRFP-GFP-LC3 tandem construct and empty vector (pcDNA), or along with the expression vector coding for OGA or OGT, and scored the colocalization of green and red signals in the cytoplasmic LC3-positive puncta, and also the number of green and red puncta. Here, autophagosomes are visible as yellow puncta and autophagolysosomes (post-lysosomal fusion) as red puncta (35). As shown in Fig. 5, co-expression of OGA led to a significant increase in the fraction of red/green-positive LC3 puncta while no such difference was noted for OGT. Similarly, there was a significant increase in the LC3 puncta that were positive only for red fluorescence (Fig. 5), suggesting
that suppression of O-GlcNAcylation did enhance the autophagy flux.
Next, we tested whether the reduction in the level of insoluble fraction of mutant huntingtin seen in O-GlcNAcylation deprived-condition is due to an enhanced autophagy flux. As shown in Fig. 6A, BafA1 treatment led to an increase in the level of insoluble fraction of the mutant huntingtin even in the OGA overexpressing cells, suggesting that decreased O-GlcNAcylation promotes the clearance of the aggregate-prone protein by enhancing autophagosome-lysosome fusion. Finally, to demonstrate that autophagy is the mechanism through which O-GlcNAcase is able to protect cells from huntingtin aggregates, we treated cells that coexpress mtHtt-Q97-GFP and OGA with an autophagy inhibitor, 3-Methyladenine (3-MA). As shown in Fig. 6B, 3-MA treatment led to a significant increase in the insoluble form of mtHtt-Q97-GFP even when OGA was co-expressed, suggesting that the protective effect conferred by OGA is indeed through the autophagic process.
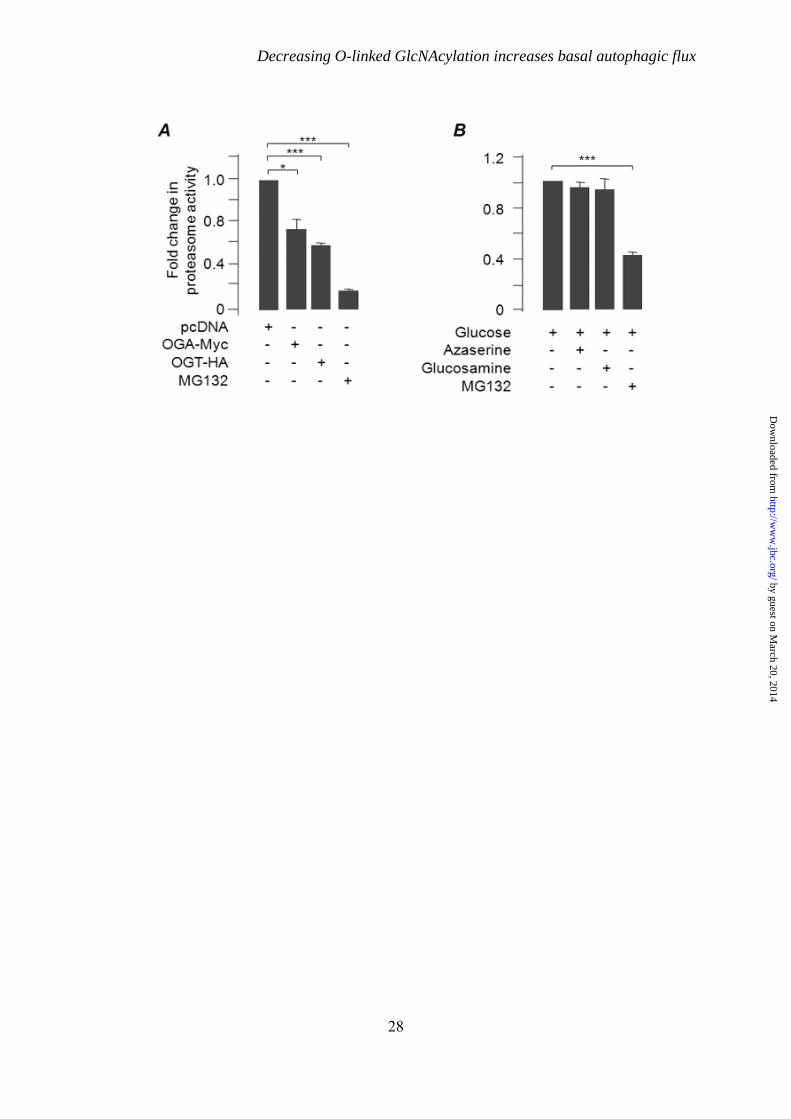
Having shown an indirect correlation between O-GlcNAcylation and autophagic flux, we checked possible effect of O-GlcNAcylation on proteasomal activity. For this cells that transiently expressed OGA or OGT or that were treated with azaserine or glucosamine were assayed for proteasomal activity. As shown in Fig. 7A, transient overexpression of OGT or OGA led to a significant reduction in the proteasomal activity. Treatment of cells with azaserine or glucosamine did not significantly alter the activity (Fig. 7B), suggesting that the O-GlcNAcylation-dependent clearance of mutant huntingtin observed in our model could be primarily through the autophagic process.
Azaserine feeding reduces mutant huntingtin aggregation in the larval eye discs of Drosophila − Having found that azaserine treatment reduces the aggregates
by guest on March 20, 2014
http://ww
w.jbc.org/
Dow
nloaded from
Decreasing O-linked GlcNAcylation increases basal autophagic flux
8
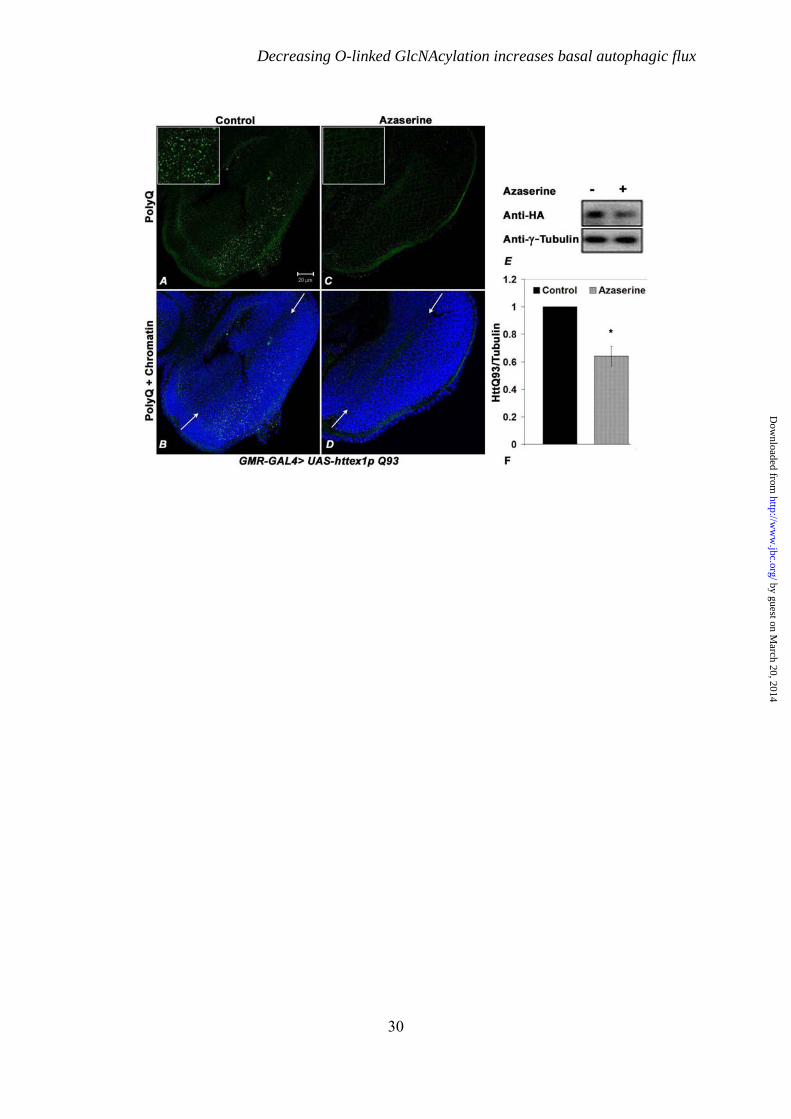
of mutant huntingtin in the mammalian cell line, we next tested whether similar effect could also be seen in vivo, for which we used the fly model of Huntington’s disease (23). We reared wild type and GMR-GAL4>httex1p Q93 larvae from the 1st instar stage onwards on food supplemented with azaserine (250 µg/ml). It is known (36, 37) that GMR-GAL4 driven expression of the mutant huntingtin protein leads to accumulation of polyQ inclusion bodies posterior to the morphogenetic furrow in late 3rd instar larval eye discs (Fig. 8A, B). We found that azaserine feeding substantially reduced the accumulation of mHtt protein so that in ~57% of the eye discs (n = 30) from azaserine-fed larvae, the aggregates were nearly absent behind the morphogenetic furrow (Fig. 8C, D) while in the remaining discs immunostaining was less than that in the eye discs (n = 29) from larvae reared on regular diet (Fig. 6A, B). Western blotting for detection of polyQ protein levels in heads of day 1 old GMR-GAL4>httex1p Q93 flies further confirmed that azaserine feeding reduced the level of polyQ protein (Fig. 8E, F).
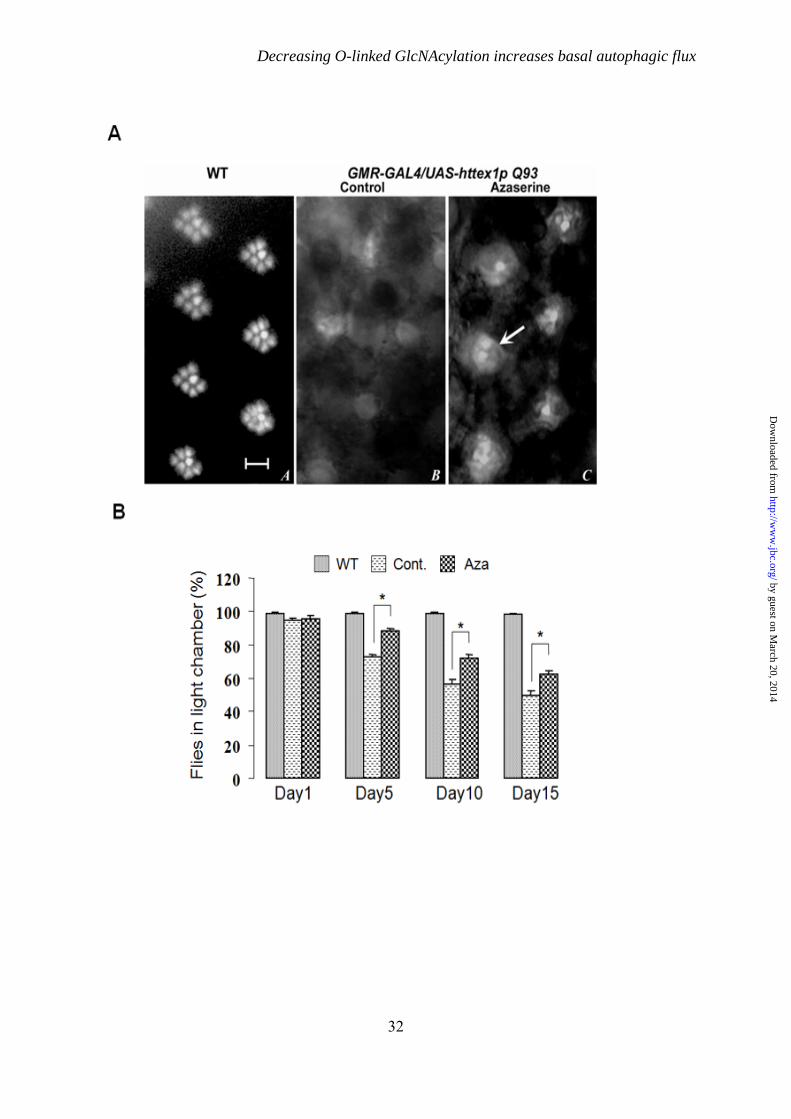
Azaserine feeding partially restores the rhabdomere morphology and suppresses the progressive loss of vision in GMR-GAL4>UAS-httex1p Q93 expressing flies − The external eye morphology and vision of freshly eclosed GMR-GAL4>UAS-httex1p Q93 flies is near normal. However, these flies show a progressive age-dependent degeneration, becoming almost completely blind by 10 days (36-38). As known from earlier studies (36-38), the eye surface of GMR-GAL4>UAS-httex1p Q93 flies did not show any appreciable change with age in any of the feeding regimes (not shown). However, as also reported earlier (36, 38), the pseudopupil images of rhabdomeres of 1 day old GMR-GAL4>UAS-httex1p Q93 expressing flies fed on normal diet showed severely degenerated rhabdomeres so that unlike the stereotyped pattern of rhabdomeres in
pseudopupil image of eyes of wild type flies (Fig. 9A), no distinct rhabdomeres were seen in their eyes (Fig. 8B). Interestingly, GMR-GAL4>UAS-httex1p Q93 flies reared on the azaserine supplemented food displayed at least some organized rhabdomere-like structures in ~60% flies (Fig. 8C).
Expression of UAS httex1p Q93 in eye cells with GMR-GAL4 driver causes progressive neuronal degeneration of the photoreceptor neurons so that the flies lose their vision as they age (36, 38). To examine whether the azaserine mediated restoration of rhabdomeric organization improved the vision of flies, we tested the functionality of vision in 5, 10 and 15 days old flies (wild type and GMR-GAL4>httex1p Q93) by the phototaxis behavioral assay, which examines the choice of flies to move between illuminated and dark chambers. While nearly all wild-type flies of different ages moved to the illuminated chamber (positive phototaxis), the GMR-GAL4>httex1p Q93 flies reared on normal food progressively lost their vision such that the proportion of flies selecting the lighted chamber declined with age (Fig. 9D). By day 10, these flies became nearly blind since they moved randomly between the dark and light chambers (Fig. 9D). Significantly, a greater proportion of GAL4>httex1p Q93 flies reared on azaserine-supplemented food continued to move to the illuminated chamber even on day 15 (Fig. 9D). Thus azaserine feeding partially restored the vision in GAL4>httex1p Q93 flies so that the proportion of flies selecting the illuminated chamber was significantly higher on each day of phototaxis assay than in those grown on normal food (Fig. 9D).
by guest on March 20, 2014
http://ww
w.jbc.org/
Dow
nloaded from
Decreasing O-linked GlcNAcylation increases basal autophagic flux
9
DISCUSSION Dynamic modification of Ser/Thr residues of proteins by O-linked N-acetylglucosamine (O-GlcNAc) is an important post-translational modification for cellular signaling (1, 3, 39). More than five hundred proteins, involved in diverse cellular functions including the transcription, translation, metabolism and stress response, have been identified to undergo this modification (1, 3, 39). It is significant that about 270 of these proteins are known in the brain tissue alone (40). Therefore it is not surprising that aberrant O-GlcNAcylation is associated with various disorders, including the neurodegenerative disorders (3-11).
A common pathological feature of many neurodegenerative diseases including Alzheimer’s, Parkinson’s and Huntington’s diseases, is the accumulation/aggregation of one or more proteins in different regions of brain, which is believed to underlie neurodegeneration (12, 37, 41). These proteotoxic aggregates are cleared by coordinated action of cellular proteolysis system (UPS and autophagy-lysosomal pathways) and molecular chaperones (12, 30). Although the regulation of UPS by O-GlcNAcylation is fairly understood, there are contrasting reports about a protective role of O-GlcNAcylation in neurodegeneration. For example, it is shown that while O-GlcNAcylation of ubiquitin-activating enzyme E1 promotes ubiquitination (42) and is thus expected to enhance protein degradation, the same modification in Rpt2 ATPase subunit of the proteasome inhibits its ATPase activity and suppresses proteasome function (43), which would lead to the accumulation of ubiquitinated proteins. Interestingly, it is shown that elevated O-GlcNAcylation in brain inhibits proteasome function and promotes neuronal apoptosis (44). We find that overexpression of either OGT or OGA led to significant reduction in the
proteasome activity in our cellular model and this corroborates well with a recent report on proteasomal function in C. elegans mutants for OGT or OGA (45). However, we did not find any difference in the proteasome activity when the cells were treated with azaserine or glucosamine for the duration and concentration used, suggesting that the level and/or activity of OGT and OGA, rather than flux through the HBP alone, are more critical in modulating the activity of proteasome. In view of these observations, and existing reports that accumulation of protein aggregates blocks proteasome function (46, 47), it appears that proteasome alone might not be sufficient to clear these aggregates. This notion is strengthened with the emerging understanding of the role of autophagy in degradation of such aggregates in cell and animal models (12, 27, 48), identification of novel regulators of autophagy that help in the clearance of toxic protein aggregates is important. Considering the established fact that O-GlcNAcylation acts as nutrient sensor (3, 49), and the role of nutrients (serum amino acid, glucose) in regulation of the autophagic process (50, 51), we hypothesized that changes in O-GlcNAcylation level might modulate autophagic process. Interestingly, we found here that inhibition of O-GlcNAcylation, either by overexpressing OGA or by azaserine treatment, decreased the polyQ aggregation by promoting their clearance via autophagy.
In agreement with the results of our in vitro cell culture model, our studies on the in vivo fly model also revealed that azaserine feeding resulted in the improvement in Drosophila eyes expressing mutant huntingtin at cellular, phenotypic, as well as at functional level in the form of reduced aggregation of mHtt, improved rhabdomere organization and improved vision, respectively. Since glucosamine was highly toxic to larvae even at a very low concentration, we could
by guest on March 20, 2014
http://ww
w.jbc.org/
Dow
nloaded from
Decreasing O-linked GlcNAcylation increases basal autophagic flux
10
not examine the effects of elevated levels of O-GlcNAcylation on polyQ toxicity in the fly model. The decrease in proteotoxicity on azaserine feeding might involve either the inhibition of toxic proteins synthesis or its enhanced clearance through the degradation machinery of cell. Several recent findings, including our present in vitro findings, suggest a greater role of enhanced clearance of toxic proteins by azaserine. Thus the reduced polyQ aggregate load seen in azaserine fed GAL4>httex1p Q93 larval eye discs and adult heads is likely to be due to their enhanced clearance, which in turn results in partial restoration of eye structure and function.
Azaserine has already been reported to decrease the level of amyloid deposition in pancreatic islets of mouse model of diabetes (52) which indicates the possibility of improvement in protein clearance machinery and thereby reducing
the accumulation of amyloid deposits. Our observations that inhibition O-GlcNAcylation induces the clearance of protein aggregates by enhancing the autophagic process is in agreement with a recent finding that cardiac O-GlcNAcylation regulates autophagic signaling in rat model of type II diabetes (53). Interestingly, a recent report, which appeared while this manuscript was in preparation, by Wang et al. (54) in C. elegans model of human neurodegenerative diseases also indicates that the suppression of O-GlcNAcylation decreases neurodegeneration. Taken together, our in vitro and in vivo findings indicate that inhibition of O-GlcNAcylation stimulates autophagy and thereby reduces the load of proteotoxic huntingtin aggregates and provides protection from neurodegeneration.
REFERENCES 1. Love, D.C., and Hanover, J.A. (2005) The hexosamine signaling pathway: deciphering
the "O-GlcNAc code". Sci STKE. 2005, re13. 2. Vocadlo, D.J. (2012) O-GlcNAc processing enzymes: catalytic mechanisms, substrate
specificity, and enzyme regulation. Curr. Opin. Chem. Biol. 16, 488-497. 3. Butkinaree, C., Park, K., and Hart, G. W. (2010) O-linked beta-N-acetylglucosamine (O-
GlcNAc): Extensive crosstalk with phosphorylation to regulate signaling and transcription in response to nutrients and stress. Biochim. Biophys. Acta. 1800, 96-106.
4. Chatham, J. C., and Marchase, R. B. (2010) Protein O-GlcNAcylation: A critical regulator of the cellular response to stress. Curr. Signal. Transduct. Ther. 5, 49-59.
5. Bond, M. R., and Hanover, J. A. (2013) O-GlcNAc Cycling: A Link Between Metabolism and Chronic Disease. Annu. Rev. Nutr. 33, 205-229.
6. Okuyama, R., and Marshall, S. (2003) UDP-N-acetylglucosaminyl transferase (OGT) in brain tissue: temperature sensitivity and subcellular distribution of cytosolic and nuclear enzyme. J. Neurochem. 86, 1271-1280.
7. Griffith, L. S., and Schmitz, B. (1995) O-linked N-acetylglucosamine is upregulated in Alzheimer brains. Biochem. Biophys. Res. Commun. 213, 424-431.
8. Arnold, C. S., Johnson, G. V., Cole, R. N., Dong, D. L., Lee, M., and Hart, G. W. (1996) The microtubule-associated protein tau is extensively modified with O-linked N-acetylglucosamine. J. Biol. Chem. 271, 28741-28744.
9. Cole, R. N., and Hart, G. W. (1999) Glycosylation sites flank phosphorylation sites on synapsin I: O-linked N-acetylglucosamine residues are localized within domains mediating synapsin I interactions. J. Neurochem. 73, 418-428.
by guest on March 20, 2014
http://ww
w.jbc.org/
Dow
nloaded from
Decreasing O-linked GlcNAcylation increases basal autophagic flux
11
10. Dong, D. L., Xu, Z. S., Hart, G. W., and Cleveland, D. W. (1996) Cytoplasmic O-GlcNAc modification of the head domain and the KSP repeat motif of the neurofilament protein neurofilament-H. J. Biol. Chem. 271, 20845-20852.
11. Liu, F., Shi, J., Tanimukai, H., Gu, J., Grundke-Iqbal, I., Iqbal, K., and Gong, C. X. (2009) Reduced O-GlcNAcylation links lower brain glucose metabolism and tau pathology in Alzheimer's disease. Brain 132, 1820-1832.
12. Mittal, S., and Ganesh, S. (2010) Protein quality control mechanisms and neurodegenerative disorders: Checks, balances and deadlocks. Neurosci. Res. 68, 159-166.
13. Zheng, Z., and Diamond, M.I. (2012) Huntington disease and the huntingtin protein. Prog. Mol. Biol. Transl. Sci. 107, 189-214.
14. Cattaneo, E., Zuccato, C., and Tartari, M. (2005) Normal huntingtin function: an alternative approach to Huntington's disease. Nat. Rev. Neurosci. 6, 919-930.
15. Ho, L. W., Brown, R., Maxwell, M., Wyttenbach, A., and Rubinsztein, D. C. (2001) Wild type huntingtin reduces the cellular toxicity of mutant Huntingtin in mammalian cell models of Huntington's disease. J. Med. Genet. 38, 450-452.
16. Rozas, J.L., Gómez-Sánchez, L., Tomás-Zapico, C., Lucas, J.J., and Fernández-Chacón, R. (2011) Increased neurotransmitter release at the neuromuscular junction in a mouse model of polyglutamine disease. J. Neurosci. 31, 1106-1113.
17. Shirendeb, U., Reddy, A. P., Manczak, M., Calkins, M. J., Mao, P., Tagle, D. A., and Reddy, P. H. (2011) Abnormal mitochondrial dynamics, mitochondrial loss and mutant huntingtin oligomers in Huntington's disease: implications for selective neuronal damage. Hum. Mol. Genet. 20, 1438-1455.
18. Nucifora, F. C., Jr., Sasaki, M., Peters, M. F., Huang, H., Cooper, J. K., Yamada, M., Takahashi, H., Tsuji, S., Troncoso, J., Dawson, V. L., Dawson, T. M., and Ross, C. A. (2001) Interference by huntingtin and atrophin-1 with cbp-mediated transcription leading to cellular toxicity. Science 291, 2423-2428.
19. Ravikumar, B., Stewart, A., Kita, H., Kato, K., Duden, R., and Rubinsztein, D.C. (2003) Raised intracellular glucose concentrations reduce aggregation and cell death caused by mutant huntingtin exon 1 by decreasing mTOR phosphorylation and inducing autophagy. Hum. Mol. Genet. 12, 985-994.
20. Puri, R., Jain, N., and Ganesh, S. (2011) Increased glucose concentration results in reduced proteasomal activity and the formation of glycogen positive aggresomal structures. FEBS J. 278, 3688-3698.
21. Kaniuk, N. A., Kiraly, M., Bates, H., Vranic, M., Volchuk, A., and Brumell, J. H. (2007) Ubiquitinated-protein aggregates form in pancreatic beta-cells during diabetes-induced oxidative stress and are regulated by autophagy. Diabetes 56, 930-939.
22. Cohen, E., and Dillin, A. (2008) The insulin paradox: aging, proteotoxicity and neurodegeneration. Nat. Rev. Neurosci. 9, 759-767.
23. Steffan, J. S., Bodai, L., Pallos, J., Poelman, M., McCampbell, A., Apostol, B. L., Kazantsev, A., Schmidt, E., Zhu, Y. Z., Greenwald, M., Kurokawa, R., Housman, D. E., Jackson, G. R., Marsh, J. L., and Thompson, L. M. (2001) Histone deacetylase inhibitors arrest polyglutamine-dependent neurodegeneration in Drosophila. Nature 413, 739-743.
24. Freeman, M. (1996) Reiterative use of the EGF receptor triggers differentiation of all cell types in the Drosophila eye. Cell 87, 651-60.
25. Dwivedi, V., Anandan, E. M., Mony, R. S., Muraleedharan, T. S., Valiathan, M. S., Mutsuddi, M., and Lakhotia, S. C. (2012) In vivo effects of traditional Ayurvedic formulations in Drosophila melanogaster model relate with therapeutic applications. PLoS One 7, e37113.
by guest on March 20, 2014
http://ww
w.jbc.org/
Dow
nloaded from
Decreasing O-linked GlcNAcylation increases basal autophagic flux
12
26. Garyali, P., Siwach, P., Singh, P.K., Puri, R., Mittal, S., Sengupta, S., Parihar, R., and Ganesh, S. (2009) The malin-laforin complex suppresses the cellular toxicity of misfolded proteins by promoting their degradation through the ubiquitin-proteasome system. Hum. Mol. Genet. 18, 688-700.
27. Pampliega, O., Orhon, I., Patel, B., Sridhar, S., Díaz-Carretero, A., Beau, I., Codogno, P., Satir, B.H., Satir, P., and Cuervo, A.M. (2013) Functional interaction between autophagy and ciliogenesis. Nature 502, 194-200.
28. Juenemann, K., Schipper-Krom, S., Wiemhoefer, A., Kloss, A., Sanz Sanz, A., and Reits, E.A. (2013) Expanded polyglutamine-containing N-terminal huntingtin fragments are entirely degraded by mammalian proteasomes. J. Biol. Chem. 288, 27068-27084.
29. Franceschini, N., and Kirschfeld, K. (1971) Pseudopupil phenomena in the compound eye of drosophila. Kybernetik 9, 159-182.
30 Ravikumar, B., Sarkar, S., and Rubinsztein, D. C. (2008) Clearance of mutant aggregate-prone proteins by autophagy. Methods Mol. Biol. 445, 195-211.
31 Matsumoto, G., Wada, K., Okuno, M., Kurosawa, M., and Nukina, N. (2011) Serine 403 phosphorylation of p62/SQSTM1 regulates selective autophagic clearance of ubiquitinated proteins. Mol. Cell 44, 279-289.
32. Jensen, R. V., Zachara, N. E., Nielsen, P. H., Kimose, H. H., Kristiansen, S. B., and Botker, H. E. (2013) Impact of O-GlcNAc on cardioprotection by remote ischaemic preconditioning in non-diabetic and diabetic patients. Cardiovasc. Res. 97, 369-378.
33. Rajapakse, A. G., Ming, X. F., Carvas, J. M., and Yang, Z. (2009) The hexosamine biosynthesis inhibitor azaserine prevents endothelial inflammation and dysfunction under hyperglycemic condition through antioxidant effects. Am. J. Physiol. Heart Circ. Physiol. 296, H815-822.
34. Mizushima, N., Yoshimori, T., and Levine, B. (2010) Methods in mammalian autophagy research. Cell 140, 313-326.
35. Kimura, S., Noda, T., and Yoshimori, T. (2007) Dissection of the autophagosome maturation process by a novel reporter protein, tandem fluorescent-tagged LC3. Autophagy 3, 452-460.
36. Mallik, M., and Lakhotia, S. C. (2009) RNAi for the large non-coding hsromega transcripts suppresses polyglutamine pathogenesis in Drosophila models. RNA Biol 6, 464-478.
37. Mallik, M., and Lakhotia, S. C. (2010) Modifiers and mechanisms of multi-system polyglutamine neurodegenerative disorders: lessons from fly models. J. Genet. 89, 497-526.
38. Jackson, G. R., Salecker, I., Dong, X., Yao, X., Arnheim, N., Faber, P. W., MacDonald, M. E., and Zipursky, S. L. (1998) Polyglutamine-expanded human huntingtin transgenes induce degeneration of Drosophila photoreceptor neurons. Neuron 21, 633-642.
39. Akimoto, Y., Hart, G. W., Hirano, H., and Kawakami, H. (2005) O-GlcNAc modification of nucleocytoplasmic proteins and diabetes. Med. Mol. Morphol. 38, 84-91.
40. Alfaro, J. F., Gong, C. X., Monroe, M. E., Aldrich, J. T., Clauss, T. R., Purvine, S. O., Wang, Z., Camp, D. G., 2nd, Shabanowitz, J., Stanley, P., Hart, G. W., Hunt, D. F., Yang, F., and Smith, R. D. (2012) Tandem mass spectrometry identifies many mouse brain O-GlcNAcylated proteins including EGF domain-specific O-GlcNAc transferase targets. Proc. Natl. Acad. Sci. U S A. 109, 7280-7285.
41. Jadhav, S., Zilka, N., and Novak, M. (2013) Protein Truncation as a Common Denominator of Human Neurodegenerative Foldopathies. Mol. Neurobiol. 48, 516-532.
by guest on March 20, 2014
http://ww
w.jbc.org/
Dow
nloaded from
Decreasing O-linked GlcNAcylation increases basal autophagic flux
13
42. Guinez, C., Mir, A. M., Dehennaut, V., Cacan, R., Harduin-Lepers, A., Michalski, J. C., and Lefebvre, T. (2008) Protein ubiquitination is modulated by O-GlcNAc glycosylation. FASEB J. 22, 2901-2911.
43. Zhang, F., Su, K., Yang, X., Bowe, D. B., Paterson, A. J., and Kudlow, J. E. (2003) O-GlcNAc modification is an endogenous inhibitor of the proteasome. Cell 115, 715-725.
44. Liu, K., Paterson, A. J., Zhang, F., McAndrew, J., Fukuchi, K., Wyss, J. M., Peng, L., Hu, Y., and Kudlow, J. E. (2004) Accumulation of protein O-GlcNAc modification inhibits proteasomes in the brain and coincides with neuronal apoptosis in brain areas with high O-GlcNAc metabolism. J. Neurochem. 89, 1044-1055.
45. Wang, P., Lazarus, B. D., Forsythe, M. E., Love, D. C., Krause, M. W., and Hanover, J. A. (2012) O-GlcNAc cycling mutants modulate proteotoxicity in Caenorhabditis elegans models of human neurodegenerative diseases. Proc. Natl. Acad. Sci. U S A 109, 17669-17674.
46. Bence, N. F., Sampat, R. M., and Kopito, R. R. (2001) Impairment of the ubiquitin-proteasome system by protein aggregation. Science 292, 1552-1555.
47. Holmberg, C. I., Staniszewski, K. E., Mensah, K. N., Matouschek, A., and Morimoto, R. I. (2004) Inefficient degradation of truncated polyglutamine proteins by the proteasome. EMBO J. 23, 4307-4318.
48. Williams, A., Jahreiss, L., Sarkar, S., Saiki, S., Menzies, F. M., Ravikumar, B., and Rubinsztein, D. C. (2006) Aggregate-prone proteins are cleared from the cytosol by autophagy: therapeutic implications. Curr. Top. Dev. Biol. 76, 89-101.
49. Wells, L., Vosseller, K., and Hart, G. W. (2003) A role for N-acetylglucosamine as a nutrient sensor and mediator of insulin resistance. Cell Mol. Life Sci. 60, 222-228.
50. Mizushima, N. (2007) Autophagy: process and function. Genes Dev. 21, 2861-2873. 51. Chang, Y. Y., Juhasz, G., Goraksha-Hicks, P., Arsham, A. M., Mallin, D. R., Muller, L.
K., and Neufeld, T. P. (2009) Nutrient-dependent regulation of autophagy through the target of rapamycin pathway. Biochem. Soc. Trans. 37, 232-236.
52. Hull, R. L., Zraika, S., Udayasankar, J., Kisilevsky, R., Szarek, W. A., Wight, T. N., and Kahn, S. E. (2007) Inhibition of glycosaminoglycan synthesis and protein glycosylation with WAS-406 and azaserine result in reduced islet amyloid formation in vitro. Am. J. Physiol. Cell Physiol. 293, C1586-1593.
53. Marsh, S. A., Powell, P. C., Dell'italia, L. J., and Chatham, J. C. (2013) Cardiac O-GlcNAcylation blunts autophagic signaling in the diabetic heart. Life Sci. 92, 648-656.
Acknowledgments − We thank Dr Lawrence Marsh (University of California, Irvine, USA) for the mHtt-Q97-GFP expression construct, Dr T. Yoshimori (National Institute for Basic Biology, Okazaki, Japan) for the mRFP-GFP-LC3 construct, Dr John A Hannover (National Institutes of Health, USA) and Dr Gerald W. Hart (Johns Hopkins University School of Medicine, USA) for the expression constructs coding for OGA and OGT, respectively. We would also like to thank the anonymous reviewers for their suggestions and comments which greatly helped in improving the manuscript. FOOTNOTES *This work was supported by research grant from the Department of Atomic Energy (Govt. of India) to SG. AK received a post-doctoral fellowship from the Department of Biotechnology (Govt. of India). SG is a Ramanna Fellow and Gill-Joy Chair Professor at IIT Kanpur and SCL is Professor Emeritus and a DAE-Raja Ramanna Fellow at Banaras Hindu University, Varanasi.
by guest on March 20, 2014
http://ww
w.jbc.org/
Dow
nloaded from
Decreasing O-linked GlcNAcylation increases basal autophagic flux
14
4Current address: Burke Medical Research Institute, New York, USA. 5Current address: Institute of Genetics and Molecular and Cellular Biology, Strasbourg, France. 6To whom correspondence should be addressed: Department of Biological Sciences and Bioengineering, Indian Institute of Technology, Kanpur, 208016, India; Tel: (91) 512-259-4040; Fax (91) 512-159-4010; Email: [email protected] The abbreviations used are: DAPI, 4’,6-diamidino-2-phenylindole dihydrochloride; mHtt, polyglutamine expanded huntingtin exon 1 protein fragment; OGT, O-linked N-acetylglycosyl transferase; OGA, O-linked N-acetylglucosaminidase; PTM, post-translational modification; HBP, hexosamine biosynthetic pathway; GFP, green fluorescence protein; BafA1, bafilomycin A1; polyQ, polyglutamine; SDS, sodium dodecyl sulfate.
by guest on March 20, 2014
http://ww
w.jbc.org/
Dow
nloaded from
Decreasing O-linked GlcNAcylation increases basal autophagic flux
15
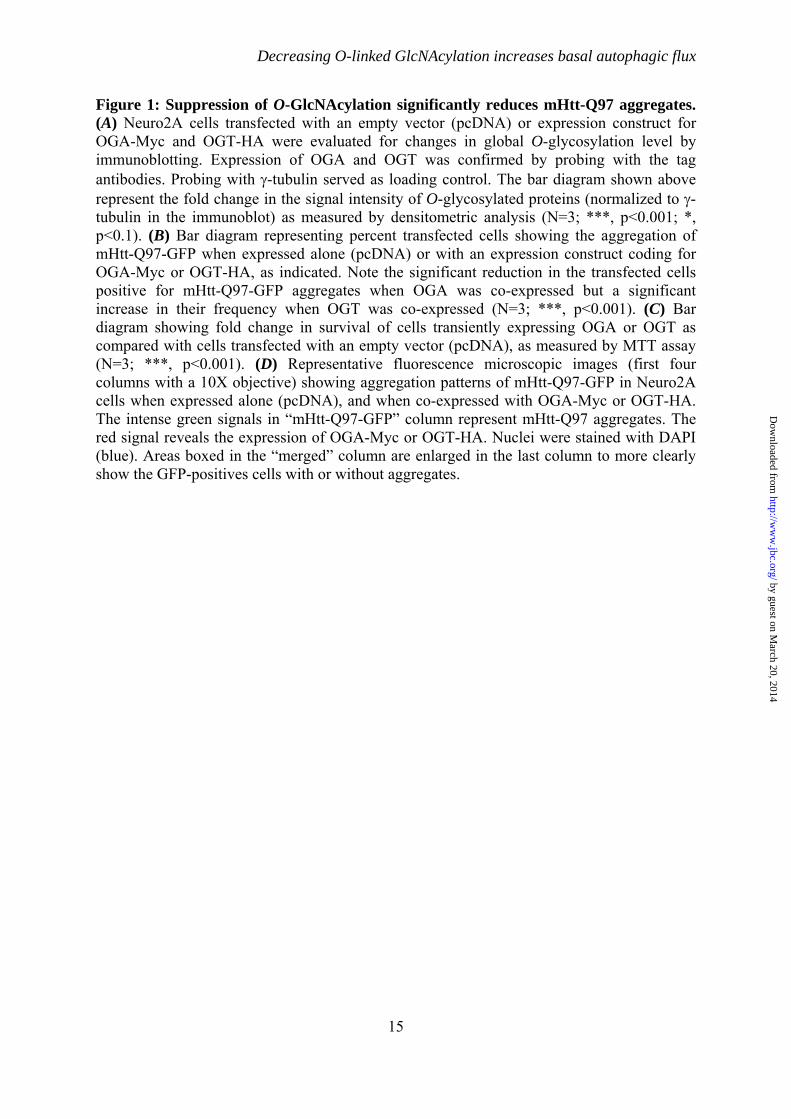
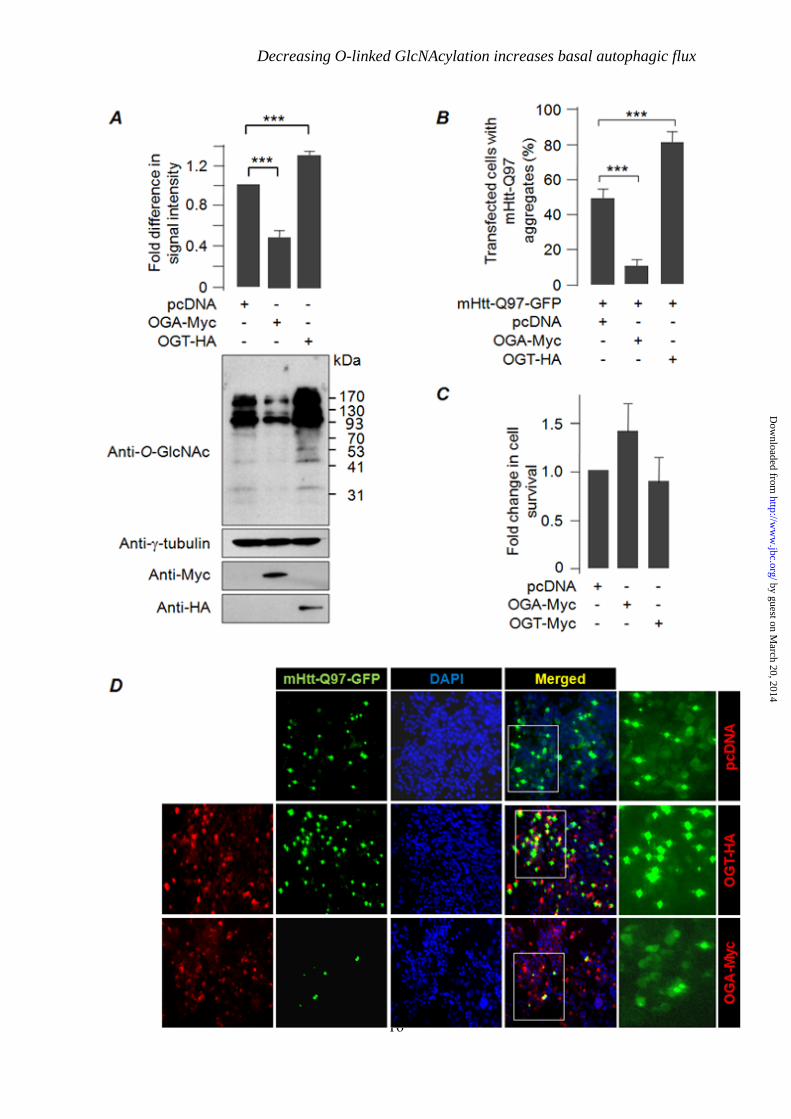
Figure 1: Suppression of O-GlcNAcylation significantly reduces mHtt-Q97 aggregates. (A) Neuro2A cells transfected with an empty vector (pcDNA) or expression construct for OGA-Myc and OGT-HA were evaluated for changes in global O-glycosylation level by immunoblotting. Expression of OGA and OGT was confirmed by probing with the tag antibodies. Probing with γ-tubulin served as loading control. The bar diagram shown above represent the fold change in the signal intensity of O-glycosylated proteins (normalized to γ-tubulin in the immunoblot) as measured by densitometric analysis (N=3; ***, p<0.001; *, p<0.1). (B) Bar diagram representing percent transfected cells showing the aggregation of mHtt-Q97-GFP when expressed alone (pcDNA) or with an expression construct coding for OGA-Myc or OGT-HA, as indicated. Note the significant reduction in the transfected cells positive for mHtt-Q97-GFP aggregates when OGA was co-expressed but a significant increase in their frequency when OGT was co-expressed (N=3; ***, p<0.001). (C) Bar diagram showing fold change in survival of cells transiently expressing OGA or OGT as compared with cells transfected with an empty vector (pcDNA), as measured by MTT assay (N=3; ***, p<0.001). (D) Representative fluorescence microscopic images (first four columns with a 10X objective) showing aggregation patterns of mHtt-Q97-GFP in Neuro2A cells when expressed alone (pcDNA), and when co-expressed with OGA-Myc or OGT-HA. The intense green signals in “mHtt-Q97-GFP” column represent mHtt-Q97 aggregates. The red signal reveals the expression of OGA-Myc or OGT-HA. Nuclei were stained with DAPI (blue). Areas boxed in the “merged” column are enlarged in the last column to more clearly show the GFP-positives cells with or without aggregates.
by guest on March 20, 2014
http://ww
w.jbc.org/
Dow
nloaded from
Decreasing O-linked GlcNAcylation increases basal autophagic flux
16
by guest on March 20, 2014
http://ww
w.jbc.org/
Dow
nloaded from
Decreasing O-linked GlcNAcylation increases basal autophagic flux
17
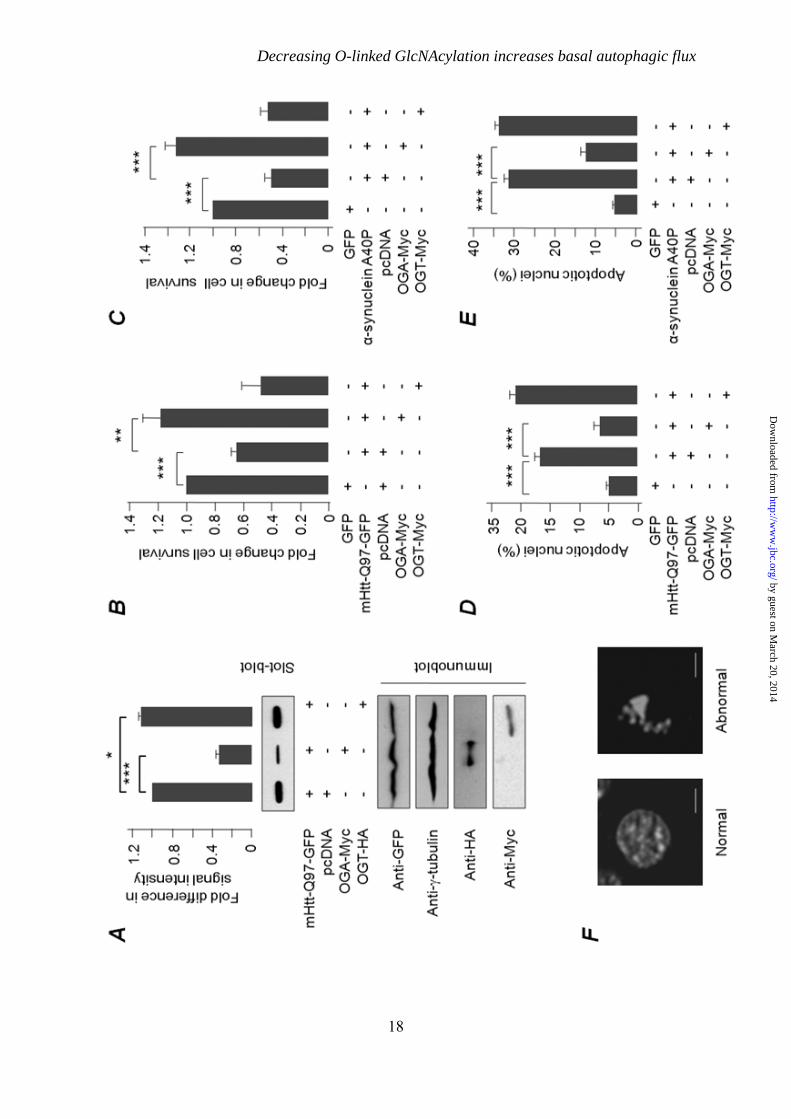
Figure 2: O-GlcNAcylation inhibition reduces mHtt-Q97-mediated cytotoxicity (A) Western blot images of insoluble, aggregated form of mHtt-Q97-GFP in filter-trap assay using a slot-blot apparatus (top) or its total form resolved by immunoblotting (bottom) when expressed with either pcDNA (empty vector control), OGT or OGA, as indicated in middle. Expression of OGT and OGA was established by probing them with anti-HA and anti-Myc antibodies, respectively levels. The bar diagram above shows the fold changes in signal intensities, based on densitometric analysis, of SDS insoluble, aggregated form of mHtt-Q97-GFP (normalized to total level detected in the immunoblot; N=3; ***, p<0.001; *, p<0.1). (B, C) Bar diagram representing the fold change in the viability of cells expressing mHtt-Q97-GFP (B) or the α-synuclein mutant A40P (C) as measured by an MTT assay. Cells transfected with indicated constructs were processed for the measurement, and in each set the value obtained for the GFP transfected cells was considered and as 1, and the relative values obtained for indicated combinations were plotted. (D, E) Bar diagram showing the percentage of cells expressing mHtt-Q97-GFP (D) or the α-synuclein mutant A40P (E) with abnormal (apoptotic) nuclei (as shown in F) as compared with cells that expressed GFP (control) when co-transfected with OGA or OGT coding constructs (in B-E, N=3; **, P<0.05; ***, P<0.005 on Student's t-test). (F) Representative images showing a normal (left) and an abnormal (apoptotic; right) nuclei as judged by DPAI staining (scale, 5 µM).
by guest on March 20, 2014
http://ww
w.jbc.org/
Dow
nloaded from
Decreasing O-linked GlcNAcylation increases basal autophagic flux
18
by guest on March 20, 2014
http://ww
w.jbc.org/
Dow
nloaded from
Decreasing O-linked GlcNAcylation increases basal autophagic flux
19
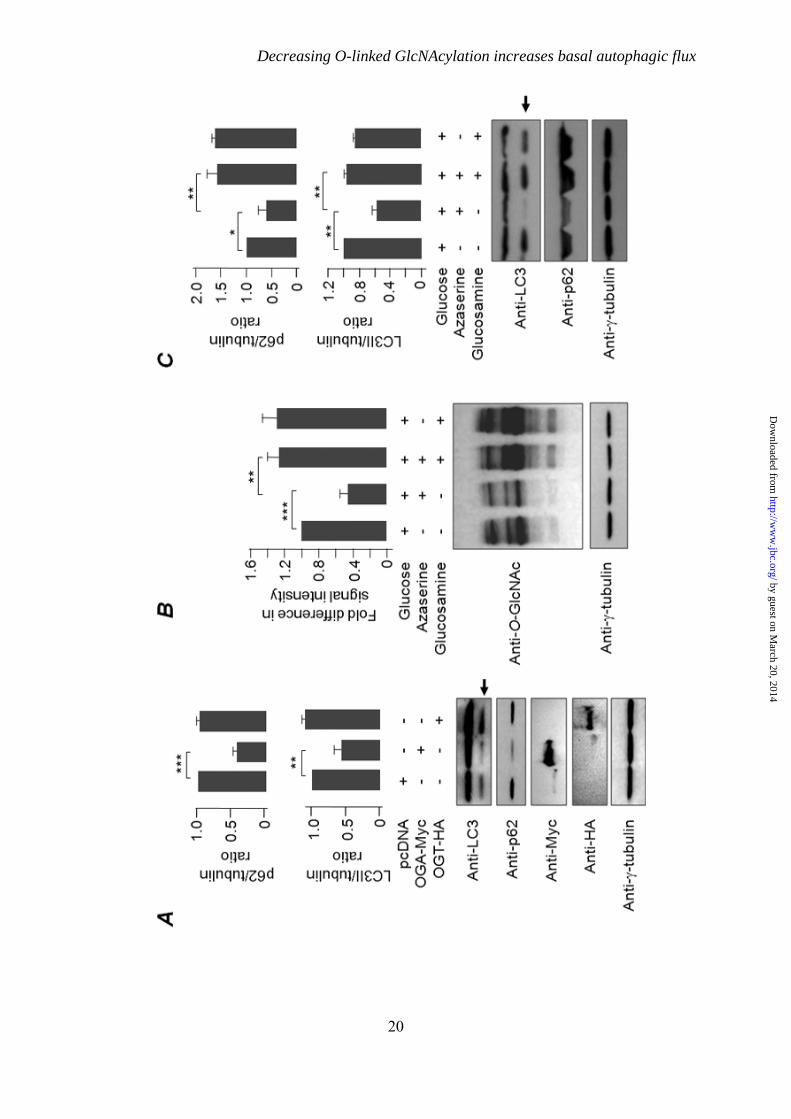
Figure 3: O-GlcNAcylation modulates autophagy. (A) Immunoblots (bottom panel) of Neuro2A cells, transiently expressing pcDNA empty vector alone or OGA-Myc or OGT-HA for 36 hrs, to show levels of the autophagic markers, LC3II and p62. Probing with anti-γ-tubulin served as loading control. Note the change in the level of LC3II band (identified by an arrow) in cells that expressed OGA. Co-expression of OGT did not show such an effect. Bar diagrams above show the fold changes in signal intensities of the LC3II and p62 (both normalized to γ-tubulin signal) bands when compared with the control (pcDNA transfected cells). (B) Neuro2A cells were grown in a medium with or without azaserine and or glucosamine for 12 hrs as indicated, and the changes in the global glycosylation level were evaluated. The bar diagrams above show the fold changes in the glycosylation levels compared to cells that were fed with glucose. (C) Samples shown in B were tested for the level of autophagy markers LC3 and p62 as indicated. Note the reduction in the intensity of the band for LC3II (identified by an arrow) and p62 in the azaserine treated cells and their restoration in the azaserine/glucosamine double treated cells. Bar diagrams above represent the fold changes in the signal intensities for LC3II and p62 (both normalized to γ-tubulin signal) bands compared to the control (glucose fed cells) (in A-C, N=3; *, P<0.5; **, P<0.05; ***, P<0.005 on Student's t-test).
by guest on March 20, 2014
http://ww
w.jbc.org/
Dow
nloaded from
Decreasing O-linked GlcNAcylation increases basal autophagic flux
20
by guest on March 20, 2014
http://ww
w.jbc.org/
Dow
nloaded from
Decreasing O-linked GlcNAcylation increases basal autophagic flux
21
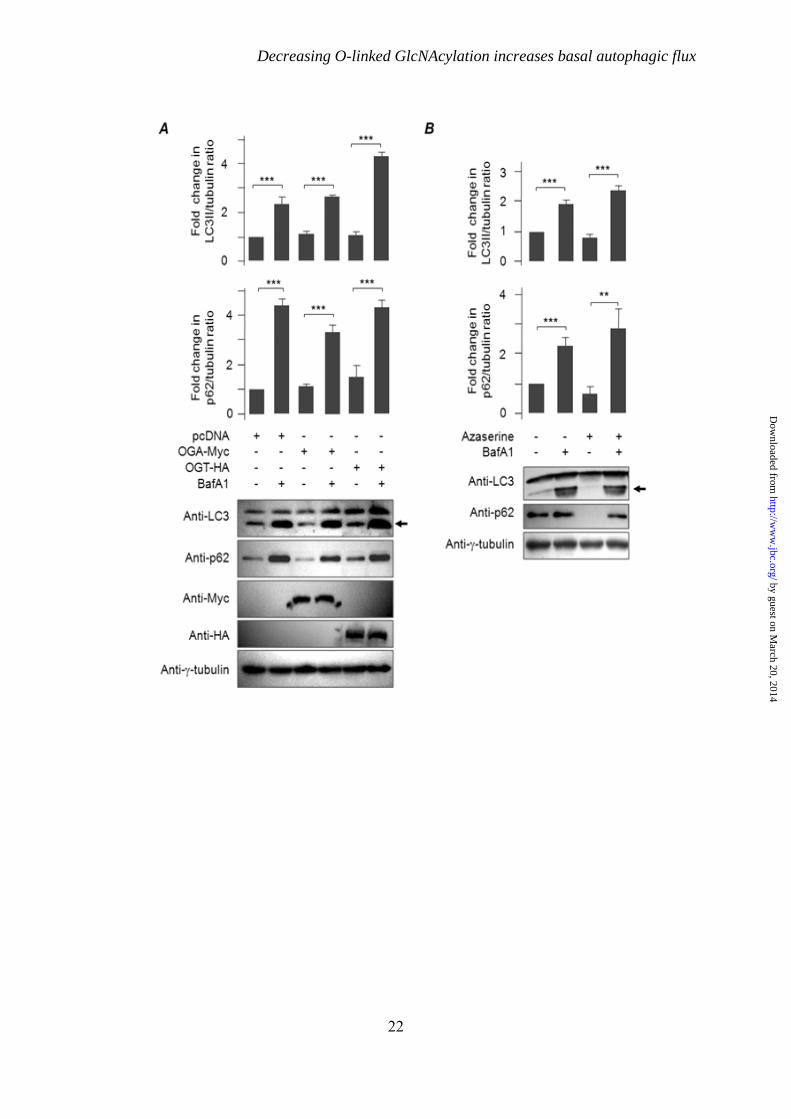
Figure 4: Suppression of O-GlcNAcylation increases autophagy flux. (A) Neuro2A cells at 24 h post- transient transfection with an empty vector (pcDNA) or with a construct coding for OGA or OGT were either left untreated or treated with BafA1 for 12 h as indicated and the levels of autophagy markers LC3 and p62 were evaluated by immunoblotting. Note the increase in the signal intensities of LC3II (arrow) and p62 in all samples treated with BafA1. The blot was probed with anti-Myc and Anti-HA antibodies to show the expression of OGA and OGT, respectively; probing with anti-γ-tubulin served as the loading a control. (B) Immunoblot to show levels of LC3II (arrow) and p62 in Neuro2A cells, as in A, untreated or treated with azaserine, alone or in combination with BafA1 as indicated; γ-ubulin served as loading control. Bar diagrams above represent the fold changes in the signal intensities for LC3II and p62 (both normalized to γ-tubulin signal) bands compared to the control (N=3; **, P<0.05; ***, P<0.005 on Student's t-test).
by guest on March 20, 2014
http://ww
w.jbc.org/
Dow
nloaded from
Decreasing O-linked GlcNAcylation increases basal autophagic flux
22
by guest on March 20, 2014
http://ww
w.jbc.org/
Dow
nloaded from
Decreasing O-linked GlcNAcylation increases basal autophagic flux
23
Figure 5: Suppression of O-GlcNAcylation increases autophagy flux. (A) Representative images of cells showing LC3 positive puncta in cells that were transiently transfected with mRFP–GFP–LC3 expression construct along with an empty vector (pcDNA) or an expression construct coding for OGA or OGT as indicated. Puncta that are positive both for red and green fluorescence represent autophagosomes while those positive only for red represent autolysosomes (bar = 10 µM). (B) Bar diagram showing the fraction of puncta positive for both RFP and GFP (yellow) or only the RFP (red) in transiently transfected cells coexpressing mRFP–GFP–LC3 and pcDNA or OGA or OGT, as indicated. N=3; *, P<0.5; **, P<0.05 on Student's t-test).
by guest on March 20, 2014
http://ww
w.jbc.org/
Dow
nloaded from
Decreasing O-linked GlcNAcylation increases basal autophagic flux
24
by guest on March 20, 2014
http://ww
w.jbc.org/
Dow
nloaded from
Decreasing O-linked GlcNAcylation increases basal autophagic flux
25
Figure 6: Suppression of O-GlcNAcylation increases autophagy flux. Western blots showing changes in the levels of insoluble, aggregated form of mHtt-Q97-GFP (filter-trap assay; top) or its total form (immunoblotting; bottom) when expressed with OGA and treated or not treated with BafA1 (A) or 3-MA (B) as indicated. The bar diagrams, shown above, represent fold changes in the signal intensity of SDS insoluble, aggregated form of mHtt-Q97-GFP (normalized to total level detected in the immunoblot) as measured by densitometric analysis (N=3; ***, p<0.001; *, p<0.1).
by guest on March 20, 2014
http://ww
w.jbc.org/
Dow
nloaded from

Decreasing O-linked GlcNAcylation increases basal autophagic flux
26
by guest on March 20, 2014
http://ww
w.jbc.org/
Dow
nloaded from
Decreasing O-linked GlcNAcylation increases basal autophagic flux
27
Figure 7: Effect of O-GlcNAcylation on proteasomal activity. Bar diagram showing fold change in the proteasomal activity in cells transiently transfected with a construct coding for OGA, OGT or an empty vector (pcDAN) (A) or with the drug azaserine or glucosamine in the presence or absence proteasomal blocker MG132, as indicated (N=3; *, P<0.5; **, P<0.05 on Student's t-test).
by guest on March 20, 2014
http://ww
w.jbc.org/
Dow
nloaded from
Decreasing O-linked GlcNAcylation increases basal autophagic flux
28
by guest on March 20, 2014
http://ww
w.jbc.org/
Dow
nloaded from
Decreasing O-linked GlcNAcylation increases basal autophagic flux
29
Figure 8: Azaserine feeding reduces accumulation of mutant Huntingtin protein in fly model. (A-D) Confocal projection images (projections of 4 consecutive optical sections which show the morphogenetic furrow) of eye imaginal discs of late 3rd instar GMR-GAL4>UAS-httex1p Q93 Drosophila larvae, reared from the 1st instar stage onwards on normal (A, B) or azaserine supplemented food (C, D), immunostained for HA-tagged mutant Htt (green, A-D, identified as “PolyQ”); nuclei are counterstained with DAPI (blue, B and D). The insets in A and C are higher magnification images of a part of the eye discs in A and C, respectively, to more clearly show the polyQ aggregates, which are very abundant in A but nearly absent in C. Arrows in B and D indicate position of the morphogenetic furrow. Scale bar in A represents 20 μm and applies to A to D. (E) Immunoblot of total proteins from heads of one day old GMR-GAL4/UAS-htt-ex1p Q93 flies, reared on normal (Aza -) or azaserine supplemented (Aza +) food since the 1st instar stage, probed with anti-HA antibody to detect Htt-Q93 protein. (F) Histograms show mean relative levels of HA-tagged polyQ protein (mean ratios of Htt-Q93 and γ-tubulin densities) determined from triplicate immunoblots as in E; the mean ratio of HttQ93 and γ-tubulin densities in Aza- food was taken as 1. (* p<0.001).
by guest on March 20, 2014
http://ww
w.jbc.org/
Dow
nloaded from
Decreasing O-linked GlcNAcylation increases basal autophagic flux
30
by guest on March 20, 2014
http://ww
w.jbc.org/
Dow
nloaded from
Decreasing O-linked GlcNAcylation increases basal autophagic flux
31
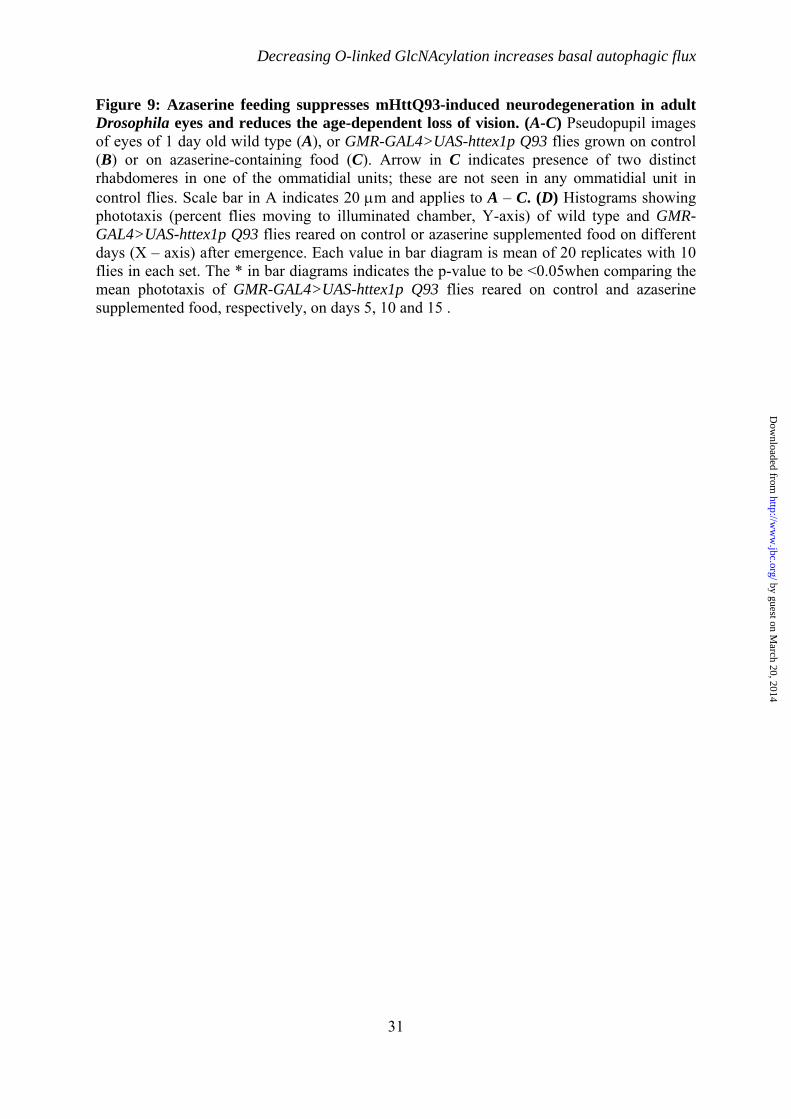
Figure 9: Azaserine feeding suppresses mHttQ93-induced neurodegeneration in adult Drosophila eyes and reduces the age-dependent loss of vision. (A-C) Pseudopupil images of eyes of 1 day old wild type (A), or GMR-GAL4>UAS-httex1p Q93 flies grown on control (B) or on azaserine-containing food (C). Arrow in C indicates presence of two distinct rhabdomeres in one of the ommatidial units; these are not seen in any ommatidial unit in control flies. Scale bar in A indicates 20 μm and applies to A – C. (D) Histograms showing phototaxis (percent flies moving to illuminated chamber, Y-axis) of wild type and GMR-GAL4>UAS-httex1p Q93 flies reared on control or azaserine supplemented food on different days (X – axis) after emergence. Each value in bar diagram is mean of 20 replicates with 10 flies in each set. The * in bar diagrams indicates the p-value to be <0.05when comparing the mean phototaxis of GMR-GAL4>UAS-httex1p Q93 flies reared on control and azaserine supplemented food, respectively, on days 5, 10 and 15 .
by guest on March 20, 2014
http://ww
w.jbc.org/
Dow
nloaded from
Decreasing O-linked GlcNAcylation increases basal autophagic flux
32
by guest on March 20, 2014
http://ww
w.jbc.org/
Dow
nloaded from
Copyright © 2022 FDOKUMEN