Decomposition of 13C-labelled standard plant material in a latitudinal transect of European...
24
Biogeochemistry 54: 147–170, 2001. © 2001 Kluwer Academic Publishers. Printed in the Netherlands. Decomposition of 13 C-labelled standard plant material in a latitudinal transect of European coniferous forests: Differential impact of climate on the decomposition of soil organic matter compartments MARIE-MADELEINE COÛTEAUX 1∗ , PIERRE BOTTNER 1 , JONATHAN M. ANDERSON 2 , BJÖRN BERG 3 , THOMAS BOLGER 4 , PERE CASALS 5 , JOAN ROMANYÀ 5 , JEAN M. THIÉRY 6 & V. RAMON VALLEJO 7 1 CEFE-CNRS, 1919 Route de Mende, F-34293 Montpellier Cedex 5, France; 2 School of Biological Sciences, Hatherly Laboratories, University of Exeter, Prince of Wales Road, Exeter EX4 4PS, U.K.; 3 Department of Soil Ecology, BITÖK, P.O. Box 101251, University of Bayreuth, DE-95 448 Bayreuth, Germany; 4 Department of Zoology, National University of Ireland, Dublin, Belfield, Dublin 4, Ireland; 5 Department Biologia Vegetal, Universitat de Barcelona, 645 Diagonal, SP-08028 Barcelona, Spain; 6 CEA-Cadarache, DSV/DEVM/ Valorisation, F-13108, St Paul lez Durance, France; 7 CEAM, Parque Tecnológico, 46980 Paterna, Spain ( ∗ author for correspondence, e-mail: [email protected]) Key words: 13 C labelling, climatic response functions, decomposition, first-order two- compartment models, global change, soil organic matter compartments Abstract. 13 C labelled plant material was incubated in situ over 2 to 3 years in 8 conifer forest soils located on acid and limestone parent material along a north-south climatic transect from boreal to dry Mediterranean regions in western Europe. The objectives of the experiment were to evaluate the effects of climate and the soil environment on decomposition and soil organic matter dynamics. Changes in climate were simulated using a north-to-south cascade procedure involving the relocation of labelled soil columns to the next warmer site along the transect. Double exponential, decay-rate functions (for labile and recalcitrant SOM compartments) vs time showed that the thermosensitivity of microbial processes depended on the latitude from which the soil was translocated. Cumulative response functions for air temperature, and for combined temperature and moisture were used as independent variables in first order kinetic models fitted to the decomposition data. In the situations where climatic response functions explained most of the variations in decomposition rates when the soils were translocated, the climate optimised decomposition rates for the local and the translocated soil should be similar. Differences between these two rates indicated that there was either no single climatic response function for one or both compartments, and/or other edaphic factors influenced the transloca- tion effect. The most northern boreal soil showed a high thermosensitivity for recalcitrant organic matter compartment, whereas the labile fraction was less sensitive to climate changes for soils from more southern locations. Hence there was no single climatic function which describe the decay rates for all compartments. At the end of the incubation period it was found
Transcript of Decomposition of 13C-labelled standard plant material in a latitudinal transect of European...

Biogeochemistry 54: 147–170, 2001.© 2001 Kluwer Academic Publishers. Printed in the Netherlands.
Decomposition of 13C-labelled standard plant materialin a latitudinal transect of European coniferousforests: Differential impact of climate on thedecomposition of soil organic matter compartments
MARIE-MADELEINE COÛTEAUX1∗, PIERRE BOTTNER1, JONATHANM. ANDERSON2, BJÖRN BERG3, THOMAS BOLGER4, PERECASALS5, JOAN ROMANYÀ5, JEAN M. THIÉRY6 & V. RAMONVALLEJO7
1CEFE-CNRS, 1919 Route de Mende, F-34293 Montpellier Cedex 5, France; 2School ofBiological Sciences, Hatherly Laboratories, University of Exeter, Prince of Wales Road,Exeter EX4 4PS, U.K.; 3Department of Soil Ecology, BITÖK, P.O. Box 101251, University ofBayreuth, DE-95 448 Bayreuth, Germany; 4Department of Zoology, National University ofIreland, Dublin, Belfield, Dublin 4, Ireland; 5Department Biologia Vegetal, Universitat deBarcelona, 645 Diagonal, SP-08028 Barcelona, Spain; 6CEA-Cadarache, DSV/DEVM/Valorisation, F-13108, St Paul lez Durance, France; 7CEAM, Parque Tecnológico, 46980Paterna, Spain (∗author for correspondence, e-mail: [email protected])
Key words: 13C labelling, climatic response functions, decomposition, first-order two-compartment models, global change, soil organic matter compartments
Abstract. 13C labelled plant material was incubated in situ over 2 to 3 years in 8 conifer forestsoils located on acid and limestone parent material along a north-south climatic transect fromboreal to dry Mediterranean regions in western Europe. The objectives of the experiment wereto evaluate the effects of climate and the soil environment on decomposition and soil organicmatter dynamics. Changes in climate were simulated using a north-to-south cascade procedureinvolving the relocation of labelled soil columns to the next warmer site along the transect.
Double exponential, decay-rate functions (for labile and recalcitrant SOM compartments)vs time showed that the thermosensitivity of microbial processes depended on the latitude fromwhich the soil was translocated. Cumulative response functions for air temperature, and forcombined temperature and moisture were used as independent variables in first order kineticmodels fitted to the decomposition data. In the situations where climatic response functionsexplained most of the variations in decomposition rates when the soils were translocated, theclimate optimised decomposition rates for the local and the translocated soil should be similar.Differences between these two rates indicated that there was either no single climatic responsefunction for one or both compartments, and/or other edaphic factors influenced the transloca-tion effect. The most northern boreal soil showed a high thermosensitivity for recalcitrantorganic matter compartment, whereas the labile fraction was less sensitive to climate changesfor soils from more southern locations. Hence there was no single climatic function whichdescribe the decay rates for all compartments. At the end of the incubation period it was found

148
that the heat sum to achieve the same carbon losses was lower for soils in the north of thetransect than in the south. In the long term, therefore, for a given heat input, decompositionrates would show larger increases in boreal northern sites than in warm temperate regions.
The changes in climate produced by soil translocation were more clearly reflected bydecomposition rates in the acid soils than for calcareous soils. This indicates that the physico-chemical environment can have important differential effects on microbial decomposition ofthe labile and recalcitrant components of SOM.
Introduction
Climate warming due to anthropogenic gas emission is expected to increasethe mean surface air temperature of the earth by 2 to 5 ◦C during the next 50–100 yrs and will consequently modify the hydrologic cycle (Houghton et al.1990). As soil organic matter (SOM) is a major reservoir of organic carbon inthe biosphere, any change in the rate of SOM decomposition due to climatechange will lead to either a positive or a negative feedback to atmosphericCO2 concentrations.
Various parameters have been used to represent temperature effects inmodels of SOM. For example, the sum of the daily temperature above 0 ◦Chas been used as an approximation of the heat required to drive biologicalsoil processes (Andrén & Paustian 1987; Honeycutt et al. 1988; Van Cleveet al. 1990; Sparrow et al. 1992) and the van’t Hoff function was used tomodel the responses of decomposition to changing temperature (Jansson &Berg 1985; Andrén & Paustian 1987; Lloyd & Taylor 1994). In addition,several functions, including the Q10 relationship, have been used to describedecomposition response to temperature (Rodrigo et al. 1997; Lomander et al.1998; Kätterer et al. 1998).
Responses to changes in soil moisture have been generally assessed inshort-term, laboratory experiments at constant temperature (Bunnel & Tait1974; Stott et al. 1986; Rodrigo et al. 1997) so that their relevance tofield conditions is questionable. Furthermore, models of soil organic matterdynamics have related these response to soil moisture values predicted fromwater and heat transfer models derived from regional climatic data andresponse functions are based on soil moisture content or water potential(Jansson & Berg 1985; Andrén et al. 1992) or derived from potential evapo-transpiration and precipitation (Parton et al. 1987). It is important that thesecritical parameters for predicting effects of climate change on soil processesare validated by measurements carried out over extended periods of timeunder realistic environmental conditions. Recently, soil-warming experimentshave been carried out in the field in an attempt to simulate the expectedeffects of increases in soil temperature under conditions closer to those in

149
the real world (Peterjohn et al. 1993; Harte et al. 1995, 1996; Ineson et al.1998). A few attempts have been made to examine the climate controls ondecomposition rates using natural climate gradients (Jansson & Berg 1985;Berg et al. 1993; Trumbore et al. 1996; Giardina & Ryan 2000). Ineson et al.(1998) used altitudinal translocation of soil cores as an analogue to climatechange to minimise artefacts due to experimental warming.
In this present study, soils were translocated along a 40–64◦ north latitu-dinal transect to investigate the effects of climate changes on C mineralisationin sites with mean annual temperatures ranging from 0.2 to 15.2 ◦C, andannual precipitation from 396 to 1096 mm, monitoring the variation in 13Cmineralisation over a period of 2 to 3 yrs in a West-European, north-southtransect of coniferous forest soils (Bottner et al. 2000). The present paperpresents results of the modelling synthesis of data of this experiment. Theobjectives were to determine whether (1) a single climatic response func-tion can be used to model decomposition of different fractions of the SOM,(2) these functions are the same for soils in different climatic areas, and(3) response functions vary for soil types within regions. This analysis wasperformed using a two-compartment model with first-order kinetics.
Materials and methods
Experimental design
The data used in the models came from a study conducted at 8 sites locatedin western Europe along two north-south climatic sequences of coniferousforests from northern Sweden (64◦N, boreal climate) to Spain (40◦N, dryMediterranean climate). Major characteristics of the sites and soils are givenin Table 1. The 2 sequences were chosen on the basis of parent materials: acidand calcareous soils. A comprehensive description of the sites and the soiltranslocation (cascade) procedure is given by Bottner et al. (2000). Briefly,columns (diameter: 12 cm, height: 25–30 cm) containing reconstituted soilwere incubated for 2–3 years at their site of origin (donor site; local soil). Inaddition, columns from each site were translocated and incubated in the siteimmediately to the south of the donor site in each sequence (host site; trans-located soil). The southward translocation was considered to be analogousto global temperature increases. A total of 704 columns were incubated inthe field. Soil columns were reconstituted using sieved soil (4-mm mesh)from the different soil horizons according to the organic matter distributionin the profile. In the reconstituted columns, the layers were compacted to theinitial volume, bulk density and thickness (from 2 to 4 cm) of the naturalhorizons. Discs of a 1 mm mesh polyester netting separated them. The major

150
Tabl
e1.
Cha
ract
eris
tics
ofth
est
udy
site
s
Site
sL
atitu
deFo
rest
type
Soil
type
sH
uman
type
spH
(H2
O)
CN
Clim
ate
Tem
pera
ture
∗Pr
ecip
itatio
n∗W
ater
Lon
gitu
deSt
and
age
(FA
O)
ofth
est
udie
d(%
)(%
)ty
pe(◦
C)
(mm
)de
fici
t∗(y
ears
)(m
m)
Aci
dso
ilsse
quen
ce
VIN
DE
LN
64◦ 0
0′N
Pic
eaab
ies
ferr
icpo
dzol
mor
(Oh)
3.4
44.8
1.40
bore
al0.
260
419
(Sw
eden
)21
◦ 05′
E10
0
JÄD
RA
ÅS
60◦ 4
9′N
Pin
ussy
lves
tris
hum
o-fe
rric
mor
(Oh)
3.5
35.7
0.83
bore
al3.
976
330
(Sw
eden
)16
◦ 01′
E14
0po
dzol
HA
LD
ON
50◦ 3
7′N
Pic
eaab
ies
dyst
icca
mbi
sol
acid
mul
l(A
1)5.
15.
80.
39A
tlant
ic10
.113
5315
(UK
)03
◦ 04′
W52
TH
EZ
AN
43◦ 0
7′N
Pin
uspi
nast
erch
rom
iclu
viso
lac
idxe
rom
oder
(Oh)
4.3
40.2
1.03
wet
14.4
579
187
(Fra
nce)
02◦ 4
5′E
>100
acid
mul
l(A
1)5.
25.
30.
13M
edite
rran
ean
DE
SER
T40
◦ 06′
NP
inus
pina
ster
chro
mic
luvi
sol
acid
mul
l(A
1)5.
64.
40.
13dr
y14
.953
823
2
(Spa
in)
00◦ 0
0′E
>100
Med
iterr
anea
n
Cal
care
ous
soils
sequ
ence
FRIS
TO
N50
◦ 37′
NP
inus
sylv
estr
ishu
mic
cam
biso
lne
utra
lmul
l(A
1)4.
15.
20.
36A
tlant
ic11
.180
159
(UK
)00
◦ 12′
W>5
5
LA
CL
APE
43◦ 0
9′N
Pin
usha
lepe
nsis
chro
mic
cam
biso
lne
utra
lxer
omod
er(O
h)5.
240
.21.
64w
et14
.858
719
2
(Fra
nce)
03◦ 0
8′E
>100
calc
icm
ull(
A1)
7.3
2.6
0.14
Med
iterr
anea
n
MA
IAL
S41
◦ 22′
NP
inus
hale
pens
isca
lcic
rego
sol
neut
ralx
erom
oder
(Oh)
7.3
36.5
1.20
dry
15.2
396
414
(Spa
in)
00◦ 2
2′E
30ca
lcar
eous
mul
l(A
1)7.
34.
820.
30M
edite
rran
ean
∗ Lon
g-te
rman
nual
mea
ns.

151
organic horizon(s), Oh and/or A1 horizons depending on the soil types, werelabelled by addition of 13C (10% enrichment) standard plant material (matureuniformly labelled wheat) with low N content. In order to avoid modifyingthe physical and chemical characters of the SOM, the C in the labelled plantmaterial added to the soil never exceeded 3.5% of the initial native soilC. Finally, the columns were covered with litter according to the speciesand litter depth of the donor site. The decomposition of this plant materialreflected the activity of the total decomposer community in each type of soiland layer, giving comparative figures of the biological activity throughout theclimatic transect. Four columns were destructively sampled on each samplingoccasion (7 for Vindeln, 8 for Jädraås and 9 for the other sites). Total C and13C isotopic ratios were measured (1) in the initially labelled horizon and (2)in the horizons directly located above and below it, by the ‘Service Centrald’Analyses’ of the CNRS, Vernaison (France), using a CN elemental analysercoupled with a mass spectrometer (Finnigan delta S or MAT 252).
Climate data
Daily air temperature and precipitation, both long-term and for the periodof the experiment, were provided by national meteorological stations locatedat less than 10 km from the sites (Table 1). For the 2 French sites (Thézanand La Clape), the soil moisture was measured gravimetrically in columnsreconstituted in the same way as the labelled ones. Moisture determina-tions were made every 2 or 3 days over 16 months for Thézan, and 6months for La Clape. The water balance variables were calculated using theWATERBUD computer program (Sharpe & Prowse 1983). The maximumsoil-water storage was fixed at 300 mm (e.g. Meentemeyer 1984; Dyer et al.1990; Kurz et al. 1998) to allow comparisons with previous works. The waterdeficit (Table 1) is the difference between the potential evapotranspiration(PET) according to the procedures of Thornthwaite and Mather (1957) andthe actual evapotranspiration (AET).
Non-linear regression models
All the basic data used for calculations were published earlier by Bottner etal. (2000). Non-linear regression was used to fit the amount of remaining13C to a variety of independent variables using the least-squares technique inPRISM (Graphpad Software, Inc., San Diego, USA). Amounts of 13C foundin the horizon located above the initially labelled horizon were negligibleand the 13C recovered in the horizon located directly below represented lessthan 2–3% of the initial label. Thus the upward migration and the downwardleaching were low. Hence the total 13C remaining in the soil was calculatedas the sum of the 3 horizons, assuming that the initial 13C = remaining 13C +

152
evolved CO2-13C. The following two-compartment, first-order decay modelwas used (Eq. 1)
RC = Ae−kax + Bekbx (1)
where RC is the amount of 13C remaining expressed as a percentage of theinitial 13C; A and B are the initial proportions of 13C (as percent) in the fastand the slow decomposing compartments, respectively (A+B = 100); ka andkb are the decay rate constants for the A and B fractions, respectively, and x
is the independent variable. The 13C at time = 0 was measured on an aliquotof the initial mixture of 13C-labelled straw and soil that was used to fill up thecylinders, and the total remaining 13C during the time course of decomposi-tion was calculated as a percent of this value. Since the same standard 13Clabelled plant material was used in all treatments, the initial proportions ofthe compartments A and B were assumed to be identical in all soils and fixedto 42% for A, the mean value obtained from free adjustments in the acid soilsequence (data not shown). This value is close to the value obtained usingthe CENTURY model (Parton et al. 1987) for partition between metabolicand structural compartments. Fixing the size of the compartments reducedthe number of fitted parameters, therefore reduced the ka and kb fitting errors.
Time is generally used as the independent variable (x) in kinetic models.Since the ‘time’ parameter effectively stops when the temperature and mois-ture conditions prevent any microbial activity, we have used additionalindependent variables to model these processes. Here, we used two climaterelated variables: (1) τsum, the sum of τ (the daily van’t Hoff’s temperatureresponse function calculated with Eqs. 2 and 3), and (2) τµsum, the sum of theproducts of τ and µ (the moisture response function calculated on the basisof water deficit with Eqs. 4 and 5). The aim of this exercise was to definethe optimised decomposition rates based on temperature and temperature ×moisture, ka and kb because if climatic response functions completely explainthe variations when the soils are translocated, the decomposition rates, ka andkb, of the local and the translocated soil should be similar. If this is not thecase, the response function of one or both compartments is more complexand/or factors other than climate contribute to the effect of translocation.
The van’t Hoff function (τ , Eq. 2) has frequently been used to describetemperature related decomposition kinetics (e.g. Jansson & Berg 1985;Andrén & Paustian 1987; Berg et al. 1990; Kätterer et al. 1998; Lomanderet al. 1998):
τ = Q(Td−Tmax)/1010 (2)
where τ is a daily temperature response function normalised from 0 to 1, ifTd ≤ Tmax . Q10 is the rate multiplication factor when temperature increases

153
by 10 ◦C, Td is the mean daily air temperature and Tmax was fixed at 30 ◦C,the highest mean daily temperature that was recorded during the experimentwas calculated for Q10 = 2.2 according to the model fit and literature data(e.g. Jenny 1980 in Kirschbaum 2000).
The sum of the daily τ values (τsum) was used as an independent variable.This variable can be considered as a temperature corrected time factor andrepresents the time required to reach any given level of decomposition whenthe daily temperature is constantly at optimum for microbial processes
τsum =∑
τ (3)
The moisture response function was calculated as
µ = DEFlim − DEF
DEFlim(4)
with µ = 0 when DEF > DEFlim, where µ is a moisture response functionranging in value from 0 to 1, DEF is the actual water deficit computed withthe WATERBUD model on a monthly basis. DEFlim is the threshold overwhich the response function is zero. It was fixed at 90 mm based on the fit tothe model.
The sum of the product (τµsum) of the temperature and moisture responsefunctions was also used as an independent variable.
τµsum =∑
τ × µ (5)
τµsum is considered as a temperature x moisture corrected time and repres-ents the time needed to reach the decomposition level when both temperatureand moisture remain at their optimum.
Statistical treatments
Significance of the differences between the fitted parameters were based onthe confidence interval of the fitting error (p < 0.05). By using successivelytime, τsum, and τµsum as the independent variable, we hypothesise that, if theintroduction of a climatic component into the explanatory variable reducesthe distances between the decomposition curves of the local and translocatedsoil, the difference between these decomposition kinetics is related to climate.To test the modification of this distance by the independent variable, for eachsoil, we fitted a common non-linear regression curve to the combined data ofthe local and translocated soils for the 3 independent variables. Then we useda Student t-test to compare the residuals of the local and the translocateddata with respect to this common curve. If the climatic parameters have an
154
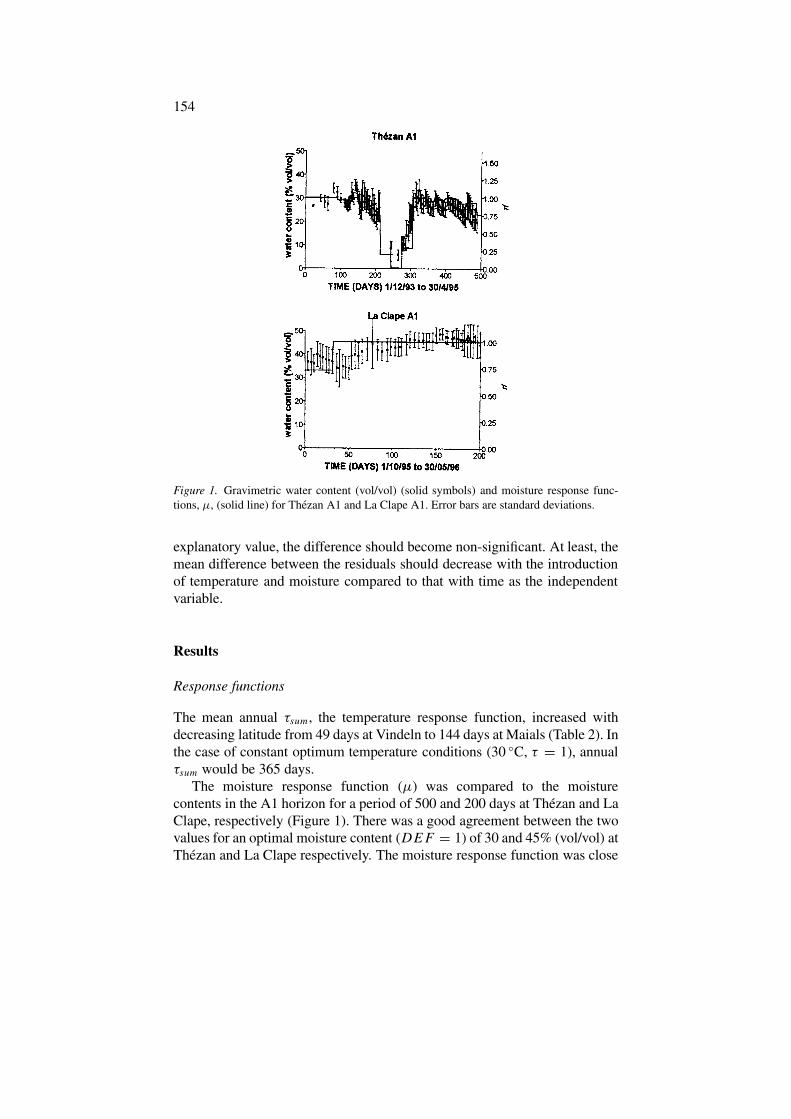
Figure 1. Gravimetric water content (vol/vol) (solid symbols) and moisture response func-tions, µ, (solid line) for Thezan A1 and La Clape A1. Error bars are standard deviations.
explanatory value, the difference should become non-significant. At least, themean difference between the residuals should decrease with the introductionof temperature and moisture compared to that with time as the independentvariable.
Results
Response functions
The mean annual τsum, the temperature response function, increased withdecreasing latitude from 49 days at Vindeln to 144 days at Maials (Table 2). Inthe case of constant optimum temperature conditions (30 ◦C, τ = 1), annualτsum would be 365 days.
The moisture response function (µ) was compared to the moisturecontents in the A1 horizon for a period of 500 and 200 days at Thézan and LaClape, respectively (Figure 1). There was a good agreement between the twovalues for an optimal moisture content (DEF = 1) of 30 and 45% (vol/vol) atThézan and La Clape respectively. The moisture response function was close

155
Tabl
e2.
Para
met
erva
lues
and
coef
fici
ents
ofde
term
inat
ion
(R2)
for
the
two
com
part
men
tfi
rst
orde
rm
odel
wit
hti
me,
τ sum
and
τµ
sum
asin
depe
nden
tva
riab
le.A
was
fixe
dat
42%
Soi
lH
oriz
onH
osts
ite∗
Inde
pend
ent
vari
able
x=
tim
e(d
ays)
x=
τ sum
(day
s)x
=τµ
sum
(day
s)
ka
kb
R2
ka
kb
R2
ka
kb
R2
Aci
dse
quen
ce
Vin
deln
Oh
Vin
deln
0.00
88bc
∗∗0.
0003
5a
0.93
0.04
5cd
0.00
35de
0.95
0.04
4c
0.00
44bc
d0.
95
Oh
Jädr
aås
0.00
93c
0.00
076
cd0.
970.
042
c0.
0061
f0.
970.
049
c0.
0066
e0.
96
Jädr
aås
Oh
Jädr
aås
0.01
32cd
0.00
051
b0.
950.
049
cd0.
0042
e0.
980.
057
c0.
0046
cd0.
98
Oh
Hal
don
0.00
82bc
0.00
085
d0.
970.
050
cd0.
0038
e0.
970.
056
c0.
0041
c0.
97
Hal
don
A1
Hal
don
0.01
67d
0.00
069
c0.
960.
104
d0.
0032
d0.
970.
118
d0.
0034
b0.
97
A1
The
zan
0.00
59b
0.00
077
cd0.
950.
030
bc0.
0020
b0.
930.
025
b0.
0038
bc0.
94
The
zan
Oh
The
zan
0.02
28cd
0.00
054
b0.
920.
061
cd0.
0014
ab0.
910.
103
cd0.
0026
ab0.
93
Oh
Des
ert
0.00
92bc
0.00
052
b0.
930.
021
b0.
0014
a0.
930.
051
c0.
0028
ab0.
93
A1
The
zan
0.01
22cd
0.00
057
bc0.
920.
030
bc0.
0016
ab0.
910.
054
c0.
0028
ab0.
93
A1
Des
ert
0.01
72d
0.00
057
bc0.
94no
conv
erge
nce
noco
nver
genc
e

156
Tabl
e2.
Con
tinu
ed
Soi
lH
oriz
onH
osts
ite∗
Inde
pend
ent
vari
able
x=
tim
e(d
ays)
x=
τ sum
(day
s)x
=τµ
sum
(day
s)
ka
kb
R2
ka
kb
R2
ka
kb
R2
Cal
care
ous
sequ
ence
Fri
ston
A1
Fri
ston
0.01
87d
0.00
115
e0.
950.
077
d0.
0043
e0.
960.
105
d0.
0050
d0.
97
A1
La
Cla
pe0.
0121
cd0.
0007
9cd
0.96
0.04
3cd
0.00
22bc
0.97
0.05
2c
0.00
35bc
0.96
La
Cla
peO
hL
aC
lape
0.00
23a
0.00
066
bcd
0.94
0.00
6a
0.00
20ab
cd0.
930.
010
a0.
0029
ab0.
93
Oh
Mai
als
0.00
32ab
0.00
056
abc
0.84
0.00
6a
0.00
17ab
0.76
0.03
5bc
0.00
22a
0.96
A1
La
Cla
pe0.
0249
bcd
0.00
089
d0.
950.
112
d0.
0025
c0.
960.
106
bcd
0.00
40bc
0.96
A1
Mai
als
0.03
03d
0.00
097
de0.
950.
056
cd0.
0024
bc0.
960.
162
d0.
0052
de0.
96
∗ Sit
esw
here
the
soil
sw
ere
incu
bate
d.∗∗
Dif
fere
ntle
tter
sin
dica
tesi
gnifi
cant
diff
eren
ces
wit
hin
aco
lum
n(p
<0.
05).
157
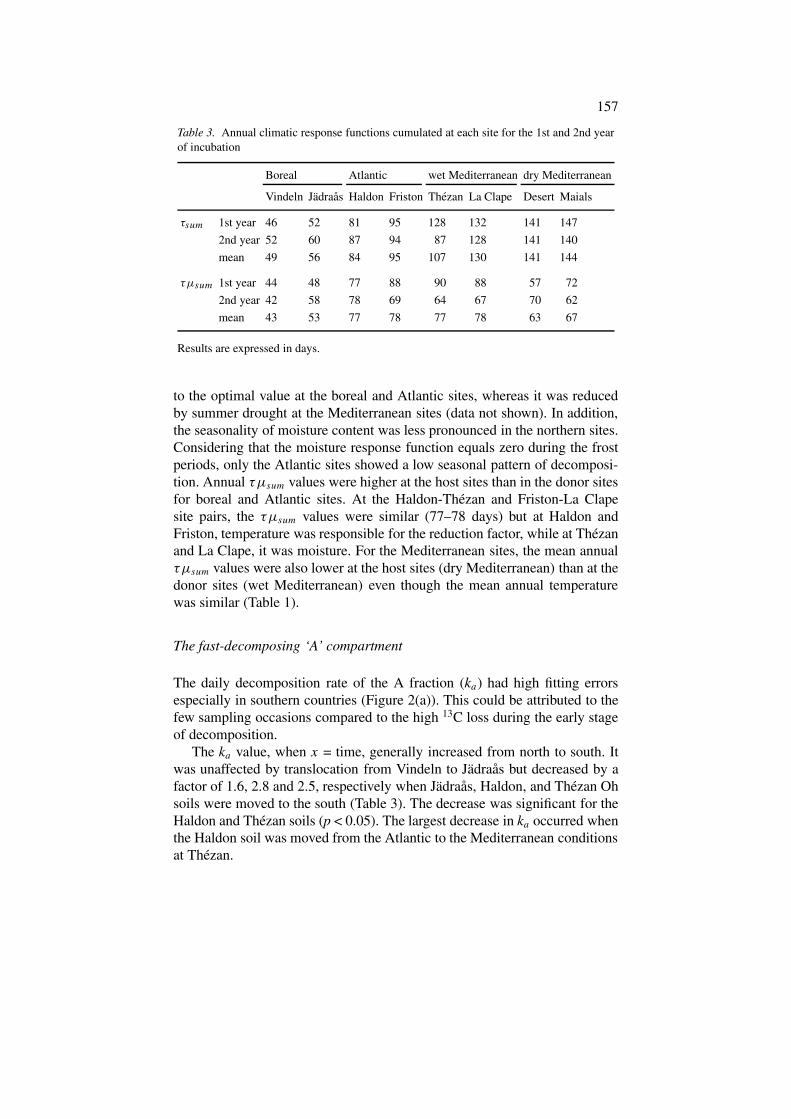
Table 3. Annual climatic response functions cumulated at each site for the 1st and 2nd yearof incubation
Boreal Atlantic wet Mediterranean dry Mediterranean
Vindeln Jädraås Haldon Friston Thezan La Clape Desert Maials
τsum 1st year 46 52 81 95 128 132 141 147
2nd year 52 60 87 94 87 128 141 140
mean 49 56 84 95 107 130 141 144
τµsum 1st year 44 48 77 88 90 88 57 72
2nd year 42 58 78 69 64 67 70 62
mean 43 53 77 78 77 78 63 67
Results are expressed in days.
to the optimal value at the boreal and Atlantic sites, whereas it was reducedby summer drought at the Mediterranean sites (data not shown). In addition,the seasonality of moisture content was less pronounced in the northern sites.Considering that the moisture response function equals zero during the frostperiods, only the Atlantic sites showed a low seasonal pattern of decomposi-tion. Annual τµsum values were higher at the host sites than in the donor sitesfor boreal and Atlantic sites. At the Haldon-Thézan and Friston-La Clapesite pairs, the τµsum values were similar (77–78 days) but at Haldon andFriston, temperature was responsible for the reduction factor, while at Thézanand La Clape, it was moisture. For the Mediterranean sites, the mean annualτµsum values were also lower at the host sites (dry Mediterranean) than at thedonor sites (wet Mediterranean) even though the mean annual temperaturewas similar (Table 1).
The fast-decomposing ‘A’ compartment
The daily decomposition rate of the A fraction (ka) had high fitting errorsespecially in southern countries (Figure 2(a)). This could be attributed to thefew sampling occasions compared to the high 13C loss during the early stageof decomposition.
The ka value, when x = time, generally increased from north to south. Itwas unaffected by translocation from Vindeln to Jädraås but decreased by afactor of 1.6, 2.8 and 2.5, respectively when Jädraås, Haldon, and Thézan Ohsoils were moved to the south (Table 3). The decrease was significant for theHaldon and Thézan soils (p < 0.05). The largest decrease in ka occurred whenthe Haldon soil was moved from the Atlantic to the Mediterranean conditionsat Thézan.

158
Figure 2. Relationships between the latitude of soil column incubation and decompositionrate constants (ka and kb) for the double exponential function when x = time (a, b), x = τsum
(c, d), and x = τµsum (e, f). Error bars are 95% confidence intervals.
When the cumulative daily van’t Hoff function τsum was used as x value,the temperature corrected ka values (0.006 to 0.112 day−1) were 3 to 4times higher than the ka values obtained using time alone as the independentvariable (0.002–0.03 day−1). The distribution pattern of these values wascomparable (Figures 2(a) and (c)), with generally higher values for the lime-stone soils compared to the acid soils. The distribution range of values wasnot reduced. Thus the temperature optimisation improved the ka estimation inboreal translocations, whereas it had little effect in the other translocations.
When the cumulated daily value τµsum (sum of the products of the van’tHoff function and the moisture response function) was taken as the x value(Eq. (1); Table 3, Figure 2(e), Figure 3), the range of variation in ka wasof the same amplitude as when τsum was used. This indicates that moisture

159
Figure 3. Remaining 13C vs τµsum for each soil. Closed symbols are measured data at donorsite. Open symbols are measured data at host site. Solid lines are predicted values at donorsite, dashed lines are predicted values at host site using a double exponential model. Errorbars are standard deviations.

160
may have contributed much less than temperature in determining the ratesof decomposition. However, the use of the combined coefficients decreasedthe fitting errors compared to the van’t Hoff function alone, indicating animproved explanation of the climatic effect by the τµsum variable althoughfor most soils, the ka variations due to translocation were poorly explained byclimate.
The slow-decomposing ‘B’ compartment
The values for kb, when x = time, of the most northern soils were increasedsignificantly (p < 0.05) by translocation. For Vindeln the increase was a factorof 2.1 and for Jädraås 1.7. There was a non-significant increase for Haldonsoil and the value was unchanged for Thézan Oh and A1 soils (Table 3,Figure 2(b)).
In the calcareous sequence, the kb values of Friston and La Clape A1 soilsshowed significantly higher loss rates than in the acid sequence. The Mediter-ranean soil at La Clape is of special interest because its upper horizon, Oh (axeromoder), had the lowest ka value and its deeper organic horizon (A1) thehighest ka value. Unlike the acid sequence, the calcareous sequence did notshow any trend as a consequence of translocation except for the translocationof the Friston soil to La Clape where there was a significant reduction of kb
(times 0.69, p < 0.05).The kb values were 4–5 times higher than those obtained with time as
independent variable. They displayed two different patterns: (i) the boreal andAtlantic soils with the highest values and (ii) the Mediterranean soils with thelowest values (Figure 2(d)). For the Vindeln soil, the translocated/local kb
ratio was reduced from 2.2 to 1.7 for x = time and x = τsum respectively.This indicates that although the difference between the local and translocatedkb constants was reduced, temperature did not completely explain the trans-location effect. In contrast, values of kb converged for local and translocatedJädraås soils. Both Atlantic soils showed a significant decrease of kb whentranslocated to the Mediterranean conditions, again illustrating that tempera-ture alone did not explain the response to translocation. The translocationfrom wet to dry Mediterranean climate did not significantly modify kb values.The values were very close regardless of the soil type (acid or calcareous),of the kind of horizon (Oh or A1) and of the origin of the soils (local ortranslocated).
Statistical significance of the soil translocation
The differences between the residuals of the data for the local and thetranslocated samples compared to the common fitted curve adjusted to thecombined data set for x = time, τsum and τµsum are shown in Table 4. If

161
Table 4. Mean differences between the residuals of the local or translocated 13C datacompared to the common fitted curve
Soil x = time (days) t-test x = τsum (days) t-test x = τµsum (days) t-test
Acid sequence
Vindeln Oh 9.43 ± 2.20 *** 6.69 ± 1.97 ** 6.10 ± 2.07 *
Jädraås Oh 4.75 ± 2.12 * –1.03 ± 1.05 ns –1.38 ± 1.11 ns
Haldon A1 –3.21 ± 2.17 ns –9.92 ± 2.12 *** –4.74 ± 2.66 ns
Thezan Oh –3.41 ± 2.15 ns –3.86 ± 2.24 ns –1.39 ± 2.05 ns
A1 1.52 ± 1.77 ns 1.07 ± 1.99 ns 3.57 ± 1.78 ns
Calcareous sequence
Friston A1 –6.89 ± 1.81 ** –11.1 ± 1.58 *** –6.98 ± 1.61 ***
La Clape Oh 0.64 ± 4.11 ns –3.98 ± 4.56 ns 4.85 ± 3.95 ns
A1 1.45 ± 2.03 ns –1.97 ± 1.92 ns 4.34 ± 1.90 *
the climate optimised independent variable explained the variation in theamounts of remaining 13C, the differences should decrease. This was thecase for Vindeln and Jädraås soils. For these, temperature had a dominanteffect on decomposition. For the Haldon and Friston soils translocated intoa wet Mediterranean climate, introducing temperature into the independentvariable increased the difference showing that the temperature effect was lessimportant than some other factor. As shown by the decrease of the differences,the introduction of a moisture effect reduced the variation in decompositioncoefficients. For the Mediterranean soils, the differences were not signi-ficant, with all independent variables showing that the effect of changingthe climate was low. However, the effects of drought limitation of microbialprocesses is already strong in the south of France and the translocation didnot change the moisture effect to any great extent. Nevertheless, significantdifferences between local and translocated Vindeln, Friston and La ClapeA1 soils indicated the effect of other factors than climate when soils weretranslocated.
Discussion
Temperature and moisture response functions
The sum of the daily temperatures above zero has been used as a heat unit(Andrén & Paustian 1987; Van Cleve et al. 1990; Sparrow et al. 1992;Vreeken-Buijs & Brussaard 1996). For example, Honeycutt et al. (1988)

162
showed, in laboratory studies, that a single line could described soil respira-tion at different temperatures when cumulative CO2 efflux was plottedagainst degree-days. Hence a single parameter collectively accounted for thetemperature effects on the microbial decomposition processes.
The exponential Q10 rate function based on the van’t Hoff law is widelyused in modelling the response of soil C pools to temperature. Das etal. (1995) showed that Q10 integrates oscillating temperature effects andsuggested the use of a rate unit accumulation rather than heat unit accumula-tion. We used the sum of the daily van’t Hoff function (τsum) with an optimaldaily temperature of 30 ◦C and a fixed Q10 of 2.2. This value is close to themedian value 2.4 given by Raich and Schlesinger (1992) for respiration ofa large range of soils. However, Q10 appears to vary with temperature andSchleser (1982) and Kirschbaum (1995) calculated low values under hightemperatures and high values (up to 6) under low temperatures. From 149values given in the literature (Table 5), we calculated a linear relationshipbetween Q10 and temperature: Q10 = −0.0708T + 3.61 and based on thisrelationship, we calculated τ using a variable Q10. τsum was increased for alltreatments with higher increases for the warm sites than for the cold ones.However the fit was not improved (results not shown). Kätterer et al. (1998)also found that a constant Q10 was adequate for describing the temperaturedependence in the intermediate temperature range (about 5–35 ◦C).
At Jädraås, air temperature was recorded at the same time as soil tempera-ture (0 to 10 cm). The calculation of τ and the model fits were not improvedby using soil temperature and we therefore consider that air temperature maybe used for modelling SOM decomposition.
We assumed that the response function to moisture was linear with thewater deficit between 0 (µ = 1) and a limit water deficit (DEFlim) abovewhich the decomposition stops (µ = 0). For high moisture contents, soilconditions become anaerobic and decomposition rates decrease. In thesesequences, soils were located in well-drained areas and we assumed thatthe anaerobic threshold was generally not reached. Under field conditions,good predictions of soil respiration or decomposition for moisture controlwere obtained by Schlentner and Van Cleve (1985) using the GRESP model(Bunnel & Tait 1974) and by Jansson and Berg (1985) using the ratio of thecurrent moisture content or the water potential to an optimal threshold.
Several authors (Wildung et al. 1975; Casals et al. 2000) have shown,from field data, that the moisture effect on microbial respiration is tempera-ture dependent. At low temperatures, the increase in moisture content hasa small effect on soil respiration whereas the range of response to mois-ture increases at higher temperatures. In order to take the interactive effectsbetween temperature and moisture into account, the authors generally usethe product of the temperature and moisture response functions (e.g. Jansson

163
Tabl
e5.
Sou
rce
data
forQ
10va
lues
for
CO
2pr
oduc
tion
orm
ass
loss
Dat
eso
urce
Tem
pera
ture
sM
easu
rem
ent
Eco
syst
emC
ount
ry
Don
nell
yet
al.1
990
4,12
,24
mas
slo
ssfo
rest
Ore
gon,
US
A
Hol
land
etal
.199
515
,25,
45,5
5C
O2
effl
uxpa
stur
e,fo
rest
Haw
aii,
US
A
Joer
gens
enet
al.1
990
15,2
5,35
CO
2ef
flux
gras
slan
dU
K
Nad
elho
ffer
etal
.199
13,
9,15
CO
2ef
flux
tund
raA
lask
a,U
SA
O’C
onne
ll19
904,
20,3
5C
O2
effl
uxE
ucal
yptf
ores
tso
uth-
wes
tern
Aus
tral
ia
Pet
erjo
hnet
al.1
993
+5
CO
2ef
flux
mix
edde
cidu
ous
fore
stM
assa
chus
etts
,US
A
Pöh
hack
er&
Zec
h19
955,
15m
ass
loss
beec
hfo
rest
Ger
man
y
Ros
s&
Cai
rns
1978
0,5,
10,1
5,20
,25
CO
2ef
flux
tuss
ock
gras
slan
dN
ewZ
eala
nd
Set
o&
Yan
agiy
a19
8315
,20,
30C
O2
effl
uxvo
lcan
icfo
rest
Japa
n
Sto
ttet
al.1
986
0,5,
10,1
5,20
CO
2ef
flux
whe
atre
sidu
e
Tow
nsen
det
al.1
997
20,3
0,40
CO
2ef
flux
past
ure,
fore
stH
awai
i,U
SA
Win
kler
etal
.199
64,
15,2
2,38
CO
2ef
flux
mix
edfo
rest
Nor
thC
arol
ina,
US
A
Wol
ters
&E
ksch
mit
t199
55,
15C
O2
effl
uxbe
ech
litte
rG
erm
any

164
Figure 4. Linear regression between kb and latitude (LAT) for local (kb = 0.9.10−4 LAT– 1.2.10−3, R2 = 0.96, p < 0.01, solid line) and translocated soils (kb = 1.6.10−4 LAT –3.5.10−3, R2 = 0.91, p < 0.05, dashed line).
& Berg 1985; Parton et al. 1987; Rodrigo et al. 1997; Kätterer et al. 1998).Although the balance between both response functions is arbitrary, there is aconsensus about the validity of this simple combination.
In the present study, the effect of the translocation on 13C decompositionwas largely explained by the combined response function for the Jädraås soilindicating that the variation of decomposition rates due to the translocationwas almost exclusively due to the climate. However, for the other soils,discrepancies between the measured and expected data indicate that otherfactors must be involved.
Deviation from expected trends
If both climate components completely explain the observations, the tempera-ture × moisture optimised ka and kb parameters should reach similarrespective values (1) amongst the sites and (2) for the local and transplantedsoils, regardless the climatic condition of the sites. This was not generally thecase. The value of ka was similar for both boreal soils (Vindeln & Jädraås)(Figure 2(e)) and for donor and host sites but for more southerly soils, ka
was different in both Atlantic local soils (Haldon & Friston) and in the localMediterranean soils of La Clape Oh and A1. Thus the ka values of most ofthe local and translocated Atlantic and Mediterranean soils differ and wereunexplained by the climate variables alone. From Figures 2(a) to 2(c) to1(e) only the fitting errors were improved. The range of variation of kb wasreduced for the τµsum optimised values (Figure 2(f)). Nevertheless, despite

165
the overlap of the fitting errors, the kb showed a trend of lowering from northto south in the acid sequence as indicated by the linear regression for both thelocal and the translocated soils (Figure 4). The slope of this regression wassignificantly different from 0, thus the temperature × moisture optimised kb
values decreased from north to south. No trend appeared in the calcareoussequence.
By the end of the experiment (after 3–3.5 years), the 13C remaining inthe soils was 30–25% of the initial amount, reaching similar levels of miner-alisation at all sites, and for local and translocated soils and may indicatethat the stabilised fraction was insensitive to climate variation. Giardinaand Ryan (2000) have shown that responses of soil-C turnover along meanannual temperature gradients to increased temperatures are small, ephemeralor non-existent. However, the amount of C stabilisation occurred earlier inthe warmer southern sites than in the colder northern sites. This was reflectedby the overall decline in kb and increase in ka values as towards the south.This also implied (and was observed when the measured data were plottedagainst τsum) that the northern soils required less temperature units thanthe southern soils to reach the same mineralisation level, even if τsum iscorrected by µsum (Figure 3). Using soils from the same sites as in the presentexperiment, McTiernan (1998) showed under laboratory conditions, that soilmicrobial inocula originating from Mediterranean coniferous forests inducedlower decomposition rates at all temperatures than inocula originating fromboreal forests. He concluded that the decomposer community differed eitherin composition or in efficiency with respect to climate. Dalias et al. (2001a,b),incubating soils at different temperature found that the magnitude of thetemperature response function was related to the period of soil incubation.Initial temperature responses of microbial communities were different tothose shown after a long period of laboratory incubation and may havereflected shifts in microbial species composition in response to changes in thetemperature regime. The amount of material that can be readily decomposed,at a given decomposition stage, was higher in samples incubated at 4 ◦C thanat 30 ◦C. It was concluded that in addition to temperature controlling rates ofC mineralisation in soil it also affects the processes of decomposition so thatmaterial produced at higher temperatures was more recalcitrant than at lowertemperatures. These results support the hypothesis that there is probably not asingle decomposition response function to climate as confirmed by the overalllowering of kb in Figure 2(f).
Finally for kb, three results deviate from the general distribution pattern:the translocated Vindeln soil and limestone Friston and La Clape soils(Figure 2(f)). The translocation of the Vindeln soil stimulated the decom-position of the B fraction to an extent not directly explained by the climateparameters (Figure 2(b), (d) and (f)). At Vindeln the top organic soil may

166
be temporarily under anaerobic conditions at snowmelt when the sub-soil isstill frozen with a high ground water, thus preventing the normal drainage. AtJädraås, under warmer conditions, with deep ground water and well-drainedsoil, this phenomenon is expected to be less pronounced and of a shorterduration. Thus the deviation of the translocated Vindeln soil may be explainedby a climate effect that was not reflected by the response functions.
The temperature effect prevailed at the northern sites. The Mediterraneansites were dominated by prolonged water stress (Table 1) and the temperatureeffect was counteracted by µ close to 0 during summers. This is illustratedby comparing data in Figure 2(d) and (f) for the boreal and Atlantic sites,where the kb values were not modified when the moisture factor was inte-grated, in contrast, moisture reduced the generally sinking of kb values forthe Mediterranean sites.
Soil physico-chemical characters, given by Bottner et al. (2000), can insome cases explained the higher and climate-independent dispersion of ka
rates. Bottner et al. (1998) found, for some soils of these series that mineral-isation rates in the laboratory were generally higher for the calcareous soils,possibly because the microbial activity was stimulated by neutral or basicpH and more nutrient-rich soils. This may explain the higher ka values forLa Clape A1, and Friston (local soil) but also the higher kb values of thesecalcareous soils. Thus soil pH may be considered as a factor determiningdecomposition parameters. The Oh horizon at La Clape deserves specialconsideration. The humus type is morphologically recognised as a ‘xero-moder’, where the raw humus accumulates and remains largely undecom-posed, probably due to the extreme dry conditions of the top horizon. Insuch Mediterranean soils, the top organic horizon is isolated from the mineralsoil by a layer of stones (Bottner et al. 2000; Casals et al. 2000) which wassimulated in the soil columns. Nevertheless the particular conditions of thishorizon does not completely explain the ka and kb, since the climate optimisedka and kb are still deviated toward the lowest values (Figure 2(e) and (f)compared to (a) and (b)). Obviously, in these ‘xeromoders’, the microbialcomposition and efficiency are different from the other soils. The Haldon soil(the Atlantic site of the acid sequence) also shows a high ka value unexplainedby climate. All the other acid soils, developed on granite or sandstone, aresandy soils. The Haldon soil, developed on chalk, is characterised by a muchhigher clay content which should reduce the 13C mineralisation rate. Thusfor the climate optimised ka values, the local Haldon soil and the significantdifferences after translocation of Friston, Haldon and La Clape Oh soilsremain unexplained. The translocation effect of the Mediterranean wet soilsto the dry Mediterranean zone was generally significant neither for ka nor forkb. This is may be explained by the fact that the climate differences are toosmall especially for temperature (Table 1).

167
The kb parameter was expected to be more closely related to the soilcharacteristics than ka, since the stabilised B pool is closely linked to thesoil mineral part and this is confirmed for the limestone soils. Nevertheless,in general, our results show that ka was less explainable by the climatecomponents than kb suggesting for ka a higher contribution from the soilphysico-chemical environment. The specific temperature response of A andB pools is another possible explanation. Despite Kätterer et al. (1998) andLomander et al. (1998) assumption that the decomposition rates of differentSOM compartments are equally affected by temperature, the results of thisstudy suggest, as mentioned also by Trumbore et al. (1996), that the poolsmay not have responded in the same way to climate conditions.
Conclusions
This experiment, using standard 13C labelled plant material, showed that noneof the effects on decomposition, due to changes in temperature and mois-ture produced by translocating soil between sites, were explained by a singleclimatic response function.1. Estimates of kb values were better than for the ka values;2. except for boreal sites, the slow-decomposing compartment B was more
sensitive to climate than the fast-decomposing compartment A;3. except for the Jädraås soil, the climate response functions did not fully
explain the translocation effect;4. the kb values optimised for climate decreased with latitude indicating that
the SOM stabilisation occurred earlier in warmer sites; and5. some indirect effects of climate are not taken into account by the response
functions. For example, the anaerobic conditions that may occur duringthe spring when permafrost smelt in the boreal site of Vindeln, or thestrong water stress that occurred in xeromoder laying on a stone layer inthe Mediterranean site of La Clape.
Acknowledgements
This study was performed within the VAMOS programme funded bythe European Union (Climate and Environment programme, DG XII,EV5VCT920141). We thank G Billès, H Casabianca, V Coûteaux, J Cortina,P Cox, P Dalias, F Picasso, P Rovira, L Sanger, P Splatt and MJ Whelan fortheir contributions to the experiment. We are also grateful to Prof V Meente-meyer for providing the WATERBUD model. Financial support for this workwas also provided by German Ministry for Education, Science, Research and

168
Technology (BMBF, Grant No PT BEO-51-0339476) to Dr Björn Berg, whileworking as a guest scientist at BITÖK, University of Bayreuth.
References
Andrén O & Paustian K (1987) Barley straw decomposition in the field: A comparison ofmodels. Ecology 68: 1190–1200
Andrén O, Steen E & Rajkai K (1992) Modelling the effects of moisture on barley straw androot decomposition in the field. Soil Biol. Biochem. 24: 727–736
Berg B, Berg MP, Bottner P, Box E, Breymeyer A, Calvo de Anta R, Coûteaux MM, EscuderoA, Gallardo A, Kratz W, Madeira M, Mälkönen E, McClaugherty C, Meentemeyer V,Muñoz F, Piussi P, Remacle J & Virzo De Santo A (1993) Litter mass loss rates in pineforests of Europe and Eastern United States: some relationships with climate and litterquality. Biogeochem. 20: 127–153
Berg B, Jansson PE & McClaugherty C (1990) Climate variability and litter decomposition,results form a transect study. In: Boer MM & De Groot RS (Eds) Landscape-ecologicalImpact of Climatic Change (pp 250–273). IOS Press, Amsterdam
Bottner P, Austrui F, Cortez J, Billès G & Coûteaux MM (1998) Decomposition of 14C and15N labelled plant material, under controlled conditions, in coniferous forest soils fromnorth-south climatic sequences of Western Europe. Soil Biol. Biochem. 30: 597–610
Bottner P, Coûteaux MM, Anderson JM, Berg B, Billès G, Bolger T, Casabianca H, RomanyàJ & Rovira P (2000) Decomposition of 13C labelled plant material in a European 60◦–40◦latitudinal transect of coniferous forest soils: simulation of climate change by translocationof soils. Soil Biol. Biochem. 32: 527–543
Bunnell FL & Tait DEN (1974) Mathematical simulation models for comparisons betweentundra sites. In: Holing AJ, Heal OW, MacLean SF Jr & Flanagan PW (Eds) Soil Organ-isms and Decomposition in Tundra (pp 207–225). Tundra Biome Steering Comittee,Stockholm
Casals P, Romanyà J, Cortina J, Bottner P, Coûteaux MM & Vallejo VR (2000) CO2 effluxfrom a Mediterranean semi- arid forest soil. I. Seasonality and effects of stoniness.Biogeochem. 48: 261–281
Dalias P, Anderson JM, Bottner P & Coûteaux MM (2001a) Long-term effects of temperatureon carbon mineralisation processes. Soil Biol. Biochem., in press
Dalias P, Anderson JM, Bottner P & Coûteaux MM (2001b) Temperature responses of carbonmineralisation in conifer forest soils from different regional climates incubated understandard laboratory conditions. Glob. Change Biol., in press
Das B, Kluitenberg GJ & Pierzynski GM (1995) Temperature dependence of nitrogenmineralization rate constant: a theoretical approach. Soil Sc. 159(5): 294–300
Dyer ML, Meentemeyer V & Berg B (1990) Apparent controls of mass loss rate of leaf litteron a regional scale. Scand. J. For. Res. 5: 311–323
Donnelly PK, Entry JA, Crawford DL & Cromack K (1990) Cellulose and lignin degradationin forest soils: response to moisture, temperature and acidity. Microbial Ecology 20: 289–295
Giardina CP & Ryan MG (2000) Evidence that decomposition rates of organic carbon inmineral soil do not vary with temperature. Nature 404: 858–861
Harte J, Rawa A & Price V (1996) Effects of manipulated soil microclimate on mesofaunalbiomass and diversity. Soil Biol. Biochem. 28: 313–322

169
Harte J, Torn MS, Chang F, Feifarek B, Kinzig AP, Shaw R & Shen K (1995) Global warmingand soil microclimate: Results from a meadow-warming experiment. Ecol. Appl. 5: 132–150
Holland EA, Townsend AR & Vitousek PM (1995) Variability in temperature regulation ofCO2 fluxes and N mineralization from five Hawaiian soils: Implications for a changingclimate. Glob. Change Biol. 1: 115–123
Honeycutt CW, Zibilske LM & Clapham WM (1988) Heat units for describing carbonmineralization and predicting net nitrogen mineralization. Soil Sc. Soc. Am. J. 52:1346–1350
Houghton JT, Jenkins GJ & Ephraums JJ (1990) Intergovernmental Panel of Climate Change.Climate Change: The IPCC Scientific Assessment. Press Syndicate of the University ofCambridge, Cambridge
Ineson P, Taylor K, Harrison AF, Poskitt J, Benham DG, Tipping E & Woof C (1998) Effectsof climate change on nitrogen dynamics in upland soils. I. A transplant approach. Glob.Change Biol. 4: 143–152
Jansson PE & Berg B (1985) Temporal variation of litter decomposition in relation to simu-lated soil climate. Long-term decomposition in a Scots pine forest. V. Can. J. Bot. 63:1008–1016
Jenny H (1980) The Soil Resource: Origin and Behaviour. Springer Verlag, New YorkJoergensen RG, Brookes PC & Jenkinson DS (1990) Survival of the soil microbial biomass at
elevated temperatures. Soil Biol. Biochem. 22: 1129–1136Kätterer T, Reichstein M, Andrén O & Lomander A (1998) Temperature dependence of
organic matter decomposition: a critical review using literature data analyzed withdifferent models. Biol. Fert. Soils 27: 258–262
Kirschbaum MUK (1995) The temperature dependence of soil organic matter decomposition,and the effect of global warming on soil organic C storage. Soil Biol. Biochem. 27: 753–760
Kirschbaum MUK (2000) Will changes in soil organic carbon act as a positive or negativefeedback on global warming. Biogeochem. 48: 21–51
Kurz C, Coûteaux MM, Ribeiro C & Romanyà J (1998) Decomposition and changes inthe chemical composition of Pinus pinaster needles in three forests with different waterregimes: a kinetic model based on direct measurements. 16th World Congress of SoilScience, Montpellier, 20–26/08/1998, CDrom
Lomander A, Kätterer T & Andrén O (1998) Modelling the effects of temperature and mois-ture on CO2 evolution from top- and subsoil using a multicompartment approach. SoilBiol. Biochem. 30: 2023–2030
Lloyd J & Taylor A (1994) On the temperature dependence of soil respiration. Funct. Ecol. 8:315–323
McTiernan KB (1998) The effect of climate on the decomposition of chemical constituents oftree litters. PhD, Lancaster University, 175 pp
Meentemeyer V (1984) The geography of organic matter decomposition. An. Ass. Am. Geogr.74: 551–560
Nadelhoffer K, Giblin A, Shaver G & Laundre J (1991) Effects of temperature and substratequality on element mineralization in six artic soils. Ecology 72: 242–253
O’Connell A (1990) Microbial decomposition (respiration) of litter in Eucalypt forests ofsouth-Western Australia: an empirical model based on laboratory incubations. Soil Biol.Biochem. 22: 153–160
Parton WJ, Schimel DS, Cole CV & Ojima DS (1987) Analysis of factors controling soilorganic matter levels in great plains grasslands. Soil Sc. Soc. Am. J. 51: 1173–1179

170
Peterjohn WT, Melillo JM, Bowles FP & Steudler PA (1993) Soil warming and trace gasfluxes: experimental design and preliminary flux results. Oecologia: 93: 18–24
Pöhhacker R & Zech W (1995) Influence of temperature on CO2 evolution, microbial biomassC and metabolic quotient during the decomposition of two humic forest horizons. Biol.Fertil. Soils 19: 239–245
Raich JW & Schlesinger WH (1992) The global carbon dioxide flux in soil respiration and itsrelationship to vegetation and climate. Tellus 44B: 81–99
Rodrigo A, Recous S, Neel C & Mary B (1997) Modelling temperature and moisture effectson C-N transformations in soils: comparison of nine models. Ecol. Model. 102: 325–339
Ross DJ & Cairns A (1978) Influence of temperature on biochemical processes in some soilsfrom tussock grasslands. New Zealand J. Sci. 21: 581–589
Schlentner RE & Van Cleve K (1985) Relationships between CO2 evolution from soil,substrate temperature, and substrate moisture in four mature forest types in interior Alaska.Can. J. For. Res. 15: 97–106
Schleser GH (1982) The response of CO2 evolution from soils to global temperature changes.Zeitsch. Naturfor. 37a: 287–291
Seto M & Yanagiya K (1983) Rate of CO2 evolution from soil in relation to temperature andamount of dissolved organic carbon. Japan. J. Ecol. 33: 199–205
Sharpe DM & Prowse CW (1983) WATERBUD: Water Budget Concepts and Applications.Environmental Simulations Laboratory, Carbondale, IL, USA
Sparrow SD, Sparrow EB & Cochran VL (1992) Decomposition in forest and fallow subarcticsoils. Biol. Fert. Soils 14: 253–259
Stott DE, Elliott LF, Papandick RI & Campbell G (1986) Low temperature or low waterpotential effects on the microbial decomposition of wheat residue. Soil Biol. Biochem.18: 577–582
Thornthwaite CW & Mather JR (1957) Instructions and tables for computing potentialevapotranspiration and the water balance. Publ. Climatol. 10: 185–311
Townsend A, Vitousek P, Desmarais DJ & Tharpe A (1997) Soil carbon pool structureand temperature sensitivity inferred using CO2 and 13CO2 incubation fluxes from fiveHawaiian soils. Biogeochem. 38: 1–17
Trumbore SE, Chadwick OA & Amundson R (1996) Rapid exchange between soil carbon andatmospheric carbon dioxide driven by temperature change. Science 272: 393–396
Van Cleve K, Oechel WC & Hom JL (1990) Response of black spruce (Picea maritima)ecosystems to soil temperature modification in interior Alaska. Can. J. For. Res. 20: 1530–1535
Vreeken-Buijs MJ & Brussaard L (1996) Soil mesofauna dynamics, wheat residue decom-position and nitrogen mineralization in buried litterbags. Biol. Fert. Soils 23: 374–381
Wildung RE, Garland TR & Buschbom RL (1975) The interdependent effects of soil tempera-ture and water content on soil respiration rate and plant root decomposition in aridgrassland soils. Soil Biol. Biochem. 7: 373–378
Winkler JP, Cherry RS & Schlesinger WH (1996) The Q10 relationship of microbialrespiration in a temperate forest soil. Soil Biol. Biochem. 28: 1067–1072
Wolters V & Ekschmitt K (1995) Earthworm effects on the use of C sources by microorgan-isms: Non-linear response to temperature alteration. Biol. Fertil. Soils 19: 109–114