Decision Support System to Assess Regional Biomass Energy Potential
23
This article was downloaded by: [Indian Institute of Science] On: 10 September 2013, At: 05:30 Publisher: Taylor & Francis Informa Ltd Registered in England and Wales Registered Number: 1072954 Registered office: Mortimer House, 37-41 Mortimer Street, London W1T 3JH, UK International Journal of Green Energy Publication details, including instructions for authors and subscription information: http://www.tandfonline.com/loi/ljge20 Decision Support System to Assess Regional Biomass Energy Potential T. V. Ramachandra a b , S. Vamsee Krishna a & B. V. Shruthi a a Center for Ecological Sciences, Indian Institute of Science, Bangalore, India b Centre for Sustainable Technology, Indian Institute of Science, Bangalore, India Published online: 22 Aug 2006. To cite this article: T. V. Ramachandra , S. Vamsee Krishna & B. V. Shruthi (2005) Decision Support System to Assess Regional Biomass Energy Potential, International Journal of Green Energy, 1:4, 407-428, DOI: 10.1081/GE-200038704 To link to this article: http://dx.doi.org/10.1081/GE-200038704 PLEASE SCROLL DOWN FOR ARTICLE Taylor & Francis makes every effort to ensure the accuracy of all the information (the “Content”) contained in the publications on our platform. However, Taylor & Francis, our agents, and our licensors make no representations or warranties whatsoever as to the accuracy, completeness, or suitability for any purpose of the Content. Any opinions and views expressed in this publication are the opinions and views of the authors, and are not the views of or endorsed by Taylor & Francis. The accuracy of the Content should not be relied upon and should be independently verified with primary sources of information. Taylor and Francis shall not be liable for any losses, actions, claims, proceedings, demands, costs, expenses, damages, and other liabilities whatsoever or howsoever caused arising directly or indirectly in connection with, in relation to or arising out of the use of the Content. This article may be used for research, teaching, and private study purposes. Any substantial or systematic reproduction, redistribution, reselling, loan, sub-licensing, systematic supply, or distribution in any form to anyone is expressly forbidden. Terms & Conditions of access and use can be found at http://www.tandfonline.com/page/terms- and-conditions
Transcript of Decision Support System to Assess Regional Biomass Energy Potential
This article was downloaded by: [Indian Institute of Science]On: 10 September 2013, At: 05:30Publisher: Taylor & FrancisInforma Ltd Registered in England and Wales Registered Number: 1072954 Registeredoffice: Mortimer House, 37-41 Mortimer Street, London W1T 3JH, UK
International Journal of Green EnergyPublication details, including instructions for authors andsubscription information:http://www.tandfonline.com/loi/ljge20
Decision Support System to AssessRegional Biomass Energy PotentialT. V. Ramachandra a b , S. Vamsee Krishna a & B. V. Shruthi aa Center for Ecological Sciences, Indian Institute of Science,Bangalore, Indiab Centre for Sustainable Technology, Indian Institute of Science,Bangalore, IndiaPublished online: 22 Aug 2006.
To cite this article: T. V. Ramachandra , S. Vamsee Krishna & B. V. Shruthi (2005) Decision SupportSystem to Assess Regional Biomass Energy Potential, International Journal of Green Energy, 1:4,407-428, DOI: 10.1081/GE-200038704
To link to this article: http://dx.doi.org/10.1081/GE-200038704
PLEASE SCROLL DOWN FOR ARTICLE
Taylor & Francis makes every effort to ensure the accuracy of all the information (the“Content”) contained in the publications on our platform. However, Taylor & Francis,our agents, and our licensors make no representations or warranties whatsoever as tothe accuracy, completeness, or suitability for any purpose of the Content. Any opinionsand views expressed in this publication are the opinions and views of the authors,and are not the views of or endorsed by Taylor & Francis. The accuracy of the Contentshould not be relied upon and should be independently verified with primary sourcesof information. Taylor and Francis shall not be liable for any losses, actions, claims,proceedings, demands, costs, expenses, damages, and other liabilities whatsoever orhowsoever caused arising directly or indirectly in connection with, in relation to or arisingout of the use of the Content.
This article may be used for research, teaching, and private study purposes. Anysubstantial or systematic reproduction, redistribution, reselling, loan, sub-licensing,systematic supply, or distribution in any form to anyone is expressly forbidden. Terms &Conditions of access and use can be found at http://www.tandfonline.com/page/terms-and-conditions
INTERNATIONAL JOURNAL OF GREEN ENERGY
Vol. 1, No. 4, pp. 407–428, 2004
Decision Support System to Assess Regional
Biomass Energy Potential
T. V. Ramachandra,1,2,* S. Vamsee Krishna,1 and B. V. Shruthi1
1Center for Ecological Sciences and2Centre for Sustainable Technology, Indian Institute of Science, Bangalore, India
ABSTRACT
Biomass is a renewable source that accounts for nearly 33% of a developing
country’s energy needs. In India, it meets about 75% of the rural energy needs and
the rural population constitutes 70% of the total population. Sustainable
management of these resources requires better and timely decisions, which can
lead to increased cost-efficiency and productivity. This would help in regional
energy planning and conservation through appropriate decision interventions.
To assist in strategic decision-making activities, considering spatial and temporal
variables, Spatial Decision Support Systems (SDSS) are required. Spatial decision
support system is an interactive computerized system that gathers data from a
wide range of data sources, analyze the collected data, and then present it in a way
that can be interpreted by the decision maker to deliver the precise information
needed to make timely decisions. Decision support system (DSS) framework is
designed and implemented to ease and speed up the use of environmental systems.
In this regard, to assist planners to plan and manage bioresources in a sustainable
way, Biomass Energy Potential Assessment (BEPA) decision support system is
designed and is being implemented at regional levels through proper training.
Overall objective of this DSS is the development of a set of tools aimed at
*Correspondence: T. V. Ramachandra, Energy Research Group, CES RNO 215, Center
for Ecological Sciences, Indian Institute of Science, Bangalore 560012, India; Fax:
91-080-23601428; E-mail: [email protected].
407
DOI: 10.1081/GE-200038704 1543-5075 (Print); 1543-5083 (Online)
Copyright & 2004 by Marcel Dekker, Inc. www.dekker.com
Dow
nloa
ded
by [
Indi
an I
nstit
ute
of S
cien
ce]
at 0
5:30
10
Sept
embe
r 20
13
transforming data into information and aid decisions for bioresources. This
article outlines the design and implementation of DSS for assessment of biomass
energy potential of a region considering the resources available and the demand.
It is designed with user friendly GUI’s (Graphic User Interface) using VB (Visual
Basic) as frontend with Microsoft Access database as the backend. This helps to
build executive information systems and reporting tools that tap vast data
resources and deliver information in the context of daily processes. This tool can
be used to form a core of practical methodology that will result in more resilience
in less time and can be used by decision-making bodies to assess the impacts of
various scenarios and to review cost and benefits of decisions to be made. It also
offers means of entering, accessing and interpreting the information for the
purpose of sound decision making.
Key Words: Biomass; Bioenergy; DSS; Sustainable management; Regional
energy planning.
INTRODUCTION
Biomass refers to solid carbonaceous material derived from plants and animals.The energy resulting from biomass is bioenergy. Although bioenergy use is predomi-nant in rural areas, it also provides an important fuel source for the urban poor andmany rural, small and medium scale industries. In order to meet the growing demandfor energy, it is imperative to focus on efficient production anduse of bioenergy tomeetfuel requirements (Ramachandra et al., 2000). At present, a comprehensive approachto biomass exploitation is required for regions where other kinds of energy are difficultto exploit or where the use of biomass could decrease environmental pollution andenhance regional welfare, e.g., by providing local employment opportunities orimproving environmental preservation. The amount and complexity of informationrelating to the development of bioenergy systems increases and so does the problem ofhow to handle the information in a manner is helpful for decision making. In thisrespect, decision support systems (DSS) have been designed to assist in bioresourcemanagement at a regional level (Davide et al., 2004). Computer models are oftencomplex to use so there has been much effort to develop DSS, which provides the userwith an accessible interface with the computer and where the results are presented in aform, which is readily understandable by the user (Mitchell, 2000). It is an interactivesystem that is able to produce data and information and in some cases, even promoteunderstanding related to a given application domain in order to give useful assistancein resolving complex and ill-defined problems (Fausto and Luigi, 2004). Decisionsupport system analyzes the collected data and then presents it in a way that can beinterpreted by the decision maker. Decision analysis programs can assist the user tocreate a decision tree of possible decisions and then predict the probabilities and costsof different outcomes. Decision support system allows ad-hoc enquiries and can assessthe probable consequences of decisions before they are made. The DSS analysis tooldisintegrates a problem into multiple series of decisions that could be made.Ultimately, the principal distinctive feature of these tools is to enlighten theprobability of different outcomes and the expected outcomes. The result of designand execution of DSS for environmental systems, which generate energy, are prolific.
408 Ramachandra, Krishna, and Shruthi
Dow
nloa
ded
by [
Indi
an I
nstit
ute
of S
cien
ce]
at 0
5:30
10
Sept
embe
r 20
13
Decision support systems (DSS) focus on providing flexible tools for policyanalysis, than providing models to answer structured problems (Parker andUl-Ataibi, 1986). Decision support system would present the results of a model ina lucid, easily understandable manner to enable policy makers in taking hierarchicalsequence of decisions. Most decision support systems are actually based uponmathematical models. Indeed, modelling tools are only a part of DSS, whichcomprises three component subsystems, namely,
(a) The Database Management: Manages an integrated database to drive allmodels.
(b) The Model Management: Helps in creating new models, cataloging andediting existing models, and inter-relates models by links through thespatial and attribute database and integrates small models (buildingblocks) into larger model systems.
(c) The Dialogue Management: Using consistent and familiar interface(like spreadsheet or word processing programs), this design is guided byvarious methodological considerations, such as:
(i) Scenario Approach: Simulates alternative energy and economicfutures under different assumptions.
(ii) Integrated Resource Planning: Stresses the importance of integratingthe analyses within a comprehensive planning while emphasizing on adisaggregated approach.
(iii) Flexibility and User Friendliness: Designed as a set of flexible,expandable and comprehensive modules.
Energy assessment across sectors, through time and localities (region) requiresa wide range of information available through a reliable, consistent source.Good information can help to assess various outputs under multiple schemes.Improved technology and growing user acceptance are fueling increased usagedemand of DSS for assessment of energy from bioresources. Scope for wide spreaduse of DSS for bioresources management is its ease of query, reporting, onlineanalysis of both simulated and observed data, and speed of processing the data.Decision support system provides flexible tool for decision makers to assess theeffectiveness of the decision through querying and visualisation. Energy savingspotential can be observed across different regions.
The world’s energy markets rely heavily on fossil fuels such as coal, petroleum,crude oil and natural gas as sources of energy, fuels and chemicals. Since millionsof years were required to form fossil fuels in the earth, their reserves are finite andsubject to depletion as they are consumed. The only other naturally occurring,energy-containing carbon resource, that is large enough to be used, as a substitutefor fossil fuels is biomass. Compared to these, bioresources are renewable witha cycling time less than 100 years. It is the most developed renewable energy sourceproviding 35 and 3% of the primary energy needs of developing and industrialisedcountries, respectively (Boyle, 1996). With 70% of India’s population still in ruralareas, there is tremendous demand on resources such as fuelwood, agriculturalresidues, etc., to meet the daily fuel requirements. About 13.01% of the energyin India is derived from bioresources (http://mnes.nie/achl.htm, 2004). Dependence
Decision Support System 409
Dow
nloa
ded
by [
Indi
an I
nstit
ute
of S
cien
ce]
at 0
5:30
10
Sept
embe
r 20
13
on bioresource to meet the daily requirement of fuel, fodder, etc., in rural areas ismore than 85% while in urban area the demand is about 35%.
Biomass is all nonfossil organic materials that have intrinsic chemical energycontent. They include aquatic and terrestrial vegetation and all waste biomass such asmunicipal solid wastes, municipal bio-solids and animal wastes, forestry andagricultural residues, and certain types of industrial wastes. Unlike fossil fuels,biomass is renewable in the sense that only a short period of time is needed to replacewhat is used as an energy resource. Biomass is a renewable energy source becausethe energy it contains comes from the sun. Through the process of photosynthesis,chlorophyll in plants captures the sun’s energy by converting carbon dioxide fromthe air and water from the ground into carbohydrates, complex compounds composedof carbon, hydrogen and oxygen. When these carbohydrates are burned, they turnback into carbon dioxide and water and release the sun’s energy they contain.Bioenergy is regarded as ‘‘green’’ energy for several reason. Recent study on energyutilisation in Karnataka considering all types of energy sources and sector wiseconsumption reveals that traditional fuels such as firewood (7.440 million tonne ofoil equivalent—43.62%), agro residues (1.510 million tonne of oil equivalent—8.85%), biogas and cow dung (0.250 million tonne of oil equivalent—1.47%) accountfor 53.20% of total energy consumption (Ramachandra and Subramanian, 1997).
Assessment of available bioresources is helpful in revealing its status and helpsin planning a sustained supply to meet the energy demand. Assessment of bioenergypotential can be theoretical, technical or economic. Natural conditions that favor thegrowth of biomass determine the theoretical potential. Technical potential dependson the available technologies that can be exploited for the conversion of biomassto more flexible forms and so is subjected to change with time. Of all the threepotential estimates, the economic potential is subjected to high variability, aseconomic conditions fluctuate drastically over space and time (Ramachandra et al.,2004). To cater these requirements an integrated decision support system is designedthat combines sound scientific methods of analysis and assessment of biomass energy(location wise), which can be exploited to meet the regional energy demand in adecentralised way. The assessment also necessitates the validation of DSS with thedata compiled for the particular region.
Biomass energy potential assessment (BEPA) Decision Support System providesan integrated framework for easy access of data analysis and the design and evaluationof biomass energy assessment strategies with a unified user interface, comprising offully menu-driven symbolic/graphic user interface, with a built in context sensitivehelp features. The distinctive feature of the database is its handling, display, andanalysis of observation time series data, with a linkage to real time data acquisitionand monitoring. It supports realistic analysis and practical simulations of energyassessment.
LITERATURE REVIEW
A hypertext based DSS was developed to aid deployment of bioenergy systems.These approaches are discussed with reference to a short rotation forestry productioninformation system and DSS for harvesting wood for energy from conventional
410 Ramachandra, Krishna, and Shruthi
Dow
nloa
ded
by [
Indi
an I
nstit
ute
of S
cien
ce]
at 0
5:30
10
Sept
embe
r 20
13
forestry and short rotation forestry. Existing models and DSS were linked togetherto produce an integrated biomass electricity model, to investigate the interfacebetween supply and conversion and to assess the impact of different feedstocksand conversion processes on the costs of generating electricity (Mitchell, 2000).
Geographical information system (GIS) based DSS was developed, whichprovides the tools to identify the geographic distribution of the economicallyimportant bioresources. The procedure introduces a four level analysis to determinethe theoretical, available, technological and economically exploitable potential. TheDSS handles all possible restrictions and candidate power plants are identified usingan iterative procedure that locates bioenergy units and establishes the neededcultivated area for biomass collection. Electricity production cost is used as acriterion in the identification of the sites for biomass based power generation(Voivontas et al., 2001).
Decision support system was developed to assess the possibility of biomassexploitation for both thermal and electric energy production in a given area, whilerelating this use to an efficient and sustainable management of the forests within thesame territory. In the proposed approach, geographic information system basedtechniques are integrated with mathematical programming methods to yield acomprehensive system that allows the formalization of the problem, decision taking,and evaluation of effects. This DSS helps in identifying the optimal location forplants as well as computation of their optimal sizing (specifying energy types for thespecific area), taking into account several aspects (economic, technical, regulatoryand social), and deciding how to plan biomass collection and harvesting (Davideet al., 2004).
Using GIS, spatial mapping of the resources has been done for assessing thebioenergy potential for Karnataka State. Bioresource availability analysis shows thathorticulture constitutes the major share of 43.6%, followed by forests (39.8%),agricultural residues (13.6%), animal residues (3.01%) and plantations (0.15%).Talukwise demand analysis shows that taluks such as Thirthahalli, Sirsi and Sagarhave surplus bioresource compared to taluks such as Anekal, Malur, Gudibandaand Sidlaghatta. The computation of bioenergy availability, demand, and talukwisestatus shows that Siddapura taluk in Uttara Kannada district has the highestbioenergy status of 2.004. Anekal taluk in Bangalore Urban district has the leaststatus of 0.004 (Ramachandra and Subramanian, 1997).
A spatial decision support system with algorithms specific for bioresourcesassessment and conservation was designed incorporating routines for forest mappingand monitoring changes at landscape level. It also provides inputs to decision-makers to deal with global issues such as global warming and understandingof carbon flux. Integration of biomass assessment and productivity models offeredrapid and customized methods for resource estimation (Shirish, 2002).
STUDY AREA
Kolar district is located in the southern plains of Karnataka State, India. It liesbetween 77� 210 and 78� 350 east longitude and 12� 460 to 13� 580 north latitudeand extends over an area of 8225 sq. km. The population was 2.523 million (as per
Decision Support System 411
Dow
nloa
ded
by [
Indi
an I
nstit
ute
of S
cien
ce]
at 0
5:30
10
Sept
embe
r 20
13
2001 census report). For administrative purposes, the district has been divided into11 taluks. There are 15 towns and 3345 inhabited villages in the district. Figure 3shows the study area. Kolar belongs to the semi arid zone of Karnataka. In the semiarid zone apart from the year-to-year fluctuations in the total seasonal rainfall, thereare also large variations in the time of commencement of rainfall adequate forsowing as well as in the distribution of drought periods within the crop-growingseason. Kolar district depends on the rainfall during southwest and northeastmonsoon. Out of about 2800 sq. km of land under cultivation, 35% is under well andtank irrigation. There are about 951 big tanks and 2934 small tanks in the district.The average population density of the district is 2.09 persons/hectare (rural) and 2.69persons/hectare (rural and urban). The population density ranges from 1.44(Bagepalli), 1.69 (Gudibanda), 1.70 (Srinivasapur) to the maximum of 2.55(Kolar). While, the population density in taluks is as follows: Bangarpet (2.52),Malur (2.38), Gauribidanur (2.36), Sidlaghatta (2.16), Chintamani (2.10), Mulbagal(2.04) and Chikballapur (1.92).
The average livestock density of the district is 0.81. It ranges from 0.68 (Bagepalli,Malur), 0.70 (Kolar) to a maximum of 1.09 (Gauribidanur). Extent of forest cover inthe district (as per Forest Department records) is about 6.5%. It ranges from1.71% (Bangarpet), 2.3% (Malur), 2.78% (Kolar) to 15% (Srinivasapur) and 20%(Chikballapur). Taluks are grouped into three categories based on percentage offorest cover (<10%, 10–20% and>20% cover). Chikballapur and Bagepalli haveforest cover>20%, Gudibanda and Srinivasapur are in the range 10–20%, whileremaining taluks have forest cover<10% (Jagadeesh et al., 2000).
Karnataka State is situated between 11� 400 and 18� 270 north latitude and 74� 50
and 78� 330 east longitude in the center of western peninsular India, covering an areaof 19.1million ha and accounts for 5.8% of the country’s total geographic area. It hasa 350 km long coastline, which forms the western boundary. According to the 2001provisional census, the population of the State is 52.6 million (26.8 million malesand 25.8 million females), with a rural population of 66.02% and an urbanpopulation of 33.98%. Physiograpically, the State can be divided into two distinctregions, Malnad or Hilly region comprising of mainly the Western Ghats and theMaidan or Plain region comprising of the inland plateau of varying heights. The foresttypes prevalent in the State are: Tropical Wet Evergreen, Tropical Semi Evergreen,Tropical Moist Deciduous, Tropical Dry Deciduous and Tropical Thornforests. Karnataka is divided into 10 agroclimatic zones taking into considerationthe rainfall pattern-quantum and distribution, soil types, texture, depth and physio-chemical properties, elevation, topography, major crops and types of vegetation.
METHODOLOGY
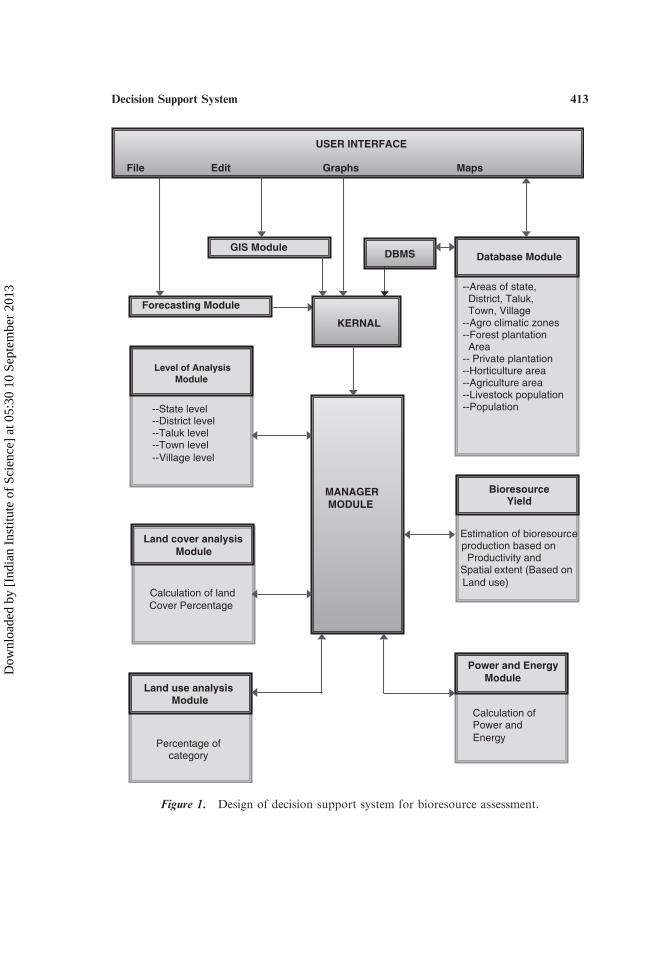
The DSS of biomass energy assessment (Fig. 1) provides an user friendlyGraphic User Interface (GUI), developed using Microsoft Visual Basic 6.0 asfrontend with Microsoft Access database as backend. This GUI Environment helpsin entry, edit or update of database along with the options to compute biomassenergy potential spatially. Various sub-modules are Database, Database
412 Ramachandra, Krishna, and Shruthi
Dow
nloa
ded
by [
Indi
an I
nstit
ute
of S
cien
ce]
at 0
5:30
10
Sept
embe
r 20
13
MANAGER MODULE
GIS Module
Forecasting Module
Database Module
--Areas of state, District, Taluk, Town, Village --Agro climatic zones--Forest plantation Area -- Private plantation --Horticulture area --Agriculture area--Livestock population --Population
Bioresource Yield
Estimation of bioresourceproduction based on Productivity and Spatial extent (Based onLand use)
Power and Energy Module
Calculation ofPower and Energy
Level of Analysis Module
--State level --District level --Taluk level --Town level --Village level
Land cover analysis Module
Calculation of landCover Percentage
Land use analysis Module
Percentage ofcategory
KERNAL
DBMS
USER INTERFACE
File Edit Graphs Maps
Figure 1. Design of decision support system for bioresource assessment.
Decision Support System 413
Dow
nloa
ded
by [
Indi
an I
nstit
ute
of S
cien
ce]
at 0
5:30
10
Sept
embe
r 20
13
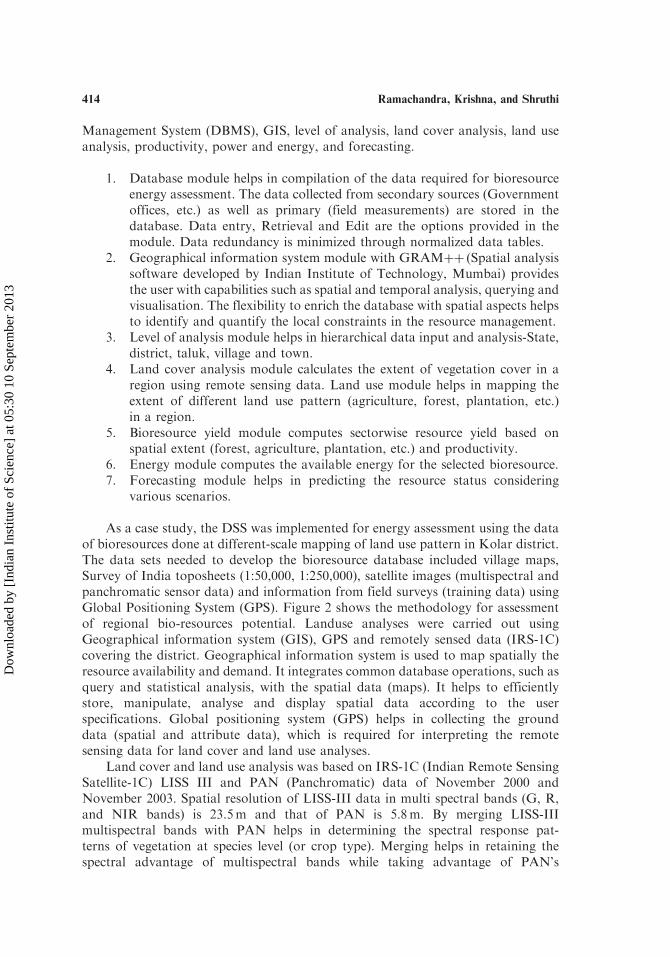
Management System (DBMS), GIS, level of analysis, land cover analysis, land useanalysis, productivity, power and energy, and forecasting.
1. Database module helps in compilation of the data required for bioresourceenergy assessment. The data collected from secondary sources (Governmentoffices, etc.) as well as primary (field measurements) are stored in thedatabase. Data entry, Retrieval and Edit are the options provided in themodule. Data redundancy is minimized through normalized data tables.
2. Geographical information system module with GRAMþþ (Spatial analysissoftware developed by Indian Institute of Technology, Mumbai) providesthe user with capabilities such as spatial and temporal analysis, querying andvisualisation. The flexibility to enrich the database with spatial aspects helpsto identify and quantify the local constraints in the resource management.
3. Level of analysis module helps in hierarchical data input and analysis-State,district, taluk, village and town.
4. Land cover analysis module calculates the extent of vegetation cover in aregion using remote sensing data. Land use module helps in mapping theextent of different land use pattern (agriculture, forest, plantation, etc.)in a region.
5. Bioresource yield module computes sectorwise resource yield based onspatial extent (forest, agriculture, plantation, etc.) and productivity.
6. Energy module computes the available energy for the selected bioresource.7. Forecasting module helps in predicting the resource status considering
various scenarios.
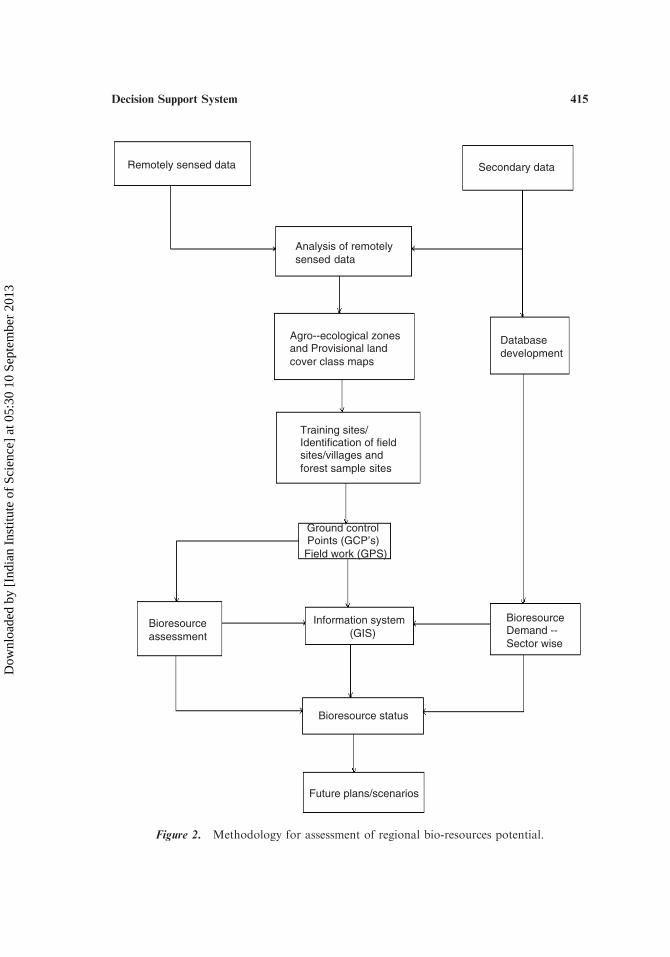
As a case study, the DSS was implemented for energy assessment using the dataof bioresources done at different-scale mapping of land use pattern in Kolar district.The data sets needed to develop the bioresource database included village maps,Survey of India toposheets (1:50,000, 1:250,000), satellite images (multispectral andpanchromatic sensor data) and information from field surveys (training data) usingGlobal Positioning System (GPS). Figure 2 shows the methodology for assessmentof regional bio-resources potential. Landuse analyses were carried out usingGeographical information system (GIS), GPS and remotely sensed data (IRS-1C)covering the district. Geographical information system is used to map spatially theresource availability and demand. It integrates common database operations, such asquery and statistical analysis, with the spatial data (maps). It helps to efficientlystore, manipulate, analyse and display spatial data according to the userspecifications. Global positioning system (GPS) helps in collecting the grounddata (spatial and attribute data), which is required for interpreting the remotesensing data for land cover and land use analyses.
Land cover and land use analysis was based on IRS-1C (Indian Remote SensingSatellite-1C) LISS III and PAN (Panchromatic) data of November 2000 andNovember 2003. Spatial resolution of LISS-III data in multi spectral bands (G, R,and NIR bands) is 23.5m and that of PAN is 5.8m. By merging LISS-IIImultispectral bands with PAN helps in determining the spectral response pat-terns of vegetation at species level (or crop type). Merging helps in retaining thespectral advantage of multispectral bands while taking advantage of PAN’s
414 Ramachandra, Krishna, and Shruthi
Dow
nloa
ded
by [
Indi
an I
nstit
ute
of S
cien
ce]
at 0
5:30
10
Sept
embe
r 20
13
Remotely sensed data Secondary data
Analysis of remotelysensed data
Agro--ecological zonesand Provisional land cover class maps
Training sites/Identification of field sites/villages and forest sample sites
Databasedevelopment
Ground control Points (GCP’s) Field work (GPS)
Information system(GIS)
Bioresource assessment
Bioresource Demand --Sector wise
Bioresource status
Future plans/scenarios
Figure 2. Methodology for assessment of regional bio-resources potential.
Decision Support System 415
Dow
nloa
ded
by [
Indi
an I
nstit
ute
of S
cien
ce]
at 0
5:30
10
Sept
embe
r 20
13
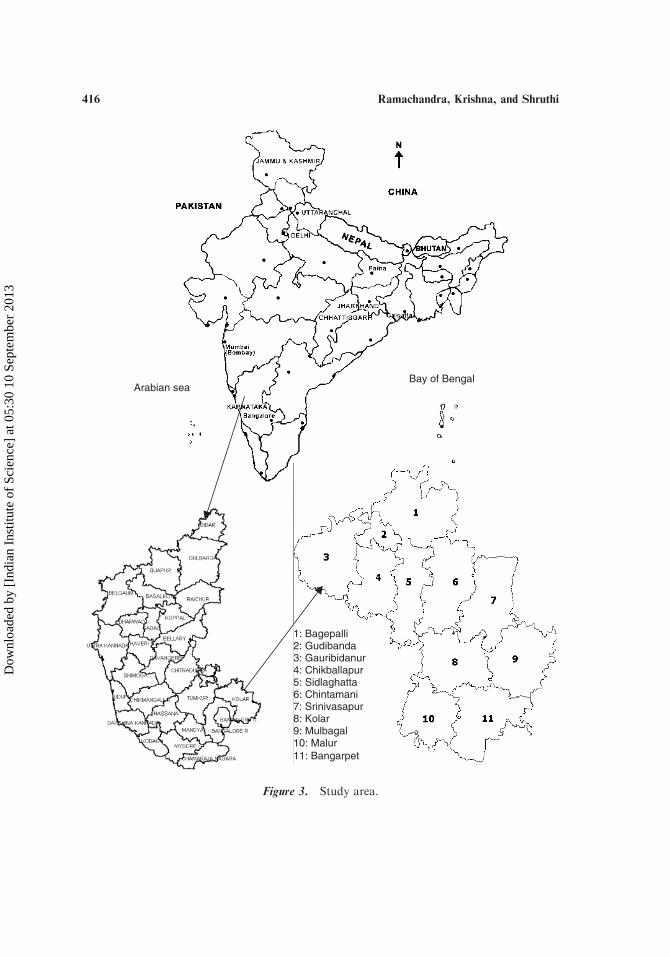
1: Bagepalli2: Gudibanda 3: Gauribidanur4: Chikballapur 5: Sidlaghatta6: Chintamani7: Srinivasapur 8: Kolar 9: Mulbagal10: Malur 11: Bangarpet
Arabian sea Bay of Bengal
Figure 3. Study area.
416 Ramachandra, Krishna, and Shruthi
Dow
nloa
ded
by [
Indi
an I
nstit
ute
of S
cien
ce]
at 0
5:30
10
Sept
embe
r 20
13

spatial resolution. This helps in mapping bioresources at pixel levels (covering anarea of few square meters).
The methodology developed for landscape analyses (landscape classification)at disaggregated levels provides an up-to-date land characteristic database anda model for further research. Taluks located in northern part of Kolar (Gudibanda,Gauribidanur, Bagepalli, and northern part of Sidlaghatta) have lesser vegetationcompared to southern part of the district. The landscape of mixed vegetation isof deciduous and scrub species. Plantations of Eucalyptus and Acacia auriculiformisare found in most parts compared to natural vegetation.
Land cover analysis was done with the computation of the vegetation indicesnamely NDVI (Normalized Difference Vegetation Index) and TSAVI (TransformedSoil Adjusted Vegetation Index) from the LISS-III bands (RED and NIR)of IRS-1C. This helps in identifying observed physical cover-vegetation andnonvegetation. It roughly indicates the extent of the vegetation cover in theregion. NDVI is defined as:
NDVI ¼ ðNIR�REDÞ=ðNIRþREDÞ ð1Þ
The index normalizes the difference between the bands so that the values rangebetween �1 and þ1. The negative value represents nonvegetated area while positivevalue represents vegetated area. Kolar district being in semi-arid region, vegetationcover is poor and sparsely spread. Pixels (remote sensing data) contain a mixtureof vegetation and soil background. Hence to cancel the effect of soil brightness,Transformed Soil-adjusted Vegetation Indices (TSAVI1 and TSAVI2) werecomputed. These indices are slightly less sensitive to changes in vegetation coverthan NDVI at low levels of vegetation cover. These indices are also more sensitiveto atmospheric variations than NDVI. Transformed soil-adjusted vegetation index 1assumes that the soil line has arbitrary slope and intercept and it makes use of thesevalues to adjust the vegetation index and is written as:
TSAVI1 ¼aðNIR� a�RED� bÞ
REDþ a�NIR� a� bþ Xð1þ a2Þð2Þ
where, NIR: reflectance in near infrared band,RED: reflectance in red band,a: slope of the line,b: intercept of the soil line,X: adjustment factor that is set to minimize soil noise.
Red band is taken as independent variable for regression analysis. Ratio valueless than�9.0 is taken as nonvegetation while greater than �9.0 is taken asvegetation. With some resistance to high soil moisture, TSAVI1 proves to be a verygood candidate for use in semi-arid regions. Transformed soil-adjusted vegetationindex 1 was specifically designed for semi-arid region and does not work well inareas with heavy vegetation. Transformed soil-adjusted vegetation index 2 ismodified version of TSAVI which was readjusted with an additive correction factorof 0.08 to minimize the effects of the background soil brightness and is given by,
TSAVI2 ¼aðNIR� a�RED� bÞ
REDþ a�NIR� a� bþ 0:08ð1þ a2Þð3Þ
Decision Support System 417
Dow
nloa
ded
by [
Indi
an I
nstit
ute
of S
cien
ce]
at 0
5:30
10
Sept
embe
r 20
13

Land use analysis for Kolar district was done through supervised classificationapproach using multi spectral data of IRS-1C. The maximum likelihood classifica-
tion method is found to be more appropriate (based on confusion matrix analyses)compared to other classification approaches.
Bioenergy status assessment was done taluk-wise and aggregated for the district.This is based on compilation and computation of bioresource supply (forests,
agriculture, plantations, etc.) and sector-wise bioenergy requirement (domestic,agriculture, industry, etc.). Bioresource supply from agriculture (residues), forest,
horticulture, plantation and livestock is considered to assess the energy status talukwise. This data is compiled from the agriculture, horticulture, forest and veterinarydepartments of the State apart from land use analyses using remote sensing data.
The talukwise potential is evaluated using maps of administrative boundaries (talukboundaries) along with remote sensing and statistical data.
Bioresource supply is based primarily on land use data, yield of various cropresidues (agriculture and horticulture) and plantation and forest biomass producti-
vities. Data on the historical land use pattern were collected from the Directorateof Economics and Statistics, Government of Karnataka. The major source ofinformation on forest lands is the Karnataka Forest Department (KFD), which
maintains a variety of records like the annual administration reports, working plans,forest inventory reports, which gave information on the growing stock, current
status of the forests, the management practices adopted, plantations maintained andtheir prescribed felling cycle. The inventory of forest resources published by theForest Survey of India was also referred (Forest Survey of India, 1999). The forest
area by types, given division wise in the forest records, was used to compute the foresttype at the taluk level. The biomass potential of the forests is dependent on the type
of forest and its distribution.Above ground standing biomass of trees is the weight of trees above ground,
in a given area, if harvested at a given time. The change in standing biomass overa period of time is called productivity. The standing biomass helps to estimate the
productivity of an area and also gives information on the carrying capacity of land.It also helps in estimating the biomass that can be continuously extracted.The standing biomass is measured using the harvest method or by using the
biomass estimation equations. In the harvest method, vegetation in the selectedsample plots is harvested and the weight is estimated in fresh and dry form
to measure biomass. For trees, this method is inappropriate, as it requires theirfelling or destructive sampling. However, this could be computed by the knowledgeof its height and girth (at 130 cm). Standing biomass (in kg) is given by:
Tree biomass ¼ bþ ðaD2HÞ ð4Þ
where D is the diameter at 130 cm, H is the height of the tree, a and b are constants.Equations involving the basal area are used for all tree species and therefore are used
to estimate the standing biomass of mixed forests. Productivity, which is the increasein weight or volume of any biomass over a period of time, can be estimated when thestanding biomass estimates are available for two consecutive years. It can also be
calculated by knowing the age of the forest stand in addition to the litter availableannually. Productivity is equal to standing biomass per hectare/age of a tree or the
418 Ramachandra, Krishna, and Shruthi
Dow
nloa
ded
by [
Indi
an I
nstit
ute
of S
cien
ce]
at 0
5:30
10
Sept
embe
r 20
13
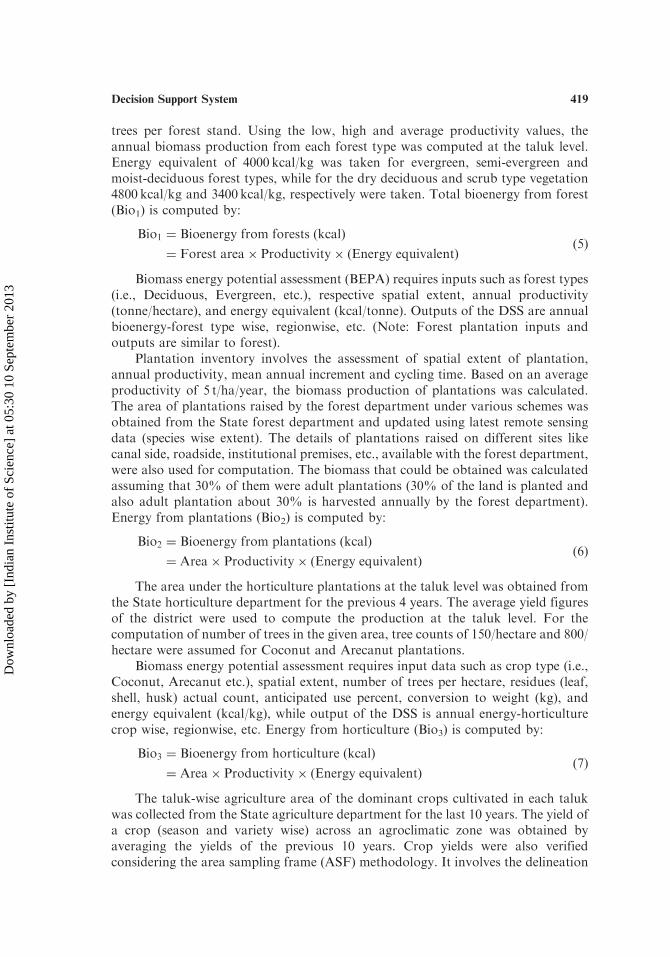
trees per forest stand. Using the low, high and average productivity values, theannual biomass production from each forest type was computed at the taluk level.Energy equivalent of 4000 kcal/kg was taken for evergreen, semi-evergreen andmoist-deciduous forest types, while for the dry deciduous and scrub type vegetation4800 kcal/kg and 3400 kcal/kg, respectively were taken. Total bioenergy from forest(Bio1) is computed by:
Bio1 ¼ Bioenergy from forests ðkcalÞ
¼ Forest area� Productivity� ðEnergy equivalentÞð5Þ
Biomass energy potential assessment (BEPA) requires inputs such as forest types(i.e., Deciduous, Evergreen, etc.), respective spatial extent, annual productivity(tonne/hectare), and energy equivalent (kcal/tonne). Outputs of the DSS are annualbioenergy-forest type wise, regionwise, etc. (Note: Forest plantation inputs andoutputs are similar to forest).
Plantation inventory involves the assessment of spatial extent of plantation,annual productivity, mean annual increment and cycling time. Based on an averageproductivity of 5 t/ha/year, the biomass production of plantations was calculated.The area of plantations raised by the forest department under various schemes wasobtained from the State forest department and updated using latest remote sensingdata (species wise extent). The details of plantations raised on different sites likecanal side, roadside, institutional premises, etc., available with the forest department,were also used for computation. The biomass that could be obtained was calculatedassuming that 30% of them were adult plantations (30% of the land is planted andalso adult plantation about 30% is harvested annually by the forest department).Energy from plantations (Bio2) is computed by:
Bio2 ¼ Bioenergy from plantations ðkcalÞ
¼ Area� Productivity� ðEnergy equivalentÞð6Þ
The area under the horticulture plantations at the taluk level was obtained fromthe State horticulture department for the previous 4 years. The average yield figuresof the district were used to compute the production at the taluk level. For thecomputation of number of trees in the given area, tree counts of 150/hectare and 800/hectare were assumed for Coconut and Arecanut plantations.
Biomass energy potential assessment requires input data such as crop type (i.e.,Coconut, Arecanut etc.), spatial extent, number of trees per hectare, residues (leaf,shell, husk) actual count, anticipated use percent, conversion to weight (kg), andenergy equivalent (kcal/kg), while output of the DSS is annual energy-horticulturecrop wise, regionwise, etc. Energy from horticulture (Bio3) is computed by:
Bio3 ¼ Bioenergy from horticulture ðkcalÞ
¼ Area� Productivity� ðEnergy equivalentÞð7Þ
The taluk-wise agriculture area of the dominant crops cultivated in each talukwas collected from the State agriculture department for the last 10 years. The yield ofa crop (season and variety wise) across an agroclimatic zone was obtained byaveraging the yields of the previous 10 years. Crop yields were also verifiedconsidering the area sampling frame (ASF) methodology. It involves the delineation
Decision Support System 419
Dow
nloa
ded
by [
Indi
an I
nstit
ute
of S
cien
ce]
at 0
5:30
10
Sept
embe
r 20
13
of long-term sampling segments from satellite imagery. These were then used as
sampling frames for subsequent agricultural surveys. The crop residues are surveyedduring both the Kharif and Rabi season. Field sampling is carried out within one
week before harvest to ensure that crop yield and residue measurements are relatedto fully mature crops.
Area under cultivation was not variety specific for a crop at the taluk level. The
proportion of the area under high yielding variety and the traditional variety of acrop at the district level was used to segregate the area by variety at the taluk level.
The grain yield and production figures for each crop were available only at thedistrict level, which were used to compute the grain production at the taluk level.
The ratio of the main product to the by-product for each crop grown under local
conditions along with their energy equivalents was used to compute the agro residuesproduction. The energy equivalent of these residues was taken based on what would
be obtained if they were subjected to the most energy efficient transformation
processes. Apart from this, the actual availability of residues as energy supplementswould also depend on other factors like efficiency of collection, mode of
transportation and storage. Considering these, in the computation of bio residuefrom agriculture only 50% is accounted for fuel. Bioenergy from agriculture residues
(Bio4) is computed by:
Bio4 ¼ Bioenergy from agriculture ðkcalÞ
¼ ðProductivity of waste� Crop area� Energy equivalentÞ ð8Þ
To compute bioenergy from agricultural crops, BEPA requires inputs such as
crop type (i.e., Cotton, Green grams, etc.), spatial extent, crop yield, or productivity,residue to crop ratio, energy equivalent (kcal/tonne), while outputs are annual
energy-crop wise, regionwise, etc.The livestock population of cattle, buffalo, sheep and goat was collected from
the State veterinary department. The field survey shows that quantity of dung yield
varies from region to region. It was taken as 12–15 kg/animal/day for buffalo, 3–7.5 kg/animal/day for cattle and 0.1 kg/animal/day for sheep and goat. The total
dung produced annually was calculated by multiplication of the animal dungproduction per year and the number of heads of different animals taking the lower
and higher dung yield. Assuming 0.036–0.042m3 of biogas yield per kg of cattle/
buffalo dung, the total quantity of gas available was estimated. Total bioenergy fromlivestock (Bio5) is computed by:
Bio5 ¼ Bioenergy from livestock ðkcalÞ ¼ ðBiogas� Energy EquivalentÞ ð9Þ
where, Biogas (m3)¼Biogas yield�Dung� 1000 and Dung (tonnes)¼Dungyield�Population� 365 (for annual energy computation).
Data input for BEPA to compute energy from livestock are livestock type (i.e.,
Buffalo, Cattle, Goat, etc.); population, dung yield (kg/animal/day), biogas yield(m3/kg) and energy equivalent (kcal/m3), and output would be biogas (m3) and
annual energy.Total bioenergy available from various sectors is computed by aggregating the
energy computed from individual sectors (forestry, plantation, horticulture,
420 Ramachandra, Krishna, and Shruthi
Dow
nloa
ded
by [
Indi
an I
nstit
ute
of S
cien
ce]
at 0
5:30
10
Sept
embe
r 20
13
agriculture, livestock) and is given by,
Bioenergy availability ¼X5
i¼1
ðBioiÞ ð10Þ
where i¼ 1, 2, . . . , 5 and Bio1: Bioenergy from forest, Bio2: plantation, Bio3:horticulture, Bio4: agriculture and Bio5: livestock.
Estimation of rural energy demand for domestic purposes was based on theState rural population, which was obtained from the provisional population total,Census of India 2001, Karnataka. Bioresource demand is the sector-wise bioenergyrequirement that was computed based on the statistics of earlier energy surveys froma sample of 3500 households covering various agro-climatic zones in Karnataka.Energy-demand survey results reveal that 80–85% of the rural population isdependent on bioenergy and hence the demand was projected taking into account theentire rural population. Domestic fuel consumption depends on the size of thefamily. Energy consumption patterns are seen to vary across geographical,agroclimatic zones, seasons and the different economic strata of the society.Hence, analysis was done for agro-climatic zones in Karnataka. Per Capita FuelConsumption (PCFC) is computed to
(i) Determine the fuel consumption pattern in various agro-climatic zones.(ii) Find the various parameters involved in the variation and level of
consumption.(iii) Estimate the daily per capita consumption of fuel wood in traditional and
improved stoves for cooking and water heating.
The per capita fuel consumption is given by
PCFC ¼ FC=P ð11Þ
where FC is the fuel consumed in kg/day and P is the number of adult equivalents,for whom the food was cooked. Standard adult equivalents of 1, 0.85 and 0.35 formale, female and children (below 6 years) respectively, were used.
Bioresource demand for domestic activity in a region is given by,
Bioresource demand ðdomesticÞ ¼ ðaverage PCFCÞ � Population� 365 ð12Þ
where PCFC¼Per Capita Fuelwood Consumption.Bioresource status for a particular region is computed by,
Bioresource status ¼ Bioenergy availability=
Bioresource demand ðDomesticÞ ð13Þ
RESULTS AND DISCUSSIONS
The flowchart for navigating DSS is given in Fig. 4. This DSS is implementedand the results are discussed for Kolar district, Karnataka State. An executable file is
Decision Support System 421
Dow
nloa
ded
by [
Indi
an I
nstit
ute
of S
cien
ce]
at 0
5:30
10
Sept
embe
r 20
13
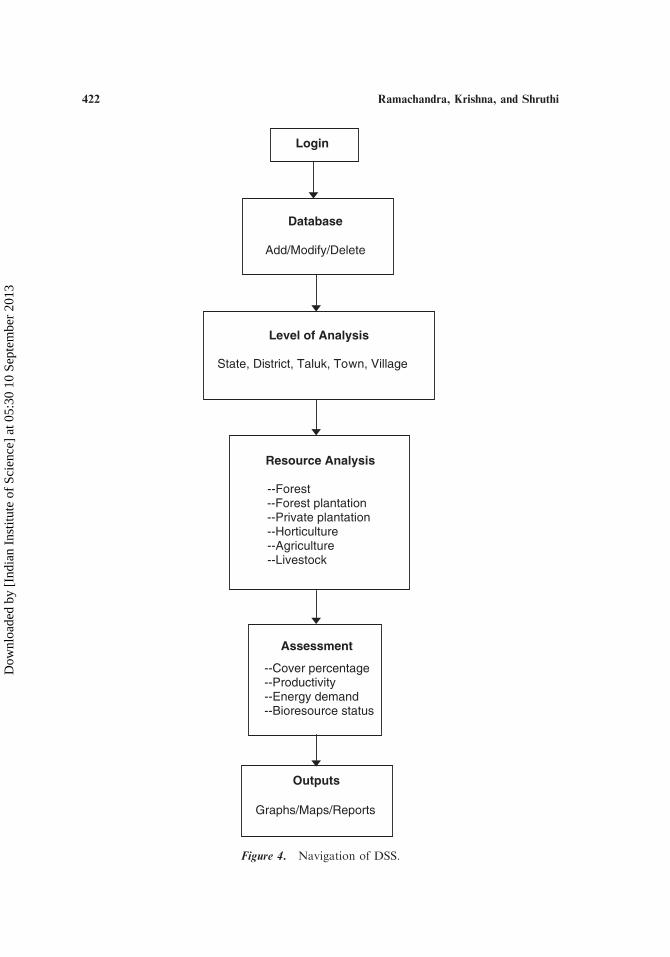
Database
Add/Modify/Delete
Level of Analysis
State, District, Taluk, Town, Village
Resource Analysis
--Forest --Forest plantation --Private plantation --Horticulture --Agriculture --Livestock
Assessment
--Cover percentage --Productivity--Energy demand --Bioresource status
Outputs
Graphs/Maps/Reports
Login
Figure 4. Navigation of DSS.
422 Ramachandra, Krishna, and Shruthi
Dow
nloa
ded
by [
Indi
an I
nstit
ute
of S
cien
ce]
at 0
5:30
10
Sept
embe
r 20
13
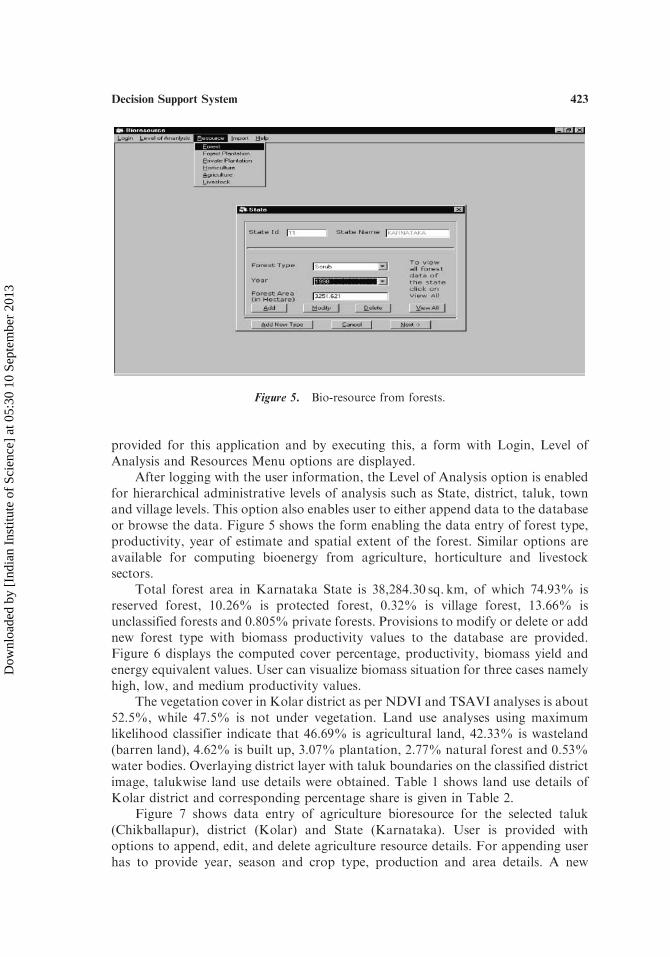
provided for this application and by executing this, a form with Login, Level of
Analysis and Resources Menu options are displayed.After logging with the user information, the Level of Analysis option is enabled
for hierarchical administrative levels of analysis such as State, district, taluk, town
and village levels. This option also enables user to either append data to the database
or browse the data. Figure 5 shows the form enabling the data entry of forest type,
productivity, year of estimate and spatial extent of the forest. Similar options are
available for computing bioenergy from agriculture, horticulture and livestock
sectors.Total forest area in Karnataka State is 38,284.30 sq. km, of which 74.93% is
reserved forest, 10.26% is protected forest, 0.32% is village forest, 13.66% is
unclassified forests and 0.805% private forests. Provisions to modify or delete or add
new forest type with biomass productivity values to the database are provided.
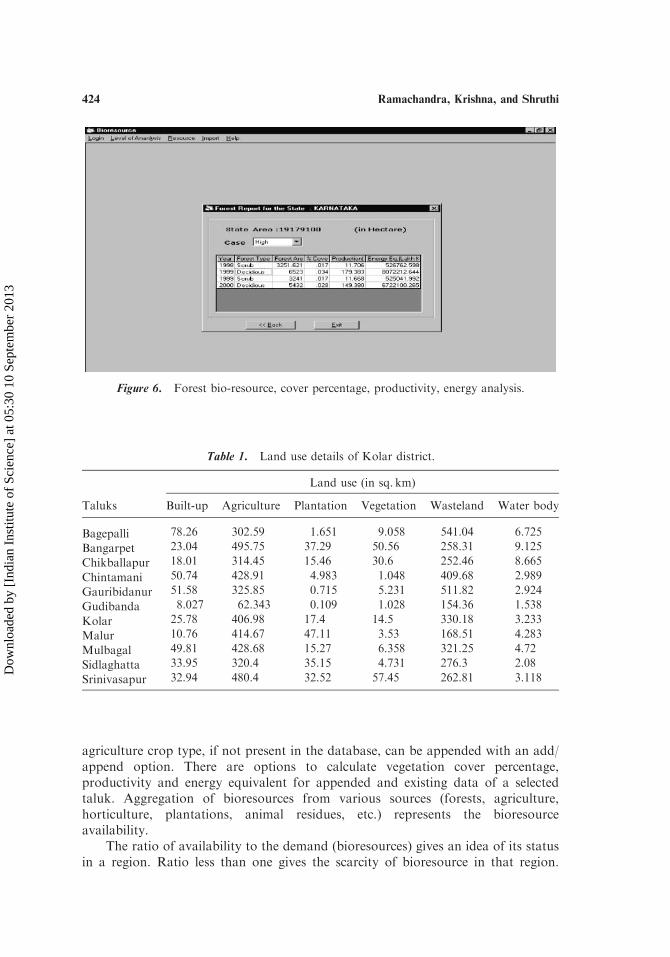
Figure 6 displays the computed cover percentage, productivity, biomass yield and
energy equivalent values. User can visualize biomass situation for three cases namely
high, low, and medium productivity values.The vegetation cover in Kolar district as per NDVI and TSAVI analyses is about
52.5%, while 47.5% is not under vegetation. Land use analyses using maximum
likelihood classifier indicate that 46.69% is agricultural land, 42.33% is wasteland
(barren land), 4.62% is built up, 3.07% plantation, 2.77% natural forest and 0.53%
water bodies. Overlaying district layer with taluk boundaries on the classified district
image, talukwise land use details were obtained. Table 1 shows land use details of
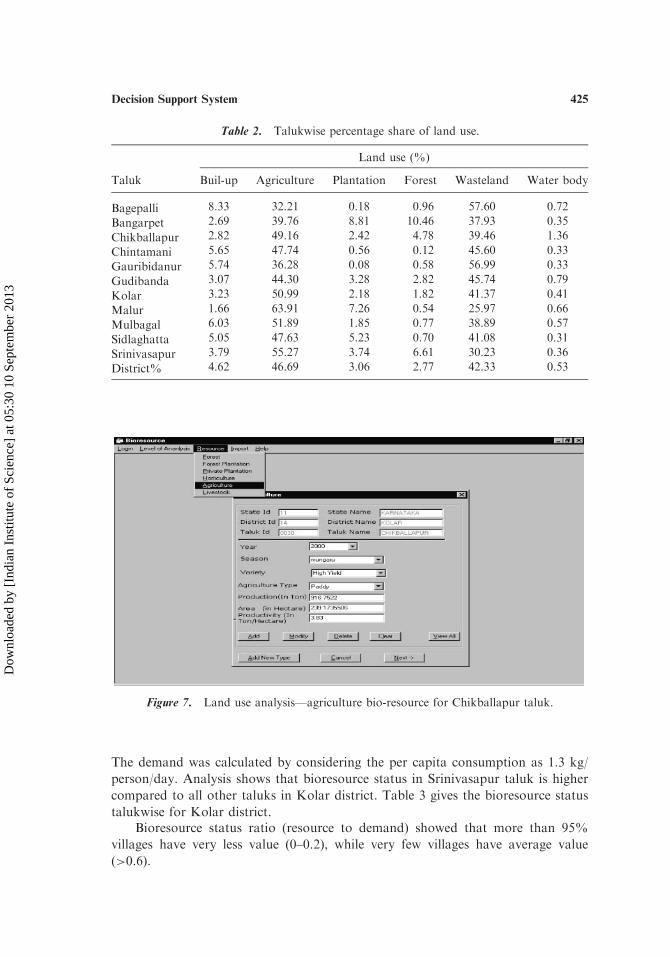
Kolar district and corresponding percentage share is given in Table 2.Figure 7 shows data entry of agriculture bioresource for the selected taluk
(Chikballapur), district (Kolar) and State (Karnataka). User is provided with
options to append, edit, and delete agriculture resource details. For appending user
has to provide year, season and crop type, production and area details. A new
Figure 5. Bio-resource from forests.
Decision Support System 423
Dow
nloa
ded
by [
Indi
an I
nstit
ute
of S
cien
ce]
at 0
5:30
10
Sept
embe
r 20
13
agriculture crop type, if not present in the database, can be appended with an add/append option. There are options to calculate vegetation cover percentage,productivity and energy equivalent for appended and existing data of a selectedtaluk. Aggregation of bioresources from various sources (forests, agriculture,horticulture, plantations, animal residues, etc.) represents the bioresourceavailability.
The ratio of availability to the demand (bioresources) gives an idea of its statusin a region. Ratio less than one gives the scarcity of bioresource in that region.
Figure 6. Forest bio-resource, cover percentage, productivity, energy analysis.
Table 1. Land use details of Kolar district.
Taluks
Land use (in sq. km)
Built-up Agriculture Plantation Vegetation Wasteland Water body
Bagepalli 78.26 302.59 1.651 9.058 541.04 6.725
Bangarpet 23.04 495.75 37.29 50.56 258.31 9.125
Chikballapur 18.01 314.45 15.46 30.6 252.46 8.665
Chintamani 50.74 428.91 4.983 1.048 409.68 2.989
Gauribidanur 51.58 325.85 0.715 5.231 511.82 2.924
Gudibanda 8.027 62.343 0.109 1.028 154.36 1.538
Kolar 25.78 406.98 17.4 14.5 330.18 3.233
Malur 10.76 414.67 47.11 3.53 168.51 4.283
Mulbagal 49.81 428.68 15.27 6.358 321.25 4.72
Sidlaghatta 33.95 320.4 35.15 4.731 276.3 2.08
Srinivasapur 32.94 480.4 32.52 57.45 262.81 3.118
424 Ramachandra, Krishna, and Shruthi
Dow
nloa
ded
by [
Indi
an I
nstit
ute
of S
cien
ce]
at 0
5:30
10
Sept
embe
r 20
13
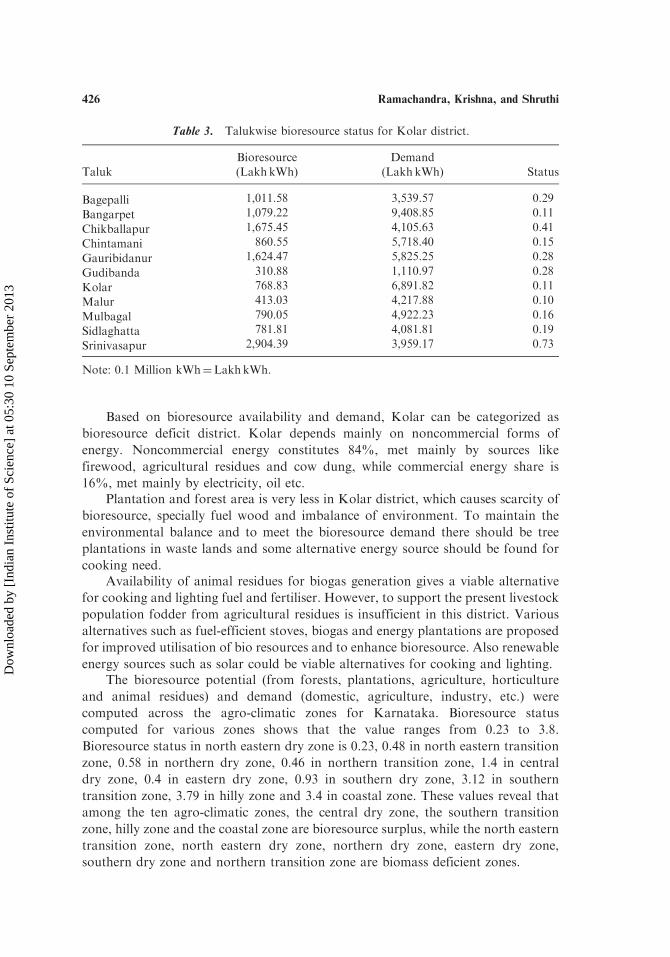
The demand was calculated by considering the per capita consumption as 1.3 kg/
person/day. Analysis shows that bioresource status in Srinivasapur taluk is higher
compared to all other taluks in Kolar district. Table 3 gives the bioresource status
talukwise for Kolar district.Bioresource status ratio (resource to demand) showed that more than 95%
villages have very less value (0–0.2), while very few villages have average value
(>0.6).
Figure 7. Land use analysis—agriculture bio-resource for Chikballapur taluk.
Table 2. Talukwise percentage share of land use.
Taluk
Land use (%)
Buil-up Agriculture Plantation Forest Wasteland Water body
Bagepalli 8.33 32.21 0.18 0.96 57.60 0.72
Bangarpet 2.69 39.76 8.81 10.46 37.93 0.35
Chikballapur 2.82 49.16 2.42 4.78 39.46 1.36
Chintamani 5.65 47.74 0.56 0.12 45.60 0.33
Gauribidanur 5.74 36.28 0.08 0.58 56.99 0.33
Gudibanda 3.07 44.30 3.28 2.82 45.74 0.79
Kolar 3.23 50.99 2.18 1.82 41.37 0.41
Malur 1.66 63.91 7.26 0.54 25.97 0.66
Mulbagal 6.03 51.89 1.85 0.77 38.89 0.57
Sidlaghatta 5.05 47.63 5.23 0.70 41.08 0.31
Srinivasapur 3.79 55.27 3.74 6.61 30.23 0.36
District% 4.62 46.69 3.06 2.77 42.33 0.53
Decision Support System 425
Dow
nloa
ded
by [
Indi
an I
nstit
ute
of S
cien
ce]
at 0
5:30
10
Sept
embe
r 20
13
Based on bioresource availability and demand, Kolar can be categorized as
bioresource deficit district. Kolar depends mainly on noncommercial forms of
energy. Noncommercial energy constitutes 84%, met mainly by sources like
firewood, agricultural residues and cow dung, while commercial energy share is
16%, met mainly by electricity, oil etc.Plantation and forest area is very less in Kolar district, which causes scarcity of
bioresource, specially fuel wood and imbalance of environment. To maintain the
environmental balance and to meet the bioresource demand there should be tree
plantations in waste lands and some alternative energy source should be found for
cooking need.Availability of animal residues for biogas generation gives a viable alternative
for cooking and lighting fuel and fertiliser. However, to support the present livestock
population fodder from agricultural residues is insufficient in this district. Various
alternatives such as fuel-efficient stoves, biogas and energy plantations are proposed
for improved utilisation of bio resources and to enhance bioresource. Also renewable
energy sources such as solar could be viable alternatives for cooking and lighting.The bioresource potential (from forests, plantations, agriculture, horticulture
and animal residues) and demand (domestic, agriculture, industry, etc.) were
computed across the agro-climatic zones for Karnataka. Bioresource status
computed for various zones shows that the value ranges from 0.23 to 3.8.
Bioresource status in north eastern dry zone is 0.23, 0.48 in north eastern transition
zone, 0.58 in northern dry zone, 0.46 in northern transition zone, 1.4 in central
dry zone, 0.4 in eastern dry zone, 0.93 in southern dry zone, 3.12 in southern
transition zone, 3.79 in hilly zone and 3.4 in coastal zone. These values reveal that
among the ten agro-climatic zones, the central dry zone, the southern transition
zone, hilly zone and the coastal zone are bioresource surplus, while the north eastern
transition zone, north eastern dry zone, northern dry zone, eastern dry zone,
southern dry zone and northern transition zone are biomass deficient zones.
Table 3. Talukwise bioresource status for Kolar district.
Taluk
Bioresource Demand
Status(Lakh kWh) (Lakh kWh)
Bagepalli 1,011.58 3,539.57 0.29
Bangarpet 1,079.22 9,408.85 0.11
Chikballapur 1,675.45 4,105.63 0.41
Chintamani 860.55 5,718.40 0.15
Gauribidanur 1,624.47 5,825.25 0.28
Gudibanda 310.88 1,110.97 0.28
Kolar 768.83 6,891.82 0.11
Malur 413.03 4,217.88 0.10
Mulbagal 790.05 4,922.23 0.16
Sidlaghatta 781.81 4,081.81 0.19
Srinivasapur 2,904.39 3,959.17 0.73
Note: 0.1 Million kWh¼LakhkWh.
426 Ramachandra, Krishna, and Shruthi
Dow
nloa
ded
by [
Indi
an I
nstit
ute
of S
cien
ce]
at 0
5:30
10
Sept
embe
r 20
13
CONCLUSION
The role of bioresources in meeting a region’s requirement of fuel, food, fodderand timber has increased the interest for quantifying the amount of biomassavailable in a region. In addition to the many environmental benefits, biomass offersmany economic and energy security benefits. The estimation of biomass of tropicalforests has continually been refined over the past decade or so as the methodologies,knowledge, and the technology available for such methods and for such estimationhave improved. The technologies and methods used to develop and deploy DSS toaid in biomass energy assessment make work easier for a decision maker. Thepossibility of quickly accessing and processing large spatial databases over highspeeds offers a tremendous improvement. In spite of rapidly advancing computertechnology and the proliferation of software for decision support, relatively few DSShave been developed for assessment of biomass energy. This DSS is a User-friendlyGUI, which provides user with all needs to estimate and calculate biomass energyat different locations with different conditions. The entire framework is designedin such a way that, user is provided with helpful tips and context-sensitive helpoptions.
The bioresource status analysis shows that Kolar is a bioresource deficitdistrict. Kolar depends mainly on noncommercial forms of energy. Noncommercialenergy constitutes 84%, met mainly by sources like firewood, agricultural residuesand cow dung, while commercial energy share is 16%, met mainly by electricity,oil, etc.
ACKNOWLEDGMENT
We are grateful to the Ministry of Science and Technology, Government ofIndia and Indian Institute of Science for the infrastructure support and financialassistance. We thank Mr. B. K. Vijay Prasad, Mr. Rajeev Kumar Jha and Ms.Samapika Phady for the assistance in data compilation and analysis, and Mr.JoshuaDelay David and Mr.Sanjeev Kumar for proof reading the manuscript.
REFERENCES
Boyle, G. (1996). Renewable Energy Power for a Sustainable Future. 1st ed. Oxford,UK: Oxford University Press, 1–34.
Davide Freppaz, Riccardo Minciardi, Michela Robba, Mauro Rovatti, RobertoSacile, Angela Taramasso. (2004). Optimizing forest biomass exploitation forenergy supply at a regional level. Biomass and Bioenergy 26(1):15–25.
Fausto Cavallaro, Luigi Ciraolo. A multicriteria approach to evaluate wind energyplants on an Italian island. Energy Policy. http://www.sciencedirect.com(accessed Jan 2004).
Forest Survey of India. (1999). State of Forest Report, FSI: Dehra Dun, India,55–58.
http://mnes.nic/ach1.htm (accessed Jan 2004).
Decision Support System 427
Dow
nloa
ded
by [
Indi
an I
nstit
ute
of S
cien
ce]
at 0
5:30
10
Sept
embe
r 20
13
Jagadeesh, K., Rao, G. R., Kiran, M. K., Jagadish, K. S., Ramachandra, T. V.(2000). Mapping of Fuel wood Trees in Kolar district using Remote SensingData and GIS. ttp//wgbis.ces.iisc.ernet.in/energy/paper/fuelwood/abstract.html (accessed Jan 2004).
Mitchell, C. P. (2000). Development of decision support systems for bioenergyapplications. Biomass and Bioenergy 18(4):265–278.
Parker, B. J., Ul-Ataibi, G. A. (1986). Decision support systems: the reality thatseems hard to accept. International Journal of Management Science14(2):135–143.
Ramachandra, T. V., Subramanian, D. K. (1997). Industrial energy utilisation inKarnataka and potential savings. Energy Conversion and Management38(6):563–599.
Ramachandra, T. V., Joshi, N. V., Subramanian, D. K. (2000). Present andperspective role of bioenergy in regional energy system. Renewable andSustainable Energy Reviews 4:375–430.
Ramachandra, T. V., Kamakshi, G., Shruthi, B. V. (2004). Bioresource status inkarnataka. Renewable and Sustainable Energy Reviews 8(1):1–47.
Shirish Ravan. (2002). Spatial decision support system for biodiversity conservation.GIS @ Development 6(4):33–34.
Voivontas, D., Assimacopoulos, D., Koukios, E. G. (2001). Assessment of biomasspotential for power production: a GIS based method. Biomass and Bioenergy20(2):101–112.
Received March 17, 2003Accepted July 10, 2004
428 Ramachandra, Krishna, and Shruthi
Dow
nloa
ded
by [
Indi
an I
nstit
ute
of S
cien
ce]
at 0
5:30
10
Sept
embe
r 20
13
All in-text references underlined in blue are linked to publications on ResearchGate, letting you access and read them immediately.