Deciphering the interactions between chlorambucil and calf thymus DNA: A multi-spectroscopic and...
8
Deciphering the interactions between chlorambucil and calf thymus DNA: A multi-spectroscopic and molecular docking study Sayeed Ur Rehman, Tarique Sarwar, Hassan Mubarak Ishqi, Mohammed Amir Husain, Ziaul Hasan, Mohammad Tabish ⇑ Department of Biochemistry, Faculty of Life Sciences, A.M. University, Aligarh, U.P. 202002, India article info Article history: Received 1 November 2014 and in revised form 25 November 2014 Available online 17 December 2014 Keywords: Chlorambucil Calf thymus DNA Non-covalent interactions Groove binding Molecular docking abstract Non-covalent interactions of chlorambucil with calf thymus DNA was investigated using multi-spectro- scopic techniques and molecular docking study. Binding constant calculated was found to be 1.54 10 4 M 1 at 290 K , significantly lower than various known intercalators. Quenching process was found to be static as evident by biomolecular quenching constant. Thermodynamic parameters revealed the involvement of hydrophobic interactions and hydrogen bonds in the binding. Chlorambucil was found to interact via external binding mode and follow groove binding as it replaces Hoechst (a typical groove binder) from the groove of DNA but does not replace intercalating dyes including ethidium bro- mide and acridine orange from the DNA helix. These results were further supported by KI quenching experiments, DNA melting studies, CD spectroscopy and molecular docking. Ó 2014 Elsevier Inc. All rights reserved. Introduction DNA is the major intracellular target for wide range of drugs [1,2]. These drugs are capable of binding and interfering with var- ious vital functions of DNA. Studying these interactions provide insight into the functioning of these drugs [3,5]. Some commonly used anticancer drugs are capable of generating reactive oxygen species (ROS) 1 and causing DNA damage. The diverse interaction between these small molecules and DNA is indeed a promising area to be explored. Small molecules may interact with DNA following covalent or non-covalent interactions. Three major modes of non- covalent interactions are groove binding, intercalative binding and electrostatic interactions. Two different types of groove binding mode are major groove and minor groove binding that involves hydrogen bonding or van der Waals interaction with nitrogenous bases. Intercalation occurs when small molecules intercalate within the nucleic acid base pairs while electrostatic binding occurs due to interaction of positively charged end of small molecules and nega- tively charged DNA phosphate backbone [6,7]. Studies focussed to decipher these interactions between drugs and DNA help in better understanding the mechanism of drug action at molecular level. Also, the results obtained from such studies have been very useful in designing novel and promising drugs for clinical use. Chlorambucil (Fig 1A) is a DNA alkylating agent routinely used in chemotherapy of blood and lymphatic system cancer along with treatment of other tumors [8]. It is also an important immunosup- pressive agent used to treat rheumatoid arthritis and systemic lupus erythematosus. Chlorambucil is known to form adducts causing DNA crosslinks in the cell [9]. Chlorambucil induced DNA crosslinking results due to alkylation that occurs preferentially in the middle runs of guanines [10]. High occurrences of covalent modifications of DNA induced by chlorambucil causes cytotoxicity since cells are unable to repair them. However, cytotoxic action of chlorambucil is not selective and is directed against all rapidly dividing cells that include normal hemopoietic tissue, gonads and mucous membrane. Due to these non-specific interactions of chlor- ambucil, it is also known to have mutagenic and carcinogenic effects that lead to the promotion of secondary malignancies [11,12]. In this study, we have explored interaction between chloram- bucil and calf thymus DNA (CT-DNA). UV–visible spectroscopy was employed to study the complex formation. Fluorescence stud- ies were performed to calculate the binding constant between chlorambucil and DNA. Various thermodynamic parameters were also calculated. Competitive displacement assays were used to decipher the binding mode that was further supported by KI quenching experiments, DNA melting study and CD spectroscopy. Molecular docking was employed to deduce the binding mode http://dx.doi.org/10.1016/j.abb.2014.12.013 0003-9861/Ó 2014 Elsevier Inc. All rights reserved. ⇑ Corresponding author. E-mail address: [email protected] (M. Tabish). 1 Abbreviations used: ROS, reactive oxygen species; CT-DNA, calf thymus DNA; AO, acridine orange; EB, ethidium bromide. Archives of Biochemistry and Biophysics 566 (2015) 7–14 Contents lists available at ScienceDirect Archives of Biochemistry and Biophysics journal homepage: www.elsevier.com/locate/yabbi
-
Upload
independent -
Category
Documents
-
view
2 -
download
0
Transcript of Deciphering the interactions between chlorambucil and calf thymus DNA: A multi-spectroscopic and...

Archives of Biochemistry and Biophysics 566 (2015) 7–14
Contents lists available at ScienceDirect
Archives of Biochemistry and Biophysics
journal homepage: www.elsevier .com/ locate/yabbi
Deciphering the interactions between chlorambucil and calf thymusDNA: A multi-spectroscopic and molecular docking study
http://dx.doi.org/10.1016/j.abb.2014.12.0130003-9861/� 2014 Elsevier Inc. All rights reserved.
⇑ Corresponding author.E-mail address: [email protected] (M. Tabish).
1 Abbreviations used: ROS, reactive oxygen species; CT-DNA, calf thymus DNA; AO,acridine orange; EB, ethidium bromide.
Sayeed Ur Rehman, Tarique Sarwar, Hassan Mubarak Ishqi, Mohammed Amir Husain, Ziaul Hasan,Mohammad Tabish ⇑Department of Biochemistry, Faculty of Life Sciences, A.M. University, Aligarh, U.P. 202002, India
a r t i c l e i n f o a b s t r a c t
Article history:Received 1 November 2014and in revised form 25 November 2014Available online 17 December 2014
Keywords:ChlorambucilCalf thymus DNANon-covalent interactionsGroove bindingMolecular docking
Non-covalent interactions of chlorambucil with calf thymus DNA was investigated using multi-spectro-scopic techniques and molecular docking study. Binding constant calculated was found to be1.54 � 104 M�1 at 290 K, significantly lower than various known intercalators. Quenching process wasfound to be static as evident by biomolecular quenching constant. Thermodynamic parameters revealedthe involvement of hydrophobic interactions and hydrogen bonds in the binding. Chlorambucil wasfound to interact via external binding mode and follow groove binding as it replaces Hoechst (a typicalgroove binder) from the groove of DNA but does not replace intercalating dyes including ethidium bro-mide and acridine orange from the DNA helix. These results were further supported by KI quenchingexperiments, DNA melting studies, CD spectroscopy and molecular docking.
� 2014 Elsevier Inc. All rights reserved.
Introduction
DNA is the major intracellular target for wide range of drugs[1,2]. These drugs are capable of binding and interfering with var-ious vital functions of DNA. Studying these interactions provideinsight into the functioning of these drugs [3,5]. Some commonlyused anticancer drugs are capable of generating reactive oxygenspecies (ROS)1 and causing DNA damage. The diverse interactionbetween these small molecules and DNA is indeed a promising areato be explored. Small molecules may interact with DNA followingcovalent or non-covalent interactions. Three major modes of non-covalent interactions are groove binding, intercalative binding andelectrostatic interactions. Two different types of groove bindingmode are major groove and minor groove binding that involveshydrogen bonding or van der Waals interaction with nitrogenousbases. Intercalation occurs when small molecules intercalate withinthe nucleic acid base pairs while electrostatic binding occurs due tointeraction of positively charged end of small molecules and nega-tively charged DNA phosphate backbone [6,7]. Studies focussed todecipher these interactions between drugs and DNA help in betterunderstanding the mechanism of drug action at molecular level.
Also, the results obtained from such studies have been very usefulin designing novel and promising drugs for clinical use.
Chlorambucil (Fig 1A) is a DNA alkylating agent routinely usedin chemotherapy of blood and lymphatic system cancer along withtreatment of other tumors [8]. It is also an important immunosup-pressive agent used to treat rheumatoid arthritis and systemiclupus erythematosus. Chlorambucil is known to form adductscausing DNA crosslinks in the cell [9]. Chlorambucil induced DNAcrosslinking results due to alkylation that occurs preferentially inthe middle runs of guanines [10]. High occurrences of covalentmodifications of DNA induced by chlorambucil causes cytotoxicitysince cells are unable to repair them. However, cytotoxic action ofchlorambucil is not selective and is directed against all rapidlydividing cells that include normal hemopoietic tissue, gonads andmucous membrane. Due to these non-specific interactions of chlor-ambucil, it is also known to have mutagenic and carcinogeniceffects that lead to the promotion of secondary malignancies[11,12].
In this study, we have explored interaction between chloram-bucil and calf thymus DNA (CT-DNA). UV–visible spectroscopywas employed to study the complex formation. Fluorescence stud-ies were performed to calculate the binding constant betweenchlorambucil and DNA. Various thermodynamic parameters werealso calculated. Competitive displacement assays were used todecipher the binding mode that was further supported by KIquenching experiments, DNA melting study and CD spectroscopy.Molecular docking was employed to deduce the binding mode

8 S.U. Rehman et al. / Archives of Biochemistry and Biophysics 566 (2015) 7–14
and minimum energy complex formed between chlorambucil andDNA.
Materials and methods
Materials
CT-DNA, chlorambucil, Hoechst 33258 and acridine orange (AO)were purchased from Sigma Aldrich, USA. Ethidium bromide (EB)was purchased from HiMedia, India. All other chemicals and sol-vents were of reagent grade and used without purification.
Sample preparation
CT-DNA was suspended in 10 mM Tris–HCl buffer (pH 7.2) at4 �C for 24 h with occasional stirring to ensure the formation of ahomogeneous solution. To check the purity of DNA solution, absor-bance ratio (A260/A280) was recorded. No further purification wasrequired since the value of ratio was between 1.8 and 1.9. Variousconcentration of DNA solutions were used in different experimentsafter determining its concentration spectrophotometrically usingaverage molar extinction coefficient value of 6600 M�1 cm�1 of asingle nucleotide at 260 nm. Stock solution of chlorambucil wasprepared in 1:1 (v/v) ethanol:water.
UV–visible spectroscopy
UV–visible spectra were recorded on Shimadzu spectrophotom-eter (JAPAN) using a cuvette of 1 � 1 cm path length. Spectra ofchlorambucil and chlorambucil–DNA complex were measured inthe wavelength range of 220–340 nm. Increasing concentrationof CT-DNA was titrated against 30 lM of chlorambucil. Maximumabsorption wavelength of CT-DNA and chlorambucil fall very clo-sely in the absorption spectra. Hence, a fixed amount of CT-DNA(30 lM) was taken in the blank and baseline was corrected.
Steady state fluorescence
Fluorescence emission spectra of chlorambucil were recordedon a Shimadzu RF-5301PC spectrofluorophotometer (JAPAN)equipped with xenon flash lamp using 1.0 cm quartz cells. Excita-tion of chlorambucil was done at 257 nm and emission spectrawere recorded from 320 nm to 430 nm after setting the widths ofboth the excitation and the emission slits at 5 nm. Backgroundfluorescence of buffer was subtracted from the final readings. The
Fig. 1. Interaction of chlorambucil with CT-DNA. (A) Molecular structure of chlorambucilconcentrations of CT-DNA in Tris–HCl buffer (pH 7.2). Hyperchromism was observed withDNA.
fluorescence titration was carried out by keeping the concentrationof chlorambucil constant (30 lM) and varying DNA concentration(0–63 lM). These studies were also performed at three differenttemperatures to calculate various thermodynamic parameters ofchlorambucil–DNA interaction.
Competitive displacement assays
Dye displacement assays were performed using spectrofluo-rometer. EB displacement assay was performed with a solutioncontaining 2 lM EB, 20 lM DNA and increasing concentration ofchlorambucil was added as mentioned in the figure. EB–DNA com-plex was excited at 471 nm and emission spectra were recordedfrom 525 to 675 nm. In similar experiments, AO-DNA complexwas excited at 490 nm and emission spectra were recorded from500 to 650 nm while DNA-Hoechst 33258 complex was excitedat 343 nm and emission spectra were recorded from 375 to600 nm respectively. 10 mM Tris–HCl (pH 7.2) buffer was used inall cases. Concentration of AO and Hoechst was 2 lM.
KI quenching studies
Iodide quenching experiments were performed after excitingchlorambucil and recording the fluorescence spectra in presenceof increasing concentration of KI, both in absence and presenceof DNA (30 lM). 3 ml reaction mixture included 30 lM chlorambu-cil, 10 mM Tris–HCl (pH 7.2) and varying concentration of KIbetween 0 and 120 mM. Excitation was done at 257 nm and emis-sion spectra were recorded from 320 to 430 nm. Ksv was calculatedboth in absence and presence of DNA with the help of Stern–Vol-mer equation.
Role of ionic strength
Effect of ionic strength was studied by varying the concentra-tion of NaCl between 0– and 135 mM in total volume of 3 ml con-taining 30 lM chlorambucil, 30 lM CT-DNA and 10 mM Tris–HCl(pH 7.2). Excitation was done at 257 nm and emission spectra wererecorded between 320 and 430 nm.
DNA melting study
DNA melting study was performed in absence and presencechlorambucil by monitoring the absorbance intensity at 260 nmover a wide range of temperature ranging from 25–100 �C. CT-DNA
. (B) UV–visible absorption spectra of chlorambucil (30 lM) in presence of increasingincreasing concentration of CT-DNA confirming the interaction of chlorambucil and

S.U. Rehman et al. / Archives of Biochemistry and Biophysics 566 (2015) 7–14 9
(50 lM) was taken alone or in presence of 50 lM chlorambucil inbuffer. The temperature of the sample was monitored with the helpof thermostat attached with sample holder. The absorbance wasrecorded at 260 nm and the result is plotted as the function of tem-perature. The melting temperature (Tm) of DNA was determined asthe transition midpoint of melting curve.
CD spectroscopy
CD spectra were recorded using Applied Photophysics CD spec-trophotometer (model CIRASCAN, U.K.) equipped with a Peltiertemperature controller to monitor the temperature of the sample.All the CD spectra were recorded in the range 225–300 nm with ascan speed of 200 nm/min and a spectral band width of 10 nm. Thetemperature of sample was kept constant at 25 �C. Average of threescans was taken in all experiments. Background spectrum of buffersolution (10 mM Tris–HCl, pH 7.2) was subtracted from the spectraof DNA and chlorambucil–DNA complex.
Molecular docking
A molecular graphics program, HEX 6.3, was used to study thechlorambucil–DNA interaction. The Hex 6.3 performs dockingusing spherical polar fourier correlations. It necessitates theligands and the receptor as input in PDB format. Structure of theB–DNA dodecamer d(CGCGAATTCGCG)2 (PDB ID: 1BNA) wasdownloaded from the protein data bank (http://www.rcsb.org./pdb). Chlorambucil structure was obtained from https://pub-chem.ncbi.nlm.nih.gov/g in SDF format and further converted intoPDB format using Avogadro’s 1.01. The parameters that were usedfor docking include: correlation type – shape only, FFT mode – 3D,grid dimension – 0.6, receptor range – 180, ligand range – 180,twist range – 360, distance range – 40. Finally, PyMol softwarewas used for visualisation of the docked pose. AutoDock Vinawas also used to perform docking studies. DNA and chlorambucilpdb file was first converted to pdbqt format. The grid box dimen-sions were chosen to be sufficiently large in order to include com-plete dodecamer d(CGCGAATTCGCG)2. Docking was performed anddocked complex was visualised using PyMol.
Fig. 2. Interaction of chlorambucil with CT-DNA studied using fluorescencespectroscopy. Fluorescence emission spectra of chlorambucil (30 lM) in thepresence of increasing concentrations of CT-DNA. Decrease in the fluorescenceintensity was observed with increasing DNA concentration. Excitation wavelengthwas 257 nm and emission was recorded as shown in the figure.
Results and discussion
UV–visible spectroscopy
Studying the interaction of small molecules with DNA is animportant step to understand their mechanism of action. UV–visi-ble absorption spectroscopy is effective and simplest techniqueused to study the interaction of small molecules with DNA andcomplex formation. The absorption spectra of chlorambucil in theabsence and presence of increasing concentration of CT-DNA wasrecorded and is shown in Fig. 1B. With the increasing concentra-tion of CT-DNA, there was a progressive increase in the absorptionwith no apparent shift in the band position. In general, hyperchro-mism has been linked to presence of various non-covalent interac-tions that occur outside the DNA helix [13]. These interactions mayincluded electrostatic binding, hydrogen bonding and groove bind-ing. Also, there was no clear isobestic points observed on additionof DNA. Hence, UV–visible spectroscopy confirms the interactionbetween chlorambucil and CT-DNA. Further experiments wereperformed to study the binding mode with more details.
Steady state fluorescence
Fluorescence spectroscopy is one of the most widely usedtechniques to study the drug-DNA interaction. We have therefore
performed a series of experiments based on fluorescence spectros-copy and deduced the binding mode of chlorambucil with DNA.Steady state fluorescence experiment was performed by studyingthe emission spectra of chlorambucil in the presence of increasingconcentration of CT-DNA (Fig. 2). Quenching of chlorambucil fluo-rescence occurred in presence of CT-DNA with no detectable shiftin the band position suggesting interaction between chlorambuciland CT-DNA. To further analyse these interactions, ratio of peakfluorescence emission intensity of chlorambucil in the absenceand presence of CT-DNA (F0/F) was plotted as a function of CT-DNA concentration at different temperatures (Fig. 3). Taking helpof Stern–Volmer equation,
F0=F ¼ 1þ Ksv½Q � ð1Þ
where F0 and F are the highest fluorescence intensity in the absenceand presence of CT-DNA [Q], Stern–Volmer constant (Ksv) was cal-culated from the slope of Fig. 3 and is listed in Table 1. The Ksv
obtained in our study varied from 0.9 � 104 to 1.36 � 104 litre/mol at different temperatures. These values are significantly higherthan the chlorambucil–DNA binding constant obtained earlier [14].The possible reason for the variation in binding constant is possiblydue to the calculation of these parameters using different tech-niques. Since the maximum absorbance of chlorambucil (257 nm)fall very close to CT-DNA (260 nm), we have avoided using UV–vis-ible studies for the same reason. Due to close proximity of the max-imum absorbance wavelength of both ligand and DNA, there mightbe chances of error in calculation of the binding constant. In case offluorescence spectroscopy, DNA does not interfere with the chlor-ambucil spectra since it does not show any fluorescence property.Further, the Ksv value obtained was lower than well known interca-lators [15]. Thus, lower Ksv value suggested a non-intercalativebinding between chlorambucil and CT-DNA. Since the quenchingprocess of chlorambucil–DNA interaction has not been reportedearlier, formation of complex between chlorambucil and CT-DNAwas further analysed to study this process. Quenching process isclassified as static quenching or dynamic quenching which followsdifferent mechanism [16]. With the help of experiments, these twoclasses can be easily distinguished. To study the quenching processinvolved in our study, the bimolecular quenching constant (Kq) wascalculated from the equation

Fig. 3. Stern–Volmer plot for interaction of chlorambucil with CT-DNA at threedifferent temperatures. Binding constant was calculated from the slope. F0 and F arethe fluorescence intensity of chlorambucil in absence and presence of CT-DNA.
Table 1Effect of temperature on chlorambucil–DNA interaction.
T(K)
KSV (�104)(litre/mol)
Kq (�1012) (litre/mol per s)
K (�104)(litre/mol)
n R2
290 1.36 1.36 1.54 1.012 0.998300 1.15 1.15 1.40 1.020 0.995310 0.93 0.93 1.27 1.031 0.999
10 S.U. Rehman et al. / Archives of Biochemistry and Biophysics 566 (2015) 7–14
Kq ¼ Ksv=s0 ð2Þ
where, s is the lifetime of the fluorophore. If Kq value is higher thanthe limiting diffusion rate constant (�2 � 1010 L mol�1 s�1), thequenching process is static [17]. From the reference [17] takingvalue of s0 = 10�8 s, value of Kq was found to be in the range of0.9–1.36 � 1012 at different temperatures (Table 1). Since Kq washigher than the limiting diffusion rate constant, the quenching pro-cess was found to be static rather than dynamic process [17].Another widely used method to differentiate the quenching processis to study the temperature-dependence pattern of quenching. It iswell known that the Ksv value decreases with increasing tempera-ture in case of static process while reverse is observed in case ofdynamic process. In case of chlorambucil–DNA interaction, therewas a significant decrease in the Ksv value thus confirming the exis-tence of static quenching process (Table 1).
Competitive displacement assays
Taking the help of fluorescence spectroscopy, various knownDNA binding dyes were used to decipher the binding modebetween chlorambucil and DNA. In competitive displacementassays performed using these fluorescent dyes, any small moleculethat replaces the bound dye from DNA will interact with DNA viasame mode as the replaced dye. Hence, by studying the changein fluorescence behaviour of dye-DNA system in presence of anydrug, binding mode of drug can be elucidated. EB is extensivelyused as fluorescence probe that binds to DNA via intercalativefashion [18]. Fluorescence of EB increases on intercalation betweenDNA base pairs. Chlorambucil was added subsequently to the solu-tion containing EB–DNA and the fluorescence was recorded(Fig. 4A). We did not observe any change in the emission spectraof EB–DNA system suggesting that chlorambucil could not replace
EB from DNA helix. Hence, chlorambucil is expected to interactwith DNA via non-intercalative binding mode. In a similar experi-ment, AO was used to study the binding mode of chlorambucil. AOis also a well known intercalating dye that shows enhanced fluo-rescent intensity on intercalating with DNA [19]. As seen in theFig. 4B, fluorescence intensity does not decrease on addition ofchlorambucil indicating that chlorambucil was not able to replaceAO from DNA helix and hence follows non-intercalative bindingmode. In another experiment, competitive displacement was per-formed using Hoechst 33258, a minor groove binder [20]. Hoechst33258 showed enhancement in the fluorescent intensity on bind-ing with DNA [20]. In our experiment, Chlorambucil was foundto replace Hoechst dye from the DNA groove as there was signifi-cant decrease in the fluorescent intensity of Hoechst–DNA complex(Fig 4C). These results clearly indicate the groove binding being themajor binding mode between chlorambucil and DNA.
KI quenching studies
Iodide quenching experiments clearly indicate the location ofthe bound molecules to be either inside or the outside of DNA.Iodide ions, a highly negatively charged quencher, can effectivelyquench the fluorescence of small molecules in an aqueous med-ium. In the presence of DNA, iodide ions are repelled by similarlycharged phosphate backbone of DNA and any small molecule thatpenetrates inside DNA helix is well protected from being quenchedby these negatively charged quenchers. However, electrostaticallybounded molecules as well as groove binders are not well pro-tected from anionic quenchers even in the presence of DNA envi-ronment and are readily quenched by KI [21]. The relativeaccessibility of drug to anionic quencher in the absence and pres-ence of DNA is studied by calculating Ksv from Stern–Volmer plot.Ksv obtained in the absence and presence of DNA is compared andthe binding mode is predicted. Relative decrease in the Ksv value inpresence of DNA occurs in case of intercalation. However, there isnegligible or very little change in the Ksv value in case of groovebinding or electrostatic interaction [21]. As seen in Fig. 5, KI couldeffectively quench the fluorescence of chlorambucil and Ksv valueof 3.79 M�1 was obtained with the help of Stern–Volmer plot.However, in the presence of DNA, Ksv value was found to be3.69 M�1 (Table 2). The negligible difference in the Ksv value inabsence and presence of DNA clearly suggest for an external orgroove binding mode between chlorambucil and DNA.
Role of ionic strength
Binding mode is also differentiated by studying the role of ionicstrength on drug–DNA interaction. NaCl is commonly used whereaddition of electrolyte to free molecule has no effect on the fluores-cence intensity free molecule. However, on increasing the ionicstrength by increasing NaCl concentration in drug-DNA solution,the electrostatic interaction between small molecule and DNA sur-face is weakened [22]. To check the role of electrostatic interactionin chlorambucil–DNA binding, effect of increasing concentration ofNaCl was studied (Fig. 6). On addition of NaCl, there was a slightincrease in chlorambucil–DNA fluorescence spectra initially. How-ever, no major change was observed afterwards. This suggests for avery little to negligible role of electrostatic interaction in chloram-bucil–DNA interaction.
Calculation of binding constant
With the help of fluorescence titration data, binding stoichiom-etry (n) and the binding constant (K) of chlorambucil–DNA com-plex was obtained. Calculation of K and n was done at threedifferent temperatures using the following equation [13].

Fig. 4. Competitive displacement assays between chlorambucil and various dyes.(A) Fluorescence titration of EB and CT-DNA complex with chlorambucil (CHL). EB-DNA complex was excited at 471 nm and emission spectra were recorded from525–680 nm. No change in fluorescence intensity was recorded with addition ofincreasing concentration of chlorambucil. (B) Fluorescence titration of AO and CT-DNA complex with chlorambucil (CHL). AO-DNA-complex was excited at 490 nmand emission spectra were recorded from 500–650 nm. No change in fluorescenceintensity was recorded with addition of increasing concentration of chlorambucil.(C) Fluorescence titration of CT-DNA and Hoechst (groove binder) complex withchlorambucil. Hoechst–DNA complex was excited at 343 nm and emission spectrawere recorded from 375–600 nm. Fluorescence intensity decreases with subse-quent addition of chlorambucil.
Fig. 5. KI quenching studies. Stern–Volmer plot to calculate the KI quenchingconstant in absence and presence of DNA. Slight decrease in KSV value is obtained incase of groove binding.
Table 2Various parameters obtained in KI quenching studies.
KSV (litre/mol) R2 Change in KSV (%)
Chlorambucil 3.79 ± 0.466 0.999 –Chlorambucil + DNA 3.69 ± 0.970 0.996 2.6
Fig. 6. Role of NaCl on chlorambucil–DNA interaction. Increasing concentration ofNaCl had little effect on fluorescence of chlorambucil–DNA complex. Chlorambucilwas excited at 257 nm and emission spectra recorded as shown in the figures.
S.U. Rehman et al. / Archives of Biochemistry and Biophysics 566 (2015) 7–14 11
log½ðF0 � FÞ=F� ¼ log K þ n log½Q � ð3Þ
Here, F0 and F are the fluorescence emission intensities of drugin the absence and presence of DNA [Q] respectively. Plot of log[(F0 � F)/F] versus log [DNA] was obtained and the intercept of thisplot corresponds to log K (Fig. 7). As mentioned in Table 1, value ofK was calculated to be 1.54 � 104 M�1 at 290 K and was found todecrease with the increasing temperature. Further, the slope ofthe above mentioned plot was used to obtain the value of n. Thevalue of n was found to be 1.012 at 290 K and was almost unaf-fected with any change in temperature.
Determination of thermodynamics parameters
Thermodynamic parameters are very important in defining theacting forces between the drug and macromolecules. These acting

Fig. 8. Van’t Hoff plot for the interaction of chlorambucil with CT-DNA.
Table 3Various thermodynamics parameters obtained for the binding of chlorambucil withCT-DNA at different temperatures.
T (K) DG (kJ/mol) DH (kJ/mol) DS (J/mol per K)
290 �23.251 �7.138 55.58300 �23.812 – –310 �24.367 – –
12 S.U. Rehman et al. / Archives of Biochemistry and Biophysics 566 (2015) 7–14
forces involve various non-covalent interactions which includeelectrostatic forces, hydrogen bonds, van der Waals forces andhydrophobic interactions. The main thermodynamic parametersthat define the binding mode are enthalpy change (DH), entropychange (DS) and free energy change (DG). Earlier studies havenot reported thermodynamic parameters for chlorambucil–DNAinteraction which gives valuable information regarding the roleof various forces involved in the interaction. Due to its importance,we have studied thermodynamic parameters with the help of fol-lowing equations [23,24].
log K ¼ �DH=ð2:303RTÞ þ DS=ð2:303RÞ ð4Þ
DG ¼ DH � TDS ð5Þ
Here K and R are the binding constant and universal gas con-stant respectively at absolute temperature T. The values of DHand DS were evaluated from the slope and intercept of van’t Hoffplot (Fig. 8). The free energy change (DG) was calculated fromEq. (5) and is listed along with DH and DS in Table 3. Interactionof chlorambucil with CT-DNA was found to be an exothermic reac-tion that was accompanied by negative enthalpy (DH) and positiveentropy (DS). The binding interaction between chlorambucil andCT-DNA was found to be spontaneous as evident by negative DG.As reported, typical hydrophobic interaction is characterised bypositive values of both DH and DS. Negative values of DH and DSarise from the van der Waals forces and hydrogen bonding whileelectrostatic interaction is followed by negative DH and positiveDS value [25]. In case of chlorambucil–DNA interaction, negativevalue of DH and positive value of DS was obtained. However, thenegative value of DH obtained in our study cannot be attributedto electrostatic interactions since in case of electrostatic interac-tion; DH is very small and close to zero [26]. The negative DHand positive DS value in our study suggests for the existence ofhydrophobic interactions and hydrogen bonds that may play majorroles in the interaction of chlorambucil with DNA. These resultsobtained in case of chlorambucil–DNA interaction are in consistentwith other minor-groove binders [17]. Participation of hydrogenbonds in chlorambucil–DNA interaction has also been reportedearlier [14].
DNA melting studies
The DNA helix is remarkably stable due to hydrogen bondingand base stacking interactions. The double helix dissociates to
Fig. 7. Plot of log(F0/F)/F versus log[CT-DNA] at different temperatures. Chloram-bucil (30 lM) was excited at 257 nm and increasing concentration of CT-DNA wasadded.
Fig. 9. DNA melting studies. Thermal melting profile of CT-DNA (50 lM) in absenceand presence of chlorambucil (50 lM). Only a slight increase in the meltingtemperature of CT-DNA was observed in presence of chlorambucil and hencesuggest for non-intercalative binding between chlorambucil and DNA.
single strands due to weakening of various binding forces onincreasing the temperature. The temperature at which a half of aDNA sample is melted is known as the melting temperature(Tm), and is strongly related to the stability of the double-helicalstructure. On intercalation of small molecules within the doublehelix of DNA, there is an increase in the DNA melting temperature(Tm) by about 5–8 �C [27]. This increase in melting temperature isattributed to the enhanced stability of DNA helix due to intercala-tion of small molecules within the strand [28]. However, in case ofgroove binding and electrostatic mode of interaction, no or slightincrease in the Tm is observed [29]. Binding of chlorambucil withCT-DNA was also studied by DNA melting experiments. In ourstudy, Tm value of DNA was calculated in absence and presenceof chlorambucil. Absorbance of DNA bases at 260 nm were
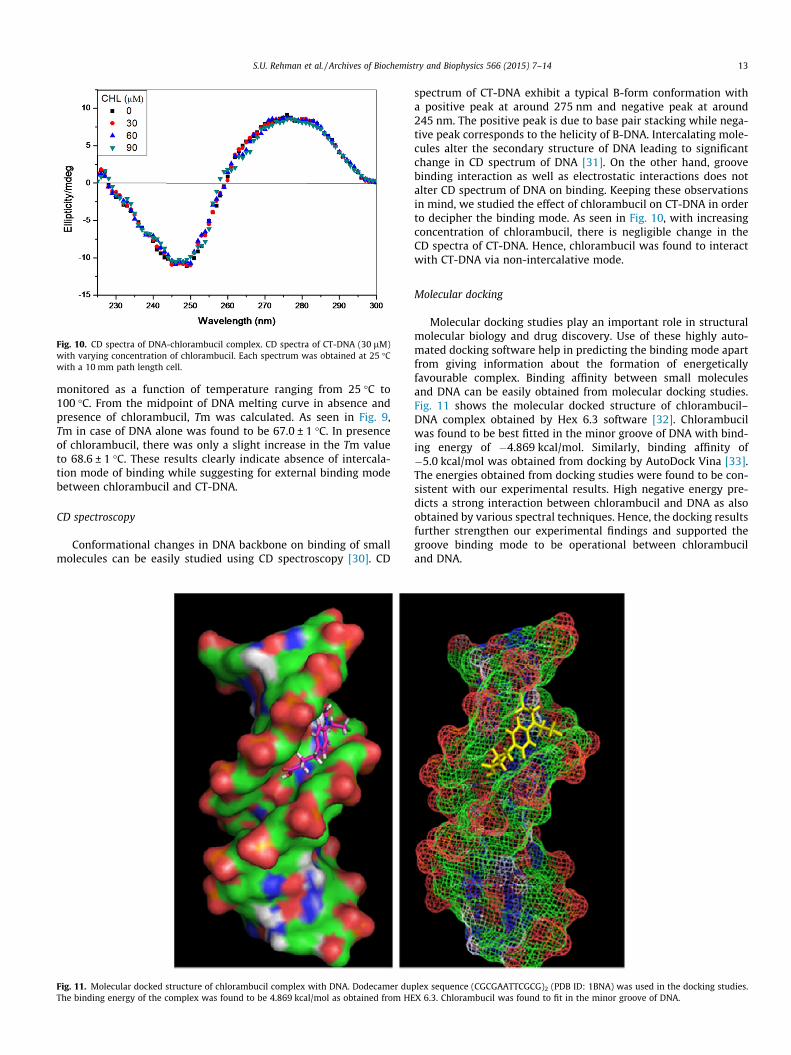
Fig. 10. CD spectra of DNA-chlorambucil complex. CD spectra of CT-DNA (30 lM)with varying concentration of chlorambucil. Each spectrum was obtained at 25 �Cwith a 10 mm path length cell.
S.U. Rehman et al. / Archives of Biochemistry and Biophysics 566 (2015) 7–14 13
monitored as a function of temperature ranging from 25 �C to100 �C. From the midpoint of DNA melting curve in absence andpresence of chlorambucil, Tm was calculated. As seen in Fig. 9,Tm in case of DNA alone was found to be 67.0 ± 1 �C. In presenceof chlorambucil, there was only a slight increase in the Tm valueto 68.6 ± 1 �C. These results clearly indicate absence of intercala-tion mode of binding while suggesting for external binding modebetween chlorambucil and CT-DNA.
CD spectroscopy
Conformational changes in DNA backbone on binding of smallmolecules can be easily studied using CD spectroscopy [30]. CD
Fig. 11. Molecular docked structure of chlorambucil complex with DNA. Dodecamer duThe binding energy of the complex was found to be 4.869 kcal/mol as obtained from HE
spectrum of CT-DNA exhibit a typical B-form conformation witha positive peak at around 275 nm and negative peak at around245 nm. The positive peak is due to base pair stacking while nega-tive peak corresponds to the helicity of B-DNA. Intercalating mole-cules alter the secondary structure of DNA leading to significantchange in CD spectrum of DNA [31]. On the other hand, groovebinding interaction as well as electrostatic interactions does notalter CD spectrum of DNA on binding. Keeping these observationsin mind, we studied the effect of chlorambucil on CT-DNA in orderto decipher the binding mode. As seen in Fig. 10, with increasingconcentration of chlorambucil, there is negligible change in theCD spectra of CT-DNA. Hence, chlorambucil was found to interactwith CT-DNA via non-intercalative mode.
Molecular docking
Molecular docking studies play an important role in structuralmolecular biology and drug discovery. Use of these highly auto-mated docking software help in predicting the binding mode apartfrom giving information about the formation of energeticallyfavourable complex. Binding affinity between small moleculesand DNA can be easily obtained from molecular docking studies.Fig. 11 shows the molecular docked structure of chlorambucil–DNA complex obtained by Hex 6.3 software [32]. Chlorambucilwas found to be best fitted in the minor groove of DNA with bind-ing energy of �4.869 kcal/mol. Similarly, binding affinity of�5.0 kcal/mol was obtained from docking by AutoDock Vina [33].The energies obtained from docking studies were found to be con-sistent with our experimental results. High negative energy pre-dicts a strong interaction between chlorambucil and DNA as alsoobtained by various spectral techniques. Hence, the docking resultsfurther strengthen our experimental findings and supported thegroove binding mode to be operational between chlorambuciland DNA.
plex sequence (CGCGAATTCGCG)2 (PDB ID: 1BNA) was used in the docking studies.X 6.3. Chlorambucil was found to fit in the minor groove of DNA.
14 S.U. Rehman et al. / Archives of Biochemistry and Biophysics 566 (2015) 7–14
Conclusion
In this study, non-covalent interactions between chlorambuciland CT-DNA were investigated using various spectroscopic tech-niques and molecular docking studies. Chlorambucil was foundto interact non-covalently with DNA via groove binding mode.The binding constant was calculated at three different tempera-tures and was found to be significantly lower than intercalatorsand the quenching was found to be static. Various thermodynamicparameters involved in the chlorambucil–DNA are reported for thefirst time and suggest possible role of hydrogen bonds and hydro-phobic interactions in the chlorambucil–DNA interaction. Molecu-lar docking studies revealed minimum energy complex and furthersupported our experimental findings.
Author contributions
Conceived and designed the experiments: SUR TS HMI MT. Per-formed the experiments: SUR TS ZH. Analysed the data: SUR MAHTS MT. Contributed reagents/materials/analysis tools: MAH HMI.Wrote the manuscript: SUR MT.
Acknowledgments
Authors are thankful to CSIR, New Delhi, for the award of CSIR-SRF fellowship to SUR (File no. 09/112(0470)/2011-EMR1) andDepartment of Biochemistry, Faculty of Life Sciences, AMU, Aligarhfor providing the necessary facilities. We also thank UGC and DBT,New Delhi for providing financial assistance. CD experiments wereperformed at AIRF, JNU, New Delhi.
References
[1] L.H. Hurley, Nat. Rev. Cancer 2 (2002) 188–200.[2] Y.J. Liu, X.Y. Wei, F.H. Wu, W.J. Mei, L.X. He, Spectrochim. Acta A 70 (2008)
171–176.
[3] Y. Shi, C. Guo, Y. Sun, Z. Liu, F. Xu, Y. Zhang, Z. Wen, Z. Li, Biomacromolecules 12(2011) 797–803.
[4] Y. Ding, L. Zhang, J. Xie, R. Guo, J. Phys. Chem. B 114 (2010) 2033–2043.[5] R.M. Elder, T. Emrick, A. Jayaraman, Biomacromolecules 12 (2011) 3870–3879.[6] M. Ilanchelian, R. Ramaraj, J. Fluoresc. 21 (2011) 1439–1453.[7] Z.W. Chen, A. Balamurugan, S.M. Chen, Bioelectrochemistry 75 (2009) 13–18.[8] G.B. Faguet, J. Clin. Oncol. 12 (1994) 1974–1990.[9] D. Mohamed, S. Mowaka, J. Thomale, M.W. Linscheid, Chem. Res. Toxicol. 22
(2009) 1435–1446.[10] A. Polavarapu, J.A. Stillabowe, S.G. Stubblefiel, W.M. Taylor, M.H. Baik, J. Org.
Chem. 77 (2012) 5914–5921.[11] G.P. Margison, K.M.F. Santibáñez, A.C. Povey, Mutagenesis 17 (2002) 483–487.[12] B.J. Sanderson, A.J. Shield, Mutat. Res. 355 (1996) 41–57.[13] N. Shahabadi, M. Maghsudi, Mol. BioSyst. 10 (2014) 338–347.[14] S. Charak, M. Shandilya, G. Tyagi, R. Mehrotra, Int. J. Biol. Macromol. 51 (2012)
406–411.[15] S. Kashanian, J.E.N. Dolatabadi, Eur. Food Res. Technol. 230 (2010) 821–825.[16] H. Chen, S.S. Ahsan, M.B. Santiago-Berrios, H.D. Abruña, W.W. Webb, J. Am.
Chem. Soc. 132 (2010) 7244–7245.[17] X. Ling, W. Zhong, Q. Huang, K. Ni, J. Photochem. Photobiol., B 93 (2008) 172–
176.[18] T. Sarwar, S.U. Rehman, M.A. Husain, H.M. Ishqi, M. Tabish, Int. J. Biol.
Macromol. (2014), http://dx.doi.org/10.1016/j.ijbiomac.2014.10.017.[19] J. Long, X.M. Wang, D.L. Xu, L.S. Ding, J. Mol. Recognit. 27 (2014) 131–137.[20] N. Shahabadi, M.M. Khodaei, S. Kashanian, F. Kheirdoosh, Spectrochim. Acta A
120 (2014) 1–6.[21] G. Zhang, L. Wang, X. Zhou, Y. Li, D. Gong, J. Agric. Food Chem. 62 (2014) 991–
1000.[22] F.Y. Wu, F.Y. Xie, Y.M. Wu, J.I. Hong, J. Fluoresc. 18 (2008) 175–181.[23] P.B. Kandagal, S. Ashoka, J. Seetharamappa, S.M. Shaikh, Y. Jadegoud, O.B. Ijare,
J. Pharm. Biomed. Anal. 41 (2006) 393–399.[24] N. Zhao, X. Wang, H. Pan, Y. Hu, L. Ding, Spectrochim. Acta A 75 (2010) 1435–
1442.[25] S.N. Khan, M. Danishuddin, A.U. Khan, Biosci. Rep. 30 (2010) 331–340.[26] J.B. Chaires, Arch. Biochem. Biophys. 453 (2006) 26–31.[27] S. Bi, H. Zhang, C. Qiao, Y. Sun, C. Liu, Spectrochim. Acta A 69 (2008) 123–129.[28] M. Sirajuddin, S. Ali, A. Badshah, J. Photochem. Photobiol. B 124 (2013) 1–19.[29] C.V. Kumar, R.S. Turner, E.H. Asuncion, J. Photochem. Photobiol. A 74 (1993)
231–238.[30] S.U. Rehman, Z. Yaseen, M.A. Husain, T. Sarwar, H.M. Ishqi, M. Tabish, PLoS ONE
9 (2014) e93913.[31] M.A. Husain, Z. Yaseen, S.U. Rehman, T. Sarwar, M. Tabish, FEBS J. 280 (2013)
6569–6580.[32] T. Sarwar, M.A. Husain, S.U. Rehman, H.M. Ishqi, M. Tabish, Mol. BioSyst.
(2014), http://dx.doi.org/10.1039/C4MB00636D.[33] O. Trott, A.J. Olson, J. Comput. Chem. 31 (2010) 455–461.