Ingestional Aesthetics: Deciphering Eating in Contemporary Art
ORIGINAL ARTICLE
Deciphering factors controlling trace element distributionin the soils of Karaduvar industrial-agricultural area(Mersin, SE Turkey)
Cuneyt Guler Æ Musa Alpaslan Æ Mehmet Ali Kurt ÆAbidin Temel
Received: 24 November 2008 / Accepted: 30 April 2009 / Published online: 19 May 2009
� Springer-Verlag 2009
Abstract In this study, 30 topsoil samples were collected
from Karaduvar area (Mersin, SE Turkey) where at present
various industrial and agricultural activities are occurring.
Using a five-step ultrasound-assisted sequential extraction
(UASE) procedure, trace elements in soil samples were
partitioned into the following: (1) soluble-exchangeable;
(2) bound to carbonates; (3) bound to Fe- and Mn-oxides;
(4) bound to organic matter and sulfide compounds, and (5)
residual fraction. Concentrations of 11 trace elements in
the extracts were determined using ICP-MS. Total con-
centrations ranged between (in mg kg-1) 3.35 and 7.26 for
As; 1.18 and 3.96 for Cd; 10.76 and 20.26 for Co; 37.99
and 63.48 for Cr; 18.55 and 243.1 for Cu; 338.7 and 565.6
for Mn; 4.42 and 6.44 for Mo; 148 and 279.3 for Ni; 10.12
and 73.71 for Pb; 17.93 and 36.55 for V, and 25.46 and
331.7 for Zn. Factor analysis was applied to dataset in
order to discriminate between natural and anthropogenic
pollution sources and factors controlling the spatial distri-
bution of trace elements in the area. Results suggest that
distributions of Co, Cr, Mn, and Ni are mainly controlled
by lithological factors, whereas, distributions of Cu, Pb,
and Zn can be attributed to agricultural activities such
as pesticide/herbicide use and fertilizer application, as well
as irrigation with petroleum hydrocarbon-contaminated
groundwater. Highest concentrations of Cd and Mo are
generally observed around the diesel-fired thermal power
plant and ATAS refinery. Highest concentrations of As and
V are generally observed at the NW sector of the area;
however, no definitive source can be designated for both of
these elements.
Keywords Soil pollution � Trace elements �Sequential extraction � Anthropogenic factors �Factor analysis � Turkey
Introduction
Increasing concerns regarding the possible environmental
risks associated with the heavy metal pollution of soils has
led to growing number of studies in the recent literature
(e.g. Lu et al. 2003; Falk et al. 2006; Li and Huang 2007).
Heavy metals are the most important source of trace ele-
ment toxicity in the environment given that most organisms
and plants are not adapted to tolerate high concentrations of
them (Abimbola et al. 2007). Studies have shown that
heavy metals can be taken up and accumulated in roots,
leaves, and edible parts of the plants (Chopin et al. 2008)
with a resulting risk to human and animal health (Gupta
and Gupta 1998). Soil pollution is commonly caused by
various point and non-point sources including natural
parent material weathering, mining activities, urban and
industrial discharges/spills/wastes/emissions in the form of
liquid, solid or gas, and agricultural activities such as
pesticide/herbicide use, fertilizer application and irrigation.
Pollution of soils by trace elements is critical because they
can be persistent in the environment and have a tendency to
accumulate in soils (Kabata-Pendias 2001) by preferential
adsorption onto silt- and clay-size fractions and adsorption
by Fe- or Mn-oxides and organic matter (Abderahman and
Abu-Rukah 2006). In soils, the forms of trace elements
strongly depend on their nature and origin (Ma and Uren
C. Guler (&) � M. Alpaslan � M. A. Kurt
Jeoloji Muhendisligi Bolumu, Mersin Universitesi,
Ciftlikkoy Kampusu, 33343 Mersin, Turkey
e-mail: [email protected]
A. Temel
Jeoloji Muhendisligi Bolumu, Muhendislik Fakultesi,
Hacettepe Universitesi, Beytepe, 06532 Ankara, Turkey
123
Environ Earth Sci (2010) 60:203–218
DOI 10.1007/s12665-009-0180-8
1998). Trace elements naturally exist as impurities on the
crystal structure of mineral phases and more importantly,
as exploitable minerals. On the other hand, the anthropo-
genic trace elements may exist on the surfaces of soils as
reactive forms (Levy et al. 1992; Ramos et al. 1994).
Although the total concentrations of trace elements in soil
give some indication of the level of contamination, it
provides no insight into element fractionation, mobility,
bioavailability, or toxicity (Ahnstrom and Parker 1999;
Romaguera et al. 2008).
Trace elements in soils are associated with a number of
physicochemical forms (Shuman 1985) which in turn
critically affect leaching behavior of trace elements. Frac-
tionation studies of trace elements in soils using a
sequential extraction procedure can provide an under-
standing of their chemical forms and occurrences of ele-
ments (Tessier et al. 1979). Many single and sequential
extraction schemes (ranging from 3 to 7 steps) have been
proposed for determination of specific chemical forms of
trace elements and studying the mobility/availability of
them in soil samples (e.g. Tessier et al. 1979; McGrath and
Cegarra 1992; Gimeno-Garcıa et al. 1995; Ho and Evans
1997; Ahnstrom and Parker 1999; Polyak and Hlavay
2001; Vaisanen and Kiljunen 2005). A comprehensive
review on the subject, including remarks on the reagents
used and their selectivity as well as their extraction capa-
bility, can be found in Filgueiras et al. (2002). Principle of
sequential extraction procedure is based on the selective
extraction of trace elements bound by specific soil frac-
tions. Most of the sequential extraction procedures are
based on Tessier’s scheme, which has been modified by
several researchers (Campanella et al. 1995; Borovec 1996;
Gomez Ariza et al. 2000; Vaisanen and Kiljunen 2005) in
order to optimize sequential extraction of trace elements in
different geo-environmental media. In this study, ultra-
sound-assisted sequential extraction (UASE) method pro-
posed by Vaisanen and Kiljunen (2005) was used to
perform a five-step sequential extraction on the soil
samples.
Karaduvar site is one of the most interesting and dra-
matic examples of an area experiencing various environ-
mental problems. Pollution from past petroleum refining
and thermal power generation activities, petrochemical
accidents (explosive burning of storage tanks and spills),
untreated industrial discharges, agricultural activities and
disordered urbanization are believed to be the main envi-
ronmental problems in the study area. These activities have
co-existed nearly half a century at the site and have all had
profound effects on the environment. Nevertheless, at the
site no serious pollution characterization or remediation
studies have been taken so far. The aims of this study were
to (1) report on the mineralogical and geochemical com-
position of the soil samples; (2) assess the mobility and
fractionation of the 11 trace elements (As, Cd, Co, Cr, Cu,
Mn, Mo, Ni, Pb, V and Zn) using UASE procedure, and (3)
make an inventory of the spatial extent of the pollution and
define the pollution sources (natural vs. anthropogenic)
using univariate and multivariate statistical techniques.
Materials and methods
Site history and description of the study area
The study area (Karaduvar site) is located at the eastern
side of the city of Mersin (in SE Turkey) along the coast of
the Mediterranean Sea, and it is bounded by latitudes
36�4801200–36�500900N and the longitudes 34�4002300–34�430400E (Fig. 1). The history of Karaduvar (ancient
name Anchiale) dates back to Neolithic period (ca. 3600
BC) and continues unbroken through Chalcolithic and
Early Bronze ages. The area has been traditionally asso-
ciated with agricultural activities although the agricultural
areas have been markedly decreasing since the past three
decades due to industrial and urban expansions. Crops
grown in the area include pepper, green bean, tomato,
radish, leek, cauliflower, savoy cabbage, leaves and salad
herbs, and citrus fruits, most of which are native to Med-
iterranean region. Given that the region has fertile alluvial
soils and mild climate, agricultural activities continue all
year long.
At the Karaduvar site, industrial areas are found side by
side with areas of intensive agriculture. After the estab-
lishment of ATAS petroleum refinery in Karaduvar in
1962, the area has become the center of attraction for a
wide variety of industrial activities ranging from petro-
chemical to energy and chemical to fertilizer production. In
1970, a diesel-fired thermal power plant was established in
the area with a capacity of 4 9 25 MW and closed down in
1994. In 1972, a nitrogen fertilizer factory was also
established in the area, which currently produces CAN and
DAP fertilizers (total production is 744 9 103 t year-1). In
2005, ATAS refinery phased out its crude oil-refining
operations; however, its petroleum hydrocarbon storage
and transport activities are still operative. Additionally,
there are 11 actively operating storage facilities in the area,
which are dealing with storage and marketing of refined
petroleum products (e.g. gasoline, diesel fuel, fuel oil, etc.)
and/or liquefied petroleum gas (LPG). According to year
2000 census, there were 1,154 active enterprises and 2,137
residential houses in the area.
Rocks and unconsolidated deposits found in the area
and surrounding region can be divided into three major
geologic units (Senol et al. 1998): (1) Permo-Carboniferous
Karahamzausagı formation and upper Cretaceous Mersin
ophiolitic melange; (2) tertiary sedimentary rocks, and
204 Environ Earth Sci (2010) 60:203–218
123
(3) quaternary unconsolidated deposits (Fig. 2). Karaham-
zausagı formation is the oldest rock unit of the area and it
consists of marble, schist, and quartzite. Mersin ophiolitic
melange contains various rocks with differing composi-
tions including gabbro, harzburgite, verlite, dunite, clino-
pyroxenite, diabase, and radiolarite. Ophiolitic melange
also contains substantial amounts of chromite (Cr2O3)
mineralizations with chromite contents between 52 and
60% (Yaman 1991). Ophiolitic melange is generally found
in the northern part of the study area within deep canyons
and shows serpentinization. Tertiary sedimentary rocks are
composed of lower-middle Miocene Karaisalı and Guvenc
formations (limestone and clayey limestone, respectively),
middle–upper Miocene Kuzgun formation (sandstone,
conglomerate and limestone), and upper Miocene–Pliocene
Handere formation (clay–siltstone, marl, limestone, sand-
stone, gypsum) (Fig. 2). Tertiary sedimentary rocks consist
of a succession of marine, lacustrine, and fluvial deposits
which display transitional characteristics both vertically
and areally (Senol et al. 1998). Quaternary unconsolidated
deposits are described by Senol et al. (1998) as heteroge-
neous mixture of rock detritus ranging from clay to boulder
size. The mixture includes shore and sand dune deposits,
deltaic sediments, stream alluvium, talus deposits, caliche,
and Terra Rosa deposits (Mediterranean red soil) (Senol
et al. 1998).
The study area is a low-lying deltaic plain with slopes
ranging from 0.57 to 0.96% and the elevations between
0 and 30 m above mean sea level. The study area has a
typical Mediterranean climate that is characterized by hot
and dry summers, mild winters and low precipitation.
According to 72-year-long records (1930–2002), mean
annual temperature in the area is 18.8�C with a mean
temperature above 20�C from May through October. The
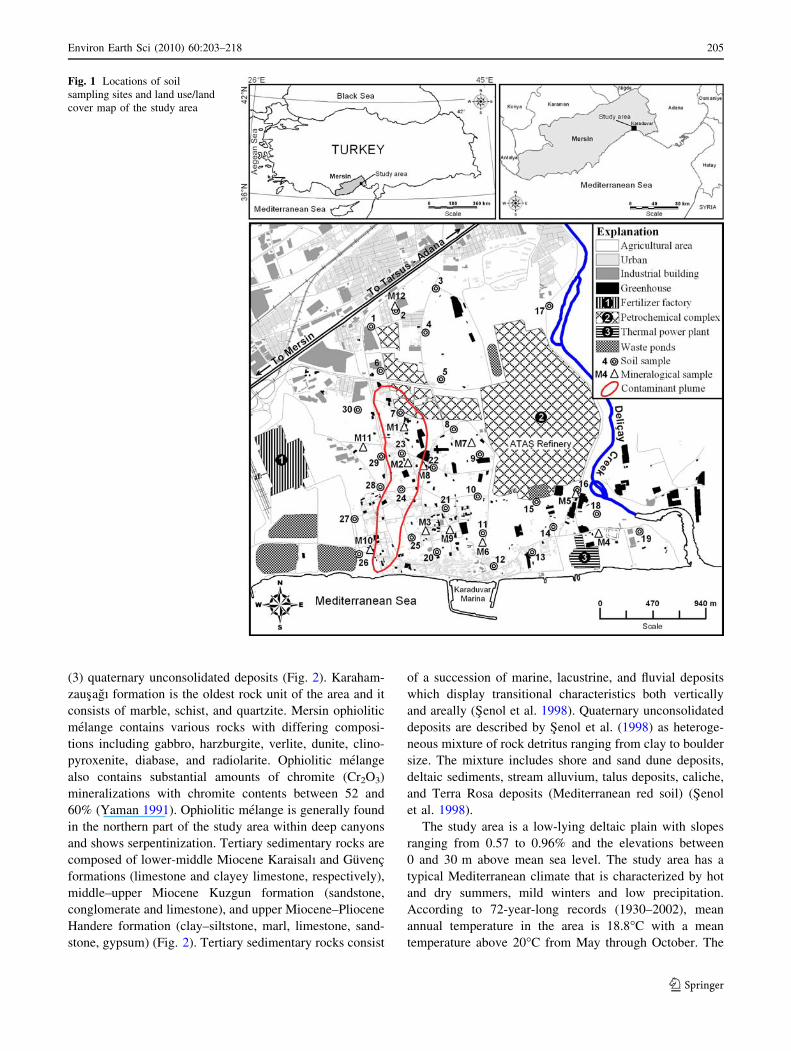
Fig. 1 Locations of soil
sampling sites and land use/land
cover map of the study area
Environ Earth Sci (2010) 60:203–218 205
123
area receives mean annual precipitation of *500 mm, and
extended periods (i.e., 4–5 months) without precipitation
are common (Demirel and Guler 2006). Alpine climate
conditions prevail in the northern part of the study area (at
the Taurus Mountains).
Soil sampling and sample preparation
For geochemical studies, 30 cultivated topsoil samples
from a depth interval of 0–20 cm were collected from the
agricultural plots located around various industrial facili-
ties. For mineralogical studies, additional soil samples
were taken from 12 different locations and from three
different depth intervals (0–30, 50–80 and 90–120 cm) in
each location. Field work was completed in 1 day (2
February 2007) to rule out any seasonal effects. Sampling
locations are depicted in Fig. 1. All soil samples were
taken by so-called Edelman hand auger (Eijkelkamp Ag-
risearch Equipment, The Netherlands) and transported to
the laboratory in tightly sealed 1-kg polyethylene bags to
exclude loss or addition of moisture or pollutant. All soil
samples were subsequently air-dried at room temperature
and carefully disaggregated in a ceramic mortar before
sieving through a 2-mm nylon sieve to remove large par-
ticles and other debris. Finally, the fraction \2 mm was
powdered in an agate mortar and was used for further
mineralogical (XRD) analyses.
Analytical procedures
Reagents
All the chemicals used were of the analytical grade unless
otherwise stated. Deionized water (ELGA Purelab Prima,
UK) was used as feed water to produce ultra pure water
from the ELGA Purelab UHQ (UK). The water used
throughout the period of experimentation had a resistivity
of 18 MX cm at room temperature. All extractant, standard
and rinse solutions were made from this water. The acids
used were nitric acid (65%), hydrochloric acid (37%), and
acetic acid (C99.5%). The reagents used in the production
of the extracting solutions were sodium acetate anhydrous
Fig. 2 Geology map of the study area and surrounding region (coordinates are in UTM meters and datum is WGS84)
206 Environ Earth Sci (2010) 60:203–218
123
(C99%), hydroxylamine hydrochloride (C99%), hydrogen
peroxide (35%), magnesium chloride hexahydrate (C99%),
sodium hydroxide pellets (98%) and ammonium acetate
(C98%). All glassware and plastic vessels used for the
experiments was previously soaked in 10% HNO3 for 48 h
and rinsed with ultra pure water. All extracts were kept in
thoroughly cleaned plastic bottles.
XRD measurements and soil pH
X-ray diffraction (XRD) analyses of soil samples were
carried out at the Hacettepe University Geological Engi-
neering Department in Ankara, Turkey. The mineralogical
composition of the powdered samples and clay fraction
(\2 lm) was determined on random and oriented samples
using a Rigaku D/Max-2200/PC X-ray diffractometer
(Japan) with Cu-Ka radiations generated at 40 kV, 30 mA.
The scanning rate was 1� 2h min-1. To prepare oriented
mounts, selected five subsamples of clay fraction were
treated with hydrogen peroxide overnight to oxidize
organic matter. Then, each sample was divided into three
parts. The first part was saturated with ethylene glycol, the
second was heated up to 550�C, and the third part was left
without treatment. XRD data for all samples were collected
for values of 2h between 2� and 50�.
Soil pH (pH-H2O) was determined by saturating soil
sample (\2 mm fraction) with deionized water (1:5 solid
to solution ratio) and shaking it mechanically at 15 rpm for
1 h (Rayment and Higginson 1992). The pH-H2O of the
supernatant was measured by means of a digital WTW
Multi 340i/SET (Wissenschaftlich-Technische Werkstat-
ten, Germany) multi-parameter instrument attached to a
glass pH electrode, which was calibrated at pH 4.01 and
7.00 using standard buffer solutions.
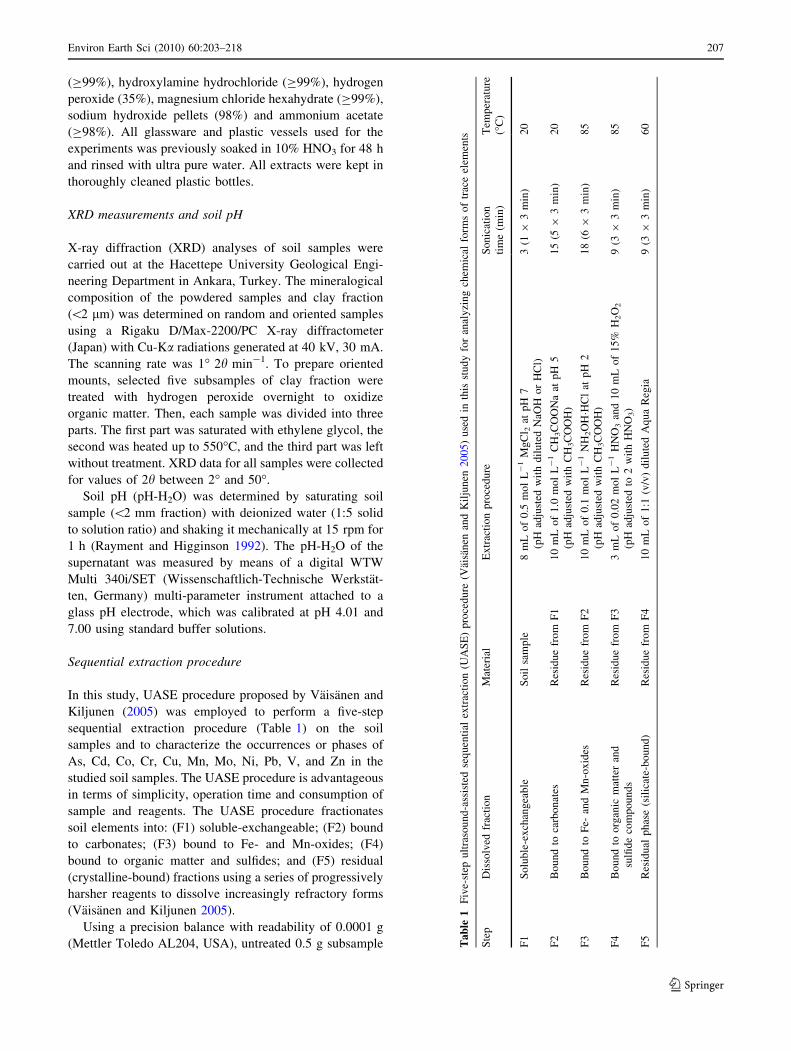
Sequential extraction procedure
In this study, UASE procedure proposed by Vaisanen and
Kiljunen (2005) was employed to perform a five-step
sequential extraction procedure (Table 1) on the soil
samples and to characterize the occurrences or phases of
As, Cd, Co, Cr, Cu, Mn, Mo, Ni, Pb, V, and Zn in the
studied soil samples. The UASE procedure is advantageous
in terms of simplicity, operation time and consumption of
sample and reagents. The UASE procedure fractionates
soil elements into: (F1) soluble-exchangeable; (F2) bound
to carbonates; (F3) bound to Fe- and Mn-oxides; (F4)
bound to organic matter and sulfides; and (F5) residual
(crystalline-bound) fractions using a series of progressively
harsher reagents to dissolve increasingly refractory forms
(Vaisanen and Kiljunen 2005).
Using a precision balance with readability of 0.0001 g
(Mettler Toledo AL204, USA), untreated 0.5 g subsample Ta
ble
1F
ive-
step
ult
raso
un
d-a
ssis
ted
seq
uen
tial
extr
acti
on
(UA
SE
)p
roce
du
re(V
aisa
nen
and
Kil
jun
en2
00
5)
use
din
this
stu
dy
for
anal
yzi
ng
chem
ical
form
so
ftr
ace
elem
ents
Ste
pD
isso
lved
frac
tio
nM
ater
ial
Ex
trac
tio
np
roce
du
reS
on
icat
ion
tim
e(m
in)
Tem
per
atu
re
(�C
)
F1
So
lub
le-e
xch
ang
eab
leS
oil
sam
ple
8m
Lo
f0
.5m
ol
L-
1M
gC
l 2at
pH
7
(pH
adju
sted
wit
hd
ilu
ted
NaO
Ho
rH
Cl)
3(1
93
min
)2
0
F2
Bo
un
dto
carb
on
ates
Res
idu
efr
om
F1
10
mL
of
1.0
mo
lL
-1
CH
3C
OO
Na
atp
H5
(pH
adju
sted
wit
hC
H3C
OO
H)
15
(59
3m
in)
20
F3
Bo
un
dto
Fe-
and
Mn
-ox
ides
Res
idu
efr
om
F2
10
mL
of
0.1
mo
lL
-1
NH
2O
H�H
Cl
atp
H2
(pH
adju
sted
wit
hC
H3C
OO
H)
18
(69
3m
in)
85
F4
Bo
un
dto
org
anic
mat
ter
and
sulfi
de
com
po
un
ds
Res
idu
efr
om
F3
3m
Lo
f0
.02
mo
lL
-1
HN
O3
and
10
mL
of
15
%H
2O
2
(pH
adju
sted
to2
wit
hH
NO
3)
9(3
93
min
)8
5
F5
Res
idu
alp
has
e(s
ilic
ate-
bo
un
d)
Res
idu
efr
om
F4
10
mL
of
1:1
(v/v
)d
ilu
ted
Aq
ua
Reg
ia9
(39
3m
in)
60
Environ Earth Sci (2010) 60:203–218 207
123
of soil sample accurately weighed into a 50-mL polypro-
pylene centrifuge tube into which an appropriate amount of
extracting solution is added (Table 1). The residues from
each step were sequentially treated to obtain the five
operationally defined fractions shown in Table 1. In this
study, UASE procedure was performed with Bandelin
Sonorex brand ultrasonic water bath with 880 W power
and 35 kHz frequency (Progen Scientific Ltd., UK). Soni-
cation times were divided into equal 3-min steps so that
after each 3-min step, the centrifuge tube is shaken by hand
to prevent sedimentation (Vaisanen and Kiljunen 2005).
Then, the sample is placed into the ultrasonic water bath
for the next sonication step. After each extraction proce-
dure, the supernatant was collected by centrifugation at
3,000 rpm for 10 min using a Sigma 2-16 centrifuge
(SIGMA Laborzentrifugen GmbH, Germany). Then, the
solution is pipetted into a 50-mL volumetric flask. After
centrifugation, the residues from steps F1, F2, F3, and F5
were washed once with 5 mL of ultra pure water. Whereas,
residue from F4 was washed with a solution of 5 mL of
3.2 mol L-1 CH3COONH4 (CH3COONH4 in 20% v/v
HNO3). These rinse solutions were centrifuged and pipet-
ted into same volumetric flasks with the preceding extracts.
Later, pooled extracts diluted to volume with ultra pure
water (Vaisanen and Kiljunen 2005).
Soil standard reference material, SRM 2710 (Montana
Soil), was also subjected to UASE procedure and analyzed
to check the accuracy of the results and elemental recov-
eries. The SRM 2710 contains moderately elevated level of
trace metals, certified by the National Institute of Standards
and Technology (NIST 2003) and was received air-dried,
pulverized, and homogenized. Certified reference materials
play a vital role in the analytical quality assurance (NIST
2003) and they also allow the comparability of results
produced by different laboratories (Polyak and Hlavay
2001).
ICP-MS measurements
ICP-MS (Inductively Coupled Plasma-Mass Spectrometry)
analyses were performed in the Environmental Geochem-
istry laboratory at the Mersin University Geological
Engineering Department, Mersin, Turkey. Concentrations
of 11 elements (As, Cd, Co, Cr, Cu, Mn, Mo, Ni, Pb, V and
Zn) in the solution extracts were determined in triplicate by
Agilent 7500ce ICP-MS (Tokyo, Japan) equipped with a
collusion/reaction cell in the form of octopole reaction
system (ORS). The argon gas utilized was of spectral purity
([99.998%). The external standard calibration method was
applied to all determinations, using 6Li, Sc, Ge, Y, In, Tb
and Bi internal standard mix (in 2% HNO3 matrix). NIST
single-element reference standards are used to construct
five-point calibration curves. At regular intervals during
analysis, calibration standards were analyzed as samples to
monitor instrument drift. Furthermore, extractant and ultra
pure water blanks were frequently analyzed alongside
samples to check for contamination. Blanks were prepared
by completion of the full analytical procedure without
samples. The analytical accuracy was checked from repli-
cate measurement of several samples and by measuring
certified reference materials. The relative error is less than
±5% for all analyzed elements.
Statistical analyses and data treatment
Statistical associations do not necessarily establish cause-
and-effect relationships, but do present the information in
a compact format as the first step in the complete analysis
of the data and can assist in generating hypothesis for the
interpretation of occurring processes (Guler et al. 2002).
First, descriptive univariate statistics were examined to
study the distributions of the variables. Then, Kolmogo-
rov–Smirnov (K–S) statistic test was used for the confir-
mation of normal distribution of the variables. R-mode
factor analysis (FA) was used for the multivariate statis-
tical analysis of the soil geochemical data. Detailed
technical descriptions of FA technique is provided in
detail in Harman (1967) and Rummel (1970), hence, only
brief mention of this technique is made here. As a pattern
recognition method, FA can provide a powerful tool for
analyzing soil geochemical data. This approach has been
applied successfully to extract related variables and infer
the processes that control soil chemistry (Tao 1998;
Al-Khashman and Shawabkeh 2006). The assumptions of
FA include homoscedasticity (equal variance) and normal
distribution of the variables (Bretzel and Calderisi 2006).
Therefore, equal weighing of all variables requires the
normalization and subsequent standardization of the rel-
evant variables. FA technique reduces a large number of
variables to a minimum number of ‘‘new’’ variables called
‘‘factors’’ by linearly combining measurements made on a
number of variables (Davis 1986). Kaiser’s Varimax
rotation is generally applied to the ‘‘new’’ variables in
order to find factors that can be more easily explained in
terms of natural or anthropogenic processes (Closs and
Nichol 1975). This rotation is called varimax because the
goal is to maximize the variance of the ‘‘new’’ variable,
while minimizing the variance around the ‘‘new’’ variable
(StatSoft, Inc. 1997). The number of factors extracted is
defined by using the ‘‘Kaiser criterion’’ (Kaiser 1960)
where only the factors with eigenvalues greater than unity
are retained. Statistical software R version 2.5.1 (R
Development Core Team 2007) was used to perform the
data analysis.
208 Environ Earth Sci (2010) 60:203–218
123
Results and discussion
Soil mineralogy and pH
Mineralogical composition of the soil samples was deter-
mined by XRD analysis. The results presented here are
semi-quantitative values that were obtained after the
evaluation of a total of 36 individual XRD diffractograms.
The analysis results show that clay minerals are the dom-
inant phase in the soil samples with no discernible differ-
ences in clay mineral content of the soil profile. XRD
analysis of the\2-lm clay fraction separated from the five
mineralogical soil samples (M1, M3, M5, M7, M12; see
Fig. 1) revealed the presence of illite with lesser amounts
of vermiculite, kaolinite, and serpentine. XRD data also
indicate that the soils contain quartz ? feldspar ? cal-
cite ? dolomite ? mica ? serpentine ± hornblende min-
erals. This composition greatly reflects the mineralogy of
the geologic units found in the drainage area (e.g. ophio-
litic melange, sandstone, marl, limestone and dolomite
etc.) (Fig. 2).
The soil pH-H2O values indicate a neutral to slightly
alkaline character (7.50–8.15) with a mean value of 7.89
(n = 30). High pH values are possibly due to presence of
carbonates (calcite and dolomite) in soils. It is also
known that after the application of nitrate fertilizers such
as calcium nitrate and potassium nitrate the soil pH
values can increase remarkably. These types of fertilizers
are liberally applied throughout the area. Soil pH is one
of the main factors controlling the solubility of trace
elements in soils (Ross 1994). Previous studies have
shown that each unit of increase in pH results in
approximately a twofold decrease of the concentration of
trace elements (e.g. Cd, Ni, and Zn) in the soil solution
(Christensen 1984; Sanders et al. 1986), hence limiting
the mobility of trace elements.
Evaluation of the analytical performance
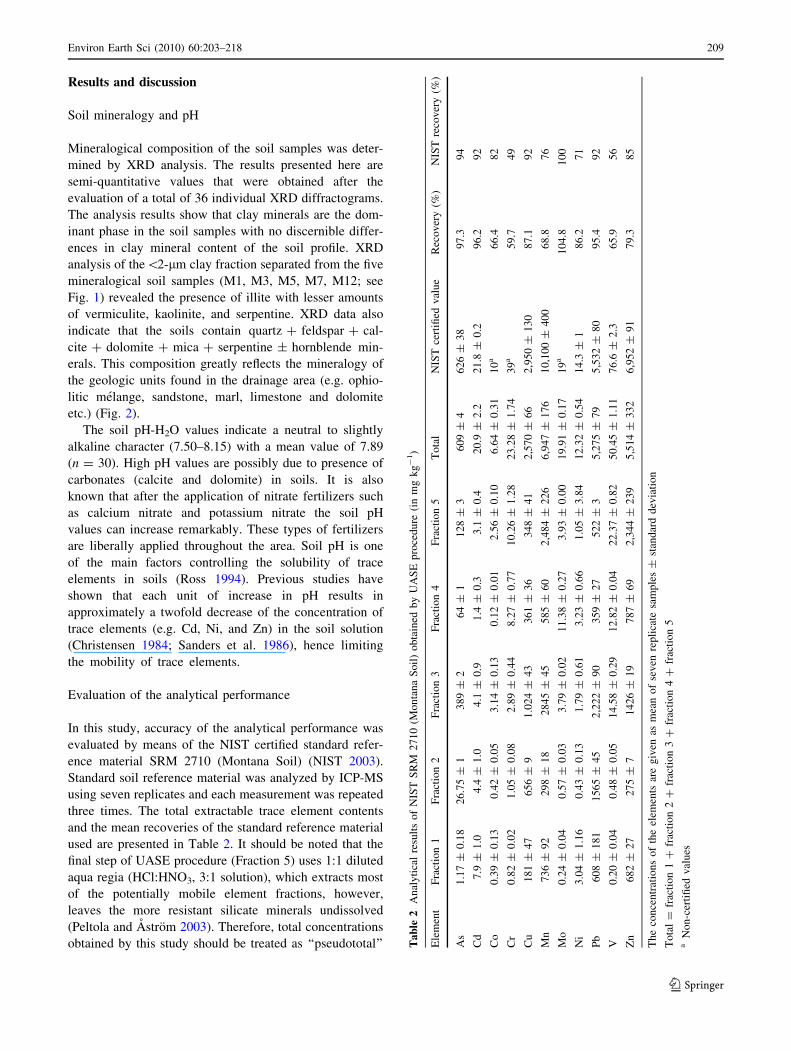
In this study, accuracy of the analytical performance was
evaluated by means of the NIST certified standard refer-
ence material SRM 2710 (Montana Soil) (NIST 2003).
Standard soil reference material was analyzed by ICP-MS
using seven replicates and each measurement was repeated
three times. The total extractable trace element contents
and the mean recoveries of the standard reference material
used are presented in Table 2. It should be noted that the
final step of UASE procedure (Fraction 5) uses 1:1 diluted
aqua regia (HCl:HNO3, 3:1 solution), which extracts most
of the potentially mobile element fractions, however,
leaves the more resistant silicate minerals undissolved
(Peltola and Astrom 2003). Therefore, total concentrations
obtained by this study should be treated as ‘‘pseudototal’’ Ta
ble
2A
nal
yti
cal
resu
lts
of
NIS
TS
RM
27
10
(Mo
nta
na
So
il)
ob
tain
edb
yU
AS
Ep
roce
du
re(i
nm
gk
g-
1)
Ele
men
tF
ract
ion
1F
ract
ion
2F
ract
ion
3F
ract
ion
4F
ract
ion
5T
ota
lN
IST
cert
ified
val
ue
Rec
ov
ery
(%)
NIS
Tre
cov
ery
(%)
As
1.1
7±
0.1
82
6.7
5±
13
89
±2
64
±1
12
8±
36
09
±4
62
6±
38
97
.39
4
Cd
7.9
±1
.04
.4±
1.0
4.1
±0
.91
.4±
0.3
3.1
±0
.42
0.9
±2
.22
1.8
±0
.29
6.2
92
Co
0.3
9±
0.1
30
.42
±0
.05
3.1
4±
0.1
30
.12
±0
.01
2.5
6±
0.1
06
.64
±0
.31
10
a6
6.4
82
Cr
0.8
2±
0.0
21
.05
±0
.08
2.8
9±
0.4
48
.27
±0
.77
10
.26
±1
.28
23
.28
±1
.74
39
a5
9.7
49
Cu
18
1±
47
65
6±
91
.02
4±
43
36
1±
36
34
8±
41
2,5
70
±6
62
,95
0±
13
08
7.1
92
Mn
73
6±
92
29
8±
18
28
45
±4
55
85
±6
02
,48
4±
22
66
,94
7±
17
61
0,1
00
±4
00
68
.87
6
Mo
0.2
4±
0.0
40
.57
±0
.03
3.7
9±
0.0
21
1.3
8±
0.2
73
.93
±0
.00
19
.91
±0
.17
19
a1
04
.81
00
Ni
3.0
4±
1.1
60
.43
±0
.13
1.7
9±
0.6
13
.23
±0
.66
1.0
5±
3.8
41
2.3
2±
0.5
41
4.3
±1
86
.27
1
Pb
60
8±
18
11
56
5±
45
2,2
22
±9
03
59
±2
75
22
±3
5,2
75
±7
95
,53
2±
80
95
.49
2
V0
.20
±0
.04
0.4
8±
0.0
51
4.5
8±
0.2
91
2.8
2±
0.0
42
2.3
7±
0.8
25
0.4
5±
1.1
17
6.6
±2
.36
5.9
56
Zn
68
2±
27
27
5±
71
42
6±
19
78
7±
69
2,3
44
±2
39
5,5
14
±3
32
6,9
52
±9
17
9.3
85
Th
eco
nce
ntr
atio
ns
of
the
elem
ents
are
giv
enas
mea
no
fse
ven
rep
lica
tesa
mp
les
±st
and
ard
dev
iati
on
To
tal
=fr
acti
on
1?
frac
tio
n2
?fr
acti
on
3?
frac
tio
n4
?fr
acti
on
5a
No
n-c
erti
fied
val
ues
Environ Earth Sci (2010) 60:203–218 209
123
soil elements. Analysis of the SRM 2710 showed satis-
factory accuracy, with the recoveries for As 97.3%; Cd
96.2%; Cu 87.1%; Mn 68.8%; Ni 86.2%; Pb 95.4%; Zn
79.3%, and V 65.9%. Recoveries for Cu, Mn, and Zn were
slightly lower than the NIST recoveries given in Table 2.
Trace element fractionation and mobility
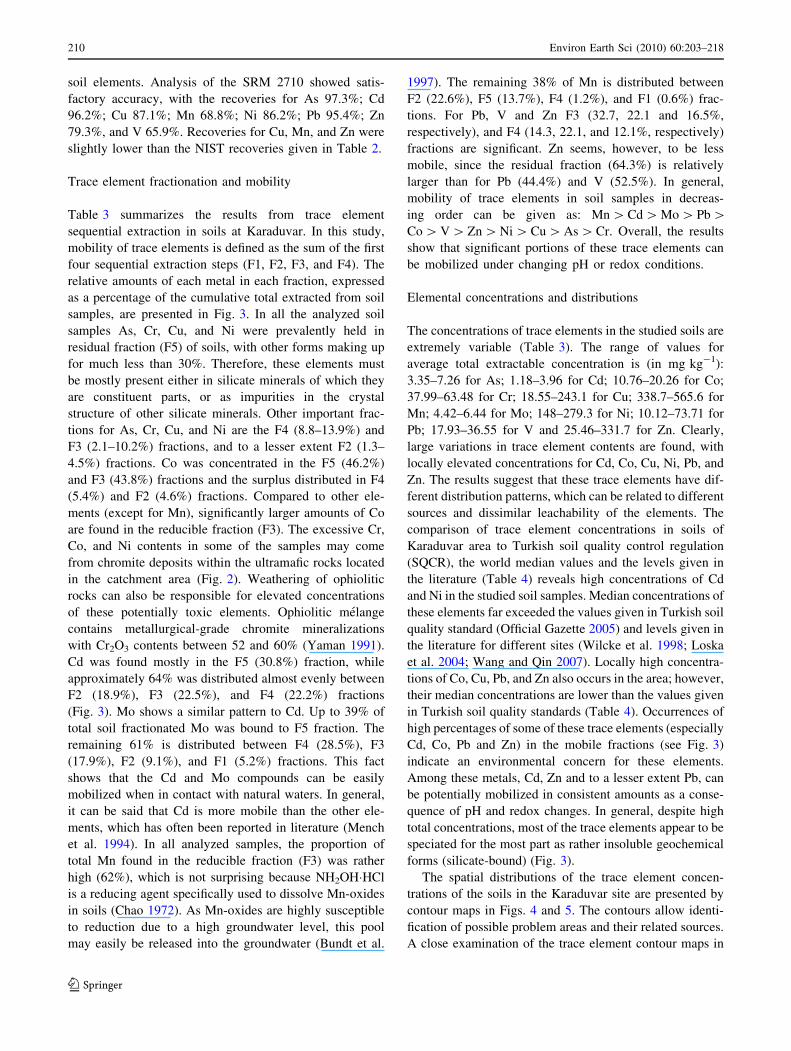
Table 3 summarizes the results from trace element
sequential extraction in soils at Karaduvar. In this study,
mobility of trace elements is defined as the sum of the first
four sequential extraction steps (F1, F2, F3, and F4). The
relative amounts of each metal in each fraction, expressed
as a percentage of the cumulative total extracted from soil
samples, are presented in Fig. 3. In all the analyzed soil
samples As, Cr, Cu, and Ni were prevalently held in
residual fraction (F5) of soils, with other forms making up
for much less than 30%. Therefore, these elements must
be mostly present either in silicate minerals of which they
are constituent parts, or as impurities in the crystal
structure of other silicate minerals. Other important frac-
tions for As, Cr, Cu, and Ni are the F4 (8.8–13.9%) and
F3 (2.1–10.2%) fractions, and to a lesser extent F2 (1.3–
4.5%) fractions. Co was concentrated in the F5 (46.2%)
and F3 (43.8%) fractions and the surplus distributed in F4
(5.4%) and F2 (4.6%) fractions. Compared to other ele-
ments (except for Mn), significantly larger amounts of Co
are found in the reducible fraction (F3). The excessive Cr,
Co, and Ni contents in some of the samples may come
from chromite deposits within the ultramafic rocks located
in the catchment area (Fig. 2). Weathering of ophiolitic
rocks can also be responsible for elevated concentrations
of these potentially toxic elements. Ophiolitic melange
contains metallurgical-grade chromite mineralizations
with Cr2O3 contents between 52 and 60% (Yaman 1991).
Cd was found mostly in the F5 (30.8%) fraction, while
approximately 64% was distributed almost evenly between
F2 (18.9%), F3 (22.5%), and F4 (22.2%) fractions
(Fig. 3). Mo shows a similar pattern to Cd. Up to 39% of
total soil fractionated Mo was bound to F5 fraction. The
remaining 61% is distributed between F4 (28.5%), F3
(17.9%), F2 (9.1%), and F1 (5.2%) fractions. This fact
shows that the Cd and Mo compounds can be easily
mobilized when in contact with natural waters. In general,
it can be said that Cd is more mobile than the other ele-
ments, which has often been reported in literature (Mench
et al. 1994). In all analyzed samples, the proportion of
total Mn found in the reducible fraction (F3) was rather
high (62%), which is not surprising because NH2OH�HCl
is a reducing agent specifically used to dissolve Mn-oxides
in soils (Chao 1972). As Mn-oxides are highly susceptible
to reduction due to a high groundwater level, this pool
may easily be released into the groundwater (Bundt et al.
1997). The remaining 38% of Mn is distributed between
F2 (22.6%), F5 (13.7%), F4 (1.2%), and F1 (0.6%) frac-
tions. For Pb, V and Zn F3 (32.7, 22.1 and 16.5%,
respectively), and F4 (14.3, 22.1, and 12.1%, respectively)
fractions are significant. Zn seems, however, to be less
mobile, since the residual fraction (64.3%) is relatively
larger than for Pb (44.4%) and V (52.5%). In general,
mobility of trace elements in soil samples in decreas-
ing order can be given as: Mn [ Cd [ Mo [ Pb [Co [ V [ Zn [ Ni [ Cu [ As [ Cr. Overall, the results
show that significant portions of these trace elements can
be mobilized under changing pH or redox conditions.
Elemental concentrations and distributions
The concentrations of trace elements in the studied soils are
extremely variable (Table 3). The range of values for
average total extractable concentration is (in mg kg-1):
3.35–7.26 for As; 1.18–3.96 for Cd; 10.76–20.26 for Co;
37.99–63.48 for Cr; 18.55–243.1 for Cu; 338.7–565.6 for
Mn; 4.42–6.44 for Mo; 148–279.3 for Ni; 10.12–73.71 for
Pb; 17.93–36.55 for V and 25.46–331.7 for Zn. Clearly,
large variations in trace element contents are found, with
locally elevated concentrations for Cd, Co, Cu, Ni, Pb, and
Zn. The results suggest that these trace elements have dif-
ferent distribution patterns, which can be related to different
sources and dissimilar leachability of the elements. The
comparison of trace element concentrations in soils of
Karaduvar area to Turkish soil quality control regulation
(SQCR), the world median values and the levels given in
the literature (Table 4) reveals high concentrations of Cd
and Ni in the studied soil samples. Median concentrations of
these elements far exceeded the values given in Turkish soil
quality standard (Official Gazette 2005) and levels given in
the literature for different sites (Wilcke et al. 1998; Loska
et al. 2004; Wang and Qin 2007). Locally high concentra-
tions of Co, Cu, Pb, and Zn also occurs in the area; however,
their median concentrations are lower than the values given
in Turkish soil quality standards (Table 4). Occurrences of
high percentages of some of these trace elements (especially
Cd, Co, Pb and Zn) in the mobile fractions (see Fig. 3)
indicate an environmental concern for these elements.
Among these metals, Cd, Zn and to a lesser extent Pb, can
be potentially mobilized in consistent amounts as a conse-
quence of pH and redox changes. In general, despite high
total concentrations, most of the trace elements appear to be
speciated for the most part as rather insoluble geochemical
forms (silicate-bound) (Fig. 3).
The spatial distributions of the trace element concen-
trations of the soils in the Karaduvar site are presented by
contour maps in Figs. 4 and 5. The contours allow identi-
fication of possible problem areas and their related sources.
A close examination of the trace element contour maps in
210 Environ Earth Sci (2010) 60:203–218
123
Ta
ble
3S
tati
stic
alsu
mm
ary
of
con
cen
trat
ion
of
elem
ents
ind
iffe
ren
tfr
acti
on
so
fK
arad
uv
arso
ilsa
mp
les
(dep
th0
–2
0cm
)(c
on
cen
trat
ion
sin
mg
kg
-1)
Fra
ctio
nS
tati
stic
s(n
=30)
As
Cd
Co
Cr
Cu
Mn
Mo
Ni
Pb
VZ
n
F1
Ran
ge
0.0
04–0.1
17
0.0
60–0.1
86
0.0
0–0.0
00.0
0–0.2
63
0.0
42–0.6
61
0.0
–10.1
40
0.1
94–0.3
45
1.1
82–2.2
40.0
0–0.2
84
0.1
03–0.7
16
0.0
12–8.6
56
Med
ian
0.0
28
0.0
77
0.0
00.0
00
0.1
52
2.3
90
0.2
65
1.6
44
0.0
00
0.2
65
0.5
03
AM
±A
SD
0.0
33
±0.0
22
0.0
85
±0.0
25
0.0
0±
0.0
00.0
41
±0.0
74
0.2
19
±0.1
54
3.1
78
±2.8
64
0.2
63
±0.0
37
1.6
69
±0.3
00.0
29
±0.0
66
0.2
98
±0.1
49
1.1
13
±1.9
88
GM
±G
SD
0.0
28
±1.8
10
0.0
83
±1.2
70
0.0
0±
0.0
00.0
74
±1.6
81
0.1
78
±1.9
00
3.0
53
±2.0
40
0.2
61
±1.1
50
1.6
43
±1.1
90.0
40
±1.9
36
0.2
64
±1.6
30
0.4
20
±4.1
80
F2
Ran
ge
0.1
18–0.3
96
0.2
06–1.0
01
0.0
0–1.6
24
0.2
50–1.8
93
0.3
29–3.4
77
37.4
–168.4
0.3
93–0.7
83
2.8
38–9.1
50.7
44–5.3
52
0.2
68–1.0
21
0.7
57–20.1
4
Med
ian
0.2
02
0.2
61
0.7
65
0.6
27
0.6
75
116.2
0.4
26
5.9
54
1.3
64
0.5
86
3.0
84
AM
±A
SD
0.2
15
±0.0
62
0.2
94
±0.1
40
0.7
70
±0.4
60
0.6
50
±0.3
31
0.8
43
±0.6
46
109.9
±33.1
0.4
56
±0.0
79
6.2
03
±1.6
81.9
26
±1.2
27
0.6
0±
0.2
07
3.7
77
±3.4
22
GM
±G
SD
0.2
07
±1.3
15
0.2
78
±1.3
21
0.6
52
±1.9
96
0.5
84
±1.5
82
0.7
10
±1.6
97
104.1
±1.4
17
0.4
51
±1.1
57
5.9
74
±1.3
21.6
30
±1.7
47
0.5
64
±1.4
32
3.0
68
±1.8
21
F3
Ran
ge
0.1
74–0.7
94
0.2
43–0.8
23
3.3
24–9.7
17
0.4
10–3.4
06
0.0
0–26.5
50
230.7
–366.8
0.7
58-2
.542
8.7
0–40.0
62.7
27–22.1
72.6
35–12.2
91.9
79–40.4
9
Med
ian
0.3
04
0.3
04
7.2
77
0.9
76
2.4
95
293.8
0.7
99
21.1
46.0
24
5.5
42
9.8
06
AM
±A
SD
0.3
42
±0.1
34
0.3
49
±0.1
26
7.1
53
±1.7
35
1.0
98
±0.5
98
3.1
11
±4.6
29
297.6
±33.3
0.9
11
±0.3
36
21.4
7±
7.2
47.2
55
±4.2
89
6.0
57
±2.2
41
10.9
65
±7.2
6
GM
±G
SD
0.3
21
±1.4
07
0.3
33
±1.3
23
6.9
26
±1.3
01
0.9
79
±1.5
97
2.1
80
±2.1
61
295.8
±1.1
20.8
78
±1.2
70
20.2
4±
1.4
26.3
34
±1.6
55
5.6
89
±1.4
22
9.3
15
±1.7
74
F4
Ran
ge
0.2
33–0.8
32
0.2
51–1.0
99
0.0
0–1.5
63
2.0
26–10.8
30.2
34–216.0
0.0
0–16.7
90
1.2
93–1.7
29
9.7
2–36.6
20.3
28–17.0
73.6
88–9.9
72
0.0
26–136.9
Med
ian
0.4
05
0.2
84
0.9
59
7.4
20
2.6
43
4.6
78
1.3
52
28.9
25
2.6
06
5.6
70
6.0
87
AM
±A
SD
0.4
23
±0.1
34
0.3
56
±0.1
84
0.8
70
±0.3
97
7.1
38
±2.3
34
10.2
8±
38.9
35.6
33
±5.0
17
1.4
18
±0.1
36
27.1
8±
5.9
63.5
16
±3.5
16.0
46
±1.8
13
10.9
1±
24.0
9
GM
±G
SD
0.4
04
±1.3
52
0.3
29
±1.4
22
0.8
13
±1.6
14
6.6
80
±1.4
81
2.8
16
±3.0
54
4.5
27
±3.2
12
1.4
12
±1.0
95
26.3
9±
1.3
02.4
09
±2.3
93
5.7
96
±1.3
35
5.4
19
±3.5
85
F5
Ran
ge
2.5
28–5.1
19
0.3
58–0.9
17
4.2
30–8.7
21
31.7
7–50.4
915.5
8–41.9
326.6
1–85.7
91.6
92–2.5
35
95.0
–205.8
4.4
62–41.9
39.2
61–17.9
319.1
5–303.7
Med
ian
3.5
73
0.4
00
7.4
13
42.0
626.6
667.0
65
1.9
29
150.2
8.0
27
14.3
95
36.8
15
AM
±A
SD
3.8
08
±0.7
65
0.4
76
±0.1
61
7.3
89
±1.0
11
42.2
6±
4.9
04
27.7
2±
5.6
12
66.2
1±
12.7
31.9
52
±0.2
00
152.1
±27.0
9.6
57
±6.7
15
14.0
23
±1.9
945.7
4±
49.5
9
GM
±G
SD
3.7
34
±1.2
21
0.4
56
±1.3
10
7.3
10
±1.1
64
41.9
8±
1.1
23
27.1
9±
1.2
18
64.6
8±
1.2
63
1.9
43
±1.1
00
149.7
±1.2
08.5
47
±1.5
52
13.8
78
±1.1
638.4
1±
1.5
71
Tota
lR
ange
3.3
52–7.2
58
1.1
82–3.9
57
10.7
6–20.2
637.9
9–63.4
818.5
5–243.1
338.7
–565.6
4.4
23–6.4
38
148–279.3
10.1
2–73.7
117.9
3–36.5
525.4
6–331.7
Med
ian
4.6
63
1.3
35
16.6
16
51.2
10
31.8
34
487.2
06
4.7
76
209.2
24
17.6
82
27.0
33
56.6
20
AM
±A
SD
4.8
21
±0.8
81
1.5
60
±0.5
94
16.1
8±
2.4
25
51.1
87
±5.5
942.1
7±
39.1
3482.5
±43.6
45.0
0±
0.5
43
208.6
±33.9
22.3
8±
13.0
727.0
2±
4.4
25
72.5
0±
59.5
7
GM
±G
SD
4.7
46
±1.1
92
1.4
89
±1.3
19
15.9
9±
1.1
71
50.8
9±
1.1
15
36.3
8±
1.5
42
480.4
1±
1.1
04.9
73
±1.1
07
206.0
±1.1
719.8
1±
1.5
98
26.6
7±
1.1
79
61.2
2±
1.6
64
Tota
l=
frac
tion
1?
frac
tion
2?
frac
tion
3?
frac
tion
4?
frac
tion
5
AM
±A
SD
Ari
thm
etic
mea
n±
arit
hm
etic
stan
dar
ddev
iati
on
GM
±G
SD
Geo
met
ric
mea
n±
geo
met
ric
stan
dar
ddev
iati
on
Environ Earth Sci (2010) 60:203–218 211
123
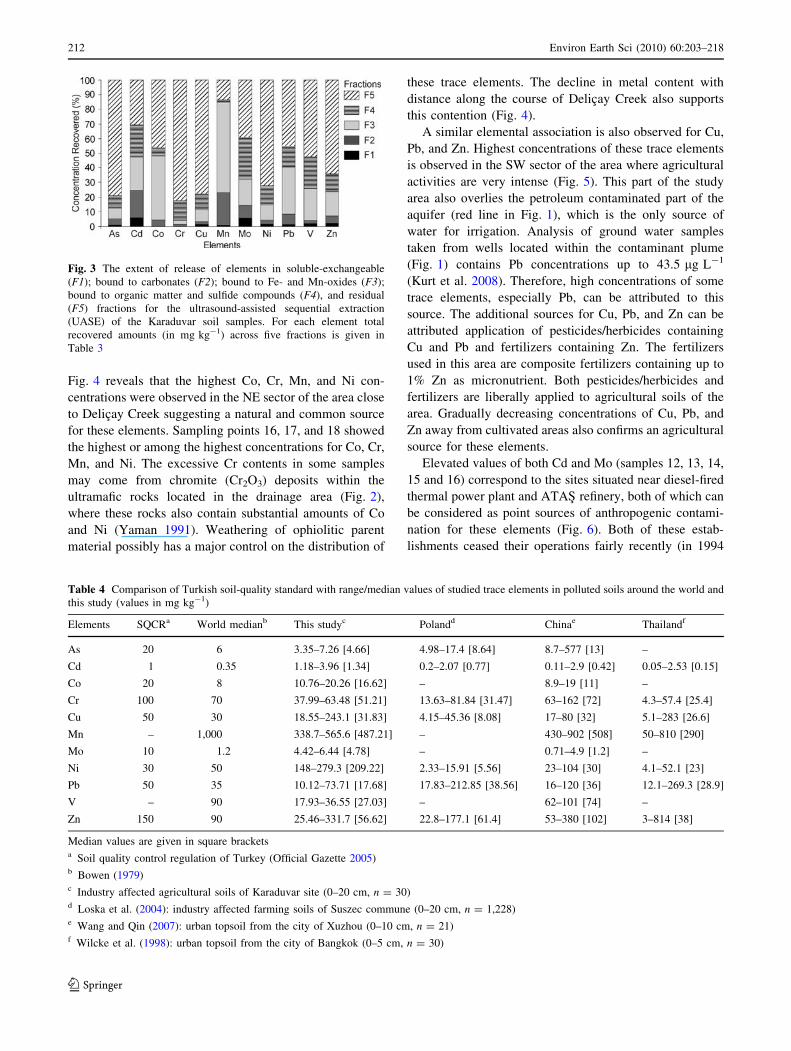
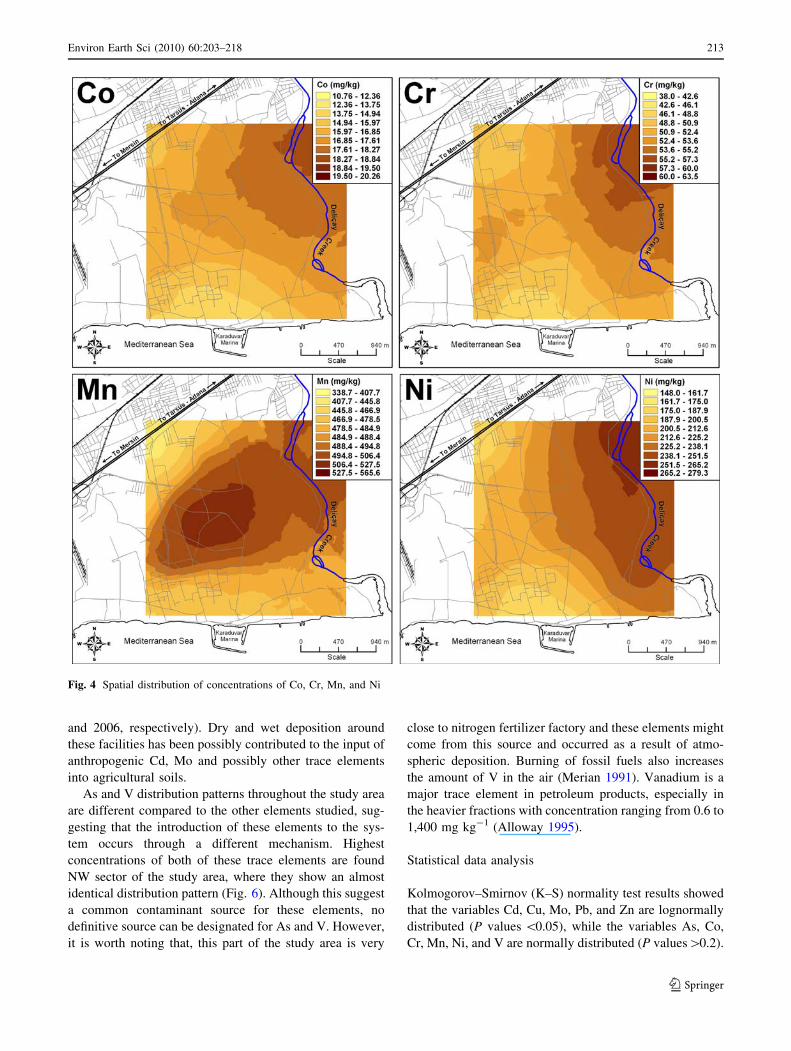
Fig. 4 reveals that the highest Co, Cr, Mn, and Ni con-
centrations were observed in the NE sector of the area close
to Delicay Creek suggesting a natural and common source
for these elements. Sampling points 16, 17, and 18 showed
the highest or among the highest concentrations for Co, Cr,
Mn, and Ni. The excessive Cr contents in some samples
may come from chromite (Cr2O3) deposits within the
ultramafic rocks located in the drainage area (Fig. 2),
where these rocks also contain substantial amounts of Co
and Ni (Yaman 1991). Weathering of ophiolitic parent
material possibly has a major control on the distribution of
these trace elements. The decline in metal content with
distance along the course of Delicay Creek also supports
this contention (Fig. 4).
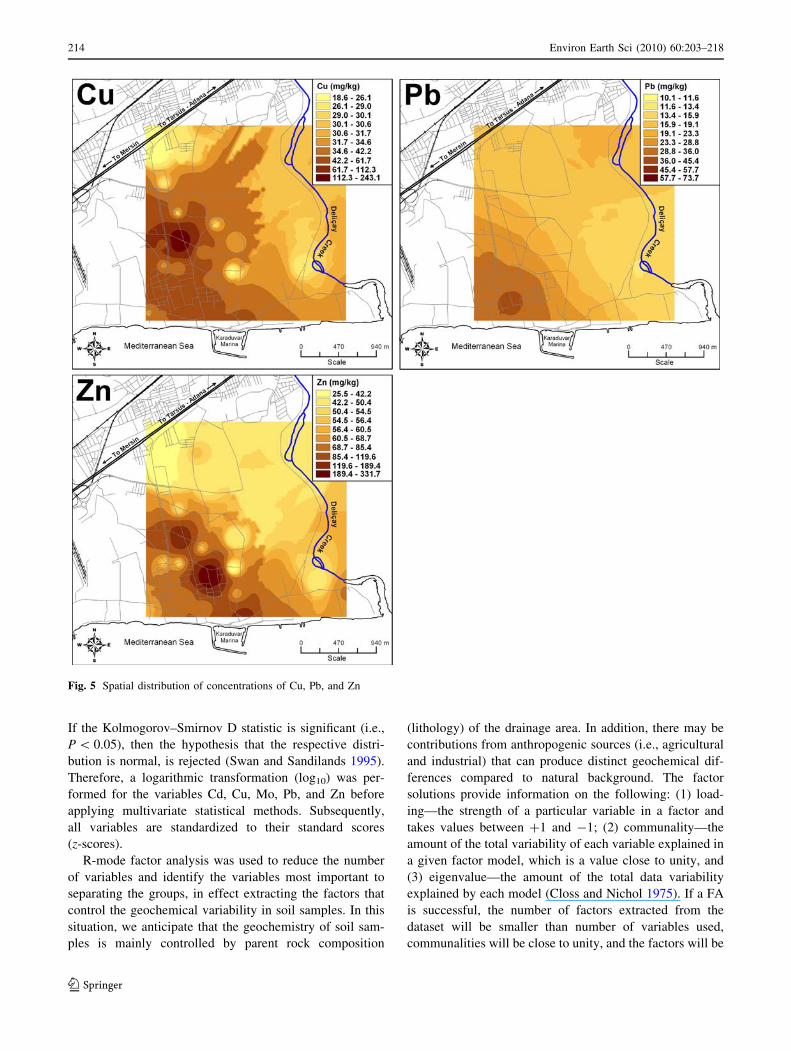
A similar elemental association is also observed for Cu,
Pb, and Zn. Highest concentrations of these trace elements
is observed in the SW sector of the area where agricultural
activities are very intense (Fig. 5). This part of the study
area also overlies the petroleum contaminated part of the
aquifer (red line in Fig. 1), which is the only source of
water for irrigation. Analysis of ground water samples
taken from wells located within the contaminant plume
(Fig. 1) contains Pb concentrations up to 43.5 lg L-1
(Kurt et al. 2008). Therefore, high concentrations of some
trace elements, especially Pb, can be attributed to this
source. The additional sources for Cu, Pb, and Zn can be
attributed application of pesticides/herbicides containing
Cu and Pb and fertilizers containing Zn. The fertilizers
used in this area are composite fertilizers containing up to
1% Zn as micronutrient. Both pesticides/herbicides and
fertilizers are liberally applied to agricultural soils of the
area. Gradually decreasing concentrations of Cu, Pb, and
Zn away from cultivated areas also confirms an agricultural
source for these elements.
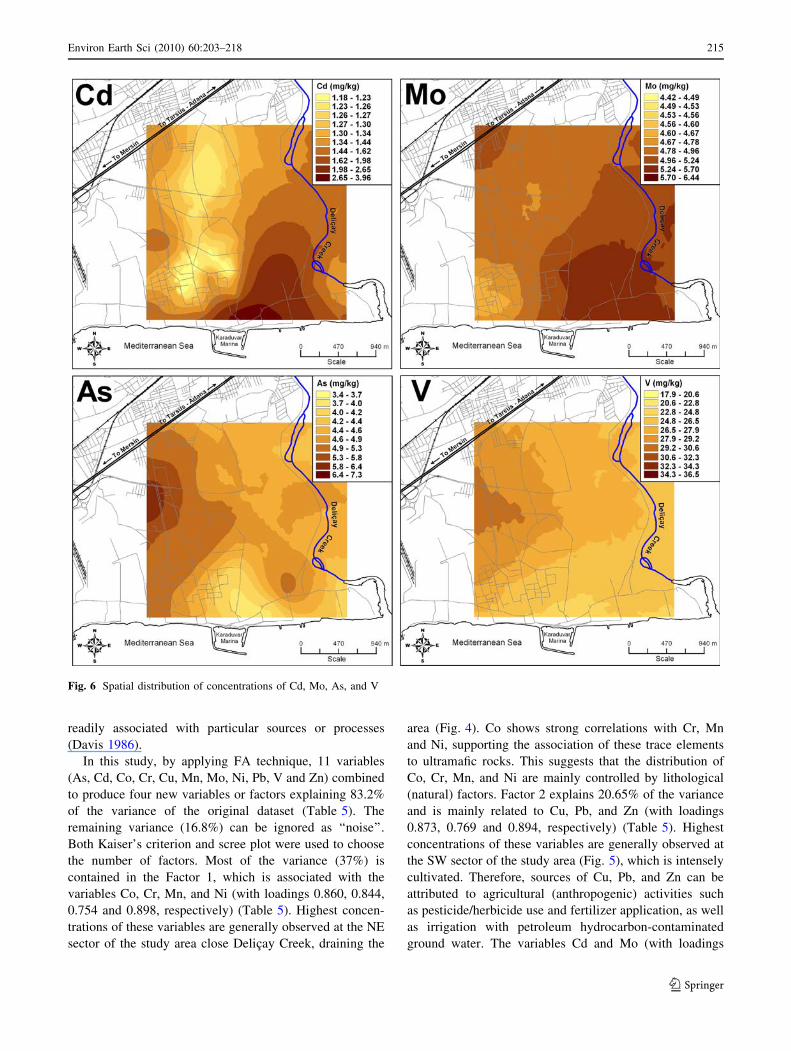
Elevated values of both Cd and Mo (samples 12, 13, 14,
15 and 16) correspond to the sites situated near diesel-fired
thermal power plant and ATAS refinery, both of which can
be considered as point sources of anthropogenic contami-
nation for these elements (Fig. 6). Both of these estab-
lishments ceased their operations fairly recently (in 1994
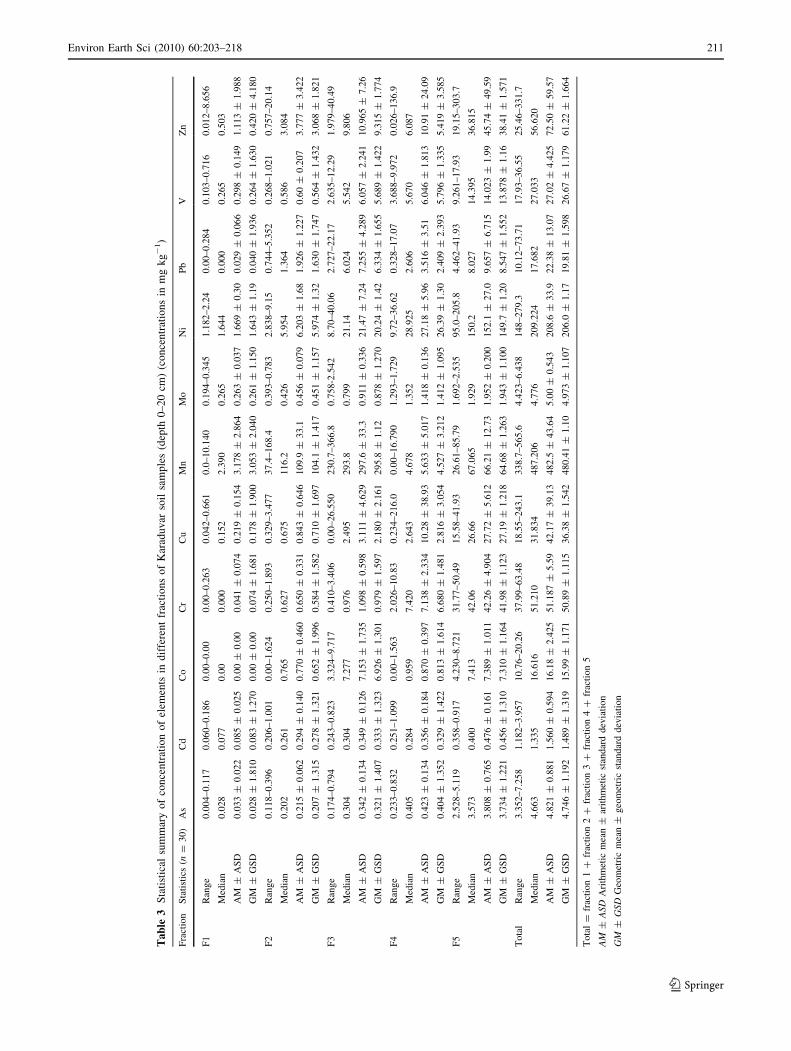
Fig. 3 The extent of release of elements in soluble-exchangeable
(F1); bound to carbonates (F2); bound to Fe- and Mn-oxides (F3);
bound to organic matter and sulfide compounds (F4), and residual
(F5) fractions for the ultrasound-assisted sequential extraction
(UASE) of the Karaduvar soil samples. For each element total
recovered amounts (in mg kg-1) across five fractions is given in
Table 3
Table 4 Comparison of Turkish soil-quality standard with range/median values of studied trace elements in polluted soils around the world and
this study (values in mg kg-1)
Elements SQCRa World medianb This studyc Polandd Chinae Thailandf
As 20 6 3.35–7.26 [4.66] 4.98–17.4 [8.64] 8.7–577 [13] –
Cd 1 0.35 1.18–3.96 [1.34] 0.2–2.07 [0.77] 0.11–2.9 [0.42] 0.05–2.53 [0.15]
Co 20 8 10.76–20.26 [16.62] – 8.9–19 [11] –
Cr 100 70 37.99–63.48 [51.21] 13.63–81.84 [31.47] 63–162 [72] 4.3–57.4 [25.4]
Cu 50 30 18.55–243.1 [31.83] 4.15–45.36 [8.08] 17–80 [32] 5.1–283 [26.6]
Mn – 1,000 338.7–565.6 [487.21] – 430–902 [508] 50–810 [290]
Mo 10 1.2 4.42–6.44 [4.78] – 0.71–4.9 [1.2] –
Ni 30 50 148–279.3 [209.22] 2.33–15.91 [5.56] 23–104 [30] 4.1–52.1 [23]
Pb 50 35 10.12–73.71 [17.68] 17.83–212.85 [38.56] 16–120 [36] 12.1–269.3 [28.9]
V – 90 17.93–36.55 [27.03] – 62–101 [74] –
Zn 150 90 25.46–331.7 [56.62] 22.8–177.1 [61.4] 53–380 [102] 3–814 [38]
Median values are given in square bracketsa Soil quality control regulation of Turkey (Official Gazette 2005)b Bowen (1979)c Industry affected agricultural soils of Karaduvar site (0–20 cm, n = 30)d Loska et al. (2004): industry affected farming soils of Suszec commune (0–20 cm, n = 1,228)e Wang and Qin (2007): urban topsoil from the city of Xuzhou (0–10 cm, n = 21)f Wilcke et al. (1998): urban topsoil from the city of Bangkok (0–5 cm, n = 30)
212 Environ Earth Sci (2010) 60:203–218
123
and 2006, respectively). Dry and wet deposition around
these facilities has been possibly contributed to the input of
anthropogenic Cd, Mo and possibly other trace elements
into agricultural soils.
As and V distribution patterns throughout the study area
are different compared to the other elements studied, sug-
gesting that the introduction of these elements to the sys-
tem occurs through a different mechanism. Highest
concentrations of both of these trace elements are found
NW sector of the study area, where they show an almost
identical distribution pattern (Fig. 6). Although this suggest
a common contaminant source for these elements, no
definitive source can be designated for As and V. However,
it is worth noting that, this part of the study area is very
close to nitrogen fertilizer factory and these elements might
come from this source and occurred as a result of atmo-
spheric deposition. Burning of fossil fuels also increases
the amount of V in the air (Merian 1991). Vanadium is a
major trace element in petroleum products, especially in
the heavier fractions with concentration ranging from 0.6 to
1,400 mg kg-1 (Alloway 1995).
Statistical data analysis
Kolmogorov–Smirnov (K–S) normality test results showed
that the variables Cd, Cu, Mo, Pb, and Zn are lognormally
distributed (P values \0.05), while the variables As, Co,
Cr, Mn, Ni, and V are normally distributed (P values[0.2).
Fig. 4 Spatial distribution of concentrations of Co, Cr, Mn, and Ni
Environ Earth Sci (2010) 60:203–218 213
123
If the Kolmogorov–Smirnov D statistic is significant (i.e.,
P \ 0.05), then the hypothesis that the respective distri-
bution is normal, is rejected (Swan and Sandilands 1995).
Therefore, a logarithmic transformation (log10) was per-
formed for the variables Cd, Cu, Mo, Pb, and Zn before
applying multivariate statistical methods. Subsequently,
all variables are standardized to their standard scores
(z-scores).
R-mode factor analysis was used to reduce the number
of variables and identify the variables most important to
separating the groups, in effect extracting the factors that
control the geochemical variability in soil samples. In this
situation, we anticipate that the geochemistry of soil sam-
ples is mainly controlled by parent rock composition
(lithology) of the drainage area. In addition, there may be
contributions from anthropogenic sources (i.e., agricultural
and industrial) that can produce distinct geochemical dif-
ferences compared to natural background. The factor
solutions provide information on the following: (1) load-
ing—the strength of a particular variable in a factor and
takes values between ?1 and -1; (2) communality—the
amount of the total variability of each variable explained in
a given factor model, which is a value close to unity, and
(3) eigenvalue—the amount of the total data variability
explained by each model (Closs and Nichol 1975). If a FA
is successful, the number of factors extracted from the
dataset will be smaller than number of variables used,
communalities will be close to unity, and the factors will be
Fig. 5 Spatial distribution of concentrations of Cu, Pb, and Zn
214 Environ Earth Sci (2010) 60:203–218
123
readily associated with particular sources or processes
(Davis 1986).
In this study, by applying FA technique, 11 variables
(As, Cd, Co, Cr, Cu, Mn, Mo, Ni, Pb, V and Zn) combined
to produce four new variables or factors explaining 83.2%
of the variance of the original dataset (Table 5). The
remaining variance (16.8%) can be ignored as ‘‘noise’’.
Both Kaiser’s criterion and scree plot were used to choose
the number of factors. Most of the variance (37%) is
contained in the Factor 1, which is associated with the
variables Co, Cr, Mn, and Ni (with loadings 0.860, 0.844,
0.754 and 0.898, respectively) (Table 5). Highest concen-
trations of these variables are generally observed at the NE
sector of the study area close Delicay Creek, draining the
area (Fig. 4). Co shows strong correlations with Cr, Mn
and Ni, supporting the association of these trace elements
to ultramafic rocks. This suggests that the distribution of
Co, Cr, Mn, and Ni are mainly controlled by lithological
(natural) factors. Factor 2 explains 20.65% of the variance
and is mainly related to Cu, Pb, and Zn (with loadings
0.873, 0.769 and 0.894, respectively) (Table 5). Highest
concentrations of these variables are generally observed at
the SW sector of the study area (Fig. 5), which is intensely
cultivated. Therefore, sources of Cu, Pb, and Zn can be
attributed to agricultural (anthropogenic) activities such
as pesticide/herbicide use and fertilizer application, as well
as irrigation with petroleum hydrocarbon-contaminated
ground water. The variables Cd and Mo (with loadings
Fig. 6 Spatial distribution of concentrations of Cd, Mo, As, and V
Environ Earth Sci (2010) 60:203–218 215
123
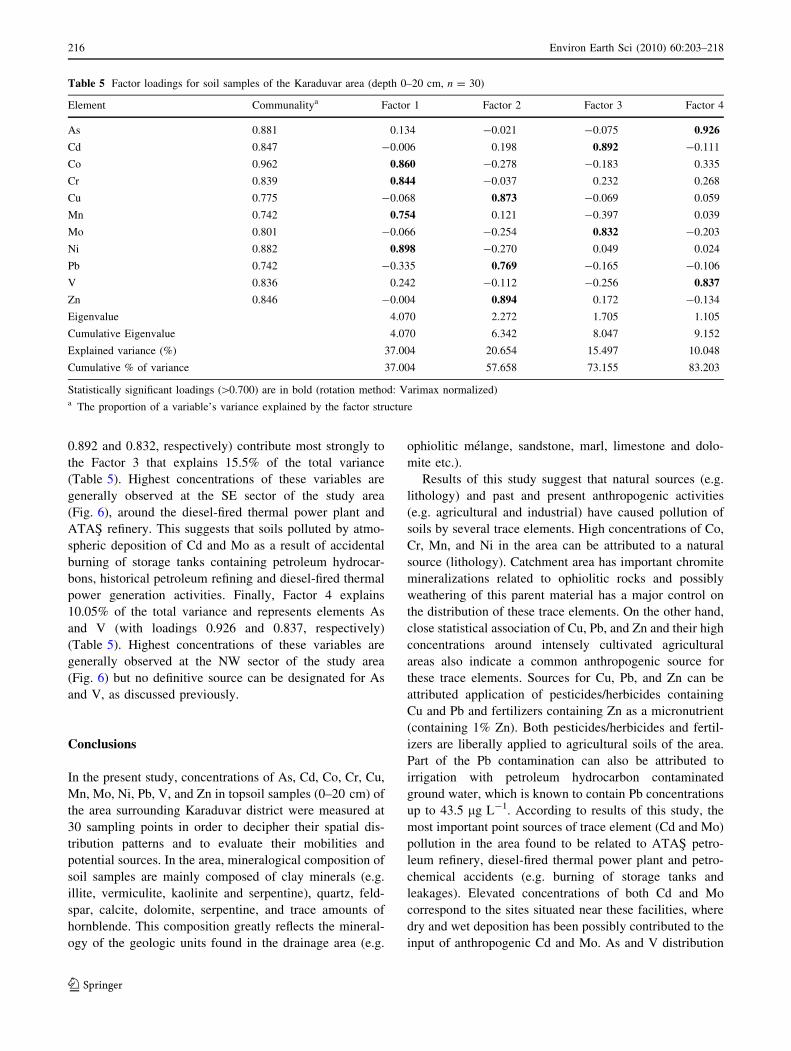
0.892 and 0.832, respectively) contribute most strongly to
the Factor 3 that explains 15.5% of the total variance
(Table 5). Highest concentrations of these variables are
generally observed at the SE sector of the study area
(Fig. 6), around the diesel-fired thermal power plant and
ATAS refinery. This suggests that soils polluted by atmo-
spheric deposition of Cd and Mo as a result of accidental
burning of storage tanks containing petroleum hydrocar-
bons, historical petroleum refining and diesel-fired thermal
power generation activities. Finally, Factor 4 explains
10.05% of the total variance and represents elements As
and V (with loadings 0.926 and 0.837, respectively)
(Table 5). Highest concentrations of these variables are
generally observed at the NW sector of the study area
(Fig. 6) but no definitive source can be designated for As
and V, as discussed previously.
Conclusions
In the present study, concentrations of As, Cd, Co, Cr, Cu,
Mn, Mo, Ni, Pb, V, and Zn in topsoil samples (0–20 cm) of
the area surrounding Karaduvar district were measured at
30 sampling points in order to decipher their spatial dis-
tribution patterns and to evaluate their mobilities and
potential sources. In the area, mineralogical composition of
soil samples are mainly composed of clay minerals (e.g.
illite, vermiculite, kaolinite and serpentine), quartz, feld-
spar, calcite, dolomite, serpentine, and trace amounts of
hornblende. This composition greatly reflects the mineral-
ogy of the geologic units found in the drainage area (e.g.
ophiolitic melange, sandstone, marl, limestone and dolo-
mite etc.).
Results of this study suggest that natural sources (e.g.
lithology) and past and present anthropogenic activities
(e.g. agricultural and industrial) have caused pollution of
soils by several trace elements. High concentrations of Co,
Cr, Mn, and Ni in the area can be attributed to a natural
source (lithology). Catchment area has important chromite
mineralizations related to ophiolitic rocks and possibly
weathering of this parent material has a major control on
the distribution of these trace elements. On the other hand,
close statistical association of Cu, Pb, and Zn and their high
concentrations around intensely cultivated agricultural
areas also indicate a common anthropogenic source for
these trace elements. Sources for Cu, Pb, and Zn can be
attributed application of pesticides/herbicides containing
Cu and Pb and fertilizers containing Zn as a micronutrient
(containing 1% Zn). Both pesticides/herbicides and fertil-
izers are liberally applied to agricultural soils of the area.
Part of the Pb contamination can also be attributed to
irrigation with petroleum hydrocarbon contaminated
ground water, which is known to contain Pb concentrations
up to 43.5 lg L-1. According to results of this study, the
most important point sources of trace element (Cd and Mo)
pollution in the area found to be related to ATAS petro-
leum refinery, diesel-fired thermal power plant and petro-
chemical accidents (e.g. burning of storage tanks and
leakages). Elevated concentrations of both Cd and Mo
correspond to the sites situated near these facilities, where
dry and wet deposition has been possibly contributed to the
input of anthropogenic Cd and Mo. As and V distribution
Table 5 Factor loadings for soil samples of the Karaduvar area (depth 0–20 cm, n = 30)
Element Communalitya Factor 1 Factor 2 Factor 3 Factor 4
As 0.881 0.134 -0.021 -0.075 0.926
Cd 0.847 -0.006 0.198 0.892 -0.111
Co 0.962 0.860 -0.278 -0.183 0.335
Cr 0.839 0.844 -0.037 0.232 0.268
Cu 0.775 -0.068 0.873 -0.069 0.059
Mn 0.742 0.754 0.121 -0.397 0.039
Mo 0.801 -0.066 -0.254 0.832 -0.203
Ni 0.882 0.898 -0.270 0.049 0.024
Pb 0.742 -0.335 0.769 -0.165 -0.106
V 0.836 0.242 -0.112 -0.256 0.837
Zn 0.846 -0.004 0.894 0.172 -0.134
Eigenvalue 4.070 2.272 1.705 1.105
Cumulative Eigenvalue 4.070 6.342 8.047 9.152
Explained variance (%) 37.004 20.654 15.497 10.048
Cumulative % of variance 37.004 57.658 73.155 83.203
Statistically significant loadings ([0.700) are in bold (rotation method: Varimax normalized)a The proportion of a variable’s variance explained by the factor structure
216 Environ Earth Sci (2010) 60:203–218
123
patterns throughout the study area is different compared to
the other elements studied, suggesting that the introduction
of these elements to the system occurs through a different
mechanism. Although their identical spatial distribution
and statistical association suggest a common contaminant
source for these elements, no definitive source can be
designated for As and V.
Results of this study suggest that despite their locally
high total concentrations, most of the studied trace ele-
ments appear to be speciated for the most part as rather
insoluble geochemical forms and their mobilities in
decreasing order can be given as: Mn [ Cd [ Mo [ Pb
[ Co [ V [ Zn [ Ni [ Cu [ As [ Cr. However, occur-
rences of high percentages of some of these trace elements
(especially Cd, Co, Pb and Zn) in the mobile fractions
indicate an environmental concern for these elements,
especially under changing pH or redox conditions. In light
of the findings of the present work, further scientific studies
are needed in the Karaduvar site, which evaluate potential
toxicity of agricultural products grown in the contaminated
soils of the area. This is essential because of the risks
caused by these soils for the near populations and the
agricultural areas that surround the site.
Acknowledgments This research was fully funded by TUB_ITAK
(Scientific and Technical Research Council of Turkey) under the
grant number CAYDAG 104Y268. Financial assistance provided
from July 2005 to October 2007 is gratefully acknowledged.
References
Abderahman N, Abu-Rukah YH (2006) An assessment study of heavy
metal distribution within soil in upper course of Zarqa River
basin/Jordan. Environ Geol 49:1116–1124. doi:10.1007/s00254-
005-0154-4
Abimbola AF, Kehinde-Phillips OO, Olatunji AS (2007) The Sagamu
cement factory, SW Nigeria: ıs the dust generated a potential
health hazard? Environ Geochem Health 29:163–167. doi:
10.1007/s10653-006-9068-7
Ahnstrom ZS, Parker DR (1999) Development and assessment of a
sequential extraction procedure for the fractionation of soil
cadmium. Soil Sci Soc Am J 63:1650–1658
Al-Khashman OA, Shawabkeh RA (2006) Metals distribution in soils
around the cement factory in southern Jordan. Environ Pollut
140:387–394. doi:10.1016/j.envpol.2005.08.023
Alloway BJ (1995) Heavy metals in soils. Glasgow, Scotland Blackie
Academic and Professional Publishers, London, pp 22–51
Borovec Z (1996) Evaluation of the concentrations of trace elements
in stream sediments by factor and cluster analysis and the
sequential extraction procedure. Sci Total Environ 177:237–250.
doi:10.1016/0048-9697(95)04901-0
Bowen HJM (1979) The environmental chemistry of the elements.
Academic Press, New York
Bretzel F, Calderisi M (2006) Metal contamination in urban soils of
coastal Tuscany (Italy). Environ Monit Assess 118:319–335. doi:
10.1007/s10661-006-1495-5
Bundt M, Kretzschmar S, Zech W, Wilcke W (1997) Seasonal
redistribution of manganese in soil aggregates of a Costa Rican
coffee field. Soil Sci 162:641–647. doi:10.1097/00010694-
199709000-00005
Campanella L, Dorazio D, Petronio BM, Pietrantonio E (1995)
Proposal for a metal speciation study in sediments. Anal Chim
Acta 309:387–393. doi:10.1016/0003-2670(95)00025-U
Chao TT (1972) Selective dissolution of manganese oxides from soils
and sediments with acidified hydroxylamine hydrochloride. Soil
Sci Soc Am Proc 36:764–768
Chopin EIB, Marin B, Mkoungafoko R, Rigaux A, Hopgood MJ,
Delannoy E, Cances B, Laurain M (2008) Factors affecting
distribution and mobility of trace elements (Cu, Pb, Zn) in a
perennial grapevine (Vitis vinifera L.) in the Champagne region
of France. Environ Pollut 156:1092–1098. doi:10.1016/j.envpol.
2008.04.015
Christensen TH (1984) Cadmium soil sorption at low concentrations:
I. Effect of time, cadmium load, pH and calcium. Water Air Soil
Pollut 21:105–114. doi:10.1007/BF00163616
Closs LG, Nichol I (1975) The role of factor and regression analysis
in the interpretation of geochemical reconnaissance data. Can J
Earth Sci 12:1316–1330
Davis JC (1986) Statistics and data analysis in geology. Wiley, New
York
Demirel Z, Guler C (2006) Hydrogeochemical evolution of ground-
water in a Mediterranean coastal aquifer, Mersin-Erdemli basin
(Turkey). Environ Geol 49:477–487. doi:10.1007/s00254-005-
0114-z
Falk H, Lavergren U, Bergback B (2006) Metal mobility in alum
shale from Oland, Sweden. J Geochem Explor 90:157–165. doi:
10.1016/j.gexplo.2005.10.001
Filgueiras AV, Lavilla I, Bendicho C (2002) Chemical sequential
extraction for metal partitioning in environmental solid samples.
J Environ Monit 4:823–857. doi:10.1039/b207574c
Gimeno-Garcıa E, Andreu V, Boluda R (1995) Distribution of heavy
metals in rice farming soils. Arch Environ Contam Toxicol
29:476–483. doi:10.1007/BF00208377
Gomez Ariza JL, Giraldez I, Sanchez-Rodas D, Morales E (2000)
Metal sequential extraction procedure optimized for heavily
polluted and iron oxide rich sediments. Anal Chim Acta
414:151–164. doi:10.1016/S0003-2670(00)00804-7
Guler C, Thyne GD, McCray JE, Turner AK (2002) Evaluation of
graphical and multivariate statistical methods for classification
of water chemistry data. Hydrogeol J 10:455–474. doi:10.1007/
s10040-002-0196-6
Gupta UC, Gupta SC (1998) Trace element toxicity relationships to
crop production and livestock and human health: implications
for management. Commun Soil Sci Plant Anal 29:1491–1522.
doi:10.1080/00103629809370045
Harman HH (1967) Modern factor analysis. The University of
Chicago Press, Chicago
Ho MD, Evans GJ (1997) Operational speciation of cadmium, copper,
lead and zinc in the NIST standard reference materials 2710 and
2711 (Montana Soil) by the BCR sequential extraction procedure
and flame atomic absorption spectrometry. Anal Commun
34:363–364. doi:10.1039/a706954e
Kabata-Pendias A (2001) Trace elements in soils and plants. CRC
Press, Boca Raton
Kaiser HF (1960) The application of electronic computers to
factor analysis. Educ Psychol Meas 20:141–151. doi:10.1177/
001316446002000116
Kurt MA, Guler C, Alpaslan M, Temel A (2008) Karaduvar (Mersin)
tarım topraklarındaki bazı agır metallerin kokeni ve dagılımınınfaktor analizi ve CBS yardımıyla belirlenmesi: 61. Turkiye
Jeoloji Kurultayı, Bildiri Ozleri Kitabı (in Turkish), s. 17
Levy DB, Barbarrick KA, Siemer EG, Sommers LE (1992) Distri-
bution and partitioning of trace metals in contaminated soils near
Leadville, Colorado. J Environ Qual 21:185–195
Environ Earth Sci (2010) 60:203–218 217
123
Li X, Huang C (2007) Environment impact of heavy metals on urban
soil in the vicinity of industrial area of Baoji city, P.R. China.
Environ Geol 52:1631–1637. doi:10.1007/s00254-006-0608-3
Loska K, Wiechuła D, Korus I (2004) Metal contamination of
farming soils affected by industry. Environ Int 30:159–165. doi:
10.1016/S0160-4120(03)00157-0
Lu Y, Gong Z, Zhang G, Burghardt W (2003) Concentrations and
chemical speciations of Cu, Zn, Pb and Cr of urban soils in
Nanjing, China. Geoderma 115:101–111. doi:10.1016/S0016-
7061(03)00079-X
Ma YB, Uren NC (1998) Transformations of heavy metals added to
soil—application of a new sequential extraction procedure.
Geoderma 84:157–168. doi:10.1016/S0016-7061(97)00126-2
McGrath SP, Cegarra J (1992) Chemical extractability of heavy
metals during and after long-term applications of sewage sludge
to soil. J Soil Sci 43:313–321. doi:10.1111/j.1365-2389.1992.
tb00139.x
Mench M, Didier V, Loeffler M, Gomez A, Masson P (1994)
Evaluation of metal mobility, plant availability and immobili-
zation by chemical agents in a limed silty soil. J Environ Qual
23:58–63
Merian E (1991) Metals and their compounds in the environment:
occurrence, analysis and biological relevance. VCH, Weinheim
NIST (2003) Certificate of analysis, standard reference material 2710
(Montana Soil). National Institute of Standards and Technology,
Gaithersburg
Official Gazette (2005) Soil quality control regulation of Turkey.
Official Gazette no. 25831, 31.05.2005 (in Turkish), Ministry of
the Environment and Forestry, Ankara
Peltola P, Astrom M (2003) Urban geochemistry: a multimedia
and multielement survey of a small town in northern Europe.
Environ Geochem Health 25:397–419. doi:10.1023/B:EGAH.
0000004553.56489.0c
Polyak K, Hlavay J (2001) Chemical fractionation of a fly ash sample
by a sequential leaching method. Fresenius J Anal Chem
371:838–842. doi:10.1007/s00216-001-1094-9
R Development Core Team (2007) R (version 2.5.1): a language and
environment for statistical computing. R Foundation for Statis-
tical Computing, Vienna
Ramos L, Hernandez LM, Gonzalez MJ (1994) Sequential fraction-
ation of copper, lead, cadmium and zinc in soils from or near
Donana National Park. J Environ Qual 23:50–57
Rayment GE, Higginson FR (1992) Australian laboratory handbook
of soil and water chemical methods. Inkata Press, Melbourne
Romaguera F, Boluda R, Fornes F, Abad M (2008) Comparison of
three sequential extraction procedures for trace element parti-
tioning in three contaminated Mediterranean soils. Environ
Geochem Health 30:171–175. doi:10.1007/s10653-008-9140-6
Ross SM (1994) Retention, transformation and mobility of toxic
metals in soils. In: Ross SM (ed) Toxic metals in soil–plant
systems. Wiley, Chichester, pp 63–152
Rummel RJ (1970) Applied factor analysis. Northwestern University
Press, Evanston
Sanders JR, McGrath SP, Adams TM (1986) Zinc, copper and nickel
concentrations in ryegrass grown on sewage sludge contami-
nated soils of different pH. J Sci Food Agric 37:961–968. doi:
10.1002/jsfa.2740371003
Senol M, Sahin S, Duman TY (1998) Adana-Mersin dolayının jeoloji
etud raporu. MTA, Ankara, p 46 (in Turkish)
Shuman LM (1985) Fractionation method for soil microelements. Soil
Sci 140:11–22. doi:10.1097/00010694-198507000-00003
StatSoft, Inc. (1997). Electronic statistics textbook, Tulsa. http://
www.statsoft.com/textbook/stathome.html
Swan ARH, Sandilands M (1995) Introduction to geological data
analysis. Blackwell, Maine
Tao S (1998) Factor score mapping of soil trace element contents for
the Shenzhen area. Water Air Soil Pollut 102:415–425. doi:
10.1023/A:1004915128107
Tessier A, Campbell PGC, Bisson M (1979) Sequential extraction
procedure for the speciation of particulate trace metals. Anal
Chem 51:844–851. doi:10.1021/ac50043a017
Vaisanen A, Kiljunen A (2005) Ultrasound-assisted sequential
extraction method for the evaluation of mobility of toxic
elements in contaminated soils. Int J Environ Anal Chem
85:1037–1049. doi:10.1080/03067310500138992
Wang X-S, Qin Y (2007) Some characteristics of the distribution of
heavy metals in urban topsoil of Xuzhou, China. Environ
Geochem Health 29:11–19. doi:10.1007/s10653-006-9052-2
Wilcke W, Muller S, Kanchanakool N, Zech W (1998) Urban soil
contamination in Bangkok: heavy metal and aluminum parti-
tioning in topsoils. Geoderma 86:211–228. doi:10.1016/S0016-
7061(98)00045-7
Yaman S (1991) Mersin ofiyolitinin jeolojisi ve metallojenisi. Ahmet
Acar Jeoloji Sempozyumu Bildirileri, pp 225–267 (in Turkish)
218 Environ Earth Sci (2010) 60:203–218
123
Copyright © 2022 FDOKUMEN