Mobilization of seed reserves and environmental control of seed germination
Upload
khangminh22Category
view
0download
0
Decentralised Fish Seed Networks in Northwest Bangladesh: Impacts on Rural Livelihoods
A Thesis Submitted for the Degree of Doctor of Philosophy
By
Mohammad Mahfujul Haque BSc Fisheries (Hons) & MS in Aquaculture
Aquaculture Systems and Development Group Institute of Aquaculture
University of Stirling Scotland, UK
2007

Dedicated to
My Parents

Declaration
I hereby declare that this thesis has been composed entirely by myself. The work
presented in this thesis has not previously been submitted for any other degree or
qualification. The nature and extent of my work carried out by, or in conjunction with
others, has been specifically acknowledged by reference.
Mohammad Mahfujul Haque

i
Abstract
Ricefield based fish seed production (RBFSP) in irrigated spring (boro) ricefields after
initial introductions by external promoters has spread among farmers in parts of
Northwest Bangladesh. This approach to producing juvenile fish, rather than by
specialised geographically clustered hatchery and nursery enterprises, has been
recognised as a strategy for decentralised production that makes large high quality seed
available locally and supports food fish production. RBFSP has been promoted by the
international NGO CARE as part of a process to improve rice-based livelihoods of
farming households using a farmer field school (FFS) approach in two consecutive
projects between 1993 and 2005. The approach is technically simple and is based on the
stocking of common carp (Cyprinus carpio) eggs and Nile tilapia (Oreochromis
niloticus) broodfish in ricefields. As a new approach to farmer level fish seed
production, its livelihood impacts on the farming households as well as associated
actors; its adoption, adaptation and rejection process in farming households; and its cost-
effectives for dissemination at farmer level were not well understood.
This thesis mainly applies the concept of the sustainable livelihood approach (SLA)
using tools and processes of the growing family of participatory research. A systems
approach was used to ensure that the key stakeholders including households, community
and extension organizations were included. The study was initiated with a well-being
analysis of community households to identify poorer households before exploring
impacts of RBFSP on poorer producing households (RF) compared to non-producing
(NRF) households based on one-off and longitudinal surveys. Livelihoods impacts on
other actors linked directly and indirectly with RBFSP were also investigated. The
adoption process of RBFSP at the household level and the cost-effectiveness of its
promotion were assessed.

ii
Impact studies at the household level showed that RF households were significantly
larger and had lower levels of formal education than NRF. Adoption of RBFSP had
improved practical skills and hence substantially improved human capital in RF
households. RF households tended to have more of their ricefish plots located adjacent
to their households. Poor and intermediate adopters had smaller riceplots than better-off
households but higher seed production efficiencies (poor-315.1 kg fingerlings/ha;
intermediate-419.1 kg fingerlings/ha) than better-off households (294.6 kg
fingerlings/ha). In addition to direct consumption of large fingerlings, RF households
restocked them for further growth in their household ponds in doing so increasing yields
by 60%. Fish consumption increased substantially in RF households based on their own
production reducing their dependency on purchase from markets. The year round
longitudinal survey revealed that activities for RBFSP were compatible with their
existing rice-based agriculture activities for household members including men, women
and children. The relatively limited income from fingerling production improved cash
flow in the low income months. Consumption of large size fingerlings from ricefields
provided nutrient dense food in the ‘hungry gap’ months when supplies of wild fish
were poor, smoothing consumption. Apart from RF households, RBFSP extended its
livelihoods impacts to a wide range of actors in and around the seed producing
community. Poor fry traders were found to be key actors in the spread and support of
RBFSP. On average fry traders supplied fingerlings to 35 foodfish producers within a
mean distance of 5 Km from producing households in a community where RBFSP was
well established. The end users (foodfish producers) included households with their own
ponds, ponds with multiple ownership and larger waterbodies leased by small groups.
Locally available RFBSP juveniles were attractive to each of these groups,
supplementing hatchery derived seed.

iii
A large number of complex socio-cultural and technical factors were related to
household level adoption of RBFSP. The major factors included use of cash generated to
prevent distress sales of rice; lack of requirement to use pesticide in ricefields; meeting
the household consumption demand; capacity to restock fingerlings in ponds; lack of
any negative effects on rice production; increased non-stocked fish production in
riceplots; simplicity of the technology; ease of fish harvest from riceplots; increased
ability to gift fingerlings/foodfish to relatives and neighbours; more efficient use of both
riceplot and irrigation pumps. The most important reasons for households not attempting
or quickly rejecting RBFSP were labour conflicts with other activities. However, lost
access to the riceplots through changes in tenure was the most common cause of late
rejection by households who had practiced RBFSP for several years after withdrawal of
CARE support. Location of fish seed producing plots close to the homesteads facilitated
household women to contribute to seed production activities through feeding and
looking after fish. Women were able to decide and control resources generated from
fingerling sales as well as choosing to gift fingerlings to their relatives. Informal transfer
of fingerlings in this way stimulated spread of RBFSP.
Decentralised fish seed production was promoted through FFS very cost effectively. The
introduction of an improved strain of Nile tilapia (GIFT) broodfish greatly enhanced the
returns from decentralised seed production based on common carp alone. High levels of
secondary adoption improved benefits from promoting RBFSP. The major benefit
derived from the improved returns to food fish farmers using locally produced seed.
Higher levels of net present value (NPV) and benefit cost ratio (BCR) were achieved
based on promotion of mixed-sex tilapia in RBFSP than mono-sex tilapia produced in a
large scale central hatchery. Cost-effectiveness in terms of multiplier development
impacts on ramification of secondary adopters and, income of fry traders and foodfish
producers, RBFSP also showed better performance than a mono-sex tilapia hatchery.
iv
Acknowledgements
I am immensely grateful to the Support for University Fisheries Education and Research (SUFER) Project, DFID for providing me with a scholarship to get admitted to the University of Stirling (UoS), UK for the doctoral study. My gratefulness is due to late C. P. Morrice, former SUFER Project Coordinator for arranging such a sincere selection process that gave me a great opportunity for competition in achieving this scholarship. Similarly I am grateful to Aquaculture and Fish Genetics Research Programme (AFGRP), DFID for its financial support to carry out filed work in Northwest Bangladesh. I owe a great debt to my principal supervisor, Dr. David C. Little, Institute of Aquaculture, UoS who introduced me to multi-disciplinary research and nurtured me to in-depth investigation critically to enrich my knowledge and understanding on the complex dynamics of rural livelihoods. His encouragement, stimulation and empathy throughout the study has been immeasurable. I strongly believe his untiring guidance and support has made this study merely possible. I would like to express my earnest gratitude to my local supervisor, Prof. Dr. M. A. Wahab, Department of Fisheries Management, Bangladesh Agricultural University (BAU) for his constant stimulating direction, encouragement and ample support throughout the study period. I am very grateful to my additional supervisor, Dr. Trevor Telfer, Institute of Aquaculture, UoS for his valuable comments and suggestions in study design and statistical analysis. My enormous gratitude is to Dr. Benoy Kumar Barman, Coordinator, WorldFish Center, Bangladesh. His support through providing me with constructive comments and suggestions in designing study protocol and encouragement has facilitated to carry out this field based study smoothly. My profound gratefulness is to Dr. Cori Critchlow-Watton, Teaching Fellow, Institute of Aquaculture, UoS for her support in various ways throughout the study. Especially her constructive comments and suggestions with her well-built knowledge base of scientific writing and editing greatly contributed to the improvement of my thesis draft. I would like to acknowledge my heartfelt gratitude to the community people of Northwest Bangladesh who shared with me the details of their livelihoods, which ultimately helped me immensely to gain insights into the research. Special appreciation goes to field staff Utpal Chakrabarty, Taposhi Barma, Mehdi Hasan and Jewel for their industrious support in terms of data collection in the remote rural communities and, data entry and data rechecking in field office. I would like to thank WorldFish Centre, Bangladesh for providing me with support of the field office in the Northwest, necessary field staff and access to its head office, Dhaka to review a wide range of literature relevant to my study. I am also thankful to the people of CARE Bangladesh, particularly Dr. Md. Mehrul Islam, Livelihood Coordinator and Md. Abdul Malek Khan, Technical Coordinator for their extending support proving me with necessary documents and access to CARE field offices as well
v
as their working communities. Special thanks to the Executive Directors and staff of the partner NGOs of CARE Bangladesh for giving me adequate access to their offices to carry out an important part of this study. My acknowledgement would not be complete without special thanks to all the members of, and my friends in the Aquaculture Systems and Development Group, UoS for their help and support throughout the study period. Especially my appreciation goes to Mr. William Leschen, Mr. Anton Immink, Dr. Lindsay Pollock, Dr. Francis Murray, Dr. Faruk-Ul-Islam, Dr. Manjurul Karim, Dr. Golam Faruque, Dr. Jack Morales, Dr. Ekram Azim, Mr. Benjamin Belton, Mr. Danai Turongruang, Mr. Garry Milwain, Mrs. Phuong Nguyen and Mr. Charlie Price for their kind help in various aspects, and encouragement with friendly manner during the study period. Special thanks go to Dr. Shahjahan Shahid, Research Fellow, Department of Computing Science & Mathematics, for his various help and Mr. Mohd. Golam Quader Khan (Milton), PhD Student, Institute of Aquaculture, UoS for his sincere help to collect some field level information in Bangladesh. I would like to thank the staff at the Institute of Aquaculture especially, Melanie Cruickshank and Betty Stenhouse for their sincere and cordial official support. Special appreciation is also due to the Library staff, UoS for giving me the opportunity of various training on IT skill development and for the massive support of the Document Delivery Service to collect diverse literature from different places of the world. My deep respects and gratitude goes to my MS supervisor, Prof. Dr. Md. Anwarul Islam, Department of Aquaculture, BAU (ex vice-chancellor of BAU), who gave me a vital training in field research during master’s degree that made me able to carry out this study smoothly. Earnest thanks is to my respected teacher Prof. Dr. Md. Mohsin Ali, Department of Aquaculture, BAU for his encouragement to this study and kind official advice and help in BAU to get study leave several times. I am grateful to my respected teachers especially, Prof. Dr. S. M. Rahmatullah, Prof. Dr. Md. Ali Reza Faruk and Dr. M. A. Salam, Department of Aquaculture, colleagues and friends in BAU for their cordial support in various ways throughout the study. I would like to take this opportunity to thank my respected father as well as college teacher A.B.M. Serajul Haque, my mother Fatema Chowdhury, my brother and sister and relatives, especially my father- and mother-in-law for their emotional support and sacrifice during the whole period of study. Without such support and sacrifice, this study would have been difficult. Last but not least, I am deeply grateful to my wife Aeysha Akter (Ruma) for her love, encouragement, generosity and sacrifice throughout my study.
Finally, I am immeasurably grateful to Almighty Allah.

vi
Acronyms and Abbreviations
Abbreviation/Acronymes Term ADB Asian Development Bank AFGRP Aquaculture and Fish Genetics Research Programme BAU Bangladesh Agricultural University BBS Bangladesh Bureau of Statistics BCR Benefit Cost Ratio BRAC Bangladesh Rural Advancement Committee CARE Cooperative America Relief for Everywhere CBO Community Based Organization CEA Cost Effective Analysis DAE Department of Agriculture Extension DFID Department for International Development DoF Department of Fisheries DoL Department of Livestock FAO Food and Agriculture Organization of the United Nations FFS Farmer Field School GIFT Genetically Improved Farmed Tilapia Go-Interfish Greater Opportunities for Integrated Rice-Fish IMOF Improved Management of Openwater Fisheries Interfish Integrated Rice-Fish IPM Integrated Pest Management KI Key Informant MDG Millennium Development Goal MOA Ministry of Agriculture NADP Northwest Aquaculture Development Project NAEP National Agriculture Extension Policy NFEP Northwest Fisheries Extension Project NGO Non Government Organization NPV Net Present Value PAR Participatory Action Research PRA Participatory Rural Appraisal RBFSP Ricefield Based Fish Seed Production RDRS Rangpur Dinajpur Rural Service SLA Sustainable Livelihoods Approach SRS Self Recruiting Species SUFER Support for University Fisheries Research and Education UNDP United Nations Development Programme UoS University of Stirling WB World Bank

vii
Glossary of Terms
Local term English Amon Rainfed rice crop Arat Auction market of fish Bazar/Hat Village market Beel Seasonally inundated water body Boro Irrigated rice crop Community A cluster of households within a village Decimal Unit of land area, 1 decimal = 40.48 m2 DTW Deep tube well Eid Muslim religios festival Hectare (ha) 1 hectare = 10,000 m2 Kacha road Earthen road Paiker Fish retailer Paka road Hard bitumen surfaced road Puja Hindu religious festival Shalish Local informal court STW Shallow tube-well Thana/upazila Sub-district level of local government Union Local government unit comprising several villages
viii
Table of Contents Abstract……….................................................................................................................. i Acknowledgements ......................................................................................................... iv Acronyms and Abbreviations ........................................................................................vi Glossary of Terms..........................................................................................................vii Table of Contents ..........................................................................................................viii List of Table……………………………………………………………………………xii List of Figures................................................................................................................. xv List of Appendices.........................................................................................................xix Chapter 1: General introduction ............................................................................... 1
1.1 Background........................................................................................................ 1 1.1.1 The concept of sustainable development ................................................... 6 1.1.2 The concept of the SLA............................................................................. 8 1.1.3 Sustainable natural resource (NR) based development for the poor ....... 12 1.1.4 Sustainable aquaculture development...................................................... 14
1.2 Aquaculture potential for food security and poverty reduction....................... 17 1.2.1 Aquaculture development in Bangladesh ................................................ 19 1.2.2 Context of fish seed in Bangladesh.......................................................... 22
1.3 The concept of decentralised fish seed production.......................................... 24 1.3.1 Potential of ricefield for fish seed production ......................................... 26 1.3.2 Present context of irrigated ricefields ...................................................... 28 1.3.3 Decentralised fish seed production in irrigated ricefields: an overview.. 30
1.4 Justification of the study.................................................................................. 35 1.4.1 Research hypotheses and objectives ........................................................ 38 1.4.2 Outline of the thesis ................................................................................. 38
Chapter 2: General methodology............................................................................. 42 2.1 Introduction...................................................................................................... 42
2.1.1 Conceptual framerowrk of methodological process ................................ 42 2.2 General background of the study area ............................................................. 54 2.3 Step 1 ............................................................................................................... 58 2.4 Step 2 ............................................................................................................... 68 2.5 Step 3 ............................................................................................................... 68 2.6 Step 4 ............................................................................................................... 69 2.7 Step 5 ............................................................................................................... 69 2.8 Observation...................................................................................................... 70 2.9 Data management ............................................................................................ 70 2.10 Statistical analysis............................................................................................ 72
2.10.1 Parametric test.......................................................................................... 72 2.10.2 Non-parametric tests ................................................................................ 73 2.10.3 Statistics used for presenting results........................................................ 74
2.11 Triangulation and validation of key findings................................................... 75 2.12 Assumptions of the study................................................................................. 77
Chapter 3: Contextualisation of RF households and their livelihoods................. 79 3.1 Introduction...................................................................................................... 79
3.1.1 Objectives of this study............................................................................ 82 3.1.2 Hypothesis ............................................................................................... 83
ix
3.2 Research process and methodology................................................................. 84 3.3 Results.............................................................................................................. 89
3.3.1 Institutional mediation ............................................................................. 90 3.3.2 Livelihood capital .................................................................................... 91 3.3.3 Livelihood strategies and outcomes....................................................... 109
3.4 Discussion...................................................................................................... 137 3.4.1 Institutional mediation ........................................................................... 137 3.4.2 Livelihood assets.................................................................................... 138 3.4.3 Livelihoods strategies and outcomes ..................................................... 149 3.4.4 Conclusion ............................................................................................. 163
Chapter 4: Seasonality of RBFSP and its impacts on livelihoods....................... 165 4.1 Introduction.................................................................................................... 165 4.2 Methodology.................................................................................................. 169
4.2.1 Questionnaire survey ............................................................................. 169 4.2.2 Data management .................................................................................. 170 4.2.3 Data analysis .......................................................................................... 171
4.3 Results............................................................................................................ 172 4.3.1 Labour allocation of household members for different activities.......... 172 4.3.2 Fish seed production in riceplot and its associated usages .................... 183 4.3.3 Income and expenses ............................................................................. 185 4.3.4 Consumption of food ............................................................................. 190 4.3.5 Health condition..................................................................................... 199 4.3.6 Correlation between income and other factors ...................................... 200
4.4 Discussion...................................................................................................... 202 4.4.1 Activities................................................................................................ 202 4.4.2 Income and expenditure......................................................................... 208 4.4.3 Consumption of food and health............................................................ 210
4.5 Conclusion ..................................................................................................... 216 Chapter 5: Broader scale impacts of RBFSP: an actor oriented investigation . 218
5.1 Background.................................................................................................... 218 5.2 Research framework and methodology ......................................................... 220
5.2.1 Community selection ............................................................................. 220 5.2.2 Actor identification ................................................................................ 221 5.2.3 Development of actor linkage matrices ................................................. 223 5.2.4 Development of social capital................................................................ 225
5.3 Results............................................................................................................ 227 5.3.1 General characteristics of community ................................................... 227 5.3.2 Seed producers....................................................................................... 231 5.3.3 Fry traders .............................................................................................. 239 5.3.4 Pond fish (foodfish) producers using fingerling from BAH.................. 246 5.3.5 Fish producers in large waterbodies (beel) ............................................ 247 5.3.6 Fishers.................................................................................................... 248 5.3.7 Aratdar ................................................................................................... 249 5.3.8 Retailer................................................................................................... 251 5.3.9 Fish consumer via fish market ............................................................... 252 5.3.10 Fish consumers directly consumed fish from the community ............... 254
x
5.3.11 Non government organization (NGO) ................................................... 255 5.3.12 Actor network matrix............................................................................. 256 5.3.13 Building social capital ........................................................................... 257
5.4 Discussion...................................................................................................... 258 5.4.1 Seed producers....................................................................................... 258 5.4.2 Fry traders .............................................................................................. 261 5.4.3 Foodfish producers (pond and beel) ...................................................... 263 5.4.4 Fish traders and market.......................................................................... 264 5.4.5 NGOs ..................................................................................................... 265 5.4.6 Social capital.......................................................................................... 266
5.5 Conclusion ..................................................................................................... 268 Chapter 6: Adoption, adaptation and rejection process of RBFSP technology 271
6.1 Introduction.................................................................................................... 271 6.2 Analytical framework .................................................................................... 272 6.3 Methodology.................................................................................................. 277
6.3.1 Data/information management and analysis.......................................... 281 6.4 Results............................................................................................................ 282
6.4.1 Adopting households: primary and secondary....................................... 282 6.4.2 Non-adopting households ...................................................................... 295 6.4.3 Pair–wise comparison of major factors between adopters and non-adopters …………………………………………………………………………300 6.4.4 Women in adopting households............................................................. 301 6.4.5 Women in non adopting households...................................................... 304
6.5 Discussion...................................................................................................... 306 6.5.1 Adopting households ............................................................................. 306 6.5.2 Non-adopting households ...................................................................... 321 6.5.3 Women from adopting and non-adopting households........................... 324
6.6 Conclusion ..................................................................................................... 325 Chapter 7: Cost-effectiveness of different approaches to extension of RBFSP in terms of its development returns................................................................................ 328
7.1 Introduction.................................................................................................... 328 7.1.1 Development of extension delivery towards FFS in Bangladesh .......... 328
7.2 Methodology.................................................................................................. 342 7.2.1 Determination of costs of different decentralised and centralised seed production systems ................................................................................................ 342 7.2.2 Determination of effectiveness .............................................................. 343 7.2.3 Understanding programme sustainability among CARE’s partner NGOs …………………………………………………………………………346
7.3 Results............................................................................................................ 347 7.3.1 Project investment based cost-effectiveness.......................................... 347 7.3.2 Development (economic) cost-effectiveness ......................................... 357
7.4 Discussion...................................................................................................... 364 7.4.1 Sustainability of programme in PNGO.................................................. 371 7.4.2 Conclusion ............................................................................................. 375
Chapter 8: General discussion ............................................................................... 377 8.1 Introduction.................................................................................................... 377

xi
8.2 Impacts on human capital .............................................................................. 379 8.2.1 Development of knowledge on natural resources management ............ 379 8.2.2 Participation of household member in RBFSP ...................................... 383
8.3 Impacts on natural and physical capital thorough farm diversification......... 385 8.3.1 Ricefields ............................................................................................... 385 8.3.2 Relationships to pond management ....................................................... 387 8.3.3 Other waterbodies .................................................................................. 388
8.4 Impacts on food security................................................................................ 389 8.5 Impacts on financial capital ........................................................................... 390 8.6 Compatibility with the poor........................................................................... 392 8.7 Development of social capital and network................................................... 394 8.8 Adoption process of this technology ............................................................. 396 8.9 Rejection and sustainability of technology.................................................... 399 8.10 Promotion of RBFSP technology .................................................................. 401 8.11 Summary and conclusion............................................................................... 404
References…................................................................................................................. 408 Appendices…................................................................................................................ 440

xii
List of Table Table 1.1: Ricefield productivity for aquatic animals in wild and cultured condition in different countries ............................................................................................................ 28 Table 1.2: Research hypotheses and objectives............................................................... 38 Table 2.1: Types of farmer participation in participatory research (Biggs, 1989) .......... 44 Table 2.2: The major criteria perceived by key informants to group households in different well-being categories ........................................................................................ 64 Table 2.3: Basic characteristics of sampled farming households by type ....................... 67 Table 3.1: Distribution of the sample households (N=118) by farmer type and well-being category............................................................................................................................ 85 Table 3.2: Human capital of sampled households by farmer type and well-being.......... 92 Table 3.3: Physical capital of sampled households by farmer type and well-being group......................................................................................................................................... 97 Table 3.4: Landholdings of sampled households by farmer type and well-being ......... 101 Table 3.5: Various dimensions of ricefish plots accessed by RF households according to their well-being status.................................................................................................... 103 Table 3.6: Cost for installation of groundwater shallow irrigation pump ..................... 106 Table 3.7: Financial capital of sampled households by farmer types and well-being groups............................................................................................................................. 108 Table 3.8: Cultivation of different crops and income by farmer type ........................... 109 Table 3.9: Mean (±SD) area cultivated, production, expenditure and income per household from field crops by farmer types and well-being ......................................... 111 Table 3.10: Average annual total income from different types of livestock by farmer type and well-being........................................................................................................ 113 Table 3.11: Rice production and its management in the ricefish plot in boro and amon season............................................................................................................................. 116 Table 3.12: Comparative production, expenditure and income from boro and amon rice....................................................................................................................................... 117 Table 3.13: Input uses, production of fingerling and associated uses for different purposes of households and income from fingerlings by well-being group.................. 118 Table 3.14: Correlation matrix between the seed production in riceplots and other related factors............................................................................................................................. 120 Table 3.15: Regression output on seed production from the ricefish plot in farming households ..................................................................................................................... 121 Table 3.16: Fish production in ponds and income by farmer type and well-being ....... 127 Table 3.17: Amount of fish consumed (kg/household) at household level by farmer type and well-being................................................................................................................ 130 Table 3.18: Household income (US$) from different sources by farmer type and well-being............................................................................................................................... 132 Table 3.19: Household level annual expenditure (US$) of RF and NRF farmers by well-being group .................................................................................................................... 134 Table 4.1 Time spent (hr/capita/week) for different activities in RF households by gender............................................................................................................................. 174 Table 4.2: Land (ha) cultivated during boro and amon season for rice production....... 176

xiii
Table 4.3: Percent contribution of income (US$/capita/week) from different sources by well-being ...................................................................................................................... 185 Table 4.4: Average and percentage share of expenditure (US$/capita/week) in fish seed producing (RF) households from different sources by well-being................................ 188 Table 4.5: Correlation co-efficient between income and other factors.......................... 201 Table 5.1: Methods of investigations used at different level of actors .......................... 224 Table 5.2: General characteristics of the selected communities.................................... 228 Table 5.3: Amount of fingerlings produced and sold to fry traders in BAH and GUL. 233 Table 5.4: Gifting and selling fingerlings to relatives and neighbours from the producing households in BAH and GUL........................................................................................ 233 Table 5.5: Gifting and selling foodfish to relatives and neighbours from the producing households in BAH and GUL........................................................................................ 234 Table 5.6: Selling foodfish in the market with amount and price.................................. 235 Table 5.7: Reasons for selling seed as foodfish by % seed producers........................... 235 Table 5.8: Characteristics of fingerling distribution through fry traders from seed producing community to the foodfish producers........................................................... 242 Table 5.9: Advantages for trading of fish seed produced from the ricefield based systems....................................................................................................................................... 244 Table 5.10: Advantages and benefits of foodfish producers due to use of fish fingerling produced in ricefield based systems .............................................................................. 246 Table 5.11: Actor linkage matrix showing links developed for RBFSP between different actors in well established community - BAH (upper diagonal) and recently introduced community - GUL (lower diagonal) .............................................................................. 256 Table 6.1: Categories of the households at the community level by adopters and non-adopters and their sample distribution ........................................................................... 280 Table 6.2: General household characteristics of primary and secondary adopters........ 283 Table 6.3: Household members (%) received knowledge on seed production at primary and secondary farming level .......................................................................................... 285 Table 6.4: Perceptions of approaches to improving rice production incorporating other technologies in and around riceplots ............................................................................. 286 Table 6.5: Pair wise difference between the technologies in terms of scoring.............. 287 Table 6.6: Adoption and adaptation linkage with riceplot, pond, farming family, farming seasonality and farming society..................................................................................... 290 Table 6.7: Use of money derived from seed selling by primary and secondary adopters....................................................................................................................................... 293 Table 6.8: Characteristics of households who never tried, initially rejected and rejected after few years the RBFSP technology.......................................................................... 296 Table 6.9: Pair-wise comparison between different groups of respondents .................. 300 Table 6.10: Women involved in different fish seed production activities..................... 302 Table 6.11: Primary income use from seed selling by household members.................. 303 Table 6.12: Causes for current non-adoption of RBFSP by households ....................... 305 Table 7.1: Cost for implementing FFS by Go-Interfish partner NGO (1US$=Tk.58.00)....................................................................................................................................... 347 Table 7.2: Cost for RBFSP training in Interfish-FFS .................................................... 348 Table 7.3: Cost for RBFSP training in FFS of IF tilapia research area ......................... 349 Table 7.4: Training cost for RBFSP in Go-Interfish project ......................................... 350

xiv
Table 7.5: Cost and benefit of tilapia seed production in mono-sex hatchery............... 351 Table 7.6: Net present value for Interfish project area .................................................. 353 Table 7.7: Calculation of benefit-cost ratio for Interfish area ....................................... 353 Table 7.8: Calculation of net present value for Interfish research area ......................... 353 Table 7.9: Calculation of benefit-cost ratio for Interfish research area ......................... 354 Table 7.10: Calculation of net present value for Go-Interfish project........................... 354 Table 7.11: Calculation of benefit-cost ratio for Go-Interfish project........................... 355 Table 7.12: Calculation of net present value for GIFT tilapia hatchery ........................ 355 Table 7.13: Calculation of benefit-cost ratio for mono-sex tilapia hatchery ................. 356 Table 7.14: Multiplier benefits in Interfish area ............................................................ 357 Table 7.15: Multiplier benefits from Interfish research area ......................................... 358 Table 7.16: Multiplier benefits from Go-Interfish area ................................................. 359 Table 7.17: Multiplier benefits from centralised mono-sex tilapia hatchery................. 360 Table 7.18: Partner NGO’s profile with regard to their existing programmes .............. 362 Table 7.19: Statistics of community based organizations formed by 9 NGOs under CARE Go-Interfish project in the Northwest Bangladesh............................................. 363

xv
List of Figures
Figure 1.1: Sustainable Livelihoods Framework (source: Adato and Meinzen-Dick, 2002). ............................................................................................................................... 10 Figure 1.2: The three inter-related aspects of sustainability of an aquaculture systems: production technology, social and economic aspects, and environmental aspects, source : AIT (1994). ...................................................................................................................... 15 Figure 1.3: Comparative production of fish fry from wild and hatchery over the last two decades in Bangladesh (FRSS, 2003-2004)..................................................................... 23 Figure 1.4: The most important rice producing countries as characterized by their irrigation development, adapted from MacLean et al. (2002). ........................................ 29 Figure 2.1: Schema illustrating analytical framework of the research (adapted from Bush, 2004). ..................................................................................................................... 51 Figure 2.2: Map of Bangladesh showing study area in four districts (Thakurgaon, Dinajpur, Rangpur and Kurigram) highlighted in Northwest Bangladesh. ..................... 55 Figure 2.3: Flowchart illustrating methodological processes used in whole study. ........ 57 Figure 2.4: Interface of database in Microsoft Access. ................................................... 71 Figure 2.5: Sharing and validation of findings at different levels of respondents........... 76 Figure 3.1: Percent of households received training from various organizations by farmer type and well-being (BRAC=Bangladesh Rural Advancement Committee, TTC= Teacher Training Centre), YDC = Youth Development Centre, IFN=Islamic Foundation, DoL=Department of Livestock, DAE=Department of Agriculture Extension, DoF = Department of Fisheries, AVDP = Ansar VDP and RDRS = Rangpur Dinajpur Rural Service). ........................................................................................................................... 90 Figure 3.2: Pyramidal distribution of whole population based on age and sex by farmer type in RF and NRF households. ..................................................................................... 93 Figure 3.3: Education (number of schooling year) of the sample household head. ........ 94 Figure 3.4: Construction materials of living rooms of household members (C=concrete, T=corrugated tin, S= soil, B= bamboo and St= straw; - - - = floor-wall-roof)................ 96 Figure 3.5: Access to different pond ownerships by farmer type and well-being (share in = sharecropping; multi-owner = multiple households ownership; own=single household ownership pond). ............................................................................................................. 99 Figure 3.6: Ownership pattern of ricefish plot in different well-being groups of RF households. .................................................................................................................... 102 Figure 3.7: Whole set of groundwater irrigation pump belongs to a better-off farmer (left) poorer households only had the borehole to which they attached a rented pump-set (right). ............................................................................................................................ 105 Figure 3.8: Percent of households received credit from different organizations........... 107 Figure 3.9: Income from different non-farm sources by farmer type and well-being. .. 114 Figure 3.10: Rice varieties cultivated in fish seed producing riceplot (HYV= High yielding varieties). ......................................................................................................... 115 Figure 3.11: Species combination for fish fingerling production by well-being group.118 Figure 3.12: Scatter plot of production efficiency of fingerling by well-being status of farming households........................................................................................................ 119 Figure 3.13: Uses of fish seed/fingerling for different purposes. .................................. 122 Figure 3.14: Importance of different marketing channels for selling of fish juveniles. 123

xvi
Figure 3.15: Income per household from rice (boro and amon) and fish fingerling. .... 124 Figure 3.16: Source of fish seed stocked in own pond by farmer type and well-being........................................................................................................................................ 125 Figure 3.17: Pond production and income by farmer type and well-being. .................. 126 Figure 3.18: Sources of fish seed stocked in multiple-ownership pond by farmer type and well-being................................................................................................................ 127 Figure 3.19: Sources of fish consumed by origin. ......................................................... 129 Figure 3.20: Average annual fish consumption by the household from different sources........................................................................................................................................ 131 Figure 3.21: Percentage share of income by farmer type and sources. ......................... 133 Figure 3.22: Annual household annual expenditure (US$) of RF and NRF farmers. ... 134 Figure 3.23: Potential factors recognised by RF farmers based on their experience over the year of practices. ...................................................................................................... 135 Figure 3.24: Major constraints to producing juveniles in boro ricefields faced by the RF farmers. .......................................................................................................................... 136 Figure 4.1 Geographical position of Bangladesh (source: http://worldatlas.com). ....... 166 Figure 4.2: Result discussion meeting at the community level. .................................... 172 Figure 4.3: Percent time allocation for different activates done in RF household. ....... 173 Figure 4.4: Percent time spent (hr/capita/week) carrying out different agriculture activities in RF household.............................................................................................. 175 Figure 4.5: Average time spent (hr/capita/week) carrying out agricultural activities in RF household by month and wellbeing. .............................................................................. 175 Figure 4.6: Average time spent (hr/capita/week) for ricefish and other agricultural activities by farmer type and month. ............................................................................. 176 Figure 4.7: Percent time (hr/capita/week) utilization for different activities in fish seed production plots. ............................................................................................................ 177 Figure 4.8: Percent utilization of time (hr/capita/week) for different activities of pond culture ............................................................................................................................ 178 Figure 4.9: Percent of time (hr/capita/week) used for homestead level reproductive activities in RF households. ........................................................................................... 180 Figure 4.10: Average time spent (hr/capita/week) for homestead re-productive, non-farm reproductive and non-farm productive activities in RF household by month and well-being............................................................................................................................... 180 Figure 4.11: Time spent (hr/capita/week) for homestead re-productive, non-farm reproductive and non-farm productive activities by month and farmer type. ............... 181 Figure 4.12: Percent of time (hr/capita/week) used in different non-farm re-productive and productive activities. ............................................................................................... 182 Figure 4.13: Usages of fish seed/fingerling (kg/capita/week) in RF households by month and well-being................................................................................................................ 183 Figure 4.14: Scatter plot showing distribution of fingerling production (kg/capita/week) by well-being. ................................................................................................................ 184 Figure 4.15: Average income (US$/capita/week) of RF households by wellbeing and month. ............................................................................................................................ 186 Figure 4.16: Household level income (US$/capita/week) from different sources by month and well-being .................................................................................................... 187

xvii
Figure 4.17: Expenditure (US$/capita/week) in seed producing household by month and well-being. ..................................................................................................................... 189 Figure 4.18: Different expenses (US$/capita/week) in RF households by month and well-being. ..................................................................................................................... 190 Figure 4.19: Fish consumption (g/capita/week) in RF households from different sources by month and well-being. .............................................................................................. 191 Figure 4.20: Fish consumption (g/capita/week) in farming households from different sources by month and farmer type................................................................................. 192 Figure 4.21: Average rice consumption (g/capita/week) in RF households by month and wellbeing........................................................................................................................ 193 Figure 4.22: Vegetable consumption (g/capita/week) of RF farmer by month and well-being............................................................................................................................... 194 Figure 4.23: Vegetable consumption (g/capita/week) by month and farmer type......... 195 Figure 4.24: Meat & egg consumption (g/capita/week) in RF households by month and well-being. ..................................................................................................................... 196 Figure 4.25: Meat & egg consumption (g/capita/week) in farming households by month and farmer type. ............................................................................................................. 197 Figure 4.26: Pulse consumption (g/capita/week) in RF households by month and well-being............................................................................................................................... 198 Figure 4.27: Pulse consumption (g/capita/week) in farm households by month and farmer type..................................................................................................................... 199 Figure 4.28: Average sickness (days/capita/week) in RF farming households by month and well-being................................................................................................................ 200 Figure 5.1: FGD for identification of actors/people those are connected directly or indirectly with decentralised RBFSP............................................................................. 222 Figure 5.2: Putnam’s conceptual framework of network in social capital -adapted from Bode and Howes (2003). ............................................................................................... 226 Figure 5.3: Map of well established community (BAH) of decentralised seed production........................................................................................................................................ 229 Figure 5.4: Map of recently introduced community (GUL) of decentralised fish seed production. ..................................................................................................................... 230 Figure 5.5: Benefits experienced by seed producers using their own fingerling in BAH (N=21) and GUL (N=6)................................................................................................. 232 Figure 5.6: Cumulative number of fry traders involved in fish seed trading................. 239 Figure 5.7: Entry points through which fry traders come to this profession. ................ 240 Figure 5.8: Occupations of fry traders. .......................................................................... 241 Figure 5.9: Decentralised seed distribution area from BAH (figures in the parentheses indicate distance in Km) ................................................................................................ 242 Figure 5.10: Seasonal income of fry traders. ................................................................. 243 Figure 5.11: Fry trader income proportion from trading of ricefield produced seed in comparison with other income sources.......................................................................... 244 Figure 5.12: Proportion of tilapia in comparison with other fishes sold by a retailer in a nearby market of BAH................................................................................................... 251 Figure 5.13: Purchasing of fish (kg/month) by a consumer from the local market nearby BAH. .............................................................................................................................. 253

xviii
Figure 6.1: Analytical framework of adoption, non-adoption and rejection process of RBFSP in farming households....................................................................................... 276 Figure 6.2: Farmer perception of criteria for involvement in RBFSP activities............ 284 Figure 6.3: Location of irrigation pump and supply of water in ricefish plots.............. 289 Figure 6.4: Number of adopters (%) sold fish seed through different channel. ............ 292 Figure 6.5: Percent of adopters sold seed/fingerling in the different months................ 293 Figure 6.6: Reasons for which respondents (%) did not adopt fish seed production in the rice field based systems ................................................................................................. 298 Figure 6.7: Diagram showing detail reasons for non-adoption of RBFSP; figures in parentheses indicate the number of respondents out of 30 in each group …………….299 Figure 6.8: Percent of women making decisions regarding seed sales.......................... 302 Figure 6.9: Percent of women gifting fingerlings to different relatives and neighbours....................................................................................................................................... 304 Figure 7.1: Schematic view of promotion of ricefish based fish seed production during the period from 1993 to 2005 (adapted from Gregory and Kamp, 1999b; Barman, 2000; CARE, 2001a)................................................................................................................ 334 Figure 7.2 FFS implementation by CARE direct and PNGO delivery mechanisms..... 336 Figure 7.3: Scale of fingerlings production of households under different delivery systems (a = Interfish, b = Interfish resaerch and c = Go-Interfish area). ..................... 352 Figure 7.4: Comparative NPV of different decentralised promotions and centralised hatchery based on initial investment of US$ 10,000. .................................................... 356 Figure 7.5: Multiplier benefits of fish fingerling production based on investment of US$ 10,000. ........................................................................................................................... 361 Figure 8.1: An imaginary schema showing changes in the accumulation of assets in adopting households of RBFSP; drawn based on the number of major livelihood impacts on each asset (DFID, 1999). .......................................................................................... 381

xix
List of Appendices
Appendix 1: One-off survey (baseline) questionnaire................................................... 440 Appendix 2: Longitudinal survey questionnaire............................................................ 450 Appendix 3: Results of non-parametric Chi-square test showing difference between RF and NRF households in terms of having barshi (hook gear)......................................... 458 Appendix 4: Results of parametric univariate analysis of variance on household size. 459 Appendix 5: Questionnaire for study of adoption, adaptation and rejection process of ricefield based fish seed production............................................................................... 461 Appendix 6: Comparative technological preferences of the primary adopters ............. 480 Appendix 7: Comparative technological preferences of the secondary adopters .......... 481 Appendix 8: Problems faced and measures taken by the primary adopters .................. 482 Appendix 9: Problems faced and measures taken by the secondary adopters............... 483 Appendix 10: Photographs showing case study, observation, triangulation and validation findings at the field level ............................................................................................... 484 Appendix 11: Data/information collection from CARE and its PNGOs for cost-effectiveness analysis of FFS......................................................................................... 489 Appendix 12: Report on expenditure for implementation of FFS ................................. 490

Chapter 1
1
Chapter 1: General introduction
1.1 Background
Development requires the removal of ‘poverty’ which is one of the major sources of
‘unfreedom’ as eloquently stated by the veteran economist and Nobel Laureate Amartya
Sen (1999). Poverty occurs the world over and out of its 6 billion people, 2.8 billion,
almost half of the total population live on less than US$2 a day, and 1.3 billion live on
less than US$1 a day (World Bank, 2004). Approximately 70% of the world’s 1.3 billion
poor people live in Asia are generally characterised by under-nutrition, a low asset-base,
inadequate access to education, vulnerability and a crisis in coping strategies (World
Bank, 2004).
In order to enable millions of poor people to improve their livelihoods, the Millennium
Development Goals (MDG) have been adopted by 192 member states of the United
Nations (White, 2005). Out of eight MDGs, the first one is to ‘eradicate extreme poverty
and hunger’ which has been demonstrated as very strongly linked with agriculture.
Moreover, the seven other MDGs demonstrated are also linked directly and indirectly
with agriculture (Rosegrant et al. 2006). In agriculture however, unstable and limited
crop yields have been identified as important vulnerability factors for poorer households
acting as poverty traps (Barrett et al. 2001; Zimmerman and Carter, 2003). Crop yields
are risky because they depend on weather, biotic stress and optimal timing of inputs. In
terms of inputs, agriculture productivity depends to a great extent on the availability of
quality seeds. All other inputs like fertilizers, pesticides and improved implements will
go for naught unless accompanied by quality seed (Ray et al. 2001).
Chapter 1
2
Since the Second World War advances in seed production have contributed significantly
to the worldwide increase in crop yields. More specifically, in developing countries,
seed production lies at the heart of the ‘Green Revolution’ which has been successful in
raising grain production in areas of medium and high potential for arable farming1
(Wiggins and Cromwell, 1995). The ‘Green Revolution’ tripled food production in
tropical areas of Asia, particularly through increasing yields in rice, wheat, and maize,
thereby relieving hundreds of millions of people from hunger (IYRS, 2003). The Asian
Green Revolution in other words has been termed as a ‘seed-fertilizer’ revolution
(Otsuka and Kalirajan, 2006). Despite a considerable improvement in rice seed, the
open-pollinated nature of nearly all rice in Asia led farmers themselves to produce,
preserve and maintain high yielding varieties of rice seed year after year (ISIS, 2004). In
terms of maize cultivation, open pollinated local and improved varieties together occupy
the major part of seed supply to the farmers in developing countries. Open pollinated
seed production is simpler and relatively inexpensive, and subsistence farmers who grow
them can save their own seed to plant in the following season, reducing their dependence
on external sources (The Maize Program, 1999). Saving seed at the household level is
not only a viable option for poor rural farmers but as a result improves stability of cereal
production across the world (Louwaars, 1997). This is because, although physical access
to an appropriate quantity of quality seed is critical, the timing of availability, and
information about seed are often more important (Rohrbach and Malusalila, 2000; Tripp,
2001). Thus traditional seed production and preservation is the most important method
of seed supply and seed multiplication for small-scale farmers in developing countries
with approximately 70% of all seed stored by small-scale farmers drawn, principally
from on-farm seed production (Delouche, 1982; Lewis and Mulvany, 1997).
1 The general defining criteria for medium and high potential arable land is wetness class - slight and nil; effective soil depth – 60 and 150 cm; soil texture – sandy loam to clay and sandy clay loam to clay; permeability – rapid to slow and moderate; and available water capacity – 15 and 25 cm respectively (Young, 1976).

Chapter 1
3
In Bangladesh in 2002, almost 90% of rice seed planted was obtained from on-farm
production or through exchange with neighbours (Hossain et al. 2006). Production and
preservation of open-pollinated seed continues to be an important activity of rural
households where household members, particularly women, keep seed from cereals,
vegetables, fruits and many other crops. Knowledge regarding seed saving has typically
been transmitted from mother to daughter, from sister to sister, from mother-in-law to
daughter-in-law, or from village sister to others (Akhter, 2001). Saving their own seed
offers several clear advantages to farmers in developing countries as described by Lewis
and Mulvany (1997). Firstly, most seed saved is the farmers’ own seed and is of known
quality. Secondly, small quantities of seed can usually be obtained from neighbours, if
necessary. Thirdly, seed is usually readily available at the required time. Fourth, if seed
is purchased, payment can be made by a variety of means other than cash. Finally,
locally adapted varieties of seed unavailable elsewhere can be retained and used (Lewis
and Mulvany, 1997).
In comparison to the agrarian history, aquaculture has been regarded as an infant
(Kongkeo, 2001). But aquaculture as a sector is the most diverse of all animal food
production sectors due to the great variety of “culturable species”, a wide range of
“aquatic environments” (e.g. fresh, marine, brakish, cold, temperate, and warm water), a
wide range of “containments” (e.g. pond, ricefield, pen, cage etc.) and different degrees
of “culture intensity” (extensive, semi-intensive and intensive practices (Tacon et al.
1995). Aquaculture in its many forms began to make a significant contribution to overall
food as well as animal protein supplies in the later part of the 20th Century (De Silva,
2001). In particular, Asian aquaculture has evolved over the past 20 years from a
traditional practice to a science-based activity and grown into a significant food
production sector, contributing more to national economies and providing better
livelihoods for rural and farming families (FAO/RAP, 2000). Over the years, the

Chapter 1
4
development of aquaculture has occurred as a peri-urban practice in terms of its
information flow to the farmer level, commercial and vertical integration, multipurpose
use of ponds and broad range of benefits to the poor through service and consumption
(Little and Edwards, 2003).
As with crop seed in the global context, the availability of quality fish seed is a
prerequisite for the adoption of sustainable aquaculture (Little et al. 2002b). The wider
involvement of poorer households in aquaculture was reported to be constrained by a
lack of fish seed/fingerling in many countries (AIT, 1997; Edwards, 1999b). Over the
recent decades, aquaculture development has increased demand for quality seed and
consequently exposed the shortcomings of wild seed resources. Seed production from
hatcheries has therefore expanded rapidly in many parts of Asia. Although the
techniques for mass production of fish seed were successfully introduced through the
public to private sectors, the distribution of quality seed to rural remote and peripheral
farming households has often remained constrained. Private sector entrepreneurs,
characterised as networks of ‘actors’ now produce and distribute the bulk of seed in
different countries such as Bangladesh, India, Thailand and Vietnam but typically
production is centralised in certain geographical areas (Little et al. 2002b).
The centralised hatchery-based seed production common in many parts of Asia appears
to result in poor or erratic quality of seed reaching farmers (Little et al. 2002b). The
most obvious and common conception of poor ‘quality’ is the very small size of seed
reaching farmers. The stocking of undersized fingerlings or even fry results in sub-
optimal and inconsistent yields and returns to on-growers. This reality is related to the
majority hatcheries having inadequate facilities for fry to fingerling rearing and
difficulties of distributing live fry or fingerling to the farmer level (De Silva, 2001).

Chapter 1
5
Competition among nursery producers and traders, and typically long distance
transportation appear to result in poor quality seed reaching farmers in Vietnam
(Demaine, 1996). The co-location of many small producers is a characteristic feature of
Asian fish seed networks that derives from their proximity to natural sources of riverine
seed and/or the location of government and private hatcheries (Little et al. 2002a). Such
‘clusters’ of enterprises have implications for seed quality; while the high density of
such operations can lead to easy transfer of pathogens, it can also lead to high levels of
information exchange and sharing at minimum transaction costs. Additionally, such
clusters lead to improved availability of materials and equipment, attract
traders/distributors and improve linkages among service providers (Little et al. 2002a).
The usual approach of donor-funded development projects was to set up large, centrally
based, government hatcheries to provide farmers with fingerlings which are rarely
sustained following withdrawal of financial support (Van den Berg, 1996). These
hatcheries are expensive to build and operate and typically only distribute seed over a
limited area. This can limit the involvement of poor farmers in remote areas in rural
aquaculture (Edwards, 1999b). Seed production and distribution of fish such as carp and
catfish from government hatcheries have proved less sustainable in different regions of
the world (Little and Edwards, 2003). A similar scenario was reported in the case of
reproductive health services offering artificial insemination for cattle being operated by
a conventional traditional centralised veterinary hospital in Bangladesh. This approach
does not ensure that farmers in remote agriculturally marginal areas can benefit from the
service at the proper time resulting in low conception rates and economic loss. In order
to ensure that such services reach rural farmers, local level artificial insemination
services have been developed and promoted with encouraging livelihood benefits
(Shamsuddin et al. 2007). Lessons learnt from the Green Revolution, as well as from
livestock development, could be applied to aquaculture development i.e. promoting local

Chapter 1
6
production and availability of quality fish seed. The concept of local level fish seed
production could greatly strengthen sustainable development of quality fish seed supply.
Fish seed is extremely perishable and the importance of ‘timeliness’ of production and
delivery for rainfed aquaculture systems is critical. From this background the main
hypothesis of the present study was framed as ‘local production of fish seed in irrigated
ricefields has positive, diverse and subtle impacts on rural livelihoods in Northwest
Bangladesh’.
1.1.1 The concept of sustainable development
The concept of sustainable development has resulted from perceived inadequacies of
earlier models of economic growth and development. Relating to sustainable
development, the shift from economic development to people-first development has
come to the fore, putting greater emphasis on human and social aspects (Chambers,
1997). This is due to previous economic models did not provide a broad enough base on
which to make balanced judgements on the costs and benefits of various policies which
tended to focus on short-term gains at the expense of longer term aspirations (FAO,
1999). There has been some debate over the concrete definition of sustainable
development. Williams and Millington (2004) argued that sustainable development is a
notoriously difficult, slippery and elusive concept to pin down. Fowke and Prasad
(1996) have identified at least 80 different, often competing and sometimes
contradictory, definitions of sustainable development. The best known, however, is that
given in the Brundtland Report, where it is suggested that sustainable development
means ‘development that meets the needs of the present without compromising the
ability of future generations to meet their own needs’ (WCED, 1987). The interpretation
of the Brundtland definition is as follows:-

Chapter 1
7
A commitment to meet the needs of present and future generations has various
implications. "Meeting the needs of the present" means satisfying (WCED, 1987):
� Economic needs – including access to assets providing an adequate livelihood or
productive economic activity; also economic security when unemployed, ill,
disabled or otherwise unable to secure a livelihood.
� Social, cultural and health needs - including a shelter which is healthy, safe,
affordable and secure, within a neighbourhood with provision for piped water,
drainage, transport, healthcare, education and child development, and protection
from environmental hazards.
� Political needs - including freedom to participate in national and local politics and
in decisions regarding management and development of one's home and
neighbourhood, within a broader framework which ensures respect for civil and
political rights and the implementation of environmental legislation.
Meeting such needs "without compromising the ability of future generations to meet
their own needs" means (WCED, 1987):
� Minimising use or waste of non-renewable resources - including minimising the
consumption of fossil fuels and substituting with renewable sources where feasible.
Also, minimising the waste of scarce mineral resources (reduce use, re-use, recycle,
reclaim).
� Sustainable use of renewable resources - including using freshwater, soils and
forests in ways that ensure a natural rate of recharge.

Chapter 1
8
� Keeping within the absorptive capacity of local and global sinks for wastes –
including the capacity of rivers to break down biodegradable wastes as well as
the capacity of global environmental systems, such as climate, to absorb
greenhouse gases.
Alongside the development of this definition of sustainable development, the World
Commission on Environment and Development (WCED), acknowledged the concept of
‘sustainable livelihood approach (SLA)’ when it first appeared in the report of an
advisory panel of the WCED in 1987 (WCED, 1987). This wider concept of sustainable
development made SLA an important guide for many nations and the international
development communities which is increasingly being adopted in a wide range of fields
(Williams and Millington, 2004).
1.1.2 The concept of the SLA
The most well known definition of a SLA comes from Chambers and Conway (1992)
and a modified version of this definition has been generally adopted, with minor
differences between authors and organisations:
“a livelihood comprises the capabilities, assets (including both material and social
resources) and activities required for a means of living: a livelihood is sustainable which
can cope with and recover from stress and shocks and maintain or enhance its
capabilities and assets….”
“... both now and in the future (Carney, 1998)” or
“... while not undermining the natural base (Scoones, 1998)” or
“….including both these last statements (Farrington et al. 1999)”.

Chapter 1
9
Ellis (2000) in his definition of a ‘livelihood’ has placed more emphasis on the ‘access’
to assets and activities that is influenced by social relations (gender, class, kin, belief
systems) and institutions. He has however, excluded any reference to capabilities or
sustainability. The most well known sustainable livelihood framework has been
documented by DFID (Figure 1.1) (Carney, 1998; Carney, 1999; DFID, 1999).
Assets
The SLA is based on the premise that understanding the asset status of the poor is
fundamental to understanding the options open to them, the strategies they adopt to
attain livelihoods, the outcomes they aspire to and the vulnerability context under which
they operate (Ellis, 2000). DFID distinguishes five categories of assets (or capital) –
natural, social, human, physical and financial (Carney, 1998). In aquaculture, natural
assets include fish species raised; physical capital includes constructed ponds, human
capital includes knowledge of fish culture; financial capital includes income from selling
fish; and social capital includes the use of pond water for washing, bathing etc. by other
community households (Little et al. 2007). An analysis of assets is a review of what
people have (and recognition of what people do not have) rather than an analysis of
needs (Helmore, 1998).

Chapter 1
10
Figure 1.1: Sustainable Livelihoods Framework (source: Adato and Meinzen-Dick, 2002).
Transforming structures and processes
It is important to understand the structures or organisations, and the processes such as
laws, policies, societal norms and incentives. Access, control and use of assets are
influenced by the institutional structures and processes. For instance, in Bangladesh,
earlier aquaculture extension organizations tended to exclude poorer households.
However, recently broader development and effort by promoters appear to be increasing
pond culture as an opportunity for the poorer through enhancing access arrangements
(e.g. sharecropping, lease arrangements etc.) (Little et al. 2007). An understanding of
structures and processes provides the link between the micro (individual, household and
community) and the macro (regional, government and powerful private enterprise) level
(Scoones, 1998; Carney, 1998; Ellis, 2000).
H
P
N F
S
VULNERABILITY CONTEXT
•SHOCKS
•TRENDS
•SEASONALITY
POLICIES INSTITUTIONS PROCESSES
STRUCTURES
•Levels of government
•Private
sector •Laws
•Policy
•Culture
•Intuitions
PROCESSES
LIVELIHOOD OUTCOMES
•More income
•Increased well-being
•Reduced vulnerability
•Improved food security
•Sustainable use of NR base
LIVELIHOOD ASSETS
LIVELIHOOD STRATEGIES
Influence & access
H=Human P=Physical N=Natural F=Financial S=Social
AGRICULTURAL TECHNOLOGIES
IN O
RD
ER
TO
AC
HIE
VE

Chapter 1
11
Livelihood strategies
The term ‘livelihood strategy’ is used to denote the range of combination of activities
and choices that households make in order to achieve their livelihood goals. Livelihood
strategies include: how people combine their income generating activities, the way in
which they use their assets; which assets they chose to invest in; and how they manage
to preserve existing assets and income (DFID, 2000). For instance in aquaculture, both
producer and non-producers carry out versatile activities as part of their livelihood
strategies. At the producer level, integration of pond aquaculture with vegetable
cultivation on the pond dikes using pond water and mud for irrigation and fertilization
respectively has been adopted by poorer households as part of their livelihood strategy in
Bangladesh (Little et al. 2007). Whereas at the non-producer level, fry traders generate
income by trading fish seed from hatchery/nursery to pond farmers (Barman et al. 2002)
and fish traders generate income by trading fish from pond farmers to markets (Faruque,
2007).
Livelihood outcomes
Livelihood outcomes are the achievement or results of livelihood strategies. Outcomes
can be examined in relation to the sustainable use of resource-base, improved food
security, more income; increased well-being; improved social relation and status;
improved dignity and respect; and reduced vulnerability (DFID, 2000). In aquaculture
practice, use of ponds in a sustainable manner, increased fish consumption, additional
income from fish, consumption of fish in the month when fish are less available in
market or from wild sources have been identified as important livelihood outcomes in
Bangladesh (Little et al. 2007).

Chapter 1
12
Vulnerability context
Vulnerability is a key component in the SLA. The vulnerability context refers to the
shocks, trends and seasonality that negatively affect people’s livelihoods. The key
feature of all factors within the vulnerability context is that they are not controllable by
local people in the immediate or medium term. Vulnerability or livelihoods insecurity
resulting from these factors is a constant reality for many people in the world (DFID,
2000). Households however often try to reduce the consequences of vulnerability factors
such as shocks, trends and seasonality. In the case of aquaculture, households were
reported to increase fish consumption from their own ponds to cope with seasonal
shortages wild fish (Karim, 2006).
During the past decade, the SLA has been adopted by a number of government, non-
government and multilateral organisations, such as the DFID, UNDP, OXFAM and
CARE as a basis for natural resource based development and research (DFID, 1999;
UNDP, 1999; NZAID, 2002).
1.1.3 Sustainable natural resource (NR) based development for the poor
About 70% of the MDG targeting poorer people live in rural areas, where their
immediate livelihood benefits can be achieved through the development of agriculture
using existing NR base (e.g. land, waterbodies etc.), which could help the poor to
overcome some of the critical constraints they face in meeting their basic needs
(Rosegrant et al. 2006). In 2000, the member states of the United Nations adopted the
Millennium Declaration as a renewed commitment to human development. The
Declaration includes eight MDGs, each with quantified targets having direct and indirect
linkages with agriculture, to motivate the international community and provide an
accountability mechanism for actions taken to enable millions of poor farmers to
improve their livelihoods. Considering rural communities with their existing ecosystems,

Chapter 1
13
a necessary component in meeting the MDGs by 2015 in many parts of the world is a
more sustainable productive and profitable agricultural sector (Rosegrant et al. 2006).
Among the MDG’s target countries, Bangladesh is the most densely populated country
in the world excluding Singapore (Sen, 2003). Agriculture provides livelihoods to more
than two-thirds of the rural population in Bangladesh (FFYP, 1998). However, due to its
dense population, Bangladesh has one of the lowest land/person ratios (Rasul and Thapa,
2004). Population growth (around 2% annually) further reduces the availability of land
for agriculture by creating increased demand for land for settlements, roads, industry,
and other non-agricultural uses (FAO, 2000a).
There is therefore, a growing emphasis on sustainable agriculture in response to
concerns about the adverse environmental and economic impacts of conventional
agriculture (Hansen, 1996). Sustainable agriculture should be considered from the
perspectives of ecological soundness, economic viability, and social acceptability.
Ecological soundness refers to the preservation and improvement of the natural
environment. Economic viability refers to maintenance of yields and productivity of
plant and animal, and ‘social acceptability’ refers to self-reliance, equality and improved
quality of life (Yunlong and Smith, 1994). The diversity and abundance of literature
written over the years to conceptualize sustainability has formed a consensus on three
basic features. These are: (i) maintenance of environmental quality, (ii) stable plant and
animal productivity, and (iii) social acceptability (Rasul and Thapa, 2004). As an
important part of agriculture, aquaculture development in particular strives to be
sustainable, to all intents and purposes (De Silva, 2001).

Chapter 1
14
1.1.4 Sustainable aquaculture development
The broader definition of aquaculture put forward by Beveridge and Little (2002) based
on the key criteria of i) some form of intervention to increase yield; and ii) either
ownership of stock or controls on access to and benefits accruing from the interventions.
Aquaculture systems may be characterized by their degree of intensity of farming as
intensive, semi-intensive and extensive (Edwards, 1999). Intensive aquaculture systems
depend on relatively high-cost, nutritionally complete diets. In semi-intensive systems
natural food within the system is increased by organic (manures) or inorganic fertilizers
and/or is complemented by usually low-cost supplementary feed. Extensive aquaculture
relies on natural food such as plankton for fish in the culture system without intentional
human intervention (Edwards, 1999b). There have been however, many efforts to create
a conceptual framework for understanding and defining sustainable aquaculture (Wurts,
2000).
A stakeholder survey was conducted by Caffey et al. (1998) in an attempt to develop a
consensus assessment of sustainable aquaculture in the south-western United States.
Respondents were polled to determine measurable indicators of sustainability in three
different areas: sociological, economic and environmental. Sociological interests centred
on employment, local concerns such as residency/ownership and aesthetics, and regional
sources of inputs. Economic issues focused on profitability, market demand and
improved feeding efficiency. Environmental concerns dealt with the quantity of land,
water and energy used; water quality; and effluents (Caffey et al. 1998).

Chapter 1
15
Social and economic aspects
Environmental aspects
Production technology
Sustainable aquaculture systems
Environmental compatible
Socially relevant and profitable
Productive
Figure 1.2: The three inter-related aspects of sustainability of an aquaculture systems: production technology, social and economic aspects, and environmental aspects, source :
AIT (1994).
The semi-intensive and extensive aquaculture have been characterised as rural
aquaculture systems (Edwards, 1999a), which greatly depend on locally adopted
technologies and limited household resources (Edwards and Demaine, 1997).
Sustainability in respect of rural aquaculture, has been expressed schematically (AIT,
1994), where it was considered in terms of three interrelated aspects viz. production
technology, social and economic aspects, and environmental aspects (Figure 1.2).
Definitions of the inter-related aspects required in general for aquaculture technology to
be sustainable in the poor farming households are (AIT, 1994):-
� Production technology – a technology needs to be sufficiently productive for
aquaculture to be an attractive option to possible alternative and/or competing
uses of resources.

Chapter 1
16
� Social and economic aspects – low-unit cost input systems may be most
appropriate for the limited resource base of most poor farming households; and
low production costs mean that fish can be sold at a relatively low market price
and be affordable to poor consumers.
� Environmental aspects – a technology needs to fit into the limited resource base of
the poor, not use resources that may be used more productively in other ways,
and be environmentally friendly.
The basic intents and purposes of this definition of sustainable aquaculture are more or
less similar to those in the definition of sustainable development given by WCED
(1997). It is however, essential that aquaculture not be considered only in narrow
technical aspects, in isolation from crucial social, economic and environmental contexts.
Rather sustainable aquaculture technologies need to be characterised with respect to
their ability to contribute to the improved welfare of the poor in each and every local
situation or context in which they have potential (Edwards, 1999a).
Recent aquaculture research began to assess on the livelihoods of the poor and embrace
non-producers as beneficiaries through the emergence of complex marketing and service
networks (Faruque, 2007). Additionally, benefits of aquaculture may relate to the
integrated use of water rather than simply fish production alone (Prein, 2002; Karim,
2006; Turongruang, 2007). It may also be extended to include the management of
unstocked aquatic animals and food security of poorer households in Asia (Morales,
2007).

Chapter 1
17
1.2 Aquaculture potential for food security and poverty reduction
Poverty is a multidimensional concept, and viewed as pronounced deprivation in
wellbeing (World Bank, 2001). The most common identified causes of poverty in rural
areas are related to living in remote areas and unfavourable agricultural environments,
limited access to transport, power and infrastructure, illiteracy and having very few
agricultural and non agricultural assets (Sen, 2003). The typical means of poverty
reduction emphasise food production, agricultural diversification, creating access and
human development in terms of education, health and nutrition (Sen, 2003).
In spite of continued efforts by development promoters to provide a more stable,
sustainable food supply including provision of an adequate nutritional quality for poorer
people, a great proportion of the population in the developing world still suffers from
chronic under-nutrition and poverty (Ahmed and Lorica, 2002). Agricultural policies in
developing countries, while continuing to focus on ways of increasing supply from
traditional crop farming, have overlooked the role of diversified production,
employment and income generation on farms in achieving food security (Ahmed, 1999).
Recognition is given to the role of balanced nutrition, including critical vitamins and
minerals in the diet, and the need for improvements in sanitation, hygiene and living
environments, which are related to income and purchasing power, rather than just food
production and consumption (Ahmed and Lorica, 2002). Technological development,
the revolution in information and communications and the current trends towards
increasing globalization have created new opportunities and challenges for developing
countries to improve the food security of low-income poorer section of the population
(Pinstrup-Andersen, 1999). Further, the cereals and crop commodity supply perspective
of food security has now changed to include products such as fish and livestock (Ahmed
et al. 1999; Delgado et al. 1999).
Chapter 1
18
Of the different global food production systems, aquaculture is widely perceived as an
important weapon in the global fight against malnutrition and poverty, particularly
within developing countries (Tacon, 2001). Aquaculture is regarded as an important
domestic provider of much needed high quality animal protein and other essential
nutrients (generally at affordable prices to the poorer segments of the community) and/or
a provider of employment opportunities and cash income. In view of these positive
characteristics, that aquaculture has been the world’s fastest growing food production
sector for nearly two decades (Tacon, 2001) and over this time scale the relative
contribution of aquatic products to global animal production has increased. Aquaculture
production in the developing countries has been growing more than five times as fast as
in developed countries since 1984 (FAO, 2000c). Between 1990 and 2000, the annual
growth rate in aquaculture was 11.4%, compared to 4.9% for poultry, 2.5% for pork and
0.5% for beef (FAO, 2004), and it is expected that this trend will continue over the
coming decades (Ahmed and Lorica, 2002).
Continued growth in the aquaculture sector has also resulted in an increasing
contribution to total world fishery production, which historically has been dominated by
capture fisheries (New, 1999). Estimates for 2003 showed a total aquaculture production
(excluding seaweed) of 41.9 million tons, constituting about 31.69 % of total world
fishery production, compared with 30.6 million tons (25.88%) in 1998 (FAO, 2005). Of
global aquaculture production, 15.54 million tons (37%) originated from freshwater of
which the major share (42%) was Chinese and Indian carp species (FAO, 2005).
In most of the low-income food deficit countries finfish aquaculture production is based
on the culture of low-value herbivorous/omnivorous freshwater finfish in inland rural
communities, within semi-intensive or extensive farming systems that use moderate to
low levels of production inputs. These systems produce large quantities of affordable
Chapter 1
19
food-fish for home consumption and purchase by low income people in domestic
markets (Tacon, 2001; FAO, 1996). In 1998, nearly 90% of the total world aquaculture
production came from developing countries, mainly from low-income food deficit
countries, with China as the world leader contributing two-thirds of world production
(Tacon, 2001). The share of aquaculture in total fisheries production has likewise grown
in low-income food deficit countries, especially against the backdrop of over-fishing and
declining productivity from capture fisheries.
A steady growth in the production of fish species grown on agricultural farms in low-
income food deficit countries and consumed domestically has occurred (FAO, 1996;
New, 1999; Laureti, 1998). Thus, considerable adoption of aquaculture on traditional
agricultural farms in a number of countries, such as Bangladesh, China, India, Indonesia,
Thailand and Vietnam, have shown some early signs of aquaculture’s ability to improve
productivity and food security, contribute to the diversification of farm operations,
poverty reduction, and create additional employment and income (Ahmed and Lorica,
2002). The linkages between the traditional and cultural consumption habit of fish-based
diet, declining wild stocks of fish and increasing year round demand and supply of low
priced cultured fish (e.g. tilapia culture in Thailand) has reinforced the importance of
aquaculture for the poor in developing countries (Belton et al. 2007).
1.2.1 Aquaculture development in Bangladesh
The People’s Republic of Bangladesh, a unitary, independent and sovereign country
only since 1971, was under Muslim rule for five and half centuries prior to the onset of
British rule in 1757. During the British rule it was a part of the British Indian province
of Bengal and Assam. In August, 1947 the land of Bangladesh gained independence
from the British rule as East Pakistan (BBS, 2003a). Finally Bangladesh emerged as an
independent country on March 26, 1971 after a civil war of liberation with Pakistan.

Chapter 1
20
With a total land area of 147,570 km2, Bangladesh has a large population (123.1 million;
2001 census), with high population density (about 834 persons per km2), low per capita
arable land (0.06 ha low per person) and low per capita income (US$ 461 per year)
(BBS, 2003a). The growth rate of the population has been lowered dramatically from
about 3.0% in 1960s to 2.4% in 1980s, then sharply to 1.5% in 1990s through the
adoption of a National Family Planning programme (Hossain et al. 2005). The current
and expected population however are exceedingly high and the increasing number of
poor and functionally landless (Hossain et al. 2005) are expected to increase faster in the
near future than anywhere else in the world.
Agriculture (including aquaculture and capture fisheries) is a major contributor to the
economy of Bangladesh, accounting for 22 % of GDP (BBS, 2003a). Aquaculture and
capture fisheries make up 24% of agriculture and 5% of GDP (DoF, 2005). Fish and
fisheries have been an integral part of the life of the people of Bangladesh from time
immemorial, and play a major role in employment, nutrition, foreign exchange earnings
and other aspects of the economy (Alam and Thompson, 2001). The fisheries sector
provides full-time employment to an estimated 2 million fishers, small fish traders, fish
transporters and packers, etc. and another 10 million people are partly dependent on
fishing, e.g. part-time fishing for family subsistence (DoF, 2005). Fish is a natural
complement to rice in the national diet, and fish alone supplies about 63% of average
animal protein intake, hence giving rise to the adage mache-bhate bangali, a Bangali is
made of fish and rice (DoF, 2005).
In terms of fisheries resources, the country is very rich in inland water for fish
production, being the delta of three major river systems, i.e. the Ganges, Brahmaputra
and Meghna. Altogether, a total of 230 large and small rivers (BBS, 2003a) with their
tributaries and branches criss-cross the country, with extensive floodplains along their

Chapter 1
21
banks. The estimated total floodplain area is 6.3 million ha, of which 0.8 million ha have
been permanently dried through flood protection measures. The balance of 5.5 million
ha (MPO, 1989) is inundated at various depths ranging from very shallow (0–30 cm) to
deeply flooded (more than 1.8 m) during the monsoon season. Additionally, recent
expansion of aquaculture through private initiatives, as ad hoc development often for
pond construction and rice production have reduced the area of permanent and
seasonally flooded land. The estimated total area of freshwater pond is 230,000 ha which
contributes the major portion of culture fisheries. Other fisheries resources include
oxbow lakes (5488 ha), Kaptai lake (68,800 ha), road side ditches, borrowpits and
irrigation canal (500,000 ha).
There are about 300 freshwater species (260 indigenous fish, 12 exotic fish and 24
prawn species) available in Bangladesh (DoF, 2005) of which only a limited number of
species are cultured. In 2004, the major bulk (about 80%) of fish production was derived
from inland fisheries of which a declining share (45%) was from capture fisheries. The
remaining 55% of inland production was derived from culture fisheries based on 16
species of Indian and exotic major carps, catfish and tilapia (DoF, 2005), indicating the
increasing importance of aquaculture in food supply.
The distinctive characteristic of aquaculture compared to capture fisheries is that, the
growth potential of aquaculture primarily depends on a greater control over seed. In
semi-intensive carp polyculture, which still dominates aquaculture in Bangladesh,
stocking of fingerlings has been identified as the major input cost per ha production
(Alam, 2002). It was also stressed by Mazid (2002) that poor access and cost of quality
seed is the single largest limitation to aquaculture in Bangladesh. Moreover, it was
realised that inadequate supply of fingerlings with respect to both quality and quality is

Chapter 1
22
constraining many pond fish producers in Bangladesh (Alam, 2002; Brown, 2003; Little
et al. 2005) .
1.2.2 Context of fish seed in Bangladesh
Before the development of fish seed producing hatcheries in Bangladesh in the 1960’s
following successful artificial breeding of Indian major and Chinese carps, farmers
relied on wild seed to culture fish. Until the 1980’s approximately 95% of fish spawn
was collected from natural sources (Figure 1.3), currently more than 98% of spawn is
produced in the hatcheries (DoF, 2005). Private centralised hatcheries developed in
clusters are the main producers of fish seed meeting the major requirement of farmers
supplying seed through a complex network of nursery operator and fry traders (ADB,
2005). Increasingly networks of private hatchery producers and traders are dominating
the supply of fish seed to the farmers however, poor quality seed, caused by poor genetic
management of breeders and accidental hybridization is a common emerging constraint
(ADB, 2005). The possible underlying genetic and non-genetic causes responsible for
gradual deterioration in yields and individual size of many species of cultured fish were
identified (Morrice, 1995). Poor husbandry of fish seed during nursing, holding or
transportation is believed to negatively affect their later performance in Northwest
Bangladesh (Morrice, 1995).

Chapter 1
23
Hatchery source
Wild source
1980
1981
1982
1983
1984
1985
1986
1987
1988
1989
1990
1991
1992
1993
1994
1995
1996
1997
1998
1999
2000
2001
2002
2003
2004
Year of production
0
100
200
300
Am
ount of fry
pro
duct
ion (T
on)
Figure 1.3: Comparative production of fish fry from wild and hatchery over the last two decades in Bangladesh (FRSS, 2003-2004).
A survey on the existing methodology of fry/fingerling production in Bangladesh was
conducted by an FAO/UNDP project in 1990. This survey revealed that the production
technology was characterized by overstocking of nursery ponds, inadequate pond-
preparation, improper manuring and fertilization and use poor quality feed. Also,
intermittent thinning of the fry population and unnecessarily prolonging the production
cycle were common features in nursery practices (FAO, 1992). Low survival, slow
growth, low production of biomass, unnecessary wastage of fry resource and fertilizer,
and low profit margin are the inevitable results of inadequate nursery management
systems (FAO, 1992). A previous study however, revealed that some large hatcheries
have the capacity to satisfy their customers with a supply of good quality hatchlings
(Barman et al. 2002).

Chapter 1
24
The single most important indicator of ‘quality’ of fish seed is the size of juvenile fish
that could be supplied to foodfish producing farmers. A larger seed will survive better
and grow faster to marketable size than a smaller seed produced under the same
conditions (Little et al. 2005). The supply of large size fingerlings for stocking in
different types of waterbodies is increasingly being emphasised by policy makers and
promoting organizations (Rahman, Undated) as the success of aquaculture operations
greatly depends on survival which can be ensured by stocking of large fingerlings. For
instance, the Department of Fisheries (DoF), Bangladesh, in collaboration with Non-
Government Organization (NGOs) implemented the New Fisheries Management Policy
(NFMP) and later Improved Management of Openwater Fisheries (IMOF) to enhance
the production of open waterbodies involving the poor with the expectation of improved
livelihoods, but the target was constrained by the irregular supply of fingerlings (Lewis,
1997). As a result, the timely and adequate supply of good quality seed has been a
precondition in all regions, both for scaling up production and adoption of aquaculture
by new entrants (World Bank, 2006). Realising the context of fish seed supply,
strategies to decentralize fish seed/fingerling production at the farming household level
have been emphasised to ensure the availability of quality fish seed (Little et al. 1999).
1.3 The concept of decentralised fish seed production
The classical concept of decentralisation has a long tradition in political science and is
concerned with the extent to which power and authority should be dispersed through the
geographical hierarchy of the state, and the institutions and processes through which
such dispersal occurs (Smith, 1985). In an organizational management context, the term
‘decentralisation’ implies more autonomy, whereby authority is vested in those further
removed from the centre, while conversely ‘centralised’ implies the authority to make
important decisions lies toward the ‘head’(Cummings, 1995). The policies of
decentralisation are currently used in a number of different countries in a number of
Chapter 1
25
different ways and contexts (Samoff, 1990). In terms of Bangladesh Government policy,
it is argued that decentralisation is a more efficient way of meeting the needs of local
poor, moreover decentralisation can cut red tape and make government and
administration more flexible, accountable and responsive by bringing government closer
to the people (Westergaard and Alam, 1995).
Outside of the political arena a decentralised approach is effectively being used to
deliver healthcare building satellite clinics (Habib et al. 2000) and to provide electricity
facilities through photovoltaic systems (Biswas et al. 2004) in the remote and peripheral
areas of Bangladesh. The concept of a decentralised approach does however have some
limitations. For instance under a decentralised local government in Bangladesh, local
resources (e.g. state own waterbodies) were reportedly controlled and exploited by elites
or political factions (Westergaard and Alam, 1995).
As with the classical concept of decentralisation, fish seed production at the farmer level
has been regarded as a strategy for the decentralization of fish seed production (Little et
al. 2005). Decentralised or farmer level fish seed production can be accomplished in two
ways i) through conventional earthen pond nursing; and ii) alternative methods of
spawning and nursing of fish seed that generally require a lower level of investment. As
an alternative method which is ‘less ‘risky’, a smaller-scale and promising approach is
spawning and nursing of small fry in irrigated ricefields (Little et al. 2005). In Indonesia,
with limited nursery capabilities, the potential of using ricefields quickly became evident
and ricefish farming for fingerling production became popular among rice farmers
(Halwart, 1998). In ricefield based decentralised fish seed production system, most
success has been achieved to date using small carp and tilapia (AIT Aqua Outreach,
1997; Gregory et al. 1997; Barman and Little, 2006).

Chapter 1
26
1.3.1 Potential of ricefield for fish seed production
‘There is rice in the fields, fish in the water’. This sentence inscribed on a stone tablet
from the Sukhothai period – a Thai Kingdom that flourished 700 years ago - depicts a
scene of an idyllic value (Schuster, 1955). Since long ago, in flooded ricefields, living
aquatic resources such as fish, freshwater prawns and crabs, snails, mussels and frogs
occur naturally. These were regularly caught or collected and have played an important
role in the diet of rural farming households in many parts of Asia (Prein, 2002).
Before the intensification of agriculture in Bangladesh, traditionally rural farmers
captured wild fish that entered the rice fields through flooding by excavation of a sump
in the low-lying area of their farms (Gupta et al. 2002). There were concerns that
intensification of rice cropping was adversely affecting the ecology of rice fields
(Pingali, 1992). With the use of pesticides and larger amounts of inorganic fertilisers, the
natural occurrence of these living aquatic resources has been reduced considerably
(Prein, 2002). The decline in wild stocks, coupled with increasing demand for fish,
elicited special attention from researchers in 1970s and 1980s (Gupta et al. 2002).
Hence, there has been a move towards diversification out of rice monoculture (Pingali,
1992). In this regard, it was suggested that the area under rice cultivation will have to
accommodate crop diversification in Bangladesh as demand for other food items
increases rapidly as a result of urbanization and a spectacular growth in per capita
incomes since the mid 1980s (Hossain et al. 2006). This leads to renewed interest in
research and development on alternatives to rice monoculture. One of these is the age-
old practice of integrating fish culture with rice farming (Gupta et al. 2002).
Stocking and culture of fish in ricefields has a long history (Guan and Chen, 1989)
which can be traced back to the Eastern Han Dynasty (25-222 AD) in China (Li, 1992)
with numerous designs and experiences in experimentation and implementation (dela
Chapter 1
27
Cruz, 1994; Cai et al. 1995; Halwart and Gupta, 2004). In some societies selected
species of fish, molluscs and crustaceans have been stocked intentionally to augment the
availability and production of protein from ricefields. In floodplain conditions, trap
ponds in ricefields, in which wild fish are concentrated in the dry season, have been used
to extend the holding period of fish with modest feeding (e.g. rice bran) in order to avoid
a bulk harvest (Guttman, 1999). This is characterised as an intermediate system of
managing non-stocked aquatic animals contributing to rural livelihoods (Islam, 2007).
The ricefish system functions through the feeding of fish on organisms (particularly
insects and other possible rice pests) and weeds, and the stirring of the sediment through
their foraging action which leads to nutrient re-suspension (Lightfoot et al. 1993). In
ricefield systems it has also been frequently observed that rice yields increase through
the inclusion of fish (dela Cruz et al. 1992; Cai et al. 1995). As the price of rice has
fallen considerably in recent decades, the value of the produced fish can be higher than
that of the crop and, thereby, of great importance for additional cash generation by
farmers (Prein, 2002). The benefits of ricefish culture as a low-investment entry-level
technology for resource-poor farmers has been demonstrated in Bangladesh (Gupta et al.
1996), Indonesia (IIRR/ICLARM, 1992; Purba, 1998), the Philippines (IIRR/ICLARM,
1992; Horstkotte-Wesseler, 1999) and Vietnam (Rothuis, 1998). Research initiatives
over the years indicate a range of variability in the productivity of ricefields for fish
(Table 1.1).

Chapter 1
28
Table 1.1: Ricefield productivity for aquatic animals in wild and cultured condition in different countries
Means of production
Countries Production Sources
Thailand 208kg/ha (Middendorp, 1992) Malaysia 175kg/ha (Ali, 1990) Wild captured Bangladesh 37kg/ha (Anonymous, 1985)
China 2.5t/ha (Li, 1992) India 2t/ha (Ghosh, 1992) Indonesia 805kg/ha (Koesoemadinata and Costa-Pierce,
1992) Vietnam 2.2t/ha (Quyen et al. 1992) Thailand 900kg/ha (Fedoruk and Leelapatra, 1992) Bangladesh 980kg/ha (Ali et al. 1993) Bangladesh 271kg/ha (Haroon and Pittman, 1997)
Culture intensification
Bangladesh 742Kg/ha (Frei et al. 2007)
Although ricefields have shown potential for fish production, several studies suggest that
the lack of availability of fish seed when required is one of the major constraining
factors to promote ricefish cultivation (Waibel, 1992; Gupta et al. 1996; Halwart, 1998;
Edwards, 1999b). Over the last decade however, irrigated ricefields have evolved as a
potential system of fish fingerling production in the Northwest region of Bangladesh
(Barman and Little, 2006).
1.3.2 Present context of irrigated ricefields
Rice is cultivated in approximately 147 million ha worldwide, which roughly
corresponds to the combined land area of Portugal, Spain, France and Germany (Frei
and Becker, 2005). Almost 90% of this areas lies in Asian countries, most of which are
under considerable population pressure (Figure 1.4). Currently, the highest yields per ha
obtained are in the sub-tropical regions, e.g., Egypt, southern United States, Australia,
Southern Europe and Japan, where rice production is highly mechanized and fully
irrigated (Frei and Becker, 2005).

Chapter 1
29
Figure 1.4: The most important rice producing countries as characterized by their irrigation development, adapted from MacLean et al. (2002).
Production pressure on land was reportedly increasing rapidly in developing countries in
Asia that rely heavily on rice production, such as Bangladesh. Population density is
projected to rise by more than 80% in Bangladesh by 2050 (United Nations, 2002). To
meet the projected increase in food demand, agriculture productivity will have to
increase (Frei and Becker, 2005) and the use of agricultural land will be further
intensified (Jenkins, 2003).
Traditionally, Bangladeshi farmers grew their main annual rice crop in autumn (amon, in
lowland fields), and summer (aus, in upland areas), along with secondary winter crops
of pulses, wheat, oilseeds, and other minor grains. Boro (irrigated spring rice) rice did
not constitute a major proportion of the overall rice harvest. However, over the past few
decades improved varieties of boro rice have become the dominant winter crop in
Bangladesh (Oakley and Momsen, 2005).
Bangladesh

Chapter 1
30
The main factor making boro rice the dominant crop is increased and easy access of
farmers to irrigation throughout the country (Hossain et al. 2006). The rapid expansion
of irrigation began in the early 1980s with the promotion, under the private sector, of
small capacity shallow tube-wells for ground water irrigation. Beginning in 1986, the
government removed the ban on private sector imports of agriculture equipment and
easy availability of spare parts, and reduced import duties on agricultural machinery.
Those led to a substantial reduction in the cost of tubewells and development of a market
for irrigation services which contributed to the large expansion of irrigation in the
1990’s (Mandal, 1980; Hossain et al. 2002). Ground water irrigation now accounts for
nearly three-fourths of the total irrigated area in Bangladesh (GOB, 2002). In particular,
65% of the area planted to boro rice is operated through the expansion of minor
irrigation through shallow tube-wells and power pumps (Hossain et al. 2006).
1.3.3 Decentralised fish seed production in irrigated ricefields: an overview
The production of fish fingerlings in irrigated ricefields by farmers rather than in
specialised geographically clustered hatchery and nursery enterprises can be termed as a
form of decentralised fish seed production. Indeed, stocking eggs of common carp,
broodstock of tilapia and hatchery produced fry in ricefields is the approach used in the
decentralised fish fingerling production system (Little pers. com., 2004). Fish
seed/fingerling production in irrigated ricefield based systems has taken a new direction
over the last 1990s in Bangladesh.
Initially through the initiative of Northwest Fisheries Extension Project (NFEP) in 1991,
forty farmers from four tubewell schemes in Northwest Bangladesh were willing to
attempt rice-field culture in their ricefields during the boro rice crop. Encouraging
results from these farmers led to an expansion of activities in 1992, when Cooperative
American Relief for Everywhere (CARE) promoted fingerling production of common

Chapter 1
31
carp in irrigated ricefields at the farmer level (Gregory and Kamp, 1999b). CARE
initiated the use of locally produced common carp eggs in irrigated ricefields to produce
fingerlings through its Integrated Rice Fish (Interfish) project with the funding support
from the Department for International Development (DFID), UK. Although this
approach was used initially as a tool for integrated pest management (IPM) techniques,
it later showed its potential for fish seed production. Emphasising the potential of
ricefields for fish seed production technology, such promotion was further extended
from 2000 to 2005 by CARE with continuous support from DFID through its Greater
Opportunities for Integrated Rice Fish (Go-Interfish) project (Barman et al. 2004). The
CARE’s Go-Interfish project together with its 45 partner NGOs, disseminated this
technology along with broader livelihood improvement programmes for poorer
households in the Northwest region of Bangladesh in Dinajpur, Thakurgaon, Panchagar,
Rangpur, Nilphamari, Kurigram, Lalmonirhat, Gaibandha, and Joypurhat districts
(CARE, 2006). Initially, the practice of fish seed production in the ricefield based
systems was developed at the rural household level using common carp eggs collected
using water hyacinth from their own or neighbouring household ponds in winter
(December to February) and stocked in irrigated ricefields to produce fingerlings.
Thereafter, seed production of an improved tilapia strain (GIFT) in ricefields, supported
by a DFID-NFEP research project, was piloted in two communities within CARE-
Interfish project areas of Rangpur district in 1999. The use of tilapia in which a small
number of broodfish were stocked in ricefields was evaluated as a potentially
complementary seed production strategy to the ongoing production of common carp
seed (Barman, 2000). CARE later disseminated both common carp and tilapia seed
production in its new Go-Interfish areas in Northwest Bangladesh. In addition, some
farmers who had the ability to purchase riverine carp fry stocked them along with
common carp and tilapia in the same ricefields to produce fingerlings (Barman et al.
2004).

Chapter 1
32
The impacts of ricefield based seed production on households’ livelihoods could occur
in several ways. Lack of availability of cash input is an obstacle for many poor farmers
and their livelihoods (DFID, 2004). The bulk of their income typically comes only after
rice harvest and many farmers do not have sufficient access to credit, savings or
remittances to finance the costs of inputs such as seed and fertilizer (DFID, 2005). In
order to minimize input costs of fish culture, fingerlings produced in decentralised
systems could be stocked in household’s own ponds (Barman and Little, 2006; Little et
al. 1999).
Sustainable agriculture technology seeks to minimize the dependency on external inputs.
The high dependency on external inputs increases farmer’s vulnerability to reduced
profits, as they have no control over supply and price of inputs (Ikerd, 1993; Pretty,
1995; Altieri, 2000). Thus, sustainable agriculture tends to be about low-input farming
which can contribute to growth and poverty reduction (DFID, 2005). An efficient
aquaculture system requiring fewer inputs and producing wider benefits and fewer
wastes could be expected to be more sustainable (Muir, 2005). Decentralised common
carp and tilapia fingerling production in ricefields is less likely to be ‘competitive’ with
centralised hatchery based seed production as centralised hatchery/nursery based seed
production is dominated by riverine carps and catfish (Barman et al. 2004). As the
fingerlings produced are large in size, it might be expected that they some could also
contribute directly to enhanced food security through direct consumption (Barman and
Little, 2006). In decentralised systems, tilapia fingerlings could be produced as well as
foodfish over a longer period of time, potentially alleviating seasonal malnutrition
through filling the seasonal hungry gap of farming households (Gill, 1991).
Fingerling production in irrigated ricefields is relatively extensive and low input, thus
pressures to intensify with the consequent negative impacts on quality are low.

Chapter 1
33
Therefore, the fingerlings tend to be healthy and more predator resistant and they are
easy to identify and less likely to have suffered physical damage as a result of transport
over long distances (Little et al. 1999). Through decentralised fish seed production
systems, employment and income generation would be localised and the monopolistic
tendencies that lower returns and increase risk for poorer workers in the existing fish
seed networks be reduced (Little et al. 1999). Fingerlings could be readily marketed in
the localities though direct involvement of fry traders and food fish producers (Barman
and Little, 2006) which in turn could overcome the major quality issues for rural
foodfish producers. Moreover, marketing of locally produced fish seed can stimulate and
support local people to incorporate fish culture within their livelihood systems (Little et
al. 2002b). As the movement of women is culturally restricted in Bangladesh, it is quite
difficult for them to travel to distant areas to purchase necessary inputs like fertilizers,
fingerlings and feed that are required for fish culture (Shelly and Costa, 2001).
Household level fish seed production could potentially encourage women to be involved
in aquaculture (Barman et al. 2004).
A previous study showed that better-off farmers tended to adopt ricefish technology
(Gupta et al. 2002). However, during the development of ricefield based fish seed
production (RBFSP), the strategy of the promoters was to emphasise the involvement of
poorer households into their intervention from the onset (Banu and Bode, 2002; Barman
and Little, 2006). In irrigated ricefields seed production tends to be carried out with the
minimum expenditure as it does not require many external inputs. Such a poverty
focused approach along with the low cost nature of this technology appears to stimulate
adoption the technology by poorer households (Barman and Little, 2006). However
these earlier studies showed few insights into the reasons for adoption of this
technology. Reasons responsible for non-adoption identified were water scarcity, time
competition with off-farm activities and other agricultural activities (Barman et al.
Chapter 1
34
2004). Adoption of RBFSP has also been reported to minimize and eliminate the use of
pesticides in ricefields (Gregory and Kamp, 1999b; CARE, 2001a; Barman and Little,
2006). In terms of water uses for human food production in terrestrial and aquatic
environment, aquatic food production requires a much higher volume of water compared
to terrestrial food production (Verdegem et al. 2006). Adoption of fingerling production
in irrigated ricefields could maximize the utility of irrigated groundwater.
Initially, this technology was promoted by the CARE Interfish project through farmer
participatory action learning process with their groups within deep tube-well irrigation
schemes. Shortly after that CARE Interfish and Go-Interfish projects adopted a farmer
field school approach to disseminate ricefield RBFSP technology. Farmer field schools
(FFS) were adopted as a participatory experimental learning process delivering hands-on
training to attract and facilitate both illiterate and literate farmers and to keep them
interested in a range of innovative ricefield management practices. In FFS curricula,
ricefield based fish seed production was only one of several low-input approaches
promoted (CARE, 2001a).
In ricefield based decentralised seed production system, an initial institutional support to
farmers for providing training and supply of quality strain of broodfish of common carp
and tilapia is important (Barman et al. 2004). This is because the quality of tilapia could
deteriorate after several generations through negative selection and genetic introgression
through contamination with local tilapia (Macaranas et al. 1986). Quality deterioration
of tilapia in terms of growth has been perceived by some community farmers in
Northwest Bangladesh (Barman et al. 2004). This indicates a potential need for external
institutional support to provide farmers with initial training on this technology and
quality germplasm in new areas as well as to replace the germplasm in areas where the
species are already established.

Chapter 1
35
The literature reviewed regarding local level fish seed production has shown few
insights into its impacts on farming households or especially its impacts on the wider
community, its adoption process and need for institutional support. In order to better
understand these broader impacts of decentralised fish seed production, a project based
investigation was carried out.
1.4 Justification of the study
Achieving benefits from agriculture across MDG targeted countries, ensuring the supply
of basic inputs such as seed and fertilizer have been heavily emphasised by the member
states of the United Nations (Rosegrant et al. 2006). As aquaculture is an important and
fast growing part of agriculture, the agenda of ensuring and strengthening seed supply to
aquaculture at the farmer level deserves similar attention.
Initially riverine hatchlings were the main source of seed in Northwest Bangladesh as in
other parts of the country. In the 1980s, hatchlings were produced and supplied from
hatcheries in Jessore in Southwest Bangladesh over 100 miles away from the Northwest
region. In recent times, a small number of government and private hatcheries have
started to supply fish seed to the region and a large amount of seed is supplied from
Adamdighi in Bogra district located in the southern part of the Northwest region. Most
hatcheries are small or medium in size, compared to hatcheries located in districts
further north that all are small. The number of nurseries in the region has increased as
demand for fingerlings has increased. Between 70-100 million fingerlings however,
were imported from outside the region in 2002 (Barman et al. 2002) which indicates the
increasing demand for fish fingerlings that exists. In this context, decentralised fish seed
production has developed rapidly in ricefield based systems. This relatively new model
for seed supply in aquaculture certainly deserves holistic investigation.

Chapter 1
36
The poverty related questions remain important for any future targeted aquaculture
development strategy in Bangladesh (Lewis, 1997). Conventional approaches to the
development and dissemination of aquaculture technologies have failed to have major
impacts on the poor (Edwards, 1999b). This study was designed to understand the
impacts of this technology on the poorer sections of the communities in rural areas by
identifying households according to their well-being status to understand to what extent
this technology fitted with the need and resources of poorer households. As a major
proportion of people live in rural areas, a significant section of them remain vulnerable
to food security (Hossain et al. 2005). This study also explored potential seasonal
impacts of this technology on the livelihood systems of the farming households.
Aquaculture has often been narrowly viewed as intensive farming, adopted mainly by
relatively wealthy farmers to provide high value products for export (Philips et al. 1993).
The narrow view of aquaculture development hides the potential of fish farming,
particularly in the context of rural livelihood development (ADB, 2005). There is a need
to view aquaculture within the wider context of roles and relationships within which it
takes place. A poverty focused approach to aquaculture will need to consider other
participants, or ‘actors’ in the network of aquaculture activities. Such categories include
the fish seed traders who traditionally supply village ponds, and the fishermen who are
traditionally hired by pond owners to harvest their pond on a share cropping basis
(Lewis, 1997). In particular, fish seed traders are the last and most critical actors in the
complex network linking sources of seed producers and foodfish producers – the
ultimate users of seed (ADB, 2005). Addressing such linkages and coalitions is
becoming increasingly important in natural resource based research and development
(Biggs and Matsaert, 2004). This study comprehensively attempts to investigate how this
technology impacts on the broader network of actors towards livelihoods improvement
beyond the seed producing farmers.

Chapter 1
37
Questions of agricultural technology adoption lie at the heart of economists’
longstanding concerns over economic growth and poverty reduction (Moser and Barrett,
2006). Adoption of agricultural technology is directly linked to livelihoods of the poor
around the world. Thousands of studies have been carried out across the globe seeking
answers to why and how people come to adopt, or not, new agricultural technologies and
practices (Leeuwis and van den Ban, 2004). Most of the studies however, used
instrumental variables (e.g. econometric model) looking at a few household
characteristics but were unable to unpack the adoption process of technology as a whole
(Leeuwis and van den Ban, 2004). In this context, there was a need for a comprehensive
understanding of the adoption process of RBFSP technology. A non-instrumental
participatory approach was applied to understand the causal reasons behind the adoption
and rejection process of this technology in farming households.
This technology has been developed and promoted in a participatory way through the
involvement of farmers and promoting organizations provided with improved quality
tilapia germplasm. Introduction and maintenance of the genetic quality of fish within
decentralised systems requires some continued linkages to the networks of promoters
(Little et al. 2007). Institutional mechanisms for promotion of this technology require
grass roots level capacity (Little et al. 2007). Therefore, the process of technological
dissemination needs to be addressed in terms of cost and effectiveness of different
promoting mechanisms and their sustainability. Considering the above circumstances of
decentralised fish seed production technology, this research was designed based on the
following hypotheses and objectives.

Chapter 1
38
1.4.1 Research hypotheses and objectives
The working hypotheses and objectives of the research are presented in the following
Table 1.2.
Table 1.2: Research hypotheses and objectives
Working hypotheses Objectives
The asset profiles of RBFSP adopters are the same as non-adopter households of different levels of well-being
To assess the livelihood impacts of rice-field based fish seed production strategies on the adopting farming households compared to non-adopting households in the Northwest Bangladesh.
Seasonal changes may cause variation in livelihood outcomes of farming households by well-being and farmer type and these are affected by adoption of RBFSP
To assess the affect of seasonality combined with other household characteristics on the livelihoods strategies such as household level activities, food consumption, income, expenditure, health etc. in both adopting and non-adopting households.
RBFSP benefits other actors such as fry traders, pondfish producers and other beneficiaries within seed production and marketing network
To assess impacts of rice-field based fish seed production on a broader-scale and among a range of actors from seed producers, fingerlings traders, food fish producers, consumers etc.
Adoption of RBFSP can be sustained by farming households
To analyze the process of adoption, adaptation and rejection of rice-field fish seed production strategies among farming households.
FFS promoting RBFSP delivery is the most cost-effective approach to achieving positive impacts through aquaculture
To determine the cost effectiveness of different approaches to extension of RBFSP in farming households.
1.4.2 Outline of the thesis
This dissertation is organised into eight chapters including this introduction –Chapter 1.
This chapter inaugurates the present context of aquaculture ranging from a national to
global level in relation to fish seed production based on development concept towards
livelihoods impacts of the poor. This chapter discusses the inadequacies of fish seed
production and supply in Bangladesh and other Asian countries impeding widespread
Chapter 1
39
involvement of the poor in fish culture. A review of the relationship between ricefields
and fish culture then strategies for RBFSP is provided with the recent evidence of its
livelihoods impacts on poorer farming households.
Chapter 2 discusses the process of the whole study including an introduction to the
different types of methodologies used. Based on the sustainable livelihood approach
relating to participatory research, the methodologies consisted of both quantitative and
qualitative investigation and analysis of data/information. Investigation and analysis
were carried out at different levels ranging from micro to macro level e.g. household,
community, institutions etc. Details not relevant to an overview of methods used were
included within specific chapters.
Chapter 3 provides a snap-shot of the current livelihood condition of 118 households in
20 communities in 4 districts of the Northwest Bangladesh. This information was
collected through well-being analyses of farming households at the community level
based on participatory methods and then through in-depth questionnaire surveys. This
chapter attempts to understand impacts of RBFSP on adopting households as compared
to non-adopting households in view of the household’s well-being status.
Chapter 4 explores the seasonal dimensions of livelihoods of the farming households
investigated in Chapter 3 based on a longitudinal survey. This Chapter describes the
affects of seasonality on livelihood strategies including various household level
activities, food consumption, income, expenditure and health condition. This chapter
explains how RBFSP impacts on fish consumption and income in different seasons
among poorer farming households.
Chapter 5 explores the potential benefits to a range of actors through quantitative and
qualitative investigations including focus group discussion, survey, case studies etc.

Chapter 1
40
Livelihoods benefits were investigated among different types of actors such as
producing households, fry traders, fishers, neighbours, relatives, markets, NGOs etc.
Chapter 6 describes the process of adoption, adaptation and rejection of RBFSP among
farming households. The study did not use a conventional instrumental procedure for
adoption studies, but rather used a qualitative approach based on a semi-structured and
mostly open-ended survey tool with respondents aggregated by type of households and
gender in seed producing communities. The types of households investigated in this
study were primary adopting households, secondary adopting households, households
who had never adopted, households who adopted initially and then rejected, households
who had adopted for several years after withdrawal of CARE support and then rejected.
The perceptions of women regarding RBFSP were assessed in a specific exercise with
women in adopting households and women in non-adopting households. The
investigation with different types of household allowed the assessment of complex
socio-cultural processes responsible for adoption, adaptation and rejection of RBFSP in
farming households in the Northwest Bangladesh.
Chapter 7 attempts to determine the cost-effectiveness of dissemination strategies of
RBFSP technology at the farmer level. In this chapter, extension strategies of CARE and
its different approaches to development were examined comparing centralised hatchery
based seed production based on primary and secondary data. The sustainability of a
partner NGO’s extension strategy based on the approach of farmer field schools has also
been examined.
Chapter 8 discusses the results from each chapter in an overall livelihood context of
farming households. Special emphasis was given to explore the asset-bases of
households, seasonal impacts of RBFSP on households, broader scale impacts on other

Chapter 1
41
actors, the adoption and rejection process of this technology and cost-effectiveness of
RBFSP delivery mechanisms at the farmer level. Potential implications of the findings
for future interventions are discussed and, where appropriate, recommendations made.

Chapter 2
42
Chapter 2: General methodology
2.1 Introduction
A research methodology is a system of explicit process on which research is based
against which claims for knowledge are evaluated (Nachmias-Frankfort and Nachmias,
1996). The methodological processes of the research are continuously being improved;
scientists look for new means of observation, analysis, logical inference and
generalisation (Nachmias-Frankfort and Nachmias, 1996). A major function of any
methodological process used in research is to facilitate communication between
researchers and other audiences who either have shared or want to share a common
experience.
This chapter describes the methodological process followed to achieve the objectives of
the study. Firstly, it describes the conceptual framework of methodological process,
mode of investigation and general background of the study area. Secondly, it presents an
overview of steps followed in individual chapters with their study design, sampling
procedure and tools and procedures of data collection. Finally, this chapter presents
techniques of data management, data analysis and triangulation and validation of the key
findings.
2.1.1 Conceptual framerowrk of methodological process
The sustainable livelihood approach (SLA) was used as the main foundation in this
research investigation. The SLA recognises diverse livelihood strategies, it can be
multilevel, household, community, regional or national as well as dynamic (Singh and
Gilman, 1999). It provides a framework for policy makers, which focuses on poverty
within the contexts of the people who are poor, and on the processes that underlie
poverty. For consultants who operate in the field of development, the SLA represents a

Chapter 2
43
framework for the formulation of development projects that focus on the people being
affected by the project and the variety of ways in which they might be affected. For
social scientists, the SLA provides a framework for a holistic interpretation of the
dynamics of development and the different rhythms of change. For natural scientists the
sustainable livelihood framework serves the purpose of linking their specific work and
capacities with what people are capable of doing, what they are looking for, and how
they perceive their needs. The sustainable livelihood framework thus provides a
continuum for research and development (Hebinck and Bourdillon, 2002).
Assessing the impacts of agricultural research and development is difficult as
agricultural technologies impact peoples’ livelihoods in diverse ways. Earlier, many
studies simplified the assessment focusing on few factors missing many important
aspects of life and livelihoods of the rural poor (Adato and Meinzen-Dick, 2002), which
seems to be similar to the prevailing situation of aquaculture. In order to understand the
impacts of aquaculture research and development interventions, this approach is
increasingly being used in Bangladesh. Recently, the use of SLA in aquaculture research
has built an intrinsic information base of farming households and the impacts of
aquaculture through several studies in the fields of integrated aquaculture, aquaculture
and marketing and non-stocked fish management (Little et al. 2007) . In order to present
a holistic view of SLA, the use of participatory research, a growing family of approaches
and methods to enable rural people to share, analyse their knowledge of life and
condition, and to plan, act, monitor and evaluate has been an essential (Chambers,
1997).
2.1.1.1 Participatory research
At its simplest, participatory research ensures involvement with farmers in the process of
agricultural research (Okali et al. 1994). The on-farm research literature has always

Chapter 2
44
placed a strong emphasis on farmer participation and collaboration, and on talking to
farmers about their needs, problems and reactions to technology. The idea of farmers
participating in research is not new (Biggs, 1989). Participatory research is not a
method, but a methodological approach to its application (Cornwall and Jewkes, 1995).
Participatory research is a source of considerable contention and it covers a wide range
of approaches and applications (Chambers, 1994) and in principle this orientation can be
applied to any group of farmers, resource-rich or –poor (Biggs, 1989).
While the need to work with resource-poor farmers has been recognised, there is a wide
difference of opinion over central issues such as how farmers should participate, for
what purpose, and at what stage in the research process. A lack of clarity has led to the
failure of other scientists and farmers to understand what on-farm researchers were
trying to do, often resulting in implementation problems (Biggs, 1989). To facilitate
analysis of these issues, four models of farmer participation in research have been
defined (Table 2.1).
Table 2.1: Types of farmer participation in participatory research (Biggs, 1989)
Mode of farmer participation Objective of farmer participation Contractual Scientist contract with farmers to provide land and
services Consultative Scientist consult farmers about their problems and
then develop solution Collaborative Scientist and farmers collaborate as a partners in
research process Collegial Scientists work to strengthen farmers’ informal
research and development systems in rural areas
Participatory approaches have proved effective in generating and adapting new
technologies for a range of natural resource based adaptive and applied research
programmes at the farmer level (Sutherland, 1998). Indirectly, participation familiarizes
farmers with research, although they usually are not trained in formal scientific methods,

Chapter 2
45
and experiment systematically as part of their everyday production activities. Farmers,
through their informal research activities, contribute to the stock of indigenous technical
knowledge in rural areas and are important sources of technological innovation (Biggs
and Clay, 1981). Such informal research and development systems have considerable
potential to contribute to agricultural development (Biggs, 1989).
Approaches which aim towards a more collaborative or collegiate research process
include participatory rural appraisal (PRA) (Chambers, 1992), participatory action
research (PAR) (Rahman and Fals-Borda, 1991), and participatory research (PR) (KKU,
1987). Although in principle PRA seeks to create an open and collegiate approach to
research, in practice applications are often consultative or collegiate (Cornwall and
Jewkes, 1995).
PRA developed from rapid rural appraisal (RRA) influenced by action research
(Rahman, 1994), applied anthropology (Brokensha et al. 1980) and agro-ecosystem
analysis (KKU, 1987). The focus of PRA shifted from rapid, extractive data collection to
facilitating local people to produce and analyse their own information, according to their
own practice (Chambers, 1992). However, PRA shares some of its principles with RRA
such as direct learning from local people, offsetting biases, optimizing tradeoffs,
triangulating, and seeking diversity. To these it adds its own principles which concern
the behaviour of outsiders such as facilitating analysis by local people, practicing critical
self awareness and responsibility and sharing (Chambers, 1994). Mode of investigation
in PRA, sharing and analysis are open-ended, and often visualised by groups of people,
and through comparisons. Among many applications, PRA has been used in natural
resource management (fisheries, soil and water conservation, forestry, wildlife,
community planning, etc.), programmes for women and the poor, agriculture, health and
food security. Moreover, participatory methods have been used increasingly to identify

Chapter 2
46
target groups, particularly to identify the poor through well-being ranking exercises
(Chambers, 1994).
PRA involves collecting different kinds of data, which focuses attention on people, their
livelihoods and their inter-relationships with socio-economic and ecological factors.
When compared to conventional structured surveys, PRA is neither looking for averages
nor for set patterns. The strength of PRA lies in the flexibility of generating both
quantitative and qualitative data through a range of methods appropriate for revealing
rural peoples’ perceptions. PRA methods can generate data both at a single point in time,
through seasons or over extended timelines (Mukherjee, 1997). It has been argued that a
lack of standardization in the concepts and categories emerging from PRA can make
comparability difficult across areas and over time (Mukherjee, 1997). Furthermore, PRA
methods can give undue attention to dramatic events, in outliers rather than the central
tendency. In this context however, there is a great scope for combination of both PRA
and survey methods to complement each other in building up a rich information base
(Mukherjee, 1997). As pointed out in the literature, participatory methods complement
questionnaire surveys, using various protocols and schedules for recording and
standardization (Chambers, 1994). A combination of qualitative and quantitative tools
such as PRA, sample surveys, institutional appraisals etc. can make research
investigation effective (Kleih et al. 2003).
Within the growing PRA family, actor network analysis (ANA) derived from actor
network theory (ANT) (Law, 1992) is an increasingly important tool being used to
understand the linkages, and relationships behind the linkages, developed among various
types of actors involved directly and indirectly in natural resources base management
(Biggs and Matsaert, 2004).

Chapter 2
47
2.1.1.2 Analytical framework
Using SLA as a foundation, the analytical framework was designed to demonstrate
linkages between different aspects of livelihoods of the households both in horizontal
and vertical terms. Horizontal refers to the various domains of household well-being
(e.g. poor, intermediate, better-off etc.) and ‘vertical’ refers to the various domains of
household administration (e.g. household, community, institutions etc.). The zoom-in or
zero-in approach in the methodological process follows a similar logic in organizing the
modalities of data collection, ensuring that those sets of linkages are fully explored
(Pittaluga et al. 2004).
The growing body of participatory research approaches on the compilation of livelihood
profiles at micro level (e.g. in a household or community) has come to the fore. Various
techniques particularly the wealth ranking approach are commonly utilised to classify
individuals or households into poverty, vulnerability, or food security classes (SCF-UK,
2000). Identifying and characterising the poor and vulnerable is crucial for designing
and implementing actions to improve their livelihood conditions. This is because
policies and programmes do not commonly target single individuals, it is necessary to
identify meaningful groups for policy and programme action. By employing the
livelihood framework, it is possible to cluster individuals at the micro level with similar
characteristics into groups that are subject to similar factors and processes affecting their
poverty and vulnerability (e.g. seasonality). Within a livelihood system, the analysis
could be focused at the household or individual level depending on the scope and nature
of actions envisaged (Pittaluga et al. 2004).
Analysis of livelihood systems at the micro level attempts to go beyond an investigation
on common views of poverty and vulnerability, attempting to evidence how these co-
vary with respect to gender (Pittaluga et. al. 2004). Gender analysis is a process to better

Chapter 2
48
understand the realities of the women and men, girls and boys whose livers are impacted
by the development interventions. Principally it aims to unpack the dynamics of gender
differences across variety of issues (DFID, 2000). These include gender issues with
respect to i) social relationships - how male and female are defined in the given context,
their normative roles, duties and responsibilities; ii) activities - productive and
reproductive activities at the household and community level); iii) access and control -
over resources, services, institutions of decision-making and networks of power and
authority; iv) and needs - distinct needs of men and women (e.g. needs which, if met,
would change their position in society). In gender analysis daily activity schedule is an
important task in terms of identifying daily patterns of activity by gender division of
labour and understand how busy women and men are in a day, how long they work and
when they have spare time for development activities (DFID, 2000).
Inter relationships between people at various levels (individuals, households, institutions
etc.) are complex and by interviewing a number of people at each level, the network
could be explained. Understanding networks of various actors (such as people,
institutions etc.) is viewed as increasingly important in natural resource research and
development (Biggs and Matsaert, 2004). By interviewing a number of people expected
to be knowledgeable about realities at each level, networks making up livelihoods
systems begin to unfold. For example, analysing poverty simply from a micro-
perspective may implicitly obscure the policy and institutional elements that could
contribute to reproducing poverty. On other hand, a conclusion simply from interviews
at the individual level may obscure the distinctive features of poverty and vulnerability
of individuals at household level, their dynamic nature, and the local body of knowledge
about those dynamics (Wilson, 2001). The zero-in approach lays out a framework for
ensuring that many stakeholder voices are able to express their understanding of reality,

Chapter 2
49
and in doing so, it provides a mode of organizing information about multidimensional
issues related to poverty.
Poverty, food security, and vulnerability and impacts of development intervention on
poor are diverse and context-specific. In order to understand them it is necessary to
include the realities perceived by stakeholders (e.g. development organizations). The
overall picture then emerges gradually from the combination and analysis of different
viewpoints of stakeholders (Sapsford and Jupp, 1996). Involving different stakeholders
and informants at various levels is based on more than a simple need to foster bottom-up
approaches of participation at all levels. From a data collection as well as from an
analytical point of view, this approach of participation is justified by different and
distinct understandings of reality by different stakeholders (Campbell, 2003).
The nature of the different levels micro, meso and macro varies, and depends on the
specific situation. Therefore, interpretation of each level can be very flexible (Pittaluga
et al. 2004). For example, in the Ivory Coast, a livelihood system profile was carried out
in communities living on a lake. The lake was large and no formal institutions operating
throughout the overall water body existed. Researchers therefore decided to look at the
dynamics of poverty in all the prefectures adjacent to the lake (macro), then in a selected
sample of villages (meso) and finally complementing those observations with a
household (micro) survey (Pittaluga et al. 2004).
In the present study, the macro scale denotes the institutions such as CARE-Bangladesh
and its partner NGOs that promoted RBFSP; the meso scale includes communities,
villages and markets; and the micro scale includes households and individuals. The
analytical framework of this thesis draws on the notion of ‘zero-in’ approach developed
by Pittaluga (2004) to describe livelihoods of farming households. Most research carried

Chapter 2
50
out over multiple scales usually takes a linear or conical approach, either starting with a
general and then ‘zooming in’, or starting with particular and ‘zooming out’. However,
the analytical framework in this thesis is a hybrid between the two traditional scale
sensitive frameworks by adopting an ‘hourglass approach’ (Bush, 2004) (Figure 2.1).
The central theme of this thesis was to address the livelihood impacts of ricefield field
based fish seed production ranging from adopting households to community and market
level, and the institutional role of disseminating this technology. Analyses therefore
started at micro scale at household level and progressively zoomed-out to meso scale at
the community level and again zoomed-in at micro scale research at household level and
finally zoomed-out at macro scale at the institutional level at which the dissemination
strategy was formulated.
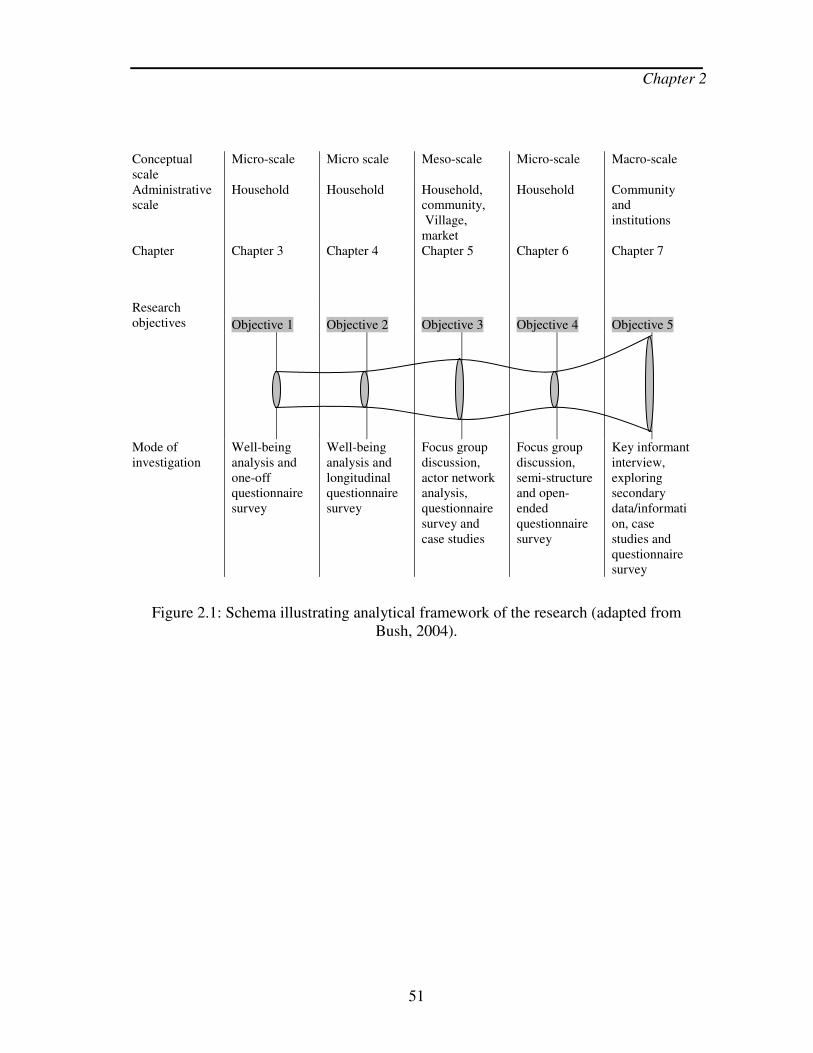
Chapter 2
51
Conceptual scale
Micro-scale Micro scale Meso-scale Micro-scale Macro-scale
Administrative scale
Household Household Household, community, Village, market
Household Community and institutions
Chapter Chapter 3 Chapter 4 Chapter 5 Chapter 6 Chapter 7
Research objectives Objective 1 Objective 2 Objective 3 Objective 4 Objective 5
Mode of investigation
Well-being analysis and one-off questionnaire survey
Well-being analysis and longitudinal questionnaire survey
Focus group discussion, actor network analysis, questionnaire survey and case studies
Focus group discussion, semi-structure and open-ended questionnaire survey
Key informant interview, exploring secondary data/information, case studies and questionnaire survey
Figure 2.1: Schema illustrating analytical framework of the research (adapted from Bush, 2004).

Chapter 2
52
2.1.1.3 Mode of investigation
In this research approach, both quantitative and qualitative methods of investigation
have been employed. Over the years there has been a large amount of complex
discussion and argument surrounding the topic of research methodology and the theory
of how inquiry should proceed. Much of this debate has centred on the issue of
qualitative versus quantitative inquiry which might be the best and/or more scientific.
Different methodologies become popular at different social, political, historical, and
cultural times of development and all methodologies have their specific strengths and
weaknesses (Dawson, 2002).
Quantitative methods refer to random sampling for survey research, structured
individual interviews for data collection and the statistical analyses generated. These
methods maximize representativity and generalizability to a larger study population
(Krishna and Shrader, 1999). In quantitative methods, the uses of histograms, pie charts,
and line graphs add dynamic visual applications to the presentation of findings.
On the other hand, qualitative methods refer to a wide range of data collection and
analysis techniques allowing for in-depth analysis of social phenomena (Krishna and
Shrader, 1999). Qualitative methods including observation, participant observation, life
histories, in-depth interviews, and focus group discussion, have long been used to
elucidate values, perceptions, attitudes, and opinions of both individuals and groups of
people, providing in-depth examination of relationships and behaviours. Qualitative
methods are used in a variety of disciplines, including organizational management
studies, evaluation research, and sociology, to assess the organizational dynamics of
both formal and informal institutions, key structure of social capital (Krishna and
Shrader, 1999). In qualitative methods, visual analysis by researchers, respondents or
both provide dramatic documentation of causality links, patterns of behaviour, mapping

Chapter 2
53
of community assets and so on. These often illustrate, on a single page complex
interrelationships which are difficult to capture in pages of text (Miles and Huberman,
1994). Over the years, a range of participatory qualitative methods have developed with
the added benefit of being produced by respondents with little or no intermediation of
external researchers (Chambers, 1997).
Quantitative and qualitative methods may be combined in a variety of ways to improve
the trustworthiness of survey and experimental findings. During the second half of the
1990s, attempts were made to highlight the complementarity of the two approaches.
Also the pros and cons of each type of approach, and the value(s) of surveys in a general
development context, were examined. In the field of renewable natural resources
research it was realised that although some research practitioners were combining
methods, experiences were often not documented and moreover, several avenues of
potential remain untapped (Marsland et al. 2001). However increasingly, socio-
economic research has employed both quantitative and qualitative methods in the quest
for research designs best suited for assessing complex issues and concepts. Integration
of complementary methodologies is a successful strategy for several reasons: it enhances
confirmation or corroboration of varying methodologies via triangulation; elaborates or
develops analysis providing richer detail; and initiates new lines of thinking through
attention to surprises or paradoxes (Rossman and Wilson, 1984).

Chapter 2
54
2.2 General background of the study area
Bangladesh is criss-crossed by innumerable rivers, of which the Jamuna, the fifth
longest river in the in the world, flows from north towards south and virtually divides
the country into east and west zones. The river, Padma (the major trans-boundary river
and distributary of Ganges) again dissects the west zone into southern and northern part.
The Jamuna had not only created a serious physical barrier to uninterrupted road and rail
communications but also results in uneven development between east and west zones of
the country. The recent construction of a bridge (known as Jamuna bridge - south Asia’s
longest bridge) has dramatically improved connections between country’s east central
part including capital city of Dhaka (Alam et al. 2003). Although communications
between the north, and the eastern and the central regions have improved, the Northwest
region is still distant from the main and central part of the country (Figure 2.2).
The Northwest region of Bangladesh is generally considered to be one of the poorest
parts of the country (WFP, 2002). Overall in the western region-Rajshahi including the
Northeast, 61% of the total households are poor compared to 45% in central region-
Dhaka (Sen, 2003). People in the Northwest are mostly dependent on agricultural
activities and overall improvements of their livelihoods greatly depend on a broarder
agricultural development. This type of agricultural development cannot be possible
without emphasising the development of fisheries resources being an important part
(25%) of agricultural economy in Bangladesh (DoF, 2005).

Chapter 2
55
Figure 2.2: Map of Bangladesh showing study area in four districts (Thakurgaon, Dinajpur, Rangpur and Kurigram) highlighted in Northwest Bangladesh.
4
2
1
Legend Major rivers National boundary National highway Meter gauge railway
Broad gauge railway
STUDY AREA 1-Thakurgaon 2-Dinajpur 3-Rangpur 4-Kurigram
Northwest
Bogra
Rajshahi
Mymensingh
Dhaka
Sylhet
Jessore
Khulna Barisal
Chittagong
Jamuna bridge (1998)
INDIA
INDIA
INDIA
INDIA
MAYANMAR
BAY OF BENGAL
0 70 140
Kilometre
Comilla
N
Lalan Shah (Padma) bridge (2005)
Harding bridge (1915)
Megna River
3

Chapter 2
56
In terms of fisheries resources, the Northwest region is characterized by limited
openwater resources (rivers, floodplains, lakes etc.), a relatively low level of natural fish
production and low rainfall suggesting more attention is needed for the development of
aquaculture. The small landholdings, homestead size, seasonal ponds and ricefields of
the large numbers of poor and marginal farmers show great potential for the
development of small-scale aquaculture in the area. There are few private fish hatcheries
and nurseries in the region due to unfavourable soil and water quality and the presence
of a large informal fish seed market in Parbatipur (Barman et al. 2002). In Parbatipur
railway junction, traders transport fish seed by rail from Jessore – a southern district of
Bangladesh about 100 Km away from the Northwest region (Figure 2.2). In Jessore, the
large-scale development of hatcheries and nurseries occurred due to favourable soil and
water quality, proximity to rail communication, high demand for seed from pond fish
producers, and access to essential materials (e.g. pituitary glands, insecticides, net, etc)
from West Bengal (Milwain et al. 2002).
As a result, the farmers in Northwest are largely dependent on the supply of fish seed
from outside of the region, namely Jessore and Bogra. Development of aquaculture
technologies focusing on small-scale farmers’ resources in the Northwest, with
appreciation of their social, cultural and economic aspects, is important in this regard
(Barman, 2000). As part of the development process of aquaculture technology, a
decentralised fish seed production strategy in the ricefield based systems has been
developed through two subsequent project phases of CARE in the Northwest. The
developmental process of decentralised seed production has been discussed in detail in
Chapter 1. Focusing the development decentralised ricefield based fish seed production,
research investigation based on a project has been carried out according to the following
chronological Steps (Figure 2.3).

Chapter 2
57
Figure 2.3: Flowchart illustrating methodological processes used in whole study.
• Made initial contact and discussion with key informants from CARE officials in Northwest Bangladesh
• Listed 767 communities in CARE-Interfish and 150 communities in CARE Go-Interfish areas where ricefield based fish seed production has already been promoted
• Made a series of visits in 40 Interfish communities and 40 Go-Interfish communities. From those 80, 25 communities were randomly sampled
Background
Taken randomly sampled 20 communities (10 from Interfish and 10 from Go-Interfish area)
Well-being ranking exercise through the participation of community farmers
Sampling of households
60 ricefish (RF) households 60 non- ricefish (NRF) households
One-off survey
Longitudinal survey for one year
Survey of 10 randomly sampled communities
Sampling of RF households
• 30 primary adopter
• 30 secondary adopter
• 30 female from RF households
Sampling of NRF households
• 30 farmers who never tried
• 30 farmers who initially rejected
• 30 farmers rejected after few years
• 30 females from NRF households
Broader investigation of various actors in and around 1 well established and 1 recently introduced community
Survey on all seed producers and involved fry traders and foodfish producers of selected communities
Case studies on farmers, fry traders, neighbours, foodfish traders, retailers and customers
Study at institutional level
• Case studies at CARE direct delivery and its partner NGO offices
• Field based three year monitoring data from 12 Interfish, 2 Interfish research, 11 Go-Interfish communities and a mono-sex tilapia hatchery; data from the study in Step 1 and Step 3 were also combined in this Step
Ste
p 1
(2
00
3):
Un
der
stan
din
g l
ivel
ihoo
ds
and
im
pac
ts o
f
RB
FS
P o
n f
arm
ing
hou
seh
old
s
Ste
p 2
(2
00
3-4
):
An
aly
sis
of
seas
on
al i
mp
acts
Ste
p 3
(2
00
4):
Bro
ader
im
pac
ts
anal
ysi
s b
ased
on
acto
r n
etw
ork
Ste
p 4
(2
00
5):
U
nd
erst
and
ing
ado
pti
on
an
d
reje
ctio
n p
roce
ss
Ste
p 5
(2
00
5-6
):
An
aly
sis
of
cost
-
effe
ctiv
enes
s o
f
pro
mo
tio
n
Da
ta a
naly
sis
an
d l
iter
atu
re r
evie
w
Init
ial
lite
ratu
re r
evie
w f
rom
CA
RE

Chapter 2
58
2.3 Step 1
Project set up
The ‘decentralised seed project’ was a five-year collaborative project funded by
Aquaculture and Fish Genetics Research Programme (AFGRP) – DFID programme.
This project carried out its research activities in Asia in collaboration with the Institute
of Aquaculture, University of Stirling (UoS), UK; WorldFish Centre, Bangladesh;
School of African and Asian Studies, University of Sussex, UK; Asian Institute of
Technology, Thailand; Research Institute for Aquaculture, Dinh Bang, Vietnam; CARE
International, Bangladesh; and Bangladesh Agricultural University (BAU),
Mymensingh. The purpose of the project was to develop the “sustained availability of
quality seed in rural areas”. Based on this, the following activities were undertaken over
a 5 year period between 2001 and 2006.
� Assess existing seed supply practices
� Action research to assess causes of performance deterioration and appropriate
approaches to production initiated
� Monitoring and evaluation of seed production approaches; potential for strain
improvement using different methods assessed; and institutional changes in
partner organizations monitored.
� Assess impacts of strategy including importantly productivity and livelihood
benefits of producers and supply network; broader community level changes
analysis; partner institutional changes analysis; and develop strategy with key
regional donors to link pro-poor aquaculture development with appropriate seed
supply mechanisms.

Chapter 2
59
Involvement of researcher in the project
The decentralised seed project was a multi-disciplinary team based research project
which was implemented through the WorldFish Center in Bangladesh and based in
temporary field office in Dinajpur district in the Northwest region. Local staff were
recruited for field work during a previous phase of support to Dr. Benoy Barman as a
research fellow of University of Stirling, UK seconded to WorldFish Center. In this
project, I was contracted as a doctoral student but with some responsibilities for project
management. The activities related to assessing the livelihood impacts of RBFSP were
the focus for the doctoral study presented in this thesis. The major activities were as
follows:-
� Orientation to RBFSP research in Dhaka and Northwest based field offices of
WorldFish Center and making visits to CARE field offices and communities
where RBFSP had been promoted through FFS.
� Collection of relevant literature and development of research protocols.
� Giving training to field staff on the use of PRA tools, questionnaire pre-testing,
data collection and data entry to computer. At the same time receiving IT based
training on large-scale database preparation, data management and analysis.
� Personal involvement in data collection in the field. I personally conducted
approximately 15% and 65% of field work for quantitative and qualitative data
collection respectively.
� Monitoring and overseeing of field work, particularly with regard to quality
control of data collection. Checking, analysis and interpretation of all collected
data.

Chapter 2
60
� Maintaining the progress of the work in accordance with the stages agreed with
supervisors, including preparation of fortnightly written reports to allow for
comments and discussions before proceeding to the next stage.
� Discuss impediments to maintaining the agreed time table with the supervisors at
regular intervals.
� Presenting findings in different local and international fora to inform a wide range
of audiences.
Selection of study sites
During Step 1, attempts were made to understand livelihoods of farming households and
the impacts of RBFSP on farming households. This study was built on a previous study
(Figure 2.3) conducted to improve the general understanding of practices of RBFSP in
Northwest Bangladesh. At the onset of that study, initial contacts with personnel
working in the CARE Go-Interfish project were made to collect information about on-
going and previous activities of CARE Interfish project related to RBFSP. A list of 767
communities from the Interfish and 150 communities from the Go-Interfish project area
was drawn-up to make visit where RBFSP has already been promoted.
Then with the help of CARE field staff, a series of visits to 80 communities (40 from
Interfish and 40 from Go-Interfish) were carried out to understand the methods CARE
used when working with farmers, especially the concept of the farmer field school (FFS)
approach and general background of fish seed production practices at the household
level (Barman et al. 2004). Based on this background information, a total of 10
communities in the Go-Interfish areas of Thakurgaon and Dinajpur districts and 10
communities in the Interfish areas of Rangpur and Kurigram districts were randomly
Chapter 2
61
sampled. The study area is located within 4 districts of Northwest Bangladesh (Figure
2.2), consisting of 9 upazilas (sub-districts) and 12 unions (local government units).
A large number of communities were sampled randomly from a broader geographical
area to generate a representative view of RBFSP. According to Rob (1995), a
community is defined as a local informal management unit, comprising i) a number of
households bounded by a shared culture, consisting of e.g. language, religion, social
organization or values; and ii) the surrounding environment which provides the basis of
their livelihoods and the focus of their subsistence activities. Physically, a community
consisting of the inhabited area as well as the surrounding environment, may or may not
be clearly delineated from the point of view of the outside (Kuper and Kuper, 1989).
In the present study, important criteria of communities sampled were: a) development of
decentralised fish seed production technology in ricefield based system within the
community; b) a sizable promotion of adopters (regardless if they were primary or
secondary adopters) within the community; and c) access to community households
with respect to farmer’s cooperation to collect data/information. Moreover, in the study
sites access to available information at the level of on-going organizations (CARE and
its partner NGOs) was also considered.
Well-being analysis
Wealth is defined in terms of access to or control over important economic resources
(Grandin, 1998). Determining the wealth (or poverty) status at the individual, household,
family or community level is a highly complex task. It is usually carried out by
development programmes through structured questionnaires or means tests designed to
elicit information on income, savings, landholdings etc. Designing and implementing
such investigatory exercises is complicated and time consuming. People are often

Chapter 2
62
reluctant to disclose details of savings or landholdings and sample surveys risk missing
out the poorest who usually live a low profile existence with little involvement in
community affairs. The technique of poverty ranking has been developed to correct
these biases, or at least minimise them (Grandin, 1988). Well-being ranking provides
field workers with a simple participatory technique that enables them to identify the
poorest people in a target community, using the value judgements of community
members (Grandin, 1998).
The well-being ranking exercises were carried out through the collaborative efforts of
the researcher, facilitators/enumerators and key informants in the sampled communities.
In order to carryout range of research activities, a team of facilitator/enumerator/field
staff comprised of 3 males and 1 female was formed and based in a local field office in
Dinajpur. All staff were the inhabitants of the Northwest and each individual had at least
a graduate level of education and a good understanding of local terms/language and
socio-cultural factors. The key informants were selected during initial visits in the
communities with the help of CARE Go-Interfish project staff and discussion with
community people. Individuals who stayed most of the time in the communities and
knew more about the well-being of the households were chosen as key informants
(Mukherjee, 1997).
A complete list of all household heads was developed through interviewing a key
informant from each community with the assistance of the facilitators. Then the
household list was checked by other key informants to ensure that all households were
included. The name of each household head was written in a separate small piece of
white paper (card). The facilitator explained the method of well-being ranking and the
key informants carried out the exercise on an individual basis independently. No other
person was allowed to join the key informants during the exercise in order to avoid

Chapter 2
63
possible noise and bias. Key informants were asked to group the households into
categories from richest to the poorest (putting the piles of the cards sequentially from
left to right). The numbers of piles or groups were not fixed but they ranged from 5-6.
They checked and re-checked the households in each pile in order to get homogenous
grouping. The facilitator scored the cards as each key informant completed the ranking
exercise. In the case of ranking, a score was put on the back side of the card based on the
serial number of piles from left to right (richest to poorest). If the informant created 4
piles then the households were given a score of 25 (1/4x100) and the households furthest
to the right were given a score of 100 (4/4x100). At the end of the piling, the facilitator
recorded the criteria used by the key informant for grouping each of the piles. The
exercise was repeated with two further key informants without revealing the outcomes
from previous exercises. Finally, each household received 3 scores and from that the
average score was calculated.
Based on average scores the households in the selected communities were grouped into
three wealth categories using natural breaks of score (Grandin, 1994). This process of
well-being exercise has been well established on extension work in Northwest
Bangladesh (Gregory and O’Riordan, 1999) and has proved very useful in poverty
focused extension, particularly when identifying poor extension clients (Lewis, 1997).
All community key informants and other associates identified the well-being of
households as poor, intermediate and better-off mainly based on criteria including land
ownership, food security, house and its boundary, livestock, agriculture equipment, off-
farm activities, credits, toilet facilities etc. at the household level (Table 2.2).
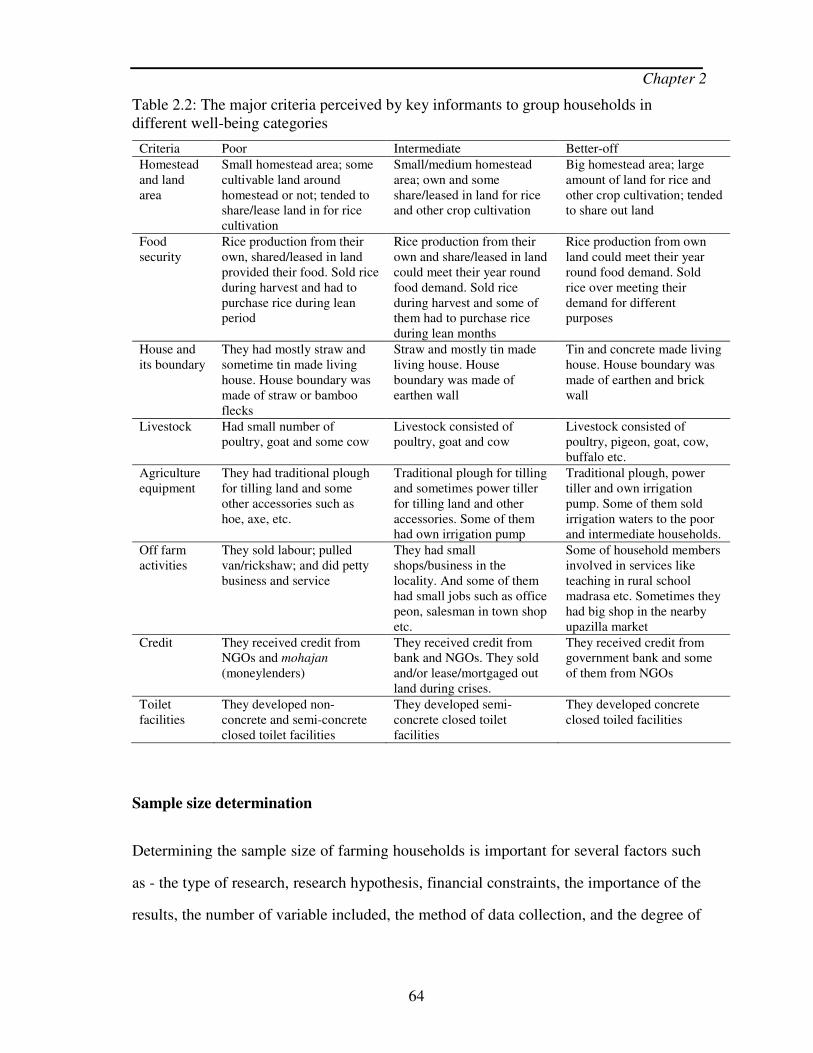
Chapter 2
64
Table 2.2: The major criteria perceived by key informants to group households in different well-being categories
Criteria Poor Intermediate Better-off
Homestead and land area
Small homestead area; some cultivable land around homestead or not; tended to share/lease land in for rice cultivation
Small/medium homestead area; own and some share/leased in land for rice and other crop cultivation
Big homestead area; large amount of land for rice and other crop cultivation; tended to share out land
Food security
Rice production from their own, shared/leased in land provided their food. Sold rice during harvest and had to purchase rice during lean period
Rice production from their own and share/leased in land could meet their year round food demand. Sold rice during harvest and some of them had to purchase rice during lean months
Rice production from own land could meet their year round food demand. Sold rice over meeting their demand for different purposes
House and its boundary
They had mostly straw and sometime tin made living house. House boundary was made of straw or bamboo flecks
Straw and mostly tin made living house. House boundary was made of earthen wall
Tin and concrete made living house. House boundary was made of earthen and brick wall
Livestock Had small number of poultry, goat and some cow
Livestock consisted of poultry, goat and cow
Livestock consisted of poultry, pigeon, goat, cow, buffalo etc.
Agriculture equipment
They had traditional plough for tilling land and some other accessories such as hoe, axe, etc.
Traditional plough for tilling and sometimes power tiller for tilling land and other accessories. Some of them had own irrigation pump
Traditional plough, power tiller and own irrigation pump. Some of them sold irrigation waters to the poor and intermediate households.
Off farm activities
They sold labour; pulled van/rickshaw; and did petty business and service
They had small shops/business in the locality. And some of them had small jobs such as office peon, salesman in town shop etc.
Some of household members involved in services like teaching in rural school madrasa etc. Sometimes they had big shop in the nearby upazilla market
Credit They received credit from NGOs and mohajan (moneylenders)
They received credit from bank and NGOs. They sold and/or lease/mortgaged out land during crises.
They received credit from government bank and some of them from NGOs
Toilet facilities
They developed non-concrete and semi-concrete closed toilet facilities
They developed semi-concrete closed toilet facilities
They developed concrete closed toiled facilities
Sample size determination
Determining the sample size of farming households is important for several factors such
as - the type of research, research hypothesis, financial constraints, the importance of the
results, the number of variable included, the method of data collection, and the degree of

Chapter 2
65
accuracy needed (Sufian, 2003). In this study, the sample size of respondents used in the
Chapter 3 & 4 was determined through a systematic procedure.
From the previous study conduced by Barman et al. (2004) and from CARE reports, it
was possible to estimate the proportion of adopting households at the community level.
Therefore there was an easy way to apply a proportional estimate, which minimises the
expected variances and indicates a sample size that is sure to be representative. The
assumed proportion used for determining sample size was 0.05 with the expected
precision level of 5% (NAO, 1992).
In order to calculate the required sample size a standard statistical formula was used
(Hays and Winkler, 1990) which is as follows:-
)(2
2
id
pqzn −−−−−−−−−−−−−−−=
)(
1
ii
N
n
nn f −−−−−−−−−−−−−−
+
=
Where, n = Desired sample size (when population is more than 10,000) nf = Desired sample size (when population is less than 10,000) N = Population size (approximately 2,000) z = Standard normal distribution value (Z is given in the probabilities table of the standard normal distribution, 1.96) p = Proportion in the target population estimated (that is 0.05).
)(0.1 iiipq −−−−−−−−−−−−−−=
d = Degree of accuracy (desired set at 0.05) Therefore calculated sample size is

Chapter 2
66
72)05.0(
95.005.0)96.1(2
2
=××
=n
But the population size in the study is less than 10,000 (i.e. approximately 2,000) Therefore, the calculated sample size is
69
2000
721
72=
+
=fn
Sampling procedure
A random sampling technique was employed to avoid sample bias. In order to achieve a
representative sample size and considering the capacity of field research, 3 ricefish
households were randomly chosen from each of 20 communities from 4 districts, i.e. 60
(=20 x 3). Corroborating this calculated sample size, literature suggested a rule of thumb
that if the total population is 20,000, the recommended sample size is 392 (Arens and
Loebbecke, 1981). Along with ricefish farmers (RF), the same numbers of non-ricefish
farmers (NRF-treated as control) were sampled randomly from each community.
Normally in experimental design, control is accomplished by randomly assigning
research participants to experimental and control groups. The logic of controlled
experimentation assures that all extraneous variables have been controlled for and that
the two groups differ only with regard to their exposure to the independent variables
(Nachmias-Frankfort and Nachmias, 1996).
The total sample size therefore, eventually consisted of 120 households. Out of 120
households, 60 households (50% RF and 50% NRF) from 10 communities of Rangpur
and Kurigram districts and 60 households (50% RF and 50% NRF) from 10
communities of Thakurgaon and Dinajpur districts were included in the study. The
categorisation of RF and NRF households were made based on the criteria of having

Chapter 2
67
knowledge of ricefish farming, adoption, fish culture in pond, and current practice of
fish seed production in ricefields (Table 2.3).
Table 2.3: Basic characteristics of sampled farming households by type
Criteria Ricefish (RF)* Non-Ricefish (NRF)**
Idea of seed producing farmer
They acquired technical knowledge of RBFSP as direct participants of the CARE Interfish and Go-Interfish projects; some of them were secondary adopters acquired technical knowledge from primary adopters (participants of CARE projects)
They might or might not be the participants of CARE projects; they had knowledge of RBFSP as some of them received CARE training and live in the same community
Adoption They adopted ricefield based fish seed production
They had not adopted ricefield based fish seed production
Fish culture in pond
Not all RF farmers had a pond. Those who had pond for growing fish tended to use fish fingerlings from their own source
Not all NRF farmers had a pond. Those who had pond for growing fish tended to collect fish seed from other sources
Status during selection
They were selected in 2002 according to their on-going fish seed production practices
They were selected as farmers not currently practising fish seed production, however they might be the previous adopters but rejected later
**A household producing seed in ricefield will be denoted as a RF household.
**A farmer not producing seed in ricefield denoted NRF households throughout the thesis.
In this study, farmer type as defined in the Table 2.2 was considered as the main factor
to investigate the impacts of RBFSP on the farming households. The well-being status
(poor, intermediate and better-off) of households was also used as the second factor to
explore the impacts of RBFSP on farmer type within different strata of well-being.
Data collection through questionnaire survey
A one-off structured questionnaire survey was employed to collect data/ regarding
livelihood asset-base, livelihood strategies, livelihood outcomes and vulnerability
context of farming households. As 4 facilitators/enumerators were involved in data
collection, variation in consistency, interpretation, unit of measures and methods of
presentation of data was possible. Hence, adequate measures were taken to minimize
data collection errors such as (a) initial training of staff in data collection at the field
Chapter 2
68
level; (b) pre-testing of and checking the questionnaire to identify any shortcomings; (c)
modifying the questionnaire where the questions remained unanswered; and (d) finally
data collection was carried out from the field level.
2.4 Step 2
The second step was a year long longitudinal household monitoring survey using a
structured questionnaire (Figure 2.3). This was conducted with the same households
sampled for the survey in Step 1. The purpose of this survey carried out with farming
households was to investigate the seasonal patterns of livelihood systems focusing on
the impacts of RBFSP. The 60 RF households sampled in Step 1 were interviewed every
month throughout the year of investigation. The remaining 58 NRF farmers were
interviewed every three months (i.e. the respondents were interviewed four times over
the year of investigation). The NRF farmers were only interviewed four times in a year
as opposed to 12 times due to their reduced interest in the project. After each monthly
interview, the questionnaire data was checked thoroughly to highlight any confusing or
missing data/information. Microsoft Access was used to store data for subsequent
analysis. The data entered in the database was cross-checked with the hardcopy of the
questionnaire to identify important errors.
2.5 Step 3
At this stage, based on an actor-oriented approach, an investigation was carried out to
look into the broader-scale impacts of RBFSP on actors at different levels (Figure 2.3).
This study was conducted in two communities including a well established community
and a recently introduced community of RBFSP using PRA tools of key informant
interview (KII), focus group discussion (FGD) and case study with structured and semi-
structured questionnaire surveys. Key informant interviews examined various resources
at the community level while focus group discussions identified the actors within the

Chapter 2
69
community and outside the community involved in RBFSP activities directly or
indirectly. The roles and motivations of key actors including seed producers (RF
farmers), fry traders and food fish produces were studied using structured and semi-
structured questionnaire surveys. All seed producers in both communities, all fry traders
and 30 foodfish producers linked with well established community were surveyed based
on the concept of “census sampling” (Walonick, 2004). Other actors including fry
traders, foodfish producers (of recently introduced community) fishers/food fish traders,
aratdar (owner of auction market), retailers, and consumer were interviewed using case
a study approach. As in Steps 1 and 2, the data from the questionnaire surveys were
entered in a database.
2.6 Step 4
This step looked at the adoption, adaptation and rejection processes of RBFSP activities
in farming households (Figure 2.3). This study was conducted in 10 communities
sampling various categories of respondents including primary and secondary adopters of
this technology, households who had never adopted the technology, initial rejecters of
the technology, late rejecters of the technology, women in the adopting households and
women in the non-adopting households. In each group, 30 respondents were interviewed
using a semi-structure questionnaire. A sample of 30 respondents is generally taken as
an adequate sample size however, sample size smaller than this fall into the category of
case studies, where statistical inferences to the population cannot be made (NAO, 1992).
After survey, data and information was entered into a database and responses were
coded in numerical frequency for subsequent analysis.
2.7 Step 5
In this Step the cost-effectiveness of disseminating decentralised fish seed production
through different approaches to CARE delivery was analysed making a comparison with

Chapter 2
70
a centralised mono-sex tilapia hatchery (Figure 2.3). In addition the sustainability of
such types of programmes of CARE partner NGO level was also examined. The costs of
training for dissemination of RBFSP were determined by conservative methods (Quizon
et al. 2001) using secondary sources of data collected from CARE and its partner NGOs.
The effectiveness of the approaches to delivery mechanisms was determined with
respect to project based investment and development effectiveness. For these, three
years monitoring data of income of fingerling production from 12 Interfish, 2 Interfish
research and 11 Go-Interfish communities along with the data from a mono-sex tilapia
hatchery were used. Alongside these, data from Step 3 and Step 5 were used to
determine multiplier effectiveness i.e. development effectiveness (Richardson and
Moore, 2002) involving fry traders and foodfish producers. The sustainability of such
types of programmes at NGO level was assessed using open-ended questionnaire
interviews comparing nine partner NGOs during their on-going partnership with CARE
and following the withdrawal of CARE support.
2.8 Observation
Observation and analysis are ‘interwoven processes’ in field research (Babbie, 1979). In
conjunction with data collection for the sake of specific objectives, observations should
be undertaken during field work and important outcomes of these observations should
also be noted (Sufian, 2003). In this research, complementary observations were made
during field surveys of the physical, social, economic and environmental conditions of
the study area as well as the overall livelihood conditions of the people and community
(Appendix 10).
2.9 Data management
After collecting the data using structured or semi-structured questionnaires, databases
were designed using Microsoft Access where validation rules and text were built for

Chapter 2
71
minimizing errors during data entry. The database interface was structured to appear as a
similar to the form of the questionnaire to make data entry easy for the field staff (e.g.
Figure 2.4). Data were entered by field staff in the field office and checked thoroughly
comparing with the original hardcopy of the questionnaire to identify missing
information or errors. Using the Query Option in Microsoft Access, data was arranged in
various ways to conduct statistical analyses according to the research objectives.
Figure 2.4: Interface of database in Microsoft Access.
Chapter 2
72
All statistical analyses were carried out using SPSS version 11.5 (statistical software),
and Microsoft Excel was used for tabulation and graphical representations of the
findings. Comparisons of proportions and means across the farmer types (ricefish and
control farmers) by well-being categories (poor, intermediate and better-off) were
carried out using appropriate statistical tests. The general features of the major statistical
tests used in this study are given below:-
2.10 Statistical analysis
Both parametric and non-parametric statistical tests were used to analyse the parametric
and non-parametric data respectively. Brief discussions of these statistical tests are given
below.
2.10.1 Parametric test
Analysis of variance (ANOVA)
In SPSS version 11.5, univariate analysis of variance was performed through the
General Linear Model (GLM) procedure. The General Linear Model (GLM) procedure
provides analysis of variance (ANOVA) for one dependent variable by one or more
factors and/or variables. The factor variables divide the population into different groups.
Using this GLM procedure, it is easily possible to test hypotheses about the effects of
other variables on the means of various groupings of a single dependent variable. It also
allows investigating interactions between factors as well as the effects of individual
factors. Normality of data was tested before analysis based on the distribution of data on
normal probability plot - a procedure for testing normality in SPSS.
Correlation and regression analysis
Correlation studies, as the phrase implies, look at co-relations between variables. A
correlation analysis frequently used is the Pearson product-moment correlation or the

Chapter 2
73
Pearson r. (Field, 2005). Although Pearson r is predicted on the assumption that the two
variables involved are approximately normally distributed, the formula often performs
well even when assumptions of normality are violated or when one of the variable is
discrete (Field, 2005). The correlation coefficient (r) ranges from -1 to + 1 indicating
two variables are negatively or positively correlated respectively.
Regression analysis is a statistical technique designed to predict values of dependent (or
criterion) variables from knowledge of the values of one or more independent (or
predictor) variable (s). If the relationship between two variables is known, then it can be
used as regression analysis to predict one variable from knowledge of the other.
The general form regression equation is written as
)(iveXY −−−−−−−−−−−−−++= βα
Y is the value of the dependent variable or the variable being predicted or explained α or alpha is a constant; it equals the value of Y when the value of X=0 β or beta is the coefficient of X; the slope of the regression line; how much Y changes for each one-unit change in X. X is the value of the Independent variable, what is predicting or explaining the value of Y e is the error term; the error in predicting the value of Y, given the value of X (it is not displayed in most regression equations).
2.10.2 Non-parametric tests
Chi-square test
The Chi-square test is a non-parametric test that makes comparisons (usually cross-
tabulated data) between two or more samples of the observed frequency of values with
the expected frequency of values. The Chi Square test requires that the data should be

Chapter 2
74
expressed as frequencies, i.e. numbers in each category; this is a nominal level of
measurement. The general equation of Chi-square test is as follows:-
)()(6
1
22
vE
EOi
i
ii −−−−−−−−−−−−−−−
=∑ =χ
Where, Oi = an observed frequency Ei = an expected (theoretical) frequency
To be reliable the Chi-square statistic requires that the expected frequencies in each
category should not fall below 5 - this can cause problems when sample size is relatively
small. Finally, the different categories of data used must be independent of each other.
Friedman test
The Friedman test is the non-parametric test similar to the parametric repeated measures
ANOVA. It tests whether three or more groups differ significantly from each other,
based on average rank of groups rather than comparison of means from normally
distributed data.
Wilcoxon’s signed-rank test
The Willcoxon singed-rank test is a non-parametric alternative to the paired Student’s t-
test for the case of two related samples or repeated measurements on a single sample.
Likewise the t-test, the Wilcoxon test involves comparisons of differences between
measurements.
2.10.3 Statistics used for presenting results
The field of statistics involves methods for i) describing and analysing data and ii) for
making decisions or inferences about phenomena represented by the data. Methods in

Chapter 2
75
the first category are referred to as descriptive statistics; and methods in the second
category are called inferential statistics (Nachmias-Frankfort and Nachmias, 1996).
Descriptive statistics is a group of methods used to organize, summarize, and present
data in an informative way. The techniques are commonly classified as graphical
description in which graphs are used to summarize data and tabular description in which
tables are used to summarize data. On the other hand, inferential statistics consists of
generalizing from samples to populations, performing hypothesis testing, determining
relationships among variables, and making predictions. Inferential statistics try to reach
conclusions that extend beyond the immediate data alone. Both descriptive and
inferential statistics help researchers to develop explanations for complex socio-
economic characteristics of households that deal with relationships between variables
(Nachmias-Frankfort and Nachmias, 1996). In the present study both descriptive and
inferential statistics have been used.
2.11 Triangulation and validation of key findings
Triangulation of findings derived from data analysis was both formal and informal. At
Stage 1, after analysis of one-off survey data, key findings were shared at the individual
and community level to understand findings and interpret results. At the stage 2,
community meetings were convened at the termination of data analysis (Figure 2.5). The
research findings were presented by researchers through drawings of graphs and charts
on paper and setting on a stage in farmer’s household premises in the community.
Finally sessions were held based on open invitation with groups to discuss any
modification of the results based on ideas arising from RBFSP activities. Invitations
were given to communities with the help of both RF and NRF farmers who participated
in the initial one-off and longitudinal surveys. Participants in the discussion meeting
were from the wider community without consideration of class or category. Discussion

Chapter 2
76
sessions were facilitated by field staff and all comments, suggestions, and interpretations
were noted.
Figure 2.5: Sharing and validation of findings at different levels of respondents.
At Stage 3, key findings were shared individually at actor level particularly at farmer
and fry trader levels for validation and better understanding. At the Stage 4, some key
Step 3: Broader impacts analysis using actor network approach
Step 2: Analysis of seasonal impacts
Step 1: Understanding livelihoods
Step 4: Understanding adoption and rejection process
Step 5: Analysis of cost-effectiveness of promotion
Results
Sharing and validation of key findings at community level
Discussion with farmers in mixed group of people at community level
Share and validate key findings with actors at various levels
Share and validate key findings with personnel at institutional levels
Share and validate key findings with farmers at community level
2004
2005
2005
2005
2006
Data analysis
Data analysis

Chapter 2
77
findings regarding the adoption and rejection process of RBFSP, were shared with
farmers at community level to get better understanding. At Stage 5, the results of the
study at the institutional level were validated with respective personnel of CARE and its
partner NGOs. In the CARE Go-Interfish project office, Project Manager and Project
Officers were asked to validate the findings. At the partner NGO level, sharing and
validation of findings were carried out through discussion of key findings with the
Executive Director and Account Officer.
2.12 Assumptions of the study
The following assumptions were made while undertaking this study:-
� The respondents selected for this study were knowledgeable enough about their
socio-economic context to answer the questions made during the survey.
� The views and opinions provided by the farmers included in the sample were the
representative views and opinions of all the farmers of the study area.
� The researcher and the associated team members who acted as an interviewer were
well acquainted with the social environment of the study area.
� As a series of research activities were carried out over the period of several years,
understanding of various social phenomena of farming households was clear.
� The sampling procedure followed for this study, data collection, the analysis of
data and interpretations etc. were systematically carried out reflecting the validity
and reliability of information.
� The findings of the study were expected to be useful for planning and
implementation of the future extension programmes to make available quality

Chapter 2
78
fish seed in the rural areas for increasing aquaculture production and welfare of
household livelihoods.

Chapter 3
79
Chapter 3: Contextualisation of RF households and their livelihoods
3.1 Introduction
This chapter presents the livelihood contexts of ricefish (RF) and non-ricefish (NRF)
households by their well-being status based on a one-off structured questionnaire survey.
The livelihood aspects include livelihood assets, strategies and outcomes of sampled
households. Within the livelihood context, impacts of RBFSP on farming households
(RF) compared to NRF households are demonstrated within their different well-being
status.
The Northwest region of Bangladesh is comprised of eight districts (Panchagrh,
Thakurgaon, Dinajpur, Lalmonirhat, Nilfamari, Rangpur, Kurigram and Gaibandha)
with an area of 16,318 Km2 and encompassing 12% of the total area of Bangladesh
(BBS, 2003). This region has traditionally been recognised as marginalised from the rest
of the country. The remoteness of the region from the political and economic centres
was due to poor infrastructural facilities, lack of industrial development, and the
prevalence of remnants of feudalism in agriculture and landholding systems. This has
contributed to the positioning of the region as one of the poorest in the country (DFID,
2002). There has also been less industrial development in the Northwest region than in
the country as a whole, although the opening of Jamuna multi-purpose bridge in 1998
and the resultant improvement in transport links with other parts of Bangladesh is
expected to accelerate industrialisation (WARPO, 2001).
The total population and number of households in the region were 20.58 and 3.05
million respectively in 2001 with an average household size of 6.74 (BBS, 2003a). The
population density in this region is much higher (1260.93/Km2) than the national

Chapter 3
80
average (839.27/Km2) (BBS, 2003). The literacy level at 7 years or older in 2001 was
39.50% in the area which is lower than the national average of 45.32% (BBS, 2003a).
The low level of educational achievement is a serious impediment to economic growth
in the Northwest. The key characteristics of the Northwest economy are low wages, high
interest rates, extreme levels of poverty, and very slow rate of urbanization which shapes
the economic behaviour the region. With cultivated land more or less constant, pressure
on the rural area is acute and growing and needs a more rapid pace of economic
development (DFID, 2002).
Geologically, almost all Bangladesh including the Northwest consists of mainly low and
flat land except some hilly parts. Bangladesh is a part of the Bengal basin, one of the
largest geosynclinals in the world (Rahman et al. 1994). The formation and growth of
the Bengal basin is directly related to the origin and morphology of the Indo-Gangetic
trough, which itself is overlaid and filled by sediments, thousands of meters thick
(DFID, 2002). The floor of Bengal basin consists of quaternary sediments deposited by
the Ganges, the Brahmaputra, and the Meghna rivers known together as GBM river
system. The sediments are washed down from highland on three sites of the basin,
particularly from the Himalayas. Over 90% of the annual run-off generated in the GBM
catchments area flows through Bangladesh. The sediments of GBM provides ideal
moisture, water and silt for cultivation of rice in the Northwest as well as other parts of
Bangladesh (Rahman et al. 1994).
Hydrologically out of eight regions of Bangladesh, the Northwest (all 16 districts of
Rajshahi Administrative Division) is the largest and has groundwater almost free from
the threat of arsenic contamination (WARPO, 2001). Hydraulically, there are three
aquifers across the country: an upper aquifer or composite aquifer, main aquifer and
deep aquifer. The main aquifer occurring in most of the parts of the country ranges from

Chapter 3
81
less than 5 meters in the Northwest region to more than 75 meters in south (WPA, 2005;
BANCID, 2007). The relatively shallow water table has facilitated the use of shallow
tube-well pumps for agricultural irrigation. Such easy access to underground water and
cheap installation of shallow pumps has led to a rapid increase and wide coverage of
irrigated agriculture in Northwest Bangladesh. Out of total cultivable land, 63.03% is
irrigated in this region which is greater than the national average of 48.31% (BBS,
2003a). The development of irrigated agriculture in this region along with other parts of
country has been attributed to a series of policy reforms that started in the late 1970s.
Particularly, after the devastating floods in 1987 and 1988, government policy to import
agricultural machinery caused an influx of cheap engines from Republic of Korea and
China, contributing to the accelerated diffusion of shallow tube-wells. The exploitation
of groundwater through the use of tube-wells converted the fallow land of the dry season
into fertile ricefields well suited to seed-fertilizer technology (Fujita and Hossain, 1995).
The lack of off-farm opportunities coupled with the development of irrigated agriculture
has increased dependency of farming households on agriculture based livelihoods. In
recent years, the availability of irrigation has stimulated diversification through potato
and maize cultivation (ADB, 2000).
In terms of fisheries resources, the total estimated area of waterbodies in the Northwest
region is 31,954.78 ha including 20,970 ha of household ponds. Every year the area
covered by constructed ponds is increasing in Northwest Bangladesh (BBS, 2003a). In
parallel, the scope for people to benefit from wild fish supplies is diminishing due to
over exploitation and crop intensification (NFEP, 2001) suggesting the growing
importance of fish culture in this region.
In this context of higher levels of poverty, strictly agriculture-based farming, low level
of literacy and limited scope for off-farm employment indicate the livelihoods of people

Chapter 3
82
in Northwest Bangladesh are particularly vulnerable. On the other hand, improved
access to irrigation facilities and increased pond based aquaculture identified the
development of RBFSP as a strategy with the potential to improve livelihoods. In this
milieu, this chapter attempts to contextualise RF households (ricefield based fish seed
producers) and their livelihoods in a broader view.
3.1.1 Objectives of this study
Today, aquaculture technology comprises much more than the rearing of fish in ponds or
ricefields. With the aim of improving rural livelihoods in developing countries,
development organizations have focused on aquaculture with one or a combination of
objectives including i) to increase household food supply and improve nutrition; ii) to
increase household resilience through diversification of income and food sources; iii) to
strengthen marginal economies by increasing employment and reducing food prices; iv)
to improve water resources and nutrient management for maximizing household based
benefits as well as broader community based benefits; and v) to preserve aquatic bio-
diversity through restocking and to reduce pressure in fishery resources (FAO, 2000b).
In order to engage the people in small-scale aquaculture with a view to obtaining
benefits, different combinations and components of the five types of livelihood asset
(human, physical, natural, financial and social) are required. The presence or absence of
various types of capital assets can facilitate or hinder, respectively, the likelihood of
success. Individual farmers and households employ their capital assets in different ways,
and use various means to overcome access barriers through combinations of asset
components (ADB, 2005). Considering livelihood assets and impacts, the objective of
the research is to differentiate between farmers successfully practising the technology of
decentralised fish seed production in ricefields, and the households who were not
practising.

Chapter 3
83
3.1.2 Hypothesis
The asset profiles RBFSP adopters are the same as non-adopter households of different
levels of well-being.
Research questions
The following research questions were set out to gain a comprehensive understanding of
the hypothesis stated above:
� What are the livelihood characteristics of seed producing households compared to
non-producers at different strata of well-being? How do the livelihood
characteristics fit into the new practice of RBFSP technology?
� Does this technology require higher inputs compared to existing rice farming?
How does this technology affect overall on-farm productivity and benefits?
� How does fish seed production impact on poorer farming households in
comparison with non-producer households?
� How can fish seed production facilitate the relationship between asset status and
adoption of RBFSP?
� How does fish production impact on food consumption and expenditure at the
household level?

Chapter 3
84
3.2 Research process and methodology
Site selection of the study area
The primary study area for this investigation was Northwest Bangladesh where
decentralised fish seed production had been initially introduced, developed and
promoted by external agencies and also substantially spread among farmers. The whole
selection process and background of the study sites in Northwest Bangladesh have been
discussed detailed in Chapter 2.
Well-being analysis
The well-being status of a household affects almost every aspect of the type and quality
of existence. Wealth affects such parameters as the availability of labour, land, money
for purchasing inputs, or savings and investment. The amount of cropping, types of
crops grown, and use of crops are likely to vary with wealth status (Grandin, 1994).
Rural wealth differences are often ignored or not fully addressed in farming systems
research and extension. Wealth ranking allows researchers to understand quickly the
nature of wealth differences in a community and to determine the appropriate wealth
status of each community household. It solves the problem of identifying truly
representative farmers, eliminating the serious difficulties that can arise from distorted
sampling (Grandin, 1994).
As the special interest of the present study was to determine the livelihood impacts of
RBFSP on farming households of different socio-economic status, a well-being ranking
exercise was carried out to segregate the households into three well-being groups. A
standard wealth ranking methodology developed by Grandin (1994) was applied to
segregate the households into different wealth groups, which was descried elaborately in
Chapter 2.

Chapter 3
85
Sampling
Sample size was determined using the appropriate statistical procedure of probability
sampling. In sampling of households at the community level, a simple randomized
sampling technique was employed without considering primary and secondary adopters.
The procedure of sample size determination and sampling were described in Chapter 2.
The distribution of sample households in Table 3.1 shows a remarkable proportion of
secondary adopters developed alongside primary adopters in seed producing
communities.
Table 3.1: Distribution of the sample households (N=118) by farmer type and well-being category
Well-being categories
Ricefish (RF)
Community households
Primary RF
Secondary RF
Total RF
% of secondary out of total RF
Non-Ricefish (NRF)
Total community households
Poor 62 17 79 21.5 877 956
Intermediate 42 26 68 38.2 553 621
Better-off 31 12 43 27.9 100 143
Total 135 55 190 28.9 1530 1720
Sample households
Poor 20 4 24 16.7 31 55
Intermediate 17 3 20 15.0 15 35
Better-off 13 3 16 18.7 12 28
Total 50 10 60 16.6 58 118
Primary RF= Ricefish farmers who learnt technological know-how directly from CARE training; Secondary RF= Ricefish farmers who did not receive any support from CARE rather they learnt from primary adopters.
Framework of the study
Assessing the impact of agricultural technology on poverty is difficult, as there are so
many ways in which agricultural research can have an effect (IFPRI, 2000). For this
reason, many studies have tended to simplify the linkages between agricultural research
and poverty and measure only one or two aspects of those linkages. However, this sort
of approach can miss many important aspects of rural poor people’s lives, including the

Chapter 3
86
diverse ways in which technology directly or indirectly affects their livelihoods (Adato
and Meinzen-Dick, 2002). In order to minimize the missing elements, the sustainable
livelihoods framework is used by a growing number of researchers and applied
development organizations including Department for International Development
(Carney, 1999). It is a conceptual framework for analysing causes of poverty, peoples’
access to resources and their diverse livelihoods activities and relationship between
relevant factors at micro, intermediate and macro levels (Adato and Meinzen-Dick,
2002). The various components of the sustainable livelihood framework and its merits
and drawbacks are discussed in detail in Chapter 1. Based on the SL framework the
present study explores livelihood assets, livelihood strategies, livelihood outcomes and
many other livelihood aspects of adopters and non-adopters of RBFSP. In Chapter 2,
farmer or household type (RF and NRF) was defined which is considered as the main
factor to investigate the impacts of RBFSP in farming households. Well-being status
(poor, intermediate and better-off) of households was considered as the second factor to
explore its affects on the livelihood benefits gained through adoption of RBFSP.
Questionnaire survey for data collection
This chapter focuses on micro-level analyses based on the sustainable livelihoods
framework using the collected information from the household survey. Commonly, the
household is the basic unit of analysis in many microeconomic and government models.
By definition, in the context of a developing country like Bangladesh, households are
neither a group of people acting as if they were a single individual nor are they a
collection of individuals co-operating in the interests of maximizing economic gains
(Kabeer, 2001). More specifically, for the purpose of this study, a “household” has been
considered a group of people in a housing unit living together as a family and sharing
the same kitchen (Paul, 1998).

Chapter 3
87
The household, as a unit of analysis in micro-level studies provides valuable insights
into economic and social relations of rural areas in the developing world (Cain et al.
1979). Household surveys provide a rich source of data on economic behaviour and
various livelihood aspects of household members. In recent years, there has been a great
deal of interest in social experiments, including the use of household survey data to
evaluate the results of social experiments (Deaton, 1997).
Household surveys, as a methodological approach were carried-out for primary data
collection using a structured questionnaire to interview RF and NRF households in the
study area. Questionnaires used for quantitative research in the social sciences are
usually designed using operational definitions of concepts, instruments that reflect
strength of attitudes, perceptions, views and options. This involves trying to measure and
quantify how intensively people feel about issues, as opposed to what they know or can
do (Black, 1999).
For development of the questionnaire, secondary information from published and
unpublished documents regarding ricefish practices were collected from the CARE
Dinajpur field office, used as supporting evidence where necessary. The whole process
of the questionnaire survey has been described in Chapter 2. The questionnaire content
was fixed to a structure that allowed data to be gathered on general household
background information of livelihood assets, livelihood strategies and livelihood
outcomes (Appendix 1). Out of a total of 120 randomly selected respondents, 118 were
successfully interviewed with a response rate of 98 per cent. Two respondents were
excluded due to incomplete questionnaires. While conducting the questionnaire survey,
observation of field and household activities was also carried out through informal
discussion with key informants at the farmer and institutional level, particularly with
CARE personnel.

Chapter 3
88
Data management and analysis
Data management process was discussed in the Chapter 2. Both non-parametric and
parametric statistical tests were carried out to analyse data. Non-parametric data was
tested using the Chi-square test (e.g. Appendix 3). In the parametric test of analysis of
variance, farmer types and well-being were included as independent fixed variables (e.g.
Appendix 4). Many other variables such as fish seed production, food fish production,
rice production, vegetable production, poultry production, income, expenditures etc.
were included as dependent variables.
All main effects were evaluated as well as two-factor interactions between farmer type
and well-being. Tukey’s test was used for the post hoc detection of significant pair-wise
comparisons. Before carrying out parametric tests, data distribution was checked to
confirm normality. Non-normal data were log transformed (Pallant, 2001). Only p
values for main effects and significant interactions are presented for interpretation of
results.

Chapter 3
89
3.3 Results
The results of this chapter include an analysis of livelihood assets, livelihood strategies
and livelihood outcomes of the farming households. According to the livelihood asset
pentagon (five types of livelihood assets in the sustainable livelihood framework- Figure
1.1), all types of assets are included, however social capital particularly related to seed
production activities is explored explicitly and described in Chapter 5. Moreover, how
complex socio-cultural factors act as driving forces are discussed in terms of the
adoption process of this technology in Chapter 6.

Chapter 3
90
3.3.1 Institutional mediation
The sampled households had previously received training from various organizations of
which CARE, DoF, DAE and DoL led to deliver training to farming households on
different subject matters (Figure 3.1).
0 20 40 60 80 100
CARE
DoF
DAE
BRAC
CARITAS
AVDP
RDRS
CARE
DoF
DAE
TTC
YDC
CARE
DoF
DAE
DoL
IFN
YDC
BRAC
Po
or
Inte
rme
dia
teB
ette
r-o
ff
Percent of households
RF
NRF
Figure 3.1: Percent of households received training from various organizations by farmer type and well-being (BRAC=Bangladesh Rural Advancement Committee, TTC= Teacher Training Centre), YDC = Youth Development Centre, IFN=Islamic Foundation,
DoL=Department of Livestock, DAE=Department of Agriculture Extension, DoF = Department of Fisheries, AVDP = Ansar VDP and RDRS = Rangpur Dinajpur Rural
Service).
Except with respect to CARE training, no remarkable difference was found between RF
and NRF households in terms of other organizations. CARE had delivered training on
RBFSP along with other subject matter (Chapter 7) at the household level. The
government organization, DoF and other non-government organizations such as
CARITAS and BRAC had trained farmers on pond fish culture. Farmers received

Chapter 3
91
agriculture related training particularly from DAE and some other non-government
organizations such as BRAC, RDRS and CARITAS. The DoL and YDC - the
government organizations had trained farmers on livestock rearing. There was no
variation among the different well-being groups of households in terms of receiving
training from CARE. However, a higher proportion of better-off households received
training from government organizations compared to poor and intermediate households.
3.3.2 Livelihood capital
3.3.2.1 Human capital
Household size
Household size was defined as the number of persons, working or not, belonging to the
same household. Average household occupancy (number of members/household) of the
total sampled farmers (N=118) was 5.6±2.3 ranging from 2 to 20 members in an
individual household. A significant (P<0.05) difference was found between RF and NRF
farmers in terms of household occupancy with the average RF farmer’s household size
being 20% larger (6.1±2.8) than the NRF farmers (5.1±1.6). Household occupancy was
also found to be affected by well-being level. Better-off seed producing households were
found to have more members than intermediate and poor households (Table 3.2).

Chapter 3
92
Table 3.2: Human capital of sampled households by farmer type and well-being
Poor Intermediate Better off Human capital
RF NRF RF NRF RF NRF
HH size (no of person/hh) 4.9±1.5(24) 4.8±1.4(31) 5.6±1.4(20) 4.3±1.1(15) 8.8±3.9(16) 5.9±2.4(12) Age of hhh Young age (%) 25(6) 12.9(4) 14.3(5) 8.3(1) Middle age (%) 75(18) 70.9(22) 90(18) 66.7(10) 62.5(10) 75(9) Old age (%) 16.1(5) 10(2) 37.5(6) 16.7(2) Literacy level of hhh Illiterate (%) 45.8(11) 41.9(13) 22.7(3) 15.4(5) 25(4) Primary (%) 33.3(8) 35.5(11) 31.8(7) 23.1(2) 12.5(2) 16.7(2) Secondary (%) 16.7(4) 16.1(5) 40.9(9) 30.8(4) 62.5(10) 58.3(7) Above secondary (%) 4.2(1) 6.5(2) 4.6(1) 30.8(4) 25(3) Primary occupation of hhh Agriculture (%) 70.8(17) 87.1(27) 85(17) 66.7(10) 93.8(15) 83.3(10) Business (%) 12.5(3) 9.7(3) 5(1) 33.3(5) 8.3(1) Service (%) 3.2(1) 10(2) 6.3(1) 8.3(1) Petty business (%) 4.2(1) Van puller (%) 12.5(3) Secondary occupation of hhh Agriculture (%) 35(7) 17.4(4) 17.7(3) 38.46(5) 8.33(1) 20(2) Livestock rearing (%) 40(8) 21.7(5) 47.1(8) 38.46 (5) 83.3(10) 50(5) Business (%) 5(1) 13(3) 23.5(4) 15.4(2) 10(1) Petty business (%) 5(1) 13(3) 5.9(1) 8.3(1) 10(1) Service (%) 8.7(2) 7.7(1) 10(1) Day labour (%) 15(3) 26.1(6) Fish culture (%) 5.9(1)
hh= Household; hhh=Household head; figures in the parentheses indicate number (N)
Age
The age of the respondents (N=118), normally the heads of the households, ranged
between 20 to 90 years with an average of 45.8 ±13.5 years. From whole sample, 73.7%
of the household heads were within the middle age (31-60 years) group (Table 3.2). No
significant variation (P<0.05) was noted in the age of the respondents between the
farmer types. Chi-square test did not show any significant difference (P>0.05) in the
distribution of age groups between the wealth classes. More than 50% of farmers in the
middle age group were found to be involved in fish seed production activities and this
was also higher in all well-being groups.

Chapter 3
93
NR
FR
FFemaleMale
120
100
80
60
40
20
0
Ag
e120
100
80
60
40
20
0
120
100
80
60
40
20
0
120
100
80
60
40
20
0
40 30 20 10 0
Frequency
403020100
Figure 3.2: Pyramidal distribution of whole population based on age and sex by farmer type in RF and NRF households.
According to age group, the pyramidal distribution of sample shows a bulk of people in
RF households lies below the age level of 20 years (Figure 3.2). Lower number of
household members at this level in NRF households was possibly be due to the use of
family planning method as NRF farmers were more educated than RF farmers.
However, this section of household labour in RF households is likely to contribute to the
management of RBFSP activities. Age of household members close to zero indicates the
presence of lactating mothers in farming households. In addition, the number of
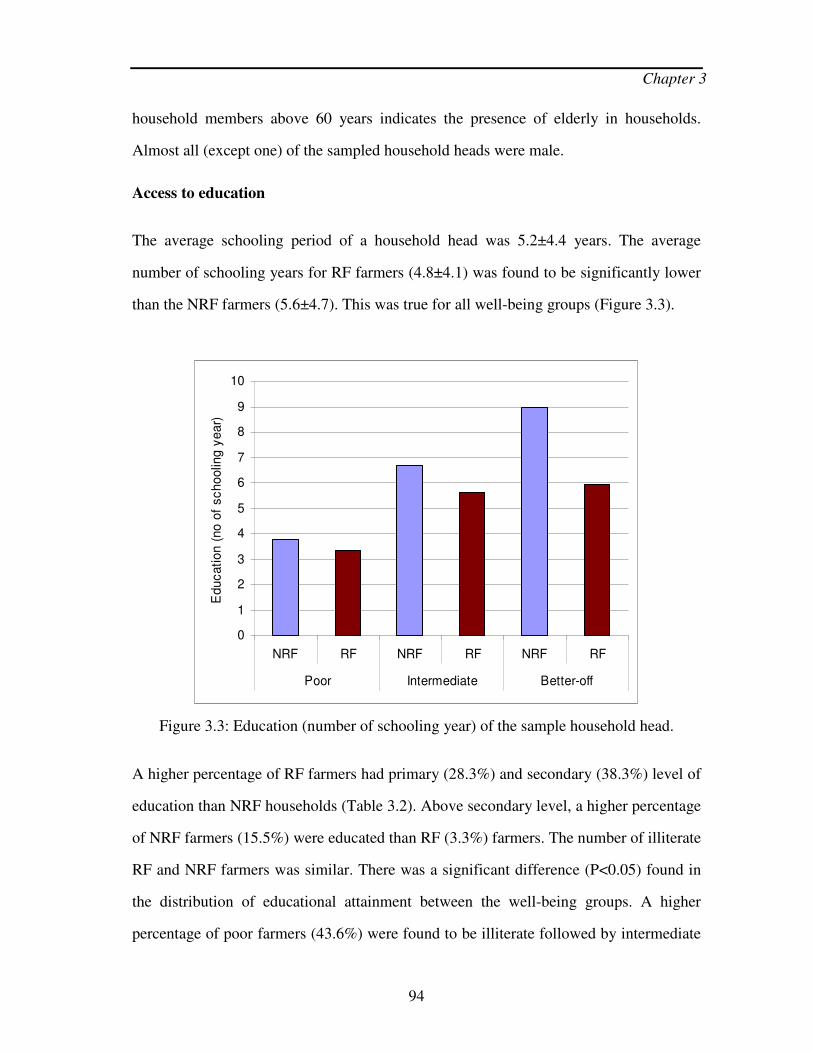
Chapter 3
94
household members above 60 years indicates the presence of elderly in households.
Almost all (except one) of the sampled household heads were male.
Access to education
The average schooling period of a household head was 5.2±4.4 years. The average
number of schooling years for RF farmers (4.8±4.1) was found to be significantly lower
than the NRF farmers (5.6±4.7). This was true for all well-being groups (Figure 3.3).
0
1
2
3
4
5
6
7
8
9
10
NRF RF NRF RF NRF RF
Poor Intermediate Better-off
Ed
uc
ati
on
(no
of
sc
ho
olin
g y
ea
r)
Figure 3.3: Education (number of schooling year) of the sample household head.
A higher percentage of RF farmers had primary (28.3%) and secondary (38.3%) level of
education than NRF households (Table 3.2). Above secondary level, a higher percentage
of NRF farmers (15.5%) were educated than RF (3.3%) farmers. The number of illiterate
RF and NRF farmers was similar. There was a significant difference (P<0.05) found in
the distribution of educational attainment between the well-being groups. A higher
percentage of poor farmers (43.6%) were found to be illiterate followed by intermediate

Chapter 3
95
(22.9%) and better-off (14.3%) groups. However, a considerable portion of poor farmers
(34.6%) were found to have attained a primary education followed by the intermediate
(25.7%) and better-off (14.3%) groups. On the contrary, the reverse scenario was
observed in secondary and higher secondary levels of education, which suggests that
poor farmers had adequate access to primary education but inadequate access to
secondary and higher secondary levels. In this context, technical and practical
knowledge of the poor on RBFSP is more important that for better-off farmers.
Overall the majority of RF farmers were found to be illiterate, nevertheless they learnt
and applied technical know-how of fish seed producing technology, which suggests that
illiteracy did not exclude households from accessing technology and enjoying livelihood
benefits.
Primary occupation
There were no significant differences found between the farmer types and well-being
groups in terms of primary occupation. Agriculture was found to be the major
occupation amongst both types of farmers, even at a similar level (81%), which suggests
that agriculture based activity, was the principal livelihood strategy for the majority of
farming households in rural areas. Remarkably in intermediate and better-off category, a
higher percentage of RF farmers listed agriculture as their primary occupation compared
to NRF farmers (Table 3.2).
Secondary occupation
As with primary occupation, no significant variations were found between different
groups of farmers in terms of secondary occupations. However, agriculture, livestock
rearing, business, petty business and small service were found as the secondary
occupations in both types of households. Only one RF farmer was found within the

Chapter 3
96
intermediate well-being group having fish culture as a secondary occupation.
Comparatively poor NRF farmers tended to list different non-farm activities as
secondary occupations such as business, petty business, service and day labour (Table
3.2). More educated NRF farmers are likely to be involved in more non-farm activities.
3.3.2.2 Physical capital
Dwelling space
The average number of living rooms in the RF household (2.1±1.3) was significantly
(P<0.05) higher than in NRF households (1.6±0.7). Well-being significantly (P<0.05)
affected the possession of living rooms in farming households. Poorer RF and NRF
farmers had a similar number of living rooms with differences in the intermediate and
better-off classes.
0%
20%
40%
60%
80%
100%
NRF RF NRF RF NRF RF
Poor Intermediate Better-off
Pe
rce
nt
of
hou
se
ho
lds
STT
SStT
SStSt
SST
SSSt
SCT
SBT
SBSt
CTT
CTT
Figure 3.4: Construction materials of living rooms of household members (C=concrete, T=corrugated tin, S= soil, B= bamboo and St= straw; - - - = floor-wall-roof)

Chapter 3
97
Within the whole sample, about 30% of the household’s living rooms were made using a
combination of soil-floor, soil-wall and corrugated tin-roof. More than 30% household’s
living rooms were constructed using soil-floor, bamboo-fence and corrugated tin-roof.
Better-off farmers tended to construct concrete and tin made living rooms. On the other
hand, living rooms of the poorer households tended to be constructed using mostly soil
based floor; bamboo, soil and straw made wall; and straw and tin made roof (Figure
3.4). This suggests that poor households made their dwelling rooms using low-cost
materials due to lack of sufficient asset base.
Almost every farming household had a kitchen room, which for the most part made of
soil-floor, bamboo-fence and straw-roof. The majority of the households had a cattle den
which with a soil-floor, bamboo-fence and tin-roof. Some of the better-off households
had storerooms which were made of bamboo-floor, bamboo-fence and tin-roof for
storage of rice and other agricultural crops.
Table 3.3: Physical capital of sampled households by farmer type and well-being group
Poor Intermediate Better off Physical capital
RF NRF RF NRF RF NRF
Housing Living room (no/hh) 1.5±0.7(24) 1.5±0.6(31) 2.2±1.1(20) 1.7±0.8(15) 2.9±1.8(16) 1.7±0.7(12) Kitchen room (no/hh) 1(24) 1(24) 1(20) 1(15) 1(16) 1(12) Cattle den (no/hh) 1(19) 1(18) 1(16) 1(12) 1(16) 1(10) Store room (no/hh) 1(3) 1(3) 1(6) 1(3) 1(6) 1(4) Drinking water source of hh Own tube well (%) 91.7(22) 87.1(27) 100(20) 93.3(14) 100(16) 100(12) Others tube well (%) 8.3(2) 12.9(4) 6.7(1) Toilet facilities of hh Concrete enclosed (%) 10(2) 13.3(2) 25(4) 8.3(1) Semi-concrete enclosed (%) 41.6(10) 35.4(11) 50(10) 53.3(8) 75(12) 91.6(11) Non-concrete enclosed (%) 58.3(14) 64.5(20) 40(8) 33.3(5) Pond resources Own (no/hh) 1(10) 1.2±0.4(9) 1(15) 1.2±0.5(8) 1.7±0.9(13) 1.8±0.8(9) Own area (ha/hh) 0.1±0.1(10) 0.04±0.02(9) 0.04±0.03(15) 0.1±0.1(8) 0.2±.1.2(13) 0.1±0.1(9) Multiowner pond (no) 1(6) 1.3±0.5(4) 1 (4) 1.7±1.2(6) 2.7±1.6(3) 1(3) Multiowner pond area (ha) 0.1±0.04(6) 0.1±0.1(4) 0.1±0.02(4) 0.3±0.5(6) 0.5±0.6(3) 0.3±0.1(3) Multiple-ownership ha/hh 0.02±0.01 0.02±0.01 0.02±0.01 0.03±0.04 0.07±0.02 0.03±0.01
hh= household; figures in the parentheses indicate number (N)
Chapter 3
98
Access to drinking water
Regardless of well-being group, around 90% of households were found to have
developed their own drinking water facilities through installation of a shallow tube-well
within their household premises. No significant difference was found between the
farmer types in terms of having a shallow tube-well for drinking water. A small number
of poor and intermediate farmers (Table 3.3) were found to be dependent on their
neighbour’s drinking water sources.
Toilet facilities
Out of the total sample, more than 50% of households had developed semi-concrete
enclosed toilet facilities, whereas approximately 40% of households were using non-
concrete closed toilet. A non-concrete enclosed toilet consists of an earthen pit
surrounded by straw and a bamboo fence. In the intermediate well-being class, most of
the farmers used semi-concrete enclosed toilets, and in the better-off category, the same
types of toilet facilities were used by most of the farmers (Table 3.3). A semi-concrete
enclosed toilet consists of a cemented ring and slab surrounded by a bamboo or
corrugated tin made fence. Better-off farmers were found to use concrete enclosed toilets
constructed of a cemented pit and wall. Poor farmers however, could not build concrete
enclosed toilet facilities. No better-off households used any non-concrete enclosed toilet
facilities.
Access to ponds
As the household ponds were constructed by farmers, they were considered as physical
capital (Little et al. 2007). Out of the total sample set (RF-60; NRF-58), 93% of RF and
72% of NRF households were found to have access to ponds through different tenures
such as their own, multi-owner, share-in and leased in arrangements (Figure 3.5). Sixty
three percent of RF and 45% of NRF farmers owned their own pond. The average

Chapter 3
99
number of household owned ponds in RF and NRF households was 1.2±0.6 and 1.4±0.6
respectively. RF and NRF households had similar sized (0.08 ha) ponds ranging from
0.01 to 0.40 ha and from 0.01 to 0.49 ha respectively. Although no significant variation
was found between the farmer types however, significant (P<0.05) variation was found
between the well-being groups in terms of the number and size of ponds. Only thirteen
farmers of both RF and NRF had multiple-ownership ponds (Figure 3.5) which were
larger than single owned ponds.
0%
20%
40%
60%
80%
100%
NRF RF NRF RF NRF RF
Poor Intermediate Better-off
Pe
rce
nt
of
ho
seh
old
Leased-in
Share-in
Multi-owner
Own
Figure 3.5: Access to different pond ownerships by farmer type and well-being (share in = sharecropping; multi-owner = multiple households ownership; own=single household
ownership pond).
Within the intermediate and poor well-being groups, NRF farmers tended to have access
to more and larger multiple household owned ponds compared to RF farmers. Very few
farmers had shared-in and leased-in ponds which did not show any statistical
significance between groups in terms of number and size.

Chapter 3
100
Possession of fishing gear
The tendency to use their own, traditional fishing gear such as barshi (hook gear), trap
gear, cast net, gill net, harpoon and seine net, was higher in seed producing households.
The majority of farmers were found to have their own cast net and trap gear. A
significantly (P<0.05) higher percentage of RF farmers (60%) owned barshi compared
to NRF household, which is a very effective method of catching fish from ricefields. In
addition, catching fish, particularly tilapia from the ricefields is a recreational event for
the children and older members within the household.
Access to rural infrastructure
Farming households had access to different levels of physical infrastructure such as paka
road (hard bitumen surface), school/college, local shop/market, mosque and temple,
kacha road (earthen road) etc. RF households tended to have better access to kacha
roads (earthen road) (P<0.05) than NRF households. Kacha roads were developed by the
local government and have enhanced the suitability of riceplots for fish seed production
through facilitating ditch development inside the riceplot and enlargement of at least one
dike. For instance, in the community – Bahagili, Rangpur (Chapter 6), the majority of
the fish seed producing riceplots are adjacent to the road. Positioning a riceplot adjacent
to the road allows the dike to be enlarged ensuring longer term water holding capacity
during the irrigated boro season.

Chapter 3
101
3.3.2.3 Natural capital
Access to land
On average each household owned 0.08±0.07 ha homestead area with a range of 0.01 to
0.51 ha. There was no significant difference between RF (0.08 ha) and NRF (0.07 ha)
households in homestead landholdings. However, there was a significant (P<0.05) effect
of well-being on farmer type in the possession of homestead area. The better-off
households had larger holdings than intermediate and poor households in the case of
both RF and NRF households (Table 3.4).
The average farm household studied possessed their own agricultural land with a mean
landholding of 0.89±1.04 ha ranging from 0.0 ha (landless) to 6.45 ha. Among farmer
types, RF households had larger (P<0.05) landholdings (1.15±01.20 ha) compared to
NRF (0.63±0.76 ha) households. The level of well-being significantly (P<0.05) affected
the landholding of farmers. Poor, intermediate and better-off households had average
landholdings of 0.34±0.29, 0.83±0.55 and 2.06±1.44 ha respectively (Table 3.4). Apart
from the single household owned land, access to land through sharecropping was found
to be an important land tenure mechanism among poorer households. In addition, land
was accessed by relatively few households through multiple-ownership, leasing-in and
mortgaging-in in the poor and intermediate well-being groups.
Table 3.4: Landholdings of sampled households by farmer type and well-being
Poor Intermediate Better off Household characteristics RF NRF RF NRF RF NRF
Homestead (ha/hh) 0.06±0.06(24) 0.05±0.04(31) 0.07±0.03(20) 0.09±0.10(15) 0.13±0.12(16) 0.11±0.05(12) Own land (ha/hh) 0.40±0.29(24) 0.29±0.30(31) 1.02±0.60(20) 0.58±0.37(15) 2.44±1.55(16) 1.41±1.15(12) Share-in (ha/hh) 0.24±0.16(9) 0.45±0.23(13) 0.26±0.06(5) Share-out (ha/hh) 0.45±0.37(2) 0.40±0.42(2) 0.54±0.30(2) Multi-owner (ha/hh) 0.24±0.04(2) 0.22±0.19(2) 0.06±0.12(2) 0.28(1) Leased-in (ha/hh) 0.15±0.14(4) 0.08(1) 0.26±0.12(2) Mortgage-in (ha/hh) 0.24±0.20(3) 0.14(1) Mortgage-out (ha/hh) 0.33(1) 0.67±0.32(2)
hh= household; figures in the parentheses indicate number (N)
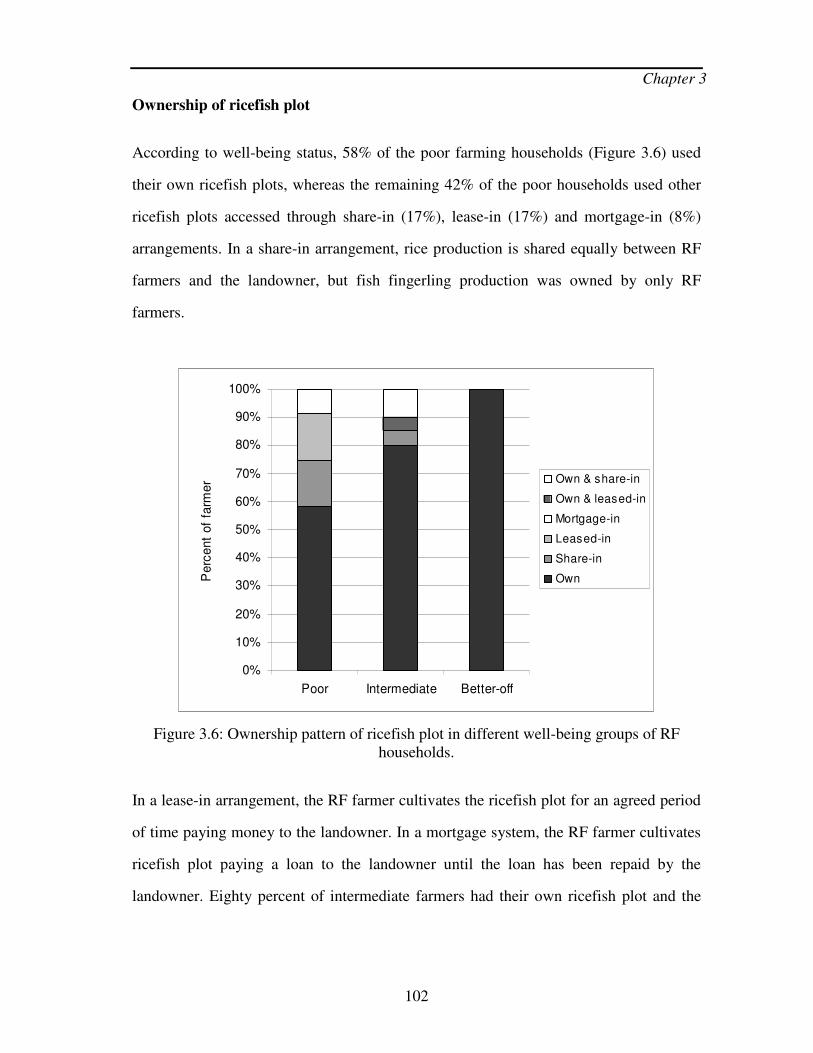
Chapter 3
102
Ownership of ricefish plot
According to well-being status, 58% of the poor farming households (Figure 3.6) used
their own ricefish plots, whereas the remaining 42% of the poor households used other
ricefish plots accessed through share-in (17%), lease-in (17%) and mortgage-in (8%)
arrangements. In a share-in arrangement, rice production is shared equally between RF
farmers and the landowner, but fish fingerling production was owned by only RF
farmers.
0%
10%
20%
30%
40%
50%
60%
70%
80%
90%
100%
Poor Intermediate Better-off
Pe
rce
nt
of
farm
er Own & share-in
Own & leased-in
Mortgage-in
Leased-in
Share-in
Own
Figure 3.6: Ownership pattern of ricefish plot in different well-being groups of RF households.
In a lease-in arrangement, the RF farmer cultivates the ricefish plot for an agreed period
of time paying money to the landowner. In a mortgage system, the RF farmer cultivates
ricefish plot paying a loan to the landowner until the loan has been repaid by the
landowner. Eighty percent of intermediate farmers had their own ricefish plot and the

Chapter 3
103
remaining 15% had other types of access, however all of the better-off households
(100%) owned the riceplot used for fish seed production.
Ricefish plot, ditch and dike
The average riceplot area accessed by a farm household was 0.17±0.27 ha ranging from
0.01 to 1.62 ha. A significant difference (P<0.05) was found between ricefish plot areas
of different well-being groups. The average area of the better-off farmers’ riceplots was
0.26±0.4 ha followed by intermediate (0.17±0.22) and poor (0.11±0.09) households
(Table 3.5). Poor, intermediate and better-off households used 30, 23 and 16% of the
total own land respectively for ricefish plots.
Table 3.5: Various dimensions of ricefish plots accessed by RF households according to their well-being status
Well-being Criteria of ricefish plot, ditch and dike Poor Intermediate Better-off Plot area (ha/hh) 0.11±0.09(24) 0.17±0.22(20) 0.26±0.43(16) Plot distance from homestead (m) 164.16±188.61 61.47±199.96 148.41±177.43 Average ditch size (m2) 2.82±4.56 2.93±3.16 2.22±4.02 Average depth of ditch (m) 0.96±0.66 0.96±0.70 0.89±0.76 Average dike width (m) 0.38±0.33 0.45±0.33 0.57±0.42 Average dike height (m) 0.43±0.27 0.50±0.35 0.51±0.41
hh=household; figure inside the parentheses indicating number (N)
There was no significant difference found between the well-being groups in terms of the
distance of riceplots from their households. The average distance from household to
riceplot was 125 m. There were no significant differences found between the RF farmers
of different well-being groups in terms of ditch size, ditch depth, dike width and dike
height of their ricefish plots. Relatively, the ditch area among poor and intermediate
households was larger than in better-off households suggesting poor and intermediate
households intensified the utility of their riceplots compared to better-off households. In
addition it was also observed that the configuration of ditches in most of the farmer’s
riceplots was rectangular in shape.

Chapter 3
104
Soil type of ricefish plot
According to farmers’ perceptions and direct observation at the field level, soil quality
was found to be clay-loam in the ricefish plots of the majority of households (63%)
followed by loam (17%) and sandy-loam (15%). Clay-loam soil has a higher water
retention capacity which facilitated farmers to hold water for a longer period of time in
their ricefish plots.
Level of ricefish plot and water holding capacity
According to farmer perceptions of riceplot water holding capacity, the topographic
level of ricefish plot has been categorized into low and medium level. Over 70% farmers
indicated their riceplot level as medium. The medium level of riceplots implies physical
characteristics which include being free from the threat of periodic flooding due to
sudden heavy rainfall and periodic drought during the dry season. More than 50% of
farmers mentioned that their plots had medium water holding capacity followed by good
(25%) and poor (20%).

Chapter 3
105
Sources of water to ricefish plot
Overall, about 60% of farmers developed their own shallow pump facilities and the
remaining farmers were dependent on renting access to shallow (30%) and deep tube-
wells (10%). Well-being level significantly (P<0.05) affected the access of farmers to
water supply facilities from irrigation pumps into their ricefish plots. Among the well-
being groups, 81% of better-off farmers exploited groundwater using their shallow tube-
well to supply their own riceplots followed by 65% intermediate and 37% poorer.
Better-off farmers tended to have their own irrigation pumps (machine and borehole)
whereas poorer households tended to only have a borehole (Figure 3.7).
Figure 3.7: Whole set of groundwater irrigation pump belongs to a better-off farmer (left) poorer households only had the borehole to which they attached a rented pump-set
(right).
Those intermediate and poor farmers who did not own their own irrigation facilities
depended on water supply from rented shallow and deep tube-wells. Some poor farmers
tended to rent pump-sets to use with their own borehole. From field observation it was
estimated that installation of a bore hole cost about US$ 53.3, a pump-set required an
additional US$ 161 totalling US$ 200 (Table 3.6).
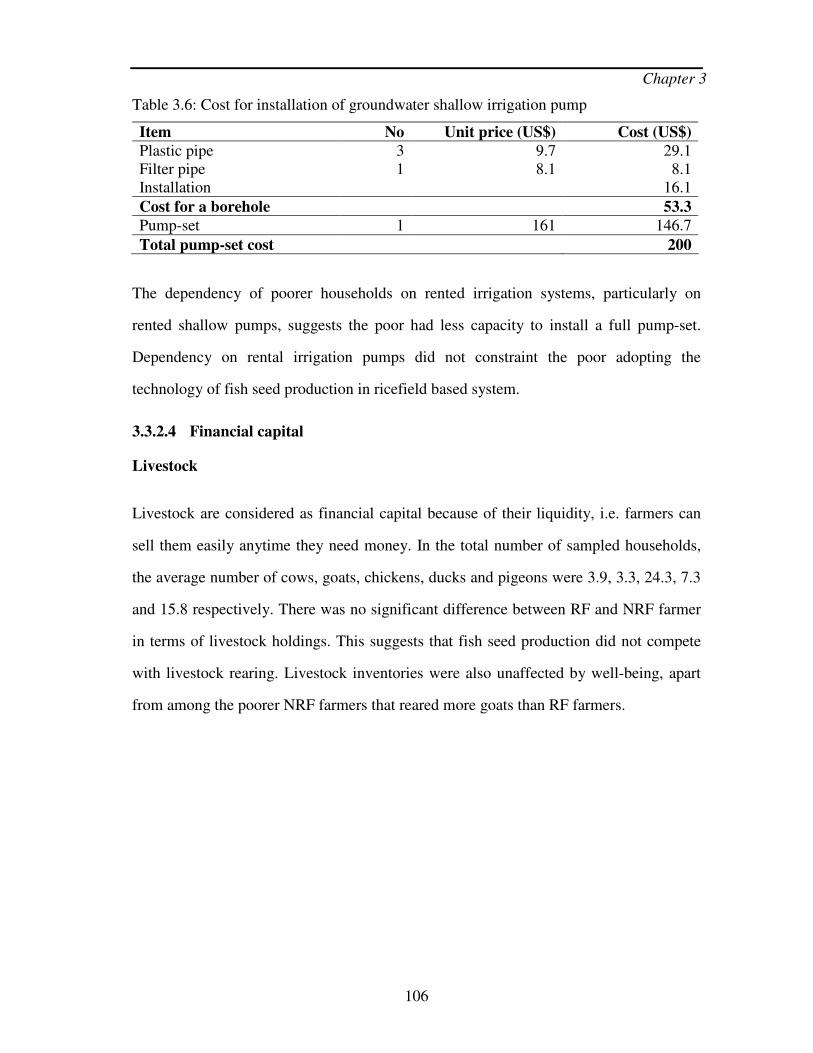
Chapter 3
106
Table 3.6: Cost for installation of groundwater shallow irrigation pump
Item No Unit price (US$) Cost (US$) Plastic pipe 3 9.7 29.1 Filter pipe 1 8.1 8.1 Installation 16.1
Cost for a borehole 53.3 Pump-set 1 161 146.7
Total pump-set cost 200
The dependency of poorer households on rented irrigation systems, particularly on
rented shallow pumps, suggests the poor had less capacity to install a full pump-set.
Dependency on rental irrigation pumps did not constraint the poor adopting the
technology of fish seed production in ricefield based system.
3.3.2.4 Financial capital
Livestock
Livestock are considered as financial capital because of their liquidity, i.e. farmers can
sell them easily anytime they need money. In the total number of sampled households,
the average number of cows, goats, chickens, ducks and pigeons were 3.9, 3.3, 24.3, 7.3
and 15.8 respectively. There was no significant difference between RF and NRF farmer
in terms of livestock holdings. This suggests that fish seed production did not compete
with livestock rearing. Livestock inventories were also unaffected by well-being, apart
from among the poorer NRF farmers that reared more goats than RF farmers.

Chapter 3
107
Access to credit
Farmers received credit from different organizations, such as government banks and
organizations, local NGOs, large national NGOs and money lenders and neighbours
(Figure 3.8).
0%
15%
30%
45%
60%
75%
90%
105%
Contr
ol
Ric
efish
Contr
ol
Ric
efish
Contr
ol
Ric
efish
Poor Medium Better-off
Perc
ent
of
farm
er Neighbours & money
lendersLocal NGOs
Large national NGOs
Gov. bank & organization
Figure 3.8: Percent of households received credit from different organizations.
A significant difference (P<0.05) was found between the proportion of RF and NRF
households receiving credit from different organizations (Figure 3.8). About 59% of RF
farmers received credit from major financial organizations which was higher than NRF
farmers. This was due to the role CARE played in mediating between farmers and credit
providing organizations which possibly improved the access of RF households to larger
institutional credit. Relatively poor and intermediate households tended to receive credit
from local and large national NGOs as well as from money lenders and neighbours.

Chapter 3
108
Table 3.7: Financial capital of sampled households by farmer types and well-being groups
Poor Intermediate Better off Financial capital
RF NRF RF NRF RF NRF
Livestock (no/hh) Cow 4.9±3.2(22) 3.3±1.6(25) 3.9±2.2(14) 3.5±1.6(13) 4.1±2.5(14) 3.3±1.2(11) Goat 3.7±2.4(15) 2.3±1.3(14) 2.9±2.1(12) 3.2±2.3(5) 3.8±2.67(12) 4.1±1.6(7) Chicken 14.0±10.8(21) 14.9±19.0(25) 58.7±140.8(17) 20.1±10.9(15) 15.0±16.8(14) 29.4±19.9(11) Duck 7.5±6.4(17) 4.9±5.7(18) 11.7±18.5(14) 6.3±5.3(13) 4.2±2.9(13) 11.4±10.1(8) Pigeon 8.7±3.1(3) 19.0±13.7(4) 6.0 (1) 40.0(1) 10(1) Access to credit (US$/hh) Govt. bank & org. 110.6±67.6(7) 80.7±48.4(3) 206.1±84.5(9) 137.1±34.2(2) 229.4±115.8(10) 261.3±101.6(5) Local NGOs 112.9±39.5(8) 137.1±95.4(4) 112.9±22.8(2) 32.3 (1) 96.8 (1) 32.3 (1) Large national NGOs 129.0±86.4(4) 80.7±89.5(6) 80.7(1) 84.7±42.4(4) 80.7 (1) 56.5±34.2(2) Lenders & neighbours 24.2±11.4(2) 40.3±11.4(2) 109.7±67.9(5) 182.8±260.7(3) 96.8±91.2(2)
hh= household; figures in the parentheses indicate number (N)
There was no significant difference between the amount of current credit received by RF
(182.26$) and NRF households (189.33$) from government bank and other organization.
However, well-being significantly (P<0.05) affected the amount of credit received by RF
and NRF farmers. The size of credit and number of receivers were comparatively higher
in the better-off households (Table 3.7). Better-off NRF farmer’s credit amount was
found to be larger than better-off RF farmers. These findings revealed that there was
only minimal formal lending from banks, probably because the bank does not target
poorer households as they cannot provide sufficient collateral such as a bond
landownership and the assurance to repay within the stipulated time.
3.3.2.5 Social capital
Social capital operates at various levels of human life in the rural areas of Bangladesh.
In a livelihood framework, it overlaps and interacts with other assets and strategies in
different ways. Spreading knowledge of fish fingerling production from primary to
secondary farmers through informal relationships is a building block of social capital in
this context.
Access to land by means of different tenures such as share, lease, and mortgage systems
is an important part of social capital. Among RF farmers (i.e. seed producers), a number

Chapter 3
109
of poor farmers were found to gain access to riceplots through different means of tenure.
Some poor farmers also gained access to ponds through share-in tenure, depending on
social relationships. Access to drinking water and shallow pumps for riceplot irrigation
is another building block of social capital. Receiving credit from neighbours and money
lenders depends on social relationships. Gifting fish seed and foodfish to neighbours and
relatives contributed to social capital in seed producing communities (Figure 3.13).
3.3.3 Livelihood strategies and outcomes
3.3.3.1 Agriculture crop production and income
Farmers cultivated different agriculture crops such as amon rice, boro rice, aus rice,
potato, vegetables, wheat, jute, mustard, betel nut and banana. All of the farmers (100%)
belonging to RF and NRF households cultivated amon and boro rice (Table 3.8).
Cultivation of aus rice between the boro and amon season was practised by only 2 RF
and 2 NRF farmers. The second most important field crop was potato cultivated by 47%
households of both types. Potato cultivation is likely to compete for resources with fish
seed production in ricefields.
Table 3.8: Cultivation of different crops and income by farmer type
RF NRF Crops
Percent farmer cultivated
Area (ha/hh)
Expenditure (US$/hh)
Income (US$/hh)
Percent farmer cultivated
Area (ha/hh)
Expenditure (US$/hh)
Income (US$/hh)
Amon 100 (60) 0.9 70.0 243.5 100 (58) 0.7 50.3 167.7
Boro 100(60) 0.7 104.6 201.4 100(58) 0.5 88.4 153.6
Potato 46.7(28) 0.3 59.8 125.3 46.6(27) 0.2 47.7 58.6
Vegetable 36.7(22) 0.2 15.4 55.4 31.3(18) 0.2 13.3 28.4
Wheat 31.7(19) 0.8 28.6 35.3 25.9(15) 0.4 36.7 40.5
Jute 28.3(17) 0.3 18.3 11.9 15.5(9) 0.2 27.3 23.6
Mustard 10(6) 0.3 13.9 30.9 8.6(5) 0.2 4.5 11.8
Battle nut 20(12) 0.1 0.0 44.6 6.9(4) 0.2 0.4 65.7
Banana 8.3(5) 0.2 75.8 179.5 6.9(4) 0.3 48.8 58.9
Aus 3.3(2) 0.3 19.4 83.1 5.1(3) 0.5 21.2 50.3
hh=household; figures inside the parentheses indicate number (N)

Chapter 3
110
Potato farming became popular as a cash crop due to the development of cold storage
facilities in northern Bangladesh and improved opportunities for marketing after the
construction of the Jamuna Bridge.
Other crops such as wheat, jute, mustard, betel nut and banana were cultivated by a
smaller number of farmers in both RF and NRF groups (Table 3.8). The average area
cultivated by the RF farming households for amon rice, boro rice, wheat and potato were
found to be higher than by NRF households. The average area cultivated by the RF and
NRF farmers for amon rice were 0.9 and 0.7 ha respectively and for boro rice were 0.7
and 0.5 ha respectively. RF and NRF farmers used 0.82 and 0.39 ha for wheat
cultivation and 0.26 and 0.19 ha for potato growing respectively. The area of land used
by the RF farmer for growing aus rice, banana and betel nut was lower than NRF
households. Average per household land use, expenditure and income were found to be
higher in amon season. This was due to the ability of farmers to cultivate their maximum
land area during the rainy season.
Amon rice cultivation by farmer type and well-being
There were significant differences between farmer types in terms of per household land
use for amon cultivation and related expenditure, production and income (Table 3.9).
The area of land use for amon was found to be higher than in boro irrespective of farmer
type and well-being, relating to the dependence of boro rice on groundwater irrigation
and higher capital investment for fertilizers. These factors limited cultivation to smaller
areas than for amon.

Chapter 3
111
Table 3.9: Mean (±SD) area cultivated, production, expenditure and income per household from field crops by farmer types and well-being
Poor Intermediate Better off Crop production
RF NRF RF NRF RF NRF
A) Amon Area (ha/hh) 0.37±0.21 (24) 0.45±0.27 (31) 0.72±0.54(20) 0.46±0.33(15) 1.87±1.17(16) 1.42±0.95(12) Production (kg/hh) 1102.5±785.4 1320.8±888.9 2274.0±1435.3 1407.5±979.0 5350.6±3073.7 3970.0±2128.9 Production (kg/ha) 2780.3±1496.2 3027.2±970.5 3313.4±938.6 3074.7±784.9 3375.3±2427.9 3102.1±929.9 Expenditure (US$/hh) 27.9±21.5 34.6±30.5 53.3±36.6 33.9±27.3 154.2±107.9 111.1±80.7 Expenditure (US$/ha) 72.5±48.3 77.5±35.0 78.5±31.6 67.8±26.0 80.7±41.7 83.7±47.4 Income (US$/hh) 107.7±93.1 123.0±83.4 205.4±139.2 130.5±79.6 480.5±362.3 329.2±165.7 Income (US$/ha) 261.5±167.9 288.2±112.8 285.3±143.0 288.1±118.2 250.5±135.3 268.8±100.6 B) Boro Area (ha/hh) 0.27±0.19 (24) 0.37±0.24 (31) 0.64±0.46 (20) 0.34±0.17(15) 1.47±1.07 (16) 1.25±0.73 (12) Production (kg/hh) 1369.2±1146.2 1649.9±2600.5 2733.4±1905.9 1488.0±840.3 6226.6±4671.7 5368.3±3375.4 Production (kg/ha) 4894.9±1787.3 4993.1±1125.9 4352.0±1525.7 4335.3±1936.5 4282.5±1757.9 4433.9±1902.4 Expenditure (US$/hh) 44.5±34.5 63.4±41.1 94.0±62.3 56.7±41.6 210.9±191.9 197.8±149.6 Expenditure (US$/ha) 159.2±57.4 175.2±56.9 155.7±69.6 159.8±88.1 141.7±72.3 166.1±79.4 Income (US$/hh) 98.8±96.3 102.8±80.6 199.4±164.2 110.5±73.8 382.5±295.8 347.1±239.1 Income (US$/ha) 349.7±154.2 317.9±274.3 311.6±153.1 314.1±161.2 292.4±142.9 280.6±175.8 C) Potato Area (ha/hh) 0.18± 0.17 (8) 0.13± 0.10(11) 0.20± 0.16 (10) 0.13± 0.08 (8) 0.39±0.37 (10) 0.32±0.16 (8) Production (kg/hh) 2585.0±3927.5 965.5±1048.2 2546.5±2710.9 652.5±455.4 3676.0±4254.4 3673.1±3160.7 Production (kg/ha) 13376.1±6659.8 8106.3±6624.5 11450.2±7154.4 5636.7±3693.9 9729.4±8810.6 11019.3±7044.7 Expenditure (US$/hh) 48.6±79.3 23.0±21.0 62.4±75.2 20.3±16.4 66.2±61.6 103.0±93.2 Expenditure (US$/ha) 240.4±162.5 227.9±206.0 273.6±195.9 202.7±153.3 236.3±257.5 286.4±200.4 Income (US$/hh) 166.3±284.1 33.3±51.6 77.1±114.4 26.2±21.4 139.9±164.5 131.6±94.8 Income (US$/ha) 674.5±536.7 229.2±276.8 335.3±261.2 252.9±243.7 381.6±340.4 437.7±262.6 C) Vegetable Area (ha/hh) 0.10± 0.08 (6) 0.08± 0.03 (9) 0.11± 0.05 (9) 0.22± 0.17 (5) 0.30±0.38 (7) 0.36±0.40 (4) Production (Kg/hh) 308.3±515.2 114.4±113.26 166.7±222.7 367.6±439.2 394.3±381.9 593.0±815.9 Production (Kg/ha) 2348.1±3470.9 1657.7±1693.7 1126.5±1468.2 3669.9±4802.3 4727.1±4955.8 1403.9±1272.4 Expenditure (US$/hh) 19.4±27.6 6.4±8.5 13.8±10.9 13.5±20.8 14.1±16.4 28.5±21.8 Expenditure (US$/ha) 186.3±227.4 86.0±105.2 113.1±70.7 87.9±96.7 152.8±130.4 169.7±158.9 Income (US$/hh) 89.2±121.1 7.5±5.7 44.2±39.4 34.2±30.5 40.8±42.1 68.2±65.6 Income (US$/ha) 810.4±968.6 125.8±124.4 435.1±377.4 460.5±711.7 270.7±208.1 321.9±246.9 D) Wheat Area (ha/hh) 0.25± 0.11 (8) 0.20± 0.13 (8) 0.23±0.22 (3) 0.46±0.5 (5) 1.61± 3.5 (8) 0.98± 0.27 (2) Production (kg/hh) 537.5±245.5 278.8±282.1 386.7±260.3 1040.0±1279.9 481.9±623.9 940.0±254.6 Production (kg/ha) 2280.8±627.1 1549.9±896.8 2151.6±1560.5 2052.9±724.1 1250.9±919.7 1032.9±545.4 Expenditure (US$/hh) 27.8±12.6 16.6±19.9 16.1±13.9 59.4±76.8 33.4±52.9 56.5±11.4 Expenditure (US$/ha) 142.0±109.6 91.4±43.5 75.3±7.7 109.64±37.4 76.6±65.0 58.1±4.5 Income (US$/hh) 36.6±20.7 17.5±17.1 33.7±22.8 72.1±78.0 34.6±36.2 57.3±42.2 Income (US$/ha) 146.3±41.3 99.7±84.7 214.8±228.2 157.8±70.1 84.8±65.5 66.8±61.5
Figures inside the parentheses indicate number (N)
Well-being level significantly (P<0.05) affected the area of land used by farmers as well
as production, expenditure and income from amon. Poor RF farmers cultivated a smaller
amount of land compared to poor NRF farmers resulting in lower production and
income.
Boro rice cultivation
There was no significant difference between RF and NRF households for land use,
production, expenditure and income from boro cultivation. Well-being affected the the
use of land for the cultivation of boro rice. As with amon, poor RF farmers tended to use
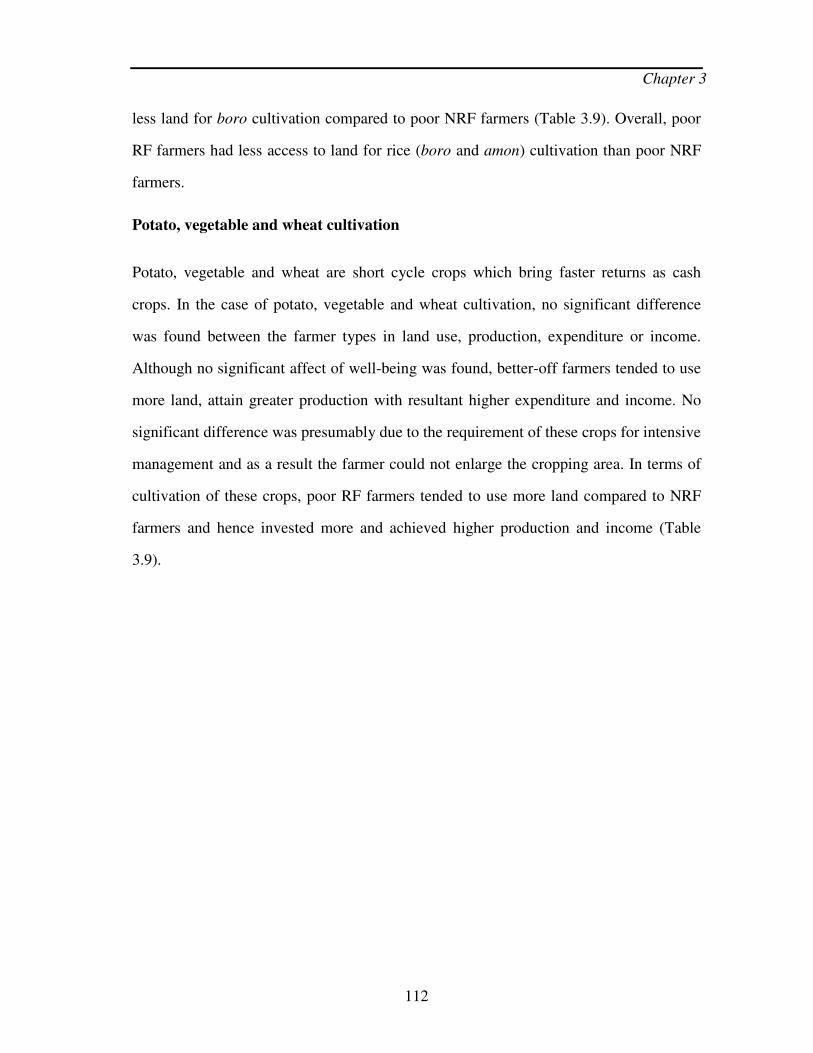
Chapter 3
112
less land for boro cultivation compared to poor NRF farmers (Table 3.9). Overall, poor
RF farmers had less access to land for rice (boro and amon) cultivation than poor NRF
farmers.
Potato, vegetable and wheat cultivation
Potato, vegetable and wheat are short cycle crops which bring faster returns as cash
crops. In the case of potato, vegetable and wheat cultivation, no significant difference
was found between the farmer types in land use, production, expenditure or income.
Although no significant affect of well-being was found, better-off farmers tended to use
more land, attain greater production with resultant higher expenditure and income. No
significant difference was presumably due to the requirement of these crops for intensive
management and as a result the farmer could not enlarge the cropping area. In terms of
cultivation of these crops, poor RF farmers tended to use more land compared to NRF
farmers and hence invested more and achieved higher production and income (Table
3.9).
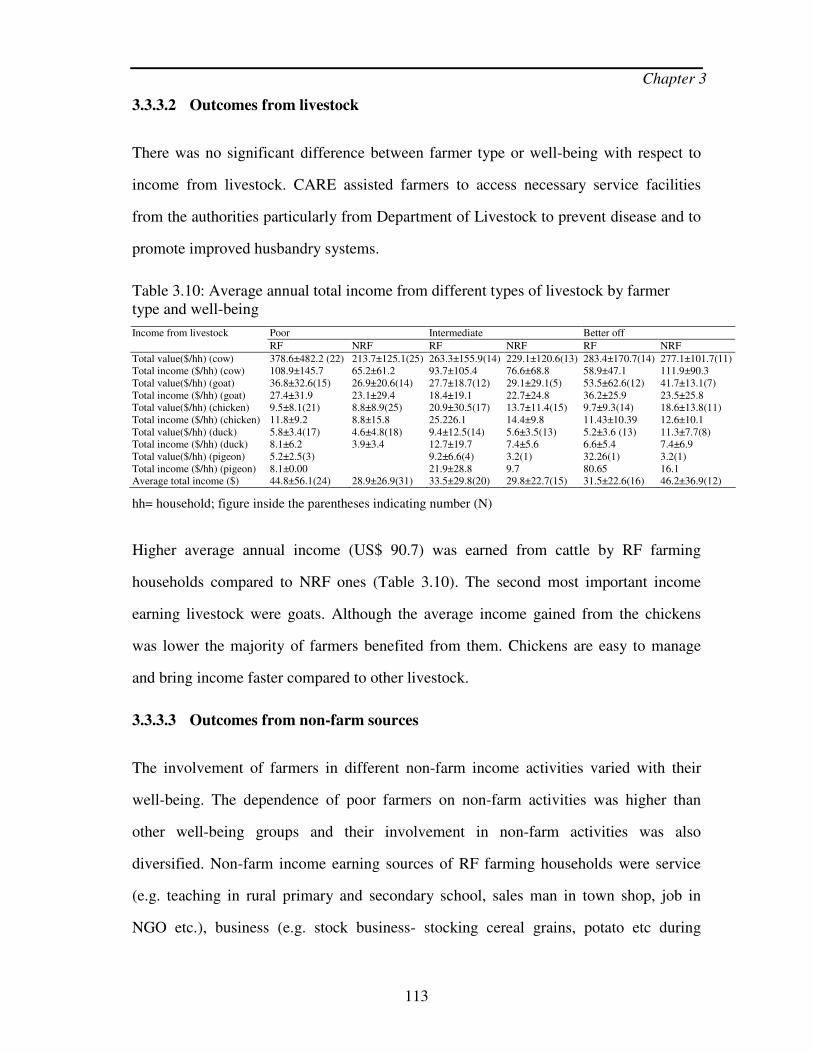
Chapter 3
113
3.3.3.2 Outcomes from livestock
There was no significant difference between farmer type or well-being with respect to
income from livestock. CARE assisted farmers to access necessary service facilities
from the authorities particularly from Department of Livestock to prevent disease and to
promote improved husbandry systems.
Table 3.10: Average annual total income from different types of livestock by farmer type and well-being
Poor Intermediate Better off Income from livestock
RF NRF RF NRF RF NRF
Total value($/hh) (cow) 378.6±482.2 (22) 213.7±125.1(25) 263.3±155.9(14) 229.1±120.6(13) 283.4±170.7(14) 277.1±101.7(11) Total income ($/hh) (cow) 108.9±145.7 65.2±61.2 93.7±105.4 76.6±68.8 58.9±47.1 111.9±90.3 Total value($/hh) (goat) 36.8±32.6(15) 26.9±20.6(14) 27.7±18.7(12) 29.1±29.1(5) 53.5±62.6(12) 41.7±13.1(7) Total income ($/hh) (goat) 27.4±31.9 23.1±29.4 18.4±19.1 22.7±24.8 36.2±25.9 23.5±25.8 Total value($/hh) (chicken) 9.5±8.1(21) 8.8±8.9(25) 20.9±30.5(17) 13.7±11.4(15) 9.7±9.3(14) 18.6±13.8(11) Total income ($/hh) (chicken) 11.8±9.2 8.8±15.8 25.226.1 14.4±9.8 11.43±10.39 12.6±10.1 Total value($/hh) (duck) 5.8±3.4(17) 4.6±4.8(18) 9.4±12.5(14) 5.6±3.5(13) 5.2±3.6 (13) 11.3±7.7(8) Total income ($/hh) (duck) 8.1±6.2 3.9±3.4 12.7±19.7 7.4±5.6 6.6±5.4 7.4±6.9 Total value($/hh) (pigeon) 5.2±2.5(3) 9.2±6.6(4) 3.2(1) 32.26(1) 3.2(1) Total income ($/hh) (pigeon) 8.1±0.00 21.9±28.8 9.7 80.65 16.1 Average total income ($) 44.8±56.1(24) 28.9±26.9(31) 33.5±29.8(20) 29.8±22.7(15) 31.5±22.6(16) 46.2±36.9(12)
hh= household; figure inside the parentheses indicating number (N)
Higher average annual income (US$ 90.7) was earned from cattle by RF farming
households compared to NRF ones (Table 3.10). The second most important income
earning livestock were goats. Although the average income gained from the chickens
was lower the majority of farmers benefited from them. Chickens are easy to manage
and bring income faster compared to other livestock.
3.3.3.3 Outcomes from non-farm sources
The involvement of farmers in different non-farm income activities varied with their
well-being. The dependence of poor farmers on non-farm activities was higher than
other well-being groups and their involvement in non-farm activities was also
diversified. Non-farm income earning sources of RF farming households were service
(e.g. teaching in rural primary and secondary school, sales man in town shop, job in
NGO etc.), business (e.g. stock business- stocking cereal grains, potato etc during
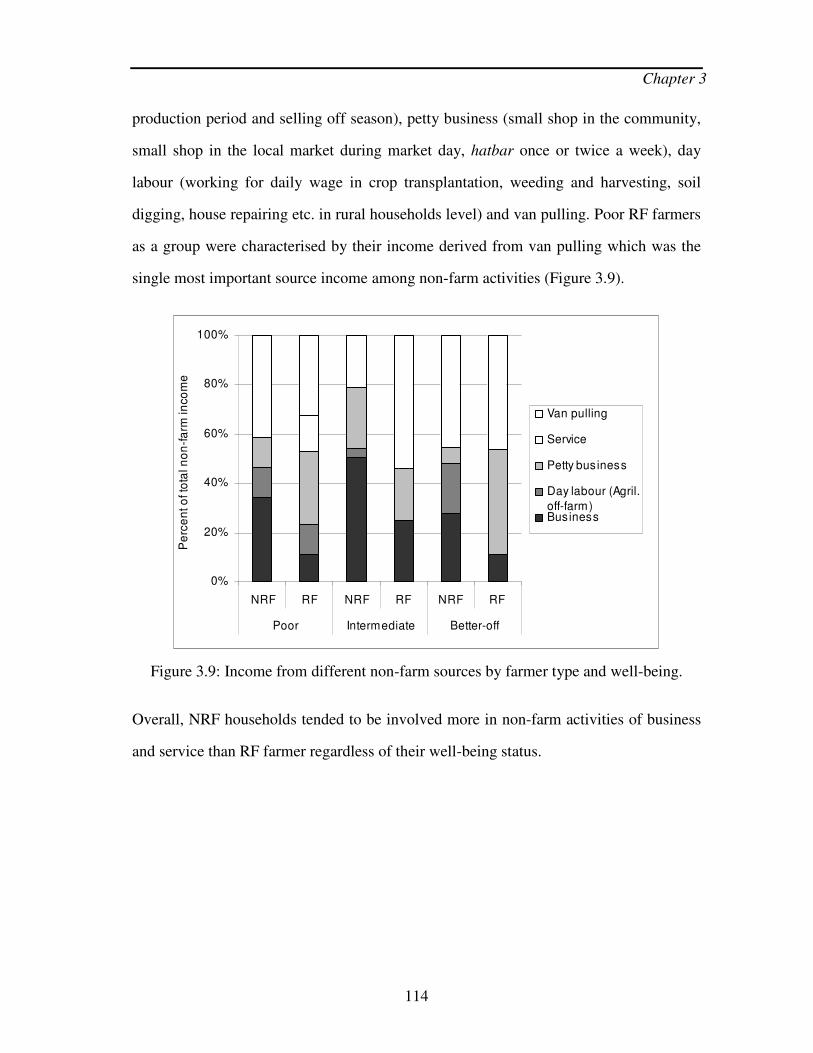
Chapter 3
114
production period and selling off season), petty business (small shop in the community,
small shop in the local market during market day, hatbar once or twice a week), day
labour (working for daily wage in crop transplantation, weeding and harvesting, soil
digging, house repairing etc. in rural households level) and van pulling. Poor RF farmers
as a group were characterised by their income derived from van pulling which was the
single most important source income among non-farm activities (Figure 3.9).
0%
20%
40%
60%
80%
100%
NRF RF NRF RF NRF RF
Poor Intermediate Better-off
Pe
rce
nt o
f to
tal n
on
-fa
rm in
com
e
Van pulling
Service
Petty business
Day labour (Agril.
off-farm)Business
Figure 3.9: Income from different non-farm sources by farmer type and well-being.
Overall, NRF households tended to be involved more in non-farm activities of business
and service than RF farmer regardless of their well-being status.

Chapter 3
115
3.3.3.4 Outcomes from fish seed producing riceplot
3.3.3.4.1 Rice production
Use of rice varieties
Various high yielding rice varieties (HYV is the generic name for genetically improved
rice varieties) were cultivated in the boro compared to the amon season by RF farmers in
their riceplots (Figure 3.10). During the boro season the rice varieties BR-28 (Brridhan
28) and BR-29 (Brridhan 29) were cultivated by more than 80% of households. The
same percentage of farmers cultivated BR-11 (Brridhan-11) in amon season.
0
10
20
30
40
50
60
70
80
90
BR-28 BR-29 BR-14 Other
HYV
BR-11 Swarna
Boro season Amon season
Pe
rce
nt
of
farm
er
Figure 3.10: Rice varieties cultivated in fish seed producing riceplot (HYV= High yielding varieties).
Chapter 3
116
Rice production in the boro season
There was no significant differences in input, production level or income per ha land
between well-being groups. Interestingly, poorer households used more organic manure
(cowdung) in riceplots which might have been an attempt to minimise their expenditure
on inorganic fertilizers.
Rice production in the amon season
There was no significant difference found between well-being groups in their input use
per ha both in boro and amon seasons in the ricefish plot (Table 3.11). Similarly, no
significant difference was observed in per ha income from rice production between
wealth classes.
Table 3.11: Rice production and its management in the ricefish plot in boro and amon season
Well-being Rice production in ricefish plot Poor Intermediate Better-off
Rice production (boro) Cowdung (kg/ha) 6115.7±4096.2 3119.6±2472.3 4231.1±5483.1 Urea (kg/ha) 214.9±110.4 229.7±151.4 187.7±117.1 TSP (kg/ha) 96.3±71.1 88.9±94.9 74.1±51.2 MP (kg/ha) 61.8±45.9 61.8±62.5 44.5±36.9 Zipsum (kg/ha) 14.8±22.9 39.5±46.2 24.7±34.9 Rice production (kg/ha) 5226.5±2496.9 5016.6±2649.9 5357.4±2504.4 Total expenditure (US$/ha) 143.1±68.8 124.5±91.9 155.1±98.1 Net income (US$/ha) 491.7±234.2 478.1±276.3 466.1±227.7 Rice production (amon) Urea (kg/ha) 98.8±68.6 128.4±115.2 61.8±43.3 TSP (kg/ha) 29.6±50.9 39.5±53.6 22.2±28.9 MP (kg/ha) 22.2±32.8 22.2±26.9 14.8±23.2 Rice production (kg/ha) 2702.2±1669.4 2954.1±1442.6 3280.2±725.4 Total expenditure (US$/ha) 43.6±9.3 47.7±17.4 52.9±39.4 Net income (US$/ha) 323.8±30.7 395.2±90.9 373.9±191.9
Figure inside the parentheses indicating number (N)
Overall, the use of inputs was found to be higher in the boro season compared to the
amon in the same riceplot. Moreover during the boro season farmers used organic
fertilizers and gypsum but not in the amon season. In the boro season per ha rice
production was much higher than the amon season for all well-being groups. Likewise,
in the boro season expenditure per unit area of riceplot was much higher than in the
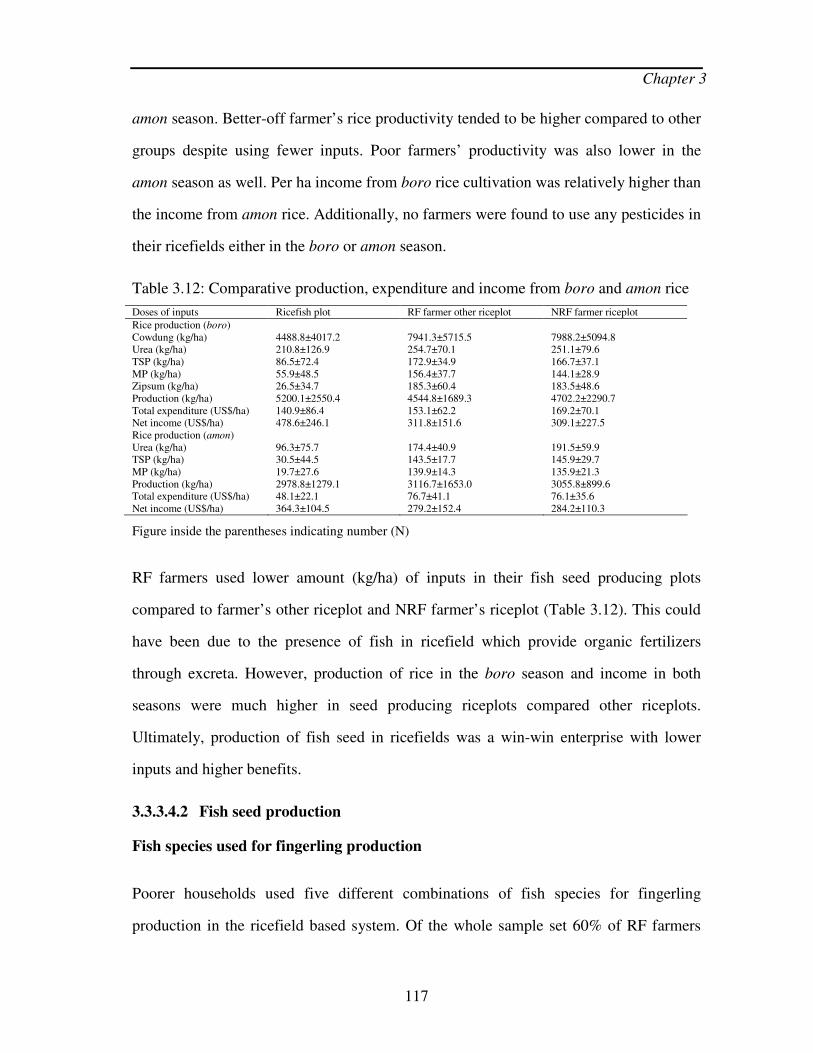
Chapter 3
117
amon season. Better-off farmer’s rice productivity tended to be higher compared to other
groups despite using fewer inputs. Poor farmers’ productivity was also lower in the
amon season as well. Per ha income from boro rice cultivation was relatively higher than
the income from amon rice. Additionally, no farmers were found to use any pesticides in
their ricefields either in the boro or amon season.
Table 3.12: Comparative production, expenditure and income from boro and amon rice
Doses of inputs Ricefish plot RF farmer other riceplot NRF farmer riceplot
Rice production (boro) Cowdung (kg/ha) 4488.8±4017.2 7941.3±5715.5 7988.2±5094.8 Urea (kg/ha) 210.8±126.9 254.7±70.1 251.1±79.6 TSP (kg/ha) 86.5±72.4 172.9±34.9 166.7±37.1 MP (kg/ha) 55.9±48.5 156.4±37.7 144.1±28.9 Zipsum (kg/ha) 26.5±34.7 185.3±60.4 183.5±48.6 Production (kg/ha) 5200.1±2550.4 4544.8±1689.3 4702.2±2290.7 Total expenditure (US$/ha) 140.9±86.4 153.1±62.2 169.2±70.1 Net income (US$/ha) 478.6±246.1 311.8±151.6 309.1±227.5 Rice production (amon) Urea (kg/ha) 96.3±75.7 174.4±40.9 191.5±59.9 TSP (kg/ha) 30.5±44.5 143.5±17.7 145.9±29.7 MP (kg/ha) 19.7±27.6 139.9±14.3 135.9±21.3 Production (kg/ha) 2978.8±1279.1 3116.7±1653.0 3055.8±899.6 Total expenditure (US$/ha) 48.1±22.1 76.7±41.1 76.1±35.6 Net income (US$/ha) 364.3±104.5 279.2±152.4 284.2±110.3
Figure inside the parentheses indicating number (N)
RF farmers used lower amount (kg/ha) of inputs in their fish seed producing plots
compared to farmer’s other riceplot and NRF farmer’s riceplot (Table 3.12). This could
have been due to the presence of fish in ricefield which provide organic fertilizers
through excreta. However, production of rice in the boro season and income in both
seasons were much higher in seed producing riceplots compared other riceplots.
Ultimately, production of fish seed in ricefields was a win-win enterprise with lower
inputs and higher benefits.
3.3.3.4.2 Fish seed production
Fish species used for fingerling production
Poorer households used five different combinations of fish species for fingerling
production in the ricefield based system. Of the whole sample set 60% of RF farmers

Chapter 3
118
and more than 50% of farmers from all well-being groups used tilapia as a common
species along with common carp and other species for fingerling production (Figure
3.11). Overall, poor and intermediate households managed to access tilapia as easily as
better-off.
0%
10%
20%
30%
40%
50%
60%
70%
80%
90%
100%
Poor Medium Better-off
Pe
rce
nt o
f fa
rme
r
Common carp
Common carp & others
Tilapia & others
Tilapia, common carp & others
Tilapia & common carp
Figure 3.11: Species combination for fish fingerling production by well-being group.
Production of fingerlings
The average production of fingerling in riceplots of the poor, intermediate and better-off
households was 34.7, 71.3 and 76.6 kg respectively (Table 3.13).
Table 3.13: Input uses, production of fingerling and associated uses for different purposes of households and income from fingerlings by well-being group
Well-being Input used, production and uses of fish fingerling Poor Intermediate Better-off
Feeding (kg/household) 14.1±23.5 51.0±58.2 21.9±65.8 Total production (kg/household) 34.6±40.4(24) 71.2±81.8(20) 76.6±140.5(16) Total production (kg/ha) 315.1±448.3 419.1±371.7 294.6±326.7 Consumption (kg/ household) 10.1±13.8 28.5±27.8 13.5±26.4 Restocking (kg/ household) 7.5±10.2 15.8±18.8 14.4±28.2 Gifting (kg/ household) 0.1±0.4 0.7±2.9 0.7±2.5 Sale (kg/ household) 17.1±26.9 26.3±47.5 47.9±122.1 Expenditure (US$/ household) 1.6±3.8 3.3±4.7 9.1±28.1 Expenditure (US$/ ha) 14.9±42.0 19.7±21.3 34.7±65.3 Net income (US$/ household) 22.6±25.8 46.1±78.9 55.1±96.8 Net income (US$/ ha) 205.6±286.3 271.1±358.4 211.9±225.2
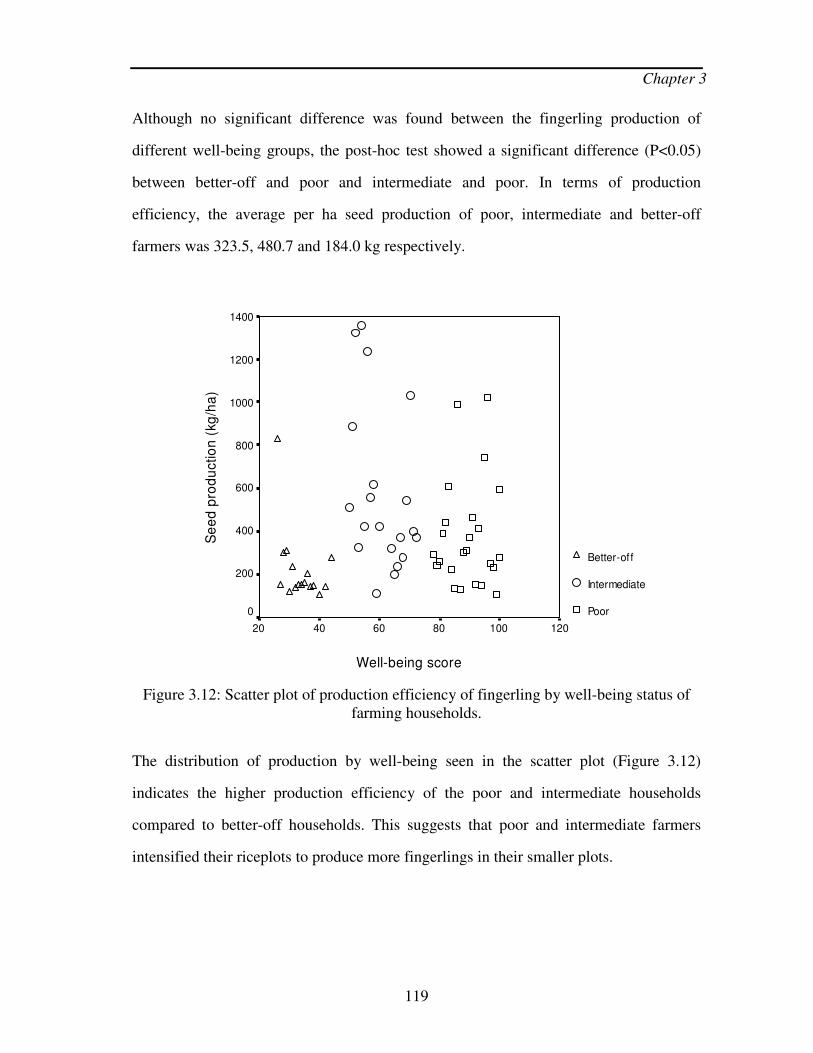
Chapter 3
119
Although no significant difference was found between the fingerling production of
different well-being groups, the post-hoc test showed a significant difference (P<0.05)
between better-off and poor and intermediate and poor. In terms of production
efficiency, the average per ha seed production of poor, intermediate and better-off
farmers was 323.5, 480.7 and 184.0 kg respectively.
Well-being score
12010080604020
Se
ed
pro
du
ctio
n (
kg/h
a)
1400
1200
1000
800
600
400
200
0
Better-of f
Intermediate
Poor
Figure 3.12: Scatter plot of production efficiency of fingerling by well-being status of farming households.
The distribution of production by well-being seen in the scatter plot (Figure 3.12)
indicates the higher production efficiency of the poor and intermediate households
compared to better-off households. This suggests that poor and intermediate farmers
intensified their riceplots to produce more fingerlings in their smaller plots.

Chapter 3
120
Related factors of seed production in riceplots
In the case of feeding, intermediate farmers used a higher amount of feed (50.95 kg)
compared to other groups (Table 3.13). The correlation analysis (Table 3.14) suggested
seed production (kg/ha) was found to be significantly (P<0.01) correlated with use of the
amount of cowdung and supplementary feeds (such as rice bran, wheat bran etc.) used.
However, well-being status was found to be negatively correlated with fingerling
production (kg/ha).
Table 3.14: Correlation matrix between the seed production in riceplots and other related factors
Well-being (score)
Riceplot area (ha)
Fertilizer used (kg)
Cowdung (kg/ha)
Feed used (kg/ha)
Riceplot used (ha) 0.407**
Fertilizer used (kg/ha) 0.206 0.008
Cowdung (kg/ha) 0.189 0.038 0.598
Feed used (kg/ha) 0.011 0.063 0.414 0.438
Seed production (kg/ha) -0.007 0.034 0.297* 0.356** 0.930**
* Correlation is significant at the 0.05 level (2-tailed).
** Correlation is significant at the 0.01 level (2-tailed).
Following stepwise regression analysis, the use of feed explains 49% of the variability
of seed production (kg/ha) in model 1 (Table 3.15). Model 2 combining feed and
fertilizers explains 50.25% variability of seed production (kg/ha). Comparing the two
models, it could be noted that use of supplementary feed has a considerable influence on
per ha fingerling production. In addition, inorganic fertilizers contributed to fingerling
production although it was used for primarily rice production.

Chapter 3
121
Table 3.15: Regression output on seed production from the ricefish plot in farming households
Model Explanatory variable B Coefficients
R Square Adjusted R Square
F value
(Constant) 0.243 1
Fertilizer used (kg/ha) 0.910** 0.865 0.862 370.551
(Constant) 0.425
Riceplot used (ha) 0.953**
2
Fertilizer used (kg/ha) -0.113*
0.874 0.870 197.77
** Significant at 0.01 confidence level; * Significant at 0.05 confidence level
Dependent variable: Seed production (kg/ha)
Use of fish fingerlings
A significant difference (P<0.05) was found between well-being categories in terms of
the use of fingerlings for household consumption. During the boro season, i.e. very early
season of fish production in culture as well as natural environment, seed producing
households ate large sized fingerlings, mainly tilapia, from their riceplots. Poor (10.04
kg; about 30% of their total production) and intermediate (28.48 kg; about 40% of their
total production) households consumed a relatively higher proportion of their total
production compared to better-off (13.48 kg; about 18% of their total production)
households. Moreover, intermediate and better-off households restocked more into their
household ponds and riceplots compared to poorer households (Figure 3.13).

Chapter 3
122
0 5 10 15 20 25 30 35 40 45 50 55 60 65 70 75 80 85
Poor
Intermediate
Better-off
Amount of fry and fingerling (kg)
Gifting (kg)
Re-stocking
Household consumption (kg)
Sale (kg)
Total production (kg)
Figure 3.13: Uses of fish seed/fingerling for different purposes.
Poorer households also sold 50% of their total production as fingerlings and foodfish
which was higher than the intermediate group (Figure 3.13).
Sale of fish fingerlings
Out of the total number of RF farmers (n = 60) 45% farmers sold seed to fry traders
(Figure 3.14), which indicated the importance of this group in the decentralised seed
marketing system. About 25% of poor and intermediate producers sold fingerlings
directly to farmers/neighbours in their community who then stocked them into their
pond for foodfish production. Around 13% of farmers sold large seed as foodfish in the
market. Poorer households disposed of their seed in a greater number of ways compared
to other categories.

Chapter 3
123
0%
10%
20%
30%
40%
50%
60%
70%
80%
90%
100%
Poor Intermediate Better-off
Pe
rce
nt o
f RF
fa
rme
rs Not sold
Farmer & market
Fry trader & farmer
Farmer
Market
Foodfish trader
Fry trader
Figure 3.14: Importance of different marketing channels for selling of fish juveniles.
Better-off households spent more compared to others possibly due to their greater use of
hired labour for many activities particularly rice transplantation and weeding in larger
plots (Table 3.13). On the contrary, the lower expenses associated with management of
poor and intermediate households suggest they carried out activities in riceplots
themselves due to lack of money. The average income of better-off farmers from seed
production was US$ 55.1 compared with intermediate at US$ 46.1 was substantially
more than the poor at US$ 22.6 (Figure 3.15). However poor (US$1.3/kg) and
intermediate households (US$1.8/kg) sold seed at slightly higher prices than better-off
households (US$1.2/kg). Average annual per ha total income from riceplots collectively
was (boro US$ 476.6 + amon US$ 239.4 + fish fingerling US$ 230.0) US$ 945.9.

Chapter 3
124
0
20
40
60
80
100
120
140
160
180
Poor Intermediate Better-off
Ne
t in
co
me (
US
$/h
ou
se
ho
ld)
Rice
Fingerling
Figure 3.15: Income per household from rice (boro and amon) and fish fingerling.

Chapter 3
125
3.3.3.5 Outcomes from fish production in household ponds
3.3.3.5.1 Production and income from own pond
Out of the total sample, 38 (63%) RF and 26 (45%) NRF farmers were found to own
their own pond. Production was based on stocked fish seed from different sources
including their own riceplot, fry traders, neighbours and hatcheries (Figure 3.16).
0%
15%
30%
45%
60%
75%
90%
105%
NRF RF NRF RF NRF RF
Poor Intermediate Better-off
Pe
rce
nt o
f fa
rme
r Hatchery
Neighbour
Fry trader
Own and fry trader
Own
Figure 3.16: Source of fish seed stocked in own pond by farmer type and well-being.
The majority of RF farmers stocked fingerlings produced in their own ricefield based
systems. Particularly, in every well-being group, a substantial proportion of RF farmers
stocked fingerlings from their own sources and from fry traders. NRF farmers within all
well-being groups tended to purchase seed from fry traders, while some collected
fingerlings from neighbouring RF farmers, which suggests that they were depending on
the local seed sources to some extent. A small percentage of RF farmers bought fry
(dhani) for stocking into their pond from hatcheries.

Chapter 3
126
There was a significant difference (P<0.05) between farmer types and a significant affect
of well-being on the average production and income from fish (Figure 3.17).
0
50
100
150
200
250
300
350
400
450
NRF RF NRF RF NRF RF
Poor Intermediate Better-off
Pro
du
ctio
n (
kg
)/h
ou
se
ho
ld
0
20
40
60
80
100
120
140
160
180
200
Inco
me
(U
S$
)/h
ou
se
ho
ldProduction (kg)/household
Income (US$)/household
Figure 3.17: Pond production and income by farmer type and well-being.
While no significant difference was found between RF and NRF farmers in terms of
their own pond size, the average production from household ponds was 196.7 and 119.2
kg respectively, with average net incomes of 94.5 and US$ 51.2 respectively. In terms of
production efficiency (kg/ha) RF households were found to be higher compared to other
well-being groups (Table 3.16). Poor and intermediate RF farmers invested less cash in
pond culture than NRF farmers as they largely used their own source of fish seed. The
better-off RF farmers invested more than the NRF as they tended to produce fish
commercially stocking different types of fingerlings from other sources and providing
supplementary feed and other inputs.

Chapter 3
127
Table 3.16: Fish production in ponds and income by farmer type and well-being
Poor Intermediate Better off Pond production
RF NRF RF NRF RF NRF
Single ownership pond Production (kg/hh) 88.1±78.5 69.0±53.9 129.5±41.1 74.4±54.4 395.8±397.1 191.6±236.8 Production (kg/ha) 2000.7±1114.9 1538.8±735.8 2882.5±1432.6 1141.1±979.8 2576.2±1148.1 1489.4±647.8 Value (US$/hh) 73.2±47.0 50.5±37.6 40.4±25.5 51.9±32.1 226.9±234.9 91.7±75.9 Expenditure (US$/hh) 7.9±5.6 14.2±16.4 9.7±8.1 16.1±15.7 53.6±59.5 11.9±9.4 Net income ($) 65.3±44.8 36.4±32.9 45.7±45.9 35.9±24.1 173.4±190.6 79.7±73.5 Multiple ownership pond Production (kg/pond) 106.75±39.30 105.3±36.9 142.5±20.6 210.7±221.3 435.0±493.9 190.0±103.9 Production (kg/ha) 1525.7±982.7 1276.2±1146.4 1398.9±219.7 1115.5±747.9 958.6±304.3 762.4±231.4 Production/hh 28.5±14.6 20.6±3.1 33.6±4.4 23.7±17.1 66.4±21.3 20.3±6.9 Value ($/hh) 19.31±10.2 11.4±1.8 17.9±6.9 15.0±11.5 49.3±13.0 11.6±2.3 Expenditure ($/hh) 1.1±0.7 2.1±0.6 2.3±0.2 2.0±1.5 3.9±2.3 2.6±0.8 Net income ($/hh) 18.2±9.9 9.4±1.5 15.7±7.0 13.1±10.2 45.4±10.9 9.0±1.9
hh - household
3.3.3.5.2 Production and income from multiple-ownership ponds
A small number of RF (13) and NRF (13) farmers had multiple-ownership ponds.
Within this group of farmers, some RF farmers stocked seed from their own sources.
Out of 13 RF farmers, 3 poor, 1 intermediate and 1 better-off farmer stocked fingerlings
from their own sources along with seed purchased from fry traders (Figure 3.18). In
addition, 1 poor NRF and 1 intermediate NRF farmer purchased fingerlings from
neighbours (RF farmer) to stock into their multiple-ownership ponds.
0
1
2
3
4
5
6
7
NRF RF NRF RF NRF RF
Poor Intermediate Better-off
Num
ber
of
farm
er
Ow n and fry trader
Neighbour
Hatchery
Fry trader
Figure 3.18: Sources of fish seed stocked in multiple-ownership pond by farmer type and well-being.

Chapter 3
128
There was no significant difference found between farmer types and no affect of well-
being in terms of production and income from the multiple-ownership pond (Table
3.16). However, in relative terms productivity and net income were higher in RF
household ponds than NRF irrespective of well-being groups. Such attitudes of poor and
intermediate farmers suggest that small farmers tended to utilise their pond resources
efficiently. Alongside RF farmers (i.e. seed producers), farmer level seed production was
found to contribute to fish production in multiple-ownership ponds of NRF farmers.
Multiple ownership ponds tended to be managed less intensively. This was due to the
inability of farmers to come to a common consensus over the use of inputs such as seed
and feed in specific times of the production period. Lower pond production of the better-
off farmer suggests their ponds were less intensively managed as they had their own
ponds. In contrast the poor farmers’ ponds stocking with their on-farm fingerlings
appeared to attain higher production is likely to influence positively better pond
management practices.
3.3.3.6 Fish consumption
Sources
A significant difference (P<0.05) was found between the RF and NRF farmers in the
consumption of fish from different sources such as ricefish plot, pond, wild sources and
purchased. The seed producing households consumed fish from their riceplots along
with other sources (Figure 3.19).

Chapter 3
129
0%
20%
40%
60%
80%
100%
NRF RF NRF RF NRF RF
Poor Intermediate Better-off
Pe
rce
nt o
f h
ou
se
ho
lds
Market-wild
Pond-wild-market
Pond-wild
Pond-market
Riceplot-market-
wild
Riceplot-pond-
market-wild
Riceplot-pond-
market
Riceplot-pond
Figure 3.19: Sources of fish consumed by origin.
From ricefish plot
A significant (P<0.05) difference was found between poor (10.04 kg), intermediate
(28.48 kg) and better-off (13.48 kg) households in terms of fish consumed from riceplot
(Table 3.17). Post-hoc testing showed significant differences (P<0.05) between poor and
intermediate and, poor and better-off households in average fish consumption from the
ricefish plots. Although the total fingerling production of better-off farmers was higher
than others, intermediate households consumed more than double the quantity of fish
than better-off households (Figure 3.13). Consequently better-off farmers sold around
double the quantity of fish compared to intermediate farmers. Better-off households
consumed relatively fewer fish from their riceplots but much more from their ponds.
This indicates that better-off farmers consumed fish from ponds stocked with riceplot
produced fingerlings showing ‘delayed gratification’ of fish consumption from their
riceplots.

Chapter 3
130
Table 3.17: Amount of fish consumed (kg/household) at household level by farmer type and well-being
Poor Intermediate Better off Fish consumption RF NRF RF NRF RF NRF Ricefish plot 10.1±13.8(24) 28.5±27.8(20) 16.3±26.2(16) Pond 52.4±30.2(18) 44.2±39.2(13) 57.5±38.2(19) 48.4±85.3(13) 121.5±87.5(15) 60.9±36.2(12) Wild sources 9.4±5.6(20) 12.3±6.7(29) 9.5±4.4(14) 8.4±3.5(11) 17.8±10.1(13) 11.5±5.9(10) By purchase 12.9±13.7(23) 18.9±13.8(28) 16.8±17.6(15) 17.7±16.1(14) 17±16.5(13) 26.8±27.8(11) Total 99.9±62.2 61.8±32.6 112.3±49.1 74.5±97.5 194.6±117.1 106.0±50.9
Figure inside the parentheses indicating number (N)
From pond
Significant difference (P<0.05) was found between the households of different well-
being categories in their consumption of fish from ponds. Average RF household’s fish
consumption was higher (68.71 kg) than NRF (58.03 kg) (Table 3.17). The stocking of
larger sized fingerlings in their ponds, a major factor in increased production, also
appeared to impact on fish consumption. There was a significant (P<0.05) affect of well-
being on fish consumption from household ponds. On average, RF farming households,
irrespective of well-being category consumed 20% more pond fish than NRF
households.
Wild Source
No significant difference was found between farming households in terms of fish
consumption derived from wild sources. RF households however, consumed slightly
more wild fish than NRF households particularly in the case of better-off households
(Table 3.17). Better-off farmers had large areas of riceplots from where they could catch
fish during the rainy season using trap gear. However, there was no significant affect of
well-being on farmer types in case of wild fish consumption. This indicates that wild
sources now generally have limited availability.

Chapter 3
131
Purchased fish
Non-seed producing households consumed a significantly (P<0.05) higher amount of
purchased fish compared to seed producing households (Table 3.17). Own seed
production led to multiplier effects on foodfish production in riceplots as well as in
ponds resulting in increased household consumption from own source that reduced the
need to purchase. On average RF households consumed around 23 kg more fish annually
than NRF household (Figure 3.20).
0 10 20 30 40 50 60 70 80 90 100 110 120
From Ricefish plot
From pond
From wild sources
By purchase
Total
Average annual fish consumption (kg/household)
RF
NRF
Figure 3.20: Average annual fish consumption by the household from different sources.
3.3.3.7 Comparative income from different sources
In farming households, incomes were derived from agricultural crops, livestock, pond
culture and non-farm activities (Table 3.18). Additionally, RBFSP has been added to
seed producing households as a new source of income generating activity following
CARE FFS training.

Chapter 3
132
Significant differences (P<0.05) were found between farmer types with respect to
income derived from agricultural crops. Well-being significantly affected (P<0.05) the
income from agricultural crops between the RF and NRF households. This was due to
the significant difference in landholdings between the well-being groups.
In the case of income generated from ponds, a significant difference was found between
farmer types. Well-being significantly (P<0.05) affected the income generation from
pond culture between RF and NRF households with the ricefield households earning
more than NRF in every well-being group.
Table 3.18: Household income (US$) from different sources by farmer type and well-being
Poor Intermediate Better off Comparative income (US$)
RF NRF RF NRF RF NRF
Agriculture 314.4±298.6 (24)
239.8±156.6 (31)
485.2±309.1 (20)
307.5±139.4 (15)
1071.5±770.4 (16)
830.3±378.7 (12)
Livestock 44.8±56.1 28.9±26.9 33.5±29.8 29.8±22.7 31.5±22.6 46.2±36.9 Pond 56.4±77.9 17.8±31.2 70.5±149.9 73.6±90.5 153.3±178.4 93.1±102.3 Fish seed 23.6±25.9 46.1±78.9 55.1±96.9 Non-farm 159.9±184.7 177.1±197.8 404.2±519.6 241.8±262.6 727.4±1763.2 578.2±683.8
Figure inside the parentheses indicating number (N)
The income from seed production was higher in better-off farming households followed
by intermediate and poor with a significant difference between them. This was due to the
size difference of ricefish plots and production between the well-being groups. In the
case of a household’s non-farm income, significant differences were observed between
the well-being groups due to the variation in non-farm activities in different well-being
groups. Income generated from non-farm sources was lower in the poorer RF
households than in NRF households. This explains that the income from fingerling
production reinforced the overall income in RF households.
When farm and non-farm income were combined, significant differences (P<0.05) were
found between farmer types with well-being also affecting income. Decentralised fish

Chapter 3
133
NRF
Agriculture
crops,
48%
Off-farm,
42%
Pond, 6%
Fish seed,
0%Livestock,
4%
RF
Pond, 8%
Fish seed,
3%
Off-farm,
35%
Livestock,
3%
Agriculture
crops, 51%
seed production in ricefields contributed an estimated 3% to the total household income.
The contribution of pond aquaculture to RF households was 8%, whereas in the NRF
household it was 6% (Figure 3.21).
Figure 3.21: Percentage share of income by farmer type and sources.
Fish farming (fish seed and foodfish from riceplot and pond fish) collectively,
contributed 11% of the total income of RF households which was nearly double the
income from the pond of NRF households. It was also estimated that fish seed
production contributed 5% of on-farm income to RF households. This together with
pond fish production contributed 17% of on-farm income to RF households whereas
only pond fish production contributed 10% of on-farm income to NRF households.
3.3.3.8 Annual expenditure of the households
Figure 3.22 shows that the average annual expenditure on food in RF households (US$
129.04) was lower than in the NRF group (US$ 154.76). This might be due to RF
households consuming more fish from their own sources rather than purchased fish
resulting in lower expenditure on food. Irrespective of all well-being categories,
expenditure on food was also lower in RF households than in NRF households.

Chapter 3
134
Expenditures on clothing, education, housing, medical treatment and social events were
higher in RF than NRF households.
0
100
200
300Food
Clothing
Education
Housing
Medical treatment
Ceremony
NRF
RF
Figure 3.22: Annual household annual expenditure (US$) of RF and NRF farmers.
A significantly (P<0.05) greater expenditure on social occasions was observed in the RF
farming households compared with NRF households (Table 3.19). This may due to the
larger average size of RF household indicating a probable reason for higher ceremonial
expenditures such as buying new clothing during the Eid/Puja festival and additional
cost for other social events such as wedding.
Table 3.19: Household level annual expenditure (US$) of RF and NRF farmers by well-being group
Poor Intermediate Better off Household characteristics RF NRF RF NRF RF NRF
Food 90.7±46.3(24) 104.8±78.3(31) 99.8±37.9(15) 176.1±124.5(20) 224.1±235.7(16) 312.7±402.5(12) Clothing 35.4±15.1(24) 35.6±21.4(31) 68.2±35.5(20) 48.9±25.8(15) 105.5±85.5(16) 75.3±37.9(12) Education 47.9±90.8(20) 39.0±36.0(22) 64.8±54.2(18) 52.2±42.8(12) 177.4±178.7(16) 119.9±94.2(8) Housing 22.5±13.4(17) 20.4±17.1(25) 89.9±154.2(14) 54.3±87.5(11) 53.6±47.9(13) 83.5±137.9(12) Treatment 22.6±32.9(22) 37.8±42.5(31) 121.2±361.7(20) 46.7±59.1(15) 60.8±85.1(16) 51.89±58.5(12) Ceremony/social 191.6±291.9 (24) 59.9±97.8(31) 134.9±234.0 (19) 33.9±31.8(14) 363.4±617.1(16) 109.5±148.4(12)
Figures in the parentheses indicate number (N)

Chapter 3
135
3.3.3.9 Facilitating and constraining factors experienced by RF farmers
RF farmers were asked to unpack the factors that facilitated or constrained seed
producing activities.
0 10 20 30 40 50 60 70 80
Having w ater supply facilities
Homestead adjacent plot
Scope for grow -out in rice f ield and pond
Ow n source of brood f ish
Marketing facilities of f ry/f ish
Flood free area
Plot w ith w ater inlet outlet facilities
Know ledge and skill on fry rearing
Having f ishing gear
Know ledge on grow -out
Know ledge on IPM
Know ledge on fry/f ish marketing
Percent of rice f ish farmer
Figure 3.23: Potential factors recognised by RF farmers based on their experience over the year of practices.
Based on their experiences, more than 70% of RF farmers mentioned that good water
supply and locating their RF plot adjacent to their household were most critical to
support decentralised fish seed production in ricefields (Figure 3.23). The seed
production period takes place in the boro season which relies on ground water supply
provided by pumps installed on the dike of riceplots. Most farmers said that a medium
level of water i.e. 3-4 inches deep, was acceptable in the riceplot to allow for the
movement of fish and not damaging rice. Pump ownership facilitated farmers to cope
with periodic drought during the food fish production period in the amon season. In
addition, more than 40% of farmers also mentioned that having scope for grow-out in
the ricefield and pond, their own source of broodfish and marketing facilities of fry and
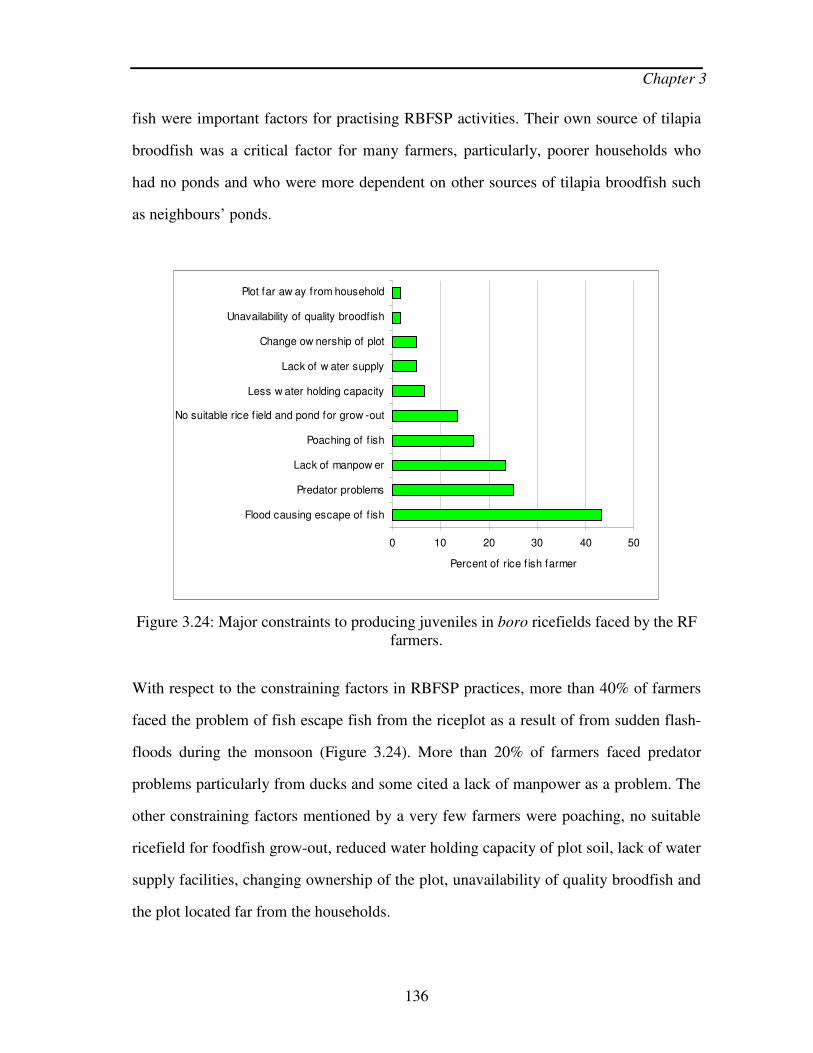
Chapter 3
136
fish were important factors for practising RBFSP activities. Their own source of tilapia
broodfish was a critical factor for many farmers, particularly, poorer households who
had no ponds and who were more dependent on other sources of tilapia broodfish such
as neighbours’ ponds.
0 10 20 30 40 50
Flood causing escape of f ish
Predator problems
Lack of manpow er
Poaching of f ish
No suitable rice f ield and pond for grow -out
Less w ater holding capacity
Lack of w ater supply
Change ow nership of plot
Unavailability of quality broodf ish
Plot far aw ay from household
Percent of rice f ish farmer
Figure 3.24: Major constraints to producing juveniles in boro ricefields faced by the RF farmers.
With respect to the constraining factors in RBFSP practices, more than 40% of farmers
faced the problem of fish escape fish from the riceplot as a result of from sudden flash-
floods during the monsoon (Figure 3.24). More than 20% of farmers faced predator
problems particularly from ducks and some cited a lack of manpower as a problem. The
other constraining factors mentioned by a very few farmers were poaching, no suitable
ricefield for foodfish grow-out, reduced water holding capacity of plot soil, lack of water
supply facilities, changing ownership of the plot, unavailability of quality broodfish and
the plot located far from the households.
Chapter 3
137
3.4 Discussion
3.4.1 Institutional mediation
This study reveals the better-off households could access government support more
effectively in rural communities. Conventional approaches to agriculture extension have
often failed to respond adequately to the needs of poor farming households (Cox et al.
1998). More specifically, in terms of aquaculture extension many pond owners believed
that they had to be wealthy to practice proper aquaculture management. Many
aquaculture extension agencies (e.g. Department of Fisheries, Asian Development Bank
and FAO sponsored programmes) tend to target owners of large ponds who are both
wealthy and well-educated (Morrice, 1998). Hence a belief developed that farmers
should be better-off to practice aquaculture.
Public aquaculture extension systems in Bangladesh have only had limited impact on the
poorest sector of farming households (Scarborough et al. 1997) due to the constraints of
(i) inappropriate contact farmer methods, (ii) lack of relevant technological messages
(iii) inadequate feedback of farmer needs into research and (iv) small public sector
budgets that can supply only a limited number of extensionists in the field (Lewis,
1998). The limited impact was also due to limited number of manpower for extension
work for which in each local administrative area or sub-district/upazila/thana which has
up to 250,000 people, where there is only one Fisheries Extension Officer with his three
official subordinates (Lewis, 1998). This indicates that the government fisheries
extension department does not have the capacity to promote such types of farmer field
school based programmes involving poor households over wider areas.
CARE however, carried out activities emphasising households of poor and intermediate
categories through the farmer field school approach towards improvement of their
livelihoods (CARE, 2001a). Initially CARE project activities were concentrated on
Chapter 3
138
ricefield management practices. Later alongside ricefish, CARE diversified their
activities with a wide range of issues which included other agricultural activities and
building linkages between households with many service providing organizations. These
were towards engaging poorer people in CARE interventions made its extension
approach involving farmer field schools more effective.
3.4.2 Livelihood assets
3.4.2.1 Human capital
The average household size of the whole sample was found to be 5.7±2.3, showing a
similar size (5.2) to the national rural average (BBS, 2003b). Better-off households
tended to be larger than intermediate and poorer households. This was due to the
household head (father) usually retaining ownership of his land with a degree of
authority within the household until his death. Such de facto authority and day to day
control over household and family affairs may have passed from father to sons over a
long period, but ultimate authority is most often not relinquished until death (Cain,
1991). This tendency of the better-off household head to have authority over
landholdings for a long period of time influences the households to remain united and
have a larger occupancy. On the contrary, poorer households are smaller in size
compared to the better-off households. In rural Bangladesh, sons of land-poor
households leave their parental home earlier than the sons of landed households to form
households of their own (Cain, 1977). According to White (1992) it is common among
marginal and poor households for married sons to set up a separate household (although
they may live in the same family compound) after 2-3 years of marriage. Cain (1977)
also stated that land-poor fathers have less influence over the timing of son’s departure
from the parental households. Such types of behaviour of land-poor households are
likely to explain their smaller size of occupancy.

Chapter 3
139
Household occupancy affects the occupation and income of the household members
(Islam, 1995) and especially the type of profile of farming activities. In the present
study, the size of RF households was found to be larger than NRF ones. A previous
study conducted in Mymensingh area has shown that larger households (9.4 members)
were more likely to carry out integrated ricefish farming compared to the average
national household size of 5.5 (Gupta et al. 2002). Larger households were also reported
to have an increased interest in pond farming in the Northwest region (Morrice, 1998)
and southern region of Bangladesh (FTEP, 1999). Larger household size i.e. additional
labour, also appeared to support diversification into juvenile fish production in the
ricefields. Gupta et al. (2002) reported that larger household size was an important factor
in supporting ricefish technology adoption. Moreover, larger households need more fish
for their daily consumption, which also acted as an indirect but strong stimulating factor
towards carrying out this technology. This finding is consistent with the information
regarding constraining factors to seed production activities (Chapter 6), where a
remarkable number of households reported that the shortage of manpower was one of
the constraining factors for non adoption of this technology.
The age distribution of household heads could influence the adoption of new technology
in farming households (Miah and Halim, 1998). Comparatively a higher percentage of
middle aged farmers were found to be involved in fish seed production activities.
According to Miah (2002) middle aged people have more risk taking ability and higher
capability to integrate and adjust to change in farming activities. They have a
psychological closeness, commonness of understanding with respect to aspects of
professional, social, economic, religious and even political issues, which bring them
together on many occasions. The variation in belief and attitude between elderly and
young people of the rural society is more and wider than the young and middle age and
middle age and elderly people. Middle aged people have both experience and wisdom

Chapter 3
140
which is likely to act as a balance of interest for both younger and older people. This
scenario indicates that middle aged people had more motivation towards technology,
who could be the central clients of extension programme and subsequent source of
information for younger and elderly farmers in the rural areas.
Generally education encourages the development of the human mind and it increases the
power of observation, analysis, integration, understanding, decision making and
adjustment to new situations of an individual as well as their family members (Miah,
2002). Making decisions regarding carrying out of agricultural technologies has shown
mixed relationships with the education level of farmers. Some studies showed a positive
relationship between the decision making behaviour of farmers and their level of
education and many did not show any relationship. For instance, the literacy level was
positively correlated with the decision making process in the cultivation of Binasile rice
(improved rice variety) in Bangladesh (Islam et al. 1998) possibly due to the increased
complexity in using inputs and other management practices involved. Farmers with
higher literacy have a greater likelihood to choose lucrative technologies. In some areas
of Bangladesh, mixed and mono-sex tilapia hatchery owners were reported to be
relatively highly educated (55% Master degree and 22% Bachelor degree) (WorldFish
Center, 2004).
On the contrary, the level of education had no relation with decision making process of
women in homestead gardening. This was not unexpected as traditionally women have
been responsible for vegetable cultivation where integrating improved knowledge is
commonplace. In this study the majority of RF farmers were found to be illiterate and/or
with a primary level of education. In Vietnam, a lower level of education did not hamper
the farmers who carried out ricefish culture (Rothuis et al. 1998). Similarly in the
present study, illiteracy and a low level of education did not impede seed producing

Chapter 3
141
farmers gaining benefits from this technology. This was probably a result of knowledge
inherent in farmers about fish in ricefields (Prein, 2002). This sort of indigenous
knowledge about fish in ricefields possibly simplified the decision making process to
carry out this technology.
Agriculture was the primary occupation of the majority of the sample households.
Studies done in Northwest Bangladesh show that about 85% of the households derived
income from agriculture, either through working their own land/or that of other farmers
on a daily paid basis (Morrice, 1998). Similarly a study carried out by CARE has shown
that the majority of households in the Northwest depend on one form of agriculture or
another ranging from producing crops on their own land to selling labour for agriculture
(CARE, 2002). Apart from in the Northwest region, recent studies indicate that
agriculture, particularly rice farming, is the main occupation of rural households in
Bangladesh (ADB, 2005). Greater involvement in rice farming suggests that there was
very limited scope for other non-farm activities. In this regard, a previous study has
shown that households that were not involved in non-agricultural activities were more
likely to be farming intensively (Ellis et al. 1999). RBFSP technology has diversified
such rice-based livelihoods of farming households. For instance, over recent years pond
based aquaculture has diversified activities and income in many households in
Bangladesh (Ross et al. 2004b). After agriculture, as the primary occupation, poorer
farmers tended to diversify more compared to other well-being groups. This can be
explained by the relatively greater insecurity of rural poor households stimulating
diversification of livelihoods strategies for better survival (Ellis, 2000).
3.4.2.2 Physical capital
The number of living rooms was found to be higher in RF farming households compared
to NRF ones. This was due to higher household occupancy of RF farming households.

Chapter 3
142
Out of the whole sample the majority of households tended to have living rooms with
soil-floor, bamboo-fencing and tin-roofs. These findings are similar to the national
statistics, where it has been reported that that 76% of living room-roofs were made of
tin in rural areas and the majority of living room’s fences ( room walls) were made of
bamboo (BBS, 2003b).
Recent studies by CARE-Bangladesh show that during the last two decades, a noticeable
improvement has occurred in the area of water and sanitation in Bangladesh (CARE,
2001a). Currently 97% of the population has access to tube-wells or ring wells for
drinking water. In the case of some districts in Northwest Bangladesh such as Rangpur
and Bogra, the coverage has reached 100% (CARE, 2001a). The findings of the present
study were more or less consistent with this, however results show that some poor
farmers still use their neighbouring drinking water facilities. As a whole in the present
study about 60% of farming households used closed latrines (concrete and semi-
concrete) which is more or less similar to the finding of national statistics (72%)
reported by (UNICEF, 1999).
About 81% (13 out of 16) of better-off households and 41% (10 out of 24) of poorer
households were found to have their own pond. A study conducted in Northwest
Bangladesh showed approximately 80% of the wealthiest households had ponds
compared to only 20% in the poorest (Barman, 2000). The difference between the
previous and present findings in terms of pond ownership by poorer households could
reflect the increasing construction of new ponds over the last few years. The average
pond size of fish seed producing farmers (0.08 ha) was similar to that reported by a
previous study (0.06ha) undertaken in Northwest Bangladesh (Morrice, 1998). This
study also showed that 30% of pond owners were marginal and small (<1.0ha

Chapter 3
143
landholdings), 50% intermediate (1.0-2.4 ha) and 20% were larger farmers (>2.4 ha)
(ICLARM, 1999).
The present study shows that small-scale shallow groundwater pumps at the individual
household level brought remarkable change providing access to irrigation to all wealth
classes of farmers. Between 1950 and 1987, public tube-wells, regulation of private
installations and public monopolies in the supply of pumps, motors and other equipment
were a constraint to the development of irrigation in Bangladesh. Since 1972, emphasis
has been placed on minor irrigation through low lift pumps mainly using shallow tube-
wells and deep tube-wells. From 1979 to 1990, there was a liberalized expansion of
minor irrigation with diesel and electric shallow tube-wells (STW) in the private sector
(Al-Mamun et al. 2003). Deep tube-wells (DTW) are generally 100 m in depth, require
rings for installation and in the past were installed by the government. They have now
been privatised and are owned and operated by cooperatives. The STWs, on the other
hand, are generally 40-60 m deep, manually installed and privately owned and operated.
Both DTWs and STWs, generally pump from the same aquifer, but due to larger
investment costs and intricate operation and management, the number of active DTWs
has steadily declined following privatization (Mondal and Saleh, 2003). The scenario of
irrigation development at the farmer level in the Northwest Bangladesh is similar to the
scenario of whole country. Almost all of the better-off farmers installed pumps
individually for ensuring irrigation in their field crops. Some intermediate and poor
farmers were also found to own irrigation pumps, however those who could not afford to
install a full pump (ground water pipe and machine) installed only the tube-well, buying
low-cost plastic piping and renting machines locally for pumping water when required.
Moreover, poorer households without their own pump tended to access irrigation water
from the better-off households at the community level. Hossain (2004) reported that over
recent years an increase in the number of shallow tube-wells, pumps, power tillers and

Chapter 3
144
rickshaw vans has created jobs as in the operation and repair and maintenance in rural
area of Bangladesh.
RF farming households tended to be located adjacent to rural roads. Rural earthen roads
developed by local government in the study area were found to contribute to the
development of riceplots with broader, more substantial dikes to preserve irrigation
water and protect fish from flash floods caused by sudden rainfall. Additionally,
improved road communication in rural areas facilitates farmers, fry traders and food-fish
traders for marketing fish fingerling and foodfish in different places. More than 90% of
the roads in the Northwest Bangladesh are earthen (Bakht, 2000). This was evidence that
the development of rural roads contributed to the livelihoods of rural people. This was
also indicated by the higher price of roadside land than for land located away from the
road. Moreover, the incidence of NGO’s membership has been observed to be higher
villages serviced by good roads compared to villages remote from good roads (Bakht,
2000). This possibly partly contributed to RF households having more access to credit
than NRF households.
3.4.2.3 Natural capital
The average landholdings found by the present study (0.89 ha) were similar to the
findings (0.68 ha) of a previous study carried out by Morrice (1998). The average area of
land owned by poor RF farmers was found to be 0.40±0.29 compared to intermediate
(1.02±0.06ha) and better-off (2.44±1.55ha) farmers. Similar findings regarding land
ownership of poor farmers (0.38ha) was reported by CARE (2005b) confirming the
limited landholdings of poor households. During formation of farmer field school in the
community, the CARE Go-Interfish project considered the landholding criteria of
marginal and small farmers to range from 0.19 to 1.01 ha (Banu and Bode, 2002). Due
to limited landownership, poor farmers of both RF and NRF households (about 40%)

Chapter 3
145
tended to access land through sharecropping systems. Sharecropping is the most
frequent form of land access and the dominant access mechanism for poorer farmers
(CARE, 2005b). Under sharecropping arrangements, the farmers divide the harvest of
rice with the landowner, and the costs of production are shouldered by the sharecropper.
Apart from sharecropping, a few poor farmers were found to gain access to land through
leasing and mortgaging tenure systems. These sorts of tenure arrangements require
monetary investment which is not affordable for many poorer farmers (CARE, 2005b).
Alongside own landholdings, dependency of poorer households on others’ landholdings
indicate their insecure livelihoods. Land ownership as an income-generating physical
asset has a predictable link with poverty incidence in rural areas. The extremely poor are
completely landless, owning neither homestead nor arable land and, if not homeless,
they live on borrowed land sometimes in fear of eviction (ADB, 2005). As a result,
control over land is a strong indicator of household livelihoods in rural Bangladesh. In
Northwest Bangladesh the ownership of land has historically been inequitable and
concentrated in the hands of rural elites, who lease or share out their land to land poor
farmers (CARE, 2005b). The existing land tenure systems are often found to be
defective and as a result, agricultural development has been hampered and rural poverty
perpetuated (Griffin et al. 2002). Normally the tenant’s rights, including security of
tenure, are enshrined in legislation. These are currently almost invariably ignored in
practice, and may offer some scope for intervention (CARE, 2003b).
3.4.2.4 Financial capital
In most areas of rural Bangladesh, animals, particularly cattle provide not only draught
power, fuel, fertilizer and an important protein source through milk, but also a source of
capital that can be readily liquidated in times of need. The majority of sampled
households maintained livestock holdings that did not vary significantly between

Chapter 3
146
households, perhaps due to difficulty in feeding and management. The most common
form of livestock was chicken because of its minimal maintenance costs. Earlier studies
in rural Bangladesh showed that family poultry contributed 28% of the total protein
supply as eggs and meat in the rural households (Sonaiya et al. 1999). Family poultry
plays a significant role in the cultural life of rural people: as gifts to visitors and
relatives; as starting capital to youths and newly married women and as sacrificial
offering in traditional worship (Sonaiya et al. 1999).
In terms of credit, RF farmers tended to obtain more credit than NRF farmers. This was
explained by the institutional mediation undertaken by CARE resulting in linkages
between farmers and credit providing organizations. In terms of access to the formal
credit, the present study reveals that fewer poorer households received credit compared
to intermediate and better-off households. The growing literature on credit and its
impacts reports mixed results. According to Sinha (2000) credit in terms of an increased
in number of loans has grown, where 80% of the poor are now reached by micro-credit
programmes. In contrast, according to Halder and Mosley (2004) poorer households
have scant access to the lines of formal credit and tend to face unfavourable lending
terms, since lenders have a preference for the less risky clients.
The majority of farmers tended to receive credit from NGOs; it is generally understood
that the most common source of credit in the Northwest are the NGOs. Generally NGOs
and the Grameen Bank consistently target poorer households when lending money
across the region (CARE, 2002). In terms of the use of credit, a study in the Northwest
showed that the most frequent uses of credit by borrowers included healthcare (50%),
immediate consumption needs (45%) and investing in farming (27%) (CARE, 2002).
CARE (2005b) reported some other uses of credit including shelter improvement, social
obligations related to marriage, dowry and the settling of previous debts. These studies

Chapter 3
147
illustrate the need for and use of credit in farming households where easy access to
credit is likely to be an important financial capital towards improving livelihoods.
3.4.2.5 Social capital
The present study showed social capital operating at many levels of farming households
in fish seed producing communities. This result is corroborated by previous studies
showing similar findings in rural areas in Northwest Bangladesh (Bode and Howes,
2003). Development requires the mobilization of existing social capital as well as the
creation of new linkages as success in communities depends on existing social bonds
which encourage individuals to pursue a greater diversity of activities (Woolcock and
Narayan, 2000). Growth of social capital can result from group activities in a wide range
of natural resource management sectors, including watershed management, irrigation,
micro-finance, forest management, integrated pest management and farmer
experimentation (Pretty, 2003).
Regarding RBFSP, there were different types of relationships and linkages suggesting
contributions to existing social capital. Among different bonds of social capital, the
relationships between landlord and tenant was found to be an internal vertical social
relationship, which is patron-client based relationship in Northwest Bangladesh (Bode
and Howes, 2003). This sort of relationship affects the poorer tenants ability to sustain
their land tenancies. In contrast accessing drinking water facilities via neighbouring
households shows internal horizontal relationships. Production of fish seed/foodfish in
ricefields and the subsequent gifting to neighbours and relatives enriched social capital
through building internal horizontal linkages. Studies carried out by ITAD/ODI/OPM
(2001) reported that RBFSP improved farmers capacity to gift fish to neighbours and
relatives which in turn strengthened social capital.

Chapter 3
148
Moreover, social capital developed through the creation of farmer field schools
contributed to the community in several ways. According to CARE (2001a), farmers
used the social networks that FFSs strengthened to share knowledge and information
regarding agricultural technologies and other services provided by government and non-
government organizations. Social relationships were also reported to mitigate domestic
violence and dowry problems and facilitate the provision services at an institutional
level.
Chapter 3
149
3.4.3 Livelihoods strategies and outcomes
3.4.3.1 Agriculture crops
Rice cultivation
In the present study, the basic agricultural crop was rice as it was cultivated by all
farmers both in the amon and boro seasons. Although the area under rice increased only
marginally from 9.8 to 10.6 million ha in Bangladesh, rice production increased from 16
million tons before independence to 38 million tons in 2000-2001 (Hossain, 2004). This
was brought brought about through higher investment in inputs (e.g. fertilizers, irrigation
etc.) used to cultivate irrigated rice (boro) than for rainfed rice (amon). The increased
investment in boro results in higher benefits compared to amon (Hossain et al. 2006).
The source of investment to one crop comes from the preceding crop, as a result farmers
have the income from amon rice which contributes a substantial amount of investment to
boro rice. To maximize the benefits from an increased investment in boro rice, farmers
also produced fish fingerlings in irrigated ricefields. Rice production (kg/ha) of RF
households was found to be relatively higher than NRF households. This was possibly
due to RF farmers having better access to irrigation which also improved the
management of ricefields.
Vegetable cultivation
Vegetables have been categorised into two groups, potato and other vegetables grown as
field crops. Average potato production of all sampled households was 9,840 kg/ha where
production of RF and NRF households was 11,385.92 and 8,237.70 kg/ha respectively.
The average potato production of a RF farmer was similar to the production (12,598
kg/ha) recorded in national statistics (BBS, 2003a). The higher production by RF
farmers may have resulted from access to information as well as to good quality and
high yielding potato seed given by CARE field trainers. Improved quality potato seeds

Chapter 3
150
are supplied by the Bangladesh Agricultural Development Corporation (BADC) and
some NGOs in northern Bangladesh. Potato is recognized as a cash crop at the farmer
level and land allocation for its cultivation was increased in the 1990s (BBS, 2003a).
The agricultural sector in the Northwest districts has experienced major changes since
the opening of the Jamuna Bridge. This was due to the development of a strong
marketing infrastructure and diversification into cash crops such as potatoes, vegetables
and banana (CARE, 2001a). Poorer RF households tended to produce more vegetables
than poor NRF farmers. This suggests that fish seed production is also compatible with
intensified vegetable cultivation which is considered a cash crop. In contrast, potato
cultivation was reported to be competitive with RBFSP in one community of Rangpur
Sadar out of 25 communities investigated in the Northwest (Barman et al. 2004)
possibly because of light sandy soil which is relatively better for potatoes cultivation.
Apart from potato, the average production of other vegetables was found to be 2405.1/ha
where RF farmer’s productivity (2,605.3/ha) was relatively higher than NRF farmer
(2,160.3 kg/ha). Although the NRF farmers were from the same community as the RF
farmers, the lower productivity of NRF farmers was possibly due to less intensive
cultivation and their higher education level that enhanced their involvement in non-farm
activities.
Vegetable production in Bangladesh increased between 1980 and 2003, with an annual
growth rate of 2.8% (Weinberger and Genova, 2005). According to recent statistics the
average vegetable yield in Bangladesh is 5,800 kg/ha. However, it is misleading to
discuss yields for aggregated vegetables, as the mix of crops may change significantly
over time (Weinberger and Genova, 2005). A study carried out in 2005 has shown an
average vegetable (potato and other vegetable together) production of 4,155.8 kg/ha in
rural areas of Mymensingh district (Karim, 2006). Collectively (potato and other

Chapter 3
151
vegetable) per ha vegetable production tended to be much higher in Northwest
Bangladesh possibly due to the availability of improved seed.
Other strategies
RF households tended to benefit more from livestock than NRF households. This could
be explained by the improved management of livestock by RF households where
household members were given training by CARE for timely healthcare of livestock
received from different organizations (Banu and Bode, 2002). The behaviour of RF
farming households towards improved management of livestock was compatible with
other farming activities such as vegetable production and improved management of
ricefield for fish fingerling production. This also reflects more intensified farming of RF
households whereas NRF households tended to be dependent more on non-farm
activities.
Poorer households tended to be more diversified in non-farm activities suggesting farm-
based activities were not sufficient for their livelihoods. Diversification into non-farm
activities is a very common behaviour of poorer households (Ellis, 2000) and has
possibly been replicated on-farm through diversification into ricefield based fish seed
production.
3.4.3.2 Production from ricefish plot
Rice varieties and fish species
In the present study farmers cultivated high yielding rice varieties in their ricefish plot
during both boro (mostly BR-28 and BR-29) and amon (mostly BR-11 and Swarna)
seasons suggesting the compatibility of fish seed production with these varieties. In
Bangladesh, rice is grown on over 10 million ha (Joshi et al. 2007). It contributes over
50% of the agricultural gross domestic product (GDP) and accounts for about one third

Chapter 3
152
of national GDP (Baffes and Gautam, 2001). The cultivation of high yielding varieties
has resulted in a greater contribution to the food supply and national economy.
The high yielding early variety used in the dry season BR-3 was released in 1973. The
yield potential of this variety was surpassed only in 1994 with the release of BR-29 that
showed an average yield of 7.5t/ha in multi-location trials (Hossain et al. 2006). The
highest yielding amon season variety for the season is BR-11 released in 1980. Many
new varieties have been released for the amon season since then but none with the yield
potential of BR-11. The most popular varieties during amon season are BR-11, (23%),
Swarna (23%) and Pijam (13%) together occupying 79% of the total cultivation area of
high yielding varieties. The remaining 22% of varieties might be of less interest to the
farmers for their fish seed production plot as well as for riceplot only. During the boro
season, a large number of varieties were grown; the most popular ones were BR-28
(11%), BR-29(9%), BR-14 (11%), BR1(7%) and BR-8 (6%).
Despite socio-economic factors such as the predominance of small and marginal farmers
and tenancy cultivation in the agrarian structure, the adoption of high yielding varieties
in Bangladesh has expanded (Hossain et al. 2003). Several studies noted that the rate of
adoption was higher among small-scale and tenant farmers in Bangladesh compared to
other countries (Lipton and Longhurst, 1989). Generally farmers value traits of high
yield, good grain quality and shorter maturity, as shown by rapid diffusion of BR-28 and
BR-29 (dry season) in the late 1990s (Hossain et al. 2006). Considering the favourable
traits of high yielding rice varieties, farmers discovered a synergy with high yielding
improved strain of Nile tilapia (GIFT) for production of fish seed and foodfish in
ricefields. These synergies may have also made the ricefields compatible, to a greater
extent, to fish seed production. It has been demonstrated that ricefields are compatible

Chapter 3
153
for fish fingerling production in Indonesia, China (Halwart et al. 1996) and in Vietnam
(Nguyen and Little, 2006).
Riceplot management
The dosages of fertilization vary from region to region as well as from crop to crop in
Bangladesh based on different degrees of soil fertility. During the boro season average
urea, TSP and MP dosages in the present study were 163.6, 87.2 and 59.5 kg per ha
respectively. The dosages of urea, TSP and MP for boro production across the country
were 259.4, 197.0 and 41.5 kg per ha (BBS, 2003a).
During the amon season, the dosages of urea, TSP and MP in the present study were
75.2, 28.6 and 17.8 kg per ha respectively. Literature shows the higher corresponding
values for amon production throughout the country as 111, 111 and 31 kg per ha
respectively (BBS, 2003a). The comparatively lower fertilizer doses used in ricefish
plots suggest that fish culture in ricefields reduces the need for fertilizer inputs. Earlier
there was speculation that ricefish farming might use 50 to 100% more fertilizer than
rice farming without fish (Chen, 1954). As with the finding of the present study, an
experimental study has shown that ricefish culture could reduce fertilizer use by 30% (Li
et al. 1995). This is due to the increase in organic matter through fish excreta and the
remains of supplementary feeds (rice bran) (Coche, 1967).
Overall along with a reduction of fertilizer, farmers did not use pesticides in fish
fingerling producing riceplots. Earlier on-farm experimentations on tilapia fingerling
production in ricefields in this study area of Northwest Bangladesh (Barman and Little,
2006) and in Vietnam (Nguyen and Little, 2006) showed similar results. This could be
explained by the changes occurring in natural and human capital in farming households.
Naturally, fish eat larvae of many harmful insects in ricefields (Coche, 1967). In terms

Chapter 3
154
of human capital, the presence of tilapia in ricefields and its growth were reported to
change the farmer’s behaviour to avoid the use of pesticides. It was also reported that
farmers developed their understanding to an extent where they could still get the same
production level of rice without using pesticides (CARE, 2001a). This reflects the
effectiveness of CARE’s farmer field school approach towards a broader understanding
of improved ricefields ecosystems.
Fish seed production in ricefields was less likely to face water constraints as compared
to traditional ricefish culture (Coche, 1967) despite seed production activities starting in
the dry season. This is due to the hatching of common carp eggs and breeding of tilapia
that could take place in smaller ditch water areas in the ricefields. Until the onset of rain,
hatchlings could be accommodated in the ditch area (Barman and Little, 2006).
Alongside this, those riceplots tended to be located adjacent to earthen irrigation canals
allowing uncontrolled leakage of water into the riceplot. This sort of riceplot was
reportedly able to maintain a better water level than the riceplots located away from
irrigation canals (Gregory and Kamp, 1999b). Immediately after the rains start,
hatchlings move into the whole area of the riceplot and use abundant natural food
(Barman and Little, 2006). This strategy of fingerling production in irrigated ricefields
appears to use irrigation water effectively (Kutty, 1987).
According to the present study however, escape of fish from riceplots due to heavy
rainfall is the major constraining factor for fish seed production. This finding is in
agreement with an earlier study that reported storms with heavy rainfall to cause flash
flooding of the plots and loss of fish (Gregory and Kamp, 1999b). To minimize the
degree of this natural threat, farmers tended to locate fish seed production in riceplots
adjacent to roads with larger dikes. This protects riceplots from sudden flash floods as
well as loss of water during dry months.

Chapter 3
155
Production of rice in ricefish plots was found to be higher than that of the national
average suggesting presence of fish in ricefield contributed to an increased yield of rice
or farmers have chosen more fertile riceplots for fish seed production. Average
production of boro and amon rice has been recorded as 3,195 and 2,376 kg/ha
respectively (BBS, 2003a). Rice productivity was found to be higher in fish seed
producing riceplots compared to other riceplots of the RF farmers as well as of NRF
farmers. Evidence shows that during the amon season, rice production was 4,980 kg /ha
(ranging from 3,264 to 6,571) and 4,555 kg/ha (ranging from 3,046-6,000) in integrated
and only riceplots respectively. During the amon season, rice production was 3,811 kg
/ha (ranging from 2,058 to 4,940) and 3,498 kg/ha (ranging from 1,976-6,250) in
integrated and controled riceplots respectively (Gupta et al. 2002). In an analysis of 18
ricefish studies an average increase in rice yield of 15% was reported which was due to
the presence of fish in ricefields (Lightfoot et al. 1992). Studies in the CARE Interfish
area showed that rice production appeared to benefit with a 5% to 10% of yield increase
owing to better water management (ITAD/ODI/OPM, 2001). A study conducted on
RBFSP in Vietnam reported approximately double the production of rice (>6100 kg/ha)
than the present study as a result of using a high yielding hybrid rice variety. However,
rice production in fish seed plots was relatively higher than rice only plots (Nguyen and
Little, 2006). This study in Vietnam also confirmed that rice production in fish seed
plots was higher than rice only plots.
Income from rice
Both investment and net returns were comparatively higher in boro rice compared to
amon suggesting importance of boro cultivation in terms of its operating cost being
maintained by the farming households. A recent study also showed a higher return from
boro (US$ 270) compared to amon (US$136) cultivation (Gupta et al. 2002). Income
from rice grown in ricefish plots was found to be higher than from RF farmer’s other

Chapter 3
156
riceplots and NRF farmer’s riceplots possibly due to the use of fewer inputs. Literature
showed that the cost of producing rice through integrated farming was lower than for
rice monoculture in both boro (9.4%) and amon (10.1%) seasons due to the use of fewer
fertilizers and a lower cost of weeding (Gupta et al. 2002). Increased productivity in
ricefish plots suggests that seed production in riceplots reduced the level of cash
investment for inputs and resulted in higher margins.
In relation to input use and rice production, relatively better-off farmers were found to
use fewer inputs and get a higher production of rice compared to poor and intermediate
households. The possible underlying reasons could be the use of higher levels of
fertilizer inputs by poor and intermediate households that resulted in crop lodging and
lower grain production (Biradar et al. 2005). Another possible underlying reason might
be that riceplots of better-off households were more productive than those of other
groups of farmers.
Feeding of fingerlings
RF farmers tended to use their ‘on-farm’ produced rice bran as supplementary feed for
fish in ricefields. According to Gupta et al. (2002), farmers used mostly ‘on-farm’ inputs
(cattle manure, rice/wheat bran) in the case of ricefish farming. Farmer can therefore use
locally derived by-products as feed rather than purchasing high cost industrially
produced feed for the production of fingerlings.
Fingerling production
Poorer and intermediate households were found to be more efficient in producing
fingerlings compared to the better-off farmers. A previous study showed that smaller
farmers were more efficient in their use of land for high yielding rice production through
efficient use of irrigation and available labour in their households (Feder et al. 1985).

Chapter 3
157
Poor and intermediate households sold their fingerlings through diversified channels at
higher prices than better-off households showing stronger marketing efficiency. Similar
attitude of poorer farmers were reported in marketing agricultural products where they
participate successfully in marketing chains, either on their own or with the help of co-
operatives (Ellis and Biggs, 2001).
Income from fingerling
The present study found the average net benefit from fingerling and foodfish production
to be Tk 14,231.1/ha, which was much higher than found in previous studies. A previous
study in Mymensingh region, reported the average net income from foodfish produced in
ricefield to be Tk. 9,925/ha. The lower net return shown in previous studies was due to
the use of purchased fingerlings which accounted for 60% of the production cost (Gupta
et al. 2002). However, in the present study farmers purchased fewer fry as they produced
fingerlings themselves. Moreover, farmers in the present study sold their fish as
fingerlings which tended to be higher value than foodfish. Evidence also shows that
income from fingerling production in irrigated ricefields was generally greater than the
food fish production from rainfed systems (Kamp and Gregory, 1993). This was due to
the high demand for fingerlings peaking at the onset of monsoon period (Barman and
Little, 2006). Relatively poor and intermediate farmer’s selling efficiency (US$/kg
fingerlings) was higher than in better-off households, as small farmers tended to
maximize the return through their higher marketing efficiency (Ellis and Biggs, 2001).
Moreover in the decentralised fingerling marketing system, producers are likely to have
a relatively strong position as they can wait for the next customer without quality
deteriorating. If fingerlings are not sold they can still be sold as foodfish, restocked or
eaten in households. According to an earlier study, ricefish farming appeared to be
suitable only for well-off households (Gupta et al. 2002). However, the present study
Chapter 3
158
suggests that decentralised fish production strategy using ricefield system could be a
sustainable option that benefits poorer households.
Pond production
In terms of input costs, poor and intermediate RF households reduced their expenditure
on pond production compared to NRF households by stocking on-farm produced
fingerlings. Better-off households tended to restock more of the ricefield produced
fingerlings in their household ponds as they had larger ponds. In rural areas, fish seed
can be the most costly input in the pond polyculture of carp and tilapia (Karim, 2006).
According to the present study decentralised tilapia and carp seed production in ricefield
based system could be a viable option to reduce expenses of pond based aquaculture in
many other rural parts of Bangladesh.
Pond fish production significantly increased in RF households compared to NRF
households mainly due to stocking of their own large sized fingerlings with higher
survival rate. It appears that farmers of the CARE Interfish project used improved
knowledge of foodfish production in ricefields in their pond aquaculture (CARE,
2001b). Farmers under the Go-Interfish project received training on pond aquaculture
and also used their knowledge in practice. In the present study, average pond production
of RF farming households was found to be 2,548 kg/ha. Compared to the present study,
a bit (<16%) lower production (2,195 kg/ha) was achieved in trial farmers’ ponds in carp
polyculture model in Northwest Bangladesh (Morrice, 1998). In that trial, farmers were
given training in pond culture techniques and they were provided with fingerlings,
fertilizers and rice bran by the NFEP project on the basis of interest-free credit. Average
pond production in Northwest Bangladesh was 740 kg/ha in 1992 (Morrice, 1998) which
has been increased more than threefold in RF household ponds. The average yields of

Chapter 3
159
pond fish increased from 1000kg/ha to 3300 kg/ha after Mymensingh Aquaculture
Extension Project (MAEP) interventions (GoB/Danida, 2004).
Multiple-ownership of ponds is a common constraint in all parts of Bangladesh (Gill and
Motahar, 1982) which leads to mis-management and lower productivity of ponds.
Decentralised fish seed production contributed to the supply of seed and increased
production of fish in such less intensively managed multiple-ownership ponds.
The trend towards increased fish production in RF households in this study area shows
the potential of fish production in household ponds by stocking on-farm fish fingerlings.
Overall, this scenario strongly indicates that far more could be achieved by stocking
large size fingerlings in currently managed culture systems than any other single
management step.
Fish consumption
The World Bank acknowledges that small-scale fisheries provide most of the fish
consumed by people in developing countries. Between 1961 and 1990 the fish food
supply per capita declined steadily in Bangladesh and many other developing countries
(Kent, 1997). In Bangladesh the overall animal protein supply per capita has been falling
together with the fish supply, which means that fish has not been replaced with other
forms of animal protein (Kent, 1997).
The present study shows that RF households increased their on-farm fish production
substantially and consumed more fish in spite of their larger household size than NRF
households. Poor and intermediate households tended to eat larger sized fingerlings
produced in their riceplots than better-off households. This suggests that better-off
households could delay eating fish from their riceplots as they have ponds in which to

Chapter 3
160
stock and add value to them. Evidence from CARE studies show that households
participating in CARE interventions have raised their fish consumption (CARE, 2001a).
It was also reported that increased fish production at the household level met the
consumption demand for children.
Fish consumption from wild sources was found to be limited, with RF households
consuming slightly more than NRF. A study carried out by CARE has shown that the
estimated annual wild fish catch from inland waters per household for Rangpur, Bogra
and Jessore were 8 kg, 15 kg and 22 kg respectively (CARE, 2001a) suggesting variable
and lowest wild fish production in CARE project areas. Similarly, a recent study in
Bangladesh found that annual per household wild fish consumption was variable ranging
from 2.5 to 14.5 kg (Islam, 2007). The amount of wild fish determined in the present and
previous study appears to be at a similar level and indicative of their limited contribution
to household consumption and a chronic scarcity of wild fish especially for poorer
households. The price of small indigenous fish species, that are normally caught from
wild sources, has surpassed the price of major carps substantially in recent years
(Thompson et al. 2000). Previously small indigenous wild fish was known as poor
people’s food, however, due to the supply deterioration and higher prices, this fish has
disappeared from the plates of the poor people (Kent, 1997).
Middle and high income people consumed a greater amount of fish compared to low
income people (Kent, 1997). A recent study showed that high income households
consumed more (90.93 kg/household/year) than low income households (64.88
kg/household/year) in the Mymensingh region of Bangladesh (Karim, 2006). For low
income people particularly dependent on fish in their diets this reduction in supply may
have serious consequences in terms of both economics and nutrition (Kent, 1997).
Adoption of fish culture by any means is therefore very important for low income poor
Chapter 3
161
people. The present study shows that poorer households increased their consumption
substantially through adoption of fish seed production technology in ricefields. Possibly
due to this fact, to sustain domestic fish consumption in Vietnam, fish production from
ricefields is expected to increase sustainably (NEDECO, 1993).
Overall household income and expenditure
Considering the whole sample, the present study reveals that, the average annual
household income from all sources together was US$ 935.48 where RF and NRF
household income was found to be US$ 1138.83 and US$ 732.00 respectively. National
household surveys showed the average rural household annual income was US$ 963.2 in
2000 (BBS, 2003) which is relatively higher than the finding of present study. This
difference between the national average and the average of the present study suggests
that overall households are relatively poorer in Northwest Bangladesh.
Overall the income of RF households was found to be higher than NRF ones. According
to literature, the CARE project have produced a number of choices for production
systems e.g. fish seed and foodfish production in riceplot, homestead gardening,
improved aquaculture, integrated pest management etc. which increased households
income by at least 50% (ITAD/ODI/OPM, 2001). According to the present study,
considering the whole sample, on average agriculture contributed about 50% of the
household income, which is higher than the national average (35%) (BBS, 2003b)
presumably due to the greater dominance of agriculture in livelihoods in Northwest
Bangladesh.
Irrespective of well-being category, expenditure on food was also lower in RF farming
households than in NRF households. A previous study has shown that although the
economy appears to be improving in general, statistics suggest that the real living

Chapter 3
162
standard of most people has fallen steadily, as there has been a rise in consumer prices
disproportionate to income growth (RDRS, 2000). According to the Consumer
Association of Bangladesh (CAB), in 1999 the cost of living increased 6.42% with a
2.15% rise in consumer item prices. During 1999, it was reported that the price of fish
and meat among other agricultural commodities tended to rise as well as industrial
commodities and government-control services (RDRS, 2000). Households’ budgets are
largely devoted to food and when faced with a large increase in the cost of one of their
major foods, they become worse-off economically as well as in nutritive terms (Kent,
1997). Expenditure on clothing, education, housing, medical treatment and social events
were higher in RF farming households possibly because of additional income from
ricefish farming.
It was also noted that significantly higher ceremonial costs were observed in rice
farming households compared to NRF households. This may have been due to the larger
size of households compared to the control which gives probable reasons for higher
ceremonial expenditures for buying new clothing during Eid/Puja, excessive expenses
for wedding event of daughter etc. This also indicates that RF households had more
disposable income which they spent in various social activities, possibly leading to the
accumulation of social capital. Other studies have shown that households with higher per
capita expenditure, more assets, better access to credit and higher savings in the past
year have closer relationships and greater social capital (Grootaert, 1999).
Fish farming (fish seed and pond fish) collectively, contributed 11% to the total income
and 17% of on-farm income to RF households which was nearly double the income from
the pond culture of NRF households. Fishpond operation along with crop production and
other on-farm activities contributed between 5 and 10% of the total household income in
Bangladesh (Bouis, 2000). Decentralised fish seed contributed a relatively minor

Chapter 3
163
proportion of annual household’s income however, it enhanced the overall income of the
fish sector in farming households.
Spatially in some situations where aquaculture has been targeted to increase on-farm
production of resource-poor households in certain agro-ecological regions, the income
changes were reportedly more significant (Gupta et al. 1999). For example, following an
intervention in a flood-prone area of Bangladesh, income derived from fish culture rose
from 4.6% to 21.6% of the total farm income and from 2.8% to 13.5% of the total
household income. The higher contribution of income from fish culture to overall
household income was as a direct consequence of living in a flood-prone area, where the
majority of households tended to be poorer with low household income (Gupta et al.
1999). Northeast Bangladesh is one of the poorest regions, where income from ricefield
based fish seed and pond fish production is likely to carry similar importance in
households’ livelihoods.
3.4.4 Conclusion
The study in this chapter contributed the findings to the hypothesis of ‘the asset profiles
RBFSP adopters are the same as non-adopter households of different levels of well-
being’. At the outset of CARE-project interventions in Northwest Bangladesh, farmers
lacked access to livelihoods resources, particularly human capital regarding knowledge
of sustainable management of ricefield ecosystems. The dominant livelihood strategy in
the study area was rice based agriculture depending on the cultivation of high yielding
varieties of rice with few opportunities for non-farm diversification. CARE programmes
provided little input in the form of human capital, through participatory FFS training
which brought broader changes over the livelihood assets of both primary and secondary
seed producing households compared to NRF households.

Chapter 3
164
RF farmers had no knowledge at all of fish seed production in ricefield based systems
before participating in farmer field schools either directly as primary farmers or through
as secondary adopters. After receiving training on fish seed production they started to
utilize their riceplots to produce additional fish seed and foodfish. Incorporating fish
seed production in ricefield based systems considerably changed the natural riceplot
ecosystems. Farmers did not use pesticides and increased their use of organic manure
thus reducing the operational cost of riceplot management. Literature shows that
elimination of pesticide uses has been noted in 93% of cases in Northwest Bangladesh
though there is no overall trend in other parts of Bangladesh for reducing their use
(ITAD/ODI/OPM, 2001).
Restocking fish fingerlings in household ponds increased pond production substantially
suggesting improvement pond use which is an important physical capital in farming
households. Production of fish in the riceplots and in household ponds increased fish
consumption at the household level suggesting improvement of human capital
nutritionally. Selling fingerlings and foodfish from ricefish plots and foodfish from
ponds diversified financial assets for the farming households. Riceplot tenure
mechanisms, gifting fish fingerling to relatives/neighbours and other relationships owing
to fish seed production activities contributed substantially to enhance social capital.
Overall, ricefield based fish seed producers improved their livelihood asset-base
substantially.

Chapter 4
165
Chapter 4: Seasonality of RBFSP and its impacts on livelihoods
4.1 Introduction
The preceding chapter was based on the analysis of one-off survey data and describes
the livelihood conditions of farming households in relation to RBFSP. A one-off survey
demonstrates household livelihood strategies and impacts of this technology which
broadly include fish seed production, foodfish production, consumption, income etc.
However, how farm households carry out seed production activities along with their
various farming activities throughout the year was not clearly understood. Additionally,
how outcomes of RBFSP contribute to or conflict with the seasonal needs of farming
households were yet to be fully understood. Therefore, a year long longitudinal
household survey was carried-out to understand how the seasonal dynamics of RBFSP
affected in farming households.
The world’s developing countries lie in the lower latitudes, that is, the tropics and
subtropics, being positioned between the Tropic of Cancer and the Tropic of Capricorn.
The tropical and subtropical zones have climatic distinctions (e.g. temperature,
humidity, rainfall etc.) from temperate zones, which are of vital importance to
agriculture and to the influence of seasonality on agriculture (Gill, 1991).
Along with a large number of developing countries, Bangladesh is located in Tropic of
Cancer with a considerable distance from the Equator (Figure 4.1). As a result,
Bangladesh has a subtropical monsoon climate, where there are six seasons in a year of
which three namely winter, summer and monsoon are prominent. This seasonal variation
has a close relationship to, and implications for, the livelihoods of rural people in
Bangladesh (BBS, 2003a). The importance of seasonality in socioeconomic activities,

Chapter 4
166
nutrition, food, and health at the household level has long been a concern of
anthropologists (Chambers, 1982).
Figure 4.1: Geographical position of Bangladesh (source: http://worldatlas.com).
The annual agricultural cycle results in substantial seasonal variation in the economic
activity of both men and women in rural households of Bangladesh (Cain et al. 1979).
Consequently, the sources from which income can be generated by household members
varies between seasons (Sahn, 1989).
In the mainly agrarian structure of Bangladesh, household level food production
strategies are the basis for survival. Seasonal shortages during the planting period, when
crops from the previous season have been exhausted and the new crops are not yet ripe
cause hunger (Messer, 1989). Therefore, seasonality has been recognized as a key
determinant of nutritional status in humans in low-income countries because of its role
in food production and food access (Brown et al. 1982; Tetens et al. 2003). Moreover,

Chapter 4
167
the role of climatic seasonality in human energetics has been recognised because of its
significant role not only in food intake but also in physical activity and thus energy
expenditure (Ferro-Luzzi, 1990).
Seasonal differences in the availability and intake of food and the effect of seasonality
on the nutritional status of people are well recognized in Bangladesh. However, there is
little empirical evidence on how food varies with the seasons and on the availability of
food at the household level. The staple food in Bangladesh is traditionally cereal,
especially rice, the availability of which is highly seasonal. This is due to the relative
abundance of rice occurring cyclically in relation to harvest and storage after sun drying.
A shortage of rice then occurs during the pre-harvest period (Abdullah, 1989).
Household characteristics with respect to bulk storage of rice after harvest for season
long consumption are different to that for other household-produced food items such as
vegetables and fish. Fish intake however is also affected by season as well as other
factors including location, water level of fish producing waterbodies and household
income which is again affected by season (Ross et al. 2004a).
During the past decades, the many ways in which the seasons of the year affect the lives
of poor have come to provide a common focal point for scientists and practitioners from
a broad range of disciplinary backgrounds. For many people, particularly the poor and
marginal farming households, it must have been almost beyond comprehension that such
an intrinsic aspect of human existence as the cycle of seasons actually needed to be
drawn to the attention of professionals concerned with the problem of food security and
poverty (Abdullah, 1989). In this regard, longitudinal studies under various ecological
and socio-economic conditions are needed for precise quantification of the effect of
seasonality on rural livelihoods to identify appropriate counter-seasonal measures.

Chapter 4
168
Therefore, the study attempts to take an account of the dynamic effects of cyclical
changes through assessment household level fish seed production in the irrigated
ricefield systems.
The main hypothesis of this chapter is that ‘seasonal changes may cause variation in
livelihood outcomes of farming households by well-being and farmer type and these are
affected by adoption of RBFSP’. The specifics are:-
� Work intensity for different purposes varies seasonally in farming households and
RBFSP does not compete for household labour with other more important
activities.
� RBFSP increases total household fish production and, improves and expedites
consistency of fish consumption year round towards reducing vulnerability.
� Household level income varies seasonally and RBFSP reduces vulnerability to
those cycles in adopting households compared to non-adopting households.
� Income from fish seed production is relatively more important to the poor than the
better-off.
� Seasonality affects the health condition of household members whilst RBFSP has
positive livelihood impacts.

Chapter 4
169
4.2 Methodology
4.2.1 Questionnaire survey
The most common method of longitudinal data collection in developing countries is the
personal interview, where an enumerator asks one or more household members to recall
information such as expenditure and food consumption over a reference period. Use of
recall periods and multiple rounds of surveys increase the reliability of estimates of
households which is generally termed longitudinal study (Smith, 2002). There are five
approaches to longitudinal investigations namely; repeated cross-section, cohort studies,
event history; time series and panel studies (Lambert, 2005). In socio-economic
research, a panel study is generally regarded as household monitoring (Diggle et al.
2002). The panel survey designs are a more rigorous solution to the time dilemma of
cross-sectional surveys (Nachmias-Frankfort and Nachmias, 1996) allowing insights into
the time order of the different socio-economic variables (Bryman, 2001).
In the present study, a month-interval panel survey of a total of 118 households was
conducted from May 2003 to April 2004 with the inclusion of the same farmers from the
same communities studied in Chapter 3. As the basic information was determined
through a one-off survey in Chapter 3, the same farmers were interviewed for this
longitudinal survey with a view to understanding the remaining year round dimensions
of livelihoods in their farming households. The survey was carried out using a structured
questionnaire incorporating information about the aspects of various activities, income
from different sources, expenditure for different purposes, food consumption and health
condition.
Initially the questionnaire was tested with households that were not included in this final
study. After necessary corrections and modification, the questionnaire was used for data
collection (Appendix 2). The same four field facilitators, who conducted the cross-

Chapter 4
170
sectional survey (Chapter 3), carried out this longitudinal survey which helped them to
deal with the farming households easily. The monitoring survey was begun immediately
following the cross-sectional survey. During the initiation of this survey, meeting with
the cross-sectional survey farmers were organized in each of the 20 communities to
share the objectives and process of monitoring survey and subsequently the farmers (3
RF and 3 NRF) were sampled from the same group. During discussion with farmers it
was discovered that NRF farmers were less interested in continuing with the monthly
questionnaire survey, and therefore a less frequent schedule was agreed with a three-
month interval between interviews. The repeated survey was carried-out with the same
household heads and available family members at the end of each survey month. The
survey dates were fixed for respective farmers in such a way that one month was
covered for each of the sampled households. This process of data collection was useful
in two ways i) the enumerators were not hurried during the interview to survey 6
households in a day and ii) farmers were aware about their interview date and could
mentally prepare himself/herself for the survey.
4.2.2 Data management
After completion of a year-long survey, the collected data were entered by the field
enumerators in a database prepared in Microsoft Access. The data were then checked
and verified by the enumerators using hardcopies of the questionnaires. This process of
database preparation involving the enumerators, minimized the errors in the dataset in
two ways firstly, they were confident entering the data they had collected and secondly,
they were able to solve any problems regarding incorrect and missing information while
rechecking the dataset. Using MS Access, different query options were used to arrange
different permutations and combinations as per the respective objectives of the study.

Chapter 4
171
4.2.3 Data analysis
As in Chapter 3, the study population comprised the same 118 households aggregated
into three well-being groups selected from 20 communities in Northwest Bangladesh.
Out of a total of 118 households, 60 were seed producing (RF) and the remaining 58
were non-seed producing (NRF) households.
Using the procedure of General Linear Model (GLM) in SPSS, univariate analysis of
variance was performed for inferential statistics. In the statistical model, time spent for
different productive and re-productive activities, income, expenditure and food
consumption of farming households were considered as dependent variables. These data
were converted to weekly per capita basis before analysis (e.g. Karim 2006; Islam,
2007) for comparison with available literature. Farmer type, well-being and season were
included as independent fixed variables. All main effects were evaluated as well as two-
factor interactions between farmer type and wellbeing; and three-factor interactions
between farmer types, well-being and season.
Tukey’s test was used for the post hoc detection of significant pair-wise comparisons.
Descriptive statistics such as mean, standard error and percentages as well as inferential
statistics of P values for main effects and significant interactions were used to interpret
the results. Descriptive statistics were presented through graphs and tables using MS
Excel software. Based on the results, a number of meetings were carried out at the
community level in February 2005 involving farmers to share the findings for validation
and better understanding of results and interpretations (Figure 4.2).

Chapter 4
172
Figure 4.2: Result discussion meeting at the community level.
Before discussion meetings, the results were drawn on a paper with coloured marker
pens so that farmers could understand the findings. During discussion with the farmers,
any contradictory interpretations were raised and discussed.
4.3 Results
4.3.1 Labour allocation of household members for different activities
Labour allocation between income generating activities in households and other
household activities are affected by economic as well as socio-cultural factors. This
deserved attention as the participation of women in economic activities outside the home
is very low in Bangladesh.
The household level labour allocation has been divided into two categories: i) economic
activities (activities which generate income); and ii) domestic activities (activities which
generate utility but not cash income). This distinction between the two categories is not

Chapter 4
173
clear-cut as domestic activities have a market value (e.g. price of childcare, prepared
food etc.) (Hossain et al. 2004). In the present study, household labour requirements
have been divided into two categories i) labour necessary for generating income and
capital or “productive work”; and ii) labour necessary for maintenance and upkeep the
household, which is not directly productive in the sense of generating income-is termed
arbitrarily as “re-productive work” (Cain, 1991).
Overall, in a RF household, productive activities with respect to agriculture, fish seed
production (ricefish), pond culture and non-farm productive activities collectively
required 43% of total time (Figure 4.3). Re-productive activities related to non-farm and
homestead level activities collectively made up 55% of household time.
Agricultural
activities
30%
Ricefish
activities
1%
Pond based
activities
2%
Non-farm
productive
activities
10%
Homestead re-
productive
activity
39%
Non-farm re-
productive
activities
18%
Figure 4.3: Percent time allocation for different activates done in RF household.

Chapter 4
174
Within the overall time (hr/capita/week) spent carrying out different activities, fish seed
production activities required only 1% of time, which was proportionality lower than
any other household activity (Table 4.1).
Table 4.1 Time spent (hr/capita/week) for different activities in RF households by gender
Average time spent (hr/capita/week) Activities
Household head
Household head wife
Household head son
Household head daughter
Household elderly member
Total household activity
Agriculture 23.70±0.69 8.32±0.37 10.83±0.62 1.11±0.15 1.47±0.19 45.43±1.04
Ricefish 0.66±0.03 0.08±0.01 0.53±0.04 0.03±0.01 0.01±0.01 1.3±0.06
Pond 2.58±0.11 1.26±0.02 1.59±0.08 0.10±0.02 0.12±0.02 5.65±0.15 Productive
Non-farm productive
5.98±0.54 0.26±0.12 8.29±0.78 0.40±0.00 0.95±0.25 15.48±1.06
Homestead re-productive
1.80±0.21 41.28±1.04 1.14±0.15 5.58±0.36 11.23±0.80 61.05±0.93
Re-productive Non-farm
re-productive 10.68±0.56 3.29±0.40 8.63±0.72 3.92±0.47 1.72±0.31 28.24±1.24
According to the time allocation observed (Figure 4.3), the majority of productive
activities were found to be male dominated which were carried-out by household heads
and their sons. In terms of ricefish activities, household heads and their sons collectively
contributed the major proportion of time required. Homestead level re-productive
activities also consumed a major portion of time (Figure 4.3), and were strictly female
dominated, where the household wife contributed a major portion of her time.
Agriculture activities
Agriculture activities were categorized into four groups: rice-based agriculture,
livestock-based agriculture, vegetable-based agriculture and other agricultural activities
(Figure 4.4). Among them, rice-based activities accounted for 50% of the total time
followed by livestock, vegetable and other activities.

Chapter 4
175
Rice
49%
Livestock
39%
Vegetable
7%
Other activities
5%
Figure 4.4: Percent time spent (hr/capita/week) carrying out different agriculture activities in RF household.
0
2
4
6
8
10
12
14
16
18
Po
or
Inte
rme
dia
teB
ette
r-o
ffP
oo
rIn
term
ed
iate
Be
tte
r-o
ffP
oo
rIn
term
ed
iate
Be
tte
r-o
ffP
oo
rIn
term
ed
iate
Be
tte
r-o
ffP
oo
rIn
term
ed
iate
Be
tte
r-o
ffP
oo
rIn
term
ed
iate
Be
tte
r-o
ffP
oo
rIn
term
ed
iate
Be
tte
r-o
ffP
oo
rIn
term
ed
iate
Be
tte
r-o
ffP
oo
rIn
term
ed
iate
Be
tte
r-o
ffP
oo
rIn
term
ed
iate
Be
tte
r-o
ffP
oo
rIn
term
ed
iate
Be
tte
r-o
ffP
oo
rIn
term
ed
iate
Be
tte
r-o
ff
May Jun Jul Aug Sep Oct Nov Dec Jan Feb Mar Apr
Tim
e s
pe
nt (h
r/ca
pita
/we
ek)
Ricefish
Pond
Agriculture
Figure 4.5: Average time spent (hr/capita/week) carrying out agricultural activities in RF household by month and wellbeing.

Chapter 4
176
Time spent (hr/capita/week) carrying out agriculture activities was affected significantly
(P<0.05) by month. Agricultural activities peaked in the month of May for all well-being
groups (Figure 4.5). However, during the months of July and August better-off
households spent more time on agricultural activities compared to other groups. This
was due to the tendency for better-off households to maximise their land use for amon
cultivation (Table 4.2).
Table 4.2: Land (ha) cultivated during boro and amon season for rice production
Well-being group Boro season Amon season Increased land in amon season
Poor 0.28 0.37 0.09 Medium 0.64 0.72 0.08 Better-off 1.42 1.87 0.45
There was no significant difference between RF and NRF households in time spent
carrying out agricultural activities in the months of May, September, January and April.
0.00
2.00
4.00
6.00
8.00
10.00
12.00
14.00
16.00
NRF RF NRF RF NRF RF NRF RF
May Sep Jan Apr
Tim
e s
pe
nt
(hr/
ca
pita
/we
ek
) Ricefish
Pond
Agriculture
Figure 4.6: Average time spent (hr/capita/week) for ricefish and other agricultural activities by farmer type and month.
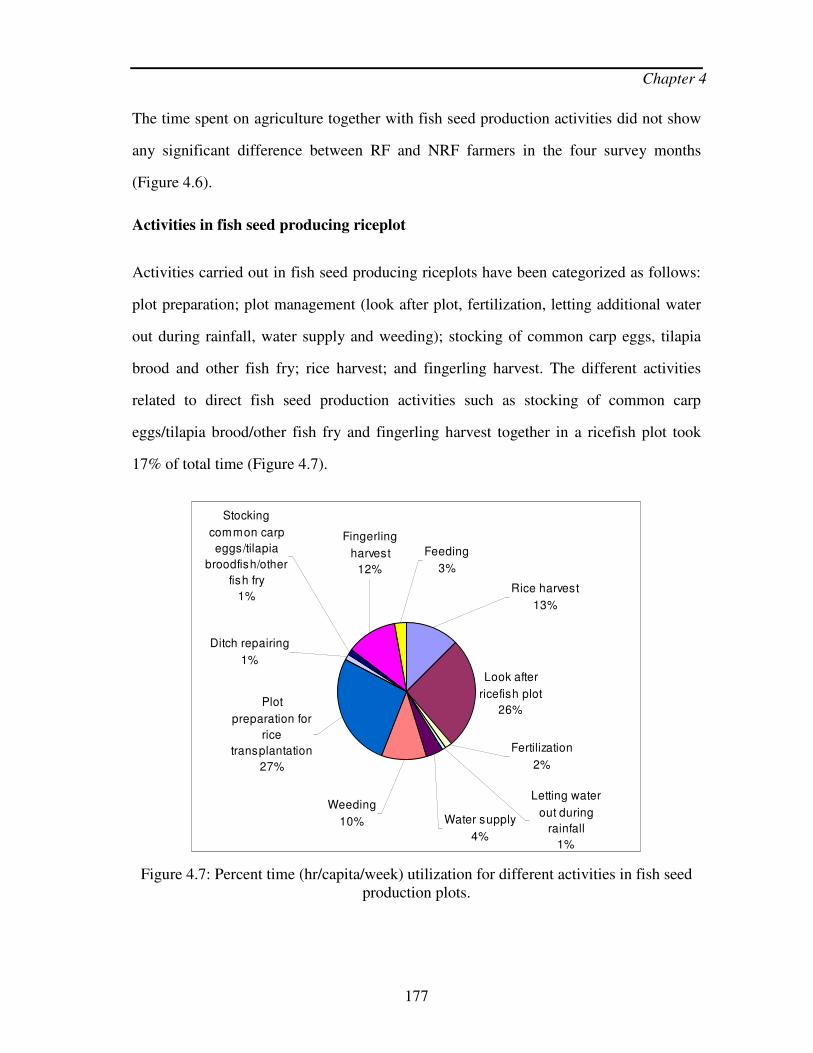
Chapter 4
177
The time spent on agriculture together with fish seed production activities did not show
any significant difference between RF and NRF farmers in the four survey months
(Figure 4.6).
Activities in fish seed producing riceplot
Activities carried out in fish seed producing riceplots have been categorized as follows:
plot preparation; plot management (look after plot, fertilization, letting additional water
out during rainfall, water supply and weeding); stocking of common carp eggs, tilapia
brood and other fish fry; rice harvest; and fingerling harvest. The different activities
related to direct fish seed production activities such as stocking of common carp
eggs/tilapia brood/other fish fry and fingerling harvest together in a ricefish plot took
17% of total time (Figure 4.7).
Look after
ricefish plot
26%
Fertilization
2%
Water supply
4%
Letting water
out during
rainfall
1%
Weeding
10%
Plot
preparation for
rice
transplantation
27%
Ditch repairing
1%
Stocking
common carp
eggs/tilapia
broodfish/other
fish fry
1%
Fingerling
harvest
12%
Feeding
3%
Rice harvest
13%
Figure 4.7: Percent time (hr/capita/week) utilization for different activities in fish seed production plots.

Chapter 4
178
The average time (hr/capita/week) spent carrying out fish seed production activities in
riceplots was significantly (P<0.05) affected by month. The time spent peaked in the
months of May, July, November and February, when the poor spent more time
compared to intermediate and better-off households (Figure 4.5).
Pond aquaculture
Pond based activities in farm households were: pond preparation, pond management and
pond harvest. Activities related to pond management required the highest amount of
time (56%) followed by pond harvest and pond preparation (Figure 4.8). Pond harvest
consumed a remarkable percentage of overall time possibly related to frequent
intermediate harvest of fish by household members typically using a cast net. RF
households tended to use cast nets which are easy to operate and effective fishing gear
for catching fish from ponds (Chapter 3).
Pond
preparation
3%
Pond
management
56%
Pond
harvest 41%
Figure 4.8: Percent utilization of time (hr/capita/week) for different activities of pond culture.
The average time spent (hr/capita/week) carrying out pond culture activities in RF
households was found to be affected by month and well-being. The time spent in pond

Chapter 4
179
culture activities peaked in the months of May, June and October (Figure 4.5). A
significant difference (P<0.05) was found between the RF and NRF farmers in terms of
time spent on pond culture activities. The time spent by RF households was found to be
56% higher compared to NRF households (Figure 4.6). This finding suggests that RF
farming households were more likely to improve their pond culture compared to NRF
farmers. The tendency of RF households to improve pond culture could be explained by
their access to fingerlings produced on-farm level, which in turn influenced them to
intensify management of their pond culture systems.
Homestead level re-productive activities
There are different types of homestead level re-productive activities carried-out which
include cooking and serving food to household members; washing and cleaning;
childcare; rice processing (boiling, drying and cleaning of rice); construction and
repairs; fuel collection and preparation (e.g. leaf litter collection, cow dung stick making
etc.); care of the sick and aged; and making household goods (e.g. handicraft katha -
blanket making). Among the various activities, cooking food and serving, as well as
washing and cleaning consumed the major proportion of the total time (Figure 4.9).

Chapter 4
180
0 10 20 30 40 50 60
Cooking and serving food
Washing and cleaning
Childcare
Rice processing
Construction and repairing
Fuel collection and preparation
Patient and old age care
Household goods making
Percent of total time
Figure 4.9: Percent of time (hr/capita/week) used for homestead level reproductive activities in RF households.
0
5
10
15
20
25
30
Po
or
Inte
rme
dia
teB
ette
r-o
ffP
oo
rIn
term
ed
iate
Be
tte
r-o
ffP
oo
rIn
term
ed
iate
Be
tte
r-o
ffP
oo
rIn
term
ed
iate
Be
tte
r-o
ffP
oo
rIn
term
ed
iate
Be
tte
r-o
ffP
oo
rIn
term
ed
iate
Be
tte
r-o
ffP
oo
rIn
term
ed
iate
Be
tte
r-o
ffP
oo
rIn
term
ed
iate
Be
tte
r-o
ffP
oo
rIn
term
ed
iate
Be
tte
r-o
ffP
oo
rIn
term
ed
iate
Be
tte
r-o
ffP
oo
rIn
term
ed
iate
Be
tte
r-o
ffP
oo
rIn
term
ed
iate
Be
tte
r-o
ff
May Jun Jul Aug Sep Oct Nov Dec Jan Feb Mar Apr
Tim
e s
pe
nt (h
r/ca
pita
/we
ek)
Non-farm productive
Non-farm reproductive
Homestead reproductive
Figure 4.10: Average time spent (hr/capita/week) for homestead re-productive, non-farm reproductive and non-farm productive activities in RF household by month and well-
being.
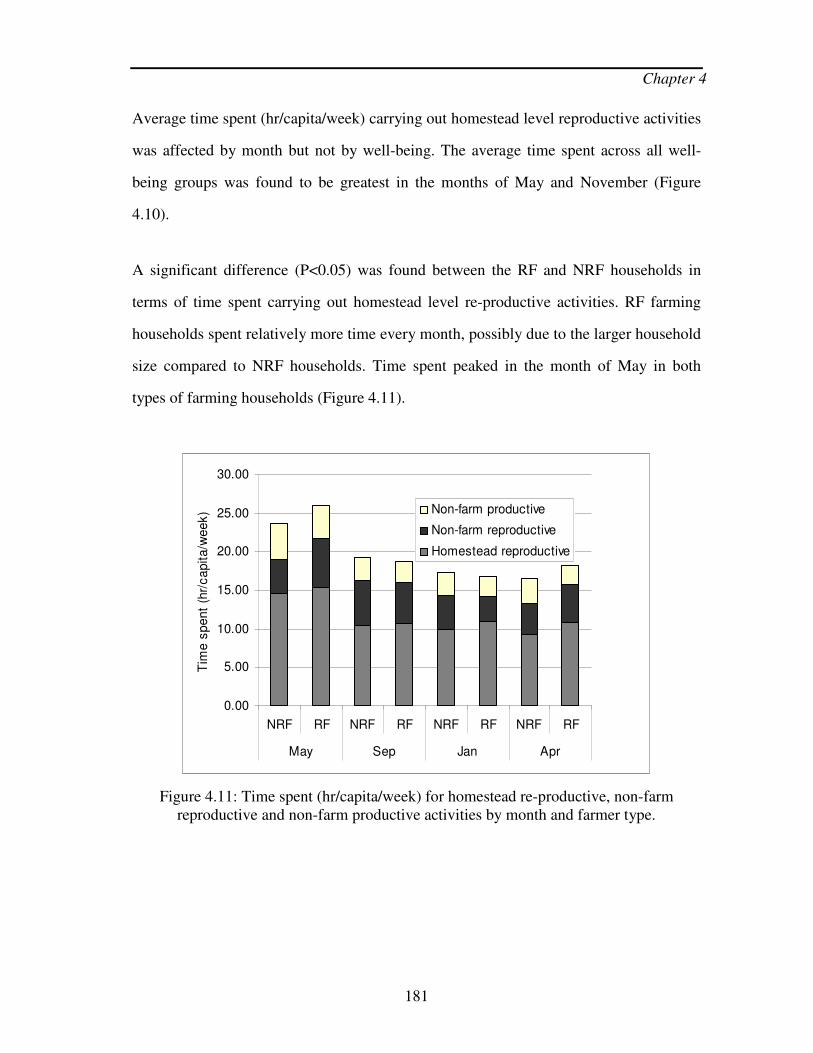
Chapter 4
181
Average time spent (hr/capita/week) carrying out homestead level reproductive activities
was affected by month but not by well-being. The average time spent across all well-
being groups was found to be greatest in the months of May and November (Figure
4.10).
A significant difference (P<0.05) was found between the RF and NRF households in
terms of time spent carrying out homestead level re-productive activities. RF farming
households spent relatively more time every month, possibly due to the larger household
size compared to NRF households. Time spent peaked in the month of May in both
types of farming households (Figure 4.11).
0.00
5.00
10.00
15.00
20.00
25.00
30.00
NRF RF NRF RF NRF RF NRF RF
May Sep Jan Apr
Tim
e s
pe
nt
(hr/
ca
pita
/we
ek) Non-farm productive
Non-farm reproductive
Homestead reproductive
Figure 4.11: Time spent (hr/capita/week) for homestead re-productive, non-farm reproductive and non-farm productive activities by month and farmer type.

Chapter 4
182
Non-farm re-productive and productive activities
Of the total time spent on non-farm activities, the major portion (60%) was used for re-
productive activities including, visiting relative/neighbour’s house, schooling, shopping,
recreation (watching television, listening song to cassette player & radio and gossiping
etc.), marketing, official work, treatment as well as other minor activities (Figure 4.12).
The remaining 40% of the time was used for productive activities such as service
(teaching in primary, secondary, college, and madrasha; engineer, NGO activists etc.),
business, labouring and petty service (employee in shop, mill, and office peon).
Productive
activities (40%)
Child schooling
18%
Shopping
9%
Labouring
10%
Visit to relative &
neighbours
16%
Service
15%
Petty service
3%
Business
12%
Off icial w ork
2%
Marketing
4%
Recreation
7%
Treatment
1%Other activities
3%
Re-productive
activities (60%)
Figure 4.12: Percent of time (hr/capita/week) used in different non-farm re-productive and productive activities.
In terms of non-farm reproductive activities in RF households, the average time spent
(hr/capita/week) was affected by month but not by well-being (Figure 4.10). The
average time spent on non-farm reproductive activities was also affected by month and
farmer type (Figure 4.11). In terms of non-farm productive activities in RF households,

Chapter 4
183
time spent (hr/capita/week) was not affected by month but by well-being (Figure 4.10).
Time spent on non-farm productive activities was also varied by month and farmer type
(Figure 4.11).
4.3.2 Fish seed production in riceplot and its associated usages
Total production of fish seed/fingerling (kg/capita/week) was affected significantly
(P<0.05) by month. The production of better-off farmers was relatively higher than the
medium and poor farmers. Weekly per capita seed/fingerling sale (kg) was affected
significantly (P<0.05) by month but not by well-being. The amount of fingerlings
consumed was found to be affected significantly (P<0.05) by month and well-being
(Figure 4.13). The amount of fish seed (kg/capita/week) restocked and gifted was also
significantly (P<0.05) affected by month but not by well-being.
0.00
0.20
0.40
0.60
0.80
1.00
1.20
Poo
rIn
term
ed
iate
Be
tte
r-off
Poo
rIn
term
ed
iate
Be
tte
r-off
Poo
rIn
term
ed
iate
Be
tte
r-off
Poo
rIn
term
ed
iate
Be
tte
r-off
Poo
rIn
term
ed
iate
Be
tte
r-off
Poo
rIn
term
ed
iate
Be
tte
r-off
Poo
rIn
term
ed
iate
Be
tte
r-off
Poo
rIn
term
ed
iate
Be
tte
r-off
Poo
rIn
term
ed
iate
Be
tte
r-off
Poo
rIn
term
ed
iate
Be
tte
r-off
Poo
rIn
term
ed
iate
Be
tte
r-off
Poo
rIn
term
ed
iate
Be
tte
r-off
May Jun Jul Aug Sep Oct Nov Dec Jan Feb Mar Apr
Use
s o
f fis
h s
ee
d/f
ing
erl
ing
(kg
/ca
pita
/wee
k)
Gif t
Restocking
Consumption
Sale
Figure 4.13: Usages of fish seed/fingerling (kg/capita/week) in RF households by month and well-being.

Chapter 4
184
Higher production in better-off households in the months of May and November was
due to particularly a large harvest by 2 better-off farmers in these months (Figure 4.14).
Well-being score
12010080604020
Pro
du
ctio
n (
kg
/ca
pita
/we
ek)
1.5
1.4
1.3
1.2
1.1
1.0
.9
.8
.7
.6
.5
.4
.3
.2
.1
0.0
Well-being
Better-of f
Medium
Poor
Figure 4.14: Scatter plot showing distribution of fingerling production (kg/capita/week) by well-being.

Chapter 4
185
4.3.3 Income and expenses
Household level income
Rice sales dominated household total incomes (US$/capita/week) in intermediate and
better-off RF households earning 40.72 and 44.44% respectively, but were less than 20%
in poor households. Poor households had more diversified income sources where
RBFSP contributed more (4.64%) to their overall income compared to intermediate and
better-off households (Table 4.3).
Table 4.3: Percent contribution of income (US$/capita/week) from different sources by well-being
Income sources Poor Intermediate Better-off
Mean % of total Mean % of total Mean % of total
Fish seed 0.14±0.49 4.64 0.12±0.49 2.71 0.20±1.30 3.17
Rice sale 0.57±1.89 18.87 2.13±1.64 40.72 2.80±4.02 44.44
Service 0.43±0.18 14.24 1.01±2.17 22.85 0.67±1.74 10.63
Business 0.45±1.04 14.90 0.31±1.07 7.01 0.73±2.54 11.58
Other off-farm sources
0.58±1.41 19.21 0.28±0.95 6.33 0.33±1.63 5.23
Livestock sources 0.40±1.06 13.25 0.41±1.07 9.28 0.65±1.52 10.31
Pond 0.24±0.89 7.95 0.24±0.67 5.43 0.61±1.15 9.68
Vegetable 0.12±0.30 3.97 0.14±0.61 3.17 0.18±0.28 2.85
Other on-farm sources
0.09±0.74 2.98 0.11±0.48 2.49 0.13±0.52 2.06
Total income 3.02±1.85 100 4.42±2.01 100 6.30±2.63 100
Percentage of income is shown by column; service includes both government and non-government services; other ff-farm activities include day labour for agriculture activities, part-time labour in rice mill etc.

Chapter 4
186
0
1
2
3
4
5
6
7
8
9
Po
or
Inte
rme
dia
teB
ett
er-
off
Po
or
Inte
rme
dia
teB
ett
er-
off
Po
or
Inte
rme
dia
teB
ett
er-
off
Po
or
Inte
rme
dia
teB
ett
er-
off
Po
or
Inte
rme
dia
teB
ett
er-
off
Po
or
Inte
rme
dia
teB
ett
er-
off
Po
or
Inte
rme
dia
teB
ett
er-
off
Po
or
Inte
rme
dia
teB
ett
er-
off
Po
or
Inte
rme
dia
teB
ett
er-
off
Po
or
Inte
rme
dia
teB
ett
er-
off
Po
or
Inte
rme
dia
teB
ett
er-
off
Po
or
Inte
rme
dia
teB
ett
er-
off
May Jun Jul Aug Sep Oct Nov Dec Jan Feb Mar Apr
Inco
me
(U
S$
/ca
pita
/we
ek)
Other income
Fish fingerlings
Figure 4.15: Average income (US$/capita/week) of RF households by wellbeing and month.
Average total income (US$/capita/week) in RF households was affected significantly
(P<0.05) by month and well-being (Figure 4.15). Overall, incomes peaked between the
months of December to February and from June to August. Income from fish seed
(US$/capita/week) was affected significantly (P<0.05) by month as well as month and
well-being combined. Contribution of the income from fish seed production to the total
income of poorer households was found to be higher in the months of June and October.
In terms of farmer type (RF and NRF farmer) and month (four survey months) income
(US$/capita/week) did not differ significantly. However per capita income in RF
households was relatively higher than NRF household incomes.
Income from rice sales was significantly affected by month and well-being in the RF
households. Income from selling fingerlings appeared to protect distress sale boro rice in
the months of May and June (Figure 4.16).

Chapter 4
187
0
1
2
3
4
5
6
7
8
9
Poo
rIn
term
ed
iate
Bette
r-off
Poo
rIn
term
ed
iate
Bette
r-off
Poo
rIn
term
ed
iate
Bette
r-off
Poo
rIn
term
ed
iate
Bette
r-off
Poo
rIn
term
ed
iate
Bette
r-off
Poo
rIn
term
ed
iate
Bette
r-off
Poo
rIn
term
ed
iate
Bette
r-off
Poo
rIn
term
ed
iate
Bette
r-off
Poo
rIn
term
ed
iate
Bette
r-off
Poo
rIn
term
ed
iate
Bette
r-off
Poo
rIn
term
ed
iate
Bette
r-off
Poo
rIn
term
ed
iate
Bette
r-off
May Jun Jul Aug Sep Oct Nov Dec Jan Feb Mar Apr
Inco
me
(U
S$
/ca
pita
/we
ek) Other on-farm
Vegetable
Pond
Livestock
Other off-farm
Business
Service
Rice sale
Fish seed
Figure 4.16: Household level income (US$/capita/week) from different sources by month and well-being.

Chapter 4
188
Expenditure
Food consumption incurred the highest expenditure in poorer RF households, whereas
purchased agricultural inputs incurred the highest expenditure in medium and better-off
households (Table 4.4).
Table 4.4: Average and percentage share of expenditure (US$/capita/week) in fish seed producing (RF) households from different sources by well-being
Income sources Poor Intermediate Better-off
Mean % of total Mean % of total Mean % of total
Agriculture crops 0.51±1.17 18.81 0.85±1.46 27.41 1.28±1.28 29.83
Food 0.64±0.32 23.61 0.63±0.28 20.23 0.69±0.49 16.08
Clothing 0.17±0.28 6.27 0.18±0.25 5.80 0.27±0.44 6.29
Education 0.11±0.23 3.05 0.13±0.26 4.19 0.24±0.44 5.59
Housing 0.21±1.10 7.74 0.25±1.09 8.06 0.36±2.27 8.39
Kerosene/ electricity
0.05±0.05 1.84 0.05±0.05 1.16 0.07±0.17 1.63
Festival 0.10±0.18 3.69 0.16±0.50 5.16 0.22±1.01 5.12
Health treatment 0.13±0.28 4.79 0.16±0.26 5.16 0.25±0.47 5.82
Livestock 0.07±0.40 2.58 0.09±0.51 2.90 0.11±0.56 2.56
Pond 0.10±0.46 3.69 0.11±0.31 3.54 0.19±0.32 4.42
Credit repay 0.25±0.97 9.22 0.16±0.95 5.16 0.27±1.01 6.29
Other 0.40±1.99 14.76 0.39±1.17 12.58 0.41±1.61 9.56
Fish seed 0.011±0.004 0.38 0.008±0.003 0.24 0.013±0.006 0.30
Total 2.75±0.57 100 3.16±0.54 100 4.37±0.77 100
Percentage of expenditure is shown by column
Expenditure incurred for the production of fingerlings was less than that for kerosene
and electricity for all well-being groups. This was comparatively the lowest item of
expenditure in farming households.

Chapter 4
189
0
2
4
6
8
10
Po
or
Inte
rme
dia
teB
ette
r-o
ffP
oo
rIn
term
ed
iate
Be
tte
r-o
ffP
oo
rIn
term
ed
iate
Be
tte
r-o
ffP
oo
rIn
term
ed
iate
Be
tte
r-o
ffP
oo
rIn
term
ed
iate
Be
tte
r-o
ffP
oo
rIn
term
ed
iate
Be
tte
r-o
ffP
oo
rIn
term
ed
iate
Be
tte
r-o
ffP
oo
rIn
term
ed
iate
Be
tte
r-o
ffP
oo
rIn
term
ed
iate
Be
tte
r-o
ffP
oo
rIn
term
ed
iate
Be
tte
r-o
ffP
oo
rIn
term
ed
iate
Be
tte
r-o
ffP
oo
rIn
term
ed
iate
Be
tte
r-o
ff
May Jun Jul Aug Sep Oct Nov Dec Jan Feb Mar Apr
Exp
en
ditu
re (
US
$/c
ap
ita
/we
ek)
Fish fingerlings
Other expense
Figure 4.17: Expenditure (US$/capita/week) in seed producing household by month and well-being.
Overall, the total household expenditure (US$/capita/week) was affected significantly
(P<0.05) by month and well-being (Figure 4.17). Weekly per capita expenditure peaked
in the months of May, June, July and January. Expenditure related to fish seed
production was found to be very lower compared to overall expenditure in farming
households. Overall expenditure (US$/capita/week) in RF household was relatively
higher than in NRF households.
The greatest expenditure of a farmer’s income was towards agriculture and was
significantly affected by month and well-being. Expenditure for health treatment and
social/ceremonial purposes was found to be higher in the months of May to August and
December to March (Figure 4.18).

Chapter 4
190
0
1
2
3
4
5
6
7
8
9
10
Po
or
Inte
rme
dia
teB
ett
er-
off
Po
or
Inte
rme
dia
teB
ett
er-
off
Po
or
Inte
rme
dia
teB
ett
er-
off
Po
or
Inte
rme
dia
teB
ett
er-
off
Po
or
Inte
rme
dia
teB
ett
er-
off
Po
or
Inte
rme
dia
teB
ett
er-
off
Po
or
Inte
rme
dia
teB
ett
er-
off
Po
or
Inte
rme
dia
teB
ett
er-
off
Po
or
Inte
rme
dia
teB
ett
er-
off
Po
or
Inte
rme
dia
teB
ett
er-
off
Po
or
Inte
rme
dia
teB
ett
er-
off
Po
or
Inte
rme
dia
teB
ett
er-
off
May Jun Jul Aug Sep Oct Nov Dec Jan Feb Mar Apr
Exp
en
ditu
re (
US
$/c
ap
ita
/we
ek)
Fish seed
Other cost
Credit repay
Pond
Livestock
Health treatment
Social/ceremonial
Kerosene
Housing
Education
Clothing
Foods
Agril. crops
Figure 4.18: Different expenses (US$/capita/week) in RF households by month and well-being.
4.3.4 Consumption of food
4.3.4.1 Fish consumption
Total average fish consumption (g/capita/week) in RF households was found to be
407±12.48 g/capita/week. Average total fish consumption (g/capita/week) was affected
significantly (P<0.05) by month and well-being. Fish consumption in better-off
households was higher than in medium and poorer households. Consumption of fish
peaked in August to September but was lowest in March to April.

Chapter 4
191
0
100
200
300
400
500
600
700
Po
or
Me
diu
mB
ette
r-o
ffP
oo
rM
ed
ium
Be
tte
r-o
ffP
oo
rM
ed
ium
Be
tte
r-o
ffP
oo
rM
ed
ium
Be
tte
r-o
ffP
oo
rM
ed
ium
Be
tte
r-o
ffP
oo
rM
ed
ium
Be
tte
r-o
ffP
oo
rM
ed
ium
Be
tte
r-o
ffP
oo
rM
ed
ium
Be
tte
r-o
ffP
oo
rM
ed
ium
Be
tte
r-o
ffP
oo
rM
ed
ium
Be
tte
r-o
ffP
oo
rM
ed
ium
Be
tte
r-o
ffP
oo
rM
ed
ium
Be
tte
r-o
ff
May Jun Jul Aug Sep Oct Nov Dec Jan Feb Mar Apr
Fis
h c
on
su
mp
tio
n (
g/c
ap
ita
/we
ek)
Purchase
Wild
Pond
Riceplot
Figure 4.19: Fish consumption (g/capita/week) in RF households from different sources by month and well-being.
Consumption of fish (g/capita/week) caught in the RF plot was affected by month and
well-being. Weekly per capita fish consumption of the poor (60.22±7.03g) and
intermediate (90.43±11.23g) households was found to be higher than for better-off
farmers (31.47±5.09g). Poorer farmers appeared to consume fish from their riceplots in
the months of March, April and May while total fish consumption was lower in those
months (Figure 4.19). In these months consumption of fish from wild sources was very
limited suggesting that the contribution of the riceplot was very important for the poor
households compared to other months. Consumption of fish (g/capita/week) from on-
farm ponds was affected by well-being and was relatively higher in better-off
households than in other well-being groups.

Chapter 4
192
Month and well-being significantly affected (P<0.05) the consumption (g/capita/week)
of fish from wild sources. About 56% of total wild fish was consumed in the months of
August and September. Better-off farmers consumed more fish from wild sources
followed by poor and medium farmers. Consumption of purchased fish was significantly
(P<0.05) affected by well-being where the better-off households consumed higher
amounts.
Overall fish consumption (g/capita/week) was affected (P<0.05) by farmer type and
month. RF farmers consumed significantly more fish than NRF farmers.
0
100
200
300
400
500
600
NRF RF NRF RF NRF RF NRF RF
May Sep Jan Apr
Fis
h c
on
su
mp
tion
(g
/we
ek/c
ap
ita)
Purchase
Wild
Pond
Ricefield
Figure 4.20: Fish consumption (g/capita/week) in farming households from different sources by month and farmer type.
Fish consumption from wild sources was significantly affected by month. Consumption
of fish (g/capita/week) differed significantly (P<0.05) between RF and NRF farmers
from both ponds and market sources (Figure 4.20). RF farmers consumed a higher
amount of fish than NRF farmers from household ponds and vice versa from the market.

Chapter 4
193
The tendency for NRF farmers to consume purchased fish suggests that they used more
of their disposable income for this purpose.
4.3.4.2 Rice consumption
As a whole in the RF farming households, 93% of the rice consumed derived from their
own farm and the rest was purchased from the market. Better-off households met a
relatively higher proportion of their subsistence needs.
0
1000
2000
3000
4000
5000
6000
Po
or
Inte
rme
dia
teB
ett
er-
off
Po
or
Inte
rme
dia
teB
ett
er-
off
Po
or
Inte
rme
dia
teB
ett
er-
off
Po
or
Inte
rme
dia
teB
ett
er-
off
Po
or
Inte
rme
dia
teB
ett
er-
off
Po
or
Inte
rme
dia
teB
ett
er-
off
Po
or
Inte
rme
dia
teB
ett
er-
off
Po
or
Inte
rme
dia
teB
ett
er-
off
Po
or
Inte
rme
dia
teB
ett
er-
off
Po
or
Inte
rme
dia
teB
ett
er-
off
Po
or
Inte
rme
dia
teB
ett
er-
off
Po
or
Inte
rme
dia
teB
ett
er-
off
May Jun Jul Aug Sep Oct Nov Dec Jan Feb Mar Apr
Fo
od
co
ns
um
ptio
n (
g/c
ap
ita/w
ee
k)
Purchased
Ow n
Figure 4.21: Average rice consumption (g/capita/week) in RF households by month and wellbeing.
Although rice consumption (g/capita/week) did not differ significantly between the well-
being groups, it tended to be higher in poorer households (4794.57±1946.88) compared
to intermediate (4711.84±1689.51) and better-off (4154.69±1013.62) households.
Although variation was insignificant in rice consumption (g/capita/week) by month, a
little peak was observed during the summer months from May to August irrespective of
well-being groups (Figure 4.21). Poor and intermediate households purchased rice from

Chapter 4
194
the market in the months of August, September, October, November, February, March
and April. There was no significant difference between RF and NRF households in
terms of rice consumption (g/capita/week).
4.3.4.3 Vegetable consumption
Regarding sources of vegetables for consumption, 85% of vegetables were sourced from
the farmer’s own-land and the rest (15%), from market sources. Vegetable consumption
(g/capita/week) was significantly affected by month and well-being. Average vegetable
consumption (g/capita/week) in RF households was 1780.1±1387.4. Vegetable
consumption (g/capita/week) was significantly higher in intermediate (1934.4±1463.8)
and poorer (1873.7±1524.8) households than better-off (1449.1±967.8) households.
0
500
1000
1500
2000
2500
3000
Po
or
Inte
rme
dia
teB
ette
r-off
Po
or
Inte
rme
dia
teB
ette
r-off
Po
or
Inte
rme
dia
teB
ette
r-off
Po
or
Inte
rme
dia
teB
ette
r-off
Po
or
Inte
rme
dia
teB
ette
r-off
Po
or
Inte
rme
dia
teB
ette
r-off
Po
or
Inte
rme
dia
teB
ette
r-off
Po
or
Inte
rme
dia
teB
ette
r-off
Po
or
Inte
rme
dia
teB
ette
r-off
Po
or
Inte
rme
dia
teB
ette
r-off
Po
or
Inte
rme
dia
teB
ette
r-off
Po
or
Inte
rme
dia
teB
ette
r-off
May Jun Jul Aug Sep Oct Nov Dec Jan Feb Mar Apr
Foo
d c
on
sum
ptio
n (
g/c
ap
ita/w
eek
)
Purchased
Ow n
Figure 4.22: Vegetable consumption (g/capita/week) of RF farmer by month and well-being.
An increasing trend in vegetable consumption was apparent from the month of
November and continued until May (Figure 4.22). During this period poor and medium

Chapter 4
195
households tended to consume more vegetables. Households of all well-being groups
purchased more vegetables from July to October. Vegetable consumption
(g/capita/week) from on-farm and market sources differed significantly between RF and
NRF households. RF households tended to consume more vegetables from their own
sources than NRF households. Seasonality significantly (P<0.05) affected total weekly
per capita vegetable consumption (Figure 4.23).
0
500
1000
1500
2000
2500
NRF RF NRF RF NRF RF NRF RF
May Sep Jan Apr
Ve
ge
tab
le c
on
su
mp
tio
n (
g/c
ap
ita
/we
ek)
Purchased
Own
Figure 4.23: Vegetable consumption (g/capita/week) by month and farmer type.
4.3.4.4 Meat and egg consumption
Overall 41% of meat and eggs were derived from on-farm sources and the remaining
59% were purchased from market sources. The average meat and egg consumption in
RF households was 115.32±5.60 g/capita/week and was affected significantly (P<0.05)
by month and well-being (Figure 4.24). Better-off farmers tended to consume more meat
and eggs compared to medium and poor farmers.

Chapter 4
196
0
50
100
150
200
250
300
Po
or
Med
ium
Bett
er-
off
Po
or
Med
ium
Bett
er-
off
Po
or
Med
ium
Bett
er-
off
Po
or
Med
ium
Bett
er-
off
Po
or
Med
ium
Bett
er-
off
Po
or
Med
ium
Bett
er-
off
Po
or
Med
ium
Bett
er-
off
Po
or
Med
ium
Bett
er-
off
Po
or
Med
ium
Bett
er-
off
Po
or
Med
ium
Bett
er-
off
Po
or
Med
ium
Bett
er-
off
Po
or
Med
ium
Bett
er-
off
May Jun July Aug Sep Oct Nov Dec Jan Feb Mar Apr
Me
at &
eg
g c
on
sum
ptio
n (
g/c
ap
ita
/we
ek)
Figure 4.24: Meat & egg consumption (g/capita/week) in RF households by month and well-being.
Average meat & egg consumption for the NRF (130.14±13.38 g/capita/week)
households was relatively higher than for RF households (114.71±7.93 g/capita/week)
over the survey months (Figure 4.25).

Chapter 4
197
0
30
60
90
120
150
180
210
NRF RF NRF RF NRF RF NRF RF
May Sep Jan Apr
Me
at &
eg
g c
on
su
mp
tion
(g
/ca
pita
/we
ek)
Figure 4.25: Meat & egg consumption (g/capita/week) in farming households by month and farmer type.
4.3.4.5 Pulse consumption
Average pulse consumption (g/capita/week) in RF households was 37.13±2.41. Pulse
consumption was affected significantly (P<0.05) by well-being with medium and poor
farmers consuming more pulses than better-off farmers.
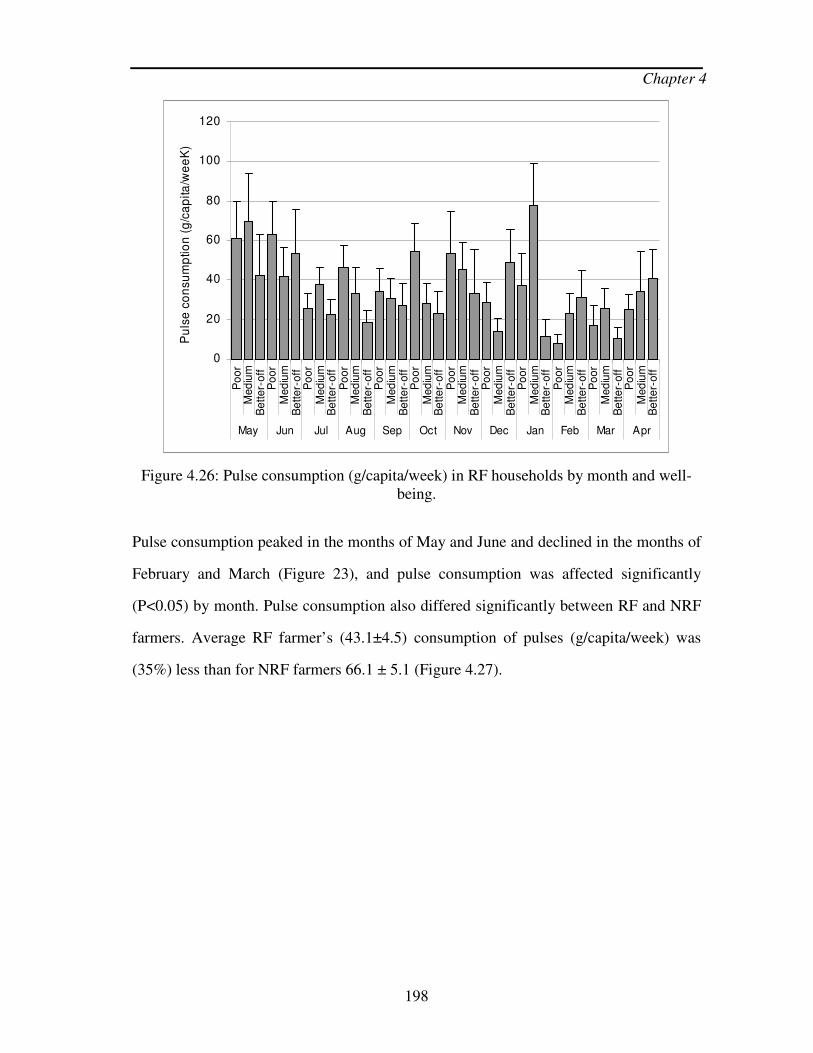
Chapter 4
198
0
20
40
60
80
100
120
Po
or
Med
ium
Be
tte
r-off
Po
or
Med
ium
Be
tte
r-off
Po
or
Med
ium
Be
tte
r-off
Po
or
Med
ium
Be
tte
r-off
Po
or
Med
ium
Be
tte
r-off
Po
or
Med
ium
Be
tte
r-off
Po
or
Med
ium
Be
tte
r-off
Po
or
Med
ium
Be
tte
r-off
Po
or
Med
ium
Be
tte
r-off
Po
or
Med
ium
Be
tte
r-off
Po
or
Med
ium
Be
tte
r-off
Po
or
Med
ium
Be
tte
r-off
May Jun Jul Aug Sep Oct Nov Dec Jan Feb Mar Apr
Pu
lse
co
nsu
mp
tion
(g
/ca
pita
/we
eK
)
Figure 4.26: Pulse consumption (g/capita/week) in RF households by month and well-being.
Pulse consumption peaked in the months of May and June and declined in the months of
February and March (Figure 23), and pulse consumption was affected significantly
(P<0.05) by month. Pulse consumption also differed significantly between RF and NRF
farmers. Average RF farmer’s (43.1±4.5) consumption of pulses (g/capita/week) was
(35%) less than for NRF farmers 66.1 ± 5.1 (Figure 4.27).

Chapter 4
199
0
10
20
30
40
50
60
70
80
NRF RF NRF RF NRF RF NRF RF
May Sep Jan Apr
Pu
lse
co
nsu
mp
tio
n (
g/c
ap
it/w
ee
k)
Figure 4.27: Pulse consumption (g/capita/week) in farm households by month and farmer type.
Overall rice and vegetable consumption (g/capita/week) was higher in poor and medium
households compared to better-off households. The opposite was found for fish, meat
and egg consumption.
4.3.5 Health condition
Sickness (days/capita/week) in RF faming households was affected by month with peaks
in June, October and November but not by well-being (Figure 4.28). Sickness was not
however affected by farmer type. Poorer and intermediate RF households tended to be
affected by respiratory problems including asthmatic disorder, pneumonia, influenza and
other diseases at the beginning of winter in November. They were also found to be more
affected by dysentery and diarrhoeal diseases than better-off households. Women in
poor and intermediate households were more affected by female diseases than in better-
off households. Female diseases were not discussed in detail with the respondents. Other
diseases/disorders including weakness, gallbladder stones, jaundice, ear problems, eye
problems, dental problems etc. also affected household members.

Chapter 4
200
0.0
0.1
0.1
0.2
0.2
0.3
0.3
0.4
0.4
Po
or
Inte
rme
dia
teB
ett
er-
off
Po
or
Inte
rme
dia
teB
ett
er-
off
Po
or
Inte
rme
dia
teB
ett
er-
off
Po
or
Inte
rme
dia
teB
ett
er-
off
Po
or
Inte
rme
dia
teB
ett
er-
off
Po
or
Inte
rme
dia
teB
ett
er-
off
Po
or
Inte
rme
dia
teB
ett
er-
off
Po
or
Inte
rme
dia
teB
ett
er-
off
Po
or
Inte
rme
dia
teB
ett
er-
off
Po
or
Inte
rme
dia
teB
ett
er-
off
Po
or
Inte
rme
dia
teB
ett
er-
off
Po
or
Inte
rme
dia
teB
ett
er-
off
May Jun Jul Aug Sep Oct Nov Dec Jan Feb Mar Apr
Sic
kn
es
s (
day
s/c
apita
/we
ek
)Reumatic pain
Other
Injury/disability
Blood pressure
Gastric/ulcer
Fever
Female diseases
Dysentery/diarrhoea
Cronic heart disease
Respiratory/asthama
Figure 4.28: Average sickness (days/capita/week) in RF farming households by month and well-being.
4.3.6 Correlation between income and other factors
Correlation analysis between income and activity, expenditure and food consumption
related factors showed several positive relationships (Table 4.5). In terms of productive
activities, the correlation with income was found to be positive but not significant.
Income and expenditure were found to be significantly (P<0.05) correlated. Fish
consumption from a household own pond and through purchase were positively
correlated with income. Interestingly, the correlation between income and the amount of
meat and eggs consumed was positive and highly significant (P<0.05).

Chapter 4
201
Table 4.5: Correlation co-efficient between income and other factors
Factor Correlation coefficient (‘r’ value)
Level of significance
Agriculture activity 0.042 Pond culture activity 0.175 Ricefish activity 0.022 Non-farm productive activity -0.049 Non-farm reproductive activity 0.980 ** Homestead activity 0.064 Expenditure 0.183 * Rice consumption 0.109 Fish consumption (riceplot) 0.045 Fish consumption (wild) 0.038 Fish consumption (pond) 0.025 * Fish consumption (purchase) 0.033 * Fish consumption total 0.002 Meat & egg consumption 0.810 ** Pulse consumption 0.028 Vegetable consumption 0.040 Health (sickness days) 0.043
*Correlation is significant at 0.01 level.
** Correlation is significant at 0.05 level.

Chapter 4
202
4.4 Discussion
In the present study, longitudinal data has been used to understand the behaviour of
livelihood characteristics on farm households practicing RBFSP activities and livelihood
outcomes. Longitudinal household data can have considerable advantages for social
science analysis over more widely available cross-sectional data. Longitudinal data
enables researchers to trace the dynamics of behaviours; identify the influence of past
behaviours on current behaviours; and controlling for unobserved fixed characteristics in
the investigation of the effect of time-varying exogenous variables on endogenous
behaviours (Alderman et al. 2001). As a result, advantages of the use of longitudinal
data are increasingly appreciated.
4.4.1 Activities
Agricultural activities
The present study shows that household level activities were carried out through team
work whereby household members performed different activities or the same activity to
different extents. Typically household activities are carried out within an approach of
specific institutional arrangements (Kabeer, 1994). In a household economy, a person
(typically a husband of wife at the same time a father of children) is the household head
ruling to ensure welfare for all household members simplifying the nosiness and
messiness of intra-household relationships at the community level (Kabeer, 1994).
Bangladesh remains a highly labour-intensive economy where the majority of people
subsist directly as a result of their immediate family’s physical labour. Household labour
utilization is for both productive and reproductive activities (Cain, 1991). In terms of
productive activities, rice cultivation is the main and most labour intensive activity in
agricultural farming (Rasul and Thapa, 2004). In rice cultivation the amon, rainfed rice
was traditionally the main crop, but boro (irrigated rice) rice has become more important

Chapter 4
203
over the last decade due to the introduction of high-yielding rice varieties and modern
irrigation technology (Tetens et al. 2003). According to the present study, farmers
cultivated a smaller land area in boro than in the amon seasons however, boro was more
important with respect to its higher production cost, expected yields and use of its
income in the following amon season (Gill, 1991). During boro rice harvest, household
members spend time exclusively to prevent the possible loss of production from the
ricefield due to seasonal storms (kal boishakhi) and heavy rainfall. In this time farmers
are very busy drying rice (mainly by women) and straw (mainly by men) as rainfall
causes damage to these products. Sun drying of straw is very important as it contributes
about 70-90% of cattle feed in rural areas of Bangladesh (Al-Manun et al. 2002). Time
spent transplanting and harvesting by better-off farmers tended to be higher compared to
other farmers during the months of amon. This was due to the cultivation of a larger area
of rainfed amon compared to irrigated boro.
In the present study, the household head spent the majority of his time carrying out
productive activities such as agriculture, pond and fish seed production. The head of the
household is defined as the person making the major economic, social and household
decisions (Paul, 1998). Apart from the household head, productive activities were also
performed by other household members where sons played a dominant role. The higher
proportion of labour directed towards productive activities done by household heads and
sons suggests these activities or direct income generating activities are still male
dominated in rural areas. According to Cain (1991), men monopolise the most
remunerative forms of employment although they have to depend on other family
members for carrying out various supportive re-productive activities.
Women, particularly the household head’s wife were found to dominate the performance
of reproductive activities within their homestead where preparation of food and serving

Chapter 4
204
of other family members was the main labour intensive activity. According to Cain
(1991) housekeeping activities are not directly productive and these include activities
such as cooking food and serving, cleaning and sweeping the house and compound,
washing clothes and shopping, and caring for young children. In contrast, most
productive activities generating income directly takes place away from the homestead, a
major consequence of this specialization is that in typical households men are primary
income producers (Cain, 1991). In rural areas, women do not go away from the
homestead (e.g. market) because of the strictures of purdah (seclusion) (Cain et al.
1979). Women however, can carry out productive activities that typically take place in
and around homesteads (e.g. homestead gardening). Women in the present study were
found to participate in RBFSP activities due to the close proximity of fish seed
producing plot to their homesteads (Chapter 3).
Apart from household heads and wives, sons and daughters were also found to
participate in different household level activities. In the preceding chapter (Chapter 3), a
pyramidal population distribution showed the availability of both male and female
children under the age of 20 in farming households. Cain (1977) reported that rural
children of both sexes begin their economically useful lives at around 6 years of age,
performing such activities as caring for livestock, gathering fuel, fetching water,
carrying messages and caring for younger children. In general, a household with a
greater number of economically active members will be in a better position to diversify
and exploit multiple sources of income, particularly when, the peak opportunities of
different income coincides (Cain, 1977). Incorporation RBFSP activities in farming
households appeared to be compatible with the participation of children.
Chapter 4
205
Seasonality of agriculture activities
The annual agricultural cycle results in substantial seasonal variation in the economic
activity of both men and women. Seasonal peaks in activity coincide with the harvest
and processing of rice crops (Cain et al. 1979). Time spent carrying out agriculture
activities was higher in the boro season (May) because of its higher level of harvesting
and processing activities. However, seasonally RBFSP did not make any significant
difference in terms of time required and its integration with other agricultural activities,
suggesting this technology did not compete with other productive activities (e.g. boro).
In terms of monetary input, this technology required little investment and as such it can
be termed a low-external input technology (LEIT). A review study done by Tripp (2006)
(Tripp, 2006b) revealed that LEIT is often labour and information-intensive. Tripp
argues that such characteristics do not necessarily represent the exceptionally diverse
nature of LEIT. The external input requirements of LEIT vary according to technology,
farming system and farmer experience. For instance in the Philippines, hillside ‘soil
conservation’ by placing crop residues required a great deal of labour, on the other hand
‘compost preparation’ for soil fertilization in Tanzania required very little labour (Tripp,
2006b).
In the case of pond fish culture, RF farmers spent more time carrying out pond
management activities than NRF farmers in every month of observation. This may have
resulted from knowledge provided by CARE-FFS training that led them to intensifying
management of their pond, increasing time spent in the RF farming households.
According to CARE (2001), the technical knowledge of RF culture has also been
applied to their pond fish production. This finding indicates that RF households
improved the utilization of their resources including household labour, pond, riceplots
etc. in a broader spectrum.

Chapter 4
206
Household level labour division is very distinct in the rural society of Bangladesh for
socio-cultural reasons. Women are vulnerable in this setting because cultural
prescriptions block their access to most of the remunerative forms of employment (Cain,
1991). Women were found to carry out different homestead level reproductive activities
over the year including cooking two meals per day, cleaning the house, fetching drinking
water, washing cloths, looking after children, taking care of the elderly, collecting
biomass for fuel and shaping and drying cowdung cakes, rearing poultry and livestock
etc. (Banu and Bode, 2002). Tasks associated with food preparation, including provision
of fuel and water, are the most time-consuming types of household maintenance and do
not vary seasonally (Cain, 1991). But at crop harvesting time, when rice and other food
crops enter the household in raw forms, women spend more time for processing (Cain,
1991). Rice requires (e.g. boro) repeated winnowing and drying and during the rainy
season paddy must be brought out and dried at every opportunity (Cain, 1991).
In the present study, along with daily activities, women contributed some time to fish
seed production activities. The contribution of women to fish seed production was
possible due to the location of RF plot in the vicinity of the farming households.
Possibly due to this factor, male farmers (Chapter 3) often consider the ‘proximity of the
ricefish plot to the household’ as one of the important factors in adoption of RBFSP.
Women also reported (Chapter 6) suitability of the riceplot as a facilitating factor for
adoption of RBFSP where perception of suitability included proximity of riceplots to the
household.
In terms of non-farm productive activities, poorer and better-off farmers tended to spend
more time carrying out these activities than intermediate households. The better-off
farmers had higher levels of education and better access to non-farm jobs. In contrast,
poorer households had fewer farm resources and therefore tended to spend more time in

Chapter 4
207
non-farm activities. This suggests that RBFSP might be particularly appropriate for
intermediate households who demonstrated relatively higher productivity (kg
fingerlings/ha) of fingerling than better-off and poor households respectively (Chapter
3). Similarly Barman (2000) observed that medium well-being households in the same
part of Bangladesh tended to be more successful in hapa based tilapia seed production
than either poorer or better-off households and related this to their greater labour
availability on farm.
RBFSP increased on-farm diversification and had impacts over prolonged periods of the
year. Poorer farmers were found to sell a greater proportion of the seed they produced
compared to better-off farmers with a corresponding longer period of cash flow. The
nature of generating cash flow in farm household indicates the strength of RBFSP in the
context of the Northwest as one of the poverty prone areas of Bangladesh (Sen, 2003).
On-farm fish seed production in ricefields impacts social relationships of households
through gifting seed and foodfish to relatives and neighbours. Gifting fish seed to
neighbours and relatives was not restricted to any particular time of the year but
occurred several times. The timing of gifting seemed to be associated with visits from
relatives during summer fruit growing months (e.g. mango and jackfruit) and on-farm
labour requirements from neighbours. The custom of gifting from small to big items
(e.g. chicken, sheep) among extended families and households in African countries
(e.g. Burkina Faso, West Africa) is noteworthy and contributes to social security systems
allowing integration and mutual moral and material support during times of hardship
(Prudencio, 1983). Gifting of fish seed and foodfish to relatives and neighbours is likely
to contribute to “social smoothing” (Bogard, 2000) in rural communities.

Chapter 4
208
Social/ceremonial costs appeared to peak in the months following rice harvest. This is a
time of increased income when marriage ceremonies generally occur in rural
communities where farmers are often invited. According to social custom, invitee
farmers normally have to purchase gift items to attend the ceremonies and income
derived from fingerling sales could possibly contribute towards these expenses.
4.4.2 Income and expenditure
All rural households confront seasonality as an inherent feature of their livelihoods
(Chambers, 1982). The production cycles of crop enterprises are determined by many
climatic factors including the timing of onset and duration of the rains, the length of the
growing season, temperature variation across the calendar year and so on. Seasonal
production variation tends to result in uneven agricultural income in farm households.
On-farm diversification can contribute to income smoothing, by utilizing labour and
generating alternative sources of income in off-peak periods in the traditional farm cycle
(Ellis, 2000).
The major source of income in in the research area farming households irrespective of
well-being was the sale of rice which peaks twice during the year after amon and boro
harvests. This is particularly important in the Northwest region as a major rice producing
region where it is the principal source of income compared to the South-central region
where people were reported to depend more on non-agricultural activities (Islam, 2007).
In most households, both rich and poor face continual cash flow problems during the
year as inputs and expenditure on irrigation, fertilizers, labour etc. occurs at times when
cash reserves are already low as a number of months have passed since the previous crop
(amon) harvest (Cain, 1977).

Chapter 4
209
In the present study, income generated from RBFSP was significantly affected by month
and well-being. Households of all socio-economic groups earned additional income
immediately after the boro harvest when demand for fingerlings peaked among pond
fish producers (Barman and Little, 2006) which in turn reduced the necessity for distress
sales of rice by seed producing households. Poorer households generated a relatively
important amount of income from fish seed in the months of May, September and
October relative to their other income sources. These months are recognised as low
income months for households in the Northwest as well as other areas of Bangladesh.
Poorer sections in Northwest often face the impact of monga - a seasonal famine-like
situation occurring before the harvest of amon almost every year. Traditional agriculture
requires counter-seasonal strategies where reliance on crop diversity as means of
extending harvesting seasons and spreading out income is very important for sustainable
agriculture (Gill, 1991).
Poorer households tend to spend a higher proportion of income on food purchase (e.g.
meat & egg, rice and vegetable), which explains their reasons for adopting RBFSP as
measure to improve food security. Monthly variation of expenditure in farm households
suggests that farmers had to face expenditure smoothing problems. Irrespective of well-
being, low expenditure was observed in the months of September, October, November
and April following the trend of income. Most people in rural Bangladesh survive on
day to day basis (Paul, 1998), hence the lack of savings to see them through lean
periods. There was a strong correlation between income and expenditure found in farm
households. Since the major source of income is from the sale of on-farm produced rice,
any diversified source of income at other periods of the year has a positive impact.
In developed countries, farmers or agricultural systems with sufficient access to inputs,
knowledge and skills can produce large amounts of food. Most farmers in developing

Chapter 4
210
countries however are not in such a position, and poorer farmers generally lack financial
assets to purchase inputs (Pretty et al. 2003). In the present study, apart from providing
food directly and some cash-flow, RBFSP did not make large demands for cash at
anytime. Expenditure for fingerling production in ricefields was lower than any other
expenditure and close to that of kerosene/electricity. Such low expenditure indicates a
‘poor friendly’ activity - an important characteristic of a LEIT (Tripp, 2006b). In a
broader review, many LEITs including soil and water management, soil fertility
management, crop establishment and controlling weeds and pests were criticised as
labour-intensive technologies (Tripp, 2006a). However it was argued if LEIT does not
require capital investment and its production is high, the margin can outweigh the
additional cost of labour (Milner and Bueningen, 1993). For instance, planting velvet
bean along with maize in Honduras, which does not require external inputs and by using
household labour means that production and economic margin is much higher (Milner
and Bueningen, 1993).
In summary, fish seed production was a low cost enterprise that contributed a small
amount of income at critical times during the year. The proportion was relatively higher
in poorer households compared to intermediate and better-off households. Because costs
of production and additional labour requirement were low, households were not
negatively affected at the critical time of the year. Considering the low investment,
RBFSP contributed proportionately higher income flows than other activities.
4.4.3 Consumption of food and health
The contribution of fish produced in ricefields was modest in terms of overall
consumption of households at all socio-economic levels. Poor farmers consumed
relatively less fish, but fingerling production in riceplots made an important contribution
to fish consumption during certain periods of the year. Weekly average per capita fish

Chapter 4
211
consumption in RF farming households was found to be 407.5 g, of which seed
producing riceplots contributed 62.62 g. Excluding the riceplot contribution, fish
consumption become 344.8 g (= 407.5-62.6), which is close to national rural average
(310.4 g) reported by BBS (2003). This consumption figure is about half that in Laos
(724.9 g/capita/week) to which abundant stocks of wild fish contribute 60% of the total
fish consumed (Bush, 2004). In contrast, wild fish stocks have decreased in Bangladesh
and now contribute relatively less to the household diet for several reasons (DoF, 2005).
Natural stocks are particularly low in the Northwest compared to South-central region of
Bangladesh (Islam, 2007). In this context, the adoption of RF based fish seed production
at the household level could increase consumption levels by 20% over the present
national level.
The contribution of the riceplot and pond to fish consumption appears to be most
important in the months of December to May for the poorer farmers. This is the period
when total fish consumption of wild fish is particularly low as stocks are less available at
this time of the year. Such coping behaviour of farming households, with seasonal
hungry gaps, was reported in a number of recent studies carried out in Asia. In
Bangladesh, during periods of low wild fish availability farmers consumed more fish
from ponds in the Mymensingh region (Karim, 2006; Little et al. 2007) and from farmer
managed aquatic systems (ponds and ricefields) in the Northwest (Islam, 2007). Even in
Laos, culture ponds were reported to supplement fish at times of the year when wild fish
were low in abundance (Bush, 2004). While NRF farmers purchased more fish from the
market RF farmers gained more benefits nutritionally and economically from their seed
production activities. This was through supplementation of fish from riceplots and
reducing the dependency on purchased fish. Rural diets of low income, fish dependent
people are particularly sensitive to reduction in fish supplies from local production

Chapter 4
212
sources which may have serious nutritional consequences (Kent, 1997). On-farm fish
production was found to alleviate this problem in the current study.
In the food bundle, rice made up nearly two-thirds of the share of the total food
consumption (g/capita/week). Recent studies showed similar levels of contribution of
rice to the rural diet in Northwest Bangladesh however, which was significantly higher
than South-central region of Bangladesh (Islam, 2007). In contrast, people in the South-
central region consumed relatively more other foods such as meat, egg, pulse etc. This
was due to their higher income from various non-farm sources such as service, business,
driving etc which made them better capable to purchase such food items than the people
in the Northwest region (Islam, 2007). According to BBS (2003) the contribution of rice
to the total calorie intake in rural diets was 73.3% in 2000. Seasonally rice consumption
peaked in summer during the boro harvest. This is the most obvious example of seasonal
variation contributing to nutrient requirements as a high amount of energy is needed
during this season of hard physical labour for household member (Abdullah, 1989; Gill,
1991).
Average vegetable consumption (g/capita/week) was found to be at a similar level to
recent studies in Northwest Bangladesh (Islam, 2007), however this is higher than the
national rural average (BBS, 2003). This is possibly due to the higher consumption of
potato in the Northwest, which has also increased in other parts of Bangladesh (Hossain
et al. 2005). Interestingly, there has been a change in the diet of the people of the
Northwest where, women cook potato in the form of a soup which is used as an
alternative to pulses. Possibly due to this, vegetable consumption in poor and medium
households was higher than in better-off households. Seasonally, poor households
consumed more vegetables during the main vegetable production period of November to
December and March to May (Elias and Hussain, 2000), probably related to their own

Chapter 4
213
production peaking at that time and purchase from markets as prices were cheaper at
this time. Seasonally, vegetable consumption in the RF farming households was higher
than NRF households possibly because the production of RF farmers was higher in their
backyard fields (Chapter 3). Knowledge regarding improved vegetable production
systems may be more widespread in communities targeted by CARE FFS that promoted
vegetable production as well as ricefish (CARE, 2001a).
Vegetable consumption irrespective of well-being declined from July to October
indicating a critical hungry gap (Abdullah, 1989). The lower level of vegetable
consumption can be linked to lower levels of on-farm vegetable production at this time
of high rainfall and dependence on market sources (Karim, 2006). In this critical period,
on-farm fish production including fish fingerlings produced in ricefields, contributed
substantially to households coping strategies.
Average meat and egg consumption (g/capita/week) in the RF farming households was
found to be similar to the national rural average (107.8g/capita/week) in 2000 (BBS,
2003). This finding suggests that the consumption of foods from animal origins are at a
relatively stagnant level, possibly due to the limited scope for expansion of livestock
rearing at the household level. Meat & egg consumption was affected by month and
well-being and positively correlated with income suggesting that the majority of these
food items were purchased. In the month of October, poorer households consumed
significantly (P>0.05) less meat and eggs, however at this time they consumed more fish
from the riceplot, suggesting that fish seed production in the riceplot supplemented
protein during the hungry period. According to the concept of marginal product utility
(Gill, 1991), there is a seasonal variation in the marginal utility of consumption and the
marginal utility of food is highest during a hungry month. Greater consumption of fish
during periods of low meat and egg consumption increased the marginal utility of fish

Chapter 4
214
produced from riceplots. The timing of food production can be even more important to a
family than its total volume, when households face periods of low food availability (Gill,
1991). Households, irrespective of socio-economic group consumed more meat and eggs
during February because of the religious festival of Id-Ul-Azha relating to the sacrifice
of mammals (cow and goat generally). At this time households also consumed more fish
from their own ponds possibly due to a need for a variety of high quality foods during
this festival.
Average pulse consumption was found to be lower than the national rural average
estimated in the year 2000 (BBS, 2003) possibly because pulses need to be purchased
and potato is used as an alternative. Pulses are not generally produced in the study area
(Shahjahan, 2004). In the study area RF farmers consumed fewer pulses than NRF
farmers possibly due to their relatively higher consumption of fish and vegetables.
Seasonally farmers consumed more pulses in the months following the main pulse
harvesting period when prices declined. However, consumption of pulses in the months
of the hungry gap in RF households suggests the use of money from sale of fingerlings
to purchase pulses.
Per capita rice consumption in poor and medium households was found to be higher than
in better-off households. In rural areas, the consumption of rice, the dominant staple
food for Bangladeshis, reached higher levels than the minimum requirement, but diets
were unbalanced with respect to sources of animal protein (Hossain et al. 2005).
Consumption of rice varied less throughout the year than consumption of nutrient-dense
diets suggesting nutritional imbalances in the diet, especially in important micro-
nutrients which are seasonal in poor societies (Kent, 1997).

Chapter 4
215
Consumption of nutrient-dense items such as fish, meat and egg consumption was higher
in better-off households compared to medium and poor households. This reversed
scenario suggests that poorer farmers had less access to nutrient dense food hence they
consumed more rice. On the other hand better-off households had more access to protein
dense food which possibly influenced them to consume less rice. According to Hossain
(2005), while the richer sections of the society are able to gradually reduce their rice
intake and diversify their diet, the poorer are still spending their incremental income on
rice. From a nutritional point of view, this implies that the intake of an unbalanced diet
has worsened over the years for the poorer sections of the population. Nutrient dense
food items other than rice need to be purchased which is more affordable for better-off
farmers. The primary factor affecting the per capita consumption of such nutrient dense
food among poor developing country populations is income (Nugent, 2002).
The major source of income for farming households is from the sale of rice.
Furthermore, households also strictly depend on rice as it is the staple food in rural
areas. Thus rice based agriculture is a linchpin of survival for developing country poor
populations, both economically and nutritionally (Nugent, 2002). This dependence on
rice is likely to make farmers vulnerable both in turn nutritionally and economically. In
this context, RBFSP is likely to contribute the farming households both nutritionally and
economically.
Health is an important indicator of development (BBS, 2003b). The present study shows
that irrespective of socio-economic groups, household members suffer from similar
levels of sickness. However, better-off households tended to spend more than other
groups on treatment possibly because they can afford to. Access to healthcare is a basic
right and it is an obligatory responsibility of the government to ensure healthcare
facilities for all the citizens of Bangladesh. However, statistics from 2001 show that the

Chapter 4
216
ratio of persons per government physician/doctor was only 4,043:1 (BBS, 2003a).
Government health centres are typically located at the upazila level where private health
services are also developing. In terms of receiving treatment in rural areas, as many as
70.32% patients did not take any treatment until their health problems become serious
(BBS, 2003b) perhaps due to their lack of knowledge about health and long distance
travel to government hospital. Other important causes for delaying treatment include its
high cost or negligence on the part of the household head to take the initiative and seek
treatment (BBS, 2003b). Poorer and intermediate households tended to suffer more from
respiratory diseases in the winter season possibly due to a lack of warm clothing. They
also suffered from enteric diseases possibly due to their inadequate hygienic knowledge
and poor financial capability to get access to treatment.
Income from fingerlings sale appeared to be used for health treatments of household
members during June, July and August. Moreover, at that time the ricefield produced
large sized fingerlings which might have been consumed as nourishing food by the
patients. In rural society fish are considered to be important nourishing foods especially
for those convalescing (Gupta, 1908).
4.5 Conclusion
The study in this chapter contributed the findings to the hypothesis stated in the section
4.1. Overall, seasonality had a significant affect on all aspects of livelihoods in farming
households including the use of household labour, income, expenses, food consumption
etc. Activities of RBFSP were not gender specific rather were carried out through the
participation of men, women and children in farming households. Close proximity of
ricefish plots to the households facilitated women contribution to RBFSP activities in a
traditionally restricted society in which women are not allowed go far for productive
activities. Seasonally RBFSP activities were compatible with other agricultural activities

Chapter 4
217
as the activities were within the ricefields in which farmers spent the majority of their
working time.
The serious problem for the poor households related to seasonality is the marked
fluctuation of food consumption particularly non-cereal protein based food such as meat
and eggs indicating vulnerability or food insecurity i.e. ‘consumption smoothing
problem’. To cope with the seasonal problem of food insecurity, on-farm production
technology has been recognised as sustainable strategy for the poor. Production
strategies with respect to complementarity between enterprises have been suggested for
coping with seasonality (Gill, 1991). Production of fingerlings in ricefields contributed
nutrient-dense food in the hungry gap periods of the year. Stocking of fingerlings in
ponds increased on-farm fish production which in turn contributed to consumption of
fish during hungry gaps.
Fingerling production in ricefields made it possible for households to sell both fish
fingerlings and foodfish which provided them long term cash flow. There were marked
seasonal fluctuations of income which is recognized as ‘income smoothing problem’
(Ellis, 2000). The contribution of income from selling fish seed/foodfish during the low
income months appeared as a counter seasonal strategy to reduce the ‘income smoothing
problem’. Seasonal income from fingerling sale facilitated households to purchase other
food items, which in turn contributed to the reduction of their ‘consumption smoothing
problem’. Furthermore, the sale of fingerlings contributed to the health treatment of
household members by providing monetary support and nourishing food. Overall this
study confirms the importance of RBFSP in terms of several positive seasonal livelihood
impacts towards reducing vulnerability in farming households.
Chapter 5
218
Chapter 5: Broader scale impacts of RBFSP: an actor oriented investigation
5.1 Background
The preceding cross-sectional (Chapter 3) and longitudinal studies (Chapter 4)
demonstrated livelihood impacts of RBFSP on farming households. These studies
ignored the impacts of the approach on other beneficiaries. Therefore, based on an actor
oriented investigation, the present chapter attempts to assess the livelihood impacts of
RBFSP on other related actors.
The concept of actor networks derived from Actor Network Theory (ANT) is the tenet
of heterogeneous networks containing dissimilar elements (Law, 1992). ANT claims that
social order is an effect caused by the smooth running of an actor network. This order
starts to break down when certain actors are removed from the network (Law, 1992).
From 1990s onwards actor networks became an increasingly popular tool for analysis in
a range of science and technology studies such as health studies, organizational analysis,
informatics, anthropology, sociology etc. Alongside these, actor oriented approach had
also been used in the field of natural resource based research and development in
developing countries (Biggs and Matsaert, 2004). A network is a simple concept of
social science consisting of two things: i) nodes or actors and ii) links between the
nodes. The actors in the networks are people, groups and organizations (Davies, 2003).
The defining feature of actor network analysis is the focus on the structure of
relationships between the actors. This approach is in contrast with other areas of the
social science where, the focus has been on attributes of actors, the characteristics of
people, groups and organizations, rather than the relationships between them (Scott,
2002). Actor linkages may be developed through social contacts, exchange of
information, political influence, money, joint membership in organizations, joint
Chapter 5
219
participation in specific events or many other aspects of human relationships (Davies,
2003).
Among different social events, innovation systems are made up of a range of actors
involved in a generation and use of new knowledge, technologies, management
practices, marketing processes and institutional relationships (Matsaert et al. 2004).
Through innovation systems all major social actors affect the revealing,
acknowledgement, generation, and diffusion of technical and institutional knowledge
over time (Hall et al. 2001a; Hall et al. 2001b; Ekboir, 2002; Clark et al. 2003).
Technological intervention develops different impacts points and networks among the
different actors (Shah et al. 1991). Within actor networks, the ties and relationships of
‘social capital’ are embedded by which actors obtain their access to resources and
benefits (Nahapiet and Ghoshal, 1998; Burt, 2001). Recently special emphasis has been
given for research to take into account how linkages are developed in order to provide
benefits to the actors involved in networks (Ratten and Suseno, 2006).
In terms of natural resource development, the need to address actor linkages and
coalitions is becoming increasingly important to the development organizations
(Byerlee, 1998; Kidd, 2002). Actor network analysis can improve insight into issues of
adoption and diffusion of innovation which although less quantitative, can be
informative (Engel and Salmon, 1997). Research funders and governments are actively
encouraging new, pluralistic models of research, development and extension which
bring together actors in the private, public and civil society (Byerlee, 1998; Kidd, 2002).
The hypothesis of the study in this Chapter is that ‘RBFSP benefits other actors such as
fry traders, pond fish producers and other beneficiaries within seed producing and
marketing networks’. The present chapter, focusing on broader scale impacts of

Chapter 5
220
decentralised seed, aims to address the network among the actors (e.g. traders, foodfish
producers, neighbour, relatives etc.) involved directly or indirectly in RBFSP activities.
In addition this chapter attempts to describe how the network among actors creates
social capital in decentralised fish seed producing communities in Northwest
Bangladesh.
5.2 Research framework and methodology
5.2.1 Community selection
Using a judgement sampling procedure (NAO, 1992), two communities were selected,
one of them in which RBFSP was well established (Bahagili-BAH) another in which its
introduction was more recent (Guliara - GUL). Bahagili was selected from the Kaunia
upazilla of Rangpur where RBFSP began in 1993 through the intervention of CARE’s
Interfish project. Later in 1999, DFID-NFEP through a research programme introduced
tilapia seed production along with common carp seed production in ricefields in BAH
(Barman, 2000). In consultation with the staff of the ongoing CARE Go-Interfish
project, the recently introduced community-GUL was selected from the Khanshama
upazilla of Dinajpur district where the Go-Interfish project had just completed 18
months of farmer field school training in June 2004. In GUL, decentralised RBFSP was
started with common carp seed production in ricefields. The purpose of these specific
selecting sites, where RBFSP was established or relatively recent, was to explore
differences between network development (relations/coalition etc.) among different
actors/peoples involved directly or indirectly with fish seed production activities.
General background information on the selected communities was collected through key
informant interviews. Key informants were selected amongst the more knowledgeable
persons in the community who then helped to provide general background information

Chapter 5
221
on the community (Mukherjee, 1997). The information given by key informants was
cross checked with other knowledgeable people from the same community.
5.2.2 Actor identification
Identification of actors in an actor network analysis approach provides a good basis to
gaining a fuller understanding of the wider development intervention. Actor
identification can be done by outlining an actor time-line which can be generated
through literature review or key informant interviews or focus group discussions (FGD).
Usually a combination of these methods provides the fullest information (Matsaert et al.
2004). The main and majority of actors related to RBFSP activities were identified
initially during the preceding study (Chapter 3). However for an in-depth understanding,
focus group discussions were arranged in the selected communities involving seed
producing farmers, local farmers and neighbouring community people. In order to
review the historical background related to the development of RBFSP technology, FGD
was undertaken to identify all the actors (people, organizations etc.) within or outside the
community, those were directly or indirectly connected in RBFSP activities (Figure 5.1).
According to Hanneman and Riddle (2005) actor network studies are much more likely
to include all of the actors who occur within same (usually naturally occurring)
boundary. In addition to focus group discussion, a participatory resource mapping
exercises were carried out to understand community resources.

Chapter 5
222
Figure 5.1: FGD for identification of actors/people those are connected directly or indirectly with decentralised RBFSP.
The identified actors from the focus group discussion were as follows:-
Individual actors
� Seed producing farmers: farmers producing fish seed in ricefield based systems in
the community.
� Fry traders: people who do not produce fish seed themselves but buy fish seed
from ricefield based fish seed producers and sell to other foodfish producers.
� Food fish producers: farmers producing foodfish in their ponds who purchase fish
fingerlings from the producers of the selected communities or from traders or
both.
� Consumers (neighbours/relatives): people in or outside the producer community
consuming fish derived from RBFSP.

Chapter 5
223
Group actor
� Foodfish producer group: a group people who produce fish in a large water body
(beel).
� Fishermen cum foodfish traders: a group of people from the same or outside the
community were involved in harvesting fingerlings and foodfish.
� Local market: in the local fish market there were arats (auction fish market)
consisting of a small group of people; in fish market there were also other
individual actors such as retailers and consumers; in the market foodfish were
supplied from seed producers and foodfish producers.
� Non-government organizations (NGO): an NGO was found to purchase tilapia
broodfish from seed producing communities to promote their extension
programmes in other places.
5.2.3 Development of actor linkage matrices
Actor linkage matrix was developed by summarising the findings of quantitative and
qualitative data based on interviews, case studies or monitoring observation of the actors
- as suggested by Matsaert et al. (2004). Scientists encouraged such integrated use of
quantitative and qualitative approaches to gain a fuller understanding (Leeuwis and van
den Ban, 2004). Studies of individual actors were done using quantitative and qualitative
methods to observe the relationships between the actors and causal factors behind the
relationships.
The collected information from different levels of actors (nodes) was analysed and used
to develop an actor matrix. In the matrix the strength of ties among the actors is
presented in a binary way. According to Hanneman and Riddle (2005), the strength of

Chapter 5
224
ties among actors may be nominal or binary (represent presence or absence of tie);
signed (represents a negative, a positive tie, or no tie); ordinal (whether tie is the
strongest, next strongest, etc.); or valued (measured on an interval or ratio level).
A quantitative questionnaire survey was carried out including fish seed producers within
the communities, and fry traders, and foodfish producers within and outside of the
communities. In the case of food fish producers there was scope to sample 30
respondents as the population was bigger in comparison to the other actors. However in
the case of community seed producers and fry traders, statistical sampling could not be
performed due to relatively fewer numbers of respondents. Hanneman and Riddle (2005)
stated that actor network studies often do not sample at all rather they include all the
actors connected to a particular event in a population. Fry traders and foodfish producers
purchased fingerlings from BAH were taken under the survey as their number were
higher and suitable for quantitative analysis than that of GUL (Table 5.1).
Table 5.1: Methods of investigations used at different level of actors
Methods of investigation Actors BAH GUL
Fish seed producer Survey Survey Fry traders Survey Case study Pond fish producers Survey Survey Fish producers in beel Case study Not included as no beel was
found connected with RBFSP Fisher group Case study Case study Aratdar Case study Case study Retailer Case study Observation Consumer in market Case study Observation Consumer in community Case study Case study NGO Case study Not included as no NGO
found connected with RBFSP
In some instances, the number of actors was very low, so the case study approach was
applied. A case study can be undertaken either for an individual or household or group
or community in relation to one or more events or phenomenon or alternatively; it could

Chapter 5
225
be a study of some socio-economic or political change in relation to an individual,
household, group or community (Mukherjee, 1997). At the market level, observation and
discussion were carried out with retailers and consumers.
5.2.4 Development of social capital
As an actor network develops social capital (Lyon, 2000), the major ties between focal
actors (e.g. seed producers) as well as other important actors in the matrix are considered
to explain social capital based on Putnam’s theory of social capital. According to Robert
Putnam (1993), social capital is made up three interacting and mutually re-enforcing
elements: trust, norms of reciprocity and networks of civic engagement (Table 5.4).
Trust is the foundation of moral behaviour on which social capital is built. One of the
most fundamental needs of social capital is the development of a sense of trust; the
belief that one can rely on and believe in others to do what is expected. Reciprocity, in
turn, appears in two forms: balanced, referring to near simultaneous exchange of items
or services of equivalent value; and generalised or continuing relationships of exchange
which are unrequited at a particular point of time, but carry the mutual expectation that a
benefit granted now should be repaid in the future.

Chapter 5
226
Figure 5.2: Putnam’s conceptual framework of network in social capital -adapted from Bode and Howes (2003).
Networks of engagement are characterized by interpersonal communication and
exchange which may be horizontal or vertical. Horizontal networks are web-like
connections bringing together agents of equivalent status or power, and these subdivide
into weak relationships (e.g. neighbourhood association, clubs etc.) and strong
relationships (e.g. kinship). However, in social networks strong interpersonal connection
is less important than weak connection with respect to sustainable community cohesion
and collective action (Putnam, 1993). The likelihoods of weak ties are higher in linking
process of members from different small groups than are strong ones, which tend to be
concentrated within a particular group. Another type of network is vertical, linking
unequal agents in asymmetric relations of hierarchy and dependence (e.g. relation
between the CARE and farmers, or NGO and farmer). In Figure 5.2 the encircled
concepts define the area in which social capital most clearly operates.
TRUST
NORMS OF RECIPROCITY
Balanced Generalised Horizontal** Vertical
NETWORKS OF ENGAGEMENT*
“Week” relationships
“Strong” relationships
The encircled concepts define the area in which social capital most clearly operates
*Network of engagement may also be formal and informal **Horizontal networks may also be bonding or bridging in type

Chapter 5
227
5.3 Results
5.3.1 General characteristics of community
The well established RBFSP community BAH lies about 5 Km north of Kaunia sub-
district and about 15 Km south of Rangpur district headquarter/town. The recently
introduced community GUL lies about 23 Km south of Khanshama sub-district and 13
Km west of Dinajpur district headquarter/town. The general features of the two
communities are presented in Table 5.2. Both of the communities were more or less
similar in terms of common resources. Both covered less than 1 Km2 but the number of
households were substantially different. The proportion of households identified as
being of different well-being levels was similar for both communities for BAH (78) and
GUL (115).

Chapter 5
228
Table 5.2: General characteristics of the selected communities
Characteristics Bahagili (BAH) Guliara (GUL)
Establishment of RBFSP Well established community- Earlier introduction of seed production in the community where number of seed producing households relatively higher who had linkages with large number of fry traders and food fish producers
Recently introduced community- Recent introduction of seed production in the community where number of seed producing households relatively smaller who had linkages with a small number of fry traders and food fish producers
Total number of household 78 (Poor-51%, intermediate-35% and better-off-14%)
115 (Poor-48%, intermediate-35% and better-off-17%)
Total population 400 650 Literacy level 80% 95% No. of service holder 9 30 No. of rural doctor 2 1 Number of businessmen 22 15 No. of van puller 4 6 No. of day labour 71 60 Road communication Kacha road Kacha road No. of household with sanitary latrines
50% 80%
No. of household with safe drinking water access
100% 100%
Primary school 1 government primary school2 and 1 non-government primary school3
1 government and 1 registered non-government primary school4
Soil type Loamy and sandy loam Silty loam and sandy loam Total no. of ponds 42 55 Distance of rural market from the community
0.5 Km 1 Km
Kacha roads link both communities to paka roads facilitating the communication of the
people with upazila and district centres. Households of both communities had safe
drinking water facilities either from their own or a neighbour’s tube-well. BAH had a
government school and a non-government primary school (BRAC school). GUL had
both a government and a registered non-government primary school. Over the last
decade, the Bangladesh Government has accelerated primary level education through the
programme of ‘food for education’ which has increased the literacy level significantly
2 Government primary school are government schools under state revenue 3 Non-government primary schools are run by NGO 4 Registered non-government primary schools that were started privately by communities or philanthropic individuals that are now registered by the government and therefore receive subventions from the state in the form of teacher salaries and free text books
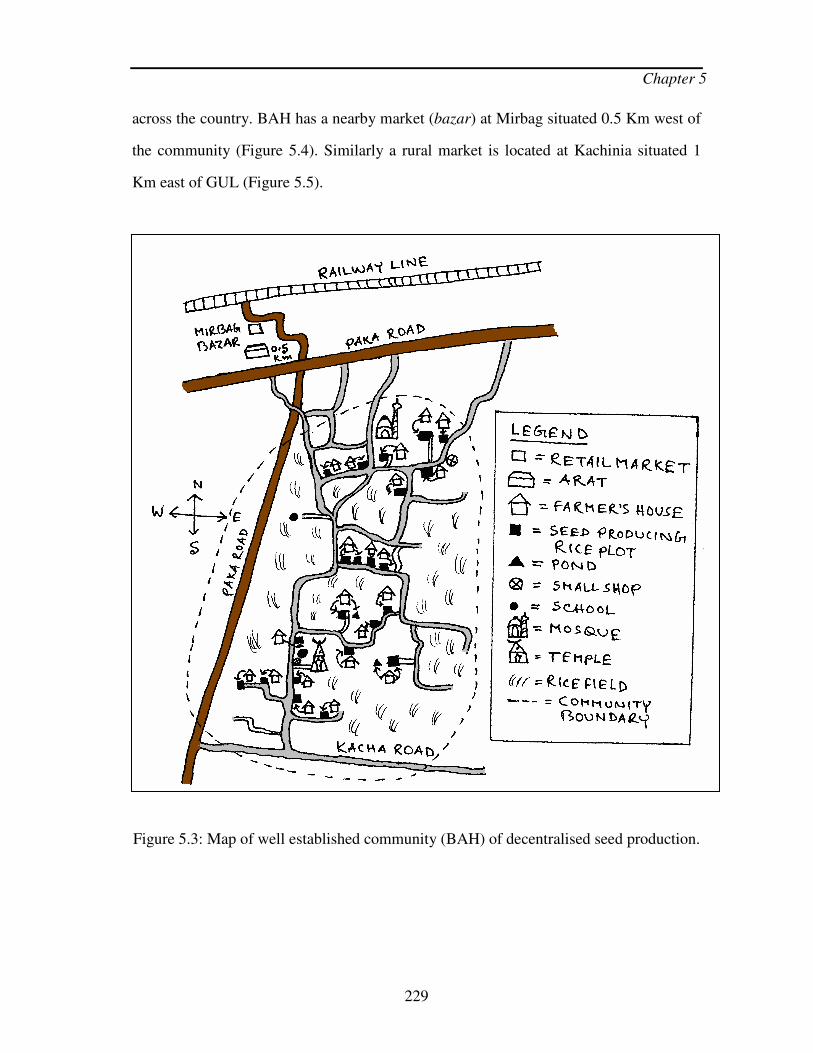
Chapter 5
229
across the country. BAH has a nearby market (bazar) at Mirbag situated 0.5 Km west of
the community (Figure 5.4). Similarly a rural market is located at Kachinia situated 1
Km east of GUL (Figure 5.5).
Figure 5.3: Map of well established community (BAH) of decentralised seed production.

Chapter 5
230
Figure 5.4: Map of recently introduced community (GUL) of decentralised fish seed production.

Chapter 5
231
5.3.2 Seed producers
5.3.2.1 Size of the riceplot
The previous chapters 3 and 4 described seed producer household level impacts of
RBFSP based on surveys in 20 communities. However, differences based on the time-
scale of the introduction of this technology and farmer’s practices in 2 communities,
required further study to explore the impacts on seed producing households.
The numbers of the seed producers in BAH and GUL were 21 and 6 respectively. The
size (0.2±0.2ha/household) of household riceplots of seed producers in BAH were
double the area of plots of households in GUL (0.1±0.1ha/household). The average
riceplot ditch size in BAH (0.02±0.01ha) was also found to be larger than in GUL
(0.01±0.01ha) and seed production was higher within households of the well established
community. Each farmer used 7.7±8.1 and 3.6±3.5 kg fingerlings for their own use in
BAH and GUL respectively. Seed producing farmers in both communities experienced
various benefits from pond fish production using their own seed produced from ricefield
based production systems (Figure 5.5).

Chapter 5
232
0
10
20
30
40
50
60
70
80
90
Higher
survival of
fingerling
Easy to
produce
No need
to go to
hatchery
Getting
bigger
size
fingerling
Getting
fingerling
timely
Growing
faster
Benefits of seed producing farmers
Pe
rcen
t o
f fa
rme
r
BAH GUL
Figure 5.5: Benefits experienced by seed producers using their own fingerling in BAH (N=21) and GUL (N=6).
Among the various benefits associated with the use, by farmers, of fingerlings produced
by themselves, some were of equal strength in both communities including higher
survival rate of fingerlings, ease of production, larger sized fingerlings and faster
growth.
5.3.2.2 Fingerlings sold to fry traders
The total number of fry traders purchasing fingerlings from the well established
community was 5 times higher than in the recently introduced community (Table 5.3).
The total amount of fingerlings sold to fry traders from BAH was several times higher
than GUL.

Chapter 5
233
Table 5.3: Amount of fingerlings produced and sold to fry traders in BAH and GUL
Community Production and sales of fingerlings by fry traders BAH GUL
Number of producers sold fingerlings to fry traders (no/community) 12 6 Total amount of fingerlings sold from each community (kg/community) 1134 82 Each producer sold fingerlings (kg/household) 94.5±82.3 13.7±11.3 Total number of fry traders purchased fingerlings (no/community) 15 3 Each fry trader purchased fingerlings (kg/fry trader/community) 75.6±65.8 27.3±22.6
Almost all of the fry traders were from outside of both of the communities. Each fry
trader purchased 75.6 and 27.3 kg of fingerlings from BAH and GUL respectively.
5.3.2.3 Seed to the foodfish producers
Out of total seed producers, the number of households that gifted and sold fingerlings to
their neighbours and relatives in BAH and GUL were 5 and 4 respectively.
Proportionately, a lower percentage of producers gifted and sold fingerlings in BAH
(23.8%) than in GUL (66.7%). A total 24 of neighbours and relatives had purchased or
received fingerlings as a gift from producing farmers in BAH. The corresponding value
in GUL was 16 neighbours and relatives (Table 5.4).
Table 5.4: Gifting and selling fingerlings to relatives and neighbours from the producing households in BAH and GUL
Characteristics BAH GUL Total number of seed producers gifting and selling seed 5 4 Percent of seed producers gifting and selling out of total producers 23.8% 66.7% Number of neighbours receiving gift 6 Amount of gift (kg/neighbour) 0.8 Number of neighbours purchasing 13 10 Amount purchasing (kg/neighbour) 0.9 0.8 Number of relatives receiving gift 4 4 Amount of gift (kg/relative) 1 0.7 Number of relatives purchasing 1 2 Amount purchasing (kg/relative) 1 1 Total number of neighbours/relatives receiving seed through gift and purchase
24 16
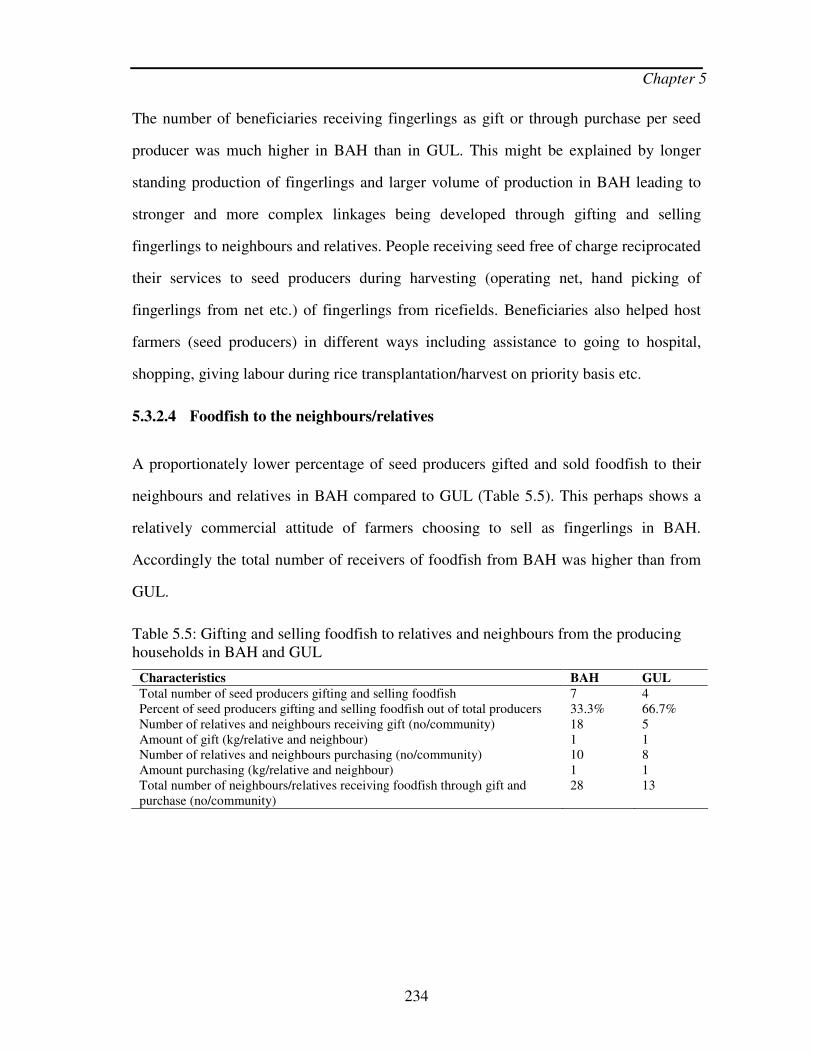
Chapter 5
234
The number of beneficiaries receiving fingerlings as gift or through purchase per seed
producer was much higher in BAH than in GUL. This might be explained by longer
standing production of fingerlings and larger volume of production in BAH leading to
stronger and more complex linkages being developed through gifting and selling
fingerlings to neighbours and relatives. People receiving seed free of charge reciprocated
their services to seed producers during harvesting (operating net, hand picking of
fingerlings from net etc.) of fingerlings from ricefields. Beneficiaries also helped host
farmers (seed producers) in different ways including assistance to going to hospital,
shopping, giving labour during rice transplantation/harvest on priority basis etc.
5.3.2.4 Foodfish to the neighbours/relatives
A proportionately lower percentage of seed producers gifted and sold foodfish to their
neighbours and relatives in BAH compared to GUL (Table 5.5). This perhaps shows a
relatively commercial attitude of farmers choosing to sell as fingerlings in BAH.
Accordingly the total number of receivers of foodfish from BAH was higher than from
GUL.
Table 5.5: Gifting and selling foodfish to relatives and neighbours from the producing households in BAH and GUL
Characteristics BAH GUL Total number of seed producers gifting and selling foodfish 7 4 Percent of seed producers gifting and selling foodfish out of total producers 33.3% 66.7% Number of relatives and neighbours receiving gift (no/community) 18 5 Amount of gift (kg/relative and neighbour) 1 1 Number of relatives and neighbours purchasing (no/community) 10 8 Amount purchasing (kg/relative and neighbour) 1 1 Total number of neighbours/relatives receiving foodfish through gift and purchase (no/community)
28 13
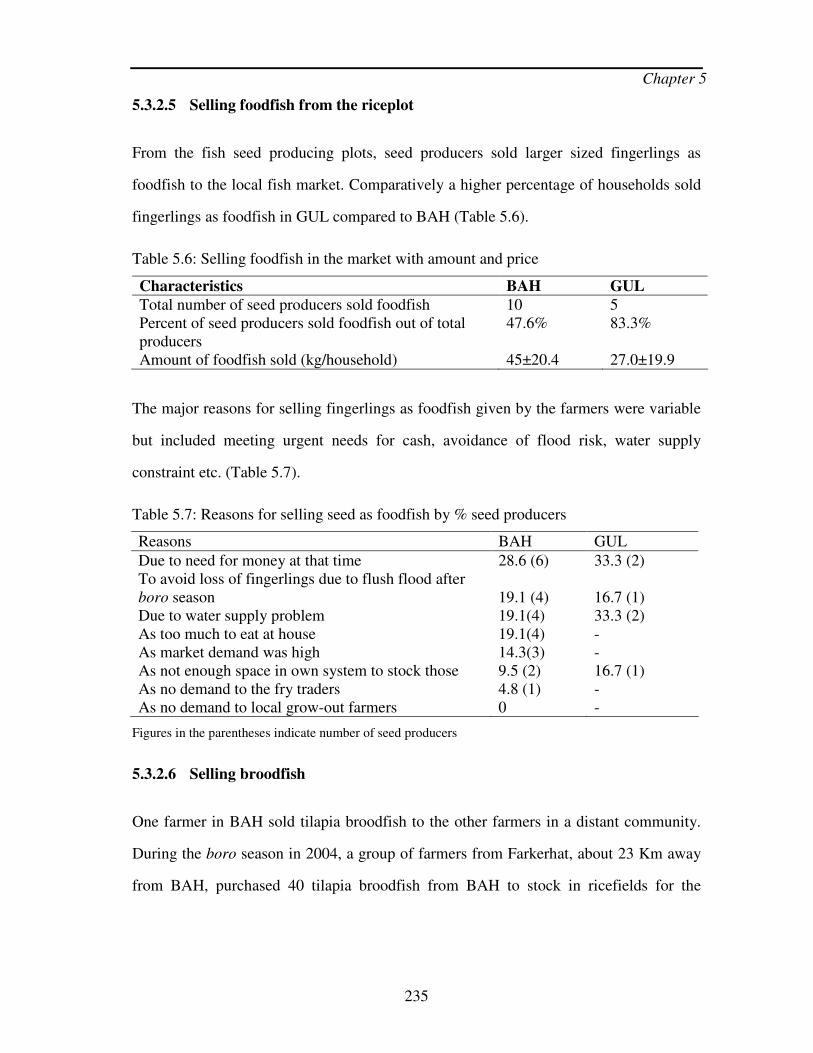
Chapter 5
235
5.3.2.5 Selling foodfish from the riceplot
From the fish seed producing plots, seed producers sold larger sized fingerlings as
foodfish to the local fish market. Comparatively a higher percentage of households sold
fingerlings as foodfish in GUL compared to BAH (Table 5.6).
Table 5.6: Selling foodfish in the market with amount and price
Characteristics BAH GUL Total number of seed producers sold foodfish 10 5 Percent of seed producers sold foodfish out of total producers
47.6% 83.3%
Amount of foodfish sold (kg/household) 45±20.4 27.0±19.9
The major reasons for selling fingerlings as foodfish given by the farmers were variable
but included meeting urgent needs for cash, avoidance of flood risk, water supply
constraint etc. (Table 5.7).
Table 5.7: Reasons for selling seed as foodfish by % seed producers
Reasons BAH GUL
Due to need for money at that time 28.6 (6) 33.3 (2) To avoid loss of fingerlings due to flush flood after boro season 19.1 (4) 16.7 (1) Due to water supply problem 19.1(4) 33.3 (2) As too much to eat at house 19.1(4) - As market demand was high 14.3(3) - As not enough space in own system to stock those 9.5 (2) 16.7 (1) As no demand to the fry traders 4.8 (1) - As no demand to local grow-out farmers 0 -
Figures in the parentheses indicate number of seed producers
5.3.2.6 Selling broodfish
One farmer in BAH sold tilapia broodfish to the other farmers in a distant community.
During the boro season in 2004, a group of farmers from Farkerhat, about 23 Km away
from BAH, purchased 40 tilapia broodfish from BAH to stock in ricefields for the

Chapter 5
236
production of fingerlings. They transported the tilapia broodfish by rickshaw and local
bus keeping them in a silver pot (patil).
5.3.2.6.1 Access to common carp eggs/tilapia broodfish between producing households
Case study: seed producer with his own source of seed (BAH)
Bhagirat Chandra Roy is a 45 year-old man of medium well-being living in BAH. He
has 0.75 ha of own land and 7 family members in his extended family. He is connected
to the large national political party Bangladesh Awami League, being a leader of the
local committee in his ward (a local government administrative section of a Union). He
achieved this leadership by means of respect and support from his community as he
provides intellectual services (e.g. shalish – informal court of the community people) to
his community people. In 1995, as a CARE member he received training on RBFSP
using common carp eggs collected from his own pond. In 1999 he received GIFT tilapia
from a neighbouring farmer and used them for seed production along with common carp
in his riceplot. His ricefish plot was 1.01 ha located adjacent to his house. Of the total
riceplot area, 50% belonged to his brother with whom it was sharecropped. His
household adjacent pond was 0.01 ha in size and held a depth of 2.5 m water year round.
His kin and neighbours use his pond water for bathing, household washing and drinking
water for their cattle. During CARE-FFS training, a number of farmers started fingerling
production in their ricefield based systems by collecting common carp eggs from
Bhagirat’s pond. From the initial year of adoption, 4-5 adopters used common carp eggs
from Bhagirat’s pond to produce fingerling in their ricefields. Bhagirat also stocked
GIFT tilapia broodfish in his pond. Some poor farmers in his community took tilapia
broodfish from his pond free of charge. Mr Bhagirat allows people to collect common
carp eggs from his pond every year. He feels that if he would have not allowed the
people to collect eggs from his pond the eggs would die naturally anyway. He felt that as

Chapter 5
237
the collection of common carp eggs takes place over a short period of time (just one
month), it does not hamper his pond in anyway. He believes that allowing his
neighbours to collect eggs from his pond has reinforced his pre-existing reputation in the
community. He feels that it is a right of the people irrespective of their well-being status
to get some help from their neighbours. He believes that supporting the community
socially or materially is his social responsibility. He does not ask anything in return
directly from the people receiving common carp eggs and tilapia broodfish from him
however, he gains benefit through esteem and support which are essential to sustain his
leadership in the community. Additionally, he receives benefit from maintaining his
neighbour interests in his riceplot probably reducing the risk of theft of fish.
Case study: seed producer without his own source of seed (BAH)
Mr. Uzzal Kumar, a poor 30 year-old farmer lives in the same community as Mr.
Bhagirat. He has 4 household members, no educational background and depends totally
on agriculture. He was a CARE member and started common carp seed production in his
riceplot (0.04 ha) with Mr. Bhagirat. He has no pond hence he has to collect common
carp eggs and tilapia broodfish from Bhagirat’s pond every year. He did not give
anything to Bhagirat in return. He feels that as a community member he can ask for
something from his neighbour as it is very common custom in rural Bangladesh.
Case study: seed producer with his own source of seed (GUL)
As with the well established community, in the recently introduced community GUL,
Mr. Abinash Chndra Roy, a 55 year-old better-off farmer has a perennial pond of 0.11
ha. He is a leader of a Hindu religious organization named Sat Shanga (best companion).
Under the umbrella of Sat Shanga, community people gather at his homestead every
month to listen to religious discussion. He was also a community organizer of the farmer
field school in GUL. Common carp eggs were produced in his pond but he had no tilapia

Chapter 5
238
broodfish. From his pond, other neighbouring seed producers without their own pond
collected fertilised eggs to stock in their riceplots to produce fingerlings. Mr. Abinash
feels that allowing other farmers to collect common carp eggs reinforces of integrity of
his Sat Shanga. In addition he also gets respect and some informal support from egg
receivers such as assistance to go to hospital, in shopping from the market and getting
labour during rice transplantation/harvest on a priority basis.
RBFSP depends on the availability of common carp eggs and tilapia broodfish in
perennial household ponds or in the other ponds of the community. In BAH both
common carp and tilapia broodfish were available whereas GUL had only common carp
broodfish. Seed producers who had their own source of both common carp eggs and
tilapia broodfish in BAH and only common carp in GUL tended to allow access to those
producers who had none. This can be termed as a social network developed among the
seed producers, which in turn develops social capital.

Chapter 5
239
5.3.3 Fry traders
5.3.3.1 Involvement of fry traders in trading of ricefield produced seed
In terms of trading decentralised seed, 15 fry traders were surveyed to understand the
impacts of RBFSP on fry traders connected to the well established community BAH
(Figure 5.6).
0
2
4
6
8
10
12
14
16
1980 1990 1991 1992 1993 1994 1996 1997 2002
Year of involvement
Cu
mu
lativ
e n
um
ber
of
fry
tra
de
rs
Figure 5.6: Cumulative number of fry traders involved in fish seed trading.
The number of fry traders involved in fish seed trading shows an increasing trend but
shows a marked increase from 1993 onwards with a rising trend until 2002. This period
coincided with the development of decentralised seed production in the ricefield systems
in the Northwest Bangladesh. Additionally, this trend could possibly have been
stimulated by the development of NFEP’s hatchery based fish seed production system in
Northwest Bangladesh suggesting the compatibility of decentralised seed with
centralised seed.

Chapter 5
240
Follow ing
neighbour, 9
Follow ing
father, 1
Follow ing
uncle, 4
Follow ing
relatives, 1
Figure 5.7: Entry points through which fry traders come to this profession.
In addition, out of 15 fry traders, 9 (60%) of them came to the trading systems following
their neighbours (Figure 5.7). The remaining 40% became fry traders as a result of this
type of profession existing within their kinships (bongsho)/relatives.
5.3.3.2 Fry trader’s occupation
As well as fry trading, the majority of the fry traders tended to be involved with non-
farm activities such as petty business (trading of vegetable seedling, vegetables etc.),
fish trading and day labour (Figure 5.8). Their involvement in agriculture however, was
very low as they were mostly landless. Almost all fry traders were illiterate and Muslim.

Chapter 5
241
0 2 4 6 8 10
Fry trading and business
Fry trading and fish trading
Fry trading and day labour
Fry trading and agriculture
Fry trading, business and agriculture
Number of fry trader
Figure 5.8: Occupations of fry traders.
5.3.3.3 Seed distribution channel of fry traders
Fry traders trading fish fingerlings produced in ricefield based systems live within a 1
Km radius of the seed producing community. Fry traders sold fingerlings in 24 different
places with the distance ranging from 1 to 14 Km around the well established seed
producing community BAH (Figure 5.9).

Chapter 5
242
Figure 5.9: Decentralised seed distribution area from BAH (figures in the parentheses indicate distance in Km).
Table 5.8: Characteristics of fingerling distribution through fry traders from seed producing community to the foodfish producers
Characteristics of fry distribution Units
Distance from the seed producing community to where fry traders live (Km) 1.1±0.7 Distance to fingerling supply outside the seed producing community (Km) 4.9±3.6 Number of places (villages) fry traders distributed seed 6.3±3.4 Time taken by fry traders to carry seed (hr) 3.9±1.9 Number of farmers took fingerling per fry trader 34.5±9.7
On average each fry trader supplied fingerlings to 6 different places, where the average
time required for transport was approximately 4 hours (Table 5.8). Each fry trader
supplied fingerlings to about 35 foodfish producers over the course of the year.

Chapter 5
243
5.3.3.4 Seasonal income of fry traders through trading of ricefield produced fingerlings
Fry traders began earning income from decentralised seed from the month of April
(boishak-first month of Bengali calendar). They earned the highest income
(approximately US$13) in the month of May followed by the month of April, June, July
and August (Figure 5.10). Fry traders started to earn income from hatchery produced
seed from June to August.
0
2
4
6
8
10
12
14
16
Apr May Jun Jul Aug Sep Oct Nov Dec Jan Feb Mar
Months
Inc
om
e (
US
$/m
on
th/h
ou
se
ho
ld)
Figure 5.10: Seasonal income of fry traders.
As a proportion of the overall annual income from different sources, fry traders earned
an estimated 5% of their income from trading ricefield produced fingerlings.
Nevertheless this income was about equal to their income from agriculture and even
higher than the income from foodfish trading (Figure 5.11).

Chapter 5
244
Agriculture 6%
Ricef ield
produced seed
trading 5%
Foodf ish trading
4%
Hatchery
produced seed
trading 60%
Other non-farm
activities 25%
Figure 5.11: Fry trader income proportion from trading of ricefield produced seed in comparison with other income sources.
5.3.3.5 Advantages of trading ricefield produced seed
The major benefit, cited by more than 80% of fry traders, buying locally produced
fingerlings was that they could be obtained on credit (Table 5.9). After selling
fingerlings they pay cash to the seed producers.
Table 5.9: Advantages for trading of fish seed produced from the ricefield based systems
Advantages No Percent
Fry traders can buy fingerling from seed producers on credit 13 86.7 Easy (as very near) to get fry and transport from local area 12 80.0 A low investment with higher income 10 66.7 Easy to sell as large fingerlings have high demand 10 66.7 Direct cash income from the trading 7 46.7
Other advantages included easy access to seed and transport of locally produced
fingerlings using a bicycle; low investment business; easy to sell as large fingerlings
have a higher demand; and direct cash income from this trading.

Chapter 5
245
Out of 15 fry traders interviewed, one Muslim fry trader named Jafur Mia (46) started
decentralised seed trading from a seed producer Mr. Bhagirat Barman in the BAH
community. He lives in Paschimbahagili very closed to the well established
decentralised seed producing community. Through selling fingerlings, Jafur makes an
informal contract with Mr. Bhagirat by which both of them had benefited. In this
contract, Jafur informs other fingerling traders about the overall situation of fingerlings
in the ricefields of Mr. Bhagirat along with time and date of selling. After selling the
fingerlings, Jafur collects credit money (as fingerlings are sold in credit) from fry
traders, in return he earns Tk 5.0 per kg of fingerlings from Mr. Bhagirat. As an efficient
agent, only Jafur took this opportunity as he lives locally and has good relationships with
many fry traders and seed producers. Mr. Jafur worked as an agent for another seed
producer in BAH and he would not allow any other fry traders to take this income
opportunity. From this informal contract, Mr. Bhagirat benefits by selling fingerlings
without having to spend time to find fry traders and collect money. However, from the
other seed producers in BAH, fry traders directly purchase fingerlings without any
mediation.
Out of 3 fry traders involved in GUL, one of them, Md. Sobhan, a 38 year-old landless
fry trader lives at Aftabmembarar Para in Margaon Union – about 1.5 away from GUL
community. As a livelihood strategy for his 5 member-household, in addition to fry
trading, he is involved with other non-farm activities such as day labour and vegetable
seedling business in the fish seed off-season. He has been involved in fry trading since
1995 with hatchery produced seed and in 2004 he started trading ricefield produced fish
fingerlings from GUL. In 2004, he purchased 25 kg of common carp fingerlings from
GUL and earned Tk 1500 (US$ 21.4) in the month of April (Jestho) just before to trade
hatchery produced seed.

Chapter 5
246
The number of fry traders involved in BAH was much higher than GUL. Figure 5.10
shows the fry traders linked with well established community trading both common carp
and tilapia fingerlings over a number of months. On the other hand fry traders in GUL
traded decentralised seed of common carp only for one month.
5.3.4 Pond fish (foodfish) producers using fingerling from BAH
Foodfish producers have been purchasing seed from BAH directly and through fry trader
channels for several years therefore, linkages have been established. Therefore 30
foodfish producers were identified with the help of seed producers and fry traders to
interview to elicit their views on locally produced seed.
Table 5.10: Advantages and benefits of foodfish producers due to use of fish fingerling produced in ricefield based systems
Benefits for using fingerling produced in ricefields Percentage (%)
Getting required amount of fingerling in time 90.0 (27) Getting large size fingerling from fry traders 90.0(27) Can stock fingerling in pond and harvest earlier for consumption 86.7(26) Can harvest earlier for foodfish selling 80.0 (24) Get higher price from foodfish selling at that time 56.7(17) Can stock again in pond after earlier harvest 66.7(20) Fingerlings show higher survival 86.7 (26) Fingerlings increase production 80.0 (24) Fingerlings bring cash quickly 86.7 (26)
Figures in the parentheses indicate number of foodfish producer
Among the foodfish producers, the local supply of fingerlings produced in ricefields
brought various encouraging benefits (Table 5.10) including timely availability of seed
at larger size which ensured higher survival rates. This in turn also led to other impacts
including earlier harvests and the opportunity for multiple stocking approaches, faster
growth, higher production and quicker economic returns.

Chapter 5
247
One of the pond fish producers used ricefield produced fingerlings from GUL, 35 year
old Sri Sudir Chandra Adhikari lives in GUL where he owns 1 ha of cultivable land and
0.05 ha of pond. Agriculture is his main occupation but he has no suitable riceplot to
produce fish fingerlings. In 2004 the year prior to this study, he purchased 2 kg of
common carp fingerlings on credit from Mr. Abinach Chandra paying 200 Tk (Tk.
100/kg). If he had purchased this amount of common carp fingerlings from other sources
he could have paid up to Tk. 300.
5.3.5 Fish producers in large waterbodies (beel)
RBFSP has extended its impact on fish production to open water-bodies. Interviews with
fry traders revealed that fish fingerlings produced in ricefield based systems in BAH
were also purchased for stocking in beels. Fry traders identified four beels to which they
supplied common carp and tilapia fingerling from BAH.
Out of the 4 beels, one was used as a case study through interview with the manager Md.
Abdur Rahim. The area of the beel was 2.4 ha and was leased by a group of five landless
share-holders. The beel belonged to well-off people and was used for rice production
during the boro season. After the boro season from May to November it was
underutilized until 2000 when the five people approached and secured a lease for the
beel from the owners (who grow rice themselves) for the period of May to November to
produce foodfish. The lease was agreed on an annual basis for the period of May to
November every year. In 2005 they stocked 120 kg of fingerlings at an average size of
3-4 inches consisting of 20 kg of Ruhu, 10 kg of Catla, 30 kg of Mrigal, 25 kg of
common carp, 8 kg of grass carp, 17 kg of bighead and silver carp and 20 kg of tilapia.
They collected tilapia and common carp fingerlings from Mr. Bhagirat – a ricefield
based fingerling producer in BAH. In the beel fertilizers and supplementary feed were
supplied for the stocked fish. Finally at the end of the season, they produced around

Chapter 5
248
2,000 kg of fish from the beel of which 12% was (250 kg) was tilapia. Fish were sold at
a rate of Tk.55/kg and each member made approximately Tk 9,000 (US$ 150) profit.
As of 5 years ago, the beel had not been utilized for fish culture, however the availability
of fish fingerlings facilitated the local people to produce fish in the beel for profit. As
tilapia fingerlings were not produced in local hatcheries in Northwest Bangladesh at that
time (Chapter 7), it was an advantage to collect from decentralised system without
facing any problems of long distance transportation. Locally produced seed in the
ricefields enhanced stocking into the large waterbodies hence developed the opportunity
of additional income and employment of local poor people.
No evidence of fingerlings stocking activity in beels was found among any farmers in
and around recently introduced community GUL.
5.3.6 Fishers
Fishermen are one of the active actors in the network developed through the adoption of
ricefield based fish seed production in BAH. A Muslim fisher group emerged in
Dakhinbahagili, a neighbouring community of BAH during 1990s consisting of 6-7
active members. They have a large seine net (berjal) for harvesting fish from ponds and
fish seed from ricefields in different community households to earn income. The leader,
Md. Abdul Awal, having no cultivable land, no educational background and 6 family
members, has been involved in fish harvesting and trading activities. All other fishers
involved in the team were of similar socio-economic status as Mr. Awal. Through this
practice each member of the team earned around Tk.100-150 (US$ 1.5 to 2.5) every day.
He said that local fish production was increasing day by day and the income from fish
harvesting and trading was increasing as well.

Chapter 5
249
In the BAH community some fish seed producers rented Mr. Awal’s net to harvest seed
from their riceplot. By netting riceplots he earned around Tk 100 (US$ 1.5) a day.
During the seed production season, he earned a good amount of money through
harvesting fish fingerlings from the riceplots in the BAH community. One of the bigger
fish seed producers in the Bahagili community named Mr. Bhagirat produced around 8
mounds (320 kg) of fish fingerlings last year. The majority of them were harvested by
the fisher team of Mr. Awal. Ricefield based fish fingerling production has linked the
fishers into a network and reinforced their professional activities through opportunities
for employment and income.
There is a Hindu fisher group consisting of 6 members in the village Amnagar,
Khanshama - 2 Km away from recently introduced community - GUL. All of the
members of the fisher group were uneducated and landless. The group owned equal
shares of a seine net that they used to harvest fish from rivers and ponds as their main
livelihood strategy. Along with several of the village ponds in Khanshama, they also
harvested fish from ponds in GUL, but they never harvested fingerlings from ricefields
in GUL.
5.3.7 Aratdar
In the local market Mirbag Bazaar 0.5 Km away from BAH there was no arat (auction
market of fish) prior to 2005 (Figure 5.4). Earlier retailers in Mirbag bazaar had to
purchase foodfish from the district market Rangpur - 15 Km away. Since then two arats
have been established and Mr. Nasiat owned one of them. Before establishing this arat
he was a paiker (retailer) at the retail fish market in Mirbag. In this arat another two
persons were employed; one to call prices and the other to calculate the price of fish. In
Nasiat’s arat throughout the year an average 4-5 mounds (160-200 kg) of fish were sold
daily worth about Tk.8000-10000 (US$ 100-150). In this arat fish came from several

Chapter 5
250
places ranging between 1 -16 Km away. Mr Nasiat commented that the amount fish
coming to the arat was gradually increasing every year.
Mr. Nsaiat was 50 years old with no educational background with 10 family members
and 0.33 ha cultivable land. His landholdings were not sufficient to maintain his large
family which prompted him to develop the arat in 2005. He gets 5% from the farmers
after selling fish to the paikers through the mediation of his arat and earned around Tk.
30,000-40,000 (US$ 500-666) in 2005. He mentioned that a large amount of tilapia
(about 15% of the total fish marketed) was sold along with other fishes in this arat. This
shows the linkage between actors in fish marketing and fish seed producers and foodfish
farmers. The development of an arat in the local market close to fish seed producing
community indicates the development of fish marketing infrastructure in the rural area.
In this infrastructure some people were employed and other associated stakeholders also
benefited. Ultimately the seed production in the ricefield based systems is contributing
to the local foodfish market.
At the village market in Kachinia, 1 Km away from GUL there is an arat where fish are
brought by fishers and farmers to sell to the retailers (paikers). Arat owner Mr. Kartik
Das mentioned that selling fish produced in ponds, particularly large carps (ruhu, mrigal
etc) and Thai Sharpunti were the main species of fish. He also mentioned that a small
proportion of tilapias of the local variety were sold along with a large volume of carps in
his arat during dry months (e.g. November and December) when pond farmers dry their
ponds.

Chapter 5
251
5.3.8 Retailer
Mr. Shah Alam (45) is a fish retailer in Mirbag Bazar (Figure 5.4) has 0.3 ha of
cultivable land with no educational background and with 5 family members. From his
cultivable land he produces about 1 ton of rice every year which is not sufficient to
maintain his family. As a result he started as a fish retailer in 1997 and earns about Tk.
80 -100 (US$ 1.5) per day. During 2005 he sold different types of fishes in the market
including carps, catfish, tilapia and other small fishes. Last year, about 10% of the fish
he sold was tilapia produced by the local foodfish producers (Figure 5.12).
0%
10%
20%
30%
40%
50%
60%
70%
80%
90%
100%
April
May
June
July
AugSep
tO
ctNov
DecJa
nFeb
Mar
ch
Fis
h s
old
(%
)
Tilapia Other fishes
Figure 5.12: Proportion of tilapia in comparison with other fishes sold by a retailer in a nearby market of BAH.
He said that tilapia has been available in this local market over the last 6-7 years and was
popular with customers. The size of tilapia ranged from 50 g to 200 g with the smaller
ones being of lower price and so were purchased by poorer people. He also added that
trading tilapia was more comfortable and less risky as its remains fresh for a longer time
compared to other fishes. This finding suggests that local fish seed production has

Chapter 5
252
enhanced fish availability and quality in the market and improved affordability to the
consumers.
Likewise aratdars retailers had also benefited from selling locally produced fresh fish to
customers. Availability of tilapia in the local market over the last few years as reported
by the retailer indicates that the RBFSP in BAH made a linkage between the retail
market and consumers.
In the retail market in Kachinia close to the GUL community, there were no observable
impacts of RBFSP at that time of study.
5.3.9 Fish consumer via fish market
Mr. Jamshed Ali was a fish buyer (consumer) living in the village of Sonaton which is 2
Km away from the Mirbag Bazar. He had 0.4 ha of cultivable land and a grocery shop
which earned him Tk 50,000 (US$ 830) annually, enough to maintain his 10 family
members. He had no pond, so had to buy fish from this market at least 3-4 times per
month for his family consumption.

Chapter 5
253
0
1
2
3
4
5
AprilM
ay
June Ju
lyAug
Sept Oct
Nov
Dec Ja
nFeb
Marc
h
Am
ou
nt o
f fis
h p
urc
ha
sed
(K
g/m
on
th)
Figure 5.13: Purchasing of fish (kg/month) by a consumer from the local market nearby BAH.
In an average month, Mr. Jmshed buys 2.33 kg fish (Figure 5.13) at a low price ranging
between Tk 60-65 (about US$ 1) per kilogram. In order to keep costs low he bought
smaller sized fish such as tilapia, smaller sized silver carp, silver barb etc. He also added
that in this fish market tilapia has been available over the last 6 years and it was cheaper
and tasty to eat. This indicated that local fish seed production in the ricefield based
systems enabled the lower income people to consume fish from the local market. The
availability of affordable tilapia along with other small fishes in the local market has
built a linkage with poor consumers.
In the market close to the recently introduced community – GUL no observable impacts
were found on consumers.

Chapter 5
254
5.3.10 Fish consumers directly consumed fish from the community
Poor local farmers in BAH, such as Bankim Barman, have no facilities to produce
foodfish or fish seed but were able to benefit through consumption of fish from fish seed
producing households. He had no pond or land except his homestead area and the
household’s livelihood was totally dependent on selling labour year round. He had very
little capacity to purchase fish. He however, purchased fish from the ricefield based fish
seed producers about 3-4 times during the period from September to October as the price
of these fish was about 25% lower than that of the local market. The local level fish seed
production, and subsequently foodfish production facilitated the poorer non-producers to
consume fish at lower price during a certain period of the year commonly recognised as
monga – hungry gap.
Poor farmers in the recently introduced community- GUL were found to benefit from
RBFSP through consumption of ricefield produced large sized fingerlings as foodfish.
One of them, Manoranjan Roy, was a landless farmer living in GUL, self-employed as a
van puller. He has no pond to produce fish which is why he has to either catch fish from
wild sources (beel and river) or buy it from the market. One day last year, he had to
purchase foodfish produced in a ricefield in GUL when he could not catch fish in the
wild. The fish cost 50% less than those sold in the market.
It appears that poor farmers in the well established community-BAH had a greater
chance of purchasing fish at a cheaper price than the farmers in the recently established
community GUL.
Chapter 5
255
5.3.11 Non government organization (NGO)
An NGO, Rangpur Dinajpur Samajic Unnayan Sangstha (RDSS) has been working in
the Northwest region of Bangladesh at the grass-root level with rural people since 1986.
In 2001 it went into partnership with CARE’s Go-Interfish project to implement
improved low-input ricefield management activities through the farmer field school
approach. Among different ricefield management activities, RBFSP was promoted
initially through the stocking of fertilised common carp eggs in ricefields collected from
perennial ponds. RDSS was also assigned by CARE to disseminate tilapia seed
production along with common carp. This activity was restricted to a few NGOs as
tilapia brood was not available everywhere. RDSS was able to disseminate tilapia seed
production, as broodfish were already available in BAH under its working area of
Kaunia Upazila in Rangpur district.
After setting up the FFS, RDSS’s field trainers suggested that the farmers collect tilapia
broodfish from BAH. Approximately 100 tilapia broodfish were purchased (Tk 8-
10/broodfish) by FFS farmers from 2 BAH seed producers in 2002. Although RDSS did
not hold tilapia broodstock, it acted as a source of information for new farmers.
Accordingly FFS participants, through their own efforts collected tilapia broodfish from
BAH to stock in their riceplots along with common carp. The NGO therefore played an
important role encouraging communication between established and current seed
producing farmers.
In GUL there was no source of tilapia broodfish. If good quality tilapia brood had been
available in GUL, NGOs working in the Go-Interfish area (Dinajpur and Thakurgaon)
could have disseminated tilapia seed production in their other intervention areas along
with common carp.

Chapter 5
256
5.3.12 Actor network matrix
An actor linkage matrix was used to explore and then summarise the relationships
between different actors. This process leads to the analysis of more complex systems
with many actors, ensuring all possible links between actors are examined and allowing
links to be given a value (Matsaert et al. 2004). This investigation resulted in the
following actor network matrix and the observed linkages between the actors were
visualised (Table 5.11).
Table 5.11: Actor linkage matrix showing links developed for RBFSP between different actors in well established community - BAH (upper diagonal) and recently introduced community - GUL (lower diagonal)
Actors
See
d p
rodu
cer
Fry
tra
der
Fo
od
fish
p
rodu
cer
Fis
her
Ara
tda
r
Ret
aile
r
Co
mm
un
ity
lev
el
con
sum
er
Mar
ket
lev
el
con
sum
er
NG
O
Seed producer
•
•
• • • • • •
Fry trader •
•
Foodfish producer
•
• • •
Fisher
•
Aratdar
•
Retailer
•
Community level consumer
•
Market level consumer
NGO
• Indicates the linkage between the actors

Chapter 5
257
The focal actor (ego) in this matrix is the seed producer connected with other different
types of actors (alters). The network between the actors is more diverse in the well
established community BAH (upper diagonal) compared with the recently introduced
community GUL (lower diagonal), although almost all actors were available in and
around GUL. The RBFSP was just emerging at this stage in GUL and the number of
seed producers (ego) and their production status of fingerlings was relatively low.
5.3.13 Building social capital
The network of relationships around seed producers leads to the development of social
capital. Such interactions have led to a trust relationship between the actors in the wider
community. During the production of fish seed in a ricefield based system the collection
of common carp eggs by the neighbouring farmer does not hamper the host farmer’s
pond fish production. Neighbouring farmers who collected common carp seed from the
host farmer were not obliged to give anything in return. The host farmer was
reciprocated through the esteem and support essential for sustaining leadership in the
community. Additionally fry traders and foodfish producers do not need to pay instantly
after buying fish and foodfish respectively from seed producers.
In terms of the norms of reciprocity, these sorts of relationships between seed producer
and other actors are ‘generalised’. Generalised relationships do not need immediate
reciprocity, which is flexible in nature rather reciprocation could take place in future.
Since common carp egg collectors, fry traders and foodfish traders are not the kin of
host seed producers, this relationship can also be expressed as a horizontal and weak
network of engagement which is essential for building social capital.

Chapter 5
258
5.4 Discussion
Investigations undertaken for this chapter were both quantitative as well as qualitative to
understand reasons behind the linkages between various actors involved in decentralised
fish seed production. Many researchers have described the usage and advantages of
qualitative methods such as case studies in research. Adelman et al. (1976) described
‘case study’ as an umbrella term for a family of research methods having in common the
decision to focus an enquiry around an instance. Yin (1984) defined the term case study
as an empirical inquiry that ‘investigates a contemporary phenomenon within its real-life
context when the boundaries between phenomenon and context are not clearly evident.
Bassey (1999) in his critical review of case study research suggested that case studies
have the ability to understand the complexity of a particular context. Integrating the
quantitative and qualitative, case study methods can unpack the structure of networks in
which various actors benefit in different ways.
5.4.1 Seed producers
The production of fish seed in ricefield based systems in farming households linked
them with different types of actors who benefited in diverse ways. Seed producers
themselves benefit if they have their own grow-out facilities by using their own seed in
their own ponds. As seen in Chapter 3 seed producing households obtained 60% extra
production from their pond compared to control non-seed producing households. The
higher production was due to higher survival, larger size and faster growing
characteristics of fingerlings and more taking care (time spent ) of their ponds. Stocking
larger sized fingerling in ponds results in higher survival and the unavailability of larger
sized fingerling has been the major constraint for the wide spread development of rural
aquaculture in Bangladesh (AIT, 1997; Alam, 2002; Brown, 2003).

Chapter 5
259
In rural pond based aquaculture, the cost of fingerlings is the largest component of
production costs (Alam, 2002; Karim, 2006). So the production of fingerlings in
ricefield based system facilitates farmers to stock, quality fingerlings into their ponds
and thereby minimizes input costs and dependency on external inputs. A major
proportion of seed producers cited that producing their own fingerlings made them self-
reliant, which was expressed as ‘no need to go to the hatchery’. Sustainable agriculture
should seek to minimise the dependency on external inputs (Ikerd, 1993; Pretty, 1995;
Altieri, 2000). The high dependency on external inputs in agriculture increases farmers’
vulnerability to reduced profit, as they have no control over supply and price of inputs
(von Braun, 2005).
The benefits of RBFSP were not only felt by the producers themselves but also by other
linked actors of which fry traders were most important. Development organizations such
as FAO have realized that there is a need to see aquaculture as one aspect of rural
development towards improving livelihoods of producers as well as other associated
actors rather than as an isolated technology (FAO, 1997). The number of fry traders to
whom farmers sold seed was higher in the community where decentralised RBFSP was
well established as a trading network was already well developed. This also indicated
the magnitude of the local seed production and the involvement of fry traders which then
highlighted the demand for decentralised seed from local foodfish producers. Before the
introduction of tilapia in BAH, farmers could not sell fingerlings to fry traders due to
their limited production of common carp fingerlings (Barman et al. 2004). The
production and sales were higher in the well established community, as households used
good quality tilapia broodfish along with common carp and their experiences of RBFSP
which contributed to building more diverse network of decentralised seed. However,
lack of good quality tilapia broodfish is critical (Barman et al. 2004) for the households

Chapter 5
260
of GUL with respect to broader impacts in a diverse network like Bahagili - as found in
Chapter 7.
Giving seed and foodfish to the neighbour and relatives as gifts is a traditional custom in
Bangladeshi society which strengthens the linkage of kinship among the rural people
(Nazneen, 2004). As discussed in Chapter 6, gifting and selling seed and foodfish to
neighbours and relatives in both communities emerged as a factor of the adoption
process of RBFSP. Interestingly, a proportionately lower percentage of seed producers
gifted and sold fingerlings to their relatives and neighbours in the well established
community. This was possibly due to the development of a more commercial attitude
among seed produces in well established community selling more seed to fry traders.
It appeared that a relatively smaller proportion of households in well-established
community sold fingerlings as foodfish to the market. In contrast, selling fingerlings as
food fish reflects lower demand and poor market development in the locality. Selling
fingerlings to the market as foodfish might be a good indicator of ‘market failure’ that is,
lack of value of the product as ‘seed’ whereas consumption of fingerlings by the
producer household, especially who they have no pond, might be more rational. Also
selling to local poor people (e.g. Barman, et al. 2004) or giving fish to neighbours or
relatives might be an ‘intermediate’ strategy to cope with market failure.
In Vietnam due to lack of market demand in the first demonstration year of ricefield
based tilapia fingerling production by farmers and uncertain perceived quality of seed
among potential customers, fingerlings of tilapia produced in ricefields were used as pig
feed (Phuong et al. 2006). The major finding of the present study was that local
production of quality fish seed was stimulated by tremendous demand among foodfish
producers in and around the producing community.

Chapter 5
261
5.4.2 Fry traders
Trading of fish fingerlings is a generic part of fish trading which was once restricted to
low caste Hindus. The present study shows this profession has also been adopted by
Muslims and that the activity can now be regarded as a ‘profession of the poor’.
According to de Graaf and Marttin (2000) traditionally professional fishermen in
Bangladesh were low caste Hindus where fishing was mainly carried out by the
Rajbangshi, the Bapari and Halder communities. The professional Hindu fishermen
belonged to the poorest segment of the population. In the socially stratified society of
Bangladesh, fishing was considered taboo for Muslims. However over the last decade
new Muslim entrants have overcome the social impingement and involved themselves in
fishing as their major occupation (FAP 17, 1995; Thompson et al. 1999).
The majority of fry traders connected to the trading of ricefield produced fingerlings
were also involved in other non-farm activities particularly small business. Involvement
of people in multiple activities is not confined to the rural sectors of developing
countries, thus in literature of industrial countries, it is termed as ‘pluriactivity’
(Shucksmith et al. 1989; Evans and Ilberry, 1993). Their involvement in different
income earning activities indicates the livelihood diversification of fry traders.
According to Ellis (2000) diverse rural livelihoods are less vulnerable than undiversified
ones and local policy should facilitate such types of diversity.
Fry traders linked to the production of fingerlings in ricefields tended to live within a 1
km radius of the well established seed producing community. They sold fingerlings over
distances from 1-14 Km which was certainly less than the distance between any fry
trader/fish producer and a centralised private and government hatchery which are
typically located close to urban areas. The income derived through local fingerling
trading was high in the early months of Bengali calendar and this income was

Chapter 5
262
collectively nearly equivalent to income flows from agriculture. Although this income
was limited, it was seasonally very important for the landless fry traders as hatcheries
did not start to produce seed in April. According to Little et al. (1999), local seed
production reduces the cost and improves the quality of seed compared to that of seed
transported and traded over greater distances. Furthermore, employment and income
generation would be localized; and the monopolistic tendencies towards lower returns
and increased risk for poorer workers in the existing fish seed network would be
reduced.
A major advantage to the fry traders of the availability of ricefield produced fingerlings
was that they could be purchased on credit due to the close relationship between fry
traders and farmers and lack of working capital of traders. Fry traders are poor, they
have little money and they do not have cash to purchase seed from seed producers. It is
not easy to purchase fish seed on credit from government centralised hatcheries (Barman
et al. 2002) as well as from wholesalers (Lewis et al. 1996). Some fry traders can also
purchase seed on credit from centralised hatcheries (Lewis, et al. 1996) but there is the
likelihood of seed mortality due to long distance transportation and cost associated with
travel by bus or train to repay credit to hatchery.
Informal trading linkages between the decentralised fish seed producers and fingerling
traders appear to benefit both partners. Involvement of a large number of fry traders in
decentralised seed networks in the well established community generated multiplier
livelihood impacts for themselves as well as for foodfish producers. The relative benefits
to the network derived from the decentralised fish seed production in seed producing
communities, per unit level of initial investment, is compared to investment in mono-sex
tilapia hatcheries in Chapter 7.

Chapter 5
263
5.4.3 Foodfish producers (pond and beel)
Foodfish producers stocking ponds and any large water bodies (beel) are the ultimate
users of the fish fingerlings produced in the ricefield based systems. Local seed
production by farming households in the well established community and use of seed by
local foodfish producers, resulted in multiple benefits encouraged stronger relationships
between seed and foodfish producers. These findings presumably suggest that local seed
production and the demand for high quality large sized fingerlings was increasing. From
the early days of aquaculture production, it was realised that it was desirable to produce
and supply large sized fingerlings in the rural areas to enhance stocking into ponds and
open waterbodies (FAO, 1992). Ricefield produced fingerlings were found to enhance
stocking in the large waterbodies. In the Bangladesh Government’s Fifth Five Year Plan
(1997-2002), there was an agenda to increase fish production through the massive
stocking of carp fingerlings in natural depressions and floodplains (Alam, 2002),
however it did not succeed due to a lack of large sized fingerlings.
Decentralised fish seed producing farmers using larger sized fingerlings show 60%
higher production in their ponds (Chapter 3) and higher survival as well as quick
economic returns. Apart from the impacts on the individual seed producing households,
the end users, the foodfish producers received fingerlings were getting a higher level of
production in their ponds. The broader benefits to the local area of foodfish producers
obtaining a major input (fingerlings) from a local source included the retention and
recycling money locally. This in contrast to when farmers purchase inputs from outside,
means that most of the money flows either to urban areas or other distance places, and
only a small percentage remains in the community as profit received by larger
middlemen such as dealers, businessmen etc. (Hefferman, 1986; Ikerd, 1999). Use of
local inputs will have positive multiplier effects on both the agricultural and non-
agricultural sectors, as a substantial proportion of agricultural income is spent on non-

Chapter 5
264
farm goods and services such as chemical fertilizers, irrigation fuel (diesel), labour etc.
(Hossain, 1998).
5.4.4 Fish traders and market
In terms of the well established RBFSP community BAH, a network has developed in
the marketing chain for selling foodfish from fish seed producing households. Within the
marketing chain, fishers, aratdar, retailers and consumers were found to be the
beneficiaries of the RBFSP in addition to seed producers (Chapter 3 and 4). As a new
approach, there could be a question of whether it had an impact on the value chain.
Huisman (1990) has suggested that market studies should precede any intervention to
enhance the contribution of aquaculture to development. One possible reason why China
and Indonesia dominate ricefish farming in Asia is the market for fingerlings cultured in
ricefields for stocking in ponds and cages and enhanced fisheries, rather than only
contributing to household subsistence (Huisman, 1990).
Commercialization and market integration of the millions of smallholder farms remains
a central task in overcoming rural poverty through the diversification in agriculture (von
Braun and Kennedy, 1995; Kherallah et al. 2002). The broader externalities of markets,
together with public goods and non-market institutions, have important developmental
and distributional effects that are not yet well understood for different rural conditions
(von Braun, 2005). The appropriate use of the linkages between agriculture and rural
industrialisation, as well as rural urban linkages facilitate smallholder productivity
growth, which has been proven as essential for pro-poor growth process in for instance,
Japan, South Korea and Taiwan (Hayami, 2000). Local fish production and its
availability in the local market facilitate local people to consume fish at a cheaper price.
The consumption habit of small fish particularly tilapia (<200g) is more important
compared to large fish in terms of the food security of poorer households (Barman et al.

Chapter 5
265
2002; Little et al. 2007) who have higher demand in market (Faruque, 2007). According
to Edwards (1999b), benefits from rural aquaculture may be either direct to a household
farming aquatic products; or indirect from increased availability of low-price fish in
local markets.
5.4.5 NGOs
The availability of tilapia broodfish in nearby community facilitated an extension
organization (NGO) to promote fish fingerling production along with common carp in
ricefields. Within the community some farmers carefully maintained their tilapia
broodstock (GIFT) year after year. In the well established RBFSP community, none of
the seed producers complained of poor growth of seed or tilapia foodfish (GIFT) over
the last 6 years of practice.
In terms of rice as Ahmed (1995) described, the traditional seed markets involve farmers
producing seed for their own use as well as for sale to markets in Bangladesh. It is not
uncommon for some farmers to become specialised in the production of rice seed. The
traditional rice seed markets have been the channel of distribution not only among
farmers within the country but also between adjoining farmers within Bangladesh and
even across the border to India. The present phenomenon of tilapia brood supply, like
rice seed, has occurred through farmers.
Ricefield produced mixed-sex tilapia showed higher yields of 36% over an existing
polyculture system in Northwest Bangladesh (Barman, 2000). There should however, be
a scientific investigation to determine how long the quality could be sustained. It could
equally be argued that farmers might be, or are capable of improving the quality of seed
themselves. There is the possibility of deterioration in the quality of improved varieties
of tilapia broodfish through mixing with feral tilapias (Lal and Foscarini, 1990). Such

Chapter 5
266
deterioration in quality may cause the breakdown of emerging linkages among the
farmers in terms of the promotion of tilapia broodfish for wide spread seed production in
ricefield based systems. In this context, local organized competent NGOs could take the
initiative to produce good quality tilapia broodfish and to supply them to new areas as
well as to replace deteriorated stock in established areas. The NGO Rangpur Dinajpur
Rural Service (RDRS) working in Northwest Bangladesh is an example of such an NGO
with experience in promoting small-scale aquaculture, staff capacity and physical
resources (e.g. pond for keeping tilapia broodfish, training centre etc.).
5.4.6 Social capital
Technological adoption contributes to human and social capital at the household and
community level (Isham, 2000). Social networks potentially reduce risk and enhance the
effectiveness of individual and collective endeavours. Social capital with diverse
networks among various actors acts as an incentive to the adoption of sustainable
practices, which is of particular significance in the rational management of natural
capital (Bode and Howes, 2003).
Social capital is a key element in the Sustainable Livelihood Framework and appeared
first as a concept in the development discourse in the 1990s, attracting significant
interest from different corners (Stirrat, 2004). Since the mid 1990’s, the concept of
social capital has become firmly established in the literature of both theoretical and
applied social science, including economics (Patrick et al. 2006). Borrowing from others
(Bourdieu, 1985; Coleman, 1988; Hirschmann, 1984; Larance, 2001; Portes, 1998;
Putnam, 1993; Putnam, 1995; Putnam, 2000), from the viewpoint of the development
discourse, recently social capital has been defined as the benefits gained by a group of
people from their relationships in extrafamilial networks (Larance and Porter, 2004). In
the present study farmer-farmer relationships in terms of movement and use of common

Chapter 5
267
carp eggs and tilapia broodfish from one household to another appears to be an
important building block of social capital. The farmer receiving eggs and tilapia
broodfish reciprocate their political support and informal care for ricefish plots of the
donor households. This together contributes to building social capital in a wider
community of decentralised fish seed producers.
Fish seed production activities involving different types of actors/stakeholders within the
network of relationships may have reinforced the pre-existing social capital with positive
development outcomes. A growing body of literature is adding weight to the concept
that social capital plays an important role in the rural development process (Patrick et al.
2006). Krishna (2002 & 2003) in socio-economic analysis of Indian farmers, found that
economic development performance was associated most strongly with a combination of
high intra-village social capital which is expected in the developing countries.
According to Bode and Howes (2003) networks of social capital operate at many levels
in the village, particularly in rural life and agriculture in Bangladesh. Sharing/leasing
land, lending money, lending or exchanging household and food items, renting in
irrigation pump, allowing access to drinking water pumps, or pond water are the
common avenues for building and creating closer social ties in Bangladeshi society,
which have been discussed in Chapter 3.
In the present study it was observed that poorer seed producers were permitted to collect
common eggs from intermediate farmers’ ponds. Thus social capital increased through
the benevolence of one farmer to another. Through this type of access poorer households
could produce a significant amount of fish seed and food fish which would have been
impossible if the better-off farmers did not allow egg collection. Grootaert (1999)
examined how the social capital of rural households, particularly as expressed by their
memberships in local associations, affects household welfare and poverty in Indonesia.

Chapter 5
268
For low income households, he found that returns from social capital were higher than
returns from human capital. The present study has shown that poorer seed producers
benefit depended on their use of social capital as they had little human and physical
capital. Within decentralised seed networks, poor fry traders were identified as ‘elite’
having special skills of communication with other fry traders and some seed producers
leading to benefits for both elite and seed producer. This sort of elite has been
recognised as ‘tertiary elite’ having a landless status but who benefit the community
regardless of class, ethnic group, religions or political constraints (CARE, 2005c).
Some decentralised fish seed producers (e.g. Bhagirat Chandra Roy) were linked with
diverse actors impacting on a wider scale including community households, a large
number of fry traders and NGO supplying tilapia broodfish for further dissemination of
decentralised seed. These abilities of farmer indicate that some farmers do not only
maintain their seed production practices but also contribute to the broader development
of decentralised seed networks. Such type of people benefiting themselves well as and
giving better chances of benefits to other people has been termed as a ‘social business
entrepreneur’ (Yunus, 2007). Further research could be carried out to develop such
entrepreneurs in the decentralised seed networks towards broader social development.
5.5 Conclusion
Agricultural economic research must address a greater diversity of actors for its
development and growth (von Braun, 2005). As with other agricultural activities,
various beneficiaries (actors) were found to be involved in different activities of
aquaculture such as producers, labour, fry traders, fish traders etc. (Edwards, 1999b).
Before the last decade, research and development interventions did not address actors
including producers and other associated actors properly in terms of their livelihoods
and its improvement (Lewis, 1997). Edwards (1999b) argued that the inadequacy of

Chapter 5
269
poverty focused assessments was one of the major obstacles to a fuller understanding of
aquaculture impacts on poverty.
This study, based on the hypothesis ‘RBFSP benefits other actors such as fry traders,
pond fish producers and other beneficiaries within seed producing and marketing
network’ using an actor oriented approach, explored linkages between actors
(beneficiaries) benefiting in different ways and to various extents from decentralised fish
seed production in irrigated ricefields. It has shown that fish seed production was not an
isolated technology at the household level rather it benefits a diverse actors at a broader
societal level. For instance, the benefits associated with landless fry traders were
important as about one-third of rural people in Bangladesh are functionally landless,
unemployed or underemployed, which is one of the major causes of poverty (Rasul and
Thapa, 2004). Involvement of fry traders and foodfish traders in the decentralised seed
production system indicates the development of an agro-business and rural marketing
network. Aquaculture as an agro-business is expected to create opportunities rural,
urban, and export markets and using markets as a tool to realise development objectives
(DSAP/ATDP-II, 2005). Recent literature also suggests that agricultural systems are
increasingly changing from a distinct sector of the economy into a integrated system, in
which resource uses and functions are linked to service chains with multiple market and
non-market institutions (von Braun, 2005). Fish seed production at the household level
was also found to contribute to reinforcing social capital at the community level. Poor
seed producers used social relationships to gain access to seed sources in ponds of the
better-off farmers showing the relative importance of social capital compared to their
other livelihood assets.
Over the years, the development of broader networks among various actors in a well
established community indicates the sustainability of decentralised fish seed production.

Chapter 5
270
In the actor network of well established community, seed producers (ego) played major
roles with higher number of adopters and their production performances being producers
of both common carp and tilapia fingerlings with longer experience on decentralised
seed. In order to diversify the actor networks in the recently introduced community, the
supply of good quality tilapia broodfish is critical in terms of increasing number of seed
producers (ego) and their production performances.

Chapter 6
271
Chapter 6: Adoption, adaptation and rejection process of RBFSP technology
6.1 Introduction
The preceding chapters have described the livelihood impacts of RBFSP on producer
and other associated beneficiaries. Having carried out such an impact analysis, the
question of adoption and rejection process of this technology at the producer household
remained. This chapter therefore, presents some assessment of the adoption and rejection
process of this technology among the households.
Lack of fish seed or fingerlings is a major constraint to more widespread involvement of
poor in aquaculture in Asia (AIT, 1997; Edwards, 1999a) and both the quality and
quantity of fingerlings is the most serious constraint to pond fish producers in
Bangladesh (Barman et al. 2002; Alam, 2002; Brown, 2003; Little et al. 2005). Among
different aquaculture practices, ricefield based fish fingerling and food fish production in
the poorer households, has been found to be a strategy with various livelihood impacts
ranging from increased fish consumption to generation of additional income (Haque et
al. 2005). As poorer households are generally characterized by having small
landholdings and less cash, the capital cost for pond construction may have prevented
them from adopting aquaculture, thus fish culture in riceplot has been proven as a
potential method for poorer farmers to produce fish (Surintaraseree and Little, 1998).
However, the unavailability of fish seed when required is one of the major constraining
factors in the promotion of ricefish cultivation to a broader spectrum (Waibel, 1992;
Gupta et al. 1996; Halwart, 1998; Edwards, 1999b). Overcoming these constraints and
promoting ricefish culture activities, RBFSP has been developed and promoted in
Northwest Bangladesh.

Chapter 6
272
In terms of adoption, a previous study by Kamp and Gregory (1993) recognised that the
factors responsible for adoption of RBFSP were increased income from fingerling sales
compared to food fish, higher income from irrigated rice than rainfed rice although
boro-monoculture is less profitable than amon. This also brought benefits to farming
households through rejection of pesticides and environmental and economic advantages.
A further study by Barman et al. (2004) recognised that the introduction of tilapia along
with existing common carp was the major stimulating factor responsible for the adoption
of fish seed production and multiplication by secondary adopters resulting in increased
fingerling production, sale and household level consumption. In contrast, that study also
revealed some constraining factors responsible for lack of adoption of this technology
which included poor availability of water and movement of farmer towards off-farm
activities.
The studies discussed above give some insights into the factors responsible for adoption
of RBFSP technology in farming households but did not adequately explain non-
adoption or later rejection of the technology. In the present study the hypothesis was that
‘adoption of RBFSP can be sustained by farming households’. This chapter therefore,
attempts to unpack how various factors contribute to the adoption, adaptation and
rejection processes of RBFSP technology.
6.2 Analytical framework
Adoption of technological innovations in agriculture has attracted considerable attention
among development economists, because the majority of the population of less
developed countries (LDCs) derives its livelihoods from agricultural production and
because new technology seems to offer an opportunity to increase production and
income substantially (Feder et al. 1985). Agriculturally, technology adoption can
dramatically improve the well-being of farming households, but many questions about

Chapter 6
273
the determinants of adoption remain unanswered (Besley and Anne, 1993). In a review
of early empirical and case study evidence on technology adoption, Feder et al. (1985)
suggest that some adoption outcomes that can not be explained with traditional models
or by standard household data may be the result of differing social, cultural and
institutional environments. Furthermore, none of these studies models or tests showed
how social structures in the villages affect adoption of innovations or unpack the actual
reasons. Rosenberg (1976) in a review of research on adoption of innovations, suggested
that the poor explanatory power of models put forward by sociologists was a
consequence of poor attention paid to the role of economic variables. Screening
numerous adoption studies, Lindner (1987) reported that the results of research in the
field have been disappointing and most of the statistical models developed have a low
level of explanatory power, despite long lists of explanatory variables already
considered in the methodology.
All innovations and their adoption processes have no equivalent units of analysis
(Rogers, 1995a). Nevertheless, there is a long-standing instrumental tradition in
extension studies that looks primarily at the adoption and diffusion of innovations.
Between 1950 and 1970 especially, thousands of studies were conducted across the
world which sought to explain why and how people came to adopt, or not, new
agricultural technologies and practices (Leeuwis and van den Ban, 2004). Many
researchers have investigated the relationship between an individual’s adoption index
and a variety of social characteristics. Such studies have been conducted in highly
diverse areas such as agriculture in industrialised and less industrialised countries, health
services and consumer behaviour. Remarkably similar results were found in all of those
fields (Leeuwis and van den Ban, 2004). The use of the dummy variable in the
traditional regression model does not allow scientists to properly unpack the causal
chain or to understand why effects are, or are not, being found. In most studies, adoption

Chapter 6
274
variables are categorized simply as “adoption” and or “non-adoption” – the dichotomous
adoption variables. Adoption apparently cannot be represented adequately by a
dichotomous qualitative variable in many cases (Feder et al. 1985). According to White
(2005), several regression models showed an insignificant outcome and even in a few
cases a perverse one. He also stressed that developmental analysis needs to be firmly
embedded in a theory-based approach which maps the causal chain from inputs to
impacts. However, recently in innovation practice and theory, ideas regarding adoption
of innovation have changed considerably in association with the shift from instrumental
models to interactive models (Leeuwis and van den Ban, 2004). In contrast to the
facilitating factors of adoption, how risk and uncertainty factors affect adoption process
of technological innovation is also important to understand sustainability (Glantz et al.
1997). This suggests if risk and uncertainty surpasses a modest limit adopters may not
continue the technology and eventually reject it. Risk and uncertainty play a number of
distinct roles in the process of adopting and rejecting new technologies. These distinct
roles have often been blurred or treated incompletely in past research (Marra et al. 2003)
in the context of socio-economic and environmental changes (Majumder and Shivakoti,
2004).
Adoption of agricultural innovation is the degree to which a new technology is used in
the long-run equilibrium when the farmers has full information about the new
technology and its potential (Feder et al. 1985). The adoption of a new practice is closely
linked with sustainable development (Dolan et al. 2006) which is concerned about the
development of a society where the costs of development are not transferred to future
generations, or at least an attempt is made to compensate for such costs (Pearce, 1993).
Technology adoption in agriculture is increasingly changing from a distinct sector of
economy into a more pervasive integrated system in which resource use and ecosystem
functions are linked to the consumer via extended food and service chains with market

Chapter 6
275
and non-market institutions shaping the system (von Braun, 2005). von Braun also
argued that agricultural development is moving from a linear relationship between
different factors towards the systems of interaction between and among the factors in a
more complex fashion. Therefore, to understand the adoption process of RBFSP, a
pervasive analytical framework encompassing household livelihoods resources and
functions of seed production technology into a causal domain encompassing ricefield
ecosystem, pond, farming family, seasonality, farming society, market of technological
product, technological problems and solution, technological changes carried-out and
gender issues in a complex fashion. In addition, this framework is considered to unpack
the reasons regarding risks and uncertainties behind process of non-adoption and
rejection of technology (Figure 6.1).

Chapter 6
276
Figure 6.1: Analytical framework of adoption, non-adoption and rejection process of RBFSP in farming households.
Rice-field based fish
seed production
Human capital
Natural capital
Physical capital
Financial capital
Social capital
� Riceplot ecology � Pond ecology � Intra-household � Vulnerability (seasonality,
shocks etc.) � Farmer’s society
� Marketing channel
Linked with Adoption
of technology
Rejection of
Technology
Changes carried out
Solution of problems
Technology Causal domain Adoption No adoption/rejection Household livelihood asset
No adoption of technology

Chapter 6
277
6.3 Methodology
Using a PRA tool, the Key Informant Interview, involving a community organizer
(leader of the CARE FFS in a community), different types of adopters and non-adopters
were identified in communities. For further validation, information given by key
informants was crossed-checked with other experienced persons in the same community.
Cross-checking of information given by key informant interviews is very important to
validate and gain further insights into the issues concerned (Mukherjee, 1997). The
adopters were divided into 2 sub-categories, (a) primary and (b) secondary adopters.
The non-adopters were divided into 3 sub-categories (a) farmers who had never tried
fish seed production-NT; (b) farmers who had initially adopted during the CARE
intervention/support and subsequently rejected it - IR; and (c) farmers who adopted and
continued for some years after withdrawal of CARE support but later rejected-LR (Table
6.1). Besides the male groups, two groups of women (household head’s spouses)
comprising 30 females in each group from both adopting and non-adopting households
were sampled to understand their views with respect to fish seed production and to
triangulate their views with the male groups.
This study was carried out in 10 communities in 4 districts of Northwest Bangladesh viz.
Rangpur and Kurigram (CARE Interfish area) and Thakurgaon and Dinajpur (CARE
Go-Interfish area). From each community 3 respondents from each sub-category were
sampled randomly to get a representative sample size of N = 30. However, 3 households
of IR and secondary adopters were not available in all communities. In order to make
sample size N=30 of each of these 2 categories, respondents were sampled from other
communities where they were available (Table 6.1). This study was conducted through a
questionnaire survey during May to July 2005. In the questionnaire both open-ended and

Chapter 6
278
structured questions were included (Appendix 5). According to the literature, this can be
termed as a semi-structured questionnaire interview, and is one of the major methods of
PRA comprising partly structured and mostly open-ended questions depending on the
responses of the person with whom the interview takes place (Mukherjee, 1997).
In the structured part of questionnaire, there was a ranking and scoring exercise method
in order to understand the technological preferences of farmers in and around the ricefish
plot. It can be noted that CARE basically promoted four types of technologies in and
around the riceplots which were low-input rice production, fish seed production, food
fish production and vegetable production on the riceplot dike.
In the other structured part of investigation, a checklist comprising farmer’s responses
was built-up to understand the reasons for adoption of this technology, which was
developed based on the preceding two years of field observations. The importance of
observation with development research has been stressed by many scientists and
practitioners. The value of observation in data collection method has been emphasised
by Simpson and Tuson (1995) who stressed that “there is almost no research strategy to
which data collection by observation cannot contribute”. Bowling (1997) also echoed
that systematic observation is a classic method of enquiry in natural science (farmer’s
experimentation, knowledge and values).
Prior to use in the survey, the questionnaire was tested with four households and
changed iteratively in the other communities to ensure appropriateness of the questions
with answers and for the complete understanding of field enumerators through
discussion between research fellow and assistants at the community level and revision in
the field office later on. The final version of the questionnaire that emerged incorporated
constructive feedback and suggestions given at different stages of modification by the
Chapter 6
279
research supervisor. In this regard Anderson (1998) stated that the success of
participatory research depends on the complementary strengths of the research team as a
whole.
Surveys were carried-out from the field office in Dinajpur with the assistance of
enumerators. As enumerators were native to the Northwest region (Chapter 2), their
good understanding of local term/language and socio-cultural factors were
complementary to this investigation. Appointing local villagers to work as technicians
was found to be a key feature for building strong community based ties in participatory
research (Biggs, 1989). It was not possible to appoint an enumerator from every
community due to a lack of competent people in each, and the inclusion of a large
number of communities over a wider geographical area. However, as the enumerators
had worked on the preceding studies for long time, they had built good relationships
with community households. According to the respondent groups presented in the Table
6.1, male and female respondents were surveyed separately by male and female
enumerators.

Chapter 6
280
Table 6.1: Categories of the households at the community level by adopters and non-adopters and their sample distribution
Basic categories of households
Sub-categories of households
Basic characteristics of sub-categories
Primary Adopters (30 households)
Farmers of CARE FFS who adopted fish seed production in the ricefield based systems and still practise it.
Adopters Secondary Adopters (30 households)
Farmers those learnt know-how from primary adopters and still practising. They were not CARE FFS members.
Never tried farmer (NT) (30 households)
Farmer within the same community but never tried to practise this technology. These farmers might be CARE members or not.
Initial rejecter (IT) (30 households)
Farmers who tried to fish seed production initially during CARE intervention/support period (FFS period-18 months) but rejected within the contact period
MA
LE
Non-adopters
Late rejecter (LR) (30 households)
Farmers who continued fish seed production for few years after CARE intervention/support period over but eventually rejected it.
Adopters Female of adopting household (30 households)
Females at the primary and secondary household level. They might be FFS members of not
FE
MA
LE
Non-adopters
Female of non-adopting households (30 households)
Female at the households where fish seed production was not adopted

Chapter 6
281
6.3.1 Data/information management and analysis
The collected information was entered into the Microsoft Access database in a
qualitative form according to the questionnaire. After entering, the information was
cross-checked with the questionnaire in the field office of Dinajpur with the help of field
assistants. In Microsoft Access, using the Query option, the respondent’s expressions of
the open-ended questions were generalised under different generic strata and then coded
for subsequent analyses. Descriptive statistics such as frequencies, percentages and
means were used for the data analysis. For pair-wise comparison of parameters between
adopters and non-adopters a post-hoc test was done using the GLM procedure.
Friedman’s test for analysis of variance by ranks (SPPS version 11.5) was used to asses
whether significant differences existed between technologies in and around the ricefields
with respect to farmers’ preferences. The test is a non-parametric equivalent of a single-
factor analysis of variance. Significant outcomes were followed up with pair-wise
comparisons using Wilcoxon’s signed-rank test. Finally the qualitative citations
corresponding to each technology were counted and tabulated to describe the reasons for
individual mean score and rank derived from statistical analysis. After analysis of data
some results were understood clearly from community level discussion with farming
households individually and in a group.
Chapter 6
282
6.4 Results
6.4.1 Adopting households: primary and secondary
6.4.1.1 General household characteristics of primary and secondary adopters
The basic data of primary and secondary adopting households shows the general
household characteristics, although no significant differences were found with respect to
any variable (Table 6.2). Although agriculture is the main occupation in both groups, it
was more dominant in primary (86.7%) than secondary (66.7%) households. In terms of
non-farm activities, secondary farmers concentrated more on business and service
whereas alongside these activities some primary farmers were involved in day labour
and van pulling activities. It was noted that more than 30% of secondary adopters
mentioned business and service as their main occupation. In the case of household
occupancy, secondary households were slightly larger than primary households which
might have acted as a facilitating factor to involve household members both in on-farm
(agriculture, ricefish etc.) and off-farm (business and service) activities. Secondary
household heads were more educated compared to primary households, which shows a
close relationship with more secondary adopters being in government (e.g. teachers in
primary schools) and non-government service (teaching in madrasa- equivalent to
secondary school teacher). In the case of land ownership between groups, there were
remarkable differences between the primary and secondary adopters. The average area
of own land of secondary adopters was greater than primary adopters who were more
dependent on leased-in and sharecropped land. The gross annual household income of
secondary farming households (US$2505.3±3855.1) was higher than for primary adopter
(US$2129.3±2741.0) which might be due to their involvement in off-farm activities such
as service and business. Overall the secondary farming households tended to be richer
than primary adopters in terms of occupations, education, annual income etc.

Chapter 6
283
Table 6.2: General household characteristics of primary and secondary adopters
Household characteristics Primary adopter Secondary adopter
Main occupation Agriculture 86.7%(26) 66.7% (20) Business 3.3% (1) 16.7% (5) Service 3.3%(1) 16.7% (5) Day labour 3.3% (1) Van puller 3.3% (1) Secondary occupation Business 6.7% (2) 16.7% (5) Day labour 6.7% (2) 6.7% (2) Others (agriculture, petty service, van puller etc.)
30.0% (9) 30.3% (10)
Not any 56.6% (17) 43.3% (13) Household occupancy Household size 5.5±1.8 5.6±2.4 No. of male 3.0±0.8 3.0±1.6 No. of female 2.5±1.4 2.6±1.4 Age distribution of household head Young age (=<30) 6.7% (2) 20.0% (6) Middle age (31-60) 80.0% (24) 80.0% (24) Old age (above 60) 13.3% (4) No. of other member in different age groups Age 1-14 1.1±0.8 1.2±1.28 Age 15-30 1.9±1.2 1.9±1.40 Age 31-60 1.5±1.1 1.3±1.30 Above 60 0.1±0.3 0.1±0.38
Education of household head Illiterate 33.3 (10) 20.0% (6) Primary 30.0% (9) 23.3% (7) Secondary 23.3% (7) 40.0% (12) Above secondary 13.3% (4) 16.7% (5) No. of other member in different education attaining groups Illiterate 1.1±0.8 1.4±1.5 Primary 1.1±0.9 1.4±1.1 Secondary 1.4±1.2 1.5±1.2 Above secondary 0.8±1.1 0.4±0.6 Land access (ha) Own 0.9±0.8 1.1±1.1 Leased in 0.1±0.5 0.03±0.1 Leased out Share in 0.02±0.06 0.01±0.1 Share out 0.01±0.04 Multi-owner 0.06±0.30 Mortgage in 0.03±0.1 Mortgage out 0.02±0.08 0.02±0.1 Total land access 1.1±0.75 1.24±1.12 Pond ownership (decimal) Own pond 13.2±15.8 16.97±22.2 Leased in Share in 1.6±8.8 Multiowner 11.4±32.6 4.23±9.6 Gross annual income (US$) 2129.3±2741.1 2505.3±3855.1
Figures in the parentheses indicate number (n); HH=household head

Chapter 6
284
6.4.1.2 Primary farmers’ perceived criteria to be involved in CARE-FFS
All primary adopters (100%) perceived that having a suitable riceplot was the most
important criterion for their involvement in fish seed production activities (Figure 6.2).
The second most important criterion was having personal interest in this technology
(73.3%), followed by access to a water pump (26.7%), higher social position (16.7%)
and having a pond (10%). Among the criteria prescribed by CARE when selecting
farming households were having a suitable riceplot and personal interest. The other
criteria recorded were not formal, however sometimes field trainers had to consider them
(e.g. water supply facility, social position etc.) to build up a farmer field school.
0% 20% 40% 60% 80% 100% 120%
Suitable riceplot
Personal interest
Having a pump
Social position
Having own pond
Percent of farmer
Figure 6.2: Farmer perception of criteria for involvement in RBFSP activities.
6.4.1.3 Acquiring knowledge on fish seed production by primary and secondary adopters
In the primary adopting households the majority of household heads (47%) solely
participated in FFS training programmes (Table 6.3). From 34% of households, both
husband and wife participated in the FFS training as CARE had a corresponding strategy
to form female FFS in the same community. The involvement of other household
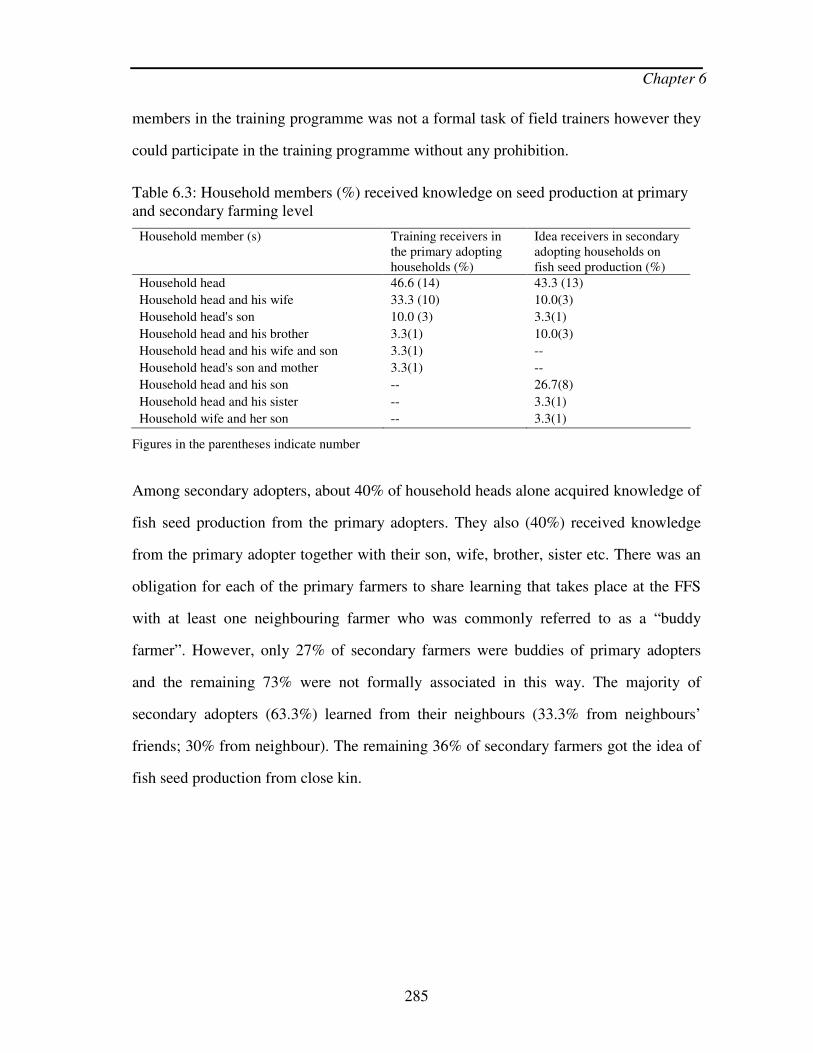
Chapter 6
285
members in the training programme was not a formal task of field trainers however they
could participate in the training programme without any prohibition.
Table 6.3: Household members (%) received knowledge on seed production at primary and secondary farming level
Household member (s) Training receivers in the primary adopting households (%)
Idea receivers in secondary adopting households on fish seed production (%)
Household head 46.6 (14) 43.3 (13)
Household head and his wife 33.3 (10) 10.0(3)
Household head's son 10.0 (3) 3.3(1)
Household head and his brother 3.3(1) 10.0(3)
Household head and his wife and son 3.3(1) --
Household head's son and mother 3.3(1) --
Household head and his son -- 26.7(8)
Household head and his sister -- 3.3(1)
Household wife and her son -- 3.3(1)
Figures in the parentheses indicate number
Among secondary adopters, about 40% of household heads alone acquired knowledge of
fish seed production from the primary adopters. They also (40%) received knowledge
from the primary adopter together with their son, wife, brother, sister etc. There was an
obligation for each of the primary farmers to share learning that takes place at the FFS
with at least one neighbouring farmer who was commonly referred to as a “buddy
farmer”. However, only 27% of secondary farmers were buddies of primary adopters
and the remaining 73% were not formally associated in this way. The majority of
secondary adopters (63.3%) learned from their neighbours (33.3% from neighbours’
friends; 30% from neighbour). The remaining 36% of secondary farmers got the idea of
fish seed production from close kin.
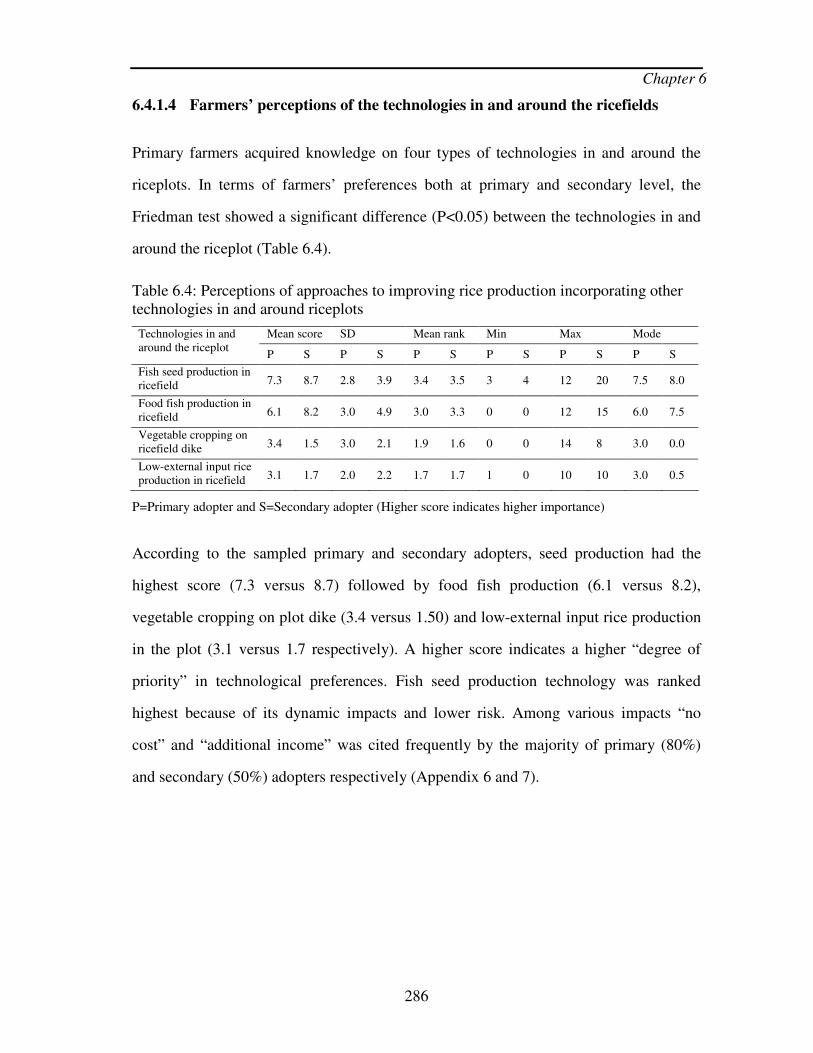
Chapter 6
286
6.4.1.4 Farmers’ perceptions of the technologies in and around the ricefields
Primary farmers acquired knowledge on four types of technologies in and around the
riceplots. In terms of farmers’ preferences both at primary and secondary level, the
Friedman test showed a significant difference (P<0.05) between the technologies in and
around the riceplot (Table 6.4).
Table 6.4: Perceptions of approaches to improving rice production incorporating other technologies in and around riceplots
Mean score SD Mean rank Min Max Mode Technologies in and around the riceplot
P S P S P S P S P S P S
Fish seed production in ricefield 7.3 8.7 2.8 3.9 3.4 3.5 3 4 12 20 7.5 8.0
Food fish production in ricefield 6.1 8.2 3.0 4.9 3.0 3.3 0 0 12 15 6.0 7.5
Vegetable cropping on ricefield dike 3.4 1.5 3.0 2.1 1.9 1.6 0 0 14 8 3.0 0.0
Low-external input rice production in ricefield 3.1 1.7 2.0 2.2 1.7 1.7 1 0 10 10 3.0 0.5
P=Primary adopter and S=Secondary adopter (Higher score indicates higher importance)
According to the sampled primary and secondary adopters, seed production had the
highest score (7.3 versus 8.7) followed by food fish production (6.1 versus 8.2),
vegetable cropping on plot dike (3.4 versus 1.50) and low-external input rice production
in the plot (3.1 versus 1.7 respectively). A higher score indicates a higher “degree of
priority” in technological preferences. Fish seed production technology was ranked
highest because of its dynamic impacts and lower risk. Among various impacts “no
cost” and “additional income” was cited frequently by the majority of primary (80%)
and secondary (50%) adopters respectively (Appendix 6 and 7).

Chapter 6
287
Table 6.5: Pair wise difference between the technologies in terms of scoring
Fish seed production in ricefield
Food fish production in ricefield
Vegetable cropping on ricefield dike
Technologies in and around the riceplot
P S P S P S
Food fish production in ricefield
NS NS
Vegetable cropping on ricefield dike
SG SG SG SG
Low-external input rice production in ricefield
SG SG SG SG NS NS
P=Primary adopter, S=Secondary adopter, NS=Non significant and SG=Significant
Similarly as per primary and secondary adopters, Wilcoxon’s test has indicated no
significant (P>0.05) difference between the fish seed and food fish production
technologies in the ricefield systems (Table 6.5). On the other hand both technologies
were significantly (P<0.05) more highly ranked compared to vegetable and low-input
rice production. Vegetable production on dike and low-input rice production resulted in
destructive effects of rats on ricefield dike integration and higher labour requirements
respectively.
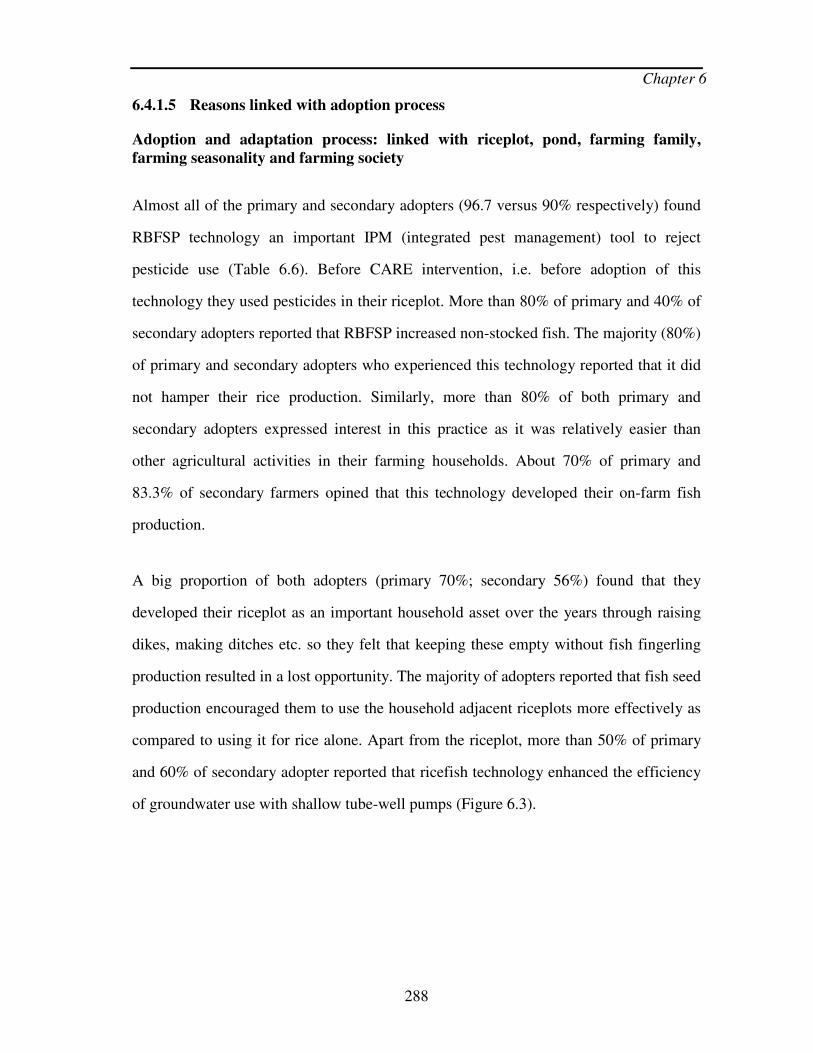
Chapter 6
288
6.4.1.5 Reasons linked with adoption process
Adoption and adaptation process: linked with riceplot, pond, farming family, farming seasonality and farming society
Almost all of the primary and secondary adopters (96.7 versus 90% respectively) found
RBFSP technology an important IPM (integrated pest management) tool to reject
pesticide use (Table 6.6). Before CARE intervention, i.e. before adoption of this
technology they used pesticides in their riceplot. More than 80% of primary and 40% of
secondary adopters reported that RBFSP increased non-stocked fish. The majority (80%)
of primary and secondary adopters who experienced this technology reported that it did
not hamper their rice production. Similarly, more than 80% of both primary and
secondary adopters expressed interest in this practice as it was relatively easier than
other agricultural activities in their farming households. About 70% of primary and
83.3% of secondary farmers opined that this technology developed their on-farm fish
production.
A big proportion of both adopters (primary 70%; secondary 56%) found that they
developed their riceplot as an important household asset over the years through raising
dikes, making ditches etc. so they felt that keeping these empty without fish fingerling
production resulted in a lost opportunity. The majority of adopters reported that fish seed
production encouraged them to use the household adjacent riceplots more effectively as
compared to using it for rice alone. Apart from the riceplot, more than 50% of primary
and 60% of secondary adopter reported that ricefish technology enhanced the efficiency
of groundwater use with shallow tube-well pumps (Figure 6.3).

Chapter 6
289
Figure 6.3: Location of irrigation pump and supply of water in ricefish plots.
The majority of adopters mentioned that the introduction of tilapia along with existing
common carp increased the total production of the riceplot in terms of seed, fingerling
and food fish. Moreover, above 30% of primary and 10% of secondary adopters reported
that fish seed plots improved production of boro rice seedlings as this could be located
in the ricefish plot’s ditch. Fingerlings produced from riceplots and subsequently
stocked to the household pond increased the pond production substantially; this was
experienced by more than 80% of both primary and secondary adopters. Women and
other household members were involved in RBFSP in 87% and 57% of primary and
secondary adopting households respectively. The majority of farming households
reported that fish seed and food fish production in their ricefish plots helped to meet
their subsistence demand for fish consumption. A remarkable number of adopters
perceived that this technology was particularly useful in regard to meeting consumption
needs when entertaining extended family and guests.
Chapter 6
290
Table 6.6: Adoption and adaptation linkage with riceplot, pond, farming family, farming seasonality and farming society
Percent of adopters Causal domains Causal effects
Primary Secondary
Rejection of the use of pesticides in seed producing riceplots
96.7 90.0
Increased abundance of non-stocked fish in ricefields-SRS 83.3 40.3
Fish seed production does not effect negatively rice production
83.3 83.3
Farmer’s affinity to this technology as it is easier than other agricultural activities
80.0 83.0
Riceplot has been developed as a threshold of fish production in households
70.0 83.3
Riceplot becomes developed asset 70.0 56.7
Effective use of riceplot 70.0 56.7
Strategic use of water pump 53.3 63.3
Introduction of tilapia increased total production in the riceplot
70.0 53.3
Riceplot ecology
Production of boro seedling in the riceplot ditch 30.3 10.0
Pond ecology Restocking to own pond that increased fish production 86.7 83.3
Compatible for absorbing available household labour such as men, women and children
86.7 56.7
Meeting the need of fish consumption of children 86.7 83.3
Meeting the need of women (household wife) to cook and feed fish herself and her family
83.3 70.0
Meeting the cumulative consumption demand of joint family having large number of members
40.0 36.7
Compatible for consumption of extended family where guests used to visit farming households frequently
40.0 16.7
Farming family
Meeting consumption demand of old aged person (farmer parents) in farmer’s family
26.7 53.7
Fish consumption during the lean season of fish during boro harvest while availability is very less both in nature and market
93.3 66.7
Income from fingerlings and its availability in the ricefields immediately after boro harvest reduces needs for distress sales of rice
70.0 57.0
Consumption and income of fish during low income month 66.7 53.3
Farming seasonality (vulnerability)
Easy to catch fish during wet season 50.0 43.3
Gifting seed and foodfish to relatives 45.0 55.0 Farming society
Gift seed and foodfish to neighbours 67.3 53.0

Chapter 6
291
Fish seed production in the ricefield based systems acted as a strategy for overcoming
the ‘fish scarce period’ namely ‘hungry gap of fish’ immediately after the boro harvest
as reported by both primary (93.3%) and secondary (66.7%) adopters. More than 50% of
adopters of both categories reported that during the boro harvesting time they could
avoid distress sales of rice to meet household expenditure and to avoid purchasing fish
from the market as they consumed fish from the ricefish plot. Fish seed production in the
ricefish plot enhanced fish consumption in the low income months for the majority of
households. Catching foodfish particularly tilapia by angling for household consumption
during the wet season was reported by 50% of primary and 43% secondary of adopters.
The majority of both primary and secondary adopters (67% versus 53%) gifted
seed/fingerling/foodfish to their relatives. Gifts were confined not only to relatives but
also to neighbours (45% primary versus 55% secondary adopters).
Adoption and adaptation process: linked with seed marketing channel
The majority (70%) of primary adopters sold seed to different customers such as pond
owners, fry traders and both fry traders and pond owners (Figure 6.4). However 25% of
adopters did not sell seed but rather used them for restocking their own pond and
riceplot to produce food fish. Overall 40% of the households sold their fingerlings to fry
traders.

Chapter 6
292
0%
10%
20%
30%
40%
50%
60%
Pond owner Fry trader Fry trader &
pond owner
Not sold
Perc
ent
of
farm
ers
Primary adopters
Secondary adopters
Figure 6.4: Number of adopters (%) sold fish seed through different channel.
About 50% of secondary adopters sold seed and the remaining 50% not at all. Out of
them, 20% sold to the fry traders and pond farmers and collectively about 35% of them
sold seed through fry traders. Figure 6.5 shows the majority of primary adopters sold
seed during the period of Boishak-Jaistha (April-May). On the other hand, the majority
of the secondary adopters (23%) sold seed in the period of Jaistha-Bhadra (May to
July). The delaying of fingerling sales by secondary adopters was due to their relative
better-off status than primary adopters.

Chapter 6
293
0%
5%
10%
15%
20%
25%
Apr-
May
May May-
Aug
Jun Mat-
Apr
Apr Jun-
Oct
Apr-Oct
Pe
rce
nt o
f ho
use
ho
lds
Primary adopters
Secondary adopters
Figure 6.5: Percent of adopters sold seed/fingerling in the different months.
In the primary adopting households, the money earned from selling seed was used
mostly for household expenditures such as shopping for food items from the local
market (Table 6.7). Twenty percent of adopting households used the money towards
their children’s education.
Table 6.7: Use of money derived from seed selling by primary and secondary adopters
Adopters (%) Uses of money
Primary (N=30) Secondary (N=30)
No use as not sold 27 53.3 Used in household expenditure (household shopping, purchasing clothing in ceremony etc.) 20 13
Used for child education expense 13 3.3
Invest in pond & household expenditure 10
Invest in agriculture 10 3.3
Invest in pond 6.7 3.3
Paying loan, household & agriculture expenses 3.3
Invest in agriculture & household 3.3
Invest in grocery shop 3.3
Saved in bank 3.3
Used to purchase land 13.3
Invested in riceplot development 3.3 Invested in business, household expenditure & bank saving 3.3
Invested in business and household expenditure 3.3

Chapter 6
294
Around 10% of secondary adopters used the money for household expenditures and 13
% for purchasing land.
Adaptation of RBFSP
Half of the primary adopters made significant changes to their systems over the period
of adoption. Thirty percent of adopters extended their plot area to increase production
and income from both seed and food fish. Some adopters (10%) increased the ditch area
in their plot to raise seed in the fallow period between the boro to amon seasons and to
ensure safety for both fingerlings and brood fish, particularly tilapia from the threat of
water crisis and theft. Moreover, changes in fry harvesting strategies were made by 10%
of adopters which included harvesting and selling of fry intermittently (3-4 times
observed at field level) to reduce the density and enhance the growth rate of fish. This
practice accelerated the production of fingerlings, attracted fry traders and resulted in
higher economic returns and better cash-flow. More than 60% of secondary adopters did
not carry-out any changes in their seed production systems. More than 20% extended
their riceplot to produce seed and food fish. In addition, about 3% of adopters shifted
fish seed production to other plots due to rat disturbance, 3% raised dikes to further
protect fish and 3% stocked additional carp fry.
More than 30% of primary adopters did not face any problems over the period of
adoption of fish seed production. However, about 70% of adopters faced different
challenges (Appendix 8), of which scarcity of broodfish was most important and
experienced by 26% adopters. Similarly, about 40% of secondary adopters (Appendix 9)
did not face any problem during seed production. The remaining 60% adopters faced
different types of problems, of which failure to collect common carp eggs due to
inconsistent spawning in household ponds was most important.

Chapter 6
295
6.4.2 Non-adopting households
6.4.2.1 General household characteristics of non-adopting households
The primary occupation of household heads in non-adopting households (NT, IR and
LR) was agriculture, however those household heads who had never tried (NT) fish seed
production were found to be more plurimodal. Activities included business (20%),
service (10%), day labour (7%) and van puller (3%). In the case of secondary
occupations, business, day labour, agriculture, petty service, van puller etc. were found
in the all three categories of non-adopting households. Other households’ characteristics
were more or less similar in all three categories of non-adopting households (Table 6.8).
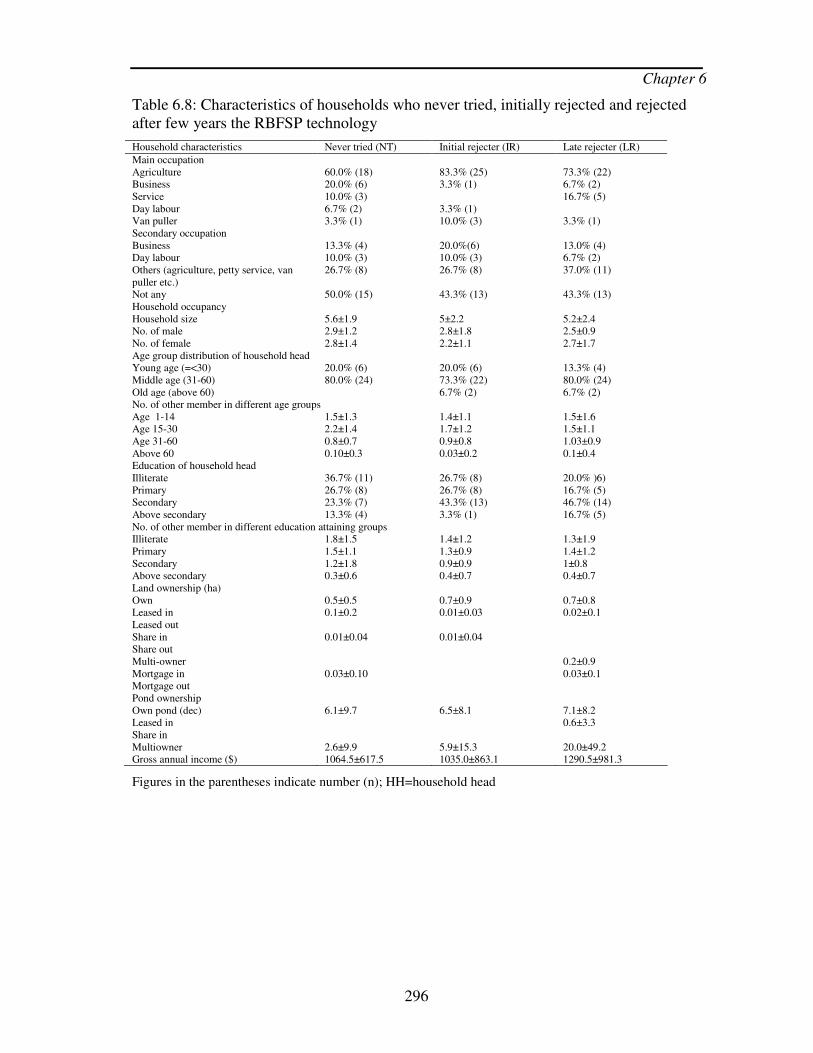
Chapter 6
296
Table 6.8: Characteristics of households who never tried, initially rejected and rejected after few years the RBFSP technology
Household characteristics Never tried (NT) Initial rejecter (IR) Late rejecter (LR)
Main occupation Agriculture 60.0% (18) 83.3% (25) 73.3% (22) Business 20.0% (6) 3.3% (1) 6.7% (2) Service 10.0% (3) 16.7% (5) Day labour 6.7% (2) 3.3% (1) Van puller 3.3% (1) 10.0% (3) 3.3% (1) Secondary occupation Business 13.3% (4) 20.0%(6) 13.0% (4) Day labour 10.0% (3) 10.0% (3) 6.7% (2) Others (agriculture, petty service, van puller etc.)
26.7% (8) 26.7% (8) 37.0% (11)
Not any 50.0% (15) 43.3% (13) 43.3% (13) Household occupancy Household size 5.6±1.9 5±2.2 5.2±2.4 No. of male 2.9±1.2 2.8±1.8 2.5±0.9 No. of female 2.8±1.4 2.2±1.1 2.7±1.7 Age group distribution of household head Young age (=<30) 20.0% (6) 20.0% (6) 13.3% (4) Middle age (31-60) 80.0% (24) 73.3% (22) 80.0% (24) Old age (above 60) 6.7% (2) 6.7% (2) No. of other member in different age groups Age 1-14 1.5±1.3 1.4±1.1 1.5±1.6 Age 15-30 2.2±1.4 1.7±1.2 1.5±1.1 Age 31-60 0.8±0.7 0.9±0.8 1.03±0.9 Above 60 0.10±0.3 0.03±0.2 0.1±0.4 Education of household head Illiterate 36.7% (11) 26.7% (8) 20.0% )6) Primary 26.7% (8) 26.7% (8) 16.7% (5) Secondary 23.3% (7) 43.3% (13) 46.7% (14) Above secondary 13.3% (4) 3.3% (1) 16.7% (5) No. of other member in different education attaining groups Illiterate 1.8±1.5 1.4±1.2 1.3±1.9 Primary 1.5±1.1 1.3±0.9 1.4±1.2 Secondary 1.2±1.8 0.9±0.9 1±0.8 Above secondary 0.3±0.6 0.4±0.7 0.4±0.7 Land ownership (ha) Own 0.5±0.5 0.7±0.9 0.7±0.8 Leased in 0.1±0.2 0.01±0.03 0.02±0.1 Leased out Share in 0.01±0.04 0.01±0.04 Share out Multi-owner 0.2±0.9 Mortgage in 0.03±0.10 0.03±0.1 Mortgage out Pond ownership Own pond (dec) 6.1±9.7 6.5±8.1 7.1±8.2 Leased in 0.6±3.3 Share in Multiowner 2.6±9.9 5.9±15.3 20.0±49.2 Gross annual income ($) 1064.5±617.5 1035.0±863.1 1290.5±981.3
Figures in the parentheses indicate number (n); HH=household head
Chapter 6
297
6.4.2.2 Perceptions regarding RBFSP technology
More than 60% of NTs knew about RBFSP from the primary adopters. Thirty percent of
respondents got the idea directly from CARE FFS members and 7% had no idea of fish
seed production in the rice fields. The majority (75%) knew at least about common carp
seed production techniques which they explained as the collection of common carp seed
during winter season from the pond using water hyacinth and stocking them into the
riceplot to produce fish seed and fish. The majority (73%) of IRs acquired knowledge of
fish seed production from CARE as direct participants. However as secondary adopters,
the remaining 27% of farmers achieved the idea of fish seed production from primary
adopters. Similarly, 83% of LRs acquired knowledge on fish seed production from
CARE as direct participants. Only 17% LRs acquired the idea from primary adopters as
secondary adopters. Among the LRs, around 75% farmers continued fish seed
production activities for 3-5 years, and the other 25% of farmers continued for a longer
period (6-14 years) before rejection of the technology.
6.4.2.3 Reasons for not adoption of rice field based fish seed production technology
Respondents (NTs) expressed different reasons responsible for never adopting RBFSP
activities. Out of the total respondents (N=30), 47% did not attempt seed production due
to lack of time; their perception was that it would conflict with off farm activities
(business, service, etc.); followed by having no suitable riceplot - 30%, having no own
land-17%, and the remaining due to the physical inability of the farmer (e.g. old aged,
disability to work, chronic disease, heart disease etc.); or being busy with agriculture
(on-farm) activities (Figure 6.6).

Chapter 6
298
0% 10% 20% 30% 40% 50%
Busy with on-farm activities
Physical inability of farmer
No own land
No suitable plot
Busy with off-farm activities
Changes plot tenure
Water supply problem
Flood due to heavy rainfall
No own source of egg collection
Percent of respondent
LR
IR
NT
Figure 6.6: Reasons for which respondents (%) did not adopt fish seed production in the rice field based systems.
More than 35% IRs rejected the technology initially citing that they were busy with off
farm activities like business, jobs etc. The reason “busy with the off-farm activities” has
different dynamisms which are disaggregated (Figure 6.7). About 26% farmers rejected
the technology due to changes of plot tenure and 20% rejected the practice because of
irregular water supply. Some IRs mentioned problems related to flood and failure in
collection of common carp eggs being responsible for rejection of technology.
The foremost important reason for LRs to reject the technology was due to changes in
land (riceplot) tenure reported by about 40% of respondents. The detailed causes of land
tenure changes in farming households are mentioned in Figure 6.7. The other causes for
rejection were water supply problems, followed by physical inability of the farmer and
conflicts with off-farm activities.

Chapter 6
299
Busy with non-farm activities (14)
• Busy with petty business (6)
• Busy with terracotta business (1)
• Busy with grocery shop in local market (1)
• Busy with activity of mason (1)
• Busy with food hotel in local market (1)
• Busy with service in teaching (2)
• Busy with service (1)
• Working in textile mill (1) No suitable riceplot (9) No own land (5) Physical inability due to old age (1) Busy with agricultural activities (1)
Changes land tenure (12) • Leased land taken back by main owner (4)
• Leased plot taken back main owner to lease out again to get more money (1)
• Shared plot taken back by main owner (3)
• Lease out land for money to invest in business (1)
• Separation of brother divide and made the plot unsuitable (2)
• Farmer made house on riceplot (1) Busy with non-farm activities (4)
• Busy with grocery shop in local market (1)
• Busy with hawking (1)
• Busy with profession of local doctor (2) Water supply problem (5)
• In sufficient water supply from other shallow pump (1)
• Insufficient water supply from shallow water (2)
• Insufficient water supply due to deep tube-well scheme failure (2)
Other reasons (9)
• Physical inability of farmer (5)
• Farmer busy with other agriculture activities (1)
• Flood due to heavy rainfall (3)
Busy with non-farm activities (11)
• Busy with grocery shop (2)
• Busy with fertilizer business (1)
• Busy with hawking business (1)
• Busy with petty business in local market (1)
• Busy with tea stall business (1)
• Busy with political leadership (1)
• Busy with vegetable business (1)
• Busy with mobile phone shop (1)
• Busy with job in NGO (1)
• Busy with profession of local doctor (1) Changes land tenure (8)
• Leased land taken back after seeing benefit from seed production (3)
• Leased out plot to get money for paying dowry (1)
• Plot sold for dowry (1)
• Land sold to deal with legal dispute (1)
• Family separation (1)
• Housing on plot (1) Physical inability of farmer (2)
• Farmer physically weak due to heart disease (1)
• Farmer got paralysed (1) Water supply problem (6)
• In sufficient water supply from other shallow pump (3)
• Insufficient water supply due to deep tube-well scheme failure (2)
• Insufficient water supply for shallow pump due to fall down of water level at the end of dry season (1)
Other reasons (3) • Farmer had not own source of egg collection (1)
• Flood due to heavy rainfall (2)
LR
Non –adoption of RBFSP
IR
NT
Figure 6.7: Diagram showing detail reasons for non-adoption of RBFSP; figures in parentheses indicate the number of respondent out of 30 in each group.
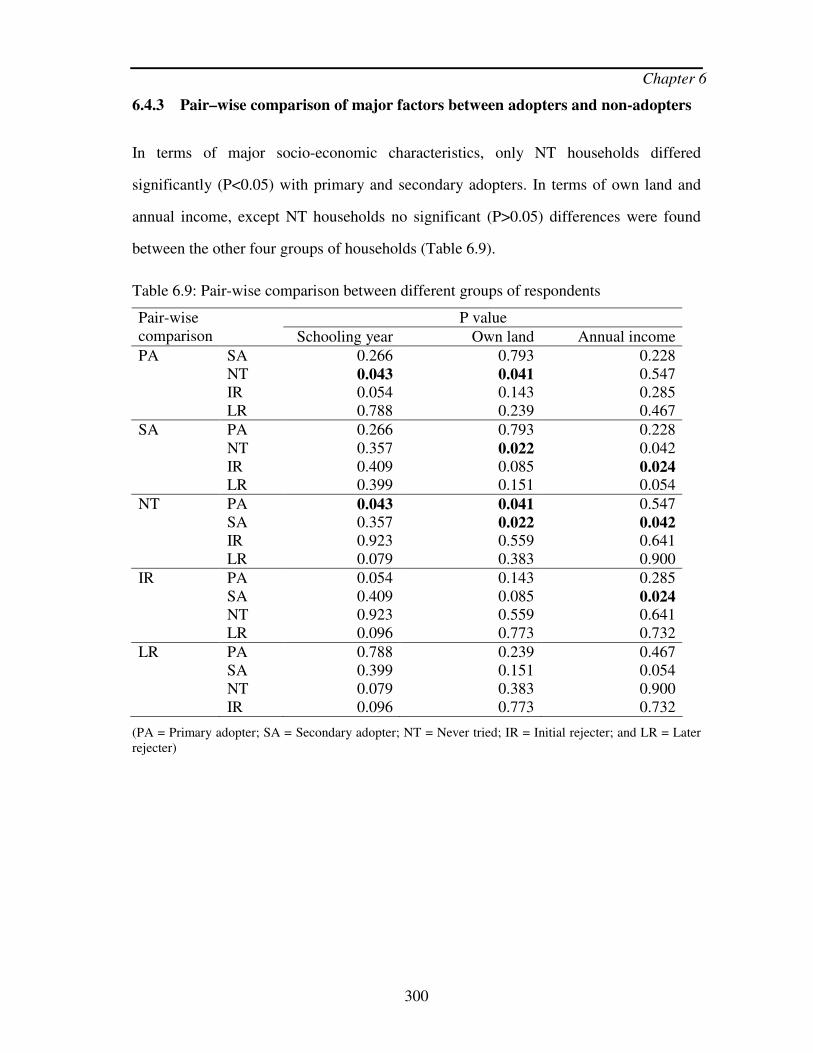
Chapter 6
300
6.4.3 Pair–wise comparison of major factors between adopters and non-adopters
In terms of major socio-economic characteristics, only NT households differed
significantly (P<0.05) with primary and secondary adopters. In terms of own land and
annual income, except NT households no significant (P>0.05) differences were found
between the other four groups of households (Table 6.9).
Table 6.9: Pair-wise comparison between different groups of respondents
P value Pair-wise comparison Schooling year Own land Annual income
PA SA 0.266 0.793 0.228 NT 0.043 0.041 0.547 IR 0.054 0.143 0.285 LR 0.788 0.239 0.467
SA PA 0.266 0.793 0.228 NT 0.357 0.022 0.042 IR 0.409 0.085 0.024 LR 0.399 0.151 0.054
NT PA 0.043 0.041 0.547 SA 0.357 0.022 0.042 IR 0.923 0.559 0.641 LR 0.079 0.383 0.900
IR PA 0.054 0.143 0.285 SA 0.409 0.085 0.024 NT 0.923 0.559 0.641 LR 0.096 0.773 0.732
LR PA 0.788 0.239 0.467 SA 0.399 0.151 0.054 NT 0.079 0.383 0.900 IR 0.096 0.773 0.732
(PA = Primary adopter; SA = Secondary adopter; NT = Never tried; IR = Initial rejecter; and LR = Later rejecter)

Chapter 6
301
6.4.4 Women in adopting households
6.4.4.1 Woman’s perception of fish seed production
The majority (70%) of women learned about RBFSP through CARE’s FFS training. The
remaining 30% were not members of the FFS, however among them 20% acquired the
knowledge from their husbands. Some females in adopting households also learned
these techniques from their neighbours (7%) and relatives (3%).
Amongst women in adopting households, there were multiple responses in terms of
knowledge gained with respect to fish seed production. A considerable proportion of
women (42%) knew how to produce common carp and tilapia seed/fingerlings in the
rice-fields. About 30% of women were familiar with common carp, tilapia and other fish
species. Moreover, about 80% were aware of techniques used to preserve common carp
and tilapia broodstock in the household pond for the next year’s seed production. They
considered this alongside the preservation of crop and vegetable seeds being analogous
with common carp and tilapia broodfish with respect to assured production of
fingerlings in the following year.
6.4.4.2 Roles of women in fish seed production activities
Women showed multiple responses in terms of their involvement in direct and indirect
activities of rice-field based fish seed production. More than 40% of women were
involved in direct activities including feeding fish and tending the ricefish plots (Table
6.10). Rice bran and by-products of rice from their households were used for feeding
fingerlings rather than purchased feed. Most women (60%) took part in the collection of
broodfish and eggs from the pond using water hyacinth for stocking into the riceplots.
Regarding indirect activities, more than 50% of women interviewed looked after their
riceplots with the help of their children. Indirectly they also maintained plots by
informing their husbands of riceplot conditions such as water level, ditch and dike

Chapter 6
302
condition, fish condition etc. Over 80% women in adopting households reported that
their participation in fish seed production activities did not affect other household
activities.
Table 6.10: Women involved in different fish seed production activities
Type Activity Percent
Feeding and looking after fish 43.3 Collection-stocking eggs, feeding and looking after fish 33.3 Collection-stocking eggs and looking after fish 10.0 Collection-stocking eggs and feeding fish 6.7
Direct activities
Collection-stocking eggs 6.7
Sent her child for looking after the plot 56.7 Informed husband plot condition to take the necessary measure 36.7
Indirect activities
Send her son to inform fry trader 6.7
6.4.4.3 Women roles in seed selling and use of earnings
The present study demonstrates the active participation of women in rice-field based fish
seed production and their share in decision making for fish seed production. More than
50% of women interviewed reported that they actively participated in the selling of seed
with their husbands (Figure 6.8).
0% 10% 20% 30% 40% 50% 60%
My husband shared
decis ions regarding
seed selling with me
Not involved in seed
sales
My husband took the
decis ion in seed
selling
I took decis ion to
sell seed
Percent of women
Figure 6.8: Percent of women making decisions regarding seed sales.

Chapter 6
303
In terms of using money gained from seed sales, 30% of women used all of the money
for household expenditures which were directly related to their own activities. These
included purchasing clothing (shari), cooking utensils and others purposes (Table 6.11).
In addition, 10 % of women used a proportion of earnings from sales of seed after
receiving from their husbands. Women revealed that the access to decision making that
was afforded to them through seed sales was positive for them and their children.
Table 6.11: Primary income use from seed selling by household members
Used of money by household member Percent of women
I used money for household expenses 30.0 My husband used the money 30.0 My husband tended to keep the money from which I used for my expenses
10.0
I keep the money, from which my husband used for his expenses 6.7 Seed were not sold 23.3
6.4.4.4 Gifting fingerlings/food fish to relatives and neighbours
The present study shows that household women played a major role in the gifting of fish
seed to their relatives. Figure 6.9 shows that women gifted fingerlings and food fish to
different types of relatives almost all of whom were natal family members.

Chapter 6
304
Not gif ted
Daughter
Husband's sister Sister
Father
Sister and
daughter
Daughter and
brother
Daughter and
sister
Father and
brother
Father and
daughter
Mother
Nephew ’s Sister and
nephew ’s Sister and aunt’s
Figure 6.9: Percent of women gifting fingerlings to different relatives and neighbours.
Approximately 64% of women gifted food fish to their neighbours. In return,
neighbours often gifted fruits, vegetables etc. or helped to catch fish from the riceplot
and protected the area from poachers. Gifting anything like seed/foodfish to neighbours
strengthened social relationships.
6.4.5 Women in non adopting households
6.4.5.1 Awareness of ricefish and RBFSP
About 90% women in the non-adopting households had the idea of fish production
activities in ricefields. Similarly about 90% of women were aware of fish seed
production in the ricefield based systems. Knowledge of these activities was gained in
different ways, one of which was through membership of a CARE FFS. While the
remainder learned about it from their husbands, neighbours etc.
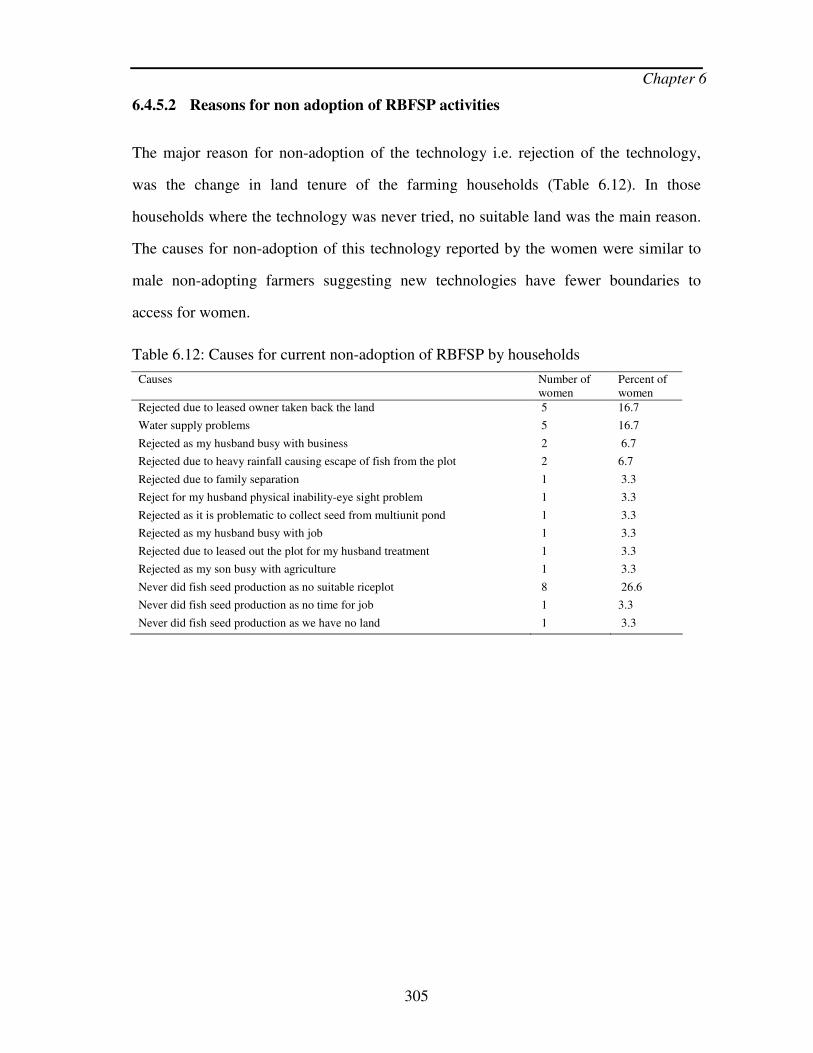
Chapter 6
305
6.4.5.2 Reasons for non adoption of RBFSP activities
The major reason for non-adoption of the technology i.e. rejection of the technology,
was the change in land tenure of the farming households (Table 6.12). In those
households where the technology was never tried, no suitable land was the main reason.
The causes for non-adoption of this technology reported by the women were similar to
male non-adopting farmers suggesting new technologies have fewer boundaries to
access for women.
Table 6.12: Causes for current non-adoption of RBFSP by households
Causes Number of women
Percent of women
Rejected due to leased owner taken back the land 5 16.7
Water supply problems 5 16.7
Rejected as my husband busy with business 2 6.7
Rejected due to heavy rainfall causing escape of fish from the plot 2 6.7
Rejected due to family separation 1 3.3
Reject for my husband physical inability-eye sight problem 1 3.3
Rejected as it is problematic to collect seed from multiunit pond 1 3.3
Rejected as my husband busy with job 1 3.3
Rejected due to leased out the plot for my husband treatment 1 3.3
Rejected as my son busy with agriculture 1 3.3
Never did fish seed production as no suitable riceplot 8 26.6
Never did fish seed production as no time for job 1 3.3
Never did fish seed production as we have no land 1 3.3

Chapter 6
306
6.5 Discussion
6.5.1 Adopting households
Basic characteristics of primary and secondary households
Although agriculture was found to be the main occupation of both primary and
secondary adopters it was relatively more important among primary adopting
households. Primary adopters were poorer than secondary adopters in terms of some
basic socio-economic characteristics such as education attainment, land ownership and
annual income. In this context of rice-based livelihoods and relatively poor wellbeing,
on-farm diversification (Ellis, 2000) through incorporation of fingerling production in
ricefields contributes to the adoption process. Although at a non-significant level, a
greater proportion of secondary adopters were involved in non-farm activities such as
business and service. While there was a difference of livelihood strategies between
primary and secondary households, adoption of RBFSP suggests compatibility of this
technology to their existing livelihoods. Sen (2003) argued that poverty escapees
overcome structural obstacles by pursuing multiple strategies (such as crop
intensification, agricultural diversification, off-farm activity, livelihood migration etc.)
which then permits them to accumulate a mix of assets relatively rapidly.
Knowledge on technology
The majority (two thirds) of secondary adopters were not buddies of primary adopters
although they were supposed to be by the second season training of FFS. The FFS
system encourages wide dissemination of knowledge through farmer to farmer
communication and there was a reliance on the trained participants to pass along all that
s/he has learnt to the others. In this study, primary farmers perhaps selected nominal
buddies as an obligatory task in FFS training sessions who were not appropriate
potential adopters of RBFSP. However, some farmers shared their interest and who had

Chapter 6
307
suitable riceplots learned this technology as secondary adopters without being buddies
with primary adopters. In previous CARE studies evidence showed there was a
significant loss and change of quality of the information as it passed from one person to
another in the field (Debashish et al. 1999). In agricultural extension, the FFS approach
is being implemented in many developing countries in Asia and Africa however, this
approach does not result in significant farmer uptake (Quizon et al. 2001). It was
anticipated that FFS graduates would retain and disseminate their FFS-acquired
knowledge and experiences making FFS a cost-effective and viable approach to
agricultural extension on a large scale. Impact analysis has shown very little diffusion of
FFS-acquired knowledge from FFS participants to other community members in the
Philippines; participants tended to retain their acquired knowledge which made the
approach less cost-effective (Rola et al. 2001). Feder et al. (2003) reported that FFS did
not have a significant impact on either the participants or their neighbours in terms of
rice farming in Indonesia.
Secondary adopters developed systems themselves after receiving knowledge from their
neighbours through observation season after season in the ricefish plot of primary
adopters. Traditionally in rural areas, it was revealed in previous studies (Hoque, 1972;
Latif, 1974) that neighbours and friends were the major sources of information. Such
informal networks were revealed in the fingerling trading network in Asia through
which pond farmers purchased fingerlings from fry traders (Barman et al. 2002). In
another study it was argued that interpersonal communicational media such as friends
and neighbours were found to be the main source of new agricultural innovations
(Kashem and Halim, 1990). In rural areas having a look at someone’s ricefish plot is not
a formal matter or restricted which has shown a adoption attribute to ‘observability’
(Rogers, 1995b). It is quite usual that some technological knowledge can be acquired by

Chapter 6
308
osmosis i.e. by observation over time, technological benefits can move horizontally in
communities (Basu et al. 2001).
About one third of secondary adopters received knowledge from their kinship group
(Bongsho) which is a very strong network in rural areas of Bangladesh. Kinship and
relatives have long been understood to be the major and most trustworthy source of
agriculture innovation information in Bangladeshi society (Hoque, 1972; Latif, 1974;
Kashem and Halim, 1990). Another study also suggests that kinship is the chief resource
for creating a support and security network among the rural people of Bangladesh
(Nazneen, 2004). Beyond kin, many secondary adopters were the neighbours of primary
adopters indicating the importance of informal social networks among farming
households through which knowledge dissemination occurrs (CARE, 1998).
Among the technologies in and around the ricefish plot, RBFSP was ranked highest by
the respondents based on its lack of financial investment by primary adopters and for its
role in additional income generation by secondary adopters. This finding supports the
assessments that primary adopters are investment averse through poverty but that
secondary adopters seek to additional income and are slightly better resourced. Primary
adopters saw this as an opportunity to diversify out of need whereas a smaller proportion
of secondary adopters saw it as a way to diversify to capitalize. Such attitudes of
secondary adopters are likely to indicate that they have sought opportunities for
entrepreneurship based on RBFSP. This smaller proportion of entrepreneurs could
leverage broader development involving fry traders, pond fish producers and other
actors in decentralised seed networks. In this connection, a previous study argued that
uniform adoption in agriculture did not occur and in most cases adoption behaviour
differs across socio-economic groups over time (Feder et al. 1985) ranging from
Chapter 6
309
subsistence to entrepreneurial households. Further research could be undertaken for
entrepreneurial development RBFSP among the rural farmers.
In terms of pair-wise comparison of fish seed and food fish production no significant
differences were found for either primary or secondary adopters. Similarity in the
preference for the two technologies was due to the success of food fish production
greatly depending on seed production in ricefields. The season for foodfish production in
ricefields is very short and the predation may be very high because of difficulties in
excluding all predators (FAO/ICLARM/IIRR, 2001) from extensive areas of ricefields –
where availability of large sized fingerlings in relatively small quantities at the critical
time is therefore very important. This confirms the widespread assertion that the
unavailability of fish seed is a major constraint of ricefish promotion in Asia (Waibel,
1992; Little et al. 1996; Gupta et al. 1996; Halwart, 1998; Edwards, 1999b).
Fish seed production, was ranked by respondents significantly higher than vegetable and
low-input rice production technologies probably due to the greater positive impacts of
RBFSP technology compared to other risks and disadvantageous factors are considered.
Vegetable production on the riceplot dike attracted rats that burrow causing destruction
of the dike which then required large scale repair every year. The basic components of
low external input rice production were line transplantation of rice seedlings, use of
organic fertilizers and application of integrated pest management systems. The lower
score of low external input rice production and the significant difference when compared
with other technologies was caused by the need for additional labour to these activities
and negative attitudes of labourers. Line transplantation was reported to reduce the
requirement of seedlings but increase the requirement for labour to carry out weeding
(CARE, 1998). At least two additional people are needed for this practice. It becomes
difficult in poor and marginal households as they typically transplant rice seedlings
Chapter 6
310
without hired labour. A recent study carried out in Madagascar showed that line
transplantation of rice is significantly more labour intensive than traditional
transplantation of rice (Moser and Barrett, 2006). Additionally, the negative attitude of
labourers to line transplantation relates to the need for outward movement within
ricefields. In many countries some low external input technologies were not adopted by
the farmers due to high labour requirement (Tripp, 2006a). The use of organic fertilizers
can reduce rice production costs but farmers lack enough means to use it over the whole
cycle of rice production due to its scarcity. Because of these limitations low-input rice
production resulted in an incomplete adoption in farming households.
Reasons for adoption related to riceplot, pond, family, seasonality and society
Almost all farmers, whether or not they were primary or secondary adopters had
established fish seed production technology as an important IPM tool and given up the
use of pesticides. It has been well verified from different empirical studies that presence
of fish in the ricefields reduces the need for the use of pesticides (Kamp and Gregory,
1993; Halwart and Gupta, 2004).
Using riceplots for fish seed production stimulated a substantial increase in non-stocked
fish. Halwart (2004) reported that since ricefish farming reduces the need to use
chemicals for pest control, this assists in preserving rice-field biota where non-stocked
fish and other aquatic animals are important. Little et al. (1996) reported that wild fish
are important agents in the control of pests in rainfed ricefields in Northeast Thailand.
Better water control in seed producing riceplots coupled with increased non-stocked fish
eating pests contributed to giving up pesticide use (Biswas, 2007). However,
discrimination was observed between the primary and secondary adopters in this regard,
i.e. primary adopters perceived the value of increased non-stocked fish more than
secondary ones. The causes behind the discrimination were investigated qualitatively at

Chapter 6
311
the field level which revealed that primary adopters emphasised the development of
riceplots for non-stocked fish also. During the rainy season they set a unidirectional
valve across the plot dike to allow the fish to enter. This knowledge developed from the
CARE FFS training while farmers were trained about the development of their ricefish
plot ecology through increasing non-stocked fish production. During FFS training in the
CARE Go-Interfish project, farmers were encouraged to stock broodfish of self
recruiting species (SRS). Discussion with a number of secondary adopters revealed that
they had not facilitated SRS production in ricefields. Due to their increased access to
ponds and knowledge of conventional pond aquaculture they perceived that external fish
may result in lower production of fish fingerlings and fish. A recent farmer participatory
research revealed that avoidance of negative action on SRS in conventional carp
polyculture in pond is important for better management SRS productivity (Islam, 2007).
Systematic knowledge on fish management in ricefields is lacking at the farmer level,
but it is crucial to understand their role in this ecosystem as well as their potential as bio-
control agents of rice-pests (Halwart et al. 1996).
The majority of the adopters reported that adoption of this technology did not hamper
their rice production. Long term studies suggest that rice yields from modern
monocultures are not practically sustainable (Pingali et al. 1990) and the negative
environmental impacts of intensive fertilisation and pesticide uses are now better
understood whereas the advantages of encouraging mutualism between rice and fish by
which they benefit (e.g fish consume pests and rice plant intake faeces of fish as
fertilizer) is clear (Halwart and Gupta, 2004). As a result, introduction of fish in the rice-
field can increase rice production (Lightfoot et al. 1992; Kamp and Gregory, 1993;
Akteruzzaman et al. 1993; Halwart and Gupta, 2004). This organic farming leads to
improved soil quality in more marginal agro-ecosystems (Pretty et al. 2003). There are
now growing signs that the rice-centric phase of agricultural/rural development is fast

Chapter 6
312
approaching its limit (Sen, 2003). Broad based agricultural growth will continue to play
an important role in rural poverty reduction, but its quantitative impact on poverty
reduction would be contingent on diversifying to high value added crops and the poultry,
livestock and fishery sub-sectors (Sen, 2003).
Many adopting farmers were interested in practicing RBFSP because of its perceived
simplicity; the relative multiplicity of benefits possible and its low technical risks.
Halwart (1999) termed ricefish as a “lower risk” production technology which can
motivate even poorer farming households. Ideally, ‘relative advantage’ is the degree to
which an innovation is perceived as being better than the idea it supersedes (Levine and
Fowler, 1995; Rogers, 1995a; Rogers, 1995b; Agarwal, 2000). It is an important factor
in adoption of any technology not only in agriculture but also in other fields of
innovation (Rogers, 1995a; Davis et al. 1989; Iivari, 1996; Kishore, 1999).
It addition RBFSP has also increased overall on-farm production achieved by the
majority of both primary and secondary adopters. A large proportion of adopters
mentioned that developing a riceplot through dike raising, digging a ditch etc. was an
important investment made by the household over time. Not stocking and no production
of fish fingerlings therefore imposed an opportunity cost. Improvement in such physical
and human asset as modified ricefields for RBFSP has been identified as important
factors influencing the escape from poverty (Sen, 2003).
Fish seed production encouraged adopting farmers to effectively use riceplots adjacent
to their households. Typically such plots were less productive due to shadowing by big
trees and bamboo bushes. Disturbance by their own and neighbours livestock resulted in
reduced rice production, particularly during the amon season. Through the introduction
of fish seed production activities, adopters often converted the shaded part of their

Chapter 6
313
riceplot into a ditch, and the availability of water in the ditch discouraged poultry/cattle
birds to enter the plot, household members also paid extra care to the plot; all together
these changes made the plot more productive than others.
Ground water irrigation became widely available after the mid 1980’s due to a series of
changes in irrigation policy in Bangladesh. As a result, although the price of deep tube-
wells increased, cheaper shallow tube-wells entered the ground water market
dramatically expanding the area under irrigation. Consequently the ground water market
has been transformed from a monopolistic situation to an ologopolistic structure after the
introduction of shallow tubewells (Al-Mamun et al. 2003). In the present study, some
adopters had shallow pumps or boreholes adjacent to their riceplots or household
premises, from where water passed to their plots as well as their neighbours, increasing
the availability of water through uncontrolled leakage across the earthen drain into
ricefish plots and facilitated adopting farmers to manage their plots with little or no
irrigation cost. Those farmers, particularly the poorer having no ability to purchase
pumping machines tended to have boreholes adjacent to their riceplots. Some adopters
with water pumps also rented them to poorer adopters thus benefiting each other. The
use of shallow tube-wells in the rural areas has improved the socio-economic condition
of rural people substantially (Mondal and Saleh, 2003).
Introducing tilapia along with the existing common carp increased total fingerling
production in ricefields (Barman et al. 2004). Relatively higher solar radiation during the
boro season (March) contributed to increased phytoplankton availability and therefore
greater production of fish in ricefields (Halwart et al. 1996). At the early developmental
state, tilapia (Orechromis niloticus) gradually change from their predominantly
omnivorous feeding habit to herbivorous growing faster into large sized fingerlings
(Trewavas, 1983). Stocking such on-farm produced large sized fingerlings enhanced

Chapter 6
314
pond production significantly (Chapter 3 and 5) (Barman, 2000) contributing to the
adoption process, thus the demand of large size fingerling has been a key factor for
aquaculture success (Little et al. 2005).
Rice-field based fish seed production absorbed household labour through the
involvement of men, women and children. Labour employment is an important indicator
of aquaculture’s contribution to poverty reduction in developing country agriculture,
where labour supply is still abundant (Ahmed and Lorica, 2002). Total labour inputs
were higher in the poorer primary adopting households compared to secondary adopters.
Culturally, women from the richer households in rural areas were less likely to work
outside the household as it is related to prestige of a family (Kabeer, 1997). In the
present study, the involvement of family members in seed production activities occurred
more in primary adopting households than among the secondary adopters suggesting
their relative poverty. Small-scale adopters have been observed to use family labour
intensively to the point of self exploitation, because it is seen to have close to zero
opportunity cost and in doing so avoids the supervision constraint of managing hired
labour (Ellis and Biggs, 2001). Family labour is by far the most important production
factor in the agrarian sector of developing countries and maintenance and enhancement
of labour productivity is central to securing and increasing income (World Bank, 1986;
Zeller and Sharma, 1998).
Fish production in the ricefield played a notable role in meeting the demand for fish of
different household members such as children, women and old aged persons.
Particularly in terms of intra-household distribution of fish and meat, different members
were evaluated differently at the household level as they can catch the small fish of low
marketable value on a regular basis. Previous studies recognised that intra-household
distribution of food discriminates against women and young children, and that in most

Chapter 6
315
developing countries, this discrimination increases at times of shortage (Schofield, 1974;
Safilios-Rothschild, 1980). Dowlah (2002) proposed that Bangladeshi people, especially
women and children, suffer from some of the highest under-nutrition and malnutrition
levels in the world. The literature also suggests that foodfish supply per capita declined
steadily in Bangladesh as well as other developing countries in the period between from
1961 to 1990. Similarly, overall annual protein supply per capita has been falling
suggesting that fish has not been replaced with other animal protein (Kent, 1997). He
also reported that while fish production has increased across the world and overall
national per capita consumption level may have gone up there may have been no
corresponding increase in consumption by the poor.
The elderly population is increasing day by day and presently they comprise around 6%
of the total population in Bangladesh (Kabir, 2003). In rural villages the primary source
of support for elderly people is still the family, especially the sons, who are expected to
support their elderly parents (Kabir et al. 2002). Good quality food stuffs that includes
fish, meat, eggs and milk has been recognized for both promotion of health and
prevention of diseases in elderly people (Nilsson et al. 2005). In the present study on-
farm fish production contributed to adoption process of RBFSP providing foodfish for
elderly people in farming households. Intra-household discrimination at the individual
level, lower per capita protein consumption, and special needs of elderly people at the
household level appeared to have been positive expectations of RBFSP that triggered the
household to adopt this technology.
Fish seed production in ricefield based systems acted as a strategy for overcoming the
“hungry gap” of fish which had been identified during the longitudinal observation
(Chapter 4). Just before and during the boro harvest (mid March to April), fish prices in
the market peak due to lower availability and the natural production of fish begins.

Chapter 6
316
Furthermore, at that time adopters are used to having little ready cash as all available
money has been invested in the boro cultivation hence they cannot afford to purchase
fish, and consumption of fish from their own plot attains a particular importance. In
addition, the market price of rice can decline rapidly at this time and ‘distress sales’ of
rice soon after the harvest are common (CARE, 1998). The adopting households
reported that their need for such distress sales to purchase foodfish from the market for
consumption had declined.
During the rainy season the household ponds fill with water and as are typically deep,
impeding the harvest of fish. Fingerling production in shallow ricefields were a time
efficient way for the adopters to catch food fish ‘particularly tilapia’ by angling for
household consumption. It was observed at the field level that the elderly and children
enjoyed angling in the ricefield to catch larger sized tilapia and so the practice was
recreational as well. In rural Bangladesh people have a common social custom as well as
social obligation to feed guests (mehman) with meat and fish (Larance, 1998). In remote
villages it becomes difficult for the host to secure meat and fish instantly as their
availability depends on specific days (hatbar) of the local market (bazar). Catching fish
from the riceplot reduces reliance on the market and assist adopters in meeting such
social expectations.
Some adopters also benefited from using nutrient rich sediments from in the deeper
ditches in modified riceplots for production of boro rice seedlings and this resulted in
production of healthy rice seedlings without the use of external fertilizers. Thus making
a ditch inside the riceplot appears complimentary to both production of fish seed and
rice an important observable indicator of the adoption process.

Chapter 6
317
Both primary and secondary adopters gifted fish to their relatives as fingerlings, foodfish
and brood fish. The major relatives of the adopters include brother, daughter, sister
(married in other localities), and father-in-law (shashur). This sort of gifting to relatives
appears to strengthen kinship links in rural areas. In return, the producing household
receives higher esteem and reciprocity of food items such as vegetables and fruits.
Adopting farmers also mentioned that gifting fish to their relatives from their own plot
made them feel happy and proud. They also gifted to their neighbours and it was found
that some adopters gifted tilapia broodfish to their neighbours when they lacked at the
time of stocking. Some adopters reported that this type of gifting improved relationship
with neighbours. Adopting farmers also stated that as fish were produced in the ricefield
in abundance, their neighbours had a social right to a share. Neighbours often helped in
harvesting fish from the riceplot which become an enjoyable social event. Gifting
something to others is one of the important parts of social custom and obligation in rural
areas of Bangladesh (Larance, 1998; Nazneen, 2004). In addition, studies have also
revealed that sending gifts to relatives and neighbours strengthens social links (White,
1992; Mallorie, 2003). Household level fish seed production therefore supported these
traditional practices being another element in strengthening social position and
sustaining better relationship and network with relatives and friends.
Marketing channel of fish seed/fingerling
The sale of fish seed to local pond owners resulted in immediate access to the quality
seed network at the community level. Selling seed through the fry trader channels
diversified market transactions and impact of seed to other people in the same and other
localities. Market transactions influenced distributional outcomes probably to a greater
extent than technological innovations in production in comparison with conventional
agrarian reform (Lewis et al. 1996). Evidence in the literature suggested that agricultural
growth was attributed to few important protagonists where one of them was market

Chapter 6
318
transaction (Harriss, 1993). Thus RBFSP encouraged livelihood diversification in a
broader context involving not only farming households but also poorer fry traders in the
same or different localities (Chapter 5). In this regard, Ellis (2000) echoed that diverse
livelihoods are less vulnerable than undiversified ones.
Primary adopters tended to market their fingerlings earlier than secondary adopters. This
suggests that primary adopters developed a fingerling marketing strategy by which they
earned income at the stage of early fingerling demand. Moreover as they were relatively
poor, early cash income from fingerling sale was very important for them. On the
contrary, the secondary adopters tended to sell fingerlings later than primary adopters
possibly due to their reduced need for money as they were better-off.
In the primary adopting households, money earned from selling seed was mostly used
for household level expenditure including purchasing food items and managing expenses
for the children’s education. Secondary adopters tended to use the money for household
expenditure as well as for land purchase. RBFSP therefore contributes to the livelihood
strategy of households in different ways – for poorer primary adopters helping with day
to day food security and for the better-off secondary adopters supporting asset
accumulation.
Adaptation of RBFSP by the adopters
Primary adopters tended to adopt the design and management of their riceplots in
different ways after the initial year of adoption. This sort of behaviour might be achieved
from FFS training which could be termed as ‘trialability’ of an innovation (Rogers,
1995b). Trialability is the degree to which an innovation may be experimented with on a
limited basis suggesting what primary adopters trialled for RBFSP was within their
limited riceplot resources. However, RBFSP holds ‘relative advantage’ (Rogers, 1995a)
Chapter 6
319
in terms of ‘trialability’ as it does not require large scale installation (e.g. such as poultry
farm that requires selective space, fixed shed, feeding accessories, electricity for
temperature management etc.) rather moving limited amounts of soil for extending
riceplots and ditches. Many primary adopters extended their plot area to increase
production and income from both seed and food fish. They also extended the ditch area
of their riceplots to improve the safety of seed and broodfish particularly tilapia from the
threat of water scarcity and theft. Moreover, changes were also carried out during the fry
harvesting time, which included harvest and sale of fry over a prolonged period through
a number of harvests. The resultant lower densities were reported to increase individual
growth rate. Moreover this practice accelerated production of fingerlings as well as their
availability and this probably helped to attract fry traders and resulted in a higher
economic return. This learning of primary adopters could be reported as the
accumulation of human capital; improving their livelihood strategy to meet the need for
cash. Accumulation of such human capital could possibly be explained through the
fostering FFS - created relationships among primary adopters (Banu and Bode, 2002) as
well their better relationships with fry traders.
The major change among secondary adopters was the extension of riceplots to produce
fingerlings and foodfish. Bringing changes to an innovation over time has been termed
as ‘modifiability’ (Glantz et al. 1997). It is the degree to which the innovation can be
updated over time. There is growing support in the research literature for the importance
of modifiability as an attribute for adopting an innovation (Glantz et al. 1997;
Blumenthal, 2001). Ideally, modifiability of an innovation strengthens the adoption
process. Overall changes carried out by primary adopters were more diverse than by
secondary adopters. This might suggest more innovative behaviour of primary adopters
which could be explained by the influence of FFS training and explorative behaviour to
enhance their livelihood strategy due to relative poverty. On the contrary, the extension

Chapter 6
320
of riceplots by better-off secondary adopters suggests the greater likelihood of them to
become entrepreneurs in decentralised seed networks in terms of more commercially
oriented production, enhancing the involvement of a wider range of actors/beneficiaries
such as fry traders and foodfish traders.
Scarcity of broodfish particularly improved Nile tilapia was the major problem facing
households adopting RBFSP. Broodfish escape from the riceplot during heavy rainfall
and poaching were problems. The problem of broodfish escape was mitigated by one
adopter through rising dikes but that was too costly for most adopters. The collection of
broodfish from neighbours and enhancing care of the riceplot at night were used to
improve the protection of broodfish in the riceplot ditch.
Failure to collect common carp eggs from household ponds was also identified as a
problem for primary adopters and reported as the main problem in the case of secondary
adopters. Collection of common carp eggs in the winter season was sometimes irregular
as adopters strongly believed that the breeding of common carp is related to the lunar
cycle (full moon and new moon) and the availability of broodfish in the pond with
suitable breeding condition. In FFSs, adopters were trained to put water hyacinth in
ponds during full and new moon when common carps breed (CARE, 2000). While
adopters failed to collect eggs from their own ponds they collected them from their
neighbours who had placed water hyacinth at the right time. Collection of broodfish and
common carp eggs from neighbours during the critical period suggests that the
adaptation process of fish seed production is not only related to the adopter himself but
also to their neighbouring adopters. This sort of dependency could contribute to building
social capital (as discussed in Chapter 5) strengthening the relationships among
producers as well as between producers and non-producers at the community level.
Generally poor adopters did not have their own pond and tended to collect eggs from the

Chapter 6
321
ponds of richer farmers. In this situation, richer farmers felt proud to let poor farmers
collect fish eggs in the same way as they allowed them to use pond water for bathing.
This dependency of poor on better-off adopters however, can be viewed as strengthening
the relationships between the well-being classes of the community. Along with
difficulties in egg/broodfish supply other problems were also faced by both primary and
secondary adopters which have been mitigated within their own communities without
any external support. The ability to solve these sorts of problems makes this technology
a simple one without “complexity” which is an important attribute of technology in
strengthening the adoption process (Rogers, 1995a).
6.5.2 Non-adopting households
The main occupation of household heads of all three groups of non-adopting households
(NT, IR and LR) was agriculture. However, NT household heads were more diversified
occupationally. In the case of secondary occupations, business, day labour, agriculture,
petty service, van puller etc. were found in the all three categories suggesting similar
access of households to these occupations.
Irrespective of the respondents in non-adopting categories, almost all of them gained
knowledge of RBFSP activities through formal as well as informal ways. Most of them
explained common carp seed production as “collection of common carp seed during the
winter season from the pond using water hyacinth and stocking into the riceplot to
produce fish seed and fish”. The majority of the rejecters (IRs & LRs) received
knowledge of fish seed production as CARE direct participants and about a quarter
acquired knowledge as secondary receivers/adopters. In terms of the duration of
practising this technology, some of the late rejecters continued for relatively long
periods.

Chapter 6
322
The major reason of NTs for not adopting the technology was identified as “busy with
off farm activities” followed by lack of suitable plot; having no land; physical inability;
and busy with on-farm (agriculture) activities. Similarly in case of IRs the reason “busy
with off-farm activities” was the main constraining factor casing rejection of the
technology. The immediate important reason was “changes in land tenure” followed by
water supply problem; physical inability of farmer; affect of flood and failure of
common carp egg collection. Finally the foremost important reason for LRs to reject the
technology was “changes of land tenure” followed by supply problems; physical
inability of farmer; water supply problem; affect of flood; and failure in common carp
egg collection.
From results discussed above some common and important reasons for non adoption and
rejection of RBFSP technology were identified. Particularly incompatibility with off-
farm activities appeared to be a major factor for NTs and IRs. These farmers had
diversified access to other livelihood options which hindered their adoption of this
technology. There has been remarkable change in the pattern of occupation during the
period of 1997/87-2000. The rising human capital content of rural labour and the
diversification into non-agricultural activities have been accompanied by a shift of rural
labour in favour of non-agricultural occupations (Sen, 2003). Sen reported that the
proportion of the labour force employed primarily in agriculture has gone down from
69% to 51%. This has been matched by the proportionate increase in the share of non-
agricultural sectors, which included a diverse mix of activities, such as salaried and
personal services, non-agricultural labour in transport, construction and agro-processing
and commercial activities, such as petty trading, shop keeping and business (Sen, 2003).
The scenario has also been reported in other countries (e.g. Laos) of Asia where
livelihoods of rural people tended to be de-linked with land (Rigg, 2006).

Chapter 6
323
Changing land tenure was the second most important constraining factor to IRs to reject
the technology and the main cause for the LRs rejections. Changes in land tenure
occurred in various ways, however the main reason was the loss of leased and shared
tenure. Basically the poor tend to access land through leased-in and shared-in tenure
systems as they have no land and insufficient cash to purchase. This finding reinforces
the concept of decentralisation of fish seed production as an appropriate technology for
the poorer section but highlights the issue of substantial access rights to improve rice-
fish systems.
Land is very scarce and its ownership is very concentrated (Griffin et al. 2002)
particularly in the Northwest (CARE, 2005a). The top 10% households own 47.2% of all
the land while the poorest 50% of the rural households owns only 5.7% of the land in
Bangladesh (Griffin et al. 2002). Similarly, land tenancy for sharecropping is a crucial
issue in Bangladesh and it has reduced from 90% in 1987/88 to 65% in 2000 (Sen,
2003). The benefits or net returns from the adoption of aquaculture technology depend
foremost on accessibility to the ownership of the principal production factors which are
land, labour and capital. A study by Veerina et al. (1999) on aquaculture development in
Andra Pradesh, India revealed that mostly landed people adopted aquaculture, where
85% of the farms owned land. Moreover, where land is not a major source of income,
land reforms that provide at least some land ownership even homestead sites-can be
important for improving the security, status and bargaining power of asset poor
households (Hanstad et al. 2002). However, in Bangladesh as well as other developing
countries, many of the rural households are unable to gain sufficient access to land when
this access would be their best option for escaping poverty (Bardhan et al. 1998; De
Janvry et al. 2001; Binswanger et al. 1995).

Chapter 6
324
This finding obviously suggests that those farmers who have no other livelihoods
options tended to grab this technology, having guaranteed tenure/ownership from better-
off farmers, as the vital factor for sustained adoption of RBFSP technology.
6.5.3 Women from adopting and non-adopting households
Although the majority of women in adopting households received training from FFS
initiatives, some women received knowledge from their relatives and neighbours. It was
reported in an earlier study that interpersonal communication with relatives, friends and
neighbours was the most reliable and trustworthy method of information transfer
regarding agricultural information (Kashem and Halim, 1990). Women were also found
to be involved in different activities of RBFSP due to the proximity of riceplots around
their households. As mentioned in the literature, women have been involved in small
scale aquaculture in different stages of operation and they are active “caretakers” of fish
in pond, nurseries, cages and rice-fields especially those located close to the homestead.
In some NGO and government programmes, women from landless households cultivate
fish individually or jointly in leased ponds, either within or near the homestead (Shelly
and Costa, 2001).
Alongside their participation in fish seed production activities, women tended to share in
the decision making regarding seed sales with their husbands. Although the participation
of women in fish seed production activities is limited, poultry rearing has been a
traditional activity performed by women for income generation (Abdullah and
Zeidenstein, 1982) because this activity is carried out within their homesteads. Feeding
livestock, breeding livestock, cleaning sheds, security measures and healthcare are the
activities performed by women. Owing to their crucial role in livestock care, women are
generally consulted when the men are buying and selling the livestock (Abdullah and
Zeidenstein, 1982).

Chapter 6
325
Decision making regarding income from seed sales appears to be substantially shared by
women possibly because of their active contribution to seed production activities.
Contribution to income oriented activities (e.g. poultry rearing) increases women’s
ability to buy personal items and items for their children (Nazneen, 2004). Apart from
selling seed, they also gifted seed/foodfish to their neighbours and relatives who were
mostly their close relatives. Previous studies have also found that women sent gifts to
natal family members in order to strengthen links and assist poor relations. Traditionally
natal family members provide material and social support to sustain the woman’s
marriage (White, 1992; Mallorie, 2003). Women’s relationship with their neighbours is
a key component of creating a security network and such a network provides emotional
support and can mitigate any domestic violence that occurs (White, 1992). The major
factor responsible for non-adoption of this technology was land access constraint
reported by the majority of women in non-adopting households. The issues regarding
access to land have been discussed earlier.
6.6 Conclusion
Rogers (1962) defines the adoption process as “the mental process of an individual from
first hearing about an innovation to the final adoption”. Feder et al. (1985) however
argued that a precise definition of adoption needs rigorous theoretical and empirical
analysis. This suggests that the definition of adoption is innovation specific, which is
why all innovation adoption studies have no unique unit of analysis (Rogers, 1995a).
Many traditional or instrumental studies of the adoption process have been carried out at
a large scale and have shown more or less similar and disappointing results focusing on
limited number of variables in many disciplines such as agricultural technologies,
medical sciences, information technology etc (Leeuwis and van den Ban, 2004).

Chapter 6
326
The present study, based on the hypothesis ‘adoption of RBFSP can be sustained by
farming households’ has been carried out using qualitative approaches beyond the
conventional long standing instrumental techniques. This study shows that the adoption
process of fish seed production technology does not depend on a few household
characteristics but depends on many causal factors embedded within the ecological and
socio-cultural complex. In an ecological context, development of the riceplot
environment and increased fish production in the riceplot and pond influenced the
farming household to adopt. In the context of a farming family, this technology met the
basic demand for “food” of different household members such as children, women and
the elderly. This study attempts to argue that fish is not confined to the traditional
scientific purpose as a “source of protein” but rather has more fundamental familial and
social values in Bangladeshi society. This intangible value acted as a power in the
adoption process of this technology. The specific technological approach clearly helped
as a coping mechanism for the seasonal “hungry gap” of fish consumption and low
income. Impacts of this technology were not only confined to the farming households
but also extended to poor fry traders to diversifying their livelihoods. Development of a
network between adopters and fry traders reinforced the adoption process.
Involvement with off-farm activities was not compatible with adoption by IRs and LRs.
This confirms that for those adopters having no other central livelihoods options except
agriculture, adoption of RBFSP could be an important livelihood option. However,
having sustained tenure/ownership of land was a critical factor for the sustained
adoption of RBFSP in the decentralised approach. At the government policy level, there
is currently no legal basis for leasing land tenure, and implementing sharecropping
tenure rights for the poor is a negligible task in government administrative authority
(Awal, 2003). CARE, during its Go-Interfish project phase developed advocacy
measures to motivate various levels of actors ranging from farmers to ministry level to

Chapter 6
327
bring about changes in existing policy. As CARE programmes have been phased out,
local influential NGOs could take the initiative to implement advocacy measures
motivating relevant actors and changing policy at the ministry level. Government has
already started to distribute state-own land (khas jami) to the poorer through the
mediation of NGOs.
In terms of ensuring egalitarian access to land, five Asian countries (Japan, Taiwan,
South Korea, China and Vietnam) successfully transformed agrarian structure into a
system of individual peasant farming after Second World War. Land reform in Japan,
Taiwan and South Korea was based on compulsory purchase of land by the government
and redistribution to tenants and landless households. China and Vietnam redistributed
the land to poorer households after expropriating land from landlords (Griffin et al.
2002). According to Rigg (2006) ‘sustainable future rural livelihoods’ could be built
through amalgamation of landholdings for emergence of large land owners and agrarian
entrepreneurs. Land amalgamation and redistribution to poor households or
amalgamation to make larger land owners would not be possible in Bangladesh (Griffin
et al. 2002) because it could be a very difficult political decisions and the limited
financial capacity of government. However in Northwest Bangladesh, there is a potential
for the better-off households to be entrepreneurs of decentralised RBFSP, which could
leverage broader rural development by producing good quality fish fingerlings,
involving landless fry traders, and foodfish producers (Chapter 5).

Chapter 7
328
Chapter 7: Cost-effectiveness of different approaches to extension of RBFSP in terms of its development returns
7.1 Introduction
The preceding chapters illustrate encouraging livelihoods impacts and complex socio-
cultural reasons responsible for the adoption process of local level fish seed production
technology. In terms of the dissemination process at the farmer level, it is important to
know the delivery mechanisms of this technology and to determine its cost-
effectiveness.
7.1.1 Development of extension delivery towards FFS in Bangladesh
Agricultural extension delivery mechanisms in Bangladesh have a long history. During
the British regime (1757-1947), the agricultural development and extension services
were established in the sub-continent as a part of the Department of Revenue to help
with the rehabilitation of rural people seriously affected by natural disasters due to
terrible famine and destitution over three decades starting from the 1860s, (Kibria,
1987). In agricultural development the then British Government was keen to generate
revenue through motivating farmers to cultivate cash crops such as cotton, indigo and
jute. However, little attention was given to the improvement of food production and
other agricultural crops.
After the end of the British period in 1947, under the government of Pakistan, the
Agriculture Department started with a large number of field workers to carry-out several
experiments creating different departments and agencies for conducting agricultural and
rural development activities. This Department under the project of Village Agricultural
and Industrial Development (V-AID) attempted to organize the rural people through
their participation in agricultural and rural development activities along with
Chapter 7
329
government personnel at the grass root level. Its objectives were to increase the
productive output and real income of the villagers through farming modern techniques
(such as livestock, fisheries, crop agriculture and initiation of irrigation), sanitation and
health, cooperatives, cottage industries and also to develop a spirit of self-help among
the men, women and youth of the locality. During this period mass media radio started
to broadcast different agricultural programmes. This project was abolished in the mid-
1950s and its different activities were merged with the Directorate of Agriculture and
passed to other rural development departments.
In the 1960s, the Directorate of Agriculture was divided into two wings, the Extension &
Management and Research & Education. It was the beginning of extension through the
dissemination of agricultural information to the farmers in a planned and systematic way
(Kibria, 1987). During this period, personal and group contacts made by extension
workers and the distributors of different inputs (seeds, fertilizer, water, credit etc.) were
the main sources of extension information to the farmers along with television which
also started to broadcast agricultural information to farmers. The extension approach
was mostly top-down and participation of the beneficiaries in the system was almost
absent, with extension activities confined to motivation, education, group formation and
distribution of inputs to the farmers through traditional extension teaching methods.
After the birth of Bangladesh in 1971, the Directorate of Agriculture fragmented into
different mono-crop extension related organizations. The creation of these organizations
was based on farmer’s needs for extension services, but measures to coordinate activities
at the field level were inadequate, the farmers and the extension workers were mostly
confused. According to Kibria (1987) the problems of the then extension programmes
were: (a) inadequate demarcation of function and areas of responsibility, (b) misuse of

Chapter 7
330
resources due to lack of coordination, and (c) farming households and the farming
community was not looked at as one unit.
Realising the drawbacks of mono-crop extension in the 1980’s, all the mono-crop
extension services were unified and the department was renamed as the Department of
Agricultural Extension (DAE) and remains so today. At this time the Training and Visit
(T&V) programme was taken as an extension mechanism which was first tried in Turkey
during 1960’s. Moreover, during this period newspapers also started to disseminate
agriculture extension information. The focal point of T&V extension approach was the
Block, the lowest unit of field extension work, where a Block Supervisor (BS) has to
visit and conduct field work. A Block covers 800 to 900 farming households depending
upon the intensity of activities in the area. A two-step flow of information (from BS to
the contact farmers and then from contact farmers to the non-contact farmers) was the
model of message delivery system in T&V approach. At one stage it was observed that
the extension activities under T&V system had become ineffective in maintaining
adequate flow of information to the farmers (Karim and Halim, 1993).
In 1992, the Agricultural Extension Support Services Project (ASSP) was introduced
with the financial support of DFID. ASSP in collaboration with the DAE earmarked
institutional reforms aiming to decentralise and to introduce the participatory approach
in the delivery of extension services to the farmers. The ASSP set the stage for the
government to draw-up and adopt an Agricultural Extension Policy in 1995 and revised
it subsequently as the New Agricultural Extension Policy (NAEP) in 1996, in which the
role of agricultural extension in the context of national policy has been set up. The
components of NAEP are: extension support to all categories of farmers, efficient
extension services, decentralisation, demand-led extension, working with groups of all
kinds, strengthened extension-research linkages, training of extension personnel,
Chapter 7
331
appropriate extension methodology, coordinated extension activities and environmental
considerations. Formulation of the NAEP, ensuring participation of beneficiaries
(farming community) as development partners and continuous monitoring and
evaluation as a built-in-mechanism have also been the main achievement of DAE during
this phase. Among different participatory mechanisms, DAE emphasised the farmer
field school (FFS) approach to deliver extension services. The goal of DAE is to
encourage the various partners and agencies within the national agricultural extension
system to provide efficient and effective services which complement and reinforce each
other in an effort to increase the efficiency and productivity of agriculture in
Bangladesh. By 2016 the DAE hopes to have implemented 69,000 FFS training 1.7
million farmers across the country (MOA, 2004).
Originally, the FFS approach first began in the 1980’s in Java, Indonesia, teaching
farmers about IPM. In 1990’s adopting the FFS approach for disseminating IPM
knowledge at farmer level had started in Bangladesh. The principal component of FFS is
that it emphasises experimental learning through a participatory approach delivering
hands-on training which is important to attract both literate and illiterate farmers and to
keep them interested in learning (Rola et al. 2001). This concept does not require that all
farmers attend FFS training, rather a selected number of farmers within a village are
trained in this informal school, which entail weekly meetings during a season-long
training course (Feder et al. 2004b). In order to disseminate new knowledge more
rapidly within the community, selected farmers receive additional training to become
farmer-trainers and are expected to share their knowledge and experiences with other
farmers within their locality. FFSs are run by facilitators rather than instructors in order
to create a group learning environment rather than a classroom setting with a teacher
giving instructions.

Chapter 7
332
7.1.1.1 Flash-back of FFS
The FFS is currently promoted by many development organizations across the world
including the FAO, World Bank and CARE as an effective approach, however there
have been mixed results. Empirical studies, including two conducted in Bangladesh by
Larsen et al. (2002a) looking at rice and Larsen et al. (2002b) at vegetables, show
positive impacts of FFS. Both of these studies compared yields and pesticide use
between FFS trained farmers and non-FFS trained farmers and the findings indicated
that FFS trained farmers had higher yields and used less pesticide than non trained
farmers. Godtland et al. (2004) investigating FFS trained potato farmers in the Peruvian
Andes concluded that increased agricultural knowledge leads to higher yields and FFS
participants were more likely than non participants to have higher output from their
farms. On the contrary, a study conducted by Feder et al. (2004b) using time series data
of rice farmers in Indonesia found no significant difference in change in yields or
pesticide use when comparing FFS participants with non participants. Another study by
Feder et al. (2004a) reported that that FFS trained farmers had a greater knowledge of
IPM than non FFS farmers, but that knowledge of IPM was not spreading to farmers
who did not attend the training in villages with FFS. An ethnographic study in two
Bangladeshi villages showed that farmers trained in IPM practices in FFSs promoted by
DAE, used the same amounts of insecticides as untrained farmers and were not doing
anything differently from them. FFSs, therefore, did not appear to have influenced
farmers to adopt IPM (Hamid and Shepherd, 2005).
In terms of investment, a recent study conducted for the determination of the unit farmer
training cost under the IMP-FFS programme implemented by DAE-Bangladesh, where
average FFS-farmer cost was found to be US$ 28.53 (Gilbert, 2005). Similarly, Quizon
et al. (2001) found that the average cost for training a farmer about IPM through FFS
was US $47.50 in Indonesia and US $62.00 in the Philippines. These scales of

Chapter 7
333
investment are significant because if FFS graduates do not share their knowledge of IPM
with their neighbours, then the lack of secondary spread and the high cost of training
farmers through FFS calls into question whether FFS is cost-effective or can be a
sustainable method for desseminating IPM at a national level.
7.1.1.2 FFS delivery mechanisms of decentralised fish seed production
Delivery mechanisms in Interfish area
CARE Bangladesh promoted RBFSP technology over 13 years between 1993 and 2005.
Initially, CARE promoted the use of locally produced common carp eggs in irrigated
ricefields to produce fingerlings through its Interfish-I project (Figure 7.1). The tenure of
Interfish-I was until 1997, where promotion through a scheme approach continued from
1993 to 1995. The scheme approach in Interfish-I was to build a farmer’s group based
around a deep tube-well irrigation scheme. Indeed, CARE intervention with scheme
farmers was the pilot-scale developing stage of FFS where the learning process of
farmers was based on participatory action learning (PAL) over three seasons. After 1995
Interfish-I and CARE’s follow-on project Interfish-II, adopted FFS approach and
continued to 2000 in a broader geographical area of Northwest Bangladesh.

Chapter 7
334
Time sale 1993 1994 1995 1996 1997 1998 1999 2000 2001 2002 2003 2004 2005
Interfish-I Scheme
Interfish-I FFS
Interfish-II FFS
GIFT trial
Go-Interfish FFS
Figure 7.1: Schematic view of promotion of ricefish based fish seed production during the period from 1993 to 2005 (adapted from Gregory and Kamp, 1999b; Barman, 2000;
CARE, 2001a).
During the later projects of Interfish-I and Interfish-II, promotion of RBFSP was carried
out through FFS using the farmer’s riceplot as the learning plot, where FFS participants
learnt about ricefield ecology and management practices in a practical way over 3
seasons - boro-amon-boro (one and half years). Apart from fish seed production, the
curricula of the scheme and FFS consisted of foodfish production, dike cropping, low
input rice production and integrated pest management (IPM). During Interfish delivery,
40 participants (30 male and 15 female) were involved in each scheme/FFS.
• Initial stage of fish seed production in ricefield around deep tube-well irrigation scheme
• Promotion of seed production started with the use of common carp
• Activity of scheme was related to increase capability in decision making process for ricefield ecosystem management
• Use of FFS approach in promotion of RBFSP
• Promotion of seed production stared with the use of common carp
• Activity of FFS was related to increase capability in decision making process of ricefield ecosystem management
• Build farmer participatory action research group to test tilapia seed production with ongoing common carp in two communities in Interfish scheme area
• Promotion of tilapia seed production with common carp
• Activity of research was on training of farmers in tilapia seed production, providing GIFT brood and monitoring seed production activities
• Use of FFS approach encompassing broader livelihood aspects of which RBFSP was a part
• Promotion of seed production started with the use of both common carp and tilapia
• Activity of FFS was related to ricefield based seed and many other non-technical issues such as health, sanitation, forestry, livestock, advocacy, etc.
Promotion of GIFT by CARE and its PNGOs in Go-Interfish area
Promotion of GIFT by farmer to farmer in Interfish area

Chapter 7
335
Delivery mechanism in Interfish research area
Seed production of the improved variety of Nile tilapia was tested in two communities in
1999 through a farmer participatory research trial with household had been engaged in
common carp seed production since the inception of the Interfish project. The selected
households were given training on tilapia seed production techniques in ricefields as
well as a small number of broodfish of an improved strain of Nile tilapia – GIFT
(Genetically Improved Farmed Tilapia). Introduction of tilapia to the research area then
spread through an organic dissemination (farmer to farmer dissemination process) in
other parts of Interfish area (Barman et al. 2004).
Delivery mechanism in Go-Interfish area
During the Go-Interfish project phase, CARE promoted fish seed production in ricefield
systems through CARE direct and its partner NGO delivery using a FFS approach over a
large geographical area in Northwest Bangladesh. CARE’s partnership with local NGOs
was due to reach a large number of beneficiaries and to make the NGOs viable, well-
governed, transparent, and publicly accountable organisations. In terms of sustainability,
CARE also had an expectation of PNGOs that, through their acquired capability from
the partnership, they would continue the programmes developed during partnership after
withdrawal of CARE support. This partnership evolved from a system that could be
characterized as ‘subcontracting’ to one in which these local NGOs were ‘partners’ in
the development endeavour. In this partnership the PNGOs had no financial input to the
implemented programmes and the higher officials (executive directors) of the PNGOs
were salaried. The partnership process involving CARE and the NGOs was developed in
a systematic way from staff recruitment to FFS implementation (Figure 7.2).

Chapter 7
336
Figure 7.2: FFS implementation by CARE direct and PNGO delivery mechanisms.
Staff recruitment by CARE and a
committee of NGO representatives
Staff hand’s on training by
CARE
Staff distribution
CARE field office
Community mapping
Wellbeing analysis
FFS formation
Season -1 (first 6 months)
Season -2 (second 6 months)
Season -3 (third 6 months)
PNGO field office
Community mapping
Wellbeing analysis
FFS formation
Season -1 (first 6 months)
Season -2 (second 6 months)
Season -3 (third 6 months)
Monitored by both CARE and
PNGO
Monitored by both CARE
From 2001-2002
technical issues.
From
2003-2005 rights
based with technical
issues

Chapter 7
337
Initially, CARE advertised in the newspaper and requesting information from interested
local NGOs in the form of a project proposal. The required information included the
NGO’s registration details, physical facilities, policies, ongoing programmes, previous
experience in development work, local people’s acceptability etc. After receiving
applications from different NGOs, CARE carried out a ground truthing mission to
validate the information and finally brought 45 NGOs under the Go-Interfish project
partnership. Staff recruitment at the PNGO level was organized by a joint selection
committee consisting of CARE and PNGO officials. The recruited PNGO staff were
trained together with CARE staff over a three months period (Season Long Training on
Sustainable Agriculture).
After completion of the training, the project development wing of CARE distributed
extension teams consisting of 7 staff (1 project officers-PO and 6 field trainers-FT) to
the PNGOs. Each FT, both in CARE direct and PNGO delivery was assigned to set up 5
FFS within an 18 month period. Training was designed for both illiterate and literate
participants and in each 25 farmers were trained. RBFSP was one of the components of
the training received at FFS. FFS were formed through a systematic procedure (Figure
7.2), which is described below.
Community mapping
Community mapping was carried out to assess the number of households in each
community; poverty, agro-ecology, suitable riceplots; fallow land/waterbody; people’s
need/interest; communication and locally available resources useful for agriculture such
organic manure, indigenous pesticide materials etc.

Chapter 7
338
Well-being analysis
At this stage the community was categorised into 5 well-being groups after which the 2
groups of extremely poor and rich were excluded. Exclusion of the extreme poor and
rich farmers was because CARE had predetermined their strategy; the extreme poor
were landless (having no riceplot) and extreme rich were not interested in ricefish
technology. The middle three groups poor, medium and better-off were prioritised to
participate in the FFS.
Formation of FFS
In each community, one male and one female FFS were formed consisting of 25
participants in each. Each FFS was appointed a leader designated as Community
Organizer (CO) during the second season the CO was elected by the participants.
Seasonal planning for training
The whole FFS training period (18 months) was carried out over three seasons where
each season was planned with twelve sessions (two sessions per month). Each session
comprised of a 2-3 hour learning covering both theoretical and practical aspects. In
seasonal planning sessions, FFS members were asked to make a plan according to their
needs. The activities of the FFS over three seasons were as follows:-
Season 1 (first 6 months) – ricefish activities: Although CARE termed this as ricefish
activities, it started produciton of fish seed in ricefields. Each FFS established a common
study plot (ricefish plot), in which participants experimented with fish seed production
using common carp and tilapia seed production along with other ricefield related
activities. At the beginning of the FFS training, field trainers made a plan of activities
(learning session) with the direct participation of farmers. In each learning session, FTs

Chapter 7
339
imparted their technical expertise on ricefield based technologies where FFS farmers
began the adoption process of the improved technologies in their own fields.
Season 2 (second 6 months) – linkage with support services: In this season, the FFS
members identified a leader termed as community organizer (CO), who then with the
support of the project staff, established networks and linkages with individuals and / or
organizations of different support services such as government, NGO, private
organizations etc. During this period participants were trained on broader non-technical
livelihood issues such as mother and child health, advocacy, marketing, poultry
vaccination, road side tree plantation etc. Here each FFS member was also asked to
select a ‘buddy’ (bando sadasya) under the secondary adoption approach who could
adopt the technologies that FFS members are using.
Season 3 (third 6 months) – CBO (Community based organization) formation: In the
third season, the field staff prepared the FFS members as ‘facilitators’ of the FFS
community. Here the farmer leader (CO) and participants took on a greater role
strengthening the organizational capacity of the farmers’ group, which included the
remaining members from the community. The objective of FFS during this season was
to form a CBO involving almost all remaining people from the community.
7.1.1.3 Centralised mono-sex tilapia seed production system
Mono-sex tilapia are produced from free swimming mixed-sex tilapia fry (both male and
female) fed a diet treated with 17 α methyltestosterone to produce all male (mono-sex)
fry (Little and Edwards, 2004). Mono-sex tilapia seed production and all other
commercial tilapia hatcheries had been established in central and southern parts of
Bangladesh (WorldFish Center, 2004). Most of the hatcheries produced tilapia seed
along with carp and other fish species. As earlier tilapia dissemination project worked in

Chapter 7
340
some parts of Bangladesh but not in the Northwest region and the availability of tilapia
in markets of this region was reported be at subsistence level (Barman, 2000). In the
Northwest, there were no hatcheries for tilapia seed production established at the time of
the study. In order to get a clear picture of the inputs and outputs, a mono-sex tilapia
hatchery was selected for study from the Mymensingh region (North-central
Bangladesh). From this hatchery, commercial farmers purchased mono-sex tilapia seed
directly without any intermediation of fry traders. In this system, hatchery owner makes
contact with foodfish producing farmers directly and fingerlings were transported
directly using oxygenated bags.
7.1.1.4 Hypothesis and objectives of the study
Hypothesis
FFS promoting RBFSP delivery is the most cost-effective approach to achieving positive
impacts through aquaculture.
Objectives
The objective of this part of study was to determine the cost-effectiveness of the
different delivery mechanisms of RBFSP at the farmer level. Cost-effective analysis
(CEA) is an important tool in selecting the right delivery system for an extension
programme (Marsh and Pannell, 2000). CEA links costs and outcomes to determine the
payoff of investing resources in a given course of action. It is an important task in terms
of impacting the decision making process, developing awareness and ensuring survival
of the extension programme. The CEA approach was first developed in the military
before its more general application where it was applied to the healthcare sectors in the
mid 1960s (Weinstein and Stason, 1977).

Chapter 7
341
Analysing the cost-effectiveness of the FFS approach is particularly important because
in Bangladesh and other developing countries, extension and training programmes
receive limited funding, therefore disseminating and implementing cost-effective
programmes is vital for sustainability. Unfortunately, until now a comprehensive
evaluation procedure that fully captures the potential effects of the participatory
extension concept had not existed (Fleischer et al. 2002). Whereas traditional economic
evaluation is based on the generated economic surplus, social scientists focus on the
process of change in behaviour and attitude of individual farmers and among
communities. Neither discipline has yet agreed on common indicators to be used
(Waibel et al. 1999).
In the present study however, cost-effectiveness analysis was carried out in terms of
project based financial investment (Mindertsma, 2004) and economic development
(Richardson and Moore, 2002) of decentralised fish seed production compared with
centralised hatchery based tilapia seed production. Within a given discount rate, project
based investment appraisal leads to an understanding of whether project benefits
exceeded costs over successive years (Mindertsma, 2004) in a particular fish seed
producing community being the target of CARE support (Banu and Bode, 2002). On the
other hand, cost-effectiveness in terms of economic development means ‘multiplier
effects’, defined here as the number of times that the initial dollar of economic activity
causes additional dollars to be generated on a wider scale (Richardson and Moore,
2002).
In this analysis, three extension delivery mechanisms of decentralised fish seed
production such as Interfish FFS, Interfish FFS cum research intervention and Go-
Interfish FFS in Northwest, and a mono-sex tilapia hatchery in North-central
(Mymensingh) Bangladesh were examined. Mono-sex tilapia hatchery was used as a

Chapter 7
342
‘control’ as there is a widespread assumption that mono-sex enhances value of tilapia-
based aquaculture production and income (Little, 2004). Sustainability of the FFS
approach towards RBFSP amongst partner NGOs of CARE Go-Interfish project was
also examined.
7.2 Methodology
7.2.1 Determination of costs of different decentralised and centralised seed production systems
Valuing programme costs and developing benefits/effects or results of extension
intervention, is often difficult as they incur diverse costs and result in different outcomes
(Richardson and Moore, 2002). However, with appropriate information, a reasonably
accurate job of estimating programme values can be achieved. Conservative methods for
the determination of CARE’s direct delivery FFS costs were used in the present study.
Quizon et al. (2001) used the conservative method in their recent study in th Philippines,
where total budget allocated for the programme was divided by the number of FFS
participants to determine individual participant cost. This procedure was also used in
another recent study conducted by Gilbert (2005) to estimate the investment per farmer
on IPM-FFS programme implemented by DAE-Bangladesh. In the present study, data
regarding cost and number of beneficiaries was collected from previous CARE Interfish-
II and Go-Interfish project reports (Appendix 11). Such conservative estimation of per
farmer or FFS cost could not explain several cost components in the implementation of
FFS. From CARE direct delivery it was not possible to collect detailed data of all cost
components. However, from CARE partner NGOs, the detailed FFS cost components
were determined through collection of data from NGO documents (Appendix 12), and
interviewing higher NGO officials (executive director).
Chapter 7
343
Broadly FFS costs were classified into training time and materials. Training costs of
RBFSP were calculated by estimating the total time allocated for learning sessions of
fish seed production along with several components of the FFS curricula. The cost of a
FFS was then divided by total time (hours) spent by a field trainer to estimate per hour
FFS training cost. Then estimated times (hour) for fish seed production training was
multiplied by per hour training cost to determine the RBFSP training cost. After
termination of FFS training CARE had not provided any further support. However,
materials provided during FFS incurred some costs in the second year which was
calculated using the method of depreciation cost (Shang, 1990). The detailed cost
components of the mono-sex tilapia hatchery were collected through a case study carried
out with the hatchery owner.
7.2.2 Determination of effectiveness
7.2.2.1 Project based financial investment effectiveness
Exploring the effectiveness of the project based financial investment looks at which
gives the highest revenues per unit of cost or lower cost per unit of revenue
(Mindertsma, 2004). Although seed production was not started in the Interfish and Go-
Interfish areas at the same time, the financial cost-effectiveness was carried out for the
same period (from 2000) as prior to the introduction of tilapia in Interfish area in 1999
the number of adopters and production was at subsistence level (Barman et al. 2004).
The monetary value of fingerlings produced in ricefields was considered revenue during
effectiveness determination. In financial investment effectiveness analysis, the estimated
net present value (NPV) and the benefit-cost ratio (BCR) of different extension
deliveries of decentralised fish seed production were compared with centralised mono-
sex tilapia seed production (SEED, 2004).

Chapter 7
344
Net present value (NPV)
The net present value is the present value of net cash flow. The NPV of an investment
project can be calculated by subtracting the costs from the benefit on a year to year basis
to derive the annual net benefit stream which is then discounted into present value. The
sum of the annual net benefits in present value form is the total net present value of the
investment project (Shang, 1990; Jolly and Clonts, 1993). The mathematical formula for
the NPV calculation is as follows:
)()1(1
ir
CBNPV
n
tt
tt −−−−−−−−−−−−−+
−=∑
=
Where, B = the gross annual benefit C = the annual operating cost t = year r = discount rate If , NPV>0, the investment would add value to the project, and the project should be accepted; NPV<0, the investment would subtract value from the project, and the project should be rejected; NPV = 0, the investment would neither gain nor lose value for the project. Benefit-cost ratio (BCR)
BCR is defined as the ratio of the total present value of benefits to the costs (Shang,
1990).

Chapter 7
345
)(
)1(
)1(
1
1ii
r
C
r
B
BCRn
tt
t
n
tt
t
−−−−−−−−−−−−−
+
+=
∑
∑
=
=
Where, B = the gross annual benefit C = the annual operating cost t = year r = discount rate
If,
BCR>1, the total present value of benefits exceeds total present value of costs, investment would be economically feasible; BCR<1, investment would not be economically feasible; BCR = 1, it would be a break-even situation.
However, in NPV and BCR estimation, the choice of an appropriate discount rate plays
a vital role. The available literature (Gittinger, 1994; Rahman, 1998) suggested that in
most developing countries the opportunity cost of capital varies between 8 to 15 percent.
The lending rates of nationalized commercial and specialised banks in the agricultural
sector of Bangladesh lie between 12 and 14%. As with many agricultural research
studies, a discount rate of 14% was chosen for the appraisal (Al-Mamun et al. 2003).
7.2.2.2 Economic development effectiveness
As fish seed availability at the farmer level potentially leverages broader development
impacts, assessing impacts only at the seed producer level underestimates overall cost-
effectiveness. This leads to other approaches of decentralised seed promotion with a
smaller number of ‘entrepreneurs’ than those with larger developmental effectiveness.
The economic development effectiveness provides an alternative which gives the highest

Chapter 7
346
benefit per unit cost to the society (Mindertsma, 2004) with multiplier benefits/effects
(Richardson and Moore, 2002).
In this regard, following three years of intervention, at per unit cost, the multiplier
effectiveness including benefits at the levels of primary farmers, secondary farmers, fry
traders and pond fish producers was estimated comparing the different extension
deliveries of decentralised fish seed production with a centralised mono-sex tilapia
hatchery.
7.2.3 Understanding programme sustainability among CARE’s partner NGOs
Beyond CARE’s partnership with local NGOs, CARE’s expectation was that those
organisations would absorb skilled staff and continue such programmes at the
community level after the withdrawal of CARE support. It was hypothesised that larger
NGOs might be able to continue such type of programmes after the withdrawal of
CARE support.
In order to investigate the attitudes of PNGOs, 9 NGOs were selected considering their
size based on their existing number of staff. Of 9 PNGOs, 3 were small (staff<20), 3
were medium (staff<100) and 3 were large (staff>100). During the on-going partnership
with CARE (January 2005), an open ended survey with 9 NGOs was undertaken to
observe the existing programmes and their attitudes towards continuation of partnership
programmes. After withdrawal of CARE support at the end of March 2005, another
round of observations was undertaken using open-ended questionnaires to understand
the prevailing situation of PNGOs.

Chapter 7
347
7.3 Results
7.3.1 Project investment based cost-effectiveness
7.3.1.1 Cost of different decentralised promotions and centralised hatchery
Investment per FFS farmer was calculated taking data from the Interfish project final
report prepared by the CARE assessment wing (CARE, 2001a). The report indicates that
within the period of the project phase from July 1995 to December 2000 the total
allocated budget was GBP 3,929,548 and the number of target FFS participants was
89,680. Therefore, the calculated investment per FFS farmer was approximately GBP
43.8 which was equivalent to US$ 60.2. Using the same conservative approach,
investment per participant was calculated from the Go-Interfish project where total
allocation for the period of July 2002 to June 2003 was US$ 2,403,573 (CARE, 2003a).
The total number of FFS formed by the Go-Interfish direct delivery approach was 900,
thus the per participant investment was US$ 106.8. The detailed calculation of data
obtained from the NGO showed that investment per farmer was US$ 41.55 (Table 7.1).
Out of the total budget, more than 80% of the expenditure was used for staff salary and
benefits, vehicle purchasing and maintenance. The cost of farmer level training was
minimal.
Table 7.1: Cost for implementing FFS by Go-Interfish partner NGO (1US$=Tk.58.00)
Cost items Cost (Tk) Cost (US$) Cost (%) Salary and benefits 447900.0 7722.4 37.2
Office rent 14000.0 241.4 1.2
Office maintenance, repairs and cleaning materials 5880.0 101.4 0.5
Communication 495.0 8.6 0.1
Stationary and supplies 7155.0 123.4 0.6
Furniture, fixture and equipment 25900.0 446.6 2.2
Vehicle, fuel, repairs and maintenance 551625.0 9510.8 45.8
Travel and lodging 18300.0 315.5 1.5
Project implementation 122500.0 2112.1 10.2
Others administrative cost/miscellaneous 11140.0 192.1 0.9
Total coat 1204895.0 20774.1
Per FFS cost 60244.8 1038.7
Per farmer cost 2409.8 41.6

Chapter 7
348
Assessing costs for RBFSP training using different approaches
Interfish project area
The total training time of Interfish-FFS was found to be 120 hours. Accordingly per FFS
cost was calculated as US$ 2409.6 through multiplying individual participant costs (US$
60.24) by the number of participants (40 participants in each FFS) in each community of
the Interfish project area (Table 7.2).
Table 7.2: Cost for RBFSP training in Interfish-FFS
Session/occasions in FFS No No. of hours Learning sessions (each session spent 2 hours) 36 72 Field day (each field day spent 4 hours) 3 12 Fare (spent 6 hours for a fair) 1 6 Cross visit (Each cross visit spent 10 hours) 3 30 Total FFS hour 120
Cost for RBFSP training Cost (US$) Per FFS cost (60.24 X 40 participants) 2409.6 Average per FFS hour cost (2409.6/120) 20.1 Per FFS fish seed production training hour cost* 120.5 Fish seed production training cost in Interfish 12 FFS (12 communities) 1445.8
Each farmer fish seed production training cost at first year (1445.8/480) 3.01
* Each FFS held 3 sessions (each of 2 hours) for RBFSP
From the total FFS expenses, costs for RBFSP training were calculated dividing the total
FFS cost by the number of hours spent for seed production training. Hence, the per
farmer or household level fish seed production cost was calculated at US$ 3.01. In the
second year there were no costs related to the CARE project for RBFSP with the
exception of some material provided during FFS. The current value of those materials
(plastic bowls and jars) was estimated using the declining balance depreciation method
(Shang, 1990). In this method, a fixed rate (30%) of depreciation was used every year.
The amount of annual depreciation costs for the materials used in 12 FFS were
calculated for the second, third and fourth years as 20.2, 14.2 and US$ 9.9 respectively.

Chapter 7
349
Interfish research area
In the 2 Interfish communities, tilapia seed production was trialled along with common
carp seed production in ricefield systems. The costs for training on fish seed production
provided by the CARE Interfish project and research programme, were calculated (Table
7.3). Here per farmer or household seed production cost was calculated at US$ 12.06. In
existing CARE Interfish FFS, research programme also provided farmers with some
materials during the trial of tilapia seed production in ricefields. Collectively the
depreciation value in the second, third and fourth year were as 44.7, 31.3 and US$ 21.9
respectively.
Table 7.3: Cost for RBFSP training in FFS of IF tilapia research area
Session/occasions in FFS No No. of hours Learning sessions (each session spent 2 hours) 36 72 Field day (each field day spent 4 hours) 3 12 Fare (spent 6 hours for a fair) 1 6 Cross visit (Each cross visit spent 10 hours) 3 30 Total FFS hour 120 Cost for RBFSP training Cost (US$) Per FFS cost (60.2 X 40 participants) 2409.6 Average per FFS hour cost (2409.6/120) 20.1 Per FFS fish seed training hour cost* 120.5 a ) Fish seed training cost of CARE Interfish in 2 FFS (2 communities) 240.9 1 researcher 40 weeks monitoring cost (US$ 8.6 X 40) 344.8 3 research assistants 40 weeks monitoring cost (US$ 2.58 X 3 X 40) 310.3 Cost of tilapia broodfish supplied during training 68.9 b ) Research cost in CARE Interfish 2 FFS (2 communities) 724.1 Total training cost (a + b) of CARE and research team 965.0
Each farmer fish seed production training cost at first year (965.0/80) 12.06
*Each FFS held 3 sessions (each of 2 hours) for RBFSP

Chapter 7
350
Go-Interfish project area
The training cost of Go-Interfish only for RBFSP was calculated as US$ 89 per FFS
(Table 7.4). In each community of CARE Go-Interfish, two FFSs were formed hence per
community cost for fish seed training was US$ 178.0. Accordingly per participant and
per household seed production training cost was calculated as 3.6 and US$ 7.2
respectively. Depreciation value of materials provided by CARE in 11 communities in
second, third and fourth year were 37.2, 26.0 and US$ 18.2 respectively.
Table 7.4: Training cost for RBFSP in Go-Interfish project
Session/occasions in FFS No No. of hours Learning sessions (each session spent 2 hours) 36 72 Field day (each field day spent 4 hours) 3 12 Fare (spent 6 hours for a fair) 1 6 Cross visit (Each cross visit spent 10 hours) 3 30 Total FFS hour 120 Cost for RBFSP training Cost (US$) Per FFS cost (106.82 X 25 participants) 2670.5 Average per FFS hour cost (2670.5/120) 22.3 Per FFS fish seed production training hour cost* 89.0 Per community fish seed production training cost in Go-Interfish (89.0 X 2) 178.0 Fish seed production training cost in 11 communities (178.0 X 11) 1958.4
Per farmer seed production training cost at first year (1958.4/550)X2 7.2
*Each FFS held 2 sessions (each of 2 hours) for RBFSP
Centralised tilapia hatchery
For developing a tilapia mono-sex hatchery, the first year total fixed and variable cost
was US$ 42733.7 (Table 7.5). Considering 30% of depreciation of fixed materials, the
total cost of operating a mono-sex hatchery in a third year was calculated at US$
29984.1.
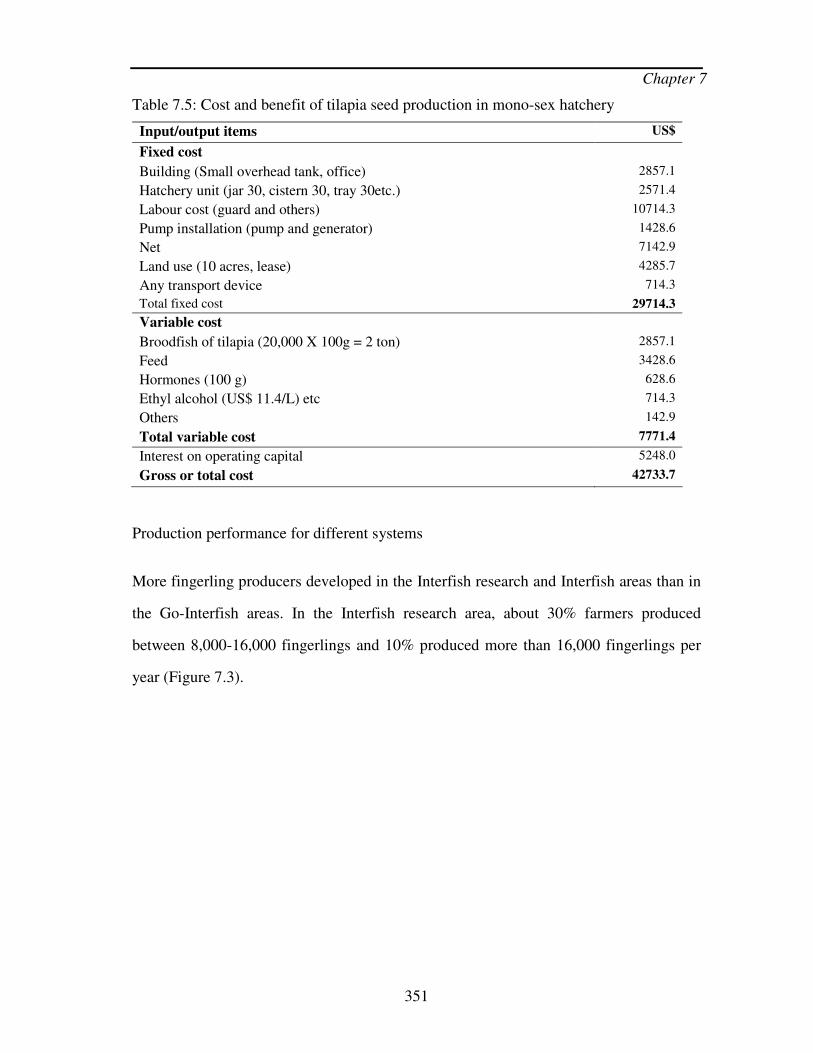
Chapter 7
351
Table 7.5: Cost and benefit of tilapia seed production in mono-sex hatchery
Input/output items US$
Fixed cost
Building (Small overhead tank, office) 2857.1
Hatchery unit (jar 30, cistern 30, tray 30etc.) 2571.4
Labour cost (guard and others) 10714.3
Pump installation (pump and generator) 1428.6
Net 7142.9
Land use (10 acres, lease) 4285.7
Any transport device 714.3
Total fixed cost 29714.3
Variable cost
Broodfish of tilapia (20,000 X 100g = 2 ton) 2857.1
Feed 3428.6
Hormones (100 g) 628.6
Ethyl alcohol (US$ 11.4/L) etc 714.3
Others 142.9
Total variable cost 7771.4
Interest on operating capital 5248.0
Gross or total cost 42733.7
Production performance for different systems
More fingerling producers developed in the Interfish research and Interfish areas than in
the Go-Interfish areas. In the Interfish research area, about 30% farmers produced
between 8,000-16,000 fingerlings and 10% produced more than 16,000 fingerlings per
year (Figure 7.3).

Chapter 7
352
(a)
0%
9%
18%
27%
36%
45%
<0.5
>0.5-1
>1-2>2-4
>4-8
>8-16
>16
No. of fingerlings ('000)
Per
cen
t o
f h
ou
seh
old
s
(b)
0%
9%
18%
27%
36%
45%
<0.5
>0.5-1
>1-2>2-4
>4-8
>8-16
>16
No. of fingerlings ('000)P
erce
nt
of
ho
use
ho
lds (c)
0%
9%
18%
27%
36%
45%
<0.5
>0.5-1
>1-2>2-4
>4-8
>8-16
>16
No. of fingerlings ('000)
Per
cen
t o
f h
ou
seh
old
s
Figure 7.3: Scale of fingerlings production of households under different delivery systems (a = Interfish, b = Interfish resaerch and c = Go-Interfish area).
Comparatively, the majority of households produced fingerlings within the range of 500
to 1000 and the mono-sex tilapia hatchery produced 10,000,000 (approximate
estimation) fingerlings over a year of operation.
7.3.1.2 Effectiveness of different decentralised promotions and centralised hatchery
Decentralised systems
Interfish project area
Net present value (NPV): The NPV calculated from fingerlings production in 12
Interfish project communities was US$ 4538.81. This value is positive and much higher
than 1, indicating the project’s investment in RBFSP extension delivery added a large
amount of value (Table 7.6).

Chapter 7
353
Table 7.6: Net present value for Interfish project area
Year Gross benefit (US$)
Gross cost (US$)
Net benefit (US$)
Discount rate (14%)
NPV (US$)
0 0 1445.8 -1445.8 1.14 -1268.2 1 2398.7 20.3 2378.4 1.29 1830.1 2 2323.6 14.2 2309.4 1.48 1558.8 3 4094.1 9.9 4084.1 1.68 2418.1
Total NPV 4538.8
Benefit-cost ratio (BCR): The calculated benefit cost ratio was 4.5, suggesting that
investment of US$ 1 in fish seed production delivery brings US$ 4.5 of benefit with an
increasing trend of BCR from initial to later years (Table 7.7).
Table 7.7: Calculation of benefit-cost ratio for Interfish area
Year Gross benefit (US$)
Discounted Benefit (US$)
Gross cost
(US$)
Discounted cost (US$)
Discount rate (14%) BCR
0 0.00 0.00 1445.8 1268.2 1.14 0.0 1 2398.7 1845.7 20.3 15.6 1.29 118.3 2 2323.6 1568.4 14.2 9.6 1.48 163.8 3 4094.1 2424.0 9.9 5.9 1.68 412.3 5838.1 1299.3 Average BCR 173.6
Discounted BCR 4.5
Interfish FFS cum research area
Net present value (NPV): The NPV of Interfish FFS cum research area was calculated as
US$ 5842.2. The positive and higher value of NPV indicates investment in RBFSP
added a great deal of value in the Interfish research area (Table 7.8).
Table 7.8: Calculation of net present value for Interfish research area
Year Gross benefit (US$)
Gross cost (US$)
Net benefit (US$)
Discount rate (14%)
NPV (US$)
0 0 965.0 -965.0 1.14 -846.5 1 2867.3 44.7 2822.6 1.29 2171.9 2 3876.5 31.3 3845.2 1.48 2595.4 3 3267.2 21.9 3245.2 1.68 1921.4
Total NPV 5842.2

Chapter 7
354
Benefit-cost ratio (BCR): Calculated benefit-cost ratio was much greater than 1,
suggesting the project investment through development and research increases benefits
by more than 7.4 times than investment alone (Table 7.9).
Table 7.9: Calculation of benefit-cost ratio for Interfish research area
Year Gross benefit (US$)
Discounted Benefit (US$)
Gross cost
(US$)
Discounted cost (US$)
Discount rate BCR
0 0 0.0 965.0 846.5 1.14 0.00 1 2867.3 2206.2 44.7 34.4 1.29 64.1 2 3876.5 2616.5 31.3 21.1 1.48 123.9 3 3267.2 1934.4 21.9 12.9 1.68 149.2 6757.2 914.9 Average BCR 84.3
Discounted BCR 7.4
Go-Interfish area
Net present value (NPV): In the Go-Interfish project the NPV was found to be US$
2322.1. Likewise in other project phases, the positive and higher value of NPV than 1
suggests investment in RBFSP was profitable (Table 7.10).
Table 7.10: Calculation of net present value for Go-Interfish project
Year Gross benefit (US$)
Gross cost (US$)
Net benefit (US$)
Discount rate (14%)
NPV (US$)
0 0 1958.4 -1958.4 0.877 -1717.9 1 1519.6 37.2 1482.5 0.769 1140.7 2 2289.3 26.0 2263.3 0.675 1527.7 3 2334.9 18.2 2316.7 0.592 1371.6
Total NPV 2322.1
Benefit-cost ration (BCR): The benefit-cost ratio in the Go-Interfish area was found to
be 2.3 suggesting that inclusion of a fish seed component in FFS training as well as
investment made the project profitable (Table 7.11).

Chapter 7
355
Table 7.11: Calculation of benefit-cost ratio for Go-Interfish project
Year Gross benefit (US$)
Discounted Benefit (US$)
Gross cost
(US$)
Discounted cost (US$)
Discount rate BCR
0 0 0 1958.4 1717.9 1.14 0 1 1519.6 1169.3 37.2 28.6 1.29 40.9 2 2289.3 1545.2 26.0 17.6 1.48 87.9 3 2334.9 1382.4 18.2 10.8 1.68 128.2 4096.9 1774.8 Average BCR 64.3
Discounted BCR 2.3
Centralised tilapia hatchery
Net present value (NPV): Net present value was estimated at US$ 89459.4 for the
centralised tilapia hatchery (Table 7.12). This high NPV calculated for the tilapia
hatchery was due to large scale investment during the installation of the hatchery, its
operation and commercial level of fingerling sales.
Table 7.12: Calculation of net present value for GIFT tilapia hatchery
Year Gross benefit (US$)
Gross cost (US$)
Net benefit (US$)
Discount rate (14%)
NPV (US$)
0 0.0 42733.7 -42733.7 0.877 -37485.7 1 92857.1 33074.1 59783.0 0.769 46001.1 2 92857.1 29984.1 62873.0 0.675 42437.5 3 92857.1 27821.1 65036.0 0.592 38506.5
Total NPV 89459.4
Benefit-cost ratio (BCR): Benefit-cost ratio was found to be 1.9 in the mono-sex tilapia
hatchery which is much lower than the BCRs of all decentralised systems (Table 7.13).
The lower BCR of centralised GIFT hatchery suggests that investment here was less
profitable than the investment in decentralised systems.

Chapter 7
356
Table 7.13: Calculation of benefit-cost ratio for mono-sex tilapia hatchery
Year Gross benefit (US$)
Discounted Benefit (US$)
Gross cost
(US$)
Discounted cost (US$)
Discount rate BCR
0 0 0.00 42733.7 37485.7 1.14 0.00 1 92857.1 71450.5 33074.1 25449.5 1.29 2.81 2 92857.1 62675.9 29984.1 20238.4 1.48 3.10 3 92857.1 54978.9 27821.1 16472.3 1.68 3.34 189105.4 99645.9 Average BCR 2.31
Discounted BCR 1.9
Based on an initial investment of US$ 10,000, a comparatively higher NPV was
demonstrated for the Interfish research area followed by the Interfish and then mono-sex
tilapia hatchery (Figure 7.4). Similarly, higher discounted BCR were found in the
Interfish research area followed by Interfish, Go-Interfish and tilapia hatchery.
0
10000
20000
30000
40000
50000
60000
70000
Interfish area Interfish
research area
Go-Interfish
area
Mono-sex
tilapia hatchery
NP
V b
ase
d o
n g
ross
co
st o
f U
S$
10
,00
0
Figure 7.4: Comparative NPV of different decentralised promotions and centralised hatchery based on initial investment of US$ 10,000.

Chapter 7
357
7.3.2 Development (economic) cost-effectiveness
7.3.2.1 Decentralised promotions
Interfish area
In the Interfish area, tilapia was introduced from the Interfish research area, when
compared to the Go-Interfish area, increased the production of fingerlings and income
(Table 7.14). This contributed to increasing benefits at the levels of secondary farmers,
fry traders and grow-out farmers.
Table 7.14: Multiplier benefits in Interfish area
Domains and descriptions of cost and benefit Benefit (US$)
Primary farmer =37 (calculated from community level survey) Fingerlings Cost of each primary farmer (US$) = 3.01 (CARE training) + 2.9 (Tilapia broodfish cost) + 6.2 (farmer own cost for ditch construction and fingerling production) = 12.1; For total 37 farmers in 12 communities initial cost = 37 X 12.1 = 447.7; Farmers learnt tilapia seed production from Interfish research communities. This cost of training was assumed as ‘willingness to pay’ for one day initial training in two communities given by researcher and research assistants = 8.6 + 2.6 = 11.2; Tilapia seed production training cost in one community = 11.2/2 = 5.6; Tilapia seed production training cost in 12 communities = 67.2; For total 37 farmers in 12 communities gross cost = 447.7 + 67.2 = 514.9 (each farmer total cost = 514.9/37 = 15.7); Total 37 farmers gross benefit = 2858.1; Total 37 farmers net benefit from fingerling production = 2858.1-514.9 = 2343.2 (each farmer net benefit from fingerling = 63.33) Pond Each farmer stocking their ricefield produced fingerlings obtained additional net benefit of 43.3 than a farmer did not use such fingerlings; Out of 37 farmers, 20 farmers had pond (average 54% farmers possess pond calculated in Chapter 3); Total 20 farmers net benefit = 43.3 X 20 = 866.0
Fingerling + pond = 2343.2 + 866.0 = 3,208.2
Secondary farmer =107 (calculated from two community level survey and conservative estimate for other communities) Fingerlings Cost of each secondary farmer = 6.2 (farmer own cost for ditch construction and fingerling production) + 2.9 (tilapia broodfish cost) + 1.8 (that would need for training of tilapia seed production) = 10.9; Total number of secondary farmers was calculated as 104; Total 104 farmers gross cost = 104 X 10.9 = 1135.3; Each farmer gross benefit from fingerling = 77.2 (considered as primary farmer) + 3.01 (cost that would need for CARE training) = 80.2; Total 104 farmers benefit from fingerlings = 80.2 X 104 = 8340.8; Total 104 farmers net benefit = 8340.8 – 1153.3 = 7187.5 Pond Each farmers net benefit from pond as primary farmer = 43.3; Out of 104 farmers, 56 farmers have pond (average 54% farmers possess pond calculated in Chapter 3). Total 56 farmers net benefit from pond = 43.3 X 56 = 2431.9
Fingerling + pond = 7187.4 + 2431.9 = 9619.3
Fry trader =23 (calculated from two community level survey and conservative estimate for other communities) Each fry trader traded 50 kg of fingerlings from fish seed producers (estimated from case studies); Benefit of a fry trader from each kg of fingerlings trading = 0.51; Total benefits from 50 kg fingerling trading = 0.51 X 50 = 25.5; Total number fry traders traded fingerlings from both primary and secondary adopters = 23; Total 23 fry traders benefit = 25.5 X 23 = 586.5
586.5
Pond fish producer = 575 (calculated from fry trader survey and conservative estimate) Each farmer cost for pond production was calculated in Chapter 3; As with primary and secondary farmers, each farmer who stocked decentralised fingerlings obtained additional net benefit of 43.3; Number of pond fish producers received fingerlings from each fry trader = 25; Total number of farmers received fingerlings from 23 fry traders = 23 X 25 = 575.0; Total pond fish producers net benefit = 575 X 43.3 = 24897.5
24,897.5

Chapter 7
358
Interfish research area
In the Interfish research area, the net benefit at the level of fingerling producers was
much higher than for other areas under CARE promotion (Table 7.15). Supply of good
quality tilapia broodfish and intensive training and monitoring brought changes at
multiple levels of beneficiaries.
Table 7.15: Multiplier benefits from Interfish research area
Domains and descriptions of cost and benefit Benefit (US$)
Primary farmer =24 (calculated from community level survey) Fingerlings Cost of each primary farmer (US$) = 3.01 (CARE training) + 2.9 (Tilapia broodfish) + 6.2 (tilapia seed production training)+ 6.2 (farmer own cost for ditch construction and fingerling production) = 18.26; Total 24 farmers gross cost = 24 X 18.26 = 438.2; Total 24 primary farmers gross benefit from fingerling = 2904 (each farmer gross benefit = 121.0); Total 24 farmers net benefit from fingerling production = 2904.0 – 438.2 = 2465.8 Pond Excluding all cost, each farmer stocking their on-farm fingerlings obtained additional net benefit of 43.3; Out of 24 farmers 13 farmers have pond (average 54% farmers possess pond calculated in Chapter 3); Total 13 farmers net benefit = 43.3 X 13 = 562.9
Fingerling + pond = 2465.8 + 562.9 = 3028.7
Secondary farmer =102 (calculated from community level survey) Fingerlings Gross cost of each secondary farmer (US$) = 6.2 (farmer own cost for ditch construction and fingerling production) + 2.9 (Tilapia broodfish) + 6.2 (that would need for tilapia seed production) = 15.3; Total number of secondary farmers were identified = 102; Total 102 farmers gross cost = 15.3 X 102 = 1560.6; Each farmer gross benefit = 121.00 (considered as primary farmer) + 3.01 (cost that would need CARE training) = 124.01; Total 102 farmers benefit from fingerlings = 124.01 X 102 = 12649.0; Total net benefit of fingerlings of 102 secondary farmers = 12649.0 - 1560.6= 11088.4 Pond Each farmers net benefit from pond as with primary farmer = 43.3; Out of 102 farmers 55 farmers have pond (average 54% farmers possess pond calculated in Chapter 3); Total 55 farmers net benefit = 43.3 X 55 = 2384.9
Fingerling + pond = 11088.4 +2384.9 = 13473.3
Fry trader = 21 (calculated from community level survey) Each fry trader traded 76 kg of fingerlings from fish seed producers (calculated from Chapter 5); Benefit of a fry trader from each kg of fingerlings trading = 0.51; Total benefits from 76 kg fingerling trading = 0.51 X 76 = 38.8; Total number fry traders traded fingerlings from both primary and secondary adopters = 21; Total 21 fry traders benefit = 21 X 38.8 = 814.8
814.8
Pond fish producer n =735 (calculated from fry trader survey) Each farmer cost for pond production was considered from Chapter 3; As with primary and secondary farmers, each farmer who stocked decentralised fingerlings obtained additional net benefit of 43.3; Number of pond fish producers received fingerlings from each fry trader = 35; Total number of farmers received fingerlings from 21 fry traders = 21 X 35 = 735.0; Total pond fish producers net benefit = 735 X 43.3 = 31825.5
31825.5

Chapter 7
359
Go-Interfish area
Net benefits in the Go-Interfish area were less than in other promoting areas of RBFSP
(Table 7.16). This was due to a lower level of production resulting from limited access
to good quality tilapia broodfish which caused lower benefits to the other domains of
beneficiaries.
Table 7.16: Multiplier benefits from Go-Interfish area
Domains and descriptions of cost and benefit Benefit (US$)
Primary farmer n=84 (calculated from community level survey) Fingerlings Cost of each primary household (US$) = 3.6 X 2 = 7.2 (CARE training) + 6.2 (farmer own cost for ditch construction and fingerling production) = 13.4; Total 84 farmers actual initial cost = 84 X 13.4 = 1125.6 (each farmer net benefit from fingerling = 10.5); Total 37 farmers net benefit from fingerling production = 10.5 X 84 = 880.3 Pond Each farmer stocking ricefield produced fingerlings obtained additional net benefit of 43.3; Out of 84 farmers 45 farmers had pond (average 54% farmers possess pond calculated in Chapter 3); Total 45 farmers net benefit = 43.3 X 45 = 1948.5
Fingerling + pond = 880.3 + 1948.5 = 2828.8
Secondary farmer =13 (calculated from community level survey) Fingerlings Cost of each secondary farmer = 6.2 (farmer own cost for ditch construction and fingerling production); Total number of secondary farmers was calculated as per observation from Interfish research area; Total 13 farmers actual operation cost = 13 X 6.2 = 80.6; Each farmer net benefit from fingerling = 10.48 (considered as primary farmer) + 7.2 (cost that would need for CARE training) = 17.7; Total 13 farmers benefit from fingerlings (US$) = 17.7 X 13 =229.8 Pond Each farmers net benefit from pond as primary farmer = 43.3; Out of 13 farmers, 7 farmers have pond (average 54% farmers possess pond calculated in Chapter 3); Total 7 farmers net benefit from pond = 43.3 X 7 = 303.1
Fingerling + pond = 229.8 + 303.1= 532.9
Fry trader =16 (calculated from community level survey) Each fry trader traded 27 kg of fingerlings from fish seed producers (calculated from Chapter 5); Benefit of a fry trader from each kg of fingerlings trading (US$) = 0.51; Therefore, benefits from 27 kg fingerling trading (US$) = 0.51 X 27 = 13.8; Total number fry traders traded fingerlings from both primary and secondary adopters = 16; Total 16 fry traders benefit = 13.8 X 16 = 220.8
220.8
Pond fish producer = 208 (calculated from fry trader survey) Each farmer cost for pond production was calculated in Chapter 3; As with primary and secondary farmers, each farmer who stocked decentralised fingerlings obtained additional net benefit of US$ 43.3; Number of pond fish producers received fingerlings from each fry trader = 13; Total number of farmers received fingerlings from 16 fry traders = 16 X 13 = 208; Total pond fish producers net benefit (US$) = 208 X 43.3 = 9006.4
9006.4

Chapter 7
360
7.3.2.2 Centralised tilapia hatchery
Overall according to actual initial costs, aggregated benefit was higher in the mono-sex
tilapia hatchery than from the Interfish research area. However, the number of
beneficiaries was much higher for decentralised seed promotion compared to a
centralised mono-sex tilapia hatchery (Table 7.17).
Table 7.17: Multiplier benefits from centralised mono-sex tilapia hatchery
Domains and descriptions of cost and benefit Benefit (US$)
Hatchery owner (calculation from hatchery owner) Cost of a hatchery operation in third year of production including fixed depreciation (30%), variable and interest on operating capital cost = 29984.1; Hatchery owner average gross return = 92857.1; Hatchery owner net return = 92857.1- 29984.1 = 62873.0
Fingerling + pond = 62873.0
Secondary farmer No scope of secondary farmers
0
Fry trader Hatchery did not sell mono-sex tilapia seed to fry traders rather seed was sold seed to commercial farmers after having a contact for a larger amount of seed in oxygenated bags
0
Pond fish producer (conservative estimation from hatchery owner) Total number of farmers purchased seed from the hatchery = 500; Each farmer purchased the number of fingerling = 20000; Each farmer produced = 3500 kg fish (calculated considering 70% survival and each piece market size = 250 g); Gross income from each kg tilapia is = 0.86. Each farmer gross income (US$) = 3500 X 0.86 = 3000; Each farmer per kg production cost (US$) = 0.4; Each farmer total production cost (US$) = 3500 X 0.4 = 1400; Each farmer net benefit (US$) = 3000-1400 = 1600; Total 500 farmer net benefit = 800,000
800,000.0
However, based on a unit initial investment cost (US$ 10,000), the Interfish research
area showed the highest effectiveness in terms of benefits amongt beneficiaries
including primary farmers, secondary farmers, fry traders and pond fish producers.
Comparatively, all decentralised promotion as found to be more effective than
centralised systems in terms extent of monetary benefits and equity of benefits based on
the number and type of beneficiaries (Figure 7.5).

Chapter 7
361
0
100000
200000
300000
400000
500000
600000
700000
800000
Interfish Interfish
research
Go-interfish Hatchery
Ne
t m
ulti
plie
r b
en
efit
on
in
ve
stm
en
t of U
S$
10
,00
0
Primary farmer
Secondary farmer
Fry trader
Pond farmer
Figure 7.5: Multiplier benefits of fish fingerling production based on investment of US$ 10,000.
7.3.2.3 Sustainability of programme in PNGOs after withdrawal of CARE support
At the time of investigation during the on-going partnership between CARE and its
PNGOs, the majority of them said that they would continue the RBFSP as well as other
programmes keeping the trained staff obtained during the CARE partnership and that
they would seek funds from other sources. Some of the NGOs mentioned that they were
seeking funds to continue the programme (Table 7.18). However, during the
investigation after withdrawal of CARE support, none of the NGOs were found to have
continued promoting RBFSP. When asked their reasons for not continuing the
programme, almost all NGOs replied that they were unable to continue without external
funding support and without continuous support for salaries it is not possible to run such
a programme.

Chapter 7
362
However, almost all of the NGOs irrespective of size were working with common
programmes such as micro-credit, sanitation, social forestry and child education. Of the
programmes micro-credit was found to be the most common programme not only in
small NGOs but also in large NGOs with a greater number of credit receivers and larger
geographical coverage.
Table 7.18: Partner NGO’s profile with regard to their existing programmes
Situation of NGOs during partnership with CARE (2005)
Situation after withdrawal of CARE support
Type of NGO
Name of NGO
Yea
r o
f es
tab
lish
men
t
No
. o
f ex
isti
ng
p
rog
ram
mes
Co
mm
itm
ent
to
con
tin
ue
CA
RE
p
artn
ersh
ip
acti
vit
ies
No
. o
f ex
isti
ng
p
rog
ram
me
Co
nti
nu
atio
n o
f C
AR
E
pro
gra
mm
es
BOHUBRIHY 1996 5 Yes 4 No
Jubok Shamity (JUS) 1995 5 Yes 3 No
Small (staff<20)
Rostamabad Mohila Unnayan Somity (RMUS)
1992 6 Yes 3 No
Al-Falah Aam Unnayan Sangstha (AFAUS)
1989 9 Yes 9 No
Jhanjira Samaj Kallyan Sangstha (JSKS)
1983 8 Yes 5 No Medium (staff<100)
Bandhan Bohumukhi Samajik Unnayan Songsths (BBSUS)
1998 5 Yes 1 No
Eco-Social Development Organization (ESDO)
1988 34 Yes 35 No
Debi Chowdhurani Palli Unnayan Kendra (DCPUK)
1981 16 Yes 12 No Large (staff>100)
Rangpur Development Samajik Sangstha (RDSS)
1986 9
Yes 3
No
Out of 9 NGOs only 2 NGOs (one medium and one medium large) have been able to
keep the staff who were trained during from the partnership programme with CARE.
This has only been possible as these NGOs were awarded projects immediately after the
withdrawal of CARE support. They did not continue to utilize them in FFS programmes.

Chapter 7
363
The final approach of the Go-Interfish project was to convert the FFS into a CBO
involving all households within the community. The approach aimed to benefit all
members of the community, so that people, irrespective of well-being categories and the
availability of resources to them could gain from the development of the CBO. The
number of the CBOs ranged from 3 to 41 per NGO and methods of direct delivery
(Table 7.19).
Table 7.19: Statistics of community based organizations formed by 9 NGOs under CARE Go-Interfish project in the Northwest Bangladesh
Criteria Number Percentage of CBO
Total number of FFS 682 Total number of community 341
In terms of FFS
In terms of community
Total number of CBO 118 17.30 34.60 Registered CGO 14 2.05 4.10 CBO-A category1 45 6.59 13.19 CBO-B category2 47 6.89 13.78 CBO-C category3 24 3.51 7.03
1Well organized with saving account in bank and communication with the service providers in the Local Government and in Upazilla level
2Well organized with saving account in bank and communication mostly with local government but not with the service providers at Upazilla level
3Having the saving account in bank but no communication with the service providers of local government and Upazilla offices
Of the total 682 FFSs formed by the 9 NGOs, only 34% developed into a CBO after the
project’s complete departure. Out of those only 4% have been registered with the
government to be recognised as a viable CBO. By building up linkages between the
government and the CBO it is possible to obtain government assistance, particularly
credit. In addition, at the end of the project, only 13% of the CBOs formed were within a
standard category. The standard CBO is registered with the Ministry of Social Welfare
and are well organised having a savings account in a bank and linkages with local
government and the government service providers at the upazilla level. Partner NGOs
were also contacted by CARE to monitor the CBOs, but in practice no NGOs presented
evidence of this.

Chapter 7
364
7.4 Discussion
Methodologically, assessment of cost- effectiveness regarding multiplier development
benefits was carried out using empirical data as well as conservative estimates based on
empirical data. Conservative estimates are widely used in medical science to make
broader decisions for cost-effective medical service (Splett, 1996; Hawkins et al. 2005).
Each estimate of impact or effectiveness has weaknesses however, logic and assumption
for cost–effectiveness analysis greatly contributes to future improvement of a project
intervention (Schreiner, 2003). In the evaluation of agricultural extension programmes,
conservative estimates are often used to estimate the demand for a specific extension
programme which could provide useful direction to extension
organizations/administrators who make difficult financial decisions to achieve broader
benefits (Roe et al. 2004).
The highest investment per household by CARE was calculated during the Go-Interfish
phase and was nearly 50% higher than in the previous Interfish project. This effect was
as a result of concentration of the Interfish Project on the improvement of rice field
management capacity of rice growing farmers. This included the concept of fish seed
production in ricefields, fish production in ricefields, dike-cropping, low external input
rice production techniques and integrated pest management (CARE, 2001a).
This higher investment by CARE per household in its Go-Interfish phase was due to the
fact that it not only worked with ricefields (fish seed, ricefish, dike cropping and low
input rice production) but also worked with other technical and non-technical issues in a
broader spectrum encompassing almost all aspects of livelihood and rural development.
Estimating the cost of fish seed training in FFSs and and the associated effectiveness
were of major interest in this study. Other technical issues included homestead vegetable
gardening, integrated pest management, compost/manure preparation, rice seed

Chapter 7
365
collection and preservation, rice seedbed preparation, pest control on vegetables, plant
grafting, cow fattening, poultry vaccination etc. The non-technical social development
activities included advocacy of facilitating access to markets, linking farmer groups with
other service providers (e.g. health and sanitation) and encouraging the formation of
groups (e.g. community based organisation) to act as the engines of social mobilization
in the community. In addition, Go-Interfish worked through local NGOs who played an
important role in implementing FFS and delivering additional services to farmers.
Building the capacity of local partner NGOs, and assisting them to work more
effectively in alliances was an important objective of the project. The capacity building
activities for local NGOs included training staff in financial management, advocacy,
marketing, monitoring and evaluation and coordination. The diverse activities of the Go-
Interfish project made it difficult to include an estimation of all benefits in the present
study, so assessment was restricted to the benefits of RBFSP.
For the partner NGO delivery, investment per participant was less than the Interfish
project and about three times lower than Go-Interfish. This was accounted for by vehicle
purchase, the large administrative and management costs of CARE direct delivery based
on retaining a large number of staff at several locations in Northwest Bangladesh and
Dhaka. The investment in FFS training at the community level was low and accounted
for less than 20% of the total programme budget. This was because field trainers’ only
costs were for snacks during each learning session. It was not possible to obtain budget-
break-down of CARE direct delivery however, as the salary and other associated costs
were much higher, the comparative budget for the actual FFS training was minimal.
Fish seed production training was a tiny part of the FFS curricula and incurred little
expenditure in all promotions of decentralised fish seed production. Thus
proportionately, investment in fish seed production training was a small amount of the

Chapter 7
366
overall expenditure. Comparatively, the time allocation for fish seed production training
was higher in the Interfish compared to the Go-Interfish FFS due to the inclusion of
additional activities in the Go-Interfish project. Although the time allocated to fish seed
training was less in Go-Interfish project, per household investment was much higher
than Interfish project due to the diversity of activities in the FFS curriculum and the
training approach. Both male and female from each household participated in Go-
Interfish FFS whereas, in Interfish FFS a participant from each household was either
male or female.
Additional value of the FFS was provided through the supply of good quality tilapia
broodfish and hands-on training on seed production could increase the number of
adopters of RBFSP at the community level. This was indicated by the research
intervention that supplied good quality broodfish of tilapia and seed production training
in two Interfish communities (Barman et al. 2004). That greatly improved the
performance of decentralised seed production with respect to an increased number of
adopters and fingerling production. Good quality broodfish supply in the Interfish
research communities contributed to stretch the impacts on Interfish area in terms of
increased performance of fingerling production and income compared with the Go-
Interfish area. Increased impacts were also evidenced through the dissemination of
improved knowledge of tilapia fingerling production from Interfish research to Interfish
communities. The intermediate level of performance in the Interfish communities could
possibly have been due to a dilution factor whereby the introduced improved qualities of
tilapia broodfish were reduced after mixing with feral tilapia species, resulting in lower
productivity. The lower level of production in the Go-Interfish area suggests a need to
supply improved quality tilapia broodfish along with better knowledge of seed
production in ricefields as in the Interfish research area (Barman et al. 2004).
Chapter 7
367
In terms of per unit project investment, decentralised fish seed production in the
Interfish research and Interfish areas was more cost-effective than in the Go-Interfish
area. This deviation reveals that the supply of good quality tilapia broodfish and seed
production training in existing standalone farmer field schools in the Go-Interfish area is
a critical step towards increasing the cost-effectiveness of RBFSP (Barman et al. 2004).
When cost-effectiveness is considered in terms of economic development, all types of
decentralised fish seed production contribute substantially more than the establishment
of a centralised hatchery. The introduction of secondary adopters in Interfish receiving
high quality tilapia broodfish from the Interfish research area added considerable extra
value to the chain of delivery. Spreading technological information and increasing the
number of secondary adopters is a key component of effectiveness (Casley and Lury,
1987). An increased number of secondary adopters after withdrawal of external support
made the programme cost-effective and sustainable and was beyond the initial
community intervention level.
There are many difficulties in measuring effectiveness with respect to calculating the
informal diffusion or the secondary spread of information from farmers who have been
reached by particular methods through contact with other farmers in their social network
who have not attended the training (Gilbert, 2005). However, the outcomes of earlier
studies (Chapter 5) regarding the adoption process of RBFSP technology can inform the
process of secondary adoption in this context. Although each participant in FFS training
was assigned to a buddy (secondary farmers), in reality it was observed that more than
30% of secondary adopters were not buddies of primary farmers. This result suggests
that there was considerable informal spread of technical knowledge (Barman et al. 2004)
which makes the FFS extension approach more cost-effective than planned. The

Chapter 7
368
involvement of fry traders was reported to have contributed to spreading knowledge of
RBFSP over a larger geographical area (Barman et al. 2004).
The rate of secondary adoption in the Interfish research area was probably higher due to
easy access to improved quality tilapia broodfish and greater benefits from fingerling
sale. There is evidence to suggest that farmers adopt a technology if they observe one of
their neighbours or peers being successful after using it (Rogers, 1995b). Godtland et al.
(2004) discussed how the rates of informal diffusion of IPM knowledge in communities
where IMP training has occurred. They argued that those who did not attend the training
adopted IPM demonstrating that the benefits of programme were extended beyond those
who participated making the programme more cost-effective.
Empirical attempts to measure the informal transfer of IPM knowledge have had mixed
results. Price (2001) found evidence of secondary transfer of information in a Philippino
village where a FFS had occurred. In Price’s study, farmers who did not participate in
the FFS showed increased knowledge of IPM practices after the field school had taken
place, indicating that they had received information from FFS graduates in the village
through informal contact. Conversely, Rola et al. (2001) found no significant difference
in IPM knowledge between farmers in the Philippines who did and did not participate in
FFS, even though it occurred in their village. Feder et al. (2004a) and Tripp (2006b)
found no significant evidence that FFS trained farmers share IPM information with their
neighbours in Indonesia. This might be due to the differences between needs for
technologies and socio-cultural interactions among farmers in different countries. Tripp
(2006b) however argued while the effects of secondary spread of IPM knowledge and
practices through informal social networks are uncertain, it is an important consideration
when determining how many people an intervention reaches, and is also important in
determining cost-effectiveness of development interventions.

Chapter 7
369
With respect to economic cost-effectiveness, a higher number of fry traders involved in
Interfish research communities made the programme more cost-effective. Prior to the
introduction of tilapia, seed production was limited to common carp at a subsistence
level which was used for restocking in household ponds and for consumption. Following
the introduction of tilapia broodfish, the higher production of fingerlings in the Interfish
research area attracted proportionately higher number of fry traders that added further
value in the promotion of the decentralised seed production system (Barman et al. 2004).
Higher levels of fry trader involvement increased beneficiaries at the pond fish producer
level which in turn made decentralised fish seed promotion more cost-effective overall.
Decentralised seed production in ricefields was found to be more cost-effective than
centralised tilapia hatchery with respect to a unit monetary investment. This was
attributed to the involvement of many co-beneficiaries towards their livelihood
improvement compared to the centralised tilapia hatchery. Hatchery level tilapia seed
production benefits the hatchery owner and grow-out farmers but does not benefit any
intermediate poor actors such as fry traders. Mono-sex tilapia seed produced in
hatcheries is sold directly mainly to better-off grow-out farmers. The value of the
product includes delivery costs for transportation in oxygenated bags, sometimes over
long distances which is much less affordable for poorer foodfish producers.
Mono-sex tilapia seed production systems have been developed to produce uniform and
larger fish that are more valuable than those from typical harvest of mixed-sex tilapia
(Green et al. 1997), but its demands are mainly associated with urban and export
markets (Little and Edwards, 2004). The growth and survival, irrespective of new-
season mono or mixed-sex tilapia, in culture ponds in Vietnam over a period of 110 days
was about 200g and 75% respectively (Dan and Little, 2000). This corroborates the fact
that there is a special advantage to the use of mixed sex tilapia fingerlings over mono-

Chapter 7
370
sex because relatively small-sized tilapias (< 200g) are more important for the food
security of poorer households (Barman et al. 2002; Little et al. 2007) and are in greater
demand in rural markets (Chapter 5) (Faruque, 2007). Another study showed that using
mixed or mono-sex tilapia seed did not make any significant difference to growth in
pond culture except with respect to the provision of external nutrients (fertilizer and
supplementary feeds) inputs (Little and Edwards, 2004). This favoured poorer
households to produce mixed-sex tilapia fingerlings in ricefields which made the
decentralised approach more cost-effective in terms food security and pond production
compared to hatchery based mono-sex tilapia seed production.
A recent study on integrated pond-dike systems in a centralised clustered hatchery
dominated area (North-central part of Bangladesh – Mymensingh) showed that stocking
of fingerlings in ponds had incurred the highest costs in terms of total inputs (Karim,
2006; Faruque, 2007). In this regard, recommendations and suggestions had been made
for farmer level spawning and nursing of fish fingerlings to minimize the operation cost
and maximize the benefits from pond-dike integrated aquaculture. The biggest share of
impacts of decentralised seed on pond production has been evidenced through increased
fish production of seed producers (Chapter 3) as well as non-seed producers who used
decentralised seed (Chapter 5). This clearly suggests that to farmers in remote areas
where hatchery produced seed particularly tilapia is not available, the relative degree of
the problem regarding high price of seed will be acute. In this context, seed production
in remote areas like Northwest Bangladesh is more cost-effective through the
decentralised system. According to a recent investigation, there were 17 tilapia seed
production hatcheries recorded in Bangladesh. Most of those were located in south and
central parts of Bangladesh where demand was high especially for larger fish, however
no hatchery was found in Northwest Bangladesh (WorldFish Center, 2004). The mixed-
sex tilapia fingerlings produced at the farmer level were of high quality indicated by the

Chapter 7
371
greatly enhanced performance of grow-out in farmer’s ponds. This explains the high
cost-effectiveness of such project interventions.
Exclusively, higher investment in and focusing tilapia seed production in Interfish
research communities made the programme highly cost-effective in terms of project
based investment and economic development. The relatively lower cost-effectiveness of
the Go-Interfish project was at least partly derived from the broader development
approach and difficulty in quantifying in the short-term effectiveness. This suggests that
RBFSP could be a component of any other developing endeavours being implemented
by other government and non-government organizations in Bangladesh. CARE realised
this potential and tried to encourage its partner NGOs to continue these farmer field
school activities in further communities and to monitor the activities in ongoing
communities.
7.4.1 Sustainability of programme in PNGO
The promotion of tilapia seed production in the Interfish research area was carried out
by the research programmes with support from NFEP that included holding and supply
of good quality tilapia broodfish and staff for the facilitation of farmer training (Barman,
2000). The capacity of holding good quality tilapia broodfish and staff for farmer level
training were likely to be key factors for the sustainable promotion of RBFSP through
local NGOs. The present study indicates that local partner NGOs were dependent on
external support (CARE support) to run natural resource based development activities
(e.g. RBFSP) due to their limited capacity in holding good quality broodfish and trained
staff.
In Bangladesh, many of the NGOs were formed during the period immediately after the
war of independence in 1971 (Garilao, 1987). Over 90% of villages had at least one

Chapter 7
372
NGO in 2000 (Fruttero and Gauri, 2005), and foreign assistance to the country
channelled through NGOs has been above 10% since 1993 (Ahmed, 2002). A recent
study shows that number of NGOs in each the sub-district (upazila) of Bangladesh
ranged from 1 to 192 (average 15.1) and that the majority were not located in the poorest
areas (Gauri and Galef, 2005). The present study shows that NGOs normally provide
beneficiaries with some continuous specific services, the major service being micro-
credit support. According to Gauri and Galef (2005) in general, 92% of NGOs provide
micro-credit as their main service. However it was demonstrated that although micro-
credit was considered as a main component of poverty reduction, it is a major source of
revenue for NGOs. Some 15% of small and 8% of large NGOs maintained a business or
canteen to generate income to support their activities (Gauri and Galef, 2005) suggesting
limited scopes for NGOs to generate funds.
In most developing countries, NGOs have limited internal resources and operate from
project to project. External funding gives them a certain degree of security to maintain
and even expand operations (Garilao, 1987). This sort of support makes the NGO
dependent on external funds, hence the notion that NGOs are here today and may be
nowhere tomorrow (Brodhead, 1987). Organizational sustainability incorporates more
forward-looking attributes such as self-reliance, autonomy, learning capacity, and
leadership which, in turn, help ensure sustainability (VanSant, 2003). NGOs having such
self self-reliant characteristics in Northwest Bangladesh include the Rangpur Dinajpur
Rural Service (RDRS) working since the independence of Bangladesh with the grass
roots people. This organization runs by both external and internal funding sources and, it
has developed a wide range of service facilities contributing to its revenue generation as
well as implementation of several collaborative programmes (RDRS, 2007). Presently it
is working in 46 Upazilas consisting of 357 unions with 337,661 beneficiaries in the

Chapter 7
373
Northwest. This organization has established field offices in 40 locations along with 13
training centres with residential facilities for both trainers and trainees.
The fact that value addition in CARE FFS could be greatly enhanced through the supply
of good quality tilapia broodfish suggesting that the inclusion of organizations such as
RDRS with physical facilities and capacity could be a way to further promote
decentralised fish seed production. In these FFSs, households already have knowledge
on ricefield ecology where it would be easier to strengthen this approach through supply
of good quality broodfish and improved knowledge of seed production.
With RDRS taking a leading role, based on research and development approach,
delivery towards improvement of FFS effectiveness could be tested by employing a
action research approach through several mechanisms such as i) providing training with
good quality broodfish; ii) giving training and literature; iii) training a leader at the
community level; iv) developing one-stop aqua-shop (OAS); v) giving training to
community mosque imam; and vi) using audio-visual aid at community shop.
Testing these extension methods at the farmer level more cost-effective approach could
be developed. Training and monitoring in the Interfish research community occurred
over 10 months but this could be reduced to 3 months during a single boro season in
FFS communities. Giving one-off training supported by provision of necessary
information in the form of literature (leaflet) could another option for low-cost delivery.
Training a leader at the community level as an opinion leader could also be a cost-
effective delivery mechanism towards strengthening decentralised approach. The
opinion leader, sometimes referred to as ‘fellow farmer’ was identified to be a relatively
more important source of information than radio or extension agents for both males and
females in Uganda (Adupa, 1999). One-stop aqua shops are a new approach of

Chapter 7
374
aquaculture service delivery system developed in rural India (Mukherjee, 2004) which
could be tested at the community level to promote decentralised seed production towards
broader aquaculture development.
Field level observations also suggest that promoters of RBFSP can be diverse. The imam
who leads prayer in mosque in almost every community is respected by all regardless of
social classes. Through the initiatives of the Islamic Foundation of Bangladesh under
Ministry of Religious Affairs, the Government of Bangladesh undertook a project called
Imam Training Project to educate imams in principles of Islam, mass education, family
welfare, agriculture, fisheries, first aid, tree plantation, afforestation, livestock farming,
etc. to enhance their capability of contribution to the socio economic development of the
country (Banglapedia, 2007). A trained imam at the community level could be a better
and more sustainable source of knowledge for decentralised tilapia seed production.
Moreover, ponds which are commonly located around mosque premises could be used
as a reservoir of good quality tilapia broodstock.
Over the years, in rural communities the number of small grocery shops selling essential
commodities has increased (Rahman, 2005). These shops also sell tea in the evening
time and show television programmes and movies with CD player to attract customers.
After a day of agricultural activities, rural farmers gather to enjoy television programmes
and movies along with a cup of tea. In such shops, documentary films on RBFSP based
on successful farmers screened with background music of Northwest folk-song could be
shown to disseminate knowledge of decentralised approach and sources of good quality
broodfish.

Chapter 7
375
7.4.2 Conclusion
Agricultural extension continues to offer hope for improving the lives of the rural poor
in the developing world (Hanson and Just, 2004). New agricultural technologies and
practices are important contributors to agricultural growth in developing countries.
When innovations improve farmers’ production practices by increasing yields or profit,
farmers receive this information, through formal institutions, informal social networks,
and their own trial and error (Conley and Udry, 2000; Bindlish and Evenson, 1997;
Rogers, 1995a). The process of diffusing information to farmers, whether conducted by
government agencies, NGOs or agricultural universities, should be improved by
assessment of cost-effectiveness in order to ensure that the training and dissemination
programs are sustainable (Gilbert, 2005).
The present study based on the hypothesis ‘FFS promoting RBFSP delivery is the most
cost-effective approach to achieving positive impacts through aquaculture’ shows that
whatever the expenditure in FFS training, it is cost-effective in terms of project based
investment for promotion of RBFSP. Within the CARE FFS expenditure fish seed
production in ricefield based systems incurred the smallest costs out of several cost
components. Alongside this, through additional level of training support along with the
supply of good quality tilapia broodfish, higher project investment and development
benefits of decentralised fish seed production revealed a higher level of effectiveness.
Such effectiveness of the decentralised system could surpass the effectiveness of any
large investment in centralised mono-sex tilapia hatcheries. This suggests that in order to
increases cost-effectiveness of standalone farmer field schools, training supports
together with the supply of good quality tilapia broodfish at the community level is
critical.
Chapter 7
376
Local partner NGOs of CARE expected to support FFSs could not continue their
activities due to their limited institutional capacity. It was estimated that during the
period of 14 years since 1992 to 2005, CARE provided extension support to only 4% of
households in Northwest Bangladesh. To strengthen and promote the decentralised fish
seed production approach in standalone FFSs and untouched communities respectively,
the creation of initiatives within capable grass root level institutions is required. Further
research into the mechanisms of low-cost extension delivery at institutional level toward
the large-scale promotion of decentralised seed production is required and could be
carried out using action research and by employing the different mechanisms discussed
above.

Chapter 8
377
Chapter 8: General discussion
8.1 Introduction
This chapter reflects on the main findings in terms of their contributions to the main
hypothesis ‘local production of fish seed in irrigated ricefields has positive, diverse and
subtle impacts on rural livelihoods in Northwest Bangladesh’ and objectives as stated in
Chapter 1. Firstly, differences between RF and NRF households focusing on their well-
being status were assessed based on the sustainable livelihood framework. The second
objective was to consider the livelihood impacts of this technology in relation to the
seasonal behaviour of farming households. The extent to which this technology involved
other actors (non-seed producers) as well as impacted on them was examined through
the third objective. The fourth objective was to gain insight into the adoption process of
this technology at the household level. Finally the fifth objective was to understand the
dissemination mechanisms of this technology at the farmer level and their cost and
benefits. The introductory Chapter provided a general overview of theoretical notions
and empirical evidence relevant to these research objectives. The subsequent empirical
Chapters dealt with these objectives in detail. This final Chapter includes an overview
and discussion of the main findings drawn from the empirical studies.
A timely and adequate supply of good quality seed is the precondition in all localities,
both for scaling up production and adoption of aquaculture by new entrants (World
Bank, 2006). Ensuring local level fish seed supply, decentralised fish seed production in
ricefield systems has been developed, adopted and promoted in Northwest Bangladesh
during the 1990s (Little et al. 2007). This change has occurred in the context of a
prevailing scarcity of quality seed which undermines the livelihoods of poor farmers and
the integrity of the production chain and entire aquaculture economy (World Bank,
2006). In this context of the development of farmer level seed production, there was a

Chapter 8
378
research interest to assess livelihood impacts, adoption and promotion process of this
technology in farming households.
Assessing the impacts of agricultural technology on poverty is difficult as there are so
many ways in which agricultural technology can affect poverty (Kerr and Kolavalli,
1999; IFPRI, 2000). Many studies tend to simplify the linkages between agricultural
research and poverty and measure only few aspects of those linkages. These sorts of
studies could miss many important aspects of poor people’s lives, including the diverse
ways in which technology directly or indirectly affects their livelihoods (Adato and
Meinzen-Dick, 2002). The sustainable livelihoods framework provides a common
conceptual approach to examining the ways in which agricultural technologies fit into
the livelihood strategies of households with different types of assets and other resources.
The livelihoods framework however, has limitations in which the lack of attention to
cultural capital was criticised (Stirrat, 2004). The suggestion to include cultural capital
which include beliefs, traditions, language, identity, festivals and sacred sites has been
made (Meinaen-Dick and Adato, 2001). However, application of this framework
requires interdisciplinary research and a combination of quantitative and qualitative
methods (Adato and Meinzen-Dick, 2002).
The findings of this thesis were derived from an interdisciplinary investigation based on
the sustainable livelihoods framework which was carried out using both qualitative and
quantitative investigation. At the beginning, participatory qualitative approaches were
used to segregate the poorer section of seed producers which were the focal point of this
research. Households were assessed through a cross-sectional survey in order to learn
the context and livelihoods systems of seed producing households compared to non-seed
producers. In order to understand seasonal dynamics of this technology a year long
longitudinal survey was carried out with the same households from the preceding study.

Chapter 8
379
Furthermore, both qualitative and quantitative investigations were carried out to
understand broader scale livelihood impacts, adoption process and delivery mechanisms
of this technology at the farmer level. The major findings derived from the preceding
empirical studies are discussed with the support of the existing body of literature.
8.2 Impacts on human capital
8.2.1 Development of knowledge on natural resources management
Human resources including skills, acquisition of skills to narrow knowledge gaps and
access to sources of information are important for small-sale aquaculture (ADB, 2005).
Improvement in human assets has been identified as one of the most important factors
for reduction of poverty (Sen, 2003). The surveyed seed producing farmers did not have
much formal education, most no more than primary level. They had no experience with
the RBFSP and had acquired the necessary skills for it from CARE through farmer field
school training in an experimental learning process (Chapter 3). Farmer-to-farmer
interactions, coupled with experience from learning by doing, were the key means of
gaining seed production skills. Evidence from adoption studies show that secondary
adoption occurred based on informal contact between farmers, illustrating the simple
and low-cost nature of this technology (Chapter 6). The majority of non-adopting
households, who had never tried this technology, were aware of fish seed production in
ricefields being practised by their neighbours. A similar scenario was reported in FFS
communities in Sri Lanka where half of the neighbouring farmers could report at least
one piece of information received from FFS farmers (Tripp, 2006b). This suggests that
accumulation of such knowledge or human capital can occur in farming communities
which could be disseminated to other farmers without further formal institutional
supports (Chapter 5).

Chapter 8
380
FFS participants were reported to be generally enthusiastic about their experience and
many eager to communicate their knowledge each other (Tripp, 2006b). Many farmers
in seed producing communities acquired a high level of knowledge in terms of when to
common carp eggs, identification of feral and improved broodfish of tilapia, broodfish
management, stocking density in ricefields etc. (Barman et al. 2004). Fish seed
producing farmers in the present study showed enthusiasm to share knowledge with
other farmers (Figure 8.1). This behaviour is likely to improve decentralised fish seed
production practices at community level.
The poorer sections of society often do not get access to knowledge necessary for
implementing new technologies (van der Zijpp et al. 2007). The CARE intervention
incorporated poorer sections of the community in its developing endeavour (Chapter 3)
who earlier used to be excluded from conventional government and non-government
interventions (Cox et al. 1998). As poorer people are more affected by illiteracy and low
levels of education, improving their skills in fish seed production was relatively more
important than for other well-being groups (Chapter 3). In terms of the economic
concept of marginal utility5, prioritizing the improvement of human capital of poor
farmers is clear. While poor farmers lacked formal education status in the Northwest, the
acquisition of technical and practical knowledge on RBFSP could be considered even
more important than formal literacy.
5 Marginal utility refers to the contribution of one additional unit of products or services to overall utility.

Chapter 8
381
Figure 8.1: An imaginary schema showing changes in the accumulation of assets in adopting households of RBFSP; drawn based on the number of major livelihood impacts
on each asset (DFID, 1999).
• Acquisition of knowledge and practical skills on RBFSP technology
• On-farm fish consumption improved nutritional status in farming households
• Absorption of household labour in RBFSP activities
• Improved pond management practices
• Significant increase of pond production
• Strategic use of irrigation pump water
• Improved riceplot ecology with SRS production
• No use of pesticides and reduced use of chemical fertilizers
• Production of fish fingerlings
• Production of foodfish in riceplot
• Re-stocking on-farm seed (natural capital) enhanced pond production
• Income from fish fingerlings and foodfish from ricefish plot
• Income from pond production
• Reduced operational cost of riceplot due to reduced use of pesticides and fertilizers
• Reduced distress sale of rice
• Reduced cash expenditure on food purchase
• Secondary adoption without external monetary input
• Spread of knowledge FFS participants to non-participants
• Tenure of ricefish plot
• Access to irrigation pump
• Collection of common carp eggs and tilapia broodfish from neighbouring ponds
• Gifting seed and foodfish to relatives and neighbour
• Informal network with fry traders
• Informal network with foodfish traders and market
Inst
ituti
onal
med
iati
on
Livelihood assets before adoption of RBFSP
Changes of livelihood assets after adoption of RBFSP
H
N F
S
P
H
S
F N
P
Social capital
Natural capital
Physical capital
Human capital
Financial capital

Chapter 8
382
Knowledge generation that could foster the better utilization of capital assets is very
important for overall development. As evidenced by previous studies, poor countries and
poor people differ from rich ones not only because they have less capital but also less
knowledge. Knowledge is often costly to create, and that is why much of it is created in
industrial countries. Developing countries can however, acquire external knowledge as
well as create their own. For instance, forty years ago Ghana and the Republic of Korea
had virtually the same income per capita. By the early 1990s Korea's income per capita
was six times higher than Ghana's. Half of this difference can be attributed to Korea's
greater success in acquiring and using knowledge (World Bank, 1998).
In the present study, knowledge of fish seed production technology was developed by
the farmers on the basis of available natural resources in their farm households. In rural
household ponds, common carp produce a large amount of fertilized eggs at the onset of
the boro season following certain climatic and physical conditions (e.g. presence of
adequate water quality, temperature and vegetation). Initially fish seed production was
promoted by encouraging the use of fertilized common carp eggs obtained from farmers’
household ponds. Later on improved strain of Nile tilapia (GIFT) seed production has
been adopted alongside common carp in the same ricefield system. The combination of
tilapia and common carp fostered decentralised seed production systems through
increased production, sale, household level consumption and income (Barman et al.
2004). Sustainable agricultural development requires more than just acquisition of
ecological knowledge by individual farmers. It also requires development of the
capability to generate, adapt and extend this knowledge within farming communities
(Tripp and Louwaars, 1997).

Chapter 8
383
8.2.2 Participation of household member in RBFSP
The present study (Chapter 4) showed that RBFSP is a male dominated activity carried
out by the household head and his son (s). Previous studies reported that 44% of the
labour force in the crop sector of Bangladesh was surplus (Hossain, 1991). Involvement
of household males in seed production activities suggests the use of surplus family
labour in productive activities. Fish seed production activities did not require much time
or appear to conflict with other agricultural activities of farming households. This was
due to that RBFSP was not a standalone activity for the farmers rather the activity was
carried out with their traditional ricefield based activities in which they spent most of
their working time.
Investigations carried out to understand the seasonal dimensions (Chapter 4) and the
adoption process (Chapter 6) showed that women also contributed their time to RBFSP
activities in addition to their domestic activities. Despite the nearly equal sex ratio of the
Bangladeshi population, society is still characterized by patrilineal and patrilocal family
dynamics, where a strict division of labour and a systematic bias towards male
dominance and superiority exists (Nazneen, 2004). Traditionally women work within the
boundary of purdah (seclusion) (Kabir, 1999). In recent years however, relatively poorer
people have started to act against purdah, to engage themselves in activities outside the
homestead consequently, their role in agriculture is gradually expanding (Mallorie,
2003).
The involvement of women in fish seed production activities appears to be an extension
of their traditional activities which have been facilitated by the most favoured location of
the riceplot being in the vicinity of their homesteads (Chapter 3). In the development and
biological diversity discourse there is a growing consensus that women’s knowledge and
practices are not only necessary and relevant, but also essential for sustainable

Chapter 8
384
development (Oakley and Momsen, 2005). In Bangladesh, although men are most active
in field preparation and planting, women are very important in post-harvest processing
and seed management activities of field crops (Abdullah and Zeidenstein, 1982; Elahi,
1998; Safilios-Rothschild and Mahmud, 1989; Scott and Carr, 1985) and in primary
management of home gardens (Shah and Nuri, 2000; Wilson, 2003). Women also play a
unique role in household poultry breeding which reflects their important function in
relation to seed production (Juma, 1989). The contribution of women to traditional seed
management practices for crops and poultry coupled with RBFSP deserves further
attention during fish seed development interventions.
Children, along with women were also found to contribute to fish seed production
activities including looking after of riceplot, harvesting of fish from riceplot etc.
(Chapter 4 and 6). Harvesting of large size tilapia fingerlings was also carried-out by
children in farming households. Tilapia is highly responsive to angling for harvesting
from ricefields which was reported as a recreational activity for the children (Barman et
al. 2004). Involvement of children shows potential to develop knowledge of this
technology at the primary level education which has been expanded throughout the
country over the years. Food for education programme in Bangladesh has increased the
presence of students at the primary schools substantially (Hossain et al. 2005). Creating
knowledge of such natural resource management at primary level could be a useful
strategy for the students who cannot continue their study after primary education due to
poverty and subsequently taking part in agricultural activities. Eventually, as farmers
they could adopt RBFSP as part of their agriculture activities in their livelihood systems.

Chapter 8
385
8.3 Impacts on natural and physical capital thorough farm diversification
8.3.1 Ricefields
Ricefields were considered as natural capital as farmers did not make any changes
except to dig a small ditch at a corner of ricefield. The present study confirmed higher
dependencies of households on rice-based activities occupationally (Chapter 3), mono-
crop rice cultivation agriculturally (Chapter 3), and rice-based food nutritionally
(Chapter 4). Occupationally agricultural dependence was due to the limited scope of
non-farm activities in the study area, which was also common phenomenon in other
rural areas of Bangladesh (Gill, 2002). The later dependencies were due to limitations in
available land, growing population and a dietary reliance on rice (Oakley and Momsen,
2005). In order to increase production of rice and to ensure that yields keep pace with
demand, Bangladesh had to adopt high yielding rice varieties for higher production
(Oakley and Momsen, 2005). Cultivation of high yielding rice varieties imposed threats
to crop diversification as it was grown in 75% of the total crop area. Fields that were
previously sown with blackgram, mustard seed, wheat, barley, millet, and spices have
been displaced by high yielding rice varieties (Oakley and Momsen, 2005). Such lack of
diversification has been recognised as a basic limitation of agricultural development in
Bangladesh (Rasul and Thapa, 2004). The basic purposes of farm diversification are to
improve natural resource efficiency, increase productivity and increase sustainability of
human food. Considerable potential exists for aquaculture through integrated
diversification in Asia, with notable improvements in the livelihoods of rural small-scale
farmers (Prein, 2002).
In this potential context, RBFSP contributed to crop diversification with various
livelihoods benefits (Chapter 3 and 4). In general, diversifying crops simultaneously or
sequentially can yield valuable benefits and relatively simple practices can be taken up

Chapter 8
386
quite widely. Various forms of diversification can be recognized however it is not
practical to generalize them with respect to the demand of labour, skills and other inputs
(Muir, 2005). Diversification of fish seed production simultaneously with irrigated rice
required very little labour or monetary inputs (Chapter 3, 4 and 6). Diversification, can
also reduce the available area for staple food production (Little and Edwards, 2003), but
seed production in ricefields did not cause any negative consequences on staple crop rice
production (Chapter 6). This is because of a win-win fundamental and complete
ecological relationship between fish and rice in ricefield (Halwart and Gupta, 2004).
Furthermore, the diversification of fish seed production in ricefields improved natural
capital (Figure 8.1) with direct and indirect benefits. Apart from many direct benefits
(e.g. fingerling production, income etc.) indirect benefits contributing to natural capital
included improved nutrient cycling, reduced level of fertilizer use and elimination of the
repeated use of harmful pesticides that negatively impact on ricefield ecology (Chapter
6). A review study carried out previously in Northwest Bangladesh showed similar
findings where incorporating fish in ricefields completely stopped the use of pesticides
(Lewis, 1997).
Rain-fed rice cultivation has 4,000 years of history suggesting that traditional rice
farming is basically sustainable. However, what is less certain is whether the dramatic
increase in rice production made possible by the Green Revolution is sustainable.
Additionally, global warming and rising sea level, increased ultraviolet radiation and
other environmental consequences are predicted to have an adverse impact on ricefield
ecosystem as well as its productivity (Greenland, 1997). Culture of fish in ricefields
could possibly enhance the sustainability of rice farming, since indications are that the
presence of fish makes the ricefield ecosystem more balanced and stable (Halwart and
Gupta, 2004). In the present study, fish seed production in ricefields appeared to

Chapter 8
387
contribute to diversify the existing rice-based agriculture and to make farming
sustainable (Chapter 3, 4, 5 and 6).
8.3.2 Relationships to pond management
Ponds were considered as physical capital as they were constructed for household use
and fish culture (Little et al. 2007). RBFSP facilitated farmers to produce large sized
fingerlings and to restock into their ponds as well as into non-seed producers’ ponds.
Lewis (1997) reported that the strengthening of aquaculture programmes among
government and development organizations was hindered by the problem of availability
of fingerlings at the farmer level. He also stated that pond based foodfish producers were
often deliberately misled by the fry traders, who could sell fish at the hatchling stage
without the pond owner being able to ensure that they were receiving the correct species.
This poses additional risks to those farmers who use small sized fry. Pond operators
could protect their interests by purchasing fish seed at the fingerling stage when species
are identifiable and mortality much lower, though costs are higher and they are generally
unavailable locally due to the incentives to deliver larger seed over long distances
(Lewis et al. 1996). The use of large size fingerlings has a considerable impact on
reducing mortality as well as expenditure. Realizing this potential, the government
fisheries extension department (DoF) put emphasis on increasing awareness among the
farmers of stocking larger sized fingerlings in ponds and other waterbodies (Rahman,
Undated). Stocking of on-farm produced fingerlings has increased pond production
substantially (Chapter 3) due to the larger size and higher survival rate (Chapter 5). The
contribution of on-farm seed to increasing pond production showed a regenerative effect
on decentralised seed in farming households. Similar approaches have been suggested
by Pretty et al. (2003) to improve food production through introduction of new
regenerative elements into the farming systems such as legumes, new and locally
appropriate crop varieties and animal breeds. Increased pond production through the

Chapter 8
388
stocking of decentralised seed suggests that no separate external extension support for
pond aquaculture is required which could minimize the transaction cost being incurred
in different aquaculture extension projects in Bangladesh.
Higher production by seed producers in multi-owner ponds compared to non-seed
producers indicated the successful development of management practices of multi-owner
ponds. Multi-owner ponds had typically been sub-optimally managed and this was
identified as one of the major constraining factors for pond culture development in
Bangladesh (Gregory and Kamp, 1999a). On-farm seed production encouraged farmers
to restock into their multi-owner ponds, which possibly facilitated other non-seed
producing shareholders to consume more fish, to earn income and to reinforce the social
relationships among them. According to Barman (2000), the increased importance of
ponds as income earning assets rather than securing foods of subsistence encouraged
owners of multi-owner ponds to solve management problems through mutual
arrangements among themselves. Since seed requires a major investment in pond culture
(Mazid, 2002; Karim, 2006), such on-farm seed production could be a simulating factor
to solve the management problems of multi-owner ponds throughout the country.
8.3.3 Other waterbodies
In broader livelihood impacts studies, local level tilapia seed production was found to
contribute to increased production in large waterbodies (beel) being managed by a group
of poor people (Chapter 5). This suggests that decentralised tilapia seed production
could be critical to the intensified management of larger, often common property
waterbodies to obtain a higher production of fish. Globally tilapia has been recognized
as the third most cultured fish after carps and salmonids (van der Zijpp et al. 2007). Its
production has expanded in recent years and the annual growth of tilapia production in
1990s was above 12%. The production of farmed tilapia had surpassed 380,000 metric

Chapter 8
389
tons in 1990 to over 1500,000 metric tons in 2004 (FAO, 2006). This indicates potential
for researchers, policy makers and other developers to rethink about fish fingerling
production at the farmer level, which in turn could stimulate local foodfish producers to
engage themselves in aquaculture using unconventional waterbodies.
8.4 Impacts on food security
RBFSP provided households with opportunities for fish consumption in the deficit
months of high quality foods, especially pulse and meat. Traditionally fish and pulses
were two most important non-cereal protein supplementing food items for the poor in
Bangladesh. Rice cultivation had been expanded for increasing rice production to meet
staple food demand for increased population (Hossain et al. 2005).
The rapid expansion in rice production in Bangladesh was achieved partly through a
reduction of area and production of pulses and oilseeds (Hossain et al. 2005). Boro
production has been rising steadily, while the area under pulses fell by 12% between
1983-84 and 1990-91 and by 5% between 1991-92 and 1997-98 (Gill, 2002).
Consequently, the consumption of pulses has reduced significantly in rural areas (Rasul
and Thapa, 2004) and daily per capita intake of pulses reduced by almost half, from 11 g
during the mid 1960s to 6g during the mid 1980s (Hossain, 1991). The prices of pulses
and fish have soared over the years indicating a relative scarcity (Hossain et al. 2005). In
the context of a growing gap in protein supplementing food, fish consumption from the
riceplot assumes an even greater importance through “consumption smoothing” (Ellis,
2000). Moreover, households had to purchase pulses from the market because they did
not cultivate in their own farm. Regarding pulse consumption, farmers tended to use the
money from selling fingerlings to purchase food items (Chapter 6) suggesting the use of
money to purchase pulse in the low income months (Chapter 4).

Chapter 8
390
Year round household monitoring showed a higher level of rice consumption among the
poor than the better-off households. Through adoption of modern boro rice in the dry
season, rice production has increased rapidly, particularly since the late 1980s, and the
country is nearly self-sufficient in rice (del Ninno and Dorosh, 2001; Rasul and Thapa,
2004). Being self-sufficient in staple food-rice however, Bangladesh faces malnutrition
problem due to unbalanced diet (Ray et al. 2001). A higher level of rice consumption has
been coupled with a substantial deficit in fish, pulses, oils and livestock products that are
the main sources of protein and micro-nutrients (Hossain et al. 2005). This dependency
on rice has seriously negative implications for those with special nutritional needs,
particularly children and pregnant and lactating women (Gill, 2002). In favour of this
category of household members, small fish producing in ricefields appears to contribute
substantially to the improvement nutritional and health status (Ross et al. 2004b).
In terms of socio-economic status of households, there are considerable disparities in
fish consumption between the poor and rich households and this is believed to be
widening (Gupta and Shah, 1992). In this context, the contribution of on-farm fish as a
high quality food, particularly during periods when other substitutes are expensive or
less available, has very important nutritional implications for the poor households.
Farmers typically consumed fingerlings from their ricefields which were smaller in size
than large carps however, the relative nutritional value is higher as fingerlings were
likely to be eaten whole (Ross et al. 2004a).
8.5 Impacts on financial capital
Financial capital refers to stocks as well as flows of money. The stock financial capital
includes cash and liquid assets (e.g. livestock, jewellery etc.) whereas the regular flow of
money includes job salary, pension, remittance etc. (ADB, 2005). According to the
present study, households tended to have limited livestock as liquid financial capital and

Chapter 8
391
very few of them had regular flows of money. Agriculture, particularly the sale of rice,
was the main source of cash income in the majority of households. In farming
households most of their paddy production was used to fulfil household level food
requirements. If they earned some income from the sale of a small amount of surplus
paddy, it was mostly utilized for buying non-food items, including clothes and other
daily necessities (Rasul and Thapa, 2004). This suggests that households suffer from
cash deficits (DFID, 2004). Sometimes farmers had to ‘distress sell’ their rice usually
motivated by acute cash needs to undertake production expenditure and to repay loans
(CARE, 2001c). The present investigation of the adoption process (Chapter 6) showed
that even small income flows from selling fish seed protected households from such
distress sales.
The longitudinal survey (Chapter 4) confirmed that farmers had to combat a financial
crisis seasonally during the pre-harvest period of rice. In a previous study it was reported
that poorer households suffered from cash deficit in the slack season, that were often met
by selling animal and tree resources, thus exacerbating the cycle of poverty (Biswas et
al. 2004). The longitudinal survey showed that farmers earned money from the sale of
seed/foodfish not only at particular times but also over a number of months suggesting
the development of financial capital and a critical improvement in cash-flow. Although
amounts of money were small, fish seed revenues facilitated the farmers to cope with the
seasonal cash crisis i.e. the problem of “income smoothing” (Ellis, 2000) which not only
benefited seed producers but also fry traders. Sales of fingerlings extended over several
months of the year (Chapter 4) suggesting that the demand for fingerlings changed as
foodfish producers adopted multiple stocking strategies (Chapter 5).
Farmers were found to have received credit from different credit providing organizations
suggesting that farmers, irrespective of fish seed production status, faced financial
Chapter 8
392
constraints. Many farmers however, do not have sufficient access to credit, savings or
remittances to finance the input costs of agriculture such as seed and fertiliser. Micro-
credit is often not available to poor farmers for agricultural activities, except where there
are relatively concentrated populations and quite well-diversified economies (DFID,
2005). Many poorer households faced additional constraints to borrowing due to their
lack of collateral or the small scale of income generating activities (Biswas et al. 2004).
In many cases, lack of credit resulted in vulnerability of households with a range of
negative livelihood impacts, including decreased food and health security and the loss of
productive assets such as land and livestock. Households that had experienced difficulty
in the repayment of their debts also reported negative social impacts, ranging from
public humiliation to social exclusion within the community and including, in some
cases, problems of verbal and physical violence against women (CARE, 2005b). Credit
has been seen however, as a resource to borrower households, but also as a debt and a
risky strategy for the poorest and most vulnerable to economic stress (Rahman, 1999).
Although farmers received credit from different organizations, they did not use credit
directly for RBFSP activities, as this technology requires a negligible amount of
investment. A previous study has also shown that credit is not a precondition for
increasing fish production for most farmers in Bangladesh (Ahmed et al. 1995).
8.6 Compatibility with the poor
In order to involve poorer households directly in aquaculture as a farming practice, they
need either access to land for culture in rice fields or ponds, or to a water body for cage
culture, culture of molluscs or seaweeds, or involvement in enhanced fisheries
(Edwards, 1999b). However, the unequal distribution of land resources in Bangladesh
and the unusually high prevalence of landlessness, complicate attempts to develop the
aquaculture sector in the interests of the rural poor (Lewis, 1997). Even if under-utilised
resources are accessed by the poorer rural groups through lease or rental arrangements,

Chapter 8
393
and economic gains are achieved thorough aquaculture work, wealthier owners and
operators are likely to assert claims over such resources (Lewis, 1997). The ICLARM
action research project (which ended in 1994) in Kapasia, Bangladesh showed that
better-off farmers tended to benefit from aquaculture suggesting the need to develop
such aquaculture technologies relevant to the needs of the poor (Lewis, 1997).
In this context, fish seed production in ricefield systems is an appropriate technology for
the poor as it does not require much initial investment (Chapter 3, 4, and 6). Small-scale
pond based fish fingerling production has emerged through the development of local
nurseries in different parts of Bangladesh. These small-scale nurseries tended to be
operated by better-off rural entrepreneurs with the ability to bear initial risks in search of
high profits (Lewis, 1997). On the contrary, the present study confirmed a higher
involvement of poorer farmers in RBFSP thus suggesting relative compatibility of this
technology for the poor.
Interestingly, production efficiency (kg/ha) of fingerlings by the poor and intermediate
households was found to be higher than the better-off, suggesting the effective use of
their smaller riceplots and the importance of this technology to the low-income farmers.
Similar pattern has been shown by the poor and marginal farmers in terms of modern
variety of rice cultivation in Asian agriculture (Ellis and Biggs, 2001) suggesting RBFSP
is a poor friendly technology to produce high quality fish seed using their smaller
riceplots.
However, the longer term retention of RBFSP by poorer farmers was threatened by their
sustained access to land. Very poor and very rich households did not get involved in FFS
due to poor access to land and a reluctance toward this technology respectively

Chapter 8
394
(Chakrabarty et al. 2001) but critical components of broader network of service actors
(e.g. fry trader, foodfish producers etc.) linked to decentralised seed are important.
8.7 Development of social capital and network
Social capital relates to the formal and informal social network and relationships (or
social resources) from which various opportunities and benefits can be drawn by people
in pursuit of livelihoods (DFID, 2000). Critical benefits of social capital include access
to information, to influence or power, and to claims or obligations for support from
others (DFID, 2000). Ricefield based fish seed producers in Northwest Bangladesh
gained knowledge substantially from CARE-based farmer field school training, but the
subsequent spread of information relied on farmer-to-farmer contact and the
development of a favourable social network with and between rural communities.
Secondary adopters (Chapter 6) acquired their knowledge of seed production practices
informally through information and advice on seed production from local primary
farmers who were kin, relatives and neighbours. According to Rola et al. (2001), this
sort of informal communication for knowledge dissemination made farmer field schools
more cost-effective (Chapter 7). The relatively better-off status of secondary adopters
compared to primary adopters (Chapter 6) suggests a trickle-up extension dissemination.
As better-off secondary farmers have the ability to expand RBFSP using their available
riceplot which in turn could be shaped as an enterprise linking the livelihoods of many
poor fry traders.
Networks, cultural norms and social cooperation among rural households are important
parts of social capital (DFID, 2000). Social relationships among people led to gain
access to resources which are important to their livelihoods (Nahapiet and Ghoshal,
1998). Poorer households tended to get access to the ponds of better-off households to
collect common carp eggs to stock in their riceplots to produce fingerlings. About a

Chapter 8
395
century old literature shows that construction of ponds was the pious ambition of every
well-off Hindu and Muslim person in Bangladesh to benefit other people and livestock
in terms of using water (Gupta, 1908). Seed producing households were found to gift
seed and foodfish produced in riceplots to their relatives and neighbours. Gifting
something to relatives and neighbours is a social obligation (DFID, 2000) which
strengthens social capital.
The social resources are also formed through working and sharing of interests which
increase people’s ability to work together (DFID, 2000). The need for farmers to sell
seed and the need for fry trader to buy and sell seed means they interact which in turn
develops linkages. Local level seed production also enhanced trust between farmers and
landless local fry traders and foodfish traders. Seed producers did not find any problem
selling their seed (Chapter 5) and poor landless fry traders traded them alongside
hatchery produced seed suggesting the compatibility of decentralised with centralized
produced seed. Such relationships of trust facilitate co-operation and sometimes help in
the development of an informal safety net amongst the poor. Poor landless fry traders
tended to buy seed from producers on credit pending payment after selling seed to grow-
out pond owners. Trading of decentralised larger and hardy fingerlings locally probably
reduced risks to the business and improving safety net for poorer fry traders. A poverty
focused approach to aquaculture needs to address actors other than producers in the
network of aquaculture activities (Lewis, 1997). Such categories include the small
fingerling traders who have supplied village ponds, and the fishermen who are
traditionally hired by pond owners to harvest their pond. Both of these categories of
people working in aquaculture service roles tend to be at a lower economic status than
most of the pond owners. These groups of people were rarely addressed directly by the
development interventions in Bangladesh (Lewis, 1997). Furthermore, about one-third
of rural people are unemployed or under employed in Bangladesh, which is one of the

Chapter 8
396
major causes of poverty. Any activities that create employment opportunities (e.g.
decentralised fish seed production in ricefield) will have a higher equity effect, through a
process of chain reaction across the rural economy (Rasul and Thapa, 2004).
8.8 Adoption process of this technology
The adoption studies unpacked various technical and socio-cultural reasons responsible
for adoption of RBFSP in farming households (Chapter 6). Using ricefield produced
fingerlings for pond production was an important factor in the adoption process of this
technology which was discussed in an earlier section (8.3.2). The impacts of
conventional pond based aquaculture on livelihood improvement of poorer households is
severely limited due to higher investment costs (Wahab and Kadir, 2005) of which
fingerlings are one of the major components (Mazid, 2002; Karim, 2006).
Meeting the household’s demand for fish consumption from the riceplot was one of the
important stimulating factors for adoption of this technology (Chapter 6). Culturally fish
as a food and particularly ricefield produced fish has a core relationship in Bengali
society. For centuries fish has been central to the diet of Bangalis and ninetieth and early
twenty century historical sources show 85% to 95% of the Bangali population ate fish
and remaining minorities (e.g. Jains, Brahmins in Bihar, widows of few high castes
Hindus etc.) ate meat (Day, 1873; Gupta, 1908). A typical meal of the Bengali people
consists of a plate of rice to which relatively a small portion of fish and vegetable curries
are added (CBF, 2007). To this day fish and rice form the mainstay of the diet of the
Bengali people reinforcing the common saying: mache bhate bangali (fish and rice
make Bangali).
Fish production in ricefields showed a relationship of need for fish, with the preparation
of everyday meal for household members which is carried out solely by women (Chapter

Chapter 8
397
4). Additionally, responsibility of women is to care for the elderly and to provide quality
food items, of which fish is critical. Women are believed to possess knowledge about
food items with high nutritional and medicinal value including different plants, fruit, fish
and animals (Akhter, 2001). Previous studies on intra-household food distribution
showed disparity between household members where female members were known to
take their meal only after men and children had eaten (Hossain et al. 2005). These sorts
of behaviours and responsibilities of women indirectly influenced them to share the
decision making process with respect to the adoption of fish seed production technology.
Overall, fish as a staple of the Bengali diet has importance with respect to cultural
history and nutrition which also contribute to the adoption process of seed production
technology. Over a century ago, fish diet was encouraged as it is more wholesome than
meat and because fish is more easily digested (Day, 1873). From a nutritional point of
view, Bangladesh has some of the world’s highest rates for stunting, wasting and low
bodyweight (Gill, 2002). Micronutrient deficiencies and high intake of carbohydrates are
likely to be increasingly limiting factors in terms of improving nutritional status.
Nutrient deficiencies in the diet limit growth and can lead to cognitive problems and
increased morbidity (Gill, 2002). Domestic agriculture like fish seed production leading
to food production will therefore have to continue to provide the bulk of the country’s
growing food needs using limited land resources. Further assessment anthropometrically
could unpack the differences in health condition of RF and NRF households.
Increased production of self recruiting species (SRS) in riceplots stimulated FFS farmers
to adopt the RBFSP technology which has a close relationship with enhanced food
production and biodiversity. In ricefields, pesticide use not only eradicate nuisance
insects but also beneficial ones, thereby reducing species diversity and ability of rice to
withstand further pest attacks (FAO, 2000b). On the contrary, fish production enhances

Chapter 8
398
whole ricefield ecosystem through reduction and elimination of pesticide use, this helps
to support biodiversity by increasing wild fish (ITAD/ODI/OPM, 2001). The SRS catch
is used mainly for consumption within the household and often accounts for a large part
of animal protein intake in Asia having high nutritional value, especially important
during the dry season when access to other waterbodies becomes limited (Morales et al.
2005). A similar finding was found through the longitudinal survey (Chapter 4), where
there was a large catch consisting of SRS and other fish from the riceplot during the
hungry months of September and October.
Elimination of the use of pesticides from the ricefield to reduce cost was one of the
important reasons for adoption. Modern rice farming has come to depend on a great
variety of insecticides, herbicides and fungicides to control pests, weeds and diseases
respectively, and each year some 5 billion kilogram of pesticides active ingredients are
applied to farms throughout the world (BAA, 2000). Many development projects across
the globe gained success in the reduction of pesticide use applying integrated pest
management (IPM) tools in ricefields (Pretty et al. 2003). The most widely applied tool
of IPM was use of reduced levels of pesticide spray (Van den Berg, 2004). Applying
such IPM tools through the FFS approach, farmers became able to grow rice entirely
without pesticides: 25% of FFS participants in Indonesia, 20-33% in the Mekong Delta
of Vietnam and 75% in parts of the Philippines (Pretty et al. 2003). In the present study
rejection of pesticide use by almost all of the RF farmers indicates how effective RBFSP
is as an IPM tool and how it should be included at the heart of IPM in rice production.
The pesticide residues absorbed by rice grains in Bangladesh could concentrate in the
human body at the rates of up to 15 times higher than the WHO recommends (FAO,
2000b). As fish seed production could reduce pesticide use significantly, pesticide free
rice production is another important outcome of RBFSP. In the Bangladeshi market

Chapter 8
399
there is currently no premium for pesticide free products (Rasul and Thapa, 2004). In
recent years however, a number of supermarkets have appeared in the capital city,
Dhaka as well as in other large cities (Shepherd, 2005) where health conscious people
shop. In the near future, pesticides free rice will probably be economically attractive, if
increasingly health-concerned urban people will be ready to pay higher prices (Rasul
and Thapa, 2004). Thus in future, a higher value rice crop might encourage fish seed and
foodfish production increasing its attractiveness to new entrants in rural communities.
8.9 Rejection and sustainability of technology
As with the adoption process, rejection of this technology was the result of complex
socio-cultural reasons. Farmers not attempting the RBFSP technology had no access to
land. The early rejection was often caused by conflicts with non-farm activities. Long-
term adoption was hindered by changes of land tenure of farming households. A
considerable proportion of poor ricefish farmers gained access to riceplots to produce
fish seed through weak tenural arrangements (Chapter 3). But changes in tenure
arrangements such as loss of leases and sharecropping tenure (Chapter 6) were common
after some time. Losing access to land was found to be an important vulnerability factor
for poorer households in Northwest Bangladesh (CARE, 2005b) severely affecting
livelihoods of many rice (only rice) producing poor households (Awal, 2003).
In terms of sustainability, similar problems were experienced by many development
projects across the globe where landlord had taken back land from tenants who had
adopted more sustainable agriculture (Pretty et al. 2003). In the case of pond based
aquaculture in Bangladesh, eviction was found to be common when access was not
secure, and interrupted operations can result in the loss of investment from which the
poorer cannot recover (ADB, 2005). Eviction of the poor from access rights to riceplots
is not likely to cause major loss as initial monetary investment is very low. However, for

Chapter 8
400
RBFSP, access and tenure rights to riceplot are the major prerequisites. When the
landless gain access to riceplots through sharecropping and other access arrangements,
secure access rights are critical. Without binding, long term arrangements on access
rights, poor seed producers are vulnerable (ADB, 2005).
Tenant rights, including securing tenure are enshrined in legislation however, these are
currently almost invariably ignored in practice and where there is a scope for
intervention. Measures are also in place for landless people to prioritize their access to
alluvial areas of government owned land as well as to a range of waterbodies. NGOs
concerned with land access issues have tended in recent years to focus their attention on
the different means by which these rights may, in practice, be secured (CARE, 2003b;
ADB, 2005). As with this intervention in government owned land, NGOs however,
could take motivational programmes to the better-off farmers to secure access of the
poor to ricefields.
Changed ricefish plot tenure was also affected by family separation which was one of
the important reasons for rejection of this technology by farmers after long term
practice. Hossain (2005) argued that there should be long term planning for sustaining
access to land for the poor towards the overall development of agriculture. Land area
managed by rural households declined from 9.2 million ha in 1983-84 to 8.2 million ha
in 1996, indicating that on average 82,000 ha of land is going out of cultivation every
year. At the same time, the number of farming households has increased from 11 to 12.7
million, leading to an agrarian structure dominated by small and marginal farmers.
Furthermore, the medium and large holdings are becoming subdivided under population
pressure, leading to an increase in the number of small and medium farms. In 1996,
small and marginal farms with holdings of less than 1.0 ha accounted for 81% of farms,
operating 41% of the cultivated area (Hossain et al. 2005).

Chapter 8
401
In an analysis of household expenditure, it was observed that ceremonial/festival costs
had greatly increased and were linked to excessive expenses during the marriage of
daughters and dowry payments. Since 1990s, trends in increased level of payments for
dowry had severely affected rural households in Bangladesh (Davis, 2007). It is a
common long term economic shock for the household as it needs to be arranged through
credit and repayment of credit takes 5-6 years (CARE, 2005b). Some farmers were
found to lease out or sell all riceplots to pay the marriage dowry which then resulted in
rejection of this technology. Although there is strong legal measure to control dowry, it
is not respected as a whole (CARE, 2005b).
8.10 Promotion of RBFSP technology
RBFSP technology was not promoted as a single technology in FFS but rather promoted
as a part of several technologies aiming at reduced external dependence and enhancing
sustainability of ricefield management. Expenditure for farmer level training,
particularly for the training of RBFSP, was estimated as a small amount out of the whole
programme budget. This suggests the dissemination of RBFSP technology per se
requires limited extension support. As a result, adoption of this technology and practices
was achieved through the participatory and problem-solving approach among FFS
farmers, which served as the focal strategy for extension activities within the community
(CARE, 2001c).
The FFS approach evolved after realization of the many drawbacks of previous top-
down trickle down extension approach. In the trickle down approach, there have been a
number of criticisms, chiefly that while ‘lead’ farmers are given incentives to pass on
their training (and are often drawn from among the better-off farmers), there is little
motivation for the next group of farmers to continue the trickle down process (Lewis,
1997). In the FFS approach, the secondary adoption that occurred appeared to be a

Chapter 8
402
‘trickle up’ effect resulting from the exposure of non-participants to the new practices
and activities embraced by direct project beneficiaries. The selected and trained farmer
leaders were expected to act as informal extension agents within the community and to
develop links between field school activities, community members, and local networks
and institutions. Partnership with local NGOs attempted to develop and foster
geographically broader and lower cost replication of project extension approaches
(CARE, 2001c). In terms of sustainability, however (Chapter 7), the partner NGOs did
not continue the FFS programmes after withdrawal of CARE support because of their
limited capacity and risk taking ability.
In the Department of Fisheries (DoF), the main government aquaculture extension
authority in Bangladesh, insufficient capacity is available to carry out such FFS
programmes. In DoF there is a little evidence that the official extension service offers
much of value to local fish farmers. There is only one extension officer, with two staff,
for each Thana/Upazila (sub-district), each of which can contain around a quarter of a
million people. Official extension staffs tend to be office-based and rooted within an
institutional culture which hinders their extension activities (Lewis et al. 1996). On the
contrary, the Department of Agriculture Extension is a large organization with large
numbers of root level staff able to provide farmers with an extension service. Therefore,
in collaboration with NGO and DAE, DoF could take the initiative to disseminate this
technology at the farmer level to give a wider coverage in the high potential parts of
Bangladesh.
Value addition through supply of good quality tilapia broodfish in FFSs through CARE
Interfish and Go-Interfish projects, could scale-up the benefits which based on per unit
investment, greatly surpass the benefits of a centralised mono-sex tilapia hatchery in
terms of total economic value and equitable development. Timely supply of good quality

Chapter 8
403
tilapia broodfish was identified as an important prerequisite for promotion of this
technology in new areas (Barman, 2000) as well as in established areas to ensure genetic
quality remains constant. Long term supply of broodfish from any single centre to
farmers in distant areas might be problematic. Maintaining good quality strains is also an
issue which can be difficult because of the relative ease of contamination with feral
strains (Barman, 2000). Evidence shows that uncontrolled introduction, accidental or
intentional release of good quality tilapia in rivers and streams has led to genetic
contamination through free cross-breeding of wild dwelling populations. Such
contaminated brood of tilapia that reproduce at small sizes has resulted in low growth
rates of fry when stocked in village ponds in Fiji (Lal and Foscarini, 1990). Locally
based competent NGOs therefore, could take the initiative to supply germplasm. For
instance, in case of crop germplasm in developing countries, many government seed
companies and an increasing number of NGOs in recent years have set up schemes to
involve small farmers in seed production. Small farmers are involved as contract
growers and provided with source seed by the organizer of the scheme. They are then
supervised in the production of a seed crop following formal field standards usually laid
down by the national seed certification authority. The farmer involvement with the crop
ends after harvest when it is sold to the scheme organizer for a premium above
prevailing grain prices. The organizer then takes responsibility for arranging the
processing and certification of the seed, and its distribution - usually using a national
input distribution network, either government- or company-run. Most of these schemes
deal exclusively with seed of modern varieties (here tilapia broodfish can be considered
as analogous of seed). The Ministry of Agriculture in Zambia runs its own scheme; the
governments of Nepal and The Gambia have mandated NGOs working locally to assure
responsibility for a substantial portion of national seed supply using smallholder seed
growers (Cromwell et al. 1992; Cromwell and Zambezi, 1993; Wiggins and Cromwell,
1995). Increasingly NGOs seeking to consolidate their rural development activities have

Chapter 8
404
started seed production projects based on this approach - often in areas where
government and private sector services fail to reach. Examples include the Mennonite
Central Committee's vegetable and soybean seed schemes in Bangladesh, and the take-
over of abandoned government seed facilities in Niassa Province, Mozambique by the
Italian NGO Crocevia (Cromwell and Zambezi, 1993). In decentralised approaches,
strategies could be developed testing various options (Chapter 7) through participatory
action research to build capacity for local competent organizations to supply quality
broodfish at the farmer level. Knowledge on improved ricefield management acquired
by both man and women in CARE Go-Interfish FFSs could lead to address gender
development involving women in promotion strategies of decentralised RBFSP. In this
connection, this could be carried out by NGOs with both institutional and physical
capacity to support the broodfish needs of households in the vicinity. Experience and
capacity in action research in the field of aquaculture and necessary resources in remote
field areas such as staff offices and training centres with ponds for keeping good quality
of tilapia broodfish are essential.
8.11 Summary and conclusion
Poverty affects the farming households in many developing countries of which
Bangladesh is one of the most densely-populated and non-industrialised countries in the
world. The increased density and on-going growth of population is reducing the
cultivable land for agricultural production. Given this loss of land and continuing
population growth, per ha food production will have to have risen by several times in
order to maintain existing and future per capita food production (Gill, 2002). Over the
years with the drive towards cereal-sufficiency, the cropping system has become
increasingly rice-dominated affecting the health and nutritional status of the poor (Gill,
2002). In the food bundle of the Bangladeshi people, just after rice, fish is the main part
of the diet contributing 63% of animal protein. Currently the major proportion of
Chapter 8
405
foodfish is derived from inland aquaculture systems which are dominated by traditional
pond based polyculture (DoF, 2005).
A supply of good quality fish seed is an important prerequisite of aquaculture which was
reportedly constrained by hatchery produced poor quality seed reaching farmers (Little
et al. 2002b; Mazid, 2002), high purchase costs of seed (Alam, 2002; Karim, 2006) and
lack of and timely seed delivery as per the farmer’s need (World Bank, 2006). Strategies
for decentralised fish seed production in ricefields have been developed and promoted in
Northwest Bangladesh towards ensuring quality seed supply in farming communities. At
the development stage of decentralised seed approach, DFID-NFEP piloted common
carp seed production in ricefields with the collaborative support of CARE-Bangladesh.
Realising the potential benefits CARE disseminated RBFSP through the FFS approach
in Northwest Bangladesh. Later the introduction of an improved strain of tilapia (GIFT)
through NFEP’s research-based trial in common carp seed producing communities
diversified the impacts of decentralised seed in farming communities (Barman et al.
2004).
There is only limited documentary evidence that aquaculture technology helps to reduce
poverty. Many projects have aimed at reducing poverty but there are few documented
examples of impacts on poverty (Edwards, 1999b). Similarly, a review of donor
experiences in about 800 livestock projects by most of the main funding agencies
indicated little evidence of sustainable impact on the poor (Anon, 1998). Most projects
were technology driven and did not support poverty focused delivery of services. The
limited documented impact on poverty was due to inadequate project approaches and
lack of impact assessment on poverty (Edwards, 1999b). In the present study however, a
poverty focused analysis of the livelihood impacts of RBFSP on both producer and non-
Chapter 8
406
producer level was carried out. Analysis shows various livelihood impacts of RBFSP on
both producer and non-producers level.
Accumulation of human capital in poorer households through improvement of
knowledge-base on ricefield management for production of fish fingerlings was very
important livelihood impact in the context of their lower level of education and technical
skill. The livelihoods benefits were not only gained by fish seed producers, but also fry
traders, foodfish producers and other beneficiaries. At the producer level, the
considerable benefits included income from sale of fingerlings and foodfish from
ricefield, increased pond production, increased level of fish consumption and social
benefits through gifting seed and foodfish to relatives and neighbours.
Towards increasing multiplier livelihood benefits, decentralised RBFSP contributed to
the improvement of physical capital (ponds) through increased levels (60%) of pond fish
production which in turn improved human capital providing increased level of nutrient
dense food (fish) and financial capital (income) in farming households. Increased pond
fish production suggests that dissemination of RBFSP could scale-up pond aquaculture
without further external extension support which could substantially minimize
transaction costs of pond-based aquaculture intervention.
Income from fish seed and consumption of fish from riceplot in low-income and hungry
months were very important seasonal impacts for the poorer households. This
contributed to the coping strategy of poorer households to reduce their seasonal
vulnerability. Involvement of poor landless fry traders in decentralised fish seed network
and their early income from RBFSP compared to hatchery produced seed showed
compatibility of RBFSP with existing hatchery based seed supply network. Fry traders
supplied ricefield produced fingerlings with in the proximity to seed producing

Chapter 8
407
communities which shorten long distance transportation and increased survivility of
fingerlings in farmers’ ponds with higher production.
The adoption and rejection processes of this technology were attributed to many
technical and socio-cultural reasons. The major reasons for adopters included
elimination of pesticide use from ricefields, reducing distress sale of rice because of
income from fingerlings selling immediately after boro harvest, meeting demand for fish
consumption of household members, gifting fish fingerlings and foodfish to their
relatives and neighbours etc. In rejection process, losing riceplot tenure was however,
the vulnerable factor to poorer households affected their adoption process RBFSP.
Considering a unit level of monetary investment, overall multiplier benefits of
decentralised seed, including the benefits of primary and secondary producers,
distributors and end users together amounted to a large value which was much higher
than that of conventional centralised hatchery.
For promotion, this technology required very minimal support in terms of external
extension and expenditure once established. The transition towards more sustainable
agriculture requires specific types of external support (Pretty et al. 2003), such as that
from locally based competent organizations that can scale-up and - out the impacts of
RBFSP identified in this study through a variety of extension approaches including i)
training framers and providing good quality broodfish, ii) training farmers and providing
them with printed literature, iii) training a farmer leader in the community, iv)
developing a one-stop aqua-shop, v) training community mosque imam and vi) using
audio-visual aids at community shop, but not limited to farmer field schools.

References
408
References
Abdullah, M. (1989) The effect of seasonality on intra-household food distribution and nutrition in Bangladesh. In: Shan, D.E., (Ed.) Seasonal Variability in Third World Agriculture: The
Consequences for Food Security, pp. 57-65. The Johns Hopkins University Press.
Abdullah, T.A. and Zeidenstein, S.A. (1982) Village Women of Bangladesh: Prospects for Change. Pergamon Press, Oxford.
Adato, M. and Meinzen-Dick, R. (2002) Assessing the impact of agricultural research on poverty using
the sustainable livelihoods framework. FCND Discussion Paper 128 & EPTD Discussion Paper 89, Food Consumption and Nutrition Division and Environment and Production Technology Division, International Food Policy research Institute, Washington DC, USA. pp.46.
ADB (2000) Showing Bangladeshi Farmers How to Grow Higher-Value Crops. News Release, Asian Development Bank, Manila, The Philippines.
ADB (2005) An Evaluation of Small-Scale Freshwater Rural Aquaculture Development for Poverty
Reduction. Operations Evaluation Department, Asian Development Bank, Manila, Phillipines, pp. 164.
Adelman, C., Jenkins, D. and Kemmis, S. (1976) "Rethinking case study: notes from the second Cambridge conference". Cambridge Journal of Education 6 139-50.
Adupa, J.D.G.H. (1999) The importance of opinion leaders in agricultural production among male and female farmers of Kasenge Parish in the Mukono District of Uganda. South African Journal of
Agricultural Extension 28 32-44.
Agarwal, R. (2000) Individual acceptance of information technologies. In: Zmud, R., (Ed.) Framing the
domains of IT management, Cincinnati, OH: Pinnaflex Educational Resources, Inc..
Ahmed, M. (1999) Policy issues deriving from the scope, determinants of growth and changing structure of supply of fish and fishery products in developing countries. In: Ahmed, M., Delgado, C., Sverdrup- Jensen, S. and Santos, R.A.V., (Eds.) Fisheries Policy Research in Developing
CountriesIssues, Priorities and Needs, ICLARM Conference Proceedings, vol. 60., pp. 37-57.
Ahmed, M. (2002) An introduction to the non-profit sector in Bangladesh. London: Allavida.
Ahmed, M., Delgado, C., Sverdrup-Jensen, S. and Santos, R.A.V. (1999) Fisheries Policy Research in the
Developing Countries: Issues, Approaches and Strategies. ICLARM Conference Proceedings, Vol. 60, pp 112.
Ahmed, M., Rab, M.A. and Bimbao, M.A.P. (1995) Aquaculture technology adoption in Kapasia Thana,
Bangladesh: some preliminary results from the record-keeping data. ICLARM Technical Report TR44, Manila.
Ahmed, M. and Lorica, M.H. (2002) Improving developing country food security through aquaculture development--lessons from Asia. Food Policy 27 (2):125-141.
Ahmed, R. (1995) Liberalization of agricultural input markets in Bangladesh: process, impact, and lessons. Agricultural Economics 12 (2):115-128.
AIT (1994) Partners in development, the promotion of sustainable aquaculture. Asian Institute of

References
409
Technology, Bangkok. Thailand.
AIT (1997) Issues in developing fish seed supply. Policy paper No 1. AIT Aqua Outreach, Asian Institute of Technology, Bangkok.
AIT Aqua Outreach (1997) Hatchery development in and around Ho Chi Minh City. State of the System Report. AIT Aqua Outreach, AIT, Bangkok. 11pp.
Akhter, F. (2001) Seeds in Women’s Hands: A Symbol of Food Security and Solidarity . The Society for
International Development. SAGE Publications 44 (4):52-55.
Akteruzzaman, M., Gupta, M.V., Sollows, J.D. and Kohinoor, A.H.M. (1993) Feasibility of Integrating Aquaculture in Rainfed Ricefields and Possible Implication of Integrated Pest Management. In: dela Cruz, C.R., (Ed.) Role of Fish in Enhancing Ricefield Ecology and in Integrated Pest
Management, ICLARM Conference Proceedings 43:29-30.
Al-Mamun, M.A., Akteruzzaman, M. and Jahan, H. (2003) Comparative profitability of deep and shallow tubewell irrigation technology: A sensitivity analysis. J. Bangladesh Agril. Univ. 1 (1):171-179.
Al-Manun, M., Akbar, M.A. and Shahjalal, M. (2002) Rice Straw, It’s Qiality and Quantity as Affected by Storage System in Bangladesh. Pakistan Journal of Biological Science 1 (3):153-155.
Alam, M.F. (2002) Socioeconomic aspects of carp production and consumption in Bangladesh. pp. 83-93. In: In: Penman, D.J., Hussain, M.G., McAndrew, B.J. and Mazid, M.A., (Eds.) Proceedings of a
workshop on Genetic Management and Improvement Strategies for Exotic Carps in Asia, 12-14 February 2002, Dhaka, Bangladesh. Bangladesh Fisheries Research Institute, Mymensingh, Bangladesh. xxx p.
Alam, Md.F. and Thompson, K.J. (2001) Current constraints and future possibilities for Bangladesh fisheries. Food Policy 26 (3):297-313.
Alam, S. (2002) Production, accessibility and consumption patterns of aquaculture products in Bangladesh. http://www.sdnpbd.org Date of access on 08 June 2006.
Alam, S.M.Z., Rahman, M.M., Rahman, M.S. and Khanam, F. (2003) Socio-economic impact of Jamuna bridge on farming community in some selected areas of Sirajgonj district of Bangladesh. J.
Bangladesh Agril. Univ. 1 (1):113-125.
Alderman, H., Behrman, J.R., Kohler, H.P., Maluccio, J.A. and Watkins, S.C. (2001) Attrition in Longitudinal Household Survey Data. Demographic Research 5 (4):79-124.
Ali, A.B. (1990) Some ecological aspects of fish population in tropical rice fields. Hydrobiol. 190 215-222.
Ali, M.H., Miah, N.J. and Ahmed, N.U. (1993) Experiences in deepwater rice-fish culture. Rice Farming Systems Division, Bangladesh Rice Research Institute, Ghazipur-I 701, Bangladesh, 28 pp.
Altieri, M.A. (2000) Developing sustainable agricultural systems for small farmers in Latin America. Natural Resources Forum 24 97-105.
Amartya Sen (1999) Development as Freedom. Oxford University Press, pp. 366.
Anderson, G. (1998) Fundamentals of Educational Research. London, The Farmer Press.
Anon (1998) The integration of livestock interventions into a sustainable rural livelihoods approach,

References
410
livestock in development, pp. 93-106. In: Carney, D., (Ed.) Sustainable Rural Livelihoods, What
Contribution Can We Make?, DFID, London.
Anonymous (1985) Final Report. Chapter IV: Fisheries. Master Plan Organization. National Water Plan Project, Ministry of Brig. Water Dev. and Flood Contr, Dhaka, Government of Bangladesh.
Arens, A.A. and Loebbecke, J.K. (1981) Applications of statistical sampling to auditing. Prentice Hall Inc., Englewood Cliffs, New Jersey.
Awal, A. (2003) Advocacy Concept and Working Tools. Go-Interfish Project, CARE Bangladesh, pp.73.
BAA (2000) Annual Review and Handbook. British Agrochemicals Association, Peterborough.
Babbie, E.R. (1979) The Practice of Social Research. California: Wadsworth Publishing Compaby, Inc.
Baffes, J. and Gautam, M. (2001) Assessing the sustainability of rice production growth in Bangladesh. Food Policy 26 515-542.
Bakht, Z. (2000) Poverty Impact of Rural Roads and Markets Improvement & Maintenance Project of
Bangladesh. Paper Presented at "World Bank South Asia Poverty Monitoring and Evaluation Workshop", India Habitat Centre, New Delhi, June 8-10, 2000.
BANCID (2007) Directory of Bangladesh -Country Profile. www.icid.org Date of Access on May 15 2006
Banglapedia (2007) Islamic Foundation Bangladesh. www.banglapedia.search.com.bd Date of Access on August 23 2007
Banu, L. and Bode, B. (2002) CARE Bangladesh’s FFS Approach: New Frontiers in Farmer
Empowerment. Go-Interfish Project, CARE Bangladesh, Dhaka, p.14.
Bardhan, P., Bowles, S. and Gintis, H. (1998) “Wealth inequality, Wealth Constraints and Economic Performance”. In: Atkinson, A. and Bourguignon, F., (Eds.) Hand Book of Income Distribution, Elsevier, Amsterdam.
Barman, B.K. (2000) Assessment of Nile tilapia (Oreochromis niloticus) seed production and growout
systems for small-scale farmers in Northwest Bangladesh. Doctoral Dissertation, Asian Institute of Technology, Bangkok, Thailand.
Barman, B.K. and Little, D.C. (2006) Nile tilapia (Oreochromis niloticus) seed production in irrigated rice-fields in Northwest Bangladesh an approach appropriate for poorer farmers? Aquaculture 261 (1):72-79.
Barman, B.K., Little, D.C. and Edwards, P. (2002) Small-scale Fish Culture in Northwest Bangladesh: a Participatory Appraisal Focusing on the Role of Tilapia. In: Edwards, P., Little, D.C. and Demaine, H., (Eds.) Rural Aquaculture, pp. 227-244. Proceedings of the Special Session on Rural Aquaculture, The Fifth Asian Fisheries Forum, International Conference on Fisheries and Food Security Beyond the Year 2000, November 11-14, 1998, Chiang, Thailand, CAB International, Oxford, U.K.
Barman, B.K., Little, D.C. and Johannes Janssen (2004) Tilapia and Common carp Fingerling
Production in Rice Fields of Farmers in Northwest Bangladesh: The Adoption and Dissemination
Strategies. Working Paper 10. Institute of Aquaculture, University of Stirling, UK. pp 43.
Barman, B.K., Little, D.C. and Nietes-Sataponvanit (2002) State of the System Report: fish seed quality

References
411
in Northwest Bangladesh. pp. 69-75. In: Penman, D.J., Hussain, M.G., McAndrew, B.J. and Mazid, M.A., (Eds.) Proceedings of a workshop on Genetic Management and Improvement
Strategies for Exotic Carps in Asia, 12-14 February 2002, Dhaka, Bangladesh. Bangladesh Fisheries Research Institute, Mymensingh, Bangladesh. xxx p.
Barrett, C.B., Bezuneh, M. and Aboud, A. (2001) Income diversification, poverty traps and policy shocks in Cote d’Ivoire and Kenya. Food Policy 26 (4):367-384.
Bassey, M. (1999) Case study research in educational settings. Open university press, Celtic court, Buckingham.
Basu, K., Narayan, A. and Ravallion, M. (2001) Is literacy shared within households? Theory and evidence for Bangladesh. Labour Economics 8 (6):649-665.
BBS (2003a) Bangladesh Bureau of Statistics. Statistics Wing, Ministry of Planning, Government of the People's Republic of Bangladesh.
BBS (2003b) Report of the Household Income & Expenditure Survey-2000. Planning Division, Ministry of Planning, Government of the People’s Republic of Bangladesh, Dhaka, pp.123.
Belton, B., Little, D. and Grady, K. (2007) Reassessing Sustainable Aquaculture through the Lens of Tilapia Production in Central Thailand. Society & Natural Resources In press
Besley, T. and Anne, C. (1993) Modeling Technology Adoption in Developing Countries. American
Economic Review Papers and Proceedings 83 (2):396-402.
Beveridge, M.C.M. and Little, D.C. (2002) History of aquaculture in traditional societies. In: Costa- Pierce, B.A., (Ed.) Ecological Aquaculture, pp. 3-29. Blackwell Science, Oxford.
Biggs, S. and Matsaert, H. (2004) Strengthening poverty reduction programmes using an actor-oriented
approach: examples from natural resources innovation systems . Network Paper No.134 The Agricultural Research and Extension Network (AgREN), ODI/DFID, UK. p.19.
Biggs, S.D. (1989) Resource-Poor Farmer Participation in Research: A Synthesis of Experiences from
Nine National Agricultural Research Systems. International Service for National Agricultural Research (ISNAR), p 37.
Biggs, S.D. and Clay, E.J. (1981) Sources of innovations in agricultural technology. World Development 9 321-336.
Bindlish, V. and Evenson, R.E. (1997) The Impact of T&V Extension in Africa: The Experience of Kenya and Burkina Faso. World Bank Research Observer 12 (1):182-201.
Binswanger, H., Deiniger, K. and Feder, G. (1995) Power Distortion, Revolt and Reform in Agricultural Land Relations. In: Behrman, J. and Srinivasan, T., (Eds.) Handbook of Development
Economics, Elsevier, Amsterdam.
Biradar, D.P., Shivakumar, Nagappa and Basavanneppa, M.A. (2005) Productivity of irrigated rice as influenced by leaf color chart-based N management in the Tungabhadra Project (TBP) area in Karnataka, India. IRRN 30 (2):40-42.
Biswas, N.R. (2007) How Rice-Fish integration can lead to overall reduction in pesticide. MSc Thesis (in progress), Institute of Aquaculture, University of Stirling, UK.
Biswas, W.K., Diesendorf, M. and Bryce, P. (2004) Can photovoltaic technologies help attain sustainable

References
412
rural development in Bangladesh? Energy Policy 32 1199-1207.
Black, R.T. (1999) Doing Quantitative Research in the Social Sciences. SAGE Publications, Thousand Oaks, London, pp. 751.
Blumenthal, M. (2001) Building a workforce for the information economy. Washington, DC: National Academy Press.
Bode, B. and Howes, M. (2003 ) Social Capital in Rural Dinajpur. CARE Rural Livelihoods Programme, CARE Bangladesh, Dhaka, p.44.
Bogard, W. (2000) 'Smoothing machines and the constitution of society'. Cultural Studies 14 (2):269-294.
Bouis, H. (2000) Commercial vegetable and polyculture fish production in Bangladesh: their impacts on household income and dietary quality. Food and Nutrition Bulletin 21 (4):482-487.
Bourdieu, P. (1985) The forms of capital. In: Richardson, J.G., (Ed.) Handbook of theory and research
for the sociology of education, pp. 241-258. New York: Greenwood.
Bowling , A. (1997) Research Methods in Health. Open University Press, Celtic Court, Buckingham, UK.
Brodhead, T. (1987) NGOs: In One Year, Out the Other? World Development 15 1-6.
Brokensha, D.W., Warren, D.M. and Werner, O. (1980) Indigenous Knowledge Systems and
Development. University Press of America, Lanham.
Brown, D. (2003) The impact of fisheries extension and training on the livelihoods of the poor in
Bangladesh. (Fisheries Training and Extension Project Phase II). FTEP-II, Dhaka, Bangladesh, p. 8.
Brown, K.H., Black, R.E., Becker, S., Nahar, S. and Sawyer, J. (1982) Consumption of foods and nutrients by weanlings in rural Bangladesh. Am J Clin Nutr 36 878-889.
Bryman, A. (2001) Social Research Methods. Oxford University Press, pp. 540.
Burt, R.S. (2001) Structural Holes versus Network Closure as Social Capital, pp1-27. In: Lin, N., Cook, K.S. and Burt, R.S., (Eds.) Social Capital: Theory and Research, Aldine de Gruyter.
Bush, S.R. (2004) A Political Ecology of Living Aquatic Resources in Lao PDR. Doctoral Thesis, School of Geosciences, University of Sydney, Australia. p.359.
Byerlee, D. (1998) The search for a new paradigm for the development of national agricultural research systems. World Development 26 (6):1049-55.
Caffey, R.H., Kazmierczak, R.H., Romaire, R.P. and Avault, J.W. (1998) Indicators of aquaculture
sustainability: a Delphi survey. Presented at World Aquaculture ’98; Las Vegas, Society, the National Shellfisheries Association and the Fish Culture Section of the American Fisheries Society. Book of Abstracts p. 91.
Cai, R.K., Ni, D.S. and Wang, J.G. (1995) Ricefish culture in China: the past, the present, and the future. In: MacKay, K.T., (Ed.) RiceFish Culture in China, IDRC, Ottawa, Canada, pp. 314.
Cain, T.M. (1977) The Economic Activities of Children in a Village in Bangladesh. Population and

References
413
Development Review 3 201-227.
Cain, T.M. (1991) The Activities of the Elderly in Rural Bangladesh. Population Studies 45 189-202.
Cain, T.M., Khanam, S.R. and Nahar, S. (1979) Class, Patriarchy, and Women’s Work in Bangladesh. Population and Development Review 5 (3):405-438.
Campbell, J. (2003) Sustainable livelihoods for the coastal poor: a research participation framework. Integrated Coastal Management. Kakinada, India.
CARE ( 1998) Effectiveness of Delivery Mechanisms, Quality and Magnitude of Secondary Adoption,
Effectiveness of Linkage-Net works and Pilot Interventions. LIFE-NoPest PhaseII Project, CARE Bangladesh, Dhaka, p.27.
CARE (2000) Farmer Field School Training Manual. Go-Interfish Project, CARE Bangladesh, Dinajpur, Bangladesh.
CARE (2001a) Integrated RF II-Qualitative Project Impact Assessment: A Livelihood Review (Volume I). CARE Bangladesh & DFID, Dhaka, Bangladesh. 73 pp.
CARE ( 2001b) Integrated RF II-Qualitative Project Impact Assessment: A Livelihood Review (Volume
II). CARE Bangladesh & Department of International Development, Dhaka, Bangladesh. 160 pp.
CARE (2001c) Paddy, fish and vegetable marketing systems in northwest Bangladesh: current situation
and opportunities for intervention. Consultancy report prepared for CARE, Bangladesh, Natural Resources Institute, University of Greenwich, Chatham, UK. pp 119.
CARE ( 2002) The findings of the northwest rural livelihoods: baseline-2002. Livelihoods Monitoring Project (LMP), CARE, Bangladesh, pp108.
CARE ( 2003a) Financial Information: Annual Report-2003. CARE Bangladesh, Dhaka, Bangladesh.
CARE ( 2003b) Land policy and administration in Bangladesh: a literature review. Care rural livelihoods programme, CARE Bangladesh, p.31.
CARE ( 2005a) Debt and Vulnerability in Northwest and Southeast Bangladesh: A Cross-Regional
Comparison. Livelihoods Monitoring Unit (LMU), CARE-Bangladesh, Dhaka, pp 16.
CARE ( 2005b) Debt and Vulnerability in Northwest Bangladesh. Livelihoods Monitoring Unit (LMU), CARE-Bangladesh, Dhaka, pp 57.
CARE (2005c) Putting rights-based development into context: CARE’s Programming approaches in
Malawi and Bangladesh. CARE Bangladesh, Dhaka, Bangladesh.
CARE ( 2006) Participant Coverage on Rice-fish. Annual Report, CARE Bangladesh, Dhaka.
Carney, D. (1998) Sustainable rural livelihoods. What contribution can we make? Papers presented at the DFID Natural Resources Advisers’ Conference, July 1998. DFID, London.
Carney, D. (1999) Livelihood approaches compared. DFID, London.
Casley, D.J. and Lury, D.A. (1987) Monitoring and evaluation of agriculture and rural development
projects. Baltimore and London: Johns Hopkins University Press (published for the World Bank).

References
414
CBF (2007) Culture of Bangladesh. http://www.virtualbangladesh.com Date of access on 20 March 2007.
Chakrabarty, S., Ara, S.Z., Awal, A. and Lewinsky, T. (2001) Training on well-being analysis and
participants selection: facilitators guide. Go-Interfish Project, CARE Bangladesh, Dhaka, p.11.
Chambers, R. (1982) “Health, agriculture and poverty: Why seasons matter”. Journal of Development
Studies 18 (2):217-238.
Chambers, R. (1992) Rural Appraisal: Rapid, Relaxed and Participatory. Institute of Development Studies, Discussion Paper No. 311. Brighton.
Chambers, R. (1997) Whose reality counts? Intermediate Technology Publications: London.
Chambers, R. and Conway, G.R. (1992) Sustainable rural livelihoods: practical concepts for the 21st
century. IDS Discussion Paper No. 296.: IDS, Brighton.
Chambers, R. (1994) Participatory Rural Appraisal (PRA): Analysis of Challenges, Potentials and Paradigms. World Development 10 1437-1454.
Chen, T.P. (1954) The culture of tilapia in rice paddies in Taiwan. Jt. Comm. Rural Recontr. China Fish. Ser. 2. 29 p.
Clark, N., Hall, A., Sulaiman, R. and Naik, G. (2003) Research as Capacity Building: The Case of an NGO Facilitated Post-Harvest Innovation System for the Himalayan Hills. World Development 31 (11):1845-1863.
Coche, A.G. (1967) Fish culture in rice fields: a worldwide synthesis. Hydrobiologia 30 (1):1-44.
Coleman, J.S. (1988) Social capital in the creation of human capital. American Journal of Sociology 94 (Suppl.):94-120.
Conley, T.G. and Udry, C.R. (2000) Learning About a New Technology: Pineapple in Ghana. Economic Growth Center, Yale University Center Discussion Paper No. 817.
Cornwall, A. and Jewkes, R. (1995) What is participatory research? Soc. Sci. Med. 41 (12):1667-1676.
Cox, A., Farrington, J. and Gilling, J. (1998) Reaching the poor? Developing a poverty screen for
agricultural research proposals. Working Paper No. 112, Overseas Development Institute, London.
Cromwell, E.A., Gurung, S. and Urben, R. (1992) The Koshi Hills Agriculture Project: An impact
assessment of the seed programme. Dhankuta, Nepal. Koshi Hills Development Programme.
Cromwell, E.A. and Zambezi. B. (1993) The performance of the seed sector in Malawi: An analysis of the
influence of organisation structure. Overseas Development Institute, London, UK.
Cummings, S. (1995) Centralization and decentralisation: the never ending story of separation and betrayal. Scand. J. Mgmt. 11 (2):103-107.
Dan, N.C. and Little, D.C. (2000) The culture performance of monosex and mixed-sex new-season and overwintered fry in three strains of Nile tilapia (Oreochromis niloticus) in northern Vietnam. Aquaculture 184 (3-4):221-231.
Davies, R. (2003) Network perspectives in the evaluation of development Interventions: more than a

References
415
metaphor. Paper presented in the conference “New Directions in Impact Assessment for Development: Methods and Practice” EDAIS Conference November 24-25, 2003.
Davis, F.D., Bagozzi, R.P. and Warshaw, P.R. (1989) User acceptance of computer technology: A comparison of two theoretical models. Management Science 35 (8):982-1003.
Davis, P. (2007) Discussions among the poor: Exploring poverty dynamics with focus groups in
Bangladesh. CPRC Working Paper 84, Chronic Poverty Research Centre, Manchester, UK. pp.22.
Dawson, C. (2002) Practical Research Methods. How To Books Ltd, Newtec Place, Oxford, United Kingdom, pp 158 .
Day, F. (1873) Report on the Fresh Water Fish and Fisheries of India and Burma. Calcutta: Office of the Superintend of the Government Printing.
de Graaf, G.J. and Marttin, F. (2000) The importance of fishing for different social strata in rural
Bangladesh, experiences of the CPP project. Paper presented at an internet conference on aquatic resources management for sustainable livelihoods of poor people.
De Janvry, Gordillo, A.G., Sadoulet, E. and Platteau, J. (2001) Access to Land, Rural Poverty and Public
Action. Oxford University Press, Oxford.
De Silva, S.S. (2001) A global perspective of aquaculture in the new millennium. In: Subasinghe, R.P., Bueno, P., Phillips, M.J., Hough, C., McGladdery, S.E. and Arthus, J.R., (Eds.) Aquaculture in
the Third Millennium, Technical Proceedings of the Conference on Aquaculture in the Third Millennium, Bangkok, Thailand, 20-25 February 2000. pp. 431-459. NACA, Bangkok and FAO, Rome.
Deaton, A. (1997) The analysis of household surveys: A Microeconomic Approach to Development
Policy. World Bank Publications, pp. 488.
Debashish, K.S., Shirin, M., Zaman, F., Ireland, M., Chapman, G. and Nandeesha, M.C. (1999) Strategies
for Addressing Gender Issues through Aquaculture Programs: Approaches by CARE
Bangladesh. CARE Bangladesh, GPO Box 226, Dhaka 1000, Bangladesh.
del Ninno, C. and Dorosh, P.A. (2001) Averting a food crisis: private imports and public targeted distribution in Bangladesh after the 1998 flood. Agricultural Economics 25 (2-3):337-346.
dela Cruz, C.R. (1994) Role of fish in enhancing ricefield ecology and in integrated pest management. ICLARM Conference Proceedings 43. 50 pp.
dela Cruz, C.R., Lightfoot, C., Costa-Pierce, B.A., Carangal, V.R. and Bimbao, M.P. (1992) RiceFish
Research and Development in Asia. ICLARM Conference Proceedings 24. ICLARM, Manila, Philippines.
Delgado, C.L., Rosegrant, M., Steinfeld, H., Ehul, S. and Courbois, C. (1999) Livestock to 2020: the next
food revolution. In 2020 Vision Discussion Paper No. 28. International Food Policy Research Institute, Washington DC.
Delouche, J.C. (1982) Seed quality guidelines for the small farmer. In: CIAT, (Ed.) Improved seed for
the small farmer, Conference proceedings, Centro Internacional de Agricultura Tropical, Cali, Colombia. pp. 26-29.
Demaine, H. (1996) Field work in the Red River Delta. Progress report. AARM Program, SERD, AIT,

References
416
Bangkok. 10 pp.
DFID (1999) Sustainable livelihood guidance sheets. http://www.livelihoods.org Date of access on 08 August 2003
DFID (2000) Glossary: Sustainable livelihood guidance sheets. http://www.livelihoods.org Date of access on 08 February 2007
DFID (2002) Subsector Analysis and Market Assessment: Fine and Aromatic Rice Subsector,
Chirrirbandar, Dinajpur. International Development Enterprises, DFID, Bangladesh. pp.64.
DFID ( 2004) Making Rural Finance Count for the Poor. Agriculture and Poverty Reduction Working Paper 3, DFID, London.
DFID ( 2005) Growth and poverty reduction: the role of agriculture. DFID Policy Paper, Department for International Development, UK, pp. 53.
Diggle, P.J., Heagerty, P.J., Liang, K.Y. and Zeger, S.L. (2002) Analysis of longitudinal data. Second edition. Oxford, Unversity Press, pp. 379.
DoF (2005) National Fish Fortnight -2005. Department of Fisheries, Ministry of Fisheries and Livestock, Government of Bangladesh, Dhaka, pp. 132.
Dolan, P., Peasgood, T., Dixon, A., Knight, M., Phillips, D., Tsuchiya, A. and White, A. ( 2006) Research
on the relationship between well-being and sustainable development: final report for DEFRA. Centre for Well-being in Public Policy, University of Sheffield, UK.
Dowlah, C.A.F. (2002) Dynamics of food-assisted development strategies in Bangladesh. Int J Soc
Welfare 11 3-21.
DSAP/ATDP-II (2005) Dynamic agribusiness focused aquaculture development. Expert consultation paper presented in the workshop held in BRAC Centre Inn, Mohakhali, Dhaka, Bangladesh on 19 April 2005.
Edwards, P. (1999a) Aquaculture and poverty: past, present and future prospects of impact. A Discussion Paper Prepared for the Fifth Fisheries Development Donor Consultation, Rome, Italy, 22-24 February 1999, pp 28.
Edwards, P. (1999b) Towards Increased Impact of Rural Aquaculture: A Discussion Paper prepared for
the First Meeting of the APFIC Ad Hoc Working Group of Experts on Rural Aquaculture. FAO Regional Office for Asia and the Pacific (RAP) Bangkok, Thailand, 20-22 October, 1999.
Edwards, P. and Demaine, H. (1997) Rural Aquaculture: Overview and Framework for Country Review. Bangkok: Food and Agriculture Organization (FAO) of the United Nations Regional Office for Asia and the Pacific.
Ekboir, L. (2002) CIMMYT 20002001 world wheat overview and outlook: Developing no-till packages
for small-scale farmers. Mexico, DF: CIMMYT.
Elahi, K.M. (1998) Home based activities and contingent work of rural women in Bangladesh. In: Ashan, A. and Nizamuddin, (Eds.) Women, work, and environment-studies in gender geography, Bangladesh Geographical Society, Dhaka 100-117.
Elias, S.M. and Hussain, M.S. (2000) Bangladesh . In: Anonymous Dynamics of vegetable production,
distribution, and consumption in Asia., Shanhua, Taiwan, Asian Vegetable Research and

References
417
Development Center, AVRDC Publication No. 00-498, p 470.
Ellis, F. (2000) The determinants of rural livelihood diversification in developing countries. Journal of
Agricultural Economics 51 (2 ):289-302.
Ellis, F. and Biggs, S. (2001) ‘Evolving Themes in Rural Development 1950s-2000s’. Development
Policy Review 19 (4):437-488.
Ellis, F. (2000) Rural Livelihoods and Diversity in Developing Countries. Oxford: Oxford University Press.
Ellis, N.E., Heal, O.W., Dent, J.B. and Firbank, L.G. (1999) Pluriactivity, farm household socio-economics and the botanical characteristics of grass fields in the Grampian region of Scotland. Agriculture, Ecosystems & Environment 76 (2-3):121-134.
Engel P.G.H. and Salmon, M. (1997) Facilitating Innovation for Development. A RAAKS Resource Box. Royal Tropical Institute, Amsterdam.
Evans, N.J. and Ilberry, B.W. (1993) The Pluriactivity, Part-time Farming, and Farm Diversification Debate. Environmental and Planning A (25):945-959.
FAO (1992) Development of large size carp fingerling production technology. Field Document, FAO, Rome, Italy.
FAO (1996) State of the World Agriculture. FAO, Rome, Italy.
FAO (1997) Aquaculture production statistics. FAO Fisheries Circular No. 815, Revision 9. FAO, Rome.
FAO (1999) FAO Technical Guidelines for Responsible Fisheries No. 8: Indicator for Sustainable
Development of Marine Capture Fisheries. Food and Agricultural Organizations of United Nations, Rome, Italy.
FAO (2000a) Selected Indicators of Food and Agriculture Development in Asia-Pacific Region, 1989-99. RAP Publication No. 2000/15.
FAO (2000b) Small ponds make a big difference. Food and Agriculture Organization of the United Nations, Rome, Italy.
FAO (2000c) International Aquaculture Meeting Plans for the Future. Food and Agriculture Organization of the United Nations, Rome, Italy.
FAO (2004) FAOSTAT statistic database. www.fao.org. Date of access on 08 March 2006.
FAO (2005) World Review of Fisheries and Aquaculture, Part-1. Food and Agriculture Organization, Rome, Italy. pp. 66.
FAO (2006) State of World Aquacultutre-2006 . Fisheries Department. FAO Fisheries Technical Paper No.500. FAO, Rome, Italy, pp.134.
FAO/ICLARM/IIRR (2001) Integrated Agriculture-Aquaculture: A Primer. FAO Technical Paper-T407, pp.149.
FAO/RAP (2000) Selected indicators of food and agriculture development in Asia-Pacific region, 1989-
1999. Bangkok, FAO Regional Office for Asia and the Pacific, pp 206.
References
418
FAP 17 (1995) Final report-Main volume . Flood Action Plan, Overseas Development Administration, UK.
Farrington, J., Carney, D., Ashley, C. and Turton, C. (1999) Sustainable livelihoods in practice: early
applications of concepts in rural areas. ODI Natural Resource Perspectives No. 42.
Faruque, G. (2007) An exploration of impacts of aquaculture production and marketing on rural
livelihoods in three regions in Bangladesh. PhD Thesis, Institute of Aquaculture, University of Stirling, UK.
Feder, G., Murgai, R. and Quizon, J.B. (2003) Sending farmers back to school: the impact of farmer field
schools in Indonesia. World Bank Policy Research Working Paper 3022, World Bank Institute, World Bank.
Feder, G., Murgai, R. and Quizon, J.B. (2004a) The Acquisition and Diffusion of Knowledge: The Case of Pest Management Training In Farmer Field Schools, Indonesia. Journal of Agricultural
Economics 55 (2):217-239.
Feder, G., Murgai, R. and Quizon, J.B. (2004b) Sending Farmers Back to School: The Impact of Farmer Field Schools in Indonesia. Review of Agricultural Economics 26 (1):45-62.
Feder, G., Richard, E.J. and Zilberman, D. (1985) Adoption of Agricultural Innovations in Developing Countries: A Survey. Economic Development and Cultural Change 33 255-98.
Fedoruk, A. and Leelapatra, W. (1992) Ricefield fisheries in Thailand. In: dela Cruz, C.R., Lightfoot, C., Costa-Pierce, B.A., Carangal, V.R. and Bimbao, M.P., (Eds.) Rice-Fish Research and
Development in Asia, ICLARM Conf. Proc. 24, pp. 91-104.
Ferro-Luzzi, A. (1990) Seasonal energy stress in marginally nourished rural women: interpretation and integrated conclusions of a multicentre study in three developing countries. Eur J Clin Nutr 44 (suppl) 41-46.
FFYP (1998) The Fifth Five Year Plan, 1998-2002. Planning Commission, Ministry of Planning, Government of Bangladesh, Dhaka.
Field, A. (2005) Discovering Statistics Using SPSS. SAGE Publication, London, pp. 779.
Fleischer, G., Waibel, H. and Walter-Echols, G. (2002) Transforming top-down agricultural extension to a participatory system: a study of costs and prospective benefits in Egypt. Public. Admin. Dev. 22 309-322.
Fowke, R. and Prasad, D. (1996) Sustainable development, cities and local government. Australian
Planner 33 61-66.
Frei, M. and Becker, K. (2005) Integrated rice-fish culture: Coupled production saves resources. Natural
Resources Forum 29 123-143.
Frei, M., Razzak, M.A., Hossain, M.M., Oehme, M., Dewan, S. and Becker, K. (2007) Performance of common carp, Cyprinus carpio L. and Nile tilapia, Oreochromis niloticus (L.) in integrated rice-fish culture in Bangladesh. Aquaculture 262 (2-4):250-259.
FRSS (2003-2004) Fisheries Resources Survey System. Department of Fisheries. Bangladesh.
Fruttero, A. and Gauri, V. (2005) The strategic choices of NGOs: Location decisions in rural Bangladesh. Journal of Development Studies 41 (5):759-787.

References
419
FTEP ( 1999) Results of the Baseline Survey of Pond Farmers, Project Report. Fisheries Training & Extension Project (FTEP II), DoF/DFID, Ramna, Dhaka. 72pp.
Fujita, K. and Hossain, F. (1995) Role of the groundwater market in agricultural development and income distribution: a case study in a northwest Bangladesh village. The Developing Economics XXXIII (4):443-463.
Garilao, E.D. (1987) Indigenous NGOs as Strategic Institutions: Managing the Relationship with Government and Resource Agencies. World Development 15 113-120.
Gauri, V. and Galef, J. (2005) NGOs in Bangladesh: Activities, resources, and governance. World
Development 33 (12):2045-2065.
Ghosh, A. (1992) Rice-fish farming development in India: Past, present and future. In: dela Cruz, C.R., Lightfoot, C., Costa-Pierce, B.A., Carangal, V.R. and Bimbao, M.P., (Eds.) Rice-Fish Research
and Development in Asia, ICLARM Conf. Proc. 24, pp. 27-43.
Gilbert, J.R. (2005) Cost-effectiveness evaluation of integrated pest management (IPM) extension
methods and programs: The case of Bangladesh. M. S. Thesis, Department of Agriculture and Applied Economics, Virginia Polytechnic Institute and State University, Blacksburg, Virginia, USA, pp 148.
Gill, G.J. (1991) Seasonality and Agriculture in the Developing World: A Problem of the Poor and
Powerless. Cambridge University Press.
Gill, G.J. (2002) Reducing Hunger or Malnutrition? The Case of Bangladesh. Paper presented in FAO FIVIMS International Scientific Symposium on ‘Measurement and Assessment of Food Deprivation and Under Nutrition’ 26-28 June 2002, Rome, Italy.
Gill, G.J. and Motahar, S.A. (1982) Social factors affecting prospect for intensified fish farming in Bangladesh. Bangladesh J. Agril. Econ. 5 (1-2):1-22.
Gittinger, J.P. (1994) Economic Analysis of Agricultural Projects. John Hopkins University Press, Baltimore.
Glantz, K., Lewis, F. and Rimer, B. (1997) Health behavior and health education. Jossey-Bass Publishers, San Francisco.
GOB (2002) National Minor Irrigation Census, 2000-2001. Ministry of Agriculture, Government of Bangladesh.
GoB/Danida (2004) Mymensingh Aquaculture Extension Component: Impact Evaluation Study. The GoB/Danida Fisheries Support Unit, Danish International Development Assistance, Dhaka, Bangladesh, p.82.
Godtland, E.M., Sadoulet, E., de Janvry, A., Murgai, R. and Ortiz, O. (2004) The Impact of Farmer-Filed- Schools on Knowledge and Productivity: A Study of Potato Farmers in the Peruvian Andes. Economic Development and Cultural Change 35 (1):63-92.
Grandin, B.E. (1998) Wealth ranking in small holder communities. ITDG, London.
Grandin, B.E. (1994) Wealth Ranking. In: Feldstein, H.S. and Jiggins, J., (Eds.) Tools for the Field:
Methodologies Handbook for Gender Analysis in Agriculture, IT Publication, London, UK.
Green, B.W., Veverica, K.L. and Fitzpartick, M.S. (1997) Fry and Fingerling Production. In: Egna, H.S.
References
420
and Boyd, C.E., (Eds.) Dynamics of Pond Aquaculture, CRC Press, Boca Raton, USA, pp. 215-243.
Greenland, D.J. (1997) The Sustainability of rice farming. CAB International, Wallingford, England, UK. pp. 273.
Gregory, R., Innes-Taylor, N.L., Guttman, H. and Little, D.C. (1997) Seed supply in Aquaculture. Policy
Paper Number 1. AIT Aqua Outreach, Asian Institute of Technology, Bangkok.
Gregory, R. and Kamp, K. ( 1999a) Aquaculture extension in Bangladesh experience from the Northwest
Fisheries Extension Project (NFEP) 1989-92. FMS and NFEP, Bangladesh.
Gregory, R. and Kamp, K. (1999b) Rice-fish culture: “green gold”. In: Griffiths, D. , (Ed.) Aquaculture
Extension in Bangladesh: Experiences from the Northwest Fisheries Extension Project 19898-
1992, pp. 61-70. Fisheries Management Support (FMS) and Northwest Fisheries Extension Project (NFEP) Dhaka, Bangladesh.
Gregory, R. and O’Riordan, B. (1999) Poverty ranking: bringing aid to the poorest. In: Griffiths, D., (Ed.) Aquaculture Extension in Bangladesh: Experiences from the Northwest Fisheries Extension
Project 19898-1992, pp. 49-60. Fisheries Management Support (FMS) and Northwest Fisheries Extension Project (NFEP) Dhaka, Bangladesh.
Griffin, K., Khan, A.R. and Ickowitz, A. (2002) Poverty and the Distribution of Land. Journal of
Agrarian Change 2 (3):279-330.
Grootaert, C. (1999) Social capital, household welfare, and poverty in Indonesia. Policy Research Working Paper 2148, World Bank, Washington, D.C.
Guan, R.J. and Chen, Y.D. (1989) Reform and Development of China’s Fisheries. FAO Fisheries Circular 822. FAO, Rome, Italy.
Gupta, K.G. (1908) Results of inquiry into the fisheries of Bengal and into fisheries matters in Europe
and America. Calcutta: The Bengal Secretariat Book Depot.
Gupta, M.V., Mazid, M.A., Islam, Md.S., Rahman, M. and Hussain, M.G. (1999) Integration of
aquaculture into the farming systems of the floodprone ecosystems of Bangladesh: an evaluation
of adoption and impact. In ICLARM Technical Report No. 56.
Gupta, M.V. and Shah, M.S. (1992) NGO linkages in developing aquaculture as a sustainable farming
activity- a case study from Bangladesh. Paper presented in Asian Farming Systems Symposium. Colombo.
Gupta, M.V., Sollows, J.D., Mazid, M.A., Rahman, A., Hussain, M.G. and Dey, M.M. (2002) Economics and Adoption Patterns of Integrated Rice-Fish Farming in Bangladesh pp. 41-53. In: Edwards, P., Little, D.C. and Demaine, H., (Eds.) Proceedings of the Special Session on Rural Aquaculture, The Fifth Asian Fisheries Forum, International Conference on Fisheries and Food Security Beyond the Year 2000, November 11-14, 1998, Chiang, Thailand, CAB International, Oxford, U.K.
Gupta, M.V., Sollows, J.D., Mazid, M.A., Rahman, M.A., Hussain, M.G. and Dey, M.M. (1996) Integrating aquaculture with ricefish farming in Bangladesh: feasibility and economic viability, its adoption and impact. In: Heidhues, F. and Fadani, A., (Eds.) Food Security and Innovations-
Successes and Lessons Learned, International Symposium, Hohenheim, Germany.
Guttman, H. (1999) Rice field fisheries - a resource for Cambodia. Naga. The ICLARM Quarterly 22
References
421
(1):11-15.
Habib, S.H., Lahiry, S., Mahtab, F.U., Khan, A.K.A. and Ali, L. (2000) Decentralization of diabetes health care delivery in Bangladesh through branch activities. Diabetes Research and Clinical
Practice 50 (Supplement 1):407
Halder, S.R. and Mosley, P. (2004) Working with the Ultra-Poor: Learning from BRAC Experiences. Journal of International Development 16 387-406.
Hall, A., Bockett, G., Taylor, S., Sivamahan, M.V.K. and Clark, N. (2001a) Why research partnerships really matter: Innovation theory, institutional arrangements and implications for developing new technology for the poor. World Development 29 (5): 783-98.
Hall, A., Bockett, G., Taylor, S., Sivamahan, M.V.K. and Clark, N. (2001b) Why research partnerships really Nelson, R.R. and Winter, S.G. (1977): In search of useful theory of innovation. Research
Policy 6 (1):36-76.
Halwart, M. (1998) Trends in rice-fish farming. FAO Aquaculture Newsletter 18 3-11.
Halwart, M. (1999) Fish in rice-based farming systems-trends and prospects, p.130-141. In: Dat Van Tran, (Ed.) International Rice Commission- assessment and orientation towards the 21st
century, Proceedings of the 19th Session of the International Rice Commission, 7-9 September 1998, Cario, Egypt, 260p.
Halwart, M. and Gupta, M.V. ( 2004) Culture of fish in rice fields. FAO and The WorldFish Center, 83 p.
Halwart, M., Borlinghaus, M. and Kaule, G. (1996) Activity pattern of fish in rice fields. Aquaculture 145 (1-4):159-170.
Hamid, A. and Shepherd, D.D. (2005) Understanding Farmers’ Decision Making on Rice Pest Management: Implications for Integrated Pest Management (IPM) Policy in Bangladesh. In: Connors, J.J., (Ed.) Educational, Extension and Research Strategies for a Changing World, pp. 503-514. Proceedings of the 21st Annual Conference, San Antonio, TX.
Hanneman, R.A. and Riddle, M. (2005) Introduction to social network analysis. Riverside, CA: University of California, Riverside.
Hansen, J.W. (1996) Is agricultural sustainability a useful concept? Agric. Systems 50 117-143.
Hanson, J. and Just, R. (2004) Evaluating a Publicly Funded, Privately Delivered Agricultural Extension
System in Honduras. Working Paper 2003-04, Department of Agricultural and Resource Economics, University of Maryland, Maryland, USA.
Hanstad, T., Brown, J. and Prosterman, R. (2002) Larger Homestead Plots and Land Reform? International Experience and Evidence from Karnataka. Economic and Political Weekly July 20
Haque, M.M., Barman, B.K., Wahab, M.A. and Little, D.C. (2005) Livelihoods impacts of rice-field
based fish seed production strategies in farming households: initial findings from the northwest
Bangladesh. Paper presented in the conference of World Aquaculture Society, Bali, Indonesia, 9-13 May, 2005.
Haroon, A.K.Y. and Pittman, K.A. (1997) Rice-fish culture: feeding, growth and yield of two size classes of Puntius gonionotus Bleeker and Oreochromis spp. in Bangladesh. Aquaculture 154 (3-4):261-281.

References
422
Harriss, J. (1993) What is happening in rural West Bengal: agrarian reform, growth and distribution. Economic and political weekly 28 (24):1237-1247.
Hawkins, N., Epstein, D., Drummond, M., Wilby, J., Kainth, A., Chadwick, D. and Sculpher, M. (2005) Assessing the Cost-Effectiveness of New Pharmaceuticals in Epilepsy in Adults: The Results of a Probabilistic Decision Model. Medical Decision Making Sep-Oct/2005 393-510.
Hayami, Y. (2000) Toward a New Model of Rural-Urban Linkages under Globalization. In: Yusuf, S., Wu, W. and Evenett, S., (Eds.) Local Dynamics in an Era of Globalization, Oxford University Press, London.
Hays, W.L. and Winkler, R.L. (1990) Statistics: probability, inference, and decision. Holt Rinehart and Winston, Inc., USA.
Hebinck, P. and Bourdillon, M.F.C. (2002) Analysis of livelihoods. In: Bourdillon M.F.C. and Hebinck. P., (Eds.) Women, men, and work: Rural livelihoods in Central-Eastern Zimbabwe, Harare: Weaver Press.
Hefferman, W.D. (1986) Review and evaluation of social externalities, new directions for agriculture and agricultural research. In: Dahlberg, K.D., (Ed.) Rowman and Allenheld, pp. 190-220. Totowa, NJ.
Helmore, K. (1998) Local know-how the right stuff. Choices 7 ( 3):6-14.
Hirschmann, A.O. (1984) Getting ahead collectively: Grassroots experiences in Latin America. New York: Pergamon.
Hoque, M.M. (1972) Information Sources used by the IRRI rice growers of Thakurgaon Thana
Cooperative Tude-well Project. MSc Thesis, Dept. of Agricultural Education, Bangladesh Agricultural University, Mymensingh.
Horstkotte-Wesseler, G. (1999) Socioeconomics of RiceAquaculture and IPM in the Philippines:
Synergies, Potentials and Problems. ICLARM Technical Report 57, ICLARM, Manila, Philippines.
Hossain, M. (1991) Agriculture in Bangladesh: Performance Problems and Prospects. University Press Ltd., Dhaka.
Hossain, M. (1998) Nature and Impact of the Green Revolution in Bangladesh. International Food Policy Research Institute & Bangladesh Institute of Development Studies joint study. IFPRI, Washington, DC.
Hossain, M., Bose, M.L., Chowdhury, A. and Meinzen-Dick, R. (2002) Changes in Agrarian Relations and Livelihoods in Rural Bangladesh: Insights from Repeat Village Studies. In: Ramachandran, V.K. and Swaminathan, M., (Eds.) Agrarian Studies: Essays on Agrarian Relations in Less
Developed Countries, New Delhi: Tulika Books.
Hossain, M., Lewis, D., Bose, M.L. and Chowdhury, A. (2003) Rice Research Technology Change, and
Impacts on the Poor: The Bangladesh Case (summary report). EPTD, Discussion Paper No. 110.Washington, D.C., International Food Policy Research Institute.
Hossain, M., Paris, T.R., Bose, M.L. and Chowdhury, A. (2004) Nature and impacts of Women’s
Participation in Economic Activities in Rural Bangladesh. CPD-IRRI Policy Brief-7, Centre for Policy Dialogue, Bangladesh.

References
423
Hossain, M., Bose, M.L. and Mustafi, B.A.A. (2006) Adoption and productivity impact of modern rice verities in Bangladesh. The Developing Economics XLIV (2):149-166.
Hossain, M., Naher, F. and Shahabuddin, Q. (2005) Food Security and Nutrition in Bangladesh: Progress and Determinants . Electronic Journal of Agricultural and Development Economics 2 (2):103-132.
Hossain, M. (2004) Poverty Alleviation through Agriculture and Rural Development in Bangladesh. Paper 39, Centre for Policy Dialogue, Dhanmondi, Dhaka, Bangladesh. pp.14.
Huisman, E.A. (1990) Aquaculture research as a tool in international assistance. Ambio 19 (8):400-403.
ICLARM ( 1999) Fisheries extension evaluation project progress report (March 1998
Mid 1999). International Center for Living Aquatic Resources Management & Department of Fisheries, Dhaka, Bangladesh.
IFPRI (2000) Impact of agricultural research on poverty reduction: An integrated economic and social
analysis. Phase II. Proposal prepared on behalf of the ISAEG/APIA by International Food Policy Research Institute, June 8, 2000.
IIRR/ICLARM (1992) Farmer-Proven Integrated AgricultureAquaculture: A Technology Information
Kit. ICLARM, Manila, Philippines and IIRR, Silang, Cavite, Philippines.
Iivari, J. (1996) Why are CASE tools not used? Communications of the ACM 19 94-103.
Ikerd, J.E. (1993) The need for a systems approach to sustainable agriculture. In: Edwards, C.A., Wali, M.K., Horn, D.J. and Miller, F., (Eds.) Agriculture and the Environment, pp. 147-160. Agric. Ecosyst. Environ.
Ikerd, J.E. (1999) Sustainable Agriculture as the Rural Economic Development Strategy . http://www.ssu.missouri.edu/faculty/jikerd/papers/sa-cdst.htm Date of access on 03 February 2005
Isham, J. (2000) The Effect of Social Capital on Technology Adoption: Evidence from Rural Tanzania. Paper Presented at the Conference on Opportunities in Africa: Micro-evidence on Firms and Households, The Centre for the Study of African Economies April 9th-10th, 2000. p.40.
ISIS ( 2004) Corporate Patents vs People in GM Rice. Institute of Sciences in Society, UK.
Islam, A.T.M.F.U. (2007) Self-recruiting species (SRS) in aquaculture: their role in rural livelihoods in
two areas of Bangladesh. PhD Thesis, (in progress), Institute of Aquaculture, University of Stirling, Scotland, UK.
Islam, M.A., Miah, M.A.M. and Haque, M.M. (1998) Use of Communication Media by the Farmers Receiving Information on Binasile Rice Cultivation. Bangladesh Journal of Nuclear Agriculture 14 21-28.
Islam, M.S. (1995) Socio-economic status of marine fishermen and their upliftment. In: Mazid, M.A., Sinha, V.R.P. and Kamal, M., (Eds.) Proceedings of the seminar on sustainable development of
marine fisheries resources in Bangladesh, pp. 58-64. Fisheries Research Institute, Cox's Bazar, Bangladesh and Food and Agriculture Organizations of United Nations.
ITAD/ODI/OPM (2001) Evaluation of DFID Support For Sustainable Agriculture. Approach Paper, pp.84.

References
424
IYRS (2003) The International Year of Rice 2004: Concept Paper. Rome: Food and Agriculture Organization of the United Nations.
Jenkins, M. (2003) Prospects of biodiversity. Science 302 1175-1177.
Jolly, C.M. and Clonts, H.A. (1993) Economics of Aquaculture. Food Products Press, London, pp. 319.
Joshi, K.D., Musa, A.M., Johansen, C., Gyawali, S., Harris, D. and Witcombe, J.R. (2007) Highly client-oriented breeding, using local preferences and selection, produces widely adapted rice varieties. Field Crops Research 100 (1):107-116.
Juma, C. (1989) Local initiatives in maintaining biological diversity. ILEIA Newsletter 4 10-11.
Kabeer, N. (1994) Reversed Realities: Gender Hierarchies in Development Thought. Verso: London and New York.
Kabeer, N. (1997) Women, Wages and Intra-household Power Relations in Urban Bangladesh. Development and Change 28 261-302.
Kabeer, N. (2001) Deprivation, Discrimination and Delivery: Competing Explanation for Child Labour
and Educational Failure in South Asia. DS Working Paper 135, Institute of Development Studies, Brighton, London.
Kabir, H. (2003) Demographic profile of the aged in Bangladesh. In M. Kabir (Ed.), The elderly-contemporary issues (pp. 6378). Dhaka: Presidency Press.
Kabir, N.N. (1999) Women in Bangladesh: Their Role as Educators. Report, UNESCO Bangladesh, p.65.
Kabir, Z.N., Szebehely, M. and Tishelman, C. (2002) Support in old age in the changing society of Bangladesh. Aging & Society 22 615-636.
Kamp, K. and Gregory, R. (1993) Rice-fish cultivation as a means to increase profitability from rice fields: implications for integrated pest management. In: dela Cruz, C.R., (Ed.) Role of Fish in
Enhancing Ricefield Ecology and in Integrated Pest Management, ICLARM Conference Proceedings 43:29-30.
Karim, A.S.M.Z. and Halim, A. (1993) Training and Visit Extension System: Some Observations. Bangladesh Journal of Extension Education, 8 (1-2):71-78.
Karim, M. (2006) The livelihood impacts of fishponds integrated within farming systems in Mymensingh
District, Bangladesh. Institute of Aquaculture, University of Stirling, Scotland, UK.
Kashem, M.A. and Halim, A. (1990) Use of Communication Media in the Transfer of Technologies to
Farmers: A Farm Level Study. Department of Agricultural Extension Education, Bangladesh Agricultural University, Mymensingh, Bangladesh.
Kent, G. (1997) Fisheries, food security, and the poor. Food Policy 22 (5):393-404.
Kerr, J. and Kolavalli, S. (1999) Impact of agricultural research on poverty alleviation: Conceptual
framework with illustrations from the literature. Environment and Production Technology Division Discussion Paper 56. International Food Policy Research Institute, Washington, D.C.
Kherallah, M., Delgado, C., Gabre-Madhin, E., Minot, N. and Johnson, M. (2002) Reforming Agriculture
Market in Africa. The Johns Hopkins University Press: Baltimore.

References
425
Kibria, A.K.M.A. (1987) Growth and development of Agricultural Extension in Bangladesh. Bangladesh
Journal of Extension Education 2 (special):7-28.
Kidd, J. (2002) Agricultural and rural livelihoods: Is globalisation opening or blocking paths out of rural
poverty? Agricultural Research and Development Network Paper No. 121. London: Overseas Development Institute.
Kishore, R. (1999) The infusion of software process innovations among information system professionals. Unpublished doctoral dissertation, Georgia State University, Atlanta, GA.
KKU (1987) Proceedings of the 1985 International Conference on Rapid Rural Appraisal. Rural Systems Research and Farming Systems Research Projects, Khon Kaen University, Thailand.
Kleih, U., Greenhalgh, P. and Oudwater, N. (2003) A Guide to the Analysis of Fish Marketing Systems
Using a Combination of Sub-Sector Analysis and Sustainable Livelihoods Framework. Chatham, UK: Natural Resources Institute, pp 87.
Koesoemadinata, S. and Costa-Pierce, B.A. (1992) Development of rice-fish farming in Indonesia: Past, present and future. In: dela Cruz, C.R., Lightfoot, C., Costa-Pierce, B.A., Carangal, V.R. and Bimbao, M.P., (Eds.) Rice-Fish Research and Development in Asia, ICLARM Conf. Proc. 24, pp. 45-62.
Kongkeo, H. (2001) Current status and development trends of aquaculture in the Asian Region. In: Subasinghe, R.P., Bueno, P., Phillips, M.J., Hough, C., McGladdery, S.E. and Arthus, J.R., (Eds.) Aquaculture in the Third Millennium, Technical Proceedings of the Conference on Aquaculture in the Third Millennium, Bangkok, Thailand, 20-25 February 2000. pp. 267-293. NACA, Bangkok and FAO, Rome.
Krishna, A. (2002) Active Social Capital: Tracing the Roots of Development and Democracy. Columbia University Press.
Krishna, A. (2003) Understanding, measuring and utilizing social capital: Clarifying concepts and
presenting a field application from India. CAPRi Working Paper No. 28, CGIAR Systemwide Program on Collective Active and Property rights, Washington, D.C.
Krishna, A. and Shrader, E. (1999) Social capital assessment tool . Paper presented in the Conference on Social Capital and Poverty Reduction The World Bank, Washington DC. USA.
Kuper, A. and Kuper, J. (1989) The Social Science Encyclopedia. pp. 135-137, London: Routledge.
Kutty, M.N. (1987) Fish culture in rice fields. Food and Agricultural Organization of the United Nations, Rome, Italy.
Lal, S.N. and Foscarini, R. (1990) Introduction of tilapia species and constraints to tilapia farming in
Fiji. Food and Agricultural Organization of the United Nations, Rome, Italy.
Lambert, P. (2005) Five approaches to longitudinal data analysis. A presentation during the Workshop on Longitudinal Data Analysis in the Social sciences. 22nd 23rd March 2005. Lancaster University, UK.
Larance, L.Y. (2001) Fostering social capital throughNGOdesign: Grameen Bank membership in Bangladesh. International Social Work 44 (1):7-18.
Larance, L.Y. and Porter, M.Y.L. (2004) Observations From Practice: Support Group Membership as a Process of Social Capital Formation Among Female Survivors of Domestic Violence. Journal of

References
426
International Violence 19 (6):676-690.
Larance, L.Y. (1998) Building Social Capital from the Center: A Village-Level Investigation of
Bangladesh’s Grameen Bank. Grameen Trust Working Paper, 33p.
Larsen, E.W., Haider, M.L., Roy, M. and Ahmed, F. ( 2002a) Impact Sustainability and Lateral Spread of
Integrated Pest Management in Rice in Bangladesh. Document SPPS 73, Department of Agricultural Extension and DANIDA.
Larsen, E.W., Haider, M.L., Roy, M. and Ahmed, F. ( 2002b) Impact Sustainability and Lateral Spread of
Integrated Pest Management in Rice in Bangladesh. Document SPPS 74, Department of Agricultural Extension and DANIDA.
Latif, M.A. (1974) How Farmers Receive Agricultural Information. M. Sc. (Ag. Ext. Ed.), Thesis, Dept. of Agricultural Education, Bangladesh Agricultural University, Mymensingh.
Laureti, E. (1998) Fish and fishery products: world apparent consumption statistics based on food
balance sheets (1961-1993). In FAO Fisheries Circular 821, Rev. 3.
Law, J. (1992) Notes on the Theory of the Actor-Network: Ordering, Strategy and Heterogeneity. Systems Practice 5 (4):379-393.
Leeuwis, C. and van den Ban, A. (2004) Communication for Rural Innovation: Rethinking Agricultural
Extension . 3rd edn, Blackwell Publishing Company, pp. 412.
Levine, L. and Fowler, P. (1995) Technology transition pull: A case study of rate monotonic analysis
(part 2). Software Engineering Institute, Carnegie Mellon University.
Lewis, D., Wood, G.D. and Gregory, R. (1996) Trading the Silver Seed: Local Knowledge and Market
Mortalities in Aquaculture development. University Press Limited, Dhaka, Bangladesh. p.199.
Lewis, D.J. (1998) Partnership as process, building an institutional ethnography of an inter-agency aquaculture project in Bangladesh, pp. 99-115. In: Mosse, D., Farrington, J. and Rew, A., (Eds.) Development as process, concept and methods for working with complexity, Routledge, London and New York.
Lewis, D. (1997) Rethinking aquaculture for resource-poor farmers: perspectives from Bangladesh. Food
Policy 22 (6):533-546.
Lewis, V. and Mulvany, P.M. (1997) A Typology of Community Seed Banks. NRI Project Report. Intermediate Technology Development Group, Rugby, UK. pp 42.
Li, K. (1992) Rice-fish farming systems in China: Past, present and future. In: dela Cruz, C.R., Lightfoot, C., Costa-Pierce, B.A., Carangal, V.R. and Bimbao, M.P., (Eds.) Rice-Fish Research and
Development in Asia, ICLARM Conf. Proc. 24, pp. 17-26.
Li, X., Huaixun, W. and Yontai. Z. (1995) Economic and ecological benefits of rice-fish culture, p. 129-138. In: MacKay, K.T., (Ed.) Rice-fish culture in China., International Development Research Centre (IDRC), Ottawa, Canada, 276 p.
Lightfoot, C., Costa-Pierce, B.A., Bimbao, M.P. and dela Cruz, C.R. (1992) Introduction to rice-fish research and development in Asia. In: dela Cruz, C.R., Lightfoot, C., Costa- Pierce, B.A., Carangal, V.R. and Bimbao, M.P., (Eds.) Rice-Fish Research and development in Asia., ICLARM Conference Proceedings 24:1-10.

References
427
Lightfoot, C., Roger, P.A., Cagauan, A.G. and dela Cruz, C.R. (1993) Preliminary steady-state models of a wetland ricefield ecosystem with and without fish. In: Christensen, V. and Pauly, D., (Eds.) Trophic Models of Aquatic Ecosystems, ICLARM Conference Proceedings 26, pp. 5664. ICLARM, Manila, Philippines.
Lightfoot, C., van Dam, A.A. and Costa-Pierce, B.A. (1992) What’s happening to the rice yields in rice-fish systems?, p. 177-184. In: De la Cruz, C.R., Lightfoot, C., Costa-Pierce, B.A., Carangal V.R. and Bimbao, M.P., (Eds.) Rice-fish research and development in Asia., ICLARM Conf. Proc. 24, 457 p.
Lindner, R.K. (1987) Adoption and diffusion of technology: an overview. In: Champ, B.R., Highly, E. and Remenyi, J.V., (Eds.) Technological Change in Postharvest Handling and Transportation of
Grains in the Humid Tropics. ACIAR Proceedings No. 19, Australian Centre for International Agricultural Research, Canberra, pp. 144-151.
Lipton, M. and Longhurst, R. (1989) New Seeds and Poor People. John Hopkins University Press, Baltimore, 473 pp.
Little, D.C. (2004) Delivering Better Quality Tilapia Seed to Farmers. In: Bolivar, R.B., Mair, G.C. and Fitzsimmons, K., (Eds.) New Dimensions on Farmed Tilapia, 6th International Symposium on Tilapia in Aquaculture Philippine International Convention Center Roxas Boulevard, Manila, Philippines September 12-16, 2004. Pages 3-17.
Little, D.C., Barman, B.K., Critchlow-Watton, C. and Johannes (2005) Fish for life: Producing high
quality fish in rural areas of Asia, a policy brief. AFGRP, Institute of Aquaculture, University of Stirling, Stirling, FK9 4LA, UK.
Little, D.C., Barman, B.K., Haque, M.M. and Wahab, M.A. (2007) Decentralised Nile tilapia seed production. In: van der Zijpp, A.J., Verreth, J.A.J. , Tri, L.Q., van Mensvoort, M.E.F., Bosma, R.H. and Beveridge, M.C.M., (Eds.) Fishponds in farming systems, Wageningen Academic Publishers, The Netherlands, pp. 49-58.
Little, D.C. and Edwards, P. (2003) Integrated livestock-fish farming systems. Food and Agricultural Organization of the United Nations, Rome, Italy, pp 189.
Little, D.C. and Edwards, P. (2004) Impact of nutrition and season on pond culture performance of mono-sexed and mixed-sex Nile Tilapia (Oreochromis niloticus) . Aquaculture 232 (1-4):279-292.
Little, D.C., Golder, I. and Barman, B. (1999) Rice field based fish seed production-understanding and improving a poverty-focused approach to the promotion of Aquaculture in Bangladesh. AARM
Newsletter 4 (2):7-10.
Little, D.C., Karim, M., Turongruang, D., Morales, E.J., Murray, F.J., Barman, B.K., Haque, M.M., Kundu, N., Belton, B., Faruque, G., Azim, M.E., Islam, F.U., Pollock, L., Verdegem, M.C.J., Young, J.A., Leschen, W. and Wahab, M.A. (2007) Livelihood impacts of ponds in Asia - opportunities and constraints. In: van der Zijpp, A.J., Verreth, J.A.J., Tri, L.Q., van Mensvoort, M.E.F., Bosma, R.H. and Beveridge, M.C.M., (Eds.) Fishponds in farming systems, Wageningen Academic Publishers, The Netherlands, pp. 177-202.
Little, D.C., MacNiven, A., Bhujel, R.C., Satapornvanit, A., Pham, A.T., Tu, N.V., Turner, W.A., Barman, B.K., Yoorong, Y. and Kosy, S. (2002a) Improving the quality of freshwater fish seed available
to farmers in Asia. Paper presented at the World Aquaculture Symposium, Beijing, PRC, 23 27 April, 2002.
Little, D.C., Satapornvanit, A. and Edwards, P. (2002b) Freshwater Fish Seed Quality in Asia, pp.185-
References
428
195. In: Edwards, P., Little, D.C. and Demaine, H., (Eds.) Proceedings of the Special Session on
Rural Aquaculture, The Fifth Asian Fisheries Forum, International Conference on Fisheries and Food Security Beyond the Year 2000, November 11-14, 1998, Chiang, Thailand, CAB International, Oxford, U.K.
Little, D.C., Surintaraseree, P. and Innes-Taylor, N. (1996) Fish culture in rainfed rice fields of northeast Thailand. Aquaculture 140 (4):295-321.
Louwaars, N.P. (1997) Seed Supply Systems in Developing Countries. Technical Centre for Ahgricultural and Rural Cooperation : Wageningen Agricultural University, Wageningen, Netherlands.
Lyon, F. (2000) Trust, Networks and Norms: The Creation of Social Capital in Agricultural Economies in Ghana. World Development 28 (4):663-681.
Macaranas, J.M., Taniguchi, N., Pante, M.J.R., Capili, J.B. and Pullin, R.S.V. (1986) Electrophoretic evidence for extensive hybrid gene introgression into commercial (Oreochromis niloticus) stocks in the Philippines. Aquaculture and Fisheries Management 17 19-34.
MacLean, J.L., Dawe, D.C., Hardy, B. and Hettel, G.P. (2002) Rice almanac: Source book for the most
important economic activity on earth. (3rd edn), CABI Publishing.
Majumder, J.R. and Shivakoti, G.P. (2004) Constraints of Tilapia (Oreochromis niloticus) Production in
Bangladesh: Looking from Socio-economic Perspective. Paper presented in the International Workshop on “Tilapia Culture in Bangladesh: Constraints and Potentials” during 4-5 April 2004, organized by PD/A CRSP at BRAC Center, Mohakhali, Dhaka.
Mallorie, E. (2003) Role of Women in Agriculture and Related Rural Livelihoods. CARE, Bangladesh.
Mandal, M.A.S. (1980) Farm Size, Tenancy and Productivity in an Area in Bangladesh Bangladesh. Journal of Agricultural Economics 3 (2):21-42.
Marra, M., Pannell, D.J. and Abadi Ghadim, A. (2003) The economics of risk, uncertainty and learning in the adoption of new agricultural technologies: where are we on the learning curve? Agricultural
Systems 75 (2-3):215-234.
Marsh, S.P. and Pannell, D.J. (2000) Agricultural extension policy in Australia: the good, the bad and the misguided. Australian Journal of Agricultural and Resource Economics 44 605-727.
Marsland, N., Wilson, I., Abeyasekera, S. and Kleih, U. (2001) Combining Quantitative (Formal) and
Qualitative (Informal) Survey Methods: Socio-economic Methodologies for Natural Resources
Research Best Practice Guidelines. Chatham, Natural Resources Institute, UK.
Matsaert, H., Ahmed, Z., Islam, N. and Hussain, F. (2004) Actor oriented tools for analysis of innovation
systems: some guidelines from experience of analysing natural resource based innovation
systems in Bangladesh. The University of Greenwich, UK, pp 18.
Mazid, M.A. (2002) Development of Fisheries in Bangladesh: Plans and Strategies for Income
Generation and Poverty Alleviation. Published by Nasima Mazid, Kallyanpur Main Road, Dhaka, Bangladesh. 176 pp.
Meinaen-Dick, R. and Adato, M. (2001) Applying the Sustainable Livelihoods Framework to Impact
Assessment in Integrated Natural Resource Management. International Food Policy Research Institute, pp. 21.
Messer, E. (1989) Seasonality in Food Systems: An Anthropological Perspective on Household Food

References
429
Security. In: Shan, D.E., (Ed.) Seasonal Variability in Third World Agriculture: The
Consequences for Food Security, pp. 151-172. The Johns Hopkins University Press.
Miah, M.A.M. (2002) Flow of agricultural information to the farmers in two selected areas of
Bangladesh. PhD Thesis, Department of Agricultural Extension Education, Bangladesh Agricultural University, Mymensingh-2202, Bangladesh.
Miah, M.A.M. and Halim, A. (1998) Demand and Supply of Agricultural Information in Rural Households in Bangladesh. Bangladesh Journal of Extension Education 10 (1&2):7-12.
Middendorp, H.A.J. (1992) Contribution of stocked and wild fish in ricefields to fish production and farmer nutrition in northeast Thailand. Asian Fisheries Science 5 (2):145-161.
Miles, M.B. and Huberman, A.M. (1994) Qualitative Data Analysis. Thousand Oaks, California: Sage Publications.
Milner, S. and Bueningen, C.V. (1993) Low Input Farming: Merits and Limits. Extracts From Ceres No.
149, FAO. 25 (6):1-14.
Milwain, G.K., Little, D.C., Kundu, N. and Immink, A.J. (2002) Overview of fish seed production and
distribution in West Bengal, India. Working Paper, Institute of Aquaculture, University of Stirling, Scotland, UK.
Mindertsma, D. (2004) ICRA-Learning Materials, Cost Benefit Analysis I, Key Concepts. International Centre for Development Oriented Research in Agriculture, Wageningen International, The Netherlands.
MOA (2004) The National Workshop for the Finalization of Draft Strategy and Action Plan for
Implementation the National IPM Policy. Ministry of Agriculture, The People’s Republic of Bangladesh.
Mondal, M.S. and Saleh, A.F.M. (2003) Evaluation of some deep and shallow tubewell irrigated schemes in Bangladesh using performance indicators. Agricultural Water Management 58 (3):193-207.
Morales, A.E.E.J. (2007) Self-recruting species in farmer managed aquatic systems (FAMS): its
importance to the livelihoods of the rural poor in south-east Asia. PhD Thesis, Institute of aquaculture, University of Stirling, UK.
Morales, A.E.E.J., Immink, A.J., Little, D.C., Lorenzen, K., UI Islam F. and Karapanagiotidis, I. (2005) Self-Recruiting Species (SRS) from farmer managed aquatic systems: their role in rural
livelihoods. DFID summary report. 12p.
Morrice, C. (1995) NW Bangladesh aquaculture extension project annual report. NFEP 2, Parbatipur, Dinajpur, Bangladesh. 52 pp.
Morrice, C.P. (1998) A Trial to Test the Suitability of a Low-Input Cost, Silver Barb (Puntius gonionotus )- Based Polyculture Model for Seasonal Ponds in Northwest Bangladesh. Asian Fisheries
Science 11 121-132.
Moser, C.M. and Barrett, C.B. (2006) The complex dynamics of smallholder technology adoption: the case of SRI in Madagascar. Agricultural Economics 35 (3):373-388.
MPO (1989) Fisheries and Flood Control, Drainage and Irrigation Development. Technical Report No. 17.

References
430
Muir, J. (2005) Managing to harvest? Perspectives on the potential of aquaculture. Phil. Trans. R. Soc. B 360 191-218.
Mukherjee, N. (1997) Participatory Rural Appraisal: Methodology and Applications. Concept Publishing Company, New Delhi, India, p. 160.
Mukherjee, R. (2004) Promoting the Pro-Poor Policy Lessons of R8100 with Key Policy Actors in India:
One-Stop Aqua Shop Planning Meeting. DFID NRSP Research Project R8334, Purulia, West Bengal, India.
Nachmias-Frankfort, C. and Nachmias, D. (1996) Research methods and the social sciences. St Martin’s Press, Inc. pp. 600.
Nahapiet, J. and Ghoshal, S. (1998) "Social capital, intellectual capital, and the organizational advantage". Academy of Management Review 23 242-266.
NAO (1992) A Practical Guide to Sampling. National Audit Office, Statistical and Technical Team, UK.
Nazneen, S. (2004) Gender Relations in Bangladesh: The Household and Beyond Dowry, Women’s
Property Rights and Salish. A literature Review, CARE Bangladesh, p.36.
NEDECO (1993) Masterpaln for Mekong Delta in Vietnam, a Perspective for Sustainable Development
of Land and Water Resources. Government of Vietnam, State Planning Committee, World Bank, Mekong Secretariat, UNDP.
New, M.B. (1999) Global aquaculture: current trends and challenges for the 21st century. World
Aquaculture 30 (1):8-13.
NFEP (2001) Northwest Fisheries Extension Project: Second Phase, 1996-2001. Experience presented at the NFEP-2 workshop, Dhaka, Bangladesh.
Nguyen, C.D. and Little, D.C. (2006) Nile tilapia seed production in ricefields in Northern Vietnam. Aquaculture Submitted
Nilsson, J., Grafstrom, M., Zaman, S. and Kabir, Z.N. (2005) Role and function: Aspects of quality of life of older people in rural Bangladesh. Journal of Aging Studies 19 (3):363-374.
Nugent, R.A. (2002) Contributions and constraints from agriculture in achieving a nutrition strategy to prevent chronic diseases. Asia Pacific J Clin Nutr 767-771.
NZAID (2002) Policy statement. New Zealand Agency for International Development, New Zealand.
Oakley, E. and Momsen, A.J.H. (2005) Gender and Agrobiodiversity: A Case Study from Bangladesh. The Geographical Journal 171 (3):195-208.
Okali, C., Sumberg, J. and Farrington, J. (1994) Farmer Participatory Research: Rhetoric and Reality. London: Intermediate Technology Publications on behalf of Overseas Development Institute.
Otsuka, K. and Kalirajan, K.P. (2006) Rice green revolution in Asia and its transferability to Africa: an introduction. The Developing Economies XLIV (2):107-122.
Pallant, J. (2001) SPSS Survival Manual. Open University Press, Buckingham, UK. pp.286.
Patrick, I., Marshall, G., Ambarawati, I.G.A.A. and Abdurrahman, M. (2006) Determining the Role of
Social Capital in Linking Smallholders with Agribusiness. Paper presented at the 50th Annual

References
431
Conference of the Australian Agricultural & Resource Economic Society, Manly Pacific Hotel, Sydney, Australia, February 8-10, 2006.
Paul, B.K. (1998) Coping mechanisms practised by drought victims (1994/5) in North Bengal, Bangladesh. Applied Geography 18 (4):355-373.
Pearce, D. (1993) Measuring sustainable development. Earthscan Publications.
Philips, M.J., Lin, C.K. and Beveridge, M.C.M. (1993) Shrimp Culture and the Environment: Lessons from the World’s most Rapidly Expanding Warmwater Aquaculture Sector. In: Pullin, R.S.V., Rosenthal, H. and Maclean, J.L., (Eds.) Environment and Aquaculture in Developing Countries, Manila, ICLARM.
Phuong, N.T.D., Tuan, P.A. and Tien, N.T.H. (2006) "Tilapia seed production in rice fields” in Peri-
urban Hanoi". PAPUSA Project, Institute of Aquaculture, University of Stirling, UK.
Pingali, P. (1992) Diversifying Asian rice-farming systems: a deterministic paradigm. In: Trends in agricultural diversification: regional perspectives.
Pingali, P.L., Moya, P.F. and Velasco, L.E. (1990) The post-green revolution blues in Asian rice
production-the diminished gap between experiment station and farmer yields. IRRI Social Science Division Pap. No. 90-01.
Pinstrup-Andersen, P. (1999) Food Policy Research for Developing Countries: Emerging Issues and
Unfinished Business. International Food Policy Research Institute, Washington, DC.
Pittaluga, F., Salvati, N. and Seghieri, C. (2004) Livelihood systems’ profiling: mixed methods for the
analysis of poverty and vulnerability, A manual. FAO, Fisheries Department, p.65.
Portes, A. (1998) Social capital: Its origins and applications in modern sociology. Annual Review of
Sociology 24 1-24.
Prein, M. (2002) Integration of aquaculture into crop-animal systems in Asia. Agricultural Systems 71 (1-2):127-146.
Pretty, J. (2003) Social capital and collective management of resources. Science 302 1912-1914.
Pretty, J.N. (1995) Regenerating Agriculture: Policies and Practice for Sustainability and Self-reliance. Earthscan Publications Limited, London.
Pretty, J.N., Morison, J.I.L. and Hine, R.E. (2003) Reducing food poverty by increasing agricultural sustainability in developing countries. Agriculture, Ecosystems & Environment 95 (1):217-234.
Price, L.L. (2001) Demystifying Farmers' Entomological and Pest Management Knowledge: A Methodology fo Assessing the Impacts on Knowledge from IPM-FFS and NES Intervention. Agriculture and Human Values 18 153-176.
Prudencio, Y.C. (1983) A village study of soil fertility management and food crop production in Upper
Volta: Technical and economic analysis. Ph.D Dissertation. Tucson, USA, University of Arizona. pp. 365.
Purba, S. (1998) The economics of rice fish production systems in North Sumatra, Indonesia: an empirical and model analysis. Farming Systems and Resource Economics in the Tropics, 31 Wissenschafverlag Vauk Kiel KG.

References
432
Putnam, R. (1993) The prosperous community: Social capital and public life. American Prospect (13):35-42.
Putnam, R. (1995) Bowling alone: America’s declining social capital. Journal of Democracy 6 (1):65-78.
Putnam, R. (2000) Bowling alone: The collapse and revival of American community. NewYork: Basic Books.
Putnam, R.D. (1993) Making Democracy Work: Civic Traditions in Modern Italy. Princeton University Press, USA.
Quizon, J., Feder, G. and Murgai, R. (2001) Fiscal Sustainability of Agricultural Extension: The Case of
the Farmer Field School Approach. Development Research Group, The World Bank, Washington, DC.
Quyen, M.V., Duong, L.T., Son, D.K., Minh, P.N. and Nghi, N.D. (1992) Ricefield aquaculture systems in the Mekong Delta, Vietnam: Potential and reality. In: dela Cruz, C.R., Lightfoot, C., Costa-Pierce, B.A., Carangal, V.R. and Bimbao, M.P., (Eds.) Rice-Fish Research and Development in
Asia, ICLARM Conf. Proc. 24, pp. 105-115.
Rahman, A.A., Huq, S., Haider, R. and Jansen, E.G. (1994) Environment and Development in
Bangladesh. The University Press Limited, Dhaka, Bangladesh.
Rahman, A.K.A. (Undated) Seed Supply for Aquaculture. In: Muir, J.F., (Ed.) Fisheries Sector Review
and Future Development: Background Papers, pp. 119-127.
Rahman, A. (1999) Microcredit Initiatives for Equitable and Sustainable Development: Who Pays? World Development 27 (1):67-82.
Rahman, M. (1998) An Economic Study of Multiple Uses of Power Tiller in an Area of Mymensingh
District of Bangladesh. M. S. Thesis, Department of Agricultural Economics, Bangladesh Agricultural university, Mymensingh.
Rahman, M. (2005) Micro Credit in Poverty Eradication and Achievement of MDGs: Bangladesh
Experience. Paper for Expert Group Meeting on “The First United Nations Decade for the Eradication of Poverty (1997-2006): Progress and the Road Ahead” organized by the Division for Social Policy and Development, Department of Economic and Social Affairs, United Nations in collaboration with the Economic and Social Commission for Asia and the Pacific, 6-7 July 2005, Thailand, Bangkok.
Rahman, M.A. (1994) Grassroots Participation and Self-Reliance. Oxford and IBH, New Delhi.
Rahman, M.A. and Fals-Borda, O. (1991) A Self-review of PAR in Action and Knowledge: Breaking the
Monopoly with Participatory Action Research . Intermediate Technology Publication.
Rasul, G. and Thapa, G.B. (2004) Sustainability of ecological and conventional agricultural systems in Bangladesh: an assessment based on environmental, economic and social perspectives. Agricultural Systems 79 (3):327-351.
Ratten, V. and Suseno, Y. (2006) Knowledge development, social capital and alliance learning. International Journal of Educational Management 20 (1):60-72.
Ray, S.K., Sabur, A. and Kamruzzaman, M. (2001) Vegetable Seed Marketing System in Some Selected Areas of Bangladesh . OnLine Journal of Biological Sciences 1 (6):524-528.

References
433
RDRS ( 2000) Annual report 1999. Rangpur Dinajpur Rural Service, Bangladesh.
RDRS (2007) RDRS-Bangladesh in Brief. www.rdrsbangla.net Date of Access on 23 October 2007.
Richardson, J.G. and Moore, C.L. (2002) Determining Extension Program Economic Benefit Value:
Extension Education: A Fact Sheet. NC State University, Raleigh, North Carolina. USA.
Rigg, J. (2006) Land, farming, livelihoods, and poverty: Rethinking the links in the Rural South. World
Development 34 (1):180-202.
Rob, A.K.U. (1995) Community characteristics, leader fertility and contraception in Bangladesh. Asia-
Pacific Population Journal 3 (2):55-72.
Roe, B., Haab, T.C. and Sohngen, B. (2004) The Value of Agricultural Economics Extension Programming: An Application of Contingent Valuation . Review of Agricultural Economics 26 (3):373-390.
Rogers, E. (1962) Diffusion of Innovations . New York, Free Press of Glencoe, USA.
Rogers, E.M. (1995a) Diffusion of Innovations. Fourth edn, The Free Press, A Division of Simon & Schuster Inc. New Yrok, USA. p 519.
Rogers, E.M. (1995b) Diffusion of Innovations. New York: the Free Press.
Rohrbach, D. and Malusalila, P. (2000) Developing rural retail trade of seed through small packs. Matopos Research Station, Zimbabwe.
Rola, A.C., Jamias, S.B. and Quizon, J. (2001) Do Farmer Field School Graduates Retain and Share What They Learn? An Investigation in Iloilo Philippines. Journal of International Agricultural and
Extension Education 9 (1):65-76.
Rosegrant, M.W., Ringler, C., Benson Todd., Diao, X., Resnick, D., Thurlow, J., Torero, M. and Orden, D. ( 2006) Agriculture and Achieving The Millennium Development Goals. Agriculture and Rural Development Department, World Bank, Washington DC. pp 104.
Rosenberg, N. (1976) On technological expectations. Economic Journal 86 523-535.
Ross, N., Islam, M.M. and Thilsted, S.H. (2004a) Small Indigenous Fish Species in Bangladesh: Contribution to Vitamin A, Calcium and Iron. Current Opinion in Clinical & Metabolic Care 7 (6):671-687.
Ross, N., Thilsted, S. and Islam, M.M. (2004b) Small indigenous fish species in aquaculture in Bangladesh: contribution to vitamin A, calcium, and iron intakes. In: Ross, N., Bouis, H.E., Hassan, N. and Kabir, K.A., (Eds.) Alleviating malnutrition through agriculture in Bangladesh:
biofortification and diversification as sustainable solutions, Proceedings of the workshop on alleviating micronutrient malnutrition through agriculture in Bangladesh: biofortification and diversification as long-term, sustainable solutions, Gazipur and Dhaka, Bangladesh April 22-24, 2002.
Rossman, G.B. and Wilson, B.L. (1984) Numbers and words: Combining quantitative and qualitative methods in a sinlge large-scale evaluation study. Evaluation Review 9 (5):627-643.
Rothuis, A.J., Nhan, D.K., Richter, C.J.J. and Ollevier, F. (1998) Rice with fish culture in semi-deep waters of the Mekong delta, Vietnam: a socio-economical survey. 29 47-57.

References
434
Rothuis, A. (1998) Rice-fish culture in the Mekong Delta, Vietnam: constraint analysis and adaptive
research. Thesis submitted for the award of the degree of Doctor of Science, Laboratory for Ecology and Aquaculture, K.U. Leuven, Belgium. p.113.
Safilios-Rothschild, C. (1980) The role of the family-A neglected aspect of poverty. World Bank Staff Working Paper no. 403. Washington, D. C., World Bank.
Safilios-Rothschild, C. and Mahmud, S. (1989) Women’s roles in agriculture: present trends and
potential for growth. UNDP and UNIFEM-Bangladesh Agricultural Sector Review.
Sahn, D.E. (1989) A Conceptual Framework for Examining the Seasonal Aspects of Household Food Security. In: Shan, D.E., (Ed.) Seasonal Variability in Third World Agriculture: The
Consequences for Food Security, pp. 3-16. The Johns Hopkins University Press.
Samoff, J. (1990) Decentralization: The politics of interventionism. Development and Change 21 513-530.
Sapsford, R. and Jupp, V. (1996) Data collection and analysis. London, Sage Publications.
Scarborough, Killough, V.S., Johnson, D.A. and Farrington, J. (1997) Farmer-led extension, concepts
and practices. Intermediate Technology Publications Ltd., London.
SCF-UK (2000) The household food economy approach. Save the Children Fund, SFK-UK, London.
Schofield, S. (1974) Seasonal factors affecting nutrition in different age groups and especially preschool children. Journal of Development Studies 2 22-40.
Schreiner, M. (2003) A Cost-Effectiveness Analysis of the Grmeen Bank of Bangladesh. Development
Policy Review 21 (3):357-382.
Schuster, W.H. (1955) Fish culture in conjunction with rice cultivation. World Crops 7 (11-14):67-70.
Scoones, I. (1998) Sustainable rural livelihoods. A framework for analysis. IDS Working Paper No. 72. IDS, Brighton.
Scott, G.L. and Carr, M. (1985) The impact of technology choice on rural women in Bangladesh:
problems and opportunities . World Bank Staff Working Papers Number 731 World Bank, Washington DC.
Scott, J. (2002) Social Network Analysis: A Handbook. Sage: London.
SEED (2004) Cost Effectiveness Analysis, SEED Program Guidelines. www.oregon.org Date of access on 08 August 2006
Sen, B. (2003) Drivers of Escape and Descent: Changing Household Fortunes in Rural Bangladesh: Chronic Poverty and Development Policy. World Development 31 (3):513-534.
Shah, P., Bharadwaj, G. and Ambastha, R. (1991) "Farmers as analysts and facilitators in participatory
rural appraisal and planning". PRA Notes, Number 13, IIED, London.
Shah, W.A. and Nuri, S.J. (2000) Local vegetable seed storage methods and women’s participation in development. In: Sillitoe, P., (Ed.) Indigenous knowledge development in Bangladesh: present
and future, Intermediate Technology Publications, London 916.
Shahjahan, M. (2004) Pulses in Bangladesh: production, problems, prospects, and future plans . In: Ross,

References
435
N., Bouis, H.E., Hassan, N. and Kabir, K.A., (Eds.) Alleviating malnutrition through agriculture
in Bangladesh: biofortification and diversification as sustainable solutions, pp 81-84., Proceedings of the workshop on alleviating micronutrient malnutrition through agriculture in Bangladesh: biofortification and diversification as long-term, sustainable solutions, Gazipur and Dhaka, Bangladesh April 22-24, 2002.
Shamsuddin, M., Hossein, M.S., Siddiqui, M.A.R., Khan, A.H.M.S.I., Bari, F.Y., Alam, M.F., Rahman, M., Sayem, A.S.M. and Momont, H. (2007) Use of milk progesterone radioimmunoassay and computer applications for community based reproductive health services in smallholder dairy farms of Bangladesh, pp 9-22. In: IAEA, (Ed.) Improving the Reproductive Management of
Dairy Cattle Subjected to Artificial Insemination, International Atomic Energy Agency, Vienna, Austria.
Shang, Y.C. (1990) Aquaculture Economic Analysis: An Introduction. The World Aquaculture Society, pp 211.
Shelly, A.B. and Costa, M.D. (2001) Women in Aquaculture: Initiatives of Caritas Bangladesh. In: Williams, M.J., Chao, N.H., Choo, P.S., Matics, K., Nandeesha, M.C., Shariff, M., Siason, I., Tech, E. and Wong, J.M.C., (Eds.) Global Symposium on Women in Fisheries, Sixth Asian Fisheries Forum, 29 November 2001, Taiwan. WorldFish Center, Penang, Malaysia.
Shepherd, A.W. (2005) The implications of supermarket development for horticultural farmers and
traditional marketing systems in Asia. Agricultural Management, Marketing and Finance Service, FAO, Rome, Italy. pp. 16.
Shucksmith, D.M., Bryden, J., Rosenthall, P., Short, C. and Winter, D.M. (1989) Pluriactivity, Farm Structures and Rural Change. Journal of Agricultural Economics 40 (3):
Simpson, M. and Tuson, J. (1995) Using observation in small scale research: A beginners guide. Scottish Council for Research in Education, Edinburgh, UK.
Singh, N. and Gilman, J. (1999) Making livelihoods more sustainable. International Social Science
Journal 162 539-545.
Sinha, S. (2000) The Role of Central Banks in Microfinance in Asia and the Pacific: Bangladesh. Manilla: Asian Development Bank. .
Smith, B.C. (1985) Decentralisation. The Territorial Dimension of the State. London: George Allen.
Smith, L.C. (2002) Keynote Paper: The use of household expenditure surveys for the assessment of food
insecurity. Paper presented on Scientific Symposium 'Measurement and Assessment of Food Deprivation and Undernutrition' , Rome, 26-28 June 2002.
Sonaiya, E.B., Branckaert, R.D.S. and Gueye, E.F. (1999) The Scope and Effect of Family Poultry Research and Development. First INFPD/FAO Electronic Conference on Family Poultry,
www.fao.org Date of access on 25 April 2006
Splett, L.P. (1996) The practitioner’s guide to Cost-effectiveness Analysis of Nutrition Intervention. National Center for Education in Maternal and Child Health, Arlington, USA. pp55.
Stirrat, R.L. (2004) Yet another ‘magic bullet’: the case of social capital. Aquatic Resources, Culture and
Development 11 (1):25-33.
Sufian, A.J.M. (2003) Methods and Techniques of Social Research. The University Press Limited,

References
436
Dhaka, Bangladesh.
Surintaraseree, P. and Little, D.C. (1998) Thailand: diffusion rice-fish culture. The extension, adoption
and retention of rice-fish technology in Thailand’s North-east Region. The Rural Extension Bulletin, October, 1998.
Sutherland, A. (1998) Participatory research in natural resources.Socio-economic Methodologies. Best
Practice Guidelines. Natural Resources Institute, Chatham, UK.
Tacon, A.G.J. (2001) Increasing the contribution of aquaculture for food security and proverty alleviation. In: Subasinghe, R.P., Bueno, P., Phillips, M.J., Hough, C., McGladdery, S.E. and Arthus, J.R., (Eds.) Aquaculture in the Third Millennium, Technical Proceedings of the Conference on Aquaculture in the Third Millennium, Bangkok, Thailand, 20-25 February 2000. pp. 63-72. NACA, Bangkok and FAO, Rome.
Tacon, A.G.J., Phillips, M.J. and Barg, U.C. (1995) Aquaculture feeds and the environment: the Asian experience. Water Sci. Tech. 31 41-59.
Tetens, I., Hels, O., Khan, N.I., Thilsted, S.H. and Hassan, N. (2003) Rice-based diets in rural Bangladesh: how do different age and sex groups adapt to seasonal changes in energy intake? Am J Clin Nutr 78 406-413.
The Maize Program (1999) Development, Maintenance, and Seed Multiplication of Open-Pollinated
Maize Varieties. 2nd Edition, Mexico, D.F.:CIMMYT. pp, 11.
Thompson, P.M., Sultana, M.N., Islam, M.N., Kabir, M.M., Hossain, M.M. and Kabir, M.S. (1999) An
assessment of co-management arrangements developed by the Community Based Fisheries
Management Project in Bangladesh. Paper presented at the international workshop on fisheries co-management, 23-28 August 1999, Penang, Malaysia.
Thompson, P.M., Sultana, P., Nuruzzaman, M. and Khan, A.K.M.F. (2000) Impacts of Aquaculture
Extension on Pond Operators and the Rural Community. ICLARM, Dhaka, Bangladesh, 9 pp.
Trewavas, E. (1983) Tilapiine Fishes of Genera Sarotherodon, Oreochromis and Danakilia. Br. Mus. (Nat. Hist.), London, 583 pp.
Tripp, R. (2001) Can biotechnology reach the poor? The adequacy of information and seed delivery. Food Policy 26 (3):249-264.
Tripp, R. (2006a) Is low external input technology contributing to sustainable agricultural development? Natural Resource Perspective, Overseas Development Institute, UK.
Tripp, R. (2006b) Self-Sufficient Agriculture: Labour and Knowledge in Small-Scale Farming. Earthscan Publications Ltd, pp. 242.
Tripp, R. and Louwaars, N. (1997) Seed regulation: choices on the road to reform. Food Policy 22 (5):433-446.
Turongruang, D. (2007) Impact of pond dike system on livelihoods in Northeast Thailand. PhD Thesis, Institute of Aquaculture, University of Stirling, UK.
UNDP (1999) Sustainable livelihoods documents: Introduction, Overview and Sustainable Livelihoods: concepts, principles and approaches to indicator development. Available November. http://www.undp.org Date of access on 08 August 2003.

References
437
UNICEF (1999) Pragotir Pathey. Achieving the goals for children in Bangladesh. Bangladesh Bureau of Statistics, Ministry of Planning, Bangladesh.
United Nations (2002) World population prospects: The 2002 revision population database. Population Division, Department of Economics and Social Affairs, United Nations.
Van den Berg, F. (1996) The private sector: a potential key element in the development of small-scale aquaculture in Africa. FAO Aquaculture Newsletter No. 12 14-16.
Van den Berg, H. (2004) IPM Farmer Field Schools: A synthesis of 25 impact evaluations. Food and Agriculture Organization of the United Nations, Rome, Italy, pp.53.
van der Zijpp, A.J., Verreth, J.A.J., Tri, L.Q., van Mensvoort, M.E.F., Bosma, R.H. and Beveridge, M.C.M. (2007) Programme for optimization of nutrient dynamics in integrated agriculture-aquaculture farming systems. In: van der Zijpp, A.J., Verreth, J.A.J., Tri, L.Q., van Mensvoort, M.E.F., Bosma, R.H. and Beveridge, M.C.M., (Eds.) Fishponds in farming systems, Wageningen Academic Publishers, The Netherlands, pp. 13-18.
VanSant, J. (2003) Challenges of Local NGO Sustainability. Keynote remarks presented in the USAID/PVC-ASHA Annual PVO Conference, 14 October, 2003. Duke Center for International Development, Duke University.p.12.
Veerina, S.S., Nandeesha, M.C., Silva, S.S. and Ahmed, M. (1999) An analysis of production factors in carp farming in Andra Pradesh, India. Aquaculture Research 30 805-814.
Verdegem, M.C.J., Bosma, R.H. and Verreth, J.A.B. (2006) Reducing Water Use for Animal Production Through Aquaculture. Water Resources Development 22 (1):101-113.
von Braun, J. and Kennedy, E. (1995) Commercialisation of Agriculture, Economic Development, and
Nutrition . The Johns Hopkins University Press: Baltimore.
von Braun, J. (2005) Agricultural economics and distribution effects. Agricultural economics 32 (1):1-20.
Wahab, M.A. and Kadir, A. (2005) Polyculture of Puti and Mola with Carps. A technology manual developed by USAID-CDR funded project “Developing a Polyculture Technique for Farmers Consumption and Cash Crop”, Department of Fisheries Management, Bangladesh Agricultural University, Mymensingh, pp.6.
Waibel, H. (1992) Comparative economics of pesticide use in rice and rice-fish farming. In: dela Cruz, C.R., Lightfoot, C., Costa Price, B.A., Carangal, V.R. and Bimbao, M.P., (Eds.) Rice-Fish
Research and Development in Asia. ICLARM. Conf. Proc., pp. 245-254.
Waibel, H., Fleischer, G., Kenmore, P. and Feder, G. (1999) Evaluation of IMP Programs: Concepts and
Methodologies. Pesticide Policy Project Publication Series No. 8, University of Hanover/GTZ: Hanover.
Walonick, D.S. (2004) Survival Statistics. StatPac, Inc. Bloomington, MN, USA.
WARPO (2001) National Water Management Plan. Volume No. 1, Ministry of Water Resources, Government of the People’s Republic of Bangladesh.
WCED ( 1987) Our Common Future. World Commission on Environment & Development, Oxford, UK, Oxford University Press, pp. 401.

References
438
Weinberger, K. and Genova, C.A. (2005) Vegetable production in Bangladesh: Commercialization and
Rural Livelihoods. Technical Bulletin-33, AVRDC-The World Vegetable Center.
Weinstein, M.C. and Stason, W.B. (1977) Fundamentals of cost-effectiveness analysis for health and medical practice. N Engl J Med 296 716-721.
Westergaard, K. and Alam, M.M. (1995) Local Government in Bangladesh: Past Experiences aye Yet Another Try. World Development 23 (4):679-690.
WFP (2002) Food Security Assessment in Bangladesh: Issues and Implications for Vulnerability Analysis
and Mapping. Situation Analysis Report, Vulnerability Analysis and Mapping Unit (VAM), Dhaka.
White, H. ( 2005) Challenges in evaluating development effectiveness. Institute of Development Studies, Brighton, Sussex, England, 20p.
White, S. (1992) Arguing with the Crocodile: Class and Gender Hierarchies in a Bangladeshi Village. Dhaka: UPL.
Wiggins, S. and Cromwell, E. (1995) NGOs and seed provision to smallholders in developing countries. World Development 23 (3):413-422.
Williams, C. and Millington, A.C. (2004) The diverse and contested meanings of sustainable development. The Geographical Journal 170 (2):99-104.
Wilson, D. (2001) "Social literature review for the “knowledge in fisheries management project”. Copenhagen, Institute for Fisheries Management and Coastal Community Development.
Wilson, M. (2003) Exchange, patriarchy, and status: women’s homegardens in Bangladesh. In: Howard, P.L., (Ed.) Women and plants: gender relations in biodiversity management and conservation, Zed Books, New York and St Martin’s Press, London 211-225.
Woolcock, M. and Narayan, D. (2000) Social Capital: Implications for Development Theory. The World
Bank Research Observer, 15 (2):225-49.
World Bank (1986) Poverty and hunger. In: Anonymous In A World Bank Policy Study. World Bank, Washington, DC.
World Bank (1998) Knowledge for Development. World Development Report 1998, The World Bank, Washington DC, USA. pp 265.
World Bank (2001) World Developemnt Report 200-2001. Oxford University Press.
World Bank (2004) Partnership in Development: Progress in Fight Against Poverty. The World Bank, Washington, DC.
World Bank (2006) Aquaculture: Changing the Face of the Waters-Meeting the Promise and Challenge
of Sustainable Aquaculture . Report No-36622-GLB, Agriculture and Rural Development, The World Bank, Washington DC, USA.
WorldFish Center (2004) Status of Tilapia/GIFT Seed and Grow-out Production in Hatchery-nursery and
farm based system in Bangladesh. Draft survey report, WorldFish Center Bangladesh and Bangladesh Fisheries Research Institute, pp. 19.
WPA (2005) Ground Water. www.worldproutassembly.org Date of Access on May 23 2006

References
439
Wurts, W.A. (2000) Sustainable Aquaculture in the Twenty-First Century. Reviews in Fisheries Science 8 (2):141-150.
Yin, R.K. (1984) Case study research. Design and methods. Sage publication. California.
Young, A. (1976) Tropical soils and soil survey. Cambridge University Press. pp.468.
Yunlong, C. and Smith, B. (1994) Sustainability in agriculture: a general review. Agric. Ecosyst.
Environ. 49 299-307.
Yunus, M. (2007) Social Business Entrepreneur. www.muhammadyunus.org Date of Access on 15 October 2007.
Zeller, M. and Sharma, M. (1998) Rural finance and poverty alleviation. In: Anonymous In Food Policy Report. International Food Policy Research Institute, Washington, DC. 32pp.
Zimmerman, F.J. and Carter, M.R. (2003) Asset smoothing, consumption smoothing and the reproduction of inequality under risk and subsistence constraints. Journal of Development Economics 71 233-260.

Appendices
440
Appendices
Appendix 1: One-off survey (baseline) questionnaire
1. Basic information of farming household 1.1. Date of interview: 1.2 Name of Interviewer: 1.3 Name of interviewee: 1.4 Name of the household head: 1.5 Address: Community (Para): Village: Union: Upazila: District: Region: 1.4 Religion: Muslim/Hindu/ Christian/Others (………………….). For Hindu (caste): For Muslim (category): Munshi/Sardar/Chowdhury/Sayed/others 1.5 Institutional involvement:
a. Care FFS member Year:
b. Care PNGO member Year:
c. Care scheme member Year:
d. Member of other institution Year:
e. Non-member
1.6 If Care PNGO member then name of the PNGO with location:
1.7 If member of other institution then name of the institution with location:
1.8 FFS membership: Only man/ only woman/Both man and woman

Appendices
441
1.9 Technology Adoption: Rice-fish/Fish seed in rice-field/Low input rice/dyke cropping/others
(……………….)
1.10 Rice-fish Adoption: Primary adopter /Secondary adopter/Drop-out/Non-adopter 1.11 Migration status (district/country): Non- migrant / Migrant If migrant (no. of years migrated):
1.12 Well- being status: (wealth ranking exercise already carried out) 1.13 Household profile
Serial No.
Name M/F Age (Year)
Education
1 2 3 4 5 1
2
3
4
Profession Relationship with household head
Remarks Serial No
Main Secondary Tertiary 6 7 8 9 10 1
2
3
4
2.0. Resource Mapping 2.1 Map of Resources (location of homestead area, location of plots of land, pond, other water resources having access like community beels, canals, rivers and community ponds). Should be plotted in A4 size paper for each individual household. 2.2 Land resources (descriptions of rice and other crops produced in last year in plots except rice-fish plot)
Crops Description Sl. No.
Plot area (decimal)
Ownership
1st crop
Prod (kg)
Value (Tk.)
Exp (Tk.)
2nd crop
Prod (kg)
Value (Tk.)
Exp (Tk.)
3rd crop
Prod (kg)
Value (Tk.)
Exp (Tk.)
1 2 3 4 5 6 7 8 9 10 11 12 13 14 15
1

Appendices
442
2
3
2.3. Crop Calendar: One for each individual household for 5 main crops produced in the last year.
Crops
Jan Feb Mar April May June July Aug Sept Oct Nov Dec
1.
2.
3.
2.4 Descriptions of pond resources
Sl. No. Pond area (dec)
Ownership Production (kg)
Value (Taka)
Expenditure (Taka)
Species Source of fingerlings
1 2 3 4 5 6 7 8
1
2
2.5 Activity calendar for pond-based fish culture
Activities
Jan Feb Mar April May June July Aug Sept Oct Nov Dec
Pond re-excavation/repair
Pond preparation
Stocking of fingerlings
Fish harvest for household consumption
Fish harvest for sale
2.6 Land Resources (rice-fish plot)
Plot no.
Area (decimal.)
Distance from
homestead
Soil type Level of plot Water holding
Capacity
Water Supply Frequency of water supply
1
2

Appendices
443
2.7. Configuration of rice-fish plot/s with surrounding conditions and important remarks about the overall physical conditions of the plot/s 2.8 Ditch and Dyke of rice-fish plot/s
Ditch Dyke Plot No
Number Area (m2) Shape Depth (m) Width (M) Height (m) Remarks
1
2
2.9 Rice production with management (Ricefish plot)
Organic manure (Kg) Other fertilizers (kg) Urea (kg) Number of plot Rice variety
. Cowdun
g TSP MP 1st 2nd 3rd
Boro
Amon
Crop Method of pest control Rice Production (kg) Expenditure (Taka) Income
(Taka) Remarks
Boro
Amon
2.10 Rice-fish Calendar
Rice-fish Activities
Jan Feb Mar April May June July Aug Sept Oct Nov Dec
Plot preparation
Rice transplantation
Egg/brood fish /fry/fingerlings
Fingerlings harvest for stocking
Fingerlings harvest for sale
Food fish harvest for household consumption
Fish harvest for sale
Rice harvest

Appendices
444
2.11 Fish seed and or food fish production in rice-fish plot/s Plot No
Plot area (decimal)
Production Systems
Production method
Fish species Fertilization for fish (kg)
Feeding (kg)
Fish production
1 2 3 4 5 6 7 8
1
2
2.12 Uses of fish seed/ foodfish from rice-fish plot
Plot no.
Production Sale Household Consumption
Stock Gift Selling System
Expenditure
Income
1 2 3 4 5 6 7 8 9
1
2
3 Fish Seed production system
3.1 Common carp seed production system
• Stock egg at plot ditch
• Stock fry after hatchling in chari/ ditch/ hapa in pond
• Stock fry after purchasing
• Stock broodfish in plot
• Fry hatchling in pond with giving shelter (water hyacinth etc.).
3.2 Tilapia seed production system
• Stock broodfish in plot
• Stock fry/fingerlings after purchase
• Stock fry/fingerlings from pond
3.3 Fingerling production system of others fish species
• Stock fry after boro harvest
• Stock fry during amon 3.4 Constraints and Potentials of rice-fish production Systems
3.4.1 Constrains of rice- fish based seed production: (Just �)
• Quality broodfish problem
• Look after problem due to distance
• Look after problem due to shortage of manpower

Appendices
445
• Water supply problem
• Water holding problem
• Problems of sudden flooding of the plot/s
• Predator or scavenger duck problem
• Marketing networking problem
• Poaching problem
• Change of ownership of land for sharecropper
• No stocking or selling -not sufficient amount to sell
• Option after harvest - farmers who don’t have suitable plot for grow out in amon
or pond
• Escape of fish or fingerlings from one’s plot to another due to heavy rain (
mainly in Amon season)
3.4.2 How you coped such constraints 3.5.2 Advantages/Potentials of rice-fish
• Near homestead and having look after facilities
• Suitable plot for fry rearing and partial harvesting
• Plot with water inlet and outlet facilities
• Scope of stocking in rice-field or pond after harvest
• In a command area of good marketing facilities (such as Bahagili, khidra)
• Having good water supply facilities
• Plot not in a flood-prone area
• Have previous knowledge of fry rearing
• Previous knowledge of marketing of fry as well as fish
• Previous knowledge of aquaculture
• Knowledge of IPM
• Have own source of quality broodfish and manage it
• Have scope to attract SRS and rear with cultured fish at plot
• Have own equipment (net or other tools) to do fry/fish harvest
• Have hapa to hold fry after harvest for sale.
3.5.4 To what extent and how you are using such potentials
3.5.5 What are the important reasons for conducting rice fish base seed production after its introduction?
• Easy source of egg/ fry
• Less investment
• Broodfish production by own

Appendices
446
• Food fish production
• Early availability of fingerling for stocking
• Local availability of fingerling
• Cash income from selling of fingerling
• Household Consumption
• Less or no use of pesticide
3.5.6 What social benefits rice-field based seed production bring in the community?
• Relationship development with neighbours through access to eggs of common carp/broodfish of tilapia/fry from pond
• Strengthening relationship with relatives through providence of fish seed/foodfish as gift
• Fry traders benefited by getting easy source of fingerlings for sale
• Fishers benefited by getting easy source of food fish from rice-fish for harvesting and marketing
• Sharing of rice-fish technology with relatives, friends, neighbours
4 Livestock Resources 4.1 Description of livestock resources
Type of animal
Total number
Number of adult
Number of (young)
Total Value (Taka)
Total annual income (Taka)
Ownership (Man/Woman/ Both)
1 2 3 4 5 6 7 8 Cow
Buffalo
Goat
Chicken
Duck
Pigeon
4.2 Does introduction of rice-fish systems causes any problems in management of livestock?
What are the problems and how it affects? How you try to overcome such problems? 4.3 What are the advantages of rice-fish on livestock resource development? (Production of
Napier grass/maize/pulses in the rice-field dyke can be used as feed for cattle/goat; the maize can be used as feed for poultry)?

Appendices
447
5. Housing Housing details (Note; Concrete-1, Semi concrete-2, Soil- 3, Tin- 4, Wood-5, Bamboo-6, Straw-7, Leaves-8)
Estimated value of homestead No. of house
Wall Floor Roof Purpose of use
Boundary
Land Tree/ fruits
1 2 3 4 5 6 7 8
1
2
3
6. Household equipments Use of household level equipments (household - television, radio, cassette player, VCD, fan; farming – bicycle, motorcycle, net and others):
Sl. no
Household
Number Fishing Number Transport Number Farming Number Remarks
1 2 3 4 5 6 7 8 9 10
1
2
7 Drinking water and toilet facilities 7.1 Drinking water source: Tube well (own)/Tube well (others)/Well/Pond/Rain water/other 7.2 Toilet facilities: Concrete/Semi-concrete (slab)/ non-concrete/________________
8 Off-farm income: (service, small business, day labour, van/ rickshaw puller)
Name Profession Annual Income Remarks 1 2 3 4
1.
2.
9 Training Received
Name What Kind of training received
Where from Duration Year
1 2 3 4 5
1.
2.

Appendices
448
10 Basic knowledge on fish culture and or fish seed production
10.1 Liming
10.2 Fingerlings stocking
10.3 Feeding and fertilization
10.4 Disease prevention and control
10.5 Pest control for rice-fish
11 Health Issues: (Did any of your family member get sick last twelve months? (Yes / No)
Name Type of illness Frequency Duration How recover
1 2 3 4 5
12 Major stress/shocks
• Death of household members
• Flew away of household members
• Separation of households
• Burning of houses
• Loss of cattle
• Damage/disorder of shallow/deep tube well
• Loss of crops due to storm, flooding
• Extreme cold
• Drought 13 Access to credit:
Source Name Form of credit
Amount Condition for received credit
1 2 3 4 5
Bank N.G.O Private lender Others
14 Institutional linkage of rice-fish based seed producer
Name of organization
Who communicate Support received
How frequently Where (you go there/ they
come) 1 2 3 4 5

Appendices
449
15 Fish consumption 15.1 Source of fish with variations and consumption
Gear used Source Starting period
Peak period
Amount (Kg ) Value (Taka.) Mainly By whom
1 2 3 4 5 6 7
Rice-fish plot
Pond
Wild source
Purchase
15.2 What you do when get large amount of fish from any source?
• Consume frequently
• Sale
• Short-term preserve
• Long-term preserve
• Gift to relatives. 16 Annual expenditure of the households? Item of expenditure Amount (Taka)
1 2 1. Food
2. Clothing
3. Education
4. Housing
5. Treatment
6. Ceremony/Festival
7.Others

Appendices
450
Appendix 2: Longitudinal survey questionnaire
1 General information 1.1 Household code: 1.2 Date of interview: 1.3 Name of the Interviewer: 1.4 Name of interviewee: 1.5 Name of household head: 1.6 Name of community: 1.7 Technology Adoption: Food fish in rice-field/Fish seed in rice-field/Dyke cropping /Others (………………………………..)
2 Agricultural Activities (using household resource map) 2.1 Agricultural activities on household land (crop production, livestock, homestead gardening) IN THE LAST SEVEN DAYS
Household member
Activities Where (code) Frequency Time spent (hour)
2.2 Major agricultural activities on household land (crop production, livestock, homestead gardening) DURING THE LAST THREE WEEKS
Household member
Activities Where (code) Frequency Time spent (hour)
Cycle No.

Appendices
451
2.3 Agricultural activities in others land (crop production, livestock, homestead gardening) IN THE LAST SEVEN DAYS
Household member
Activities Where (code) Frequency Time spent (hour)
2.4 Major agricultural activities in others land (crop production, livestock, homestead gardening) DURING THE LAST THREE WEEKS
Household member
Activities Where (code) Frequency Time spent (hour)
2.5 Pond based aquaculture activities IN THE LAST SEVEN DAYS
Household member
Activities Where (code) Frequency Time spent (hour)
2.6 Major pond based aquaculture activities IN THE LAST THREE WEEKS
Household member
Activities Where (code) Frequency Time spent (hour)
Appendices
452
2.7 Rice-fish-dyke cropping activities IN THE LAST WEEKS Household
member Activities Where (code) Frequency Time spent
(hour)
2.8 Rice-fish activities IN THE LAST THREE WEEKS
Household member
Activities Where (code) Frequency Time spent (hour)
3.0 Household and non-farm activities 3.1 Non-farm activities in the last month
Household member
Activities Where (code) Frequency Time spent (hour)
3.2 Household activities in the last 7 days
Household member
Activities Where (code) Frequency Time spent (hour)
Appendices
453
4 Management activities in and around the rice-fish plot 4.1 Configuration of rice-fish plot/s with surrounding conditions and important remarks about the overall physical conditions of the plot/s 4.2 Rice production with management (rice-fish plot) IN THE LAST SEVEN DAYS
Organic manure (Kg)
Other fertilizers (kg) Urea (kg) Number of plot
Plot area
Rice variety
. Cowdung TSP MP 1st 2nd 3rd
1
2
3
4
Number of
plot Method of pest control Rice
Production (kg)
Expenditure (Taka)
Income (Taka)
Remarks
1
2
4.3 Rice production with management (rice-fish plot) IN THE LAST THREE PRECEEDING WEEKS
Organic manure (Kg) Other fertilizers (kg) Urea (kg) Number of plot
Plot area
Rice variety Cowdung TSP MP 1st 2nd 3rd
1
2
Number of plot
Method of pest control
Rice Production (kg)
Expenditure (Taka) Income (Taka)
Remarks
1
2
4.4 Fish seed production or food fish production in rice-fish plot/s IN THE LAST SEVEN DAYS
Plot No
Plot area (decimal)
Production Systems
Production method
Fish species
Fertilization for fish (kg)
Feeding (kg)
1
2

Appendices
454
4.5 Fish seed and or food fish production in rice-fish plot/S IN THE LAST THREE PRECEEDING WEEKS
Plot No
Plot area (decimal)
Production Systems
Production method
Fish species Fertilization for fish (kg)
Feeding (kg)
1
2
4.6 Use of fish seed/ foodfish from rice-fish plot for last month
Plot no.
Production (kg/number)
Sale (kg/number)
Household Consumption
(kg)
Stock (number)
Gift (kg/no)
Selling System
Expenditure (Taka)
Income (Taka)
1
2
4.7 Crop / Homestead / Plant nursery production with management in other than rice-fish plots (Own + Leased in + Share crop)
Organic manure (Kg) Other fertilizers (kg) Urea (kg) No. of plot
Plot code
Crop
Cowdung TSP MP 1st 2nd 3rd
1
2
Number of plot
Method of pest control
Crop production (kg) Expenditure (Taka) Income (Taka)
Remarks
1
2
5 Condition of fish Seed production system in the last seven days 5.1 Common carp seed production system Activities Who Time spent When Remarks Place of water hyacinth for egg collection
Stocking of egg/ hatchling/ fry/ brood fish
Fertilization
Feeding Harvesting
Selling
Activities Stock eggs
at plot ditch Stock own fry
Stock purchase fry
Stock brood fish
Eggs hatch in pond
Date of stocking
Interval after rice transplantation
Amount
Number of brood fish Size of broodfish

Appendices
455
5.2 Tilapia seed production system Activities
Stock own brood fish
Stock purchased brood fish
Stock own fry/fingerlings
Stock purchased fry/fingerlings
Remarks
Date of stocking
Interval after rice transplantation Total number of brood fish
Total number of male brood fish
Total number of female brood fish
5.3 Fingerling production system of others fish species
Activities
Stock own brood fish
Stock purchased brood fish
Stock own fry/fingerlings
Stock purchased fry/fingerlings
Remarks
Date of stocking
Interval after rice transplantation
Number Size
Male brood fish
Female brood fish
6. Fish production in pond and other waterbodies 6.1 Production and cost of pond fish and other water bodies
Wages Household member
Activities Frequency Where Total time Kind Quantity Tk.
6.2 Fish harvesting from pond, river and other water bodies Who collected Location Collection
method Frequency Species Quantity
(Kg.) Use of fish Price (Tk.)
7. Household level food intake 7.1 Food intake for last three days
Food item Quantity (Kg.) Frequency Source Preparation Who eat
7.2 Major food intake for remaining days of 27 days of the last month Food item Quantity (Kg.) Frequency Source Preparation Who eat

Appendices
456
8. Income and expenditure 8.1 Income of last month from non-farm source (service, business, money lending, credit receive etc.)
Source Who Time spent/ frequency
Amount (Tk.) Control by
Service (Salary)
Wages (day labour)
Rental of land/ equipment (Shallow pump, power tiller)
Business
Livestock
Land cultivation with own equipment to others land
Money lending
Credit received
Dairy (milk)
Dowry received
Tree
8.2 Expenditure (food, clothing, treatment, travel, education, housing, travel, credit repayment, credit repayment/deposit, livestock treatment, tools and equipment, Installation of tube well and toilet, livestock purchase, presentation, dowry, land purchase, occasion/festival, amusement and others
Item Who Quantity (Kg./No.) Amount (Tk.) Remarks
Rice Fish
Vegetables
Meat
Others food Clothing
Treatment
Education
Housing
Travel Credit repayment/ Cash deposit
Livestock treatment
Tools and equipment
Installation of tube well & toilet
Livestock purchase Presentation
Dowry
Land purchase
Occasion/ Festival
Amusement (T.V, Radio,_____)

Appendices
457
9. Other household’s livelihood issues 9.1 Visitors (Officials from different organizations) in the last month
Name/ Designation and Organization
Why/ Purpose Frequency Achievement
9.2 Relatives in the last month
Relation with H.H. Where from Frequency Duration of stay Purpose
9.3 Occasion and festival
Name Duration place Remarks
9.4 Health Aspects (Sickness) in the last month
H.H. member Type of sickness Duration How recover Remarks
9.5 Livestock died or born in the last month
Born Died Type
No. No. Price How
9.6 Participation in Training, Meeting, Workshop, Fair, social, institutional programme
Name Where Duration Achievement/ Purpose
Remarks
9.7 Natural hazard (flood, draught, extreme cold, heavy rain, tornado)/ Shocks/ stress/constraints occurred in the last month 9.8 Participation in Training, Meeting, Workshop, Fair, social, institutional programme 9.10 Household and Social conflict arrived and solved in the last month 9.11 Potential for Rice-Fish (through observation) 9.12 What are the factors for no adoption?

Appendices
458
Appendix 3: Results of non-parametric Chi-square test showing difference between RF and NRF households in terms of having barshi (hook gear)
FarmerType * BARSHI
Crosstab
38 20 58
65.5% 34.5% 100.0%
24 36 60
40.0% 60.0% 100.0%
62 56 118
52.5% 47.5% 100.0%
Count
% within FarmerType
Count
% within FarmerType
Count
% within FarmerType
Control
Rice fish
FarmerType
Total
No Yes
BARSHI
Total
Chi-Square Tests
7.701b 1 .006
6.712 1 .010
7.791 1 .005
.006 .005
7.636 1 .006
118
Pearson Chi-Square
Continuity Correctiona
Likelihood Ratio
Fisher's Exact Test
Linear-by-LinearAssociation
N of Valid Cases
Value dfAsymp. Sig.
(2-sided)Exact Sig.(2-sided)
Exact Sig.(1-sided)
Computed only for a 2x2 tablea.
0 cells (.0%) have expected count less than 5. The minimum expected count is7.53.
b.

Appendices
459
Appendix 4: Results of parametric univariate analysis of variance on household size
Univariate Analysis of Variance
Between-Subjects Factors
Control 58
Rice fish 60
Poor 55
Intermediate
35
Better-off 28
1
2
FarmerType
1
2
3
Q112WBS
Value Label N
Tests of Between-Subjects Effects
Dependent Variable: TNUM_MEM
.603a 5 .121 5.602 .000
56.703 1 56.703 2636.049 .000
.124 1 .124 5.779 .018
.370 2 .185 8.598 .000
7.941E-02 2 3.970E-02 1.846 .163
2.409 112 2.151E-02
63.517 118
3.012 117
SourceCorrected Model
Intercept
FARMERTY
Q112WBS
FARMERTY * Q112WBS
Error
Total
Corrected Total
Type III Sumof Squares df Mean Square F Sig.
R Squared = .200 (Adjusted R Squared = .164)a.
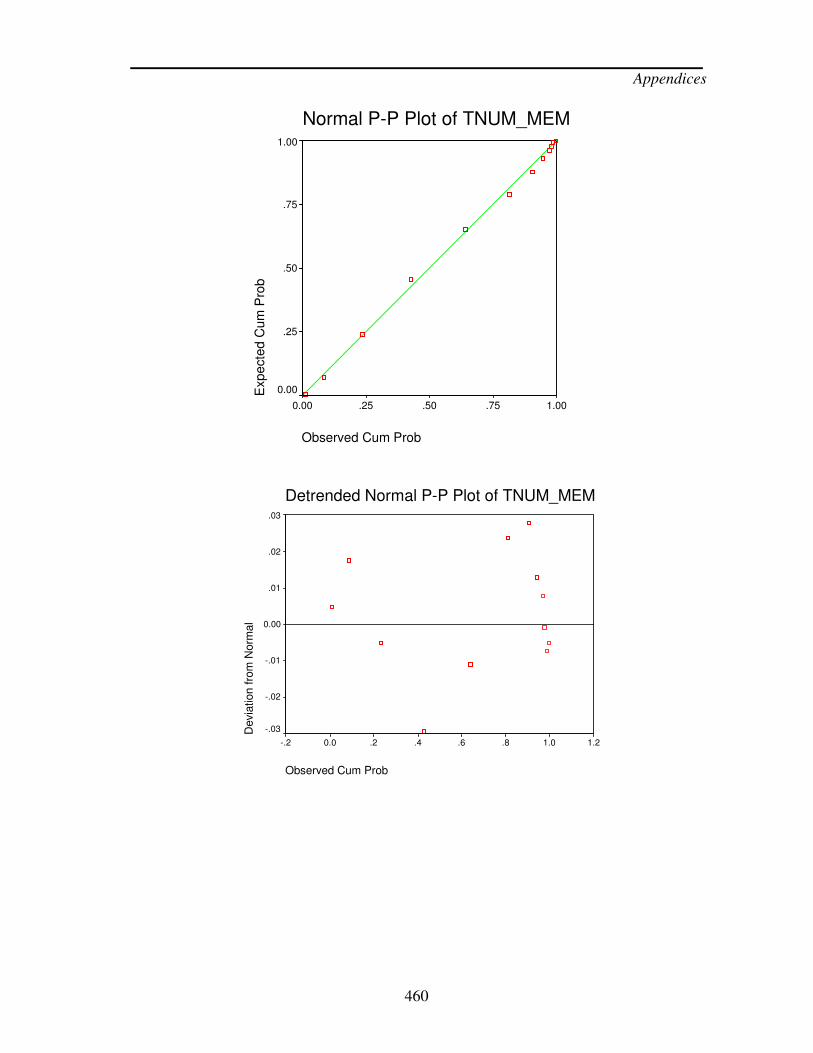
Appendices
460
Normal P-P Plot of TNUM_MEM
Observed Cum Prob
1.00.75.50.250.00
Exp
ecte
d C
um
Pro
b
1.00
.75
.50
.25
0.00
Detrended Normal P-P Plot of TNUM_MEM
Observed Cum Prob
1.21.0.8.6.4.20.0-.2
Devia
tion f
rom
Norm
al
.03
.02
.01
0.00
-.01
-.02
-.03

Appendices
461
Appendix 5: Questionnaire for study of adoption, adaptation and rejection process of ricefield based fish seed production
1) Primary adopters Name of the farmer:------------------ Community: --------------Upazilla:------------------- District:------------------ 1.1 How did you get involved with rice fish activities? Year of involvement CARE interventions Other interventions 2000 Yes
1.2 When and where did you get information on rice fish? 1.3 What were your qualifications/capacities to get involved with the rice fish program? 1.4 Who got training from your family on rice fish? 1.5 Which part of the rice fish based technologies was most interesting and benefiting? Please score them and mention reasons Technologies Scoring Ranking Reasons Rice fish (grow-out for food fish production)
Fish seed production
Low input rice production (Apply line transplantation, use of organic fertilizers, less use of inorganic fertilizers)
Dyke cropping (production of vegetable on the dyke of rice fish plot)
1.6 How long are you continuing RF based fish seed production?

Appendices
462
1.7 Did you face any constraints during the time of practice RF based seed production? If yes how did you cope that? Constraints Year Cope at that year
of constraint appeared
If not at that year of constraint but cope in the next year
Cannot collect cc seed from the pond
Brood fish overflowed by heavy rainfall
Broodfish was affected by theft
Community pond owner did not allow me to collect CC eggs from his pond last year
1.8 Why are you continuing the RF based seed production? Please mention the reasons. 1.9 What is system you are using for RF based seed production? 1.10 What are the changes did you did over the period of adoption? Please describe (periodical changes) a) Developed a business relationship with a better-off farmer b) Changed the timing of the harvest c) Extended his production area 1.11 How has the change in system affected/strengthened/weakened this and other relationships in the community? 1.12 How has the change in harvest practice affected rice /or other livelihoods options 1.13 Has the extended area resulted in any other changes?

Appendices
463
1.14 Do you find that production of RF based seed adoption met the demand of fish consumption in your household level? If yes how do you get benefits? (Answers with the fish consumption calendar and some qualitative expressions) Fish consumption calendar from rice fish plot Sources of fish
Bois
hak
Jest
ha
Ash
ar
Sra
van
Vhad
ra
Ash
in
Kar
tic
Agra
hyon
Poush
Mag
h
Fal
gun
Choit
ra
Boro season
Amon season
Market
Open water
Other places
a) b)
c) 1.15 Do you find that RF adoption facilitated to gift fish to the relatives? If yes how do you feel benefits? 1.16 Do you find that RF based seed adoption facilitated to gift fish to the neighbours and strengthen the relationship? if yes how? 1.17 How do you sell fish seed and why? Is selling of seed related to fry traders? If yes how and why? 1.18 When do you sell fish seed? 1.19 How do you use the money? 1.20 How does the money contribute to household? Describe the nature of cash flow?

Appendices
464
1.21 Did you have any remarkable change (purchase/modify anything in your household) in your household from RF based seed over the period of adoption? 1.22 Did anybody receive the RF based seed production technological idea from you? If yes how many of their number?
Within the community Outside the community Name of the idea receiver
Year
Relative Neighbours Relative Non-relative
1.23 How did you give the idea to them? 1.24 Do you think that they are following RF based seed production according to your advice? If not why and how they are continuing? 1.25 Are they used to take suggestions from you time to time for RF based seed production? 1.26 Do you think that other people in your community could do RF based seed production? How many people could do RF based seed production in your community? Why they did not do that? Please mention reasons. 1.27 Do you exchange your idea on RF based seed production with other household or agricultural activities? If yes, please describe.

Appendices
465
2 Secondary Adopter Name of the farmer:----------------------Community:-------------------------Upazilla:----- ------------------District:------------------- 2.1 How did you get involved with rice fish activities? 2.1 When and where did you get information on rice fish? 2.3 What is the relationship with the primary farmers/advisors? 2.4 Who received the idea of RF based fish seed production from your family on rice fish? 2.5 Do you know other technologies related to riceplots? If yes please mention those. a) b) c) d) Please rank those technologies with specific reasons Technologies Scoring Ranking Reasons
Rice fish (grow-out for food fish production)
Fish seed production
Low input rice production (Apply line transplantation, use of organic fertilizers, less use of inorganic fertilizers)
Dyke cropping (production of vegetable on the dyke of rice fish plot)
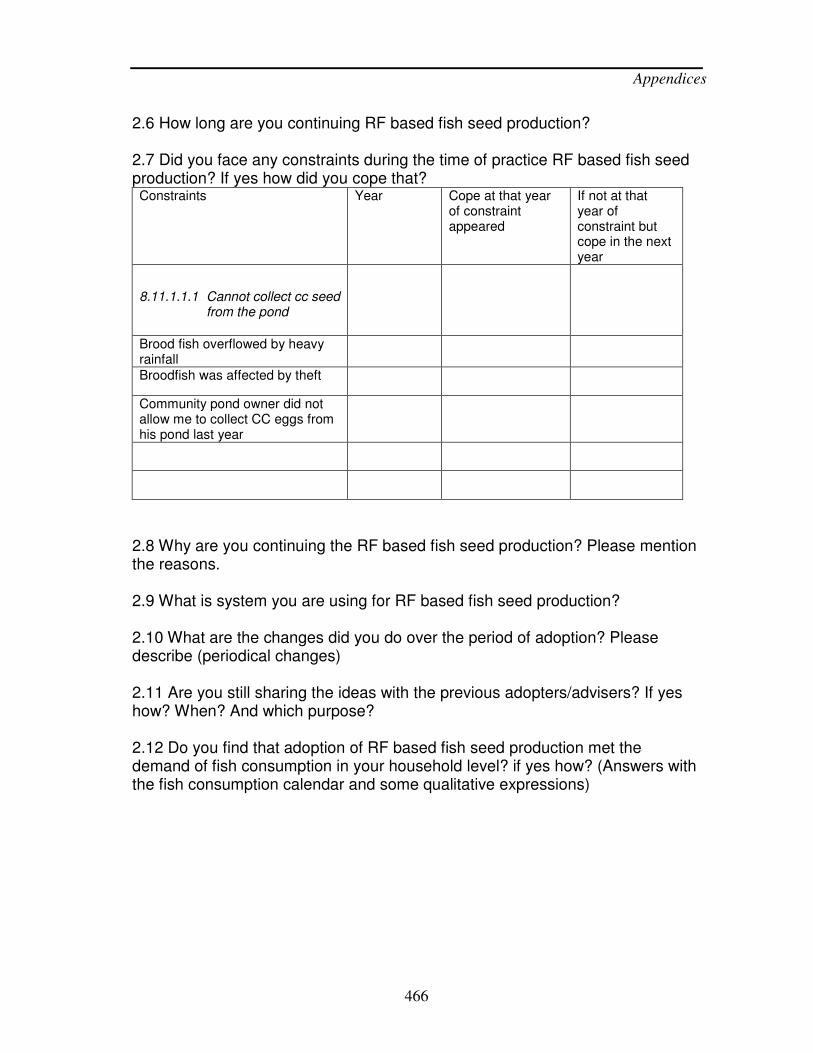
Appendices
466
2.6 How long are you continuing RF based fish seed production? 2.7 Did you face any constraints during the time of practice RF based fish seed production? If yes how did you cope that? Constraints Year Cope at that year
of constraint appeared
If not at that year of constraint but cope in the next year
8.11.1.1.1 Cannot collect cc seed from the pond
Brood fish overflowed by heavy rainfall
Broodfish was affected by theft
Community pond owner did not allow me to collect CC eggs from his pond last year
2.8 Why are you continuing the RF based fish seed production? Please mention the reasons. 2.9 What is system you are using for RF based fish seed production? 2.10 What are the changes did you do over the period of adoption? Please describe (periodical changes) 2.11 Are you still sharing the ideas with the previous adopters/advisers? If yes how? When? And which purpose? 2.12 Do you find that adoption of RF based fish seed production met the demand of fish consumption in your household level? if yes how? (Answers with the fish consumption calendar and some qualitative expressions)

Appendices
467
Fish consumption calendar from rice fish plot (I will use this calander later on) Sources of fish
Bois
hak
Jesth
a
Ashar
Sra
van
Vha
dra
Ashin
Kart
ic
Agra
hyo
n
Poush
Magh
Falg
un
Choitra
Pond Boro season
Amon season
Market Open water Other places
a) b)
c) 2.13 Do you find that adoption of RF based fish seed production facilitated to gift fish to the relatives and strengthen the relationship? If yes how? 2.14 Do you find that adoption RF based fish seed production facilitated to gift fish to the neighbours and strengthen the relationship? if yes how? 2.15 How do you sell fish seed? Is selling of seed related to fry traders? If yes how and why? 2.16 When do you sell fish seed? 2.17 How do you use the money? 2.18 How does the money contribute to your household? Describe the nature of cash flow? 2.19 What is the major contribution to your household from RF based fish seed production over the period of adoption? 2.20 Did anybody receive the RF based fish seed production technological idea from you? How many of their number?

Appendices
468
2.21 How did you give the idea to him? 2.22 Do you think that they are following RF based fish seed production according to your advice? If not why and how they are continuing? 2.23 Are they used to take suggestions from you time to time for RF based fish seed production? 2.24 Do you exchange your idea on RF based fish seed production with other household or agricultural activities? If yes, please describe.

Appendices
469
3 Person never tried RF based fish seed production
Name of the farmer:------------------------------Community:-------------------------------- Upazilla:---------------------District:-------------------------------- 3.1 Do you know about the ideas of rice fish farming? If yes please describe. When and how do you know that? 3.2 Do you know about RF based fish seed production in the rice field? 3.3 Why don’t you practise RF based fish seed production? Mention the reasons please (personal, familial, social and rice plot related matters) 3.4 Did you discuss about the RF based fish seed production with the RF based seed producing farmers? What type of discussion you did, please describe? 3.5 Has anybody from your household/community affected your decision to adopt RF based fish seed production? 3.6 Do you have any plan to adopt RF based fish seed production future? If yes – how? And if no-why?

Appendices
470
4 Initially tried during FFS but not continued Name of the farme:---------------------------------Community:------------------------------- Upazilla:--------------------------District:--------------------------- 4.1 When and how did you get idea of RF based fish seed production? 4.2 How did you try to produce fish seed in rice field? 4.3 What were your outcomes during trying to do RF based fish seed production? 4.4 Why didn’t you continue RF based fish seed production? Please mention the reasons. 4.5 Did the discontinuation of RF based fish seed production reduce labour use/or other cost/investment to your household anyway? 4.6 Has anybody from your household/community affected your decision to continue that? If yes why? 4.7 Has anybody from your household/community influenced your decision to continue that? If yes how and why? 4.8 Do you have any plan to adopt RF based fish seed production future? If yes – how? And if no-why? 4.9 Does the production of fish in ricefields affect you anyway? Has it increased/reduced your access to food (rice)/seasonality/water availability?

Appendices
471
5 Continued for few years but rejected
Name of the farmer:----------------------Community:------------------------------ Upazilla:------------------------District:---------------------- 5.1 When and how did you get idea of RF based fish seed production? 5.2 When did you start fish seed production in rice field? 5.3 How long did you continue RF based fish seed production in your rice field? 5.4 Why and how did you reject the RF based fish seed production? Please mention the reasons. 5.5 Did the rejection of RF based fish seed production reduce labour use/or other cost/investment to your household anyway? 5.6 Has anybody from your household/community asked you to reject that? If yes why? 5.7 Has anybody from your household/community asked you to continue that? If yes why? 5.8 Do you have any plan to adopt RF based fish seed production in future? If yes – how? And if no - why? 5.9 Does the production of fish in rice fields affect you in anyway? Has it increased/reduced your access to food (rice)/seasonality/water availability?

Appendices
472
6 Women in adopting households
Name of the housewife/women:-------------------------------Community:----------------- Upazilla:----------------------------District:--------------------------Date: 6.1 Do you know about rice fish culture? If yes, how do you know about that? 6.2 Could you please explain about rice fish culture? 6.3 Do you know about fish seed production in ricefield? If yes, how do you know about that? 6.4 Could you please describe about fish seed production in rice field based systems? 6.5 Which part of the rice fish based technologies was most interesting and benefiting? Please score them and mention reasons.
Reasons Technologies Scoring Ranking
Advantages Disadvantages
Rice fish (grow-out for food fish production)
Fish seed production
Low input rice production (Apply line transplantation, use of organic fertilizers, less use of inorganic fertilizers)
Dyke cropping (production of vegetable on the dyke of rice fish plot)

Appendices
473
6.6 Do you involve in fish seed production activities in ricefields? 6.7 If yes, why (willingly, force from husband), how and what type of activities with you involve? a) Direct activities b) Indirect activities 6.8 What type of supports to your husband comes-out from your involvement? Please point-out the outcomes. 6.9 Did you find any problems due to your involvement with seed production activities? If yes, please describe. If not, why not. 6.10 How your family members got benefited from fish seed production? a) Husband b) Children c) Others d) Me 6.11 Do you sell fish seed? If yes, who take the decision to sell seed and why? Me/My husband 6.12 Do you use the money? If yes how do use the money of seed selling? Please describe. 6.13 If you don’t use the money, why? Who and how do use the money?

Appendices
474
6.14 Did you find any major contribution from the income of seed? Please describe. 6.15 Did you find any problems over the period of seed production? If yes, how did you contribute to solve the problems? 6.16 Do you find that adoption of RF based fish seed production met the demand of fish consumption in your household level? If yes how do you get benefits? (Answers with the fish consumption calendar and some qualitative expressions) Fish consumption calendar from rice fish plot
Sources of fish
Bois
hak
Jest
ha
Ash
ar
Sra
van
Vhad
ra
Ash
in
Kar
tic
Agra
hyon
Poush
Mag
h
Fal
gun
Choit
ra
Boro season
Amon season
Market
Open water
Pond a) b)
c) 6.17 Do you find that adoption of RF based fish seed production facilitated to gift fish to the relatives? If yes how do you feel benefits? 6.18 Do you find that adoption of RF based fish seed production facilitated to gift fish to the neighbours and strengthen the relationship? If yes how?
6.19 Did anybody receive technological idea of RF based fish seed production from you? If yes how many of their number?
Year Within the community Outside the community Name of the idea receiver(s)
Relative Neighbours Relative Non-relative

Appendices
475
6.20 How did you give the idea to them? 6.21 Do you think that they are following RF based fish seed production according to your advice? If not why and how they are continuing? 6.22 Are they used to take suggestions from you time to time for RF based fish seed production? 6.23 Do you find that your involvement with RF based fish seed production affected your other households’ works? If yes, how? 6.24 Do you find that you involvement with RF based fish seed production empowered you? If yes how? 6.25 Do you exchange your idea on RF based fish seed production with other household or agricultural activities? If yes, please describe. 6.26 How do your neighbors (men and women) evaluate your activities in fish seed production? 6.27 Do you think other type of women can take part in seed production activities in the community? If yes why, if not why? 6.28 Could you please describe what type of women can take part in RF based fish seed production activities (what should be their criteria)? 6.29 Does your children take part in fish seed production activities? If yes, how? Please describe.

Appendices
476
7 Women in non-adopting households
(a) Initially rejected/ (b) Rejected after few years/ (c) Never tried households Name of the housewife/women:----------------------------Community:-------------------- Upazilla:--------------------------District:-----------------------Date:---------------------------- 7.1 Do you know about rice fish culture? If yes, when how do you know about that? 7.2 Could you please explain about rice fish culture? 7.3 Do you know about fish seed production in ricefield? If yes, how and when did you know about that? 7.4 Could you please describe about fish seed production in rice field based systems? 7.5 Did you involve in fish seed production activities in ricefields? (a) and (b) 7.6 If yes, why did your household reject that technology? Please describe the reasons. for (a) and (b) 7.7 Why did not involve your household in seed production activities in ricefield based system? Please describe the reasons. for (c) 7.8 How did your family members get benefited from fish seed production activities? for (a) and (b) a) Husband b) Children

Appendices
477
c) Others d) Me 7.9 Did you find that your involvement with RF based fish seed production affected your other households’ works? If yes, how? for (a) and (b) 7.10 How did your neighbors evaluate your involvement in the activities of ricefield based system seed production? for (a) and (b) 7.11 How do you evaluate the women, those are involve in fish seed production activities? for (c ) 7.12 Could you please describe what type of women can take part in RF based fish seed production activities (what should be their criteria)?

Appendices
478
Socio-economic information for adoption studies Name of the farmer/women-------------------------------Community----------------------------
---
District-------------------------Well-being-------------
Group of the farmer
Primary adopter Rejecter after few years Secondary adopter Adopting women Never tried Non-adopting women Initially rejecters
1) Main occupation of household head------------------ 2) Secondary occupation of household head----------- 3) Number of earner in the household (excluding household head)------------- Off-farm------------On farm--------------- 4) Number of household member: Male-----------Female-------------Total--------------------- 5) Age of household head--------------- Age distribution of other household members
Age groups Sex
1-14 14-30 31-60 60 above
Male
Female
6) Education level of household head--------------- Education level of other household members
Education attainment Sex
Illiterate Primary Secondary Higher secondary
Above higher secondary
Male
Female
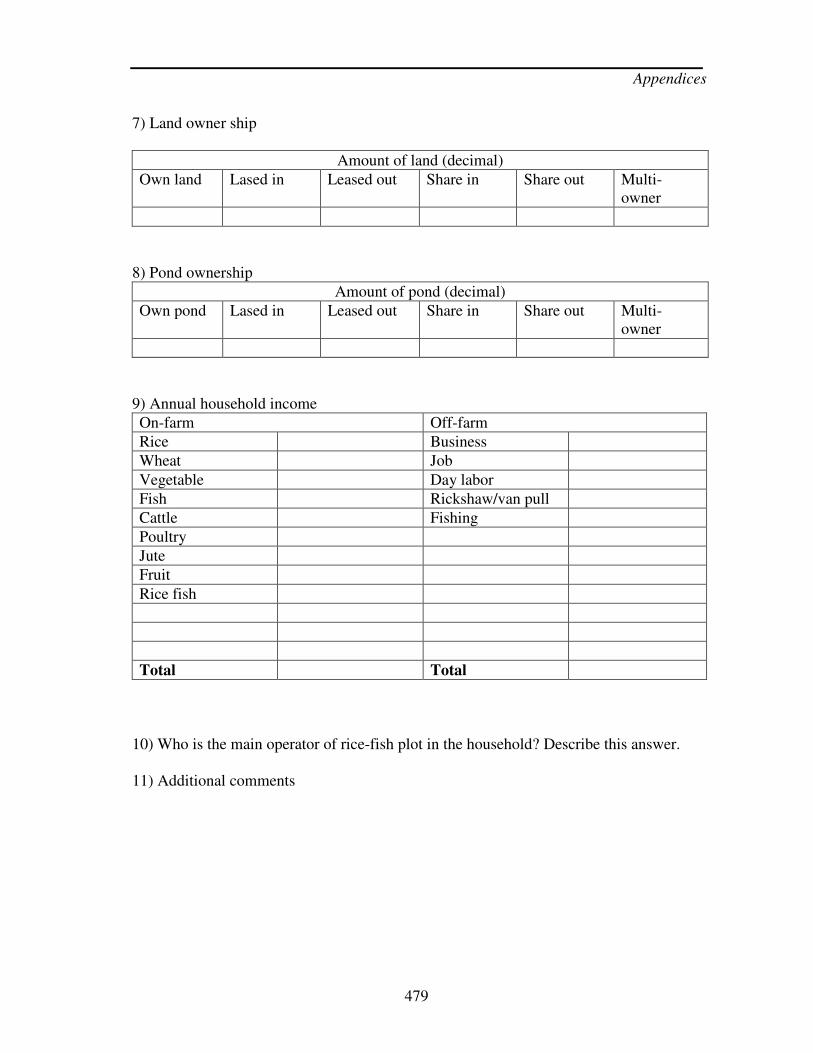
Appendices
479
7) Land owner ship
Amount of land (decimal)
Own land Lased in Leased out Share in Share out Multi-owner
8) Pond ownership
Amount of pond (decimal)
Own pond Lased in Leased out Share in Share out Multi-owner
9) Annual household income
On-farm Off-farm
Rice Business
Wheat Job
Vegetable Day labor
Fish Rickshaw/van pull
Cattle Fishing
Poultry
Jute
Fruit
Rice fish
Total Total 10) Who is the main operator of rice-fish plot in the household? Describe this answer. 11) Additional comments

Appendices
480
Appendix 6: Comparative technological preferences of the primary adopters
Technology Advantages Percent of
farmer Disadvantages Percent of
farmer No cost production 83.33 Common carp borrow and
destroy the dyke 3.33
Additional income 63.33 Cannot collect eggs every year
3.33
Can stock to the pond 60.00
Increased pond production 53.33
Can gift to others 33.33
Can consume at household level 33.33
Can get quality fry 26.66
Grow faster 20.00
Fish seed
Stock to the other riceplot 10.00
Additional income 80.00 Escaping of fish due to heavy rainfall
20.00%
Meet the demand of household consumption
76.66 Need additional security 16.66
Grow faster 13.33 Fish growth not well 10.00
Can gift to the relative 13.33
Low input production 13.33
Easy to catch 10.00
Food fish
Meet the demand of household consumption
83.33 Destruction of dyke by rat 23.33
Additional income 60.00 Additional cost 10.00
Can gift to relatives 20.00 Need additional cost 10.00
No other land for vegetable cultivation
10.00 Need additional labour 3.33
Low input production 6.66 Need to use pesticides 3.33
Vegetable production
Pouching of vegetable 3.33
Low cost production 66.66 Need additional labour for rice transplantation; labour does not want to do that
13.33
No use of pesticides 33.33 Difficult to use pesticides 6.66
Easy to weeding 13.33 Difficult to manage organic fertilizers
3.33
Increased rice production 10.00
Fish can move freely in riceplot 6.66
Low-input rice
production
Increased use of organic fertilizer
6.66

Appendices
481
Appendix 7: Comparative technological preferences of the secondary adopters
Technologies Advantages Percent of farmers
Disadvantages Percent of farmer
Additional income 50.00 Can not stock as not have pond
6.66
No cost production 40.00 Difficult to harvest tilapia 6.66
Can stock to the pond 36.66 Can not collect common carp eggs
3.33
No need to purchase seed 30.00
Increase pond production 20.00
Can consume at household level
16.66
Can gift to others 13.33
Can stock to other riceplot 10.00
Fish seed Production
Own source production 10.00
Additional income 86.66 Can not produce food fish due to heavy rainfall
6.66
Meet the demand of household 73.33 Can not produce food fish because of draught
3.33
Can gift 46.66 Disease on silver barb 3.33
No need to buy from the market
16.66 Social vandalisms 3.33
Fish grow faster in the riceplot 10.00
Foodfish production
Fish destroy pest 6.66
Meet the demand of household consumption
43.33 Less interest to do 33.33
Can gift 33.33 Need additional investment
26.66
Additional income 26.66 Attack of rat on dyke and vegetable
23.33
No need to buy from the market
13.33 Disturbance of cattle 20.00
Destroy vegetable during heavy rainfall
6.66
Need wider dike 6.66
Attack of pest and disease 3.33
Dyke cropping
Stolen by man 3.33
Reduced cost of rice production
70.00 Labour cost is higher in transplantation; labour does not want to do that
10.33
Easy to pest control 13.33 Scarcity of cowdung 6.66
Easy to weeding 10.00 Using pesticides is problematic
6.66
Increased rice production 10.00
Easy to fertilization 3.33
Low-input rice
production
Easy to rice harvest 3.33

Appendices
482
Appendix 8: Problems faced and measures taken by the primary adopters
Problems faced by primary adopters Percent
of farmer Measures taken by the farmers
No problems faced 36.66 These farmer did not face any problems during the period of their adoption
Broodfish escaped from the plot because of heavy rainfall. Sudden heavy rainfall particularly during night causes escaping of brood fish from the plot
13.33 Out of 4 farmers 1 raised the dyke in following year, others did not do as it is costly
Pouching of tilapia brood fish. Farmers used to stock broodfish of tilapia and common carp in the riceplot ditch. Where brood fish is stolen sometimes
13.33 One farmer collected stocked broodfish from neighbour source at free of cost. Others provide safety and security
Cannot collect common carp eggs from the pond. The collection of common carp eggs depends on the specific time and availability of fish in the household pond, which act as a limiting factor sometimes
13.33 Out of four 3 farmers has collected eggs from neighbour pond. One farmer brought fry from fry trader
Ploughing before Amon season using power tiller causing death of fry
10.00 Farmers became conscious about mechanized tilling later on keeping the fry in the ditch
Fry escaped from the plot because of heavy rainfall. Sudden heavy rainfall particularly during night causes escaping of fry from the plot
6.66 Did not take any measure during heavy rainfall
Using excess dose of fertilizers caused less production of fish. During Boro season farmers used to use excessive fertilizers in their rice field, which becomes problematic in the ricefish plot
6.66 Afterwards the farmers became conscious about using of fertilizers learning about that from neighbour adopters
Water supply insufficiency due to fall down the ground water level. Due to concurrent exploitation of ground water in the Boro season, water head of pump falls down in some places
6.66 After taking out the fry from ditch farmers deepened the ditch and restock again fry
Destruction of dyke by rat. Vegetable production on the riceplot dyke causes availability of rat. Rat is used to hollow out the dyke and make vulnerable the plot to hold and water and fish
3.33 Next year the farmer repaired the dyke
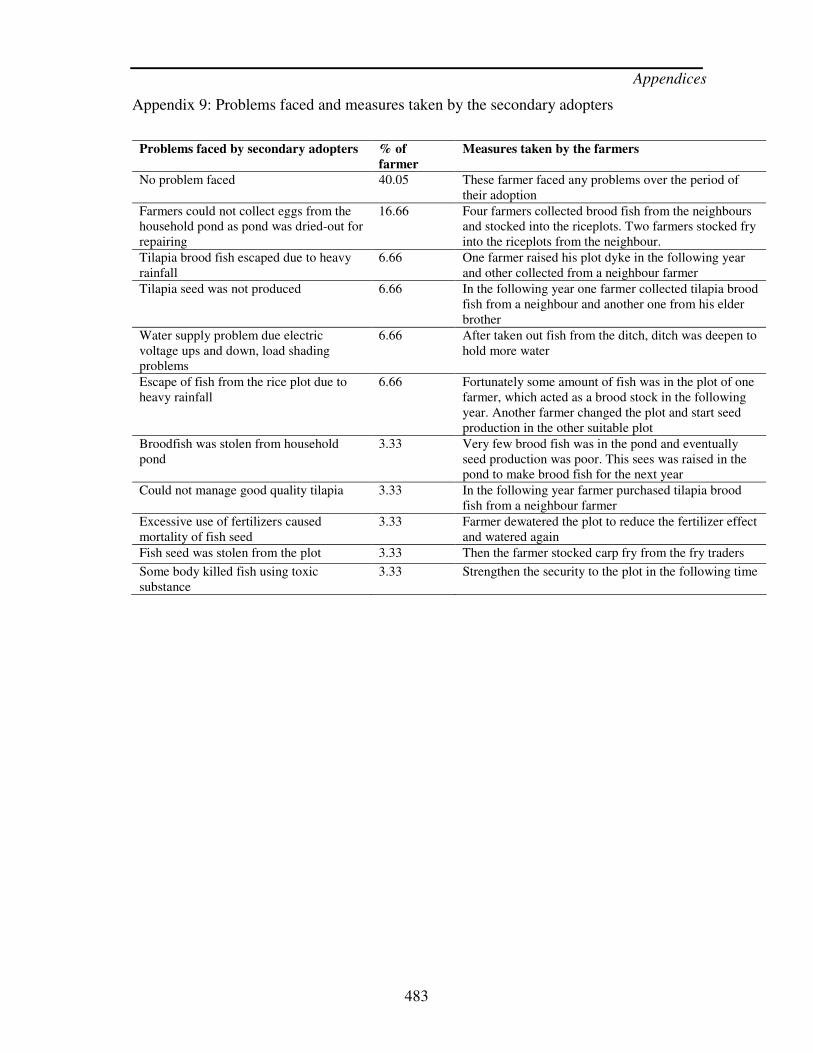
Appendices
483
Appendix 9: Problems faced and measures taken by the secondary adopters
Problems faced by secondary adopters % of
farmer Measures taken by the farmers
No problem faced 40.05 These farmer faced any problems over the period of their adoption
Farmers could not collect eggs from the household pond as pond was dried-out for repairing
16.66 Four farmers collected brood fish from the neighbours and stocked into the riceplots. Two farmers stocked fry into the riceplots from the neighbour.
Tilapia brood fish escaped due to heavy rainfall
6.66 One farmer raised his plot dyke in the following year and other collected from a neighbour farmer
Tilapia seed was not produced 6.66 In the following year one farmer collected tilapia brood fish from a neighbour and another one from his elder brother
Water supply problem due electric voltage ups and down, load shading problems
6.66 After taken out fish from the ditch, ditch was deepen to hold more water
Escape of fish from the rice plot due to heavy rainfall
6.66 Fortunately some amount of fish was in the plot of one farmer, which acted as a brood stock in the following year. Another farmer changed the plot and start seed production in the other suitable plot
Broodfish was stolen from household pond
3.33 Very few brood fish was in the pond and eventually seed production was poor. This sees was raised in the pond to make brood fish for the next year
Could not manage good quality tilapia 3.33 In the following year farmer purchased tilapia brood fish from a neighbour farmer
Excessive use of fertilizers caused mortality of fish seed
3.33 Farmer dewatered the plot to reduce the fertilizer effect and watered again
Fish seed was stolen from the plot 3.33 Then the farmer stocked carp fry from the fry traders
Some body killed fish using toxic substance
3.33 Strengthen the security to the plot in the following time

Appendices
484
Appendix 10: Photographs showing case study, observation, triangulation and validation findings at the field level
Case study with a fish seed producing farmer.
Case study with a fry trader.

Appendices
485
Observation on the installation of a shallow irrigation pump in ricefield.
Observation on collection process of common carp eggs using water hyacinth in perennial household pond.

Appendices
486
Observation on tilapia broodfish management in a farmer’s riceplot.
Observation on water management in fish seed producing riceplots during heavy rainfall.

Appendices
487
Catching of fish fingerlings from ricefields during boro harvest.
A harvest of fingerlings of different sizes from ricefields.

Appendices
488
Observation on fingerling purchased by fry traders from a decentralised seed producing household.
Triangulation and validation of findings with farmers.

Appendices
489
Appendix 11: Data/information collection from CARE and its PNGOs for cost-effectiveness analysis of FFS
Figure: Interview with CARE official (Manager, Thakurgaon Field Office, Go-Interfish
Project, CARE Bangladesh).
Figure: Interview with NGO Executive Director, (CARE partner NGO, JUS, Badargonj,
Rangpur).

Appendices
490
Appendix 12: Report on expenditure for implementation of FFS
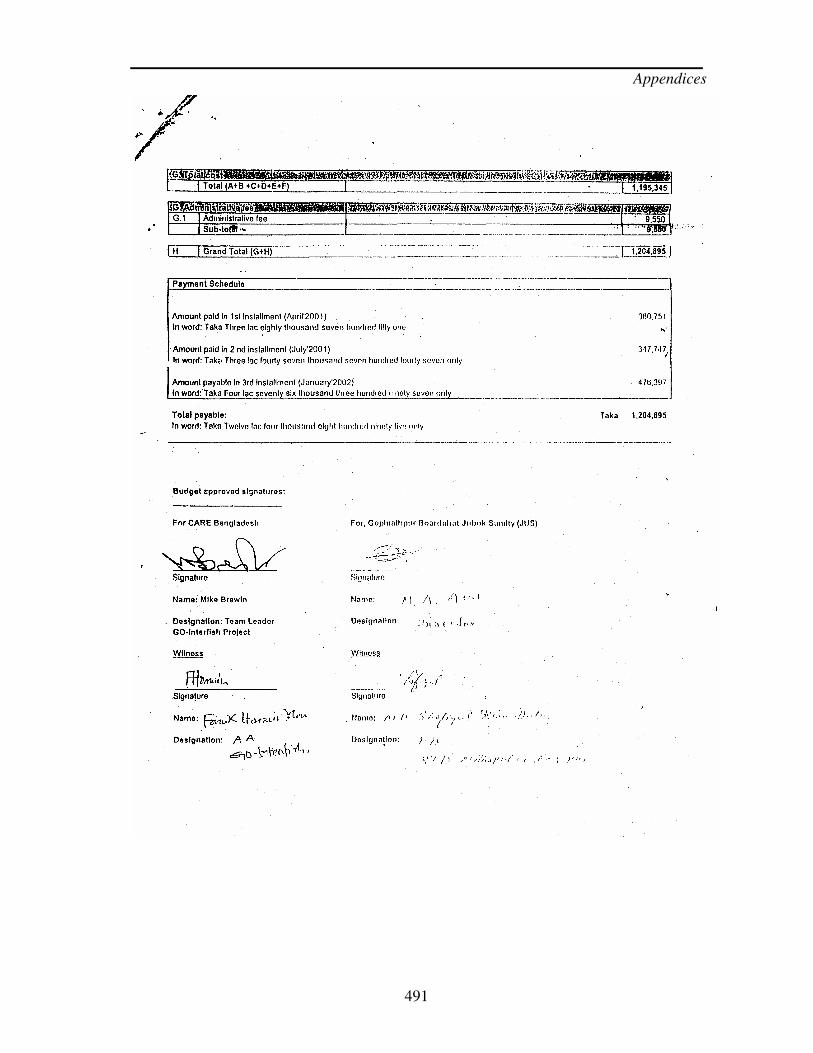
Appendices
491
Copyright © 2022 FDOKUMEN