the performance of health workers in decentralised
402
THE PERFORMANCE OF HEALTH WORKERS IN DECENTRALISED SERVICES IN UGANDA by GEORGE WILLIAM LUTWAMA Submitted in accordance with the requirements for the degree of DOCTOR OF LITERATURE AND PHILOSOPHY in the subject HEALTH STUDIES at the UNIVERSITY OF SOUTH AFRICA PROMOTER: PROF JH ROOS JOINT PROMOTER: DR BL DOLAMO JUNE 2011
-
Upload
khangminh22 -
Category
Documents
-
view
0 -
download
0
Transcript of the performance of health workers in decentralised

THE PERFORMANCE OF HEALTH WORKERS IN DECENTRALISED
SERVICES IN UGANDA
by
GEORGE WILLIAM LUTWAMA
Submitted in accordance with the requirements
for the degree of
DOCTOR OF LITERATURE AND PHILOSOPHY
in the subject
HEALTH STUDIES
at the
UNIVERSITY OF SOUTH AFRICA
PROMOTER: PROF JH ROOS
JOINT PROMOTER: DR BL DOLAMO
JUNE 2011

Student Number: 4502-562-2
DECLARATION
I declare that THE PERFORMANCE OF HEALTH WORKERS IN
DECENTRALISED SERVICES IN UGANDA is my own work and that all the
sources that I have used or quoted have been indicated and acknowledged by
means of complete references and that this work has not been submitted before
for any other degree at any other institution.
..................................................... ...................................
Dr George William Lutwama Date

DEDICATION
To my mother Bernadette, my father Peter, and my late grandfather Emmanuel
who introduced me to the academic world

ACKNOWLEDGEMENTS
I would like to thank following persons and organisations for their contributions
and support to this thesis: Special thanks to:
Professor JH Roos, my promoter and Dr BL Dolamo my joint promoter for
their guidance, support, and encouragement throughout my study. They have
been an inspiration to me and I have learnt a lot from their expertise.
The adminsitration of the University of South Africa (UNISA) for offering a
students bursary in the third year of my studies.
Mr. Ishmael Misinga, at the University of Malawi for his guidance and
assistance with statistical data analysis.
Ms. Jane Makeneuoe Jonkomane for professional editing of my manuscript.
Mr. Richard Dictus, the United Nations Resident Representative in Malawi for
offering me a special paid leave during data collection.
The University of South Africa (UNISA), Uganda National Council for Science
and Technology (UNCST), Mbale Hospital Institutional review board, the
Office of the President of the Republic of Uganda, for the ethical clearance of
this study.
The Resident District Commissioners, Chief Administrative Officers, and the
District Health Officers from the districts of Kumi, Mbale, Sironko and Tororo
for giving me permission to collect data from their respective health
institutions and facilities.
The health workers from the districts of Kumi, Mbale, Sironko, and Tororo for
their willingness to participate in this study.
The health services managers in the districts, health sub-districts and
hospitals in Kumi, Mbale, Sironko and Tororo for taking time off their busy
schedules to participate in this study.
And finally my wife Jane, my son Gabriel, my daughters Dinah and Cissy for
their love, understanding, and encouragement.
Glory be to the ALmightY God for all his blessings throughout this
study

THE PERFORMANCE OF HEALTH WORKERS IN DECENTRALISED SERVICES IN UGANDA
STUDENT NUMBER: 4502-562-2 STUDENT: GEORGE WILLIAM LUTWAMA DEGREE: DOCTOR OF LITERATURE AND PHILOSOPHY DEPARTMENT: HEALTH STUDIES, UNIVERSITY OF SOUTH AFRICA PROMOTER : PROF JH ROOS JOINT PROMOTER: DR BL DOLAMO
ABSTRACT
This study investigated the performance of health workers in the decentralised
services in Uganda in order to develop a management framework that may be used
to improve performance. The study followed a mixed research methodology and
was descriptive. The survey design was used to collect quantitative data by means
of a structured questionnaire. Qualitative data was collected using a semi-structured
interview guide.
The study population for the quantitative strand comprised 276 health workers
including doctors, clinical officers, and professional nurses working in four districts:
Kumi, Mbale, Sironko and Tororo. The health workers were selected using stratified
random sampling. The population for qualitative strand was health services
managers (N=21) from the same districts. The managers were selected purposively.
Quantitative data was analysed using SPSS version 18.0, while qualitative data was
coded and analysed manually.
The findings revealed that the performance of health workers is generally affected
by health systems and work environment related factors. The findings indicated that
health workers are skilled, competent, and generally have positive attitudes and
behaviours towards their clients. The study uncovered loop holes in performance
management in the district health sectors. In most cases there is no target setting,
no performance management planning, performance indicators are not clearly
defined, and the schedules for performance measurement are not always followed.
There is limited career progression and lack of functional performance feedback and
rewarding mechanisms. Although health workers are committed, there is
widespread political interference and nepotism in the district health sector
management. Overall, the researcher is optimistic that if the proposed performance
management framework is implemented, the performance of health workers might
improve.
Keywords: health workers; districts; decentralised services; performance
management; performance management framework; health sub-districts; health
services; health service managers; mixed research methodology; health sector
reforms.

i
Table of contents Page
CHAPTER 1 ORIENTATION TO THE STUDY
1.1 INTRODUCTION ............................................................................................... 1
1.2 BACKGROUND INFORMATION ABOUT THE RESEARCH PROBLEM .......... 2
1.2.1 The source of the research problem .............................................................. 3
1.2.2 Background to the research problem ............................................................. 4
1.2.2.1 Human resources for health (HRH) in Uganda............................................... 5
1.2.2.2 The health care system in Uganda ................................................................. 8
1.2.2.3 Health care sector performance during reforms ......................................... 10
1.3 STATEMENT OF THE RESEARCH PROBLEM .............................................. 15
1.4 AIM AND OBJECTIVES OF THE STUDY ....................................................... 16
1.5 SIGNIFICANCE OF THE STUDY .................................................................... 17
1.6 DEFINITION OF KEY CONCEPTS .................................................................. 17
1.7 FOUNDATIONS OF THE STUDY .................................................................... 20
1.7.1 Theoretical framework ................................................................................... 20
1.7.2 Relevance of the theoretical framework to this study ................................. 23
1.8 RESEARCH DESIGN AND METHODOLOGY ................................................ 23
1.8.1 Level 1 of the study ....................................................................................... 24
1.8.2 Level 2 of the study ....................................................................................... 25
1.8.3 Design validity and reliability of level 1 ........................................................ 25
1.8.4 Trustworthiness of the data obtained during level 2 ................................... 26
1.8.5 Ethical considerations ................................................................................... 26
1.9 SCOPE AND LIMITATIONS OF THE STUDY ................................................. 28
1.10 STRUCTURE OF THE THESIS ....................................................................... 28
1.11 CONCLUSION ................................................................................................. 29
CHAPTER 2 LITERATURE REVIEW
2.1 INTRODUCTION ............................................................................................. 30
2.2 DESCRIPTION OF THE THEORETICAL FRAMEWORK ................................ 31
2.2.1 Individual attributes ....................................................................................... 32

ii
Table of contents Page
2.2.2 Individual behaviour ...................................................................................... 33
2.2.3 Performance ................................................................................................... 35
2.2.4 Organisational strategy ................................................................................. 36
2.2.5 Situational constraints .................................................................................. 37
2.2.6 Justification for using the chosen theoretical framework .......................... 37
2.3 THE CONCEPT OF DECENTRALISATION OF HEALTH SERVICES ............ 39
2.3.1 The approaches to decentralisation ............................................................. 40
2.3.2 Decentralisation of health services in Uganda ............................................ 41
2.3.3 Decentralisation and human resources for health (HRH) ........................... 43
2.4 HUMAN RESOURCE MANAGEMENT ............................................................ 47
2.4.1 The value of human resource management in performance ...................... 48
2.4.1.1 Enhancing worker’s knowledge, skills and abilities.................................... 49
2.4.1.1.1 Selection of workers ......................................................................................... 49
2.4.1.1.2 Training of health workers ................................................................................ 50
2.4.1.1.3 Compensation level ......................................................................................... 51
2.4.1.2 Motivation problems and enhancing practices ............................................ 52
2.4.1.3 Employee empowerment and enhancing practices .................................... 54
2.5 PERFORMANCE OF HEALTH WORKERS .................................................... 56
2.5.1 Dimensions of health workforce performance............................................. 57
2.5.1.1 Availability of health workers ........................................................................ 57
2.5.1.2 Responsiveness of health workers .............................................................. 59
2.5.1.3 Productivity of health workers ...................................................................... 61
2.5.1.4 Competence of health workers ..................................................................... 62
2.5.2 Determinants of health worker performance ............................................... 64
2.5.3 Strategies to optimise the performance of health workers ........................ 66
2.5.3.1 Job-related strategies .................................................................................... 66
2.5.3.1.1 Having comprehensible job descriptions .......................................................... 67
2.5.3.1.2 Formation of professional norms and codes of conduct ................................... 67
2.5.3.1.3 Matching appropriate skills to the work roles .................................................... 68

iii
Table of contents Page
2.5.3.1.4 Implementing effective support supervision ...................................................... 69
2.5.3.2 Support system related strategies................................................................ 70
2.5.3.2.1 Regular and satisfactory remuneration ............................................................. 70
2.5.3.2.2 Develop a functional communications system to facilitate flow of health information ....................................................................................................... 72
2.5.3.2.3 Expand the health infrastructure and improve supply chain management ........ 72
2.5.3.3 Work environment related strategies ........................................................... 73
2.5.3.3.1 Encourage continous professional education and development ....................... 74
2.5.3.3.2 Institute proper and effective management skills among the health teams ....... 75
2.5.3.3.3 Empower middle and lower level managers to take full responsibility of health service delivery ..................................................................................... 76
2.6 PERFORMANCE MANAGEMENT .................................................................. 76
2.6.1 The functions of performance management ................................................ 77
2.6.1.1 Strategic function .......................................................................................... 78
2.6.1.2 Administrative function ................................................................................. 78
2.6.1.3 Developmental function ................................................................................ 78
2.6.2 Performance management process .............................................................. 80
2.6.3 Performance appraisal .................................................................................. 81
2.6.3.1 The purpose of performance appraisals ...................................................... 82
2.6.3.2 The differences between performance management and performance appraisals ....................................................................................................... 82
2.6.3.3 The characteristics of an effective performance appraisal system ............ 83
2.6.4 Performance measurement ........................................................................... 84
2.6.4.1 The uses of performance measurement....................................................... 85
2.6.4.2 Performance standards ................................................................................. 86
2.6.4.3 Performance indicators ................................................................................. 88
2.6.5 Approaches to measuring performance....................................................... 90
2.6.5.1 Comparative approach .................................................................................. 91
2.6.5.2 The attribute approach .................................................................................. 91
2.6.5.3 The behavioural approach ............................................................................ 92

iv
Table of contents Page
2.6.5.4 The results approach ..................................................................................... 93
2.6.5.5 The quality approach ..................................................................................... 95
2.6.5.6 The multi-rater approach (360-degree feedback) ......................................... 96
2.6.5.7 Mistakes made by appraisers during performance measurement ............. 97
2.6.5.8 The causes of failure in performance appraisal .......................................... 99
2.6.6 Performance appraisal feedback ................................................................ 100
2.6.7 Performance Improvement .......................................................................... 103
2.6.7.1 Staff training ................................................................................................. 104
2.6.7.2 Staff development ........................................................................................ 105
2.7 THE ROLE OF LEADERSHIP IN PERFORMANCE MANAGEMENT ........... 107
2.8 CONCLUSION ............................................................................................... 109
CHAPTER 3 RESEARCH DESIGN AND METHODOLOGY
3.1 INTRODUCTION ........................................................................................... 111
3.2 RATIONALE OF THE STUDY ....................................................................... 111
3.3 THE SCOPE OF THE STUDY ....................................................................... 112
3.4 RESEARCH DESIGN .................................................................................... 112
3.4.1 Mixed methods research approach ............................................................ 113
3.4.1.1 Triangulation design ................................................................................... 115
3.4.1.1.1 Variants of triangulation design ...................................................................... 116
3.4.3 The quantitative research approach (Level 1)............................................ 118
3.4.4 The qualitative research approach (Level 2) .............................................. 119
3.4.5 Descriptive research design ....................................................................... 120
3.4.6 Survey research design ............................................................................... 121
3.5 LEVEL 1: QUANTITATIVE RESEARCH METHODS .................................... 122
3.5.1 Population and sampling at level 1 (Health facility level) ......................... 122
3.5.1.1 Study population for level 1 ........................................................................ 122
3.5.1.2 Target population for level 1 ....................................................................... 122
3.5.1.3 Accessible population for level 1................................................................ 123

v
Table of contents Page
3.5.1.4 Sampling frame for level 1 .......................................................................... 124
3.5.1.5 Sample size determination for health workers .......................................... 124
3.5.1.6 Sampling and sampling techniques of health workers ............................. 125
3.5.2 Data collection during the quantitative study (level 1) .............................. 127
3.5.2.1 Data collection approach and method for health workers ........................ 128
3.5.2.2 Construction of the questionnaire .............................................................. 129
3.5.2.3 Structure of the questionnaire .................................................................... 130
3.5.2.4 Pre-testing of the data collection tools ...................................................... 131
3.5.2.4.1 Expert review of the data collection tools ....................................................... 131
3.5.2.4.2 Pre-testing with the health workers and health services managers ................ 133
3.5.2.5 Administration of the questionnaire ........................................................... 133
3.5.3 Validity and reliability of the questionnaire ............................................... 134
3.5.3.1 Validity of the questionnaire ....................................................................... 134
3.5.3.2 Reliability of the questionnaire ................................................................... 136
3.5.4 Quantitative data analysis ........................................................................... 136
3.6 LEVEL 2: QUALITATIVE RESEARCH METHODS ....................................... 137
3.6.1 The target population and sampling for level 2 ......................................... 137
3.6.1.1 Sampling of health service managers ........................................................ 137
3.6.1.2 Sample size for health service managers .................................................. 138
3.6.2 Data collection during the qualitative study (level 2) ................................ 138
3.6.2.1 Data collection approach and method for health service managers ........ 139
3.6.2.2 Development of the interview schedule ..................................................... 139
3.6.2.3 Structure of the interview schedule ............................................................ 140
3.6.2.4 Training of the research assistants ............................................................ 140
3.6.2.5 Administration of the interviews ................................................................. 141
3.6.2.6 Criteria for enhancing quality and integrity of qualitative data ................ 142
3.6.3 Qualitative data analysis ............................................................................. 144
3.6.3.1 Processing and analysing interview data .................................................. 144
3.7 ETHICAL CONSIDERATIONS ...................................................................... 146

vi
Table of contents Page
3.7.1 Protecting the participants .......................................................................... 146
3.7.2 Protecting the right of the institution ......................................................... 147
3.7.3 Scientific integrity of the research.............................................................. 147
3.8 CONCLUSION ............................................................................................... 148
CHAPTER 4 ANALYSIS, INTERPRETATION, AND DISCUSSION OF QUANTITATIVE DATA
(LEVEL 1)
4.1 INTRODUCTION ........................................................................................... 149
4.2 RESPONSE RATE ........................................................................................ 150
4.3 DATA ANALYSIS .......................................................................................... 150
4.3.1 Statistical analysis programme .................................................................. 151
4.3.2 Testing for the normality of data................................................................. 151
4.3.3 Reliability of the data collection scale ........................................................ 151
4.3.4 Descriptive statistics ................................................................................... 153
4.3.5 Inferential statistics ..................................................................................... 153
4.4 DEMOGRAPHIC INFORMATION OF THE PARTICIPANTS ......................... 154
4.5 FINDINGS RELATED TO OBJECTIVE ONE ................................................ 157
4.5.1 Individual attributes ..................................................................................... 157
4.5.1.1 Job related skills and abilities .................................................................... 157
4.5.1.2 Aspects of self-monitoring ability............................................................... 159
4.5.1.3 Dimensions of self motivation .................................................................... 160
4.5.1.4 Aspects concerning individual commitment to the organisation ............. 162
4.5.1.5 Aspects concerning the individual values and beliefs .............................. 165
4.5.2 Individual behaviours for performance ...................................................... 166
4.5.2.1 Dimensions of individual proficiency behaviours of health workers ....... 166
4.5.2.2 Dimensions of individual adaptive behaviours .......................................... 168
4.5.2.3 Dimensions concerning individual proactive behaviours......................... 169
4.5.2.4 Dimensions concerning the individual client oriented behaviour ............ 170
4.5.3 Organisational factors ................................................................................. 171
4.5.3.1 Dimensions concerning the clarity of the organisational strategy .......... 171

vii
Table of contents Page
4.5.3.2 Dimensions concerning the work environment ......................................... 173
4.5.3.3 Dimensions concerning staff in the organisation ..................................... 176
4.5.3.4 Dimensions concerning the work schedule of health workers ................ 178
4.5.3.5 Dimensions concerning the organisational culture .................................. 179
4.5.4 Performance dimensions ............................................................................ 182
4.5.4.1 Dimensions concerning responsiveness of services ............................... 183
4.5.4.2 Dimensions regarding the availability of health workers in the health facility ........................................................................................................... 184
4.5.4.3 Dimensions regarding the productivity of health workers........................ 186
4.5.4.4 Dimensions regarding competence of health workers ............................. 188
4.5.5 Association statistics .................................................................................. 189
4.5.5.1 Correlation between the individual attributes and the performance ........ 190
4.5.5.2 Correlation between the individual performance behaviours and performance of health workers ................................................................... 192
4.5.5.3 Correlation between the organisation factors and performance of health workers ............................................................................................. 194
4.6 FINDINGS RELATED TO OBJECTIVE TWO ................................................ 196
4.6.1 Performance management .......................................................................... 196
4.6.1.1 Approaches to reviewing the performance of health workers .................. 197
4.6.1.2 How the results of performance review are utilised .................................. 198
4.6.1.3 Setting performance standards .................................................................. 199
4.6.1.4 Performance measurement ......................................................................... 201
4.6.1.5 Performance reporting ................................................................................ 203
4.6.1.6 Dimensions of performance improvement ................................................. 205
4.6.1.7 Dimensions regarding the rewarding system ............................................ 208
4.6.1.8 Dimensions concerning staff training and development .......................... 209
4.6.1.9 Dimensions concerning the overall performance of health workers ....... 212
4.6.2 Association between the dimensions of performance management and the performance dimensions ...................................................................... 212
4.7 FINDINGS RELATED TO OBJECTIVE THREE ............................................ 215

viii
Table of contents Page
4.8 CONCLUSION ............................................................................................... 217
CHAPTER 5 ANALYSIS, INTERPRETATION, AND DISCUSSION OF QUALITATIVE DATA
(LEVEL 2) 5.1 INTRODUCTION ........................................................................................... 219
5.2 RESEARCH METHODOLOGY ...................................................................... 219
5.2.1 Study population .......................................................................................... 219
5.2.2 Sampling ...................................................................................................... 220
5.3 DATA COLLECTION ..................................................................................... 220
5.3.1 Permission to conduct interviews .............................................................. 220
5.3.2 Interview guide ............................................................................................. 220
5.3.3 Conducting interviews ................................................................................. 221
5.3.4 Transcription of interviews ......................................................................... 221
5.4 DATA ANALYSIS .......................................................................................... 221
5.5 PRESENTATION OF FINDINGS FROM SECTION A OF THE INTERVIEW GUIDE ........................................................................................................... 222
5.5.1 Demographic characteristics of the participants ...................................... 222
5.5.1.1 Gender of the participants .......................................................................... 222
5.5.1.2 Age categories of the participants.............................................................. 223
5.5.1.3 District of work of the participants ............................................................. 223
5.5.1.4 Duration of work in the district ................................................................... 224
5.5.1.5 Training in human resource management or general management ........ 224
5.5.1.6 Type of training/programme in which the managers learnt human resource management ................................................................................. 225
5.5.1.7 Forum for discussion of issues concerning the performance of health workers ......................................................................................................... 225
5.6 PRESENTATION, INTERPRETATION AND DESCRIPTION OF FINDINGS FROM SECTION B OF THE INTERVIEW GUIDE ......................................... 226
5.6.1 Theme 1: Factors that may enhance or impede the performance of health workers ............................................................................................. 228
5.6.1.1 Subtheme 1.1: Organisational (health system) factors ............................. 229
5.6.1.1.1 Working environment ..................................................................................... 229

ix
Table of contents Page
5.6.1.1.2 Drugs, supplies and equipment ...................................................................... 230
5.6.1.1.3 Remuneration ................................................................................................ 231
5.6.1.1.4 Accommodation and living conditions ............................................................ 232
5.6.1.1.5 Transport and referral system ........................................................................ 233
5.6.1.1.6 Support supervision ....................................................................................... 233
5.6.1.1.7 Prospects for further studies .......................................................................... 234
5.6.1.1.8 Communication and interpersonal relationships ............................................. 235
5.6.1.1.9 Experience sharing ........................................................................................ 236
5.6.1.1.10 Promotion prospects or career movement...................................................... 236
5.6.1.1.11 Performance appraisal and recognition .......................................................... 237
5.6.1.1.12 Working relationships ..................................................................................... 238
5.6.1.1.13 Responsibility ................................................................................................. 239
5.6.1.1.14 Clarity of organisational mission ..................................................................... 239
5.6.1.1.15 Mobility of health workers ............................................................................... 240
5.6.1.1.16 Staffing levels and turnover rates ................................................................... 240
5.6.1.1.17 Primary Health Care (PHC) funding ............................................................... 241
5.6.1.2 Subtheme 1.2: Individual factors ................................................................ 241
5.6.1.2.1 Availability ...................................................................................................... 242
5.6.1.2.2 Competence .................................................................................................. 243
5.6.1.2.3 Pro-activity ..................................................................................................... 244
5.6.1.2.4 Client oriented behaviour ............................................................................... 244
5.6.1.2.5 Productivity .................................................................................................... 245
5.6.1.3 Subtheme 1.3: Institutional (local government) factors ................................... 246
5.6.1.3.1 Decentralisation ............................................................................................. 246
5.6.1.3.2 Government policies and guidelines............................................................... 248
5.6.1.3.3 Political interference ....................................................................................... 249
5.6.1.3.4 Health seeking behaviours of the communities .............................................. 250
5.6.2 Theme 2: Views of managers on how to improve the performance of health workers ............................................................................................. 251

x
Table of contents Page
5.6.2.1 Subtheme 2.1: Organisational initiative ..................................................... 251
5.6.2.1.1 Improving remuneration ................................................................................ 251
5.6.2.1.2 Training of health workers .............................................................................. 252
5.6.2.1.3 Delegation of responsibility ............................................................................ 254
5.6.2.1.4 Hospital infrastructure, accommodation and transport ................................... 255
5.6.2.1.5 Support supervision ...................................................................................... 255
5.6.2.2 Subtheme 2.2: Institutional initiative .......................................................... 256
5.6.2.2.1 Centralise the district health office and the management of health workers.. 256
5.6.2.3 Subtheme 2.3: Community initiatives ......................................................... 257
5.6.2.3.1 Community appreciation and support for health workers ................................ 258
5.6.3 Theme 3: Existing practises for managing the performance of health workers ......................................................................................................... 259
5.6.3.1 Subtheme 3.1: Planning for performance appraisal .................................. 259
5.6.3.1.1 Target setting and performance agreements .................................................. 259
5.6.3.1.2 Pre- appraisal planning meetings .................................................................. 260
5.6.3.2 Subtheme 3.2: Performance measurement ............................................... 261
5.6.3.2.1 Performance measurement tools and indicators ........................................... 261
5.6.3.2.2 Frequency of performance measurement ...................................................... 262
5.6.3.3 Subtheme 3.3: Performance reporting and feedback ............................... 263
5.6.3.3.1 Mode and frequency of reporting ................................................................... 263
5.6.3.3.2 Mode and frequency of giving performance feedback ................................... 264
5.6.3.4 Subtheme 3.4: Recognising performance ................................................. 265
5.6.3.4.1 Modes of recognising performance ............................................................... 265
5.6.3.5 Subtheme 3.5: Use of performance appraisal results .............................. 266
5.6.3.5.1 Ways in which performance appraisal results are used .......................... 266
5.6.4 Theme 4: Suggestions of managers on how to improve performance appraisal ....................................................................................................... 267
5.6.4.1 Subtheme 4.1: Performance appraisal tool ............................................... 267
5.6.4.1.1 Review the performance appraisal tool .......................................................... 268
5.6.4.2 Subtheme 4.2: Performance appraisal process ......................................... 268

xi
Table of contents Page
5.6.4.2.1 Nature and frequency of appraisal process .................................................... 269
5.6.4.3 Subtheme 4.3: Recognising performance .................................................. 269
5.6.4.3.1 Rewarding good performance ........................................................................ 270
5.6.4.4 Subtheme 4.4: Performance appraisal feedback ....................................... 271
5.6.4.4.1 Frequency of performance appraisal feedback .............................................. 271
5.6.4.5 Subtheme 4.5: Using performance appraisal results ................................ 272
5.6.4.5.1 Promotion, confirmation in civil service and training ....................................... 272
5.6.4.6 Subtheme 4.6: Training of supervisors ..................................................... 273
5.6.4.6.1 Training of health managers on the importance of performance appraisal ... 273
5.7 CONCLUSION ............................................................................................... 274
CHAPTER 6 CONCLUSIONS, LIMITATIONS, AND RECOMMENDATIONS
6.1 INTRODUCTION ........................................................................................... 275
6.2 THE AIM AND OBJECTIVES OF THE STUDY ............................................. 275
6.3 RESEARCH DESIGN AND METHODOLOGY .............................................. 275
6.3.1 Level 1 .......................................................................................................... 276
6.3.2 Level 2 .......................................................................................................... 276
6.4 CONCLUSIONS ............................................................................................ 276
6.4.1 Identify the factors that enhance or impede the performance of health workers. ........................................................................................................ 277
6.4.2 Assess the current practices used to manage the performance of health workers ............................................................................................. 280
6.4.3 Determine the views of health workers and their managers on how to improve performance of health workers .................................................... 284
6.4.4 Develop a performance management framework for health workers based on the research findings .................................................................. 286
6.4.4.1 The key components of the performance management framework ......... 296
6.4.4.1.1 Understanding the context for performance management in the health sector 296
6.4.4.1.2 Performance planning .................................................................................... 297
6.4.4.1.3 Coaching ....................................................................................................... 298
6.4.4.1.4 Staff training and development....................................................................... 298

xii
Table of contents Page
6.4.4.1.5 Performance review ....................................................................................... 299
6.4.4.1.6 Performance feedback ................................................................................... 300
6.4.4.1.7 Rewards and recognition of good performance .............................................. 301
6.4.4.1.8 Monitoring and evaluation of performance management system .................... 302
6.5 LIMITATIONS OF THE STUDY ..................................................................... 302
6.6 RECOMMENDATIONS .................................................................................. 304
6.6.1 Recommendations for addressing the factors that hinder the performance of health workers ................................................................... 304
6.6.2 Recommendations for addressing the current practices for managing performance of health workers ................................................................... 306
6.6.3 Recommendations for further research ..................................................... 307
6.7 CONTRIBUTION OF THE STUDY................................................................. 308
6.7.1 Implications of the study ............................................................................. 309
6.8 CONCLUDING REMARKS ............................................................................ 309
BIBLIOGRAPHY ............................................................................................................. 311

xiii
List of tables Page
Table 1.1 The district health system structure in Uganda……………………...... 9
Table 1.2 Uganda‟s health status outcomes during the reforms………………... 12
Table 1.3 Performance against the 8 PEAP indicators for FY 2007/08………... 13
Table 1.4 Data sources, methods of sampling and data collection…………….. 24
Table 2.1 Determinants of health workers‟ performance ………………………... 65
Table 3.1 Distribution of health workers in the four districts of Eastern Uganda 123
Table 3.2 Proportional distribution of participants in the sample………………... 126
Table 3.3 Number of questionnaires sent and returned in usable state……….. 134
Table 4.1 Response rate for the study ……………………………………………. 150
Table 4.2 Reliablity coefficiencts for the 26 constructs………………………...... 152
Table 4.3 Rule of thumb for interpreting the size of a correlation coefficient (r) 154
Table 4.4 Demographic characteristics of the participants (N=276) …………… 155
Table 4.5 Job related skills and abilities of the participants N=276) ………...... 158
Table 4.6 Self-monitoring ablity of the participants (N=276) ……………………. 159
Table 4.7 Dimensions concerning self motivation of health workers N=276)….. 161
Table 4.8 Dimensions of the participants‟ commitment to the organinsation
(N=276) ……………………………………………………………………
163
Table 4.9 Dimensions of individual values and beliefs (N=276) 165
Table 4.10 Dimesions concerning the individual profieciency behaviours of
health workers (N=276) ………………………………………………….
167
Table 4.11 Dimensions concerning the adaptive behaviours of health workers
(N=276) ……………………………………………………………………
168
Table 4.12 Dimensions for individual proactive behaviours (N=276) ……………. 169
Table 4.13 Dimensions concerning the client oriented behaviours (N=276) …… 170
Table 4:14 Dimensions concerning the clarity of the organisational strategy
(N=276) ……………………………………………………………………
172
Table 4.15 Dimensions concerning the work environment (N=276) ……………. 174
Table 4.16 Dimensions concerning the staffing in the organisation (N=276) …... 177
Table 4.17 Dimensions concerning the work schedule of health workers
(N=276)…………………………………………………………………....
178
Table 4.18 Dimensions concerning the organisational culture (N=276) ……….. 180

xiv
List of tables Page
Table 4.19 Dimensions concerning responsiveness of health workers (N=276) . 183
Table 4.20 Dimensions concerning the availability of health workers (N=276)…. 185
Table 4.21 Dimensions concerning the productivity of health workers (N=276) . 187
Table 4.22 Dimensions concerning the competence of health workers (N=276). 188
Table 4.23 Correlation between the individual health workers‟ attributes and the
dimensions of perfomance (N=276) ……………………………………
190
Table 4.24 Correlation between the individual performance behaviours and
dimensions of performance (N=276) …………………………………...
193
Table 4.25 Correlation between the organisational factors and the dimensions
of performance of health workers (N=276) …………………………….
194
Table 4.26 The use of performance review results in the districts (N=276) ……. 198
Table 4.27 Dimensions concerning the setting of performance standards
(N=276) ……………………………………………………………………
199
Table 4.28 Dimensions of performance measurement in the districts (N=276) .. 202
Table 4.29 Dimensions concerning the reporting of performance of health
workers (N=276) …………………………………………………………
204
Table 4.30 Dimensions concerning perfomance improvement in the districts
(N=276) ……………………………………………………………………
206
Table 4.31 Dimensions concerning the rewarding system (N=276) …………….. 208
Table 4.32 Dimensions concerning staff training and development (N=276) .….. 210
Table 4.33 Dimensions concerning the overall perfomance of health workers
(N=276) …………………………………………………………………...
212
Table 4.34 Correlations between perfomance management and the dimensions
of perfomance (N=276) ………………………………………………….
213
Table 4.35 Health wokers‟ responses on how to improve performance
(N=261)……………………………………………………………………
215
Table 5.1 The number of years managers have worked in the district
(N=21) ……………………………………………………………………
224
Table 5.2 Type of training programme attended by the managers
(N=16) …………………………………………………………………….
225

xv
List of tables Page
Table 5.3 Forums where perfomance has been discussed N=21) …………….. 226
Table 5.4: Emerging themes, subthemes, and categories ………………………. 227
Table 5.5 Organisational factors influencing the performance of health
workers …………………………………………………………………….
229
Table 5.6 Individual factors influencing the performance of health
workers …...........................................................................................
242
Table 5.7 Institutional factors affecting the performance of health
workers …...........................................................................................
246
Table 5.8 Views of managers on how to improve the performance of health
workers …………………………………………………………………….
251
Table 5.9 Institutional initiative to improve performance of health
workers …………………………………………………………………….
256
Table 5.10 Community initiatives to improve performance of health
workers …………………………………………………………………….
257
Table 5.11 Current practices for managing performance of health
workers ……………………………………………………………………
259
Table 5.12 Performance measurement of health workers ……………………….. 261
Table 5.13 Performance reporting and feedback …………………………………. 263
Table 5.14 Recognising performance of health workers …………………………. 265
Table 5.15 Use of performance appraisal results …………………………………. 266
Table 5.16 Improving performance appraisal tool …………………………………. 267
Table 5.17 Performance appraisal process ………………………………………... 269
Table 5.18 Recognising performance of health workers …………………………. 270
Table 5.19 Frequency of performance appraisal feedback ………………………. 271
Table 5.20 Recommendations on use of performance appraisal results ……….. 272
Table 5.21 Training of supervisors ………………………………………………….. 273
Table 6.1 The performance management framework for health workers in the
decentralised services …………………………………………………...
288
xvi
List of figures Page
Figure 1.1 The map of Uganda showing the districts as of July 2010…………... 3
Figure 1.2 The strategic performance model (adapted from Noe et al
2008:345) ………………………………………………………………….
22
Figure 3.1 The visual multilevel triangulation model (Adapted from Creswell &
Plano-Clark 2007:64) …………………………………..........................
117
Figure 4.1 How performance of health workers is reviewed in the districts
(N=276) …………………………………………………………………
197
Figure 5.1 Gender of the health service managers (N=21) …………………… 222
Figure 5.2 Age of the health service managers (N=21) ……………………….. 223
Figure 5.3 Districts where the health service managers work (N=21) ……….. 223
Figure 5.4 Training in human resource or general management
(N=21) …………………………………………………………………..
224

xvii
List of annexures
Annexure A Certificate of clearance from the University of South Africa, Health
Studies Research and Ethics Committee
Annexure B Letter of ethical clearance from the Uganda National Council for Science
and Technology
Annexure C Letter of Ethical Clearance from the institutional review board of Mbale
Regional Hospital
Annexure D Letter of permission from the office of the president of Republic of
Uganda
Annexure E The consent form
Annexure F Covering letter accompanying the self administered questionnaire
Annexure G Letter requesting for permission from health service managers to collect
data and conduct interviews
Annexure H Self-Administered questionnaire for health workers
Annexure I Interview Schedule for the health service managers
Annexure J Tests for normality of data from health workers questionnaire
Annexure K Correlation matrices between individual attributes and performance
dimensions
Annexure L Correlation matrices between individual behaviours and performance
dimensions
Annexure M Correlation matrices between organisational factors and performance
dimensions
Annexure N: Correlation matrices between performance management and
performance dimensions

xviii
LIST OF ACRONYMS AND ABBREVIATIONS ACA American Correctional Academy
AIDS Acquired Immune Deficiency Syndrome
ART Antiretroviral Therapy
BSC Balanced Scorecard
CAO Chief Administrative Officer
CME Continuing Medical Education
DDHS District Director of Health Services
DFID Department for International Development
DHC District Health Committee
DHMT District Health Management Team
DHO District Health Officer
DIRPSER Department of Industrial Relations, Public Sector and Employee
Relations
DMO District Medical Officer
DSC District Service Commission
EMR Eastern Mediterranean Region
FY Financial Year
GoU Government of Uganda
HC II Health Centre at parish
HC III Health Centre at Sub county level
HC IV Health Centre at Sub-district or county level
HC V Health Centre at District Level (District Hospital)
HC Health Centre
HIV Human Immune Virus
HMIS Health Management Information System
HR Human Resources
HRD Human Resource Development
HRH Human Resources for Health
HRM Human Resource Management
HSC Health Service Commission
HSD Health Sub-District
HSSP II Health Sector Strategic Plan number two
HSSP Health Sector Strategic Plan

xix
IMCI Integrated Management of Childhood Illnesses
ISCO International Standard Classification of Occupations
JLI Joint Learning Initiative
LC III Sub-County Local Council (III)
LC IV District Local Council
LC V Local Council five
LC Local Council
MBO Management by Objectives
MDGs Millennium Development Goals
MoH Ministry of Health
MoPS Ministry of Public Service
N Population
n Sample
NGO Non Government Organisation
NHP National Health Policy
PEAP Poverty Eradication Action Plan
PHC Primary Health Care
PNFP Private Not for Profit
ProMES Productivity Measurement and evaluation system
PRP Performance related payment
SPSS Statistical Package for Social Sciences
TB Tuberculosis
TQM Total Quality Management
UK United Kingdom
UN United Nations
UNCST Uganda National Council for Science and Technology
UNMHCP Uganda National Minimum Health Care Package
USA United States of America
SWOT Strengths, Weaknesses, Opportunities and Threats
WHO World Health Organization

1
CHAPTER 1 ORIENTATION TO THE STUDY
1.1 INTRODUCTION
There is growing recognition on the importance of health workforce studies. This
is motivated by links that have been established between human resource
issues and health systems performance resulting from the health sector reforms
(Fritzen 2007:[1]). The World Health Organization (WHO 2006: xxv) launched
the health workforce decade (2006-2015) with high priority given to countries to
develop effective workforce strategies through: improving recruitment, improving
performance and reducing attrition of health workers. It is widely accepted that
human resources are the most important assets of the health system and play a
critical role in the attainment of the reform objectives (Ssengooba,
Rutebemberwa & Hongoro 2005:2). Fritzen (2007:[2]) describes health
workforce issues as strategic because they affect the overall systems
performance, feasibility and sustainability of health sector reforms. Hence,
addressing the health workforce issues strategically helps in identifying the gaps
in policy and implementation of health sector reforms.
The health workforce crisis in developing countries is receiving increasing
worldwide attention. Policy makers realise that it will not be possible to attain the
millennium development goals (MDGs) unless availability and performance of
health workers are addressed more effectively. Poor performance of health
workers leads to inappropriate health care which in turn contributes to
undesirable health outcomes (Dieleman, Gerretsen & van der Wilt 2009:[2];
WHO 2006:67-70). Scholars have documented problems related to poor
performance of health workers, yet there is still no sufficient evidence on what
actually works to improve health workforce performance (Chopra, Munro, Lavis,
Vist & Bennett 2008:673; Garcia-Prado & Chawla 2006:98; Rowe, de Savigny,
Lanata & Victora 2005:1028).
Performance management has been described by many writers as an effective
tool in strengthening health services delivery. Currently it has become an area of

2
great research interest. Internationally, health systems are faced with the
demands to trim costs and get better health outcomes (Lozan, Soliz, Gakidou,
Abbott-Klafter, Feehan, Vidal, Ortiz & Murray 2006:1729; Tawfik-Shukor,
Klazinga & Arah 2007:[10]). Since the 1990s a series of reforms have taken
place in Uganda. These reforms, including decentralisation and organisational
restructuring were meant to improve systems performance. However, the
reforms did not pay much attention to the human resource issues (Okuonzi
2004:1174; Ssengooba et al 2005:3). Cognisant of the situation, it is important to
uncover more evidence on health workforce performance. This evidence may
assist policy makers to recognise and apply appropriate strategies for improving
performance. This chapter presents the source and background to the problem,
states the research problem, study aim and objectives, and the significance of
the study. Furthermore, the researcher presents the definition of key concepts
and terms, the theoretical foundations, a brief of the research methodology, and
the ethical considerations. Lastly, the researcher presents the scope and
anticipated limitations of the study.
1.2 BACKGROUND INFORMATION ABOUT THE RESEARCH PROBLEM
Uganda is a land locked country situated in East Africa. It is bordered by Sudan
in the north, Kenya in the east, Tanzania and Rwanda in the south, and
Democratic Republic of Congo in the west. Uganda is divided into 112 districts
across four regions namely; Central, Eastern, Western, and Northern (see Figure
1.1). Each district is further divided into counties, sub-counties, parishes, and
villages. The total population of Uganda is estimated to be 31 million people, with
an annual growth rate of 3.2% (Uganda Bureau of Statistics & Macro
International Inc 2007:1-2). During the post independence era (1962 -1971)
Uganda was one of the countries with the best health indices and vibrant health
care system in Africa. Following the two decades of civil unrest, the health
system collapsed. After the civil war, the Government of Uganda (GoU) began
reconstruction and rehabilitation programmes by nurturing the political and
economic environment conducive for growth. Since the early 1990s the
government of Uganda has placed high priority to improving the health status of

3
the people, yet, the health indicators have remained poor (Ministry of Health
Uganda (MoH) 2009:1-2).
Figure 1.1: The map of Uganda showing the districts as of July 2010 Source: http://molg.go.ug/Content/images/uganda_2010.gif
1.2.1 The source of the research problem
The researcher was inspired to carry out this study in the field of human
resource for health by a number of reasons. These emanate from the
researcher‟s eight-year hands-on experience as a medical officer and later as
District Director of Health Services in the decentralised health system. During
this period the researcher observed a number of performance problems facing
health workers that necessitate further investigations. Secondly, the current
press reports in Uganda provide staggering evidence regarding health worker
performance problems in decentralised health services. Some of these include;

4
absenteeism, neglect of patients, drug pilferage and poor staff motivation among
others. The press has also reported the current Minister of Health in Uganda,
blaming decentralisation as the cause for poor delivery of health services in the
country (Lirri 2008:1). Thirdly, as a result of the deterioration of the health sector,
the President of Uganda, Mr. Yoweri Museveni wrote a letter to the Minister of
Health in April 2008 demanding explanation for health sector failures (Fanaka
Kwa Wote 2008:1). Furthermore, the annual report for 2007/2008 of the Uganda
Ministry of Health (MoH) clearly states that some health indicators are either
stagnating or deteriorating, thanks to inadequate health worker performance
(Ministry of Health Uganda 2008:25). It is therefore worth investigating the
performance of health workers in the decentralised services in order to establish
the root cause of the problems.
1.2.2 Background to the research problem
As part of the health sector reforms which began in the early 1990s,
decentralisation is one of the major reforms that have been implemented across
the Ugandan health care delivery system. These reforms were operationalised
through the Health Sector Strategic Plan (HSSP) under the National Health
Policy (NHP) with the focus on reducing morbidity and mortality from major
illnesses. Among the anticipated benefits of health sector reforms were
responsiveness, efficiency, and accountability in decision making among
stakeholders (Awio & Northcott 2001:75-76). In Uganda the delivery of health
services is decentralised to the district level. Decentralisation entails significant
changes to the way human resources are managed in public service,
transforming the authority, accountability structures, career paths, recruitment,
payment, training, and discipline of staff. The degree of responsiveness of the
district systems to the needs of the health workers such as payment of salaries,
promotion, social and personal development is essential in understanding the
impact decentralisation on health workers‟ performance (Ssengooba et al
2005:3).

5
1.2.2.1 Human resources for health (HRH) in Uganda
There are over 20 categories of health workers within the health sector.
However, for the purpose of this study, the researcher considered three main
categories that are critical for the implementation of the Uganda National
Minimum Health Care Package (UNMHCP) and these include doctors, clinical
officers and nurses.
A medical doctor is referred to as medical officer in the Ugandan public service.
Medical doctors are trained for a minimum of five years, and graduate with
Bachelor of Medicine and Bachelor of Surgery degree. They undergo a
mandatory one year of supervised internship. After the internship, medical
doctors are fully registered with the Uganda Medical and Dental Practitioners
Council to practice medicine. Postgraduate training in any medical specialities
takes between 3 to 4 years. There are three public medical schools in Uganda
that train doctors and these are; Gulu University, Makerere University, and
Mbarara University of Science and Technology. A medical doctor joins the
service as medical officer and progresses to medical officer special grade
(specialist) and eventually to senior consultant (Matsiko & Kiwanuka 2003:18-
19).
The clinical officers are health care providers that are commonly found in sub-
Saharan Africa. In Uganda, clinical officers are trained for three years and
graduate with a diploma in clinical medicine and community health. Clinical
officer‟s training covers approximately 60% of the curriculum for medical doctors
and the emphasis is placed on solving community problems by applying their
knowledge of medicine. Unlike some other African countries, clinical officers in
Uganda are not required to undergo internship. They are registered by the
Uganda Allied Health Professionals Council. Clinical officers either work
independently or with a medical officer to provide healthcare services largely to
the rural population (Matsiko & Kiwanuka 2003:18). In Uganda, there are three
public schools for training clinical officers based in the towns of Fort Portal, Gulu,
and Mbale. There is no clear career path for clinical officers. When a clinical

6
officer wants to upgrade to the level of a medical doctor, she or he enters the
university medical school through mature age entry programme and has to start
from the first year.
Nurses are the largest cadre of health workers who are critical to the
implementation public health interventions. The nurses in Uganda have varying
qualification levels ranging from degree to certificate holders. Nurses holding a
university degree are referred to as professional nurses, those with diplomas are
associate professional nurses (registered nurses/midwives) and those with
certificates are either enrolled nurses or midwives (Orach 2009:3). The training
of nurses varies from three years (3 years) for enrolled nurses/midwives to 4 and
5 years for diploma and degree holders respectively (Matsiko & Kiwanuka
2003:16-18). In order to practice nursing in Uganda, all nurses are supposed to
be registered with Uganda Nurses and Midwives Council, which is the national
regulatory body for this profession. There is a clear career path for nurses in
Uganda and opportunities for post-graduate training is available up to doctoral
level.
Uganda is among the 57 countries with critical human resource shortages. The
situation is worse at the lower levels of the health system where the burden of
disease is high (WHO 2006:196). By November 2008, only 51% of the approved
positions at national level were filled. The situation is said to be worse in rural,
conflict and post-conflict, and the hard-to-reach areas (Ministry of Health Uganda
2009:5). Many factors have been attributed to the many vacancies, which
include but are not limited to insufficient training capacity, low remuneration and
poor working conditions. These conditions make it difficult for the districts to
recruit and retain health workers. Additionally, there is inequitable distribution of
health workers among districts, rural and urban areas, and between public and
private providers. There has been attrition of health workers from private not for
profit (PNFP) facilities to public facilities over the past few years due to the
decision by government to increase salaries and incentives of civil servants.

7
Emigration of health workers to other countries is also common due to more
attractive salaries and opportunities. The Centre for Global Development (2000)
quoted in Clemens and Pettersson (2008:[7-9]), report that in the year 2000 out
of 4266 Ugandan born doctors, 1837 (43%) were residing outside their country.
Most of them were working in Great Britain (62%), United States of America
(16%), Canada (9%), South Africa (10%), Australia (3%) and the rest (0.3%)
were in France, Belgium, Portugal and Spain. Additionally, during the same
period, out of the 9851 Ugandan born professional nurses, 1122 (10%) were
working or residing outside their country. The biggest percentage was in Great
Britain (64%), United States of America (26%), Canada (7%), Australia (3%) and
South Africa (1%). Hagopian (2006:21) reports that from the year 2000 to 2005,
a total of 586 nurses applied for external licensing. The majority of these (75%)
were either registered nurses or midwives who are crucial in the delivery of the
UNMHCP. Furthermore, a study carried out among nursing students at Makerere
Nursing School and Aga Khan University Nursing School in Kampala in July
2006; reveals that 70% of the participants would like to work outside Uganda.
They indicated that within five years they would be working in USA (59%) or the
United Kingdom (49%). About 27% indicated their intention of working in another
African country and only 8% of all students reported the unlikelihood to emigrate
upon completion of their studies (Nguyen, Ropers, Nderitu, Zuyderduin, Luboga
& Hagopian 2008:[4]).
Several writers report that productivity of health workers in public facilities is low
due to high rates of absenteeism and rampant dualism. Poor attitudes of health
workers towards patients also affect the utilisation of services. Health workers do
not feel accountable to communities. At the same time leadership and
management of human resources are weak at all levels (Ministry of Health
Uganda 2009:6). Shortage of health workers poses a challenge to achieving the
millennium development goals (MDGs). The few health workers available on the
ground are faced with the burden to implement a wide range of services within
the UNMHCP and to meet the targets of the second Health Sector Strategic Plan
(HSSP II), the national Poverty Eradication Action Plan (PEAP) and the MDGs
(Orach 2008:31).

8
1.2.2.2 The health care system in Uganda
Health services are provided both by public and private sectors. In the public
sector, the UNMHCP has been developed as a basis for services delivery. The
UNMHCP comprises the most cost-effective priority health interventions and
services that address the major causes of high disease burden. The UNMHCP is
intended to be the basic indication for determining the allocation of public funds
and other essential inputs. The UNMHCP includes the following components:
Health promotion, disease prevention and community health initiatives.
Examples of these are school health, health education, environmental health
services, and epidemic and disaster preparedness.
Nutrition and food security.
Maternal and child health services such as Integrated Management of
Childhood Illnesses (IMCI), immunisation, and sexual and reproductive health
and rights.
Prevention, management and control of communicable diseases like malaria,
HIV/AIDS, and Tuberculosis.
The different levels of health care system are expected to provide the UNMHCP
in an integrated manner (Ministry of Health Uganda 2009:14-15).
The public health system in Uganda consists of the national and regional referral
hospitals, and the district health system. The national and regional referral
hospitals are autonomous and self-accounting institutions. The district health
care systems are managed by the local governments which are aligned to the
administrative structures as shown in Table 1.1.

9
Table 1.1: The district health system structure in Uganda
Administrative structure
Local council level Corresponding health care structure
Village I Village Health team (VHT)
Parish II Health Centre II (HC II)
Sub-county III Health Centre III (HC III)
County (Sub-District) IV Health Centre IV (Health Sub-district (HSDs)
District V District General Hospital (HC V)
Source: Ministry of Health Uganda (2002:2)
Politically, the head of the district local government is an elected chairperson of
local council five (LC V). The district council (LC V) oversees the functions of the
district including the health services. The Chief Administrative Officer (CAO) is
the head of administration and civil service. The District Health Officer (DHO) is
the head of district health system assisted by the District Health Management
Team (DHMT). The local councils V (LC V), IV (LC IV) and III (LC III) are local
governments, while the local councils II (LC II) and I (LC I) are local
administrative units. The local governments have administrative, financial and
legislative authority. However, the local administrative units largely have
administrative powers (United Nations Department for Economic and Social
Affairs 2004:7).
As indicated in Table 1.1, the district health care system consists of the district
general hospitals, health centres (HC) level II, III IV, and the village health
teams. At the district level, the district hospital is the highest level of health care.
The district hospital is headed by the medical superintendents, assisted by a
number of doctors, clinical officers, nurses and midwives and other allied health
professionals.
The district health system is further subdivided into health sub-districts (HSDs) or
health centre level IV (HC IV). This usually corresponds with the administrative
structure of the counties or parliamentary constituencies. The health sub-district
is headed by a medical doctor, assisted by 2 clinical officers, registered nurses,
and enrolled nurses, midwives, and laboratory technician. The health centre IV
offers operation theatre services for emergency obstetric care, maternity
services, laboratory services, in and outpatient services. The staff at HC IV

10
supervise the operations of the lower level health care units within their
catchment areas. Every county is divided into sub-counties. This is the lowest
level of local governments. At this level, the health care services are provided by
health centre level III (HC III). Usually a clinical officer heads the services at this
level assisted by a nurse and midwife, laboratory technician, and nursing
assistants. The services provided at this level include maternity, laboratory
services, as well as in and outpatient services. The sub-counties are further
sub-divided into parishes or wards. The health care facility at the parish or ward
level is health centre level II (HC II). An enrolled nurse and midwife manage the
HC IIs. This is the lowest level of health care facility and offers primary health
care services. These health centres do not offer any maternity, theatre,
laboratory or inpatient services. Lastly, parishes/wards are divided into villages
(LC Is), which are the lowest administrative units. At this level there are village
health teams, which are teams of local residents appointed to oversee the
performance of health activities in their communities (Kavuma 2009:1-2).
Generally, the management capacity at the districts is still very limited due to
inadequate leadership, poor management, lack of specialist skills and high
attrition rates which inhibit capacity building initiatives. About 72% of households
in Uganda live within 5km from a health facility. However, utilisation is limited
due to poor infrastructure, lack of drugs, shortage and low motivation of health
workers (Ministry of Health Uganda 2009:3). Therefore, the functionality of the
health system in Uganda remains a challenge such that system strengthening,
especially at district level is required to facilitate effective service delivery.
1.2.2.3 Health care sector performance during reforms
Although Uganda‟s decentralisation has been praised, it has brought with it
some obstacles to service provision. This is because most of the funds allocated
to the local governments are assigned by MoH for specific activities. Hence,
local governments use funds as directed by the MoH and not according to their
needs.

11
Despite the analysis of the achievements and failures of health reforms, in
general, little attention has been paid to the human resources yet they play a
significant part in determining the achievements of the health reforms (Okuonzi
2004:1173). The Joint Learning Initiative (JLI) (2004:21-26) outlines the
importance of health workforce in performing services by stating that „health
worker numbers, quality, and professionalism determine output and productivity‟.
A significant number of information sources have documented problems of poor
health care outcomes resulting from inadequate performance of health workers.
For instance, Garcia-Prado & Chawla (2006:98); JLI (2004:1); Rowe et al
(2005:1026-1027); Van Lerberghe, Conceição, Van Damme & Ferrinho
(2002:581); and WHO ( 2006: xvii) note that the poor performance may result
from too few health workers or from health workers providing substandard care
which is not responsive to the needs of the clients. Some of the performance
problems may be attributed to factors such as unclear expectations, skills deficit,
resource or equipment shortages, and lack of motivation among others. These
problems are entrenched in a deteriorating health system characterised by low
salaries, difficult working and living conditions and inappropriate training.
Performance management in the Ugandan health sector is still weak, with little or
no documented proof of its practice. Although official reports on the effects of
health sector reforms may paint a rosy picture, the reality has often been, and
remains shockingly different. Okuonzi (2004:1174) reports that Uganda has
failed to achieve a functioning health system despite the reforms. The
performance of health systems has actually deteriorated after the introduction of
the reforms and from 1990-1995 and 2000-2004 key health statistics worsened
as shown in Table 1.2. It is thus imperative to ascertain whether this trend could
possibly be due to performance of health workers or poor performance
management systems within the decentralised services.

12
Table 1.2: Uganda’s health status during reforms
Aspect of performance 1990-1995 2000-2004
Nutrition (% of children with stunting) 6.2 7.8
Access to safe water (%) 39.4 53.8
Access to proper sanitation (%) 34 51
Infant mortality (deaths/1000 live birth) 81 88
Neonatal mortality (death/1000 live birth) 27 33.2
Malaria morbidity (%) 25 37
Diarrhoea morbidity (%) 17.7 17.8
Maternal mortality ratio (death/100,000 live birth) 506 505
Child mortality (death/1000) 147 151
Life expectancy (years) 50 47
Deliveries in health facilities (%) 38 47
Fertility rate (average number of children/mother) 7.4 6.9
Source: Okuonzi (2004:1174)
The Uganda annual health sector performance report for 2007/2008 financial
year (FY) has shown some successes in attaining some of the health indicators
under the second Health Sector Strategic Plan (HSSP II). However, the report
has also indicated a significant stagnation and sometimes a decline in important
health indicators. For example, the proportion of children under one year who
have received 3 doses of the pentavalent vaccine as per schedule reduced from
89% in financial year 2005/06 to 78% in 2007/08 against the target of 87%.
Tuberculosis (TB) cure rate reduced from 73% to 68.4% during the same period.
The proportion of sick under-five children seen by a health worker, using
Integrated Management of Childhood Illnesses (IMCI) guidelines, reduced to
30% (2007/08) from 45% baseline and below the target of 55%. The outpatient
new attendance rate stagnated at 80% for the past consecutive two years
(Ministry of Health Uganda 2008:25). This decline in health sector performance
could either be attributed to the failure of the health system itself or to individual
health workers. Table 1.3 shows some of the achievements against the target for
the PEAP indicators for the FY 2007/08 and compared with the performance in
FY 2006/07, FY 2005/06, and the baseline year FY 2004/05.

13
Table 1.3: Performance against the 8 PEAP indicators for FY 2007/08
Indicator Baseline FY 04/05
Achieved FY 2005/06
Achieved FY 2006/07
Target 2007/08
Achieved FY 2007/08
OPD Utilisations in Govt & PNFP Units
90% 90% 90% 90% 80%
DPT 3 /Pentavalent vaccine coverage
89% 89% 90% 95% 82%
Percentage of deliveries taking place in health facilities (Govt & PNFP)
25% 29% 32% 35% 33%
Proportion of approved posts filled by trained Health workers
68% 75% 38.4% 85% 79%
National average HIV sero-prevalence at ANC Surveillance sites
6.1% No data 6.4% - -
Proportion of Health facilities without stock (out of 5 tracer medicines & supplies)
35% 27% 35% 60% 28%
Household latrine coverage 57% 58% 58.5% 100% 63%
Couple Years of protection (CYP)
234,259 309,757 325,407 325,407 361,080
Source: Ministry of Health Uganda (2008: xvi)
Human resource management challenges have been reported in Uganda by
various documents. For example, the value for money audit conducted in the
MoH by the Auditor General in 2006, discovered significant staffing gaps in most
of the health facilities. The District Service Commissions (DSCs) had difficulties
in attracting and retaining qualified medical personnel. Additionally, the districts
did not have clear policies on training, staff transfer and rotation, leading to mal-
distribution of health workers, with a bias towards urban areas. At the same time,
districts did not regularly appraise and supervise staff. Monitoring and evaluation
of performance was irregularly done leading to sloppiness by districts and health
workers in providing health services. Finally, the districts and health facilities
were not utilising the existing Health Management Information System (HMIS) to
report their performance (Auditor General Uganda 2006:7).
Poor performance of health systems and workers is not unique to Uganda. Other
countries within Africa and beyond experience the same problem. Dieleman,
Toonen, Toure and Martineau (2006:[5-6]) report poor performance
management in Mali, evidenced by lack of job descriptions and training needs
analysis; inadequate and subjective supervision and appraisal system. Based on

14
their findings, Dieleman et al (2006:[6]) recommend improvements in existing
performance management strategies. Researchers have identified some factors
that impact on individual performance and job satisfaction. These include
personality, values, attitudes, perceptions, abilities, and motivation. Once these
factors are optimised they improve individual health worker performance and job
satisfaction, which in turn translate into superior organisational performance
(Dieleman & Harnmeijer 2006:5; Dussault 2006:7; Fritzen 2007:[5]; Marchant
1999:63).
El-Jardali, Jamal, Abdallah and Kassak (2007:[9]) describe the lack of
development in human resource for health issues in the WHO Eastern
Mediterranean Region (EMR). These authors report inadequate information on
health workers‟ productivity and lack of informed human resources policies to
guide planning beyond the usual health worker density and indicators. Therefore,
without credible information on existing health workers‟ productivity, it is almost
impossible to implement interventions for improving performance. Dieleman et al
(2009:[7-8]) indicate that human resource management interventions in health
sectors such as training, local performance analysis and payment combined with
organisational change can improve workforce performance.
Against this backdrop, the researcher carried out this study to fill knowledge
gaps on performance management of health workers in the decentralised
services. According to the researcher‟s knowledge, no such research has been
carried out in Uganda. It is hoped that by identifying the factors involved, a
framework for effective performance management will be put forward.

15
1.3 STATEMENT OF THE RESEARCH PROBLEM
Delivery of health services in Uganda has been decentralised since the 1990s.
The decentralisation of health care services was part of the reform processes
that were initiated in 1993 (Jeppsson & Okuonzi 2000:276; Kisubi 1996:83-106).
District and urban authorities were expected to take over responsibility for health
facilities from the district hospital level to HC IIs, school health services, rural
ambulance services, hygiene services and health education. Districts were
broadly given the authority to set fees for any services provided, including health
care. Through the DSCs, districts could confirm appointment of public servants
including health workers, exercise disciplinary control, protect them against
arbitrary dismissal and facilitate their career development through training
(Kyaddondo & Whyte 2003:332).
In a decentralised system, health workers form significant links between the
health system and the final consumers of services. They play a major role in
translating policy from paper to practice. Yet, most studies on decentralisation of
health services concentrate on the formulation processes, reorganisation, and
the impact it has on users. This reflects the main objectives of decentralisation
which are: improved service delivery and reduced costs, the goals that mainly
benefit the central level and consumers. Although decentralisation of the health
care sector is highly popular worldwide, it is problematic in many low resources
countries. Little emphasis has been put on its implications for health workers
both professionally and socially (Kyaddondo & Whyte 2003:330).
Despite the ongoing health sector reforms in Uganda, services have remained
poor. The inadequate performance of health workers coupled with lack of
adequate support from the central and local governments are believed to have
partly contributed to this deterioration and stagnation of some of the important
health indicators under the second Health Sector Strategic Plan (HSSP II).
Whatever the case, poor performance of individual health workers culminates
into poor organisational performance. Failure of the stakeholders in the health

16
sector to implement programmes meant to enhance workforce performance has
led to poor quality of health services seen currently in the country.
The Ugandan Ministry of Health (2009:5) reports the critical situation of human
resources for health, which is a result of insufficient training capacity of health
workers with the right skills mix, low remuneration, and poor working conditions
both in public and private not for profit (PNFP) sectors. There is also an
inequitable distribution of health workers among the districts, between rural and
urban areas, and between public and private providers. The researcher believes
that performance management has a bearing on the way health workers execute
their duties. Hence, the necessity to investigate factors that impede or enhance
the performance of health workers in the decentralised services. Informed
policies are required to guide the planning and management of human resources
for health (HRH). This can only be attained through rigorous gathering and
analysis of facts. Health sector planning practices need to go beyond numbers
and health status indicators to concrete management of available health
workers. This study has assisted the policy makers by developing a
management framework outlining the strategies and recommendations for
improving performance management.
1.4 AIM AND OBJECTIVES OF THE STUDY
The aim of this study was to investigate the performance of health workers in
order to come up with a management framework that may be used by
stakeholders to improve performance in the decentralised services in Uganda.
The objectives of this research were to
identify factors that impede or enhance performance of health workers
assess the current practices used to manage performance of health workers
determine the views of health workers and their managers on how to improve
performance

17
develop a performance management framework for health workers based on
the findings of this research.
1.5 SIGNIFICANCE OF THE STUDY
The researcher believes that the findings of this study will add to the existing
body of knowledge and understanding of the subject of performance
management and its application in the decentralised health systems. The results
will be useful to health planners, policy makers and other stakeholders by
contributing towards the formulation of a performance management framework
which is specific to the health workers. This makes the study useful not only in
Uganda but also in other countries both within and outside Africa.
This research will:
Provide useful information on factors that might contribute to success or
failure of health workers‟ performance.
Support and enrich theories and models of performance management that
take into account the nature of work and performance of health workforce.
Generate greater awareness among the public health sector on the
importance of having appropriate and practical performance management
frameworks as media to organisational effectiveness.
Allow the identification of concepts and frameworks of performance
management that acknowledge the nature of work and the setting of the
decentralised health systems.
1.6 DEFINITION OF KEY CONCEPTS
Decentralisation
Decentralisation is a change in the organisation of government or other
institution, involving the transfer of power and functions from the top of the
hierarchy of power and service provision to peripheral levels. This organisational

18
shift involves transfer of decision-making, and other functional roles such as
services delivery from national to various sub-national levels such the districts.
One of the key motivations for decentralisation is its capacity to empower the
local institutions and people to make their own decisions and to introduce
appropriate delivery of services (Mayanja 2005:1; Muriisa 2008:84-86).
In this research, decentralisation refers to the transfer of power and functions of
health service delivery from the ministry of health to the local governments
(districts, counties and sub-counties). During the reforms, the responsibility for
delivery of health service (preventive and curative) from the level of general
hospitals (HC Vs) to HC IIs was decentralised to the districts and urban
authorities. The other services that have been decentralised include school
health services, rural ambulance services, hygiene services and health
education. Lastly, recruitment, confirmation of appointments of health workers,
disciplinary control and facilitation of career development through training were
all decentralised to the districts (Kyaddondo & Whyte 2003:332).
Health workers
Health workers are all people that engage in the promotion, protection, or
improvement of the health of the population (Diallo, Zurn, Gupta & Dal Poz
2003:3). This definition includes other non-medical professionals such as family
members looking after the sick and other unpaid caregivers and volunteers that
contribute to the improvement of health. For the purpose of this study however,
the researcher defines health workers as health service providers that are
directly engaged in the delivery of health services as described in the three-digit
International Standard Classification of Occupations (ISCO-88) system used in
the South African Census of 2001 (Dal Poz, Kinfu, Dräger & Kunjumen 2006:1-
4). In this study, the term health workers refer to medical doctors,
nurses/midwives and clinical officers.

19
Performance
Performance implies the actions of doing things; using things; attending to
conditions; processing; communicating, and achieving results (Langdon
2000:12). Performance is understood as achievements of the health workers in
relation with their set goals. This includes outcomes accomplished through
contribution of individuals or teams to the organisation‟s strategic goals.
Performance has a linkage with the individual potential and how best it is
realised by the individual (Noe, Hollenbeck, Gerhat & Wright 2008:344-345). In
this study, health worker performance refers to availability, competence,
productivity, and responsiveness of health workers.
Performance management
Performance management is the means through which managers ensure that
employees‟ activities and outputs are congruent with organisation‟s goals (Noe
et al 2008:344). By implication, performance management is a mechanism by
which organisations, teams, and individuals can obtain improved results. A
clearly defined set of performance goals and competency requirements can aid
in this regard. Thus, performance management involves creating a common
understanding of performance targets, and employee management and
development. In this research, performance management refers to planning,
managing, reviewing, and recognising individual health worker‟s performance.
Responsiveness
Responsiveness is the willingness or readiness of employees to provide service
(Heizer & Render 2008:212). In this study, health workers‟ responsiveness is
described as their ability and willingness to understand and address the clinical
and emotional requirements as well as the demands of existing and potential
clients.

20
Service
A service is any action or assistance that one party can provide to another that is
basically intangible and does not result into ownership (Kotler & Keller
2006:402). According to Kotler and Keller (2006:405-408) services cannot be
seen, tasted, touched before they are purchased. Services usually depend on
people who provide them and where they are provided, hence their variability in
quality. Additionally services cannot be stored; they are typically produced and
consumed simultaneously. In this study, service refers to health care activities
that are carried out by the health workers and are geared towards improving the
well being of clients or their communities.
Skill
Oxford Advanced Learners Dictionary, defines the term skill as „the ability to do
something well‟ (Hornby 2005:1378). Skill involves carrying out a task which
regularly requires the use of motor functions as well as explicit knowledge. In this
study, skill means the health workers‟ proficiency in carrying out of their routine
activities in delivering care to the patients.
1.7 FOUNDATIONS OF THE STUDY
The following section presents the theoretical framework that the researcher
used to structure and to maintain the focus of this study.
1.7.1 Theoretical framework
Burns and Grove (2007:171) describe a theoretical framework as a brief
explanation of the theory or those portions to be tested in a quantitative study.
The theoretical framework forms the basis of explanation of what variable is
expected to lead to another and the idea is usually expressed as a research
question to be answered by the study methodology.

21
In this study, the researcher used the process model of performance developed
by Noe et al (2008:345). In their model the authors suggest that individual
attributes such as knowledge, skills, and personality are the vital ingredients for
performance. Therefore, for an individual to perform these attributes have to be
translated into behaviour. The individual behaviour will then lead to results. The
authors further suggest that the various work groups and individuals must align
their activities to the overall organisation strategy in order to achieve results. The
model emphasises the impact of situational constraints on achievement of the
individual and organisational results. The workers might have the necessary
skills yet they may not exhibit the necessary behaviour. For example, a rigid
organisational culture may discourage the employees from performing
effectively. Lack of motivation may prevent workers from exhibiting the right
behaviour especially if they believe that their activities will not be rewarded.
Finally, workers may exhibit effective behaviour and yet results do not follow due
to misalignment of their activities with the overall mission of the organisation
(Noe et al 2008:344-345).
Figure 1.2 illustrates the theoretical model that guided this study, which the
researcher calls „the strategic performance model‟. This model is an adaptation
from Noe et al‟s (2008:345) performance process model. The researcher has
named it „strategic‟ in order to emphasise the call for alignment of individual
attributes, behaviour and results to the overall organisational strategy.��

22
����������
Figure 1.2: The strategic performance model (adapted from Noe et al 2008:345)
The model consists of the following:
Organisational strategy that include mission, goals, objectives, training and
development policies, and retention policies.
Individual attributes that include skills and abilities, self monitoring, intrinsic
motivation, organisation commitment, worker experience, values and beliefs.
Individual behaviours which include client-oriented behaviour, individual task
behaviour, team membership behaviour, and organisational membership
behaviour.
Organisational strategy
Mission Goals
Objectives Training, development & retention policies
Individual behaviours
Individual task behaviour
Team membership behaviour Organisation membership
behaviour Client –oriented behaviour
Situational Constraints
Organisational culture Community expectations
Performance management style Leadership
Rewards and sanctions Working environment
Decentralisation
Individual attributes
Skills & abilities Self-monitoring
Intrinsic motivation Organisation commitment
Worker experience Values and beliefs
Performance
Availability Productivity
Responsiveness Competence

23
Situational constraints that include organisation culture, community
expectations, performance management style, leadership, rewards and
sanctions, working environment and decentralisation.
Performance dimensions that include availability, productivity,
responsiveness, and competence of health workers.
1.7.2 Relevance of the theoretical framework to this study
The theoretical model presented is very useful because it describes performance
enhancing dimensions which the researcher explored at length. This model
helped the researcher to determine and maintain focus of study. The model also
assisted the researcher in organising literature review, data collection
instruments, presentation of data, discussion of findings and the development of
a performance management framework.
1.8 RESEARCH DESIGN AND METHODOLOGY
Burns and Grove (2007:38) define research design as the detailed plan of how
the study is to be conducted with full advantage of control over factors that could
interfere with the desired outcomes. Mouton (2001:56) refers to research
methodology as the research process and the kind of tools and procedures to be
used. This study was descriptive and used mixed research methodologies to
collect data from the participants. Mixed methodology is an approach where both
quantitative and qualitative research methods are used at the same time or in a
series of studies (Creswell, Plano-Clark & Garrett 2008:66). In order to achieve
the study objectives and ensure that the research process was logical, two
different study populations as well as two different methods of sampling and data
collection were used (see Table 1.4). This was done in order to achieve
methodological triangulation, which ensured the validity and trustworthiness of
results (Polit & Beck 2008:309). The detailed discussion of the research design
and methodologies is given in chapter 3.

24
Table 1.4: Data sources, methods of sampling and data collection
Level 1 Level 2
Source of data Health workers (doctors, clinical officers, and nurses/midwives)
Health service managers
Method of data collection
Self administered questionnaire
Semi-structured interview guide
Nature of data Quantitative Qualitative
Sampling Probability Non-probability
1.8.1 Level 1 of the study
Level 1 used quantitative methods and the study population comprised of health
workers (doctors, clinical officers and nurses) from the health facilities in Kumi,
Mbale, Sironko and Tororo districts. In order to collect data on factors influencing
the performance of health workers and the current practices used to manage
performance, the researcher used probability sampling specifically stratified
random sampling to ensure that the samples were unbiased (Polit & Beck
2008:340; Saunders, Lewis & Thornhill 2009:222). The researcher used the
health workers‟ registers to list all the health workers in the respective facilities
from which a sample was randomly drawn. A total of 331 health workers were
included in the final sample and out of these 83.4% (n=276) completed
questionnaires (see chapters 3 & 4).
The data was collected using a self-administered questionnaire, where the
participants were asked to record answers in a structured manner. All the
questions except one (see annexure H) were based on a 5-point Likert scale.
The data was cross-checked for completeness, coded, and entered into a
computer using the Statistical Package for Social Sciences (SPSS) version 18.0.
A statistician cleaned and analysed the data, using the same version of SPSS.
Statistical calculations were done for both descriptive and inferential statistics.
The results were presented in the form of graphs, pie charts and tables (see
chapters 4 and 5). Since data was collected using a tool based on ordinal scale
(Likert scale), Spearman‟s rho rank order correlations (rs) were used to measure
the association between two key variables (Polit & Beck 2008:766).

25
1.8.2 Level 2 of the study
Level 2 of the study followed qualitative research methodology and the study
populations were health services managers involved in human resource
management at district, hospital, and health sub-district levels from the districts
of Kumi, Mbale, Sironko and Tororo. The health service managers at the
research sites were purposively selected for inclusion. Purposive sampling is a
non-probability sampling method in which the researcher uses his/her own
judgement regarding the participant from whom information is to be collected
(Polit & Beck 2008:355). Level 2 of this study involved collection of qualitative
data using a semi-structured interview guide (see annexure I) through face-to-
face interviews. A tape recorder was used. The data collected was transcribed,
coded, and analysed manually. Analysis involved creating categories, refining
them and grouping them into themes and sub-themes before presentation,
interpretation, and discussion. The researcher used the qualitative approach in
order to get in-depth information on why performance is managed the way it is
and to explore the views of health workers and managers on how their
performance can be improved (see chapter 3 for details).
1.8.3 Design validity and reliability of level 1
Validity and reliability are important notions for determining the suitability of the
research instrument.
Validity
Validity is the suitability of instrument while reliability to its consistency in
measuring whatever it is intended to measure (Polit & Beck 2008:457). In this
study, the researcher used face, construct, and content validity (see details in
chapter 3).

26
Reliability
Saunders et al (2009:156 & 373) refer to reliability as “the extent to which data
collection technique or analysis procedure yields consistent findings”. In this
study, reliability was equated to clarity, quality, stability, consistency, adequacy
and accuracy of the study instruments. Reliability was ensured through pre-
testing of the questionnaires to ensure clarity of the questionnaire items and by
ensuring anonymity of the participants to the questionnaires. Additionally,
reliability of questionnaire items was tested by means of Chronbach‟s coefficient
Alpha (α), which is an index for testing internal consistency of the test items
using SPSS. The Chronbach‟s coefficient for all the questionaire constructs was
0.70 and above except for one construct (question 30) which was 0.61 (see
Table 4.2). As a rule, Alpha (α) should be at least 0.70 or higher (Amin
2005:298-302; Polit & Beck 2008:454-456). The details of validity and reliability
of level 1 questionnaire are discussed in chapters 3 and 4.
1.8.4 Trustworthiness of the data obtained during level 2
Lincoln and Guba (1985) cited in Polit and Beck (2008:539) propose four
constructs for measuring the trustworthiness or soundness of the qualitative
research approach. These include credibility, transferability, dependability and
confirmability. In this study the researcher used these constructs to ensure
trustworthiness of the study findings. The details of these four constructs are
discussed in chapter 3.
1.8.5 Ethical considerations
Polit and Beck (2008:753) describe ethics as „a system of moral values
concerned with the degree to which research procedures adhere to professional,
legal and social obligations of the participants‟. Ethical consideration in research
should consider fairness, honesty, openness, disclosure of methods, and the
purpose for which the research is being carried out. Based on this

27
understanding, the researcher used the following ethical standards during the
process of this study.
Approval was obtained from the Research and Ethics Committee at the
Department of Health Studies of UNISA (annexure A).
Approval was obtained from the Uganda National Council for Science and
Technology, the body responsible for ethical clearance for all research
conducted in Uganda (annexure B & C).
Permission to carry out data collection was requested from the district
officials, hospital superitendents, and heads of the health sub-districts
(annexure D & G).
Informed written consent was obtained from all the health workers and their
managers who participated in the study (annexure E).
Privacy of the participants was respected at all levels.
Confidentiality was maintained by protecting data collected from unauthorised
access.
The participants of this study remained anonymous by ensuring that their
responses are not in any way linked to particular individuals.
In addition to the questionnaires, the participants were provided with all the
relevant information regarding the details of the study and the benefits of this
study. The researcher also provided all the respondents his contact details
(annexure F).
The researcher respected the work of others through acknowledging the
sources of information.
The researcher reported what the data collected revealed and not what the
researcher wanted to achieve. Hence, there was no distortion of data at any
moment during this study.
The details of the ethical considerations are discussed in chapter 3.

28
1.9 SCOPE AND LIMITATIONS OF THE STUDY
This study was conducted in four (4) districts in Eastern Uganda. Since the
1990s all districts are operating under decentralisation. The main focus of this
study was limited to doctors, clinical officers and professional nurses. Other
health professional cadres were not represented although they form part of the
health workforce. This probably excluded some important findings from cadres of
health workers that were not represented. Although stratified sampling by district,
cadre, and level of health facility was used, the researcher observed that some
districts had more staff in some strata than others. This was overcome by using
proportionate stratified sampling (sampling ratio of 40%) to ensure
representation of the target population.
The researcher used a structured self-administered questionnaire which was
delivered by the researcher or research assistant and collected after one to two
week. Some health workers were not able to fill the questionnaires and return
them to the collection points on time. The researcher tried to overcome this by
constantly reminding the health workers by phone to complete their
questionnaires. However, since the researcher did not attain 100% response
rate, some vital findings from non responders may have been left out. In
addition, a structured questionnaire used to collect data from health workers
does not permit probing, therefore, it was not possible to ask follow-up questions
to achieve in depth inquiry about the research problem.
Lastly, at the time of the study, the researcher was working in Malawi, while the
study was conducted in Uganda; therefore, a lot of travel was required. The
researcher overcame this by applying for a special leave at the time of data
collection and analysis.
1.10 STRUCTURE OF THE THESIS
Chapter one presents the introduction and the background to the research
problem. The statement of the problem, significance, aim and objectives, and

29
foundations of this study are put forward. Lastly, the research design and
methodology, ethical considerations, scope and limitations of this research have
been outlined.
Chapter two presents the review of relevant literature on the subject of
performance of health workers. The conceptual framework is discussed in detail.
The concept analysis of decentralisation and performance are also outlined.
Chapter three discusses in detail the research design and methodologies used in
this study.
Chapter four deals with quantitative data analysis, interpretation, and discussion
of the research findings.
Chapter five outlines qualitative data analysis, interpretation and discussion.
Chapter six presents the conclusions, limitation and recommendations arising
from this study. In the same chapter the proposed performance management
framework that was developed from the findings of the study is presented.
1.11 CONCLUSION
Chapter one is the first stride to a comprehensive study about the performance
of health workers in decentralised services in Uganda. In this chapter the
researcher outlined the source and background to the research problem. The
researcher presented the study aims and objectives; significance of the study,
and has described the theoretical model that was used to guide this study. In
addition, a brief account of the methodological orientation of this study is
outlined. The researcher is optimistic that the outcome of this study will be
beneficial to all parties concerned while at the same time contributing to the body
of knowledge in the field of HRH.

30
CHAPTER 2 LITERATURE REVIEW
2.1 INTRODUCTION
Health workers‟ performance is a complex area to address because of a variety
of influencing issues at different levels of health care. These issues are rooted in
the ministries of health, districts, health facilities, individual health workers, and
the communities. Health care delivery is highly dependent on manual labour. It
needs skilled, competent, committed, responsive, and productive workers to
achieve the mission and goals. As such, health workers are crucial to the
delivery of health services. They manage other resources and a big percentage
of the annual national health budget is spent on them (JLI 2004:21). Despite the
achievements made since the introduction of market reforms in Uganda, little is
known and published about the performance of health workers. Most of the
studies done worldwide are focusing on performance of health systems and are
not specifically targeted to health workers. In order to improve the health status
of Ugandans and performance of health workers, policymakers need evidence to
make informed decisions.
This research aims at developing a performance management framework that
health sector stakeholders can use to improve service delivery. Its main
contribution is geared towards the formulation of a framework for performance
management that is specific to health workers. Performance management in the
health sector is still deficient in Uganda and its implementation is not well
documented. The performance management and appraisal guidelines used by
health workers are similar to those used by other professionals in public service.
Therefore, there is a need to have guidelines that are specific to health
profession due to the complexity involved in health service delivery.
This chapter presents a review of existing literature relevant to the study. The
review is aimed at identifying what is already known about performance of health
workers in order to assist in identifying the grey areas that could be addressed
by this study. The researcher identified and clarified the various determinants

31
that influence performance of health workers. Since there is insufficient
information about performance of health workers in Uganda, this review
presented performance from a general perspective. The following are the main
areas of focus:
The description of the components of the theoretical model which is
illustrated in Figure 1.2.
The concept of decentralisation of health services.
The importance of human resources management practices as tools for
managing performance.
The discussion of the health workforce performance dimensions which
include health workers availability, competence, productivity, and
responsiveness.
Performance management and appraisal of health workers.
The role of leadership in guiding performance of health workers.
2.2 DESCRIPTION OF THE THEORETICAL FRAMEWORK
The researcher based this study on the „strategic performance model‟ adapted
from Noe et al (2008:345) as illustrated in Figure 1.2. The „strategic performance
model‟ guided literature review, data analysis and presentation of results. The
model makes reference mainly to the following concepts: individual attributes
and behaviours, organisational strategy, performance dimensions and situational
constraints. Noe et al (2008:345) describe individual attributes as key drivers of
performance. These attributes must be translated into individual behaviours for
performance to occur. The individual attributes and behaviours are influenced
among other things by the organisational strategy and the situational constraints.

32
2.2.1 Individual attributes
These are characteristics that make individuals unique and differentiate them
from others. These can be related to what Armstrong (2009:300) and Baines,
Asch, Hadfield, Mason, Fletcher and Kay (2005:496) describe as factors that
influence individual performance since they are unique for every individual. Such
factors include skills and abilities, self-monitoring abilities, intrinsic motivation,
organisational commitment, worker experience, values and beliefs. Further
attributes include personality, demographics, physiology and cognition. These
factors influence performance in a number of ways. For example, skills and
abilities dictate the capability of an individual to perform tasks as required (Kahya
2007:517). The extent to which an employee keeps his performance in check
(self-monitoring) and his ability to take corrective action when performance falls
below acceptable standards is vital. The cognitive ability can contribute directly
to overall job performance through its effects on knowledge and skills acquisition
(Kahya 2009:101; Ree, Earles & Teachout 1994:518). Additionally, Hackman
and Oldham (1976:255) mention that the state of motivation such as job
satisfaction is positively related to individual performance.
Authors like Baines et al (2005:499), Kahya (2007:515), and Viswesvaren and
Ones (2000:223) emphasise that general cognitive ability and personality
dimension of precision are strongly related to work performance. Moreover, they
indicate that personality traits such as interpersonal skills, training and turnover
are essential for performance of workers. Other writers such as Suliman and Iles
(2000:415) and Van Scotter (2000:93) argue that in addition to the individual
characteristics, several circumstantial and attitudinal factors are positively
associated with work performance through motivation. Organisational
commitment, job satisfaction and work-related attitudes, values and beliefs are
particularly important factors for performance. The demographics and
physiological factors such as age and gender are also relevant for work
performance (Baines et al 2005:498; Kahya 2007:516).

33
2.2.2 Individual behaviour
Behaviour is the way individuals conduct themselves in a specific situation and
at a particular point in time. Armstrong (2009:301) emphasises that individual
behaviour at work is dependent on both the personal characteristics (abilities,
intelligence, personality, attitudes, and emotions) and the situation in which they
work. Individual behaviours have a crucial role to play in determining work role
performance (Kahya 2009:96). Health workers need specific behaviours to
contribute to the desired health outcomes. Such behaviours are not directly
under the control of central or local governments but are controlled at both the
individual and organisational levels. These behaviours are directly related to
performing job tasks (work roles) (Fritzen 2007:[2]; Perkins, Jensen, Jaccard,
Gollwitzer, Oettingen, Pappadopulos & Hoagwood 2007:343).
In this study, the researcher investigated the work role performance behaviour of
health workers as individuals (individual task behaviour), members of teams and
organisations (team and organisation membership behaviours), and client-
oriented behaviour. Murphy and Jackson (1999:335) and Kahya (2009:96)
describe work roles as „…the total set of performance responsibilities associated
with one‟s employment‟. These responsibilities are carried out in conjunction with
the behaviours just listed. Based on this definition, Griffin, Neal and Parker
(2007:330) proposed a model of positive work role performance behaviours
which address effectiveness in uncertain and interdependent organisational
contexts. Griffin et al (2007:330), cross-classified the three levels at which work
role behaviours contribute to effectiveness (individual, team, and organisation)
and the three different forms of behaviour (proficiency, adaptability, and pro-
activity) into sub-dimensions of work role performance. The researcher would
like to use a similar approach in this study since it is a grey area especially in
public health.
Individual task proficiency describes behaviours which fulfils the known
expectations and requirements of the roles of an individual. Team proficiency
behaviour reflects the degree to which the individual meets the expectations and

34
requirements of his roles as a member of a group. Organisation proficiency
behaviours refer to how the individual contributes to the expectations and
requirements as a member of the organisation (Griffin et al 2007:331). Kahya
(2009:102) notes that behaviours involving cooperation, creativity, and self
development contribute to performance.
Individual task adaptability describes the degree to which employees cope with
or respond to changes that affect their roles. On the other hand, team member
task adaptability, reflects how the individuals respond to changes that affect their
roles as members of the group. Organisation member adaptability describes how
the individuals cope with changes that affect their roles in an organisation (Griffin
et al 2007:331-332).
Task pro-activity refers to extent to which individuals themselves or within a
teams and organisation engage in self-directed and future oriented behaviour
and toward changes in work situations. Such behaviour ensures that the
organisation as a whole develops and innovates rather than promote change
only within a department (Griffin et al 2007:332). Kahya (2009:102) explains the
strong relationship that exists between creative performance and innovative
effectiveness. The workers who score highly on creative performance generally
obtain high outcomes in innovative effectiveness (Kahya 2009:102).
Another important variable for individual behaviour is the client-oriented
(customer-oriented) behaviour. The term client orientation has been used
constantly in marketing literature to explain an organisational posture in which
the clients are main focus for the organisational strategy design (Noor &
Muhamad 2005:126; Saura, Contri, Berenguer, Taulet & Velázquez 2005:497).
At individual level client orientation is the willingness of the service providers to
adjust their services delivery according to the needs, problems, and
circumstances of the customers (Daniel & Darby 1997:272; Lanjananda &
Patterson 2009:8). On the other hand, Hartline, Maxham and McKee (2000:35)
and Noor and Muhamad (2005:126) define client (customer)-orientation at the

35
organisational level as „…the set of standards that puts the clients‟ interests at
the forefront , in order to develop a sustainable and profitable enterprise‟.
Other scholars like Lanjananda and Patterson (2009:8) refer to client-oriented
behaviour as „…the specific behaviours displayed by employees during service
encounters that lead to satisfied customers. These behaviours may include
empathy, assurance, responsiveness, authenticity, listening, dedication and
civility (Lanjananda & Patterson 2009:9). According to Berry and Bendapudi
(2007:111), health care is perhaps the most personalised service that clients
search for. However, many studies document variations in the quality of care
provided. Hence, the behaviours of front-line health workers such as nurses,
clinical officers and medical doctors are critical for both patient satisfaction and
successful health outcomes. It is therefore important to understand what
behaviours predict the performance of health workers. This research, attempted
to explain the performance of front-line health workers by simultaneously
examining the individual attributes and behaviours, the situational constraints,
and the organisational strategy.
2.2.3 Performance
Performance has many dimensions. It involves delivering favourable results on
time, within budget, and according to set standards (Department of Industrial
Relations, Public Sector & Employee Relations (DIRPSER) 2005:5). Armstrong
(2009:136) mentions that the notion of performance covers what has been
achieved and how it is achieved. In this study, performance refers to availability,
productivity, competence and responsiveness of the health workers (WHO
2006:68).
Whereas producing better health outcomes is important so is the aptitude to
respond efficiently and effectively to the emerging challenges in the health
sector. Since client satisfaction is a critical component of perfomance, it is
important to create and maintain this ability. Performance management is
concerned with the management of key relationships with clientele, work-mates,

36
higher-ranking managers and legislators. The realisation of performance targets
and client satisfaction are both dependent upon employee performance.
Therefore, performance is composed of efficiency and effectiveness of internal
organisational procedures and ultimately depends on individual employee
commitment. Managing health workers‟ perfomance, obtaining feedback
regularly about workers‟ satisfaction with management procedures as well as
monitoring the institutional environment are all crucial perfomance dimensions
(DIRPSER 2005:5). The dimensions of health workers‟ performance are
discussed in detail in sub-section 2.5.
2.2.4 Organisational strategy
This refers to the direction the organisation wants to take to achieve its goals
(Noe et al 2008:69). Thompson, Strickland and Gamble (2010:6) define a
strategy as „...the management‟s action plans for running the business and
conducting operations‟. Performance management is critical in supporting the
formulation and implementation of the organisational strategy. The formulation of
a strategy involves the establishment of five major components which include the
organisation‟s mission, strategic goals, external analysis, internal analysis and
the strategic choice (Noe et al 2008:75). The organisation‟s mission specifies the
reason for existence and the strategic goals reflect on what the organisation
intends to achieve. External analysis provides information about the threats and
opportunities that exist within the organisation‟s environment whereas the
internal analysis provides information about the organisation‟s strengths and
weaknesses. Lastly, the strategic choice is the organisation‟s chosen plan that
stipulates the way the mission and strategic goals will be achieved (Noe et al
2008:77). Hence,employee input and alignment of organisational activities to the
mission is vital to strategy formulation and implementation.
Noe et al (2008:80) mention five variables that influence the success of strategy
implementation. These include organisation structure, type of information and
information systems, task design, selection, training and development, and
employee reward systems. The last three variables are the direct responsibility

37
of human resource management function and the first two variables are
influenced by human resources. Therefore, a performance management system
provides a mechanism for steering organisations towards achieving their goals
by facilitating the monitoring of existing strategies to ascetain the achievement
of desired outcomes. When circumstances warrant change, performance
management systems provide managers with a powerful tool to ensure the rapid
change implementation (DIRPSER 2005:5).
2.2.5 Situational constraints
Situational constraints are contextual factors within and outside the organisation
that are likely to affect the performance of health workers. These factors may
also influence individual characteristics and behaviours (Noe et al 2008:346).
Situational constraints may include organisation factors, working environment,
and economic factors. Therefore, when evaluating performance of health
workers, it is important to scrutinise situational factors that are likely to positively
or negatively affect performance. These factors may either motivate or de-
motivate health workers. As illustrated in Figure 1.2, the researcher‟s focus is on
the following situational constraints: organisational culture, community
expectations, performance management style, working environment, leadership,
rewards and sanctions, and decentralisation. For example, Kahya (2007:515)
reports that poor working conditions (physical efforts, environmental conditions
and hazards) may decrease employee performance. Such factors may consist of
rigid organisational rules, lack of cooperation among co-workers in solving
complex tasks, and absenteeism among others.
2.2.6 Justification for using the chosen theoretical framework
The „strategic performance‟ model provides a strong conceptual basis for this
study as it emanates from the strategic management process. This model is built
on the premise that a clear link must be established between the overall
organisation‟s strategy and its human resource management strategy. The result
of this endearvour is human resource practices geared towards the attainment

38
of the organisation‟s goals and objectives. Similarly, human resource
management practices must be aligned to performance (Armstrong 2009:146).
Human resources management practitioners like Armstrong (2009:147) have
established that well executed human resources management (HRM) practices
positively influence employee performance.
The use of the „strategic performance model‟ is justified in this study because it
guided the researcher‟s quest to achieve the research objectives. The model
helped the researcher answer the question of what factors impede or enhance
the performance of health workers. Could it be that health workers do not
understand the mission, goals and objectives of their organisation or the top
management does not support employee skills advancement through training,
development and proper employee retention policies?
Perhaps the organisational culture contradicts with expected health outcomes, or
the community expectations and health objectives are not in harmony? It could
be that the human resource management practices such as performance
management style, leadership, rewards and sanctions as well as the working
environment are impediments to the desirable performance.
In addition, individual attributes such as skills, abilities, self monitoring, intrinsic
motivation, commitment to the organisation, work experience, values and beliefs
can all either promote acceptable performance or hamper it. If individual health
worker‟s behaviours do not support the overall health service provision goals,
poor performance is to be expected. However, when the health workers portray
positive individual task behaviours, team membership behaviours, organisation
membership behaviours and client centred behaviours, performance could be
enhanced.
Indeed the strategic performance model assisted the researcher to develop a
viable performance management framework which will guide performance
management practices to ensure availability, productivity, responsiveness and
competence of health workers. Additionally, the opinions and suggestions of

39
health workers were sought on how to improve performance of health workers
specifically in line with organisational strategy, situational constraints, individual
attributes and behaviour.
Overall the theoretical model presented is very useful because it describes
performance enhancing dimensions which the researcher would like to explore
at length. This model aided the researcher to determine and maintain the focus
of the study. The model also assisted the researcher in organising literature
review, data collection instruments, presentation and discussion of the findings
as well as the formulation of recommendations.
2.3 THE CONCEPT OF DECENTRALISATION OF HEALTH SERVICES
The term „decentralisation‟ in the context of health services, is used to label a
variety of reforms characterised by the transfer of fiscal, administrative, and
political authority for planning, management, or service delivery from the central
Ministry of Health (MoH) to alternate institutions (Mitchell 2009:216). These
recipient institutions may be regional or local offices of the same ministry, local
governments (such as the districts), autonomous public service agencies (such
as Health Service Commission (HSC) and DSCs), or private sector organisations
(Bossert & Beauvais 2002:14; Mitchell 2009:216). During its implementation in
Uganda, it was anticipated that decentralisation would enhance perfomance in
the health sector in the following ways:
efficiency in resource allocation by allowing the services and expenditure to
be determined by preferences of the clients ;
enhanced technical effectiveness through increased cost realisation at
grassroots level;
innovative delivery of service tailored to local client needs by way of ongoing
trials ;
better service quality and transparency due to participative decision making;

40
equitable resource distribution catering for the needs of previously
disadvantaged places and populations (Bossert & Beauvais 2002:14; Mitchell
2009:217).
Internationally, there is considerable interest in revitalising primary health care
(PHC) and strengthening health systems especially in low and middle-income
countries (WHO 2008:xiii). Recent reports suggest the need for expansion of
access to PHC services and organisational reforms to attain „close-to-client‟
approaches that make services more relevant and responsive to the needs of
communities. Decentralisation in particular, has been promoted as a means for
improving the responsiveness and effectiveness of health systems in developing
countries. Advocates for decentralisation argue that shifting financial and
administrative control of health services to local authorities can improve
efficiency in allocation („doing the right things‟), as distinct from technical
efficiency („doing things right‟). Decentralisation increases accountability,
responsiveness to the recipients of health services, and facilitate the mobilisation
of local resources (Mitchell 2009:217). In the case of primary health care, further
arguments for decentralisation include potentially improved community
participation and integration with specialised hospital care, and more effective
collaboration between health and non-health sectors (Guanais & Macinko
2009:1127). On the contrary, critics point out that decentralisation can instead
lead to increased fragmentation of services and management practices that
provide political or financial gains to local authorities. Furthermore,
decentralisation may weaken the central ministries of health, and increase
inequities in health care among regions or districts (Bryant 1999:12; Guanais &
Macinko 2009:1127).
2.3.1 The approaches to decentralisation
Mills (1994:282-283) and Munga, Songstad, Blystad and Maestad (2009:[2]),
describe a four-fold typology of different forms of decentralisation that can be
applied to community health, these include: deconcentration, delegation,
devolution, and privatisation.

41
Deconcentration is the shifting of power from the central government to the
district offices within the structure of MoH.
Delegation shifts responsibility and authority to automomus and semi-
autonomous institituions (such as HSC and DSC).
Devolution is the shifting of responsibility and authority from the central offices
of the MoH to local government (such as districts, health sub-districts and sub-
counties).
Privatisation relinguishes operating responsibilities and sometimes ownership,
to private service providers with clearly defined contracts of what is expected in
return for public funding (Bossert & Beauvais 2002:14; Kolehmainen-Aitken
2004:[2]; Mills 1994:282-283; Munga et al 2009:[2]).
2.3.2 Decentralisation of health services in Uganda
The form of decentralisation in the public health sector in Uganda can be
described as devolution. There is „shifting of authority away from the central
government to local administrative and political structures. Decentralisation
reforms involved three main components namely political, administrative, and
financial. Decentralisation in Uganda has transferred all political and
administrative powers from the central government to the local governments.
The districts now have the responsibility to deliver health services and manage
the health personnel (Bossert & Beauvais 2002:16; Mitchell 2009:222-223).
Decentralisation of the public health sector is an integral part of Uganda‟s
government reforms. Politically, the district health sector is governed by the
District Health Committee (DHC), whose membership is drawn from the LC V.
The non-hospital-based care is headed by the DHO, previously known as the
District Director of Health Services (DDHS). The DHO reports to the Chief
Administrative Officer (CAO), who is the civil servant in charge of the whole
district administration. The DHO is assisted by the District Health Management
Team (DHMT), comprising technical officers in that office. Since the fiscal year
1998/99, the management responsibilities of district hospitals have also been

42
transferred to the districts under the DHO. The national and regional hospitals,
however, are still directly under the MoH (Jeppsson 2004:23).
Several reforms have taken place in line with the decentralisation policy during
the last 17 years. They were aimed at establishing a single, coordinated,
comprehensive district health system. The District councils (LC Vs) are
responsible for providing health services to their local area residents, and
whoever provides health services in the district does it on their behalf. It is the
responsibility of the DHO to ensure that all health care activities are coordinated,
and health providers are supported. A more recent development is the
introduction of Health Sub-Districts (HSDs). These are functional zones within
the district health system, established around an existing hospital or Health
Centre IV (HC IV). This is the lowest unit to employ staff physicians, and the
lowest to offer elective surgery. The purpose of establishing HSDs is to bring
qualified health care personnel closer to the people. However, the management
structures at the HSD level remain unclear and are at present not supported by
any central guidelines. Sub-county local councils (LC IIIs) have been established
and are operational in all districts. The planning capacity of sub-counties in
different districts (and even within one district) varies greatly. There are also
large regional variations in the status of health infrastructure and staffing
patterns (Jeppsson 2004:25).
Following the shift of managerial powers to the local governments, the
recruitment, disciplining, and dismissal of staff are now under the jurisdiction of
the DSC. Prior to decentralisation, this used to be the duty of the central
MoH.Despite the fact that the MoH knew the country‟s needs, the distribution of
health personel was inequitable, and some marginalised districts had critical staff
shortages. Following decentralisation, the vacant posts are now advertised, and
recruitment is done by the DSC. However, the inequity between remote and and
centrally located districts remains a major challenge (Jeppsson 2004:25; Mitchell
2009:225; Munga et al 2009:[8]).

43
Under decentralisation, the functions of the central government are now directed
towards policy formulation, planning, inspection, provision of technical
supervision to local governments, and management of national health
programmes and projects. The health services delivery now lies within the
framework of the districts. Each district, through its DSC has the power to
recruit, discipline, and dismiss health workers. In order to ensure uniformity in all
the districts, the Ministry of Public service (MoPS) standing orders still govern
the conditions of service in the country (Bossert & Beauvais 2002:16; Jeppsson
2004: 26; Mitchell 2009:216).
2.3.3 Decentralisation and human resources for health (HRH)
The MoH in Uganda (2006:1) defines human resources for health (HRH) as
„…all persons, with or without formal training, who contribute towards the
improvement of health‟. This includes all health workers, whether they are
employed by the public service, non-governmental organisations or the private
sector. In this study, the researcher has focused on medical doctors, clinical
officers, and professional nurses.
The architects of decentralisation have focused more on the financial and structural
reform measures but ignored the human resource implications. Kolehmainen-
Aitken (2004:[1-2]) and Munga et al (2009:[7]) point out that in many countries
technical health experts have not been adequately incorporated in designing
and planning the decentralisation processes. Evidence shows that re-allocation
of roles and responsibilities that usually occur during decentralisation always
affect the health workers performance. This is true, irrespective of the extent to
which health managers are allowed to shape decentralisation and the
management structures (Munga et al 2009:[7]). Van Lerberghe, Adams and
Ferrinho (2002:525) and Mitchell (2009:226) observe that there is no evidence to
automatically link decentralisation to more effective management of human
resources. In most low-resource countries, local managers do not have staff
adequately trained in personnel administration and they know little about the

44
simple systems of managing workforce performance (Esmail, Cohen-Kohler &
Djibuti 2007:[7]; Mitchell 2009:224-225).
Decentralisation raises a number of crucial human resource issues that often
frustrate effective performance which may subsequently instigate substantial
agitation among health workers. Kolehmainen-Aitken‟s (1999:39) findings
indicate that numerous performance problems were experienced because
human resources issues were inadequately addressed under decentralisation.
Academics mention that the performance of health workers in countries such as
Papua New Guinea, Philippines, Nicaragua, and Zambia has deteriorated due to
unclear definition of roles between the central and local government workers;
inappropriate human resource planning capacities; inadequate management
training; and in consideration of the motivation of the workers (Bossert 2000:65;
Bossert & Beauvais 2002:28; Kolehmainen-Aitken 1999:39; Mitchell 2009:227).
Kolehmainen-Aitken (2004:[4]) explains that in order to enhance the
performance of health workers, the local government health service managers
should be able to measure workforce performance, conduct employee support
supervision, and effectively address the performance gaps identified. The health
service managers must ensure that their workers have the essential resources
and equipment required execute their duties. Employee motivation directly
influences performance. Therefore, it is often challenging to address all these
issues under decentralisation where the management tasks are performed by
managers with insufficient experience in managing human resource.
Additionally, in most instances the tools used for performance appraisals are out-
of-date and unclear to local personnel managers (Esmail et al 2007:[6-7];
Mitchell 2009:228; Tong, Straussman & Broadnax 1999:193). In countries like
Tanzania and Mozambique decentralisation has led to confusion in supervision
responsibility. This confusion has weakened technical supervision capabilities
and consequently to reduction in the number of supervisory visits to the health
facilities (Munga et al 2009:[8-9]; Saide & Stewart 2001:156).

45
Decentralisation usually requires a change in staffing requirements,such as the
need for new management skills. Both decentralised and centralised levels need
new roles, expertise, and job descriptions. The new powers and responsibilities
devolved to health facilities dictate that health workers and managers assume
new roles in order for them to coordinate, negotiate with local and national
officials as well as make dependable decisions. This calls for training of existing
employees in new skills and recruitment of new personnel with new skills and
abilities (Bossert 2000:65: Mitchell 2009:225; Munga et al 2009:[9]).
Devolution has a devastating impact of employees as they are separated from
the comfort and salary scales of the national civil service. The aim of
decentralisation is to enable lower level managers to be in charge of hiring, firing
and employee motivation. The ability to control human resource functions is vital
for improving the quality and efficiency of health services. One of the key
problems of public service is the propensity to use job security and patronage for
political purposes. The result is usually the reduction in workers‟ efficiency. On
the positive side, civil service protections and regular salary scales offer some
security for technical workforce from the subjective personal and political criteria
for hiring and firing. Health workers‟ unions have engaged in endless battles to
establish safer jobs and salary gains through the national health system
(Kolehmainen-Aitken 2004:[5]). For example, the Zambian health workforce has
engaged in a process of „de-linkage‟. In this process some MoH employees have
been successful in competing for positions offered by the local health boards, in
some instances at higher salary scales. However, this process seems to have
stopped recently (Bossert 2000:66). The other effect of this separation is the
disruption of career development for health experts in a joint public service;
leaving few options for career development for those at the devolved health
facilities. In an integrated health system, health professionals normally
commence their careers in primary health care facilities and gradually progress
either into hospital services or into public health administration, beginning at the
district level up to national level. The devolution of the primary health care
facilities usually eliminates this direct career progression and confines the career
development of the devolved workforce (Bossert 2000:66; Kolehmainen-Aitken
2004:[6]).

46
Health care experts, who are more familiar with central level managerial
positions, frequently struggle to be held directly accountable to local politicians
(Mitchell 2009:225; Munga et al 2009:[9]). For instance, in Chile and Bolivia,
political leaders in some rural municipalities were considerably less educated
than the local health facility physicians and nurses. Such scenario often created
decision making conflicts. Physicians would usually resist duties assigned.
Sometimes, in order to avoid potential conflicts the physicians would avoid
recruitment by these local governments. The local politicians sometimes have
their own agendas and want to exploit the health services for their own benefit
and patronage such as „recruiting supporters as health workers‟ (Bossert
2000:67).
Access to opportunities for career development is vital for performance. Health
services managers mainly from the lower level health facilities have contradictory
attitudes. Much as they may want to fill vacant positions with suitably trained
health workers, they are usually hesitant to let them go for further studies.
Workforce shortages may be so severe in such health facilities that there is no
one to substitute the personnel who go for further training. Some studies have
indicated that decentralisation has actually reduced the prospects of professional
development and career mobility (Kolehmainen-Aitken 2004:[7]).
Lastly, the literature demonstrates a negative effect of decentralisation on staff
motivation. This is mainly because of the perception the health workers have
concerning the poor working conditions and the inadequate salaries that have
resulted from the decentralisation (Esmail et al 2007:[7]; Kolehmainen-Aitken
2004:[7]). Bach (2001:1) and Hagopian, Zuyderduin, Kyobutungi, and Yumkella
(2009:w863) emphasise that health service managers need to pay sufficient
attention to handling issues surrounding the working conditions and professional
development that may influence health workers‟ motivation and performance.

47
2.4 HUMAN RESOURCE MANAGEMENT
Human resource (HR) practitioners have different perspectives on the definition
of human resource management (HRM). Different authors put emphasis on
diverse aspects of HRM. Nel, Werner, Haasbroek, Poisat, Sono and Schultz
(2008:6) describe human resources management as „…the productive use of
people in achieving the organisation‟s strategic objectives and the satisfactions
of their individual needs‟. Snell and Bohlander (2007:4) refer to human resource
management as „…the process of managing human talent to achieve the
organisation‟s objective‟. Other authors like Noe et al (2008:4) define the concept
of HRM as „…those policies and practices that might influence the attitudes,
behaviours, and subsequently the performance of workers‟.
Buchan (2004:6) asserts that HRM function in the health sector has a number of
distinctive features because:
The health labour force is big and is divided into different professions (such
as doctors, nurses, clinical officers, pharmacists among others) with varied
expertise;
the health personnel like doctors and professional nurses pay more
allegiance to their profession and clients rather than to their managers;
the entry into most health training institutions and programmes or service is
based on strict criteria and standards determined by the respective
professional associations or councils;
the health sector is one main recipient of public funds with a lot of political
involvement; and
health service delivery involves a lot of manual labour and big proportions of
the annual national health budgets are spent on health personnel as
compared to the expenditure on non-health workforce.
In order to achieve workforce performance, Nel et al (2008:6-8) emphasise the
need for human resource management to create a fit between the dynamic
components of the organisation which are:

48
the individual employee;
the job;
the organisation itself; and
the environment.
Human resource management practises are so highly interrelated that if
executed well, can contribute not only to individual success but also to the
overall success of the organisation. The sequence with which the HR practises
are carried out plays an essential part to their success. Ideally human resource
managers must begin by identifying the HR strategy that is, how the HR function
will be organised in the quest to achieve organisational mission. It follows
therefore, that HR strategy must be properly aligned to the overall organisational
strategy.
Secondly, the HR department embarks on human resource planning to
determine future demand and supply for human resources. This is followed by
recruitment, selection and induction. The new recruits must undergo training to
help them attain optimum performance in their jobs. They also need to be
prepared for future jobs through continuous development. At this stage the
employer has done the prerequisites and therefore expects better performance.
This is where performance management becomes useful. Employee
compensation is largely dependent on how well they perform. If the employer is
pleased with the employee‟s performance he may go to an extent of providing
lucrative benefits, services, and career planning opportunities to keep the morale
high.
2.4.1 The value of human resource management in performance
For many years, HR experts believed that their function enhances performance.
Liu, Combs, Ketchen and Ireland (2007:504), mention that human resource
management practices mould performance through three main channels namely:
raising the workers‟ knowledge, skills and abilities;

49
motivating workers to leverage their knowledge, skills and abilities; and
empowering workers to achieve the desired results.
Liu et al (2007:507) argue that high level of knowledge, skills and abilities among
workers are prerequisites for effective performance. When the workers only
know the regular tasks of their jobs, they cannot contribute productively to the
organisation outside their allocated tasks. Additionally, when workers have the
essential knowledge, skills and abilities that enable them to work beyond their
regular functions they are not likely to do so unless they are adequately
motivated. Furthermore, well-informed, skilled and inspired employees will not
use their valuable time and capacities without favourable organisational structure
and job designs..
2.4.1.1 Enhancing worker’s knowledge, skills and abilities
The performance of health workers is crucial because it has an instant effect on
health care delivery and eventually on the health of the population. According to
World Health Organization (2006:67), the performing health workforce is one that
functions in responsive, reasonable and proficient ways to achieve the superior
health results. Proper selection, training and development, and compensation
practices can enhance health workers‟ performance.
2.4.1.1.1 Selection of workers
Selection of employees is the critical step towards building a productive health
workforce. Snell and Bohlander (2007:234) define selection as „...the process of
choosing individuals who have relevant qualifications to fill existing or projected
job openings‟. Selection involves choosing the best applicants to fill a position
(Grobler, Wärnich, Carrell, Elbert & Hatfield 2006:182). Thoroughly planned
selection procedure assists in identifying the precise set of knowledge, skills and
abilities required for the jobs (Liu et al 2007:505). It is very important during the
selection process to identify the fit between the individual and the job as well as

50
between the worker and the organisation‟s culture and values. The lack of the fit
between the job and the candidate as well as between the candidate and the
organisational culture may lead to poor performance and lack of commitment
(Kristof-Brown, Zimmerman & Johnson 2005:315). Studies have demonstrated
that good selection practices contribute greatly to job satisfaction, organisational
commitment, and reduce staff turnovers (Saks & Ashforth 1997:395).
2.4.1.1.2 Training of health workers
Training is defined by Noe et al (2008:267) as „…the planned effort by an
organisation to facilitate employees‟ learning of job-related competencies‟. These
competencies include knowledge, skills and behaviour that are critical for
successful work performance (Kahya 2009:102).
The health workforce needs the latest knowledge and skills to execute their
duties well. Insufficient knowledge, skills and improper attitudes can be
impediments to quality health care. Advances in medical field such as treatment
and diagnosis, and the changing roles and responsibilities within the health
sector require continuous professional development (Dieleman & Harnmeijer
2006:16). The WHO (2006:82) suggests that constant learning process must be
developed at the commencement of a health profession career. Various methods
are used to upgrade the skills and knowledge of health workers. Low cadre
health workers (such as nursing assistant) who attend a few weeks or months of
pre-service education have varying learning requirements from high cadre staff
(such as doctors or professional nurses) with long duration of training and
experience. Despite these differences, there are some common principles which
underlie any approaches to health professional development. The approaches
that may be used for professional development may be categorised either as
individual or organisation-wide. The individual approaches are training courses,
continuous professional development and web-based training and access to
information. The team or organisation based approaches include retreats,
teleconferencing, and collaborating workspaces (WHO 2006:83).

51
In low resource settings like Uganda, the commonly used methods are training
courses and seminars that are organised away from the duty stations. Some
writers however doubt the usefulness of these learning interventions since there
is no evidence to prove their effectiveness (Rowe et al 2005:1028; WHO
2006:83). This is possibly due to lack of problem analysis and training needs
assessment (Potter & Brough 2004:336). Additionally, it may be due to the
mismatch between the training content, skills required, the choice of target
group, and the training methods used (Mathauer & Imhoff 2006:[11]; Morgan &
Deutschmann 2003:21). Apart from training subjects and methods, access to
training opportunities among health workers also vary, with rural areas at a
disadvantage (Dieleman et al 2006:[6]; Mathauer & Imhoff 2006:[11]). The WHO
(2006:82), however, points out that the formal training courses organised outside
the duty stations are known to be inadequate in modifying the clinical practice of
the health professionals. In-service training courses can successfully transform
the practices and behaviours of health personnel when it is interactive, using
real-life situation, and when followed by ongoing support supervision.
2.4.1.1.3 Compensation level
Grobler et al (2006:35) emphasise that „…compensation does not only refer to
extrinsic rewards such as salary and benefits but also to intrinsic reward such as
achieving personal goals, autonomy and more challenging job opportunities‟.
Indeed, Noe et al (2008:486) point out the need to align the compensation policy
with the overall organisation strategy. Compensation level is one of the most
important dynamics affecting job choice. It determines whether the prospective
worker will accept or reject the job. Ideally, the compensation system should
promote the organisational culture and employee behaviours necessary for
achievement of the organisation‟s strategic goals. Liu et al (2007:506) maintain
that attractive compensation helps to build the organisation‟s image as an
employer of choice and further leads to attraction and retention of high quality
workers. In highly routinised work such as health care delivery, staff with high
level of knowledge, skills and abilities has less opportunity to make
improvements. Additionally, paying extra to have knowledgeable and skilled

52
employees is of little value if there is lack of motivation or workers confront
problems in applying their skills. While investing in higher compensation pays off,
managers have to ensure that they are able to take advantage of the higher
knowledge, skills and abilities, which such compensation generate (Liu et al
2007:506).
2.4.1.2 Motivation problems and enhancing practices
Armstrong (2009:317) describes the term motivation as „…the goals individuals
have, the ways in which individuals choose their goals and the ways in which
others try to change their behaviours‟. Therefore, motivation is about getting
individuals to move in the right direction in order to achieve the desired results.
Workforce literature has put a lot of focus on the relationships between the
conditions in which health personnel operate and performance. According
Fritzen (2007:[3-4]) one useful way to think about how to boost health workers‟
ability to perform maximally, is to think of what they „can do” (the skills and
training that enables them to perform) and what they „will do‟ (motivation and
empowerment). On the „will do‟ side, literature emphasises the need to consider
a wide range of factors that affect health workers‟ motivation. Fritzen (2007:[5-6])
classifies these factors into those that are obvious (day-light factors) and those
that are hidden (shadow-side factors). The day-light factors include the workers‟
terms of service, managerial goal setting, performance management, and
prospects for career growth. The shadow aspects include informal organisation
culture and expectations, alternative source of income, and the strength of
professional ethics and social expectations. All these can influence the
motivation and performance of health workers (Fritzen 2007:[6]).
Manongi, Marchant and Bygbjerg (2006:[6]) report that incentives for positive
performance are very weak and even non-existent in most health sectors of
developing countries. In their study in Tanzania, Manongi et al (2006:[5-6]),
found that workers felt that they had very little to gain from working hard or being
responsive to either the patients or superiors. The poor career paths and
promotion opportunities led to health workers feeling stuck, while their salaries

53
are very meagre to meet most of their needs. Hence, health workers ended up
engaging in part-time work in the private sector or in totally different informal
occupations in order to improve their income. Liu et al (2007:506) established a
positive link between incentives compensation and performance of workers. The
WHO (2006:75) maintains that three aspects of compensation have a bearing on
the performance of the health personnel. These include the level and steadiness
of pay; the system used for payment; and the presence of other motivators. The
health personnel should be compensated, rationally for the duties they perform.
Poor remuneration and a sense of inequality negatively affect their performance.
Several authors such as Kolehmainen-Aitken (2004:[5]) and Fort and Voltero
(2004:[4-5]) report that performance management and strategic planning
systems for health workers are very weak or even non-existent in most low
income countries. For example, a study done in Cambodia by Men, Grundy,
Rasmey, An, Soeung, Jenkinson, Boreland, Maynard and Biggs (2005:12) found
lack of effective systems for performance management of health workers. There
was no system linking the individual performance goals and functions to the
organisational strategy or rewarding strategy. There was also lack of
compensation or rewards for appropriate initiative and behaviours (Men et al
2005:10). Some of the reasons for lack of effective performance systems in
public services of developing countries include prerequisites such as living wage
and availability of drugs. When such necessities are lacking, one cannot hold
health workers accountable for poor performance in their jobs (Kolehmainen-
Aitken 2004:[6]). According to Liu et al (2007:506) strategies that encourage
promotion of workers from within the organisation are becoming more popular
nowadays due to their motivating effects. Internal promotion procedures aid the
employees to envisage clear prospect concerning their potential which inspires
them to perform better and increase their skills and abilities for successive
positions.
The „shadow aspects‟ of the health systems have been found to reduce the
morale of health workers. Kyadondo and Whyte (2003:338-340), mention that
informal organisational norms and work ethics of some front-line health workers

54
in rural locations in Uganda are more oriented towards alternative livelihood
strategies for survival than they are towards high standard of service delivery. In
Vietnam for example, Dieleman, Cuong, Anh and Martineau (2003:[9]) report
that maintaining the sense of professionalism of health workers is weak,
especially in rural areas, where workers feel that commitment of the central and
local governments to attend to their problems and social expectations is lacking.
A strong and positive organisational culture can be as effective as incentives in
motivating health workers.
While remuneration and job security are important determinants of morale, many
organisations in low resource settings are found to significantly improve
performance of health workers by cultivating a participatory and open
performance oriented culture. In culturally oriented organisations the results of all
the group members should be evaluated regularly against comparable
performance objectives and indicators (Krogstad, Hofoss, Veenstra & Hjortdahl
2006:[7]).
2.4.1.3 Employee empowerment and enhancing practices
Heizer and Render (2008:199) refer to employee empowerment as „…the
involvement of the workforce in every step of decision making process‟. The
designs of work processes that consistently produce the desired quality services
require involvement of those who understand the weaknesses of the system.
Employee empowerment techniques include:
nurturing open communication systems that engage the workers;
promotion of open supportive supervision;
shifting responsibility from top managers to service level (operation level)
workers;
developing high morale in organisation; and
building recognised structures such as quality circles and teams (Heizer &
Render 2008:200).

55
Liu et al (2007:507) emphasise the link between employee participation and
performance. Employee participation is the extent to which workers can
influence decisions. In institutions that support employee involvement, the
workforce is allowed discretionary initiatives, contribute to decision making, and
share views related to their employment. This gives a chance to the employees
who are more conversant and competent about their duties than their
supervisors to spot and correct mistakes. Furthermore, employee participation
supports efforts for continuous innovation within the organisations (Liu et al
2007:507). Wright, McCormick, Sherman, and MacMahan (1999:551) point out
that the complete benefits of workers‟ involvement are only realisable if the
workers have the knowledge, skills and abilities to make good decisions and
have the right motivation..
Researchers have reported a positive relationship between flexitime and
individual performance (Liu et al 2007:507). Many organisations in the developed
world are offering flexitime as a way to attract and retain workers. Similarly, job-
sharing, telecommuting and part-time work allows workers to have greater
control over their schedules. Such practices allow workers to remain focused
and fulfil their responsibilities both at their workplace and at home (Liu et al
2007:507).
Some authors report that grievance procedure has an effect on performance of
employees. Grievance procedures provide a formal avenue for employees‟
voices to be heard in case they are not satisfied with their work environment.
Grievance procedures are said to empower workers by offering an opportunity
for resolving disagreements with managers and other employees. If the workers
realise that complaints procedures are fair and efficient, then they are more likely
to be contented with the results or outcomes (Liu et al 2007:507; Peterson &
Lewin 2000:395).
Employment security is another employee empowerment practice. Employment
security is thought to enhance the level of commitment of the employee to the
organisation. Ahmad and Schroeder (2003:19) and Liu et al (2007:507)

56
emphasise that devoted workers usually subscribe to the organisation‟s strategy.
Moreover, a stable engagement helps the workers to build long-term and broad
view of their employment.
2.5 PERFORMANCE OF HEALTH WORKERS
Performance has many dimensions. It involves using the available resources to
deliver timely results based on the standard procedures and circumstances
(Armstrong 2009:136; DIRPSER 2005:5; Langdon 2000:12; Noe et al 2008:344-
345). While delivering results is of current importance, it is crucial for the
organisations to have the potential to effectively respond to future challenges.
Creating and sustaining this potential is vital for performance. Client satisfaction
is the fundamental aspect of performance. Thus, performance of health
personnel is important because of its direct impact on health service delivery and
on the wellbeing of the population (WHO 2006:67).
Performance is about managing vital relationships with all stakeholders including
the clients, contractors, managers, and community leaders. The attainment of
results and meeting the patients‟ expectations depends on the way the health
workers carry out their duties. Therefore, performance involves good
organisation of the tasks and adding value to internal management procedures.
Good performance depends on the dedication of the employees. Ongoing
support supervision of the workers; obtaining regular feedback from the workers
concerning the organisations management actions; and the regular review of
organisational environment are all essential performance variables (DIRPSER
2005:3; Noe et al 2008:344).
The WHO (2006:67) defines a well-performing workforce as „…one that works in
ways that are responsive, reasonable and proficient to achieve the paramount
health outcomes‟. Poor performance of health workers leads to lack of access to
quality health care. This results in inadequate health outcomes because the
clients may not use the services due to neglect by the health personnel
(Dieleman & Harnmeijer 2006:5).

57
2.5.1 Dimensions of health workforce performance
The WHO (2006:68) suggests four dimensions that determine how health
workers perform. These dimensions include availability, responsiveness,
productivity and competence. In this study, the researcher looks at the
performance of health workers in terms of these four (4) dimensions.
2.5.1.1 Availability of health workers
Availability refers to having the right numbers of health workers, in the right
locations, at the right moment and with the necessary expertise (Buchan 2005:3-
5). Another author (Manuwa-Olumide 2009:5), refers to availability as „…the
distribution and attendance of health workers‟. Health workers form the
backbone of the health system. They assist in the execution of health service
delivery (Anyangwe & Mtonga 2007:93). It is the responsibility of the respective
governments to facilitate access of its citizens to affordable and appropriate
health care, however in many developing countries the health systems are faced
with a range of personnel problems. Some of these challenges include lack of
and inequitable distribution, as well as attrition of skilled health personnel
(Stilwell 2004:21).
Internationally, there is increasing recognition that health worker shortages affect
nearly all countries. Amidst the shortages, there is also a challenge of global
mal-distribution of the available workers. Chen, Evans, Anand, Boufford, Brown,
Chowdhury, Cueto, Dare, Dussault and Elzinga (2004:1984) observe that in
order to achieve the health related MDGs, the minimum level of health workers
required is estimated to be 2.5 health workers per 1000 people. In sub-Saharan
Africa, the health workforce averages to only 0.8 health workers per 1000
people, which is considerably lower compared to other regions of the world
(Chen et al 2004:1984).
Anyangwe and Mtonga (2007:94) observe that availability of health workers is
one of the indicators that distinguish the developing from the developed

58
countries. In ideal situations, the poor countries (like most of the sub-Saharan
countries) with the highest burden of disease should have the largest health
workforce. Regrettably, most sub-Saharan African countries have the lowest
concentration of health workers. Studies have reported disparities in the
distribution of health workers even within the same country, with large
concentrations of well qualified health personnel in urban areas (Anyangwe &
Mtonga 2007:95).
Shortages of health workers affect performance of the existing staff because
health care delivery is a labour-intensive industry. There is need to have
sufficient health care providers to treat and care for the patients (Anyangwe &
Mtonga 2007:97). Studies have revealed positive correlations between
availability and concentration of health workers and the quality of health care.
Therefore, as the number of health workers drops, the ability of health care
systems to deliver quality services is compromised (Awofeso, Schelokova &
Dalhatu 2008:[1]; JLI 2004:23; Mercer & Dal Poz 2002:1).
In Malawi and Zambia for example, the growth in the number of health facilities
has surpassed the capacity of governments to staff them (Dovlo & Martineau
2004:40). Consequently the rural population suffers the impact of reduction in
health personnel since they are least preferred by health workers. Health
workforce shortages in health facilities increase the workload on those who
remain. The shortage also limits access and reduces the quality of health care.
Furthermore, waiting times are longer and often facilities are staffed with
unqualified health personnel. Sometimes even clients seen by qualified
personnel are put at risk due to time constraints and fatigue of health workers
(Padarath, Chamberlain, McCoy, Ntuli, Rowson & Loewenson 2003:26). It is
therefore imperative for governments to focus on the availability of health
workers by providing some incentives as one way to attract and retain them in
their jobs. This, coupled with other actions will help to improve the performance
of health workers.

59
2.5.1.2 Responsiveness of health workers
Heizer and Render (2008:212) define responsiveness as „…the willingness or
readiness of employees to provide a service‟. The Department for International
Development (DFID) (2006:1) describes responsiveness as „…the extent to
which service providers demonstrate receptiveness to the opinions, grievances
and propositions of the clients by transforming its organisational strategy.‟
Responsiveness is indicated by the appropriateness of the services. The
provision of quality health services requires more resources (such as drugs and
medical equipment) in addition to augmenting the numbers of health personnel.
Thus, it is important to pay particular attention to those aspects that affect the
efficiency and receptiveness of health workers. The health workforce must have
the skills and enthusiasm to appreciate and deal with the health needs of their
clients. Freedman (2005:19) maintains that focusing on health workers‟
receptiveness allows for a more holistic approach to quality service provision by
taking into consideration the technical aspects and client satisfaction.
A number of factors impede the responsiveness of health workers. These may
be the social, cultural, and political economy. These factors might prevent health
workers from providing quality care to the clients and may ultimately affect
motivation. According to DFID (2006:3), health worker responsiveness may be
hampered by;
lack of professional support and management,
lack of training and professional development programmes,
lack of awareness of the clients‟ and workers‟ rights,
inability to communicate in local languages, and
inability to contribute to decision making process within the health systems.
Others factors that could hinder health worker responsiveness include lack of
interpersonal communication skills, lack of public recognition for the value of
health workers, and poor terms and conditions of services. Lastly, the inability of
the health workers to provide appropriate care may be hampered by lack of skills

60
and adequate equipment and supplies which limits their sense of achievement
and performance. Given the fore-mentioned factors, the responsiveness of
health workers can be improved through a number of mechanisms. These may
include, increase in remuneration and provision of other types of incentives such
as hardship allowance for health workers in the hard-to-reach areas. These
could eventually contribute to improved health worker performance and retention
(Ammassari 2005:10; DFID 2006:6).
Monetary incentives are not the only measures that can be used to improve
health workers‟ performance. In some countries like Ghana, the decentralisation
of health service functions, the empowerment and recognition of local staff are
said to be essential if retention and performance strategies are to be successful.
Health workers should be consulted, their professional associations should be
brought on board and their opinions represented in the policy outcomes (Sagoe
2005:2). For example, in Uganda, the relatively good performance of health
workers in the religious private not for profit (PNFP) health facilities is attributed
to the favourable working environment made by the decentralised health clinics
with more decision-making powers over their facilities, budgets, and
expenditures (DFID 2006:7; Reinikka & Svensson 2003:30).
Another effective tool for enhancing performance of health workers, improving
their skills, capacity building, and raising awareness is through training. This
approach is deemed successful when combined with organisational
transformations that guarantee that acquired knowledge and skills are utilised by
health personnel to improve the quality of services. The Indonesian experience
indicates that performance and the quality of health care resonates more with
what health workers know and achieve than the remuneration offered (DFID
2006:7).
Performance of health workers can also be improved through provision of better
infrastructure, equipment, and materials such that the employees can apply and
develop their professional skills. For example, in Ethiopia Lindelow, Serneels,
and Lemma (2005:12) report that even though monetary incentives are the main

61
pull factor of health workers to private sector, the availability of better equipment
and infrastructure also play a big role in attracting health workers.
2.5.1.3 Productivity of health workers
Productivity is defined as „…the ratio of outputs to inputs or the relationships
between inputs and outputs‟ (Heizer & Render 2008:13; Nayeri, Nazari, Salsali &
Ahmadi 2005:[2]). The JLI (2004:146) defines productivity as „…the outputs
extracted from given inputs, such as patients seen per worker or number of
procedures per provider‟. This is perceived to be an economic measure of
productivity and is dependent on the accessibility of information on personnel‟s
contribution to the organisation‟s goals (such as man hours) and health care
outputs (such as number clients attended to) (Buchan 2005:4). The above
definitions of productivity do not overtly address the quality of service, and the
health outcomes resulting from the care provided. In addition they are dependent
on availability of information on both inputs and outputs. Other authors, such as
Kurowski, Wyss, Abdulla and Mills (2007:116) define productivity based on two
concepts of productivity. They define health worker productivity as „…the time
spent on health service related activities such as patient care or staff meetings‟.
They also define service productivity as „…the proportion of useful staff time
used in provision health priority interventions‟. Manuwa-Olumide (2009:5) also
describes productivity as „…the ability of health workers to provide efficient
services and favourable outcomes‟. In this study, productivity is about achieving
improved „health outcomes‟ from the current „contributions‟ of the health
workforce without compromising quality of care provided.
Although the performance of health workers may not be easy to quantify and
monitor, this could be done by using suitable indicators. Hornby and Forte
(2002:2) and Manuwa-Olumide (2009:5) describe human resource indicators
that can be used to monitor health workforce performance. These indicators
include interventions delivered per health worker such as outpatient or home
visits, bed occupancy rates, and patients‟ contacts among others.

62
The productivity of a health worker is affected by a myriad of factors. These
factors may include inadequate medical equipment and supplies; poor health
management structures; inadequate knowledge and skills; and insufficient
receptiveness of workers (Dieleman & Harnmeijer 2006:16; Hagopian et al
2009:w867-869). The inadequate performance of workers emanates from a
number of multifaceted yet interrelated variables. For instance, inadequate
wages my result in increased rate absenteeism, since workers will be looking for
work elsewhere to earn extra income. Studies also report that poor salaries may
lead to low motivation of the workforce which generally hinders performance
(Dieleman & Harnmeijer 2006:16).
A study carried out among nurses in Iran (Nayeri et al 2005:[5]) reports that the
productivity of nurses is limited mainly by human resource factors. The human
resource issues that promote or hinder the productivity of nurses in Iran include
informed selection procedures of new workers based on proven standards;
regular appraisal of employees; reliable staffing levels; full involvement of the
ward nurses during patients‟ admissions; and open communication among the
health teams. The authors further report that factors such as nursing standards,
nurses‟ skills and experiences, and organisational strategies and procedures,
availability of equipment, and the activities of the other members within the
health care team determine the workload and the productivity of nurses (Nayeri
et al 2005:[7]). Therefore, addressing these issues of human resources
management can improve productivity.
2.5.1.4 Competence of health workers
Armstrong (2009:202) mentions that competence related to performance.
Competence is a generic term referring to „…a person‟s overall ability‟. It refers
to the specific capabilities, such as leadership, and comprises knowledge, skills
and attitudes (Armstrong 2009:202; Victorian Government Department of Human
Resources 2009:3). Armstrong (2009:203) adds that competence is an individual
ability that results in the actions that meet the requirements of the job.

63
Competence is important when assessing someone‟s work attributes and
generally includes multiple actions and responsibilities (Miner, Childers, Alperin,
Cioffi & Hunt 2005:11). The Joint Learning Initiative (2004:143) defines
competencies as „…knowledge, skills, and attitudes that an individual acquires
and develops through learning and work experiences‟. Competence essentially
takes into account what workers achieve in different situations including the
readily observable and measurable behaviours, as well as unobservable traits
(such as attitudes and values).
Generally, workforce competencies are frequently utilised to generate job
descriptions (Miner et al 2005:11). Worldwide, health workers are gradually
accepting competence standards as one way of communication with each other.
Hornby and Forte (2002:2), Manuwa-Olumide (2009:5), and the WHO (2006:71)
point out some human resources indicators that may be used to measure the
health workers‟ performance dimension of competence. These include individual
indicators and institutional indicators. The individual indicators embrace aspects
like prescribing practices while the institutional ones are patient re-admission
rates, number of live births, and number cross-infections (Ntoburi, Wagai, Irimu
& English 2008:445).
The improvements in quality of health services mandates health workers to
understand the objectives they have to achieve and how they are to achieve
them. Quality enhancement initiatives require health personnel to direct their
efforts towards receptiveness and efficiency of the services they offer. Health
professionals should have up-to-date knowledge and skills to use advanced
technologies to support health service delivery. This can be applied through the
health information management systems that are essential in monitoring the
health outcomes. Communication systems like mobile and fixed telephones,
internet, and paging devices can facilitate information sharing and consultations
regarding patients with other services providers in different locations
(telemedicine) (Ntoburi et al 2008:445-446; Pruitt & Epping-Jordan 2005:637).

64
Insufficient knowledge and skills, and improper attitudes towards clients can be a
hindrance to quality health care. Therefore, because of the frequent changes in
the trends of diseases, diagnosis, and treatment protocols health workers need
continuous professional development. According to WHO (2006:77), continuous
learning practice has to initiate at the commencement of any career in the health
profession. Bossyns and Van Lerberghe (2004:[3-4]) in their study, in Niger,
report lack of competence among rural nurses, which led to delays in the referral
of patients to higher levels of management. The rural nurses had insufficient
technical and organisational competence to effectively determine which patients
to refer. They also lacked counselling and communication skills to convince
patients who are referred to go to the referral hospitals. Such incompetence
leads to inappropriate health care and hence poor performance of health
workers (Bossyns & Van Lerberghe 2004:[5]). Another contrasting study done in
rural India (Iyengar & Iyengar 2009:15) reports that with good skills in identifying
complicated obstetric cases, good counselling and communication skills leads to
improved maternal health outcomes. This implies that improving the skills of
midwives and access of mothers to skilled health care during and after childbirth
is crucial in reducing maternal mortality rates.
2.5.2 Determinants of health worker performance
The national health care systems cannot function efficiently without adequate
skilled health personnel. Health workers have a vital role to play in the proper
functioning of these health systems (JLI 2004:21). Unfortunately, several
challenges avert health workers‟ performance efforts. Consequently, poor health
outcomes are observed in most of the developing countries. Unless there are
radical changes in performance of health workers, most developing countries
might fail to attain the health related MDGs by 2015. Generally, the attainment of
an effective health workforce requires the recruitment of potentially effective
personnel, optimising the performance of the existing health workers, and
retaining them (Manuwa-Olumide 2009:3; WHO 2006:67). The four dimensions
of health workforce performance (availability, competence, productivity and
responsiveness) are influenced by factors within and outside the health systems.

65
These factors are categorised into individual, organisational, health system, and
broad environmental factors (Dussault 2006:6). The main factors are shown in
Table 2.1.
Table 2.1: Determinants of health workers’ performance
Category Determinants
Individual Age, sex, marital status, geographical origin, religion; Education, training received; Competence level; Personal values, preferences and interests.
Organisational Structure and culture; Management capacities, capabilities, style, practices; Working conditions, occupational safety, workloads, availability of other inputs, state of infrastructures and equipment.
Health sector Health policies, and human resource for health (HRH) policies (terms of employment, career, placements, transfers, promotions) Organisation of services; Regulation, labour relations mechanisms; Dominant values, objectives; Degree of centralisation, of bureaucratisation; Role of interest groups (unions, councils, user groups, pharmaceutical, equipment companies).
Broader environment
Policy priorities (finance, civil service, planning, education), representations; Economic growth, security, quality of governance.
Source: Dussault (2006:7)
Over the years it was believed that the principal cause of poor performance of
health workers was insufficient knowledge and skills. Presently however, this
perception seems to be changing. According to the WHO (2006:70-71), health
workers may perform poorly because of their personal characteristics such as
their socio-cultural background, knowledge, experiences, motivation and work
ethics. In addition, their performance may be impeded by the characteristics of
the population they serve such as their level of education, their knowledge,
attitude, and beliefs about health and disease, and the economic characteristics
such as income levels, and the availability of resources.
Furthermore, the characteristic of the health sector itself and the wider
environment may also determine the conditions under which health workers
perform. Such characteristic may include allocation of resources for health
workers to do their job, the internal environment, the organisational culture, how
workers are compensated, supervised, and managed, and their personal safety
(Manuwa-Olumide 2009:6; WHO 2006:71).

66
Health policies define the regulation and management of work and duties of the
health workers. These policies also determine the budgets for health workers
and other inputs required for service delivery. Often, there is a tendency among
the health managers to spend more funds on medical equipment and
infrastructures instead of securing a continuous supply of drugs and providing
incentives to the health workers. External policies such as those from ministries
or departments of finance, and public service significantly impact on the working
conditions of the health workforce. A good example of this is the fact that public
service career development structures are applied to the health workers with
less consideration of the uniqueness, the needs, and the prospect of the health
workforce (Dussault 2006:7-8).
2.5.3 Strategies to optimise the performance of health workers
Optimising the performance of existing health workers is crucial due to its
immediate impact on service delivery. Thus, understanding the aspects that
influence how health personnel execute their duties is critical to strategy
formulation. Knowledge of the determinants of performance informs the
formulation of strategy for improving the performance of health workers. The
instruments available to support the performance of health workers are classified
as job-related, support system related, and the enabling work environment-
related strategies (WHO 2006:71). These strategies may be directed at
individual health workers, at the health teams or the entire heath system (Ferlie
& Shortell 2001:281). Therefore, improvement in workforce performance and
productivity usually results from a package of linked interventions rather than the
uncoordinated ones (Buchan 2005:15).
2.5.3.1 Job-related strategies
These are strategies that are particularly relevant to the jobs or professions. The
strategies include having comprehensible job descriptions, having professional
norms and codes of conduct, matching appropriate skills to the work roles, and

67
support supervision (Dieleman et al 2003:[6-8]; Rowe et al 2005:1028; WHO
2006:72).
2.5.3.1.1 Having comprehensible job descriptions
The WHO (2006:72) reports that health workers in many developing countries
lack proper job descriptions. Studies show that the use of written job descriptions
with clearly stated objectives, responsibilities, authority and lines of
accountability are consistently associated with improved achievement of work
goals (Franco, Bennett & Kanfer 2002:1255). Job descriptions have been used
effectively in many public health systems of developing countries with good
performance results. For example, in Indonesia one study demonstrated that
using job descriptions with clear standards along with better in-service training
can enhance job satisfaction and compliance with standards among nurses and
midwives (Dolea & Zurn 2004:1).
2.5.3.1.2 Formation of professional norms and codes of conduct
The health workers‟ sense of professional identity, vocation, and work ethics
influence performance in terms of competence and responsiveness. For
example, there are instances where health workers continue to provide services
despite difficult and sometimes dangerous conditions (WHO 2006:72).
Health workers are expected to conduct themselves with integrity, to selflessly
apply their technical knowledge, and to put the interest of patients above their
own (Blumenthal 2002:525; Miettinen 1999:107). Usually the professional values
are nurtured through written codes of conduct and regulations set by the
professional associations (Manuwa-Olumide 2009:7). Wibulpolprasert and
Pengpaibon (2003:[13-14]) assert that the professional associations foster health
workers‟ sense of valued identity, responsibility and higher morale. Therefore,
creation of the professional associations may be desirable in the long run, but
they take time to establish. Recently employers are establishing clear written
codes of conduct for their workers. However, the effectiveness of such codes

68
has not been proven (WHO 2006:73). The enforcement of the codes of conduct
is still poor especially in developing countries. For example, due to difficult living
conditions health workers in low resourced countries adopt some coping
strategies which may compromise the maintenance of professional ethics
(Ferrinho, Omar, de jesus Fernandes, Blaise, Bugalho & Van Lerberghe 2004:[2-
3]). In order to be successful the regulations and codes of conduct need to be
well publicised and actions taken when they are broken.
2.5.3.1.3 Matching appropriate skills to the work roles
Health workers are likely to perform well when their tasks are congruent with
their skills (Hagopian et al 2009:w867). Across the globe, there are numerous
examples of the inefficient use of the skills of individual health workers. For
example, sometimes the tasks do not match the individual skills of health
workers (nurses doing clerical work, untrained health workers carrying out
deliveries on the wards). Certain tasks consume excessive amount of time (such
as hosting visiting missions) such that the workers are not available at work at
the time when the workload is high. A study done in Tanzania found that about
40-50% of the district medical officer‟s time was used on report writing, and
about 20% on hosting missions. In Uganda the district health managers spend
an estimated 70-80% of their time on planning, reporting, and training workshops
(WHO 2006:73). This leaves little time for implementation of health activities.
Buchan (2005:14-15) suggests that harmonising review missions, training
courses, and overlapping reporting demands can actually reduce the amount of
time wasted. Hence, this time can be put to important use to match the skills of
workers to the right activities. Additionally, shift patterns and time flexibility may
also be used to increase health worker productivity. This can help to achieve a
better match between staffing and workload at limited costs.
Task shifting is another way that can be used to enhance the perfomance of the
health workers (Buchan & Hinton 2005:2). The task shifting requires the
development of standardised protocols, including basic and simplified clinical,

69
recording, reporting, and monitoring and evaluation guidelines. Task shifting
provides opportunities to improve access to life-saving treatment and stimulates
creation of multidisciplinary health teams with better strategic skills mix to cope
with growing patient loads (Zachariah, Ford, Philips, Lynch, Massaquoi,
Janssens & Harries 2009:550). For example, in Malawi, Lesotho, Lusikisiki, and
South Africa, nurses initiate and manage antiretroviral therapy (ART) at rural
primary health clinics with support from mobile medical teams who provide
clinical mentoring. This enables access for patients who otherwise might not
have received the treatment they need (Zachariah et al 2009:550).
Task shifting may also provide health benefits for patients and health systems.
For example, the costs of initial training of medical assistants and clinical officers
are lower than for doctors, especially because the pre-service training periods
are shorter (Zachariah et al 2009:551). In addition, task shifting increases
retention, and reduces the risk of international „brain drain‟. This is because,
through task shifting, new cadres of staff are established that are better retained
in rural and hardship areas as their qualifications are generally not recognised
internationally (Zachariah et al 2009:552).
2.5.3.1.4 Implementing effective support supervision
Studies demonstrate that supportive supervision when combined with appraisal
and feedback to health workers has been found to improve performance (Rowe
et al 2005:1029). Support supervision helps to solve specific problems, can
improve performance, job satisfaction and motivation (Hagopian et al
2009:w871). For example, in Ghana good supervision made a difference in staff
motivation and performance between public hospitals and quasi-autonomous
hospitals (Dovlo, Sagoe, Ntow & Wellington 1998:4). In Afghanistan Edward,
Dwivedi, Mustafa, Hansen, Peters and Burnham (2009:942) report that support
supervision and training in Integrated Management of Childhood Illnesses (IMCI)
improves the quality of case management of children under the age of 5 years.
When support supervisory visits are seen as fault-finding and punitive, they have
negative impact on performance of health workers (WHO 2006:75).

70
2.5.3.2 Support system related strategies
Health workers require support from their organisations to enhance performance.
The key support features include but are not limited to remuneration, adequate
information, and infrastructure including equipment and supplies (WHO
2006:75).
2.5.3.2.1 Regular and satisfactory remuneration
It is believed that remuneration influences the behaviours of health workers. The
level of remuneration, the way health workers are paid, and presence of other
incentive always have an impact on performance of health workers (Hagopian et
al 2009:w869). The WHO (2006:75) emphasises that health workers must be
paid reasonably well for the work they do. All health workers should receive a
living wage which corresponds to their tasks. At the same time, the wages must
be paid regularly and timely. If this is not done then other forms of coping
mechanisms will result such as absenteeism, migration, creation of ghost
workers and referring patients from public to private clinics where some public
health workers also hold part-time jobs (Ferrinho et al 2004:[5]; Macq & Van
Lerberghe 2000:180; McPake, Asiimwe, Mwesigye, Ofumbi, Ortenblad,
Streefland & Turinde 1999:849).
Some countries in Africa have tried to raise the salaries of health workers as a
mechanism to improve their performance and retention. In Tanzania and Uganda
for example, salaries of all health workers were increased in recent years
following the job evaluation exercises. This meant that the salary of low cadre
nurses almost doubled and became equivalent to the salary of a new university
graduate. In Uganda however, the salary increment for health workers in the
public sector led to the migration of health personnel from the religious private
not for profit (PNFP) hospitals to public hospitals. This contributed to
understaffing in those facilities. In Ghana and Zambia, the governments tried to
remove the health workers from the regular civil service structure in order to
improve their remuneration. However, this exercise was resisted by other non-

71
health professional bodies which led to its failure (High-Level Forum on the
Health Millennium Development Goals 2004:2). Some studies report delays or
lack of payment of salaries in some developing countries. For instance in Chad,
salaries remain unpaid for long time which leads to absenteeism as health
workers are looking for other ways to earn a living (Zachariah, Lange & D‟Altilia
2001:332).
The way health workers are compensated is a major determinant of their
performance and productivity. Service based methods (fee-for-service) are found
to be more effective in increasing performance and productivity than time-based
methods such as salaries and fixed budgets (Langenbrunner, Orosz, Kutzin &
Wiley 2005:242). Accordingly, the performance-related payment methods are
increasingly being applied in many developed countries (Isaac 2001:111;
Manuwa-Olumide 2009:8; WHO 2006:78). Although performance-related
payment system is gaining more popularity in some developing countries, its
application still remains limited.
The use of incentives to improve performance of health workers is documented
by many writers. The application of various types of allowances and bonuses
has been proved to be effective in enhancing performance of health workers
(Hagopian et al 2009:w870). Examples of such allowances include rural or
hardship allowances, lunch allowance, and stipends for outreach services such
as immunisations (Arrowsmith, French, Gilman & Richardson 2001:114;
Hagopian et al 2009:w870). In Thailand, for example, payment of extra
allowances to health workers in rural areas proved to be effective in increasing
the availability of health personnel in those areas (Nityarumphong,
Srivanichankorn & Pongsupap 2000:55).

72
2.5.3.2.2 Develop a functional communications system to facilitate flow of health information
A functional national health information system is a key component for improving
the performance of health workers. Rowe et al (2005:1032) point out that having
information helps health workers to do their jobs better. This information must be
relevant to the job, available when needed, be of good quality, and easy to
understand. Health workers at different levels require different types of
information from various sources such as medical records, facility activity
reports, health workforce inventories, and financial accounts. The overall
productivity of workers should be based on reliable data concerning workforce
levels, distribution, skills mix, and information about the factors that impede
performance (WHO 2006:80).
Although information and communication are important in improving
performance of health workers, unfortunately health personnel often lack
adequate feedback on their performance. Most national health systems need to
improve their health information management in order to make the required
information available. Additionally, there is a need to develop a culture of
monitoring and evaluation, and feedback systems to enhance performance of
heath workers (Manuwa-Olumide 2009:8; Rowe et al 2005:1032). Particular
attention must be drawn to the use of modern communication technology (such
as internet, mobile telephony) to improve data management, services delivery,
and productivity in developing countries (Brimberry 1988:397; WHO 2006:80-
81).
2.5.3.2.3 Expand the health infrastructure and improve supply chain management
Regardless of how skilled health workers are, very little can be achieved without
the basic infrastructure such as clean water, working equipment, essential drugs,
and other supplies (Manuwa-Olumide 2009:8; Stekelenburg, Kyanamina, &
Wolffers 2003:109; Rese, Balabanova, Danishevski, McKee & Sheaff 2005:204;

73
WHO 2006:18). Drug stock-outs are reported in a number of developing
countries particularly in Africa and Asia (WHO 2006:81). In Niger, Bossyns and
Van Lerberghe (2004:[3]) point out that nurses in rural health centres are
reluctant to refer patients to district hospitals because only a few of them provide
surgical care, most do not even provide blood transfusions or oxygen. There is
also lack laboratory and x-ray facilities. Another study in Kyrgyzstan reports that
health workers providing care to diabetic patients lacked testing strips,
glucometers, had poorly equipped laboratories, and irregular supply of insulin.
This hampers the performance and productivity of health workers (Hopkinson,
Balabanova, McKee & Kutzin 2004:43). Therefore, the availability of health
infrastructure and other supplies contributes significantly to the productivity of
health workers (Edward et al 2009:942; Kelly 2001:111).
A safe working environment is just as important. Health workers need to be
provided with health care when sick. At the same time improving basic
infrastructure such as paying utility bills for electricity may make a quicker
difference to productivity than any other specific performance tool (WHO
2006:81). There is a need to recognise the importance of other support staff if
performance of health workers is to improve. Particular attention should be paid
to stores and supplies managers, account clerks, procurement managers. These
workers are critical in the scaling up of the health service delivery (Manuwa-
Olumide 2009:8; WHO 2006:81).
2.5.3.3 Work environment related strategies
Enabling work environment can promote performance of health workers.
Enabling environment mostly involves managerial, cultural and organisational
arrangements. The researcher focused on continous professional learning, team
work and management , and full delegation of responsibilities and accountability.

74
2.5.3.3.1 Encourage continous professional education and development
The knowledge and skills of health practitioners needs to be updated constantly
to keep up with the rapid changes in knowledge and practices in public health.
Continuous professional development is necessary for health practitioners at all
levels of care, specifically those at the lowest level who go through the shortest
periods of training (Manuwa-Olumide 2009:9; Mbindyo, Gilson, Blaauw & English
2009:[7]; WHO 2006:82). Continuous professional development is defined by the
London Institute of Health Management (2004:1) as „…a systematic ongoing
cyclical process of self-directed learning for individuals‟. Such approaches
include career paths, feedback from others, mentoring, and secondment.
Experience shows that interactive hands-on experiential training with continuing
supervision and support is more effective than training without practice (Davis,
Thomson, Oxman & Haynes 1995:700; Davis, O‟Brien, Freemantle, Wolf,
Mazmanian & Tylor-Vaisey 1999:870; Egger, Travis, Dovlo & Hawken 2005:1).
Some writers like Garcia, Hughes, Carcamo and Holmes (2003:807) mention
that such methods improve prescribing and dispensing behaviours and also the
clinical skills of health workers (WHO 2006:83).
Distance education is increasingly being used and has proven to be effective.
Distance education increases knowledge and knowledge seeking behaviour,
self-confidence, and positive attitudes towards the patients (Harris, Kutob,
Suprenant, Maiuro & Delate 2002:287; WHO 2006:83). For example, in
Guatemala a study by Flores, Robles and Burkhalter (2002:48) demonstrates
that a 10-months distance education course supported by at least two contacts
with tutors significantly increase the correct assessment and management of
diarrhoea cases. Overall, care has to be taken to choose the training and
development approaches that are likely to be effective for specific level of health
care.

75
2.5.3.3.2 Institute proper and effective management skills among the health teams
Over the years attention about the performance of health workers has focused
on knowledge and skills for clinical services rather than the skills needed for the
health systems to work. In order to stimulate better performance of health
workers, the whole range of basic HRM strategies must be routinely
implemented. These strategies include those for effective manpower planning,
procurement, preparation and maintenance with emphasis on leadership and
team-building. Human resource for health supervisors need to establish a work
environment where the needs of health workers are harmonised with
organisational demands, leading to the creation of a purposeful, willing,
harmonious and well-motivated work team (Manuwa-Olumide 2009:9; Mbindyo
et al 2009:[5]). This is not an easy task especially in districts where many cadres
of staff from different backgrounds have to work together. Hence, managers
must give priority to ensure that health practitioners understand the vision,
mission and objectives, feel recognised and valued, participate in decision
making, work as a team, develop through mentoring, coaching, training, advance
in their careers, are supervised supportively and are constantly monitored and
evaluated, are given feedback, and rewarded or sanctioned as appropriate
(Boyne & Walker 2005:485; Mbindyo et al 2009:[9]; WHO 2006:85).
The assessment of facility performance is becoming more common, but
experience is still scarce in low income settings. For example, Malawi introduced
the performance contract scheme while Zambia introduced the performance
improvement review system. In both cases the effectiveness of the performance
audit and feedback is not well known (Shaw 2005:98). A study on performance
management of district health managers in nine Latin American countries reports
that teamwork is difficult to introduce into a health system that promotes
hierarchical structure and favours an authoritative management style (Diaz-
Monsalve 2003:301).

76
2.5.3.3.3 Empower middle and lower level managers to take full responsibility of health service delivery
Giving local health managers the liberty to allocate resources can contribute to
positive personnel and health facility performance. In Uganda, although
decentralisation of health services has taken place and local health facility
managers have been given responsibility for service delivery, they are not given
enough power over funds and human resources. This often affects local
performance. High level managers have to ensure that the culture of
accountability is developed at all levels. This is a difficult task, given the current
culture of corruption in many African countries including Uganda. There is a
need to start by educating the communities to know what they should expect
from their health providers and that the communities have the right to hold health
workers accountable for their actions (de Savigny, Kasale, Mbuya & Reid
2004:3; George 2002:1; Manuwa-Olumide 2009:10). In Uganda for example, the
performance of the health districts is ranked and the results are published in the
annual health sector reports (WHO 2006:86). Formal mechanisms for handling
allegations against health providers can also be effective but are very difficult to
implement successfully in developing countries (Bhat 1996:265; Mbindyo et al
2009:[9]).
2.6 PERFORMANCE MANAGEMENT
Performance management has been adopted recently into the health sector. It is
one of the crucial functions of HRM. Performance management meant to
establish a system that can help managers to improve the effectiveness of their
workforce. Recently the competitiveness of many institutions and business
enterprises is based on the capability of employees to apply their knowledge and
skills to produce favourable results (Luecke 2006: xii-xiii).
Authors attach different meanings to performance management. Luecke
(2006:140) defines performance management as „…the methods used to
measure and improve the effectiveness of workers in their institutions‟. Noe et al

77
(2008:343) define performance management as „...the process through which
managers ensure that the activities and outputs of the workers are aligned with
the organisation‟s strategy‟. This definition emphasises the need for performance
management to support the strategy of the organisation. Another scholar
(Aguinis 2009:1) describes performance management as „…a continuous
process of identifying, measuring, and developing the performance of individuals
and teams and aligning that performance with the strategic goals of the
organisation‟. Armstrong (2009:618) describes performance management as
„…a systematic process for improving organisational performance by developing
the performance of individuals and teams‟. It is widely believed that performance
management systems are based on consideration of both the behaviours and
results.
Armstrong (2009:618) emphasises three main concerns of performance
management and these are:
matching individual and organisational objectives as well as encouraging
workers to support the core values of the organisation;
enabling the expectations of the managers and their subordinates to be
defined and agreed in terms of roles, responsibilities, accountabilities, skills,
and behaviours; and
providing individuals with prospects to realise their own goals and develop
their professional careers.
2.6.1 The functions of performance management
Noe et al (2008:346) asserts that a performance management system has three
(3) main functions which include:
strategic;
administrative; and
developmental functions.

78
2.6.1.1 Strategic function
Performance management system serves to link the workers‟ performance to the
overall organisational strategy and objectives. However, research shows that few
institutions understand and utilise performance management to support the
organisational strategy. This strategic purpose may be achieved through
designing an evaluation system that defines the performance of health workers
in terms of the organisation‟s strategies and goals. Nevertheless, performance
management systems should be sufficiently flexible to adjust to the changes that
may occur in the organisation‟s strategic goals (Armstrong 2009:619; Noe et al
2008:346).
2.6.1.2 Administrative function
Performance management provides useful information which may assist
organisations in decision-making. For example, organisations may use the
performance information derived during staff appraisals to decide on things like
salary increments, promotions and terminations in service, lay-offs, and
recognition of achievements (Noe et al 2008:347). Despite the importance of
these decisions, some managers in the health sectors see performance
appraisal as a compulsory burden through which they must go to fulfil their job
requirements. Some health service managers may feel uncomfortable evaluating
others and giving them feedback. Hence, these health service managers may
highly rate every worker or at least rate them the same, rendering performance
appraisal information worthless (Armstrong 2009:618; Longenecker 1987:183;
Noe et al 2008:347).
2.6.1.3 Developmental function
Performance management provides information about the strengths and
weaknesses of health workers. By so doing, the workers‟ development needs
are identified. When the workers are not performing according to the

79
expectations, performance management seeks to improve their performance.
The feedback given during performance evaluation often identifies the
weaknesses of workers. Not only does the performance evaluation identify
weaknesses but also the causes of those deficiencies such as skills and
motivational inadequacies (Armstrong 2009:620; Noe et al 2008:348).
Bernardin, Hagan, Kane and Villanova (1998:15), Lawler and McDermott
(2003:49-50), and Noe et al (2008:348-351), mention that in order for
performance management systems to effectively meet the strategic,
administrative and developmental functions the following should occur:
Ensure that the organisational doctrines are incorporated into the system.
There should be noticeable senior management support.
The key organisation performance measures should be clearly defined.
Job descriptions should be linked to the performance management system.
Ensure that performance management system assesses workers fairly and
objectively based on clearly understood standards.
Managers should be trained on how to use the performance management
tools and how to effectively give feedback.
Link appraisal to total rewards and recognition system.
Personnel training and development plans should be linked to the results of
performance appraisals.
Performance management system should be evaluated for its effectiveness
in tansforming organisations..
Based on the evaluations, the performance management system should be
adjusted as required.
Authors like Luecke (2006:xiii) point out that everyone in the organisation
benefits when there is effective performance management. For example;
Clients and patients will observe better health outcomes and results because
the health workers are of top-quality and working in unison towards key
strategic goals.

80
Supervisors are more successful, because their subordinates are doing the
right things.
The workers experience greater job security, career improvement, and better
remunerations, thanks to outstanding performance.
2.6.2 Performance management process
Performance management process is essentially about measuring, analysing,
and improving the performance of workers as a contribution to the overall
organisational performance. While staff and organisational performance are
closely inter-related, the nature of the relationship is complex and subject to
many external variables (Armstrong 2009:621; Landrum & Baker 2004:14;
Martinez 2001:4).
Aguinis and Pierce (2008:141) describe the performance management process
as „…an ongoing process that involves the following stages: prerequisites,
performance planning, performance execution, performance assessment,
performance review, and performance renewal and re-contracting‟. Luecke
(2006: xii) on the other hand describes performance management process as
composed of several activities including goal setting, tracking changes,
coaching, motivation, appraisal, and employee development. These processes
usually take place in a cyclical and on-going approach.
Aguinis and Pierce (2008:141) mention that the first stage of prerequisites refers
to having the knowledge of the organisation‟s mission, strategic goals, and the
job in question. Performance planning stage involves a discussion and
agreements between the appraiser or supervisor and the worker (appraisee),
regarding what needs to be done and how it should be done (consideration of
both behaviours and results) as well as the development plan of workers. During
the performance execution stage, the worker strives to produce results and
display behaviours that were agreed upon earlier during the planning phase as
well as to work on the developmental needs (Aguinis & Pierce 2008:141).

81
Performance assessment is a two way process that engages both the
supervisors and their surbodinates. This assessment is aimed at reviewing
whether the targeted outcomes have been achieved and examining the extent to
which the desired behaviours have been displayed. Many sources can be used
to collect the performance information (such as peers, clients, managers, and
suppliers), in most cases the immediate supervisor provides the information.
This also includes an evaluation of the extent to which the goals stated in the
organisation‟s development plan have been achieved (Aguinis & Pierce
2008:141).
During the performance review stage, a meeting takes place between the
workers and their superiors to review their assessments. This meeting is refered
to as „appraisal meeting or discussion‟. The meeting provides an official setting
through which the employee receives feedback about his or her performance.
The final stage of performance process is the renewal or re-contracting. This
stage is almost similar to the initial planning component. The only difference is
that renewal and re-contracting stage uses information gained from other phases
of the performance management process (Aguinis & Pierce 2008:141;
Armstrong 2009:626).
2.6.3 Performance appraisal
Performance appraisal is defined by Luecke (2006:78) as „…a formal method for
assessing how well an employee is doing with respect to assigned goals‟.
Üstünlüoğlu (2009:118) also describes performance appraisal and evaluation as
„…the identification, measurement and management of employee performance
in organisations which provides individuals with useful feedback and coaches
them to higher levels of performance‟. Armstrong (2009:618) describes
performance appraisal as a formal assessment and rating of individuals by their
managers at and after a review meeting. The primary goal of performance
appraisal is to provide feedback to employees on how well they are doing their
work and to provide direction for future development and accomplishments.
Performance appraisal is generally conducted annually, with follow-ups as

82
required. Just like a physical examination conducted by a doctor, this annual
check-up gives the manager an opportunity to spot the performance problems
before they become serious and to encourage the continuation of good work.
Additionally, performance appraisal also helps the workers and managers to
focus on the goals and performance expectations that affect salary, merit
increase, and promotions (Luecke 2006:79).
2.6.3.1 The purpose of performance appraisals
Various authors (Armstrong 2009:629; Hornby & Forte 2002:2; Luecke 2006:79;
Üstünlüoğlu 2009:119) discuss the main reasons for measuring performance.
Performance appraisal serves as a tool for managers to:
identify who is eligible for promotions and salary increments;
recognise training and development needs for the workers;
provide feedback required for improvement;
place workers according to their ability;
document the reasons for punitive actions, and in some situations assist in
defence of actions which may be legally challenged;
encourage goal setting for future accomplishments and measure attainment.
This assists employees to advance their job skills and knowledge; and
inspire workers in their routine work.
2.6.3.2 The differences between performance management and performance appraisals
There are many differences between performance management and
performance appraisal. First, in contrast to performance management,
performance appraisal does not generally include strategic business
consideration. Second, performance appraisal usually does not include wide-
ranging and on-going feedback that employee worker can exploit to improve
performance. Third, performance appraisal is normally an annual event that is
often driven by the HR departments, while performance management is a

83
constant way of managing business that is driven by managers (Aguinis & Pierce
2008:140; Armstrong 2009:619). Generally, performance appraisal is seen as a
prerequisite for the HR department. It does not characteristically include
business and strategic consideration, while performance management can be a
tool that helps organisational performance.
Noe et al (2008:343) emphasise that performance appraisal is only a component
of performance management since it involves the administrative and relatively
isolated duty of measuring aspects of the worker‟s performance. Performance
management is a broader than performance appraisal because it provides not
only for the measurement of performance but also defines performance
according to organisational goals as well as providing performance feedback.
2.6.3.3 The characteristics of an effective performance appraisal system
Noe et al (2008:354) mention the following characteristics of a good appraisal
programme. The appraisal system should have:
a system for evaluating specific job roles;
recognised performance standard for all the rated tasks;
standards that are specific, clear, and measurable;
statement of expected standards of every worker at the beginning of the
appraisal period;
a mechanism of recording performance to show why standards were attained
or not;
a plan for training supervisors in defining, preparing and using the
performance appraisal tools;
a procedure which can be used by the workers to respond to appraisal
results;
a mechanism for supervisors to acknowledge that the rationale of the
appraisal is to motivate workers and guide them in their quest for personal
improvement, and help them resolve problems; and

84
a procedure that does not necessarily overstrain the managers (Noe et al
2008:354).
2.6.4 Performance measurement
Measurement and evaluation are often used to strengthen and improve
performance practices. Kruk and Freedman (2008:265) describe performance
measurement as „…the periodic assessment of progress toward explicit short
and long term objectives and the reporting of the results to decision-makers in
attempt to improve performance‟. Performance measurement provides quality
information to decision-makers so that they can determine whether their efforts
are on course, and inform the political leadership and citizens who are entitled to
regular reports on the performance (Kruk & Freedman 2008:264).
Performance measurement helps managers to understand whether their health
programmes are succeeding or failing by pointing out potential management
challenges when the performance indicators do not show the desired results.
Performance measurement encourages managers to take initiatives, to be
responsible, and to explain the expectations and desires of the policy-makers
(Armstrong 2009:623; Cook, Vansant, Stewart & Adrian 1995:1304; Kruk &
Freedman 2008: 265).
Usually health and development programmes require timely and quality
information. However, most performance reports in the health sector continue to
focus on the amount of resources spent and the quantity of services given rather
than the quality and the results achieved. Some writers like Kruk and Freedman
(2008:270) and Wholey and Hatry (1992:604) mention that performance
measurement should focus mainly on programme quality and on the results
achieved through the use of public funds and other resources.
The recognition that new and fundamental changes in the management of health
care are essential for the achievement of higher levels of performance has
increased the importance of performance measurement. Most of these changes

85
were brought by the health sector reforms. The reinforcement of reform in the
management of health workforce is the basis for successful health sector
performance. This reinforcement also referred to as human resource
development (HRD) is focussed on improving the institutional performance
through the establishment of a dependable health workforce (Hornby & Forte
2002:2; Kruk & Freedman 2008:269).
2.6.4.1 The uses of performance measurement
Effective performance measurement systems have a number of applications.
Cook et al (1995:1304), Kruk and Freedman (2008:263), and Smith, Mossialos
and Papanicolas (2008:1) point out that performance measurement system is
used to formulate budgets, distribute resources, encourage workers, improve
services, and facilitate information flow between the people and governments.
These authors further argue that performance measurement can help to improve
integrity and in acquiring resources needed to maintain and enhance health
programmes. The authors emphasise that performance measurement should be
used for self-assessment and improvement, not simply auditing and monitoring.
Additionally, performance measurement needs focus on how to improve the
health programmes, and not dwell excessively on individual job performance.
Performance measurement enables an organisation to monitor its successes in
achieving the strategic goals and objectives, and in achieving desirable
outcomes. Performance measurement is closely linked to organisation‟s
strategic plans, goals and objectives, and information analysis for decision-
making (Cook et al 1995:1304; Kruk & Freedman 2008:268; Smith et al 2008:1).
There is no dearth of opinions concerning the significance of performance
measurement in strategic management. As Cannon and Fry (1992:3) said,
„…what gets measured gets managed‟. It is a good management practice to find
out how well the workforce and the programmes are performing, and to use this
information for programme planning, implementation, and improvement. The key
assumption of this argument is that performance measurement makes good

86
sense if the tools for doing it are available, and such tools are used to gather
information. Getting managers to use performance data to manage their
programmes is a big challenge in many organisations including health sectors.
Therefore, for performance appraisal to be successful the organisation must
commit the necessary financial and human resources. This will facilitate
successful achievement of the desired outcomes, and ensure that all
stakeholders know the goals and objectives to be achieved (Halachmi 2002:232;
Kruk & Freedman 2008:273; Smith et al 2008:1).
2.6.4.2 Performance standards
The American Correctional Academy (ACA) (2010:5) describes a performance
standard as „…a statement that clearly defines the required or essential
condition to be achieved and maintained‟. Katz and Green (1997:9) define a
standard as „…a written value statement of rules, conditions, and actions in
patient care that is sanctioned by an appropriate authority‟. Therefore, a
performance standard describes a state of being and activities or practices that
might be necessary to achieve compliance. Performance standards reflect the
organisation‟s overall mission and purpose and contribute to the realisation of
the articulated goals (American Correctional Academy 2010:2). Nocochea and
Fort (2003:13) mention that standards should be based on solid foundation of
evidence and should be developed with input from various stakeholders,
management cadres, and health workers themselves. It is however observed
that most developing countries are constrained by lack of standard practice,
outdated norms and standards. In addition, institutional capacity to provide
evidence-based information to guide the development of performance standards
(Nocochea & Fort 2003:9).
The processes used to evaluate and improve the quality of health care have
evolved from techniques used to manage quality in other industries such as
Total Quality Management (TQM). Just as product quality and cost are the
primary concerns assessed in industrial settings, measures of accessibility and
appropriateness of health care, technical competence, patient satisfaction,

87
medical costs, and medical outcomes are objects of quality improvement efforts
in health sector (Heizer & Render 2008:212; Panzer & Cronin 1993:85). Quality
and performance information can also be used to guide consumer choice, to
satisfy regulatory requirements, and to identify best practices, and priorities for
improvement (Adair, Simpson, Casebeer, Birdsell, Hayden & Lewis 2006:92). To
evaluate medical care systems, many health service researchers utilise a model
that groups data about health care delivery into three dimensions: structural,
processes, and outcomes. The characteristics of health care in each of these
dimensions can be analysed separately according to specific measures. The
combination of these types of data provides a complete picture of the quality of
care within a health care system (Adair et al 2006:92; Pransky, Benjamin &
Dembe 2001:296; Smith et al 2008:9).
Overall, the performance standards should be measurable and known to both
the supervisor and employee. Three types of standards are identified namely;
structural, process and outcome standards.
Structural standards
Structural standards refer to the material and social instruments used to provide
care. Structural attributes of health care delivery include: the organisation and
setting of care; financial, regulatory and administrative systems; available
resources; and the composition of the provider networks (Pransky et al
2001:296; Smith et al 2008:3).
Process standards
Processes in health care are those activities involving the delivery of health
services, including the actual procedures involved in providing care, patient-
provider relationships, diagnostic and treatment choices, accessibility as well as
the aptness of care. Thus, process norms are written standards that transform
the organisation‟s value into interventions and actions (Adair et al 2006:92;
Pransky et al 2001:296; Smith et al 2008:5).

88
Outcome standards
Smith et al (2008:4) describe treatment outcomes as the changes that occur in
health status of individuals or communities as direct results of the health care
processes or its structures. Structures and processes must be measured since
no medical care could be provided without them. However, the ultimate
assessment of quality is the outcome of treatment offered to patients. Therefore,
the outcome standards deal with the expected or desired outcomes of
interventions or results that must be achieved, for example, the change in patient
status after treatment (Adair et al 2006:92; Pransky et al 2001:296; Smith et al
2008:4-5).
Rafferty, Maben, West and Robinson (2005:16) stress that until the 1990s,
quality improvement efforts were directed towards structural and process
standards. However, there has been a gradual change to emphasise patient
outcome standards. It is important to ensure that all performance standards are
described precisely so that they contain all the key components of what is being
assessed and the criteria upon which the assessment is based. Rafferty et al
(2005:17) state that the agreed description of standards should be „SMART’.
S - Stated concretely and specifically,
M - Meaningful and practically measurable,
A - Agreed upon between the managers and workers,
R - Realistic, achievable, and based on sound rationale,
T - Time related and achievable in a defined period.
2.6.4.3 Performance indicators
Indicators are necessary to measure performance of health systems.
Bankauskaite and Dargent (2007:126) mention that performance indicators are
employed for four basic functions: facilitating accountability; monitoring health
care systems and services as a regulatory responsibility; modifying the
behaviour of professionals and organisations at both macro (population) and

89
micro (patient) level; and forming policy initiatives. The indicators are mainly
outcome measures and less frequently process measures (Arah, Klazinga,
Delnoij, Ten-Asbroek & Custers 2003:377; Bankauskaite & Dargent 2007:126).
The WHO (2000:24) emphasises the importance of health systems as being
more outcome-oriented. In view of this, Katz and Green (1997:106) describe
performance indicators as specific type of performance outcomes based on
reliable, quantitative process or outcome measure. These are related to one of
the dimensions of performance such as efficiency, effectiveness, efficacy,
appropriateness, timeliness, availability, continuity, safety, and responsiveness.
Hence, the performance of the health system depends on the knowledge, skills
and motivation of the people responsible for delivering the services (WHO
2003:7).
Boyce (2002:229) describes healthcare performance indicators as „…statistics or
other units of information which reflect, directly or indirectly the performance of
health care system in maintaining or increasing the well-being of its target
population‟. Hornby and Forte (2002:1) go further to describe performance
indicators „…as tools that monitor and enhance the performance of an
organisation in general, including at the clinical level‟. The indicators that are
related to patient care are called clinical indicators (Katz & Green 1997:106). A
clinical indicator is „…a quantitative measure that can be used to measure and
evaluate the quality of patient care and support services‟ (Katz & Green
1997:106). Nonetheless, this is not a direct measure of quality; rather it is a flag
that points to specific issues that require intensive review. The WHO (2005a:13)
mentions that these performance indicators quantitatively measure whether an
initiative has achieved the stated goals for the performance of the health
systems.
Human resource performance indicators on the other hand are concerned with
the development and utilisation of staff in an organisation. These indicators are
designed to monitor the levels of organisational and workers‟ performance.
Hornby and Forte (2002:1) explain the usefulness of performance indicators in
modern health care management. These include:

90
Achieving business-oriented and objective-based management techniques.
Building organisations that learn through measuring and supervising their
performance.
Initiating management processes that support the core values of the
organisation.
Relating achievements, outputs and outcomes to available resources.
Empowering the workforce to improve their performance through
performance management (Awases 2006:66; Hornby & Forte 2002:2; Smith
et al 2008:5).
Evaluating performance involves setting goals and targets to be achieved by
managers and their surbordinates. By design, it is believed that measuring
performance of health systems leads to performance improvement (WHO
2005b:5). Realistically this may not always be true. Mullen (2004:217) mentions
that there is proof indicating that some performance indicators that endorse
employee judgement may be a disincentive and detrimental to performance. On
the positive note, indicators that promote professional values, learning,
investigations, and trust have a desirable impact on performance. It follows that,
approaches that involve judgement, obligatory performance improvement, table
ratings, and mistrust have negative effects on performance (Awases 2006:66;
Mullen 2004:226).
2.6.5 Approaches to measuring performance
Noe et al (2008:355) describe the five main approaches for measuring
performance of workers. These include:
comparative approach;
attribute approach;
behavioural approach;
results approach; and
quality approach.
All these approaches to performance measurement have their own strengths
and weaknesses.

91
2.6.5.1 Comparative approach
This approach measures employee‟s performance by comparing his/her
performance to the performance of others. There are three techniques in this
category. The first is ranking, „…where the appraiser ranks his subordinates from
the best performer to the worst‟. Second is forced distribution „…where
employees are ranked in groups. Third is the paired comparison „…where the
supervisor compares every employee with every other employee in the work
group, giving an employee a score of one every time she/he is considered to be
a higher performer‟. The main strength of the comparative approach is that it is
useful when employee performance needs to be differentiated. It also eliminates
the problems of leniency, strictness, and central tendency (Armstrong 2009:632;
Noe et al 2008:359).
Despite its strength this approach has its drawbacks which are:
The techniques are not linked to the overall strategy of the organisation.
The ratings are subjective and therefore the validity and the reliability of the
assessment are dependent on the appraiser.
The techniques do not provide specific information necessary for feedback
purposes.
The techniques do not measure performance against absolute standards of
performance (Noe et al 2008:359).
2.6.5.2 The attribute approach
Noe et al (2008:359-360) mention that this approach focuses on identification of
employee characteristics necessary for the organisational success and the
employee performance is measured according to those features. This approach
include the graphic rating scale where the supervisor rates the subordinate on a
particular trait and characteristic and the mixed standard scales. The strengths of
the attribute-based approaches are:

92
They are easy to develop and apply across a range of jobs.
If designed properly, they can be reliable and valid (Noe et al 2008:362).
The weaknesses of attribute-based approaches for measuring performance
include:
The techniques provide little strategic congruence.
Performance standards are usually vague and may be interpreted differently
by different appraisers (hence low validity and reliability).
The techniques do not provide specific and relevant performance feedback
information.
The techniques may bring defensiveness in employees (Noe et al 2008:362).
2.6.5.3 The behavioural approach
This appraisal technique defines behaviours necessary for effective performance
in a particular job. When the supervisor is assessing performance, he/she
identifies the extent to which the subordinate has exhibited the required
behaviours. Examples of behavioural approaches include: critical incidents,
behaviour anchored rating scales, behaviour observation scales, organisational
behaviour modification and assessment centres (Noe et al 2008:362-366).
The strengths of the behavioural approach include:
It provides the linkage between the organisational strategy and the
behaviours required of the employee for strategy implementation.
It provides employees with specific feedback about their performance.
Acceptability of this approach by employees and managers is usually high.
The techniques used rely on thorough job analysis which ensures reliability
and validity (Noe et al 2008:366).
The weaknesses of the behavioural approach include:

93
Behaviours measured need to be monitored and revised regularly to ensure
that they are linked to the organisational strategy;
It assumes that there is one best way to do the job; and
It is least suited to complex jobs (Noe et al 2008:366).
2.6.5.4 The results approach
The results approach is based on the premise that results are the best indicators
of how worker‟s performance has contributed to the organisational success (Noe
et al 2008:367). The results-based techniques include: management by
objectives (MBO) „…where goal setting is cascaded down throughout the
organisation and the goals become the standards against which an employee‟s
performance is measured‟. Another type is the productivity measurement and
evaluation systems (ProMES) „…which involves a process of motivating
employees to higher productivity‟ (Noe et al 2008:367). The last technique is the
balanced scorecard (BSC) method.
The BSC concept was first introduced by Kaplan and Norton (1992:71) in
Harvard Business Review. The concept of balanced scorecard is very relevant in
the present era of emerging global competition where the organisations are
facing increasingly knowledgeable and demanding customers. The BSC method
gives an insight into the organisational performance by integrating financial
measures with other key indicators around the client perspectives, internal
business processes, and organisational growth, learning and innovation. It
enables the organisation to track short-term financial and operating results while
monitoring progress for future growth, development, and success. The balanced
scorecard is a strategic management system that enables organisations to clarify
their vision and strategy and translate them into action. When fully deployed the
balanced scorecard transforms strategic planning from an academic exercise
into a nerve centre for the organisation (Ghosh & Mukherjee 2006:61-62; Popa
2009:215-216).

94
In Afghanistan, for example, the BSC has proved to be a useful tool for the
Ministry and NGOs working in the health sector. It has become one of the
foundations of the government‟s monitoring and evaluation system. The BSC
has helped health stakeholders to focus on specific areas where performance is
inadequate. The national perfomance results, the provincial results are
disseminated to all the stakeholders in order to compare their perfomance.This
guides the provincial medical directors to recognise the weak areas and to
establish performance targets. The BSC provides a powerful tool that signals
how efficient the delivery of the essential health package is at all levels.
However, some of the shortcomings that were identified in Afghanistan with
regard to the use of BSC approach is that it is expensive and does not offer
explanations for the observed differences in performance across the provinces
(Peters, Noor, Singh, Kakar, Hansen & Burnham 2007:149).
Snell and Bohlander (2007:358-359) point out that the BSC method enables
managers to translate organisational goals into business units, teams, and
individual employee goals. The appraiser considers four related categories that
include financial, customer, process and learning. Kaplan and Norton (1992:79)
argue that the success of the BSC is that it is the first management approach
that links vision and strategy to employees‟ everyday actions by translating the
abstract strategy into clear priorities and initiatives and relating them to
comprehensible and tangible outcomes. Therefore, the organisation and its
employees have to strive for satisfied shareholders, delighted customers,
efficient and effective processes, and a motivated workforce. Hence, the BSC
„makes strategy everyone‟s job‟ (De Waal 2003:31; Peters et al 2007:148).
In an interview with De Waal (2003:31), Kaplan argues that the BSC will still be
in use even in 10 years (2013) following the interview which is documented in
the journal article. However, he point outs that it is likely that the BSC will
increasingly be used together with the „strategic map‟ which will assist the
organisations and employees to fully understand and implement their strategy
(De Waal 2003:33). According to De Waal (2003:34) the strategy map is „…a
logical architecture that defines strategy by specifying the relationships between

95
shareholders, customers, business processes and competencies‟. The strategic
map makes sure that the BSC is linked to the organisation‟s strategy.
The results approach has a number of strengths which include:
Minimisation of subjectivity as objectives and quantifiable indicators are used.
It is highly acceptable to both supervisors and subordinates.
Employee performance is linked to organisational strategy (Noe et al
2008:369).
The disadvantages of the results approach include:
Objective measurements may be influenced by exernal factors that are
beyond the control of the worker.
The workers may only focus on the performance criteria against which they
are to be evaluated (Noe et al 2008:369).
2.6.5.5 The quality approach
The focus of the quality approach is to improve customer satisfaction through
customer-orientation and the prevention of errors (Noe et al 2008:370). The
design of a quality-based performance management system focuses on:
the assessment of employee and system factors;
the relationship between the managers and employees in solving
performance problems;
internal and external customers in setting standards and measuring
performance; and
using a number of sources to evaluate employee and system factors (Noe et
al 2008: 374).
The strengths of quality approach include:
96
it incorporates and capitalises on the strengths of both the attribute and
results approaches for performance measurement; and
it adopts a systems approach to performance measurement.
One of the possible shortcomings of this approach is that the organisations may
be reluctant to implement it due to their long established use of the traditional
approaches (Noe et al 2008:374).
2.6.5.6 The multi-rater approach (360-degree feedback)
The multi-rater approach is also referred to as „360-degree feedback system‟.
According to Luecke (2006:140), the 360-degree feedback is „…a personal
assessment tool used to systematically collect information about employee‟s
behaviour and performance from key people who interact with him/her.
Armstrong (2009:644) defines 360-degree feedback as „…a process in which
someone‟s performance is assessed and feedback given by a number of
people‟. These people may include managers, peers, patients, and suppliers.
The objective is to establish what it is like working for the organisations or with
the individuals and to identify his strengths and weaknesses.
Armstrong (2009:644) mentions that 360-degree feedback is important in:
supporting the workers‟ training and development plans;
supporting HR procedures such as appraisal and planning for the scarce
resources; and
supporting compensation resolutions.
Snell and Bohlander (2007:343) explain that many organisations adopt a 360-
degree feedback approach to performance measurement where information on
an employee‟s performance is not provided by the employee‟s immediate
supervisors, but by those he deals with on a daily basis such as clients,
subordinates, co-workers, and suppliers. Nel et al (2008:497) mention that the
360-degree approach involves the administration of a questionnaire to

97
individuals with whom the employee interacts, in which they indicate how well
the employee performs in number behavioural areas. This approach allows
employees to receive an accurate view of their performance as „different people
see different things‟.
The strengths of the 360-degree feedback approach are:
it is comprehensive since the employee is appraised from multiple
perspectives;
the data produced is of high quality;
it emphasises the use of both the internal and external clients in the
appraisal;
bias and prejudice are minimised as the appraisal reports are not dependent
on one person‟s analysis; and
feedback from people other than supervisors contributes considerably to an
worker‟s development (Armstrong 2009:646; Snell & Bohlander 2007:345).
The weaknesses of the 360-degree feedback approach include:
it is a complex system in that numerous appraisals need to be combined;
it can be frightening, resulting in resentment from the worker being assessed;
appraisals from differing individuals may be different and confusing
considerable training is required to ensure that the system works as it should;
employees could undermine the reliability of the approach through colluding
in terms of the appraisal which they are to give to each other; and
over-reliance on technology and lack of action following feedback (Armstrong
2009:646; Snell & Bohlander 2007:345).
2.6.5.7 Mistakes made by appraisers during performance measurement
Human beings have limitations in processing information which may result in
distortion of performance appraisal results. Once this happens, the performance

98
appraisals lose their effectiveness. Noe et al (2008:377-379) points out the
following common appraiser mistakes:
Recent events: the appraiser recalls recent events rather than summing up
events in the entire appraisal period.
First impression: the appraiser remembers only the initial impression.
Halo and horns effects: the appraisers fail to distinguish among different
aspects of performance. The appraiser may rate a worker low or high on all
items because of one attribute. Halo mistake leads to workers thinking that
no aspects of their performance need improvement. Horns mistake leads to
frustration and defensiveness among the workers.
Central tendency: this is the reluctance of the appraisers to rate workers at
either end of the spectrum but to rate the workers as average or satisfactory.
Similar to me effect: this occurs when the appraisers rate workers with
similar attributes higher than justified by performance.
Contrast effect: the appraiser compares an individual worker‟s performance
with that of others when it should be an individual performance.
Stereotyping: this is a tendency to judge individuals on the basis of
perceptions about the group.
Failure to define the expected standards of performance which leads to
differences on how workers and supervisors perceive the appraisals.
Evaluating the aspects that are not part of the work or position.
Rushing through the appraisal with the worker and not giving the worker a the
chance to ask or answer questions.
Evaluating the worker on aspects over which she/he has no control ,
Appraisal politics: the appraiser purposefully distorts rating to achieve
personal goals. This is likely to occur if the top management in an
organisation tolerate distortion or are complacent to it (Noe et al 2008:377-
378).
Although it is very difficult to completely eliminate these mistakes in performance
appraisal or measurement, Noe et al (2008:380) and Armstrong (2009:631-632)
propose the following ways for managers minimise them:

99
Train supervisors on proper use of the appraisal tools.
Encourage top management support for appraisal systems and vigorously
discourage distortion.
Give appraisers some autonomy to modify performance objectives and the
criteria for their appraisees.
Recognise the workers‟ accomplishments that are not self-promoted.
Ensure that constraints such as the lack of funds do not drive the appraisal
process.
Ensure that appraisal procedures are consistent throughout the organisation.
Promote a climate of openness to encourage workers to be honest about
their weaknesses (Armstrong 2009:631; Noe et al 2008:380).
2.6.5.8 The causes of failure in performance appraisal
According to Luecke (2006:79), performance appraisals are meant to
communicate personal goals, motivate good performance, provide constructive
feedback, and set the stage for an effective development plan. On many
occasions, however, performance appraisals fail to achieve their intended
objectives.
Authors like Hornby and Forte (2002:1), Luecke (2006:79), and McConnell
(2002:183-185) point out the following reasons that lead to failure of appraisals:
Feeling of guilt: some supervisors are not confident in making judgement
about the performance of their surbordinates.. This might make the
superviors nervous and which results in giving high ratings to all the workers.
This could potentially have a negative effect compensation, promotions and
job security of the workers. In order to avoid the potential liabilities
supervisors must prevail over their personal feelings and give honest
perfomance ratings.
Ineffective use of performance standards: Over-estimating of perfomance
occurs when the appraisers do not have a clear understanding of the job

100
requirements and the standards applied. Some supervisors often view ratings
of „satisfactory‟ or average as being negative. In order to have an effective
appraisal system, the supervisor and the worker must understand the job
requirements, understand the meaning of each rating, and must be willing to
make the tough decisions to ensure honest and accurate perfomance
ratings.
Lack of responsibility for accurate perfomance results: some superviors
appraise their workers without considering the rationale of the appraisal
process simply because they are not held answerable for the accurateness of
the appraisal results. This may result in high ratings for all workers. It is
imperative that superviors conduct truthful appraisals, set goals and coach
their workforce based on the perfomance appraisal results. Every supervisor
must be held responsible for preparing accurate performance appraisals.
Effective performance appraisal takes time and energy, and should be on-
going.
Lack of impartiality and fear to hurt feelings of others: some supervisors feel
uncomfortable to point out the worker‟s performance deficiencies for the fear
of comprising their relationship. However, it has to be remembered that
performance appraisal systems are intended to provide accurate and honest
feedback to workers. Inacurrate rating of workers may fail to recognise the
areas where employees need assistance in growth and development. This
would therefore hamper the worker‟s chances for promotions and
compensation in future.
Incomplete data: incomplete appraisal information gathering and using limited
criteria for assesement can create a false representation of perfomance.
Unfocused criticisms: some superviors may give general comments about
perfomance and may evaluate an employee on aspects over which she/he
has no control (Hornby & Forte 2002:1; Luecke 2006:79; McConnell
2002:183-185).
2.6.6 Performance appraisal feedback
Noe et al (2008:380) define feedback as “…the information that employees
receive while they are performing concerning how well they are meeting the

101
objectives‟. Therefore, performance management provides an opportunity for
feedback to be presented to workers so that they can correct any deficiency in
their performance. Giving and receiving performance feedback is an essential
part of coaching and management in general (Luecke 2006:55). The
performance feedback process is complex and provokes anxiety for both the
managers and employees. Researchers like Adams (2005:24), Luecke
(2006:55), Rafferty et al (2005:30), and Rowe et al (2005:1030), emphasise the
importance of feedback on both success and failure of reinforcing the
performance behaviour. They further highlight the need for effective and
immediate feedback. Feedback works well when it related to specific
performance standards and should be given as soon as the behaviour has been
observed. At the same time, it should be provided in a way that will contribute to
improvement in performance (Luecke 2006:55). The nature of feedback varies
with the situation. It may take the form of an interview between the supervisor
and the employee. The other forms of giving performance feedback include
written communication such as incident reports, oral communication such as
counselling and coaching (Luecke 2006:55).
The role of managers in providing effective performance feedback cannot be
overlooked. Rowe et al (2005:1028) and Martinez (2003:210) point out that some
supervisors or managers lack the skills to effectively communicate performance
appraisal results to their subordinates. In some situations the performance
appraisal results are kept confidential and not communicated to the staff member
concerned. If employees are not made aware of how their performance is not
meeting expectations, their performance will certainly not improve. In fact it may
get worse.
Noe et al (2008:382-383), Luecke (2006:56), and Armstrong (2009:627-629),
describe the following as the most effective way of dealing with performance
feedback:
Feedback should be given constantly and not only once a year: This enables
employees to correct the mistakes immediately and helps them to know how
their final evaluation is likely to be.

102
Create the right environment for discussion: managers choose a neutral
position when giving the feedback and at the same time conducting the
meeting in form of dialogue and not confrontation.
Recognise effective performance through praise: the purpose of the feedback
is to give precise performance information which includes recognising
effective as well as poor performance. Praising therefore provides
reinforcement of some good performance behaviours (Armstrong 2009:628).
Encourage self-evaluation from the employee prior to the feedback: self-
assessment before the feedback can be very productive. It encourages the
workers to think of their weaknesses (Armstrong 2009:628).
Encourage the employee to participate in the feedback session: when the
workers actively participate in the feedback sessions they are always
satisfied with the process. Participation includes giving the workers a chance
to voice their opinions of the performance evaluation and to discuss their
performance goals.
Focus on solving problems: the feedback sessions should not be used for
criticising poor performance, rather, the session is meant finding solutions to
fixing unsatisfactory performance. It is equally important to reinforce feedback
on good performance. This helps to build confidence among the workers
(Armstrong 2009:628; Luecke 2006:56).
Focus on behaviour or results and not character, attitude, or personality: this
practice minimises the feeling that the worker is personally attacked. A
person who feels under attack will not learn.
Minimise criticisms: an effective manager should resist the temptation of
focusing on condemnations.
Jointly agree with the subordinate on specific goals and set a date for the
next review meeting: setting goals is one of the most effective motivators of
performance. Research has demonstrated that this results in increased
satisfaction, motivation to improve, and performance improvement
(Armstrong 2009:629; Klein, Snell & Wexley 1987:267). Besides setting goals
the supervisor must also be specific about the follow-up date to review
performance towards achieving the goal. This provides added incentive for

103
the employee to take the goals seriously and work towards achieving them
(Noe et al 2008:383).
2.6.7 Performance Improvement
Performance improvement is one way managers can handle the gaps identified
during the appraisal and feedback processes. According to Katz and Green
(1997:28), performance improvement should address the question of how to
enhance the health workers performance levels. Performance improvement is a
response to make services of an organisation better, affordable, and faster. It
also seeks to rectify the existing performance problems and build upon those
performance levels that are already good (Katz & Green 1997:28). It is therefore
important to have a performance improvement plan as part of performance
management. Katz and Green (1997:200) assert that performance improvement
involves the elimination of problems and the exploitation of the performance
opportunities. The performance problems may be related to service, practice or
governance, while opportunities are factors that can be outside the organisation
but can be harnessed to improve performance.
Staff performance improvement is an important function of the organisation.
Performance monitoring and appraisal results can be used to manage and
enhance performance through staff training, counselling, and development
(Smith et al 2008:14-15). Grobler et al (2006:300) identify training as being task
oriented and focused on improving the worker‟s job performance. Development
is directed towards „creating ongoing learning opportunities so that employees
can improve over longer period of time and learn skills other than those required
for the current job‟ (Kleynhans, Markham, Meyer, Van Aswegen & Pilbean
2007:117). Other authors like Snell and Bohlander (2007:282) argue that training
tends to be more narrowly focused and oriented towards short-term performance
concerns while development is future-oriented and focuses on broadening
individual‟s skills for future responsibilities. Since the functions of the
organisations are oriented towards performance, then, performance monitoring
is a management function that attempts to ensure that productivity and staff

104
performance are kept up to standard through formal or informal staff training and
development activities.
2.6.7.1 Staff training
Noe et al (2008:267) define training as the „…planned effort by an organisation
to facilitate employees‟ learning of job-related competencies‟. These
competencies include knowledge, skills, and behaviours that are critical for
successful job performance. Training involves the application of formal
processes to impact on and help employees acquire the skills necessary to
perform their jobs satisfactorily (Armstrong 2009:665). Since the human
resources are the most important assets for any organisation, it is important that
their intellectual capital is maintained through training. In-service training is one
of commonly used methods in the health sector to boost the performance of
health workers. In-service training is about facilitating learning and development
of an employee while rendering a service to an organisation. Armstrong
(2009:667) and Swansburg and Swansburg (1999:571) maintain that in-service
training provides a learning experience in the workplace for the purpose of
refining new skills. Hence, in an organisation managers and supervisors are
responsible for developing employee‟s potential and abilities to perform and help
them adjust to the rapidly changing job requirement. The WHO (2006:82), points
out that in-service training is most likely to change behaviour when it is
interactive, based on real problems, and coupled with continuing or intermittent
support.
There are various forms and methods of in-service training. These include:
Presentation methods: where learners are passive recipients of information.
These include classroom instruction (such as lectures), distance learning,
audiovisual techniques (such as video and overheads) (Noe et al 2008:291).
Hands on methods: where the learner is actively involved in learning. This
category includes on-the-job training (employees is taught in clinical units or

105
observes peers and supervisors), simulations, case studies, and web-based
training (training delivered over internet or intranet) (Noe et al 2008:294-295).
Group building methods: where learners work together to build team identity.
This includes adventure learning (development of team work & leadership
skills using structured outdoor activities), team training (promotes ability of
members to work together), and action learning (problem solving) (Noe et al
2008:303).
Brinkerhoff (2006:303-304) notes that the impact of training is dependent on the
manner in which the training is implemented. Therefore, the key challenge which
the organisations face is how to quickly and consistently take advantage of
training to improve performance.
2.6.7.2 Staff development
Kleynhans et al (2007:117) describe staff development as „…a process directed
towards creating ongoing learning opportunities so that employees can improve
over longer period of time and learn more skills over and above those required
for the job‟. Armstrong (2009:674) adds that development takes the form of
learning activities that prepare staff to exercise wider responsibilities. Usually
staff development interventions are future oriented and serve to expand skills
within employees which will enable them to move into jobs that do not exist yet
(Nel et al 2008:446). The staff development interventions in an organisation
include: formal education programmes, assessment, job experiences, and
interpersonal relations (Noe et al 2008:389).
Formal education programmes: this includes off-site and in-house training
programmes that are customised to the organisation‟s employee (Noe et al
2008:389). Such as, IMCI training courses, tuberculosis (TB) management
courses or workshops.
Assessment: according to Noe et al (2008:409) assessment involves
„...collecting information and providing feedback to employees about their
behaviour, and communication styles or skills‟. The most popular methods

106
include performance appraisals, 360-degree feedback system, the
assessment centre, benchmarks, and the Myers-Briggs Type Indicator
(MBTI). Assessment is frequently used to determine employees with
managerial potential.
Job experiences: this refers to „…relationships, problems, demands, and
tasks, or other features that employee face in their jobs‟ (Noe et al 2008:417).
Job experiences can be used for employee development in various ways
such as:
Job enlargement: where the employee‟s existing job is expanded
horizontally so as to include a greater number of activities.
Job enrichment: where the employee‟s job is expanded vertically
to provide employee with more challenges.
Job rotation: where the employee moves among jobs within a
particular department
Others include transfers, promotions and temporally assignments
with other organisations (Noe et al 2008:420).
Interpersonal relations: development can occur through establishment of
interpersonal relationships. Methods used to enhance interpersonal
relationships include mentoring and coaching. Noe et al (2008:424) refers
to a mentor as an experienced, productive employee who helps to develop
less experienced employees. A mentor may provide career support and
psychosocial support to the employees (Noe et al 2008:426). A coach on the
other hand, is a peer or manager who works with an employee to motivate
him, help him develop skills, and provide reinforcement and feedback.
Coaching is usually one-to-one session with an employee for the purpose
giving feedback or pairing an employee with an expert in the area where
there is deficiency (Noe et al 2008:427).

107
2.7 THE ROLE OF LEADERSHIP IN PERFORMANCE MANAGEMENT
The WHO (2008:xii) recognises the mismatch between expectations and
performance as a cause for concern among health authorities in the quest to
renew primary health care (PHC). Given the growing economic weight and social
significance of the health sector, the performance of health workers creates
anxiety among politicians. Different groups have a role to play in revitalising PHC
and these include: national politicians and local governments, the health
professionals, the scientific community, the private sector, and civil society
organisations as well as the global health community (WHO 2008:82).
Armstrong (2009:376) defines leadership as „…the process of inspiring people to
do their best to achieve the desired results‟. Leaders play two important roles in
organisations. First, leaders must achieve the results. Second, leaders must
maintain effective and harmonious relationships within the organisation, and
between individual members of the organisation. In order to fulfil their roles,
leaders need to satisfy the following needs: task, group maintenance, and
individual needs (Armstrong 2009:376). Ruth (1996:27) goes ahead to describe
the main qualities of leadership as abilities for long-term strategic thinking, good
communication skills, integrity, and ambition. Therefore, leadership generally
refers to motivating and committing people to perform.
Performance management is one way organisations can communicate their
mission and vision to all the stakeholders (Ukko, Tenhunen & Rantanen
2007:40). A well designed performance management system supports leaders in
their crucial roles of providing overall direction and a strong focus for action in
their organisations, and managing key internal and external relationships. Within
the organisation, performance management provides leaders with assurance
that the strategic decisions are being implemented and that the intended targets
are being achieved. At the same time, performance management enables
leaders to identify areas where the expected targets are not being achieved,
thereby opening the way for timely remedial action (DIRPSER 2005:9;
Khaleghian & Das Gupta 2005:1091-1093; Ukko et al 2007:40).

108
Indeed DIRPSER (2005:9) and Ukko et al (2007:41) emphasise that
performance management systems should focus attention on the matters that
are critical for the achievement of desired results and help attain alignment of
priorities across all levels within the organisation. Leadership helps in identifying
issues that require collaboration across different sectors and departments
through the performance management process. Similarly, leadership assists in
the analysis of the performance drivers which ultimately leads to a detailed
understanding of performance issues. This therefore provides valuable input into
decisions about the allocation of resources including the human resources
(WHO 2008:84).
In organisations where discussions regarding performance are encouraged and
ongoing, all members of the team are aware of how their roles contribute to
achieving the organisational strategic goals. With this knowledge, leaders can
exercise their decision-making powers to introduce new ideas and work
practices. It is widely acknowledged that effective leadership use dialogue to
motivate, and provide on-going support to the workers as they strive to achieve
better outcomes. Performance appraisal data should form the basis for a
dialogue between leaders and workers. The leadership should focus on creating
an atmosphere where the workers are recognised and supported for their
contributions towards achieving the organisation‟s strategic objectives. This calls
for good interpersonal and communication skills, and the need to understand
and appreciate social and cultural differences among the workers (DIRPSER
2005:9; Ukko et al 2007:46). Khaleghian and Das Gupta (2005:1096), and Ukko
et al (2007:46-47) maintain that a good performance management system is a
powerful tool for achieving change in an organisation. Therefore, by the revising
performance criteria, managers provide staff with a clear message about the
need for and the direction of changes in the priority areas. By closely monitoring
the new criteria, managers can ensure that the desired change occurs (Luecke
2006:43).

109
The WHO (2008:86-91) explains performance information as a tool used by
governments for accountability. However, the accountability of leaders extends
beyond financial honesty and the delivery of outputs. Leaders are responsible for
advancing the capacity of their organisations to engage constructively with future
challenges through the development of their intellectual capital, and the creation
of a genuine future-oriented performance culture which actively supports
organisational learning and innovation. Leaders should also sustain the
reputation of their organisations in the eyes of their clients, their workforce, and
other stakeholders (Khaleghian & Das Gupta 2005:1093-1094; WHO 2006:86).
2.8 CONCLUSION
In this chapter the researcher has reviewed the relevant literature on the
performance and performance management of health workers. The researcher
has discussed in detail the „strategic performance model‟. The components of
the theoretical model, which include: individual attributes and behaviours,
organisational strategy, situational constraints, and the dimensions of
performance are described in a more detailed way. The researcher has also
justified the use of the strategic performance theoretical framework to guide this
study.
The researcher has discussed the concepts, types, and benefits of
decentralisation in health services. Also discussed is the link between
decentralisation and management of human resources for health.
In this literature review the researcher focused on human resource management
and the need to improve health worker performance by creating a fit between the
individual worker, the job, the organisation, and the environment. The researcher
further discussed the value of human resource management practises in
enhancing performance of workers through increasing employee‟s knowledge,
skills and abilities; motivating employees to leverage their individual attributes
and behaviours; and motivation of employees to perform.

110
This chapter further looked at the concepts of performance and the dimensions
of health workers‟ performance that include staff availability, productivity,
availability, competence and responsiveness. The determinants of health
workers‟ performance and the strategies that may be used to enhance health
workers‟ performance were presented in detail.
The researcher has also discussed the concept, functions, and the process of
performance management. The differences between performance management
and performance appraisal were presented in detail. The discussion of
performance measurement and the approaches used to measure performance
were put forward.
Lastly, the researcher discussed the concepts of performance feedback and
strategies that may be used in performance improvement of health workers. The
role of leadership in guiding performance of health workers is outlined. In the
next chapter the researcher presents a detailed account for the research design
and methodologies that were used in the study.

111
CHAPTER 3 RESEARCH DESIGN AND METHODOLOGY
3.1 INTRODUCTION
This chapter describes the research design and methods that were used to
conduct this study. The chapter re-states the rationale of the research, describes
the study design, study populations, sampling and sampling techniques,
research instruments, data collection procedures and analysis. The procedures
for ensuring validity, reliability and trustworthiness of the research findings are
outlined. The ethical considerations followed during this research are also
discussed. Additionally, the mixed methods approach as well as the research
designs appropriate to this study are presented. The two levels at which this
study was conducted are detailed. In this study the descriptive research design
was used during data collection, analysis and interpretation.
3.2 RATIONALE OF THE STUDY
As stated in chapter 1, the purpose of this study was to investigate the
performance of health workers in Uganda in order to design a framework that
may be used by stakeholders to improve performance in the decentralised health
services. The researcher envisages that this study will add to the existing body
of knowledge and understanding of performance management in the health
sector. This, the researcher hopes to achieve through the contribution towards
the formulation of the performance management framework specific to the health
profession. Furthermore, this study will generate greater awareness among the
public health sector managers on the importance of having a practical
performance management framework as a vehicle for organisational
effectiveness. For these reasons, this study is very important not only in Uganda
but also in Africa and elsewhere.

112
3.3 THE SCOPE OF THE STUDY
The researcher selected the sample from health workers and their managers
working in four (4) districts located in Eastern Uganda namely: Kumi, Mbale,
Sironko and Tororo. These districts were selected purposively based on their
performance on the district league table during the past two financial years
(FY) (FY 2006/07 & FY 2007/08) under the second health sector strategic plan
(HSSP II). The assumption was that the performance of health workers, to a
great extent, influences overall district performance. On the district league
table, Tororo district has been amongst the best 15 performers for the
consecutive 2 years and Kumi district has moved from the mid-table in FY
2006/07 to the best 10 performers during the financial year 2007/08.
Furthermore, Mbale district dropped from being amongst the best 10
performers in FY 2006/07 to the mid-table during the FY 2007/08 and Sironko
district has persistently been occupying the mid-table for the two years
(Ministry of Health Uganda 2008:37). The main focus of this study was limited
to doctors, clinical officers and professional nurses. The other health
professionals were not represented although they form part of the workforce.
3.4 RESEARCH DESIGN
Burns and Grove (2007:38) and Saunders et al (2009:136) define research
design as „…the detailed plan of how the study is to be conducted with full
advantage of control over factors that could interfere with the desired outcomes‟.
Polit and Beck (2008:66) also define research design as „…the overall plan for
obtaining answers to questions being studied and for handling some of the
difficulties encountered during the research processes‟. Creswell and Plano-
Clark (2007:58) emphasise that research design is a procedure for collecting,
analysing, interpreting and reporting data in a study. Amin (2005:210) describes
research design as an outline of what the researcher will do right from the
formulation of the research questions to the final analysis of data. A research
design is important because it facilitates smooth running of the various research
operations thereby making the study more efficient. In deciding which research

113
design to use, the researcher has to consider a number of factors. These include
the focus or orientation of the research, the units of analysis and the time
dimension (Saunders et al 2009:137). Therefore, in order to obtain a full picture
regarding the performance of health workers in decentralised services, the
researcher used the mixed methods approach, using a survey design for the
quantitative strand. In the mixed methods approach both quantitative and
qualitative research methods are used at the same time or series of studies
(Creswell & Plano-Clark 2007:58).
3.4.1 Mixed methods research approach
As already stated, the researcher used the mixed methods approach to conduct
this study. According to Creswell, Plano-Clark and Garrett (2008:66) mixed
methods research approach is „…a plan for collecting, analysing and combining
both quantitative and qualitative research methods or data in a single study or a
series of studies in order to understand the research problem‟. The mixed
methods research approach brings together the quantitative and qualitative data
either simultaneously or sequentially. In this study, the research problem is the
performance of health workers in decentralised services.
The rationale for combining both kinds of data within one study is grounded in
the fact that neither quantitative nor qualitative methods are sufficient by
themselves to capture the trends and details of the situation. When used in
combination, qualitative and quantitative methods can complement each other
and allow for more robust analysis, by leveraging the strengths of each other and
limiting the weaknesses (Hanson, Plano-Clark, Petska, Creswell & Creswell
2005:226).
Polit and Beck (2008:309) describe the following advantages of mixed methods
approach which include: complementarity, incrementality, and enhanced validity.
Complementarity: using mixed methods approach allows the researcher to
use numbers (quantitative data) and words (qualitative data) in order to
minimise the limitations of a single approach.

114
Incrementality: the progress on research topic tends to be gradual, relying on
feedback loops. Therefore, by using qualitative findings one can generate
hypotheses that can be tested quantitatively, and quantitative findings that
sometimes need clarification through in-depth probing.
Enhanced validity: when a model is supported by multiple and
complementary types of data, the researcher will be more confident about the
validity of the results (Polit & Beck 2008:309).
It is for these merits that the researcher decided to use the mixed methods
approach, in order to generate findings concerning the performance of health
workers in Uganda that are supported by both qualitative and quantitative
research approaches, hence, enhancing the credibility of this study.
Creswell et al (2008:68) classify mixed methods research approach into two
major categories. These include concurrent and sequential triangulation designs.
In the concurrent designs both qualitative and quantitative data is collected at the
same time or within the same period. In sequential designs one category of data
(quantitative or qualitative) builds on the other with emphasis put on one set of
data. Sequential designs include explanatory, exploratory and sequential
embedded designs.
Although it is thought to be more inclusive, mixed methods approach has its
challenges. For example, it requires extensive data collection, time-intensive
analysis, decisions on which research methods to combine, and how to integrate
and interpret the research findings (Creswell et al 2008:72; Stewart,
Makwarimba, Barnfather, Letourneau & Neufeld 2008:1407). For the purpose of
this study, the researcher used the „concurrent triangulation design‟ to
investigate the performance of health workers in the decentralised services in
Uganda.

115
3.4.1.1 Triangulation design
Polit and Beck (2008:768) define triangulation as „…the use of multiple methods
to collect and interpret data about a phenomenon, in order to arrive at an
accurate representation of reality‟. Saunders et al (2009:146) assert that
triangulation refers to „…use of different data collection techniques within one
study in order to ensure that the data is telling you what you think they are telling
you‟.
The purpose of triangulation is to obtain different but complementary data sets
on the same topic, with the intention of bringing together the differing strengths
and minimise the weaknesses of quantitative and qualitative research methods
(Polit & Beck 2008:196). In triangulation, simultaneous but separate quantitative
and qualitative data collection and analysis is carried out. The researcher then
attempts to merge the two sets of data by bringing the separate results together
during interpretation or by transforming data to facilitate the integration of the two
categories of data during analysis. This enables the investigator to understand
the research problem better (Creswell & Plano-Clark 2007:64).
In this study, the researcher collected data about performance of health workers
using different methods (methodological triangulation) from workers themselves
(appraisees) and their health service managers (appraisers), working in different
districts(space triangulation and person triangulation), during the same period
and integrated the findings during interpretation (data triangulation).
Methodological triangulation involves using multiple research methods or
data collection techniques about the same phenomenon, which in this case is
the performance of health workers. In this study, researcher used structured
questionnaires to collect quantitative data and semi-structured interviews to
collect qualitative data (Amin 2005:65; Polit & Beck 2008:543).
Space triangulation involves collecting data on the same topic from different
sites to test for cross-site consistency. In this study, the researcher collected
116
data from four (4) districts of Eastern Uganda with different levels of health
workers‟ performance (Amin 2005:65; Polit & Beck 2008:543).
Person triangulation involves collecting data from different types or levels of
people. This is aimed at validating data through multiple perspectives on the
topic. In this study, the researcher collected data from health workers
(appraisees) and from health service managers (appraisers) (Polit & Beck
2008:543).
Data triangulation involves the use of multiple sources of data with the same
focus to obtain various views through a range of data on a given topic in
order to enhance validity. The data collected can be analysed using different
strategies for validation (Amin 2005:65; Polit & Beck 2008:543). In this study
the researcher collected data from health workers and health service
managers at different levels of health care (HC II, HC III, HCIV & district
hospitals (HC V). The different sources of information provide insights about
the phenomenon, provide an enriched explanation of the problem, and assist
in validating conclusions (De Vos, Strydom, Fouche & Delport 2005:362).
Investigator triangulation refers to a situation where two or more investigators
with diverse background examine the same phenomenon with each having a
specific role to play in the study (Amin 2005:65).This removes the potential
bias which is likely to occur if there is only one investigator. In this study, the
researcher used the services of four trained research assistants with
background in public health and social sciences to interview the health
service managers during the qualitative phase. The aim was to reduce the
potential bias since the research assistants would not be involved in the other
stages of the study. The researcher employed services of an experienced
statistician to analyse the quantitative data and to cross check the analysis
and coding of the qualitative data. All these were aimed at enhancing the
validity, reliability, and trustworthiness of the research findings.
3.4.1.1.1 Variants of triangulation design
According to Creswell and Plano-Clark (2007:64), there are four main variants of
the triangulation design. These include the convergence model, the data

117
transformation model, the data validating quantitative model, and the multilevel
model. For the purpose of this study, the researcher used the „multilevel model‟.
In the multilevel model, different research methods (quantitative & qualitative)
are used to collect and analyse data from different levels within the health
system. The findings for each level are then merged together into one overall
interpretation (Creswell & Plano-Clark 2007:64). Figure 3.1 illustrates the
„multilevel model‟, where level 1 represents the health workers within their
facilities (appraisees), and level 2 represents the health service
managers/supervisors at district and health sub-district level (appraisers).
DECENTRALISED HEALTH SYSTEM
Figure 3.1: The visual multilevel triangulation model (Adapted from Creswell &
Plano-Clark 2007:64).
As shown in Figure 3.1, this study used the „multilevel model‟ of triangulation
with data collected, analysed and results presented for the two levels. In this
QUANTITATIVE APPROACH
Level 1 Health workers (HC IIs to HC Vs)
QUALITATIVE APPROACH
Level 2 Health service managers
Qualitative data collection: Structured
Interviews
Quantitative data collection:
Questionnaires
Qualitative data analysis: Thematic &
content analysis
Quantitative data analysis: Descriptive
and Inferential statistics
Overall Interpretation
Qualitative results
Quantitative results

118
model, different but complementary data sets were collected on the same topic
by means of both quantitative and qualitative techniques with equal priority. The
data was analysed in parallel and then merged to develop a more complete
understanding about the performance of health workers (Creswell et al 2008:68).
A survey design using self-administered questionnaires was used to collect
quantitative data on factors that enhance or impede performance of health
workers (appraisees), and the current ways their performance is managed in the
selected districts. Qualitative data was collected using semi-structured interviews
with health service managers (appraisers) at the district and health sub-district
levels to explore the phenomenon of performance of health workers, and
performance management in general. The reason for collecting quantitative and
qualitative data in the same study is to combine the strengths of both types of
research, hence, generating more credible results.
3.4.3 The quantitative research approach (Level 1)
Quantitative research approach was used to collect data from health workers
(appraisees) at the facility level. Amin (2005:210) describes quantitative
approach as „…a plan for carrying out research oriented towards data
quantification, and is applied in order to describe or investigate the current
conditions and relationships‟. Polit and Beck (2008:16), add that the quantitative
approach involves the use of a general set of organised and controlled
procedures to gather information. In quantitative research, evidence is generated
according to the specified plan, using formal instruments such as questionnaires
to collect the needed information. The data collected is generally numerical and
is analysed using statistical procedures in order to enhance objectivity (Polit &
Beck 2008:16; Somekh & Lewin 2005:215).
According to Polit and Beck (2008:63), a quantitative approach can be
experimental, quasi-experimental, or non-experimental and may use descriptive
and inferential statistics. The design can be cross-sectional or longitudinal. This
study was cross-sectional and non-experimental because data was collected at
a specific point in time in the natural environment of the health workers.

119
Therefore, the researcher used quantitative non-experimental cross-sectional
designs to identify and collect numerical data on several factors influencing the
performance health workers and the current practices used to manage their
performance. By so doing the researcher wanted to understand and describe the
predictors of health workers‟ performance, hoping that this would assist in the
development of the performance management framework.
3.4.4 The qualitative research approach (Level 2)
According to Amin (2005:43), a qualitative research approach is „…one whose
data is basically descriptive in nature‟. Amin (2005:45) outlines the
characteristics that define qualitative research. These are:
comprehensive explanation of the events;
explicit explanation of data collection and analysis;
inductive reasoning applied to evidence gathered from sources;
synthesised interpretation; and
extension of understanding by others.
In this research, qualitative research approach was used to collect data from the
health service managers/supervisors (appraisers) at district and health sub-
district levels. The data obtained using qualitative methods are mostly expressed
in non-numerical terms, although sometimes it can be transformed into
numerical variables. Even though description is emphasised, this does not mean
that numerical figures cannot be used. In qualitative methodology, the
researcher usually collects data using open-ended questions with the primary
intent of developing themes from the data.
This study used a semi-structure interview technique for data collection. The
advantages of using semi-structured interview technique to this study are:
providing depth to the data, allowing for probing, and improving the confirmation
of quantitative data. A potential disadvantage of the interview technique is the

120
perceived lack of anonymity by the participants (Polit & Beck 2008:424). For this
reason, the participants were assured of their anonymity throughout the study.
In this study, the researcher collected qualitative data from the health service
managers using semi-structured interview guide. The qualitative interview
procedures can identify experiences in an attempt to understand or interpret
phenomena in terms of the meaning people bring to it. Hence, qualitative data
assumes that reality is subjective and is constructed by participants involved in
the study. The researcher investigated and explained the reasons for sub-
optimal performance of health workers. This methodology also enabled the
researcher to get in-depth information on why performance is managed the way
it is. Lastly, the researcher used this method to collect the views of health
workers and health service managers on how performance can be improved.
3.4.5 Descriptive research design
Descriptive research is a broad class of non-experimental studies (Polit & Beck
2008:274). Saks and Allsop (2007:6) assert that descriptive studies provide
current information or intelligence regarding the research problem. Polit and
Beck (2008:274) add that in descriptive study the researcher observes, relates,
and describes measurable attributes of the phenomenon in a natural
environment. The purpose of descriptive studies is to generate precise
measurement of the phenomena being studied that can be explained by
accumulation of statistical data (Burns & Grove 2007:34; Saunders et al
2009:140).
In this study, the researcher intended to describe and categorise the factors that
positively and negatively affect the performance of health workers, and relate
them to the organisational strategy in the current working environment. In
addition, the researcher wanted to describe the various approaches that are
currently used to manage the performance of health workers. This enabled the
researcher to identify the strengths and weaknesses which in turn formed the
basis for designing the performance management framework.

121
3.4.6 Survey research design
The researcher utilised a survey design to collect quantitative data. Amin
(2005:212) defines a survey as „…a research activity that is used to gather data
from a sample of a population‟. A survey design may be used in descriptive,
explanatory, and exploratory studies. According to Polit and Beck (2008:323) a
survey is designed to obtain information about the prevalence, distribution, and
interrelations of variables within a population. Babbie (2001:238) argues that a
survey is probably the best method available for researchers who are interested
in collecting original data for describing a given population. The purpose of a
survey is to generalise data from a sample to the population so that inferences
can be produced about their characteristics. Surveys are mainly used in studies
where individuals are the units of analysis.
During this study, the researcher used the survey design because of its cost
effectiveness and its ability to can cover a large population. A survey is an
excellent way to gain knowledge from the target population of this study. It allows
the health workers to answer questions comfortably and more truthfully since
their answers are handled anonymously. Additionally, a survey helps the
researcher to be creative in shaping the areas for further research (Saunders et
al 2009:144).
Although it is advantageous, a survey design has some shortcomings. First, a
survey does not provide an in-depth picture of why certain features are there or
not and why stakeholders hold different perspectives. Second, in a survey
participants may sometimes want to portray themselves in a better light. Third, a
survey may lead to bias since people who respond to them are usually extremes
of the continuum, mostly the opinionated, generally better educated, and
wealthier. Fourth, a survey may lead to less representation of the minority
groups (Lange 2002:78; Saunders et al 2009:145).

122
3.5 LEVEL 1: QUANTITATIVE RESEARCH METHODS
A quantitative and descriptive research methodology was used at this level (level
1) to collect data from the health workers (appraisees) in their facilities. The
research objectives guided the investigations regarding the unknown aspects of
the performance of health workers. Responses to quantitative research
objectives are usually presented in statistical form.
3.5.1 Population and sampling at level 1 (Health facility level)
The research methods that were used in sampling and collection of data from
the health workers during the quantitative strand are described in the following
sections.
3.5.1.1 Study population for level 1
Amin (2005:235) defines a study population as „…a complete collection of all
elements or individuals that are of interest in a particular investigation and where
inferences are to be made‟. Trochim (2006:32) describes study population as a
group to which the results of the study are generalised. According to Saunders
et al (2009:212) a study population is „…a full set of cases from which a sample
is taken‟. The study population may include study objects such as individuals,
groups, organisations, human products, and events to which they are exposed.
Taking this into account, the study population at this level (health facility level)
were all health workers (appraisees) working in decentralised services in
Uganda.
3.5.1.2 Target population for level 1
Polit and Beck (2008:338) define target population as „…the aggregate of cases
about which the researcher would like to make generalisations‟. A target
population according to Burns and Grove (2007:324) is the entire set of

123
individuals or units that meet the sampling criteria. Amin (2005:235) describes
target population as one to which the researcher would wish to generalise the
results. For the purpose of this study, the target population at level 1 constituted
the health workers (appraisees) working in Eastern region of Uganda.
3.5.1.3 Accessible population for level 1
According to Burns and Grove (2007:324) an accessible population is „…the
portion of the target population to which the researcher has access‟. Polit and
Beck (2008:338) also define accessible population as „…the aggregate that
conforms to the designated criteria and are accessible as participants of the
study‟. Amin (2005:235) describes accessible population as one from which the
sample is actually drawn. This implies that results from the sample should only
be generalised to the sampled population and generalisation to the target
population will depend on the similarity that exist across the population. In this
study, the researcher selected the sample from health workers working in the
selected four (4) districts of Eastern Uganda namely: Kumi, Mbale, Sironko and
Tororo. At the time of this study, there were 828 health workers (doctors, clinical
officers and professional nurses) working in the 4 districts. The distribution of
health workers in the four districts is shown in Table 3.1.
Table 3.1: Distribution of health workers in the four districts of Eastern Uganda
(N=828)
District Distribution of health workers
by Cadres Distribution of health workers by
level of health facility Total (%)
Doctors Clinical Officers
Nurses & Midwives Hospital HC IV HC III HC II
Kumi 17 44 112 101 0 53 19 173
(20.9%)
Mbale 38 72 198 174 55 62 17 308
(37.2%)
Tororo 22 59 137 107 43 59 9 218
(26.3%)
Sironko 0 36 93 0 54 63 12 129
(15.6%)
Total (%)
77 (9.3%)
211 (25.5%)
540 (65.2%)
382 (46.1%)
152 (18.4%)
237 (28.6%)
57 (6.9%)
828 (100%)
Sources: Health workers‟ registers at the Kumi, Mbale, Sironko and Tororo DHO‟s offices, April 2010

124
Table 3.1 presents the distribution of health workers targeted for quantitative
study (level 1). From this table, it can be noted that professional nurses and
midwives form the dominant group (n=540; 65.2%), followed by clinical officers
(n=211; 25.5%) and doctors (n=77; 9.3%). The distribution by the level of health
facility indicates that there were more health workers in hospitals (n=382;
46.1%), HC III had 237 (28.6%) health workers, HC IV had 152 (18.4%), and HC
II had 57 (6.9%) health workers.
3.5.1.4 Sampling frame for level 1
Saunders et al (2009:214) and Trochim (2006:32) describe the sampling frame
as „…a list of elements from which the probability sample is selected‟. In this
study, the sampling frame for the quantitative approach was the lists of all health
workers namely: doctors, nurses, and clinical officers working in the four
selected districts. Each DHO maintains a register of health workers in his
jurisdictions. These registers include the name, age, gender, cadre, location, and
date of appointment among others. The numbers of each category of health
workers are indicated in Table 3.1.
3.5.1.5 Sample size determination for health workers
After establishing the number of individuals in the target population, the
researcher used the tables developed by Krejcie and Morgan (1970:608) to
determine the required sample size for the quantitative study. The sample size is
dependent on the accuracy required and the likely variations in target population.
According to the DHOs‟ registers in the four districts, there were 828 health
workers (doctors, clinical officers and nurses and midwives) as of April 2010
working in the health facilities. Based on this information and using the tables
developed by Krejcie and Morgan (1970:608), at 95% confidence interval the
minimum sample size required for this study is approximately 265 health
workers. Polit and Beck (2008:351) point out that not everybody invited to

125
participate will cooperate; hence, the research anticipated lack of cooperation or
attrition from about 25% of the sampled population. Therefore, instead of taking
the actual sample size, the researcher decided to increase the sample size by at
least 25% (265+25/100 x 265 = 265+66 = 331). The final sample size for this
study was 331 health workers drawn from the four districts in eastern Uganda.
Saks and Allsop (2007:219) assert that the larger the sample size, the smaller
the error in estimating the characteristics of the target population but the more
costly it becomes to conduct the study.
3.5.1.6 Sampling and sampling techniques of health workers
A sample is a portion of population whose results can be generalised to the
entire population for the particular study (Polit & Beck 2008:339). Therefore,
sampling is the process of extracting a portion of the population from which
generalisation of the findings can be made (Amin 2005:237; Polit & Beck
2008:339). Sampling is useful because it is more practical and economical. The
use of sampling economises on costs and time spent on the sample as
compared to the larger populations. Furthermore, sampling ensures
completeness and high degree of accuracy due to the limited area of operation.
The main disadvantage of sampling is that the selected units may not be
representative of the population, even when the best statistical methods have
been applied, especially when the sample size is small. In addition, accessible
population is not usually 100% representative since elements that are not
accessible might be different from the accessible ones (Amin 2005:239; Burns &
Grove 2007:327).
A sample may be selected using probability or non-probability sampling
methods. A probability sample is one that is selected randomly such that all the
elements in each sampling frame have an equal chance of being chosen.
Probability sampling methods include: simple random sampling, stratified
sampling, systematic sampling, cluster sampling and panel sampling (Amin
2005:244; Polit & Beck 2008:340; Saunders et al 2009:222).

126
For the purpose of this study, the researcher used probability stratified random
sampling to select participants for the quantitative strand. In stratified sampling
the population is divided into two or more strata such that the elements within
each sub-population are homogeneous. Then using random sampling, the
samples are selected independently from each sub-group (Amin 2005:246; Saks
& Allsop 2007:159; Saunders et al 2009:228).
In each district, the researcher stratified the target population by cadre and level
of health facility (hospital, HC IV, HC III & HC II). In order to get a representative
sample, the researcher followed the Neuman's rule of thumb to achieve the
appropriate proportions of the sample from each stratum. Neuman‟s rule of
thumb states that for a small population (under 1,000) a larger sampling ratio is
needed (about 30%) and for a larger population (about 10,000) a smaller ratio is
needed (10%) (Neuman 2006:241-242). In this study the target population was
under 1000 health workers, therefore the researcher applied a big sampling ratio
of 40% on each stratum to obtain the required sample of 331 participants. The
resultant distribution of the sample is shown in Table 3.2.
Table 3.2: Proportional distribution of the participants in the sample (N=331)
District Distribution of health workers
by Cadres Distribution of health workers by
level of health facility Total (%)
Doctors Clinical officers
Nurses & Midwives Hospital HC IV HC III HC II
Kumi 7 17 45 40 0 21 8 69
(20.8%)
Mbale 15 29 79 69 22 25 7 123
(37.2%)
Tororo 9 23 55 43 17 24 3 87
(26.3%)
Sironko 0 15 37 0 22 25 5 52
(15.7%)
Total (%)
31 (9.4%)
84 (25.4%)
216 (65.2%)
152 (45.9%)
61 (18.4%)
95 (28.7%)
23 (6.9%)
331 (100%)
After categorising the members of the population as elements of one of the
identified sub-groups, the researcher allocated numbers (starting from 001)
against the names of the health workers and by use of the tables of random
numbers, the required sample for each category was selected. Replacement
was done using the same procedure for the selected individuals who were found

127
to be out their stations during the start of data collection. Authors like Amin
(2005:246) and Saks and Allsop (2007:159) mention that the desired number of
units from each stratum is selected proportionately. Hence, the selection of
sample from each stratum depends on its size. This implies that large samples
were selected from big strata and small samples from the smaller strata. This
ensured representativeness of all the strata.
Table 3.2 summarises the distribution of the participants from the established
sample size (N=331). From the table it is noted that 20.8% (n=69) were drawn
from Kumi district; 37.2% (n=123) from Mbale district; 26.3% (n=87) from Tororo
district; and 15.7% (n=52) from Sironko district. With respect to the distribution
by cadre, 9.4% (n=31) were doctors; 25.4% (n=84) clinical officers; and 65.2%
(n=216) were professional nurses and midwives. With respect to the health
facilities, 45.9% (n=152) were hospital based; 18.4% (n=61) from HC IV; 28.7%
(n=95) from HC III; and 6.9% (n=23) from HC II.
3.5.2 Data collection during the quantitative study (level 1)
Burns and Grove (2007:536) define data collection as „…identification of
respondents and systematic gathering of information relevant to the aim and
objectives of the study‟. Saunders et al (2009:256) describe data collection as
the gathering of information required to address the research problem. In case of
concurrent mixed methodology both quantitative and qualitative data is collected
simultaneously with equal priority given to both types of data. In this study, the
researcher used structured data collection methods. During the quantitative
approach, the researcher used self-administered questionnaires (Amin
2005:281; Saunders et al 2009:400).

128
3.5.2.1 Data collection approach and method for health workers
Since this study followed a concurrent mixed methods approach, the researcher
collected data (quantitative and qualitative) simultaneously using a self-
administered structured questionnaire. Structured data collection involves the
use of formal instruments composed of pre-defined items and response options
(Polit & Beck 2008:371; Saunders et al 2009:601).
The questionnaire items consisted of mainly closed-ended questions. The
development of the questionnaire was guided by the objectives of the study and
the theoretical model (Saunders et al 2009:362). The structured methods yield
data that are relatively easy to quantify and analyse. Polit and Beck (2008:369)
state that „…structured self-report data collection method is strong in respect to
its directness, versatility, content coverage, and yields information that would
otherwise be difficult to obtain through other means‟.
Burns and Grove (2007:551) define a questionnaire as „…a printed, structured
self report form designed to collect information through written or verbal
responses‟. Amin (2005:269) agrees that a questionnaire is a form consisting of
interrelated questions prepared by the researcher concerning the problem under
investigation. It is assumed that if a questionnaire is to be used the participants
must be able to read and understand the items, possess information to answer
the questions, and be willing to answer questions honestly.
The researcher opted to use the questionnaire during this study because of its
advantages. Questionnaires are less costly compared to other methods and
usually offer greater assurance of anonymity. Additionally, questionnaires can
cover a wider geographical area since the researcher can approach respondents
more easily than any other method. Although the use of questionnaire is
advantageous, it has its own drawbacks, since it does not allow for probing,
prompting and clarification. At the same time, it does not give the researcher an
opportunity to motivate respondents to participate in the process of filling the
questionnaires; the identity of individual is concealed and hence, it is uncertain

129
whether the questions are answered by the targeted population. Furthermore,
questionnaire items are fixed, and due to lack of supervision some items in the
questionnaire are sometimes partially filled (Amin 2005:270; Polit & Beck
2008:369; Saunders et al 2009:365).
3.5.2.2 Construction of the questionnaire
In mixed methods approach, the researcher uses different tools to collect data
on the same topic (Saunders et al 2009:146). In this case,the researcher
developed two separate tools one for each level of the data collection process
(quantitative & qualitative). A self-administered questionnaire was developed for
quantitative strand and a structured interview guide for the qualitative strand. A
questionnaire must be clear, simple, and unambiguous. It ought to be arranged
in an orderly manner in such a way that data analysis is easy (Polit & Beck
2008:425; Saunders et al 2009:387). The researcher developed the structured
questionnaire for health workers (appraisees) with items based on a 5-point
Likert scale-style (strongly agree, agree, undecided, disagree, and strongly
disagree). The questionnaire was developed based on the literature review, the
research objectives, and the theoretical model. The researcher also looked at
the other tools that have been used by other investigators in similar studies and
adapted some of the questions that are appropriate for this study.
Almost all questionnaire items were close-ended and worded in such a way that
the participants were limited to specified mutually exclusive response options.
Closed options facilitate coding and statistical analysis of data. It also ensures
that the researcher obtains the desired information, which can increase the
reliability of the study (Saunders et al 2009:374). Therefore, the assistance of the
study promoters and statistician was sought in this regard. The questionnaires
were in English.

130
3.5.2.3 Structure of the questionnaire
The self-administered questionnaire (Annexure H) was divided into six sections
(A-F). These questions were designed to elicit information about the factors that
enhance or impede the performance of health workers and the current practices
for managing performance in the decentralised services. All questionnaire items
were closed-ended and on a 5-point Likert scale except section A which deals
with the demographic characteristics of the participants and question number 38
which was open-ended.
Section A consisted of nine items about the personal and health facility
information such as gender, age, marital status, current profession, highest
qualifications, years of experience, type of health facility, and district of
employment.
Section B consisted of five questions concerning individual attributes presented
on a 5-point Likert scale such as skills and abilities, self-monitoring ability,
intrinsic motivation, organisational commitment, as well as values and beliefs.
Section C consisted of four questions, also on a 5-point Likert scale, on
individual behaviours for performance such as proficiency, adaptive, and
proactive behaviours for performance.
Section D consisted of five questions on the situational and organisational
factors that might influence performance such as clarity of organisational
strategy, working environment, staffing issues, work schedules, and
organisational culture.
Section E consisted of four questions investigating the health workers‟
performance dimensions (availability, competence, productivity, and
responsiveness) on a 5-point Likert scale.

131
Section F consisted of ten questions concerning the current performance
management practices in the districts. Eight questions used a 5-point Likert
scale, while one question (question number 30) made use of “yes” and “no”
answers, while the question on suggestions of health workers on how to improve
their own performance (question 38) was open-ended. The items in this section
included those on performance reviews and standards, performance reporting,
performance improvement, rewarding system, staff development, and the
suggestion on how performance can be improved.
3.5.2.4 Pre-testing of the data collection tools
Polit and Beck (2008:762) define pre-test as „…the trial demonstration of a newly
developed instrument to identify flaws or assess time requirements‟. Pre-testing
is conducted in order to identify possible weaknesses in the research
instruments. Polit and Beck (2008:214) and Saunders et al (2009:394) mention
that pre-testing a questionnaire assists the researcher to find out:
the time it will take to fill the questionnaire;
the comprehensibility of the instructions;
if items on the questionnaire are ambiguous;
whether there are any major omissions in the questionnaires;
whether the layout is clear and attractive; and
potential confounding variables that may necessitate control.
In this study the pre-teseting of the questionnaires was done at two levels. The
first level was with the experts in the field of study and the second level was with
the health workers and their managers.
3.5.2.4.1 Expert review of the data collection tools
Following the design and construction of the questionnaires, the researcher
requested and sent the data collection tools to five experts and two promoters to
assess the relevancy and content of the questionnaire items. These experts

132
included two with human resources management background; two public health
experts; and one stastician. In addition the two promoters for this research also
thoroughly reviewed the questionnaire.
The general view of the experts was that the data collection tools were
comprehensive enough to cover all the variables indicated in the theoretical
framework. All the questionnaire items were relevant to the study, and the length
of the questionnaire was acceptable. The following were the recommendations
from the experts and promoters for improvement on the questionnaire:
In section A, to include whether facility is rural or urban. This led to the
inclusion of question 10 (Annexure H) which was not initially in the
questionnaire.
For question 7 (option 1) of the the self administered questionnaire
(Annexure H), the word „district‟ was removed, and left to read as „hospital‟.
This is because some districts might have more than one hospital.
It was recommended that some questionnaire items should be „positively‟
worded from the initial „negative‟ statements. These items (Annexure H)
included; 12.1, 12.2, 21.9, 21.10, 21.11, 24.4, 26.6, 26.8, 26.9, 26.10, 27.5,
and 27.6. Hence, all the items in the questionnaire are now positively worded.
For question 24 (item 24.7) it was suggested that the word „district‟ be
dropped in favour of „local political leadership‟.
For question 33 (items 33.1, 33.2, 33.4) and question 34 (item 34.5), the
word „district‟ was replaced by the word „organisation‟.
All these suggestions were incorporated in the final draft of self-administered
questionnaire (annexure H).
For the interview schedule (Annexure I), the experts indicated that all the
questions were straight forward, inclusive and clear. Therefore no modifications
were made.

133
3.5.2.4.2 Pre-testing with the health workers and health services managers
Following incorporation of the suggestions of the experts and after obtaining
permission from the relevant authorities, the researcher pre-tested the draft
questionnaire with 12 experienced participants/health workers (7 professional
nurses/midwives, 3 clinical officers, and 2 doctors). These were selected from
Mbale hospital in Mbale district and Atutur hospital in Kumi District using
convenience sampling. The questionnaire was delivered by the researcher
himself accompanied by a letter explaining the purpose of the pre-test. The
participants were requested to give constructive feedback regarding the clarity of
the questions and the time required to complete the questionnaires.
Generally, the health workers indicated that the questions were clear and easy to
answer since most of it was structured. However, they complained that the self-
administered questionnaire was long but the questions were interesting and
relevant. The health workers indicated that the questionnaires took them
between 40 and 55 minutes to complete. The health workers who participated in
the pre-testing were not included in the main study.
3.5.2.5 Administration of the questionnaire
Once the questionnaire was designed, pre-tested, and amended, it was copied
and used to collect data from the sampled participants. The researcher and the
research assistants delivered the self-administered questionnaires to 331
participants, and collected them after one to two weeks. Delivering the
questionnaires to the participants and collecting them after that period, allowed
sufficient time to answer the questions (Amin 2005:281; Saunders et al
2009:400). The researcher used this method because postal services in Uganda
are unreliable, and because this method is known to achieve high response
rates. Saunders et al (2009:400) point out that although this method adds costs,
the response rates as high as 98% could be achieved.

134
Table 3.3 shows the number of usable questionnaires that were returned and
used during the analysis.
Table 3.3: Number of questionnaires sent and returned in usable state
District Number (n) of questionnaires
sent out for distribution
Number (n) and percentage (%) of
usable questionable returned
Kumi 69 55 (79.7%)
Mbale 123 106 (86.2%)
Tororo 87 65 (74.7%)
Sironko 52 50 (96.2%)
Table 3.3 shows that slightly over 96% (n=50; 96.2%) of the questionaries sent,
were returned from Sironko district in usable state. Tororo district had the lowest
number of usable questionnaires returned (n=65; 74.7%). Overall, the response
from the districts was good.
3.5.3 Validity and reliability of the questionnaire
Validity and reliability are two important concepts in the usability of an instrument
for research purposes.
3.5.3.1 Validity of the questionnaire
Validity is the suitability of instrument while reliability refers to its consistency in
measuring whatever it is intended to measure (Polit & Beck 2008:457). Amin
(2005:285) describes validity as the ability to produce findings that are in
agreement with theoretical or conceptual values. A research instrument is said to
be valid if it actually measures what it is supposed to measure. Burns and Grove
(2007:365) assert that validity of a research instrument is the determination of
how well the instrument reflects the theoretical concept being examined. Several
writers (De Vos et al 2005:160; Polit & Beck 2008:458; Saunders at al 2009:372)
identify four main approaches for measuring the validity of research instruments,
these include: face, construct, content and criterion-related validity.

135
In this study, the researcher made use of face, construct and content validity.
Saunders et al (2009:373) define construct validity as the extent to which the
questions actually measure the presence of the variables one intends measure.
The researcher ensured construct validity by rooting the measures in a wide
literature search that defines meanings of the construct and its elements. The
researcher also ensured that categories of meaning are relevant to the
participant in their natural setting. Content validity on the other hand refers to the
extent to which the measurement tool provides adequate coverage of the
research questions (Saunders et al 2009:373). In this study, content validity was
ensured through careful sampling and good formulation of the research
instrument items. This ensured that the questionnaire items are relevant to the
study. The experts in the field of study such as the promoters of this study,
human resources management lecturers, public health experts and a stastician
were called upon to assess whether or not the instrument items were relevant
and adequately covered the known content of the subject (De Vos et al
2005:161; Polit & Beck 2008:482-483). Despite all these, the researcher
observed that using these methods might introduce bias due to their subjectivity.
The validity of the research instruments can be external or internal.
External Validity
External validity is the degree to which the research findings can be generalised
to the wider population (Polit & Beck 2008:287; Saunders et al 2009:216). In this
study, external validity was ensured through the use of probability sampling,
specifically stratified sampling in order to have adequate representation from the
major categories of health workers. In addition, the researcher tried as much as
possible to get the correct composition and adequate sample size for the study.
The researcher selected constructs relevant to the study population in general
and not only a portion of the target population. Furthermore, the researcher
selected participants from all levels of health facilities including the hospitals, HC
IV, HC III, and HC IIs.

136
Internal validity
Internal validity is intended to reveal that the reasons for a particular event or set
of data derived from the research can actually be sustained by data; in other
words the findings of the study must describe accurately the phenomena being
researched (Polit & Beck 2008:295). In this study, internal validity was ensured
through construction of questionnaires in line with study objectives, and
voluntary participations of respondents.
3.5.3.2 Reliability of the questionnaire
Saunders et al (2009:156 & 373) refer to reliability as „…the extent to which data
collection and analysis techniques yield consistent findings‟. Polit and Beck
(2008:452) define reliability as ‟…the consistency with which the research
instruments measure the targeted attributes„. Hence, when a research
instrument is administered by various researchers, it should provide similar
results under comparable conditions (De Vos et al 2005:163). In this study,
reliability was equated to clarity, quality, stability, consistency, adequacy, and
accuracy of the research instruments. For purpose of this study, reliability was
ensured through pre-testing of the questionnaires to ensure clarity of the test
items. In addition, reliability of test items was tested by means of Cronbach‟s
coefficient Alpha (α), which is an index for testing internal consistence of the test
items using SPSS. All the constructs except one, had Cronbach‟s alpha of 0.70
and above except one construct (question 30) which had an alpha of 0.61 (see
Table 4.2). As a rule, Alpha (α) should be at least 0.70 or higher (Amin
2005:298; Polit & Beck 2008:454-456).
3.5.4 Quantitative data analysis
Amin (2005:306) refers to data analysis as „…closely related operations which
are performed for the purpose of summarising the collected information and
organising it in such a way that they answer the research questions‟. In this
study, the researcher used computer software called Statistical Package for
137
Social Sciences (SPSS) for data entry and analysis of quantitative data. Analysis
of closed-ended questions was done using descriptive statistics and inferential
statistics (Spearman‟s rho rank order correlation statistics). The analysed data
was presented in the form of frequency tables, charts, and text where
appropriate. The researcher analysed open-ended questions using qualitative
content analysis, with the aim of quantifying the emerging characteristics and
concepts. Polit and Beck (2008:517) describe content analysis as the process of
analysing the substance of narrative data to identify prominent themes and
patterns among the themes. It involves breaking down data into smaller units,
coding, and naming the units according to the content they represent, and
grouping coded material based on shared concepts. The researcher employed
the services of a statistician to help with data entry and analysis.
3.6 LEVEL 2: QUALITATIVE RESEARCH METHODS
The researcher collected data from the health service managers (appraisers)
using qualitative research methods. This method enabled the researcher to
explore and explain the performance of health workers, and to get in-depth
analysis on why performance is managed the way it is. Furthermore, the
researcher used this method to collect the views of the health service managers
on how performance can be improved.
3.6.1 The target population and sampling for level 2
During this study, the target population for the qualitative strand constituted the
health service managers (appraisers) working in the four selected districts of
Eastern Uganda.
3.6.1.1 Sampling of health service managers
The researcher selected managers/supervisors (appraisers) of health workers to
participate in qualitative study using purposeful or judgemental sampling method.
Purposive sampling is a non-probability sampling method in which the

138
researcher uses his own judgement regarding the participants from whom
information is collected (Polit & Beck 2008:355). The researcher usually chooses
the sample based on his knowledge of the group to be sampled and is certain
that respondents have the information required. The main disadvantage of this
method is its potential for inaccuracy in the researcher‟s criteria and the resulting
sample selection (Amin 2005:242; Saunders et al 2009:237).
During this study the inclusion criteria was health managers who have worked in
the selected districts for at least 6 months, and were involved in supervising, and
appraising health workers. Both the male and female managers were included.
Additionally, participants had to voluntarily consent to participate in the study.
The political leaders who are members of the DHMT were excluded.
3.6.1.2 Sample size for health service managers
Polit and Beck (2008:357) suggest that the sample for qualitative study should
be determined based on the information needs. Hence, the guiding principle in
sampling is data saturation (sampling to the point at which no new information is
obtained, and redundancy is achieved). In this study, a total of 24 health services
managers were invited to participate, however, only 21 managers accepted to be
interviewed. This gave a response rate of 87.5% from the managers. Teddlie
and Yu (2007:88) emphasise that a sample size of least 20 to 30 is adequate to
achieve representativeness, and reach the saturation level in a qualitative study.
3.6.2 Data collection during the qualitative study (level 2)
The researcher used a semi-structured interview guide (annexure I) to collect
data from the health service managers.

139
3.6.2.1 Data collection approach and method for health service managers
As already stated, the researcher used a semi-structured interview guide
(annexure I) for the qualitative strand of this study in order to have uniformity in
the questions. According to Saunders et al (2009:320) structured interviews are
based on identical set of questions. The interview technique is unique in that it
involves the collection of data through direct verbal interaction. The response
rates are usually high during face-to-face interactions given that many people
cannot easily fill out the questionnaires. The interview situation permits the
researcher to follow verbal leads and thus obtain more data and greater clarity of
the questions which seem to be ambiguous or confusing to the participants. The
interview situation also permits greater depth than other methods data collection
such as the questionnaires (Amin 2005:274; Polit & Beck 2008:424).
Indeed Polit and Beck (2008:424) emphasise that the strengths of interviews
outweigh those of questionnaires, although they are costly, prevent anonymity
and bear the risk of interviewer bias. In addition, the interviewees are less likely
to give „I don‟t know‟ answers, hence missing information is minimised. In an
interview the order of the questioning does not matter a lot, since the interviewer
is at liberty to change the order in which the questions are asked. Interviews also
help to control the sample since the researcher knows whether the participants
are the intended target. Lastly, with face-to-face interviews additional information
such as understanding and the level of cooperation can be obtained through
direct observations (Polit & Beck 2008:425).
3.6.2.2 Development of the interview schedule
The interview guide for the health service managers (appraisers) was developed
based on the theoretical framework, literature review, and the objectives of the
study. The structured interview guide was meant to solicit in-depth information
about performance of health workers and the current practices used to manage
their perfomance.

140
3.6.2.3 Structure of the interview schedule
The semi-structured interview guide (Annexure I) consisted mainly of open-
ended questions. The interview guide had two main parts namely sections A and
B.
Section A consisted of seven questions or items about the biographic data of
the participants such as the gender, age, district of employment, whether they
have qualification in management, and opportunities for discussing performance.
This section has a mixture of closed and open-ended questions.
Section B consisted of eight open-ended questions. These questions were
meant to probe about factors that enhance or impede the performance of health
workers and how decentralisation has affected performance of health workers.
Other questions probe about the health workers‟ behaviours towards their
patients. The manager‟s perspective of adaptive, proactive, and proficiency
performance behaviours of the health workers within their respective districts
were explored. Furthermore, the interview guide consists of probing questions
concerning the dimensions of performance of health workers namely availability,
competence, productivity, and responsiveness. There are also questions to
investigate how performance appraisal is planned, measured, reported,
recognised, and how the appraisal information is utilised. Lastly, the researcher
elicited the views of the health services managers on how they wish to see
performance of health workers improved in their districts.
3.6.2.4 Training of the research assistants
The researcher recruited four research assistants to assist in data collection
during both the quantitative and the qualitative phases. The research assistants
participated in distributing and collecting the questionnaires in the quantitative
phase and were also involved in collecting data from health service managers in
the respective districts. The researcher recruited research assistants with
background training in public health and social sciences at post graduate level,
and with prior experience in conducting research. They had good communication

141
skills, and were fluent in both written and spoken English. Training was
conducted in order to ensure standardisation of data collection process.
Depending on the prior experience of the research assistants, training covered
both the general procedures (such as how to conduct an interview), and those
specific to this study (such as how to administer particular questions) as well as
the ethical standards for conducting research (Polit & Beck 2008:382). The
training covered topics and discussion on interview techniques. This was
followed by rehearsals and role plays, until the research assistants mastered the
skills (Polit & Beck 2008:383). The training took two days and was facilitated
among others by one consultant on qualitative research methodology from
Makerere University Institute of Social Research.
3.6.2.5 Administration of the interviews
The structured interviews use formal and written questions which are asked
face-to-face with interactions between the interviewers and the participants (Polit
& Beck 2008:428). Polit and Beck (2008:429) point out that administering
interview schedules requires different skills. The quality of interview data relies
heavily on interviewer‟s proficiency. During this study, the researcher together
trained research assistants tried as much as possible to put the participants at
ease so that they feel comfortable in expressing their opinions. The interviews
were conducted at the respective offices of the participants. The interviewers
kept time of the appointments, and attempted to be unbiased (Polit & Beck
2008:429). Questions were asked orally in English, as they appear on the
interview schedule and the responses were recorded both in audio and writing.
By probing and repeating the questions when required, the interviewers elicited
more useful information about the study topic. Before the interview commenced,
the interviewers explained the purpose and procedure for the interview, and
requested for permission to use an audio tape recorder (Polit & Beck 2008:386).
The participants were assured that all the information they were to provide would
be treated with utmost confidentiality. The interviews only commenced after an
informed written consent. The participants were assured that they were free to

142
withdraw from the interview at any time even if they had earlier consented. The
participants were also given an option to stop the tape at any time during the
interview. The interviews were transcribed in full, and participants were asked to
review the transcription after each interview (Saunders et al 2009:485). The
participants were encouraged to make additional notes directly on the
transcribed page which were returned to the researcher. This process was
important for those participants who were comfortable with written versus oral
expression (Troiano 2003:406).
3.6.2.6 Criteria for enhancing quality and integrity of qualitative data
Polit and Beck (2008:763) define qualitative research as „…the investigation of
phenomena, typically in an in-depth and holistic fashion, through the collection of
rich narrative materials using a flexible research designs‟. Both qualitative and
quantitative researchers need to test and demonstrate that their studies are
credible. While credibility in quantitative research depends on instrument
construction, in qualitative research the researcher is the instrument (Patton
2002:14; Saunders et al 2009:182). Although reliability and validity are treated
separately in quantitative studies, these terms are not viewed separately in
qualitative research. Instead the terminology that encompasses both such as
credibility, transferability, and trustworthiness is used instead (Golafshani
2003:600; Polit & Beck 2008:196).
Lincoln and Guba (1985) cited in Polit and Beck (2008:539) propose four
constructs for measuring the trustworthiness or soundness of the qualitative
research design. These include credibility, transferability, dependability and
confirmability. In this study the researcher made use of these constructs to
ensure the trustworthiness of the findings. A variety of techniques were used to
ensure that these four qualitative dimensions are tested and met.
Credibility refers to how accurately the subject of the study is identified and
described by the inquiry (Troiano 2003:407). Polit and Beck (2008:539) refer
to credibility as the confidence in truth of data and its interpretation. In this

143
study, credibility was ensured through memoing, member checking, and peer
debriefing (Polit & Beck 2008:545-548). In addition, the researcher took
comprehensive field notes; audio taped the interviews, and transcribed the
interviews verbatim.
Dependability refers to the stability (reliability) of data over time and
conditions (Polit & Beck 2008:539). Troiano (2003:407) mentions that
dependability measures the researcher‟s ability to account for changes in the
phenomenon under study. In this study, the researcher strengthened
dependability through checking and re-checking for the presence or absence
of the phenomenon by careful documentation of the interviews. In addition,
dependability was ensured through space, person, investigator, and
methodological integration (triangulation) of data (Polit & Beck 2008:549).
Confirmability refers to the congruence between two or more independent
people about the accuracy, relevance and meaning of data (Polit & Beck
2008:539). In other words confirmability is a measure of the researcher‟s
objectivity. In this study, confirmability was reinforced through inter-coder
checks, peer review and through debriefing sessions (Polit & Beck
2008:544).
Transferability refers to extent to which the findings can be applied or have
applicability in other settings or groups (Polit & Beck 2008:539). In this study,
the applicability of one set of data was achieved through triangulation of data
by use of multiple informants and multiple data collection methods. The
applicability was also ensured by taking comprehensive field notes and
ensuring that an adequate sample for data saturation was reached (Polit &
Beck 2008:544; Troiano 2003:407). Indeed, by the 17th interview, the
researcher had started getting almost no new information from the
respondent which was an indication of data saturation.
Authenticity refers to the extent to which the researcher fairly and faithfully
showed a range of different realities. According to Polit and Beck (2008:540),
authenticity emerges in a report when it conveys the tone of participants. In
this study, authenticity was ensured through audio taping and verbatim
transcription of the interviews. In addition, authenticity was also achieved
through prolonged engagement with the participants.

144
3.6.3 Qualitative data analysis
Qualitative research is increasingly becoming common in health service
research (Bradley, Curry & Devers 2007:1758). The analysis of qualitative data
is labour intensive. It requires creativity, and conceptual sensitivity (Polit & Beck
2008:507). The analysis of qualitative data is an active and interactive process.
Generally, qualitative data is challenging even to experienced researchers
because there is lack of universal rules for data analysis and enormous amount
of work is required to reduce data for reporting purposes (Polit & Beck
2008:507). Data analysis in qualitative research usually begins during the
process of data collection, mainly because the results of early data collection
guide the subsequent field work and allow timely theorising of the results (Polit &
Beck 2008:508).
3.6.3.1 Processing and analysing interview data
Bradley et al (2007:1758) and Polit and Beck (2008:509) mention that the
analysis of interview data involves a systematic approach for discovering and
categorising ideas that are conveyed by the participants. The first step in data
analysis is data-coding process. It is almost impossible to interpret qualitative
data unless one codes them. The codes define categories by pooling a wealth of
ideas into some order and structure. The codes are tags or labels which are
assigned to the whole document or segments of the document to help catagorise
key concepts while preserving the context in which these concepts occur
(Bradley et al 2007:1761). In this study, once the categories were identified and
given names, the researcher related them to the main phenomenon or idea
(performance of health workers). The coded results provided a comprehensive
summary of the content of the interviews.
Saunders et al (2009:490-497) suggest the following procedures for generating
meaning from transcribed and interview data:

145
counting frequencies of occurrences of themes;
noting patterns of the themes, which may originate from repeated themes;
considering plausibility by making sense out of the data collected to reach a
conclusion;
clustering by setting items into categories;
identifying and noting relationships between themes;
building a logical chain of evidence by noting causality and making
conclusions; and
making conceptual coherence by moving from constructs to theories to
explain the phenomena.
In this study, the researcher followed the following steps when processing the
data from the transcriptions of the audio taped interviews and field notes. In case
of each interview question the researcher:
read the data from each set without writing down anything;
read the data the second time and noted the themes and patterns emerging
as characteristics about performance of health workers;
wrote down the themes and categories as they appeared in each set of data.
These themes were laid out on a chart such that the information from each
case was visible. Codes were then developed for the themes that are related
to the research objectives;
used the codes from each theme, to enable the researcher to revisit the data
sets and coded the relevant segment in each theme; and
from the data recorded against each theme, the answers to the relevant
research objectives were obtained. This data was then crosschecked by the
statistician to ensure that there was consistency between the themes,
subthemes and the categories.

146
3.7 ETHICAL CONSIDERATIONS
According to De Vos et al (2005:57) ethics means „…preferences that influence
behaviour in relations‟. Ethics is mostly associated with morality, to deal with
issues of rights and wrong among societies. Therefore, ethics in the use of
human subject for research should not go without careful examination. Amin
(2005:28) adds that ethics refers to „…well based standards of right and wrong
that prescribe what humans ought to do usually in terms of rights, obligations,
benefits to society, fairness, or specific virtues‟. Polit and Beck (2008:753) also
describe ethics as a system of moral values concerned with the degree to which
research procedures adhere to professional, legal and social obligations of the
participants. Therefore, ethical consideration in research should uphold fairness,
honesty, openness, disclosure of methods, and the purpose for which the
research is being carried out. Based on this understanding, the researcher
followed the following ethical standards during the process of this study.
3.7.1 Protecting the participants
Every individual is entitled to the right to privacy and dignity. In this study, the
researcher treated the respondents with respect and sought their cooperation
through an informed written consent (Annexure E) (Polit & Beck 2008:171). Amin
(2005:40) and Saunders et al (2009:187) argue that participants should be told
of the research interest and should give permission to proceed. The researcher
ensured that the participants‟ identities are protected so that the information
collected does not harm them in any way. No participant‟s names were recorded
in any form on the questionnaires to ensure anonymity and confidentiality (Polit
& Beck 2008:170). The researcher did not at any point relate any information
collected to any particular individual. The researcher only collected data relevant
to this study and made the necessary effort to disclose and explain how the
participants would benefit from the results of this study. It was important for the
participants to understand the value of the study and how the information would
be used before giving their consent. Participation in this study was voluntary and
participants were informed of their right to withdraw from the study even if they

147
had initially given their consent. No form of coercion was used for those
individuals who did not show interest to participate in the study (Polit & Beck
2008:172).
3.7.2 Protecting the right of the institution
The researcher requested and received ethical clearance of the study from the
Research and Ethics Committee at the Department of Health Studies of the
University of South Africa (Annexure A). The researcher presented the certificate
of ethical clearance of UNISA to Uganda National Council for Science and
Technology (UNCST) to get clearance to collect data in Uganda (Annexure B).
The researcher also requested for permission from the Ministry of Health in
Uganda to conduct the study in the public health facilities (Annexure C). At the
district and health facility levels permission was sought from DHOs and the
respective heads of the hospitals and health centres (Annexure G). The
researcher promised to abide by the agreements made during the negotiations
for permission to conduct the study (Polit & Beck 2008:188). Furthermore, the
facilities from where the participants were drawn were identified by level of
health facility and not by name.
3.7.3 Scientific integrity of the research
The researcher respected the work of others by acknowledging all the sources
that were refered to in this study. The researcher used objective methods to
collect, analyse and report the study findings. Therefore, the researcher chose
the methodology to use based on the research objectives and not any other
reason. The data was interpreted according to the methodological standards and
not the researcher‟s fancy. The researcher maintained honesty when writing
and reporting the findings by properly explaining the methods used and the
reasons for doing so. No fabrication or distortion of data was done to fit what the
researcher wanted to achieve (Polit & Beck 2008:188). The researcher only
reported what the data revealed (Amin 2005:30; Saunders et al 2009:199). The

148
researcher honoured the participant‟s privacy. This study was low risk since it did
not involve collection of any specimen from the respondents and the researcher
did not have any contact with patients. Therefore, there was no harm this study
caused to the participants.
3.8 CONCLUSION
In this chapter the researcher has presented the research design and
methodology that was used to conduct this study. The mixed methods approach
was presented in detail. The sampling and sampling techniques used in this
study were outlined. The structure of the data collection instruments was
presented. Also presented are the strategies that were employed to ensure
validity, reliability and trustworthiness of study findings. Lastly the researcher
outlined the methods that were used to ensure that data was collected, analysed
and reported ethically. In the next chapter, the researcher presents the analysis,
presentation, and description of the quantitative research findings.

149
CHAPTER 4 ANALYSIS, INTERPRETATION AND DISCUSSION OF QUANTITATIVE DATA
(LEVEL 1)
4.1 INTRODUCTION
This chapter discusses the quantitative data analysis and interpretation. Kruger,
De Vos, Fouche and Venter (2005:218) mention that the purpose of quantitative
data analysis is to categorise, order, manipulate, and summarise data to an
intelligible and interpretable form in order to provide answers to the research
objectives and be able to draw conclusions from the data.
The objectives of this study were to
identify factors that impede or enhance the performance of health workers
assess the current practices used to manage performance of health workers
determine the views of health workers and their managers on how to improve
performance
develop a performance management framework for health workers based on
the research findings
In this chapter, the data was analysed according to the objectives of the study.
This implies that the results are not necessarily presented or discussed in the
sequence of the theoretical framework or that of the questionnaire. This chapter
is organised as follows: response rate, data analysis including testing for
normality of the data, and the reliability of the scale used. The descriptive and
inferential statistics that were used are briefly discussed. This is followed by the
presentation of the demographic characteristics of the participants and the
research findings. Finally the chapter summary is presented.

150
4.2 RESPONSE RATE
The response rate is the rate of participation in the study. According to Polit and
Beck (2008:765) the response rate is calculated by dividing the number of
persons participating in the study by the number of persons sampled. Table 4.1
shows the response rate for this study.
Table 4.1: Response rate for the study
Descriptive information Number of
questionnaires Percentage (%)
Total number of questionnaire sent out 331 100
Total number of questionnaires returned 282 85.2
Total number of usable questionnaires 276 83.4
As shown in the Table 4.1, the response rate for this study was 83.4%, which is
considered to be very good. This good participation is probably an indication that
the study was interesting to the participants given that the questionnaire items
were many. Using a similar approach to data collection in their study about
perceptions of the working conditions of health workers in Nigeria, Chirdan,
Akosu, Ejembi, Bassi, and Zoakah (2009:245) obtained a comparable response
rate of about 85.4%. Murphy-Black (2006:378) points out that studies that use
representative sample are dependent on a good response rate.
4.3 DATA ANALYSIS
Data analysis is the ability to breakdown data and to clarify the nature of the
factors and the relationships between them (Saunders et al 2009:587). Polit and
Beck (2008:751) describe data analysis as the systematic organisation,
synthesis of research data, and testing of the hypothesis using those data. The
purpose of data analysis is to provide answers to the research questions or
objectives. The plan for data analysis comes from the research objectives, the
research design, the methods of data collection used, and the level of
measurement of data (Wood & Ross-Kerr 2006:243).

151
4.3.1 Statistical analysis programme
The software that was used to analyse the data for this study was the SPSS
Version 18. The researcher collaborated with the statistician to analyse data.
Data analysis was done using both descriptive and inferential statistics. The
researcher set the p-value at less than 0.05 (p<.05) as the level of statistical
significance for the tests performed.
4.3.2 Testing for the normality of data
Following data entry and cleaning but before statistical analysis was carried out,
the researcher together with the statistician tested the data for normality. This
was done in order to determine the suitable statistical tests to use. The data for
the 26 constructs was tested for normality using the Kolmogorov-Smirnov test.
This test revealed that all the data was not normally distributed (p <.001) (see
annexure J). Therefore, since Likert scales produce ordinal data as opposed to
interval data, and given that the data was not normally distributed the non
parametric statistical tests were used (McCrum-Gardner 2008:39).
4.3.3 Reliability of the data collection scale
Reliability is the degree of consistence with which a research instrument
measures a given attribute (Polit & Beck 2008:764). Hence, reliability test
measures how consistent the participants were in answering a group of related
questions. Therefore, before calculating the average of each respondent, one
has to ascertain whether the responses were reliable.
The Cronbach alpha is the most widely used reliability index that estimates the
internal consistency of a measure composed of several subscales. The
Cronbach alpha ranges from .00 to 1.00. A measure of 1.00 signifies a perfect
reliability.

152
George and Mallery (2003:231) provide the following rule of thumb for
interpreting the Cronbach alpha: “>.90 – Excellent; >.80 – Good; >.70 –
Acceptable; >.60 – Questionable; >.50 – Poor; and <.50 – Unacceptable”.
Ideally, an alpha of .70 and above is acceptable and is considered a reasonable
goal.
Table 4.2 present a summary of the reliability coefficients of the 26 constructs or
questions used in this study.
Table 4.2: Reliability coefficients for the 26 construct
Questions (Items)
Item or construct description Number of items
Cronbach alpha (α)
11.1 - 11.10 Job related skills and abilities 10 .790
12.1 - 12.4 Self-monitoring ability 4 .865
13.1 - 13.9 Self motivation (intrinsic motivation) 9 .962
14.1 - 14.11 Commitment to organisation 11 .926
15.1 - 15.11 Individual values and beliefs 11 .849
16.1 - 16.5 Individual proficiency behaviour 5 .805
17.1 - 17.4 Individual adaptive behaviour 4 .818
18.1 - 18.3 Individual proactive behaviour 3 .763
19.1 - 19.10 Client-oriented behaviour 10 .860
20.1 - 20.9 Clarity of organisation strategy 9 .833
21.1 - 21.13 Working environment 13 .899
22.1 - 22.4 Staffing in the organisation 4 .920
23.1 - 23.5 Work schedule 5 .725
24.1 - 24.11 Organisational culture 11 .936
25.1 - 25.9 Responsiveness 9 .910
26.1 - 26.10 Availability 10 .890
27.1 - 27.6 Productivity 6 .761
28.1 - 28.9 Competence 9 .874
30.1 - 30.6 How performance review results utilised 6 .613
31.1 - 31.8 Setting performance standards 8 .952
32.1 - 32.9 Performance measurement 9 .973
33.1 - 33.6 Performance reporting 6 .787
34.1 - 34.10 Performance improvement 10 .933
35.1 - 35.6 Rewarding system 6 .807
36.1 - 36.9 Staff training and development 9 .942
37.1 - 37.6 Overall performance 6 .828
Table 4.2 shows that twenty-five (25) out of the twenty-six (26) constructs have
Cronbach alpha (α) of at least 0.70 and above. Only 1 construct (question 30)
has Cronbach alpha (α) of 0.61. Overall, this indicates that questionnaire was
reliable.

153
4.3.4 Descriptive statistics
Descriptive statistics are the various methods used to describe and summarise
data. The descriptive statistics include the means, median, and percentages. For
the purpose of this study, the researcher presented data in terms of frequencies
and percentages. The participants had to select only one response option from a
list of options provided by the researcher. All the percentages are expressed to
one decimal place in the text and in the graphical presentations. However, not all
percentages add up to 100% due to the rounding off to the nearest one decimal.
Hence, the percentages range between 99.9% and 100.1%. The responses
categories strongly agree, agree, undecided, disagree and strongly disagree
were used in the questionnaire to enable the participants respond to a specific
statement according to their personal views. For the purpose of the analysis and
discussion, the categories strongly agree and agree were grouped together to
form a category called „agree‟, likewise the strongly disagree and disagree were
grouped together to form category „disagree‟. Additionally, categories very good
and good were grouped to form category called „good‟ and very poor and poor
were grouped together to from category called „poor‟. Where the responses were
very clear and clear, these were grouped together to form a category called
„clear‟, likewise where the response was very unclear and unclear, these formed
a category called „unclear‟. The categorical data is displayed using tables and
either bar charts or pie diagrams where appropriate.
4.3.5 Inferential statistics
According to Polit and Beck (2008:755) inferential statistics is that type of
statistics that permit deductions about whether the results observed in a sample
are likely to occur in the larger population. In this study, since the data was
ordinal and not normally distributed, the association between two variables was
investigated using the non parametric Spearman‟s rho rank order correlation
coefficient (rs) (McCrum-Gardner 2008:41). The Spearman‟s rho rank order
correlation coefficient (rs) indicates the magnitude and the direction of a
relationship between two variables measured on ordinal scale (Polit & Beck

154
2008:766). The correlation coefficient can take any value between -1 and +1. A
value of +1 represents a perfectly positive correlation and a value of -1
represents a perfectly negative correlation (Saunders et al 2009:459).
The Spearman‟s rho correlation coefficient (rs) was interpreted using the rule of
thumb suggested by Hinkle, Wiersma and Jurs (1998:120), Larose (2006:45),
and Nevid (2007: A-10) as shown in Table 4.3.
Table 4.3: Rule of thumb for interpreting the size of a correlation coefficient (r)
Size of the correlation Interpretation
.90 to 1.00 (-.90 to -1.00)
.70 to .90 (-.70 to -.90)
.50 to .70 (-.50 to -.70)
.30 to .50 (-.30 to -.50)
.00 to .30 (.00 to -.30)
Very high positive (negative) correlation High positive (negative) correlation Moderate positive (negative) correlation Low positive (negative) correlation Little if any correlation
Source: Hinkle, Wiersma and Jurs (1998:120), Larose (2006:45), and Nevid (2007: A-10)
4.4 DEMOGRAPHIC INFORMATION OF THE PARTICIPANTS
This section presents the description of the biographic information of the
participants involved in this study. This information includes the gender, age,
marital status, current profession, highest professional qualification, and years of
experience as health professional. This section also presents the type of health
facility where the participants are working, the duration of their service in those
particular health facilities, the district of work, and the location of the health
facility. Table 4.4 presents the summary of the demographic characteristics of
the participants.

155
Table 4.4: Demographic characteristic of the participants (N=276)
Demographic characteristics Number Percentage (%)
Gender Female Male
(N=276) 176 100
(100) 63.8 36.2
Age 20 - 29 years 30 – 39 years 40 – 49 years 50 – 59 years 60 and above
(N=276) 50 115 57 54 0
(100) 18.1 41.7 20.7 19.6 0.0
Marital status Married Single Unknown
(N=276) 182 92 2
(100) 66.0 33.3 0.7
Current profession Medical doctor Clinical officer Registered nurse/midwife Enrolled nurse/midwife
(N=276) 19 51 111 95
(100) 6.9 18.5 40.2 34.4
Highest qualification Doctoral degree Master degree Postgraduate certificate/diploma Bachelors degree Diploma Certificate
(N=276) 2 4 5 23 148 94
(100) 0.7 1.4 1.8 8.3 53.6 34.1
Years of experience in health profession 0 – 5 years 6 – 10 years 11 –15 years 16 – 20 years 21 years and above
(N=276) 73 68 43 26 66
(100) 26.4 24.6 15.6 9.4 23.9
Type of health facility Hospital Health centre IV Health centre III Health centre II
(N=276) 119 56 80 21
(100) 43.1 20.3 29.0 7.6
Duration of service in the facility 0 – 11 months 1 – 5 years 6 -10 years 11- 15 years 16 – 20 years 21 years and above
(N=276) 53 99 51 22 28 23
(100) 19.2 35.9 18.5 8.0 10.1 8.3
District of work Kumi Mbale Sironko Tororo
(N=276) 55 106 50 65
(100) 19.9 38.4 18.1 23.6
Location of health facility Urban Rural
(N=276) 111 165
(100) 40.2 59.8
single includes the „never married, separated, divorced and widowed.
Table 4.4 shows that the majority of health workers that participated in the study
were female (n=176; 63.8%). Most of the participants (n=172; 62.3%) were aged

156
between 30 years to 49 years. There were no participants aged 60 years and
above. With regard to marital status, 66.0% (n=182) were married and 33.3%
(n=92) were single and 0.7% (n=2) did not indicate their marital staus. The
category for „single‟ included those who were never married, divorced,
separated, and the widowed. There were more professional nurses and
midwives (n=204; 74.6%) who participated in the study than the rest of the
targeted cadres of health workers. This is consistent with what is already known
that the nursing cadre constitutes the biggest proportion of the human resources
for health in most of the health systems. The clinical officers were 18.5% (n=51),
and the medical doctors were 6.9% (n=19). Most of the participants were
diploma holders (n=148; 53.6%), these were followed by the certificate holders
(n=95; 34.1%), and the bachelors degree holders (n=23; 8.3%). There were
fewer participants (n=11; 4.0%) with post graduate qualifications (certificate,
diploma, master degrees, and doctorate degrees). This is mainly because this
cadre of staff is rare to get at the district level; they are mainly working at
regional or national referral hospitals.
Overall, the majority of the participants (n=203; 73.5%) had more than 5 years of
professional experience. This indicates that most of the health workers who
participated in this study were experienced. With regard to the types of health
facility where the participants were drawn or working, most of the participants
(n=157; 56.9%) were from the various levels of health centres (II, III, IV) and
43.1% (n=119) were hospital based. Out of the 276 participants, 59.8% (n=165)
were working in rural areas, and 40.2% (n=111) in urban areas. With respect to
the duration of working in those particular health facilities, 55.1% (n=152) had
worked for 5 years or less and the rest (n=124; 44.9%) had worked in those
facilities for more than 5 years. Regarding the distribution by districts of work,
most participants (n=106; 38.4%) were from Mbale district, followed by Tororo
district (n=65; 23.6%), Kumi district (n=55; 19.9%), and Sironko district (n=50;
18.1%). This indicated good representation of participants across the 4 districts.

157
4.5 FINDINGS RELATED TO OBJECTIVE ONE
The first objective of this study was to identify the factors that enhance or impede
the performance of health workers. The researcher investigated these factors by
looking at the individual health workers‟ attributes, individual behaviours for
performance, organisational factors, and the performance dimensions. The
researcher used the Likert scale format type of questions to collect data from the
participants. The results from data analysis are presented in the following sub-
sections (4.5.1 to 4.5.5). The descriptive statistics is presented first followed by
the inferential statistics (correlations).
4.5.1 Individual attributes
This section presents the responses of the participants concerning their
attributes. The results are presented according to the following subheadings: job
related skills and abilities, self-monitoring ability, self-motivation (intrinsic
motivation), commitment to the organisation, and individual values and beliefs.
4.5.1.1 Job related skills and abilities
Table 4.5 presents the results of the analysis of the responses of the participants
concerning their job related skills and abilities.

158
Table 4.5: Job related skills and abilities of the participants (N=276)
Item description Poor Average Good Very good Total
n % n % n %
n % N %
My skills in assessing clients are 0 0.0 0 0.0 138 50.0 138 50.0 276 100.0
My abilities in delivering health education are
0 0.0 54 19.6 112 40.6 110 39.9 276 100.1
My clinical competences are 0 0.0 28 10.1 138 50.0 110 39.9 276 100.0
My skills in counselling clients are
0 0.0 55 19.9 138 50.0 83 30.1 276 100.0
My interpersonal relations are 0 0.0 27 9.8 112 40.6 137 49.5 276 99.9
My abilities in providing in-service training are
27 9.8 84 30.4 82 29.7 83 30.1 276 100.0
My time management abilities are
0 0.0 110 39.9 111 40.2 55 19.9 276 100.0
My skills in supervising other health workers are
0 0.0 55 19.9 139 50.4 82 29.7 276 100.0
My skills in maintaining health facility equipment are
0 0.0 54 19.6 167 60.5 55 19.9 276 100.0
My abilities to implement the Uganda National Minimum Health Care Package (UNMHCP) are
28 10.1 54 19.6 84 30.4 110 39.9 276 100.0
It is evident from Table 4.5 that the participants have good or very good skills
and abilities in assessing clients (n=276; 100.0%), have good interpersonal
relations (n=249; 90.1%), have good clinical competences (n=248; 89.9%), have
good skills and abilities in delivering health education (n=222; 80.5%), good
skills in maintaining health facility equipment (n=222; 80.4%), have good skills in
counselling clients (n=221; 80.1%), and skills in supervising other health workers
(n=221; 80.1%). In addition, the participants have good skills and abilities in
implementing the UNMHCP (n=194; 70.3%), have good time management
abilities (n=166; 60.1%) and good abilities in providing in-service training (n=165;
59.8%).
From these results it appears that the health workers have the skills and abilities
to enable them perform their duties satisfactorily. However, it has to be noted
that time management was average for a big proportion of the participants
(n=110; 39.9%), and a big proportion of health workers (n=27; 9.8%) had poor
abilities in providing in-service training. This is worrisome because time
management and in-service training are vital for good performance. Kahya
(2007:517) mentions that skills and abilities dictate the capability of individuals to
perform tasks as required. The findings of this study indicate that health workers

159
are knowledgeable, skilled, and are able to perform well. McKeon, Forgarty, and
Hegney (2006:119) report that higher level of knowledge and skills are
associated with lower levels of violations of patients‟ safety procedures.
Therefore, the high level of skills and abilities can act as a buffer against unsafe
practices in the health facilities. This finding is in line with previous research by
Meurier (2000:202) which identifies lack of knowledge as one of the most
common system failures contributing to unsafe practices in health facilities.
However, health workers may sometimes be let down by other factors such as
organisational factors. Lundstrom, Pugliese, Bartley, Cox, and Guither (2002:93)
mention that environmental and organisational factors can influence the well-
being of health workers, and ultimately the satisfaction, safety, and quality of
care provided to the patients.
4.5.1.2 Aspects of self-monitoring ability
Table 4.6 presents the responses regarding the aspects of self-monitoring ability
of the participants. All the participants answered the questions on the self-
monitoring ability scale. They had to indicate whether they strongly disagree,
disagree, undecided, agree or strongly agree with the statements. For the
purpose of analysis and discussion both strongly disagree and disagree were
combined to give a response of ‟disagree‟ and strongly agree and agree were
reported as „agree‟.
Table 4.6: Self-monitoring ability of the participants (N =276)
Item description Strongly disagree
Disagree Undecided Agree Strongly agree
Total
n % n % n % n %
n % N %
It is easy for me to copy the behaviour of others
54 19.6 110 39.9 0 0.0 84 30.4 28 10.1 276 100.0
I always defend the ideas that I already believe in
0 0.0 28 10.1 28 10.1 136 49.3 84 30.4 276 99.9
I am able to adapt myself to different situations and different people
0 0.0 0 0.0 0 0.0 85 30.8 191 69.2 276 100.0
I can be friendly towards others even though I really dislike them
0 0.0 56 20.3 0 0.0 193 69.9 27 9.8 276 100.0

160
As shown in Table 4.6, most of the participants (n=164; 59.5%) disagreed that
they find it easy to copy behaviours of others while 40.5% (n=112) agreed that
they find it easy to copy the behaviours. This can be interpreted in two ways. On
the one hand this characteristic may be good for performance because some
health workers may not copy bad behaviours such as poor time management
and being rude to patients. On the other hand some health workers can copy the
good behaviours within their organisations that can actually enhance their
performance.
Two hundred and twenty participants (79.7%) agreed that they always defend
the ideas they already believe in. This can be both good and at the same time
detrimental to performance. Some health workers may defend performance
boosting ideas such as voluntarily performing one‟s duties even after official
working hours. However, when health workers defend negative ideas such as
unnecessary absenteeism, it follows that performance will be compromised. All
the participants (n=276; 100.0%) agreed that they can adapt themselves to
different situations and to different people. Most respondents (n=220; 79.7%)
agreed that they can be friendly towards others even though they really dislike
them, and 20.3% (n=56) disagreed. These results indicate considerable levels of
flexibility and professionalism among the participants which in turn can improve
performance.
Barrick, Park, and Mount (2005:763) assert that high self monitoring ability may
have an important effect on jobs for which interpersonal performance is required
such as health care delivery. Barrick et al (2005:764) mention that self-
monitoring has important work-related implications and suggest that self
monitoring should be considered as an important moderator when examining the
relationship between personality and performance.
4.5.1.3 Dimensions of self motivation
Table 4.7 shows the participants‟ responses regarding the aspects of self
motivation.

161
Table 4.7: Dimensions concerning self motivation of health workers (N =276)
Item description Strongly disagree
Disagree Undecided Agree Strongly agree
Total
n % n % n % n %
n % N %
I feel satisfied when I do my job well
0 0.0 27 9.8 0 0.0 57 20.7 192 69.6 276 100.1
When I do my work well it contributes to my personal growth and development
28 10.1 27 9.8 0 0.0 84 30.4 137 49.6 276 99.9
I get a sense of accomplishment when I perform my work well
0 0.0 55 19.9 0 0.0 28 10.1 193 69.9 276 99.9
My job increases my feeling of self esteem
0 0.0 27 9.8 0 0.0 195 70.7 54 19.6 276 100.1
I have considerable freedom on how to do my work
0 0.0 56 20.3 4 1.4 184 66.7 32 11.6 276 100.0
I feel satisfied when I help others to achieve their goals
0 0.0 27 9.8 0 0.0 56 20.3 193 69.9 276 100.0
I feel satisfied when others recognise my achievements
0 0.0 27 9.8 0 0.0 140 50.7 109 39.5 276 100.0
I achieve my goals by satisfying my clients‟ needs
0 0.0 27 9.8 0 0.0 85 30.8 164 59.4 276 100.0
Overall I am satisfied with my job
0 0.0 55 19.9 29 10.5 110 39.9 82 29.7 276 100.0
From Table 4.7, the majority of the participants (n=249; 90.2%) agreed that they
felt satisfied when they do their work well, when others recognise their
achievements, and when they help others to achieve their goals. Two hundred
and forty nine (90.2%) agreed that their job increases the feeling of self esteem,
and they achieve their goals by satisfying their clients‟ needs. Additionally,
80.0% (n=221) of the participants agreed that when they do their work well it
contributes to their personal growth and development and that they get a sense
of accomplishment when they perform their work well. Others (n=216; 78.3%)
agreed that they have considerable freedom to do their work. Overall, 69.6%
(n=192) of the participants agreed that they were satisfied with their job. These
findings indicate that the health workers are self motivated and indeed willing to
perform their duties.
A study done in Nigeria (Chirdan et al 2009:247) reports that over two-thirds of
the health workers were generally satisfied with their current jobs. This is

162
comparable to the results of this study. Willis-Shattuck, Bidwell, Thomas,
Wyness, Blaauw, and Ditlopo (2008:[5]) report that recognition and/or
appreciation from managers, colleagues, or community is one of the most
important motivating factors to health workers in many developing countries.
Dieleman et al (2006:[5]) also found that in Mali health workers are encouraged
by getting results from their work, being useful to the society and taking care of
the people. Similarly, Mathauer and Imhoff (2006:[9-10]) report that in Kenya and
Benin, health workers are motivated by their desire to help patients, professional
advancement, and the recognition they get from the clients and managers.
Therefore, increasing health workers‟ intrinsic motivation serves to improve job
satisfaction, and attainment of personal objectives. This improves performance
of health workers.
4.5.1.4 Aspects concerning individual commitment to the organisation
Table 4.8 shows the responses of health workers concerning their commitment
to the organisations.

163
Table 4.8: Dimensions of the participants’ commitment to the organisation (N= 276) Item description Strongly
disagree Disagree Undecided Agree Strongly
agree Total
n % n % n % n %
n % N %
I am willing to put more effort than what is normally expected to help my organisation become successful
0 0.0 0 0.0 0 0.0 139 50.4 137 49.6 276 100.0
I am willing to accept almost any type of work in order to continue working in this organisation
0 0.0 84 30.4 0 0.0 138 50.0 54 19.6 276 100.0
My organisation inspires me to perform to the best of my ability
0 0.0 56 20.3 28 10.1 164 59.4 28 10.1 276 99.9
I talk highly about this organisation to my friends as a great place to work for
0 0.0 84 30.4 28 10.1 56 20.3 108 39.1 276 99.9
I would encourage my friends and family to seek health care from this facility
0 0.0 0 0.0 57 20.7 192 69.6 27 9.8 276 100.1
My supervisor takes personal interest in my career
0 0.0 55 19.9 29 10.5 110 39.9 82 29.7 276 100.0
My organisation strongly acknowledges my goals and values
28 10.1 56 20.3 28 10.1 109 39.5 55 19.9 276 99.9
I would be very happy to spend the rest of my life with this organisation
0 0.0 84 30.4 28 10.1 109 39.5 55 19.9 276 99.9
It would be very hard for me to leave this organisation right now even if I wanted to
29 10.5 83 30.1 27 9.8 82 29.7 55 19.9 276 100.0
I think that moving from one organisation to another would interfere with my career development
57 20.7 55 19.9 27 9.8 28 10.1 109 39.5 276 100.0
Overall, I am committed to this health facility
0 0.0 27 9.8 55 19.9 112 40.6 82 29.7 276 100.0
Table 4.8 shows that all the participants (n=276; 100.0%) agreed that they are
willing to put more effort than what is normally expected to make their
organisations successful. Two hundred and nineteen participants (79.4%)
agreed that they would encourage their friends and family to seek health care
from their facilities. About 70% (n=194; 70.3%) of the participants agreed that

164
overall they are committed to their respective health facilities. One hundred and
ninety two (69.6%) of the participants agreed that their organisations inspire
them to perform to the best of their abilities, and are willing to accept almost any
type of work in order to continue working in the organisation.
Similarly, 69.6% (n=192) of the participants, agreed that their supervisors take
personal interest in their careers. About 59% (n=164; 59.4%) agreed that they
talked highly about their facilities, that their organisations strongly acknowledges
their goals and values and that they would be very happy to spend the rest of
their career lives working for the organisation. However, 30.4% (n=84) of the
participants, disagreed that their organisations acknowledge their goals and
values and were unwilling to spend the rest of their working period with the
organisation. Slightly less than 50% (n=137; 49.6%) agreed that it would be very
hard for them to leave their organisations right now even if they wanted to and
also agreed that moving from one organisation to another would interfere with
their career development. However, for both these variables (n=112; 40.6%)
disagreed.
Overall, all these findings indicate that the health workers are considerably
committed to work for their respective health facilities. Hence, organisational
commitment is an important factor that can either enhance or impede the
performance of health workers. Managers and management researchers have
long believed that organisational goals are unattainable without enduring
commitment of the organisation members (Tella, Ayeni & Popoola 2007:2).
According to Huang, Chen, Tsai and Lin (2006:10), members of the organisation
who have high level of commitment always show better job performance, job
satisfaction, and productivity as well as lower levels of absenteeism and
tardiness. Armstrong (2009:345) proposes the following steps to create
commitment: initiatives to increase involvement and ownership, communication,
leadership development, developing a sense of excitement in the job, and
developing various human resource policies and practice initiatives.

165
4.5.1.5 Aspects concerning the individual values and beliefs
Table 4.9 presents the responses concerning the individual values and beliefs of
health workers.
Table 4.9: Dimensions of individual values and beliefs (N= 276)
Item description Disagree Undecided Agree Strongly agree
Total
n % n % n %
n % N %
I communicate openly with everyone in this organisation
56 20.3 0 0.0 193 69.9 27 9.8 276 100.0
When I make a mistake I honestly admit and try to rectify it
28 10.1 0 0.0 167 60.5 81 29.3 276 99.9
I think it is better to work as a team in order to realise my potential and get work done
28 10.1 0 0.0 55 19.9 193 69.9 276 99.9
Safety of patients is very important to me
0 0.0 0 0.0 83 30.1 193 69.9 276 100.0
I am in support of continuous improvement in patient care
0 0.0 0 0.0 83 30.1 193 69.9 276 100.0
I put a lot of effort to achieve positive health outcomes for my patients
0 0.0 28 10.1 140 50.7 108 39.1 276 99.9
I believe in provision of client driven services
27 9.8 28 10.1 113 40.9 108 39.1 276 99.9
I believe in respect of the patients
0 0.0 0 0.0 112 40.6 164 59.4 276 100.0
I believe organisational loyalty should be encouraged and rewarded
27 9.8 0 0.0 112 40.6 137 49.6 276 100.0
I believe promotions should be based on individual performance
0 0.0 0 0.0 28 10.1 248 89.9 276 100.0
I believe team work is valuable and should be rewarded
0 0.0 0 0.0 83 30.1 193 69.9 276 100.0
From Table 4.9, all the participants (n=276; 100.0%) agreed that they believed in
respect for the patient, that safety of patients was very important to them, and
were in support of continuous improvement in patient care. All participants
(n=276; 100.0%) believed that teamwork was valuable and should be rewarded,
and they also believed that promotions in service should be based on individual
performance. About ninety percent [90.2% (n=249)] of the participants, agreed
that organisational loyalty should be encouraged and rewarded. Most of the
participants (n=248; 89.9%) agreed that they put in a lot of effort to achieve
positive health outcomes for their patients and when they make mistakes they
honestly admit and try to rectify them. Likewise, most of the participants (n=248;
89.8%) also think that it is better to work as a team in order to realise their

166
potential and get work done. Lastly, the majority of the participants (n=221;
80.0%) agreed that they believed in the provision of the client driven services.
Given the responses from the participants it can be said that the health workers
possess the individual values and beliefs that are conducive to good
performance. Suliman and Iles (2000:415) and Van Scotter (2000:93) mention
that individual work-related attitudes, values and beliefs, job satisfaction, and
organisation commitment are important factors for performance. Mugisha
(2009:56-57) adds that employees' norms, beliefs, and values can be used to
support development of appropriate behaviours, organisational commitment, and
organisational strategy. Therefore, individual values and beliefs can be used to
create organisational integration and if well managed it can translate into an
effective key managerial success in the area of health workers‟ performance.
4.5.2 Individual behaviours for performance
The individual behaviours that were investigated in this study include: proficiency
behaviour, adaptive behaviour, proactive behaviour and client-oriented
behaviours. The findings for each of these behaviours are indicated in the
following sub-sections (4.5.2.1 to 4.5.2.4).
4.5.2.1 Dimensions of individual proficiency behaviours of health workers
Table 4.10 shows the responses of health workers concerning their proficiency
behaviours.

167
Table 4.10: Dimensions concerning the individual proficiency behaviours of health workers (N = 276) Item description Disagree Undecided Agree Strongly
agree Total
n % n % n %
n % N %
I always use standard procedures to ensure that my core tasks are completed properly
55 19.9 0 0.0 139 50.4 82 29.7 276 100.0
I coordinate my work with my co-workers
0 0.0 0 0.0 140 50.7 136 49.3 276 100.0
I communicate openly with my co-workers
0 0.0 0 0.0 141 51.1 135 48.9 276 100.0
I provide help to my co-workers when asked
0 0.0 0 0.0 113 40.9 135 59.1 276 100.0
I portray a positive image of my organisation to others such as the patients
28 10.1 28 10.1 84 30.4 136 49.3 276 99.9
Table 4.10 shows that all the participants (n=276; 100.0%) agreed that they
communicate openly with each other and coordinate their work well amongst
themselves and provide help to co-workers when asked. Two hundred and
twenty-one (80.1%) of the health workers agreed that they use standard
procedures to ensure that their core tasks are properly done, and 19.9% (n=55)
of the participants disagreed. Furthermore, 79.9% (n=220) of the participants
agreed that they portray a positive image of their organisations to the
stakeholders and 10.1% (n=28) either disagreed or were undecided.
Overall, the participants displayed satisfactory proficiency behaviours which are
likely to support good performance. This finding is contrary to what Nzinga,
Mbindyo, Mbaabu, Warira and English (2009:[5]) found in Kenya. In their study
they established that health workers working in the hospital paediatric
departments were not cooperating and communicating openly with each other
and this was affecting their performance and the quality of care given to patients.
According to Kahya (2009:102), behaviours that involve cooperation, creativity,
and self development contribute to job performance. Griffin et al (2007:340)
mention that role clarity is one of the strongest predictors of individual, team, and
organisation task proficiency behaviours for performance.

168
4.5.2.2 Dimensions of individual adaptive behaviours
The following table presents the results of the individual adaptive behaviours for
the health workers.
Table 4.11: Dimensions concerning the adaptive behaviours of health workers
(N=276)
Item description Disagree Agree Strongly agree
Total
n % n %
n % N %
I adjust well to changes in my core tasks
0 0.0 138 50.0 138 50.0 276 100.0
I have learned new skills to help me adjust to changes in my core tasks
0 0.0 221 80.1 55 19.9 276 100.0
I respond constructively to changes in the way my team works
55 19.9 167 60.5 54 19.6 276 100.0
I am flexible with regard to the overall changes in my organisation
28 10.1 194 70.3 54 19.6 276 100.0
Table 4.11 shows that all the participants in the study (n=276; 100.0%) agreed
that they adjust well to changes in their core tasks and have learned new skills to
help them to adjust to the changes that come up in their core tasks. A significant
number of participants (n=248; 89.9%) agreed that they are flexible with regard
to the overall changes within their organisations and 10.1% (n=28) participants
disagreed. Similarly, 80.1% (n=221) of the participants agreed that they respond
constructively to changes in the way their teams work.
In general these results indicate that the participants display positive individual
adaptive behaviours which are likely to contribute to good performance. Nzinga
et al (2009:[6-7]) report that in Kenya there were inadequacies in adapting or
responding to new clinical practices or guidelines due to lack of the perceived
benefits linked to their uptake. In that study, senior and older health workers
were often reported to be stuck in the patterns of previous clinical
practicealthough there were some exceptions. This problem was attributed to the
lack of experience of being compelled to change by emerging knowledge. Griffin
et al (2007:341) assert that openness to change is a strong predictor for adaptive

169
behaviours. This can enhance task performance for an individual, a team and
the organisation.
4.5.2.3 Dimensions concerning individual proactive behaviours
Table 4.12 shows the responses from the participants regarding their individual
proactive behaviours.
Table 4.12: Dimensions for individual proactive behaviours (N = 276)
Item description Strongly disagree
Undecided Agree Strongly agree
Total
n % n % n %
n % N %
I have initiated better ways of performing my core tasks
0 0.0 0 0.0 221 80.1 55 19.9 276 100.0
I have developed new and improved methods to help my work unit perform better
27 9.8 0 0.0 194 70.3 55 19.9 276 100.0
I have made suggestions to improve the overall performance of the organisation
27 9.8 28 10.1 139 50.4 82 29.7 276 100.0
From Table 4.12, it is clear that all the participants (n=276; 100.0%) agreed that
they have initiated better ways of performing their core tasks. Two hundred and
forty nine (90.2%) agreed that they have developed new and improved methods
to help their work unit or team perform better and 9.8% (n=27) of the participants
disagreed. Of the participants, 80.1% (n=221) indicated that they have made
suggestions to improve the overall performance in their organisations, 10.1%
(n=28) were undecided, and 9.8% (n=27) disagreed.
The results clearly indicate that the health workers are proactive and this is likely
to enhance their performance. Kahya (2009:102) observes that workers who
score highly on creative performance or are proactive achieve high outcomes in
innovative effectiveness. This is good for individual, team, and organisational
performance. Griffin et al (2007:332) maintain that proactive behaviours ensure
that the whole organisation develops rather than only individual departments.

170
4.5.2.4 Dimensions concerning the individual client oriented behaviour
Table 4.13 shows the responses from the participants concerning their client
oriented behaviours
Table 4.13: Dimensions concerning the client oriented behaviours (N =276) Item description Disagree Undecided Agree Strongly
agree Total
n % n % n %
n % N %
I try to assess what the clients‟ needs are
0 0.0 2 0.7 173 62.7 101 36.6 276 100.0
I have the clients best interest in mind
0 0.0 0 0.0 140 50.7 136 49.3 276 100.0
I try to address the clients‟ needs with the appropriate treatment available
0 0.0 28 10.1 138 50.0 110 39.9 276 100.0
I am aware that my task is to serve my clients to the best of my ability
0 0.0 0 0.0 140 50.7 136 49.3 276 100.0
I respect what the patients have to say
0 0.0 0 0.0 85 30.8 191 69.2 276 100.0
I have respect for my clients
27 9.8 0 0.0 112 40.6 137 49.6 276 100.0
I give clients opportunity to express their needs with me
0 0.0 0 0.0 139 50.4 137 49.6 276 100.0
I take a problem solving approach to care for my clients
0 0.0 0 0.0 167 60.5 109 39.5 276 100.0
I always take time to perform my clinical work
28 10.1 0 0.0 112 40.6 136 49.3 276 100.0
I always behave in a professional manner
0 0.0 0 0.0 140 50.7 136 49.3 276 100.0
Table 4.13 indicates that all the participants (n=276; 100.0%) are aware of their
task of serving the clients to the best of their ability, have the clients‟ interest in
mind, and respect what their patients say. All the participants (n=276; 100.0%)
indicated that they always behave professionally, take a problem solving
approach to care for their clients, and give the clients opportunity to express their
needs. Almost all the participants (n=274; 99.3%) agreed that they try to assess
what their clients‟ needs are and 90.2% (n=249) of the participants have respect
for their clients. Close to ninety percent (n=248; 89.9%) of the participants
indicated that they always take time to perform their clinical work and try to
address their clients‟ needs with the appropriate treatment available.

171
These results demonstrate that the participants were generally more inclined to
display client-oriented behaviours. Lanjananda and Patterson (2009:9) explains
that the client oriented behaviours include attributes such as empathy,
assurance, responsiveness, authenticity, listening, dedication, and civility which
the health workers in this study seem to display. The behaviours of frontline
health workers like doctors, nurses and clinical officers are critical to both patient
satisfaction and successful health outcomes.
4.5.3 Organisational factors
The organisational factors that were investigated include the clarity of the
organisational strategy, work environment, staffing, work schedule, and
organisational culture. This sub-section therefore presents the results concerning
the organisation factors.
4.5.3.1 Dimensions concerning the clarity of the organisational strategy
The health workers had to indicate whether the following dimensions were very
clear, clear, neutral, unclear and very unclear. For the purpose of analysis and
discussion the categories very clear and clear were grouped together and
reported as „clear‟ and the very unclear and unclear were reported as „unclear‟.
Table 4.14 shows the responses from the health workers concerning the clarity
of the organisational strategy.

172
Table 4.14: Dimensions concerning the clarity of the organisational strategy (N = 276) Item description Vey
unclear Unclear Neutral Clear Very clear Total
n % n % n % n %
n % N %
My organisation‟s mission is
0 0.0 0 0.0 0 0.0 139 50.4 137 49.6 276 100.0
My duties and responsibilities are
0 0.0 0 0.0 0 0.0 111 40.2 165 59.8 276 100.0
The goals and objectives of the job are
0 0.0 0 0.0 0 0.0 138 50.0 138 50.0 276 100.0
The way my work is related to the overall objective of the organisation is
0 0.0 27 9.8 0 0.0 139 50.4 110 39.9 276 100.1
The expected results of my work are
0 0.0 28 10.1 0 0.0 139 50.4 109 39.5 276 100.0
The way I divide my time among tasks required for my job is
0 0.0 82 29.7 0 0.0 165 59.8 29 10.5 276 100.0
The way to determine the appropriate procedures for each work assignment is
0 0.0 83 30.1 0 0.0 139 50.4 54 19.6 276 100.1
The way performance is measured is
0 0.0 111 40.2 28 10.1 110 39.9 27 9.8 276 100.0
The way performance appraisal results are utilised is
27 9.8 83 30.1 56 20.3 83 30.1 27 9.8 276 100.1
The results from Table 4.14 show that all the participants (n=276; 100.0%) were
clear about their organisation‟s mission, their duties and responsibilities as well
as the goals and objectives of the job. Most of the participants (n=249; 90.2%)
clearly know how their work is related to the overall objective of the organisation
and 89.9% (n=248) clearly know the expected results from their work. Most
participants (n=194; 70.3%) were clear about the way they divided their time
amongst the tasks required for the job, and 29.7% (n=82) were unclear.
Similarly, of the participants 69.9% (n=193) indicated that the way to determine
appropriate procedures for each work assignment was clear while 30.1% (n=83)
indicated that it was not clear. About 40% (n=111; 40.2%) of the participants
were not clear about the way performance is measured in their organisations,
49.6% (n=137) of the participants indicated that it was clear to them, and 10.1%
(n=28) were undecided. An equal number of participants (n=110; 39.9%) had

173
opposing views regarding the clarity of how performance appraisal results are
utilised. They indicated that they were either clear or unclear on how the
performance results are utilised in their organisations and about 20.3% (n=56) of
the participants were undecided.
Generally, from the results presented it seems as though the organisational
strategy is clear to most of the health workers. However, when it comes to the
way the performance is measured and how the results of the performance
appraisals are utilised, there is still considerable weakness and this may impact
negatively on the performance of health workers. According to Ntoburi et al
(2008:445) improvement in quality of health services requires that the health
workforce is clear about the expectation and outcomes of the organisation they
are working for.
In this study the results show that the health workers are clear about the mission
and the objectives of their organisation, this is good for performance. However, it
was disturbing to note that the health workers were not clear about how their
performance is measured and how the performance results are utilised. A study
done in Malawi by Manafa, McAuliffe, Maseko, Bowie, MacLachlan, and
Normand (2009:[4]) reports that most health workers do not have job
descriptions. Hence, they do not have clear expectations of performance. This
results in some health workers being given roles for which they are not
adequately prepared for and expected to perform. This therefore affects their
performance. Thompson et al (2010:6) assert that performance management is
crucial in supporting the formulation and implementation of the organisational
strategy. Hence, there should be an alignment between performance
management and the organisational strategy.
4.5.3.2 Dimensions concerning the work environment
Table 4.15 shows the results on the aspects of the work environment as
perceived by the health workers.

174
Table 4.15: Dimensions concerning the work environment (N = 276)
Item description Strongly disagree
Disagree Undecided Agree Strongly agree
Total
n % n % n % n %
n % N %
My working environment is considerably safe
55 19.9 27 9.8 28 10.1 166 60.1 0 0.0 276 99.9
My health facility has a good working space arrangement
28 10.1 54 19.6 0 0.0 167 60.5 27 9.8 276 100.0
All the necessary equipment are available
54 19.6 112 40.6 27 9.8 83 30.1 0 0.0 276 100.1
The health facility equipment are in good working condition
27 9.8 167 60.5 27 9.8 27 9.8 28 10.1 276 100.0
Drugs and supplies are sufficient
56 20.3 81 29.3 55 19.9 84 30.4 0 0.0 276 99.9
There are clear infection control guidelines
0 0.0 0 0.0 83 30.1 166 60.1 27 9.8 276 100.0
I participate in decision making concerning patients‟ care
0 0.0 55 19.9 28 10.1 166 60.1 27 9.8 276 99.9
I am satisfied with my opportunity to participate in decision making
0 0.0 55 19.9 0 0.0 194 70.3 27 9.8 276 100.0
I receive constructive comments from my supervisors
0 0.0 55 19.9 28 10.1 139 50.4 54 19.6 276 100.0
I receive constructive comments from my co-workers
0 0.0 56 20.3 0 0.0 165 59.8 55 19.9 276 100
I receive constructive comments from the patients/their relatives
0 0.0 28 10.1 28 10.1 193 69.9 27 9.8 276 99.9
My opinion is respected at work
0 0.0 28 10.1 27 9.8 194 70.3 27 9.8 276 100.0
I feel my job is secure
0 0.0 28 10.1 0 0.0 166 60.1 82 29.7 276 99.9
Table 4.15 shows that most participants (n=248; 89.9%) had a sense of job
security. About 80% (n=221; 80.1%) of the participants indicated that their
opinions are respected at work and are satisfied with the opportunity to
participate in decision making. Most of the participants (n=220; 79.7%) indicated
that they receive constructive comments from their co-workers, patients or their
175
relatives, and about 70.0% (n=193; 69.9%) receive constructive comments from
their supervisors.
About 70% (n=193; 69.9%) of the participants agreed that there are clear
infection control guidelines and about 30% (n=83; 30.1%) were undecided.
Similarly, close to 70% (n=193; 69.9%) agreed that they participate in decision
making concerning patient care while 19.9% (n=55) disagree and the rest 10.1%
(n=28) were undecided. The results also show that most of the participants
(n=194; 70.3%) agreed that their health facilities have good working space
arrangement and 29.7% (n=82) disagreed. About 60% (n=166; 60.1%) of the
participants considered their working environment to be considerably safe and
82 (29.7%) thought it was unsafe, while 10.1% (n=28) were undecided.
About 60% (n=166; 60.1%) of the participants disagreed that they have all the
necessary equipment necessary to do their work, about 30% (n=83; 30.1%)
agreed and almost 10% (n=27; 9.8%) were undecided. Of the participants,
70.3% (n=194) disagreed that the health facility equipment were in good working
condition, 19.9% (n=55) agreed and 9.8% (n=27) were undecided. With regard
to the drugs and supplies, about 50% (n=137; 49.6%) of the participants
disagreed that they had sufficient stocks of drugs, 30% (n=84; 30.4%) agreed
and close to 20% (n=55; 19.9%) were undecided.
The results here show mixed reactions about the working environment of the
health workers. Majority of the health workers seem to be contented with most of
the aspects of their working environment. However,most of the health workers
seem to be unhappy about the availability of medical equipment as well as the
drugs and supplies. As indicated by most of the health workers even some of the
equipment that is available is not in good working condition. The interpretation is
that while some aspects of the working environment may be conducive, lack of
adequate medical supplies and non-functional equipment may hinder the
performance of health workers.

176
It was important to learn that the majority of health workers are secure in their
jobs and participate in decision making concerning the patients. This is
consistent to what Huang et al (2006:11) found in their study in Taiwan. In that
study they report that most nurses believe that job security is automatically
provided by their organisations and they were given opportunity to participate in
decision making concerning patient management. Chirdan et al (2009:246) also
mention that in Nigeria, health workers find their workplace inspiring and were
happy with supervision, interpersonal relationships, and the openness a well as
support they get from their managers.
The researcher found that health workers in this study felt that their work
environment was safe and had clear infection prevention guidelines. However,
another study done in Uganda by Hagopian et al (2009:w869) points out that a
sizeable proportion of health workers felt that their managers do not take any
specific measures to protect them from infections like HIV/AIDS. Most health
workers lacked the necessary equipment, drugs, and supplies to carry out their
duties effectively. This is consistent with most of the studies done in most
developing countries. The performance of health workers in most health systems
in developing countries is constrained by lack of adequate supplies of drugs and
equipment. This affects the health workers‟ motivation and job satisfaction
(Fauveau, Sherratt & de Bernis 2008:[9]; Hagopian et al 2009:w867-w868;
Mbindyo, Blaauw, Gilson & English 2009:[8]; Willis-Shattuck et al 2008:[5]).
4.5.3.3 Dimensions concerning staff in the organisation
Table 4.16 presents the results concerning the staffing of the organisations.

177
Table 4.16: Dimensions concerning the staffing in the organisation (N=276)
Item description Strongly disagree
Disagree Undecided Agree Strongly agree
Total
n % n % n % n %
n % N %
The allocated staff in this facility are sufficient to cover the current workload
54 19.6 84 30.4 55 19.9 83 30.1 0 0.0 276 100.0
Support of staff in form of counselling at workplace is available
55 19.9 56 20.3 28 10.1 137 49.6 0 0.0 276 99.9
I have opportunity to make inputs into staffing policies and procedures
27 9.8 110 39.9 28 10.1 84 30.4 27 9.8 276 100.0
There is a good balance between health workers and their supervisors
27 9.8 112 40.6 0 0.0 110 39.9 27 9.8 276 100.1
Table 4.16 shows that there were mixed views concerning the staffing within the
health facilities. Fifty percent (n=138) of the health workers disagreed that the
allocated staff in their respective facilities was sufficient to cover the current work
load, 30.1% (n=83) agreed and 19.9% (n=55) were undecided. Almost 50%
(n=137; 49.6%) of the participants disagreed that they have opportunity to
provide input into staffing policies and procedures, 40.2% (n=111) agreed and
10.1% (n=28) were undecided. Slightly over fifty percent (n=139; 50.4%) of the
participants disagreed that there was a good balance between health workers
and their supervisors and 49.6% (n=137) agreed. The results show that 49.6%
(n=137) of the participants agreed that there was support to staff in form of
counselling at the workplace, 40.2% (n=111) disagreed and 10.1% (n=28) were
undecided.
Overall, the staffing within the health facilities is not satisfactory. This can
negatively affect the performance of health workers. However, it is important to
note that there is some form of support in terms of workplace counselling for
staff, which may assist in improving the performance of health workers, though
not satisfactory. The findings of this study are consistent with many other studies
done in developing countries. For example in Malawi, there is an acute shortage
of health workers which affects delivery of health services (Manafa et al

178
2009:[5]). Studies demonstrate a negative correlation between health worker
density and poor health outcomes (Awofeso et al 2008:[4]; Awofeso 2010:1319).
Hence, the shortages of health workers can affect the performance of the
existing staff. Armstrong (2009:960) explains that the importance of health and
safety practices is often underestimated by the managers. Prevention of
accidents and elimination of health and safety hazards is a prime responsibility
of management.
4.5.3.4 Dimensions concerning the work schedule of health workers
The results in Table 4.17 present the responses from the health workers
concerning their work schedule.
Table 4.17: Dimensions concerning the work schedule of health workers (N =276) Item description Strongly
disagree Disagree Undecided Agree Total
n % n % n % n %
N %
I have opportunities for a flexible work schedule
28 10.1 27 9.8 0 0.0 221 80.1 276 100.0
Overall I perceive my work schedule to be fair
28 10.1 28 10.1 0 0.0 220 79.7 276 99.9
I am always compensated when I work overtime
193 69.9 28 10.1 28 10.1 27 9.8 276 99.9
My workload is manageable 0 0.0 166 60.1 0 0.0 110 39.9 276 100.0
I am able to balance the demands of my work with my personal life
27 9.8 111 40.2 28 10.1 110 39.9 276 100.0
Table 4.17 shows that of the participants, 80.1% (n=221) agreed that they have
opportunities for flexible work schedule and 19.9% (n=55) disagreed. Slightly
less than 80% (n=220; 79.7%) of the participants agreed that they perceive their
work schedule to be fair. About 80% (n=221; 80.1%) of the participants
disagreed that they are always compensated when they work overtime and
about 10.1% (n=28) participants were undecided or had agreed that they are
compensated. About 60% (n=166; 60.1%) of the participants disagreed that their
workload is manageable and 39.9% (n=110) participants agreed. Fifty percent
(n=138) of the participants disagreed that they are able to balance the demands
of work with their personal lives, about 40% (n=110; 39.9%) agreed and 10.1%
(n=28) were undecided. These results show that generally the work schedule
can either enhance or impede the performance of health workers. The health

179
workers were not happy with the workload, lack of compensation for overtime
work, and lack of work-life balance. However, the health workers seemed happy
with the fairness and flexibility of their work schedules.
This study found that health workers have a flexible work schedule and the
perception that the work schedule was fair. This seems to be consistent with
what Huang et al (2006:11) found in Taiwan. The researcher found that slightly
over 60% of the participants said that their workload is not manageable. This
confirms Hagopian et al‟s (2009:w867) findings in Uganda. On the contrary, in
Nigeria, Chirdan et al (2009:246) report that about two-thirds of health workers
were happy with their workload. It is possible that there are probably more health
workers in Nigeria than there are in Uganda. This study revealed that although
there was flexibility in the work schedules; the health workers lack work-life
balance. Armstrong (2009:978) emphasises that good work-life balance policies
can lower absence, help to tackle the low morale and high degree of stress that
can lead to retention problems as employees tire of juggling work and life
responsibilities.
Furthermore, this study found that there was no compensation for working
overtime. This is a common practice in most of the African health systems. In
Tanzania Manongi, Marchant, and Bygbjerg (2006:[6]) mention that health
workers felt that they had very little to gain from working hard or being
responsive to the patients or superiors. This has contributed to absenteeism and
poor performance. Liu et al (2007:504) report that there is a positive link between
incentives compensation and performance of workers.
4.5.3.5 Dimensions concerning the organisational culture
This section presents the results of the health workers‟ opinions regarding the
organisational culture. Table 4.18 shows the distribution of the responses from
the health workers.

180
Table 4.18: Dimensions concerning the organisational culture (N=276)
Item description Strongly disagree
Disagree Undecided Agree Strongly agree
Total
n % n % n % n %
n % N %
Members of this organisation share a common purpose
0 0.0 57 20.7 28 10.1 136 49.3 55 19.9 276 100.0
My performance is assessed according to how best I execute my duties
0 0.0 28 10.1 28 10.1 139 50.4 81 29.3 276 99.9
Employees of this organisation try hard to identify problems and solve them accordingly
27 9.8 55 19.9 28 10.1 139 50.4 27 9.8 276 100.0
The policies of this organisation are consistent with the cultural belief of the community
27 9.8 110 39.9 28 10.1 84 30.4 27 9.8 276 100.0
Recruitment of new health workers is done based on qualifications
0 0.0 28 10.1 0 0.0 139 50.4 109 39.5 276 100.0
Promotions of health workers is based on merit
0 0.0 62 22.5 63 22.8 122 44.2 29 10.5 276 100.0
The local political leadership is supportive of health workers
56 20.3 83 30.1 55 19.9 55 19.9 27 9.8 276 100.0
Decentralisation has led to improvement in performance of health workers
27 9.8 112 40.6 28 10.1 109 39.5 0 0.0 276 100.0
Decentralisation has improved my chances for career progression
82 29.7 57 20.7 82 29.7 28 10.1 27 9.8 276 100.0
My co-workers have adequate skills for their job
28 10.1 83 30.1 0 0.0 138 50.0 27 9.8 276 100.0
My health facility manager is competent in his/her duties
0 0.0 56 20.3 41 14.9 143 51.8 36 13.0 276 100.0
The results in Table 4.18 show that the majority of the participants (n=248;
89.9%) agreed that recruitment of new health workers is done based on
qualifications. Close to 80% (n=220; 79.7%) of the participants agreed that their
performance is assessed according to how best they execute their duties.
Similarly, a significant proportion 69.2% (n=191) of the participants agreed that
the members of their organisation share a common purpose and about 20.7%

181
(n=57) disagreed. Most of the participants (n=179; 64.8%) agreed that their
managers are competent in executing their duties. About 60% (n=166; 60.1%) of
the participants indicated that the employees in their organisations try hard to
identify problems and solve them accordingly. Most of the participants 59.8%
(n=165) agreed that their co-workers have adequate skills for their jobs and
40.2% (n=111) of participants disagreed. Close to 55% (n=151; 54.7%) of the
participants agreed that promotions of the health workers is merit based, 22.5%
(n=62) disagreed, and 22.8% (n=63) were undecided.
Slightly over fifty percent (n=139; 50.4%) disagreed that political leadership is
supportive of health workers; that decentralisation has led to improvement in the
performance of the health workers, and that decentralisation has improved their
career progression. Furthermore, many health workers (n=137; 49.7%) thought
that the policies of their organisations were not consistent with the cultural beliefs
of the community and about 40.2% (n=111) agreed while 10.1% (n=28) were
undecided.
The results illustrate that the health workers share a common purpose; both they
and their managers are competent at their jobs; the recruitments and promotions
are done on merit. However, the political leadership is not supportive of health
workers and this may impede their performance. Likewise the participants
indicated that decentralisation has minimised their chances for career
progression and that decentralisation has led to deterioration in the performance
of health workers.
Brown and Harvey (2006:11) assert that some patterns of organisational culture
may be functional and may facilitate the accomplishment of the organisational
goals. Other patterns of behaviour or cultural norms may actually inhibit or
restrict the accomplishment of the organisational goals. In many low resource
countries like Uganda, local governments do not have staff adequately trained in
personnel administration or know little about the system of managing workforce
performance (Esmail et al 2007:[7]; Mitchell 2009:224). This has a big impact on
performance.

182
The lack of political support for health workers is regrettable since these leaders
are supposed to be the supervisors of the health services in their respective
localities. The political interference reported by this study is similar to what was
found in Chile and Bolivia (Bossert 2000:67). This is indeed detrimental to
performance and retention of health workers in the districts. Researchers like
Ssengooba, Rahman, Hongoro, Rutebemberwa, Mustafa, Kielmann and McPake
(2007:[10]) report similar political interference in the management of health
services in Uganda with district local leaders always intimidating health workers
and practicing nepotism during the recruitment and promotion processes. In
Mozambique district officials under decentralisation interfere with transfers of
health staff and in China health managers are faced with pressures from the
local authorities to recruit their relatives despite them not possessing the right
qualifications (Dieleman et al 2009:[5]).
World Health Organization (2007:4) emphasises that leadership and governance
must ensure that strategic policy frameworks exist and are combined with
effective oversight, coalition building, the provision of appropriate regulations and
incentives, attention to system-design, and accountability. This study also noted
that decentralisation had reduced the chances of career progression for the
health workers. Supporting studies have been published by Kolehmainen-Aitken
(2004:[6]) and Munga et al (2009:[7]).
4.5.4 Performance dimensions
The research investigated the performance of health workers using four
variables including responsiveness, availability, productivity and competence of
health workers. These formed the dependent variables. This section (4.5.4.1 to
4.5.4.4) presents the findings from the health workers concerning these
performance dimensions.

183
4.5.4.1 Dimensions concerning responsiveness of services
Table 4.19 presents the responses concerning responsiveness of health workers
and the services they provide.
Table 4.19: Dimensions concerning responsiveness of health workers (N=276) Item description Disagree Undecided Agree Strongly
agree Total
n % n % n %
n % N %
Clients are always satisfied with the friendly services offered by health workers
28 10.1 0 0.0 221 80.1 27 9.8 276 100.0
Clients are satisfied with the quality of services we provide
112 40.6 0 0.0 137 49.6 27 9.8 276 100.0
Clients are satisfied with the timeliness of the services
166 60.1 28 10.1 82 29.7 0 0.0 276 99.9
The complaints from stakeholders towards individual health workers are rare
55 19.9 83 30.1 138 50.0 0 0.0 276 100.0
The stakeholders are satisfied with the health workers‟ cooperation
84 30.4 28 10.1 164 59.4 0 0.0 276 99.9
The health workers clearly know who they serve
82 29.7 0 0.0 167 60.5 27 9.8 276 100.0
Health workers are always willing to address the clinical and emotional demands of the patients
55 19.9 28 10.1 166 60.1 27 9.8 276 99.9
Health workers get professional support to improve their performance
56 20.3 0 0.0 138 50.0 82 29.7 276 100.0
When at work I know what is expected of me
0 0.0 0 0.0 140 50.7 136 49.3 276 100.0
From Table 4.19, it is clear that all the participants (n=276; 100.0%) agreed that
when they are at work they know what is expected of them. Most participants
(n=248; 89.9%) agreed that the clients are always satisfied with the friendliness
of the services that health workers provide. The majority of the participants
(n=220; 79.7%) indicated that they get professional support to improve their
performance. Most of the health workers (n=194; 70.3%) clearly know who they
serve and most of them (n=193; 69.9%) are always willing to address the clinical
and emotional demands of the patients. About 60% (n=164; 59.4%) of the
participants agreed the stakeholders are satisfied with the health workers‟
cooperation and the quality of service they provide. About 41% (n=112; 40.6%)
indicated that clients were not satisfied with the quality of service the health
workers provide and about 30% (n=84; 30.4%) were not satisfied with the
184
cooperation of health workers. Fifty percent (n=138) of the participants indicated
that complaints from the stakeholders towards individual health workers are rare,
30.1% (n=83) were undecided and 19.9% (n=55) of the participants disagreed. It
is however important to note that about 60% (n=166; 60.1%) of the participants
disagreed that the patients were satisfied with the timeliness of the services and
29.7% (n=82) indicated that the clients were satisfied and 10.1% (n=28) were
undecided.
Generally, the respondents demonstrated satisfactory levels of service and
responsiveness towards the patients. However, the services are not provided in
a timely manner. Health workers must have the ability and willingness to
understand and address both the clinical and emotional demands of clients
(DFID 2006:1; Heizer & Render 2008:212). According to Freedman (2005:19),
health workers‟ responsiveness enables a more holistic consideration of the
quality of health service provision by taking into consideration both the technical
aspects and client satisfaction. The researcher found that the health workers
were not providing timely services. This can be explained by organisational
constraints such as the low staffing levels, heavy workload, poor work flow
structures, and probably lack of some of the drugs, and equipment necessary for
them to perform (Nzinga et al 2009:[5]).
4.5.4.2 Dimensions regarding the availability of health workers in the health facility
Table 4.20 shows the responses of the health workers concerning their
availability in the districts or health facilities.

185
Table 4.20: Dimensions concerning the availability of health workers (N=276) Item description Strongly
disagree Disagree Undecided Agree Strongly
agree Total
n % n % n % n %
n % N %
This organisation has a retention policy with clear strategies
27 9.8 28 10.1 55 19.9 84 30.4 82 29.7 276 99.9
I am always available when my services are required
0 0.0 28 10.1 0 0.0 139 50.4 109 39.5 276 100.0
This facility has adequate numbers of health workers to deliver the services
0 0.0 138 50.0 28 10.1 83 30.1 27 9.8 276 100.0
The rural facilities are as well staffed as the urban ones
28 10.1 193 69.9 27 9.8 28 10.1 0 0.0 276 99.9
This facility has an attendance register which is filled by every staff member
0 0.0 27 9.8 0 0.0 167 60.5 82 29.7 276 100.0
I am always present during the official working hours
0 0.0 82 29.7 28 10.1 112 40.6 54 19.6 276 100.0
I put in much effort when I am on duty
0 0.0 27 9.8 0 0.0 167 60.5 82 29.7 276 100.0
Staff attendance in this organisation is good
0 0.0 111 40.2 0 0.0 138 50.0 27 9.8 276 100.0
The workload in this facility is manageable
0 0.0 111 40.2 56 20.3 109 39.5 0 0.0 276 100.0
In this facility the patient waiting time is short
0 0.0 109 39.5 55 19.9 112 40.6 0.0 0.0 276 100.0
Table 4.20 shows that most of the participants (n=249; 90.2%) indicated that
their health facilities have attendance registers that are filled by all staff members
and a similar percentage 90.2% (n=249) agreed that they put in much effort
when they are on duty. About 90% (n=248; 89.9%) of the participants indicated
that they are always available when their services are required. About 60%
(n=166; 60.1%) of the participants indicated that they are always present at work
during the official working hours and also indicated that their organisation has a
retention policy with clear strategies. Slightly less than 60% (n=165; 59.8%) of
the participants agreed that the staff attendance in their organisations was good
and 40.2% (n=111) disagreed. There were mixed views in the responses from
the health workers concerning the patients‟ waiting time. One hundred and

186
twelve (40.6%) of the participants agreed that the patients‟ waiting time was
short, while 39.5% (n=109) disagreed and 19.9% (n=55) were undecided.
The majority of the health workers (n=221; 80.0%) disagreed that the rural
facilities are as well staffed as the urban ones. Fifty percent (n=138) of the
participants disagreed that their health facilities had adequate numbers of health
workers to deliver the services, about 40% (n=110; 39.9%) agreed and 10.1%
(n=28) were undecided. There were also mixed views in the responses of health
workers concerning the workload with 40.2% (n=111) of the participants
disagreeing that the workload at their facilities was manageable while 39.5%
(n=109) of the participants agreed that their workload was manageable and
20.3% (n=56) of the participants were undecided.
These results demonstrate that participants were more likely to take initiative as
individuals to ensure availability. However, the reported lack of adequate staffing
may probably be an explanation for high workload and long patient waiting time
(Nzinga et al 2009:[5]). Some authors like Huicho, Dieleman, Campbell, Codjia,
Balabanova, Dussault and Dolea (2010:360) mention that availability of health
workers itself cannot directly improve the health outcomes in absence of
effective components such as drug supply and functioning facilities and good
clinical practice. However, a well performing health workforce is a significant
component of a strong health system that together with other social determinants
can lead to improved health status of the population. The JLI (2004:23) mentions
that as the numbers of health workers drop, the ability of systems to deliver
health services also reduces. Hence, the maldistribution of health workers
between rural and urban health facilities as reported by this study, this affects
the quality of health care and waiting time may be longer (Padarath et al
2003:26).
4.5.4.3 Dimensions regarding the productivity of health workers
Table 4.21 shows the responses concerning the productivity of health workers.

187
Table 4.21: Dimensions concerning the productivity of health workers (N=276)
Item description Strongly disagree
Disagree Undecided Agree Strongly agree
Total
n % n % n % n %
n % N %
My productivity is measured according to the number of patients I attend to
54 19.6 55 19.9 0 0.0 140 50.7 27 9.8 276 100.0
This organisation has indicators to measuring staff productivity
27 9.8 112 40.6 27 9.8 56 20.3 54 19.6 276 100.1
I spend most of my time at work attending to patients
0 0.0 81 29.3 28 10.1 140 50.7 27 9.8 276 99.9
My skills are suited for the type of work I do
0 0.0 28 10.1 27 9.8 166 60.1 55 19.9 276 99.9
My productivity is increased by the availability of drugs and equipment
0 0.0 0 0.0 56 20.3 112 40.6 108 39.1 276 100.0
The management structures in this facility encourage the performance of health workers
0 0.0 54 19.6 28 10.1 194 70.3 0 0.0 276 100.0
The results from Table 4.21 show that most of the participants (n=221; 80.0%)
agreed that their skills are suited for the type of work they do. The majority of
workers (n=220; 79.7%) indicated that their productivity is increased by the
availability of drugs and equipment. Most of the participants (n=194; 70.3%)
indicated that their health facility management structures encourage the
performance of health workers. Slightly over 60% (n=167; 60.5%) of the
participants agreed that they spend most of their time attending to the patients
and that their productivity is measured according to the number of the patients
they attend to. About 40% (n=109; 39.5%) of the participants disagreed that their
productivity is measured according to the number of patients they attend to and
29.3% (n=81) disagreed that they spend most to their time attending to patients
while 10.1% (n=28) participants were not decided. With regard to indicators for
measuring performance slightly over 50% (n=139; 50.4%) of the participants
indicated that the organisation does not have indicators for measuring
productivity of health workers, 39.9% (n=110) agreed that there were indicators
and 9.8 % (n=27) were undecided. In general, the participants possessed

188
adequate skills necessary to perform their jobs. They emphasised the
importance of adequate supplies of materials to support productivity and
performance. However, the results showed that the measurement of productivity
of health workers was generally lacking in most health facilities.
Although the health workers may have the skills, their productivity can be limited
by a host of factors like lack of equipment, supplies, drugs, poor management
structures and low salaries among others (Dieleman & Harnmeijer 2006:16;
Hagopian et al 2009:w868). It was also noted that the health worker were almost
evenly divided on how their productivity is measured. Thus, there is need to
develop and communicate clear indicators for measuring productivity.
4.5.4.4 Dimensions regarding competence of health workers
Table 4.22 shows the responses of the health workers concerning their
competences.
Table 4.22: Dimensions concerning the competence of health workers (N=276)
Item description Disagree Agree Strongly agree
Total
n % n %
n % N %
I am confident my ability to do my job
28 10.1 113 40.9 135 48.9 276 99.9
I have mastered the skills necessary to do my job
0 0.0 222 80.4 54 19.6 276 100.0
I am confident about my prescribing practices
0 0.0 222 80.4 54 19.6 276 100.0
I always improve my knowledge and skills through continuous professional education
0 0.0 139 50.4 137 49.6 276 100.0
My attitude toward the care of patients is good
0 0.0 140 50.7 136 49.3 276 100.0
I use my knowledge and skills to improve safety of patients
0 0.0 194 70.3 82 29.7 276 100.0
I always make timely referral of patients that are in need of specialised treatment
0 0.0 140 50.7 136 49.3 276 100.0
I have good communication skills
0 0.0 194 70.3 82 29.7 276 100.0
I am able to use the available communication technology to support patient care
0 0.0 221 80.1 55 19.9 276 100.0

189
Table 4.22 indicates that all the health workers (n=276; 100.0%) have mastered
the skills necessary to do their work and are confident about their prescribing
practices. All the participants (n=276; 100.0%) said that they improve their
knowledge and skills through continuous professional education and use their
knowledge and skills to improve the safety of the patients. All the health workers
(n=276; 100.0%) agreed that their attitude towards patient care is good and
always make timely referrals of patients in need of specialised treatment.
All the health workers (n=276; 100.0%) indicated that they have good
communication skills and are able to use the available technology to support
patient care. It is also important to note that about 90% (n=248; 89.9%) of the
participants agreed that they are confident about their ability to perform their job.
Generally, the results show that the health workers are competent and this is
highly likely to enhance their performance. Liu et al (2007:507) assert that high
level of knowledge, skills and abilities among workers are necessary for effective
performance. Health workers also reported that they have good communication
skills. This is very important because listening, guidance, clear expectations and
feedback are prerequisites for better performance (Huang et al 2006:11).
The health workers in this study reported that they make timely referral when
required. Iyengar and Iyengar (2009:15) mention that good skills in identifying
complicated obstetric cases, good counselling and communication skills results
in improved maternal health outcomes in India. This finding is contrary to what is
reported in Niger by Bossyns and Van Lerberghe (2004:[5]) where rural health
workers lack the competence to communicate, counsel and convince patients
with complications for referral to higher level facilities.
4.5.5 Association statistics
Correlation statistic was used to determine if there was any association between
the various factors that influence the performance of health workers and the
performance dimensions. The performance dimensions include responsiveness,
availability, productivity and competence of health workers. The results of the
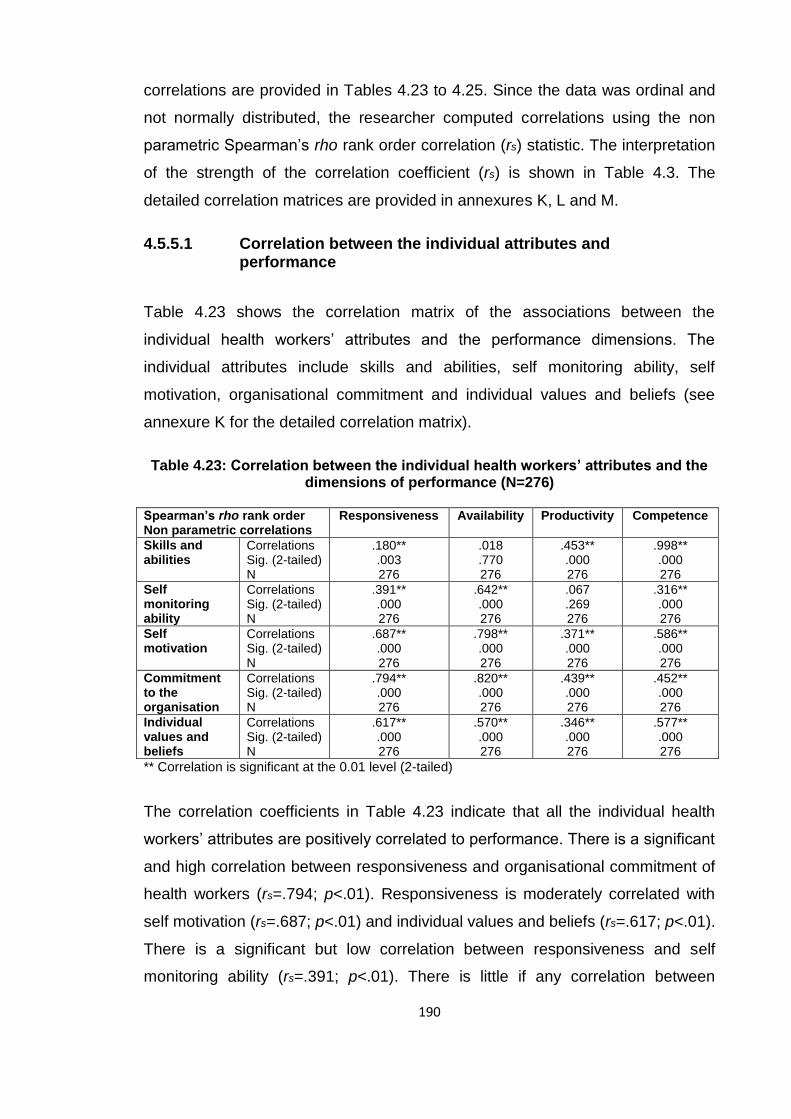
190
correlations are provided in Tables 4.23 to 4.25. Since the data was ordinal and
not normally distributed, the researcher computed correlations using the non
parametric Spearman‟s rho rank order correlation (rs) statistic. The interpretation
of the strength of the correlation coefficient (rs) is shown in Table 4.3. The
detailed correlation matrices are provided in annexures K, L and M.
4.5.5.1 Correlation between the individual attributes and performance
Table 4.23 shows the correlation matrix of the associations between the
individual health workers‟ attributes and the performance dimensions. The
individual attributes include skills and abilities, self monitoring ability, self
motivation, organisational commitment and individual values and beliefs (see
annexure K for the detailed correlation matrix).
Table 4.23: Correlation between the individual health workers’ attributes and the
dimensions of performance (N=276)
Spearman’s rho rank order Non parametric correlations
Responsiveness Availability Productivity Competence
Skills and abilities
Correlations Sig. (2-tailed) N
.180** .003 276
.018
.770 276
.453** .000 276
.998** .000 276
Self monitoring ability
Correlations Sig. (2-tailed) N
.391** .000 276
.642** .000 276
.067
.269 276
.316** .000 276
Self motivation
Correlations Sig. (2-tailed) N
.687** .000 276
.798** .000 276
.371** .000 276
.586** .000 276
Commitment to the organisation
Correlations Sig. (2-tailed) N
.794** .000 276
.820** .000 276
.439** .000 276
.452** .000 276
Individual values and beliefs
Correlations Sig. (2-tailed) N
.617** .000 276
.570** .000 276
.346** .000 276
.577** .000 276
** Correlation is significant at the 0.01 level (2-tailed)
The correlation coefficients in Table 4.23 indicate that all the individual health
workers‟ attributes are positively correlated to performance. There is a significant
and high correlation between responsiveness and organisational commitment of
health workers (rs=.794; p<.01). Responsiveness is moderately correlated with
self motivation (rs=.687; p<.01) and individual values and beliefs (rs=.617; p<.01).
There is a significant but low correlation between responsiveness and self
monitoring ability (rs=.391; p<.01). There is little if any correlation between

191
responsiveness and skills and abilities of the health workers (rs=.180; p<.01).
Even though there is a low correlation between responsiveness and skills and
abilities, overall, there is a positive association between responsiveness and the
general individual attributes. This is an indication that committed, self-motivated,
and self-monitoring health workers are highly likely to be responsive to the
patient needs. They have the self-drive to serve the clients. According to
Ammassari (2005:10) and DFID (2006:3) individual factors such as skills and
abilities, self motivation, individual values and beliefs and commitment to
organisation can affect the responsiveness of health workers.
The results show a significant and high positive correlation between availability
of health workers and organisational commitment (rs=.820; p<.01) and also self-
motivation (rs=.798; p<.01). There is a significant and moderate positive
correlation between self monitoring ability (rs=.642; p<.01), individual values and
beliefs (rs=.570; p<.01) and availability of health workers. There was no
correlation between the skills and abilities and availability of health workers
(rs=.018; p >.05). From these correlations it can be deduced that availability of
health workers is positively related to individual attributes meaning that health
workers are more likely to be available for duty when they have significant levels
of commitment, are self motivated, are able to self-monitor and possess strong
values and beliefs. Notably, the lack of relationship between availability and skills
and abilities is explainable because health workers may be available for duty
whether or not they possess adequate skills and abilities.
Table 4.23 shows that there is a significant but low positive correlation between
productivity of health workers and their skill and abilities (rs=.453; p<.01),
organisation commitment (rs=.439; p<.01), self motivation (rs=.371; p<.01) and
individual values and beliefs (rs=.346; p<.01). There is no correlation between
productivity and self monitoring ability (rs=.067; p>.05). This low positive
association illustrates that although health workers may possesses positive
individual attributes; this may not necessarily translate into productivity and
indeed the lack of correlation between productivity and individual self- monitoring
provides a vivid explanation for this. Gambin, Green and Hogarth (2009:52)

192
report that in general there is evidence to suggest that skill levels are related to
productivity: the highly skilled people efficiently produce higher value goods and
services. But there are still substantial gaps in the evidence base. This is
because it is not always clear what skills result in an increase in productivity,
whether the hard skills (e.g. formal qualification) or soft skills (e.g. interpersonal
skills, communication skills).
The results show a significant and very high positive correlation between
competence and skills and abilities of health workers (rs=.998; p<.01). The
results further show that there is a significant and moderate positive correlation
between self motivation (rs=.586; p<.01), individual values and beliefs (rs=.577;
p<.01) and competence of health workers. There is a significant but low positive
correlation between organisation commitments (rs=.452; p<.01), self-monitoring
ability (rs=.316; p<.01) and competence of health workers. Clearly, competent
health workers are more likely to have the required skills and abilities and to be
self-motivated as well as hold strong values and beliefs conducive for
performance. Liu et al (2007:507) mention that high levels of knowledge, skills
and abilities are some of the determinants of competence of workers.
4.5.5.2 Correlation between the individual performance behaviours and performance of health workers
Table 4.24 presents the correlation matrix for the associations between the
individual performance behaviours of the health workers and the performance
dimensions (see detailed correlation matrix in annexure L).

193
Table 4.24: Correlation between the individual performance behaviours and the dimensions of performance (N=276) Spearman’s rho rank order Non parametric correlations
Responsiveness Availability Productivity Competence
Individual proficiency behaviours
Correlations Sig. (2-tailed) N
.856** .000 276
.724** .000 276
.235** .000 276
.562** .000 276
Individual adaptive behaviours
Correlations Sig. (2-tailed) N
.623** .000 276
.659** .000 276
.343** .000 276
.643** .000 276
Individual proactive behaviour
Correlations Sig. (2-tailed) N
.598** .000 276
.759** .000 276
.262** .000 276
.359** .000 276
Individual client-oriented behaviours
Correlations Sig. (2-tailed) N
.669** .000 276
.537** .000 276
.396** .000 276
.449** .000 276
** Correlation is significant at the 0.01 level (2-tailed)
Table 4.24 shows that all the individual performance behaviours are positively
correlated to performance. There is a significant and high positive correlation
between responsiveness and the individual proficiency behaviours of health
workers (rs=.856; p<.01). There are also significant and moderate correlations
between individual client-oriented behaviours (rs=.669; p<.01), individual
adaptive behaviours (rs=.623; p<.01), individual proactive behaviours (rs=.598;
p<.01) and the responsiveness of health workers. Indeed there is a high
likelihood that health workers who are highly proficient, client oriented and
display adaptive and proactive behaviours, will demonstrate high responsiveness
towards clients. Kahya (2009:102) mentions that workers' behaviours that
involve teamwork, innovativeness and self advancement contribute to
performance.
The results also indicate significant and high positive correlations between the
individual proactive behaviours (rs=.759; p<.01), individual proficiency
behaviours (rs=.724; p<.01) and the availability of health workers. There are
significant and moderate correlations between the individual adaptive behaviours
(rs=.659; p<.01), client oriented behaviours (rs=.537; p<.01) and the availability of
health workers. This demonstrates that proactive and proficient individuals are
likely to be available to perform their duties. There are significant but low positive
correlations between individual client-oriented behaviours, (rs=.396; p<.01),
individual adaptive behaviours (rs=.343; p<.01), individual proactive behaviours
(rs=.262; p<.01), individual proficiency behaviours (rs=.235; p<.01) and the

194
productivity of health workers. Indeed while adaptive, proactive and proficiency
behaviours may facilitate individual productivity; it is not always certain that this
will be the case.
The results in Table 4.24 further show that there are significant and moderate
correlations between the individual adaptive behaviours (rs=.643; p<.01),
individual proficiency behaviours (rs=.562; p<.01) and the competence of health
workers. There are also significant but low correlations between the individual
client-oriented behaviours (rs=.449; p<.01), individual proactive behaviours
(rs=.359; p<.01) and the competence of health workers. This can be interpreted
as follows: adaptive and proficient health workers are highly likely to be
competent but this may not always hold since competent health workers may not
always be adaptive. According to Kahya (2009:102) those workers who score
highly on creative performance are likely to achieve high outcomes in creative
effectiveness.
4.5.5.3 Correlation between the organisation factors and performance of health workers
Table 4.25 presents the correlation matrix of the associations between the
organisational factors and the performance dimensions of the health workers
(see detailed correlation matrix in annexure M).
Table 4.25: Correlation between the organisational factors and the dimensions of performance of health workers (N=276) Spearman’s rho rank order Non parametric correlations
Responsiveness Availability Productivity Competence
Clarity of the organisation strategy
Correlations Sig. (2-tailed) N
.747** .000 276
.756** .000 276
.600** .000 276
.473** .000 276
Working environment
Correlations Sig. (2-tailed) N
.889** .000 276
.963** .000 276
.451** .000 276
.332** .000 276
Staffing of organisation
Correlations Sig. (2-tailed) N
.814** .000 276
.908** .000 276
.592** .000 276
.176** .003 276
Work schedule
Correlations Sig. (2-tailed) N
.742** .000 276
.869** .000 276
.268** .000 276
.206** .001 276
Organisation culture
Correlations Sig. (2-tailed) N
.890** .000 276
.934** .000 276
.538** .000 276
.386** .000 276
** Correlation is significant at the 0.01 level (2-tailed)

195
Table 4.25 shows that all the correlations between the organisational factors and
the performance dimensions are positive. The results show significant and high
positive correlations between organisational culture (rs=.890; p<.01), working
environment (rs=.889; p<.01), staffing of the organisation (rs=.814; p<.01), clarity
of the organisation strategy (rs=.747; p<.01), work schedule (rs=.742; p<.01) and
the responsiveness of the health workers. Clearly, a healthy organisation culture,
working environment coupled with adequate staffing, flexible work schedules and
clear strategies, are highly likely to stimulate responsiveness on the part of
health workers. Brown and Harvey (2006:11) maintain that there are some
aspects of the organisation such as culture that may facilitate the
accomplishment of the organisational goals which in this case is the
achievement of good health outcomes.
There are significant and very high correlations between work environment
(rs=.963; p<.01), organisational culture (rs=.934; p<.01), staffing of the
organisation (rs=.908; p<.01) and the availability of health workers. There are
also significant and high correlations between the work schedule (rs=.869;
p<.01), clarity of the organisational strategy (rs=.756; p<.01)and the availability of
health workers. In general, a positive organisational culture, adequate staff
levels, staff availability, clear work schedules and strategies are likely to motivate
health workers and thus promote availability. The WHO (2007:16) reports that
there is a strong correlation between health workers density, services coverage
and health outcomes. Awofeso (2010:1319) maintains that poor working and
living conditions are some of the factors that impede performance of workers in
rural and remote areas of Nigeria.
Table 4.25 shows that there are significant and moderate correlations between
clarity of the organisation strategy (rs=.600; p<.01), staffing of the organisation
(rs=.592; p<.01), organisational culture (rs=.538; p<.01) and the productivity of
health workers. There are significant but low positive correlations between the
working environment (rs=.451; p<.01), the work schedule (rs=.268; p<.01) and
the productivity of health workers. Indeed a clear strategy, sufficient staff level, a
healthy culture are likely to enhance individual productivity. A study in Nigeria by

196
Taiwo (2010:306) maintains that a conducive work environment stimulates
creativity among employees that may facilitate better methods to enhance
productivity. Furthermore, improvement in work environment can result in higher
productivity of employees while bad working conditions may contribute to low
productivity.
The results from Table 4.25 indicate that there is a significant and moderate
correlation between the clarity of the organisational strategy (rs=.473; p<.01),
organisational culture (rs=.386; p<.01), working environment (rs=.332; p<.01),
and competence of health workers. There is little if any correlation between the
work schedule (rs=.206; p<.01), staffing of the organisation (rs=.176; p<.01) and
the competence of health workers. This moderate association may be due to the
fact that clear organisational strategies, a positive culture and a favourable
working environment may promote competence of health workers but this may
not always be the case. The little relationship between the work schedules,
staffing and competence may probably be because whether or not an
organisation has flexible schedules and adequate staff levels this may not
necessarily mean that its employees will be competent in their jobs.
4.6 FINDINGS RELATED TO OBJECTIVE TWO
The second objective of this study was to assess the current practices used to
manage performance of health workers. Under this objective the researcher
investigated how the health workers‟ performance is reviewed and how the
results from the performance appraisals are utilised. Also investigated were the
following: how the performance standards are set, how performance is
measured, reported, recognised and rewarded, and strategies for improving
performance.
4.6.1 Performance management
This section presents the analysis and interpretation of the finding concerning
how performance is reviewed, and how the results of performance appraisal are

197
utilised. Also presented are the aspects for setting performance standards,
performance measurement, performance reporting, performance improvement,
the rewarding system and the dimensions concerning staff training and
development.
4.6.1.1 Approaches to reviewing the performance of health workers
Figure 4.1 shows the approaches used to review the performance of health
workers in the districts.
49.6%
30.4%
19.9%
0
10
20
30
40
50
60
Formal and regular Informal but regular Informal and unscheduled
Perc
en
tag
e (
%)
Approaches used to review performance
Figure 4.1: How performance of health workers is reviewed in the districts (N=276)
Figure 4.1 shows that most of the health workers (n=137; 49.6%) indicated that
there is a formal and regular system for reviewing performance. Eighty-four
(30.4%) of health workers mentioned that there is an informal but regular
performance review system and 19.9% (n=55) mentioned that there are informal
and unscheduled performance reviews. The results depict that the methods of
reviewing the performance of health workers exist even though some of them
may be deficient as effective tools for performance review. According to
Mathauer and Imhoff (2006:[12]) performance management tools serve to
improve the performance of health workers. Performance management assists in
setting, communicating and internalising the organisational goals. This study has

198
found that there were some forms of annual performance review. Similar results
were also reported in Kenya. However, in Benin there was no such performance
assessment for health workers (Mathauer & Imhoff 2006:[12]).
4.6.1.2 How the results of performance review are utilised
Table 4.26 presents the responses from the health workers regarding how the
information from the performance reviews is used.
Table 4.26: The use of performance review results in the districts (N=276)
Use of performance review information
Yes No Total
n % n % N %
Training of staff 220 79.7 56 20.3 276 100
Promotion in service 222 80.4 54 19.6 276 100
Demotions of staff 55 19.9 221 80.1 276 100
Rotation of staff 193 69.9 83 30.1 276 100
Rewards 193 69.9 83 30.1 276 100
Not used at all 27 9.8 249 90.2 276 100
Table 4.26 shows that most of the participants (n=249; 90.2%) thought that at
least the information from the performance appraisals is utilised in one way or
the other to improve the performance of health workers. Two hundred and
twenty-two participants (80.4%) indicated that it is used for promotion of workers
in public service, and 79.7% (n=220) indicated that it is used for identifying the
training needs of health workers. Close to 70% (n=193; 69.9%) of the
participants indicated that performance review outcomes are used for rewarding
and rotating staff. The results showed that most participants (n=221; 80.1%) do
not think that the results of the staff appraisals are used for demoting staff.
It is apparent from these findings that the performance appraisal outcomes are
largely utilised in good course. Proper use of performance appraisal results is
expected to enhance performance management function and ultimately the
performance of health workers. According to Kruk and Freedman (2008:263) and
Smith et al (2008:1) effective performance measurement system should be used
to allocate resources, motivate employees, improve services, self-assessment

199
and improvement. The systems should also focus on improving health
programmes.
4.6.1.3 Setting performance standards
Table 4.27 shows the aspects concerning the setting of performance standards
in the organisations.
Table 4.27: Dimensions concerning the setting of performance standards (N=276) Item description Strongly
disagree Disagree Undecided Agree Strongly
agree Total
n % n % n % n %
n % N %
All health workers are familiar with the organisation‟s mission towards clients
0 0.0 28 10.1 55 19.9 139 50.4 54 19.6 276 100.0
I have a clear job description
0 0.0 82 29.7 0 0.0 112 40.6 82 29.7 276 100.0
The performance standards are clear
0 0.0 55 19.9 28 10.1 139 50.4 54 19.6 276 100.0
There are appropriate performance indicators to assess the health worker‟s performance
0 0.0 83 30.1 0 0.0 111 40.2 82 29.7 276 100.0
Targets are set for activities to be achieved in a given period
0 0.0 27 9.8 55 19.9 111 40.2 83 30.1 276 100.0
The performance standards, indicators, and targets are communicated to all departments to ensure that health workers understand them
27 9.8 28 10.1 55 19.9 138 50.0 28 10.1 276 99.9
This organisation regularly reports the performance of standards, indicators and targets to the external stakeholders
0 0.0 82 29.7 28 10.1 111 40.2 55 19.9 276 99.9
All the stakeholders in this organisation participate in setting performance standards
27 9.8 55 19.9 28 10.1 139 50.4 27 9.8 276 100.0

200
Table 4.27 indicates that out of the 276 participants, 194 (70.3%) agreed that
they had clear job descriptions and also agreed that targets are set for activities
to be achieved during a given period. Eighty-two (29.7%) participants disagreed
about having clear job descriptions and about 20% (n=55; 19.9%) were
undecided on whether targets are set for activities to be carried out in a given
period. Franco et al (2002:1255) point out that job descriptions with clearly stated
objectives, authority and lines of accountability are mostly associated with
improved achievement of work goals.
About seventy percent (n=193; 69.9%) of the participants agreed that all health
workers were familiar with the organisations‟ mission towards the clients, have
clear performance standards and appropriate indicators to assess the health
workers‟ performance. A study done in Indonesia (Dolea & Zurn 2004:1) reports
that using clear job descriptions with clear standards along with better in-service
training can enhance job satisfaction, compliance with standards and
performance among nurses and midwives.
Close to sixty percent (n=166; 60.2%) of the participants agreed that all the
stakeholders in the organisation participate in setting performance standards and
that the performance standards, indicators and targets are communicated to all
departments to ensure that all the health workers understand them. Similarly,
60.1% (n=166) participants indicated that their organisations regularly report
performance standards, indicators and targets to the external stakeholders. It is
however important to note that close to 30% (n=82; 29.7%) disagreed that all
stakeholders are involved in setting performance standards and also disagreed
that the organisations regularly report performance standards and indicators to
the external stakeholders. Rowe et al (2005:1032) and Manuwa-Olumide
(2009:8) mention that sharing information helps health workers perform better.
Hence, the organisations need to develop a culture of monitoring, evaluation and
feedback of health information to improve the performance of health workers.
The general understanding from these results is that the managers attempt to
put in place yard-sticks against which the performance of health workers is to be

201
evaluated. Staff participation and staff involvement is an important human
resource management function. It permits making the best use of the health
workers‟ knowledge, hands-on experience and ideas for improvement. In
addition, staff participation involves recognition and appreciation of their
competencies. This has an important effect on motivation and performance of
health workers (Mathauer & Imhoff 2006:[11]). Mathauer and Imhoff (2006:[12])
mention that in Benin and Kenya, many health workers (57% in Kenya and 80%
in Benin) felt that they were not given chance to participate in decision making at
their health facilities. Therefore, it is important to promote participation, for
example, by holding regular meetings as forums for health workers to share
ideas and suggestions for improvement and decision making on issues that
concern their work and immediate environment (Mathauer & Imhoff 2006:[12]).
4.6.1.4 Performance measurement
Table 4.28 presents the responses from the health workers concerning the
aspects of performance measurement in the districts.

202
Table 4.28: Dimensions of performance measurement in the districts (N=276) Item description Strongly
disagree Disagree Undecided Agree Strongly
agree Total
n % n % n % n %
n % N %
Objectives to be achieved are known by individuals to be assessed
0 0.0 55 19.9 0 0.0 194 70.3 27 9.8 276 100.0
The performance standards expected from the staff are clear and understood by all
0 0.0 83 30.1 0 0.0 138 50.0 55 19.9 276 100.0
The district clearly defines the way how to measure individual activity performance
27 9.8 56 20.3 0 0.0 138 50.0 55 19.9 276 100.0
This organisation has a system for collecting and tracking staff performance data
0 0.0 83 30.1 0 0.0 138 50.0 55 19.9 276 100.0
The organisation measures most of the established individual performance standards and targets
0 0.0 83 30.1 0 0.0 138 50.0 55 19.9 276 100.0
Individual health worker‟s performance is measured regularly
0 0.0 55 19.9 55 19.9 112 40.6 54 19.6 276 100.0
I am fully aware of the process used to measure my performance
0 0.0 56 20.3 54 19.6 112 40.6 54 19.6 276 100.1
My performance is evaluated based on my job description
0 0.0 28 10.1 27 9.8 167 60.5 54 19.6 276 100.0
My performance is fairly measured
0 0.0 28 10.1 55 19.9 166 60.1 27 9.8 276 99.9
Table 4.28 shows that most of the participants (n=221; 80.1%) agreed that their
performance is evaluated based on their job descriptions and that the objectives
to be achieved are known by the individual to be assessed. About 70% (n=193;
69.9%) of the participants agreed that the district clearly defines how to measure
the individual activity performance and makes sure that the performance
standards expected from the health workers are clear and understood by all.
About 30% (n=83; 30.1%) of the participants disagreed. Similarly, about 70%
(n=193; 69.9%) of the participants indicated that the organisation has a system
for collecting and tracking staff performance and measures most of the
established individual performance standards and targets. About 30% (n=83;

203
30.1%) of the participants were did not agree. Additionally, 69.9% (n=193) of the
participants agreed that their performance is fairly measured and about 19.9%
(n=55) were undecided while 10.1% (n=28) disagreed. Slightly over 60% (n=166;
60.2%) of the participants agreed that the individual health workers‟ performance
is measured regularly and that they are fully aware of the processes involved in
measuring their performance. In both cases about 20% (n=55; 19.9%) of the
participants were either undecided or were in disagreement.
These results show that in general the health managers attempt to measure the
performance of their subordinates. The results also show that not all participants
seem to know what performance measurement is all about and which indicators
are applied. This is consistent with what Mathauer and Imhoff (2006:[12-13])
found in Kenya. Kruk and Freedman (2008:264) point out that performance
measurement provides quality information to decision makers so that they can
determine whether their efforts are on course or not. Human resources indicators
are designed to monitor the current levels of organisational as well as human
resource performance in order to successfully attain the health sector reforms
(Hornby & Forte 2002:2; Kruk & Freedman 2008:269).
4.6.1.5 Performance reporting
Table 4.29 illustrates the dimensions concerning the reporting of health workers‟
performance in the districts.

204
Table 4.29: Dimensions concerning the reporting of performance of health workers (N=276) Item description Strongly
disagree Disagree Undecided Agree Strongly
agree Total
n % n % n % n %
n % N %
This organisation documents the progress related to performance standards and targets
0 0.0 28 10.1 55 19.9 112 40.6 81 29.3 276 99.9
This organisation has a specific system that regularly reports the performance of health workers
0 0.0 55 19.9 0 0.0 194 70.3 27 9.8 276 100.0
Constructive feedback on performance appraisal is provided on a regular basis
0 0.0 84 30.4 27 9.8 110 39.9 55 19.9 276 100.0
This organisation always reports the health workers‟ performance information to the external stakeholders
0 0.0 83 30.1 81 29.3 84 30.4 28 10.1 276 99.9
The health workers‟ performance data is analysed and reviewed according to the set performance standards, indicators, and targets
27 9.8 28 10.1 54 19.6 112 40.6 55 19.9 276 100.0
The health workers are given opportunity to make comments on the results of their performance
0 0.0 0 0.0 54 19.6 195 70.7 27 9.8 276 100.1
Table 4.29 shows that the majority of the participants (n=221; 80.1%) agreed
that the organisation has a specific system that regularly reports the
performance of health workers. About 80% (n=222; 80.4%) of the participants
agreed that they are given opportunity to make comments on the results of their
performance. Close to 70% (n=193; 69.9%) of the participants indicated that the
organisation documents progress related to the performance standards and
targets. Slightly over 60% (n=167; 60.5%) agreed that the health workers‟
performance data is analysed and reviewed according to the set standards,
indicators and targets. Of the participants, 59.8% (n=165) agreed they receive
constructive feedback on performance appraisals regularly. There was
uncertainty about reporting performance to the external stakeholders. Slightly
over 40% (n=112; 40.6%) of the participants agreed that health workers‟

205
performance data is reported to the external stakeholders, about 30% (n=83;
30.1%) disagreed and 29.3% (n=81) of the participants were undecided.
Although there are some few deviations, the findings indicate that to a great
extent the managers report the results of performance appraisal process. This
may assist in the implementation of appropriate measures for improving the
performance. In their study in Kenya and Benin, Mathauer and Imhoff (2006:[13])
report that almost half of the participants in Kenya and one tenth of the
participants in Benin claimed that they do not receive any personal feedback
from their superiors. Rafferty et al (2005:30) and Rowe et al (2005:1030)
mention the importance of feedback on both the successes and failures of
reinforcing performance. These researchers emphasise that feedback needs to
be effective and immediate for it to have a great impact on performance.
Managers have a very important role in providing an effective feedback.
However, Martinez (2003:210) and Rowe et al (2005:1028) point out that some
supervisors lack the skills to effectively communicate performance appraisal
results to their subordinates. In some situations performance appraisal results
are kept confidential and not communicated to the staff member concerned.
According to Luecke (2006:55) feedback works well when it is related to specific
performance standards.
4.6.1.6 Dimensions of performance improvement
The following Table 4.30 presents the responses of the health workers
concerning performance improvement in the district.

206
Table 4.30: Dimensions concerning performance improvement in the districts (N=276) Item description Strongly
disagree Disagree Undecided Agree Strongly
agree Total
n % n % n % n %
n % N %
Timely action is taken when performance falls below the acceptable levels
0 0.0 84 30.4 55 19.9 137 49.6 0 0.0 276 99.9
The performance reports are effectively used for decision making
0 0.0 57 20.7 110 39.9 109 39.5 0 0.0 276 100.1
The health workers‟ performance information is used to set priorities for personal development
0 0.0 57 20.7 82 29.7 137 49.6 0 0.0 276 100.0
The staff are involved in decision about performance improvement
0 0.0 56 20.3 27 9.8 165 59.8 28 10.1 276 100.0
The organisation has specific processes to manage changes in policies, programmes, or infrastructure
0 0.0 28 10.1 136 49.3 112 40.6 0 0.0 276 100.0
My supervisors encourage me to use different ways to improve my performance
0 0.0 55 19.9 28 10.1 166 60.1 27 9.8 276 99.9
Rewards and sanctions are based on performance results
0 0.0 85 30.8 54 19.6 110 39.9 27 9.8 276 100.1
The analysis of employees training needs is based on the performance appraisal reports
0 0.0 83 30.1 27 9.8 111 40.2 55 19.9 276 100.0
There are procedures to collect suggestions for performance improvement from the employees
27 9.8 83 30.1 27 9.8 111 40.2 28 10.1 276 100.0
I always have access to my supervisors when I need support
0 0.0 28 10.1 0 0.0 166 60.1 82 29.7 276 99.9
Table 4.30 shows that most of the participants (n=248; 89.8%) agreed that they
always have access to their supervisors whenever they need support. One
hundred and ninety-three (69.9%) participants agreed that their supervisors
encourage them to use different ways to improve their performance and that the
207
staff themselves are involved in decisions about performance improvement.
These findings are somehow similar to what Mathauer and Imhoff (2006:[13])
found in Kenya and Benin. In their study they report that health workers felt that
their managers were accessible, however, they did not always provide
encouragement and had insufficient consideration of the health workers‟ views
for improving performance.
Slightly more than 60% (n=166; 60.1%) of the participants agreed that analysis
of employees training needs is based on the performance appraisal reports and
about 30% (n=83; 30.1%) disagreed. Slightly more than 50% (n=139; 50.4%) of
the participants indicated that there are procedures to collect suggestions from
employees about performance improvements but about 40% (n=110; 39.9%)
disagreed.
Slightly less than 50% (n=137; 49.6%) of the participant agreed health workers‟
performance information is used to set priorities for personal development and
that timely action is taken when performance falls below acceptable levels.
However, about 50% (n=139; 50.4%) either disagreed or were undecided.
Similarly, of the participants, 49.6% (n=137) agreed that rewards and sanctions
are based on performance results, while 30.8% (n=85) were in disagreement
and 19.6% (n=54) were undecided. About 49% (n=136; 49.3%) of the
participants were uncertain about the existence of specific processes to manage
changes policies, programmes and infrastructure for performance, 40.6%
(n=112) agreed and 10.1% (n=28) disagreed. There was uncertainty about
whether performance reports are effectively used for decision making. One
hundred and ten participants (39.9%) were undecided as to whether
performance appraisal reports are used to make decisions about performance,
39.5% (n=109) agreed and 20.7% (n=57) disagreed. According to Smith et al
(2008:14-15) the performance monitoring and appraisal results can be used to
manage and enhance performance through staff training, counselling and
development.

208
The results of this study reveal that even though the organisational factors such
as effective performance management systems are inadequate, there is a
considerable effort by the health systems managers to improve the performance
of health workers. Katz and Green (1997:200) point out that performance
improvement should involve the elimination of problems and the exploitation of
performance opportunities. The performance problem may be related to service,
practice or governance.
4.6.1.7 Dimensions regarding the rewarding system
The following Table 4.31 gives the responses of the health workers concerning
the rewarding system in their districts or organisations.
Table 4.31: Dimensions concerning the rewarding system (N=276) Item description Strongly
disagree Disagree Undecided Agree Strongly
agree Total
n % n % n % n %
n % N %
I am paid according to my experience
27 9.8 57 20.7 83 30.1 82 29.7 27 9.8 276 100.1
My salary is according to my job responsibilities
0 0.0 82 29.7 0 0.0 139 50.4 55 19.9 276 100.0
Hard work is acknowledged and rewarded accordingly
0 0.0 84 30.4 109 39.5 83 30.1 0 0.0 276 100.0
All health workers know their fringe benefits
0 0.0 167 60.5 27 9.8 82 29.7 0 0.0 276 100.0
I am satisfied with the fringe benefits I get from my organisation
81 29.3 140 50.7 0 0.0 55 19.9 0 0.0 276 99.9
I feel my organisation offers sufficient opportunities for promotions
27 9.8 112 40.6 0 0.0 137 49.6 0 0.0 276 100.0
Table 4.31 shows that most of the participants (n=221; 80.0%) were not satisfied
with the fringe benefits they receive from their organisations. Slightly over 70%
(n=194; 70.3%) agreed that their salaries are in accordance with their job
responsibilities and about 30% (n=82; 29.7%) disagreed. Of the participants
60.5% (n=167) disagreed that all health workers know their fringe benefits,

209
29.7% (n=82) agreed and 9.8% (n=27) were undecided. Slightly over 50%
(n=139; 50.4%) of the participants indicated that their organisations do not offer
them sufficient opportunities for promotions and 49.6% (n=137) felt that their
organisations offer them promotional opportunities. There were mixed views
from the health workers on whether their organisations acknowledge or reward
hard work. About 40% (n=109; 39.5%) of the participants were uncertain, about
30% (n=83; 30.1%) agreed and another 30.4% (n=84) disagreed. Similarly, there
were mixed views also about whether the health workers were paid according to
their experience. About 40% (n=109; 39.5%) agreed that they are paid according
to their experience while 30.4% (n=84) disagreed and another 30% (n=83;
30.1%) were undecided.
These results provide a clear picture of how deficient the rewarding system is in
the decentralised health system. This is highly likely to have a negative bearing
on the performance of health workers. According to Hagopian et al (2009:w869)
the reward and remuneration systems are believed to influence the behaviours
and performance of health workers. The WHO (2006:75) emphasises that health
workers must be remunerated well for the work they perform. If health workers
are not paid well, they are likely to adopt some sort of coping mechanisms such
as absenteeism, migration, creation of ghost workers and referring patient to
private sector where some health workers hold part-time job (McPake et al
1999:849). Langenbrunner et al (2005:242) argue that service based methods
(fee-for-service) are more effective in increasing performance and productivity
than time based methods such as salaries and fixed budgets. Performance
related payment methods are increasingly being applied in many developed
countries and some developing countries such as Rwanda have adapted such
systems (Manuwa-Olumide 2009:8).
4.6.1.8 Dimensions concerning staff training and development
Table 4.32 shows the responses of health workers concerning staff training and
development in their districts or organisation.

210
Table 4.32: Dimensions concerning staff training and development (N=276)
Item description Strongly disagree
Disagree Undecided Agree Strongly agree
Total
n % n % n % n %
n % N %
This organisation has a staff training and development policy
28 10.1 82 29.7 55 19.9 83 30.1 28 10.1 276 99.9
Opportunities exist for career advancement in this organisation
0 0.0 110 39.9 0 0.0 138 50.0 28 10.1 276 100.0
Appropriate training is conducted to ensure that health workers carry out their duties well
0 0.0 56 20.3 0 0.0 192 69.6 28 10.1 276 100.0
Job specific refresher courses are provided on a regular basis
28 10.1 109 39.5 27 9.8 112 40.6 0 0.0 276 100.0
The in-service training provided is adequate in addressing the existing skills gap
28 10.1 109 39.5 28 10.1 111 40.2 0 0.0 276 99.9
Health workers who are less competent are provided with the necessary support to improve their knowledge and skills
0 0.0 83 30.1 54 19.6 139 50.4 0 0.0 276 100.1
Health workers participate in identifying their career development needs
0 0.0 28 10.1 55 19.9 193 69.9 0 0.0 276 99.9
In the last 6 months my supervisors discussed with me my career development prospects
55 19.9 111 40.2 0 0.0 110 39.9 0 0.0 276 100.0
I have received the training required to succeed in my position
0 0.0 27 9.8 0 0.0 221 80.1 28 10.1 276 100.0
Table 4.32 shows that the majority (n=249; 90.2%) of the health workers agreed
that they have received the training required to succeed in their positions. About
80% (n=220; 79.7%) of the participants also agreed that appropriate training is
conducted to ensure that health workers carry out their duties well. Nearly 70%
(n=193; 69.9%) of health workers agreed that they participate in identifying their
career development needs. About 60% (n=166; 60.1%) of the health workers
agreed that opportunities exist for career advancement in their respective

211
organisations and about 40% (n=110; 39.9%) disagreed. The results show that
nearly 60% (n=166; 60.1%) of the participants disagreed that in the past six
months their supervisors had discussed with them their career development
prospects and about 40% (n=110; 39.9%) agreed.
Slightly over 50% (n=139; 50.4%) of the participants indicated that health
workers who are less competent are provided with the necessary support to
improve their knowledge and skills, about 30% (n=83; 30.1%) disagreed and
about 20% (n=54; 19.6%) were undecided. Slightly less than 50% (n=137;
49.6%) of the participants indicated that that the in-service training provided is
inadequate for addressing the existing skills gap and that there was irregular job
specific refresher courses; about 40% (n=112; 40.6%) thought there were
regular job specific refresher courses and about 10% (n=27; 9.8%) were
undecided. There were mixed views with regard to staff training and
development policy. About 40% (n=111; 40.2%) agreed that there was a training
and development policy for health workers; about 40% (n=110; 39.9%)
disagreed and about 20% (n=55; 19.9%) were undecided.
From these results it can be deduced that the district managers attempt to
address the short term training needs while the health workers‟ long term
developmental needs may not be sufficiently addressed. Training and
professional development are important motivation and performance
determinants as they nurture the health workers‟ personal objectives and their
value systems. Training can enable health workers to cope better with the
requirements of their jobs, enable them to take on more demanding duties and
positions and to achieve the personal goals of professional advancement
(Mathauer & Imhoff 2006:[10]). In service training is one of the commonly used
methods in the health sector to enhance performance of health workers.
Armstrong (2009:667) and Swansburg and Swansburg (1999:571) mention that
in-service training provides a learning experience in the workplace for the
purpose of refining new skills and therefore developing the health workers‟
potential to perform and adjust rapidly to the changing job requirements.
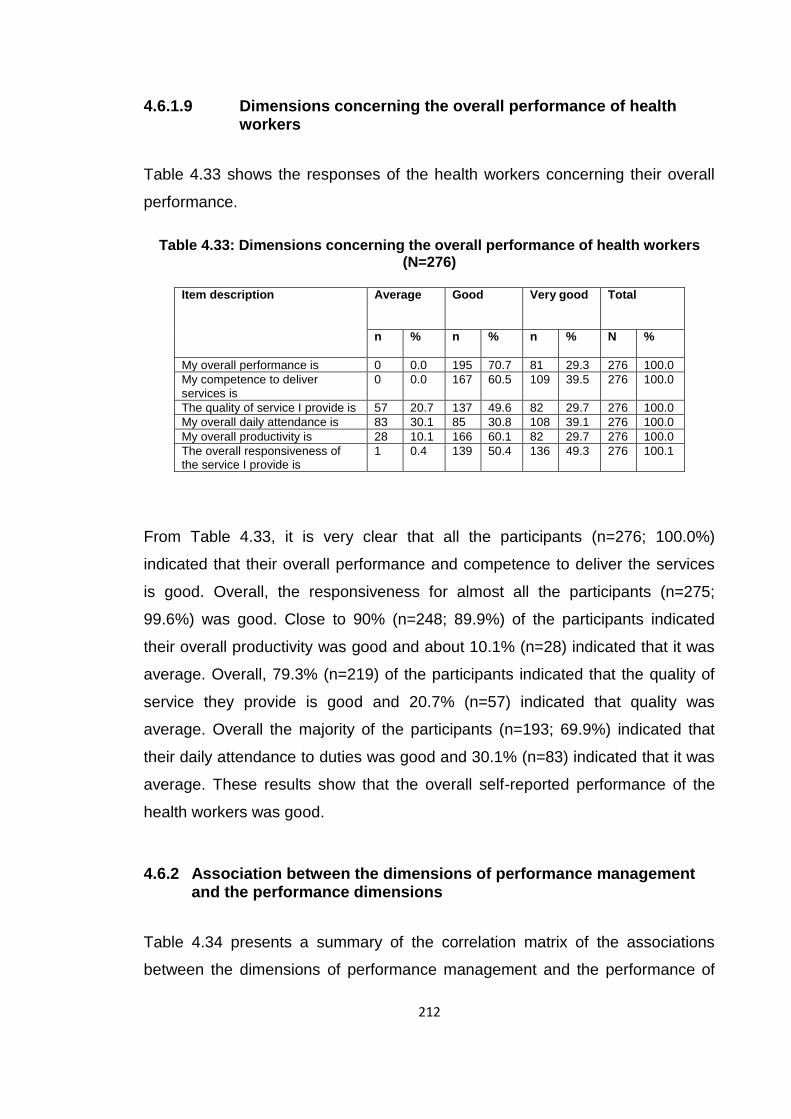
212
4.6.1.9 Dimensions concerning the overall performance of health workers
Table 4.33 shows the responses of the health workers concerning their overall
performance.
Table 4.33: Dimensions concerning the overall performance of health workers
(N=276)
Item description Average Good Very good Total
n % n %
n % N %
My overall performance is 0 0.0 195 70.7 81 29.3 276 100.0
My competence to deliver services is
0 0.0 167 60.5 109 39.5 276 100.0
The quality of service I provide is 57 20.7 137 49.6 82 29.7 276 100.0
My overall daily attendance is 83 30.1 85 30.8 108 39.1 276 100.0
My overall productivity is 28 10.1 166 60.1 82 29.7 276 100.0
The overall responsiveness of the service I provide is
1 0.4 139 50.4 136 49.3 276 100.1
From Table 4.33, it is very clear that all the participants (n=276; 100.0%)
indicated that their overall performance and competence to deliver the services
is good. Overall, the responsiveness for almost all the participants (n=275;
99.6%) was good. Close to 90% (n=248; 89.9%) of the participants indicated
their overall productivity was good and about 10.1% (n=28) indicated that it was
average. Overall, 79.3% (n=219) of the participants indicated that the quality of
service they provide is good and 20.7% (n=57) indicated that quality was
average. Overall the majority of the participants (n=193; 69.9%) indicated that
their daily attendance to duties was good and 30.1% (n=83) indicated that it was
average. These results show that the overall self-reported performance of the
health workers was good.
4.6.2 Association between the dimensions of performance management and the performance dimensions
Table 4.34 presents a summary of the correlation matrix of the associations
between the dimensions of performance management and the performance of

213
health workers. The performance dimensions of health workers include
responsiveness, availability, productivity and competence (see detailed
correlation matrix in annexure N).
Table 4.34: Correlation between performance management and the dimensions of performance (N=276) Spearman’s rank order Non parametric correlations
Responsiveness Availability Productivity Competence
Setting of performance standards
Correlations Sig. (2-tailed) N
.842** .000 276
.885** .000 276
.569** .000 276
.365** .000 276
Performance measurement
Correlations Sig. (2-tailed) N
.676** .000 276
.644** .000 276
.469** .000 276
.349** .000 276
Performance reporting
Correlations Sig. (2-tailed) N
.728** .000 276
.712** .000 276
.680** .000 276
.094
.120 276
Performance improvement
Correlations Sig. (2-tailed) N
.874** .000 276
.861** .000 276
.349** .000 276
.195** .001 276
Rewarding system
Correlations Sig. (2-tailed) N
.735** .000 276
.871** .000 276
.435** .000 276
.319** .000 276
Staff training and development
Correlations Sig. (2-tailed) N
.799** .000 276
.801** .000 276
.387** .000 276
.842** .000 276
** Correlation is significant at the 0.01 level (2-tailed)
Table 4.34 shows that all the correlations between the dimensions of
performance and performance management are positive. The results show
significant and positive high correlation between performance improvement
(rs=.874; p<.01), setting performance standards (rs=.842; p<.01), performance
reporting (rs=.728; p<.01), rewarding system (rs=.735; p<.01), staffing training
and development (rs=.799; p<.01) and responsiveness of health workers. There
is also a significant and moderate correlation between performance
measurement (rs=.676; p<.01) and responsiveness of health workers. The
interpretation of these correlations is that the health workers are more likely to be
responsive when they have clear and specific performance expectations on how
to execute their duties. An effective rewarding system motivates the health
workers and hence is likely to generate satisfactory levels of responsiveness.
Adequate staffing reduces the workload on health workers enabling them to
manage their tasks effectively. In addition, when health workers are constantly
given a feedback on how they are performing, they are more likely to execute

214
their duties efficiently in order to avoid falling behind expected levels of
performance.
The results show significant and high positive correlations between setting
performance standards (rs=.885; p<.01), performance reporting (rs=.712; p<.01),
performance improvement (rs=.861; p<.01), rewarding system (rs=.871; p<.01),
staff training and development (rs=.801; p<.01) and availability of health workers.
There is a significant and moderate positive relationship between availability of
health workers and performance measurement (rs=.644; p<.01). These can be
interpreted thus: the health workers are more likely to be available for duty when
they know that there are clear expectations on how they should perform.
The results show significant and moderately positive correlations between
setting performance standards (rs=.569; p<.01), performance reporting (rs=.680;
p<.01) and productivity of health workers. There are also significant and low
positive correlations between performance measurements (rs=.469; p<.01),
performance improvement (rs=.349; p<.01), rewarding system (rs=.435; p<.01),
staff training and development (rs=.387; p<.01) and productivity of health
workers. The results signify the high likelihood of increased productivity of the
health workers following the presence of clear performance guidelines and a
clear account of their work related activities. The low association between
performance measurement; performance improvement; rewarding system; staff
training and development and productivity indicates that there may be other
factors which determine the motivation of the health workers to perform other
than those mentioned.
Table 4.34 shows that there is a significant and high positive correlation between
staff training and development (rs=.842; p<.01) and competence of health
workers. Indeed it is to be expected that with adequate training and continuous
professional development, the health workers will be more capable of executing
their tasks competently. The results further show significant and low positive
correlations between setting performance standards (rs=.365; p<.01),
performance measurements (rs=.349; p<.01) and rewarding system (rs=.319;

215
p<.01) and competence of health workers. This shows that no matter how stern
the performance standards and the performance measurement system may be,
the health workers will not automatically become competent. Moreover, an
effective rewarding system may not necessarily translate into competence.
There was little if any correlations between performance reporting (rs=.094;
p>.05), performance improvement (rs=.195; p<.01) and competence of health
workers. These results indicate that effective performance reporting and
performance improvement may not be primary determinants of competence.
Perhaps the health managers may choose not to utilise performance appraisal
results to identify training needs, resulting in ad hoc training programs which do
not address the actual needs on the ground.
4.7 FINDINGS RELATED TO OBJECTIVE THREE
The third objective of the study was to determine the views of health workers on
how to improve performance. This objective was investigated using an open-
ended question. The responses were entered in the computer, coded, and then
analysed using the multiple response method. The results are shown in Table
4.35.
Table 4.35: Health workers’ responses on how to improve performance (N=261*)
Category of response Frequency of responses (n)
Percentage (%)
Improve staff motivation such as increase in remuneration, equipment.
201 77.0
Provide opportunities for further formal studies/training.
150 57.5
Provide continuous refresher training courses.
137 52.5
Conduct regular meetings to discuss health worker‟s performance related issues.
68 26.1
Regular staff rotation in different health facilities.
18 6.9
*15 participants did not respond to this question.
Table 4.35 shows that out of the 261 participants that responded to this question,
the majority (n=201; 77.0%) reported that they wanted to see an improvement in
216
the staff motivation. Such motivation attributes that were mentioned include
increase in remunerations; provision of equipment to facilitate easy execution of
tasks; provision of uniforms since most health workers had to purchase their own
uniforms instead of being provided by the organisation, and provision of
accommodation for staff nearer to the health facilities. They thought this would
help to improve motivation and hence the performance of health workers. The
findings of this study are in agreement with what the health workers in Kenya
and Benin suggested on how they can improve their motivation and performance
(Mathauer & Imhoff 2006:[8]).
Hagopian et al (2009:w869) observe that the level of remunerations, the way
health workers are paid and the presence of other incentives always have an
impact on the performance of health workers. Writers like Manuwa-Olumide
(2009:8), Rese et al (2005:204) and WHO (2006:18) argue that no matter how
skilled health workers are, very little can be achieved without basic infrastructure
such as working equipment, essential drugs, clean water and other supplies.
About 58% (n=150; 57.5%) of the participants suggested that there should be an
improvement in opportunities for provision of further formal training for those
health workers that want to advance their careers. Additionally, about 53%
(n=137; 52.5%) of the participants suggested that they should be provided with
continuous refresher courses. Dieleman and Harnmeijer (2006:16) argue that
advances in medical field such as treatment and diagnosis and the changing
roles within the health sector require continuous professional development.
Health workers require up-to-date knowledge to perform well. Inadequate
knowledge, skills and inappropriate attitudes may be an impediment to quality
health care. Continuous professional development is essential for the health
workers at all levels, especially those at the lowest levels who go through the
shortest periods of training (Manuwa-Olumide 2009:9; Mbindyo et al 2009:[7]).
Slightly more than 26% (n=68; 26.1%) of the participants suggested that there
should be regular staff meetings to discuss the health workers‟ performance
related issues. Information and communication are very important aspects in

217
improving the performance of health workers. Health workers need to know how
they are performing and if there are any obstacles to their performance these
can be identified and adressed at an early stage. Rowe et al (2005:1032) point
out that having information helps health workers to do their jobs better. This
information must be relevant to the job, available when needed, be of good
quality and easy to understand. According to WHO (2006:80) the productivity of
health workers should be based on reliable data about the workforce level,
distribution, skills mix and information about those aspects that impede their
performance.
Lastly, only 6.9% (n=18) of the participants suggested regular rotation of staff to
various health facilities. This can be useful since it may encourage transfer of
skills from one health facility to the other and also for example those health
workers working in rural areas can have an opportunity to move to urban areas.
This can improve their motivation and subsequently their performance.
4.8 CONCLUSION
Chapter four presented the analysis and interpretation of quantitative data. The
response rate for this study was satisfactory, standing close to 84%. Data was
tested for normality before being analysed using SPSS Version 18. In order to
determine the consistency of the responses from the participants the Cronbach‟s
reliability coefficient tests were utilised. This study made use of frequencies and
percentages to summarise the data. The extent to which association exits
between two variables was determined by the Spearman‟s rho rank order
correlation coefficient (rs).
The first objective of this study was to identify factors that either enhance or
impede the performance of health workers. Five individual attributes namely job
related skills and abilities, self-monitoring ability, self-motivation, commitment to
the organisation, and individual values and beliefs were investigated. The
general findings revealed that the health workers possessed positive attributes
suitable for good performance.

218
Objective two assessed the current practices used to manage the performance
of health workers. Of the main focus was how the performance of the health
workers was reviewed as well as how the performance appraisal results were
utilised. Of the participants 49.6% reported that the performance appraisals were
formal and regular. Eighty percent of the participants indicated that the
performance appraisal results are used for promotion in service.
The third objective investigated the views of the health workers on how to
improve performance. The health workers recommended that both the intrinsic
and the extrinsic motivational factors must be improved. The next chapter
presents the analysis, interpretation, and discussion of the qualitative findings.

219
CHAPTER 5 ANALYSIS, INTERPRETATION AND DISCUSSION OF QUALITATIVE DATA
(LEVEL 2)
5.1 INTRODUCTION
In this chapter, the analysis, interpretation and discussion of the findings for the
qualitative data is presented. The qualitative data was collected from the health
service managers in the districts of Kumi, Mbale, Sironko and Tororo. The
qualitative data collection was meant to obtain in-depth information from the
health service managers with respect to the following objectives which are to:
identify the factors that enhance or impede the performance of health
workers
assess the current practices used to manage the performance of health
workers
determine the views of the managers on how to improve performance
5.2 RESEARCH METHODOLOGY
This level of data collection used the qualitative data collection methodology.
The details of qualitative data methodology are discussed in chapter 3. Data
collection from the health service managers ran concurrently with the
quantitative data collection from the health workers. The main purpose of
qualitative data was to get the answers to the research objectives from the
perspective of the district health service managers.
5.2.1 Study population
The study population was the health service managers working in the districts of
Kumi, Mbale, Sironko and Tororo. These managers were directly involved in
supervising and appraising health workers. They included the DHOs; district
nursing officers (principal nursing officers); heads of the health the sub-districts
(health centre IVs); hospital medical superintendents; hospital administrators and

220
the principal personnel officers. All the health service managers were working in
the public sector.
5.2.2 Sampling
The participants were selected by purposive sampling based on predetermined
criteria such as hierarchy in the district health services and the level of
involvement in supervision of health workers. A total of 24 managers were
approached for the interviews. The aim was to have at least 6 interviews from
each district. Two (2) managers declined the interview saying that they did not
have time and one (1) was attending a training workshop. Ultimately, a total of
21 health service managers were interviewed. The distribution of the
interviewees per district is shown in Figure 5.3.
5.3 DATA COLLECTION
The researcher used one-to-one approach of interviewing using an interview
guide (annexure I). The researcher together with the trained research assistants
conducted the interviews. One of tthe research assistants was recording
responses on audio tape cassettes, while the others were taking comprehensive
notes of the interviews.
5.3.1 Permission to conduct interviews
A written consent was obtained from each participant using a consent form
(Annexure E). This consent form was given to the participant, who had to sign it
and return it to the interviewers just before the interview commenced. All the
managers who participated in the study signed this consent form. The consent
form indicated the purpose of the study, rights of the participants and the
purpose for which the data was to be used.
5.3.2 Interview guide
The interview guide (Annexure I) was semi-structured and had two main
sections. Section A contained the biographic information of the participants and
that of their districts. Section B had eight open- ended questions related to the

221
objectives of the study. Where and when it was necessary, probes were used in
order to get additional information.
5.3.3 Conducting interviews
All the interviews were conducted in English using the semi-structures interview
guide. The researcher gave a hard copy of the interview guide to the
interviewees well before the interview commenced in order to give them a
chance to follow the sequence of the questions. The researcher conducted the
interviews and was assisted by the trained research assistants. Permission was
sought from the participants before the interview commenced. Permission was
also requested for the use of the audio tape recorder. Out of the 21 participants,
only three declined to be audio tape recorded. In such cases comprehensive
notes were written by the trained research assistants.
5.3.4 Transcription of interviews
At the end of the interviews, the transcription of the interviews was done
verbatim and captured on computer using Microsoft Word 2007. Two
experienced transcribers were employed to transcribe the data from the audio
tapes. After the transcriptions each interview was sent back to the participants to
confirm whether what they said during the interview is what was indeed
recorded. This process was meant to ensure confirmability and credibility of the
findings. The transcriptions were confirmed by the researcher before the final
version of transcribed information was made.
5.4 DATA ANALYSIS
Data analysis commenced simultaneously with data collection and continued
after transcribing the interviews. Data from section A was analysed using the
SPSS version 18 and data from the opened-ended questions in section B of the
interview schedule was coded and analysed manually. The researcher read the
transcribed information at least three times. Following this, the themes and
subthemes were identified. Subsequently, the categories for each subtheme

222
were identified. The researcher used the services of a stastician to crosscheck
and confirm the coding. Where necessary during the presentation of the results
the researcher used typical quotes from the participants.
5.5 PRESENTATION OF FINDINGS FROM SECTION A OF THE INTERVIEW GUIDE
This section presents the results from section A of the interview guide which is
about the demographic characteristics of the participants.
5.5.1 Demographic characteristics of the participants
The demographic characteristic of the participants are indicated in the
subsequent subsections (5.5.1.1 to 5.5.1.6).
5.5.1.1 Gender of the participants
Figure 5.1 shows the gender of the participants.
Figure 5.1: Gender of the health service managers (N=21)
Figure 5.1 shows that out of the 21 health service managers that interviewed,
about 76% (n=16; 76.2%)) were male, and about 24% (n=5; 23.8%) were
female.

223
5.5.1.2 Age categories of the participants
Figure 5.2 presents the ages of the participants
Figure 5.2: Age of the health service managers (N=21)
Figure 5.2 shows that most of the participants (n=14; 66.7%) were aged between
30 years to 49 years. This is an indication that all the managers were mature
adults.
5.5.1.3 District of work of the participants
Figure 5.3 presents the distribution of health services managers by the districts.
Figure 5.3: Districts where the health service managers work (N=21)

224
There was a good representation of participants from all the four districts. Most
of the managers interviewed were from Sironko district (n=7; 33.3%), followed by
Kumi district (n=6; 28.6%). Both Mbale and Tororo districts were represented
each by 4 (19.1%) participants.
5.5.1.4 Duration of work in the district
Table 5.1 shows the years the managers have workers in their current positions
in the districts.
Table 5.1: The number of years managers have worked in the district (N=21)
Duration in Current position
Frequency (n) Percentage (%)
0-5 years 4 19.1
6-10 years 10 47.6
11-15 years 4 19.1
16 years and above 3 14.2
Total 21 100
Table 5.1 shows that most of the health service managers (n=17; 80.9%) have
been in their positions for more than 5 years. Only 4 (19.1%) managers have
been in their current positions for up to 5 years.
5.5.1.5 Training in human resource management or general management
Figure 5.4 presents the proportions of managers that have had some human
resource and/or management training.
Figure 5.4: Training in human resource or general management (N=21)

225
Figure 5.4 shows that most of the managers (n=16; 76.2%) have had some form
of training in human resource or general management.
5.5.1.6 Type of training/programme in which the managers learnt human resource management
Table 5.2 shows the type of training during which the managers learnt about
human resource management.
Table 5.2: Type of training/programme attended by the managers (n=16)
Type of Training Frequency (n) Percentage (%)
Master in public health 3 18.7
MSc health services management 2 12.5
MSc of human resource management 1 6.3
BA Public administration 1 6.3
BSc Health services management 6 37.5
Middle level managers training courses
3 18.7
Total 16 100.0
Out of the 16 managers who attended the training in management or human
resources management, 37.5% (n=6) did so under their formal masters training
courses such as Master in Public Health and Masters of Science for example in
health services management and human resource management. About 45.8%
(n=7) had training in management during their bachelor degrees and 18.7%
(n=3) had such training during the middle level managers‟ training programmes.
5.5.1.7 Forum for discussion of issues concerning the performance of health workers
All the managers interviewed (n=21), indicated that they have attended various
forums during which HRH performance issues were discussed. Table 5.3 shows
the list of forums where performance is discussed.

226
Table 5.3: Forums where performance has been discussed (n=21)
Forum level Yes No Total
n % n % N %
Ministry of Health 12 57.1 9 42.9 21 100
District 16 76.2 5 23.8 21 100
Health sub-district 12 57.1 9 42.9 21 100
Health facility level 14 66.7 7 33.3 21 100
One to one (individual basis) 11 52.4 10 47.6 21 100
Majority of the managers indicated that most of the performance related
discussions take place at the district level (n=16; 76.2%) and health facility levels
(n=14; 66.7%). An equal number of participants (n=12; 57.1%) indicated that
health workers performance related issues are discussed at the ministry of
health and health sub-district levels. About 52.4% of the health managers
indicated that performance related issues are discussed on one-to-one basis.
5.6 PRESENTATION, INTERPRETATION AND DESCRIPTION OF FINDINGS FROM SECTION B OF THE INTERVIEW GUIDE
This section deals with analysis of data obtained through the open-ended
questions of the interview schedule (Annexure I). As mentioned earlier in chapter
3, the interviews were audio taped and transcribed verbatim. After reading and
re-reading the transcripts from the 21 interviews, themes and subthemes were
identified and classified into major categories. The coding was done manually by
the researcher and was cross-checked and confirmed by an experienced
scientist from University of Malawi with a master degree in applied statistics and
with over 18 years of experience in the field of qualitative and quantitative
research methodologies. Table 5.4 shows the themes, subthemes and
categories that were identified.

227
Table 5.4: Emerging themes, subthemes, and categories
THEME SUB-THEME CATEGORIES
1 Factors that may enhance or impede the performance of health workers
1.1 Organisational (health system) factors
1.1.1 1.1.2 1.1.3 1.1.4 1.1.5 1.1.6 1.1.7 1.1.8 1.1.9 1.1.10 1.1.11 1.1.13 1.1.14 1.1.15 1.1.16 1.1.17 1.1.18
Working environment Drugs, supplies, and equipment Remuneration Accommodation and living conditions Transport and referral system Support supervision Prospects for further studies Communication and interpersonal relations Experience sharing Promotion prospects or career movement Performance appraisal and recognition Working relationships Responsibility Clarity of the organisational mission Mobility of health workers Staffing levels and turnover rates Primary health Care (PHC) funding
1.2 Individual factors 1.2.1 1.2.2 1.2.3 1.2.4 1.2.5
Availability Competence Pro-activity Client –oriented behaviour Productivity
1.3 Institutional (local government) factors
1.3.1 1.3.2 1.3.3 1.3.4
Decentralisation Government policies and guidelines Political interference Health seeking behaviours of communities
2 Views of managers on how to improve the performance of health workers
2.1 Organisational (health system) initiatives
2.1.1 2.1.2 2.1.3 2.1.4 2.1.5
Improving remuneration Training of health workers Delegation of responsibility Hospital infrastructure, accommodation and transport. Support supervision
2.2 Institutional (local government) initiative
2.2.1
Centralise the office of the District health officer (DHO) and the management of health workers
2.3 Community initiative
2.3.1
Community appreciation and support for health workers
3 Existing practises for managing the performance of health workers
3.1 Planning for performance appraisal
3.1.1 3.1.2
Target setting and performance agreements Pre-appraisal planning meetings
3.2 Performance measurement
3.2.1 3.2.2
Performance measurement tools and indicators Frequency of performance measurement.
3.3 Performance reporting and feedback
3.3.1 3.3.2
Mode and frequency of reporting Mode and frequency of giving performance feedback
3.4 Recognising performance
3.4.1
Modes of recognising performance (such as Issuing certificates, end-of-year parties, gifts and words of praise)
3.5 Use of 3.5.1 Ways in which performance appraisal

228
performance appraisal results
results are used (such as identifying training needs, promotions , redistribution of staff, support supervision , and not used)
4 Suggestions of managers on how to improve performance appraisal
4.1 Performance appraisal tool
4.1.1
Review appraisal tool
4.2 Performance appraisal process
4.2.1 Nature and frequency of appraisal process
4.3 Recognising performance
4.3.1 Rewarding good performance
4.4 Performance appraisal feedback
4.4.1
Frequency of appraisal feedback
4.5 Using performance appraisal results
4.5.1
Promotions Confirmation in the civil service Training
4.6 Training of supervisors
4.6.1
How to conduct the appraisals and the Importance of appraisal process
As indicated in Table 5.4, the data collected from the health services managers
had four major themes. The following subsections provide the detailed
presentation and discussion of the results according to the themes and
objectives of the study.
5.6.1 Theme 1: Factors that may enhance or impede the performance of health workers
One of the emerging themes from this study concerns factors that can either
enhance or impede the performance of health workers. The following three sub-
themes were identified: organisational factors (health system), individual
factors, and institutional (local government) factors. Out of these, several
categories emerged as illustrated in Table 5.4. This section discusses
organisational (health system) factors that influence the performance of health
workers as illustrated in Table 5.5.

229
Table 5.5: Organisational factors influencing the performance of health workers
THEME SUB-THEME CATEGORIES
1. Factors that may enhance or impede the performance of health workers
1.1 Organisational (health systems) factors
1.1.1 1.1.2 1.1.3 1.1.4 1.1.5 1.1.6 1.1.7 1.1.8 1.1.9 1.1.10 1.1.11 1.1.12 1.1.13 1.1.14 1.1.15 1.1.16 1.1.17
Working environment Drugs, supplies. and equipment Remuneration Accommodation and living conditions Transport and referral system Support supervision Prospects for further studies Communication & interpersonal relations Experience sharing Promotion prospects/career movement Performance appraisal and recognition Working relationships Responsibility Clarity of organisation mission Mobility of health workers Staffing levels and turnover rates Primary Health Care (PHC) funding
5.6.1.1 Subtheme 1.1: Organisational (health system) factors
Factors emanating from the organisational factors (health systems) can affect
the performance of health workers both positively and negatively. The following
categories present an outline of the factors identified by the managers as either
enhancing or impeding the performance of their subordinates (health workers). It
was noted from the interviews that all the factors but two identified by the
participants were those that negatively affect performance.
5.6.1.1.1 Working environment
Most of the interviewees (n=19; 90.5%) alluded to the poor general working
environment in the health facilities as a hindrance to good performance. The
most recurring issues under working conditions were related to lack of adequate
working space. Some of the participants stated:
“...by the time these hospitals were built the population was low and of course the infrastructures here have remained the same. You find that you have the same space now like you had in the 1960s...” “...work environment is a big problem here, you come to things like inpatient wards are too small, patients sleep on floors, the workspace is inadequate, it is really frustrating for us...”

230
“...the working environment here is not conducive at all...how do you expect me to work to the fullest...”
Working environment plays a big role in the performance of health workers. A
study done in Uganda (Hagopian et al 2009:w869) found that many health
workers are unmotivated by the working conditions in their health facilities. This
affects the motivation and morale of health workers and may consequently lead
to poor performance. This is consistent with what the researcher has found in
this study. El-Jardali et al (2007:[9]) emphasise the importance of working
conditions that can either pull or push health workers and therefore affect their
performance. Such conditions include unbearable working conditions, safety
hazards and poor management practices.
5.6.1.1.2 Drugs, supplies and equipment
Nearly all the managers (n=20; 95.2%) mentioned that the lack of sufficient
drugs and supplies such as gloves and equipment is a hindrance to
performance. These seemed to create problems not only in the context of duty
execution but also impacts on the relationships between health workers and the
communities. Some of the managers (n=12; 57.1%) regrettably reported that
some community members accuse them of hoarding the drugs to sell them for
their own (health workers‟) personal gains.
“...you find that our health workers perform their duties without any protective gear like gloves. You can have cases that require gloves but you can run out stock of gloves for months and therefore you have to depend on patient attendants to go a buy from the shops...” “...there is an instance where one of my midwives here had to deliver a baby using these plastic bags („buveera‟), the baby was coming and she had no gloves so she had to improvise and save both the baby and mother...” „‟...stock outs of drugs is a common occurrence here, and sometimes they accuse us of stealing drugs when actually the amount of drugs supplied to us cannot even last for a month...”
A number of studies have reported similar findings. Willis-Shattuck et al
(2008:[8]) report cases of frequent stock outs of materials like drugs, gloves and

231
even supplies like laboratory reagents in many health facilities in Africa.
Hagopian et al (2009:w869) report that in Uganda health workers lack the
necessary supplies needed to perform their jobs well and safely. Such supplies
include gloves, needles, bandages and the equipment such as x-ray machines
and films as well as blood pressure cuffs among others. This negatively affects
the performance of health workers. Health facility resource availability should be
a principal consideration since patient care cannot be effective without the
proper and adequate resources.
5.6.1.1.3 Remuneration
There was a unanimous view (n=21; 100.0%) that low pay for health workers
negatively impacts on the motivation of health workers, thereby resulting in poor
performance. Health workers are tempted to engage in other money making
activities besides their duties. This splits their attention and in due course
compromises their availability for work.
“...I don‟t really understand why we health workers are the least paid civil servant. Members of parliament are getting more and more allowances...” “... why do you think health worker‟s go for part-time private practice? It is because their pay is pathetic...” “...health workers in Uganda are the least paid in the whole east African region, that‟s why you see our doctors and nurses moving to other countries where pay is good...”
Chirdan et al (2009:246) point out that in Nigeria, the health workers are also not
happy with their remuneration. This is a common finding in many African and
other developing countries including Uganda. The WHO (2006:75) emphasises
that health workers should be paid well and timely for the work they do.
Hagopian et al (2009:w869) report that in Uganda only 11% of health workers
feel that their salaries are fair. Health workers find it very important to have
remuneration package that includes health care for their dependants, terminal
benefits, housing, food and transportation allowance. The way health workers
are paid makes a big difference in their performance and productivity. McPake et
al (1999:849) mention that where the health workers are not paid well they are

232
likely to develop some coping mechanisms such as migration, absenteeism and
referring patients to private clinics where they hold part-time jobs in order to
ensure survival. In general, poor compensation is more likely to impede the
performance of health workers.
5.6.1.1.4 Accommodation and living conditions
All the managers (n=21; 100.0%) firmly complained that inadequate and
substandard housing hinders the performance of health workers. Lack of
accommodation near the duty stations forces the health workers to commute
long distances. This is a disadvantage because the costs of commuting daily to
work are high yet the salaries remain low. The available staff houses are
dilapidated and there are no funds to maintain them.
“...most health workers here do not have accommodation. They live very far from their health facilities...” “...in this place you will never even get a house for rent...., this is a village, it is very difficult to work in such conditions, that‟s why I think most of our health workers stay far way in towns...” “...in our hospital a number of our staff are living outside the hospital, they have no accommodation within the health facilities. “...I have made people in this hospital to share the few houses we have; hence, I am always solving disputes among those staff who are sharing accommodation. You can‟t imagine putting two or three families in one house; they are married, with children and from different cultural backgrounds...”
Living conditions of health workers affect their morale, motivation and
consequently their performance. Hagopian et al (2009:w867) report that poor
living conditions of health workers, with poor access to decent accommodation,
lack of access to good schools for their children, poor access to entertainment
and shopping centres affects their morale, motivation and may subsequently
hamper their performance.

233
5.6.1.1.5 Transport and referral system
Most managers (n=18; 85.7%) indicated that health facilities have inadequate
means of transport, if any, to meet their daily needs for patient referrals as well
as carrying out routine support supervision visits, distribution of supplies like
drugs, gas and other supplies. inadequate transport affects the referral system
and this compounds the logistical problems faced by health workers. It is
important to note that transport plays an important role in facilitating the
performance of health workers. Health workers need transport to travel to their
places of work, conduct supervisions and also assist in the referral of patients.
Lack of hospital infrastructure is an important de-motivator and affects the
performance of health workers (Willis-Shattuck et al 2008:[5]). Lack of
infrastructure like transport affects the responsiveness of health workers.
Lindelow et al (2005:12) mention that in Ethiopia availability of better equipment
and infrastructure like transport plays a big role in the attraction and performance
of health workers in the private hospitals. Dieleman and Harnmeijer (2006:16)
and Hagopian et al (2009:w867-w869) report that the productivity and
performance of health workers is affected by lack of equipment like transport
facilities that facilitate supervision visits and the referral of patients.
5.6.1.1.6 Support supervision
Insufficient support supervision is one of the recurring issues from the interviews
that negatively affect the performance of health workers. Most managers (n=17;
81.0%) mentioned that inadequate funding and lack of transport facilities could
be some of the contributory factors to the unsatisfactory support supervision.
One manager (4.8%) explicitly mentioned that motivation of health workers does
not only emanate from financial compensation but also from factors such as
support supervision. Rowe et al (2005:1029) mention that supportive supervision
when combined with audit and feedback to staff, consistently improves the
performance of health workers. Findings from a study done in Afghanistan
(Edward et al 2009:942) illustrate that with support supervision and training in
integrated management of childhood illnesses (IMCI) there was significant

234
improvement in the quality of case management by the health workers managing
the children under five years of age. World Health Organization (2006:75) argues
that if support supervision is a sterile administrative event or is seen as fault
finding and punitive, then it is likely to have a negative impact on the
performance of health workers. Hagopian et al (2009:w871) point out that health
workers in Uganda had slightly better that neutral relationship with their
supervisors. This is almost consistent with the findings of this study.
5.6.1.1.7 Prospects for further studies
The concern of most managers (n=15; 71.4%) was that younger health workers
needed opportunities to advance their careers through further studies. However,
they are demoralised by lack of such opportunities. Where the opportunity
emerges the criteria for selecting candidates to go for further studies is not clear.
Nepotism seemed to play a part as one of the managers outlined:
“...In this district the criteria used to select who should go for further studies is not clear. For example, I am pursuing a master degree in Public Health myself but I had to go to the bank for a loan; you know I am a man from another district myself...”
Education and training opportunities have a strong motivation and performance
effect. Training enables the health workers to take on more demanding duties
and achieve their personal goals of professional development (Mathauer &
Imhoff 2006:[10]; Willis-Shattuck et al 2008:[5]). In this study, the researcher
established that the prospects for further training were not readily available and
in most case health workers have to look for their own sponsorship. This, in one
way, affects the performance of health workers since they get the feeling that
they are probably not recognised by their superiors for the work they do. This is
contrary to what is happening in other countries. In Kenya, for example, there
are prospects of sponsorship in the public health system. This makes the jobs in
public sector more attractive to health workers and hence improves performance
of health works. Willis-Shattuck et al (2008:[4]) mentions that health workers are
reluctant to work in rural areas because the opportunities for career development
are less than in urban areas. This indicates that health workers take pride and

235
are motivated to perform when they feel that they have the opportunities to
progress in their careers. In order to enhance the performance of health workers,
it is important to create opportunities for further training and at the same time
ensure equity in the selection of those who really deserve it.
5.6.1.1.8 Communication and interpersonal relationships
Slightly less than half of the managers (n=10; 47.6%) pointed out that one of the
serious impediments to good performance of health workers was
communication. Communication problems exist between the health workers
themselves; between health workers and the patients and between health
workers and the community members. This has been cited as the main cause of
conflicts with a negative bearing on performance. Communication plays a very
important role in the performance of health workers. First of all health workers
need to communicate with each other in order to share information about their
patients. Similarly, health workers must have the good skills to communicate
effectively to the patients and their relatives. The DFID (2006:3) maintains that
lack of interpersonal communication skills, lack of awareness of the clients‟
rights, and the inability to communicate in local languages impedes
responsiveness of health workers is. All these can hinder the performance of
health workers.
The WHO (2006:80) observes that information and communication are important
in improving the performance of health workers. Unfortunately, health workers
often do not receive adequate feedback on their performance. A study by Nzinga
et al (2009:[5]) report that communication among health workers employed in
paediatric wards in Kenya is poor. In general, there were few or no forums for
hospital health workers in paediatric departments and all cadres of staff to
meetand discuss issues concerning their patients. Hence, there was little
opportunity to develop any widely supported goals for paediatric care in hospitals
and there was also little self assessment, problem identification or solving at
functional and organisational levels. Lipinge, Hofnie, van der Westhuizen and
Pendukeni (2006:11) report that in Namibia, there are poor interpersonal

236
relations between health professionals at operational and ministry levels. Most of
the communication is directive with no positive information sharing and formal
feedback. This is consistent with what the researcher has established from this
study.
5.6.1.1.9 Experience sharing
More than half of the managers (n=12; 57.1%) stated that increased interaction
and sharing of information amongst themselves could enhance the performance
of health workers. This would enable them to share experiences and possibly
collaborate in managing complex cases. Yet, avenues for health workers to
interact and exchange ideas seem to be wanting. Communication and sharing
experiences are interrelated. Without proper communication the sharing of
information about performance of health workers cannot be achieved.
Rowe et al (2005:1032) argue that having and sharing information helps health
workers to perform better. The culture of sharing information can enhance the
performance of health workers and improve their ability to work together as a
team (Manuwa-Olumide 2009:8; Rowe et al 2005:1032). Nzinga et al (2009:[5])
report poor communication and team work among health workers in Kenya.
There was little if any team work among health workers in the paediatric
departments. This led to poor performance and implementation of clinical
guidelines. To counteract this there was need for enhanced supervision and
facilitation. This considerably improved cross-cadre and cross-department
communication.
5.6.1.1.10 Promotion prospects or career movement
Decentralisation was mostly blamed by all the managers (n=21; 100.0%) for its
rigidity in terms of promotion prospects of health workers. This is particularly true
for those health workers who have managed to go further studies to improve on
their qualifications. Upon their return they find that they do not fit into the district
health system. This demotivates them and affects their performance.

237
Manafa et al (2009:[4-6]) report that in Malawi health workers also have very little
if any prospects for promotions in service. The study observes that some
enrolled nurses went for upgrading but ever since they completed their diploma
training courses they neither received promotions nor bonuses. This seems to be
de-motivating the staff and therefore affects their performance. Another study in
Namibia (Lipinge et al 2006:7) report that there were limited prospects for career
movement among the health workers due to the restructuring process that had
taken place, the lack of performance appraisal system and favouritism seemed
to be a common feature about who should be promoted or not. Crush (in Lipinge
et al 2006:8) also reports that in Zimbabwe some of the reasons why health
professionals were leaving the public sector were because of inadequate
opportunities for promotion in civil service and lack of or limited opportunities for
self improvement.
5.6.1.1.11 Performance appraisal and recognition
More that a quarter of the interviewees (n=6; 28.5%) stated that from their
experience, some health workers become motivated to work when their
performance is appraised. However, performance appraisal is not done
adequately and when it is done, it is irregular and feedback is seldom given. One
of the managers said:
“...Of course appraising means you are discussing the strong and weak areas. So if people realise that you recognise their strong areas it can improve their performance but also when you tell them about their weak areas it can also motivate them...”
Where performance appraisals are conducted, good performance is not
rewarded and this may demoralise the health workers. Recognition and
appreciation is a good motivator and can assist in enhancing performance of
health workers. According to Manongi et al (2006:[5]) in Tanzania, although lack
of physical infrastructure and equipment was de-motivating health workers,
recognition and support by their superiors was a big motivator.

238
The government regulation is that all civil servants should be appraised at least
once a year for those who are confirmed in service and twice a year for those
health workers on probation. Although performance appraisal is done in one way
or another, most of the time no rewards are given for good performance. A study
done in Mali by Dieleman et al (2006:[5]) illustrate that there were infrequent
performance appraisals which were mostly subjective and there were no formal
strategies in place to show appreciation or give rewards for outstanding
performance. This seems to affect the motivation and performance of health
workers. Another study in Namibia (Lipinge et al 2006:8) reports that there was
no positive re-enforcement of staff appraisal, motivation or reward in the public
sector. Lack of recognition and appreciation is also reported by other studies
from Kenya where health workers describe it as a big barrier to good clinical
practice (Nzinga et al 2009:[5]).
5.6.1.1.12 Working relationships
Poor working relationships between the health workers themselves as well
between health workers and their employer (District Council) have a negative
impact on performance. It was noted by over half of the managers (n=12; 57.1%)
that conflicts between the health workers occur even outside the work setting.
One of the managers mentioned that some conflicts are caused by clashes that
they have in their residence. Lack of adequate housing forces some of the health
workers to share houses. As a result, personality clashes tend to create conflicts.
Lipinge et al (2006:11) mention that in Namibia, there was poor interpersonal
relationships between health professionals at operational and management
levels. They also demonstrate that communication from the ministry of health
was top-down and instructional. This is almost similar to the findings of this
study. This, in most cases, hinders the performance of health workers. Nzinga et
al (2009:[5]) report poor working relations among health workers in Kenya to an
extent that it affects the effective health service delivery. The findings of this
study contradict what was found in Nigeria (Chirdan et al 2009:246). According
to their finding, over 80% health workers in Nigeria felt that interpersonal and

239
working relations with their managers were open, at the same time over 90% felt
that co-workers were supportive. Good working relationships can indeed
enhance the performance of health workers.
5.6.1.1.13 Responsibility
Most of the managers (n=18; 85.7%) mentioned that one of the serious factors
that impede performance is little or no responsibility given to health workers. This
makes them feel unappreciated and unmotivated. If health workers are given
more responsibility in the day-to-day running of the health facilities, this is likely
to enhance their motivation and performance. Sagoe (2005:2) mentions that in
Ghana decentralisation of the health services function, the empowerment and
recognition of local staff were critical in the retention and enhanced performance
of health workers. In addition, Reinikka and Svensson (2003:30) mention that in
Uganda, health workers in the religious, private not-for-profit facilities were
performing better because of the decentralisation of decision making authority
over their facilities‟ budgets and expenditures. This is a motivator and it helps to
increase performance of health workers. Huang et al (2006:11) point out that in
Taiwan, the level of autonomy and responsibility given to nurses to control their
practice and work schedules was an important factor which increased their
organisational commitment and performance.
5.6.1.1.14 Clarity of organisational mission
The majority of the interviewees (n=15; 71.4%) reported that many lower cadre
health workers do not understand the mission statement of their organisation. In
fact, some of them do not even know that the mission statement exists. This
means that these health workers do not share into what their organisation stands
for and therefore less likely to contribute through good performance.
In order to perform, health workers need to understand and be clear of what they
want to achieve. Quality health improvement can only be achieved when health
workers know clearly the outcomes they are working towards as well as knowing

240
what changes can lead to improvements and how to evaluate their efforts
(Ntoburi et al 2008:445). If the mission of the organisation is not known to the
health workers, then it is almost impossible for them to set targets for achieving
their goals. The health workers need to be clear about the organisational
structure, the type of information and information systems, task design,
selection, training and development and the reward system (Noe et al 2008:80).
lack of clarity about all these may misdirect the performance of health worker.
Therefore, it is the responsibility of the management to make sure that health
workers know about the ministry of health‟s mission, goals and objectives in
order to align their activities accordingly.
5.6.1.1.15 Mobility of health workers
Lack of mobility emerged from over half (n=12; 57.1%) of the interviews as a
major factor causing low morale and performance among the health workers.
The decentralisation system confines the health workers to one district. If one
wants to move to another district he or she has to resign first and start at the
entry level in a different district. This finding is consistent with what is reported by
Ssengooba et al (2005:11) who mention that health workers felt a sense of
entrapment under decentralisation in a particular district, without hope of moving
across districts.
5.6.1.1.16 Staffing levels and turnover rates
Nearly all the managers (n=20; 95.2%) referred to the issue of low staffing levels
coupled with high employee turnover as major factors that demotivate and hinder
the performance of health workers. For example, one of the managers indicated
that their staffing level in his district is about 40%. As a result, health workers
experience increased workloads and low morale as their colleagues leave for
better opportunities elsewhere.
Several studies in developing countries have documented issues of
understaffing in the health systems. Manongi et al (2006:[4]) in Tanzania;
Bradley and McAuliffe (2009:[6]) and Manafa et al (2009:[5]) in Malawi and
241
Lipinge et al (2006:9) in Namibia all report chronic shortages of human
resources for health due to poor motivation and retention practices. According to
Ssengooba et al (2005:8) shortage of staff is widely perceived as a major
problem that, in many ways, affects performance of health workers in Uganda.
For instance, the high workloads make it difficult to follow standard patient care
such consultations time and the annual and study leave approvals may be
delayed due to absence of replacements to absorb the workload (Ssengooba et
al 2005:8).
5.6.1.1.17 Primary Health Care (PHC) funding
Lack of adequate funding for primary health care (PHC) activities poses
challenges to health workers. While the funds are already insufficient for meeting
the PHC requirements, all the managers (n=21; 100.0%) mentioned that the
funds keep on decreasing every year. One of the managers pointed out that:
“...Since I joined this district in 2003 I have noticed every year the PHC funds which go to health facilities has been reducing every year ... yet the population we are serving is increasing now and again...” During the period between the financial years 2002/2003 and 2005/2006, the
trend was to budget and transfer more funds to decentralised services
administered at the local government and district levels, as opposed to
centralised funding. Although this decentralisation has continued, it has not
resulted in significant improvement in delivery of services. The vast majority of
spending at the decentralised level has gone towards employee costs. While the
allocation of funds to decentralised facilities is meant to improve service
provision, the transfer of funds has not translated into the expected improvement
in the health services delivery (Fanaka Kwa Wote 2008:2).
5.6.1.2 Subtheme 1.2: Individual factors
These are the factors emanating from health workers as individuals. These are
listed in Table 5.6.
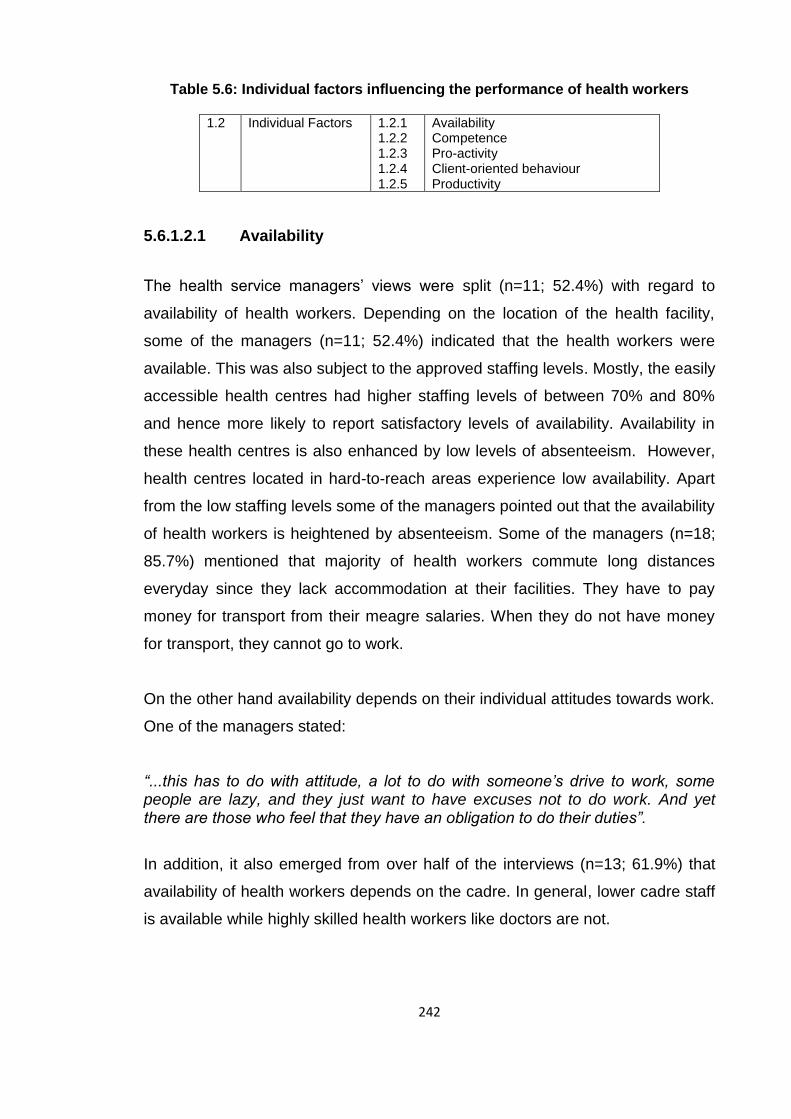
242
Table 5.6: Individual factors influencing the performance of health workers
1.2 Individual Factors 1.2.1 1.2.2 1.2.3 1.2.4 1.2.5
Availability Competence Pro-activity Client-oriented behaviour Productivity
5.6.1.2.1 Availability
The health service managers‟ views were split (n=11; 52.4%) with regard to
availability of health workers. Depending on the location of the health facility,
some of the managers (n=11; 52.4%) indicated that the health workers were
available. This was also subject to the approved staffing levels. Mostly, the easily
accessible health centres had higher staffing levels of between 70% and 80%
and hence more likely to report satisfactory levels of availability. Availability in
these health centres is also enhanced by low levels of absenteeism. However,
health centres located in hard-to-reach areas experience low availability. Apart
from the low staffing levels some of the managers pointed out that the availability
of health workers is heightened by absenteeism. Some of the managers (n=18;
85.7%) mentioned that majority of health workers commute long distances
everyday since they lack accommodation at their facilities. They have to pay
money for transport from their meagre salaries. When they do not have money
for transport, they cannot go to work.
On the other hand availability depends on their individual attitudes towards work.
One of the managers stated:
“...this has to do with attitude, a lot to do with someone‟s drive to work, some people are lazy, and they just want to have excuses not to do work. And yet there are those who feel that they have an obligation to do their duties”.
In addition, it also emerged from over half of the interviews (n=13; 61.9%) that
availability of health workers depends on the cadre. In general, lower cadre staff
is available while highly skilled health workers like doctors are not.

243
Anyangwe and Mtonga (2007:93) argue that health workers are the backbone of
any health systems and are important for the implementation of health policies.
Several studies describe the maldistribution of health workers between rural and
urban areas (Chen et al 2004:1984; Stilwell 2004:21). In Kenya Gondi, Otieno,
and James (in Mullei, Mudhune, Wafula, Masamo, English, Goodman, Lagarde,
& Blaauw 2010:S1) report acute understaffing in rural primary health care
facilities. The vacancies in rural areas being considered less desirable. Urban
settings have superior infrastructure and services while rural centres are
associated with high workloads and poorly aligned incentive systems that
disadvantage rural staff. This is comparable to the situation Uganda. Studies
demonstrate positive correlations between quality of health care and good health
outcomes with availability of health workers. As the number of health personnel
reduces, the ability of the system to offer health services also reduces (Awofeso
et al 2008:[2]; JLI 2004:23).
5.6.1.2.2 Competence
The general view of nearly all the health service managers (n=20; 95.2%) was
that the health workers demonstrate satisfactory levels of competence. Some
problems were identified though, for example, one of the interviewees stated that
sometimes the ability of health workers seems inadequate simply because they
are assigned to duties for which they are not trained.
Health workers can only be competent if they have the necessary knowledge,
skills and equipment to do their work. Manongi et al (2006:[5]) assert that in
Tanzania, due to understaffing, many low cadre health workers are compelled to
handle cases for which they are not trained. For instance, an auxiliary nurse
would do the work of pharmacist and that of clinicians. This generally results in
inadequate or substandard health services.
Whereas in general the managers recognised that the health workers are
knowledgeable enough to perform their jobs, some of them (n=17; 81.0%)
indicated that the competence of health workers needs to be revamped through

244
refresher courses. It is important to observe that the health service managers
trust the competence of health workers. However, competence alone without
other resources may not automatically translate into performance.
Huicho et al (2010:360) argue that availability and competence of health workers
by themselves cannot directly improve the health outcomes and performance of
health workers in absence of effective health systems components such as
drugs, supplies and functional equipment. Inadequate knowledge, skills and
attitudes among health workers can create an obstacle good health care and
may lead to poor performance of health workers (Bossynns & Van Lerberghe
2004:[3-4]).
5.6.1.2.3 Pro-activity
The general view of the managers was that the health workers are proactive.
Majority of the managers (n=19; 90.1%) pointed out that high levels of
innovativeness is seen among the health workers who are given authority and
responsibility. It gives them a sense of control. Health workers also display
innovativeness when there is scarcity.
“... if you have a patient with chest problems like there is fluid in the chest cavity and you know the proper way to drain the fluid is to use complicated things like chest tubes but health workers just push the needle and they are able to drain the fluid out the chest...” Kahya (2009:102) argues that workers who are creative or innovative usually
achieve high outcomes. This may be good for both individual and organisational
performance. However, it is important to observe that people can only be
innovative if they are well motivated and competent.
5.6.1.2.4 Client oriented behaviour
The behaviour of the health workers towards the clients was reported as
generally good. However, slightly less than a quarter of the managers (n=5;
23.8%) noted that there are some instances where health workers display

245
undesirable conduct towards patients. This was largely attributed to acrimony
arising from work related factors such as lack of adequate supplies, drugs and
equipment. Yet, some managers (n=8; 38.1%) also mentioned that some of the
health workers are simply not client-oriented and this may be due to their general
ill-conduct (depending on their family backgrounds).
Berry and Bendapudi (2007:111) argue that health care is the most personal and
important service that clients seek. Therefore, the behaviours of health workers
such as nurses, clinical officers and doctors are essential for both patient
satisfaction and successful health outcomes. A study in Bangladesh report that
almost all patients expected respect and politeness from health workers
irrespective of whether they use static or outreach facilities (Aldana, Piechulek &
Al-Sabir 2001:514). It is therefore important to understand the behaviour of
health workers in order to predict their performance.
5.6.1.2.5 Productivity
Most of the managers (n=13; 61.9%) indicated that on average the health
workers are productive, though many factors hinder the desired levels of
productivity. Individual drive and commitment was cited by many managers as
an important determinant of productivity. Factors such as availability of health
workers affect the productivity and performance. In health facilities with low
staffing levels productivity tends to be sub-minimal because the available
workers are overworked. General staff motivation also plays a part in
determining productivity. Resource availability has a significant bearing on how
productive the health workers will be. It was also established during the
interviews that in some health facilities productivity was difficult to determine
because there were no established indicators. Hence, productivity assessment
was most likely to be subjective. A few health facilities had indicators which
simplified the task of measuring productivity.
A study in Iran illustrates that productivity of nurses is affected mainly by human
resources factors such as proper selection of workers, adequate numbers of

246
staff, full participation and involvement in the process on managing patients,
financial security and sound communication among the team members (Nayeri
et al 2005:9). These reported findings support the results of this study. Although
it may be difficult to measure productivity of health workers, some writers like
Buchan (2005:4), Manuwa-Olumide (2009:5), Hornby and Forte (2002:2) and JLI
(2004:146) propose the indicators that can be used to measure productivity.
These indicators include, for example, the number of patients attended to as
outpatients, number of home visits made and bed occupancy rates among
others. Other studies also identify factors such as lack of equipment, drugs and
supplies and poor management practices are some of the causes of poor
motivation and poor productivity among health workers (Dieleman & Harnmeijer
2006:16; Hagopian et al 2009:w867). According Forcheh and Fako (2007:103)
productivity among service providers such as health workers highly depends on
the routine activity that each is supposed to do. Hence, there is need to have
proper indicators to closely monitor these activities. These seem to be
inadequately practiced in the Ugandan health sector.
5.6.1.3 Subtheme 1.3: Institutional (local government) factors
These are the factors which stem neither from the organisation nor from the
individual health worker. Table 5.7 illustrate institutional factors influencing the
performance of health workers.
Table 5.7: Institutional factors affecting the performance of health workers
1.3 Institutional (local
government) factors
1.3.1 1.3.2 1.3.3 1.3.4
Decentralisation Government policies and guidelines Political interference Health seeking behaviours of communities
5.6.1.3.1 Decentralisation
The managers had divergent opinions concerning the effects of decentralisation
on the performance of health workers. For those (n=14; 66.7%) who thought that
decentralisation is detrimental to the performance of health workers the following
reasons were given:

247
“...there is delayed recruitment due to lack of funding and tools...the people under central government have tools yet in the districts they are not there...” “...in other areas they do not have doctors...most doctors prefer areas like towns, they shun hard-to-reach areas...” “...in fact the staffs have stagnated because the civil service structure of the district local government is rigid. The majority of the cadres who remain at the centre or regional hospital are actually ahead by two or three steps compared to those in local government...”
On the contrary, the managers (n=7;33.3%) who were in favour of
decentralisation stated that:
“...decentralisation has brought services closer to the people and has facilitated community ownership of the health services that is our satisfaction”. In addition, one of the managers indicated that decentralisation has brought
positive effects in the supervision of the health services. The capacity of district
health management team has been improved to supervise health services
instead of supervisors from the central administration having to conduct
supervision all over the country.
Ssengooba et al (2005:14) argue that decentralisation and related organisational
restructuring was meant to improve performance of the systems by empowering
lower levels to make decisions that are most responsive to the needs of the
people. Dieleman et al (2009:[5]) emphasise that decentralisation of human
resource management functions could have positive impact but complementary
interventions to create enabling environment are required. Such interventions
include management training, changes in the bureaucratic procedures,
appropriate preparation in staffing structures and staffing levels among others.
According to Ssengooba et al (2007:[10]) under decentralisation the supervision
of health workers and services in Uganda has taken a more human angle with
the direct accountability of health staff to selected community members.
Generally, the health workers seem to appreciate the new changes in their
supervision since relationships to key community leaders improved through
closer working relationships. This supports what some of the managers reported
in this study.

248
A study by Liu, Martineau, Chen, Zhan, and Tang (in Dieleman et al 2009:[5])
report that in China decentralisation reforms led to inappropriate recruitments
due to social pressure to recruit incompetent relatives and friends. Health service
managers and workers were also faced with the organisational pressure to
increase hospital income. The focus on increasing the hospital income led to
over-treatment and over-prescriptions. This negatively affected the quality of
care given to patients and hence the performance health workers.
The researcher found that some managers (n=15; 71.4%) complained of delays
in the recruitment processes due to lack of funding and some other necessary
resources for the DSCs to carry out their duties. This is contrary to what was
found by Ssengooba et al (2007:[10]) that health workers thought that under
decentralisation recruitments were a bit faster. However, the problem under
decentralisation in Uganda is that the recruitment of health workers is threatened
by nepotism whereby those who originate from the district are better preferred
than those who are considered „aliens‟. This affects not only the motivation but
also the performance of health workers. Health workers might be working under
fear of losing their jobs in favour of the „sons and daughters of the soil‟.
Like other studies mention, health service managers thought that there were
limited opportunities for promotions in public services. This is mainly because
promotion to higher levels means an increase in salary which the districts may
not afford due to the limited financial resources and also by the quota (civil
service staffing ceiling) constraints (Bradley & McAuliffe 2009:[3-5]; Lipinge et al
2006:8; Manafa et al 2009:[6]).
5.6.1.3.2 Government policies and guidelines
One of the managers explicitly stated that government policies and guidelines
are outright clear. The decentralisation policy is good in as far as bringing
services closer to the communities. However, the implementation of the policy
remains problematic. It seems as if some people do not understand the
decentralisation concept. The fiscal decentralisation is not done properly and this

249
affects a host of other factors such as availability of health workers and other
resources. The health management information system captures most of health
related data from the health facilities. This means that the information needs of
health workers should not be a hindrance to performance. However, the
problems arise because the information system is largely manual and some of
the health workers are not trained to use it. This then affects performance
negatively.
Although the government has good policies, these are not known to all and
therefore are not implemented. When new polices and guidelines come up,
health workers have to be trained and oriented on them. Nzinga et al (2009:[4])
identify that in Kenya one of the barriers faced by health workers in
implementation of the clinical guidelines is inadequate training coverage
resulting in inadequate knowledge and skills. It is therefore important to train
most of the health workers when new policies and guidelines are introduced.
This helps to facilitate change and may assist in enhancing the performance of
health workers. Sound policy, resources allocation and day-to-day management
decisions in the health sectors require timely information from routine health
information system. In most developing countries including Uganda the health
information managements is inadequate in providing quality data and continuous
information that can be used to improve health workers and systems
performance (Hotchkiss, Aqil, Lippeveld & Mukooyo 2010:[1]). Although the
researcher found that the policies and guidelines are available they are either not
well designed or many health workers are not trained or oriented about their
existence and implementation.
5.6.1.3.3 Political interference
This has been cited by the majority of the managers (n=19; 90.5%) as a serious
hindrance to the performance of health workers. The politicians want to control
the way health facilities are run and this creates a lot of conflict between
themselves and the health workers as one manager noted:

250
“There is also political influence and interference. Some of these people who are recruited may be related to some politicians and they want them to be working in certain areas, so it makes distribution of staff difficult”.
Political interference seems to be a common occurrence in the districts. This is
consistent with some other studies done in developing countries. In
Mozambique, Saide and Stewart (in Dieleman et al 2009:[5]) mention that district
administrators influenced transfers of health workers and administrative
constraints often prevented adequate performance evaluation. In China, some
health service managers were faced with the problem of addressing recruitments
due to social pressure to recruit incompetent relatives and friends (Dieleman et
al 2009:[5]). Ssengooba et al (2007:[10]) report that in Uganda because of
political interference health workers with management responsibilities were
fearful of their precarious relationships with local authorities. This was mainly
because of local authorities claim to have decision-making power in dismissal of
health workers. Hence, this fear among health workers for dismissal leads to job
insecurity for health workers in the decentralised services and can impede the
performance of health workers.
5.6.1.3.4 Health seeking behaviours of the communities
Although this was not a general view from many managers, one manager
observed that because communities are very poor, sometimes people decide to
come to hospitals when it is too late for health workers to save their lives. This
reflects badly on the health workers because when patients die they feel that
they could have done something to save lives. Communities may sometimes put
the blame on health workers when their relatives die. This in general
demoralises health workers and negatively affects their performance. This result
is consistent with the findings of Hausmann-Muela, Ribera, and Nyamongo
(2003:8) in Tanzania that due to their cultural beliefs community members
delayed to refer serious illnesses to health facilities. Instead they preferred to
treat the patients using traditional remedies. Yet those remedies do not always
work. This leads to delay in seeking health services which would save the lives
of the patients.

251
5.6.2 Theme 2: Views of managers on how to improve the performance of health workers
The second theme which was identified from the interviews relates to the views
of health service managers on how the performance of health workers can be
improved. The following three subthemes emerged: organisational initiative,
institutional initiative and community initiative. Table 5.8 outlines the subtheme
organisational initiative along with its categories.
Table 5.8: Views of managers on how to improve the performance of health workers 2 Views of
managers on how to improve the performance of health workers
2.1 Organisational (health systems) initiatives
2.1.1 2.1.2 2.1.3 2.1.4 2.1.5
Improving remuneration Training of health workers Delegation of responsibility Hospital infrastructure, accommodation and transport Support supervision
5.6.2.1 Subtheme 2.1: Organisational initiative
This subtheme spells out what the immediate organisation can do to improve the
performance of its employees.
5.6.2.1.1 Improving remuneration
All the managers (n=21; 100.0%) interviewed suggested that better
remuneration of the health workers would boost their morale and thus improve
their performance. The salaries should be increased, be paid regularly and in a
timely manner. This quote is testimony to what some of the managers believed
should be done:
“...I can‟t go without talking about the issues of salary... because that is making health workers not stay in one place is to make ends meet. Somebody cannot sit in this place from morning to evening when he is not sure whether his children will go to school or not...so improvement of staff remuneration is important...”.

252
Many countries in Africa are reporting poor remuneration of health workers as
one of the causes of poor motivation, retention and performance. In many
African countries health workers who work for government end up being poorly
remunerated (Muula 2005:25). The WHO (2006:75) emphasises that health
workers must be paid reasonably well and on regular and timely basis. Hagopian
et al (2009:w869) maintain that the way health workers are remunerated
influences their performance. The application of bonuses and allowances such
as lunch, overtime and outreach allowances in Uganda has proved to be
effective in enhancing the performance of health workers (Hagopian et al
2009:w870).
Some health service managers (n=9; 42.9%) were of the view that remuneration
should be based on the performance results. In Namibia for example, Lipinge et
al (2006:14) report that nurses suggested that salaries should be based on
performance appraisals and market-related salaries based on qualification. Isaac
(2001:111) and Manuwa-Olumide (2009:8) observe that performance related
payments are being applied in many developed countries. However, without
proper indicators for measuring productivity and performance it is always difficult
to implement such a system.
5.6.2.1.2 Training of health workers
All the health service managers (n=21; 100.0%) recommended regular training
for all cadres to equip them with up-to-date skills that will enhance their
performance. This is what one manager had to say:
“...then the refresher courses to new staff that are recruited... There are many clinical officers who heading health units but many of them do not know how to fill the monthly report forms...”
Training and education opportunities have strong motivation effects on health
workers. According to Mathauer and Imhoff (2006:[10]) training enables health
workers to take on more challenging and demanding duties as well as assisting

253
them to achieve their personal goals of advancement. This can help them cope
better with the requirements of their jobs. Cicciò, Makumbi and Sera (2010:1250)
argue that adequate in-service training is necessary for quality health service
delivery in primary health care settings. Policy changes, new clinical guidelines
and general management tasks all require effective training of the highest
number of health workers possible in order to reach the programme objectives.
Rowe et al (2005:1027) emphasise that professional development can influence
the health worker‟s motivation as well as performance. Mbindyo et al (2009:[7])
point out that continuous professional development is necessary for health
workers at all levels in order to improve their performance.
In some countries such as Malawi, Manafa et al (2009:[4-5]) emphasise that in-
service training which represents training on specific topics identified by the
district team helps in enhancing performance of health workers. Such training is
often organised in fulfilling the patients‟ needs. From the managers‟ perspectives
the process appears to be fair and equitable. From the health workers‟
perspective, in-service training appeared to have improved their performance but
some new skills acquired were sometimes never used. Unlike their managers,
health workers in Malawi felt that there was favouritism with regards to who
benefits from continuous education and in-service training (Manafa et al
2009:[5]).
According to Lipinge et al (2006:14) in Namibia some hospital managers are of
the view that in order to enhance performance of health workers, compulsory
continuous education should be enforced to encourage health professionals to
acquire more knowledge and skills. They also recommend that each department
should have a plan which includes staff refresher courses.
Researchers from Makerere University College of Health Sciences (Kaye,
Mwanika & Sewankambo 2010:1372) emphasise that the formal community
based training experience of medical and nursing graduates significantly
influence their choice to work in rural and underserved areas. They therefore

254
conclude that while personal values may impact on the decision to work in the
rural areas, training experience also shapes these personal values and choices.
5.6.2.1.3 Delegation of responsibility
There was a general view among most managers (n=15; 71.4%) that the health
workers would perform better if they are given significant authority and
responsibility. The feeling of empowerment would increase their commitment
and improve performance. One manager observed:
“...Money motivates some people, but not everybody is motivated by money alone...others are motivated by the responsibility or assignments...additional assignments make somebody feel recognised...” Although decentralisation has taken place, not all health facilities have as much
as necessary authority over funds and staff. This is known to affect the
performance of health personnel. Health workers are motivated when they are
delegated responsibilities and this is likely to enhance their performance.
Therefore, giving district health managers freedom to allocate funds can make a
big difference in staff and health facility performance.
Health workers need more authority and responsibility over their work and that of
their co-workers. Responsibility encourages autonomy and promotes the sense
of control over one‟s job, such as the ability to make decisions about heath care
practice (Tang 2003:8). Mrayyan (2004:333) reports that increased autonomy is
influenced by supportive management, education and experience. Organisations
that have autonomous and long serving workers provide quality care to patients,
in a cost effective way (Lephalala 2006:46). One study in USA reports that
where the nurses are autonomous and empowered the quality of patient care
was consistently higher (Upenieks 2005:27). Khowaja, Merchant and Hirani
(2005:33) mention that in Pakistan, the lack of autonomy, inadequate staffing
and work overload has a significant impact on job satisfaction, performance and
attrition of nurses.

255
5.6.2.1.4 Hospital infrastructure, accommodation and transport
All managers (n=21; 100%) proposed that provision of adequate housing near
the duty stations could improve availability of the health workers. Absenteeism
could be reduced and health workers would save a lot of money which they use
to commute to and from work. They also suggested that health facility
infrastructure should be improved and the old buildings should be renovated or if
possible new ones put up for patient care. Lack of hospital infrastructure and
supplies (drugs, equipment and other medical supplies) including
accommodation and transport is a serious de-motivator to the health workers.
Willis-Shattuck et al (2008:[5]) point out that hospital infrastructure and resource
availability should be a principal consideration since patient care cannot be
effective without the correct resources, like vehicles for patient referrals. Poor
infrastructure does not inspire confidence among health workers working in a
particular health facility as well as from the clients who use those facilities.
5.6.2.1.5 Support supervision
Support supervision emerged as an important factor which the managers
believed would boost the performance levels. The majority of managers (n=18;
85.7%) pointed out that health workers need ongoing support supervision as this
enables them to learn, identify problems and solve them accordingly.
Supportive supervision when conducted properly, followed by adequate
feedback to health workers can actually improve their performance. Supportive
supervision is usually used to identify and solve specific problems, can improve
job satisfaction and motivation of health workers (Hagopian et al 2009:w871).
Finnigan (2005:1) states that one of the greatest drivers of employees‟ decisions
to stay or leave is relationship with their immediate supervisors. Edward et al
(2009:942) report that in Afghanistan, by using support supervision and training
of health workers in IMCI, there was improvement in the quality management of
children less than five years of age.

256
On the contrary, a study in Tanzania reports that support supervision to health
workers from their immediate superiors or the external supervisors from DHMT
was irregular and not supportive and it was very rare to get a feedback report
following the supervision (Manongi et al 2006:[5]). Joubert, Du Rand, and Van
Wyk (2005:39) report that some supervisors tend to abuse their subordinates, for
example doctors tend to show more aggression towards nurses. Uzun (2003:81)
report that in 2003, more than 75% of South African and Turkish nurses reported
verbal abuse. This impacts negatively on patient care, productivity, morale and
job satisfaction.
5.6.2.2 Subtheme 2.2: Institutional initiative
This describes the programmes that can be implemented by the local
governments to enable the decentralised health systems function appropriately.
These are indicated in Table 5.9.
Table 5.9: Institutional initiative to improve performance of health workers
2.2 Institutional (local government) initiative
2.2.1
Centralise district health office and the management of health workers
5.6.2.2.1 Centralise the district health office and the management of health workers
This view did not recur during the interviews but it emerged as an interesting
suggestion from three (14.3%) district managers. These managers suggested a
drastic measure of removing the control of the DHO from the District Council to
the central government just as they centralised the position and functions chief
administrative officers (CAO). According to the managers, this would enable the
DHOs to be easily transferred across districts. The managers, especially the
DHOs, are sometimes put under a lot of pressure to comply with the directives
from the district councils even if those directives may sometimes be
inappropriate. The DHOs and health workers comply because they fear that they
would be fired if they do not. They simply have to be in the „good books‟ of their

257
supervisors (district council) to retain their jobs. This supports what another
study that was conducted in Tanzania.
In Tanzania Munga et al (2009:[6-8]) extensively discuss the issues of
decentralisation as opposed to centralisation of the recruitment and control of
health workers. Their study reveals that decentralised recruitment and control
was perceived to be more effective in improving retention of the lower cadre
health workers within the districts. In contrast, the centralised arrangement was
perceived to be more effective both in recruiting qualified staff (such as the
DHOs), control and balancing their distribution across districts, but poor in
ensuring their retention. This result show that the decentralised recruitment and
control opened new avenues for political influences on technical decisions
related to employment and performance of health workers.
In Uganda some districts have failed to attract and retain highly qualified cadres
like doctors because of the perceived interference from the political leadership.
Munga et al (2009:[10]) suggests that the governments should consider a hybrid
of both centralised and decentralised management of human resources for
health in order to ensure performance.
5.6.2.3 Subtheme 2.3: Community initiatives
Community initiatives require that the community members who are served by
the health workers weigh in to ensure that the health workers perform in a
satisfactory manner. This is indicated in Table 5.10.
Table 5.10: Community initiatives to improve performance of health workers
2.3 Community
initiatives 2.3.1
Community appreciation and support to health workers

258
5.6.2.3.1 Community appreciation and support for health workers
Majority of the health service managers (n=16; 76.2%) believed that community
members could assist the health workers improve their performance by
demonstrating appreciation for the job they do under difficult circumstances.
They also suggested that community support is important to boost the morale of
health workers.
Appreciation from clients is seen as an indicator for successful professional
conduct and achievement of health workers‟ goal to provide health care for the
patients. According to Mathauer and Imhoff (2006:[9-10]) the importance of client
appreciation stems primarily from the health workers‟ satisfaction and their
professional goals of helping patients. This, in essence, motivates health
workers to perform better even if their remuneration is not all that attractive. Lack
of appreciation from clients and their families lead to poor intrinsic motivation and
this can impede the performance of health workers. In one of the studies done in
Kenya, Nzinga et al (2009:[5]) mention that the communities really appreciated
health workers for what they were doing. However, the administration or
management was not appreciating the work. Although community appreciation
was a motivator to these health workers, the lack of appreciation from the
management was a de-motivator. This is therefore likely to negatively affect the
performance of health workers.
Ssengooba et al (2007:[11]) report that in Uganda following the health sector
reforms, communities expected the quality of health services to improve
especially after the abolition of fee- for- service. The increase in the utilisation of
health services after the removal of fee-for-service put pressure on the health
system especially with frequent shortages of drugs and supplies. Some
community members were wrongly accusing health workers of siphoning drug
from the health facilities.. This, in effect, can impede the performance of health
workers.

259
5.6.3 Theme 3: Existing practises for managing the performance of health workers
The third theme of this study emerged as the existing practises used to manage
the performance of health workers. Under this theme six subthemes were
identified together with their own categories. Table 5.11 illustrates subtheme 3.1,
which is planning for performance appraisal with its two categories.
Table 5.11: Current practices for managing performance of health workers
3 Existing practises for managing the performance of health workers
3.1
Planning for performance appraisal
3.1.1 3.1.2
Target setting and performance agreements Pre-appraisal planning meetings
5.6.3.1 Subtheme 3.1: Planning for performance appraisal
This subtheme relates to activities that should be undertaken before the actual
process of appraisal begins. Two categories were identified as shown in Table
5.11.
5.6.3.1.1 Target setting and performance agreements
Few managers (n=6; 28.6%) indicated that the appraisers and appraisees sit
together to set targets which health workers should strive to achieve while
executing their duties. Still few managers noted that supervisors and their
subordinates agree on expected performance standards. One manager stated
that it is expected that target setting be done but he doubted if this was the case
at lower levels. In general, although most of the managers acknowledge that
clear performance appraisal guidelines exist, target setting was inadequately
done. The following quote confirms this:
“The biggest problem is actually setting targets. In fact what our staff put on their appraisal forms are not targets but are just statements”.

260
The study revealed that there is some form of performance appraisal system in
place; however, its implementation seems to be a big challenge to both the
health workers and their supervisors. According to Aguinis and Pierce
(2008:141) the first stage for performance management is for the employees to
have a clear knowledge of the organisation‟s mission, strategic goals and the job
in question. The performance planning stage involves a discussion and
agreement between the appraiser or supervisor and the worker regarding what
needs to be done and how it should be done. However, as indicated in sub-
section 5.6.1.1.14 of this study, many health service managers were not sure
whether the health workers at the lower levels are clear about the organisation‟
mission. Dovlo et al (1998:4) emphasise that it is important for each level of
service delivery to know the core purpose and the objectives of the health unit
and hospital. This could form the basis for discussions and feedback on the
performance of the employees. With little knowledge about the organisation‟s
strategy it becomes almost impossible to set targets.
5.6.3.1.2 Pre- appraisal planning meetings
Most of the managers (n=15; 71.4%) indicated that pre-appraisal meetings are
not done as one manager stated:
“We hardly plan for this ...I would say it is just a routine that you fill these appraisal forms, you don‟t even sit to discuss with the person concerned, you also just tick and evaluate without making realistic comments”. “...yes we have these meetings on paper but not in practice...”
The pre-appraisal meetings are meant to discuss and agree on what is to be
done, how it should be done and what behaviours are required to achieve the
required results. According to the University of Northern Iowa (2000:4) a
productive performance meeting serves as a collaborative planning session
during which both the supervisor and employee can take an in-depth look at past
and current performances and can together set new goals and objectives for the
coming period. The performance meeting helps the supervisor and employee
establish clear understanding of the employee‟s job duties, responsibilities and

261
priorities. It also provides an opportunity for the supervisor to coach the
employee on how to become more proficient and productive. Establishing
performance goals provides direction and helps the employee and supervisor to
perform their duties appropriately.
5.6.3.2 Subtheme 3.2: Performance measurement
The focus of this subtheme is on the approach employed by managers in
measuring the performance of health workers. The categories of performance
measurement are as indicated in Table 5.12.
Table 5.12: Performance measurement of health workers
3.2 Performance measurement
3.2.1 3.2.2
Performance measurement tools and indicators Frequency of performance measurement
5.6.3.2.1 Performance measurement tools and indicators
Slightly less than half of the managers (n=10; 47.6%) indicated that performance
measurement is done in their facilities while others said that they do not measure
performance. However, more than half (n=12; 57.1%) of the managers stated
that there are no clear tools for doing so, for example, in some instances mere
observations were used. The rest of the managers said that they used
performance appraisal forms to measure the performance of health workers. It
also became evident from the interviews that performance measurement is done
just as a formality or obligation in most health facilities. In addition, the
discussions revealed that performance measurement was deterred by absence
of clear indicators.
The Ministry of Public Service in Uganda has an appraisal form that is used to
measure the performance of health workers. All civil servants are obliged to
complete this appraisal form at least once annually. Although this form lacks the

262
proper indicators to monitor the performance of health workers, it can serve as a
tool to improve the performance of health workers. It is important to note that all
health workers have job descriptions, which serve as a stable framework for
evaluating and guiding staff while their daily task schedules provide more
specific measures and measurable performance guide (Dovlo et al 1998:4). In
addition to job descriptions, all hospitals and health facilities have treatment
schedules, guidelines and standards as well as the health management
information system in place. All these can be used as tools for measuring
performance of health workers. However, many managers do not know that they
can use them to measure performance of health workers (Dovlo et al 1998:4;
Hotchkiss et al 2010:[3-4]).
Many health service managers (n=16; 76.2%) reported lack of clear indicators
for measuring performance of health workers. Bankauskaite and Dargent
(2007:126) state that performance indicators are used to facilitate accountability,
monitoring health care systems and service, modifying behaviour of health
workers and forming policy initiatives. This research almost supports Mathauer
and Imhoff‟s (2006:[12]) study in Kenya illustrating that although health workers
undergo an annual performance review, not everybody knows what it was all
about and what indicators are applied.
5.6.3.2.2 Frequency of performance measurement
The managers (n=10; 47.6%) who reported that they measure performance of
the health workers observed that it is not done as frequently and regularly as
may be necessary. One of the managers clearly articulated:
“Performance measurement is done here ...but to me this is really ad hoc”.
Performance measurement is supposed to be an ongoing process and should be
done regularly. In Uganda, health workers who are on probation have their
performance monitored once every 6 months while after permanent appointment
in service they are appraised once a year. Armstrong (2009:618) affirms that the

263
primary goal of performance appraisal is to provide feedback to the employees
on how they are doing and provide a direction for the future. Therefore,
performance appraisal is generally conducted once annually, and with follow-ups
if required. Mathauer and Imhoff (2006:[12]) report that in Kenya although health
workers must pass an annual performance review every year in order to
continue working in the public sector, the quality of these appraisals is
questionable since some health workers and managers do not even know which
indicators to apply.
5.6.3.3 Subtheme 3.3: Performance reporting and feedback
This subtheme uncovers the findings concerning the way performance of health
workers is reported and whether or not the managers give performance
feedback to their subordinates. The subtheme and its categories are shown in
Table 5.13.
Table 5.13: Performance reporting and feedback
3.3 Performance reporting and feedback
3.3.1 3.3.2
Mode and frequency of reporting Mode and frequency of giving performance feedback
5.6.3.3.1 Mode and frequency of reporting
Two sets of responses emerged from the interviews regarding performance
reporting. Some managers (n=11; 52.4%) stated that they report performance
while other said that they do not report it. Among those who do not report the
performance some indicated that the reason is because they do not measure
performance. Some of the managers (n=5; 23.8%) stated that they measure
performance of health workers but they do not report it. The dominant reason
was that managers avoid creating conflicts with their subordinates especially
where the performance is not good.
Among the managers (n=11; 52.4%) who report performance the majority of
them admitted that they were faced with challenges in doing so. Some managers

264
(n=9; 42.9%) stated that the reporting was mostly generalised, reporting group
performance and not individual performance. Individual performance is generally
reported verbally apart from when there was indiscipline, only then would written
reporting was done.
Despite the challenges a few managers (n=3; 14.3%) pointed out that they had a
standard format of reporting performance. For some the reporting is done
quarterly while it was done bi-annually in some facilities. According to the
Uganda‟s HMIS, monthly reports are supposed to be completed by the individual
health facilities and sent the health sub-districts and from there to the district and
finally a consolidated report about the performance are sent to the ministry of
health (Hotchkiss et al 2010:[3]). These reports usually indicate the number of
cases seen, the equipment available and some information concerning the
health worker performance though it is very minimal with little feedback to the
source of the information.
5.6.3.3.2 Mode and frequency of giving performance feedback
All the managers (n=21; 100.0%) expressed the need for supervisors to provide
the health workers with the feedback every time the appraisal is done. They
believed that face-to-face discussion of appraisal results is an appropriate way of
showing the health workers their performance strengths and weaknesses. These
findings are similar to many other studies done in Africa.
A number of research studies indicate inadequacies in reporting performance of
health workers. In Malawi for example, although some form of performance
appraisal for health workers is carried out, there is usually no feedback. Health
workers do not receive feedback from their superiors about their performance
either during the appraisals or supervisory visits (Bradley & McAuliffe 2009:[3];
Manafa et al 2009:[5-6]). Similar findings are reported in Tanzania (Manongi et al
2006:[5]) where health workers felt that it was useless for their superiors to keep
on going for their appraisal and supervisory visits without giving them feedback
on where they are wrong to help them correct their mistakes accordingly. Further

265
research studies in Kenya and Benin by Mathauer and Imhoff (2006:[9]) also
report that most health workers do not receive any feedback from their superiors
and therefore they feel a sense of neglect by their superiors. This indeed
demotivates the health workers and may contribute to poor performance.
5.6.3.4 Subtheme 3.4: Recognising performance
The focus of this subtheme is on how the performance of health workers is
recognised. Table 5.14 illustrates the subtheme and its category.
Table 5.14: Recognising performance of health workers
3.4 Recognising
performance 3.4.1 Modes of recognising performance
(such a issuing certificates, end of year parties, gifts, and words of praise)
5.6.3.4.1 Modes of recognising performance
The most recurring ways of performance recognition that were put forward by the
health services managers include the following:
Issuing certificates
End-of-year parties
Gifts
Words of praise
At least there is some form of recognition shown to the health workers for their
performance, although it is not well spread to all the districts. Recognition of
performance of health workers not only comes from the managers but also from
the public. Khowaja et al (2005:35) point out that lack of appreciation by
managers about the performance of registered nurses in Pakistan contributed to
job dissatisfaction. Bradley and McAuliffe (2009:[3]),and Yumkella (2005:14)
assert that performance management system in the public health sector in
Malawi is weak and characterised by lack of transparency in performance
assessment, lack job descriptions, weak supervisory systems and no recognition

266
for good performance. Although there are job descriptions for most of the health
workers in Uganda, recognising performance for most of them is still lacking.
Recognition plays a major part in the motivation, job satisfaction and
performance of health workers. Dieleman et al (2006:[6]) point out that in Mali
like in most African countries there were no formal methods to show
appreciations for good performance. In Uganda, some managers also
congratulated and thanked personnel in public service. Some well performing
health workers were assigned supervisory roles or training in order to gain extra
income from allowances (Dieleman et al 2006:[6]; Hagopian et al 2009:w871).
5.6.3.5 Subtheme 3.5: Use of performance appraisal results
Table 5.15 presents subtheme 3.5 which identifies ways in which performance
appraisal results are utilised.
Table 5.15: Use of performance appraisal results
3.5 Use of performance appraisal results
3.5.1
Ways in which appraisal results are used (identifying training needs, promotions, redistribution of staff, support supervision, & not used)
5.6.3.5.1 Ways in which performance appraisal results are used
The views of the managers were divided on this issue. Some of the managers
(n=9; 42.9%) stated that the results of performance appraisals were not used in
their facilities. Most of the managers (n=12; 57.1%) indicated that the results are
used to identify training needs of the health workers. One manager regretted,
however, that training needs are identified but this does not guarantee
sponsorship for the candidates. Other managers (n=11; 52.4%) said they use
the results for promotion, support supervision, confirmation and staff re-
distribution purposes. Evidence from the discussions suggests that although
performance appraisal results are not utilised in some facilities there was an
attempt to utilise the results in other facilities. This would assist the managers to
implement appropriate measures to improve the performance of health workers.

267
These findings support what Mathauer and Imhoff (2006:[14-15]) established in
Kenya.
Kruk and Freedman (2008:263) and Smith et al (2008:1) suggest that the results
for performance measurement system should be used to formulate budgets,
allocate resources, motivate employees and improve services among others. It is
good practice to find out how well the workforce and programmes are performing
and use this information for programme planning, implementation and
improvement. According to Armstrong (2009:629) and Üstünlüoğlu (2009:119)
performance appraisal should serve to identify who is eligible for pay rises,
promotions, placement according to the abilities, motivate employees in their
jobs and give feedback for improvement. It is, therefore, important to develop the
culture of using the information that has been collected through the process of
performance management.
5.6.4 Theme 4: Suggestions of managers on how to improve performance appraisal
The fourth theme of this study is about the suggestions given by the health
service managers on how performance appraisal could be improved. Six
subthemes were identified under this theme. These are: performance appraisal
tool, performance appraisal process, recognising performance, performance
appraisal feedback, using performance appraisal results and training of the
supervisors. The first subtheme is shown in Table 5.16 with its category.
5.6.4.1 Subtheme 4.1: Performance appraisal tool
This subtheme relates to the views of the managers on how the performance
appraisal process can be improved through the appraisal tool. Table 5.16 shows
this subtheme and its category.
Table 5.16: Improving performance appraisal tool
4.1 Performance appraisal tool
4.1.1
Review performance appraisal tool

268
5.6.4.1.1 Review the performance appraisal tool
Majority of the health service managers (n=19; 90.5%) recommended that the
existing performance appraisal tool be revised as it is has some flaws. The tool
is too long and this demotivates the health workers to complete it because it
takes a long time to complete. Most managers (n=17; 81%) indicated that the
appraisal tool falls short of performance indicators. These findings are similar to
those of GTZ‟s (2009: IV) study in Malawi. GTZ (2009: IV) reports that in Malawi,
performance appraisal forms are too long, not user friendly and lack clear
indicators for measuring performance. This demotivates health workers to
complete these appraisal forms since they are not clear how their performance is
measured. Similarly, another study in Ghana report that performance appraisal
forms were too long difficult and confusing for the staff members to fill.
(Initiatives, Quality Health Partners & The Ghana Health Service 2005:14).
In addition, some of the managers (n=8; 38.1%) suggested that the appraisal
tool be made available at all times. The managers reported that they lacked
stationery to duplicate the tool to distribute to the health workers. When they fail
to do so, the health workers have to photocopy the appraisal tools themselves in
order to be appraised. Without constant supply of the performance appraisal
form, it is most likely that health workers can make excuse not to complete their
performance appraisals. It is the responsibility of the district manager to ensure
that all the required materials are in place in order to ensure effective
performance appraisal systems. The process should be clearly explained to the
health workers and the indicators for measuring individual performance should
be available and known to all the stakeholders.
5.6.4.2 Subtheme 4.2: Performance appraisal process
This subtheme reveals the opinions of the managers on how the appraisal
process could be improved. The subtheme and its category is illustrated in Table
5.17.

269
Table 5.17: Performance appraisal process
4.2 Performance appraisal process
4.2.1 Nature and frequency of the appraisal process
5.6.4.2.1 Nature and frequency of appraisal process
There was a general consensus from the managers (n=21; 100.0%) that the
appraisal process should be continuous and interactive. The supervisors need to
sit and discuss with their subordinates to agree on the objectives and set realistic
targets. Some managers (n=18; 85.7%) also suggested that the appraisal
process should be two-way. The subordinates must also appraise their
supervisors. In other words, all the stakeholders including clients or patients who
use the services should be involved in the process.
Initiatives et al (2005:16) recommend that performance appraisal should be
conducted at least once a year with an abbreviated 6-month review. This system
allows for two formal meetings between staff and supervisors and helps health
workers to assess their progress and create new strategies if necessary. The
GTZ (2009: VI) also suggests that any performance management framework
should allow for regular, on-going and continuous implementation of appraisals.
It should contain, as a pre-requisite, clear criteria for assessment and a
sustainable rewards system as part of the incentive scheme. Some scholars
suggest quarterly appraisals. However, a study done in Ghana reports that doing
quarterly performance appraisals is too cumbersome for the health workers
since it does not give them chance to have one-to-one meetings with their
supervisors (Initiatives et al 2005:16).
5.6.4.3 Subtheme 4.3: Recognising performance
This subtheme relates to how performance appraisal could be enhanced by
recognising performance. Table 5.18 presents the subtheme and its categories.

270
Table 5.18: Recognising performance of health workers
4.3 Recognising performance
4.3.1
Rewarding good performance
5.6.4.3.1 Rewarding good performance
All managers (n=21; 100.0%) suggested that good performance of health
workers should be rewarded in order to motivate them. It was discovered during
the discussions that managers believed that when health workers are motivated
they are highly likely to be enthusiastic about performance appraisal. The
rewards that were proposed include recommendation for training, promotion in
service, giving more responsibility, giving letters of recognition as well as
certificates of achievement or recognition. This is likely to enhance the
motivation and performance of health workers. Hagopian et al (2009:w869)
report that rewards and remuneration systems are known to influence the
behaviours as well as the performance of the health workers. Any performance
management system should be linked to rewards or recognition. Without this the
performance management system is incomplete.
Skinner and Green (2010:1) suggest that any actions agreed upon during the
appraisal process, whether for further training, a raise in pay, promotion, or
disciplinary action, should be followed through on as soon as possible. Any
action discussed during performance appraisals, especially rewards, should only
be offered as a result of improved performance and never as an empty promise
in an attempt to motivate an employee for the future. The appraisal is not fully
complete until both the manager and the employees have followed through on all
of the elements that have been discussed as part of the process. A manager that
does not follow through on promises will be perceived by employees as not
taking their own recommendations or the needs of staff seriously. It is important
that the appraiser be aware of any budgetary or time constraints to avoid
promising something to the employee that cannot be delivered. Making promises
that cannot be delivered seriously damages a manager‟s credibility.

271
Paul (2009:13) points out that the reward system has to be reworked so that the
health workers who meet the needs of the individual communities and provide
high quality care leading to client satisfaction get rewarded rather than those
who fill up false reports to please their supervisors. For example, in Rwanda both
the motivation and performance of health workers has increased as a result of
performance based rewarding system. This motivation is reflected in the staff
wanting to take up more responsibility and their willingness to participate actively
in activities related to improving health care services. The improved motivation is
also reflected in the availability of health workers and willingness to work
supplementary hours even though they are not paid for it (Paul 2009:13).
5.6.4.4 Subtheme 4.4: Performance appraisal feedback
The focus of this subtheme was to describe the views of the managers on how
performance feedback may improve performance appraisal. Table 5.19
illustrates the subtheme with its categories.
Table 5.19: Frequency of performance appraisal feedback
4.4 Performance
appraisal feedback 4.4.1
Frequency of appraisal feedback
5.6.4.4.1 Frequency of performance appraisal feedback
Most managers (n=19; 90.5%) recommended that performance feedback should
be given regularly to health workers. This helps the health workers know how
they are performing and may help to increase their keenness for performance
appraisal.
Skinner and Green (2010:1) assert that in a well-rounded and healthy
organisation, the appraiser should ask for employee feedback both on their own
performance and that of the organisation. At the same time the employees
should be given feedback related to their performance. The employees are not
working in a vacuum. One of the major criticisms about performance appraisals
is that they do not usually take into account the ways in which the environment

272
affects employee performance. It is important that performance appraisals be
used as an evaluative tool in context rather than in an artificial realm in which
employees are solely to blame for problems.
Paul (2009:21) adds that regular performance evaluation and feedback can
provide management and health workers with the essential information on their
strength and weaknesses and can also be formative and supportive. The health
workers should be given opportunity to express and demonstrate their opinions
and needs thereby improving the feedback mechanism. Therefore, in order to
have great impact on performance the feedback needs to be immediate and
should be related to specific performance standards (Luecke 2006:55; Rowe et
al 2005:103).
5.6.4.5 Subtheme 4.5: Using performance appraisal results
Table 5.20 presents the subtheme 4.5. This is concerned with how the use of
performance appraisal results can improve the process of performance
appraisal.
Table 5.20: Recommendations on use of performance appraisal results
4.5 Using performance
appraisal results 4.5.1
Promotion, confirmation in the civil service and training
5.6.4.5.1 Promotion, confirmation in civil service and training
From the discussions and interviews it became evident that all the managers
(n=21; 100.0%) valued the use of the results from performance appraisals. The
most recurring areas where the manager believed the use of appraisal results
would be mostly applicable are the following: training, promotions and
confirmation in the civil service. Kruk and Freedman (2008:263) and Smith et al
(2008:1) suggest that information from an effective appraisal system should be
used to motivate employees, improve services, self-assessment and to allocate
resources. Employees can be motivated through promotion, confirmation in
service and giving them opportunity to go for further training. However, Initiatives
et al (2005:17) mention that promotion alone should not be the reason for

273
performance appraisal but the process has to link to professional or career
advancement. This will stop the staff from rushing to complete the performance
appraisal forms only when they are called upon for promotional interview.
5.6.4.6 Subtheme 4.6: Training of supervisors
This subtheme is about the importance of training to performance appraisal. One
category emerged from the discussions as shown in Table 5.21.
Table 5.21: Training of supervisors
4.6 Training of
supervisors 4.6.1 Training managers about the
importance of appraisal
5.6.4.6.1 Training of health managers on the importance of performance appraisal
All the health service managers (n=21; 100.0%) believed that in order to improve
performance appraisal, supervisors and their subordinates need to be sensitised
and oriented on what performance appraisal is all about and why it is important.
This not only equips the health workers with knowledge but also empowers the
supervisors on conducting performance appraisal in a consistent and effective
manner. One of the issues noted from the managers‟ suggestions is that ongoing
support supervision is necessary in order to create a strong foundation upon
which the appraisal process can be based. It is important to have both the
supervisors and their subordinates to be oriented about the processes and
importance of performance appraisals in order to ensure effectiveness. The GTZ
(2009:19) recommends that resources should be set aside for orientation and
training of health workers as well as their managers on performance
management. Initiatives et al (2005:23) emphasise that in order to ensure
sustainability of performance management the training should be integrated into
the routine quarterly staff meetings at the district and health facility levels. This
will reduce costs and establish a sustainable forum for building capacity in
performance management.

274
5.7 CONCLUSION
This chapter presented the analysis, interpretation, and discussion of the
qualitative data. The presentation began with an introduction to the chapter. The
findings from the qualitative data collection were presented under the following
four themes:
The factors that influence the performance of health workers
The views of managers on how to improve the performance of health workers
Existing practices for managing the performance of health workers
The recommendations of health service managers on how to improve the
process of performance management.
Each theme was discussed under several subthemes which were also
subdivided into numerous categories. The research findings indicate that there
are more factors which impede the performance of health workers than there
were those that enhance the performance. Of these factors, numerous emerged
as organisational factors over which the health workers may have little if any
ability to alter even if they so desired. Individual factors as well as institutional
factors also had a role to play in either enhancing or impeding performance.
The health managers were generally of the view that improvement of both the
intrinsic and the extrinsic motivational factors would boost the performance of
health workers. Although the current practises for managing the performance of
health workers are faced with a myriad of challenges, efforts exist to improve
performance. These include performance improvement programmes such as
performance appraisals and performance reporting.
On how the performance management process can be improved the managers
suggested that all the factors which impede the performance of health workers
need to be addressed, also the factors which enhance the performance must be
strengthened. The next chapter presents the conclusions, limitations and
recommendations of the study.

275
CHAPTER 6 CONCLUSIONS, LIMITATIONS, AND RECOMMENDATIONS
6.1 INTRODUCTION
This chapter presents a summary of the key findings, implications of the findings,
limitations, and conclusions of the study. Also presented are the
recommendations for improving performance management in the health sector
as well as areas for further research. The proposed performance management
framework arising from the findings of this study is outlined.
6.2 THE AIM AND OBJECTIVES OF THE STUDY
The conclusions are presented according to the aim and the objectives of the
study. The overall aim of the study was to investigate the performance of health
workers in the decentralised services in order to come up with a management
framework that may be used to improve the performance in Uganda.
The objectives of this research were to
identify factors that impede or enhance performance of health workers
assess the current practices for managing performance of health workers
determine the views of health workers and their managers on how to improve
performance
develop a performance management framework for health workers based on
the findings of this research
6.3 RESEARCH DESIGN AND METHODOLOGY
The study used both quantitative and qualitative research methodologies. Health
workers at facility level constituted level 1 and health service managers
constituted level 2. Level 1 utilised quantitative research methodology to collect

276
and analyse data from health workers at the health facility level. Level 2 used
qualitative research methodology to collect and analyse data from the health
service managers at the district, hospital, and health sub district levels. Data
collection and analysis for level 1 and level 2 were done concurrently (see
chapter 3).
6.3.1 Level 1
The population for this level comprised professional nurses/midwives, clinical
officers, and doctors working in the districts of Kumi, Mbale, Tororo and Sironko.
Data was collected using a questionnaire with all items but one based on a 5-
point Likert scale. The last item was an open-ended question (annexure H). Data
was collected from 276 health workers out of the targeted 331. These
participants were selected through stratified random sampling. The data analysis
was done using SPSS version 18 and the results were presented in tables,
figures and text (see chapter 4).
6.3.2 Level 2
The population for level 2 were the health services managers from the districts of
Kumi, Mbale, Tororo and Sironko. The health services managers included the
DHOs, hospital administrators, medical superintendents, principal nursing
officers, senior personnel officers and the heads of the health sub districts.
These managers were selected purposively based on their positions and level of
involvement in supervising health workers. A total of 21 managers were
interviewed using a semi-structured questionnaire (annexure I). The data
collected were analysed and coded manually. The results were presented in
form of tables, figures as well as in text. Quotes were used where necessary
(see chapter 5).

277
6.4 CONCLUSIONS
The findings from the two levels are summarised according to the study
objectives.
6.4.1 Identify the factors that enhance or impede the performance of health workers
The findings indicated that a number of factors either enhance or impede the
performance of health workers. The factors identified included the individual
attributes, behaviours of health workers and organisational factors. The findings
of this study showed that the health workers have the required skills and abilities
to perform their work, although time management seems to be a problem (see
Table 4.5). During the interviews, the health service managers concurred that
health workers are competent and have the knowledge and skills to perform their
duties (see sub section 5.6.1.2.2). Similarly, the results showed that health
workers have values and beliefs that are favourable for desirable performance
(see Table 4.9).
The findings further indicate that health workers exhibit considerable levels of
flexibility and professionalism during the execution of their duties which can
enhance their performance (see Table 4.6).
The results further demonstrated that despite some challenges, the health
workers are self-motivated and willing to work (see Table 4.7). It was established
that health workers were generally committed to their work and the organisations
they work for (see Table 4.8). These are all important factors that may enhance
their performance.
Generally, the findings revealed that health workers are proficient (see Table
4.10), adaptive (see Table 4.11), proactive (see Table 4.12) and are client-
oriented (Table 4.13). These can indeed enhance their performance. This was
also echoed by most health services managers who mentioned that health
workers demonstrate satisfactory levels of competence (see subsection

278
5.6.1.2.2), they are proactive (see subsection 5.6.1.2.3) and generally exhibit
good behaviours towards the patients, although there are instances when some
workers display undesirable conduct towards patients (see subsection 5.6.1.2.4).
The findings of this research revealed that health workers are generally clear
about the strategies of their organisations (see Table 4.14). It was established
that health workers and managers share a common purpose, they are
competent and recruitments and promotions are done on merit. The health
services managers however pointed out that much as the high cadre staffs like
doctors, nurses and clinical officers are clear about the organisation‟s strategy,
many low cadre health workers do not understand the mission of their
organisations (see subsection 5.6.1.1.14). The results of the study indicated that
most health workers and managers lacked support from the local political
leadership (see Table 4.18; subsection 5.6.1.3.1 and 5.6.1.3.3). The health
service managers complained of political interferences in their work both at
technical and administrative levels leading to conflicts between health workers
and the local leaders. This negatively affects the performance of health workers.
The managers indicated that the government has good policies and guidelines,
however, their implementation still remains a challenge (see section 5.6.1.3.2).
The study further revealed that there were considerable weaknesses in the way
performance is measured and how the results of the performance appraisals are
utilised (see Table 4.14). This may impact negatively on the performance of
health workers.
There were mixed reactions concerning the working environment. Most health
workers seemed to be contented with the job security, working space, infection
control measures, opportunity to participate in decision making concerning their
clients and the feedback they receive from their supervisors. However, many
health workers were not satisfied with availability and the condition of the
medical equipment as well as the availability of drugs and other medical supplies
(see Table 4.15). This implies that while the general working environment might
be conducive, lack of adequate medical supplies to facilitate patient care can
negatively affect the performance of health workers.

279
The health service managers alluded to the following as impediments to
performance :
poor general working environment,
lack of drugs and other medical supplies,
poor remunerations,
lack of accommodation,
lack of transport at the health facilities,
insufficient support supervision,
lack of prospects for academic progression and career movement,
inadequate performance management including appraisals,
insufficient rewarding and recognition system,
poor communication, and
poor interpersonal relationships among the health workers and the
communities (see subsections 5.6.1.1.1 to 5.6.1.1.12).
The study established that overall, the staffing levels within the health facilities
are below the minimum standards set by the ministry of health (see Table 4.16).
The findings further revealed that there is increased workload for the existing
health workers, inadequate or non-existent compensation for working overtime,
and lack of work-life and personal life balance. This in many cases hinders the
performance of health workers. On a positive note, the findings showed that
health workers were happy with the fairness and flexibility of their work
schedules (see Table 4.17).
The findings further indicated that nearly all the health service managers
complained of low staffing levels and high turnover of health workers in the
facilities, which increases the workload on the existing health workers and
reduces their morale to perform (see subsection 5.6.1.1.16). The managers
indicated that hard-to-reach areas usually have low availability of staff and
usually have high turnover of staff. Although sometimes the health facilities may
have adequate numbers of health workers, late coming and absenteeism seems
to be a big challenge since many health workers have to commute long
distances to their duty stations. Yet, they may not have sufficient money to
280
manage daily transport fares due to poor remuneration (see subsections
5.6.1.1.3; 5.6.1.2.1, and 5.6.2.1.5). The health workers on the other hand
reported that they always take initiatives to ensure that they are available for
work, although they may be let down by the low staffing levels which leads to
increased workload (see Table 4.20).
The health services managers indicated that although health workers are
generally productive, those facilities with low staffing levels tended to have low
productivity and inadequate performance. This is mainly because the existing
health workers are overworked. This coupled with lack of resources like
transport, drugs and equipment tends to impede the productivity of health
workers (see subsection 5.6.1.2.5). Despite these challenges, the findings show
that health workers are responsive to the needs of their clients and patients,
even if the services they provide are not timely (see Table 4.19).
From the researcher‟s point of view most the factors which hinder the
performance of health workers emanate from the health system and those that
facilitate performance come from the individual health workers themselves.
Looking at the strategic performance model (Figure 1.2) it is evident that most of
the situational constraints as well as the organisational strategy components play
a part in hindering the performance of health workers. However, at the individual
level, the health workers seem to possess necessary attributes and behaviours
which support performance.
6.4.2 Assess the current practices used to manage the performance of health workers
The findings of the study showed that there are various methods used to review
the performance of health workers and these include formal and regular reviews
(49.6%), informal but regular reviews (30.4%) and some informal and
unscheduled reviews (19.9%). This is an indication that some type of
performance review is being done (see Figure 4.1). The study established that
performance appraisal results are used for identifying the training needs (n=220;

281
79.7%), promotion of staff (n=222; 80.4%), rotation of staff (n=193; 69.9%),
determine who to be rewarded (n=193; 69.9%) and in some case demotion of
staff (n=55; 19.9%). There were some health workers (n=27; 9.8%) and their
managers (slightly over one-third) who indicated that the results of performance
appraisals are not used at all (see Table 4.26 and subsection 5.6.3.5.1). Some
health service managers (n=11; 50%) indicated that the results of performance
appraisals are used for identifying the support supervision needs, confirmation of
staff in public service and for staff redistribution (see subsection 5.6.3.5.1).
The findings further showed that there are some attempts by the health service
managers to set standards and indicators against which the performance of
health workers is evaluated. The results showed that most of the health workers
have job descriptions with clearly stated objectives, and lines of authority and
accountability (see Table 4.27). It was, however,important to note the difference
in the responses between the managers and the health workers regarding target
setting. Whereas most health workers indicated that target setting takes place,
on the contrary, most managers reported that rarely do pre-appraisal meetings
take place for setting targets. Most managers mentioned that while performance
appraisal guidelines are available, target setting is inadequately done, pre-
appraisal planning meetings are not held and performance agreements are
never signed. This affects the quality of the performance management process
(see subsection 5.6.3.1.1).
It was established that some attempts have been made by health services
managers to measure the performance of health workers, however, the findings
demonstrated that not all health workers knew what performance measurement
is all about and what indicators are applied (see Table 4.14 and Table 4.28).
Many of the health service managers mentioned lack of clear tools for measuring
performance since even the appraisal forms from the ministry of public service
lack clear indicators for measuring and monitoring performance of health
workers. The findings further indicate that for those districts where performance
measurement is done, they know that it is supposed to be done regularly but in
practice it is done on an adhoc basis. According to the ministry of public service,

282
in Uganda, performance appraisal is supposed to be done every six months for
those health workers on probation and annually for those who are permanent. In
practice this is hardly done (see subsection 5.6.3.2.2).
The findings revealed differences in the responses concerning reporting
performance appraisal results. Most the health workers reported that somehow
their managers report the results of their performance. About 30% of health
workers (n=84; 30.4%) do not receive regular constructive feedback about their
performance and another 30.1% (n=83) do not believe that managers report the
health workers‟ performance results to the external stakeholders (see Table
4.29).
From the managers‟ perspective there were still differences in responses
concerning reporting performance. For those managers who do not report they
do so just because they do not measure performance. „How can you report
something you don‟t measure?‟ For the managers who attempted to report, they
are faced with challenges of doing so and in most cases they report generalised
group performance and not individual performance. In cases where individual
performance reporting is done, it is usually verbal unless if there is indiscipline,
when warning letters are written to the concerned staff. The frequency of
reporting performance is generally quarterly but most times annually. The
findings from the managers indicated that in case of individual performance,
supervisors provide feedback every time the appraisal is done. The managers
also believed that face-to-face discussion of performance appraisal results is the
best way of showing the health workers their strength and weaknesses. Without
a functional feedback mechanism the health workers are likely to be unmotivated
to participate in performance management process since they do not see its
benefits (see subsections 5.6.3.3.1 and 5.6.3.3.2).
The findings showed that there were deficiencies in the area of performance
improvement. It was established that the analysis of the information from the
performance management system is not used effectively to improve service
delivery. Without proper analysis of the performance appraisal results there is no

283
way managers can implement corrective interventions. In order to ensure proper
performance improvement health workers should be given a chance to suggest
ways they want to see performance improved and the supervisors should always
be available to guide health workers perform up to their organisations
expectations (see Table 4.30).
The findings of this study clearly revealed insufficiency in the rewarding system
within the districts (see Table 31). This hinders the performance of health
workers in many ways. The health service managers recognise that monetary
rewards are not the only means health workers‟ performance can be rewarded or
recognised. Health service managers mentioned a number of ways they have
been using to recognise performance of health workers including issuing
certificates of achievement, gifts for outstanding performance, end of year
parties and a word of praise. These indeed motivate health workers to perform
better (see subsection 5.6.3.4.1).
The results indicated that although the health service managers attempted to
address the short term training needs of the health workers the long-term
training and development needs are not adequately addressed (see Table 4.32).
Many health service managers blamed decentralisation as a hindrance to staff
training and development. Most managers mentioned that the opportunities for
further training are limited in the districts, and where they exist, nepotism clouds
the selection of the candidates. In addition, on completion of their further
training, most health workers are not promoted and sometimes they do not fit
into the district staffing structures. This may hamper their performance and
subsequently may lead attrition of staff (see section 5.6.1.1.7, 5.6.1.1.10 and
5.6.1.1.11).
The researcher believes that the current practices for managing the performance
of health workers could be effective if the individual efforts of managers and their
subordinates were supported by solid and functional organisational strategies
(Figure 1.2). The health managers and the health workers may be self motivated

284
to improve performance but may fail to attain their goals in the absence of a
conducive organisational environment.
6.4.3 Determine the views of health workers and their managers on how to improve performance of health workers
The findings in Table 4.35 showed that health workers would like to see an
improvement in their motivation. This was the most recurring response among all
the suggestions put forward by the health workers and their managers. The
motivation attributes suggested by the health workers included improvement in
remunerations, provision of drugs and equipment to enable them perform their
duties, provision of uniforms and provision of accommodation nearer to the
health facilities. The study revealed that most health workers do not to have
accommodation at their respective duty stations.
The study revealed that health workers would like to see improvements in the
management and administration of further formal training opportunities so that
they can upgrade their skills and advance their careers. Health workers also
suggested regular refresher courses. Training can be a motivator for
performance and may also act as a catalyst for improving the skills and
competences of health workers.
The findings established that health workers would like to have regular meetings
with their managers to discuss performance related issues. This is one way
health workers can get feedback about their performance and be able to make
timely corrective actions.
Some health workers suggested the need for regular staff rotation to various
departments and health facilities. This would facilitate in the transfer of skills and
competencies which could assist in enhancing performance of health workers.
The managers interviewed had similar suggestions to those of the health
workers. In addition to recommending improvements in remuneration and
training opportunities, the managers suggested that there should be more
delegation of duties and responsibilities to the health workers to empower them

285
and increase their motivation to perform. In addition, the health workers should
be given more powers and authority to make decisions on how to manage their
health facilities.
The health service managers suggested that the local governments should look
into the possibility of improving the infrastructure in the health facilities, provide
accommodation for staff and transport facilities to enable health workers carry
out support supervision. Furthermore, the findings of the research showed that
the health workers were suggesting an improvement in the way support
supervision is conducted. Support supervision should be continuous on-the-job
training process and should not be used as a fault finding mission. In order for
support supervision to be effective it should be planned properly and those plans
should be communicated to all stakeholders. At the end of each support
supervisory visit, proper feedback should be given immediately to the workers
who have been supervised both verbally and in writing.
In terms of the institutional initiatives, some health service managers suggested
that the position of DHO should be centralised in order to reduce the political
pressures put on them to influence some decisions. If this is done, it means the
appointment will not be politicised and that the DHOs can be transferred across
the districts within Uganda by the central government. This is likely to improve
performance in the long run.
The health services managers further suggested that the communities should be
supportive of health workers. They should appreciate what the health workers
are doing instead of harassing them. The health workers are frequently harassed
by the communities they serve. This affects their morale and could eventually
translate into poor performance (see subsection 5.6.2.3.1).
Furthermore, health service managers want to see an improvement in
performance management. The managers suggested that the appraisal
tools/forms should be shortened. This will motivate the health workers to
complete the appraisal forms. It should be the responsibility of the line managers

286
to ensure that the performance appraisal forms are available and accessible to
all the health workers to be assessed during the performance cycle. The
performance appraisal tool should also include indicators that can be used to
measure the performance of health workers.
The managers further suggested that performance appraisal should be
continuous and interactive. The process should be open and feedback should be
given as soon as the appraisal process is completed. The managers also
suggested that the performance appraisal process should be linked to the
rewarding system as one way of enhancing performance of health workers. Such
rewards and recognitions should include recommending health workers for
training, confirmation and promotions in civil service. Other means suggested
were giving letters of recognition and where possible certificates of
achievements.
Lastly, the health service managers suggested that all stakeholders involved in
conducting performance appraisals should be trained about the process, the
importance of performance appraisals and how to give effective feedback to the
staff (see subsection 5.6.4.6.1).
The suggestions given by the health workers indicate that both the individual
and organisational constraints to effective performance must be addressed. All
the stakeholders including the politicians should contribute to the improvement of
health workers‟ performance.
6.4.4 Develop a performance management framework for health workers based on the research findings
The findings of this study have facilitated the researcher to develop a
performance management framework that might be used to monitor and
enhance the performance of health workers in the decentralised services. The
strategies and the recommendations proposed in the framework (see Table 6.1)

287
were developed with the assumption that some forms of performance
management are currently implemented in the districts.
The eight key components of performance management where deficiencies or
gaps have been identified and need improvement include; understanding the
context for performance management in health sector, performance planning,
coaching, staff training and development, performance reviews, performance
feedback, rewards and recognition of performance and provision of continuous
monitoring and evaluation of the performance management systems (see Table
6.1).
The researcher has proposed strategies for each key component in the
framework to direct the implementation of corrective actions. The researcher has
further proposed some recommendations for improving performance
management practices in the health sector. These strategies and
recommendations are aimed at addressing the inefficiencies in the execution of
performance management in the decentralised health sector in Uganda. The
performance management framework presented in Table 6.1 aims at assisting
health workers and their managers in understanding what is expected of them to
ensure effective performance.

288
Table 6.1: The performance management framework for health workers in the decentralised services
Key performance management component: Understanding the context for performance management in health sector
Key research findings to support the proposed strategies
Proposed strategies Recommendations for practice in the health sector
About a tenth of the health workers indicated that the way their work is related to the overall objectives of the organisation is not clear.
Slightly over a tenth of the health workers were not familiar with the organisation‟s mission towards clients.
Close to forty percent of the health workers were not clear about the way their performance is measured and slightly over a tenth were undecided.
About forty percent of the health workers were not clear about the way the performance results are used and over a fifth were undecided.
Close to three quarters of the health services managers indicated that many low cadre staff do not understand the mission of their organisation.
Most health service managers and some health workers blamed inadequate performance to poor working environment, lack of drugs and supplies, poor remuneration, poor living conditions, poor staffing levels, inadequate support supervision, and low funding for the PHC activities.
Align the individual performance with the mission and objectives of the organisation.
Prepare and educate health workers on performance management.
Scan the environment for the factors that are likely to affect performance management.
The health services managers in the health sector need to understand the link between performance management and the individual performance expectations.
Health workers and their managers should make use of available information and documentations such as the strategic plans, operational plans, job descriptions and previous performance appraisals of each worker to align individual performance with the organisation goals and objectives.
The health services managers should use any available opportunity to disseminate the mission and strategic objectives of MoH and ensure that all stake holders in health understand them.
The health service managers should identify and find solutions to external factors that are likely to affect the performance of the health workforce and search for solutions for effective service delivery.
The health services managers have to prepare and educate health workers about performance management, including but not limited to its relevance, how it is implemented and what is expected of each of the individuals involved in the process.

289
Key performance management component: Performance planning
Key research findings to support the proposed strategies
Proposed strategies Recommendations for practice in the health sector
Close to a third of the health workers were not clear on how to divide their time among the tasks required for the job.
Nearly a third of health workers were not clear on how to determine the appropriate procedures for each work assignment.
A few health workers were not clear of the expected results of their work.
About a third of the health workers did not have clear job descriptions
Some health workers indicated that no targets are set for activities to be achieved in a given period and close to a fifth were undecided.
No appropriate performance indicators to measure their performance was indicated by nearly a third of health workers.
Almost a fifth of health workers indicated that performance standards, indicators, and targets are not communicated to all departments, and another fifth were undecided.
Almost a fifth of health workers indicated that the performance standards are not clear and some were undecided.
Most managers indicated that no pre-appraisal meetings take place between the appraisees and the appraisers to set targets.
Establish and agree upon performance expectations.
Clarify what health workers will be evaluated upon.
Set a stage for ongoing feedback and coaching throughout the performance cycle.
Agree on performance plans.
The health services managers together with the health workers should clearly identify the job tasks to be executed and ensure that the worker understands the link between his or her responsibilities and the overall goal.
The supervisors and the health workers should agree on the main job responsibilities, the individual goals to be achieved and the mechanisms for determining success or achievements.
The supervisors and health workers should be in position to know the type of help the senior manager of the organisation can provide any potential barriers to achieving the goals and the ways to overcome the barriers for performance.
The supervisors and health workers should always come up with a formal performance plan that summarises their discussions and agreements. This performance agreement should be documented and signed by the supervisors and the health workers.
Whenever necessary the job tasks should be modified to reflect changes in the job context.

290
Key performance management component: Coaching
Key research findings to support the proposed strategies
Proposed strategies Recommendations for practice in the health sector
Slightly over a tenth of the health workers do not always have access to their supervisors.
A lack of support from their supervisors were reported by close to a fifth of health workers and a tenth were undecided.
Constructive feedback from their supervisors were not received by almost a fifth of health workers.
Encourage ongoing two way communication during the performance cycle.
Focus on improving current performance and building capabilities for the future.
The supervisors should always be accessible to their subordinates for ongoing support. The health services managers should appreciate that it is dialogue that links performance planning and performance review.
The supervisors and health workers should be encouraged to constantly share information concerning work progress, potential barriers and possible solutions.
The supervisors should use techniques such as informal conversations or notes as well as formal coaching meetings and written documentations to provide ongoing support to the health workers.

291
Key performance management component: Staff training and development
Key research findings to support the proposed strategies
Proposed strategies Recommendations for practice in the health sector
Slightly over a third of the health workers indicated that they did not know about the existence of a training and development policy in their organisations and about a fifth were undecided.
A lack of career advancement opportunities in their organisations were reported by forty percent of health workers.
A lack of specific refresher courses being provided on regular basis were indicated by nearly a half of health workers and a few were not decided.
Nearly a half of the health workers indicated that the in-service training provided to them is not adequate in addressing existing skills gaps.
Slightly over sixty percent of health workers indicated that in the past 6 months their supervisors have not discussed their career development prospects with them.
A third of the health workers disagreed that less competent health workers are provided with the necessary support to improve their knowledge and skills.
Slightly less than three quarters of the health managers reported lack of prospects for further studies in the districts, lack of promotion prospects was reported by all managers.
Majority of the health service managers complained of nepotism in the selection of who should go for further training opportunities or be promoted in service.
Put in place a mechanism for keeping health workers abreast with up- to-date professional knowledge and skills for best performance.
Promote the concept of learning organisation.
Ensure fairness in the management and administration of the training opportunities.
The HRH and the health training policies of the MoH should be disseminated to all the health workers for them to know the contents and the implications to their profession.
The district officials should strengthen in-service training as one of the performance enhancement schemes. This will boost the skills and confidence of the health workers.
The continuing medical education (CME) programmes that are implemented by the MoH should be strengthened so that even the health workers in the rural and remote areas can benefit from it.
The training programmes should be correlated to the performance norms and measurement and should be reinforced through supportive supervision and problem solving.
The districts managers should put in place clear criteria regarding when and how to provide in-service training.
The health services managers should ensure that nominations or recommendations for training are based on merit and not nepotism or any other unconventional means.
The districts officials should put in place bursary schemes to support health workers would wish to go for further studies and on completion they should work in the districts that sponsored them for an agreed period.

292
Key performance management component: Performance review
Key research findings to support the proposed strategies
Proposed strategies Recommendations for practice in the health sector
Slightly less than a half of the health services managers indicated that performance measurement is not done in their health facilities.
Slightly over three quarters of the managers reported lack of clear indicators for measuring performance.
More than half of the managers indicated that they do not have clear tools for measuring performance.
Close to a half of the health service managers reported that where performance review is done it is not always frequent and regular.
Slightly over a third of the health workers indicated that performance standards expected from the staff are not clearly understood and are not understood by all.
Slightly over a fifth of the health workers are not fully aware of the processes used to measure their performance and about a fifth were not decided.
Close to a fifth of the health workers indicated that individual performance in not measured regularly and another fifth were undecided.
About a third of the health workers indicated that their organisations do not clearly define how to measure individual task or activity performance.
Just over a tenth of the health workers indicated that their performance is not evaluated based on their job descriptions and about a tenth disagreed.
Evaluate performance based on the performance planning discussions.
Determine the extent to which the set targets are achieved.
Identify the development needs of health workers with a view to develop their potential.
Provide regular performance reviews..
The health services managers should ensure that performance appraisal of the health workers is done based on the agreed performance plan.
Job description should form the basis for the agreements on the time-bound activities in the performance plan.
Every supervisor should evaluate each health worker individually and should use the standard format developed by the Uganda‟s Ministry of Public Service (MoPS).
Clear quantitative or qualitative indicators should always form the basis for performance review.
The health services managers should use the various tools such as job descriptions, treatment schedules, guidelines and standards, daily task schedules that are in use in some health facilities to provide a framework for performance monitoring.
Regular performance appraisal or reviews should be conducted as specified in the Uganda MoPS guidelines of 2007 (Ministry of Public Service 2007).
Health service managers should recognise that individual health workers‟ performance is not entirely under the workers‟ control since external factors such as decisions of others, resources availability and work systems and processes can influence job performance.
The supervisors should afford the health workers the opportunity to share their self evaluation, discuss learning and development needs, set objectives for improvement, set learning and development targets and answer the workers‟ questions regarding performance review.
The supervisors and health workers should both sign the performance review reports.

293
Key performance management component: Performance feedback
Key research findings to support the proposed strategies
Proposed strategies Recommendations for practice in the health sector
Slightly over a third of the health workers disagreed that constructive feedback on performance appraisal is given regularly and close to a tenth were undecided.
Just over a third of the health workers disagreed that their organisations report health workers performance information to external stakeholders and about a were undecided.
About a fifth of the health workers disagreed that their organisation has a specific system for regularly reporting the performance of health workers.
A half of the health services managers do not report performance of health workers.
About forty-three percent of the managers reported lack of one to one feedback about their subordinates‟ performance.
A half of managers indicated that performance feedback when given it is most of the time verbal and not written
Where performance feedback is given most of the time it is not frequently done unless if there is a problem
Provide regular feedback to the health workers concerning their performance.
Provide health workers with additional sources of feedback other than the supervisors.
Report performance appraisal results to the all the stakeholders.
Document the performance feedback.
The supervisors should provide individualised feedback concerning employee performance, including priority objectives identified during performance planning.
The supervisors should gather feedback information from other source than the supervisors, for example, from patients and peers.
The supervisor should schedule time to discuss feedback information with the health workers either prior to or during the performance review.
Health workers should take adequate time to do self evaluations in a meaningful and thoughtful manner and objectively rate their performance.
In addition to giving verbal feedback there should be written feedback concerning the worker‟s performance.
Where necessary, the performance results should be reported to stakeholders in order to implement actions such as salary increments, promotions, confirmation in public service and training.

294
Key performance management component: Rewards and recognition of good performance
Key research findings to support the proposed strategies
Proposed strategies Recommendations for practice in the health sector
Nearly a half of the health workers agreed that rewards and sanctions should be based on performance results and about a fifth were undecided.
Almost a half of health workers agreed that health workers‟ performance information should be used to set priorities for personal development and about a third were undecided.
Slightly over a third of the health workers indicated that hard work is not acknowledged or rewarded and about forty percent were undecided.
A high percentage of health workers indicated that they did not know their fringe benefits and close to a tenth were undecided.
About a third of the health workers indicated that their salaries are not paid according to job responsibilities.
More than half of the health workers indicated that their organisations do not offer sufficient opportunities for promotions.
All health service managers were of the view that good performance should be recognised and rewarded even using non monetary means such promotions in service, giving letters and certificates of recognition among others.
Almost a half health managers were of the view that remuneration of health workers should be based on their performance results.
Develop a link between performance appraisal outcomes and rewards/recognition.
Align spending to results and outcomes instead of inputs in order to reduce costs.
The rewards and sanctions should be provided based on individual performance.
The district health managers should consider the possibility of introducing performance related payment (PRP) as a mechanism to augment the performance of health workers.
The rewards should be given to the health workers who strive to meet the needs of clients by providing quality health services.

295
Key performance management component: Monitoring and evaluation of the performance management system
Key research findings to support the proposed strategies
Proposed strategies Recommendations for practice in the health sector
Close to a third of the health workers indicated that their organisations do not have a system for collecting and tracking staff performance data.
There were over a third of the health workers indicating that no timely action is taken when performance falls below acceptable levels and about a fifth were undecided.
It was indicated by slightly over a fifth of health workers that performance reports are not used effectively to make decisions and about forty percent were undecided.
Slightly over a tenth of the health workers disagreed that their organisations documents the progress related to performance standards and targets and close to a fifth were undecided.
There were about a fifth of the health workers who disagreed that their performance data is analysed and reviewed according to the set performance standards, indicators and targets
Most health services managers indicated that support supervision should be ongoing to enable health workers learn, identify problems and solve them accordingly.
Develop and implement a plan for monitoring performance of health workers on a continuous basis throughout the year to ensure that the activities are in line with the agreed performance plans.
Use performance information as a management tool to continually improve health outcomes.
Decision for improvement of health services should be based on the performance results.
Document good practices for performance management.
In all organisations, the performance management system needs to monitored and evaluated regularly in order to guarantee its effective implementation.
Regular support supervision within the health sector should be used as one of the means to monitor and evaluate performance management.
The health services managers should organise quarterly reviews to discuss the work progress, competences, personal development needs and any other issues related to performance.
The health service managers should keep track of individual performance, quarterly review reports have been suggested in the MoPS guidelines.

296
The performance management framework presented in Table 6.1 is meant to assist
health workers and their managers in understanding what is expected of them in
relation to performance.
6.4.4.1 The key components of the performance management framework
The components of the proposed performance management framework (see Table
6.1) include understanding the context for performance management, performance
planning, coaching, staff training and development, performance review,
performance feedback, rewards and recognition of good performance and
continuous monitoring and evaluation of the performance management system.
6.4.4.1.1 Understanding the context for performance management in the health sector
Performance management is an important component in demonstrating that health
sector stakeholders provide high quality services and achieve both the local and
national objectives. The presence of a comprehensible performance management
framework allows the health workers to recognise how their activities contribute to
attainment of the priority health indicators outlined in the second and the
subsequent Uganda national health sector strategic plans (HSSPs).
In the health sector, the performance management system is meant to:
improve the health workers‟ performance in their quest to achieve the strategic
goals and objectives;
support health workers‟ development and continuous learning;
align compensation with the desired health sector outcomes; and
reinforce management responsibilities.
In order to ensure that these variables are achieved, the health workforce has to
understand the goals and mission of the health sector and how they are linked to

297
performance. Where this link is not clear, the health services managers should
ensure that the stakeholders are prepared and educated about the organisation‟s
mission and objectives, the performance management procedures and how they
relate to each other. Additionally, both the health workers and their managers must
understand that performance can be affected by external factors, hence, conducting
SWOT analysis would be a useful tool in identifying such factors and devise means
to overcome them.
6.4.4.1.2 Performance planning
Performance planning is one of vital processes in performance management. The
goal of performance planning is to examine the core competencies required and
how they are related to the worker‟s job. During the planning phase, there should be
a discussion between the supervisors and the health workers to establish clear and
specific performance expectations. In efficient organisations, the tasks and
processes are planned in advance. The workers‟ involvement during the planning
phase allows them to understand better the objective of the organisation. Ideally,
the outcome of the planning process should be the alignment of the job
responsibilities and performance goals of the health workers to the goals and
objectives of the organisation. It is during the planning phase that the workers
should understand the link between their responsibilities and the overall
organisational strategy.
The supervisors and the health workers need to agree on the main tasks and
objectives the job. At the same time they have to comprehensibly agree on how
achievement will be measured and prioritise the work assignments. Where there is
need, the job responsibilities can be modified to reflect changes in the work context.
During the planning process, the health workers and their supervisors should be
able to identify any potential barriers to achieving the objectives and devise means
of overcoming those obstacles. When the planning phase is executed well, the
managers and their subordinates should come up with a formal performance plan

298
that summarises the discussions and agreements. It is imperative that the
performance plan is signed by both the supervisors and the health workers since it
forms the basis for performance review.
6.4.4.1.3 Coaching
Coaching involves continuous communication between the supervisors and health
workers with the focus on improving performance and building capabilities through
information sharing. Coaching may take various forms such as observing
performance, providing instructions, providing encouragement, correcting poor
performance, recognising good performance, listening to health workers‟ concerns
and removing barriers leading to poor performance. Coaching should occur more
frequently and whenever necessary throughout the year. The health worker or the
supervisor can initiate the coaching sessions. It is, however, imperative that what is
discussed by the health workers and the managers during the coaching sessions be
documented for appropriate use in improving performance.
6.4.4.1.4 Staff training and development
Training plays a critical role in assisting health workers and organisations meet their
goals and keep pace with advances in medicine and public health. Training health
workers improves performance by enhancing skills, improving attitudes and
increasing job satisfaction and motivation which might encourage good
performance. Training capacitates health workers to gain knowledge and skills that
allow them to adjust to the changes in their work.
As basis for improving workers‟ performance, the MoPS in Uganda instituted a
training policy for public servants (Ministry of Public Service 2006:2-9). Guided by
this policy the MoH also developed its training and HRH policy which was supposed
to trickle down to the districts and health sub districts. Despite having these policies,
some health workers are not aware of their existence. There is, therefore, a need
for the MoH to disseminate these policies. Health workers should be kept abreast

299
with the new advances in medicine and public health. This can be achieved by
reinforcing in-service training programmes and CME both in urban and rural areas.
When health workers need long-term formal trainings the districts should put in
place a mechanism of a financial support to assist health workers who would wish
to upgrade their knowledge through further studies. Such funding opportunities
should be accessible to all health workers who qualify without discrimination. This is
one of the means the health sector can improve the skills and performance of its
workforce. Where possible the health workers who go for further training using the
public funding should be bonded for a given period to the districts where they
accessed the training grants. This will enable communities to benefit from the new
knowledge and skills acquired by these workers.
6.4.4.1.5 Performance review
Districts need to identify the performing and non performing health workers. The
health service managers should constantly review the workers‟ performance.
Performance review is a vital component of the entire performance management
process. It is the culminating discussions between the supervisors and health
workers regarding their performance training and development requirements, and
the feedback from others. The health services managers need to appreciate that
what is discussed and agreed upon during the performance planning should from a
basis for measuring the performance. During performance review, the health
service managers rate and evaluate the health worker‟s performance according to
the standards and needs agreed upon in the performance plan. It is vital to set
targets and have indicators that can be used as benchmarks for measuring
performance.
Skinner and Green (2010:1) emphasise that nothing that is discussed during the
appraisals should be new to the workers. Saving problems and issues until the end-
of-the-year review wastes the opportunity to address and resolve these issues at
their inception in a non confrontational manner. Any issues or compliments that are

300
raised during the performance cycle should be documented and should become
part of the appraisal process. Holcomb (2006:572) mentions that managers who
keep their workers informed about their performance help to eliminate the fear of
the unknown. Offering constant feedback rather than once a year session draws
attention to the performance relationships between health service managers and
the health workers. Consistent feedback also provides health workers the
opportunity for continuous professional development. Additionally, regular
communication between the health workers and their managers contributes to a
pleasant working environment.
Goulding and Harrison (1997:9) mention that the most obvious reason for
appraising worker‟s performance is to secure improvement. Therefore, appraisal
should be treated as a chance for the health workforce to review the annual
performance and plans positively for the future. Performance review should not be
treated as session for criticism. The managers should ask the health workers about
the assessment of their own performance, the job and opportunities for career
advancement. Therefore, performance review should utilised as a tool for career
development of the workers.
6.4.4.1.6 Performance feedback
In institutions where performance management is taken seriously the managers
allow for the workers to self assess their performance and that of the organisation.
Health workers are not working in isolation. One of the criticisms regarding
performance assessments is that it does not regularly take into consideration the
external environmental factors that affect health workers‟ performance. The health
services managers should practice the use of multiple sources (such as from
patients, peers, self-evaluation) to offer constructive feedback. This helps the
workers to know their strength and weakness and when they need to change.

301
6.4.4.1.7 Rewards and recognition of good performance
Performance management system in organisations should recognise the workers
for their contributions towards achieving the mission and strategic objectives. When
the workers perform well they should be rewarded. This can be done through the
use of formal or informal awards. Informal awards my include a word of praise or
even a „thank you‟. The health services managers have to understand that the
awards policy need not only provide rewards to the best workers but should also be
an encouragement to poor performers. The health services managers should strive
to find out the reasons and consequences of poor personnel performance and
agree on practical solutions. In addition, as part of the action plan it is important for
the health services managers to follow up any actions agreed upon during the
performance review whether for additional training, salary increments, promotions
or disciplinary actions.
It is imperative that actions discussed during performance reviews, particularly
rewards, should only be given as a consequence of improved performance and not
as empty promises in an effort to motivate a worker for the future performance. The
appraisal is not complete until both the managers and the workers have followed
through on all of the aspects that were discussed during the review. Skinner and
Green (2010:1) mention that managers who do not fulfil the promises made during
performance review are perceived as not serious about the welfare of their staff.
Furthermore, in this study some health services managers have recommended that
the MoH should look into the possibility of introducing performance related payment
and that all the future spending should be aligned to results and health outcomes.

302
6.4.4.1.8 Monitoring and evaluation of performance management system
Performance management is aimed at improving quality of management by
supporting managers in making decisions and facilitate resources allocation
(Diamond 2005:4). Therefore, monitoring and evaluation using quantified
performance indicators facilitates taking timely remedial action (Diamond 2005: 4).
Monitoring plays a crucial role in determining the follow up step in any performance
management system. It is vital that organisations monitor their performance
management systems to ensure quality of the assessment results and unearth any
weaknesses that may require strengthening. It the responsibility of the health
services managers to continuously monitor performance in order to ensure that the
activities agreed in the performance plan are on track. The health workers should
be encouraged to seek guidance from their managers if they are in doubt. All the
critical events and outcomes that occur during the performance cycle should be
documented by the respective line managers and health workers. Furthermore, the
managers should organise quarterly review meeting to discuss the work progress,
competences, personal training and development plans and any other issues
related to performance.
6.5 LIMITATIONS OF THE STUDY
The following limitations may affect the generalisation of the study results:
This study was conducted among health workers in four districts of Eastern
Uganda, therefore the results may not necessarily be generalised to the entire
country.
The study focused on three categories of health workers including doctors,
clinical officers and professional nurses/midwives. The other categories of health

303
workers such as laboratory, pharmacy, dental, and nursing assistants might
have had different views about performance which has not been captured by this
study.
The small number of doctors (n=19; 6.9%) and clinical officers (n=51; 18.5%) at
the health facility level (level I) limits the research findings relevant to these
categories of health workers.
Data from the health workers at the health facility level was obtained using
highly structured questionnaire based on 5-point Likert scale which was self
administered, so, it was not possible to probe on the responses given by the
participants.
Data from the health services managers was obtained using semi-structured
interviews conducted with 21 managers who agreed to participate. It cannot be
assumed that their ideas about performance of health workers are essentially
the same as those managers who were not interviewed.
The participants at both health facility and district level expressed expectations
that the study would result into the implementation of performance improvement
programmes to help enhance the quality of health services in the districts. The
researcher explained that no short-term benefits were likely but the research
might attract long-term benefits in terms of policy change. These expectations
might have influenced the way they responded to the questions.
Lastly, performance management framework suggested in Table 6.1 has not
been tested empirically and remains suggestions and proposals until tested.
Notwithstanding the limitations, the study findings are reliable, valid and trustworthy.
The use of quantitative and qualitative data collection and analysis methods and the
different levels of data collection increased the validity, reliability and
trustworthiness of the study results.

304
6.6 RECOMMENDATIONS
Based on the study findings, the researcher would like to make the
recommendations for improving the performance of health workers in the
decentralised services. The researcher also recommends areas for further
research.
6.6.1 Recommendations for addressing the factors that hinder the performance of health workers
The district health service managers should ensure that all health workers
including the low cadre staff are knowledgeable about the mission and
objectives of the health sector towards which they are expected to contribute.
Although the ministry of health has good health policies, the implementation of
these policies should be done in a phased manner and if there are any policy
changes they should be communicated clearly to the health workers and their
managers at the district and health facility levels on a timely basis.
The local political leadership should be partners in the delivery of health services
instead of being antagonists. If there is good collaboration between the leaders
and the health workers, there is a likelihood in the improvement of health service
delivery at all levels since they will be planning and implementing activities in
unison.
There is a need for the ministry of health and the DHOs to ensure that the drug
supply chain is consistently maintained. Proper quantification of drug
requirements should be done in order to avoid health facilities running out of
stocks of essential drugs. In addition, the ministry has to ensure that medical
equipment are provided to all health facilities and the health workers are trained
in preventive maintenance of these equipment.
The ministry of health in collaboration with the ministry of public services should
look into the possibility of improving the remuneration of health workers as one

305
way of improving their performance. This will ensure better attraction, retention
and productivity of these workers. At the same time incentives should be put
forward for health workers in hard-to-reach areas. Without these incentives or
hardship allowances it will be very difficult to attract and retain health workers in
some districts. For the health workers who work overtime, there should be a
compensation mechanism developed to reward them for the extra time they
devote to their work. This will improve their performance and that of the health
sector.
There is a need for the local governments to provide accommodation for health
workers at the health facilities. This will reduce late coming, absenteeism and
the general poor time management which is experienced in the health facilities.
The DSCs should advertise and recruit health workers to improve on the staffing
levels within the districts and particularly in the health facilities. This will help to
reduce on the workload that is currently experienced by the few health workers
currently on the ground.
The district should ensure that short courses are organised for health workers in
communication skills. This will ensure that health workers are competent in
communicating to their clients, leaders and among themselves. With good
communication skills health workers are likely to perform better. The ministries
of health and education should also incorporate communication skills training
into the health training curriculum for all cadres in the sector.
The management of HRH should be centralised so that all the control including
recruitment, distribution and transfers are handled by the central government
instead of the district local governments. This will reduce on the levels of political
influence and nepotism that are being experienced in the current dispensation.

306
6.6.2 Recommendations for addressing the current practices for managing performance of health workers
In addition to the recommendations in Table 6.1, the researcher would like to
recommend the following:
The district health systems should use the formal appraisal system that has
been put forward by the ministry of public service. The performance
management guidelines should be adhered to and followed as stipulated. The
quarterly performance reviews should also be enforced as one way to improve
the performance of the health workers.
The ministries of health and public services should include quantified indicators
into the performance appraisal forms to enable the managers to measure
performance of health workers objectively.
There is a need for the health managers to understand the importance of the
pre-appraisal meeting and the target setting exercise. Without understanding the
importance of this it will be impossible for the stakeholders to improve
performance of health workers.
There is a need to orient health services managers and the workers to the
process of performance management since its knowledge and application
seems to be limited not only to the health workers to be assessed but also to the
managers themselves.
The health services managers should provide feedback to their supervisees
whenever necessary, both verbally and in writing. The feedback must be
constructive and preferably from more than one sources of information. This
feedback should be given individually to each health workers supervised.
The district health systems and local governments should put in place some
mechanisms of rewarding and recognising good performance. This should be
based on clear criteria agreed upon between the district managers and
representatives of the health workers. In case one is rewarded or recognised by

307
going for further training this should be done objectively and on merit rather than
using nepotism as a basis for rewards and recognition.
The results of performance management should be used for performance
improvement rather than for punishment. The use of performance appraisal
results should be towards improving health service delivery and health workers
should be given opportunity to suggest ways to improve their performance.
The district and health sub-district managers should conduct regular support
supervision at least once every quarter to ensure that their workers are
performing based on the standards set by the ministry of health. Therefore, the
district officials should provide transport facilities to enable this support
supervision to be carried out effectively and in a more integrated manner.
The government of Uganda should explore the possibility of introducing
performance based remuneration system as a way to enhance performance of
its workforce.
6.6.3 Recommendations for further research
Based on the results of this study, the researcher recommends the following
potential areas for further research:
Qualitative research should be carried out among health workers to obtain more
in-depth information about the factors that enhance their performance in
Uganda. This should be carried out in all the regions of the country and among
all categories of health workers.
Research should be carried out to investigate the effectiveness of the current
performance appraisal forms from the ministry of public service in measuring
performance of health workers.
Investigative research should be conducted to find out why Uganda usually
develops good policies for the health sector but usually fails to implement
whereas when the same policies are adapted by the neighbouring countries they
succeed.

308
Exploration of the views of health workers on performance based remuneration
systems as a vehicle for improving performance in the health sector.
Research should be carried out to investigate the causes and consequences of
the communication challenges experienced by health workers and what
strategies should be put in place to address them effectively.
Research should be conducted to establish the effects of feedback given to the
health workers by their managers on changes in the behaviours for performance
within the health sector.
6.7 CONTRIBUTION OF THE STUDY
Theoretically this study falls into the present focus of the Kampala declaration of
HRH. This declaration calls upon „leaders of bilateral and multilateral development
partners to provide coordinated and coherent support to formulate and implement
comprehensive country health workforce strategies and plans‟ (Global Health
Workforce Alliance 2008:1).
The findings of this study have provided more understanding and awareness about
the factors that may facilitate or hinder the performance of health workers. The
study has also produced some evidence on how performance management is
implemented in the health sector in Uganda and the challenges that need to be
addressed in order to have an efficient decentralised health system. It is, therefore,
envisaged that this study has contributed to the existing body of knowledge on
HRH by generating greater awareness among the stakeholders in the health sector
on having proper strategies for performance and performance management. These
would serve as means for organisational effectiveness in achieving the health
related millennium development goals (MDGs) by 2015.

309
Lastly, as a result of the findings of this study the researcher has developed and
proposed a performance management framework that can be applied to the health
sector in Uganda. If this performance management framework is operationalised, it
is hoped that it will greatly assist in the improvement of the performance of health
workforce in the decentralised services not only in Uganda but also in other limited
resource countries in Africa and elsewhere in the world.
6.7.1 Implications of the study
The findings of this study have implications to all the stakeholders involved in the
management of the HRH at national, district and health facility levels. The ministries
of health, local governments and public service as well as the bilateral and
multilateral partners need to discuss the issues and recommendations raised by this
study. If this is done it is hoped that key issues that are brought forward by this
study will be used as a basis for improving the performance of health workers in the
decentralised services, which will in turn improve the outputs related to the third
Uganda national health sector strategic plan (HSSP III).
6.8 CONCLUDING REMARKS
The aim of this study was to investigate the performance of health workers in the
decentralised services with a view of developing a management framework that
may be used to improve performance in the health sector. Indeed the objectives of
this study have been achieved. It has been established that the inadequate
performance of health workers is generally due to organisational or health systems
related factors rather than individual factors. The health workers are skilled,
competent and most of them have a positive attitudes and behaviours towards the
patients and clients.

310
Although there is a performance management system developed by ministry of
public service the study uncovered a number of loop holes in its implementation. In
many instances no target setting is done and no planning for performance
management is done in the districts. At the same time, the indicators for measuring
performance are not clearly defined to the individuals to be assessed and to the
managers themselves. The schedule for performance appraisal is not always
adhered to as stipulated by the ministry of public service. The career progression is
limited and staff training and development seems to be lacking in most districts. The
performance feedback mechanisms seem not to be functioning as well as expected
at all levels of service delivery.
Despite the political interference and to some extent the nepotism that is practiced
in recruitment, posting and nominations of candidates for further training and in the
overall management of management of the health services at district level, the
health workers are committed to their work and are willing to put in more effort to
improve the health status of the people of Uganda.
The researcher is of the opinion that the performance management framework that
has resulted from the findings of this study be implemented both as short term and
long-term strategy for improving the performance of health workers and overall
improvement of the results from the health sectors will be realised.
Scholars in organisational behaviour and human resource management (Zhang,
Song, Hackett & Bycio 2006:280) have said that...
“Performance improvement follows alignment of perceived and actual capabilities, matching authority with resources, and implementation of work strategies that strengthen connections between efforts, performance results, personal rewards, and overall organisational well being”.

311
BIBLIOGRAPHY
Adair, CE, Simpson, E, Casebeer, AL, Birdsell, JM, Hayden, KA, & Lewis, S. 2006.
Performance measurement in health care: part I-concepts and trends from a state
of the science review. Healthcare Policy, 1(4):85-104.
Adams, SM. 2005. Positive affect and feedback-giving behaviour. Journal of
Management Psychology, 20(1):24-25.
Aguinis, H & Pierce, CA. 2008. Enhancing the relevance of organisational behaviour
by embracing performance management research. Journal of Organisational
Behaviour, 29:139-145.
Aguinis, H. 2009. Performance management. 2nd edition. Upper Saddle River, NJ:
Prentice Hall.
Ahmad, S & Schroeder, RG. 2003. The impact of human resource management
practices on operational performance: recognising country and industry differences.
Journal of Operations Management, 21(1):19-43.
Aldana, JM, Piechulek, H & Al-Sabir, A. 2001. Client satisfaction and quality of
health care in rural Bangladesh. Bulletin of the World Health Organization,
79(6):512-517.
American Correctional Academy (ACA). 2010. Performance-based standards for
correctional health care explained. Available online from:
http://www.aca.org/adaview.asp?pageid=590 (Accessed on 4th January 2010).
Amin, ME. 2005. Social science research: conception, methodology and analysis.
Kampala: Makerere University Press.

312
Ammassari, DS. 2005. Migration and development: new strategic outlook and
practical ways forward. IOM Research Series, No. 21.
Anyangwe, SCE. & Mtonga, C. 2007. Inequalities in the global health workforce: the
greatest impediment to health in sub-Saharan Africa. International Journal of
Environmental Research and Public Health, 4(2):93-100.
Arah, OA, Klazinga, NS, Delnoij, DMJ, Ten-Asbroek, AHA & Custers, T. 2003.
Conceptual frameworks for health systems performance: a quest for effectiveness,
quality, and improvement. International Journal for Quality in Health Care,
15(5):377-398.
Armstrong, M. 2009. Armstrong‟s handbook of human resources management
practice. 11th edition. London and Philadelphia: Kogan Page.
Arrowsmith, J, French, S, Gilman, M & Richardson, R. 2001. Performance-related
pay in healthcare. Journal of Health Services and Research Policy, 6:114-119.
Auditor General Uganda. 2006. Value for money audit report on the management of
health programmes in the health sector Ministry of Health. Kampala: Government of
Uganda.
Awases, MH. 2006. Factors affecting performance of professional nurses in
Namibia. Doctor of Literature and Philosophy thesis. University of South Africa,
Pretoria.
Awio, G & Northcott, D. 2001. Decentralisation and budgeting: the Uganda health
sector experience. International Journal of Public Sector management, 14(1):75-78.

313
Awofeso, N, Schelokova, I & Dalhatu, A. 2008. Training of front-line health workers
for tuberculosis control: lessons from Nigeria and Kyrgyzstan. Human Resources
for Health, 6(20):[1-9]. http://www.human-resources-health.com/content/2/1/20
(Accessed on 13th October 2010).
Awofeso, N. 2010. Improving health workforce recruitment and retention in rural and
remote regions of Nigeria. Rural and Remote Health (Online), 10:1319. Available
from: http://www.rrh.org.au (Accessed on 4th October.2010).
Babbie, E. 2001. The practice of social research. 9th edition. Wordsworth:
Thompson Learning.
Bach, S. 2001. HR and new approaches to public sector management: improving
HRM capacity. Geneva: WHO. Available from:
http://www.who.int/hrh/en/improvinghrmcapacity.pdf (Accessed on 10th October
2009).
Baines, TS, Asch, R, Hadfield, L, Mason, JP, Fletcher, S & Kay, JM. 2005. Towards
a theoretical framework for human performance modelling within manufacturing
systems design. Simulation Modelling Practice and Theory, 13: 486–504.
Bankauskaite, V & Dargent, G. 2007. Health systems performance indicators:
methodological issues. Presupuesto y Gasto Público, 49:125-137.
Barrick, MR, Park, L, Mount, MK. 2005. Self-monitoring as a mediator of the
relationships between personality traits and performance. Personnel Psychology,
58: 745-767.

314
Bernardin, HJ, Hagan, CM, Kane, JS & Villanova, P. 1998. Effective performance
management: a focus on precision customer and situational constraints. In
Performance appraisal: state of art in practice. Edited by JS, Smither. San
Francisco: Jossey-Bass.
Berry, LL & Bendapudi, N. 2007. Health care: a fertile field for service research.
Journal of Service Research, 10 (2):111-22.
Bhat, R. 1996. Regulating the private health care sector: the case of the Indian
consumer protection act. Health Policy and Planning, 11:265–279.
Bless, C & Higson-Smith, C. 1995. Fundamentals of social research methods: an
African perspective. 2nd edition. Cape Town: Juta &Co.
Blumenthal, D. 2002. Doctors in a wired world: can professionalism survive
connectivity? The Milbank Quarterly, 80:525-546.
Bossert TJ. 2000. Module on decentralisation of health systems: sharing resources
and responsibilities. Harvard School of Public Health: International Health Systems
Group.
Bossert, TJ & Beauvais, JC. 2002. Decentralisation of health system in Ghana,
Zambia, Uganda and the Philippines: a comparative analysis of decision space.
Health Policy and Planning, 17(1):14-31.
Bossyns, P & Van Lerberghe, W. 2004. The weakest link: competence and prestige
as a constraint to referral by isolated nurses in rural Niger. Human Resource for
Health, 2(1):[1-8]. http://www.human-resources-health.com/content/2/1/1 (Accessed
on 21st July 2009).

315
Boyce, NW. 2002. Potential pitfalls of healthcare performance indicators. The
Medical Journal of Australia, 177(5):229-230. Available online from:
http://www.mja.com.au/public/issues/177_05_020902/boy10347_fm.html (Accessed
on 4th April 2010).
Boyne, GA & Walker, RM. 2005. Introducing the determinants of performance in
public organisations symposium. Journal of Public Administration Research and
Theory, 15:483–488.
Bradley, EH, Curry, LA & Devers, K. 2007. Qualitative data analysis for health
services research: developing taxonomy, themes, and theory. Health Service
Research, 42(4):1758-1772.
Bradley, S & McAuliffe, E. 2009. Mid-level providers in emergency obstetric and
newborn healthcare: factors affecting their performance and retention with the
Malawian health system. Human Resources for Health, 7(14):[1-8].
http://www.human-resources-health.com/content/7/1/14 (Accessed 4th November
2009).
Brimberry, R. 1988. Vaccination of high-risk patients for influenza: a comparison of
telephone and mail reminder methods. Journal of Family Practice, 26:397-400.
Brinkerhoff, RO. 2006. Increasing impact of training investments: an evaluation
strategy for building organisational learning capability. Industrial and Commercial
Training, 38(6): 302-307.
Brown, DR, & Harvey, D. 2006. An experiential approach to organisational
development. 7th edition. Upper Saddle River, NJ: Pearson Education.

316
Bryant, M. 1999. Planning for and within decentralised health systems. In Myths and
realities about the decentralisation of Health Systems. Edited by R-L, Kolehmainen-
Aitken. Boston, MA: Management Science for Health: 11-26.
Buchan, J & Hinton, L. 2005. Skill mix and new roles in the roles in health: what
does the evidence base tell us? Background paper for the World Health Report
2006. Geneva: WHO.
Buchan, J. 2004. What difference does (“good”) HRM make? Human Resources for
Health, 2(6):[1-7]. http://www.human-resources-health.com/content/2/1/6 (Accessed
on 4th November 2009).
Buchan, J. 2005. Scaling up health and education workers: increasing the
productivity of an existing “stock” of health workers. Literature review for DFID.
London: Department for International Development.
Burns, N & Grove, SK. 2007. Understanding Nursing Research. 4th edition.
Philadelphia: WB Saunders.
Cannon, P & Fry, T. 1992. Performance measurement in the public sector. LATPS
Occasional Paper Series, No. 8. London: National Accounting Office, Public Sector
Management Division.
Center for Global Development. 2000. New data on African health professionals
abroad. Available from: http://www.cgdev.org/doc/Data/Africa_health_emigration.xls
(Accessed on 9th September 2010).
Chen, LC, Evans, T, Anand, S, Boufford, J, Brown, H, Chowdhury, M, Cueto, M,
Dare, L, Dussault, G & Elzinga, G. 2004. Human resources for health: overcoming
the crisis. The Lancet, 364:1984-1990.

317
Chirdan, OO, Akosu, JT, Ejembi, CL, Bassi, AP, & Zoakah, AI. 2009. Perceptions of
working conditions amongst health workers in state-owned facilities in notheastern
Nigeria. Annals of African Medicine, 8(4):243-249.
Chopra, M, Munro, S, Lavis, JN, Vist, G & Bennett, S. 2008. Effects of policy
options for human resources for health: an analysis of systematic reviews. The
Lancet, 371(9613):668-674.
Cicciò,L, Makumbi, M, & Sera, D. 2010. An evaluation study on the relevance and
effectiveness of training activities in Northern Uganda. Rural and Remote Health
(online), 10:1250. Available from: http://www.rrh.org.au (Accessed on 1st August
2010).
Clemens, MA & Pettersson, G. 2008. New data on African health professionals
abroad. Human Resources for Health, 6(1):[1-11]. http://www.human-resources-
health.com/content/6/1/1 (Accessed on 4th November 2009).
Cook, TJ, Vansant, J, Stewart, L & Adrian, J. 1995. Performance measurement:
lessons learnt for development management. World Development, 23(8):1303-
1315.
Creswell, JW & Plano-Clark, VL. 2007. Designing and conducting mixed methods
research. Thousand Oaks, CA: Sage.
Creswell, JW, Plano-Clark, VL, & Garrett, AL. 2008. Methodological issues in
conducting mixed methods research design. In Advances in mixed methods:
theories and practices. Edited by MM, Bergman. Thousands Oak, CA: Sage.
Crush, J. 2005. The brain drain from Zimbabwe. Migration Policy Series 29. Ontario,
Canada: Southern African Migration Project.

318
Dal Poz, MR, Kinfu, Y, Dräger, S & Kunjumen, T. 2006. Counting health workers:
definitions, data, methods and global results. Geneva: WHO.
Daniel, K & Darby, D. 1997. Factors that influence nurses‟ customer orientation.
Journal of Nursing Management, 7(5):271-81.
Davis, DA, O‟Brien, MA, Freemantle, N, Wolf, FM, Mazmanian, P & Tylor-Vaisey, A.
1999. Impact of formal continuing medical education activities change physician
behaviour or health care outcomes. JAMA, 282:867- 874.
Davis, DA, Thomson, MA, Oxman, AD & Haynes, RB. 1995. Changing Physician
performance: a systematic review of the effect of continuing medical education
strategies. JAMA, 274:700-705.
de Savigny, D, Kasale, H, Mbuya, C & Reid, G. 2004. Fixing health systems.
Ottawa: International Development Research Centre.
De Vos, AS, Strydom, H, Fouche, CB & Delport, CSL. 2005. Research at grass
roots for the social sciences and human services professions. 3rd edition. Pretoria:
Van Schaik.
De Waal, AA. 2003. The future of the balanced scorecard: an interview with
Professor Robert S. Kaplan. Measuring Business Success, 7(1):30-35.
Department for International Development (DFID). 2006. Health workers‟ role in
responding to the needs of the poor. Briefing: A DFID Practice Paper, January.
Department of Industrial Relations, Public Sector & Employee Relations
(DIRPSER). 2005. The focus on people: performance management in the
Queensland public sector. Queensland: Office of Public Service.

319
Diallo, K, Zurn, P, Gupta, N & Dal Poz, M. 2003. Monitoring and evaluation of
human resources for health: an international perspective. Human Resources for
Health,1(3):[1-13].http://www.human-resources-health.com/content/1/1/3 (Accessed
28th July 2009).
Diamond, J. 2005. Establishing a performance management framework for
government. Washington: International Monetary Fund.
Diaz-Monsalve, SJ. 2003. Measuring the job performance of district health
managers in Latin America. Annals of Tropical Medicine and Parasitology, 97:299–
311.
Dieleman, M & Harnmeijer, JW. 2006. Improving health worker performance: in
search of promising practices. Geneva: World Health Organization.
Dieleman, M, Cuong, PV, Anh, LV & Martineau, T. 2003. Identifying factors for job
motivation of rural health workers in North Vietnam. Human Resources for Health,
1(10): [1-10]. http://www.human-resources-health.com/content/1/1/10 (Accessed on
5th May 2009).
Dieleman, M, Gerretsen, B & van der Wilt, GJ. 2009. Human resources
management interventions to improve health workers‟ performance in low and
middle income countries: a realist review. Health Research Policy and Systems,
7(7):[1-13]. http://www.health-policy-systems.com/content/7/1/7 (Accessed on 2nd
January 2010).
Dieleman, M, Toonen, J, Toure, H & Martineau, T. 2006. The Match between
motivation and performance management of health sector workers in Mali.
Human Resources for Health 4(2):[1-7]. http://www.human-resources-
health.com/content/4/1/2 (Accessed on 4th November 2009).

320
Dolea, C & Zurn, P. 2004. Mission to evaluate the project of clinical professional
development and management system (CPDMS) for nurses and midwives in
hospitals and health centres in Indonesia. Geneva: WHO.
Dovlo, D & Martineau, T. 2004. A review of the Migration of Africa‟s Health
Professionals. JLI Working Paper 4-4: Cambridge: Global Health Trust.
Dovlo, D, Sagoe, K, Ntow, S & Wellington, E. 1998. Ghana case study: staff
performance management in reforming health systems. Available from:
http://www.liv.ac.uk/lstm/research/documents/ghana.pdf (Accessed on 28th July
2009).
Dussault, G. 2006. Improving the performance of the health workforce: from
advocacy to action. 47th Directive Council, 27th September. PAHO/WHO.
Edward, A, Dwivedi, V, Mustafa, L, Hansen, PM, Peters, DH & Burnham, G. 2009.
Trends in the quality of health care for children aged less than 5 years in
Afghanistan, 2004-2006. Bulletin of World Health Organization, 87:940-949.
Egger, D, Travis, P, Dovlo, D & Hawken, L. 2005. Strengthening management in
low-income countries. Geneva: WHO.
El-Jardali, F, Jamal, D, Abdallah, A & Kassak, K. 2007. Human resources for health
planning and management in the Eastern Mediterranean region: facts, gaps and
forward thinking for research and policy. Human Resources for Health, 5(9):[1-12].
http://www.human-resources-health.com/content/5/1/9 (Accessed on 4th November
2009).

321
Esmail, LC, Cohen-Kohler, JC & Djibuti, M. 2007. Human resources management in
the Georgian national immunisation program: a baseline assessment. Human
Resources for Health, 5(20):[1-10]. http://www.human-resources-
health.com/content/5/1/20 (Accessed on 4th November 2009).
Fanaka Kwa Wote. 2008. Uganda Health Sector: an overview. Policy Paper: Health
sector financing in Uganda. Fanaka Kwa Wote Newsletters, 1(1):1-6. Available
from: www.kwawote.org (Accessed on 5th May 2009).
Fauveau, V, Sherratt, DR, & de Bernis, L. 2008: Human Resources for maternal
health: multi-purpose or specialist? Human Resources for Health, 6(21):[1-15].
http://www.human-resources-health.com/content/6/1/21 (Accessed 1st June 2010).
Ferlie, EB & Shortell, SM. 2001. Improving the quality of health care. The Milbank
Quarterly 79:281-315.
Ferrinho, P, Omar, MC, de jesus Fernandes, M, Blaise, P, Bugalho, AM, & Van
Lerberghe, W. 2004. Pilfering for survival: how health workers use access to drugs
as a coping strategy. Human Resources for Health, 2(4):[1-6]. http://www.human-
resources-health.com/content/2/1/4 (Accessed 7th December 2009).
Finnigan, RP. 2005. Retention culture, if you build it they will stay. Paper presented
at the 57th
Annual Conference and Exposition of the Society for Human Resource
Management (SHRM), 19-22 June. San Diego, CA.
Flores, R, Robles, J & Burkhalter, BR. 2002. Distance education with tutoring
improves diarrhoea case management in Guatemala. International Journal of
Quality in Health Care, 14 (Supplementary 1):47-56.

322
Forcheh, N & Fako, TT. 2007. Determinants of effective productivity among service
workers: the case of nurses in Botswana. African Journal of Business Management,
1(5):99-106.
Fort, AL & Voltero, L. 2004. Factors affecting the performance of maternal health
care providers in Armenia. Human Resources for Health, 2(8):[1-11].
http://www.human-resources-health.com/content/2/1/8 (Accessed on 30th June
2009).
Franco, LM, Bennett, S & Kanfer, R. 2002. Health sector reforms and public sector
health worker motivation: a conceptual framework. Social Science and Medicine,
54:1255-1266.
Freedman, LP. 2005. Achieving the MDGs: health systems as core social
institutions. Development, 45(1):19-24.
Fritzen, SA. 2007. Strategic management of the health workforce in developing
countries: what have we learned? Human Resources for Health, 5(4):[1-9]
http://www.human-resources-health.com/content/5/1/4 (Accessed on 10th March
2009).
Gambin, L, Green, AE, & Hogarth, T. 2009. Exploring the links between skills and
productivity: final Report. Coventry: Warwick Institute for employment research
(IER): 52.
Garcia, P, Hughes, J, Carcamo, C & Holmes, KK. 2003. Training pharmacy workers
in recognition, management, and prevention of STDs: district-randomised controlled
trail. Bulletin of World Health Organization, 81:806-814.

323
Garcia-Prado, A & Chawla, M. 2006. The impact of hospital management reforms
on absenteeism in Costa Rica. Health Policy and Planning, 21(2):91-100.
George, A. 2002. Accountability in health services: transforming relationships and
contexts. Working Paper Series, 13:1. Cambridge, MA: Harvard Centre for
Population and Development Studies.
George, D & Mallery, P. 2003. SPSS for Windows step by step: a simple guide and
reference. 11.0 update. 4th edition. Boston: Allyn & Bacon.
Ghosh, S & Mukherjee, S. 2006. Measurement of corporate performance through
balanced scorecard: an overview. Vidyasagar University Journal of Commerce,
11:60-70.
Giles, W & Mossholder, K. 1990. Employee reactions to contextual and session
components of performance appraisal. Journal of Applied Psychology, 75:371-377.
Global Health Workforce Alliance. 2008. Health workers for all and all for health
workers: the Kampala declaration and agenda for global action. First global forum
on human resources for health 2-7th March 2008: Kampala: Uganda. Available
online from: http://www.who.int/workforcealliance/forum/2_declaration_final.pdf
(Accessed on 20th November 2010).
Golafshani, N. 2003. Understanding reliability and validity in qualitative research.
The Qualitative Report, 8(4):597-607.
Goulding, A & Harrison, K. 1997. Performance appraisal in public libraries. New
Library World, 98: 275-280.
Griffin, MA, Neal, A & Parker, SK. 2007. A new model of work role performance:
positive behaviour in uncertain and interdependent contexts. Academy of
Management Journal, 50(2):327-347.

324
Grobler, P, Wärnich, S, Carrell, MR, Elbert, NF & Hatfield RD. 2006. Human
Resource Management in South Africa. 3rd edition. London: Thomson.
GTZ. 2009. Report on study on performance appraisal system in the Health Sector
in Malawi. Lilongwe, Malawi: GTZ. Available online from:
http://www.mghp.net/wp/content/2009/11/Performance%20Appraisal%Study%20GT
Z%202009.doc (Accessed on 3rd October 2010).
Guanais, FC & Macinko, J. 2009. The health effects of decentralising primary
health care in Brazil: when ambulatory care facilities are turned over to local control,
a locality‟s infant mortality rate appears to improve. Health Affairs, 28(4):1127-1135.
Hackman, JR & Oldman, GR. 1976. Motivation through the design of work: test of a
theory. Organizational Behaviour and Human Performance, 16(2): 250-79.
Hagopian A. 2006. Health Workers‟ flight form sub-Saharan Africa: Patterns,
Implications ans mitigating strategies. University of Washington, Seattle: Human
Resource and Services Administration.
Hagopian, A, Zuyderduin, A, Kyobutungi, N, & Yumkella, F. 2009. Job satisfaction
and morale in the Ugandan health workforce. Health Affairs, 28(5):w863-w875.
Hagopian, A. 2007. Uganda Health Workforce study: Satisfaction and intent to stay
among current Health Workers. Chapel Hill, NC: The Capacity Project and US
Health Resources and Services Administration.
Halachmi, A. 2002. Performance measurement: a look at some possible
dysfunction. Work Study, 51(5):230-239.

325
Hanson, WE, Plano-Clark, VL, Petska, KS, Creswell, JW & Creswell, JD. 2005.
Mixed methods research design in counselling psychology. Journal of Counselling
Psychology, 52(2): 224-235.
Hanson, WE, Plano-Clark, VL, Petska, KS, Creswell, JW & Creswell, JD. 2005.
Mixed methods research design in counselling psychology. Journal of Counselling
Psychology, 52(2): 224-235.
Harris, JM, Kutob, RM, Suprenant, ZJ, Maiuro, RD & Delate, TA. 2002. Can
Internet-based education improve physicians‟ confidence in dealing with domestic
violence? Family Medicine, 34:287-292.
Hartline, MD, Maxham, JG & McKee, DO. 2000. Corridors of influence in the
dissemination of customer-oriented strategy to customer contact service
employees”, Journal of Marketing, 64:35-50.
Hausmann-Muela, S, Ribera, JM, & Nyamongo, I. 2003. Health- seeking behaviour
and health system response. DCPP Working Paper No. 14. Available from:
http://www.dcp2.org/file/29/wp14.pdf (Accessed on 30th July 2010).
Heizer, J & Render, B. 2008. Operations Management. 9th edition. New Jersey:
Prentice Hall.
High-Level Forum on the Health Millennium Development Goals. 2004. Health
workforce challenges: lessons from country experiences. Abuja. Available from:
http://www.hlfhealthmdgs.org/Documents/HealthWorkforceChallengesFinal.pdf
(Accessed on 22nd August 2009).
Hinkle, DE, Wiersma, W & Jurs, SG. 1998. Applied statistics for behavioural
sciences. Boston, MA: Houghton Mifflin Company.

326
Holcomb, J. 2006. The annual performance evaluation: necessary evil or golden
opportunity? [Review of the book How to Make Performance Evaluations Really
Work: A Step by Step Guide Complete with Sample Words, Phrases, Forms and
Pitfalls to Avoid]. Law Library Journal, 98: 569-574.
Hopkinson, B, Balabanova, D, McKee, M & Kutzin, J. 2004. The human perspective
of health-care reform: coping with diabetes in Kyrgyzstan. International Journal of
Health Planning and Policy, 65:43-61.
Hornby, AS. 2005. Oxford advanced learner‟s dictionary of current English.
International students, 7th edition. Oxford: Oxford University Press.
Hornby, P & Forte, P. 2002. Guidelines for introducing human resource indicators to
monitor health service performance. Keele: Keele University Centre for Health
Planning and Management.
Hotchkiss, DR, Aqil, A, Lippeveld, T, & Mukooyo, E. 2010. Evaluation of the
performance of routine information management (PRISM) framework: evidence
from Uganda. BMC Health Service Research, 10(188):[1-17].
http://www.biomedcentral.com/1472-6963/10/188 (Accessed on 26th December
2010).
Huang, L, Chen, L, Tsai, HC, & Lin, CJ. 2006. Development of an Instrument for
assessing factors related to nurses‟ organisation commitment. Mid Taiwan Journal
of Medicine, 11: 9-19.
Huicho, L, Dieleman, M, Campbell, J, Codjia, L, Balabanova, D, Dussault, G &
Dolea, C. 2010. Increasing access to health workers in underserved areas: a
conceptual framework for measuring results. Bulletin of World Health Organization,
88:357-363.

327
Initiatives, Quality Health Partners & The Ghana Health Service. 2005. Performance
Appraisal Evaluation: Report of Findings and Recommendations. Accra, Ghana:
Quality Health Partners. Available online from: http://www.ghanaqhp.org (Accessed
on 3rd October 2010).
Isaac, J. 2001. Performance-related pay: the importance of fairness. Journal of
industrial Relations, 43:111-123.
Iyengar, K & Iyengar SD. 2009. Emergency obstetric care and referral: experience
of two midwife-led health centres in rural Rajasthan, India. Reproductive Health
Matter, 17(33):9-20.
Jeppsson, A & Okuonzi, SA. 2000. Vertical or holistic decentralisation of the health
sector? Experiences from Zambia and Uganda. International Journal of Health
Planning and Management, 15: 273-289.
Jeppsson, A. 2004. Decentralisation and national health policy implementation in
Uganda: a problematic process. Malmö, Lund: Media-Tryck.
Joint Learning Initiative (JLI). 2004. Human resources for health: overcoming the
crisis. Cambridge: Global Equity Initiative/Harvard University Press. Available from:
http://www.globalhealthtrust.org/report/ (Accessed on 5th March 2009).
Joubert, E, Du Rand, A, & Van Wyk, N. 2005. Verbal abuse of nurses by physicians
in a private sector setting. Curationis, 28(3):39-46.
Kahya, E. 2007. The effects of job characteristic and working conditions on
performance. International Journal of Industrial Ergonomics, 37:515-523.
Kahya, E. 2009. The effects of job performance on effectiveness. International Journal
of Industrial Ergonomics, 39:96-104.

328
Kaplan, RS, & Norton, DP. 1992. The balance scorecard: measures that drive
performance. Harvard Business Review, 70(1): 71-79.
Katz, MJ & Green, E. 1997. Managing quality: a guide to system-wide performance
management in healthcare. 2nd edition. St Louis: Mosby.
Kavuma, RM. 2009. Uganda‟s health care system explained. The Guardian News
and Media Limited, Wednesday 1st April 2009. Available online from:
http://www.guardian.co.uk (Accessed on 27th July 2009).
Kaye, DK, Mwanika, A, & Sewankambo, N. 2010. Influence of the training
experience of Makerere University medical and nursing graduates on willingness
and competence to work in rural health facilities. Rural and Remote Health, 10
[Online]:1372. Available from: http://www.rrh.org.au (Accessed on 13.7.2010).
Kelly, P. 2001. Local problems, local solutions: improving tuberculosis control at
district level in Malawi. Bulletin of the World Health Organization, 79:111-117.
Khaleghian, P & Das Gupta, M. 2005. Public management and essential public
health functions. World Development, 33(7): 1083-1099.
Khowaja, K, Merchant, RJ. & Hirani, D. 2005. Registered Nurses Perceptions of
Work Satisfaction at tertiary care University Hospital. Journal of Nursing
Management, 13(1):32-39.
Kisubi, M. 1996. The process of decentralisation. In Post-Conflict Uganda: towards
an effective civil service. Edited by P, Langseth & J, Mujaju. Kampala: Fountain
Publishers.

329
Klein, H, Snell, S & Wexley, K. 1987. A system model of the performance appraisal
interview process. Industrial Relations, 26:267-280.
Kleynhans, R, Markham, L, Meyer, W, Van Aswegen, S & Pilbean, E. 2007. Human
resource management: a fresh perspective. Cape Town: Pearson Education South
Africa.
Kolehmainen-Aitken, R-L. 2004. Decentralisation‟s impact on health workforce:
perspective of managers, workers and national leaders. Human Resources for
Health 2(5):[1-11]. http://www.human-resources-health.com/content/2/1/5
(Accessed 9th April 2009).
Kolehmainen-Aitken, R-L.1999. Human Resources Development under
Decentralisation. In Myths and realities about the decentralisation of Health
Systems. Edited by R-L, Kolehmainen-Aitken. Boston, MA: Management Sciences
for Health: 39-64.
Kotler, P & Keller, KL. 2006. Marketing Management. 12th edition. Upper Saddle,
NJ: Prentice-Hall International.
Krejcie, RV & Morgan, DW. 1970. Determining Sample Size for Research Activities.
Educational and Psychological Measurement, 30:607-610.
Kristof-Brown, AL, Zimmerman, RD & Johnson. EC. 2005. Consequence of
individuals‟ fit at work: A meta-analysis of person-job, person organisation, person
group, and person-supervisor fit. Personnel Psychology, 58(2):281-342.

330
Krogstad, U, Hofoss, D, Veenstra, M, Hjortdahl, P. 2006. Predictors of job
satisfaction among doctors, nurses and auxiliaries in Norwegian hospitals:
relevance of micro unit culture. Human Resources for Health 4(3):[1-8].
http://www.human-resources-health.com/content/4/1/3 (Accessed 25th March
2009).
Kruger, DJ, De Vos, AS, Fouche, CB, & Venter, L. 2005. Quantitative data analysis
and interpretation. In Research at grassroots: For social science and human service
professions. Edited by AS, De Vos, H, Strydom, CB, Fouche & CSL, Delport. 3rd
edition. Pretoria: Van Schaik: 217-244.
Kruk, ME & Freedman, LP. 2008. Assessing health systems performance in
developing countries: a review of literature. Health Policy, 85(3): 263-276.
Kurowski, C, Wyss, K, Abdulla, S & Mills, A. 2007. Scaling up priority health
interventions in Tanzania: the human resource challenge. Health Policy and
Planning, 22:113-127.
Kyaddondo, D & Whyte, SR. 2003. Working in a decentralised system: a threat to
health workers‟ respect and survival in Uganda. International Journal of Planning
and management, 18(4):329-342.
Landrum, LB & Baker, SL. 2004. Managing complex systems: performance
management in public health. International Journal of Public Health Management
Practice, 10(1):13-18.
Langdon, DG. 2000. Aligning performance: improving people, systems, and
organisations. San Francisco: Jossey-Bass Pfeifer.

331
Lange, K. 2002. Mathematical and statistical methods for genetic analysis. 2nd
edition. New York: Springer-Verlag.
Langenbrunner, JC, Orosz, E, Kutzin, J & Wiley, MM. 2005. Purchasing and paying
providers. In Purchasing to improve health systems performance. Edited by J,
Figueras, R, Robinson & E, Jakubowski. Brussels: European Observatory on Health
Systems and Policies.
Lanjananda, P & Patterson, PG. 2009. Determinants of customer-oriented
behaviour in a health care context. Journal of Service Management, 20(1):5-32.
Larose, DT. 2006. Data mining methods and models; Hobeken, New Jersey: John
Wiley & Son Inc.
Lawler, E & McDermott, M. 2003. Current performance management practices.
World at Work Journal, 12(2):49-60.
Lephalala, RP. 2006. Factors Influencing Nursing Turnover in Selected Private
Hospitals in England. Master of Arts dissertation. University of South Africa,
Pretoria.
Lincoln, YS & Guba, EG. 1985. Naturalistic inquiry. Newbury Park, CA: Sage
Publication.
Lindelow, M, Serneels, P & Lemma, T. 2005. The performance of health workers in
Ethiopia: results from qualitative research. World Bank Policy Research Working
Paper No. 3558. Washington: World Bank.

332
Lipinge, SN, Hofnie, K, van der Westhuizen, L, & Pendukeni, M. 2006. Perceptions
of about conditions of service: a Namibian case study. EQUINET discussion paper
35. Harare: EQUINET.Available online from:
http://www.equinetafrica.org/bibl/docs/DIS35HRiipinge.pdf (Accessed on 9th
September 2010).
Lirri, E. 2008. Decentralisation blamed for poor health services. The Daily Monitor
Online, 29th October. Available from:
http://www.monitor.co.ug/artman/publish/regional-special/ (Accessed on 4th May
2009).
Liu, Y, Combs, JG, Ketchen (Jr), DJ & Ireland RD. 2007: The Value of human
resource management for organisational performance. Business Horizon, 50:503-
511.
Liu, X, Martineau, T, Chen, L, Zhan, S, & Tang, S. 2006. Does decentralization
improve human resource management in the health sector? A case study from
China. Social Science & Medicine 2006, 63:1836-1845.
London Institute of Health Management. 2004. Developing through partnerships-
continuous professional portfolio for healthcare managers. London: Institute of
Health Management.
Longenecker, C. 1987. Behind the mask: the politics of performance appraisal.
Academy of Management Executive, 1:183.
Lozan, R, Soliz, P, Gakidou, E, Abbott-Klafter, J, Feehan, DM, Vidal, C, Ortiz, JP, &
Murray CJL. 2006. Benchmarking of performance of Mexican states with effective
coverage. The Lancet, 368 (9548):1729-1741.

333
Luecke, R. 2006. Performance management: measure and improve the
performance of your employees. Harvard Business Essential Series. Boston:
Harvard University Press.
Lundstrom, T, Pugliese, G, Bartley, J, Cox, J & Guither, C. 2002. Organisational
and environmental factors that affect workers health and safety and patient
outcomes. American Journal of Infection Control, 30:93-106.
Macq, J & Van Lerberghe, W. 2000. Managing health services in developing
countries: moonlighting to serve the public? In Providing health care under adverse
conditions: health personnel performance and individual coping strategies. Edited
by P, Ferrinho & W, Van Lerberghe. Antwerp: ITG Press.
Manafa, O, McAuliffe, E, Maseko, F, Bowie, C, MacLachlan, M & Normand, C.
2009. Retention of health workers in Malawi: perspectives of health workers and
district management. Human Resources for Health, 7(65):[1-9]. http://www.human-
resources-health.com/content/7/1/65 (Accessed 4th June 2010).
Manongi, RN, Marchant, TC & Bygbjerg, IC. 2006. Improving motivation among
primary health care workers in Tanzania: a health worker perspective. Human
Resources for Health, 4(6):[1-7]. http://www.human-resources-
health.com/content/4/1/6 (Accessed 4th June 2010).
Manuwa-Olumide, A. 2009. Addressing the human resource challenges in primary
health care in Nigeria: evidence-based approaches for improving health workforce
performance. An invited paper presented on the 9th June at the National Health
Conference on Primary Health Care in Nigeria 30 years after Alma-Ata, in Uyo,
Akwa-Ibom State, Nigeria. Available from:
http://www.ngnhc.org/docs/NHC2009/papers/ (Accessed on 4th August 2010).

334
Marchant, T. 1999. Strategies for improving individual performance and job
satisfaction at Meadowvale health. Journal of Management Practice, 2(3):63-70.
Martinez, J. 2001. Assessing quality, outcome and performance management.
Proceeding of a workshop on global health workforce strategy, Annecy, France, 9th -
12th December 2000. Geneva: WHO.
Martinez, J. 2003. Assessing quality outcome of performance management. In
Towards a global health workforce strategy. Edited by P, Ferrinho & MR, Dal Poz.
Antwerp: ITG Press: 205-238.
Mathauer, I & Imhoff, I. 2006. Health worker motivation in Africa: the role of non-
financial incentives and human resources management tools. Human Resources for
Health, 4(24):[1-17]. http://www.human-resources-health.com/content/4/1/24
(Accessed 15th June 2009).
Matsiko, CW & Kiwanuka, J. 2003. A review of human resource for health in
Uganda. Health Policy and Development, 1(1):15-20.
Mayanja, R. 2005. Decentralised health care services delivery in selected districts in
Uganda. Master of Education Dissertation. University of the Western Cape.
Mbindyo, P, Gilson, L, Blaauw, D & English, E. 2009. Contextual influences of
health worker motivation in district hospitals in Kenya. Implementation Science,
4(43):[1-10]. http://www.implementationscience.com/content/4/1/43 (Accessed on
29th December 2010).
Mbindyo, PM, Blaauw, D, Gilson, L & English, M. 2009. Developing a tool to
measure health workers motivation in district hospitals in Kenya. Human Resources
for Health, 7(40):[1-11]. http://www.human-resources-health.com/content/7/1/40
(Accessed on 19th December 2010).

335
McConnell, CR. 2002. The effective healthcare supervisor. 5th edition. Sudbury MA:
Jones and Bartlett Publishers Inc.
McCrum-Gardner, E. 2008. Which is the correct statistical test to use? British
Journal of Oral Maxillofacial Surgery, 46:38-41.
McKeon, CM, Forgarty, GJ & Hegney, DG. 2006. Organizational factors: impact on
administration violations in rural nursing. Journal of Advanced Nursing, 55 (1): 115-
123.
McPake, B, Asiimwe, D, Mwesigye, F, Ofumbi, M, Ortenblad, L, Streefland, P &
Turinde, A. 1999. Informal economic activities of public health workers in Uganda:
implications for quality and accessibility of care. Social Science and Medicine, 49:
849–865.
Men, B, Grundy, J, Rasmey, LC, An, NS, Soeung, SC, Jenkinson, K, Boreland, M,
Maynard, J & Biggs, BA. 2005. Key issues relating to decentralisation at provincial
level of health management in Cambodia. International Journal of Health Planning
and Management, 20(1): 3-19.
Mercer, H & Dal Poz, M. 2002. Human resources for health: developing policy
options for change. Geneva: WHO.
Meurier, CE. 2000. Understanding the nature of errors in nursing: using a model to
analyse critical incident reports of errors which had resulted in an adverse or
potentially adverse event. Journal of Advanced Nursing 32: 202–207.
Miettinen, OS. 1999. Ideas and ideals of medicine: fruits of reason or props of
power. Journal of Evaluation Clinical Medicine, 5:107-116.

336
Mills, A. 1994. Decentralisation and Accountability in the Health Sector from an
International Perspective: what are the choices? Public Administration and
Development, 14:281-292.
Miner, KR, Childers, WK, Alperin, M, Cioffi, J & Hunt, N. 2005. The MACH model:
from competencies to instruction and performance of public health workforce. Public
Health Reports, 120(suppl.1):9-15.
Ministry of Health Uganda. 2002. Uganda pharmaceutical sector baseline survey.
Kampala: Government of Uganda.
Ministry of Health Uganda. 2006. Human resources for health policy. Kampala:
Government of Uganda.
Ministry of Health Uganda. 2008. Annual health sector performance report: financial
year 2007/2008. Kampala: Government of Uganda.
Ministry of Health Uganda. 2009. The Draft Second National Health Policy.
Kampala: Government of Uganda.
Ministry of Public Service. 2006. The Uganda Public Service Training Policy.
Kampala: Government of Uganda.
Ministry of Public Service. 2007. Staff performance appraisal in the public service:
guidelines for managers and staff. Kampala: Governement of Uganda.
Mitchell, A. 2009. Decentralisation and human resources for health. In Working in
health: financing and managing the public sector health performance. Edited by M,
Vujicic, K, Ohiri & S, Sparkes. Washington: World Bank: 215-231.

337
Morgan, C, & Deutschmann, PW. 2003. An evolving model for training and
education in resource-poor settings: teaching health workers to fish. Medical
Journal of Australia, 178:21-25.
Morse, JM. 1991. Approaches to qualitative-quantitative methodological
triangulation. Nursing Research, 40(2):120-123.
Mouton, J. 2001. How to succeed in master‟s and doctoral studies: a South African
guide and resource book. Pretoria: Van Schaik.
Mrayyan, MT. 2004. Nurses‟ autonomy: Influence of nurse managers‟ actions on
nursing and healthcare management and policy. Journal of Advanced Nursing,
45(3):326-336.
Mugisha, JF. 2009. Interaction of continuing professional development,
organisational culture and performance in health service organisations: a concept
Paper. Health Development and Policy Journal, 7(1):51-59.
Mullei, K, Mudhune, S, Wafula, J, Masamo, E, English, M, Goodman, C, Lagarde,
M, & Blaauw, D. 2010. Attracting and retaining health workers in rural areas:
investigating nurses‟ views on rural posts and policy interventions. BMC Health
Services Research, 10(suppl 1):S1.
Mullen, PM. 2004. Using performance indicators to improve performance. Health
Services Management Research, 17:217-228.
Munga, MA, Songstad, NG, Blystad, A & Maestad, O. 2009. The decentralisation-
centralisation dilemma: recruitment and distribution of health workers in remote
districts of Tanzania. BMC International Health and Human Rights, 9(9):[1-11].
http://www.biomedcentral.com/1472-698X/9/9 (Accessed on 3rd February 2010).

338
Muriisa, RK. 2008. Decentralisation in Uganda: prospects for improved service
delivery. African Development, XXXIII (4):83-95.
Murphy, PR & Jackson, SE. 1999. Managing work-role performance: challenges for
21st century organisations and employees. In The changing nature of work
performance. Edited by DR, Ilgen, & ED, Pulakos. San Francisco: Jossey-Bass.
Murphy-Black, T. 2006. Using questionnaires. In The research process in nursing
.Edited by K, Gerrish & A, Lacey. 5th edition. Oxford: Blackwell: 367-382.
Muula, AS. 2005. Is there any solution to the “Brain Drain” of health professionals
and knowledge from Africa? Croatian Medical Journal, 46(1):21-29.
Nayeri, ND, Nazari, AA, Salsali, M & Ahmadi, F. 2005. Iranian staff nurses‟ views of
their productivity and human resource factors improving and impeding it: a
qualitative study. Human Resource for Health, 3(9):[1-11]. http://www.human-
resources-health.com/content/3/1/9 (Accessed on 6th July 2009).
Nel, PS, Werner, A, Haasbroek, GD, Poisat, P, Sono, T & Schultz, HB. 2008.
Human Resources Management. 7th edition. Cape Town: Oxford University Press
Southern Africa.
Neuman WL. 2006. Social research methods: qualitative and quantitative
approaches. 6th edition, Boston: Pearson Education.
Nevid, JS. 2007. Psychology concepts and applications. 2ndedition. Boston, MA:
Houghton Mifflin Company.

339
Nguyen, L, Ropers, S, Nderitu, E, Zuyderduin, A, Luboga, S & Hagopian, A. 2008.
Intent to migrate among nursing students in Uganda: Measures of the brain drain in
the next generation of health professionals. Human Resources for Health, 6(5):[1-
11]. http://www.human-resources-health.com/content/6/1/5 (Accessed on 6th July
2009).
Nityarumphong, S, Srivanichankorn, S & Pongsupap, Y. 2000. Strategies to
respond to manpower needs in rural Thailand. In Providing health care under
adverse conditions: health personnel performance and individual coping strategies.
Edited by P, Ferrinho & W, Van Lerberghe. Antwerp: ITG Press.
Nocochea, E & Fort, A. 2003. Measurement and evaluation of performance in
international reproductive health. Performance Improvement, 42(8):9-13.
Noe, RA, Hollenbeck, JR, Gerhat, B & Wright, PM. 2008. Human Resource
Management: Gaining a Competitive Advantage. 6th edition. Boston: Irwin McGraw-
Hill.
Noor, NAM, & Muhamad, A. 2005. Individual factors that predict customer-orientation
behaviour of Malaysian life insurance agents. Jurnal Pengurusan, 24:125-149.
Ntoburi, S, Wagai, J, Irimu, G & English, M. 2008. Debating the quality and
performance of health systems at a global level is not enough, national debates are
essential for progress. Tropical Medicine and International Health, 13(4):444-447.
Nzinga, J, Mbindyo, P, Mbaabu, L, Warira, A & English M. 2009. Documenting the
experiences of health workers expected to implement guidelines during an
intervention study in Kenyan Hospitals. Implementation Science, 4(44):[1-9].
http://www.implementationscience.com/content/4/1/44 (Accessed on 9th June
2010).

340
Okuonzi, SA. 2004. Learning from the failed reforms in Uganda. BMJ,
329(7475):1173-1175.
Orach, SO. 2008. Challenges of retaining health workers in the PNFP Sectors: The
Case of Uganda Catholic Health Network. Health Policy and Development, 6(1):31-
36.
Orach, SO. 2009. Uganda human resources for health strategic plan: potholes in
the planned path to 2020. Uganda Catholic Medical Bureau Articles. Available from:
http://fs.ucmb.co.ug/ucmbdocs/Articles/UGANDA%20HUMAN%20RESOURCE%20
STRATEGIC%20PLAN.pdf (Accessed on 27th July 2009).
Padarath, A, Chamberlain, C, McCoy, A, Ntuli, A, Rowson, M & Loewenson, R.
2003. Health Personnel in Southern Africa: Confronting maldistribution and brain
drain. Equinet Discussion Paper Number 3. Regional Network for Equity in Health in
Southern Africa (EQUINET) Health Systems: Trust (South Africa) and MEDACT
(UK).
Panzer, RJ, & Cronin, C. 1993. Using information in quality improvement and quality
assurance. In Putting research to work in quality improvement and quality
assurance. Edited by ML, Grady, J, Bernstein & S, Robinson. Rockville MD: Agency
for Health Care Policy and Research, Pub. No. 93-0034: 85-104.
Patton, MQ. 2002. Qualitative evaluation of and research methods. 3rd edition.
Thousand Oaks, CA: Sage Publications Inc.

341
Paul F. 2009. Health worker motivation and the role of performance based finance
system in Africa: A qualitative study of health worker motivation and the Rwandan
performance based finance initiatives in District Hospitals. Working Paper Series
No. 08-96: London School of Economics and Political Science. Available from:
http://www2.lse.ac.uk/InterantionalDevelopment/WP96.pdf (Accessed 3rd October
2010).
Perkins, MB, Jensen, PS, Jaccard, J, Gollwitzer, P, Oettingen, G, Pappadopulos, E
& Hoagwood, KE. 2007. Applying theory-driven approaches to understanding and
modifying clinicians‟ behaviours: what do we know? Psychiatric Services, 58(3):342-
348.
Peters, DH, Noor, AA, Singh, LP, Kakar, FK, Hansen, PM & Burnham, G. 2007. A
balanced scorecard for health services in Afghanistan. Bulletin of World Health
Organization, 85(2):146-150.
Peterson, RB & Lewin, D. 2000. Research on unionised grievance procedures:
management issues and recommendations. Human resource management,
39(4):395-406.
Poister, TH. 1983. Performance Monitoring. Lexington: Health and Co.
Polit, DF & Beck, CT. 2008. Nursing research: generating and assessing evidence
for nursing practice. 8th edition. Philadelphia: Lippincott Williams & Wilkins.
Popa, SA. 2009. Balanced scorecard: translating strategy into results. Economia
Seria Management, 12(2):214-217.
Potter, C, & Brough, R. 2004. Systemic capacity building: a hierarchy of needs.
Health Policy and Planning, 19(5):336-345.

342
Pransky, G, Benjamin, K, & Dembe, AE. 2001. Performance and Quality
Measurement in Occupational Health Services: Current Status and Agenda for
Further Research. American Journal of Industrial Medicine, 40:295-306.
Pruitt, SD & Epping-Jordan, JE. 2005. Preparing the 21st century global healthcare
workforce. British Medical Journal, 330: 637-639.
Rafferty, AM, Maben, J, West, E & Robinson, D. 2005. What makes a good
employer? The Global Nursing Review Initiative. Issue Paper 3. Geneva:
International Council of Nurses.
Ree, MJ, Earles, JA & Teachout, MS. 1994. Predicting job performance: not much
more than 'g'. Journal of Applied Psychology, 79(4): 518-25.
Reinikka, R & Svensson, J. 2003. Working for God? Evaluating service delivery of
religious not-for-profit healthcare providers in Uganda. World Bank Policy Research
Working Paper No. 3058, Washington: World Bank.
Rese, A, Balabanova, D, Danishevski, K, McKee, M & Sheaff, R. 2005.
Implementing general practice in Russia; getting beyond the first steps. BMJ,
331(7510):204-207.
Rowe, AK, de Savigny, D, Lanata, CF & Victora, CG. 2005. How can we achieve
and maintain high quality performance of health workers in low-resource settings?
The Lancet, 366 (9490):1026–1035.
Ruth, T. 1996. The attributes of leadership. Leadership and Organisation
Development Journal, 17(1): 27-31.

343
Sagoe, K. 2005. Stopping migration of Ghana‟s health workers. id21 insights health,
No. 7, August.
Saide, MAO, & Stewart, DE. 2001. Decentralisation and human resource
management in the health sector: a case study (1996-1998) from Nampula
provides, Mozambique. International Journal of Health Planning and Management,
16:155-168.
Saks, AM & Ashforth, BE. 1997. A longitudinal investigation of the relationships
between job information sources, applicant perceptions, and work outcomes.
Personnel Psychology, 50(2):395-426.
Saks, M & Allsop, J. 2007. Researching health: qualitative, quantitative and mixed
modes. London: Sage.
Saunders, M, Lewis, P & Thornhill, A. 2009. Research methods for business
students. 5th edition. Harlow: FT Prentice Hall.
Saura, I, Contrı´, G, Berenguer, G, Taulet, AC & Velázquez, BM. 2005.
Relationships among customer orientation, service orientation and job satisfaction
in financial services. International Journal of Service Industry Management,
16(5):497-525.
Shaw, C. 2005. Managing the performance of health professionals. In Human
resources for health in Europe. Edited by CA, Dubois, M, McKee & E, Nolte.
Brussels: European Observatory on Health Systems and Policies.

344
Skinner, J & Green, R. 2010. Making the grade: the elements of an effective
performance appraisal. Library Worklife: HR E-News for Today‟s Leaders (Online
Newsletter), 7(6):[1-2]. Available from: http://ala-apa.org/newsletter/2010/06/08/hr-
practice (Accessed on 3rd October 2010).
Smith PC, Mossialos, E & Papanicolas, I. 2008. Performance measurement for
health system: experiences, challenges and prospects. Background Document for
WHO European Ministerial Conference on Health Systems, Tallinn Estonia 25-27
June. Copenhagen: WHO Regional Office for Europe.
Snell, S & Bohlander, G. 2007. Human Resource Management. Mason: Thomson.
Somekh, B & Lewin, C. 2005. Research methods in social sciences. London: Sage.
Ssengooba, F, Rahman, SA, Hongoro, C, Rutebemberwa, E, Mustafa, A, Kielmann,
T & McPake, B. 2007. Health Sector reforms and human resources for health in
Uganda and Bangladesh: mechanisms of effect. Human Resources for Health, 5(3):
[1-13]. http://www.human-resources-health.com/content/5/1/3 (Accessed on 17th
April 2009).
Ssengooba, F, Rutebemberwa, E & Hongoro, C. 2005. Human resources for health
in decentralised Uganda: developments and implications for health systems
research. Mumbai, India: Forum 9 Conference presentation, 12-16 September.
http://www.who.int/rcp/evipnet/Human%20resources%20for%20Health%20Uganda
%20-%Developments/%20for%Health%20systems%20research%202005.pdf
(Accessed on 2nd May 2009).
Stekelenburg, J, Kyanamina, SS & Wolffers, I. 2003. Poor performance of
community health workers in Kalabo District, Zambia. Health Policy, 65:109-118.

345
Stewart, M, Makwarimba, E, Barnfather, A, Letourneau, N & Neufeld, A. 2008.
Research reducing health disparities: mixed methods approaches. Social Science &
Medicine, 66(6):1406-1417.
Stilwell, B. 2004. Understanding and influencing the International migration of health
workers. Geneva: WHO.
Suliman, A & Iles, P. 2000. Is continuous commitment beneficial to organizations?
Commitment-performance relationship: a new look. Journal of Management
Psychology, 15 (5): 407-426.
Swansburg, RC & Swansburg, RJ. 1999. Introductory management and leadership
for nurses. 2nd edition. Sudbury: Jones and Bartlett Publishers.
Taiwo, AS. 2010. The influence of work environment on workers‟ productivity: A
case of selected oil and gas industry in Lagos, Nigeria. Africa Journal of Business
Management, 4(3):299-307.
Tang, JH. 2003. Evidence-based protocol: Nurse retention. Journal of
Gerontological Nursing, 29(5):5-14.
Tashakkori, A & Teddlie, C. 1998. Mixed methodology: Combining qualitative and
quantitative approaches. Thousand Oaks, CA: Sage.
Tawfik-Shukor, AR, Klazinga, NS & Arah, OA. 2007. Comparing health system
performance assessment and management approaches in the Netherlands and
Ontario, Canada. BMC Health Services Research, 7(25):[1-12].
http://www.biomedcentral.com/1472-6963/7/25 (Accessed on 9th December 2010).

346
Teddlie, C & Yu, F. 2007. Mixed methods sampling: a typology with examples.
Journal of Mixed Methods Research, 1(1):77-100.
Tella, A, Ayeni, CO, & Popoola, SO. 2007. Work motivation, job satisfaction, and
organisational commitment of library personnel in academic and research libraries
in Oyo State Nigeria. Library Philosophy and Practice, (April):1-15.
Thompson (Jr), AA, Strickland, AJ III & Gamble, JE. 2010. Crafting and executing
strategy: the quest for competitive advantage-concepts and cases. 17th edition.
Boston: Irwin McGraw-Hill.
Tong, CH, Straussman, JD & Broadnax WD. 1999. Civil service reform in the
People‟s Republic of China: case studies of early implementation. Public
Administration and Development, 19:193-206.
Trochim, WN. 2006. The research methods knowledge base. Available from:
http://www.socialresearchmethods.net.ub (Accessed on 4th May 2009).
Troiano, PF. 2003. College students and learning disability elements of self-style.
Journal of College Student Development, 44(3):404-419.
Uganda Bureau of Statistics (UBOS) & Macro International Inc. 2007. Uganda
Demographic and Health Survey 2006. Calverton, Maryland, USA: UBOS and
Macro International Inc.
Ukko, J, Tenhunen, J & Rantanen, H. 2007. Performance measuring impacts on
management and leadership: perspective of management and employees.
International Journal of Production Economics, 110(1-2): 39-51.

347
United Nations Department for Economic & Social Affairs. 2004. Republic of
Uganda: public administration and country profile. Available online from:
http://unpan1.un.org/intradoc/groups/public/document/unpa02392.pdf (Accessed on
26th July 2009).
University of Northern Iowa. 2000. Supervisor guidelines for conducting employee
appraisals. UNI: Human Resources Services.
Upenieks, V. 2005. Recruitment and retention strategies: A magnet Hospital
prevention Model. MEDSURG Nursing (supplement): 21-27.
Üstünlüoğlu, E. 2009. Is appraisal system a threat for teachers? Procedia Social
and Behaviour Sciences, 1:118-123.
Uzun, O. 2003. Perceptions and experiences of nurses in Turkey about verbal
abuse in clinical settings. Journal of Nursing Scholarship, 35(1):81-85.
Van Lerberghe, W, Adams, O, & Ferrinho, P. 2002. Human resources impact
assessment. Bulletin of World Health Organization, 80(2):525.
Van Lerberghe, W, Conceição, C, Van Damme, W & Ferrinho, P. 2002. When staff
is underpaid: dealing with the individual coping strategies of health personnel.
Bulletin of the World Health Organization, 80(7):581-584.
Van Scotter, JR. 2000. Relationships of task performance and contextual
performance with turnover, job satisfaction, and affective commitment. Human
Resource Management Review, 10:79-95.
Victorian Government Department of Human Resources. 2009. Health workforce
competency principles. A Victorian discussion paper. Melbourne: Victoria State.

348
Viswesvaren, C & Ones, DS. 2000. Perspectives on models of job performance.
International Journal of Selection and Assessment, 8(4): 216-226.
Wholey, JS, & Hatry, HP. 1992. The case for performance monitoring. Public
Administration Review, 52 (6):604-610.
Wibulpolprasert, S & Pengpaibon, P. 2003. Integrated strategies to tackle
inequitable distribution of doctors in Thailand: four decades of experience. Human
Resources for Health,1(12):[1-17]. http://www.human-resources-
health.com/content/1/1/12 (Accessed on 3rd May 2009).
Willis-Shattuck, M, Bidwell, P, Thomas, S, Wyness, L, Blaauw, D & Ditlopo, P.
2008. Motivation and retention of health workers in developing countries: a systemic
review. BMC Health Science Research, 8(247):[1-8].
http://www.biomedcentral.com/1472-6963/8/247 (Accessed on 17th July 2010).
Wood, MJ & Ross-Kerr, JC. 2006. Basic steps in planning nursing research from
question to proposal. 6th edition. Boston: Jones & Bartlett.
World Health Organization. 2000. The world health report 2000: Health systems:
improving performance. Geneva: WHO.
World Health Organization. 2003. The world health report 2003: Shaping the future.
Geneva: WHO.
World Health Organization. 2005a. Guide to health workforce development in post-
conflict environments. Geneva: WHO.
World Health Organization. 2005b. Measuring progress and acceleration in the
implementation of initiative. Review Report. WHO/OPEC Fund for Multi-Country
Initiative on HIV/AIDS. Geneva: WHO.

349
World Health Organization. 2006. World health report 2006: Working together for
health. Geneva: WHO.
World Health Organization. 2007. Everybody business: strengthening health
systems to improve health outcomes: WHO‟s framework for action. Geneva: WHO.
World Health Organization. 2008. The world health report 2008: primary health care
now more than ever. Geneva: WHO.
Wright, PM, McCormick, B, Sherman, WS & McMahan, GC.1999. The role of
human resource practices in petrochemical refinery performance. International
Journal of Human Resource Management, 10(4): 551-571.
Yumkella, F. 2005. Retention: health workforce issues and response actions in low-
resource settings. Capacity Project Resource Paper. Chapel Hill NC: The Capacity
Project. Available from:
http://www.capacityproject.org/images/stories/files/retention_paper_long050823.pdf
(Accessed on 12th July 2009).
Zachariah, R, Ford, N, Philips, M, Lynch, S, Massaquoi, M Janssens, V & Harries,
AD, 2009. Task shifting in HIV/AIDS: opportunities, challenges and proposed
actions for sub-Saharan Africa. Transactions of the Royal Society of Tropical
Medicine and Hygiene, 103:549-558.
Zachariah, R, Lange, L, & D‟Altilia, J. 2001. Financing advances on salaries of
health workers in Chad: an example of feasible strategy to sustain the Bamako
Initiative. Health Policy and Planning, 16:332-333.

350
Zhang, K, Song, LJ, Hackett, RD & Bycio, P. 2006. Cultural boundary of expectancy
theory-based performance management: A commentary on DeNisi and Pritchard‟s
performance improvement model. Management and Organization Review, 2 (2):
279-294.

ANNEXURES
ANNEXURE A: CERTIFICATE OF CLEARANCE FROM THE UNIVESRSITY OF SOUTH AFRICA HEALTH STUDIES RESEARCH AND ETHICS COMMITTEE

ANNEXURE B: LETTER OF ETHICAL CLEARANCE FROM THE UGANDA NATIONAL COUNCIL FOR SCIENCE AND TECHNOLOGY

ANNEXURE C: LETTER OF ETHICAL CLEARANCE FROM INSITITUTIONAL REVIEW BOARD OF MBALE REGIONAL HOSPITAL

ANNEXURE D: LETTER OF PERMISSION FROM OFFICE OF PRESIDENT

ANNEXURE E: THE CONSENT FORM
STUDY TITLE: THE PERFORMANCE OF HEALTH WORKERS IN THE DECENTRALISED SERVICES IN UGANDA.
PRINCIPAL INVESTIGATOR: DR. GEORGE WILLIAM LUTWAMA Dr. George W. Lutwama, a medical doctor currently pursing a Doctoral degree from the University of South Africa. Dr. Lutwama is currently conducting a study as titled above in the fulfilment of the requirements for the award of Doctor of Literature and Philosophy degree in Health Studies (DLitt et Phil). This study will be carried out in the districts of Kumi, Mbale, Sironko and Tororo. The purpose of this study is to identify gaps in performance and performance management of health workers in wake of the health reforms. The researcher intends to use the findings from this research to develop performance management framework/guidelines that are specific to health worker. The Uganda National Council for Science and Technology (UNCST) and the Research Secretariat Office of the President as well as the district authorities have been approached and have approved that the study can be conducted these districts. The health facility managers have been notified to this effect. There will be no risk or harm to your participation in this study. You are expected to respond to the questions in the questionnaire in your free time. This questionnaire will take less than 30 minutes to complete. You are free to ask any questions if clarity is required. Your participation in this study is voluntary. You are under no obligation to participate. You have the right to withdraw at any time however your participation is highly appreciated. Your identity will not be revealed during the study, reporting or publishing the research findings. On completion of the questionnaire, kindly return it to Dr/Mr/Ms…………...........................who has been trained in ethical data collection methods and will not share the information with any other person. In case your need any clarification or any other questions kindly contact the following people. Dr. George W. Lutwama Tel:+256 787393413; +265 999 414748, e-mail: [email protected] or [email protected] or [email protected]. I have read this form and voluntarily consent to participate in this study. Participant’s Signature:……………………… Date: ……………………… I have explained this to the above participant and have sought his/her understanding for informed consent. Researcher/ Assistant’s Signature: ………………… Date: ………….......

ANNEXURE F: COVERING LETTER ACCOMPANYING THE SELF ADMINISTERED QUESTIONNAIRE
Date: 2nd May 2010 Dear Sir/Madam, SUBJECT: THE PERFORMANCE OF HEALTH WORKERS IN THE DECENTRALISED SERVICES IN UGANDA This survey is conducted as a requirement for the completion of the degree of Doctor of Literature and Philosophy (DLitt et Phil) in Health Studies from the University of South Africa. The main purpose of this research is to investigate the performance of health workers in the decentralised services in Uganda, following the health reforms. I would like to invite your participation in this survey by filling up the attached questionnaire. All information provided will be treated with the strictest confidentiality and only aggregate data will be will be analysed. As such individuals who respond to this questionnaire will not be identified. This survey will take approximately 30 to 45minutes and your participation of is very much appreciated. I would really appreciate if you could return the questionnaire to the undersigned. Thank you for valuable contribution in participating in this survey. Kind regards Dr. George William Lutwama (MBChB, MPH, DLitt et Phil (Candidate) Tel: +256 787393413; 265 999 424748 e-mail: [email protected].

ANNEXURE G: LETTER REQUESTING FOR PERMISSION FROM HEALTH SERVICE MANAGERS TO COLLECT DATA AND CONDUCT INTERVIEWS
Date: 2nd May 2010 To: ................................................... ................................................... Dear Sir/Madam, RE: REQUEST FOR PERMISSION TO COLLECT DATA FROM HEALTH WORKERS IN HEALTH FACILITES AND THEIR MANAGERS. I am a Doctoral student (DLitt et Phil in Health Studies) at the University of South Africa. I write to request permission to collected data for my thesis from health workers in selected health facilities in Eastern Uganda. The approved title for my thesis is ‘The Performance of health workers in the decentralised services in Uganda’. I intend to carry out this research in 4 districts located in Eastern Uganda namely: Kumi, Mbale, Sironko and Tororo. The study will involve interviews with health workers and their managers. I intend to use findings from this study to develop a performance management framework that is specific to health workers in Uganda and Africa as a whole. I am requesting to undertake the following activities in the health facilities.
1. Distribute self-administered to doctors, clinical officers, and Nurses. 2. Conduct interviews with health service managers at district, hospital and
health sub districts. 3. Review some records on patients‟ attendance and health performance
indicators. I have attached copies of the ethical clearance by the University of South Africa and the Uganda National Council for Science and Technology. I addition the copies of the questionnaires and interview schedules are attached. Thank you for your consideration Dr. George William Lutwama (MBChB, MPH, DLitt et Phil (Candidate) Tel: +265 999 424747; e-mail: [email protected]. .

1
ANNEXURE H: SELF-ADMINISTERED QUESTIONNAIRE FOR HEALTH WORKERS
Serial No: SECTION A: PERSONAL AND HEALTH FACILITY INFORMATION Please give your answer to each of the following questions. Read all the options first and circle only one answer for each statement. You are requested to answer all questions as truthfully as possible. 1. My gender is….
2. I am in the age category of ….
3. My marital status is….
4. My current profession is …
Medical Doctor 1
Clinical Officer 2
Registered Nurse/Midwife 3
Enrolled Nurse/midwife 4
5. The highest professional qualification I have attained is ….
Doctoral degree (e.g. PhD, D Litt et Phil) 1
Master degree (e.g. MMed, MPH, MScN, MA). 2
Postgraduate diploma (e.g. Administration, Public Health, Mental health) 3
Postgraduate certificate (e.g. Cerf. In Public Health, Cert. Mental health etc) 4
Bachelors degree (e.g. MBChB, Bsc Nursing, Bsc Clinical Medicine etc) 5
Diploma (e.g. Clinical Medicine, Diploma in Nursing & Midwifery, Dip Public Health etc) 6
Certificate (e.g. Nursing and Midwifery, Clinical Medicine etc) 7
6. I have ……. of experience in the health profession
0 – 5 years 1
6 - 10 years 2
11-15 years 3
16-20 years 4
21 years and above 5
7. The type of health facility where I work is ….
Hospital 1
Health Centre IV 2
Health Centre III 3
Health Centre II 4
Female 1
Male 2
less than 20 years 1
20-29 years 2
30-39 years 3
40-49 years 4
50 -59years . 5
60 years and above 6
Single 1
Married 2
Divorced 3
Widowed 4
Separated 5

2
8. I have been working in this health facility for …….
0 – 11 months 1
1 – 5 years 2
6 – 10 years 3
11 -15 years 4
16-20 years 5
21 years and more 6
9. I work in the district of …….
Kumi 1
Mbale 2
Sironko 3
Tororo 4
10. My health facility is located in ..........................area.
SECTION B: INDIVIDUAL ATTRIBUTES 11. Please indicate how you perceive your job related skills and abilities by circling only one answer to each of the statements below as follows: 1= Very poor (VP); 2= Poor (P); 3= Average (Av); 4= Good (G); 5= Very good (VG)
Skills and abilities VP P Av G VG
11.1 My skills in assessing clients are…. 1 2 3 4 5
11.2 My abilities in delivering health education are…. 1 2 3 4 5
11.3 My clinical competencies are…. 1 2 3 4 5
11.4 My skills in counselling clients are…. 1 2 3 4 5
11.5 My interpersonal relations are…. 1 2 3 4 5
11.6 My abilities in providing in-service training are…. 1 2 3 4 5
11.7 My time management abilities are…. 1 2 3 4 5
11.8 My skills in supervising other health workers are…. 1 2 3 4 5
11.9 My skills in maintaining health facility equipment are…. 1 2 3 4 5
11.10 My abilities to Implement the Uganda National Minimum Health Care Package (UNMHCP) are….
1 2 3 4 5
12. To what extent do you agree with the statements below regarding your self-monitoring ability? Please circle only one answer for each as follows: 1= Strongly disagree (SD); 2= Disagree (D); 3= Undecided (U); 4= Agree (A); 5= Strongly agree (SA)
Statement SD D U A SA
12.1 I find it easy to copy the behaviour of others. 1 2 3 4 5
12.2 I always defend the ideas that I already believe in. 1 2 3 4 5
12.3 I am able to adapt myself to different situations and with different people. 1 2 3 4 5
12.4 I can be friendly towards others even though I really I dislike them. 1 2 3 4 5
13. To what extent do you agree with the statements below concerning your self-motivation (Intrinsic motivation)? Please circle only one answer for each as follows: 1= Strongly disagree (SD); 2= Disagree (D); 3= Undecided (U); 4= Agree (A); 5= Strongly agree (SA)
Statement SD D U A SA
13.1 I feel satisfied when I do my job well. 1 2 3 4 5
13.2 When I perform my job well, it contributes to my personal growth and development.
1 2 3 4 5
13.3 I get a sense of accomplishment when I perform my work well. 1 2 3 4 5
13.4 My job increases my feeling of self-esteem. 1 2 3 4 5
Urban 1
Rural 2

3
13.5 I have considerable freedom on how to do my work. 1 2 3 4 5
13.6 I feel satisfied when I help others to achieve their goals. 1 2 3 4 5
13.7 I feel satisfied when others recognise my achievements. 1 2 3 4 5
13.8 I achieve my goals by satisfying my clients‟ needs. 1 2 3 4 5
13.9 In general, I am satisfied with my job. 1 2 3 4 5
14. Please indicate the extent to which you agree with the following statements regarding your commitment to the organisation by circling only one answer for each as follows: 1= Strongly disagree (SD); 2= Disagree (D); 3= Undecided (U); 4= Agree (A); 5= Strongly agree (SA)
Statement SD D U A SA
14.1 I am willing to put more effort than what is normally expected to help my organisation become successful.
1 2 3 4 5
14.2 I am willing to accept almost any type of work in order to continue working in this organisation.
1 2 3 4 5
14.3 My organisation inspires me to perform to the best of my ability. 1 2 3 4 5
14.4 I talk highly about this organisation to my friends as a great place to work for.
1 2 3 4 5
14.5 I would encourage my friends and family to seek health care from this facility.
1 2 3 4 5
14.6 My supervisor takes personal interest in my career. 1 2 3 4 5
14.7 My organisation strongly acknowledges my goals and values. 1 2 3 4 5
14.8 I would be very happy to spend the rest of my career with this organisation.
1 2 3 4 5
14.9 It would be very hard for me to leave this organisation right now even if I wanted.
1 2 3 4 5
14.10 I think that moving from one organisation to another would interfere with my career development.
1 2 3 4 5
14.11 Overall, I am committed to this health facility. 1 2 3 4 5
15. To what extent do you agree with the following statements concerning your values and beliefs in the organisation? Please circle only one answer for each as follows: 1= Strongly disagree (SD); 2= Disagree (D); 3= Undecided (U); 4= Agree (A); 5= Strongly agree
SECTION C: INDIVIDUAL BEHAVIOURS FOR PERFORMANCE 16. Please indicate the extent to which you agree with the statements below concerning your proficiency behaviour by circling only one answer for each as follows: 1= Strongly disagree (SD); 2= Disagree (D); 3= Undecided (U); 4= Agree (A); 5= Strongly agree (SA)
Statement SD D U A SA
16.1 I always use standard procedures to ensure that my core tasks are completed properly.
1 2 3 4 5
16.2 I coordinate my work with co-workers. 1 2 3 4 5
Statement SD D U A SA
15.1 I communicate openly with everyone in this organisation. 1 2 3 4 5
15.2 When I make a mistake, I honestly admit and try to rectify it. 1 2 3 4 5
15.3 I think it is better to work as a team in order to realise my potential and get work done.
1 2 3 4 5
15.4 Safety of patients is very important to me. 1 2 3 4 5
15.5 I am in support of continuous improvement in patients' care. 1 2 3 4 5
15.6 I put in a lot of effort to achieve positive health outcomes for my patients.
1 2 3 4 5
15.7 I believe in provision of client-driven services. 1 2 3 4 5
15.8 I believe in respect for the clients. 1 2 3 4 5
15.9 I believe organisational loyalty should be encouraged and rewarded. 1 2 3 4 5
15.10 I believe promotions should be based on individual performance. 1 2 3 4 5
15.11 I believe teamwork is valuable and should be rewarded. 1 2 3 4 5
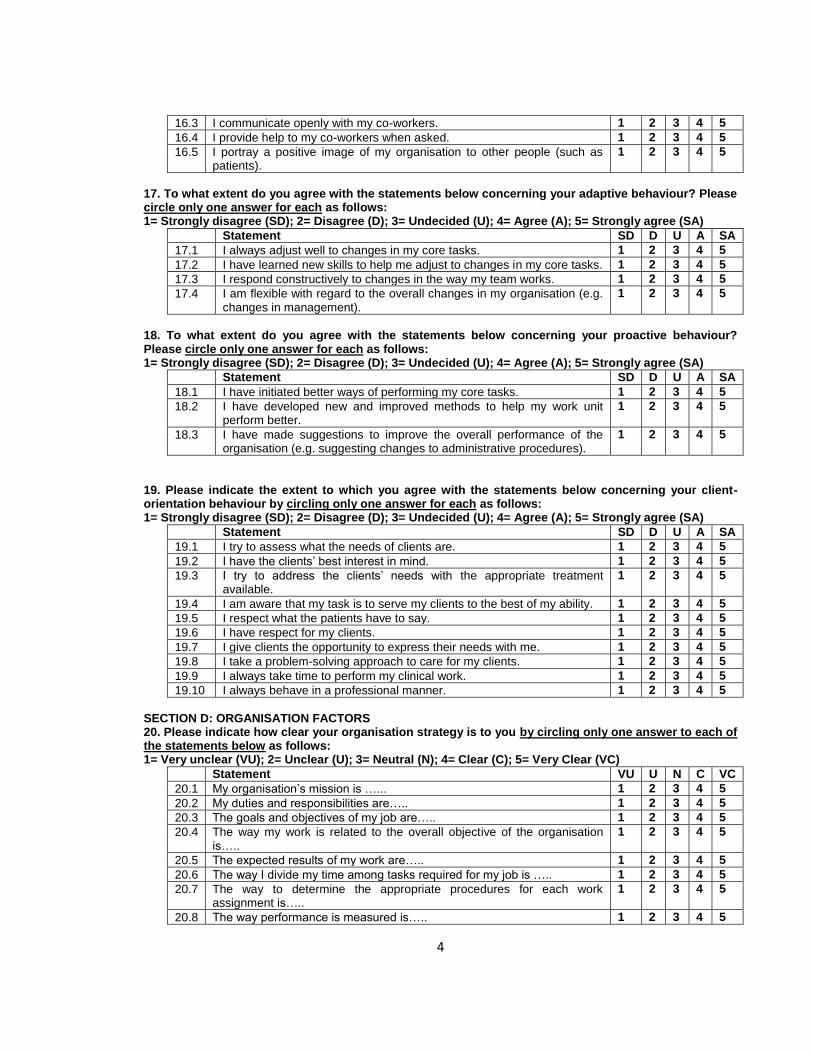
4
16.3 I communicate openly with my co-workers. 1 2 3 4 5
16.4 I provide help to my co-workers when asked. 1 2 3 4 5
16.5 I portray a positive image of my organisation to other people (such as patients).
1 2 3 4 5
17. To what extent do you agree with the statements below concerning your adaptive behaviour? Please circle only one answer for each as follows: 1= Strongly disagree (SD); 2= Disagree (D); 3= Undecided (U); 4= Agree (A); 5= Strongly agree (SA)
Statement SD D U A SA
17.1 I always adjust well to changes in my core tasks. 1 2 3 4 5
17.2 I have learned new skills to help me adjust to changes in my core tasks. 1 2 3 4 5
17.3 I respond constructively to changes in the way my team works. 1 2 3 4 5
17.4 I am flexible with regard to the overall changes in my organisation (e.g. changes in management).
1 2 3 4 5
18. To what extent do you agree with the statements below concerning your proactive behaviour? Please circle only one answer for each as follows: 1= Strongly disagree (SD); 2= Disagree (D); 3= Undecided (U); 4= Agree (A); 5= Strongly agree (SA)
Statement SD D U A SA
18.1 I have initiated better ways of performing my core tasks. 1 2 3 4 5
18.2 I have developed new and improved methods to help my work unit perform better.
1 2 3 4 5
18.3 I have made suggestions to improve the overall performance of the organisation (e.g. suggesting changes to administrative procedures).
1 2 3 4 5
19. Please indicate the extent to which you agree with the statements below concerning your client-orientation behaviour by circling only one answer for each as follows: 1= Strongly disagree (SD); 2= Disagree (D); 3= Undecided (U); 4= Agree (A); 5= Strongly agree (SA)
Statement SD D U A SA
19.1 I try to assess what the needs of clients are. 1 2 3 4 5
19.2 I have the clients‟ best interest in mind. 1 2 3 4 5
19.3 I try to address the clients‟ needs with the appropriate treatment available.
1 2 3 4 5
19.4 I am aware that my task is to serve my clients to the best of my ability. 1 2 3 4 5
19.5 I respect what the patients have to say. 1 2 3 4 5
19.6 I have respect for my clients. 1 2 3 4 5
19.7 I give clients the opportunity to express their needs with me. 1 2 3 4 5
19.8 I take a problem-solving approach to care for my clients. 1 2 3 4 5
19.9 I always take time to perform my clinical work. 1 2 3 4 5
19.10 I always behave in a professional manner. 1 2 3 4 5
SECTION D: ORGANISATION FACTORS 20. Please indicate how clear your organisation strategy is to you by circling only one answer to each of the statements below as follows: 1= Very unclear (VU); 2= Unclear (U); 3= Neutral (N); 4= Clear (C); 5= Very Clear (VC)
Statement VU U N C VC
20.1 My organisation‟s mission is …... 1 2 3 4 5
20.2 My duties and responsibilities are….. 1 2 3 4 5
20.3 The goals and objectives of my job are….. 1 2 3 4 5
20.4 The way my work is related to the overall objective of the organisation is…..
1 2 3 4 5
20.5 The expected results of my work are….. 1 2 3 4 5
20.6 The way I divide my time among tasks required for my job is ….. 1 2 3 4 5
20.7 The way to determine the appropriate procedures for each work assignment is…..
1 2 3 4 5
20.8 The way performance is measured is….. 1 2 3 4 5

5
20.9 The way performance appraisal results are utilised is….. 1 2 3 4 5
21. Please indicate the extent to which you agree with the statements below regarding your working environment by circling only one answer for each as follows: 1= Strongly disagree (SD); 2= Disagree (D); 3= Undecided (U); 4= Agree (A); 5= Strongly agree (SA)
Statement SD D U A SA
21.1 My working environment is considerably safe. 1 2 3 4 5
21.2 My health facility has a good working space arrangement. 1 2 3 4 5
21.3 All the necessary equipment are available. 1 2 3 4 5
21.4 The health facility equipment are in good working condition. 1 2 3 4 5
21.5 Drugs and supplies are sufficient. 1 2 3 4 5
21.6 There are clear infection control guidelines. 1 2 3 4 5
21.7 I participate in decision making concerning patients‟ care. 1 2 3 4 5
21.8 I am satisfied with my opportunity to participate in decision making. 1 2 3 4 5
21.9 I receive constructive comments from my supervisors. 1 2 3 4 5
21.10 I receive constructive comments from my co-workers. 1 2 3 4 5
21.11 I receive constructive comments from the patients/their relatives. 1 2 3 4 5
21.12 My opinion is respected at work. 1 2 3 4 5
21.13 I feel my job is secure. 1 2 3 4 5
22. Please indicate the extent to which you agree with the statements below concerning staffing in your organisation by circling only one answer for each as follows: 1= Strongly disagree (SD); 2= Disagree (D); 3= Undecided (U); 4= Agree (A); 5= Strongly agree (SA)
Statement SD D U A SA
22.1 The allocated staff in this facility are sufficient to cover the current workload.
1 2 3 4 5
22.2 Support of staff in form of counselling at workplace is available. 1 2 3 4 5
22.3 I have opportunity to make inputs into staffing policies and procedures.
1 2 3 4 5
22.4 There is a good balance between health workers and their supervisors.
1 2 3 4 5
23. Please indicate the extent to which you agree with the statements below concerning your work schedule by circling only one answer for each as follows: 1= Strongly disagree (SD); 2= Disagree (D); 3= Undecided (U); 4= Agree (A); 5= Strongly agree (SA)
Statement SD D U A SA
23.1 I have opportunities for a flexible work schedule. 1 2 3 4 5
23.2 Overall, I perceive my work schedule to be fair. 1 2 3 4 5
23.3 I am always compensated when I work overtime. 1 2 3 4 5
23.4 My workload is manageable. 1 2 3 4 5
23.5 I am able to balance the demands of my work with my personal life. 1 2 3 4 5
24. Please indicate the extent to which you agree with the statements below concerning the organisational culture in your facility by circling only one answer for each as follows: 1= Strongly disagree (SD); 2= Disagree (D); 3= Undecided (U); 4= Agree (A); 5= Strongly agree (SA)
Statement SD D U A SA
24.1 Members of this organisation share a common purpose. 1 2 3 4 5
24.2 My performance is assessed according to how best I execute my duties.
1 2 3 4 5
24.3 Employees of this organisation try hard to identify problems and solve them accordingly.
1 2 3 4 5
24.4 The policies of this organisation are consistent with the cultural beliefs of the community.
1 2 3 4 5
24.5 Recruitment of new health workers is done based on qualifications. 1 2 3 4 5
24.6 Promotion of health workers is based on merit. 1 2 3 4 5
24.7 The local political leadership is supportive of health workers. 1 2 3 4 5
24.8 Decentralisation has led to improvement in performance of health 1 2 3 4 5

6
workers.
24.9 Decentralisation has improved my chances for career progression. 1 2 3 4 5
24.10 My co-workers have adequate skills for their jobs. 1 2 3 4 5
24.11 My health facility manager is competent in his/her duties. 1 2 3 4 5
SECTION E: PERFORMANCE DIMENSIONS 25. Please indicate the extent to which you agree with the statements below regarding the responsiveness of the services you provide at this facility by circling only one answer for each as follows: 1= Strongly disagree (SD); 2= Disagree (D); 3= Undecided (U); 4= Agree (A); 5= Strongly agree (SA)
Statement SD D U A SA
25.1 Clients are always happy with the friendly services offered by health workers.
1 2 3 4 5
25.2 Clients are satisfied with the quality of services we provide. 1 2 3 4 5
25.3 Clients are satisfied with the timeliness of the services. 1 2 3 4 5
25.4 The complaints from stakeholders towards individual health workers are rare.
1 2 3 4 5
25.5 The stakeholders are satisfied with the health workers‟ cooperation. 1 2 3 4 5
25.6 The health workers clearly know who they serve. 1 2 3 4 5
25.7 Health workers are always willing to address the clinical & emotional demands of the patients.
1 2 3 4 5
25.8 Health workers get professional support to improve their performance. 1 2 3 4 5
25.9 When at work, I know what is expected of me. 1 2 3 4 5
26. Please indicate the extent to which you agree with the statements below regarding the availability of health workers in your facility by circling only one answer for each as follows: 1= Strongly disagree (SD); 2= Disagree (D); 3= Undecided (U); 4= Agree (A); 5= Strongly agree (SA)
Statement SD D U A SA
26.1 This organisation has a retention policy with clear strategies. 1 2 3 4 5
26.2 I am always available when my services are required. 1 2 3 4 5
26.3 This facility has adequate numbers of health workers to deliver the services.
1 2 3 4 5
26.4 The rural facilities are as well staffed as the urban ones. 1 2 3 4 5
26.5 This facility has an attendance register which is filled by every staff member.
1 2 3 4 5
26.6 I am always present during the official working hours. 1 2 3 4 5
26.7 I put in much effort when I am on duty. 1 2 3 4 5
26.8 Staff attendance in this organisation is good. 1 2 3 4 5
26.9 The workload in this facility is manageable. 1 2 3 4 5
26.10 In this facility the patient waiting time is short. 1 2 3 4 5
27. Please indicate the extent to which you agree with the statements below regarding the productivity of health workers in your facility and district by circling only one answer for each as follows: 1= Strongly disagree (SD); 2= Disagree (D); 3= Undecided (U); 4= Agree (A); 5= Strongly agree (SA)
Statement SD D U A SA
27.1 My productivity is measured according to the number of patients I attend to.
1 2 3 4 5
27.2 This organisation has indicators for measuring staff productivity. 1 2 3 4 5
27.3 I spend most of my time at work attending to the patients. 1 2 3 4 5
27.4 My skills are suited for the type of work I do. 1 2 3 4 5
27.5 My productivity is increased by the availability of drugs & equipment. 1 2 3 4 5
27.6 The management structures in this facility encourage the performance of health workers.
1 2 3 4 5

7
28. Please indicate the extent to which you agree with the statements below regarding your competence by circling only one answer for each as follows: 1= Strongly disagree (SD); 2= Disagree (D); 3= Undecided (U); 4= Agree (A); 5= Strongly agree (SA)
Statement SD D U A SA
28.1 I am confident about my ability to do my job. 1 2 3 4 5
28.2 I have mastered the skills necessary for my job. 1 2 3 4 5
28.3 I am confident about my prescribing practices. 1 2 3 4 5
28.4 I always improve my knowledge and skills through continuous professional education.
1 2 3 4 5
28.5 My attitude towards the care of patients is good. 1 2 3 4 5
28.6 I use my knowledge & skills to improve safety of patients. 1 2 3 4 5
28.7 I always make timely referral of patients that are in need of specialised treatment.
1 2 3 4 5
28.8 I have good communication skills. 1 2 3 4 5
28.9 I am able to use the available communication technology to support patient care.
1 2 3 4 5
SECTION F: PERFORMANCE MANAGEMENT 29. How, if at all is the performance of health workers reviewed in your organisation? Circle only one.
A formal system of regular appraisals with the review of the past performance objectives. 1
Informal, but regular reviews involving discussions about past performance and agreed actions for the future.
2
Informal unscheduled reviews are undertaken especially when there is a performance problem. 3
Not reviewed. 4
30. If you have performance management system in place, how are the results of the performance review utilised? Circle the correct answer to each of the statements below as follows: No =1 Yes = 2
Statement NO YES
30.1 Training 1 2
30.2 Promotion 1 2
30.3 Demotion 1 2
30.4 Rotation 1 2
30.5 Reward 1 2
30.6 Not used 1 2
31. Please indicate the extent to which you agree with the statements below concerning the setting of performance standards in your district by circling only one answer for each as follows: 1= Strongly disagree (SD); 2= Disagree (D); 3= Undecided (U); 4= Agree (A); 5= Strongly agree (SA)
Statement SD D U A SA
31.1 All health workers are familiar with the organisation‟s mission towards the clients.
1 2 3 4 5
31.2 I have a clear job description. 1 2 3 4 5
31.3 The performance standards are clear. 1 2 3 4 5
31.4 There are appropriate performance indicators to assess the health worker‟s performance.
1 2 3 4 5
31.5 Targets are set for activities to be achieved in a given period. 1 2 3 4 5
31.6 The performance standards, indicators, and targets are communicated to all departments to ensure that health workers understand them.
1 2 3 4 5
31.7 This organisation regularly reports the performance standards, indicators, and targets to the external stakeholders (e.g. consumers, councillors, superior authority, suppliers etc).
1 2 3 4 5
31.8 All the stakeholders in this organisation (e.g. health workers, clients, councillors and suppliers) participate in setting the performance standards.
1 2 3 4 5

8
32. Please indicate the extent to which you agree with the statements below concerning performance measurement in your district by circling only one answer for each as follows: 1= Strongly disagree (SD); 2= Disagree (D); 3= Undecided (U); 4= Agree (A); 5= Strongly agree (SA)
Statement SD D U A SA
32.1 Objectives to be achieved are known by individuals to be assessed. 1 2 3 4 5
32.2 The performance standards expected from the staff are clear and understood by all.
1 2 3 4 5
32.3 The district clearly defines the ways of how to measure individual activity performance.
1 2 3 4 5
32.4 This organisation has a system for collecting and tracking staff performance data.
1 2 3 4 5
32.5 This organisation measures most of the established individual performance standards and targets.
1 2 3 4 5
32.6 Individual health worker‟s performance is measured regularly. 1 2 3 4 5
32.7 I am fully aware of the processes used to measure my performance. 1 2 3 4 5
32.8 My performance is evaluated based on my job description. 1 2 3 4 5
32.9 My performance is fairly evaluated. 1 2 3 4 5
33. Please indicate the extent to which you agree with the statements below regarding performance reporting in your district by circling only one answer for each as follows: . 1= Strongly disagree (SD); 2= Disagree (D); 3= Undecided (U); 4= Agree (A); 5= Strongly agree (SA)
Statement SD D U A SA
33.1 This organisation documents the progress related to performance standards and targets.
1 2 3 4 5
33.2 This organisation has a specific system that regularly reports the performance of health workers.
1 2 3 4 5
33.3 Constructive feedback on performance appraisal results is provided on a regular basis.
1 2 3 4 5
33.4 This organisation always reports the health workers‟ performance information to the external stakeholders (such as superiors, clients, councillors etc).
1 2 3 4 5
33.5 The health workers‟ performance data is analysed and reviewed according to the set performance standards, indicators, and targets.
1 2 3 4 5
33.6 The health workers are given opportunity to make comments on the results of their performance.
1 2 3 4 5
34. Please indicate the extent to which you agree with the following statements about performance improvement in your district by circling only one answer for each as follows: . 1= Strongly disagree (SD); 2= Disagree (D); 3= Undecided (U); 4= Agree (A); 5= Strongly agree (SA)
Statement SD D U A SA
34.1 Timely action is taken when performance falls below the acceptable levels.
1 2 3 4 5
34.2 The performance reports are effectively used for decision-making. 1 2 3 4 5
34.3 The health worker‟s performance information is used to set priorities for personal improvement.
1 2 3 4 5
34.4 The staff are involved in decision about performance improvement. 1 2 3 4 5
34.5 This organisation has specific processes to manage changes in policies, programmes, or infrastructure.
1 2 3 4 5
34.6 My supervisors encourage me to use different ways to improve my performance.
1 2 3 4 5
34.7 Rewards and sanctions are based on performance results. 1 2 3 4 5
34.8 The analysis of employee‟s training needs is based on the performance appraisal reports.
1 2 3 4 5
34.9 There are procedures to collect suggestions for performance improvement from the employees.
1 2 3 4 5
34.10 I always have access to my supervisor when I need support. 1 2 3 4 5

9
35. Please indicate the extent to which you agree with the following statements regarding the rewarding system in your district by circling only one answer for each as follows: 1= Strongly disagree (SD); 2= Disagree (D); 3= Undecided (U); 4= Agree (A); 5= Strongly agree (SA)
Statement SD D U A SA
35.1 I am paid in accordance with my experience. 1 2 3 4 5
35.2 My salary is according to my job responsibilities. 1 2 3 4 5
35.3 Hard work is acknowledged and rewarded accordingly. 1 2 3 4 5
35.4 All health workers know their fringe benefits. 1 2 3 4 5
35.5 I am satisfied with the fringe benefits I get from my organisation. 1 2 3 4 5
35.6 I feel my organisation offers sufficient opportunities for promotion 1 2 3 4 5
36. Please indicate the extent to which you agree with the following statements concerning staff training and development system in your district by circling only one answer for each as follows: 1= Strongly disagree (SD); 2= Disagree (D); 3= Undecided (U); 4= Agree (A); 5= Strongly agree (SA)
Statement SD D U A SA
36.1 This organisation has a staff training and development policy. 1 2 3 4 5
36.2 Opportunities exist for career advancement in this organisation. 1 2 3 4 5
36.3 Appropriate training is conducted to ensure that health workers carry out their duties well.
1 2 3 4 5
36.4 Job-specific refresher courses are provided on regular basis. 1 2 3 4 5
36.5 The in-service training provided is adequate in addressing the existing skills gaps.
1 2 3 4 5
36.6 Health workers who are less competent are provided with the necessary support to improve their knowledge and skills.
1 2 3 4 5
36.7 Health workers participate in identifying their career development needs.
1 2 3 4 5
36.8 In the last 6 months my supervisors discussed with me my career development prospects.
1 2 3 4 5
36.9 I have received the training required to succeed in my position. 1 2 3 4 5
37. Overall how do you rate yourself on based on the following statements? Please indicate your responses by circling only one answer for each statement as follows: 1= Very poor (VP); 2= Poor (P); 3= Average (Av); 4= Good (G); 5= Very good (VG)
Statement VP P Av G VG
37.1 My overall performance is… 1 2 3 4 5
37.2 My competence to deliver services is… 1 2 3 4 5
37.3 The quality of service I provide in this facility is… 1 2 3 4 5
37.4 My overall daily attendance is… 1 2 3 4 5
37.5 My overall productivity is… 1 2 3 4 5
37.6 The overall responsiveness of the services I provide is… 1 2 3 4 5
38. In your opinion what suggestions can you make on how your performance can be improved? List at least 4 options in the space provided below.
1.…………………………………………………………………………………………………………………………………………………………………………………………………………………………………………………………............ 2.……………………………………………………………………………………………………………………………………………………………………………………………………………………………………………………………......... 3.……………………………………………………………………………………………………………………………………………………………………………………………………………………………………………………………......... 4……………………………………………………………………………………………………………………………………………………………………………………………………………………………………………………………............ 5.…………………………………………………………………………………………………………………………………………………………………………………………………………………………………………………………............
THANK YOU FOR PARTICIPATING IN THE SURVEY

1
ANNEXURE I: INTERVIEW SCHEDULE FOR THE HEALTH SERVICE MANAGERS
Serial No:
SECTION A: BIOGRAPHIC DATA 1. What is your district of work?
2. For how long have you worked in this district? ……………………………… 3. What is your gender?
4. What is your age category?
5. Do you have any human resource/management qualification/training? Circle only one answer.
If yes, what type of training/programme? ………………………………………………………………………………….............
6. Are there any forums/opportunities where performance of health workers is discussed? Circle the appropriate answer.
7. If you answer „Yes‟ to 6 above, at which of the levels indicated here below are they held? Circle whatever is applicable.
Kumi 1
Mbale 2
Sironko 3
Tororo 4
Female 1
Male 2
less than 20 years 1
20-29 years 2
30-39 years 3
40-49 years 4
50 -59 years 5
60 years and above 6
Yes 1
No 2
Yes 1
No 2
Levels Yes No
Ministry of Health 1 2
District 1 2
Health Sub-district 1 2
Health facility 1 2
One-to-one 1 2

2
SECTION B: OPEN-ENDED QUESTIONS
8. Performance of health workers seems to be a major challenge facing health care organisations in Uganda. In your view 8.1 What are the most important aspects or factors that enhance the performance of
health workers in your district? 8.2 What are the most important aspects or factors that hinder the performance of
health worker in your district? 9. Decentralisation of health services was meant „to improve the accountability, efficiency and
effectiveness in the delivery of services. Some commentators are blaming the sub-optimal performance of health workers to decentralisation in Uganda.‟ 9.1 In your organisation, how has decentralisation affected the performance of health
workers? 10. Health workers‟ behaviour has an important contribution towards delivery of services in their
respective health facilities. How do you describe the behaviour of health workers under the following areas: 10.1 Behaviours towards the patients/clients? 10.2 Adaptive behaviour to changes in the health sector? 10.3 Proactive behaviour with regards to innovativeness towards service delivery? 10.4 Proficiency behaviour for performance?
11. In your district, how do you describe the following as regards to health workers: 11.1 Availability? 11.2 Competence? 11.3 Responsiveness? 11.4 Productivity?
12. In your opinion, what could be done to improve the performance of health workers in this organisation or district?
13. Noe et al (2008:344), describe performance management as “a means through which
managers ensure that employees‟ activities and outputs are in line with the organisation‟s goals”. In your organisation or district, how do you implement the following activities geared towards managing health worker performance? 13.1 Plan for performance appraisal of health workers? 13.2 Measure performance of health workers? 13.3 Reporting performance of health workers? 13.4 Recognise performance of health workers?
14. In your organisation, how do you use the information obtained during health workers‟
performance evaluation?
15. Do you have any suggestion on how the process of performance appraisal of health workers in your organisation or district can be improved?
THANK YOU FOR PARTICIPATING IN THE SURVEY

1
ANNEXURE J: TESTS FOR NORMALITY OF DATA FROM HEALTH WORKERS’ QUESTIONNAIRE
Kolmogorov-Smirnov
a Shapiro-Wilk
Statistic df Sig. Statistic df Sig.
Q12. Self monitoring ability .122 276 .000 .936 276 .000 Q13. Self motivation (Intrinsic Motivation)
.263 276 .000 .755 276 .000
Q14. Commitment to the organisation
.261 276 .000 .805 276 .000
Q15. Individual values and beliefs
.210 276 .000 .840 276 .000
Q16. Individual proficiency behaviours
.193 276 .000 .888 276 .000
Q17. Individual adaptive behaviours
.271 276 .000 .846 276 .000
Q18. Individual proactive behaviours
.299 276 .000 .796 276 .000
Q19. Individual client oriented behaviours
.180 276 .000 .856 276 .000
Q20. Clarity of the organisation strategy
.125 276 .000 .918 276 .000
Q21. Working environment .160 276 .000 .923 276 .000 Q22. Staffing of your organisation
.196 276 .000 .918 276 .000
Q23. Your work schedule .169 276 .000 .924 276 .000 Q24. Your organisation culture
.193 276 .000 .918 276 .000
Q25. Responsiveness of the services your provide
.242 276 .000 .896 276 .000
Q26. Availability of health workers
.262 276 .000 .828 276 .000
Q27. Productivity of health workers
.193 276 .000 .913 276 .000
Q28. Competence of health workers
.131 276 .000 .927 276 .000
Q31. Setting of performance standards
.257 276 .000 .857 276 .000
Q32. Performance measurement in your district
.257 276 .000 .817 276 .000
Q33. Performance reporting in your district
.134 276 .000 .908 276 .000
Q35. Rewarding system in your district
.140 276 .000 .931 276 .000
Q36. Staff training and development in your district
.257 276 .000 .889 276 .000
Q37. Your overall performance
.238 276 .000 .804 276 .000
Q34. Performance improvement in your district
.187 276 .000 .891 276 .000
Q11. Skills and abilities .127 276 .000 .931 276 .000
a. Lilliefors Significance Correction

2
ANNEXURE K: CORRELATION MATRICES BETWEEN INDIVIDUAL ATTRIBUTES AND PERFORMANCE DIMENSIONS
Correlations
Spearman‟s rho rank order Non parametric correlations
Q11. Skills and abilities
Q12. Self monitoring ability
Q13. Self motivation (Intrinsic
Motivation)
Q14. Commitment to the organisati
on
Q15. Individual
values and
beliefs
Q25. Responsiveness of
the services
your provide
Q26. Availability of health
workers
Q27. Productivi
ty of health
workers
Q28. Compete
nce of health
workers
Spearman‟s rho
Q11. Skills and abilities
Correlation Coefficient
1.000 .353** .161
** .130
* -.098 .180
** .018 .453
** .998
**
Sig. (2-tailed) . .000 .007 .030 .105 .003 .770 .000 .000
N 276 276 276 276 276 276 276 276 276
Q12. Self monitoring ability
Correlation Coefficient
.353** 1.000 .766
** .533
** .536
** .391
** .642
** .067 .316
**
Sig. (2-tailed) .000 . .000 .000 .000 .000 .000 .269 .000
N 276 276 276 276 276 276 276 276 276
Q13. Self motivation (Intrinsic Motivation)
Correlation Coefficient
.161** .766
** 1.000 .877
** .858
** .687
** .798
** .371
** .586
**
Sig. (2-tailed) .007 .000 . .000 .000 .000 .000 .000 .000
N 276 276 276 276 276 276 276 276 276
Q14. Commitment to the organisation
Correlation Coefficient
.130* .533
** .877
** 1.000 .671
** .794
** .820
** .439
** .452
**
Sig. (2-tailed) .030 .000 .000 . .000 .000 .000 .000 .000
N 276 276 276 276 276 276 276 276 276
Q15. Individual values and beliefs
Correlation Coefficient
-.098 .536** .858
** .671
** 1.000 .617
** .570
** .346
** .577
**
Sig. (2-tailed) .105 .000 .000 .000 . .000 .000 .000 .000
N 276 276 276 276 276 276 276 276 276
Q25. Responsiveness of the services your provide
Correlation Coefficient
.180** .391
** .687
** .794
** .617
** 1.000 .908
** .515
** .437
**
Sig. (2-tailed) .003 .000 .000 .000 .000 . .000 .000 .000
N 276 276 276 276 276 276 276 276 276
Q26. Availability of health workers
Correlation Coefficient
.018 .642** .798
** .820
** .570
** .908
** 1.000 .484
** .416
**
Sig. (2-tailed) .770 .000 .000 .000 .000 .000 . .000 .000

3
N 276 276 276 276 276 276 276 276 276
Q27. Productivity of health workers
Correlation Coefficient
.453** .067 .371
** .439
** .346
** .515
** .484
** 1.000 .031
Sig. (2-tailed) .000 .269 .000 .000 .000 .000 .000 . .603
N 276 276 276 276 276 276 276 276 276
Q28. Competence of health workers
Correlation Coefficient
.998** .316
** .586
** .452
** .577
** .437
** .416
** .031 1.000
Sig. (2-tailed) .000 .000 .000 .000 .000 .000 .000 .603 .
N 276 276 276 276 276 276 276 276 276
**. Correlation is significant at the 0.01 level (2-tailed). *. Correlation is significant at the 0.05 level (2-tailed).

4
ANNEXURE L: CORRELATION MATRICES BETWEEN INDIVIDUAL BEHAVIOURS AND PERFORMANCE DIMENSIONS
Correlations
Spearman‟s rho rank order Non parametric correlations
Q16. Individual
proficiency behaviours
Q17. Individual adaptive
behaviours
Q18. Individual proactive
behaviours
Q19. Individual
client oriented
behaviours
Q25. Responsiveness of
the services
your provide
Q26. Availability of health workers
Q27. Productivity of health
workers
Q28. Competen
ce of health
workers
Spearman's rho
Q16. Individual proficiency behaviours
Correlation Coefficient
1.000 .593** .597
** .823
** .856
** .724
** .235
** .562
**
Sig. (2-tailed) . .000 .000 .000 .000 .000 .000 .000
N 276 276 276 276 276 276 276 276
Q17. Individual adaptive behaviours
Correlation Coefficient
.593** 1.000 .455
** .396
** .623
** .659
** .343
** .643
**
Sig. (2-tailed) .000 . .000 .000 .000 .000 .000 .000
N 276 276 276 276 276 276 276 276
Q18. Individual proactive behaviours
Correlation Coefficient
.597** .455
** 1.000 .409
** .598
** .759
** .262
** .359
**
Sig. (2-tailed) .000 .000 . .000 .000 .000 .000 .000
N 276 276 276 276 276 276 276 276
Q19. Individual client oriented behaviours
Correlation Coefficient
.823** .396
** .409
** 1.000 .669
** .537
** .396
** .449
**
Sig. (2-tailed) .000 .000 .000 . .000 .000 .000 .000
N 276 276 276 276 276 276 276 276
Q25. Responsiveness of the services your provide
Correlation Coefficient
.856** .623
** .598
** .669
** 1.000 .908
** .515
** .437
**
Sig. (2-tailed) .000 .000 .000 .000 . .000 .000 .000
N 276 276 276 276 276 276 276 276
Q26. Availability of health workers
Correlation Coefficient
.724** .659
** .759
** .537
** .908
** 1.000 .484
** .416
**
Sig. (2-tailed) .000 .000 .000 .000 .000 . .000 .000
N 276 276 276 276 276 276 276 276
Q27. Productivity of health workers
Correlation Coefficient
.235** .343
** .262
** .396
** .515
** .484
** 1.000 .031
Sig. (2-tailed) .000 .000 .000 .000 .000 .000 . .603

5
N 276 276 276 276 276 276 276 276
Q28. Competence of health workers
Correlation Coefficient
.562** .643
** .359
** .449
** .437
** .416
** .031 1.000
Sig. (2-tailed) .000 .000 .000 .000 .000 .000 .603 .
N 276 276 276 276 276 276 276 276
**. Correlation is significant at the 0.01 level (2-tailed).

6
ANNEXURE M: CORRELATION MATRICES BETWEEN ORGANISATIONAL FACTORS AND PERFORMANCE DIMENSIONS
Correlations
Spearman‟s rho rank order Non parametric correlations
Q20. Clarity of
the organisati
on strategy
Q21. Working environm
ent
Q22. Staffing of
your organisati
on
Q23. Your work
schedule
Q24. Your organisation culture
Q25. Responsiveness of
the services
your provide
Q26. Availability of health
workers
Q27. Productivi
ty of health
workers
Q28. Compete
nce of health
workers
Spearman's rho
Q20. Clarity of the organisation strategy
Correlation Coefficient
1.000 .807** .700
** .519
** .841
** .747
** .756
** .600
** .473
**
Sig. (2-tailed) . .000 .000 .000 .000 .000 .000 .000 .000
N 276 276 276 276 276 276 276 276 276
Q21. Working environment
Correlation Coefficient
.807** 1.000 .920
** .873
** .965
** .889
** .963
** .451
** .332
**
Sig. (2-tailed) .000 . .000 .000 .000 .000 .000 .000 .000
N 276 276 276 276 276 276 276 276 276
Q22. Staffing of your organisation
Correlation Coefficient
.700** .920
** 1.000 .824
** .916
** .814
** .908
** .592
** .176
**
Sig. (2-tailed) .000 .000 . .000 .000 .000 .000 .000 .003
N 276 276 276 276 276 276 276 276 276
Q23. Your work schedule
Correlation Coefficient
.519** .873
** .824
** 1.000 .811
** .742
** .869
** .268
** .206
**
Sig. (2-tailed) .000 .000 .000 . .000 .000 .000 .000 .001
N 276 276 276 276 276 276 276 276 276
Q24. Your organisation culture
Correlation Coefficient
.841** .965
** .916
** .811
** 1.000 .890
** .934
** .538
** .386
**
Sig. (2-tailed) .000 .000 .000 .000 . .000 .000 .000 .000
N 276 276 276 276 276 276 276 276 276
Q25. Responsiveness of the services your provide
Correlation Coefficient
.747** .889
** .814
** .742
** .890
** 1.000 .908
** .515
** .437
**
Sig. (2-tailed) .000 .000 .000 .000 .000 . .000 .000 .000
N 276 276 276 276 276 276 276 276 276
Q26. Availability of health workers
Correlation Coefficient
.756** .963
** .908
** .869
** .934
** .908
** 1.000 .484
** .416
**

7
Sig. (2-tailed) .000 .000 .000 .000 .000 .000 . .000 .000
N 276 276 276 276 276 276 276 276 276
Q27. Productivity of health workers
Correlation Coefficient
.600** .451
** .592
** .268
** .538
** .515
** .484
** 1.000 .031
Sig. (2-tailed) .000 .000 .000 .000 .000 .000 .000 . .603
N 276 276 276 276 276 276 276 276 276
Q28. Competence of health workers
Correlation Coefficient
.473** .332
** .176
** .206
** .386
** .437
** .416
** .031 1.000
Sig. (2-tailed) .000 .000 .003 .001 .000 .000 .000 .603 .
N 276 276 276 276 276 276 276 276 276
**. Correlation is significant at the 0.01 level (2-tailed).

8
ANNEXURE N: CORRELATION MATRIX BETWEEN PERFORMANCE MANAGEMENT AND PERFORMANCE DIMENSIONS
Spearman‟s rho rank order
Non parametric correlations
Q31. Setting
of perform
ance standard
s
Q32. Perform
ance measurement in
your district
Q33. Perform
ance reporting in your district
Q34. Perform
ance improvement in
your district
Q35. Rewardi
ng system in your district
Q36. Staff
training and
development in
your district
Q25. Responsiveness
of the services
your provide
Q26. Availabil
ity of health
workers
Q27. Productivity of health
workers
Q28. Competence of health
workers
Spearman's rho
Q31. Setting of performance standards
Correlation Coefficient
1.000 .893** .875
** .803
** .717
** .738
** .842
** .885
** .569
** .365
**
Sig. (2-tailed) . .000 .000 .000 .000 .000 .000 .000 .000 .000
N 276 276 276 276 276 276 276 276 276 276
Q32. Performance measurement in your district
Correlation Coefficient
.893** 1.000 .860
** .629
** .496
** .614
** .676
** .644
** .469
** .349
**
Sig. (2-tailed) .000 . .000 .000 .000 .000 .000 .000 .000 .000
N 276 276 276 276 276 276 276 276 276 276
Q33. Performance reporting in your district
Correlation Coefficient
.875** .860
** 1.000 .787
** .710
** .714
** .728
** .712
** .680
** .094
Sig. (2-tailed) .000 .000 . .000 .000 .000 .000 .000 .000 .120
N 276 276 276 276 276 276 276 276 276 276
Q34. Performance improvement in your district
Correlation Coefficient
.803** .629
** .787
** 1.000 .860
** .892
** .874
** .861
** .349
** .195
**
Sig. (2-tailed) .000 .000 .000 . .000 .000 .000 .000 .000 .001
N 276 276 276 276 276 276 276 276 276 276
Q35. Rewarding system in your district
Correlation Coefficient
.717** .496
** .710
** .860
** 1.000 .737
** .735
** .871
** .435
** .319
**
Sig. (2-tailed) .000 .000 .000 .000 . .000 .000 .000 .000 .000
N 276 276 276 276 276 276 276 276 276 276
Q36. Staff training and development in your district
Correlation Coefficient
.738** .614
** .714
** .892
** .737
** 1.000 .799
** .801
** .387
** . 842
**
Sig. (2-tailed) .000 .000 .000 .000 .000 . .000 .000 .000 .000
N 276 276 276 276 276 276 276 276 276 276
Q25. Responsivenes
Correlation Coefficient
.842** .676
** .728
** .874
** .735
** .799
** 1.000 .908
** .515
** .437
**

9
s of the services your provide
Sig. (2-tailed) .000 .000 .000 .000 .000 .000 . .000 .000 .000
N 276 276 276 276 276 276 276 276 276 276
Q26. Availability of health workers
Correlation Coefficient
.885** .644
** .712
** .861
** .871
** .801
** .908
** 1.000 .484
** .416
**
Sig. (2-tailed) .000 .000 .000 .000 .000 .000 .000 . .000 .000
N 276 276 276 276 276 276 276 276 276 276
Q27. Productivity of health workers
Correlation Coefficient
.569** .469
** .680
** .349
** .435
** .387
** .515
** .484
** 1.000 .031
Sig. (2-tailed) .000 .000 .000 .000 .000 .000 .000 .000 . .603
N 276 276 276 276 276 276 276 276 276 276
Q28. Competence of health workers
Correlation Coefficient
.365** .349
** .094 .195
** .319
** . 842
** .437
** .416
** .031 1.000
Sig. (2-tailed) .000 .000 .120 .001 .000 .000 .000 .000 .603 .
N 276 276 276 276 276 276 276 276 276 276
**. Correlation is significant at the 0.01 level (2-tails)

10
10