DEBORA RESEARCH FINAL - CORE
81
LUKU SERVICE QUALITY AND CUSTOMER SATISFACTION IN TANZANIA: A CASE STUDY OF KINONDONI MUNICIPAL. DEBORA DAVID MWAKAJE A DISSERTATION SUBMITTED IN PARTIAL FULFILLMENT OF THE REQUIREMENT FOR THE AWARD OF MASTER OF PROJECT MANAGEMENT (MPM) OF THE OPEN UNIVERSITY OF TANZANIA 2015 brought to you by CORE View metadata, citation and similar papers at core.ac.uk provided by Digital Library of Open University of Tanzania
-
Upload
khangminh22 -
Category
Documents
-
view
2 -
download
0
Transcript of DEBORA RESEARCH FINAL - CORE
LUKU SERVICE QUALITY AND CUSTOMER SATISFACTION IN
TANZANIA: A CASE STUDY OF KINONDONI MUNICIPAL.
DEBORA DAVID MWAKAJE
A DISSERTATION SUBMITTED IN PARTIAL FULFILLMENT OF THE
REQUIREMENT FOR THE AWARD OF MASTER OF PROJECT
MANAGEMENT (MPM) OF THE OPEN UNIVERSITY OF TANZANIA
2015
brought to you by COREView metadata, citation and similar papers at core.ac.uk
provided by Digital Library of Open University of Tanzania

i
CERTIFICATION
I the undersigned, certify that I have read and hereby recommend for acceptance by
the Open University of Tanzania, a dissertation entitled “LUKU Service Quality and
Customer Satisfaction in Tanzania: A Case Study of Kinondoni Municipal”, in
partial fulfillment of the requirements for the award of the master’s Degree of
Business Administration in Project Management.
………………………………………………
Dr. Salvio Macha
(Supervisor)
………………………………….
Date
ii
COPYRIGHT
This dissertation is a copyright material protected under the Berne Convention, the
Copyright Act, 1999 and other international enactments, in that behalf, on
intellectual property. It may not be reproduced by any means in full or in part, except
for short extracts in fair dealings, for research or private study, critical scholarly
review or discourse with an acknowledgement, without the written permission of the
Open University of Tanzania.
iii
DECLARATION
I, Debora Mwakaje, do hereby declare that this is my original work and has not been
submitted and will not be presented to any other College, Institution, or University
other than the Open University of Tanzania for academic credit.
…………………………………………
Signature
…………………………………..
Date

iv
DEDICATION
This dissertation is dedicated to my lovely husband Colnely for his love and care
with great support financially and morally. And my one and only daughter Cherish
for her tolerance during the whole time. They gave me the brevity to overcome all
the difficulties faced during my college time, you are the best.
v
ACKNOWLEDGEMENTS
Above all, I thank my almighty God for giving me strength and grace to go through
the course and the completion of this dissertation, also for helping me throughout my
life time. I would like also to acknowledge all who in one way or another, have given
me support in accomplishing this dissertation. Special thanks go to my Supervisor
Dr. Salvio Macha, for his tirelessly and constructive criticism he provided throughout
this research undertakings, despite his heavy duties and coordinating a lot of
activities at the Open University of Tanzania and elsewhere. He has been close to my
concern and absolutely helpful whenever I asked for his assistance.
Next, I would like to give my sincere gratitude to the staff from TANESCO and their
customers who lives at Kinondoni Municipal for their valuable contribution
particularly during data collection phase. Special thanks goes to my family: my
mother Tusajigwe, my mother in law Joyce, my sister Tumpe and my brother Mpoki
for their encouragement when writing this dissertation.
Lastly, special acknowledgements go to my lectures, my relatives, my friends, my
colleagues and my neighbours for their unique encouragement while I pursued this
course. May the almighty GOD bless you all.
Thank you all
vi
ABSTRACT
The main objective of this study was to conduct an assessment of Lipia Umeme
Kadiri Unavyotumia (LUKU) service quality and customer satisfaction in
Tanzania. The general objective of the study was to analyze LUKU service quality
and customer satisfaction in Tanzania. Specific objectives included: to identify
factors that influence LUKU service customer satisfaction, to identify factors that
influence LUKU service customers’ satisfaction, to measure satisfaction levels of
among LUKU service customers and finally to identify common problems facing
LUKU service customers. The main findings of the research revealed that there is a
positive relationship between service quality and customer satisfaction and thus
high quality services lead to high customer satisfaction. The study also revealed
that majority of the customers is not satisfied with the quality of LUKU services.
The study recommends that TANESCO should set a mechanism for collection of
views and concerns from customers and relevant stakeholders and work to solve
them, enhance application of modern technology in its operations, build capacity of
its staff on aspects of customer care and services, re-evaluate pricing strategy in
line with customer satisfaction goal, enhance operational controls to enhance
management of resources.
vii
TABLE OF CONTENTS
CERTIFICATION ...................................................................................................... i
COPYRIGHT ............................................................................................................. ii
DECLARATION ....................................................................................................... iii
DEDICATION ........................................................................................................... iv
ACKNOWLEDGEMENTS ...................................................................................... v
ABSTRACT ............................................................................................................... vi
LIST OF TABLES .................................................................................................... xi
LIST OF ABBREVIATIONS ................................................................................ xiii
CHAPTER ONE ........................................................................................................ 1
INTRODUCTION .................................................................................................. 1
1.0 Introduction ........................................................................................................ 1
1.1 Background to the Study. ................................................................................... 1
1.0.1 Statement of the Research Problem ................................................................ 3
1.0.2 Research Objectives ........................................................................................ 4
1.0.2.1 General Objective ......................................................................................... 4
1.0.2.2 Specific Objectives ....................................................................................... 4
1.0.2.3 General Question .......................................................................................... 5
1.0.2.4 Specific Questions ........................................................................................ 5
1.0.3 Significance of the Study ............................................................................... 5
1.0.4 Organization of the Study ............................................................................... 5
CHAPTER TWO ....................................................................................................... 7
LITERATURE REVIEW ......................................................................................... 7
2.0 Introduction ............................................................................................................ 7
viii
2.1 Theoretical literature Review ............................................................................. 7
2.1.1 Overview of Concepts ..................................................................................... 7
2.1.1.1 Service Quality ............................................................................................. 7
2.1.1.2 LUKU ........................................................................................................ 8
2.1.1.3 Customer Satisfaction ................................................................................ 8
2.1.1.4 Customer Loyalty ...................................................................................... 9
2.2.1 Theories of Customer Satisfaction .................................................................. 9
2.2.1.1 Disconfirmation Theory ............................................................................... 9
2.2.1.2 Contrast Theory .......................................................................................... 11
2.3 Empirical Literature Review ............................................................................ 12
2.4 Conceptual Framework .................................................................................... 16
CHAPTER THREE ................................................................................................. 18
RESEARCH METHODOLOGY ........................................................................ 18
3.0 Introduction ...................................................................................................... 18
3.1 Research Design ............................................................................................... 18
3.2 Area of the Study .............................................................................................. 18
3.3 Research Approach .......................................................................................... 19
3.4 Study Population .............................................................................................. 20
3.5 Sample Size, Distribution and procedures ....................................................... 20
3.6 Data Collection ................................................................................................ 21
3.6.1 Questionnaire ................................................................................................ 21
3.6.2 Interview ........................................................................................................ 22
3.6.3 Documentary Review .................................................................................... 22
3.6.4 Observations .................................................................................................. 22
ix
3.7 Types of Data ................................................................................................... 23
3.7.1 Primary Data ................................................................................................. 23
3.7.2 Secondary Data ............................................................................................. 23
3.8 Sampling Procedures ....................................................................................... 24
3.9 Data Analysis Procedures ................................................................................. 24
CHAPTER FOUR .................................................................................................... 25
STUDY FINDINGS AND DISCUSSION .............................................................. 25
4.0 Introduction ...................................................................................................... 25
4.1 Group of LUKU Service and Customers Served by TANESCO ..................... 25
4.2 General information of the respondents ........................................................... 25
4.1.1 Gender of Respondents ................................................................................. 25
4.1.2 Age Patterns of the Respondents ................................................................... 26
4.1.3 Education Level of Respondents ................................................................... 27
4.1.4 Research findings, 2015 ................................................................................ 28
4.1.5 Occupation of Respondents ........................................................................... 28
4.2 Customer Satisfaction on Service Quality ....................................................... 29
4.2.1 The Level of Customer Satisfaction on LUKU Service Quality ................... 29
4.2.2 Consideration on the Indicators of LUKU Service satisfaction .................... 30
4.2.3 Level of satisfaction with regard to the LUKU service satisfaction…………..
indicators. ...................................................................................................... 32
4.2.3.1 Price – the value of the service ................................................................... 32
4.2.3.2 Timeliness – ability to deliver service timely ............................................ 33
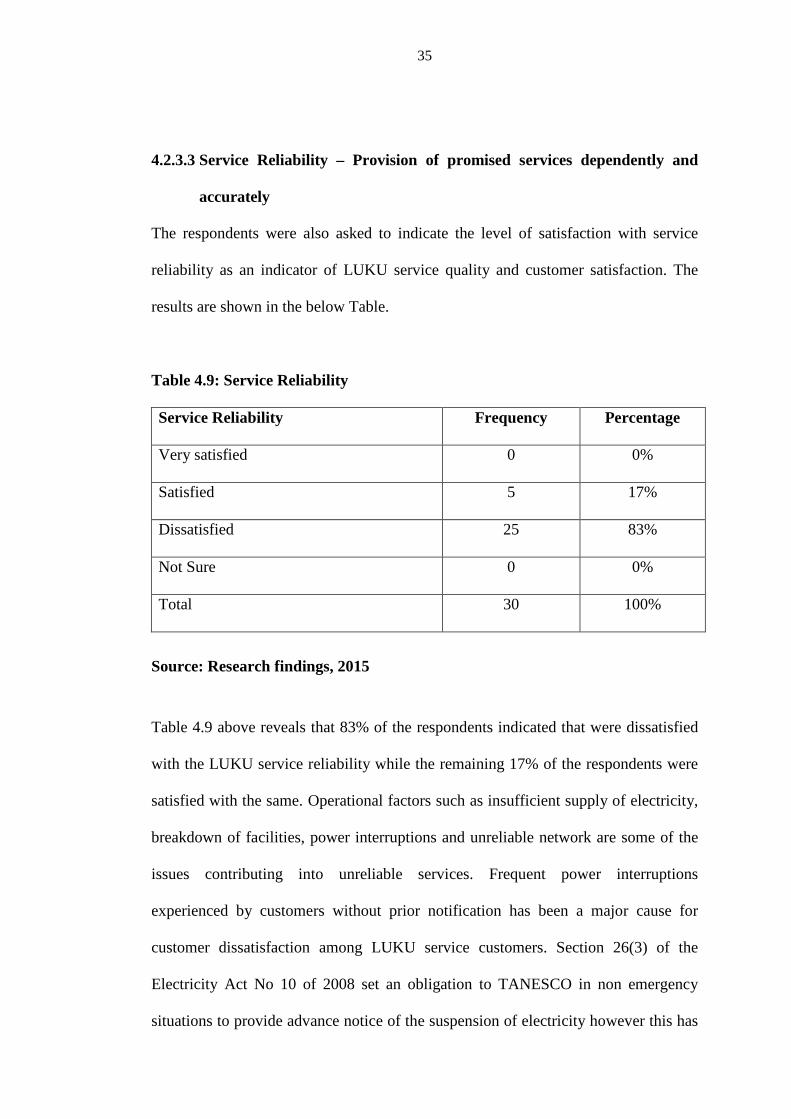
4.2.3.3 Service Reliability – Provision of promised services dependently and
accurately ............................................................................................................... 35

x
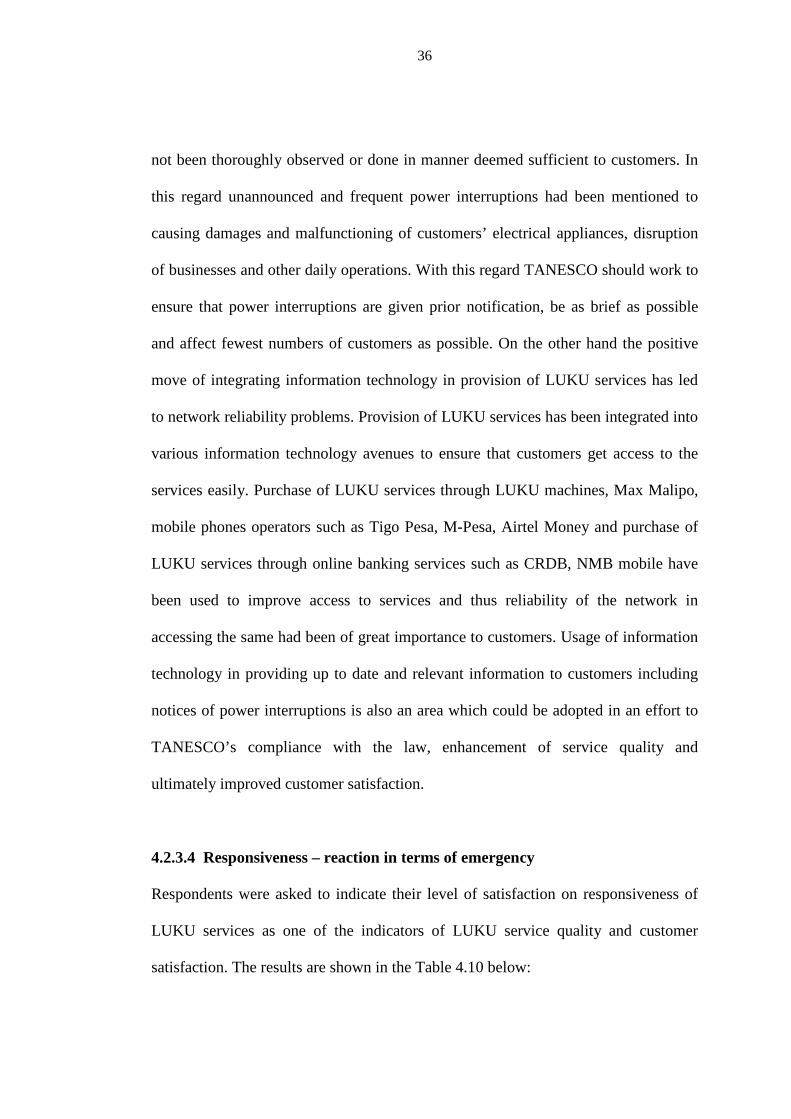
4.2.3.4 Responsiveness – reaction in terms of emergency .................................. 36
4.2.3.5 Empathy – capacity of the staff understanding the customer’s condition
from their perspective .................................................................................. 38
4.3 Factors Indicating Customers dissatisfaction ................................................... 40
4.3 Challenges and Solutions towards ensuring customer satisfaction in…………..
TANESCO ..................................................................................................... 42
4.3.1 Challenges towards Ensuring Customer Satisfaction .................................... 42
4.3.2 Proposed Solutions to the Challenges to Enhance Customer Satisfaction .... 44
4.3.3 Discussion of the findings ............................................................................. 46
CHAPTER FIVE ..................................................................................................... 48
SUMMARY, CONCLUSSION AND RECOMMENDATIONS ......................... 48
5.0 Introduction ...................................................................................................... 48
5.1 Summary .......................................................................................................... 48
5.2 Conclusion ........................................................................................................ 48
5.3 Recommendations ............................................................................................ 50
5.4 Future Research Topics .................................................................................... 52
REFERENCES ......................................................................................................... 53
APPENDICES .......................................................................................................... 59
xi
LIST OF TABLES
Table 3.1: Respondents Selected in the Study……….………...…………….……...21
Table 4.1: Gender of Respondent .............................................................................. 26
Table 4.2: Age of Respondents .................................................................................. 27
Table 4.3: Education level of Respondents ................................................................ 28
Table 4.4: Occupation of Respondents ...................................................................... 29
Table 4.5: Satisfaction Level on LUKU Service ....................................................... 29
Table 4.6: Indicators of LUKU service satisfaction .................................................. 30
Table 4.7: Price .......................................................................................................... 32
Table 4.8: Timeliness ................................................................................................. 33
Table 4.9: Service Reliability..................................................................................... 35
Table 4.10: Responsiveness ....................................................................................... 37
Table 4.11: Empathy .................................................................................................. 38
Table 4.12: Reasons for Customer Dissatisfaction .................................................... 40
Table 4.13: Challenges ............................................................................................... 42
Table 4.14: Proposed solutions to the challenges ...................................................... 44

xii
LIST OF FIGURES
FIGURE 2.1: Disconfirmation Theory Model…………………………………10
FIGURE 2.3: Conceptual Framework…………………………………………17

xiii
LIST OF ABBREVIATIONS
AMI Advanced Metering Infrastructure
AMR Automatic Meter Reading
CT Current Transformer
DISCOs Distribution Companies
DNO’s Electricity Distribution Network Operators
EEPCO Ethiopian Electricity Power Corporation
EPS Electronic Physical Security
IPPs Independent Power Plants
KWh Kilowatt hour
KV Kilovolts
LUKU Lipia Umeme Kadiri Unavyotumia
MUSA Multicriteria Satisfaction Analysis
SERVQUAL Service Quality
TANESCO Tanzania Electricity Supply Company
V Voltage
ZECO Zanzibar Electricity Supply Corporation
1
CHAPTER ONE
INTRODUCTION
1.0 Introduction
This chapter presents the general context of the study. The chapter covers the
background to the study, statement of the research problem, research objectives,
research questions, significance of the study, and area of the study.
1.1 Background to the Study.
Customer satisfaction is a measure of how a product or service supplied by a company
meet or surpass a customer’s satisfaction. It also follows that in order to meet
customer expectations and achieve customer satisfaction, a company must offer a
quality product or service. Service quality and customer satisfaction therefore are very
important aspects in management of a product or service. In current global business
environment, providing a superior service quality and providing customer satisfaction
through adequate focus on customer is one of the key factors enabling firms to gain a
lasting competitive advantages in the Market (Akele, 2012). According to Zeithamil,
et al (2009) customer satisfaction helps companies in many ways such as, assisting
companies to evaluate their ability in meeting customers’ needs and expectations and
helps companies to analyze the performance of an offering to customers in order to
identify areas for improvements as well as what areas customer consider to be very
important. For this reason, companies have been focusing on continuous monitoring
and evaluation of service quality with innovative offerings and service developments
with direct influence on customer experience and ultimate satisfaction (Ladhari, 2011)
Although companies worldwide appreciates the importance of maintaining service
2
quality and customer satisfaction for their business survival and growth, at the same
time, several organizations have been experiencing increasing level of retail
customers’ dissatisfaction (Mistry, 2013). The rational point of view suggest that the
probable causes may include but not limited to low product quality, poor customer
service, low responsiveness from staff and unreliable service. However, whether any
of these causes for dissatisfaction are true and the extent to which they impact on
customer satisfaction is not known. Moreover, there may be other causes which are
out of the above list of possible causes but none has been established.
Power supply companies being among the players in the service offering business are
also subjected to the realities of service quality influence on experience and
satisfaction of the final consumer. TANESCO being a major producer of electricity
for private sectors, public sectors and domestic users have been striving to achieve
increased efficiency, quality services, availability of affordable power and customer
satisfaction. It is worth noting however that despite the importance of service quality
and customer satisfaction as well as TANESCO’s effort to meet customer
expectations, there has been genuine calls among LUKU service customers implying
poor services and customer dissatisfaction. On the other hand despite of the
significance of customer satisfaction and service quality, there is still limited
literature available addressing issues of service quality and customer satisfaction on
electrical services specifically LUKU services. It is from this backdrop that the study
aimed at analyzing LUKU service quality and customer satisfaction in Tanzania.
3
1.0.1 Statement of the Research Problem
In order to evolve, survive and prosper in business world a company has to strive to
create quality of service and products sufficient to achieve satisfaction experiences to
the customers and consumers. The study of service quality and customer satisfaction
cut across all types of business including supply of electrical services and products.
Even though customer satisfaction has been studied extensively (Ibook and Udofot,
2012), only few studies have been dedicated to assess the impact of service quality
and customer satisfaction on electricity services and products. Among the few
studies conducted in this field include the study conducted by Abdullateef (2013),
which focused on the determinants of electricity customers’ satisfaction in selected
electricity distribution zone in Nigeria to determine their level of satisfaction. On the
other hand, Akele (2012) conducted a study on customer service quality in Ethiopian
Electrical Power Corporation. Both of those studies like few others focused on
aspects of service quality and customers satisfaction in electrical power services in
geographical areas other than Tanzania. At first glance it may seem that service
quality and customer satisfaction aspects of revealed in other regions may similarly
apply in all similar organizations in other regions. This perception however fails to
take into account that service quality and customer satisfaction may be influenced by
country specific social, political, cultural, economical, technological and perhaps
legal variables. It is for this reason that although there is abundant of literature on
service quality and customer satisfaction some business companies are still
experiencing customer dissatisfaction toward their services and products. This
situation also explains why customer dissatisfaction has persisted in some electric
power companies especially in developing countries like Tanzania. By rethinking our
4
approach to specifically address service quality and customer satisfaction, companies
can be in a better position to adopt appropriate measures for enhancement of
technical and functional qualities of products in ensuring customer satisfaction.
Unless we understand that in order to avoid companies suffer the consequences’ of
poor quality and customer dissatisfaction, organizations need to understand specific
influences of quality and customer satisfaction to allow for application of relevant
enhancement strategies, then organizations will continue to suffer.
Considering the potential impact of aspects of service quality and customer
satisfaction has on organizational survival, growth and prosperity, there was a great
need to conduct an assessment of prevailing LUKU service quality and customer
satisfaction in Tanzania in order to find out the influences of service quality and
satisfaction and determine measures for improvement.
1.0.2 Research Objectives
1.0.2.1 General Objective
The research aimed to analyze LUKU service quality and customer satisfaction in
Tanzania.
1.0.2.2 Specific Objectives
i) To identify factors that influence LUKU service customers’ satisfaction.
ii) To measure satisfaction levels among LUKU service customers.
iii) To identify common problems facing LUKU service customers

5
1.0.2.3 General Question
This study sought to answer the following research questions;
i) What are the levels of LUKU service quality and customer satisfactions?
1.0.2.4 Specific Questions
i) What are the factors that influence LUKU service customers’
satisfaction?
ii) What are the satisfaction levels of LUKU service customers?
iii) What are the common problems facing LUKU service customers?
1.0.3 Significance of the Study
It is envisioned that the findings of this study will go a long way in helping, widen
the general understanding and contribute to literature on LUKU service quality and
customer satisfaction. The study will also to assist TANESCO to assess the quality of
LUKU service system and applies the finding of the study to enhance the quality of
the services offered and customers’ satisfaction. In addition, the findings of the study
may provide relevant to other utility companies in enhancement of the service quality
and the level of customer satisfaction. Since the nature of the study is unique and still
unexplored it is expected that the findings of the study will advance knowledge in the
field and provide a platform to conduct further research in the area
1.0.4 Organization of the Study
The study focused on understanding LUKU service quality and customer
satisfaction, Kinondoni municipal was chosen as a case study. Specifically the study

6
analyzed the understanding of the current levels of service quality and customer
satisfaction and recommends measures for improvement. Key informant interviews,
questionnaires and documentary review were deployed as methods for data
collection. Through the application of the above mentioned methods, the study
objectives have been achieved and key findings have been documented with regard
to the objectives. The study shows that there is a positive relationship between
service quality and customer satisfaction and the level of customer satisfaction has
been revealed to be substandard.
In view of the above achievement and contribution of customer’s satisfaction, this
thesis has been organized in five chapters. The first chapter provides an introduction
into service quality and customers’ satisfaction in different contexts, clarification of
the problem and study objectives. The second chapter covers definitions of key
concepts, the theoretical reviews, empirical reviews and conceptual framework to
customer satisfaction in different contexts. The third chapter set out the methodology
for assessing the evidence and covers study location, sampling and methods for data
collection. Chapter four presents study findings, discussion and analysis. Chapter
five concludes the findings and draw recommendations for present and future
organizational, staff and research agenda.
7
CHAPTER TWO
LITERATURE REVIEW
2.0 Introduction
This chapter intends to discuss literatures which are relevant to the study. It will
discuss the current theories and practices that are relevant to the study. The chapter
intends to reveal the conceptual, theoretical and empirical backgrounds done by
different scholars and authors on issues of customer satisfaction. Areas covered in
this chapter include overview of concepts, theoretical framework and empirical
studies.
2.1 Theoretical literature Review
2.1.1 Overview of Concepts
2.1.1.1 Service Quality
Service quality is a focused evaluation that reflects the customer’s perception of
specific dimensions of service: reliability, responsiveness, assurance, empathy,
tangibles, satisfaction, on other hand, is more inclusive: it is influenced by
perceptions of service quality, product quality, and price as well as situational factors
and personal factors (Zeithaml & Bitner, 2003). Bitner (1990) defined service
quality as overall impression of consumers towards the superiority or inferiority of
an organization and its services. Patrick et al (1996) defined service quality as the
difference between customer’s expectation for service performance prior to the
service encounter and their perceptions for service received. Service quality theory
predicts that clients will judge that quality is low if performance does not meet their
expectations and quality increases as performance exceeds expectations, expectation
8
therefore lay the foundation for which service quality will be evaluated by customer.
It also follows that as service quality increases, customer satisfaction and intention to
reuse the service increases.
2.1.1.2 LUKU
LUKU which stands for Lipia Umeme Kadiri Unavyotumia is a prepaid meter
system introduced on 1994 the idea of which originated from South Africa where the
prepaid meter system was used. Since its establishment LUKU system has been the
best solution for TANESCO with regard to solving the problem of collecting bills
from customers since most of the customers failed to pay their bills regularly while
continuing to enjoy the service under previous conventional post paid metering
system. LUKU services have been integrated into online payment system whereby
customers can make their purchases through online payment service providers,
online banking and through mobile phones.
2.1.1.3 Customer Satisfaction
Murphy (2000) defines customer satisfaction as the minimum acceptable levels of
service that provide customer satisfaction in the key areas that are critical and where
service quality thresholds need to be set. To fall below the minimum threshold in any
key area puts one into the danger zone and one’s customer will not be satisfied.
Customer satisfaction is a compelling issue because in service industry retaining
customers is more important than attracting new ones. Retaining customers has a
more impact on profit than attracting new ones and thus in order for a company to
maximize profit should strive for zero defection through customer satisfaction.
9
2.1.1.4 Customer Loyalty
Oliver (1999) cited in Akgam (2013) defined customer loyalty as a deeply held
commitment to rebuy a preferred product/service consistently in the future, thereby
causing repetitive same – brand or same – set purchasing, despite situational
influences and marketing efforts having the potential to cause switching behavior.
Not only do loyal customers ensure sales, but they are also more likely to purchase
ancillary, high-margin supplemental products and services. Loyal customers reduce
costs associated with consumer education and marketing, especially when they
become net promoters for your organization.
2.2.1 Theories of Customer Satisfaction
A theory is a system of ideas intended to explain something such as single or
collection of facts, events, or phenomenon. A theoretical framework of a research
project relates to the philosophical basis on which the research takes place and form
the link between the theoretical aspects and practical component of the investigation
undertaken. The theoretical literature review will cover the Disconfirmation theory
and Contrast theory that contributes to the concept of LUKU service quality and
customer satisfaction.
2.2.1.1 Disconfirmation Theory
According to Ekinci et al (2004) disconfirmation theory argues that ‘Satisfaction is
related to the size direction of the disconfirmation experience that occurs as a result
of comparing service performance against expected performance. Petrick (2004)
10
commented that the disconfirmation paradigm is the best predictor of customer
satisfaction. Oliver’s (1980) updated definition on the disconfirmation theory, which
states that “satisfaction is the guest’s fulfillment response. It is a judgment that a
product or service feature, or the product or service itself, provided (or is providing)
a pleasurable level of consumption-related fulfillment, including levels of under- or
over-fulfillment.
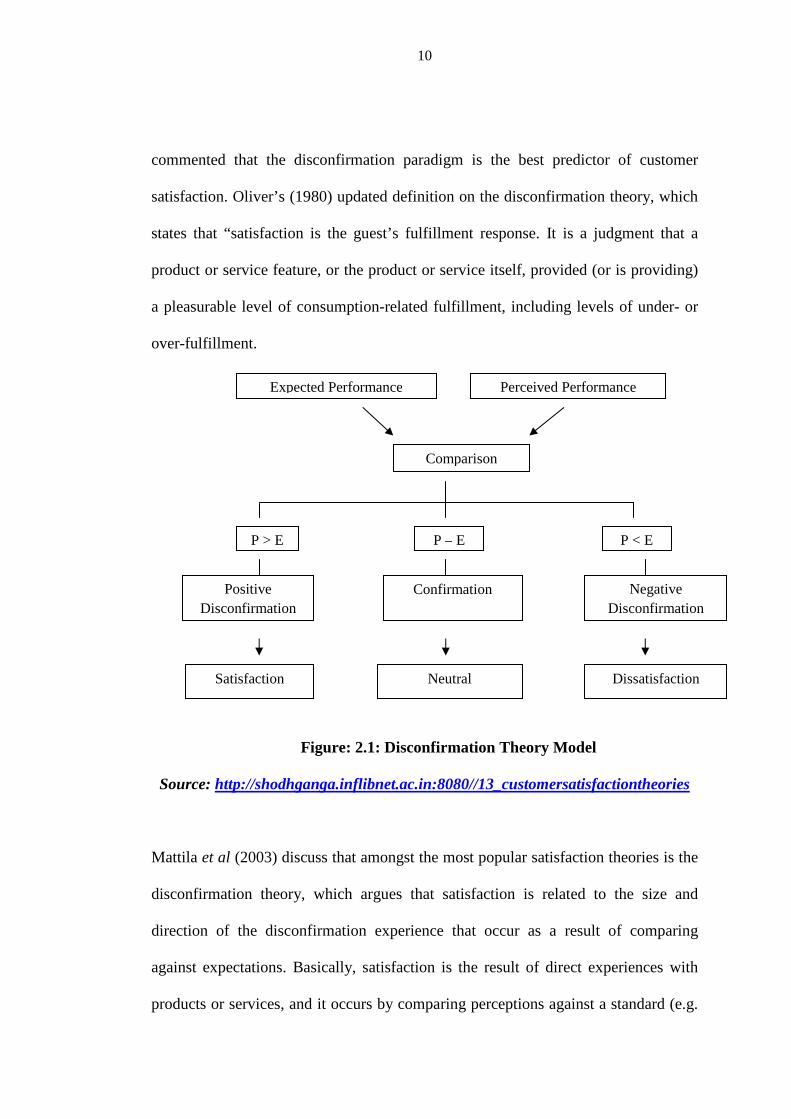
Figure: 2.1: Disconfirmation Theory Model
Source: http://shodhganga.inflibnet.ac.in:8080//13_customersatisfactiontheories
Mattila et al (2003) discuss that amongst the most popular satisfaction theories is the
disconfirmation theory, which argues that satisfaction is related to the size and
direction of the disconfirmation experience that occur as a result of comparing
against expectations. Basically, satisfaction is the result of direct experiences with
products or services, and it occurs by comparing perceptions against a standard (e.g.
Expected Performance Perceived Performance
Comparison
P > E P – E P < E
Positive Disconfirmation
Confirmation Negative Disconfirmation
Satisfaction Neutral Dissatisfaction
11
expectations). It also indicates that how the service was delivered is more important
than the outcome of the service process, and dissatisfaction towards the service often
simply occurs when the customer’s perceptions do not meet their expectations. In
terms of its application on LUKU services, the theory is relevant in the sense that
LUKU service customers tend to have their own set of expectations in terms of the
sorts of services expected out of their purchase. These expectations range from the
technical, functional and even customer servicing point of views. Their ability to
compare their expectation with what they perceive to receive together with the
results of that comparison defines their level of satisfaction towards the service.
Therefore, the Disconfirmation theory and related literature are applicable in trying
to analyze service quality and customer satisfaction from LUKU services.
2.2.1.2 Contrast Theory
Contrast theory suggests that when actual product performance falls short of
customer’s expectation about the product, the contrast between the expectation and
outcome will cause the consumer to exaggerate the disparity (Yuksel and Yuksel,
2008). The contrast theory maintains that a costumer, who receives a product less
valuable than expected, will magnify the differences between the product received
and the product expected. According to this theory “outcomes deviating from
expectation will cause the subject to favorably or unfavorably react to the
disconfirmation experiences in that, a negative disconfirmation is believed to result
in a poor product evaluation, whereas positive disconfirmation should cause the
product to be highly appraised” (Oliver, 1997)
12
Moreover it is argued that, any discrepancy of experience from expectations will be
exaggerated in the direction of discrepancy. In regard to LUKU services quality and
perceived satisfaction the theory is relevant in the sense that if TANESCO raises
expectations in its advertising on the quality of LUKU service, and then customer’s
experience is slightly less than the one advertised, the product service might be
rejected as totally un-satisfactory. Conversely, under-promising in advertising and
over-delivering might cause positive disconfirmation also to be exaggerated.
However since TANESCO is a near monopoly in terms of supply of power utility in
Tanzania, total rejection of its services may not be practical since customers would
not have any alternative supplier for electrical services. However this will lead to an
intense level of complaints and dissatisfaction towards the offering.
The two theories are both relevant for the study since they incorporate aspects of
comparison between expectations and actual performance which underlines
relationship between service quality and customer satisfaction.
2.3 Empirical Literature Review
A study by Evangelos and Yannis (2009) provide a comprehensive discussion on the
problem of evaluating customer satisfaction evaluation problem by presenting an
overview of the existing methodologies as well as the development and
implementation of an original multicriteria method dubbed MUSA (Multicriteria
Satisfaction Analysis). According to the study, it is argued that although extensive
research has defined several approaches for evaluation of customer satisfaction, all
the models and techniques adopt three main principles. These include the fact that all
13
relevant data of the problem are based on customer judgement and thus the same
should be directly collected from them, that customer satisfaction problem is a
multivariate evaluation since global satisfaction depends on a set of variables
representing service characteristics dimensions and that in order to obtain a global
satisfaction level an additive formulae should be used to aggregate partial
evaluations.
According to Ibok and Udofot (2012) customers’ satisfaction has traditionally
recognized as a major determinant of continued loyalty and long term responsive
behaviour. They pointed out that, customers’ satisfaction is a measure of how firm’s
product or service is able to meet or surpass customers’ expectation. Thus, in a
competitive market like the service and utility industry, it consists of the firm
crafting holistic strategies in order to keep the customers happy. In relation to the
service sector, Oduro (2013) investigated factors that determine customer satisfaction
level in banking services from Ghanaian banking industry. According to his study
using factor analysis, it was found that three factors which include customer relation
and services, staff competency as well as responsiveness and convenience to be
among factors influencing consumers’ satisfaction level. Mukhtar et al (2014) came
up with documentation on customer satisfaction through usage of correlation analysis
to check the intensity of relation of customer satisfaction with dimensions of service
quality. These dimensions of service quality included reliability, assurance,
responsiveness, empathy and tangibility. The study found that service quality is
positively correlated with customers’ satisfaction. Significantly the most important
variable that affects customer satisfaction was tangibility, which is followed by

14
assurance. Regression equation derived from regression analysis showed that only
assurance and tangibility has significant correlation with customer satisfaction, but
reliability, empathy and responsiveness have less important relationship with
customer satisfaction. Utility companies including electric power suppliers utilize
their assets in right direction, providing better tangibility and assurance to customers
about their services.
In a study by Kristin (2004) to measure customer satisfaction among business
customers of 100 U.S. Electric utilities, each of which serves more than 25,000
business customers it was highlighted that the overall satisfaction is examined across
six factors. Listed in order of importance, the factors include power quality and
reliability, billing and payment, corporate citizenship, price, communications, and
customer service. The study findings also revealed that power and reliability
satisfaction among customers who receive outage information is higher than those
who do not recall any information. Abdullatif (2013) focused on the determinants of
electricity consumers’ satisfaction in selected electricity distribution zone in Nigeria.
The study designed a scheme for evaluating customers’ satisfaction with a view to
determine their level of satisfaction and in the process compute satisfaction index
using multi stage sampling techniques. The study observed that there are six major
indicators appeared to be more significant in the scheme for customer satisfaction.
These include product measurement, quality of service, network reliability,
willingness to pay, responsiveness and professionalism.
15
Seyoum (2012) on the other hand conducted a study on customer service quality in
Addis Ababa - Ethiopian Electricity Power Corporation (EEPCO) with emphasis on
prepayment service quality by comparing customers’ perception of the received
service against their expectation using SERVQUAL as a methodological approach.
The study found that there were a substantial gap between customers’ expectations
and that of the service received which adversely affected the overall customer service
experience with the corporation. Significantly the unfavourably held view of the
customers on the corporations’ quality of services delivery was also shared among
employees who actually are involved in the process of delivering services.
On top of that Luhemeja et al (2010) assesses the relationship between the service
quality and the customer’s purchase decisions and satisfaction. These have been
important factors in the open market economy competition. Rise and fall of any
business to date depends largely on customer repurchase decision. In this study
service quality was found to have significant relationships with customer’s purchase
decision and satisfaction, length of time spent in waiting for the service, language of
employees to customers purchase intension and decision. The study revealed that
quality of services in terms of speed of service deliverance and service reliability had
some impact on the customer’s satisfaction and repurchase decisions in the water and
electricity utilities. The study recommended that utilities should invest in good hiring
and training procedures of its human resource due to the fact that these companies
are service oriented more direct contact between employees and customers and thus a
positive attitude of customer about the company could be created by the company’s
staff himself. The study also recommended presence of a standardized service
16
performance process throughout the organization to streamline services to customers
offered from various service centres The literature reviewed showed that service
quality and customer satisfaction are aspects which relates and influence each other.
Furthermore, the literature suggest that the determinants of customers’ satisfaction
though in general may be similar in specific industries, specifically varies according
to the nature of the product and services on offer and in the case of customer
satisfaction with respect to LUKU service quality in Tanzania context, the same is
yet to be addressed in the literature.
2.4 Conceptual Framework
A conceptual framework is the researcher’s own position on the problem and gives
direction of the study. It may be an adaptation of a model used in previous study with
modification to suit the inquiry. Aside from showing the direction of the study,
through the conceptual framework, the researcher can use the framework to show the
relationships of the different constructs aimed to be investigated.

17
Figure 2.3 Conceptual Framework
Source: Researcher 2015
CUSTOMER SATISFACTION
Price
Timeliness
Service Reliability
Responsiveness
Empathy
Satisfaction Determinants
-Loyalty
-Retention
Independent Dependent
18
CHAPTER THREE
RESEARCH METHODOLOGY
3.0 Introduction
This section describes the research approach, study area, target population, the
sample and sampling procedures, methods to be used for data collection and their
administration. The chapter describes the ways in which different types of data was
used and analyzed.
3.1 Research Design
According to Kothari, (2002) research design is the plan showing the approach and
strategy of investigation aimed at obtaining relevant data which fulfills the research
objectives and answer questions. This study was a descriptive research conducted
through a case study design since such design has proven to be useful in describing
and explaining answers to questions such as how and why. It was expected that the
data from the sample and case study would be relevant and accurate enough to
provide findings capable of covering the research gap.
3.2 Area of the Study
The study was conducted in Kinondoni Municipal which is among the areas with
LUKU service study because of envisioned customers. Considering the wider
coverage of LUKU services across the country and limitation of resources,
Kinondoni Municipal was deemed to be suitable for the study because of the
envisioned availability relevant information related to the perceived quality of
LUKU services and how customers are satisfied with the service offered. Kinondoni
19
Municipal Council is the northernmost of three municipalities in Dar es Salaam,
Tanzania, the others being Temeke (to the far Southeast) and Ilala (downtown Dar es
Salaam). To the east is the Indian Ocean, to the north and west the Pwani region of
Tanzania, is located in the northern part of Dar es Salaam City Since some of the
information was expected to be obtained from employees of the LUKU services
supplying company, TANESCO Magomeni branch was also used as a case
organization. TANESCO was selected because the company’s core business is
generation, transmission, distribution and sale of electricity to the Tanzania mainland
and bulk power supply to the Island of Zanzibar.
3.3 Research Approach
The study used both qualitative and quantitative approach in interpreting the findings
from the data collected. Qualitative research is a research using methods such as
participants’ observation or case study which result in a narrative, descriptive
account of a setting or practice (Parkinson & Drislane, 2009). Qualitative approach
was used because it gave the researcher an opportunity to study in depth a particular
aspect of interest related to the problem to enable collection of facts relevant in
establishing causes relationships and solutions to the problem. The qualitative
research enabled the researcher to get an insight in assessing customer service
satisfaction on LUKU users. The approach allowed for usage of methods such as
interviews, observations and surveys in achieving the intended objectives.
20
3.4 Study Population
Sample frame is a complete list of all the cases in the population from which the
sample is drawn (Saunders et al, 2009). In this context the sample frame was the
customers of TANESCO.
The study was conducted in Kinondoni Municipal, it has an area of 531 sq. km with
a population of 2,497,940. The population growth rate is estimated to be 4.3% per
annum and the population density is 1,179 people per square km. (Kinondoni
Municipal Council Report, 2015). The population is getting more advanced and
demanding better services.
3.5 Sample Size, Distribution and procedures
A sample according to sample is a segment of population in which researcher is
interested in gaining information and drawing conclusion (Barbie, 1992). Sampling
on the other hand involves process or technique of selecting representative part of
population for the purpose of determining parameters of characteristics of the whole
population. Ideally, a sample size should be large enough to serve as adequate
representatives of the population and small enough to be selected economically in
terms of subject availability. For the purpose of this study the sample size constituted
respondents from LUKU service customers around Kinondoni Municipal, Dar-es-
salaam and respondents from TANESCO Magomeni offices. A sample of 25 LUKU
service customers around Kinondoni Municipal and 5 employees from TANESCO
Magomeni branch was selected for the purpose of this study. In order to ensure
quality of data collection in the midst of the fact that not all employees could be in a
21
position to provide relevant information on customer service satisfaction on LUKU
users a purposely sampling was adopted.
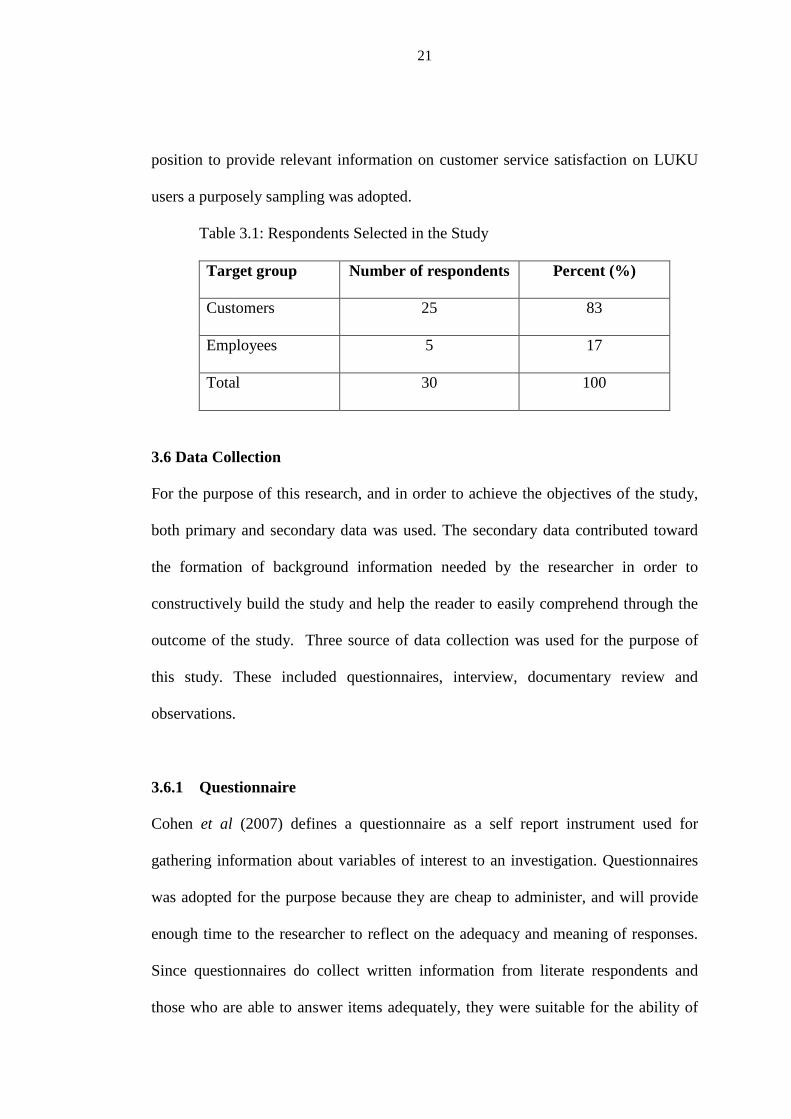
Table 3.1: Respondents Selected in the Study
Target group Number of respondents Percent (%)
Customers 25 83
Employees 5 17
Total 30 100
3.6 Data Collection
For the purpose of this research, and in order to achieve the objectives of the study,
both primary and secondary data was used. The secondary data contributed toward
the formation of background information needed by the researcher in order to
constructively build the study and help the reader to easily comprehend through the
outcome of the study. Three source of data collection was used for the purpose of
this study. These included questionnaires, interview, documentary review and
observations.
3.6.1 Questionnaire
Cohen et al (2007) defines a questionnaire as a self report instrument used for
gathering information about variables of interest to an investigation. Questionnaires
was adopted for the purpose because they are cheap to administer, and will provide
enough time to the researcher to reflect on the adequacy and meaning of responses.
Since questionnaires do collect written information from literate respondents and
those who are able to answer items adequately, they were suitable for the ability of
22
respondents from TANESCO. A pointed out by Churchill (2004). The questionnaires
containing both closed and open ended questions were used to collect information.
3.6.2 Interview
According to Mugenda & Mugenda (1999) an interview schedule is a set of
questions that the interviewer asks when interviewing. Interview technique was used
in order to reach the objectives since it is the most useful and productive method of
communication and enables spontaneity. It is envisioned that through interviews, the
researcher was able to guide the discussion back to the topic outlined in cases where
discussions were unfruitful. For the purpose of this study semi structure interviews
was conducted to sampled staff and LUKU service customers.
3.6.3 Documentary Review
According to Saunders et al (2007) documents are secondary form of data collected
and stored by organizations or governments so as to be used by externals who are
interested with those data to use in any relevant area of interest. In relation to this
form of data collection, documents related to customer service satisfaction were
reviewed.
3.6.4 Observations
An observational research technique involves the researcher making observations
which are flexible and not necessarily revolve around the formulated hypothesis. The
researcher conducted observation to the study area in order to gain an understanding
of the activities involved in customer service satisfaction. This facilitated comparison
23
between data collected on through observations and the data collected through
questionnaires, interviews and documentary review.
3.7 Types of Data
Research data is data that is collected, observed, or created for the purpose of
analysis to produce original research results. Data are distinct pieces of information,
usually formatted in a special way. Data involves facts, figures and any other
relevant materials past and present serving as bases for study and analysis.
According to Kothari (2004) there are two types of data namely primary data and
secondary data on which the researcher should keep in mind. For the purpose of this
study both primary and secondary data were employed.
3.7.1 Primary Data
According to Kothari (2002) the primary data are those which are collected afresh
and for the first time. These include sources of information on the dependent and
independent variables of the study. In collection of primary, data questionnaires were
administered to customers as well as employees of TANESCO. Observations were
made on customer service satisfaction in place to collaborate in providing relevant
and first-hand information to the researcher.
3.7.2 Secondary Data
Secondary data are data that are already available and refer to data that have already
been collected and analyzed by someone (Kothari, 2005). Secondary data were
24
obtained through documentary review, which included published and unpublished
documents, journals, and reports. This type of data helped the researcher to
understand the nature of current customer service satisfaction existing.
3.8 Sampling Procedures
The researcher intended to use purposive sampling technique for the purpose of
obtaining information from the right people who can assist at large in coming up
with valuable data which are valid and reliable when tested under the same
conditions. The sample size is considered to be reasonable and attainable to use
purposive sampling since it is manageable involving respondents who are
knowledgeable with the matter at hand.
3.9 Data Analysis Procedures
Lincoln, (1994) described data analysis as being a systematic process involving
working with data, organizing and dividing them into manageable parts. The data
were analyzed in relation to the particular research objectives and questions to find
out whether the findings give the results of the research study. The data were
analyzed using quantitative interpretation of descriptive statistics. The responses
received from the questionnaires and interview was organized, tabulated and
analyzed using simple frequencies and percentages. Data were presented in
descriptive form supported by means, tables, frequency distributions and
percentages. Care was taken by the researcher to note the number of times a view
was expressed and the number of respondents that expressed that view. This will
form the basis for drawing conclusions.

25
CHAPTER FOUR
STUDY FINDINGS AND DISCUSSION
4.0 Introduction
This chapter describes the analysis and discussion of findings from the data collected
from the study guided by the researcher’s objectives and questions mentioned in
chapter one. This chapter therefore provides a picture of the findings related to
factors that influence LUKU service customers’ satisfaction, the level of satisfaction
among LUKU service customers and identification of common problems facing
LUKU service customers.
4.1 Group of LUKU Service and Customers Served by TANESCO
4.2 General information of the respondents
This section presents data on the general information on the respondents such as
gender, employment status, level of education and age.
4.1.1 Gender of Respondents
In order to get an insight of the general information of the participants to the study,
the respondents were requested to provide their gender. The results are shown
presented in Table 4.1 below:

26
Table 4.1: Gender of Respondent
Source: Research findings, 2015
The results of Table 4.1 show that both genders participated effectively in providing
responses to the research questions. The findings shows that out of 30 respondents
who participated in the study, 60% of the respondents were female while the
remaining 40% of the respondents were male. Equal participation of genders in the
study helps to validate the results of the study by eliminating the possibility of
acquiring data which are sensitive to a particular gender alone and thus being
subjective.
4.1.2 Age Patterns of the Respondents
Respondents were similarly asked to provide information concerning their age as a
way of understanding general information of those who participated in the study. The
results are shown presented in Table 4.2.
Gender Frequency Percentage (%)
Male 12 40%
Female 18 60%
Total 30 100%
27
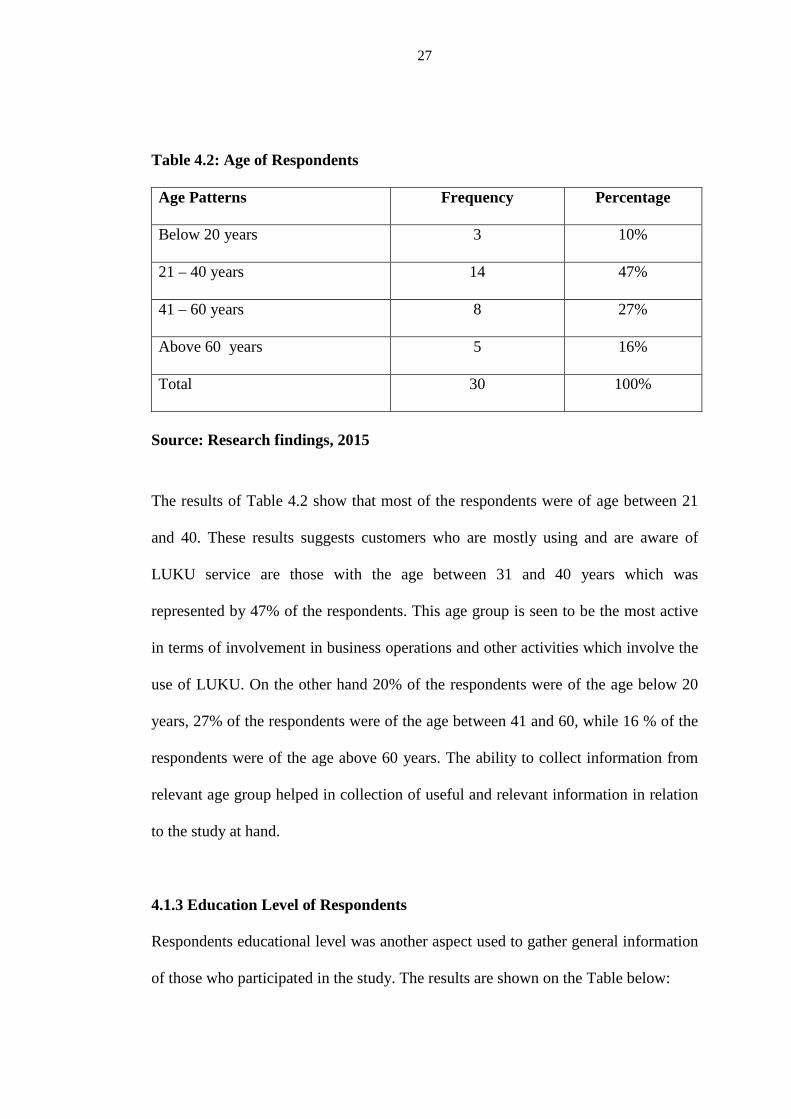
Table 4.2: Age of Respondents
Age Patterns Frequency Percentage
Below 20 years 3 10%
21 – 40 years 14 47%
41 – 60 years 8 27%
Above 60 years 5 16%
Total 30 100%
Source: Research findings, 2015
The results of Table 4.2 show that most of the respondents were of age between 21
and 40. These results suggests customers who are mostly using and are aware of
LUKU service are those with the age between 31 and 40 years which was
represented by 47% of the respondents. This age group is seen to be the most active
in terms of involvement in business operations and other activities which involve the
use of LUKU. On the other hand 20% of the respondents were of the age below 20
years, 27% of the respondents were of the age between 41 and 60, while 16 % of the
respondents were of the age above 60 years. The ability to collect information from
relevant age group helped in collection of useful and relevant information in relation
to the study at hand.
4.1.3 Education Level of Respondents
Respondents educational level was another aspect used to gather general information
of those who participated in the study. The results are shown on the Table below:
28
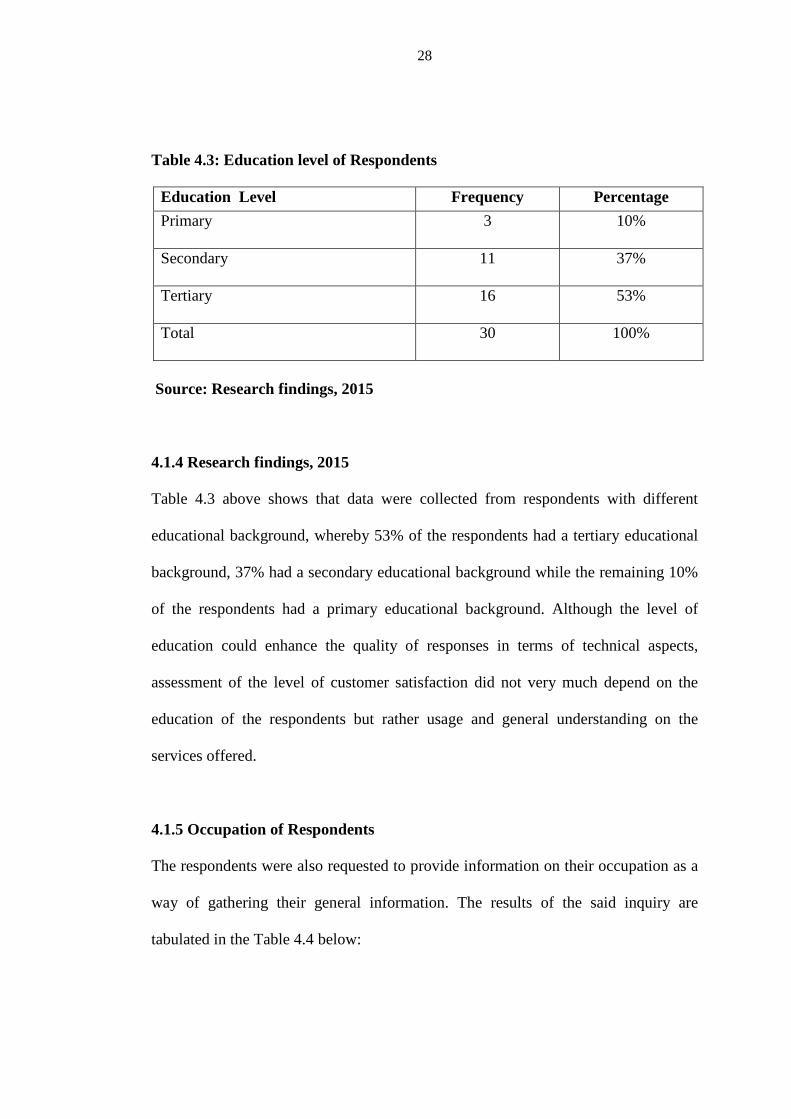
Table 4.3: Education level of Respondents
Source: Research findings, 2015
4.1.4 Research findings, 2015
Table 4.3 above shows that data were collected from respondents with different
educational background, whereby 53% of the respondents had a tertiary educational
background, 37% had a secondary educational background while the remaining 10%
of the respondents had a primary educational background. Although the level of
education could enhance the quality of responses in terms of technical aspects,
assessment of the level of customer satisfaction did not very much depend on the
education of the respondents but rather usage and general understanding on the
services offered.
4.1.5 Occupation of Respondents
The respondents were also requested to provide information on their occupation as a
way of gathering their general information. The results of the said inquiry are
tabulated in the Table 4.4 below:
Education Level Frequency Percentage
Primary 3 10%
Secondary 11 37%
Tertiary 16 53%
Total 30 100%
29
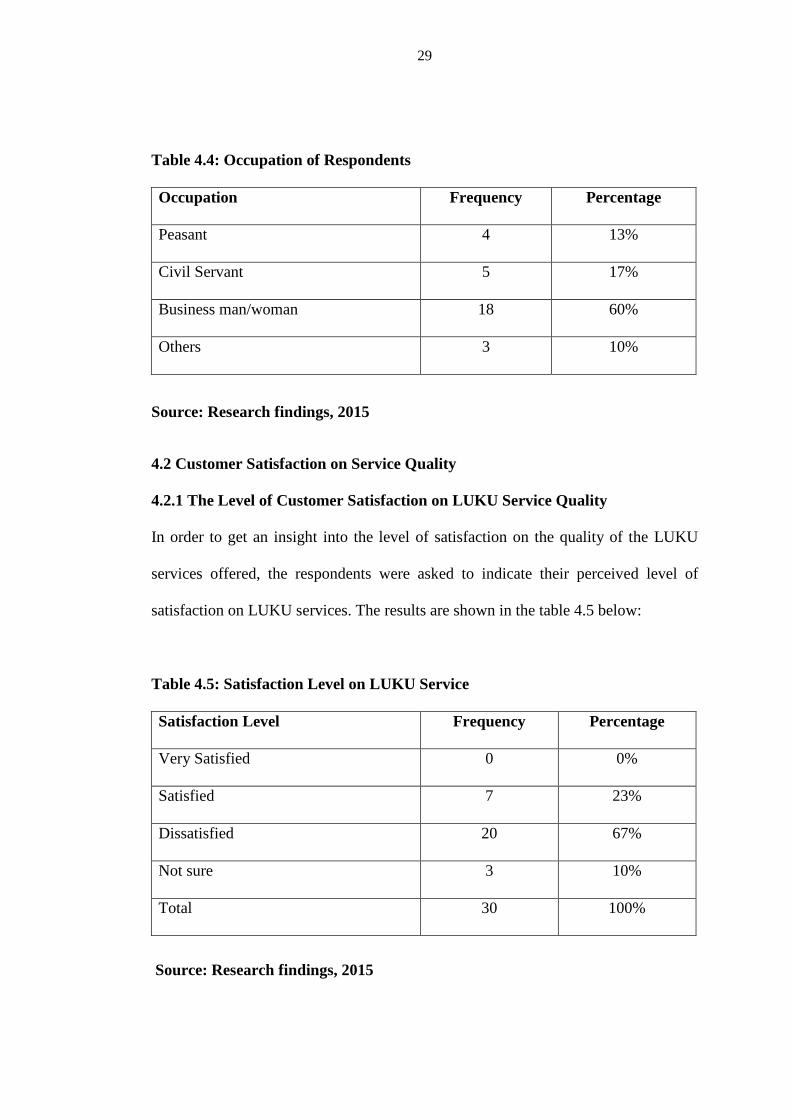
Table 4.4: Occupation of Respondents
Occupation Frequency Percentage
Peasant 4 13%
Civil Servant 5 17%
Business man/woman 18 60%
Others 3 10%
Source: Research findings, 2015
4.2 Customer Satisfaction on Service Quality
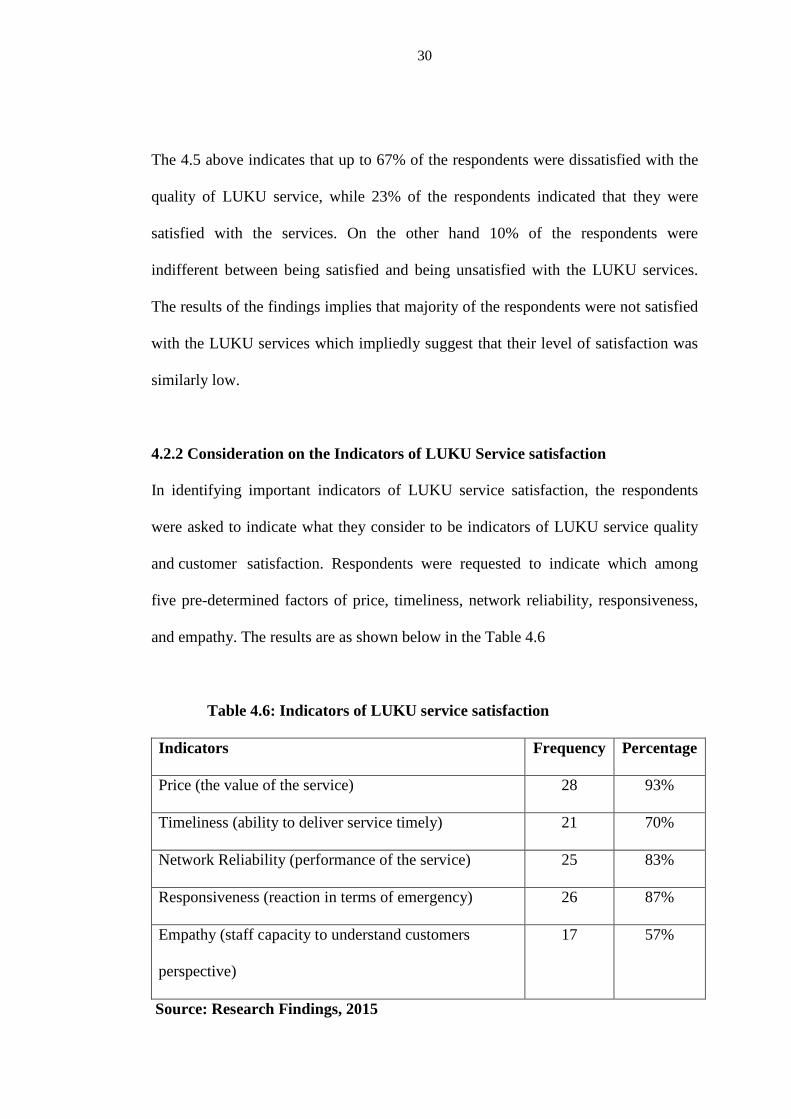
4.2.1 The Level of Customer Satisfaction on LUKU Service Quality
In order to get an insight into the level of satisfaction on the quality of the LUKU
services offered, the respondents were asked to indicate their perceived level of
satisfaction on LUKU services. The results are shown in the table 4.5 below:
Table 4.5: Satisfaction Level on LUKU Service
Satisfaction Level Frequency Percentage
Very Satisfied 0 0%
Satisfied 7 23%
Dissatisfied 20 67%
Not sure 3 10%
Total 30 100%
Source: Research findings, 2015
30
The 4.5 above indicates that up to 67% of the respondents were dissatisfied with the
quality of LUKU service, while 23% of the respondents indicated that they were
satisfied with the services. On the other hand 10% of the respondents were
indifferent between being satisfied and being unsatisfied with the LUKU services.
The results of the findings implies that majority of the respondents were not satisfied
with the LUKU services which impliedly suggest that their level of satisfaction was
similarly low.
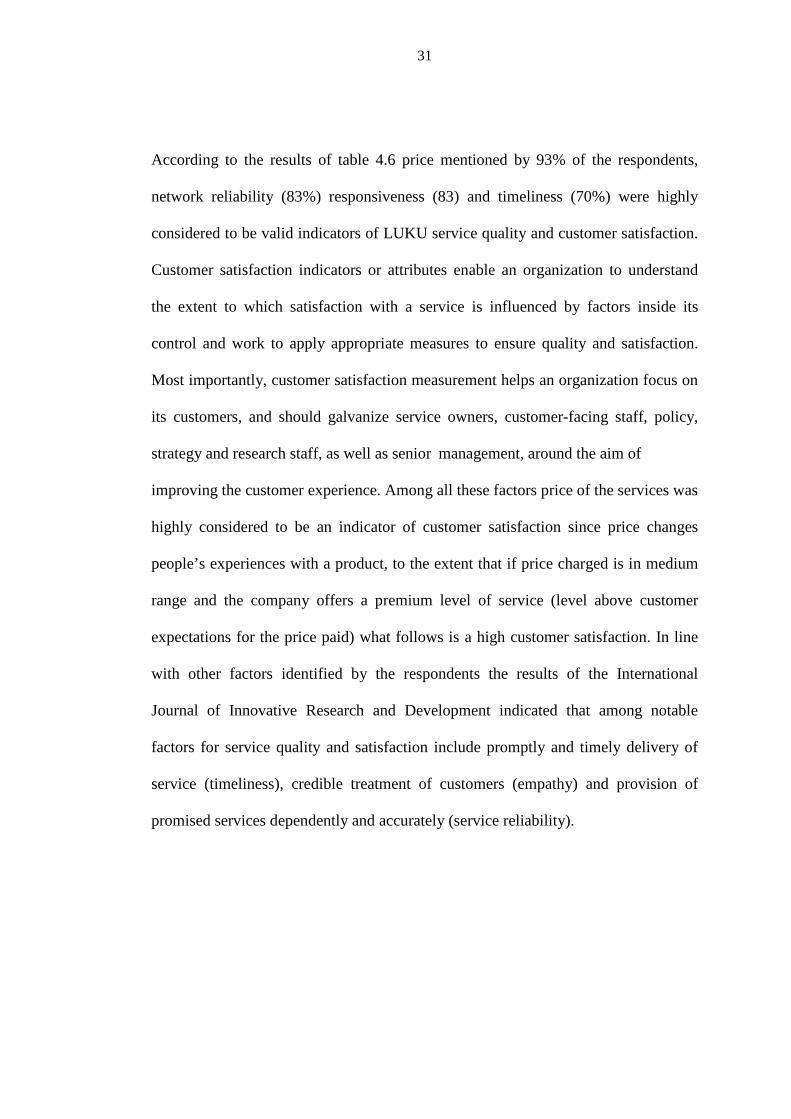
4.2.2 Consideration on the Indicators of LUKU Service satisfaction
In identifying important indicators of LUKU service satisfaction, the respondents
were asked to indicate what they consider to be indicators of LUKU service quality
and customer satisfaction. Respondents were requested to indicate which among
five pre-determined factors of price, timeliness, network reliability, responsiveness,
and empathy. The results are as shown below in the Table 4.6
Table 4.6: Indicators of LUKU service satisfaction
Indicators Frequency Percentage
Price (the value of the service) 28 93%
Timeliness (ability to deliver service timely) 21 70%
Network Reliability (performance of the service) 25 83%
Responsiveness (reaction in terms of emergency) 26 87%
Empathy (staff capacity to understand customers
perspective)
17 57%
Source: Research Findings, 2015
31
According to the results of table 4.6 price mentioned by 93% of the respondents,
network reliability (83%) responsiveness (83) and timeliness (70%) were highly
considered to be valid indicators of LUKU service quality and customer satisfaction.
Customer satisfaction indicators or attributes enable an organization to understand
the extent to which satisfaction with a service is influenced by factors inside its
control and work to apply appropriate measures to ensure quality and satisfaction.
Most importantly, customer satisfaction measurement helps an organization focus on
its customers, and should galvanize service owners, customer-facing staff, policy,
strategy and research staff, as well as senior management, around the aim of
improving the customer experience. Among all these factors price of the services was
highly considered to be an indicator of customer satisfaction since price changes
people’s experiences with a product, to the extent that if price charged is in medium
range and the company offers a premium level of service (level above customer
expectations for the price paid) what follows is a high customer satisfaction. In line
with other factors identified by the respondents the results of the International
Journal of Innovative Research and Development indicated that among notable
factors for service quality and satisfaction include promptly and timely delivery of
service (timeliness), credible treatment of customers (empathy) and provision of
promised services dependently and accurately (service reliability).

32
4.2.3 Level of satisfaction with regard to the LUKU service satisfaction
indicators.
In trying to assess the level of customer’s satisfaction with regard to the identified
indicators for LUKU service quality and customer satisfaction, the respondents were
asked to indicate their level of satisfaction with regard to each identified indicators.
4.2.3.1 Price – the value of the service
The respondents were asked to indicate the level of satisfaction by considering price
as an indicator towards LUKU service satisfaction. The results are shown in the
Table 4.7 below.
Table 4.7: Price
Price Frequency Percentage
Very satisfied 0 0%
Satisfied 2 7%
Dissatisfied 28 93%
Not Sure 0 0%
Total 30 100%
Source: Research Findings, 2015
The results of Table 4.7 above indicates that 93% of the respondents were
dissatisfied with the price offered on LUKU services while only 7% of the
respondents indicated satisfaction with the price. These results are in line with Ross
(2014) who pointed out that setting a right price and keeping customers happy can be
33
hard to achieve, although such an ability to set a right price can lead to improved
customer satisfaction and consequential increase in revenue. Hermann et al. (1992)
cited in Ross, B (2014) illustrated that the price perceptions directly influence
satisfaction judgments empirically. In this context, if price does affect customer
satisfaction, TANESCO should ask themselves if they are charging right price to
enhance high customer satisfaction. Furthermore Herrmann et al. (2007), concluded
that customer satisfaction is directly influenced by price perceptions, although
indirectly, through the perception of price fairness. The price fairness itself and the
way it is fixed and offered have a great impact on perceived quality and satisfaction.
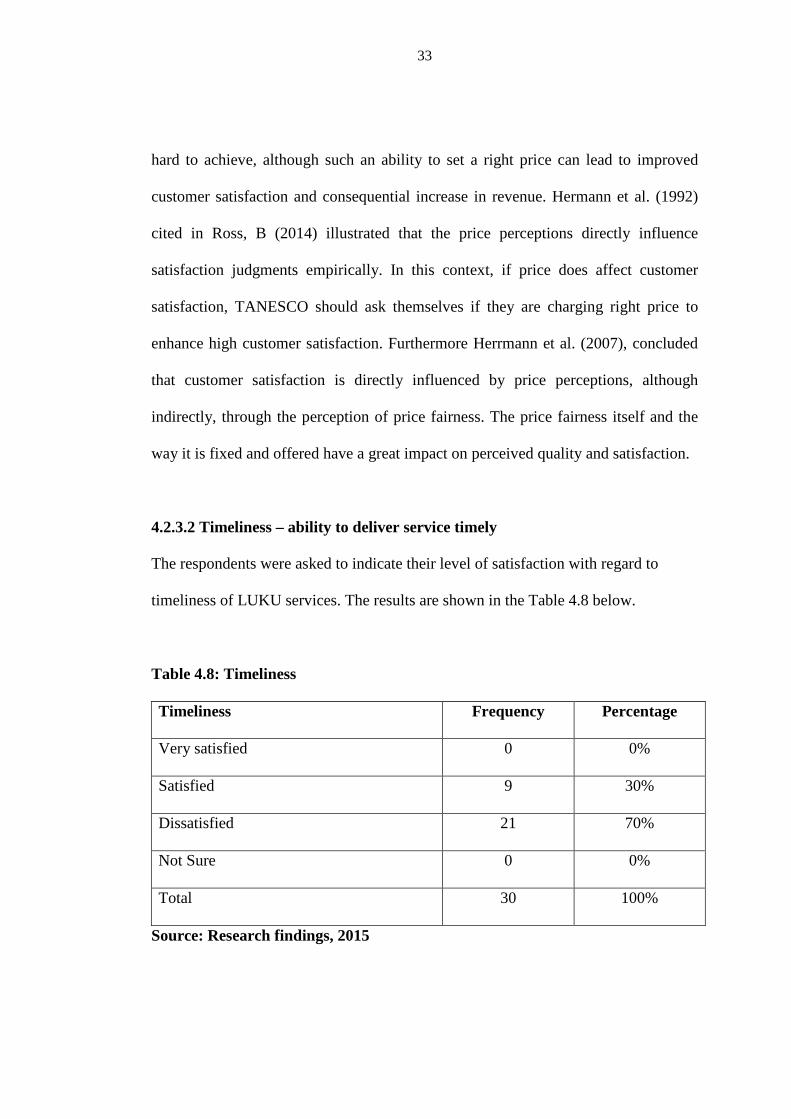
4.2.3.2 Timeliness – ability to deliver service timely
The respondents were asked to indicate their level of satisfaction with regard to
timeliness of LUKU services. The results are shown in the Table 4.8 below.
Table 4.8: Timeliness
Timeliness Frequency Percentage
Very satisfied 0 0%
Satisfied 9 30%
Dissatisfied 21 70%
Not Sure 0 0%
Total 30 100%
Source: Research findings, 2015
34
The results of Table 4.8 indicate that 70% of the respondents were dissatisfied with
timeliness while the remaining 30% of the respondents were satisfied. Ability to
deliver services on timely basis creates good impression on customers about a
particular service in question. Among the responses from various customer survey
indicates how customer’s value company’s ability quickly respond to customer
requests. In the current environment, customers have less time and would wish to get
what they want promptly without spending much time in long queue waiting for
services. Customers want service delivery to take the minimum amount of time
possible. As the complexities in the modern life of customers increase, the
corresponding demand for precision from suppliers requires that products and
services be delivered on or before the agreed upon time. Customers want suppliers
they can depend upon, who can deliver when and how they say they would deliver.
If customer satisfaction is the supplier’s goal then the supplier must understand that
timeliness is one of the most important factors in the customer supplier relationship.
Suppliers must strive to improve every aspect of timeliness within their capability.
The first step for improving timeliness is the simple process of putting yourself in the
customer’s shoes. Actually walk through the process the customer experiences and
identify where the timeliness issues show up and where the customer’s time is
wasted and work to correct them.
35
4.2.3.3 Service Reliability – Provision of promised services dependently and
accurately
The respondents were also asked to indicate the level of satisfaction with service
reliability as an indicator of LUKU service quality and customer satisfaction. The
results are shown in the below Table.
Table 4.9: Service Reliability
Service Reliability Frequency Percentage
Very satisfied 0 0%
Satisfied 5 17%
Dissatisfied 25 83%
Not Sure 0 0%
Total 30 100%
Source: Research findings, 2015
Table 4.9 above reveals that 83% of the respondents indicated that were dissatisfied
with the LUKU service reliability while the remaining 17% of the respondents were
satisfied with the same. Operational factors such as insufficient supply of electricity,
breakdown of facilities, power interruptions and unreliable network are some of the
issues contributing into unreliable services. Frequent power interruptions
experienced by customers without prior notification has been a major cause for
customer dissatisfaction among LUKU service customers. Section 26(3) of the
Electricity Act No 10 of 2008 set an obligation to TANESCO in non emergency
situations to provide advance notice of the suspension of electricity however this has
36
not been thoroughly observed or done in manner deemed sufficient to customers. In
this regard unannounced and frequent power interruptions had been mentioned to
causing damages and malfunctioning of customers’ electrical appliances, disruption
of businesses and other daily operations. With this regard TANESCO should work to
ensure that power interruptions are given prior notification, be as brief as possible
and affect fewest numbers of customers as possible. On the other hand the positive
move of integrating information technology in provision of LUKU services has led
to network reliability problems. Provision of LUKU services has been integrated into
various information technology avenues to ensure that customers get access to the
services easily. Purchase of LUKU services through LUKU machines, Max Malipo,
mobile phones operators such as Tigo Pesa, M-Pesa, Airtel Money and purchase of
LUKU services through online banking services such as CRDB, NMB mobile have
been used to improve access to services and thus reliability of the network in
accessing the same had been of great importance to customers. Usage of information
technology in providing up to date and relevant information to customers including
notices of power interruptions is also an area which could be adopted in an effort to
TANESCO’s compliance with the law, enhancement of service quality and
ultimately improved customer satisfaction.
4.2.3.4 Responsiveness – reaction in terms of emergency
Respondents were asked to indicate their level of satisfaction on responsiveness of
LUKU services as one of the indicators of LUKU service quality and customer
satisfaction. The results are shown in the Table 4.10 below:
37
Table 4.10: Responsiveness
Responsiveness Frequency Percentage
Very satisfied 0 0%
Satisfied 4 13%
Dissatisfied 26 87%
Not Sure 0 0%
Total 30 100%
Source: Research findings, 2015
The results of Table 4.10 above indicates that up to 87% of the respondents were
dissatisfied with the responsiveness of TANESCO during reported emergency
situations while the remaining 13% of the respondents indicated satisfaction in terms
of reaction to emergency situations. Lack of promptly and swift response to
emergency situations reported to TANESCO by LUKU customers is one of the
major causes for perceived low quality of services and customer dissatisfaction. Matt
(2010) noted that in the modern world where systems are a necessary part of
customer service delivery on time of emergency cannot be neglected. Many
customers have been complaining that emergency services have not been responding
swiftly and some TANESCO employees use foul language to concerned customers.
An incident reported in the Daily Newspaper of 3rd May 2015 were by the Minister
ordered TANESCO to take disciplinary measures against three arrogant staff from
Tabata, Temeke and Tazara for alleged negligence and lack of response on
emergency reported to them is an example of lack of responsiveness which had been
38
mentioned by the respondents to the study. Lack of response in cases of emergency
has tarnish the image of TANESCO and endanger property and the life reporting
customers who remained to be at risk the longer the emergency remain unattended. It
is imperative that TANESCO work to ensure that its emergency response unit work
diligently to ensure customers LUKU related problems are resolved on timely basis
and enhance service quality and customer satisfaction.
4.2.3.5 Empathy – capacity of the staff understanding the customer’s condition
from their perspective
The respondents were also asked to indicate the level of satisfaction with regard to
empathy as an indicator of LUKU service quality and customer satisfaction. The
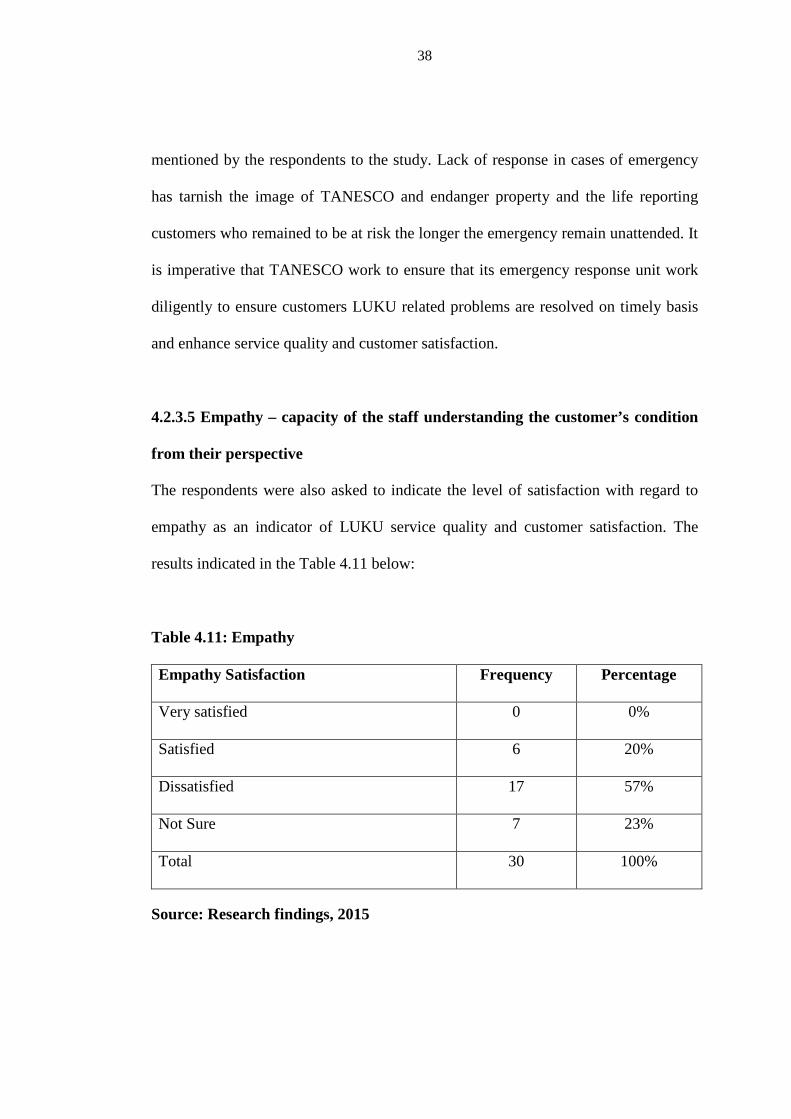
results indicated in the Table 4.11 below:
Table 4.11: Empathy
Empathy Satisfaction Frequency Percentage
Very satisfied 0 0%
Satisfied 6 20%
Dissatisfied 17 57%
Not Sure 7 23%
Total 30 100%
Source: Research findings, 2015
39
The results of Table 4.11 indicates that 57% of the respondents were dissatisfied with
the capacity of the staff to empathize with customer needs and requests, 20% of the
respondents indicated satisfaction with empathy level while the remaining 23% were
indifferent between being satisfied and dissatisfied. Empathy is one of the very
important aspects in ensuring that services are delivered to customers in a friendly
manner to enhance the experience with the services. In order to optimize empathy it
is crucial that customers define the service in the same way as the service provider.
Jeff (2014) narrated the confounding aspect about empathy is how obvious the
problem seems to those who can relate to the situation. Employees who have had
similar experiences are often naturally able to empathize with their customers in a
way that other employees can’t. Susan (2004) described Customer Service from the
Heart is service that is delivered with care, with empathy and yes, even with love.
This kind of service has positive effects on the bottom line of the companies that
model, train and encourages their employees in service from the heart. Companies
that truly care for their customers are generally more profitable than those which do
not. Incidences of poor customer handling and services related to TANESCO entails
that the company should consider the importance empathy in ensuring customer
service satisfaction. Empathy should come from having had similar experiences and
thus the easiest way to help customer service employees become more empathetic is
to put them in their customers’ shoes through simulation training. That is one of the
best ways to satisfy customers.
40
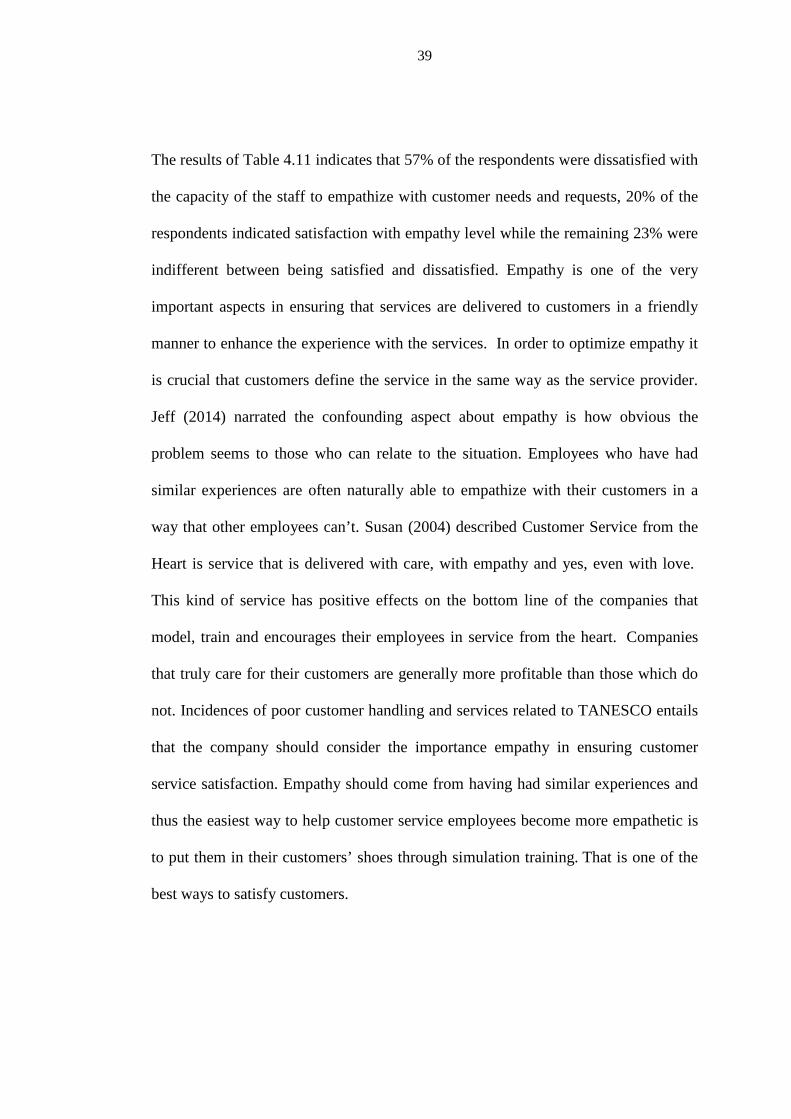
4.3 Factors Indicating Customers dissatisfaction
In order to gets an insight into factors contributing into customer dissatisfaction with
respect to LUKU services, the respondents were asked to list some of the factors
which led them to be dissatisfied with LUKU services. The results of the findings are
shown in the Table 4.12 below:
Table 4.12: Reasons for Customer Dissatisfaction
Dissatisfaction Reasons Frequency Percentage
Expensive services 29 97%
Poor customer service / care 25 83%
Poor technology and connectivity 18 60%
Delays in case of emergency 21 70%
Unreliable service 15 50%
Poor information about the service 11 37%
Lack of service choice/variations 13 43%
Source: Research Findings, 2015
The results of the findings shows that among the commonly mentioned causes for
customer dissatisfaction include expensive service compared to the daily electrical
use mentioned by (97%) of the respondents, poor customer service / care (83%),
Delays in case of emergency (70%), poor technology and connectivity (60%),
unreliable service (50%), lack of service choice/ variations (43%), and poor
information about the service (37%). In support of the above findings Anuwichanont,

41
2011 argued that higher prices have negative effects on customer purchase
(Anuwichanont, 2011). Similarly various researches have stated that perceived fair
price is an influential factor on companies’ success. Jiang and Rosenbloom, 2005
pointed that customers always compare expected price with the price that they have
paid and if a price is perceived to be less than the reference price, then customers will
perceive price fairness and transaction value else they feel loosing value.
Furthermore according to Tourism and More Journal (2008), customer dissatisfaction
comes from a variety of causes which include inability to deliver what is promised,
lack of accepting personal/corporate responsibility, rudeness and inability to connect
with customers, and unconscious projected attitude of “I really hate my job and/or
the people whom I have to serve.
It is argued that quality customer service positively affects customer satisfaction. As
Looy et al (2003) points out that Service quality is one of those factors that
contribute to customer satisfaction. And providing high quality customer service that
actually satisfies the needs of the customer and results in customer satisfaction is one
of the biggest concerns of businesses today. Customer satisfaction determines the
behavioral intentions of the customer hence the reason why companies are
continuously reaching out to the customer with the aim of building strong
relationships that will result in customer loyalty. TANESCO therefore should be
conscious of the role played by quality customer service in building these strong
relationships. By gaining such insights into customer perceptions and expectations
managers will be in a position to offer products and services that meet customer
demands.
42
In the long run the TANESCO will gain from the quality service by increasing its
customer retention and profitability. Customer service favorably affects customer
loyalty and retention which is the resultant behavioral intention that any company
should strive to achieve. Thanks to service excellence “service quality, customer
satisfaction and customer value are becoming the most important factors of business
success for either manufacturers or service providers” (Wang and Lo, 2002).
4.3 Challenges and Solutions towards ensuring customer satisfaction in
TANESCO
4.3.1 Challenges towards Ensuring Customer Satisfaction
In order to gets an insight into the challenges facing TANESCO in ensuring effective
and quality services, the respondents were asked to identify some of the challenges
facing TANESCO. The results of the findings are highlighted in the Table 4.13
below.
Table 4.13: Challenges
Challenges Frequency Percentage
Ability to deliver high quality customer service 20 67%
Under qualified employees 8 27%
Handling the large number of customers 15 50%
Ability to employ advanced and reliable/relevant
technology
22 73%
Ability to avoid theft 13 43%
Ability to provide crucial information on timely basis 19 63%
Source: Research Findings, 2015
43
The Table 4.13 above reveals that 73% of respondents indicate that inability to
employ better advanced and more reliable/relevant technology is the biggest
challenge faced by TANESCO. Other challenges mentioned include ability to deliver
high quality customer service mentioned by 67 % of the respondents, ability to
provide crucial information on timely basis (63%), handling the large number of
customers (50%), inability to control theft (43%) and presence of under qualified
employees mentioned by 27% of the respondents. Under normal circumstances
companies do faces various challenges in ensuring that their customers are satisfied
and are happy with the products and services offered by the company. This is in line
with Kotler (1997) who emphasized that, “the cost of keeping a new customer is
estimated to be five times the cost of keeping a customer happy”. In the case of
TANESCO, lack of advanced and reliable technology has proven to be a hindrance
in ensuring quality of services offered and eventual customer satisfaction. In an
interview with some of the respondents, they had pointed out that buying LUKU
units have been a challenge either through unavailability or delays. Furthermore the
LUKU machines have been prone to being tempered with and thus leading to theft
and loss of revenue as well as destruction of infrastructure of the company. Presence
of competent staff is another important aspect in ensuring service quality and
customer satisfaction. Competent staff that posses required skills, knowledge and
courtesy helps to convey trust and confidence of customers to the services offered by
the company. Presence of incompetent staff has a negative effect on perceived
quality and customer satisfaction and thus should be avoided by companies.
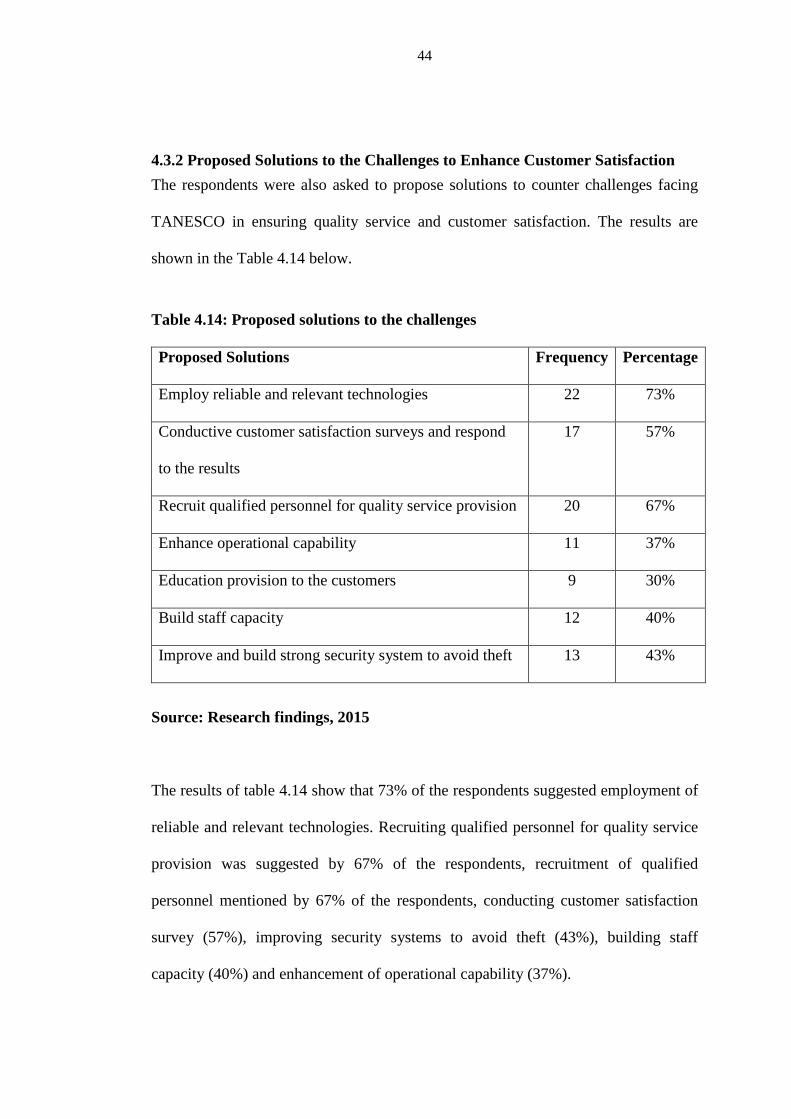
44
4.3.2 Proposed Solutions to the Challenges to Enhance Customer Satisfaction
The respondents were also asked to propose solutions to counter challenges facing
TANESCO in ensuring quality service and customer satisfaction. The results are
shown in the Table 4.14 below.
Table 4.14: Proposed solutions to the challenges
Proposed Solutions Frequency Percentage
Employ reliable and relevant technologies 22 73%
Conductive customer satisfaction surveys and respond
to the results
17 57%
Recruit qualified personnel for quality service provision 20 67%
Enhance operational capability 11 37%
Education provision to the customers 9 30%
Build staff capacity 12 40%
Improve and build strong security system to avoid theft 13 43%
Source: Research findings, 2015
The results of table 4.14 show that 73% of the respondents suggested employment of
reliable and relevant technologies. Recruiting qualified personnel for quality service
provision was suggested by 67% of the respondents, recruitment of qualified
personnel mentioned by 67% of the respondents, conducting customer satisfaction
survey (57%), improving security systems to avoid theft (43%), building staff
capacity (40%) and enhancement of operational capability (37%).
45
In order to enhance the quality of service offered and be successful effective
customer care has proven to be a crucial aspect for business organizations and
because of increasing competition (both for profit or nonprofit) has forced
businesses to pay much more attention to satisfying customers, including by
providing strong customer service. Increasingly companies have become more aware
on the role of customer service in the overall context of product or service
development and management. Improvement of security systems is also crucial in
order to avoid theft, since there are customers collaborating with some of
untrustworthy and non staff (known as vishoka) in fraudulent acts which include
vandalism, theft, and sabotage of systems and infrastructure. Incidents involving
illegal usage of stolen LUKU machines whereby unscrupulous customers have also
been rampant and contribute to the struggles of the utility company. TANESCO
therefore should find and build strong security by hiring the right people, use
electronic physical security (EPS) and surveillance system to ensure safety of and
minimize losses.
Building staff capacity through provision of proper trainings to new and current staff
to meet their key responsibilities is very crucial in ensuring delivery of quality
services and ultimate customer satisfaction.
Furthermore, enhancing operational capability is very important in the sense that it
assists organizations to better understanding and effectively integrate the total
enterprise ability or capacity to achieve .The ability to provide education and creating
awareness to the customers about the product is a means to achieve customer
46
satisfaction since when people understand what the product is and how it works,
helps to influence the level of satisfaction.
4.3.3 Discussion of the findings
In this study the researcher tried to assess LUKU service quality and customer
satisfaction in Tanzania by trying to gauge the level of satisfaction of customers in
relation to five indicators of LUKU service quality and satisfaction. These five
indicators which were generally identified through the literature were price (entailing
the value of the service), timeliness (ability to deliver the service timely) Service
reliability (provision of promised services dependently and accurately),
responsiveness (reaction in terms of emergency) and empathy (capacity of the staff
understanding the customers condition from their perspective). The findings of the
study found that there is positive relationship between service quality and customer
satisfaction. These findings are in line with the study conducted by Luhemeja et al
(2010) who assessed the relationship between the service quality and customer
purchase decisions and satisfaction in utilities and found that service quality have the
significant relationship with customers purchase decision and satisfaction.
Furthermore Ibook and Udofot (2012) found out that customer satisfaction is a
measure of how firm’s product or service is able to meet or exceed customer’s
expectation which entails a positive relationship between quality and satisfaction of
respective customers.
The results of the study furthermore show that the respondents considered price
(93% of the respondents), timeliness (70%), reliability (83% of the respondents),
47
responsiveness (87%) and empathy (57%) to be among the indicators of service
quality and related customer satisfaction. The respondents also identified poor
customer service to be among the major cause for dissatisfaction which further
highlights the importance of customer service in satisfying customers. These
findings are in line with the study conducted by Abdullatif (2013) who identified
network reliability, willingness to pay, responsiveness to be among the factors
influencing customer satisfaction. J.D Power (2005) on the other hand identified
reliability, price and customer service to be among the factors influencing overall
customer satisfaction in electricity utilities. The results are also in line with the
Mukhtar et al (2014) who identified the dimensions of service quality to include
reliability, assurance, responsiveness, empathy and tangibility. Muktar et al (2014)
on the other hand concluded that reliability, responsiveness and empathy have less
important relationship with customer satisfaction as compared to other indicators
such as willingness to pay (price) and tangibility. The study furthermore found that
among the factors leading to dissatisfaction on LUKU service were expensive
services, poor customer service/care, poor technology and connectivity, delays in
case of emergency, unreliable service, poor information about the service and lack of
service choice/variations. These factors directly affect the perceived quality of
services negatively and thus underlining the positive relationship aspect between
service quality and customer satisfaction.
48
CHAPTER FIVE
SUMMARY, CONCLUSSION AND RECOMMENDATIONS
5.0 Introduction
This chapter aims at providing conclusion from the study. Chapter one defined the
problem under study while the second chapter reviewed the literature relevant to the
problem under the study. Chapter three highlighted on the research methodology
whereas chapter four discussed data analysis and results for the study. It is therefore
the aim of this chapter to discuss the conclusions, recommendations and suggest
areas for further study.
5.1 Summary
This dissertation report sought to assess LUKU service quality and customer
satisfaction. The research report sought to establish the extent to which LUKU
services customers have been satisfied with the service provided by TANESCO. The
research design used is through questionnaire, interview, documentary review
and observations. The major finding of the reports indicates that all the research
objectives were relevant and important as presented in the chapter four.
5.2 Conclusion
As reported by various scholars, service quality and customer satisfaction is a very
important aspect in business within the electricity sector/industry among others.
Since offering a better quality to satisfy the needs of customers should be at the
forefront of business agenda for LUKU service providers, therefore the study aimed
at assessing the quality of LUKU service and related customer satisfaction in
49
Tanzania. Qualitative approach was used with some element of quantitative approach
in computation of frequency, percentage and use of tabulation
On the basis of the findings of the study, main factors influencing LUKU customer
satisfaction and the service quality are price, timeliness, network reliability,
responsiveness in case of emergency and empathy.
It has also been observed that, price and responsiveness have a relatively higher
impact on customer satisfaction than the other mentioned factors. However,
TANESCO should concentrate much on responsiveness than price, as several studies
that examined the relationship between customer satisfaction and price tolerance has
found a positive association between changes in customer satisfaction and changes in
price tolerance. According to Anderson, 2014 reported increasing customer
satisfaction is likely to decrease price elasticity of demand. This tells us that over
time, customer satisfaction does influence price tolerance. It means that as a
customer becomes more satisfied with the level of service delivered by a company,
price becomes less a factor. Moreover, network reliability, timeliness and empathy
should be taken care for by TANESCO as a way of enhancing LUKU service quality
and customer satisfaction. The study also found that LUKU service quality has direct
positive relationship to customer satisfaction as the lower the quality of service
offered lead to lower customer satisfaction and vice versa. Thus TANESSCO's
ability to provide services that meets customers’ needs is an important factor that
could influence customer satisfaction with regard to LUKU services in Tanzania.
50
The study also contributes into existing knowledge on the issue of LUKU services
customer satisfaction in Tanzania, which has not received much attention in the
literature.
5.3 Recommendations
On the basis of the findings of this study, the following recommended measures are
envisioned to enhance LUKU service customer satisfaction in Tanzania
i. To ensure proper understanding of customer’s concerns and needs in
order to properly serve them. The relevant information can be gathered
through customer forums and surveys, as well as through the interactions
that occur during normal course of transactions. Usage of comments and
concerns to determine ways the business can achieve a better response
can also be adopted. Gathering of ideas from various individuals within
the business to gain an insight on how the potential adjustments will
impact the customer and the company is also crucial.
ii. Applications of modern technology can help improve service excellence,
by improving operating processes and helping to gain and collect more
information on customers’ needs as well as improving service delivery to
customers in order to maintain customer satisfaction levels.
51
iii. Employees of TANESCO should thoroughly trained on the LUKU service, to
be able to respond to queries and converse on the product and services.
Implementing training and continuous education programs are very effective
methods for improving and maintaining customer satisfaction.
iv. Management of TANESCO should work on different customer’s complaints
and establish a system of collective through various means. Some of these
means are suggestion boxes, effective use of information and communication
technology (ICT) such collection of suggestion using e-mails, website and
others.
v. To re–evaluate the pricing strategy in order to bring it in-line with the
customer satisfaction goal. TANESCO should raise the company’s prices and
proportionately allocate more resources to create an amazing experience that
surprised the customers. This will lead to stronger satisfaction and happy
customers who consider the company’s prices to be fair.
vi To increase operational controls to prevent the issue of theft in the company.
It is important to review policy and procedure to identify any weaknesses and
enforce a zero tolerance approach to employee theft and dishonesty and
consider cross training employees and rotating their duties so that no single
employee is responsible for operation of an entire area. Furthermore
conducting regular audits to prevent deter stealing.
52
5.4 Future Research Topics
Considering the usefulness of electricity and the growth and application of
Information and Communication Technology (ICT) around the globe, it is obvious
that current and future supply of electrical services such as LUKU services would
very much integrate the use of ICT in enhancing supply or services and outreach to
customers and other stakeholder. Therefore, a future research can be performed to
assess the impact of ICT in provision, service quality and customer satisfaction of
LUKU services.
53
REFERENCES
Abdullateef, U. (2013) “Determinants of Electricity Consumers Satisfaction in
Selected Electricity Distribution Zones in Nigeria: Implications for
Regulatory Activities”, Journal of Asian Business Strategy. 3(6):
103-124.
Akele, T. S. (2012). Customer Service Quality in Ethiopia Electric Power
Corporation (EEPCO): Prepayment Customer Service. Master Thesis
Uppsala University, Department of Business Studies.
Akgam, H. (2013) Study of Customer Satisfaction in the Banking Sector in
Libya. Master Thesis, University of Utara, Malaysia.
Anuwichanont, J. (2011), “The Impact of Price Perception on
Customer Loyalty in the Airline Context”, Journal of Business and
Economics Research, 9, 37-49.
Babbie, E. (1992). The Practice of Social Research. Belmont California: 6th
Edition.
Bart, A. B. (2014). Timeliness and Customer Satisfaction.
[http://www.sandiegocorporatetraining.com/timelinessandcustomers
htm l] Site visited on 27th March, 2015.
Bitner, M. (1990) “Evaluating Service Encounters: The Effects of Physical
Surroundings and Employees Responses”. The Journal of Marketing,
69 – 82.
Churchill, G. (2004). Marketing Research: Methodological Foundation. Illinois:
Dryden Press.
54
Cohen, L., Morrison, K & Manion, L. (2007). Research Methods in Education
(6th Ed). New York: Routledge.
Ekinci, Y. & Sirakaya, E. (2004). “An Examination of the Antecedents and
Consequences of Customer Satisfaction” In: Crouch G.I, Perdue
R.R, Timmermans H.J.P, & Uysal M. Consumer Psychology of
Tourism, Hospitality and Leisure. Cambridge, MA: CABI
Publishing, 189-202.
Evangelos, G. & Yannis, S. (2009). “Customer Satisfaction Evaluation: Methods
for Measuring and Implementing Service Quality”. Springer Science
and Business Media.
Ibok N, I., and Udofot P. O., (2012). Customers’ Retention in Micro Finance
Banks: An Analysis of Drivers and Inhibitors. International Journal
of Marketing Studies. 4 (5): 74-80.
J. D. Power (2015). Electric Utility Business Customer Satisfaction Study:
Utilities See Boost in Business Customer Satisfaction. The McGraw
Hill Financial.
Jiang, P. & Rosenbloom, B. (2005). “Customer intention to return online: price
perception attribution-level performance, and satisfaction unfolding
over time”, European Journal of Marketing, 39(1/2), 150-174.
Kothari, C. R. (2004). Social Research Methodology (Methods and Techniques),
2nd Edition. New Delhi, New Age International Publisher: India.
Kotler, P. (1997). Marketing Management: Analysis, Planning, Implementation,
and Control. 9th Ed. New Jersey; Prentice-Hall Inc.
55
Looy, B.V., Gemmel, P., Van Dierdonck, R. (2003), Services Management; An
Integrated Approach.Great Britain: Pearson Education Limited. 2nd
edition.
Mattila, A. & O’Neill, J.W. (2003). “Relationships Between Hotel Room ricing,
Occupancy and Guest Satisfaction: A Longitudinal Case of a
Midscale Hotel in the United States”, Journal of Hospitality and
Tourism Research. 27 (3): 328-341. Sage Publications
Mistry, S. H. (2013) Measuring Customer Satisfaction in Banking Sector: With
Special Reference to Banks of Surat City Asia Pacific, Journal of
Marketing & Management Review. 2 (7): 132-140.
Mukhtar, A., Inam, H., Ashiq, H., Amjad, R., and Nasar, H. (2014). Customer
Satisfaction towards Financial Services of Banks: An Empirical Case
Study from Bahawalpur, Pakistan. Journal of Marketing and
Management. 2(1): 94-111.
Kinondoni Municipal Council Report (2015). [http://kinondonimc.go.tz/] Site
visited on 23rd March, 2015.
Murphy, J. A. (2000). The Lifebelt: The Definitive Guide to Managing Customer
Retention. London: John Wiley and Sons Limited.
Nationalgrid (2015). Customer Service and Network Reliability.
[http://www2.nationalgrid.com/responsibility/how-were-doing/grid-
data- centre/Customer-service-and-network-reliability/]
Site visited on 28th July, 2015.
56
Oduro, R. (2013). Factors That Determine Customer Satisfaction Level in
Banking Institutions: Evidence from Ghanaian Banking Industry,
Asian Journal of Business and Management Sciences. 2(7): 01-13.
Oliver, L. R. (1997). Effect of Expectation and Disconfirmation Theory on Post
Exposure Product Evaluations: An Alternative Interpretation,
Journal of Applied Psychology. 62 (94): 480-486.
Oliver, L. R. (1990) “Theoretical Bases of Consumer Satisfaction Research
Review, Critique and Future direction”. Inc. Lamb & P.Dunne (Eds),
Theoretical Developments in Marketing, 206-210. Chicago:
American Marketing Association.
Patrick, D., Adler, J., Epstein, B., Foran, M. (1996). Interpretation and
Application of Generally Accepted Accounting Principles. John
Wiley & Sons.
Petrick, J.F. (2004). “The Roles of Quality, value and Satisfaction in Predicting
Cruise Passengers’ Behavioral Intentions”, Journal of Travel
Research, 42 (4): 397-407, Sage Publications.
Reicheld, P., and Frederick, R. (1996).“The loyalty Effect: The hidden force
behind growth, profits and lasting value”. Watertown MA: Business
Harvard Review.[http://en.m.wikipedia.org/wiki/customer_retention
] Site visited on 16th March, 2015.
Ross Beard (2014). Customer Satisfaction: How does your pricing strategy affect
customer satisfaction?[http://blog.clientheartbeat.com/pricing-
customer- satisfaction/] Site visited on 28th July, 2015.
57
Saunders, M., Lewis, P., and Thornhill, A. (2007). Research Methods for
Business Students. 4th Edition, New York. Prentice Hall.
Tourism & More (2008). Tourism Tidbits Archive: Dealing with dissatisfied
customers.[http://www.tourismandmore.com/tidbits/dealing-with-
dissatisfied-customers/] Site visited on 21st July, 2015.
Wang, Y. & Lo, H.P., (2002). “Service Quality, Customer Satisfaction and
Behavior of Hong Kong & International Business School, Nankai
Intentions Evidence from China’s telecommunication industry”, Info
4,6. University of Hong Kong & International Business School,
Nankai University. 50-60
Woods, D. L. et al (2000). Public / Private Purchasing. In Cavinato J. L., and
Kauffman, R. G. (Eds.). The purchasing Handbook: A guide for the
purchasing and supply chain professionals, The McGraw-Hill
Companies, Arizona
Yuksel, A., Yuksel, F. (2008). Consumer Satisfaction Theories: A Critical
Review. In Tourist Satisfaction and Complaining Behavior:
Measurement and Management Issues in the Tourism and
Hospitality Industry. (Edited by Yuksel. A), Nova Science
Publishers, New York.
James Hope (2012). Electricity Distribution Annual Report.
[https://www.ofgem.gov.uk/ofgem-
publications/46553/electricitydistributionannualreportfor201011.pdf]
Site visited on 28th July, 2015.
58
Jeff, T.(2014). Have Empathy: Customer Satisfaction.
[https://www.salesforce.com/blog/2014/06/customer-service-
empathy- gp.html] Site visited on 12th 2015.
Kristin, R. (2004). Customer Service from the Heart: The Importance of
Empathy KR Consulting Inc.[http://www.krconsulting.com/custome
r- service-from-the-heart-the-importance-of-empathy/] Site visited
on 28th August, 2015.
Zeithaml, V., & Bitner, M. (2003). Services Marketing, 3rd Edition. The McGraw
Hill Higher Education: Irwin.
Zeithamil, A. V., Parasuraman, A., Berry, L. (2009). Delivering Quality Service:
Balancing Customer Perceptions. Free Press.
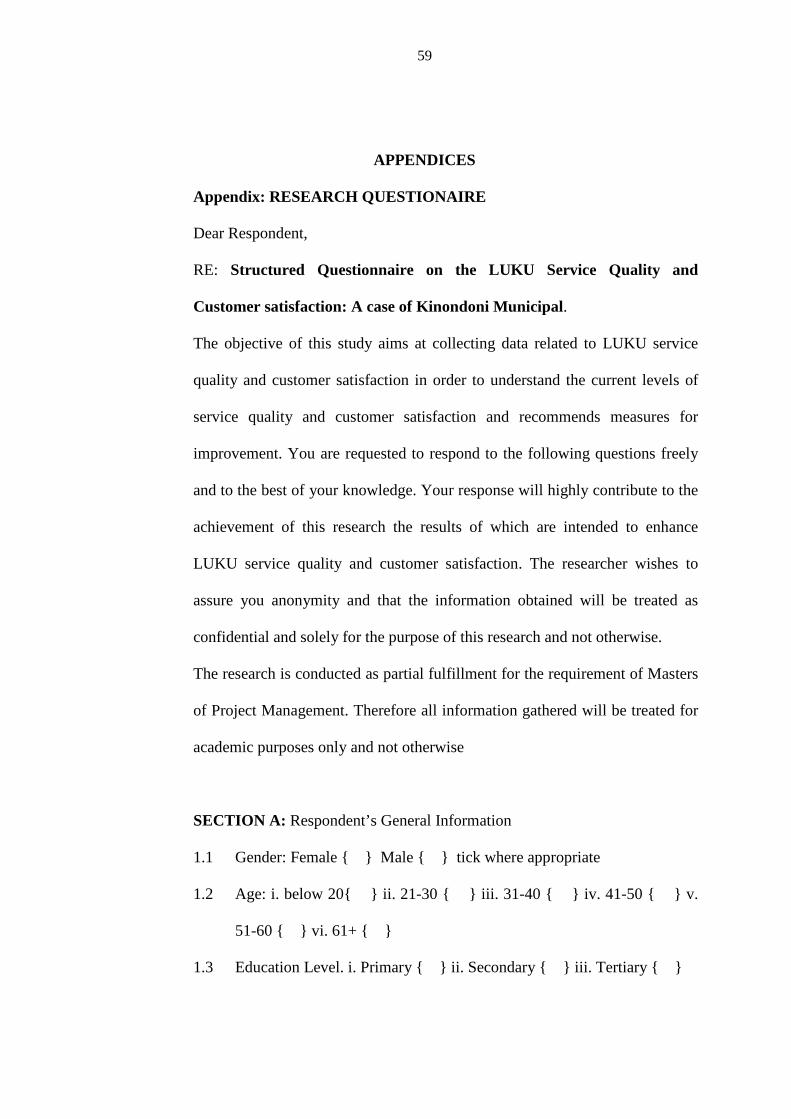
59
APPENDICES
Appendix: RESEARCH QUESTIONAIRE
Dear Respondent,
RE: Structured Questionnaire on the LUKU Service Quality and
Customer satisfaction: A case of Kinondoni Municipal.
The objective of this study aims at collecting data related to LUKU service
quality and customer satisfaction in order to understand the current levels of
service quality and customer satisfaction and recommends measures for
improvement. You are requested to respond to the following questions freely
and to the best of your knowledge. Your response will highly contribute to the
achievement of this research the results of which are intended to enhance
LUKU service quality and customer satisfaction. The researcher wishes to
assure you anonymity and that the information obtained will be treated as
confidential and solely for the purpose of this research and not otherwise.
The research is conducted as partial fulfillment for the requirement of Masters
of Project Management. Therefore all information gathered will be treated for
academic purposes only and not otherwise
SECTION A: Respondent’s General Information
1.1 Gender: Female { } Male { } tick where appropriate
1.2 Age: i. below 20{ } ii. 21-30 { } iii. 31-40 { } iv. 41-50 { } v.
51-60 { } vi. 61+ { }
1.3 Education Level. i. Primary { } ii. Secondary { } iii. Tertiary { }
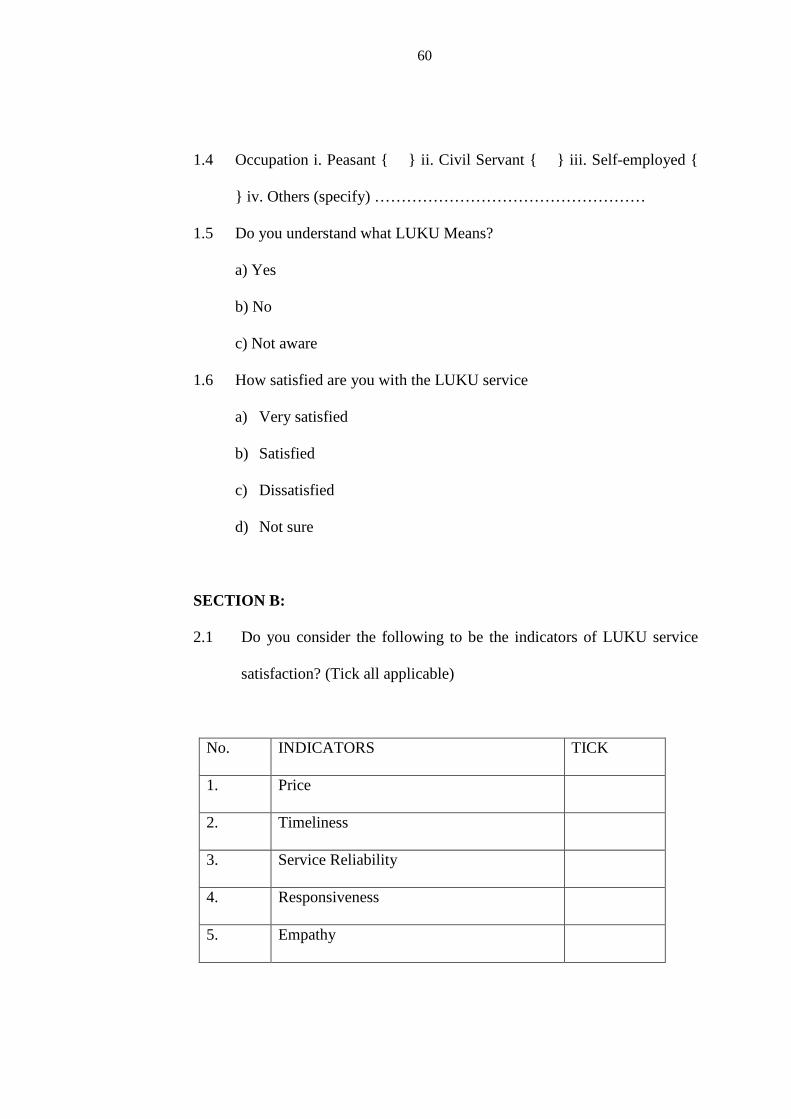
60
1.4 Occupation i. Peasant { } ii. Civil Servant { } iii. Self-employed {
} iv. Others (specify) ……………………………………………
1.5 Do you understand what LUKU Means?
a) Yes
b) No
c) Not aware
1.6 How satisfied are you with the LUKU service
a) Very satisfied
b) Satisfied
c) Dissatisfied
d) Not sure
SECTION B:
2.1 Do you consider the following to be the indicators of LUKU service
satisfaction? (Tick all applicable)
No. INDICATORS TICK
1. Price
2. Timeliness
3. Service Reliability
4. Responsiveness
5. Empathy
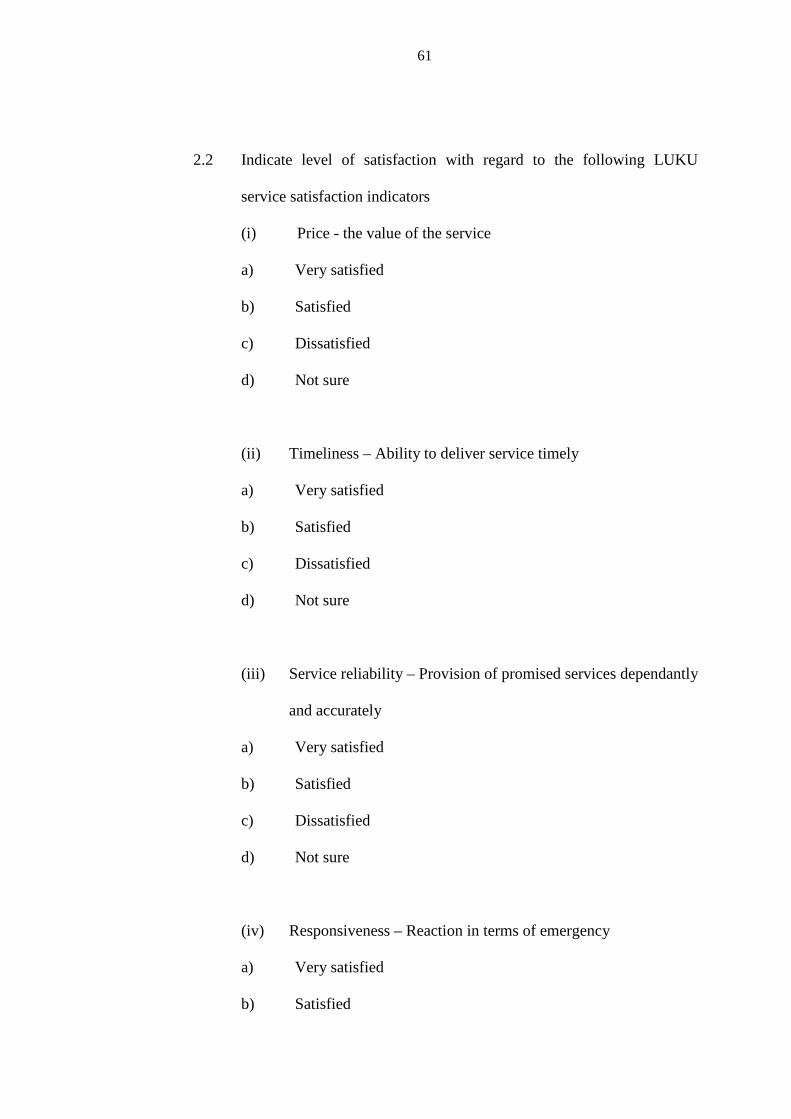
61
2.2 Indicate level of satisfaction with regard to the following LUKU
service satisfaction indicators
(i) Price - the value of the service
a) Very satisfied
b) Satisfied
c) Dissatisfied
d) Not sure
(ii) Timeliness – Ability to deliver service timely
a) Very satisfied
b) Satisfied
c) Dissatisfied
d) Not sure
(iii) Service reliability – Provision of promised services dependantly
and accurately
a) Very satisfied
b) Satisfied
c) Dissatisfied
d) Not sure
(iv) Responsiveness – Reaction in terms of emergency
a) Very satisfied
b) Satisfied
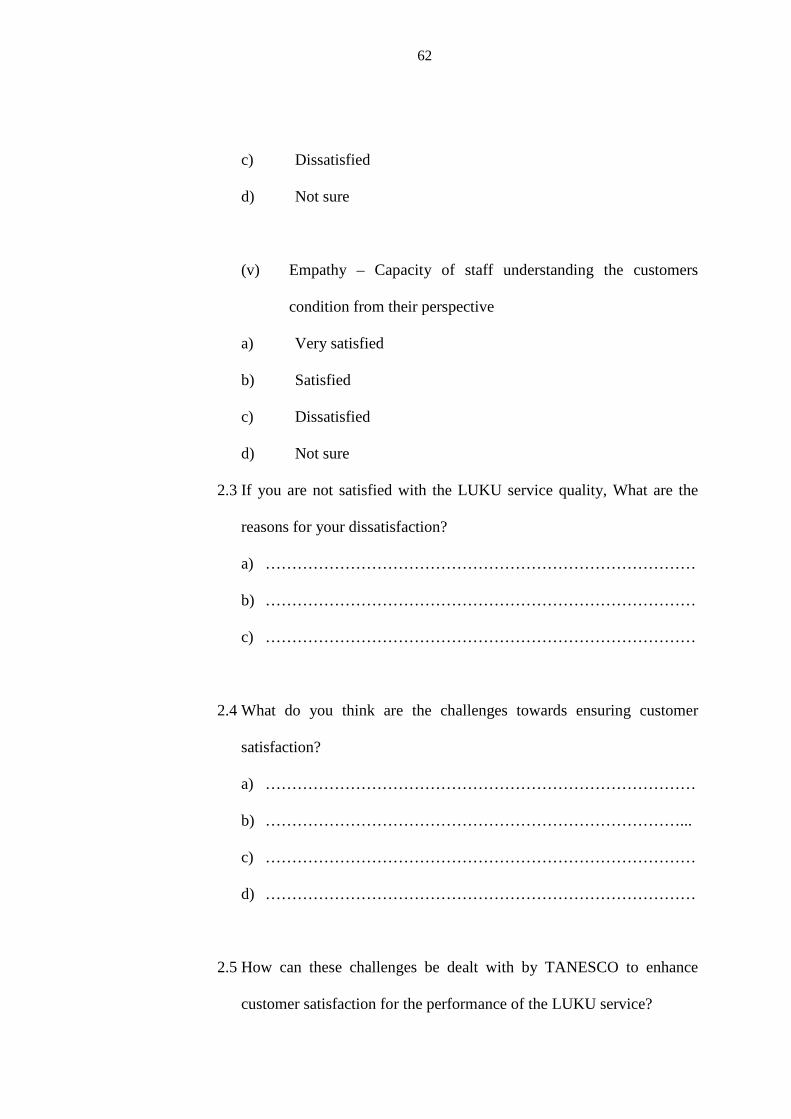
62
c) Dissatisfied
d) Not sure
(v) Empathy – Capacity of staff understanding the customers
condition from their perspective
a) Very satisfied
b) Satisfied
c) Dissatisfied
d) Not sure
2.3 If you are not satisfied with the LUKU service quality, What are the
reasons for your dissatisfaction?
a) ………………………………………………………………………
b) ………………………………………………………………………
c) ………………………………………………………………………
2.4 What do you think are the challenges towards ensuring customer
satisfaction?
a) ………………………………………………………………………
b) ……………………………………………………………………...
c) ………………………………………………………………………
d) ………………………………………………………………………
2.5 How can these challenges be dealt with by TANESCO to enhance
customer satisfaction for the performance of the LUKU service?

63
a) ……………………………………………………………………
b) ……………………………………………………………………
c) ……………………………………………………………………
d) ……………………………………………………………………
e) ……………………………………………………………………
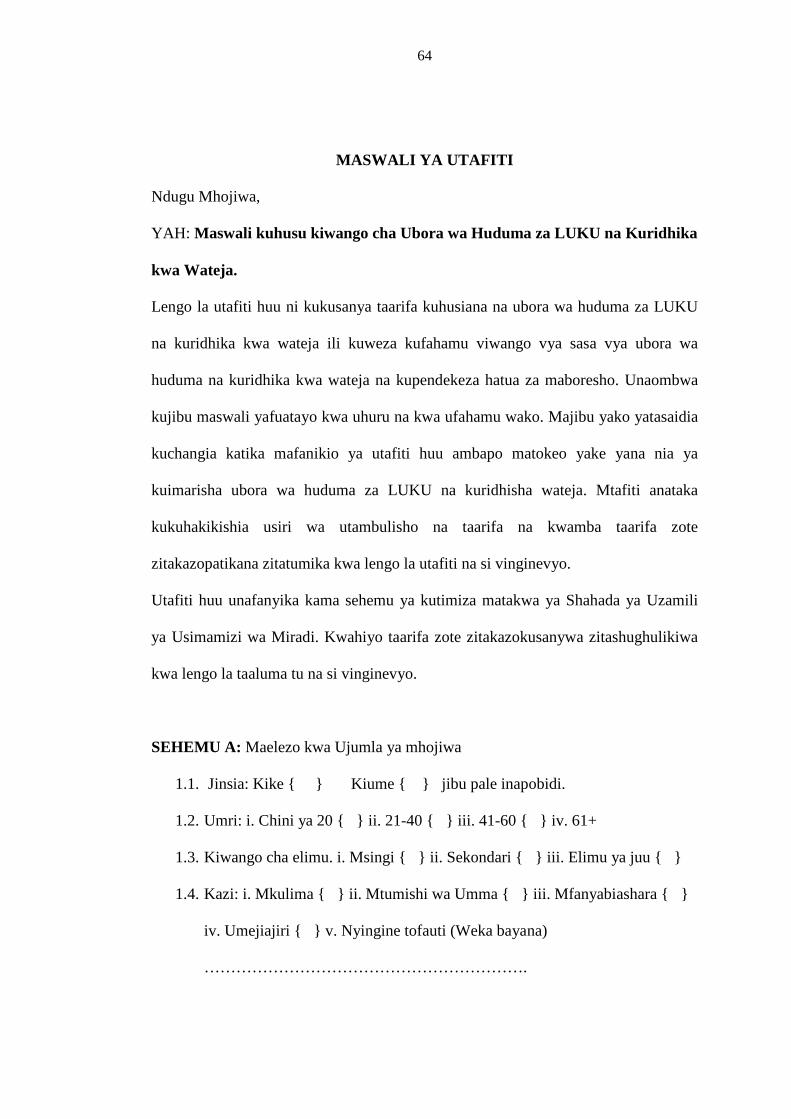
64
MASWALI YA UTAFITI
Ndugu Mhojiwa,
YAH: Maswali kuhusu kiwango cha Ubora wa Huduma za LUKU na Kuridhika
kwa Wateja.
Lengo la utafiti huu ni kukusanya taarifa kuhusiana na ubora wa huduma za LUKU
na kuridhika kwa wateja ili kuweza kufahamu viwango vya sasa vya ubora wa
huduma na kuridhika kwa wateja na kupendekeza hatua za maboresho. Unaombwa
kujibu maswali yafuatayo kwa uhuru na kwa ufahamu wako. Majibu yako yatasaidia
kuchangia katika mafanikio ya utafiti huu ambapo matokeo yake yana nia ya
kuimarisha ubora wa huduma za LUKU na kuridhisha wateja. Mtafiti anataka
kukuhakikishia usiri wa utambulisho na taarifa na kwamba taarifa zote
zitakazopatikana zitatumika kwa lengo la utafiti na si vinginevyo.
Utafiti huu unafanyika kama sehemu ya kutimiza matakwa ya Shahada ya Uzamili
ya Usimamizi wa Miradi. Kwahiyo taarifa zote zitakazokusanywa zitashughulikiwa
kwa lengo la taaluma tu na si vinginevyo.
SEHEMU A: Maelezo kwa Ujumla ya mhojiwa
1.1. Jinsia: Kike { } Kiume { } jibu pale inapobidi.
1.2. Umri: i. Chini ya 20 { } ii. 21-40 { } iii. 41-60 { } iv. 61+
1.3. Kiwango cha elimu. i. Msingi { } ii. Sekondari { } iii. Elimu ya juu { }
1.4. Kazi: i. Mkulima { } ii. Mtumishi wa Umma { } iii. Mfanyabiashara { }
iv. Umejiajiri { } v. Nyingine tofauti (Weka bayana)
…………………………………………………….
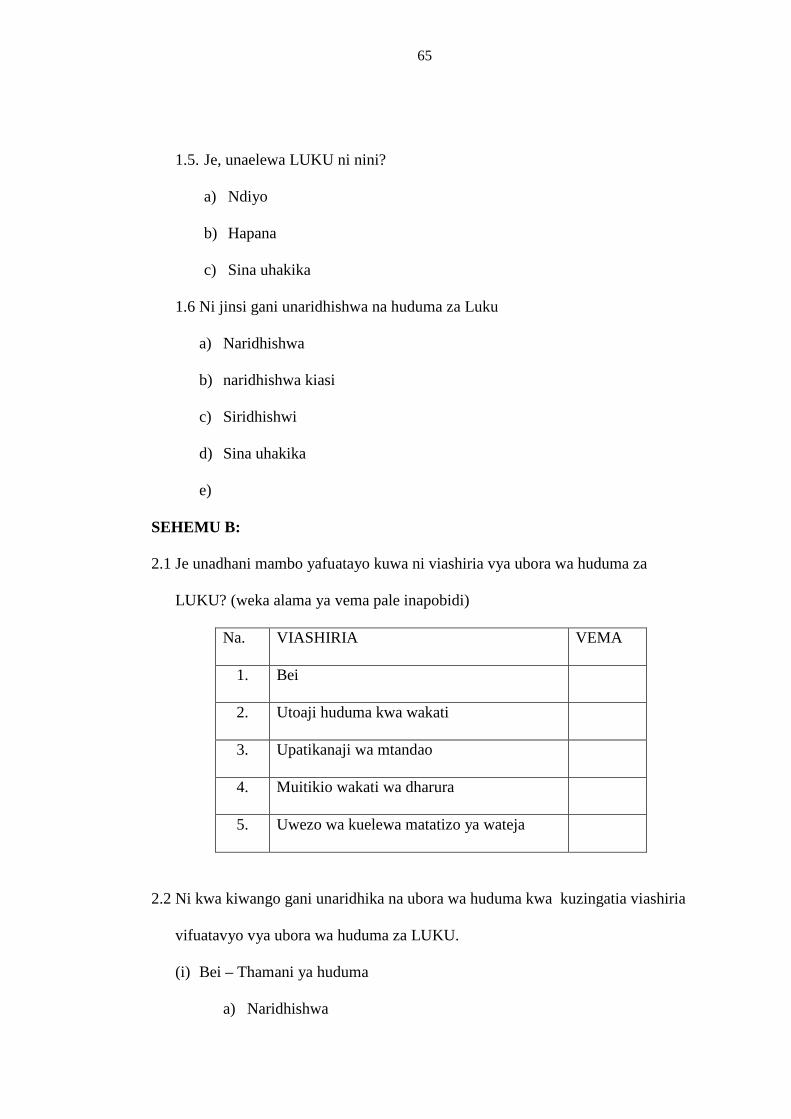
65
1.5. Je, unaelewa LUKU ni nini?
a) Ndiyo
b) Hapana
c) Sina uhakika
1.6 Ni jinsi gani unaridhishwa na huduma za Luku
a) Naridhishwa
b) naridhishwa kiasi
c) Siridhishwi
d) Sina uhakika
e)
SEHEMU B:
2.1 Je unadhani mambo yafuatayo kuwa ni viashiria vya ubora wa huduma za
LUKU? (weka alama ya vema pale inapobidi)
Na. VIASHIRIA VEMA
1. Bei
2. Utoaji huduma kwa wakati
3. Upatikanaji wa mtandao
4. Muitikio wakati wa dharura
5. Uwezo wa kuelewa matatizo ya wateja
2.2 Ni kwa kiwango gani unaridhika na ubora wa huduma kwa kuzingatia viashiria
vifuatavyo vya ubora wa huduma za LUKU.
(i) Bei – Thamani ya huduma
a) Naridhishwa

66
b) Naridhishwa kiasi
c) Siridhishwi
d) Sina uhakika
(ii) Uwezo wa kutoa huduma kwa wakati
a) Naridhishwa
b) Naridhishwa kiasi
c) Siridhishwi
d) Sina uhakika
(iii) Kutegemea huduma - Uthabiti wa ufanyaji kazi wa huduma kwa usahihi
a) Naridhishwa
b) Naridhishwa kiasi
c) Siridhishwi
d) Siridhishwi
(iv) Mwitikio – Majibu wakati wa dharura
a) Naridhishwa
b) Naridhishwa
c) Siridhishwi
d) Sina uhakiki
(v) Uelewa – Uwezo wa kuelewa matatizo ya wateja.
a) Naridhishwa
b) Naridhishwa kiasi
c) Siridhishwi
d) Sina uhakika
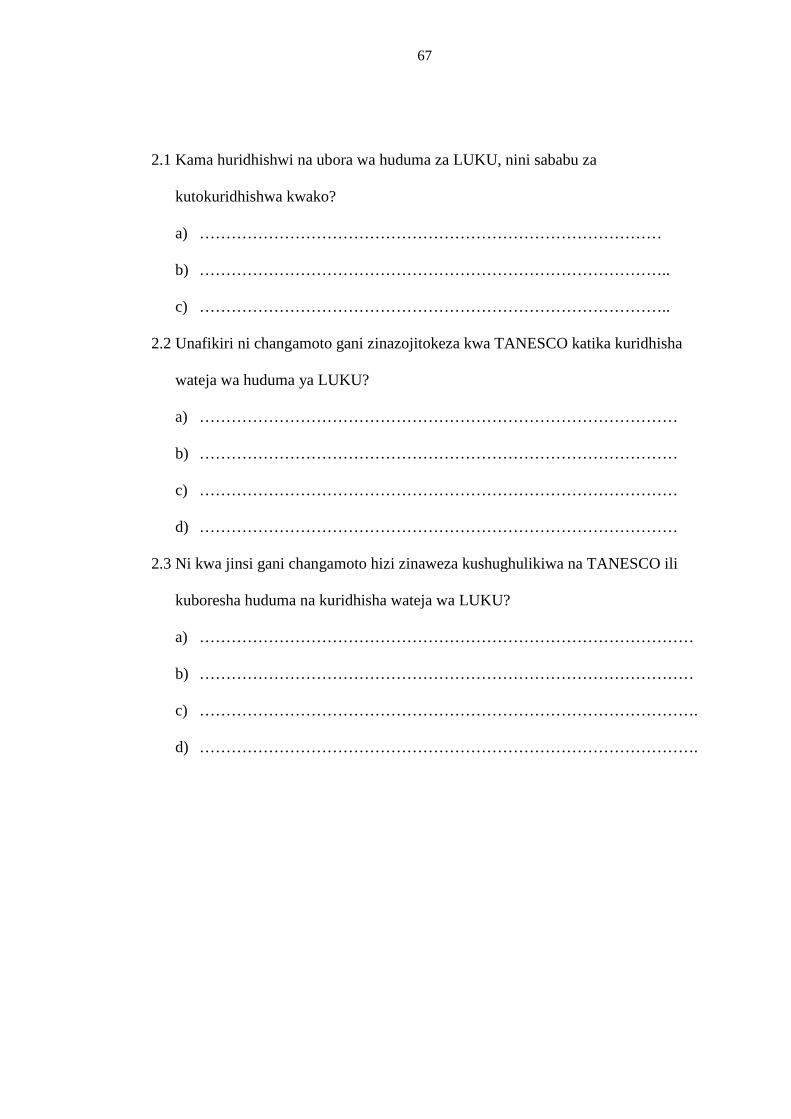
67
2.1 Kama huridhishwi na ubora wa huduma za LUKU, nini sababu za
kutokuridhishwa kwako?
a) ……………………………………………………………………………
b) ……………………………………………………………………………..
c) ……………………………………………………………………………..
2.2 Unafikiri ni changamoto gani zinazojitokeza kwa TANESCO katika kuridhisha
wateja wa huduma ya LUKU?
a) ………………………………………………………………………………
b) ………………………………………………………………………………
c) ………………………………………………………………………………
d) ………………………………………………………………………………
2.3 Ni kwa jinsi gani changamoto hizi zinaweza kushughulikiwa na TANESCO ili
kuboresha huduma na kuridhisha wateja wa LUKU?
a) …………………………………………………………………………………
b) …………………………………………………………………………………
c) ………………………………………………………………………………….
d) ………………………………………………………………………………….