Validation of Submaximal Step Tests and the 6-Min Walk Test for ... - MDPI
Reliability of heart rate recovery and EPOC International SportMed Journal, Vol.15 No.4, December 2014, pp. 352-364. Available at URL: http://www.ismj.com
352 Official Journal of FIMS (International Federation of Sports Medicine)
ISMJ International SportMed Journal
Original research article
Day-to-day variation in heart rate recovery and excess post-exercise
oxygen consumption after a submaximal treadmill protocol
1*Dr Theresa N Mann, PhD, 1,2 Associate Professor Robert P Lamberts, PhD, 1Professor Michael I Lambert, PhD
1UCT/MRC Research Unit for Exercise Science and Sports Medicine, Department of Human Biology,
Faculty of Health Sciences, University of Cape Town, P O Box 115, Newlands 7725, Cape Town, South
Africa 2Division of Orthopaedic Surgery, Department of Surgical Sciences, Faculty of Medicine and Health
Sciences, Stellenbosch University, Tygerberg, South Africa
*Corresponding author. Address at the end of text.
Abstract
Background
A recent, novel approach to measuring training load has been to investigate measures of the post-exercise return towards resting homeostasis for potential in this role. For practical reasons, it is important to determine whether changes in training load produce changes in the recovery measurement that are in excess of the day-to-day variation or within-subject reliability of the measurement. However, the day-to-day variation in certain recovery measurements is not always known. Research objective: To determine day-to-day variation in measures of heart rate recovery (HRR) and excess post-exercise oxygen consumption (EPOC) so as to determine the minimal detectable difference in these measurements for future research. Type of study: Observational cohort study. Methods: Twelve moderately trained runners completed 3 repetitions of a submaximal treadmill protocol on consecutive days. The protocol involved 20 min of running at 70% of maximal oxygen uptake and 15 min of controlled recovery. Day-to-day variation for exercise and recovery measurements was calculated as the typical error as a coefficient of variation (CVTEM). Results: Recovery measurements showed CVTEM values of 8.0% (90% C.I. 6.7-10.3%) for the magnitude of EPOC, 12.9% (90% C.I. 10.6-16.4%) for the time constant of the oxygen consumption recovery curve, 8.7% (90% C.I. 7.2-11.2%) for 1 min HRR and 10.0% (90% C.I. 8.2-12.8%) for the time constant of the HRR curve. In contrast, most exercise parameters had CVTEM values of 2-4%. Conclusions: For future studies in a similar setting, changes in training load that produce changes in HRR or EPOC greater than the CVTEM values of these recovery measurements might be interpreted as of
likely practical significance. Keywords: training load, reliability, heart rate recovery, EPOC, monitoring
*Dr Theresa Mann, PhD
Dr Mann recently completed her PhD at the University of Cape Town's UCT/MRC Research Unit for Exercise Science and Sports Medicine and is currently a postdoctoral researcher in the University of Cape Town’s Department of Surgery. Her research interests include individual variation in response to exercise training, the quantification of training load and monitoring training status.
Reliability of heart rate recovery and EPOC International SportMed Journal, Vol.15 No.4, December 2014, pp. 352-364. Available at URL: http://www.ismj.com
353 Official Journal of FIMS (International Federation of Sports Medicine)
Associate Professor Robert P Lamberts, PhD
Associate Professor Robert Lamberts is the Head of Orthopaedic Research at the Division of Orthopaedic Surgery at Stellenbosch University. In addition, he is also holds an honorary senior staff position at the UCT/MRC Research Unit for Exercise Science and Sports Medicine at the University of Cape Town. His research interests include orthopaedics, HIV research, predicting and monitoring cycling performance, over-reaching and/or overtraining, thermoregulation and biomechanics.
Email: [email protected]
Professor Michael I Lambert, PhD
Professor Lambert is a senior staff member at the University of Cape Town’s Research Unit for Exercise Science and Sports Medicine. His research interests include muscle damage and regeneration and monitoring performance and training status of high performance athletes. Professor Lambert is also editor-in-chief of the South African Journal of Sports Medicine and scientific consultant for the BokSmart programme, an initiative designed to make rugby safer without detracting from performance. Email: [email protected]
Introduction
There is at present no “gold standard” measure of the overall homeostatic stress or internal “training load” of an exercise bout
1,2. For
example, training load based on Session Rating of Perceived Exertion (S-RPE)
3 may be
influenced by subjective factors and training load calculated as a Training Impulse
4 involves
population-based averages that may not be accurate for some individuals. It follows that alternative measures of training load warrant investigation. For example, a recent novel approach has been to investigate measures of the acute recovery towards resting homeostasis at the end of an exercise bout as possible measures of training load
5,6.
It is intuitive that the overall homoeostatic stress of an exercise bout would be related to the post-exercise recovery towards resting homeostasis. For example, heart rate recovery (HRR) is determined by the time course of parasympathetic reactivation and sympathetic withdrawal after the cessation of exercise
7 and
Excess Post Exercise Oxygen Consumption (EPOC) has been attributed to factors such as the restoration of phosphocreatine reserves, increased body temperature, increased circulating catecholamines and lactate removal in the post-exercise period
8–11. As possible
measures of training load, these measures of acute autonomic- or metabolic- recovery have the advantage of being objective and individualized. However, it is not yet clear whether recovery measurements are sufficiently sensitive to changes in the training load of the preceding exercise bout. To be specific, for a recovery measurement to have practical value
as a measure of training load, the minimal detectable change in the recovery measurement should be lower than the smallest worthwhile change in training load
12.
In previous studies, some exercise scientists have justified their own estimation of the smallest worthwhile change in a measurement 13,14
and others have calculated the smallest worthwhile change in a measurement as 0.2 x the between-subject standard deviation of the measurement
15–19 based on the principle of
Cohen’s effect sizes 20
. However, it is not always easy to estimate the smallest worthwhile change in a measurement, particularly when there is no gold standard of the measurement, as in the case of training load. With this in mind, an alternative, preliminary approach is to interpret experimental changes using the minimal detectable change or reliability of the measurement
21–24.
Although measurement reliability is not a substitute for the smallest worthwhile change, it can be used as an indication of whether experimental changes are “real” and/or detectable within a typical amount of biological and technical variation. While some methods of calculating measurement reliability represent between-subject reliability (e.g. intraclass correlation coefficients), interpreting meaningful differences in a measurement requires a measure of within-subject reliability such as the typical error or typical error as a coefficient of variation. As measurement reliability can be affected by factors such as the testing protocol, equipment, participant characteristics and the period between repeated trials
25,26, it is optimal

Reliability of heart rate recovery and EPOC International SportMed Journal, Vol.15 No.4, December 2014, pp. 352-364. Available at URL: http://www.ismj.com
354 Official Journal of FIMS (International Federation of Sports Medicine)
for laboratories to collect their own reliability data under similar conditions to those of subsequent studies.
It is not yet clear which measures of recovery show relatively greater or smaller potential to represent training load and in the current study, these authors chose to include both autonomic recovery, in the form of HRR, and metabolic recovery, in the form of EPOC. To be specific, the aim of the current study was to determine the within-subject reliability of 2 variations of HRR and 2 variations of metabolic recovery as follows: the magnitude of EPOC (EPOCMAG), the time constant of the oxygen consumption
recovery curve (EPOCτ), HRR within the first
minute post-exercise (HRR60s) and the time constant of the heart rate recovery curve
(HRRτ). It was envisaged that determining the
reliability of these recovery measurements would allow for subsequent changes in each recovery measurement to be interpreted in the context of typical day-to-day variation and assist in the further investigation of dynamic recovery measurements as possible measures of training load. While the reliability of heart rate recovery has been reported previously
27–31, to the best of
these authors’ knowledge this was the first study to report the reliability of EPOC magnitude and the associated recovery curve.
Methods
Thirteen male and female runners were recruited for the study, according to the following criteria a) non-smoker b) typically running at least 3 times per week and c) able to answer “no” to all the questions in a Physical Activity Readiness Questionnaire (PAR-Q)
32. This study was
approved by the Human Research Ethics Committee of the University of Cape Town and was conducted in accordance with the
Declaration of Helsinki. All individuals signed an informed consent document prior to participation and agreed to visit the laboratory on 4 occasions. Incremental test
During the first visit, participants completed a brief, self-paced warm-up followed by a continuous, incremental protocol for the determination of maximal oxygen uptake (VO2max) and peak treadmill running speed (PTRS). The protocol started with participants running at 10 km·h
-1 for 1 minute after which the
treadmill speed was increased by 0.5 km·h-1
every 30 s until volitional exhaustion
33.
Participants were verbally encouraged during the test for maximal exertion and a subsequent “verification” run was included as follows: 8-10 min after the incremental protocol, participants completed a run to exhaustion at one stage higher than the highest stage completed during the incremental test to ensure that a “true” VO2max was attained. True VO2max was taken as the higher of the two VO2max values, although the differences between the two values were small (within 2±2%). Submaximal trials: Overview
The 3 subsequent trials for reliability testing were performed at least 48 h after the first visit and took place on consecutive days. The start time for each trial varied by no more than 1 hour to avoid variation as a result of circadian rhythm 34
. Participants were asked to abstain from food and all drink except water for at least 2 h before each trial (this was verbally confirmed at the start of each trial) and to abstain from any other exercise training over the 3 days of the trials. The submaximal protocol consisted of a 5 min treadmill warm-up, a 20 min treadmill exercise and a 15 min passive recovery period (Figure 1).

Reliability of heart rate recovery and EPOC International SportMed Journal, Vol.15 No.4, December 2014, pp. 352-364. Available at URL: http://www.ismj.com
355 Official Journal of FIMS (International Federation of Sports Medicine)
PTRS= Peak Treadmill Running Speed, RPE= Rating of Perceived Exertion
Figure 1: Overview of submaximal treadmill protocol Warm-up
The treadmill speed was adjusted to 70% of the participant’s PTRS, measured during the first laboratory visit, and a 4 min run at 70% PTRS was timed from the point at which the participant had made a comfortable transition onto the moving belt. After 4 min, the treadmill speed was increased to 90% of PTRS and the participant ran a further 1 min at this speed. This warm-up was intended as a “priming” exercise to accelerate the matching of O2 delivery to utilization at the onset of the subsequent exercise 35–38. Submaximal run
Participants were given a 10 min break after the warm-up before starting the 20 min treadmill run at 70% VO2max. For the first submaximal protocol, the initial speed to elicit 70% VO2max was estimated based on the relationship between VO2 and speed determined during the maximal test. Small adjustments were made to the speed as necessary during the early part of the run to elicit the target VO2, after which responses were generally stable. These initial adjustments were made on the basis of an average real-time VO2 vs. target VO2 discrepancy of no greater than 2 ml·min
-1·kg
-1.
For data analysis, only trials where the average measured VO2 was within 2 ml·min
-1·kg
-1 of the
target VO2 were included in the reliability calculations. Nineteen minutes into the submaximal run participants were asked to indicate their rating of perceived exertion (RPE)
39 and with 10 s of the
20 min run remaining, participants were given a
countdown to dismount the treadmill and begin the recovery phase. After 20 min of running, the participant held the rails of the treadmill and stepped to the side of the treadmill belt. The treadmill belt was stopped immediately and the participant stepped back onto the treadmill belt and stood upright on the treadmill belt without moving or speaking- a transition of 3-5 s. Recovery
The first part of the recovery period consisted of 90s standing phase, during which the participants remained motionless and upright on the treadmill. The purpose of this phase was to minimise movement over the time period from which HRR60s would be calculated. The 90s of standing recovery was immediately followed by a seated phase whereby participants were given a cue to be seated upright on the chair placed directly behind them on the treadmill. The combination of a short period of standing recovery followed by seated recovery is similar to the protocol used by Bosquet et al
40. The
duration of the seated phase was 13 min 30 s, completing a total of 15 min of controlled recovery. Participants were requested to remain silent and to minimise movement during both the standing and seated phases of recovery. VO2 and HR kinetics were measured continuously in the transition from exercise to recovery and throughout the recovery period. Temperature, humidity and equipment
calibration
Temperature and humidity in the laboratory were kept as constant as possible during all trials and the Oxycon Pro, which has been previously

Reliability of heart rate recovery and EPOC International SportMed Journal, Vol.15 No.4, December 2014, pp. 352-364. Available at URL: http://www.ismj.com
356 Official Journal of FIMS (International Federation of Sports Medicine)
validated against the Douglas Bag system 41
, was calibrated immediately before each trial using a 3 L syringe (SensorMedics
®, Milan, Italy)
and a reference gas of known composition (16% oxygen, 5% carbon dioxide, balance nitrogen). Data collection and analysis
During the maximal test, as well as during the subsequent submaximal trials, respiratory gas exchange was measured using a breath-by-breath gas analyser (Jaeger Oxycon Pro
®,
Hoechberg, Germany). Respiratory data were averaged over 15 s intervals and VO2max was determined as the highest average value during the test or verification run
42. Heart rate (HR)
during all four trials was measured continuously with Suunto T6 heart rate monitors (Suunto Oy
®,
Vantaa, Finland)43
and averaged over 2 s intervals. Maximal heart rate (HRmax) was taken as the highest HR value during the incremental protocol. Steady state VO2, ventilation (VE), respiratory exchange ratio (RER) and HR during the submaximal run were calculated as the average of the final 17 min of the 20 min exercise. Energy expenditure (EE) during the 20 min submaximal run was calculated based on standard caloric equivalents for oxygen at different respiratory exchange ratio values
44.
The start of recovery was timed from the point at which the participant was standing upright on the stationery treadmill belt. HRR60s was calculated as the difference between the end of exercise HR (taken as the average of the last 16 s of the submaximal run) and the 1 min recovery HR (taken as the average of the last 16 seconds of the first recovery minute) as described previously
29. The start of recovery was timed
from the point at which the participant was standing upright on the stationery treadmill belt. HR data over the 15 min recovery period was modelled as a one-phase exponential decay and
the time constant (HRRτ) and plateau of the
curve were recorded (Graphpad Software, SanDiego, California, USA). Recovery VO2 was also modelled using a one-phase exponential decay and the time constant
(EPOCτ) and plateau of the curve were recorded
(Graphpad Software, San Diego, California, USA). A one phase exponential decay has been shown to be suitable for modelling the recovery VO2 following “moderate” or “heavy” intensity exercise
45. The starting point of the curve was
made to equal the average VO2 over the final 3 min of exercise in order to minimize the influence of spurious breaths during the transition from exercise to recovery. EPOCMAG was calculated as the total area under the recovery curve and was reported in ml∙kg
-1.
Statistical analysis
Exercise and recovery measurements were normally distributed according to the D’Agostino and Pearson normality test (GraphPad Software, San Diego, California, USA). Between-trial differences were examined for statistical significance using repeated measures ANOVA and significant differences were further investigated using a Tukey’s post-hoc test (Statistica version 10, Stat-soft Inc., Tulsa, OK, USA). Significance was accepted at P < 0.05. Between-trial differences were also investigated by calculating Cohen’s effect sizes (d)
20. Effect
sizes were calculated as the difference between the means divided by pooled standard deviation and were interpreted as <0.2 =trivial, ≥0.2 to <0.5 =small, ≥0.5 to <0.8 =moderate and ≥0.8 =large
20. Effect sizes have been used previously
to interpret test reliability 17
. Measurement reliability in the form of typical error of measurement (TEM) and typical error as a coefficient of variation (CVTEM) were determined using the spreadsheet “Reliability from consecutive pairs of trials”, downloaded from www.sportsci.org. All measures of reliability are expressed with 90% confidence intervals (90% C.I.).
Results
All 13 participants completed 3 repetitions of the submaximal protocol on consecutive days, at the same time of day (within 1 h). One participant completed an additional 2 consecutive repetitions of the protocol due to problems with an Oxycon mask and HR belt respectively. All trials, except one, met the defined maximum acceptable deviation of 2 ml·min
-1·kg
-1above or
below the target VO2 during the 20 min run. This exception was a trial 1 deviation of 2.6 ml·min
-
1·kg
-1 from the target VO2 and resulted in the
participant’s data set being excluded from further analysis. Participant characteristics, training habits and performance in the VO2max test for the remaining 12 participants are shown in Table I. Laboratory conditions were stable at 21.4 ± 1.1 °C and 48 ± 5% relative humidity over the course of the testing period.

Reliability of heart rate recovery and EPOC International SportMed Journal, Vol.15 No.4, December 2014, pp. 352-364. Available at URL: http://www.ismj.com
357 Official Journal of FIMS (International Federation of Sports Medicine)
Table 1: Participant characteristics, training and maximal test performance
Variable Men (n=4) Women (n=8) Total (n=12)
Mean ± SD Range Mean ± SD Range Mean ± SD Range
Age (years)
30 ± 7 22-39 26 ± 6 20-35 27 ± 6 20-39
Body Mass Index (kg∙m
-2)
22.5 ± 3.6 18.6-26.6 21.0 ± 1.9 18.7-23.9 21.5 ± 2.5 18.6-26.6
Training runs per week (runs·week
-1)
5 ± 1 4-6 4 ± 1 3-5 4 ± 1 3-6
Average distance per training run (km)
11.3 ± 3.0 8.0-15.0 7.3 ± 1.4 5.0-9.0 8.6 ± 2.7 5.0-15.0
VO2max (ml·min
-1·kg
-1)
67.6 ± 5.8 59.8-72.2 53.2 ± 5.3 45.7-61.0 58.0 ± 8.8 45.7-72.2
PTRS (km·h
-1)
19.0 ± 1.0 (18.0-20.0) 16.0 ±1.0 13.5-17.0 17.0 ± 2.0 13.5-20.0
PTRS = Peak treadmill running speed
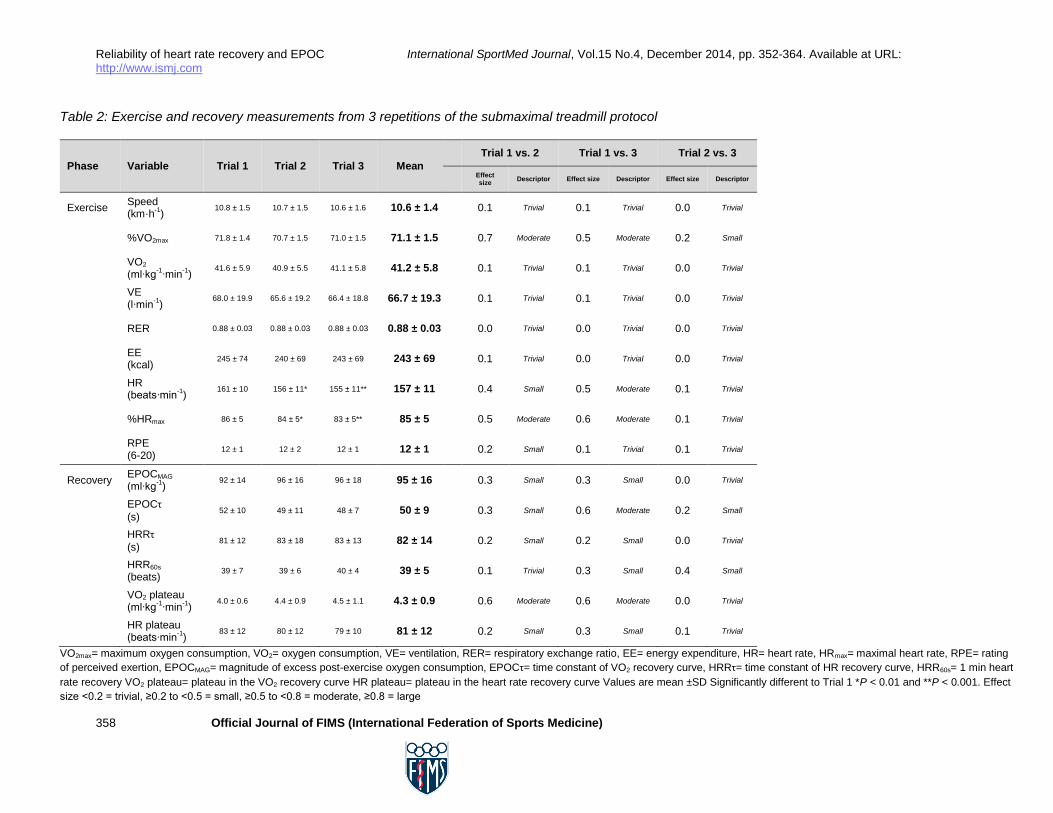
Between-trial differences in submaximal
exercise and recovery measurements
The treadmill exercises were completed at 71.1±1.5% VO2max with an RPE of 12±1. There were no significant differences in treadmill speed, VE, RER or EE across the 3 trials and the between-trial effect sizes were trivial (d ≤ 0.1) (Table 2). There were, however, significant differences in HR between the trials with HR significantly lower in the 2
nd and 3
rd trials
compared to the 1st trial (P<0.05). Between-trial
differences in HR were associated with trivial-to-moderate effect sizes (d = 0.1 to 0.5). There were no significant differences in EPOCMAG,
EPOCτ, VO2 plateau, HRR60s, HRRτ or HR
plateau between trials and the associated effect sizes were for the most part small-to-trivial (d ≤
0.4). One exception was a difference in EPOCτ between the 1
st and 3
rd trials, which was
associated with a moderate effect size (d = 0.6) (Table 2)
.
Reliability of heart rate recovery and EPOC International SportMed Journal, Vol.15 No.4, December 2014, pp. 352-364. Available at URL: http://www.ismj.com
358 Official Journal of FIMS (International Federation of Sports Medicine)
Table 2: Exercise and recovery measurements from 3 repetitions of the submaximal treadmill protocol
Phase Variable Trial 1 Trial 2 Trial 3 Mean
Trial 1 vs. 2 Trial 1 vs. 3 Trial 2 vs. 3
Effect size
Descriptor Effect size Descriptor Effect size Descriptor
Exercise Speed (km·h
-1)
10.8 ± 1.5 10.7 ± 1.5 10.6 ± 1.6 10.6 ± 1.4
0.1 Trivial 0.1 Trivial 0.0 Trivial
%VO2max 71.8 ± 1.4 70.7 ± 1.5 71.0 ± 1.5 71.1 ± 1.5
0.7 Moderate 0.5 Moderate 0.2 Small
VO2 (ml∙kg
-1∙min
-1)
41.6 ± 5.9 40.9 ± 5.5 41.1 ± 5.8 41.2 ± 5.8
0.1 Trivial 0.1 Trivial 0.0 Trivial
VE (l∙min
-1)
68.0 ± 19.9 65.6 ± 19.2 66.4 ± 18.8 66.7 ± 19.3
0.1 Trivial 0.1 Trivial 0.0 Trivial
RER 0.88 ± 0.03 0.88 ± 0.03 0.88 ± 0.03 0.88 ± 0.03
0.0 Trivial 0.0 Trivial 0.0 Trivial
EE (kcal)
245 ± 74 240 ± 69 243 ± 69 243 ± 69
0.1 Trivial 0.0 Trivial 0.0 Trivial
HR (beats∙min
-1)
161 ± 10 156 ± 11* 155 ± 11** 157 ± 11
0.4 Small 0.5 Moderate 0.1 Trivial
%HRmax 86 ± 5 84 ± 5* 83 ± 5** 85 ± 5
0.5 Moderate 0.6 Moderate 0.1 Trivial
RPE (6-20)
12 ± 1 12 ± 2 12 ± 1 12 ± 1
0.2 Small 0.1 Trivial 0.1 Trivial
Recovery EPOCMAG (ml∙kg
-1)
92 ± 14 96 ± 16 96 ± 18 95 ± 16
0.3 Small 0.3 Small 0.0 Trivial
EPOCτ (s)
52 ± 10 49 ± 11 48 ± 7 50 ± 9
0.3 Small 0.6 Moderate 0.2 Small
HRRτ (s)
81 ± 12 83 ± 18 83 ± 13 82 ± 14
0.2 Small 0.2 Small 0.0 Trivial
HRR60s (beats)
39 ± 7 39 ± 6 40 ± 4 39 ± 5
0.1 Trivial 0.3 Small 0.4 Small
VO2 plateau (ml∙kg
-1∙min
-1)
4.0 ± 0.6 4.4 ± 0.9 4.5 ± 1.1 4.3 ± 0.9
0.6 Moderate 0.6 Moderate 0.0 Trivial
HR plateau (beats∙min
-1)
83 ± 12 80 ± 12 79 ± 10 81 ± 12
0.2 Small 0.3 Small 0.1 Trivial
VO2max= maximum oxygen consumption, VO2= oxygen consumption, VE= ventilation, RER= respiratory exchange ratio, EE= energy expenditure, HR= heart rate, HRmax= maximal heart rate, RPE= rating
of perceived exertion, EPOCMAG= magnitude of excess post-exercise oxygen consumption, EPOCτ= time constant of VO2 recovery curve, HRRτ= time constant of HR recovery curve, HRR60s= 1 min heart
rate recovery VO2 plateau= plateau in the VO2 recovery curve HR plateau= plateau in the heart rate recovery curve Values are mean ±SD Significantly different to Trial 1 *P < 0.01 and **P < 0.001. Effect
size <0.2 = trivial, ≥0.2 to <0.5 = small, ≥0.5 to <0.8 = moderate, ≥0.8 = large

Reliability of heart rate recovery and EPOC International SportMed Journal, Vol.15 No.4, December 2014, pp. 352-364. Available at URL: http://www.ismj.com
359 Official Journal of FIMS (International Federation of Sports Medicine)
Within-subject reliability of exercise and
recovery measurements
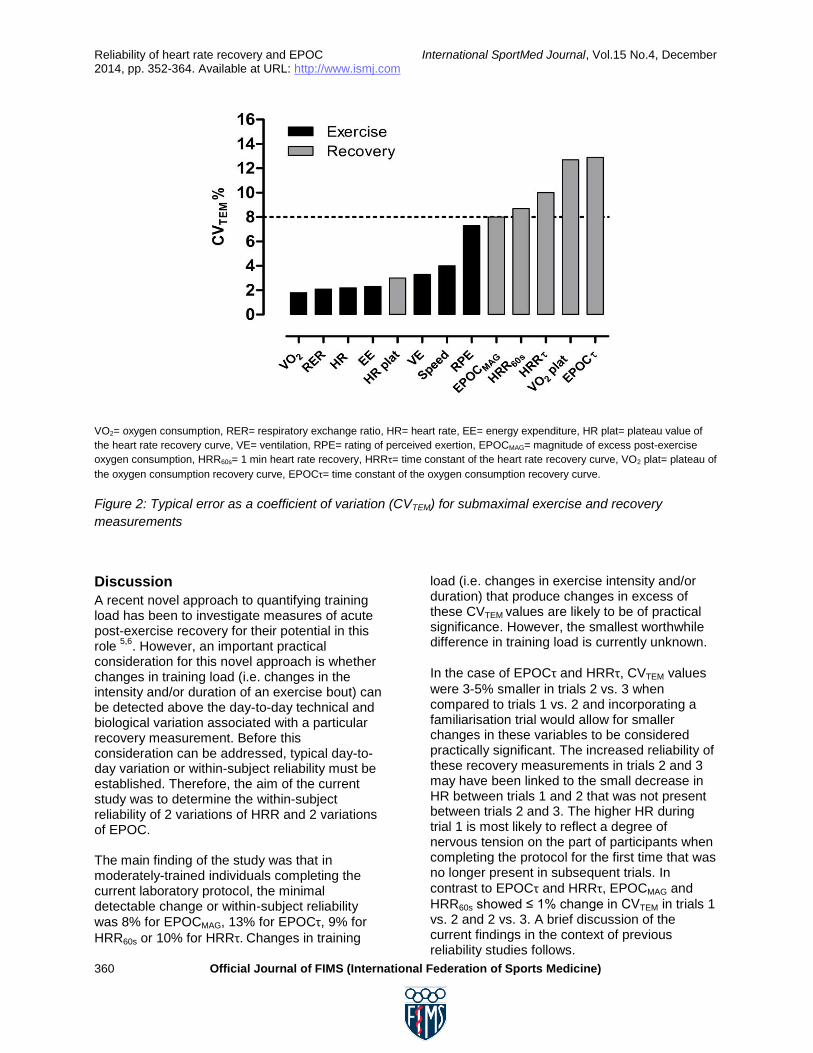
The CVTEM values of VO2, VE, RER, EE, HR and RPE were similar, ranging from 1.8% (90% C.I. 1.5-2.3%) to 4.0% (90% C.I. 3.4-5.1%) (Table 3). The RPE rating at the end of the 20 min treadmill exercise were somewhat more variable
with a CVTEM value of 7.3% (90% C.I. 6.1-9.3%). However, the highest CVTEM values of the current study were those of recovery measurements (Figure 2). For example, the day-
to-day variation of EPOCτ and HRRτ was
particularly high with CVTEM= 12.9% (90% C.I. 10.6-16.4%) and CVTEM= 10.0 (90% C.I. 8.2-12.8%), respectively.
Table 3: Day-to-day reliability of exercise and recovery measurements associated with the submaximal
treadmill protocol
Phase Variable TEM (Measurement Units)
CVTEM
(%)
Trial 1 vs. 2
Trial 2 vs. 3
Trial 1 vs. 3
Mean Trial 1 vs. 2
Trial 2 vs. 3
Trial 1 vs. 3
Mean
Exercise Speed (km·h-1)
0.4 (0.3-0.7)
0.3 (0.2-0.4)
0.5 (0.2-0.8)
0.4 (0.3-0.5)
4.3 (3.2-6.8)
2.6 (1.9-4.1)
4.8 (3.6-7.6)
4.0 (3.4-5.1)
%VO2max 1.3
(1.0-2.0) 1.2
(0.9-1.9) 1.4
(1.0-2.1) 1.3
(1.1-1.6) 1.9
(1.4-2.9) 1.7
(1.3-2.7) 1.9
(1.5-3.0) 1.8
(1.5-2.3)
VO2 (ml∙kg-1
∙min-1)
0.8 (0.6-1.2)
0.7 (0.5-1.1)
0.7 (0.56-1.12)
0.7 (0.6-0.9)
1.9 (1.4-2.9)
1.7 (1.3-2.7)
1.9 (1.5-3.0)
1.8 (1.5-2.3)
VE (l∙min-1)
2.0 (1.5-3.0)
1.6 (1.2-2.5)
2.6 (2.0-4.0)
2.1 (1.8-2.6)
3.0 (2.2-4.6)
2.7 (2.0-4.1)
4.1 (3.0-6.4)
3.3 (2.7-4.1)
RER 0.02
(0.02-0.03) 0.01
(0.01-0.02) 0.02
(0.02-0.03) 0.02
(0.02-0.02) 2.3
(1.7-3.6) 1.3
(1.0-2.0) 2.5
(1.9-3.9) 2.1
(1.7-2.6)
EE (kcal) 5.5
(4.1-8.6) 5.3
(3.9-8.2) 6.2
(4.6-9.6) 5.7
(4.7-7.1) 2.4
(1.8-3.8) 2.0
(1.5-3.2) 2.4
(1.8-3.8) 2.3
(1.9-2.9)
HR (beats∙min-1)
3.4 (2.5-5.3)
2.6 (2.0-4.1)
3.7 (2.8-5.8)
3.3 (2.7-4.1)
2.2 (1.6-3.4)
1.7 (1.3-2.7)
2.5 (1.9-3.9)
2.2 (1.8-2.7)
%HRmax 1.8
(1.4-2.8) 1.4
(1.1-2.2) 2.0
(1.5-3.1) 1.8
(1.5-2.2) 2.2
(1.6-3.4) 1.7
(1.3-2.7) 2.5
(1.9-3.9) 2.2
(1.8-2.7)
RPE (6-20) 1.0
(0.8-1.6) 0.7
(0.5-1.0) 0.6
(0.5-1.0) 0.8
(0.7-1.0) 9.6
(7.1-15.2) 6.3
(4.7-10.0) 5.5
(4.1-8.7) 7.3
(6.1-9.3)
Recovery EPOCMAG (ml∙kg-1)
7.2 (5.4-11.2)
7.6 (5.7-11.7)
6.7 (5.0-10.4)
7.2 (6.0-9.0)
8.3 (6.1-13.2)
8.2 (6.0-12.9)
7.6 (5.7-12.1)
8.0 (6.7-10.3)
EPOCτ (s)
7.4 (5.5-11.4)
4.8 (3.6-7.4)
6.1 (4.5-9.4)
6.2 (5.1-7.7)
15.5 (11.4-25.1)
10.5 (7.8-16.8)
12.1 (8.9-19.3)
12.9 (10.6-16.4)
HRRτ (s)*
8.9 (6.5-14.1)
8.0 (5.9-12.7)
5.6 (4.2-8.7)
7.6 (6.3-9.6)
11.9 (8.7-19.7)
10.1 (7.4-16.6)
7.6 (5.7-12.1)
10.0 (8.2-12.8)
HRR60s (beats)*
3.8 (2.8-6.0)
3.3 (2.4-5.2)
2.8 (2.1-4.4)
3.3 (2.6–4.4)
9.7 (7.1-15.9)
8.7 (6.4-14.3)
7.8 (5.8-12.3)
8.7 (7.2–11.2)
VO2 plateau (ml∙kg
-1∙min
-1)
0.5 (0.4-0.8)
0.4 (0.3-0.6)
0.6 (0.4-0.9)
0.5 (0.4-0.6)
13.1 (9.6-21.0)
9.7 (7.2-15.4)
14.9 (11.0-24.1)
12.7 (10.5-16.2)
HR plateau (beats∙min
-1)
2.2 (1.7-3.5)
2.4 (1.8-3.7)
2.9 (2.2-4.6)
2.6 (2.1-3.2)
2.5 (1.8-3.8)
3.0 (2.2-4.6)
3.4 (2.5-5.4)
3.0 (2.5-3.8)
TEM= Typical Error of Measurement, CVTEM= TEM as a % of the mean VO2max= maximum oxygen consumption, VO2= oxygen
consumption, VE= ventilation, RER= respiratory exchange ratio, EE= energy expenditure, HR= heart rate, HRmax= maximal heart
rate, RPE= rating of perceived exertion, EPOCMAG= magnitude of excess post-exercise oxygen consumption, EPOCτ= time constant
of VO2 recovery curve, HRRτ= time constant of HR recovery curve, HRR60s= 1 min heart rate recovery VO2 plateau= plateau in the
VO2 recovery curve HR plateau= plateau in the heart rate recovery curve Values are means with 90% confidence intervals. *n=11
rather than 12 for HRRτ and HRR60s in trials 1 vs. 2 and 2 vs. 3.
Reliability of heart rate recovery and EPOC International SportMed Journal, Vol.15 No.4, December 2014, pp. 352-364. Available at URL: http://www.ismj.com
360 Official Journal of FIMS (International Federation of Sports Medicine)
VO2= oxygen consumption, RER= respiratory exchange ratio, HR= heart rate, EE= energy expenditure, HR plat= plateau value of
the heart rate recovery curve, VE= ventilation, RPE= rating of perceived exertion, EPOCMAG= magnitude of excess post-exercise
oxygen consumption, HRR60s= 1 min heart rate recovery, HRRτ= time constant of the heart rate recovery curve, VO2 plat= plateau of
the oxygen consumption recovery curve, EPOCτ= time constant of the oxygen consumption recovery curve.
Figure 2: Typical error as a coefficient of variation (CVTEM) for submaximal exercise and recovery
measurements
Discussion
A recent novel approach to quantifying training load has been to investigate measures of acute post-exercise recovery for their potential in this role
5,6. However, an important practical
consideration for this novel approach is whether changes in training load (i.e. changes in the intensity and/or duration of an exercise bout) can be detected above the day-to-day technical and biological variation associated with a particular recovery measurement. Before this consideration can be addressed, typical day-to-day variation or within-subject reliability must be established. Therefore, the aim of the current study was to determine the within-subject reliability of 2 variations of HRR and 2 variations of EPOC. The main finding of the study was that in moderately-trained individuals completing the current laboratory protocol, the minimal detectable change or within-subject reliability
was 8% for EPOCMAG, 13% for EPOCτ, 9% for
HRR60s or 10% for HRRτ. Changes in training
load (i.e. changes in exercise intensity and/or duration) that produce changes in excess of these CVTEM values are likely to be of practical significance. However, the smallest worthwhile difference in training load is currently unknown.
In the case of EPOCτ and HRRτ, CVTEM values
were 3-5% smaller in trials 2 vs. 3 when compared to trials 1 vs. 2 and incorporating a familiarisation trial would allow for smaller changes in these variables to be considered practically significant. The increased reliability of these recovery measurements in trials 2 and 3 may have been linked to the small decrease in HR between trials 1 and 2 that was not present between trials 2 and 3. The higher HR during trial 1 is most likely to reflect a degree of nervous tension on the part of participants when completing the protocol for the first time that was no longer present in subsequent trials. In
contrast to EPOCτ and HRRτ, EPOCMAG and
HRR60s showed ≤ 1% change in CVTEM in trials 1 vs. 2 and 2 vs. 3. A brief discussion of the current findings in the context of previous reliability studies follows.

Reliability of heart rate recovery and EPOC International SportMed Journal, Vol.15 No.4, December 2014, pp. 352-364. Available at URL: http://www.ismj.com
361 Official Journal of FIMS (International Federation of Sports Medicine)
Reliability of HRR60s and HRRτ The TEM for HRR60s of 3 beats∙min
-1 is in the
present study is equivalent to the 3 beats∙min-1
reported by Lamberts et al and somewhat smaller than the TEM or standard error of measurement (SEM) values of 8-10 beats∙min
-1
reported elsewhere 27,29,31,40
. Conversely, the
HRRτ TEM of ~8 s is similar to what was
reported by Al Haddad et al (HRRτ TEM= 7 s)27
and Buchheit et al 31
(HRRτ SEM=7 s) but
somewhat smaller than the HRRτ SEM reported
by Bosquet et al 40
(SEM= 13 s). Despite some similarities in the TEM values for HRR60s and
HRRτ between the current study and previous
studies, there has been little consensus as to which of these measurements is more reliable. In the current study and in the study by Bosquet
et al, HRR60s was more reliable than HRRτ whereas Buchheit et al found HRRτ to be the
more reliable measurement than HRR60s and Al Haddad et al reported very similar reliability for
HRR60s and HRRτ. Variation in the reported reliability of HRR60s and
HRRτ is likely to result from differences in
methodology and study design. For example, the current study differed from previous studies in factors such as the training status of the participants, exercise mode, exercise intensity, exercise duration, the number of trial repetitions, the time period between trial repetitions and the equipment used
27,29–31,40. These factors may
have important implications for the reliability of a measurement
25,26 and allude to the need for
protocol-specific, laboratory-specific reliability analyses where possible. As an example, Lamberts et al demonstrated that the TEM of HRR60s was smaller following shuttle runs that elicited 86-93% of HRmax when compared to shuttle runs that elicited %HRmax values above or below this range
29.
Reliability of EPOCMAG and EPOCτ
Although some previous studies have reported the reliability of oxygen consumption measurements following submaximal exercise 45,50,51
, these studies used the aggregate of multiple square-wave bouts to model transition-phases in oxygen kinetics, rather than the reliability of the oxygen consumption recovery curve associated with EPOC. Furthermore, although Jacobsen et al reported the mean intra-individual coefficient of variation for EPOC magnitude, the EPOC trials were repeated before and after a 9 month training period and
could not be compared with the outcomes of the current study in a meaningful way
52. Therefore,
to the best of these authors’ knowledge, this was the first study to report the reliability of EPOCMAG
and EPOCτ. EPOCMAG was noticeably more
reliable than EPOCτ and these measurements
were the most- and least- reliable of 4 main recovery outcomes in the study, respectively. Reliability of submaximal exercise
measurements
Although the main focus of this study was to determine the reliability of the recovery measurements, it is briefly noted that the CV’s of the submaximal exercise measurements were similar to- or smaller than- those reported previously. For example, the current VE CVTEM of 3.3% was similar to the VE CV’s of 4-5% reported previously
46–48, the current CVTEM of
VO2 of 1.8% was similar to the VO2 CV’s of 2-4% reported previously
17,46,47,49 and the RER
CVTEM of 2.1% was slightly smaller than the RER CV’s of 3-4% reported previously
17,47. Finally,
the HR CVTEM of 2.2% was in keeping with the submaximal HR CV’s of 1-4% reported previously
17,29,46,47.
Conclusion
The current study determined the minimal detectable change or within-subject reliability
(CVTEM) of EPOCMAG, EPOCτ, HRR60s and HRRτ in moderately-trained individuals who completed a submaximal treadmill protocol on 3 occasions. Future studies could investigate whether changes in training load (i.e. changes in exercise intensity and/or duration) produce changes in recovery measurements that are in excess of this day-to-day variation and so provide insight into whether acute recovery measurements have practical value as markers of training load.
Acknowledgements
This research was supported financially by the Deutscher Akademischer Austausch Dienst (DAAD), the Ernst and Ethel Eriksen Trust and the University of Cape Town.
Address for correspondence:
Dr Theresa Mann, UCT/MRC Research Unit for Exercise Science and Sports Medicine, Department of Human Biology, Faculty of Health Sciences, University of Cape Town, P O Box 115, Newlands 7725, Cape Town, South Africa

Reliability of heart rate recovery and EPOC International SportMed Journal, Vol.15 No.4, December 2014, pp. 352-364. Available at URL: http://www.ismj.com
362 Official Journal of FIMS (International Federation of Sports Medicine)
Tel.: +27 21 650 4572 Email: [email protected]
References
1. Lambert MI, Borresen J. Measuring training load in sports. Int J Sports Physiol Perform 2010;5(3):406–11.
2. Borresen J, Lambert MI. The quantification of training load, the training response and the effect on performance. Sport Med 2009;39(9):779–95.
3. Foster C. Monitoring training in athletes with reference to overtraining syndrome. Med Sci Sports Exerc 1998;30(7):1164–8.
4. Banister EW, Calvert TW. Planning for future performance: implications for long term training. Can J Appl Sport Sci 1980;5(3):170–6.
5. Kaikkonen P, Hynynen E, Mann T et al. Can HRV be used to evaluate training load in constant load exercises? Eur J Appl Physiol 2010;108(3):435–42.
6. Kaikkonen P, Hynynen E, Mann T et al. Heart rate variability is related to training load variables in interval running exercises. Eur J Appl Physiol 2012;112(3):829–38.
7. Buchheit M, Papelier Y, Laursen PB et al. Noninvasive assessment of cardiac parasympathetic function: postexercise heart rate recovery or heart rate variability? Am J Physiol Heart Circ Physiol 2007;293(1):H8–10.
8. Gaesser GA, Brooks GA. Metabolic bases of excess post-exercise oxygen consumption: a review. Med Sci Sports Exerc 1984;16(1):29–43.
9. Bahr R. Excess postexercise oxygen consumption-magnitude, mechanisms and practical implications. Acta Physiol Scand Suppl 1992;605:1–70.
10. Frey GC, Byrnes WC, Mazzeo RS. Factors influencing excess postexercise oxygen consumption in trained and untrained women. Metabolism 1993;42(7):822–8.
11. Sedlock DA, Lee M-G, Flynn MG et al. Excess postexercise oxygen consumption after aerobic exercise training. Int J Sport Nutr Exerc Metab 2010;20(4):336–49.
12. Impellizzeri FM, Marcora SM. Test validation in sport physiology: lessons learned from clinimetrics. Int J Sports Physiol Perform 2009;4(2):269–77.
13. Paton CD, Hopkins WG, Vollebregt L. Little effect of caffeine ingestion on repeated sprints in team-sport athletes. Med Sci Sports Exerc 2001;33(5):822–5.
14. Pyne DB, Hopkins WG, Batterham AM et al. Characterising the individual performance responses to mild illness in international swimmers. Br J Sports Med 2005;39(10):752–6.
15. Buchheit M, Ufland P. Effect of endurance training on performance and muscle reoxygenation rate during repeated-sprint running. Eur J Appl Physiol 2011;111(2):293–301.
16. Al Haddad H, Laursen PB, Ahmaidi S et al. Influence of cold water face immersion on post-exercise parasympathetic reactivation. Eur J Appl Physiol 2010;108(3):599–606.
17. Saunders PU, Pyne DB, Telford RD et al. Reliability and variability of running economy in elite distance runners. Med Sci Sports Exerc 2004;36(11):1972–6.
18. Spencer M, Dawson B, Goodman C et al. Performance and metabolism in repeated sprint exercise: effect of recovery intensity. Eur J Appl Physiol 2008;103(5):545–52.
19. Robertson EY, Saunders PU, Pyne DB et al. Reproducibility of performance changes to simulated live high/train low

Reliability of heart rate recovery and EPOC International SportMed Journal, Vol.15 No.4, December 2014, pp. 352-364. Available at URL: http://www.ismj.com
363 Official Journal of FIMS (International Federation of Sports Medicine)
altitude. Med Sci Sports Exerc 2010;42(2):394–401.
20. Cohen J. Statistical Power Analysis for Behavioural Sciences. 2nd ed. Hillsdale, New Jersey: Lawrence Erlbaum Associates; 1988.
21. Nitschke JE, McMeeken JM, Burry HC et al. When is a change a genuine change? A clinically meaningful interpretation of grip strength measurements in healthy and disabled women. J hand Ther 1999;12(1):25–30.
22. Lamberts RP, Lambert MI. Day-to-day variation in heart rate at different levels of submaximal exertion: implications for monitoring training. J strength Cond Res 2009;23(3):1005–10.
23. Scharhag-Rosenberger F, Walitzek S, Kindermann W et al. Differences in adaptations to 1 year of aerobic endurance training: individual patterns of nonresponse. Scand J Med Sci Sports 2012;22(1):113–8.
24. Scharhag-Rosenberger F, Meyer T, Walitzek S et al. Time course of changes in endurance capacity: a 1-yr training study. Med Sci Sports Exerc 2009;41(5):1130–7.
25. Hopkins WG, Hawley JA, Burke LM. Design and analysis of research on sport performance enhancement. Med Sci Sports Exerc 1999;31(3):472–85.
26. Hopkins WG, Schabort EJ, Hawley JA. Reliability of power in physical performance tests. Sport Med 2001;31(3):211–34.
27. Al Haddad H, Laursen PB, Chollet D et al. Reliability of resting and postexercise heart rate measures. Int J Sports Med 2011;32(8):598–605.
28. Dupuy O, Mekary S, Berryman N et al. Reliability of heart rate measures used to assess post-exercise parasympathetic reactivation. Clin Physiol Funct Imaging 2012;32(4):296–304.
29. Lamberts RP, Maskell S, Borresen J et al. Adapting workload improves the measurement of heart rate recovery. Int J Sports Med 2011;32(9):698–702.
30. Lamberts RP, Swart J, Noakes TD et al. A novel submaximal cycle test to monitor fatigue and predict cycling performance. Br J Sports Med 2011;45(10):797–804.
31. Buchheit M, Millet GP, Parisy A et al. Supramaximal training and postexercise parasympathetic reactivation in adolescents. Med Sci Sports Exerc 2008;40(2):362–71.
32. American College of Sports Medicine. Physical Activity Readiness Questionnaire (PAR-Q). In: Whaley MH, Brubaker PH, Otto RM, editors. ACSM’s Guidelines for Exercise Testing and Prescription. Baltimore: Lippincott Williams & Wilkins; 2006. p. 26.
33. Scrimgeour AG, Noakes TD, Adams B et al. The influence of weekly training distance on fractional utilization of maximum aerobic capacity in marathon and ultramarathon runners. Eur J Appl Physiol Occup Physiol 1986;55(2):202–9.
34. Reilly T, Brooks GA. Selective persistence of circadian rhythms in physiological responses to exercise. Chronobiol Int 1990;7(1):59–67.
35. Gerbino A, Ward SA, Whipp BJ. Effects of prior exercise on pulmonary gas-exchange kinetics during high-intensity exercise in humans. J Appl Physiol 1996;80(1):99–107.
36. Perrey S, Scott J, Mourot L et al. Cardiovascular and oxygen uptake kinetics during sequential heavy cycling exercises. Can J Appl Physiol 2003;28(2):283–98.
37. Gurd BJ, Scheuermann BW, Paterson DH et al. Prior heavy-intensity exercise speeds VO2 kinetics during moderate-intensity exercise in young adults. J Appl Physiol 2005;98(4):1371–8.

Reliability of heart rate recovery and EPOC International SportMed Journal, Vol.15 No.4, December 2014, pp. 352-364. Available at URL: http://www.ismj.com
364 Official Journal of FIMS (International Federation of Sports Medicine)
38. Faisal A, Beavers KR, Robertson AD et al. Prior moderate and heavy exercise accelerate oxygen uptake and cardiac output kinetics in endurance athletes. J Appl Physiol 2009;106(5):1553–63.
39. Borg GA. Psychophysical bases of perceived exertion. Med Sci Sports Exerc 1982;14(5):377–81.
40. Bosquet L, Gamelin F-X, Berthoin S. Reliability of postexercise heart rate recovery. Int J Sports Med 2008;29(3):238–43.
41. Rietjens GJ, Kuipers H, Kester AD et al. Validation of a computerized metabolic measurement system (Oxycon-Pro) during low and high intensity exercise. Int J Sports Med 2001;22(4):291–4.
42. Macfarlane DJ. Automated metabolic gas analysis systems: a review. Sport Med 2001;31(12):841–61.
43. Weippert M, Kumar M, Kreuzfeld S et al. Comparison of three mobile devices for measuring R-R intervals and heart rate variability: Polar S810i, Suunto t6 and an ambulatory ECG system. Eur J Appl Physiol 2010;109(4):779–86.
44. Weir J. New methods for calculating metabolic rate with special reference to protein metabolism. J Physiol 1949;109(5):1–9.
45. Ozyener F, Rossiter HB, Ward SA et al. Influence of exercise intensity on the on- and off-transient kinetics of pulmonary oxygen uptake in humans. J Physiol 2001;533(Pt 3):891–902.
46. Becque MD, Katch V, Marks C et al. Reliability and within subject variability of VE, VO2, heart rate and blood pressure during submaximum cycle ergometry. Int J Sports Med 1993;14(4):220–3.
47. Wilmore JH, Stanforth PR, Turley KR, et al. Reproducibility of cardiovascular, respiratory, and metabolic responses to submaximal exercise: the HERITAGE Family Study. Med Sci Sports Exerc 1998;30(2):259–65.
48. Morgan DW, Craib MW, Krahenbuhl GS, et al. Daily variability in exercise ventilation. Respir Physiol 1994;96(2-3):345–52.
49. Williams TJ, Krahenbuhl GS, Morgan DW. Daily variation in running economy of moderately trained male runners. Med Sci Sports Exerc 1991;23(8):944–8.
50. Kilding AE, Challis N V, Winter EM et al. Characterisation, asymmetry and reproducibility of on- and off-transient pulmonary oxygen uptake kinetics in endurance-trained runners. Eur J Appl Physiol 2005;93(5-6):588–97.
51. Kemps HMC, De Vries WR, Hoogeveen AR et al. Reproducibility of onset and recovery oxygen uptake kinetics in moderately impaired patients with chronic heart failure. Eur J Appl Physiol 2007;100(1):45–52.
52. Jacobsen DJ, Bailey BW, LeCheminant JD et al. A comparison of three methods of analyzing post-exercise oxygen consumption. Int J Sports Med 2005;26(1):34–8.
Copyright © 2022 FDOKUMEN