Datta AET 2014 Title change
14
www.ijera.com 1 | Page Datta et al. Int. Journal of Engineering Research and Applications www.ijera.com ISSN: 2248-9622, Vol. X, Issue X, XXXX-XXXX 2013, pp.-XX Critical Gap Comparison between HARDERS and “INAFOGA” Methods for U-turn Median Openings Suprabeet Datta* *(Department of Civil Engineering, National Institute of Technology Rourkela, Odisha-769008 Email: [email protected]) ABSTRACT Unsignalized median openings are been installed every day on divided arterials at most of the developing cities in India during the past few years because of the non-accommodation of U-turn movements at unsignalized intersections. Studies of U-turn Gap Acceptance had been neglected under Indian traffic. In this paper, Critical gap has been used as the sole parameter for gap acceptance. Estimation of critical gaps for U-turns at median openings under mixed traffic conditions have not been addressed till today due to the complex and risky traffic interactions at these facilities. Video image processing of 4 U-turn median openings were done to extract the decision variables of the study. For the first time a new concept of merging behaviour of U-turn vehicles for evaluation of gaps by drivers has been introduced here. Two empirical methods namely Harders and Satish et al. “INAFOGA” are used for estimating critical gap considering four motorized modes of transport for all the four sections. Bar comparison plots for all four sections are drawn to compare the methods considering the four motorized modes. A paired sample T-test was done in IBM SPSS 22.0 which revealed that “INAFOGA” method yield critical gap values 28-41% more than those obtained by Harders method. This explained the effectiveness of “INAFOGA” method in judging mixed traffic conditions for U-turns at median openings. Keywords - critical gap, gap acceptance, Indian traffic, median openings, SPSS, U-turns, unsignalized I. INTRODUCTION For the few years there has been increased installation of non- traversable & directional medians all over India particularly in sub- urban cities on arterial highways. As a part of traffic management to improve intersection operation, some traffic movements are not permitted at selected intersection locations, RESEARCH ARTICLE OPEN ACCESS
Transcript of Datta AET 2014 Title change
www.ijera.com 1 | P a g e
Datta et al. Int. Journal of Engineering Research and Applications www.ijera.comISSN: 2248-9622, Vol. X, Issue X, XXXX-XXXX 2013, pp.-XX
Critical Gap Comparison between HARDERSand “INAFOGA” Methods for U-turn Median
Openings
Suprabeet Datta*
*(Department of Civil Engineering, National Institute of TechnologyRourkela, Odisha-769008
Email: [email protected])
ABSTRACTUnsignalized median openings are been installed every day on dividedarterials at most of the developing cities in India during the past fewyears because of the non-accommodation of U-turn movements at unsignalizedintersections. Studies of U-turn Gap Acceptance had been neglected underIndian traffic. In this paper, Critical gap has been used as the soleparameter for gap acceptance. Estimation of critical gaps for U-turns atmedian openings under mixed traffic conditions have not been addressed tilltoday due to the complex and risky traffic interactions at thesefacilities. Video image processing of 4 U-turn median openings were done toextract the decision variables of the study. For the first time a newconcept of merging behaviour of U-turn vehicles for evaluation of gaps bydrivers has been introduced here. Two empirical methods namely Harders andSatish et al. “INAFOGA” are used for estimating critical gap consideringfour motorized modes of transport for all the four sections. Bar comparisonplots for all four sections are drawn to compare the methods consideringthe four motorized modes. A paired sample T-test was done in IBM SPSS 22.0which revealed that “INAFOGA” method yield critical gap values 28-41% morethan those obtained by Harders method. This explained the effectiveness of“INAFOGA” method in judging mixed traffic conditions for U-turns at medianopenings.
Keywords - critical gap, gap acceptance, Indian traffic, median openings, SPSS, U-turns, unsignalized
I. INTRODUCTION
For the few years there has beenincreased installation of non-traversable & directional mediansall over India particularly in sub-
urban cities on arterial highways.As a part of traffic management toimprove intersection operation, sometraffic movements are not permittedat selected intersection locations,
RESEARCH ARTICLE OPEN ACCESS
www.ijera.com 1 | P a g e
Datta et al. Int. Journal of Engineering Research and Applications www.ijera.comISSN: 2248-9622, Vol. X, Issue X, XXXX-XXXX 2013, pp.-XXespecially along divided arterials.In most cases, such minor movementsare accommodated at separate U-turnmedian openings. This increasedinstallation reflects the muchneeded attention towards AccessManagement [1, 2]. One of the bestways of accessing roads is byinstalling non-traversable and un-signalized median openings [1, 3].The purpose of using non-traversableand directional median openings isto eliminate problems associatedwith left-turns and crossingmovements at intersections on multi-lane highways [2, 3,4]. At un-signalized median openings vehicularinteractions are extremely complex[5, 6]. Thus, a U-turning vehicledriver needs to accept a gap or timespan between the arrivals ofsuccessive vehicles on the throughstreet after it has arrived at aclose vicinity of the medianopening. This defines the phenomenonof “Gap Acceptance” for medianopenings. Conventionally, Gap isdefined as the time or space headwaybetween two successive vehicles inthe through traffic stream [7, 8,9].Gap differs from headway in the factthat the latter is measured as atime span between front bumpers oftwo successive vehicles while theformer as the time length betweenback bumpers/wheel bases. “Gapacceptance” analysis forms the primeobjective for safe operation of U-turning vehicles at Median Openingsunder heterogeneous trafficsituations.Critical gap is an importantparameter in “gap acceptance” study.The definition of critical gap hasundergone certain modifications overthe past decades [10]. Raff and Hart(1950) defined critical gap as thesize of the gap whose number ofaccepted gaps shorter than it isequal to the number of rejected gaps
longer than it [11]. “HighwayCapacity Manual (2010)” in itsVolume 3, Page 19-7 names criticalgaps as “Critical Headway” anddefines “as the minimum timeinterval in the major street trafficstream that allows intersectionentry for one minor-street vehicle”[12]. Regarding the above definitionwe tried to define “Critical Gap”for U-turns at median openings as“the minimum time interval inbetween two through/conflictingtraffic vehicles that allowscomplete merging manoeuvre for oneU-turn vehicle at a median opening”.Critical gap is difficult to measuredirectly in field. The measurementvaries for different drivers andwith time instants depending uponmanoeuvres of the U-turn vehiclesunder mixed traffic conditionsprevailing on the median openings[10, 11,13]. There are a bunch ofuseful estimation procedures fordetermination of critical gapcorresponding to homogeneous trafficconditions. Some of the estimationprocedures are empirical whereasrest have a strong theoreticalbackground [11, 16]. In this papersome of the previous estimationtechniques are used to estimatecritical gaps for various modes ofU-turning vehicles willing to mergewith the through traffic stream atun-signalized median openings.Bhubaneshwar is the capital of theIndian state Odisha. It constitutesof an average population of 1.2-1.4million people as per the 2011census [14]. The city of Bhubaneswarcomprises of wide roads in grid forminside the central city. Bhubaneswarhas approximately 1,600 kilometres(990 mi) of roads, with average roaddensity of 11.82 square kilometres(4.56 sq. m) [15]. Due to thepresence of a wide stretch ofdivided highways, the city consistsof a fair amount of unsignalized
www.ijera.com 1 | P a g e
Datta et al. Int. Journal of Engineering Research and Applications www.ijera.comISSN: 2248-9622, Vol. X, Issue X, XXXX-XXXX 2013, pp.-XXmedian openings which focused ourattention towards this area for ourstudyGap acceptance analysis for medianopenings under heterogeneous trafficconditions have not been givenproper attention in the previousyears. Neither the global trafficengineering manual HCM even in itsrecent issue of 2010 had addressedthe gap acceptance study for medianopenings. The obvious reason beingthe complex and haphazard behaviourcaused by U-turn vehicles undermixed traffic situations compared toother movements like rightturns/left turns at intersections[10, 17]. In this paper, an efforthas been made to estimate criticalgaps for different U-turning modesprevailing on the median openings inIndia which would further instigateto understand the gap acceptanceconcept under mixed trafficconditions.
II. STUDIES IN THE PAST
A large population of researchershave worked on “gap acceptance”during the past few decades, butmajority of them consideredhomogeneous traffic flow conditions.Several techniques or models havebeen established since the year of1947 in literatures to estimate“critical gap” as closely aspossible [10, 11, 16]. Thus, it isclear that literatures regarding gapacceptance phenomenon is rich.Majority of literatures normallyconsider the accepted and rejectedgaps as the key parameters inestimation of critical gaps [7, 16,18]. “HCM 2010” states that criticalheadway/gap can be estimated on thebasis of observations of the largestrejected and smallest accepted gapcorresponding to a giventransportation facility [12].
Raff in 1950 first proposed the term“critical lag” as an importantparameter in the determination of“gap acceptance” for a minor streetdriver willing to take a directionalmovement in an “un-signalizedintersection”. He defined it as thegap/lag for which the number ofaccepted lags shorter than it isequal to the number of rejected lagslonger than it [16]. He proposed agraphical model in which twocumulative distribution curvesrelated to the no. of accepted andrejected gaps intersect to yield thevalue of Critical Lag (Tl) [16]. In1974, A.J. Miller corrected theRaff’s model and concluded that itgave suitable results for light-to-medium traffic but is not acceptablein heavy traffic conditions [16,19]. He also verified that the modelgives satisfactory results for“gaps” as that obtained for “lags”.This means “critical gap” can alsobe obtained by the method. Miller(1972) developed a simple gapacceptance model to compare ninedifferent methods of critical gapestimation. Simulation study wasused to generate artificial data andcomparison was based on the centralvalue estimated by each method. Theyfound that Ashworth’s method andmaximum likelihood technique gavesatisfactory results [16, 19]. Turkiet al. in their publication on April2013, modelled estimated length oftime gap needed by a U-turn driverbased on driver’s Age, Gender andthe elapsed time between arrivingand experiencing the gap. The studyrelated driver-related factors oncritical gap acceptance whose datawere obtained by analysing 4 MedianU-turn openings in Irbid City,Jordan [5].
Ashworth (1968, 1970 and 1979)estimated the average Critical Gap(Tc,avg) from the Mean and Standard
www.ijera.com 1 | P a g e
Datta et al. Int. Journal of Engineering Research and Applications www.ijera.comISSN: 2248-9622, Vol. X, Issue X, XXXX-XXXX 2013, pp.-XXDeviation of gaps accepted by adriver through an empiricalmathematical relation with thethrough traffic volume in vehiclesper second assuming exponentialdistribution of accepted gaps[16,19]. Harders (1968) estimatedthe critical gap (Tc) by theexpectation of the cumulativefrequency distribution curve [Fc(t)] for the proportion of acceptedgaps of size i, provided to all U-turning vehicles [11, 19, 20].Troutbeck (1992) gave a more preciseform of Maximum Likelihood Methodwith a satisfactory mathematicalderivation. He used Log-Normaldistribution for finding thecritical gaps (Tc) [17, 21].
Ashalatha and Satish Chandra (2011)used some of the existing methodslike HARDER, Logit, Probit, ModifiedRaff and Hewitt methods forestimation of critical gap at an un-signalized intersections [10]. Therewas significant variation (12-38%)among the values which highlightedthe incapability of the methods toaddress mixed traffic situations[10]. Thus, they came up with analternate procedure making use ofclearing behaviour of vehicles inconjunction with gap acceptance data[10]. The new method proposed bySatish et al. was simple and easy toimplement under Indian conditions.With due respect, this paper wasselected as the “mother literature”for our study because of itsrobustness towards mixed trafficconditions prevailing in India. The“clearing behaviour” was convertedto “merging behaviour” in case of U-turns at median openings in thisstudy.This critical review of the previousliteratures instigates the need forevaluation of critical gaps for U-turning vehicles at median openings
under heterogeneous trafficsituations prevailing in Indianstates.
III. MIXED TRAFFIC PROBLEMS IN INDIAEstimation of critical gap undermixed or heterogeneous trafficsituations is more complex than thatunder homogeneous trafficconditions. The different types ofvehicles found in India and manyother developing countries havevarying operational characteristicssuch as speed, maneuverability,effective dimensions, power-weightratio and response to the presenceof other vehicles in the trafficstream [10]. Smaller size vehiclesoften squeeze through any availablegap between large size vehicles andmove into the influence area inhaphazard manner [5, 6]. A singlegap in the through traffic streamcan be accepted by more than onevehicle moving parallel to eachother and after crossing theconflicting traffic these vehiclesmove in a single file, after oneanother [10]. The combined effect ofall these factors makes theestimation of critical gap a morechallenging task. These situationsrequire a re-look into the conceptof critical gap & conflict area nearmedian openings and method of dataextraction.
IV. STUDY AREA DETAILSThe area of study can be broadlyclassified based on the necessity ofdata for analyzing “Critical Gap”and comparing the same betweendifferent modes of transport. Twotypes of median openings prevail in

www.ijera.com 1 | P a g e
Datta et al. Int. Journal of Engineering Research and Applications www.ijera.comISSN: 2248-9622, Vol. X, Issue X, XXXX-XXXX 2013, pp.-XXINDIA. First one being on a typical4-lane divided highway and thesecond one on a 6-lane dividedstreet. Median openings are providedin urban areas for minimum majorstreet flow of 500 vehicles/dayhaving a maximum speed limit of 70-80 kmph (40 miles/hr.).
Bhubaneswar being the capital ofOdisha consists of a broad networkof roadways on which mixed trafficis dominant. Some of the motorizedmodes include 3 wheelers like four-stroke Auto- rickshaws and pick-upvans, light commercial vehicleswhich includes 4 wheeler tempos,variable categories of cars namelySedans and Hatchbacks, Sportsutility or Multi-utility vehicles(SUVs/ MUVs). About 4 differentsections of median openings on 4-lane divided highways having 75-90 %of U-turning vehicles were selectedfor the study. All the sectionsinvolved with the case study forBhubaneswar varied in theirgeometry. Assumptions were maderegarding the geometrical variationsfor individual sections. Each medianopening selected for the study werespaced about 600-700 feet apart fromtheir near unsignalizedintersections as per thestipulations in HCM 2010.
4.2. Data Collection Details
Data collection primarily comprisedof video recording of the selectedmedian openings by a Sony Handycamcapable of playing videos at a framerate of 30 frames/second during themonths of January, March, April andSeptember. Peak hours of U-turns
were surveyed and video shooting wasdone for the morning, noon andafternoon sessions depending on theimportance of the days. Shooting wasdone only during weekdays. Weekendsand public holidays were generallyneglected due to variation of U-turning traffic at median openings.Video recording of all the 4sections resulted in an averageproportion of U –turning and throughtraffic of 70-90% and 65-85%respectively. All of these 4sections are median openings on 4-lane divided roads. Through trafficvolume comprised of all types ofvehicles including HVs, LCVsexcluding non-motorized vehicles andpedestrians. Classes of U-turningvehicles considered are as pointedbelow:
1. Motorized 4 Wheelers (IncludingSedan and Hatch Backs)
2. Motorized 2 Wheelers (Driver:Male / Female , Motor-bikes ,Scooters)
3. Motorized 3 Wheelers (4-stroke-Auto-rickshaws , 3W Pick-up vans)
4. Sports utility vehicles / multiutility vehicles (SUVs)
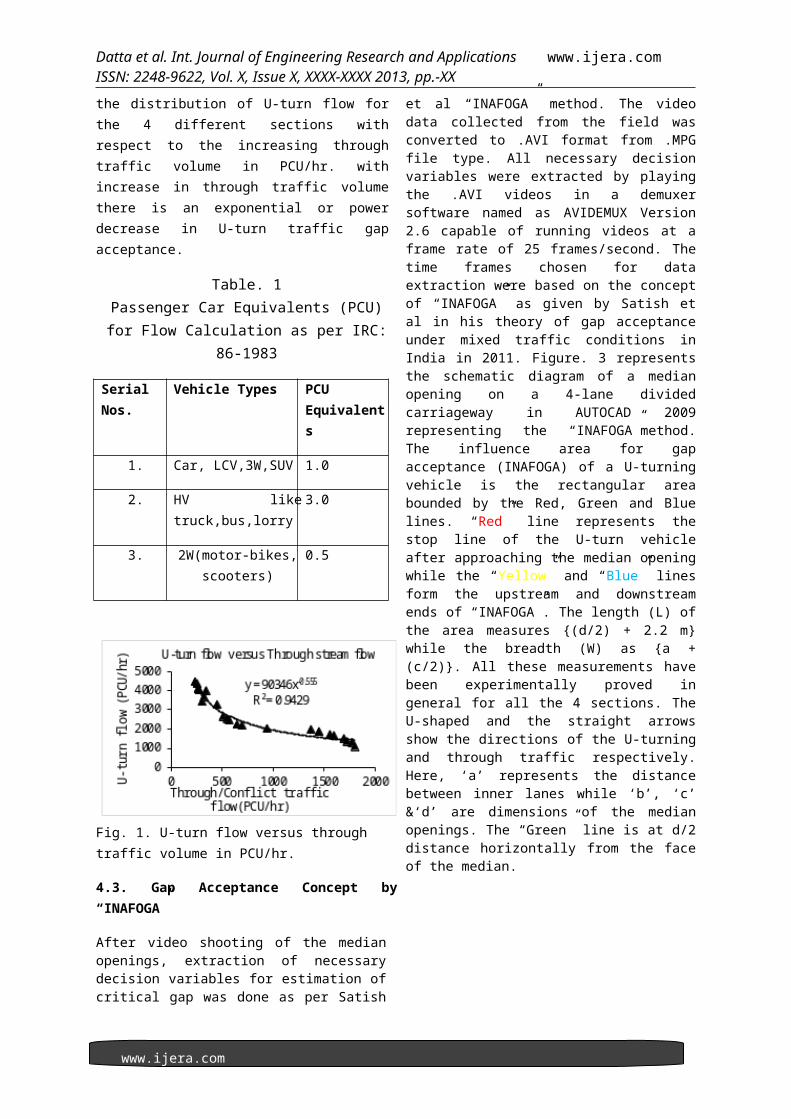
The variation of U-turning flow withrespect to through or conflictingtraffic volume can graphicallyrepresented as a cumulativedistribution in PCU/hr. Theconversion from no. of vehicles totheir corresponding Passenger carequivalents was done according toTable 1 adopted from IRC: 86-1983(Geometric Design Standards forUrban Roads on Plains). Fig. 2 shows
www.ijera.com 1 | P a g e
Datta et al. Int. Journal of Engineering Research and Applications www.ijera.comISSN: 2248-9622, Vol. X, Issue X, XXXX-XXXX 2013, pp.-XXthe distribution of U-turn flow forthe 4 different sections withrespect to the increasing throughtraffic volume in PCU/hr. withincrease in through traffic volumethere is an exponential or powerdecrease in U-turn traffic gapacceptance.
Table. 1Passenger Car Equivalents (PCU)for Flow Calculation as per IRC:
86-1983
SerialNos.
Vehicle Types PCUEquivalents
1. Car, LCV,3W,SUV 1.0
2. HV liketruck,bus,lorry
3.0
3. 2W(motor-bikes,scooters)
0.5
Fig. 1. U-turn flow versus through traffic volume in PCU/hr.
4.3. Gap Acceptance Concept by“INAFOGA”
After video shooting of the medianopenings, extraction of necessarydecision variables for estimation ofcritical gap was done as per Satish
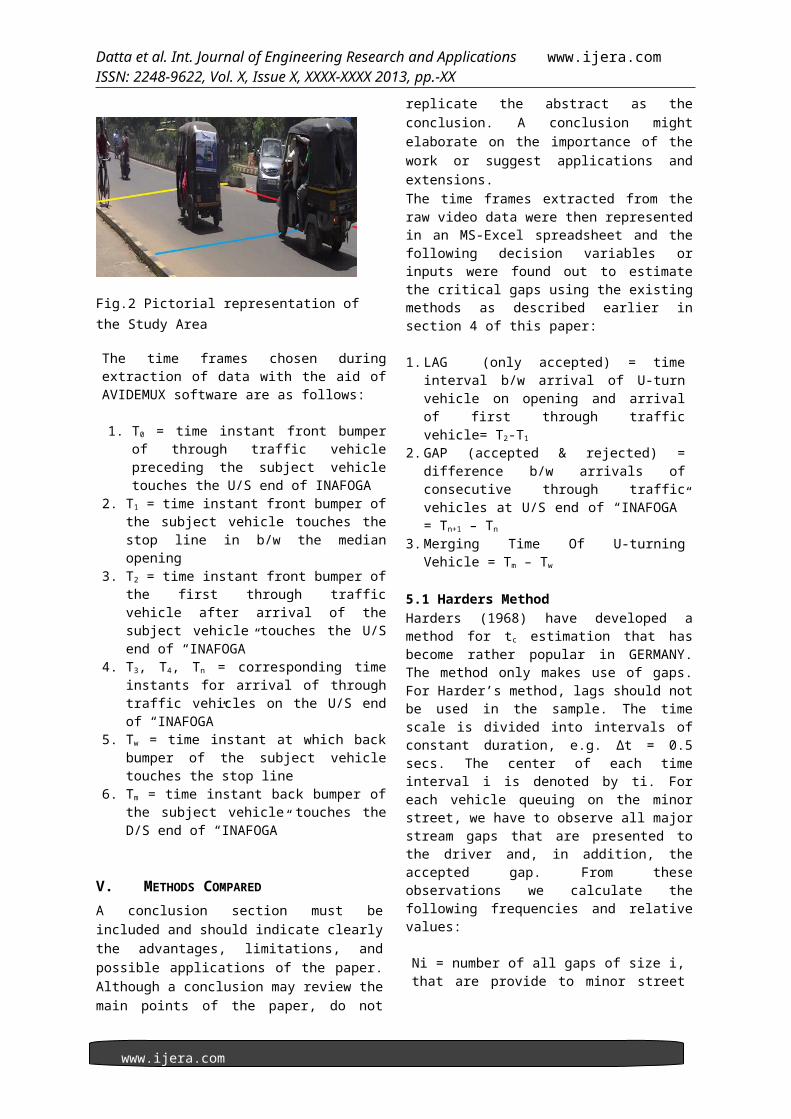
et al “INAFOGA” method. The videodata collected from the field wasconverted to .AVI format from .MPGfile type. All necessary decisionvariables were extracted by playingthe .AVI videos in a demuxersoftware named as AVIDEMUX Version2.6 capable of running videos at aframe rate of 25 frames/second. Thetime frames chosen for dataextraction were based on the conceptof “INAFOGA” as given by Satish etal in his theory of gap acceptanceunder mixed traffic conditions inIndia in 2011. Figure. 3 representsthe schematic diagram of a medianopening on a 4-lane dividedcarriageway in AUTOCAD 2009representing the “INAFOGA”method.The influence area for gapacceptance (INAFOGA) of a U-turningvehicle is the rectangular areabounded by the Red, Green and Bluelines. “Red” line represents thestop line of the U-turn vehicleafter approaching the median openingwhile the “Yellow” and “Blue” linesform the upstream and downstreamends of “INAFOGA”. The length (L) ofthe area measures {(d/2) + 2.2 m}while the breadth (W) as {a +(c/2)}. All these measurements havebeen experimentally proved ingeneral for all the 4 sections. TheU-shaped and the straight arrowsshow the directions of the U-turningand through traffic respectively.Here, ‘a’ represents the distancebetween inner lanes while ‘b’, ‘c’&‘d’ are dimensions of the medianopenings. The “Green” line is at d/2distance horizontally from the faceof the median.
www.ijera.com 1 | P a g e
Datta et al. Int. Journal of Engineering Research and Applications www.ijera.comISSN: 2248-9622, Vol. X, Issue X, XXXX-XXXX 2013, pp.-XX
Fig.2 Pictorial representation of the Study Area
The time frames chosen duringextraction of data with the aid ofAVIDEMUX software are as follows:
1. T0 = time instant front bumperof through traffic vehiclepreceding the subject vehicletouches the U/S end of INAFOGA
2. T1 = time instant front bumper ofthe subject vehicle touches thestop line in b/w the medianopening
3. T2 = time instant front bumper ofthe first through trafficvehicle after arrival of thesubject vehicle touches the U/Send of “INAFOGA”
4. T3, T4, Tn = corresponding timeinstants for arrival of throughtraffic vehicles on the U/S endof “INAFOGA”
5. Tw = time instant at which backbumper of the subject vehicletouches the stop line
6. Tm = time instant back bumper ofthe subject vehicle touches theD/S end of “INAFOGA”
V. METHODS COMPAREDA conclusion section must beincluded and should indicate clearlythe advantages, limitations, andpossible applications of the paper.Although a conclusion may review themain points of the paper, do not
replicate the abstract as theconclusion. A conclusion mightelaborate on the importance of thework or suggest applications andextensions.The time frames extracted from theraw video data were then representedin an MS-Excel spreadsheet and thefollowing decision variables orinputs were found out to estimatethe critical gaps using the existingmethods as described earlier insection 4 of this paper:
1.LAG (only accepted) = timeinterval b/w arrival of U-turnvehicle on opening and arrivalof first through trafficvehicle= T2-T1
2.GAP (accepted & rejected) =difference b/w arrivals ofconsecutive through trafficvehicles at U/S end of “INAFOGA”= Tn+1 – Tn
3.Merging Time Of U-turningVehicle = Tm – Tw
5.1 Harders Method Harders (1968) have developed amethod for tc estimation that hasbecome rather popular in GERMANY.The method only makes use of gaps.For Harder’s method, lags should notbe used in the sample. The timescale is divided into intervals ofconstant duration, e.g. Δt = 0.5secs. The center of each timeinterval i is denoted by ti. Foreach vehicle queuing on the minorstreet, we have to observe all majorstream gaps that are presented tothe driver and, in addition, theaccepted gap. From theseobservations we calculate thefollowing frequencies and relativevalues:
Ni = number of all gaps of size i,that are provide to minor street

www.ijera.com 1 | P a g e
Datta et al. Int. Journal of Engineering Research and Applications www.ijera.comISSN: 2248-9622, Vol. X, Issue X, XXXX-XXXX 2013, pp.-XXvehicle; Ai = number of acceptedgaps of size i; ai = Ai / Ni
Now, these ai values can be plottedover ti. The curve generated bydoing this has the form of acumulative distribution function ofcritical gaps. It is treated as thefunction Fc (t). However, nobody hasprovided any conclusive mathematicalconcept that this function ai=function (ti) has real properties ofFc (t) [19, 21].
Fig.3 Critical Gap for 3W by Harders MethodDecision variables or inputs usedare no. of accepted gaps along withtotal no. of all gaps. A cumulativedistribution curve showing variationof critical gap with time is plottedbetween the proportions of acceptedgaps (ai) {ratio of no. of acceptedto total no. of all gaps} and timeelapsed divided into constantdurations of 0.25 seconds. Figures 3and 4 shows the F[c]t distributionof critical gaps for 3 wheelers andSUVs respectively.
Fig.4. Critical Gap for SUVs by Harders Method
5.2 Satish et.al. “INAFOGA” MethodSatish et al in the year of March2011 introduced a new concept formeasuring critical gap making use ofclearing behaviour of vehicles inconjunction with gap acceptancedata. He proposed an area named asINAFOGA (Influence Area for GapAcceptance) which had a dimension ofL*W, where L= 3.5 m (lane width) &W= 1.5 times width of crossing/merging vehicle. It takes intoaccount the clearing behaviour of avehicle (clearing time is the timetaken by the minor street vehicle toclear the influence area) & gapacceptance behaviour. Following arethe characteristics of “INAFOGA”[10]:
i. A vehicle taking right turnfrom Minor Street waits atthe stop line near INAFOGA &is said to clear theintersection when its tailend crosses the stop line inthe major street.
ii. Difference between thearrivals of consecutive majorstreet Vehicles at theupstream end of the INAFOGAis considered as ‘Gap’
iii. In this method, a typicalcumulative frequencydistribution curve forclearing time of a minorstreet vehicle against itscorresponding Lag & GapAcceptance curve is plottedhaving a common point ofintersection. This point ofintersection indicates theminimum/critical gapsufficient for the vehicle toenter the INAFOGA keeping inmind the SAFETY aspect.
Both accepted lags and gaps are usedin this method to determine criticalgaps. Cumulative frequency
www.ijera.com 1 | P a g e
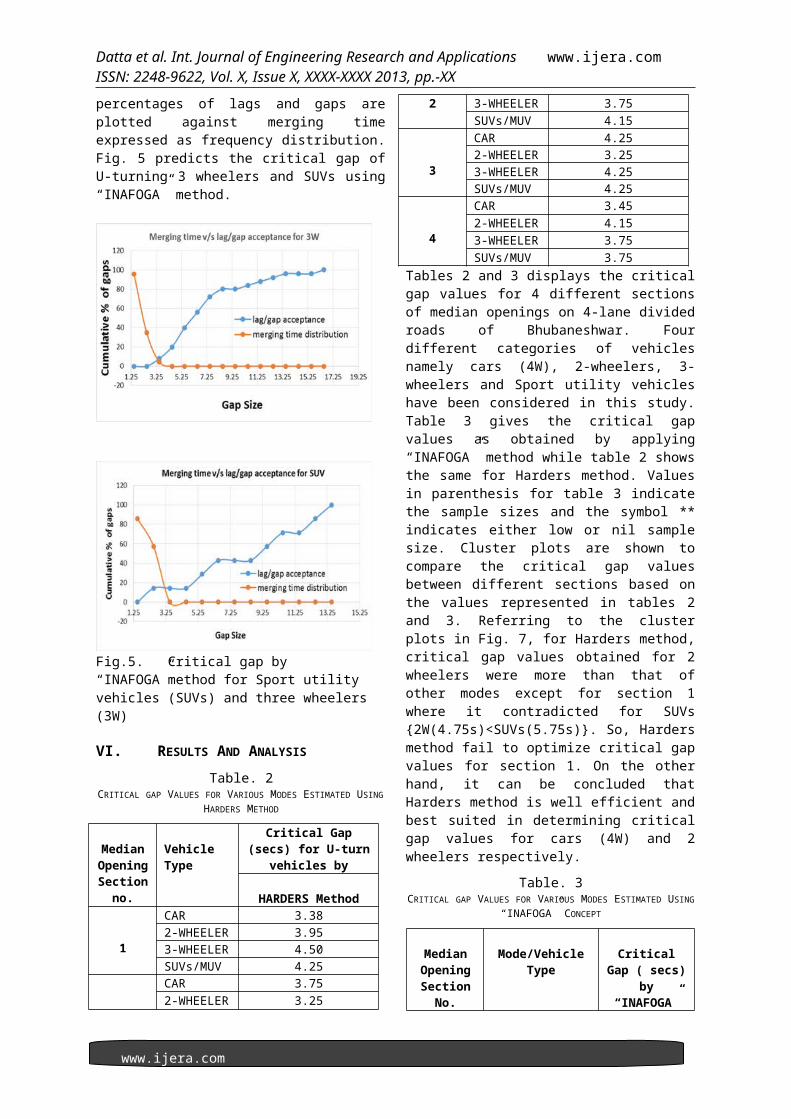
Datta et al. Int. Journal of Engineering Research and Applications www.ijera.comISSN: 2248-9622, Vol. X, Issue X, XXXX-XXXX 2013, pp.-XXpercentages of lags and gaps areplotted against merging timeexpressed as frequency distribution.Fig. 5 predicts the critical gap ofU-turning 3 wheelers and SUVs using“INAFOGA” method.
Fig.5. Critical gap by “INAFOGA”method for Sport utility vehicles (SUVs) and three wheelers (3W)
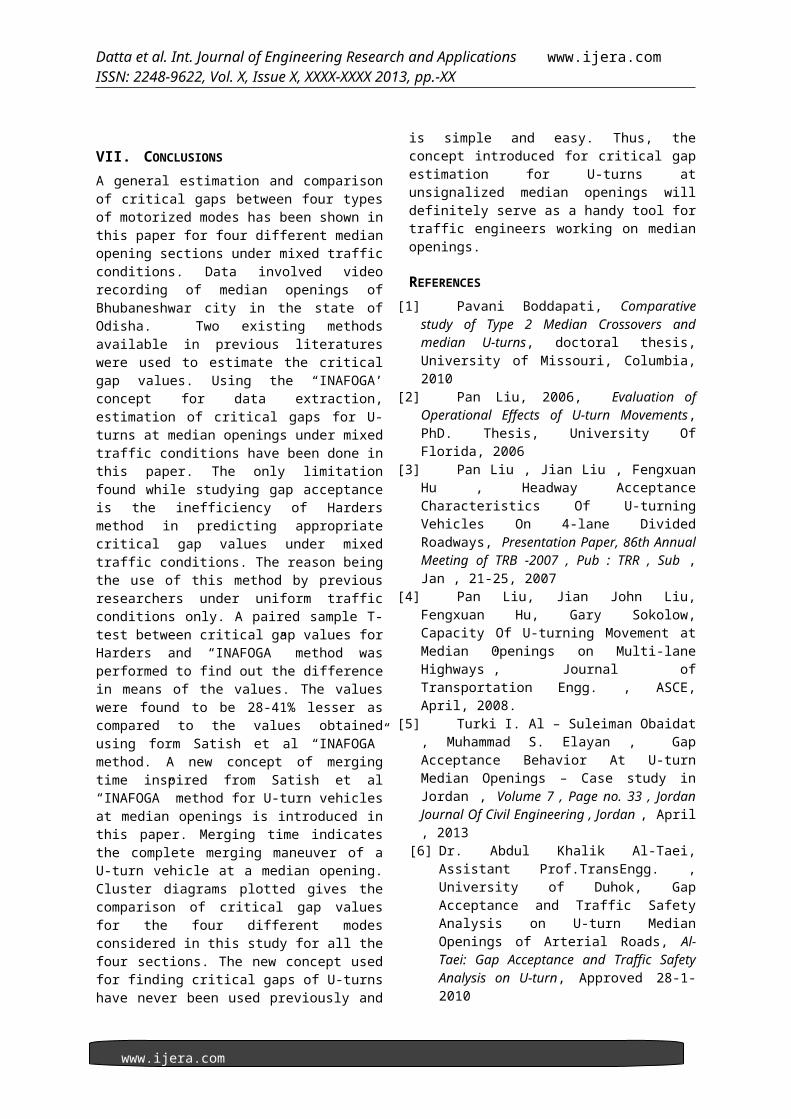
VI. RESULTS AND ANALYSISTable. 2
CRITICAL GAP VALUES FOR VARIOUS MODES ESTIMATED USINGHARDERS METHOD
MedianOpeningSection
no.
Vehicle Type
Critical Gap(secs) for U-turn
vehicles by
HARDERS Method
1
CAR 3.382-WHEELER 3.953-WHEELER 4.50SUVs/MUV 4.25CAR 3.752-WHEELER 3.25
2 3-WHEELER 3.75SUVs/MUV 4.15
3
CAR 4.252-WHEELER 3.253-WHEELER 4.25SUVs/MUV 4.25
4
CAR 3.452-WHEELER 4.153-WHEELER 3.75SUVs/MUV 3.75
Tables 2 and 3 displays the criticalgap values for 4 different sectionsof median openings on 4-lane dividedroads of Bhubaneshwar. Fourdifferent categories of vehiclesnamely cars (4W), 2-wheelers, 3-wheelers and Sport utility vehicleshave been considered in this study.Table 3 gives the critical gapvalues as obtained by applying“INAFOGA” method while table 2 showsthe same for Harders method. Valuesin parenthesis for table 3 indicatethe sample sizes and the symbol **indicates either low or nil samplesize. Cluster plots are shown tocompare the critical gap valuesbetween different sections based onthe values represented in tables 2and 3. Referring to the clusterplots in Fig. 7, for Harders method,critical gap values obtained for 2wheelers were more than that ofother modes except for section 1where it contradicted for SUVs{2W(4.75s)<SUVs(5.75s)}. So, Hardersmethod fail to optimize critical gapvalues for section 1. On the otherhand, it can be concluded thatHarders method is well efficient andbest suited in determining criticalgap values for cars (4W) and 2wheelers respectively.
Table. 3CRITICAL GAP VALUES FOR VARIOUS MODES ESTIMATED USING
“INAFOGA” CONCEPT
MedianOpeningSectionNo.
Mode/VehicleType
CriticalGap ( secs)
by“INAFOGA”

www.ijera.com 1 | P a g e
Datta et al. Int. Journal of Engineering Research and Applications www.ijera.comISSN: 2248-9622, Vol. X, Issue X, XXXX-XXXX 2013, pp.-XX
1
CAR 4.78(65)2-WHEELER 4.75(90)3-WHEELER 4.65(125)SPORTS UTILITY VEHICLES
5.15(35)
2
CAR 5.40(84)2-WHEELER 5.80(42)3-WHEELER 5.50(33)SPORTS UTILITY VEHICLES
5.70(20)
3
CAR 5.55(34) 2-WHEELER 6.00(26)3-WHEELER 5.85(22)SPORTS UTILITY VEHICLES
**
4
CAR 5.15(43)2-WHEELER 4.75(52)3-WHEELER 4.80(21)SPORTS UTILITY VEHICLES
5.75(20)
A paired sample T-test was done forthe critical gap values obtained for
Harders and “INAFOGA” method to findout the difference in means of thevalues in IBM SPSS (StatisticalPackage for Social Sciences)software version 22.0. The resultsindicated a significance value of0.044 which was lower than (p =0.050) which in turn signified thatthe critical gap values for the twomethods can indeed be compared.After a manual calculation it wascertified that the critical gapvalues obtained using Mergingbehaviour concept of U-turn vehiclesinspired from Satish et al “INAFOGA”method shown in Fig. 6, are found tobe higher by 28-41% as compared tothose obtained by Harders methodwhich has been used normally underuniform traffic conditions. Reasonbeing the abrupt vehicularinteractions in mixed trafficconditions. This indicates that the“INAFOGA” concept is successful thanHarders method in gap acceptanceanalysis under mixed traffic.
Paired Samples Statistics
Mean N Std. Deviation Std. Error Mean
Pair Harders 4.8163 32 .90157 .31875
“INAFOGA” 4.031250 32 .4292331 .1517568
Paired Samples Correlations
N Correlation Significance
Pair Harders & “INAFOGA”
32 .872 .005
Paired Samples Test
Paired Differences t-statistic
D.f
Sig.(2-tailed)
Mean Std.deviation
Std.ErrorMean
95% ConfidenceInterval of the
Difference
Lower Upper

www.ijera.com 1 | P a g e
Datta et al. Int. Journal of Engineering Research and Applications www.ijera.comISSN: 2248-9622, Vol. X, Issue X, XXXX-XXXX 2013, pp.-XXPair
Harders–“INAFOGA”
.4850000
.5676518
.2006952
.0104312
.9595688
-2.417
31 .0444
Fig. 6. Statistical Details of The Paired sample T-test Between Harders & “INAFOGA” methods for Critical Gaps
Fig. 7. Cluster Plots of critical gap comparison for 4 different sections under mixed traffic conditions
www.ijera.com 1 | P a g e
Datta et al. Int. Journal of Engineering Research and Applications www.ijera.comISSN: 2248-9622, Vol. X, Issue X, XXXX-XXXX 2013, pp.-XX
VII. CONCLUSIONSA general estimation and comparisonof critical gaps between four typesof motorized modes has been shown inthis paper for four different medianopening sections under mixed trafficconditions. Data involved videorecording of median openings ofBhubaneshwar city in the state ofOdisha. Two existing methodsavailable in previous literatureswere used to estimate the criticalgap values. Using the “INAFOGA’concept for data extraction,estimation of critical gaps for U-turns at median openings under mixedtraffic conditions have been done inthis paper. The only limitationfound while studying gap acceptanceis the inefficiency of Hardersmethod in predicting appropriatecritical gap values under mixedtraffic conditions. The reason beingthe use of this method by previousresearchers under uniform trafficconditions only. A paired sample T-test between critical gap values forHarders and “INAFOGA” method wasperformed to find out the differencein means of the values. The valueswere found to be 28-41% lesser ascompared to the values obtainedusing form Satish et al “INAFOGA”method. A new concept of mergingtime inspired from Satish et al“INAFOGA” method for U-turn vehiclesat median openings is introduced inthis paper. Merging time indicatesthe complete merging maneuver of aU-turn vehicle at a median opening.Cluster diagrams plotted gives thecomparison of critical gap valuesfor the four different modesconsidered in this study for all thefour sections. The new concept usedfor finding critical gaps of U-turnshave never been used previously and
is simple and easy. Thus, theconcept introduced for critical gapestimation for U-turns atunsignalized median openings willdefinitely serve as a handy tool fortraffic engineers working on medianopenings.
REFERENCES[1] Pavani Boddapati, Comparative
study of Type 2 Median Crossovers andmedian U-turns, doctoral thesis,University of Missouri, Columbia,2010
[2] Pan Liu, 2006, Evaluation ofOperational Effects of U-turn Movements,PhD. Thesis, University OfFlorida, 2006
[3] Pan Liu , Jian Liu , FengxuanHu , Headway AcceptanceCharacteristics Of U-turningVehicles On 4-lane DividedRoadways, Presentation Paper, 86th AnnualMeeting of TRB -2007 , Pub : TRR , Sub ,Jan , 21-25, 2007
[4] Pan Liu, Jian John Liu,Fengxuan Hu, Gary Sokolow,Capacity Of U-turning Movement atMedian Openings on Multi-laneHighways”, Journal ofTransportation Engg. , ASCE,April, 2008.
[5] Turki I. Al – Suleiman Obaidat, Muhammad S. Elayan , GapAcceptance Behavior At U-turnMedian Openings – Case study inJordan , Volume 7 , Page no. 33 , JordanJournal Of Civil Engineering , Jordan , April, 2013
[6] Dr. Abdul Khalik Al-Taei,Assistant Prof.TransEngg. ,University of Duhok, GapAcceptance and Traffic SafetyAnalysis on U-turn MedianOpenings of Arterial Roads, Al-Taei: Gap Acceptance and Traffic SafetyAnalysis on U-turn, Approved 28-1-2010
www.ijera.com 1 | P a g e
Datta et al. Int. Journal of Engineering Research and Applications www.ijera.comISSN: 2248-9622, Vol. X, Issue X, XXXX-XXXX 2013, pp.-XX[7] P.Solberg, J.C. Oppenlander, Lag
and Gap Acceptances At Stop-controlled Intersections:Technical Paper, Joint HighwayResearch Programme (JHRP), PurdueUniversity, pp.: 1-58, Purdue-e-Pubs,1964
[8] C.B.Uber, Driver Gap AcceptancePhenomenon, Doctoral diss.,J.Transportation Engg.1984.110:145-147,M.ASCE, 1994
[9] Rui-Jun Guo, Bo-liang Lin, GapAcceptance at PriorityControlled Intersections, Journalof Transportation Engg. ASCE,2011.137:296-276, 2011
[10] Ashalatha R., Satish Chandra,Critical Gap through ClearingBehavior at Un-signalizedIntersections, KSCE Journal of CivilEngineers, 2011, Springer Publications,Approved March, 10, 2011
[11] R.H.Hewitt, 1983, MeasuringCritical Gap, Transportation Science,Vol.17, No.1, February 1983.
[12] Highway Capacity Manual,Transportation Research Board,2010, Washington D.C.
[13] Tomer Toledo, Haneen Fareh,Alternative definition ofPassing Critical Gaps, TRR, Journalof the Transportation Research Board, No.2260, December, 2011
[14] City Development Plan:Bhubaneswar, JNNURM, Government ofIndia. Retrieved 14 December 2012
[15] Preface of , ComprehensiveDevelopment Plan for theBhubaneswar-Cuttack UrbanComplex, 2011
[16] W. Brilon, R. Koenig and R.J.Troutbeck, Useful EstimationProcedures for Critical Gaps,Transportation Research Part A 33, 161-186, 1999
[17] Ashalatha R, Satish Chandraand K.Prasanth, Critical Gap atUn-signalized Intersection UsingMaximum Likelihood Technique,Technical Paper, Indian Highways, India,October, 2005
[18] Antje Weinert, Estimation ofCritical Gaps and Follow –upTimes at Rural Un-signalizedIntersections in Germany,Transportation Research Circular E-C018:4th International Symposium on HighwayCapacity, Bochum, Germany, 2001
[19] Adrea Gavulova, Use ofStatistical Techniques forCritical Gap Estimation, 12thInternational Conference on “Reliabilityand Statistics in Transportation andCommunication-2012”, Riga. Liva. pp.20-26, October, 2012
[20] L.Vasconceles, A.B.Silva,A.Seco and G.Rouxinol, Estimationof Critical headways at un-signalized intersections- amicroscopic approach, Journal ofAdvances in Transportation Studies, 2012,Approved 14th May 2012.
[21] Z.Tian , Mark Vandehey , BruceW. Robinson , Wayne Kittelson ,Michael Kyte , Rod Troutbeck ,Werner Brilon and Ning Wu ,Implementing the maximumlikelihood methodology to measurea driver’s Critical Gap,Transportation Research Part A , Elsevier Ltd.,1999
[22] Ning Wu, 2006, A New Model forEstimating Critical Gap and itsDistribution at Un-SignalizedIntersections Based on theEquilibrium of Probabilities, 5thInternational Symposium on HighwayCapacity and Quality Of service

www.ijera.com 1 | P a g e
Datta et al. Int. Journal of Engineering Research and Applications www.ijera.comISSN: 2248-9622, Vol. X, Issue X, XXXX-XXXX 2013, pp.-XX