Dating the early evolution of plants: detection and molecular clock analyses of orthologs
10
Mol Genet Genomics (2007) 278:393–402 DOI 10.1007/s00438-007-0257-6 123 ORIGINAL PAPER Dating the early evolution of plants: detection and molecular clock analyses of orthologs Andreas Zimmer · Daniel Lang · Sandra Richardt · Wolfgang Frank · Ralf Reski · Stefan A. Rensing Received: 10 April 2007 / Accepted: 24 May 2007 / Published online: 26 June 2007 © Springer-Verlag 2007 Abstract Orthologs generally are under selective pressure against loss of function, while paralogs usually accumulate mutations and Wnally die or deviate in terms of function or regulation. Most ortholog detection methods contaminate the resulting datasets with a substantial amount of paralogs. Therefore we aimed to implement a straightforward method that allows the detection of ortholog clusters with a reduced amount of paralogs from completely sequenced genomes. The described cross-species expansion of the reciprocal best BLAST hit method is a time-eVective method for ortholog detection, which results in 68% truly orthologous clusters and the procedure speciWcally enriches single-copy orthologs. The detection of true orthologs can provide a phylogenetic toolkit to better understand evolutionary pro- cesses. In a study across six photosynthetic eukaryotes, nuclear genes of putative mitochondrial origin were shown to be over-represented among single copy orthologs. These orthologs are involved in fundamental biological processes like amino acid metabolism or translation. Molecular clock analyses based on this dataset yielded divergence time esti- mates for the red/green algae (1,142 MYA), green algae/ land plant (725 MYA), mosses/seed plant (496 MYA), gymno-/angiosperm (385 MYA) and monocotyledons/core eudicotyledons (301 MYA) divergence times. Keywords Ortholog detection · Molecular clock · Phylogeny · Plant evolution Introduction The availability of several complete or nearly complete genome sequences of plant and algal model species pro- vides the opportunity to investigate their evolution on a genomic scale. However, the extension of conclusions drawn from such analyses to, e.g., plants, as a whole, is diYcult due to possible sampling bias. The reduction of the analysis to orthologous “benchmark” genes or marker regions, which can be feasibly compared between multiple species in parallel is the means to overcome taxon-sam- pling issues. Yet, if the selection of these benchmark genes is arbitrary or based on the criterion of availability, unequal evolutionary rates might falsify the analysis. Paralogous “contaminations” in a benchmark set can diVuse the signal, because paralogs often evolve at a diVerent rate than their primordial ortholog (Blanc and Wolfe 2004; Fares et al. 2006). Hence, a generally applicable, fast and feasible method to detect orthologous relationships, even among species where only expressed sequence tag (EST) data are available, is needed. A classiWcation based on strict orthol- ogous relationships between gene products constitutes a benchmark for phylogenetic studies, enables calibration of the molecular clock and should eventually result in a deeper understanding of plants from genomic and evolutionary perspectives. This study uses the predicted proteins of the core eudi- cotyledon Arabidopsis thaliana, the monocotyledon Oryza Communicated by Y. Van de Peer. Electronic supplementary material The online version of this article (doi:10.1007/s00438-007-0257-6) contains supplementary material, which is available to authorized users. A. Zimmer · D. Lang · S. Richardt · W. Frank · R. Reski · S. A. Rensing (&) Plant Biotechnology, Faculty of Biology, University of Freiburg, Schaenzlestr. 1, 79104 Freiburg, Germany e-mail: [email protected] URL: www.plant-biotech.net; www.cosmoss.org
-
Upload
uni-freiburg -
Category
Documents
-
view
1 -
download
0
Transcript of Dating the early evolution of plants: detection and molecular clock analyses of orthologs

Mol Genet Genomics (2007) 278:393–402
DOI 10.1007/s00438-007-0257-6ORIGINAL PAPER
Dating the early evolution of plants: detection and molecular clock analyses of orthologs
Andreas Zimmer · Daniel Lang · Sandra Richardt · Wolfgang Frank · Ralf Reski · Stefan A. Rensing
Received: 10 April 2007 / Accepted: 24 May 2007 / Published online: 26 June 2007© Springer-Verlag 2007
Abstract Orthologs generally are under selective pressureagainst loss of function, while paralogs usually accumulatemutations and Wnally die or deviate in terms of function orregulation. Most ortholog detection methods contaminatethe resulting datasets with a substantial amount of paralogs.Therefore we aimed to implement a straightforward methodthat allows the detection of ortholog clusters with a reducedamount of paralogs from completely sequenced genomes.The described cross-species expansion of the reciprocalbest BLAST hit method is a time-eVective method forortholog detection, which results in 68% truly orthologousclusters and the procedure speciWcally enriches single-copyorthologs. The detection of true orthologs can provide aphylogenetic toolkit to better understand evolutionary pro-cesses. In a study across six photosynthetic eukaryotes,nuclear genes of putative mitochondrial origin were shownto be over-represented among single copy orthologs. Theseorthologs are involved in fundamental biological processeslike amino acid metabolism or translation. Molecular clockanalyses based on this dataset yielded divergence time esti-mates for the red/green algae (1,142 MYA), green algae/land plant (725 MYA), mosses/seed plant (496 MYA),
gymno-/angiosperm (385 MYA) and monocotyledons/coreeudicotyledons (301 MYA) divergence times.
Keywords Ortholog detection · Molecular clock · Phylogeny · Plant evolution
Introduction
The availability of several complete or nearly completegenome sequences of plant and algal model species pro-vides the opportunity to investigate their evolution on agenomic scale. However, the extension of conclusionsdrawn from such analyses to, e.g., plants, as a whole, isdiYcult due to possible sampling bias. The reduction of theanalysis to orthologous “benchmark” genes or markerregions, which can be feasibly compared between multiplespecies in parallel is the means to overcome taxon-sam-pling issues. Yet, if the selection of these benchmark genesis arbitrary or based on the criterion of availability, unequalevolutionary rates might falsify the analysis. Paralogous“contaminations” in a benchmark set can diVuse the signal,because paralogs often evolve at a diVerent rate than theirprimordial ortholog (Blanc and Wolfe 2004; Fares et al.2006). Hence, a generally applicable, fast and feasiblemethod to detect orthologous relationships, even amongspecies where only expressed sequence tag (EST) data areavailable, is needed. A classiWcation based on strict orthol-ogous relationships between gene products constitutes abenchmark for phylogenetic studies, enables calibration ofthe molecular clock and should eventually result in a deeperunderstanding of plants from genomic and evolutionaryperspectives.
This study uses the predicted proteins of the core eudi-cotyledon Arabidopsis thaliana, the monocotyledon Oryza
Communicated by Y. Van de Peer.
Electronic supplementary material The online version of this article (doi:10.1007/s00438-007-0257-6) contains supplementary material, which is available to authorized users.
A. Zimmer · D. Lang · S. Richardt · W. Frank · R. Reski · S. A. Rensing (&)Plant Biotechnology, Faculty of Biology, University of Freiburg, Schaenzlestr. 1, 79104 Freiburg, Germanye-mail: [email protected]: www.plant-biotech.net; www.cosmoss.org
123
394 Mol Genet Genomics (2007) 278:393–402
sativa, the gymnosperm Pinus taeda, the moss Physcomit-rella patens, the green and red alga Chlamydomonas rein-hardtii and Cyanidioschyzon merolae, thus covering majorphyla of photosynthetic eukaryotes, i.e., plants sensu lato.Based on molecular clock analyses, approximately1.6 BYA (Hedges et al. 2004; Yoon et al. 2004) plants splitoV from the animal and fungal lineage by a primary endo-symbiotic event, the engulfment of a cyanobacteria-likeprokaryotic cell, eventually leading to the formation ofplastids. About 200 MY later (Hedges et al. 2004; Yoonet al. 2004) the ancestors of the red and green lineage(which would later give rise to the Chlorophyta and Embry-ophyta, i.e., green algae, water and land plants) diverged.From the ancestor of the red lineage the Rhodophyta (redalgae) emerged as well as several algal divisions whichacquired their plastids by secondary endosymbiosis. Theland plants diverged from the green algae at least 1 BYA,while mosses and seed plants shared their last commonancestor at least 450 MYA, as deduced from molecular data(Theissen et al. 2001; Hedges et al. 2004). We did notinclude data from diatoms (Armbrust et al. 2004) or othersecondary endosymbionts because their plastids wereestablished several hundred MY later.
Orthologs, as deWned by Fitch (Fitch 1970) often per-form the same function in diVerent organisms, while para-logs usually deviate in function or regulation from theirarchetypical gene (Li et al. 2005; Dutilh et al. 2006).Recently, the terminology of gene relationships has beenexpanded (Fitch 2000; Sonnhammer and Koonin 2002) inorder to clarify the deWnition of paralogs, which is depen-dent on the frame of reference. While determination of trueorthologs (i.e., a single gene in each organism that can betraced back to the common ancestor) is most conWdentlyachieved by phylogenetic approaches, reciprocal homologysearches have been established as a straightforward methodto determine probable orthologs (Mushegian et al. 1998).While common orthologs of animals and yeast have alreadybeen analyzed (Mushegian et al. 1998) and orthologs ofspecies-pairs have been made available (O’Brien et al.2005), plants have not yet been the focus of such research,except for phylogenetic proWling approaches of Arabidop-sis in comparison with fungi, animals, eubacteria andarchaea (Gutierrez et al. 2004) as well as with a large groupof clustered EST data from plants (Vandepoele and Van dePeer 2005). Although clusters of orthologous groups(COGs) have been established for eukaryotes (KOGs)(Tatusov et al. 2003), these homology-based clusters alsocontain paralogs. The same is true for so-called in-paralogapproaches (Remm et al. 2001; O’Brien et al. 2005; Alex-eyenko et al. 2006) as well as approaches yielding clustersof closely related sequences (Lee et al. 2002; Li et al.2003). In order to reduce the amount of potentially disturb-ing paralogs we used reciprocal BLAST searches and
analyzed all six organisms in parallel, creating clusters oforthologous genes, which contain a single gene from eachstudied organism. Hence, the aim of our study was thedetection of orthologs sensu strictu, excluding paralogs,from six photosynthetic eukaryotes. We evaluated ourmethod by annotation and phylogenetic analysis of theortholog clusters. Subsequently, molecular clock analysesof the orthologs were used to estimate the divergence timesof red and green algae, mosses, gymnosperms as well asmonocotyledons and core eudicotyledons.
Results
Detection of cross-species ortholog clusters among photosynthetic eukaryotes
In order to avoid false positives, only clearly deWned homo-logs were selected, using Wltering criteria designed to avoidthe twilight zone of protein sequence alignments in whichhomology cannot be unambiguously determined (Rost1999). To enable the detection of cross-species orthologs,reciprocal BLAST searches of all against all species wereperformed. Subsequently, we used non-ambiguous keys toselect from the resulting database in order to determineputatively orthologous genes that were shared by all, or anychosen subset of species (see Supplementary data for agraphical representation of the method). Using theserestrictive criteria, we identiWed 9,497 such shared genesbetween the angiosperms rice (Liliopsida) and Arabidopsis(core eudicotyledons). These plants have 2,105 genes incommon with the gymnosperm Pinus, while all land plants(Embryophyta) share a group of 540 genes. Land plants andgreen algae (= green lineage) share 203 genes, whereas thenumber drops to 93 clusters when the red alga is includedinto this analysis. We determined the global conservationof the gene clusters using multiple sequence alignments.Based on global alignments, the minimum average identitywithin an ortholog cluster (6-tuple) was around 38%, themaximum around 85% (see Supplementary data). On aver-age, the genes are »60% identical over the whole sequencelength.
Phylogenetic analyses of the ortholog clusters
Phylogenetic analyses of orthologs have been carried out asa test for consistency (Mushegian et al. 1998; Raymondet al. 2002). For example, in an analysis of human, worm,Xy and yeast orthologs, the majority of ortholog clusterssupported the expected phylogeny. However, unequal evo-lutionary rates may disturb the phylogenetic reconstructionin some cases (Felsenstein 1978; Mushegian et al. 1998). Ina similar approach the individual maximum likelihood
123
Mol Genet Genomics (2007) 278:393–402 395
(ML) topologies for the 93 ortholog clusters of the photo-synthetic eukaryotes were determined and a consensus treewas calculated subsequently. In this tree, the generallyaccepted species topology is recovered, yet with better sup-port for the lower branches than for the seed plants (datanot shown). In order to determine the reasons for this obser-vation, the phylogenetic trees were analyzed in more indetail. Scatter plots of quartet puzzling support values ver-sus eVective alignment length and total branch length of theexpected trees, respectively, did not reveal a clear correla-tion (data not shown). Therefore, the weak support for theupper branches does not seem to be due to either shortsequence length or varying gene-speciWc rates. The MLdiVerences between best and expected trees were found tobe in a narrow range. For only four out of 93 trees, the like-lihood diVerences were found to be signiWcant based on theShimodaira-Hasegawa test (Shimodaira and Hasegawa1999).
Evaluation of the ortholog detection method
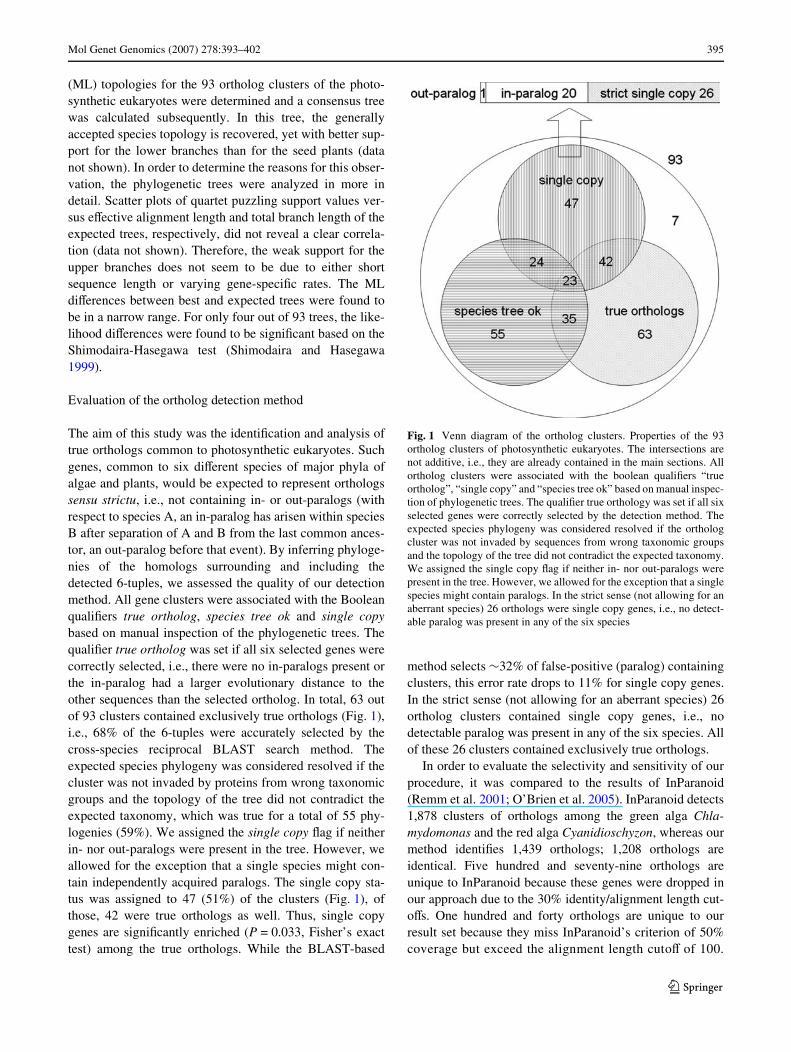
The aim of this study was the identiWcation and analysis oftrue orthologs common to photosynthetic eukaryotes. Suchgenes, common to six diVerent species of major phyla ofalgae and plants, would be expected to represent orthologssensu strictu, i.e., not containing in- or out-paralogs (withrespect to species A, an in-paralog has arisen within speciesB after separation of A and B from the last common ances-tor, an out-paralog before that event). By inferring phyloge-nies of the homologs surrounding and including thedetected 6-tuples, we assessed the quality of our detectionmethod. All gene clusters were associated with the BooleanqualiWers true ortholog, species tree ok and single copybased on manual inspection of the phylogenetic trees. ThequaliWer true ortholog was set if all six selected genes werecorrectly selected, i.e., there were no in-paralogs present orthe in-paralog had a larger evolutionary distance to theother sequences than the selected ortholog. In total, 63 outof 93 clusters contained exclusively true orthologs (Fig. 1),i.e., 68% of the 6-tuples were accurately selected by thecross-species reciprocal BLAST search method. Theexpected species phylogeny was considered resolved if thecluster was not invaded by proteins from wrong taxonomicgroups and the topology of the tree did not contradict theexpected taxonomy, which was true for a total of 55 phy-logenies (59%). We assigned the single copy Xag if neitherin- nor out-paralogs were present in the tree. However, weallowed for the exception that a single species might con-tain independently acquired paralogs. The single copy sta-tus was assigned to 47 (51%) of the clusters (Fig. 1), ofthose, 42 were true orthologs as well. Thus, single copygenes are signiWcantly enriched (P = 0.033, Fisher’s exacttest) among the true orthologs. While the BLAST-based
method selects »32% of false-positive (paralog) containingclusters, this error rate drops to 11% for single copy genes.In the strict sense (not allowing for an aberrant species) 26ortholog clusters contained single copy genes, i.e., nodetectable paralog was present in any of the six species. Allof these 26 clusters contained exclusively true orthologs.
In order to evaluate the selectivity and sensitivity of ourprocedure, it was compared to the results of InParanoid(Remm et al. 2001; O’Brien et al. 2005). InParanoid detects1,878 clusters of orthologs among the green alga Chla-mydomonas and the red alga Cyanidioschyzon, whereas ourmethod identiWes 1,439 orthologs; 1,208 orthologs areidentical. Five hundred and seventy-nine orthologs areunique to InParanoid because these genes were dropped inour approach due to the 30% identity/alignment length cut-oVs. One hundred and forty orthologs are unique to ourresult set because they miss InParanoid’s criterion of 50%coverage but exceed the alignment length cutoV of 100.
Fig. 1 Venn diagram of the ortholog clusters. Properties of the 93ortholog clusters of photosynthetic eukaryotes. The intersections arenot additive, i.e., they are already contained in the main sections. Allortholog clusters were associated with the boolean qualiWers “trueortholog”, “single copy” and “species tree ok” based on manual inspec-tion of phylogenetic trees. The qualiWer true orthology was set if all sixselected genes were correctly selected by the detection method. Theexpected species phylogeny was considered resolved if the orthologcluster was not invaded by sequences from wrong taxonomic groupsand the topology of the tree did not contradict the expected taxonomy.We assigned the single copy Xag if neither in- nor out-paralogs werepresent in the tree. However, we allowed for the exception that a singlespecies might contain paralogs. In the strict sense (not allowing for anaberrant species) 26 orthologs were single copy genes, i.e., no detect-able paralog was present in any of the six species
123
396 Mol Genet Genomics (2007) 278:393–402
A small set of 91 genes have diVerent partners, eitherbecause we consider the best hit only or they are membersof an InParanoid ortholog cluster (n > 2). Additionally, theresults for all six species were compared to the MultiPara-noid (Alexeyenko et al. 2006) method based on the pair-wise results of InParanoid. Whereas our approach isequivalent to a complete linkage clustering, MultiParanoidgenerates single linkage clusters. Because the MultiPara-noid method is based on pairwise InParanoid results theclusters can contain more than one protein per organism(orthologs, in-paralogs). Hence, the results of our methodshould be a subset of the MultiParanoid results. Indeed,with the exception of one cluster, the clusters derived fromour method are a subset of the MultiParanoid clusters. Thisaberrant cluster (CO #22) diVers only in one member, theP. patens protein PPP_312_C1, which does not appear inany MultiParanoid cluster, although it generates bestBLAST hits during the pairwise searches. All other com-mon proteins are seed orthologs (main orthologs) in InPara-noid, respectively, MultiParanoid clusters. In addition theMultiParanoid result contains 1,194 clusters. Moreover, ourmethod outperforms the MultiParanoid approach in termsof runtime and disk space usage. For the given set of organ-isms our method, including the BLAST searches and theirparsing, it is about an order of magnitude faster than gener-ating the corresponding MultiParanoid results while itrequires only about half the amount of disk space.
Ancient single copy genes and their genetic parentage
We compared the strict single copy genes with the remain-der of the 6-tuples in terms of alignment length, averagesequence identity, average quartet support and the fractionof resolved quartets. Out of these parameters, only the aver-age quartet support values were signiWcantly increased(P = 0.048) among the strict single copy clusters. Hence,the proteins do not diVer in length or conservation gradefrom those gene families that contain paralogs, but recon-struction of phylogenies from gene families that do not con-tain paralogs seems to yield better-supported topologies. Interms of pathway annotation, among the strict single copyclusters those genes that encode amino acid metabolism aresigniWcantly (P < 0.05) enriched (KEGG KO categories:00300 Lysine biosynthesis; 00330 Arginine and prolinemetabolism; 00220 Urea cycle and metabolism of aminogroups). Proteins involved in translation, energy metabo-lism and other basic processes are present as well (see Sup-plementary data).
Plastids have arisen by engulfment of a free-livingcyanobacterial-like prokaryote and subsequent establish-ment of endosymbiosis. During evolution, the majority ofprokaryotic genes have been transferred to other compart-ments, mainly to the nucleus, while the gene products are
targeted to the plastid as well as to other destinations (Mar-tin et al. 2002). The same holds true for mitochondria,which share their last common ancestor with extant alpha-proteobacteria and were established prior to plastids (Grayet al. 2001). Assignment of putative origin of the orthologsusing BLAST searches revealed that 26 (28%) out of 93genes were inherited from the mitochondrion, 19 (20%)from the plastid and 48 (52%) from the ancestral eukaryoticnucleus, i.e., genes of eukaryotic origin are enriched(P < 0.002). Among the 26 strict single copy genes, thoseof mitochondrial origin (46%) are over-represented(P = 0.016) in comparison with the other two fractions (nt:23%; pt: 16%). Also, gene families of mitochondrial origincontain signiWcantly less in-paralogs (P < 0.027) than thosederived from the ancestral eukaryotic nucleus or the plastid.
Taxonomic proWle
The taxonomic proWle (i.e., the contribution of distinct tax-onomic groups to the distribution of homologs) of the trueortholog clusters correlates well with their genetic origin(Fig. 2). Most genes of eukaryotic origin are clustered inthe upper part of the heat map. Those clusters containhomologs from protists, plants, fungi and animals, whereaseubacterial genes are clearly under-represented. In thelower part, most of the prokaryotic genes are clustered.These genes generally prevail among several eubacterialgroups while they are under-represented among mosteukaryotic groups. Yet, there are some genes for which tax-onomic distribution and heritage deviate. There are eukary-otic genes that cluster with those of prokaryotic originbecause homologs are present to a large extent amongeubacteria, like cluster 50, 65 and 45. Another trend is theprevalence of eukaryotic genes among the non-photosyn-thetic (other) protists, while this taxonomic group is clearlyunder-represented among the prokaryotic genes.
Molecular clock analyses date the early evolution of plants
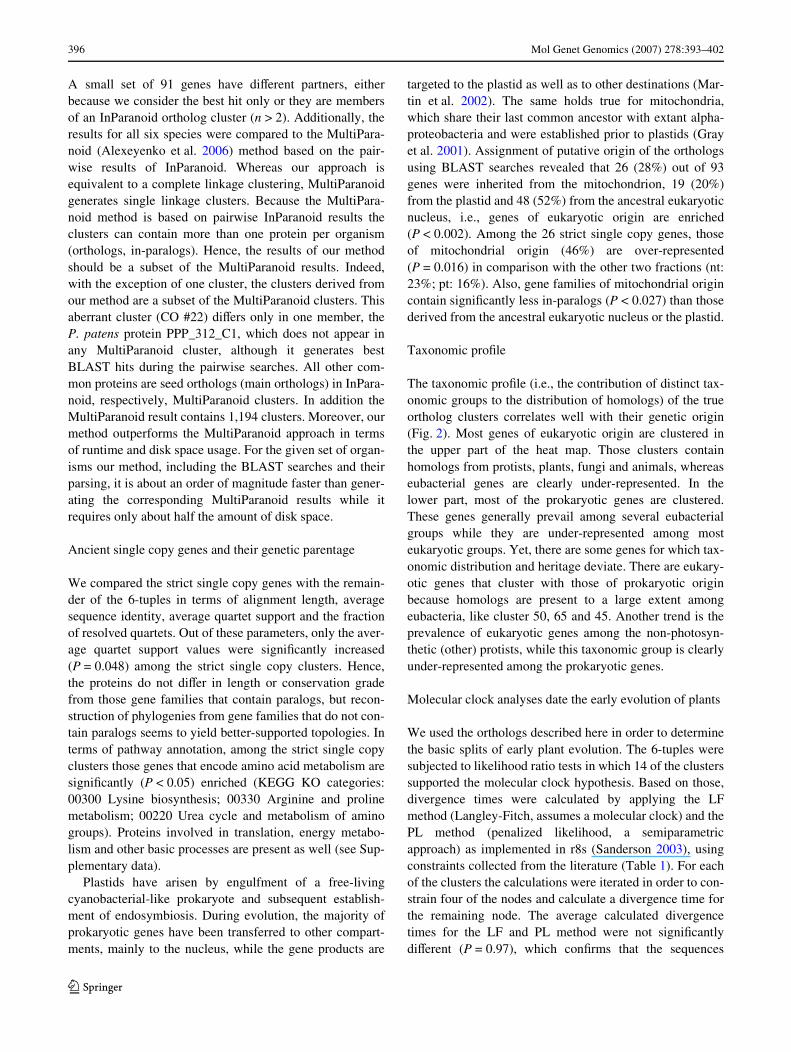
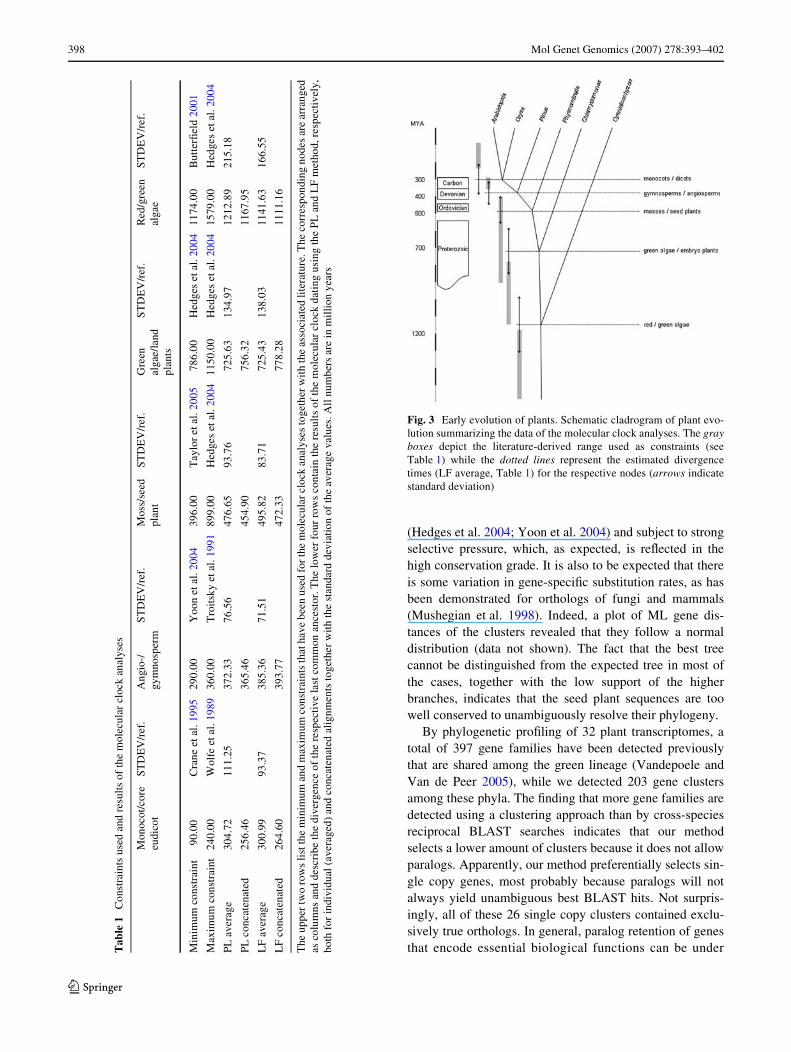
We used the orthologs described here in order to determinethe basic splits of early plant evolution. The 6-tuples weresubjected to likelihood ratio tests in which 14 of the clusterssupported the molecular clock hypothesis. Based on those,divergence times were calculated by applying the LFmethod (Langley-Fitch, assumes a molecular clock) and thePL method (penalized likelihood, a semiparametricapproach) as implemented in r8s (Sanderson 2003), usingconstraints collected from the literature (Table 1). For eachof the clusters the calculations were iterated in order to con-strain four of the nodes and calculate a divergence time forthe remaining node. The average calculated divergencetimes for the LF and PL method were not signiWcantlydiVerent (P = 0.97), which conWrms that the sequences
123

Mol Genet Genomics (2007) 278:393–402 397
show approximate clocklike behavior and that the estimatesare not dependent on the method. Because only ten out ofthe 14 clusters were assigned true orthology, we also testedwhether the estimates were diVerent between these twopopulations, which was not the case (P = 0.97). In addition,the divergence times using a concatenated alignmentinstead of the individual alignments were calculated, whichalso led to insigniWcant diVerences (P > 0.94). The esti-mates generated using the LF method exhibit the smallestaverage standard deviation. For the full set of individualalignments LF dates the split between red and greenalgae to 1,142 § 167 MY, the green algae/land plantdivergence to 725 § 138, mosses/seed plants 496 § 84,
gymno-/angiosperms 385 § 72 and monocotyledons/coreeudicotyledons to 301 § 93 (Fig. 3, Table 1).
Discussion
Not surprisingly, the set of orthologs detected among thebroad phylogenetic range of phototrophic eukaryotic organ-isms studied here exhibit a high degree of sequence conser-vation, being the result of strong purifying selection againstfunctional divergence or loss of function of these genes.The genes studied here were already established before thesplit of the red and the green lineage at least 1 BYA
Fig. 2 Taxonomic proWle of the ortholog clusters. The NCBI taxon-omy information for all true orthologs was parsed per cluster. Afternormalization of the columns, the rows were clustered and visualizedas a heat map (yellow indicates over-represented, blue indicates under-represented). The columns represent those taxonomic groups, whichcontributed signiWcantly to the distribution; the remainder of the
eubacteria, protists, plants and animals was pooled as “other”, respec-tively. All clusters with a Pearson correlation coeYcient R ¸ 0.7 aredisplayed in color to the left of the heat map. The ortholog id and anno-tation are shown to the right. Color code: yellow—gene of ancestraleukaryotic origin; green—gene of cyanobacterial origin; red—gene ofalpha-proteobacterial origin; blue font—strict single copy genes
123
398 Mol Genet Genomics (2007) 278:393–402
(Hedges et al. 2004; Yoon et al. 2004) and subject to strongselective pressure, which, as expected, is reXected in thehigh conservation grade. It is also to be expected that thereis some variation in gene-speciWc substitution rates, as hasbeen demonstrated for orthologs of fungi and mammals(Mushegian et al. 1998). Indeed, a plot of ML gene dis-tances of the clusters revealed that they follow a normaldistribution (data not shown). The fact that the best treecannot be distinguished from the expected tree in most ofthe cases, together with the low support of the higherbranches, indicates that the seed plant sequences are toowell conserved to unambiguously resolve their phylogeny.
By phylogenetic proWling of 32 plant transcriptomes, atotal of 397 gene families have been detected previouslythat are shared among the green lineage (Vandepoele andVan de Peer 2005), while we detected 203 gene clustersamong these phyla. The Wnding that more gene families aredetected using a clustering approach than by cross-speciesreciprocal BLAST searches indicates that our methodselects a lower amount of clusters because it does not allowparalogs. Apparently, our method preferentially selects sin-gle copy genes, most probably because paralogs will notalways yield unambiguous best BLAST hits. Not surpris-ingly, all of these 26 single copy clusters contained exclu-sively true orthologs. In general, paralog retention of genesthat encode essential biological functions can be underT
able
1C
onst
rain
ts u
sed
and
resu
lts
of th
e m
olec
ular
clo
ck a
naly
ses
The
upp
er tw
o ro
ws
list
the
min
imum
and
max
imum
con
stra
ints
that
hav
e be
en u
sed
for t
he m
olec
ular
clo
ck a
naly
ses
toge
ther
wit
h th
e as
soci
ated
lite
ratu
re. T
he c
orre
spon
ding
nod
es a
re a
rran
ged
as c
olum
ns a
nd d
escr
ibe
the
dive
rgen
ce o
f th
e re
spec
tive
last
com
mon
anc
esto
r. T
he lo
wer
fou
r ro
ws
cont
ain
the
resu
lts
of th
e m
olec
ular
clo
ck d
atin
g us
ing
the
PL
and
LF
met
hod,
res
pect
ivel
y,bo
th f
or in
divi
dual
(av
erag
ed)
and
conc
aten
ated
alig
nmen
ts to
geth
er w
ith
the
stan
dard
dev
iatio
n of
the
aver
age
valu
es. A
ll n
umbe
rs a
re in
mil
lion
year
s
Mon
ocot
/cor
e eu
dico
tST
DE
V/r
ef.
Ang
io-/
gym
nosp
erm
ST
DE
V/r
ef.
Mos
s/se
ed
plan
tST
DE
V/r
ef.
Gre
en
alga
e/la
nd
plan
ts
ST
DE
V/r
ef.
Red
/gre
en
alga
eST
DE
V/r
ef.
Min
imum
con
stra
int
90.0
0C
rane
eta
l. 19
9529
0.00
Yoo
n et
al. 2
004
396.
00T
aylo
r et
al. 2
005
786.
00H
edge
s et
al. 2
004
1174
.00
But
terW
eld
2001
Max
imum
con
stra
int
240.
00W
olfe
eta
l. 19
8936
0.00
Tro
itsk
y et
al. 1
991
899.
00H
edge
s et
al. 2
004
1150
.00
Hed
ges
etal
. 200
415
79.0
0H
edge
s et
al. 2
004
PL a
vera
ge30
4.72
111.
2537
2.33
76.5
647
6.65
93.7
672
5.63
134.
9712
12.8
921
5.18
PL c
onca
tena
ted
256.
4636
5.46
454.
9075
6.32
1167
.95
LF
aver
age
300.
9993
.37
385.
3671
.51
495.
8283
.71
725.
4313
8.03
1141
.63
166.
55
LF
conc
aten
ated
264.
6039
3.77
472.
3377
8.28
1111
.16
Fig. 3 Early evolution of plants. Schematic cladrogram of plant evo-lution summarizing the data of the molecular clock analyses. The grayboxes depict the literature-derived range used as constraints (seeTable 1) while the dotted lines represent the estimated divergencetimes (LF average, Table 1) for the respective nodes (arrows indicatestandard deviation)
123
Mol Genet Genomics (2007) 278:393–402 399
negative selection because of the potentially harmful dos-age imbalance that might be associated with such a change(Birchler et al. 2005).
We compared our method to the pairwise InParanoid(O’Brien et al. 2005) results of the two algae. While theresults for these two organisms diVer in some aspects, wedo not seem to exclude a large part of orthologs using ourstrict criteria as deduced from the fact that the majority ofdetected orthologs are identical. Also the comparison to themulti-species ortholog detection approach MultiParanoid(Alexeyenko et al. 2006) reveals a high amount of commonortholog clusters. Yet, our approach detects fewer ortholo-gous clusters between the six photosynthetic organisms.This leads to the conclusion that our method is more restric-tive through exclusion of potential false positives, whileprobably losing true positive hits. As our intent was not toselect all orthologous clusters, but to detect and analyzeorthologs; for, e.g., dating purposes, our method is ade-quately complete. Moreover, our method outperforms theMultiParanoid approach in terms of runtime and disk spaceusage.
Although small and large scale duplication events con-stantly occur among seed plants (De Bodt et al. 2005) wedetected 26 genes among photosynthetic eukaryotes whichdid not retain a paralog over »1.4 BY of evolution. Whilegenes that were inherited from the ancestral eukaryoticnucleus dominate the total set of ortholog clusters, genes ofmitochondrial origin are over-represented among the singlecopy gene families. Apparently, genes that were transferredto the nucleus between the primary endosymbiotic eventgiving rise to mitochondria and the division of the red andgreen lineage are less likely to be retained after duplication.Those genes encode proteins that are involved in aminoacid metabolism and other primary metabolic processes.Apparently, ancient genes, which encode essential biologi-cal functions are under negative selection against paralogretention, particularly if they are of mitochondrial origin.These dominance of eukaryotic parentage among the wholeset has also been found in a study of KOG’s among seveneukaryotic genomes (Koonin et al. 2004), where 56% of thegenes did not exhibit prokaryotic ancestry.
In terms of the taxonomic proWle, there are some genesfor which taxonomic distribution and heritage deviate(Fig. 2). E.g., the three mitochondrial ortholog clusters 68,42 and 20 exhibit a typical eukaryotic proWle except for thealpha-proteobacterial group from which they are derived.Apparently, other eubacteria use diVerent genes to fulWllthe functions associated with these orthologs. Amongplants, there are several orthologous gene families withdeviating distribution, e.g., between monocotyledons andcore eudicotyledons, such as cluster 15, 34 and 36.
The detection of recently described panorthologs (Blairet al. 2005) relies on a pairwise clustering approach and
subsequent deletion of paralogs. In our ortholog detectionapproach we only permit a single sequence to enter thecomparison in the Wrst hand. As both methods detect ortho-logs from more than two organisms, the outcome isexpected to be approximately the same, i.e., detection oftrue orthologs among a group of more than two organisms.Panorthologs have been successfully applied to calculatedivergence times based on a molecular clock (Blair et al.2005): however, the analysis focused on animals. We usedthe orthologs described here to determine the basic splits ofearly plant evolution, namely red/green algae, green algae/land plants, mosses/vascular plants, gymnosperms/angio-sperms and monocotyledons/core eudicotyledons. It hasbeen shown that divergence times estimates might be inXu-enced by, e.g., chosen method or selected dataset (Bellet al. 2005). Based on the data described above, however,our dataset yields robust estimates that are not signiWcantlyinXuenced by either gene sampling, methodology or multi-versus super-gene approach. All Wve estimates (Fig. 3,Table 1) are not signiWcantly diVerent (in terms of standarddeviation) from the literature-based constraints. The fossilrecord can only provide us with a minimum estimation, i.e.,with the date that a certain specimen appeared at the latest,it does not allow to date back to the last common ancestorand may suVer from biased sampling. The estimates fromthe literature for the nodes analyzed here display large vari-ation; with the fossil-based dates usually deWning the lower(more recent) and the molecular clock analyses the upperboundaries (Table 1). As an example, based on the fossilrecord the ancestors of mosses and seed plants were cer-tainly separated by the time Rhynie chert was deposited inthe Early Devonian, »400 MYA (Taylor et al. 2005) or bythe time spores associated with early land plants weredeposited in the Middle Ordovician, »460 MYA (Kenrickand Crane 1997), whereas the oldest known bryophyte fos-sils have been dated to the Late Devonian, »360 MYA(Crum 2001). Based on molecular clock analyses, the esti-mates for the divergence of mosses and seed plants rangefrom 450 MYA (Theissen et al. 2001) up to »900 MYA(Hedges et al. 2004). In our analysis, this particular nodewas dated to 496 § 84 (412–580) MYA, which is a nar-rower range. The same is true for the divergence time esti-mate of embryo plants/green algae and green/red algae(Fig. 3).
Taken together, our ortholog detection is a quick andeasy method to detect cross-species single copy orthologclusters. These can easily be selected (based on taxonstrings) from the complete pool of clusters without carryingout a phylogenetic analysis. The cross-species orthologspresented in this work constitute a powerful set of markers,which can be used to increase the taxonomic resolution ofphylogenetic analyses through inclusion of “pre-genome”organisms for which EST data is present. The ortholog
123
400 Mol Genet Genomics (2007) 278:393–402
clusters have been successfully applied to molecular clockanalyses, dating the major separations of early plant evolu-tion in concordance with the literature. Hence, our cross-species ortholog detection and subsequent rate analysis is aconvenient method to update our knowledge about earlyevolution as the number of completely sequenced genomesincreases.
Methods
Datasets
We used the following datasets to cover as thoroughly aspossible the transcriptomes of all major lineages of photo-synthetic eukaryotes.
Arabidopsis thaliana: 28,952 predicted proteins, TheInstitute for Genome Research (TIGR) ATH1.pep, (ftp://ftp.tigr.org/pub/data/Eukaryotic_Projects/a_thaliana/anno-tation_dbs/ATH1.pep).
Oryza sativa: 88,149 predicted proteins, TIGROSA1.pep, (ftp://ftp.tigr.org/pub/data/Eukaryotic_Projects/o_sativa/annotation_dbs/BAC_PAC_clones/OSA1.pep).
Pinus taeda: TIGR PGI release 5 (35,053 tentative con-tigs, TCs) (http://www.tigr.org/tigr-scripts/tgi/T_index.cgi?species=pinus). All non-redundant Genbank full-lengthcoding sequences from the genus Pinus (txid3337) (224sequences) were used to calculate a codon usage table forESTScan 2.0 (Iseli et al. 1999). The ESTScan predictionyielded 26,925 open reading frames (ORF) with an averagelength of 149 amino acids.
Physcomitrella patens: 26,123 clustered and assembledpublic EST (Lang et al. 2005), (http://www.cosmoss.org)were used for the prediction of ORF for P. patens usingESTcan 2.0 and a Physcomitrella speciWc model (Rensinget al. 2005), yielding 22,491 ORF.
Chlamydomonas reinhardtii: 19,832 predicted proteinsfrom release 2.0, Joint Genome Institute (http://genome.jgi-psf.org/chlre2/chlre2.download.ftp.htm).
Cyanidioschyzon merolae: 5,013 translated mRNAs,(http://merolae.biol.s.u-tokyo.ac.jp/download/cds_nt.fasta).
Protein sequences of the cyanobacteria, the alpha-prote-obacteria and non-photosynthetic eukaryotes were retrievedfrom Genbank (http://www.ncbi.nlm.nih.gov/entrez). Forthe collection of additional homologs throughout the avail-able protein space using PSI-BLAST, the UniProt Knowl-edgebase, http://www.ebi.uniprot.org/database/download.shtml, was used.
BLAST searches and determination of orthologs
Parsing of the BLAST output, processing, and detection oforthologous proteins was done using Perl scripts and
bioperl (Stajich et al. 2002) modules. A MySQL (http://www.mysql.com/) database was used to enable retrieval ofthe orthologs. In order to Wnd orthologous protein pairsamong a pair of genomes, we performed all-against-allsearches between the two sequence spaces using BLASTP(Altschul et al. 1997). SigniWcant hits were Wltered accord-ing to these criteria: E-value <1E-4, >30% identity, align-ment length >50% (with respect to the longer sequence) or>100aa, which places the hits above the twilight zone. Apair of proteins was labeled as orthologs if both sequencesare each other’s bi-directional best hit. To detect orthologsamong more than two genomes, the accessions of ortholo-gous pairs from the reciprocal all-against-all BLASTapproach were concatenated. These strings were used asnon-ambiguous keys for database queries. Genes were deW-ned as orthologs if the exact string turns up in everyBLAST result of the given subset of species (see Supple-mentary data). To determine the genetic origin of the ortho-logs, BLAST searches against all known proteins ofcyanobacteria, alpha-proteobacteria and non-photosyn-thetic eukaryotes (cutoV 1E-4, 30% identity, hits at least 50amino acids long) were carried out. From the respectivebest hits those with the highest percentage identity wereselected. In addition, the gene family trees (see below) weremanually inspected to determine as to which organismswere present in the sister branches with respect to the sixorthologs.
Comparison with InParanoid and MultiParanoid
The pairwise InParanoid run for Cyanidioschyzon merolaeand Chlamydomonas reinhardtii and also the runs for Mul-tiParanoid were performed using the algorithm default val-ues. Except for the conWdence_score cut-oV, which was setto 1.0, the MultiParanoid default values were used toretrieve only those proteins, which are main orthologs (seedorthologs) in InParanoid clusters.
Alignment, distances, phylogeny and rates
The individual ortholog clusters (6-tuples) were alignedusing probcons 1.09 (Do et al. 2005). Pairwise identity val-ues were calculated as inversed, uncorrected distancesbased on the multiple global alignments with the EMBOSS(http://emboss.sourceforge.net/) program Distmat. Basedupon the multiple sequence alignment, pairwise distanceswithin the 93 6-tuples of orthologs were calculated usingPAML 3.14 (Yang 1997) with the Jones model and thecleandata option. ML trees were calculated from the 6-tuplealignments with TREE-PUZZLE 5.2 (Schmidt et al. 2002),applying the WAG (Whelan and Goldman 2001) substitu-tion model with dataset-derived frequencies, using eightgamma-distributed rates. The WAG model was applied
123
Mol Genet Genomics (2007) 278:393–402 401
because it has been developed for globular proteins, whichis the case for most proteins in our set. In addition, WAGwas determined as the best model for 80% of the clusters ofa random sample by applying ProtTest (Abascal et al.2005). Calculation of likelihood values for the expectedtopology, likelihood ratio tests and statistical tests betweenbest and expected trees were also carried out using TREE-PUZZLE. An extended majority rule consensus tree wascalculated using the PHYLIP 3.6 (http://evolution.genet-ics.washington.edu/phylip.html) program Consense. Evolu-tionary rates were calculated based on the ML likelihoodbranch lengths using r8s 1.7 (Sanderson 2003). For the PLmethod the value of the smoothing parameter (10,000) wasestablished using cross validation. For both the PL and theLF method cross validation and the TN algorithm wereapplied. Constraints for the nodes were set as lower andupper boundaries based on values from the literature (seeTable 1). For each tree the calculations were iterated inorder to constrain four of the Wve nodes and calculate adivergence time for the remaining node. In order to calcu-late phylogenies for the gene families surrounding andincluding each of the ortholog 6-tuples, homologs weredetected using PSI-BLAST and the resulting hits wereWltered, clustered and aligned as previously described (Ric-hardt et al. 2007). Near identical sequences (containing upto 1% substitutions) were reduced to a single representativeand phylogenetic trees were calculated using a combinationof neighbor-joining (Saitou and Nei 1987) and ML(Schmidt et al. 2002) as previously described (Richardtet al. 2007).
Annotation and statistics
From the description lines of the ortholog 6-tuples a repre-sentative annotation was selected by majority rule, i.e., bybest BLAST hit consensus annotation. In cases where noclear result could be achieved (11 out of 93), manual anno-tation was carried out with HMM proWle searches usingHMMer (http://hmmer.wustl.edu/) and the above-men-tioned multiple global alignments as well as Interpro (Mul-der et al. 2003) database cross references. GO terms wereassigned to the sequences by performing InterPro searchesand parsing of the results using the bioperl module(Bio::Tools::IPrScan) as described (Lang et al. 2005). TheA. thaliana accessions were used to retrieve the GOA fromTAIR (http://www.arabidopsis.org/tools/bulk/go/index.jsp).The Kyoto Encyclopedia of Genes and Genomes (KEGG)pathways were assigned to the orthologs using KAAS(KEGG Automatic Annotation Server 1.10; http://www.genome.jp/kegg/kaas/). Searches were performed againstthe “representative set” with a bit score threshold of 60 andthe single-directional best-hit method (SBH). The resultingKO (KEGG Orthology) assignments were associated with
the orthologs based upon the term assigned to the Arabid-opsis sequence. In total, 68 (73%) of the orthologs could beassigned to a pathway. To check for signiWcant deviations,t-tests and Fisher’s exact tests were carried out. The result-ing Fisher’s exact tests P values were adjusted to controlfor multiple testing by calculating the false discovery rate(Benjamini and Hochberg 1995). Statistics were performedwith R 2.1.0 (http://www.r-project.org/). For the visualiza-tion of the taxonomic proWles, the NCBI taxonomy infor-mation for all clustered sequences was retrieved,normalized (column-wise log ratio) and subsequentlyunderwent average linkage clustering and heat map visuali-zation, as described previously (Richardt et al. 2007).
Acknowledgments We would like to thank Wolfgang R. Hess,Clemens Kreutz and Klaas Vandepoele for helpful discussions. Finan-cial support by the DFG (Re 837/10-1) is gratefully acknowledged.
References
Abascal F, Zardoya R, Posada D (2005) ProtTest: selection of best-Wtmodels of protein evolution. Bioinformatics 21:2104–2105
Alexeyenko A, Tamas I, Liu G, Sonnhammer EL (2006) Automaticclustering of orthologs and inparalogs shared by multiple proteo-mes. Bioinformatics 22:e9–e15
Altschul SF, Madden TL, SchaVer AA, Zhang J, Zhang Z, Miller W,Lipman DJ (1997) Gapped BLAST and PSI-BLAST: a new gen-eration of protein database search programs. Nucleic Acids Res25:3389–3402
Armbrust EV, Berges JA, Bowler C, Green BR, Martinez D, PutnamNH, Zhou S, Allen AE, Apt KE, Bechner M, Brzezinski MA,Chaal BK, Chiovitti A, Davis AK, Demarest MS, Detter JC,Glavina T, Goodstein D, Hadi MZ, Hellsten U, Hildebrand M,Jenkins BD, Jurka J, Kapitonov VV, Kroger N, Lau WW, Lane TW,Larimer FW, Lippmeier JC, Lucas S, Medina M, Montsant A,Obornik M, Parker MS, Palenik B, Pazour GJ, Richardson PM,Rynearson TA, Saito MA, Schwartz DC, Thamatrakoln K, Valen-tin K, Vardi A, Wilkerson FP, Rokhsar DS (2004) The genome ofthe diatom Thalassiosira pseudonana: ecology, evolution, andmetabolism. Science 306:79–86
Bell CD, Soltis DE, Soltis PS (2005) The age of the angiosperms: amolecular timescale without a clock. Evolution: Int J Org Evolution59:1245–1258
Benjamini Y, Hochberg Y (1995) Controlling the false discovery rate:a practical and powerful approach to multiple testing. J Royal StatSoc B 57:289–300
Birchler JA, Riddle NC, Auger DL, Veitia RA (2005) Dosage balancein gene regulation: biological implications. Trends Genet 21:219–226
Blair JE, Shah P, Hedges SB (2005) Evolutionary sequence analysis ofcomplete eukaryote genomes. BMC Bioinformatics 6:53
Blanc G, Wolfe KH (2004) Functional divergence of duplicated genesformed by polyploidy during Arabidopsis evolution. Plant Cell16:1679–1691
ButterWeld NJ (2001) Paleobiology of the late Mesoproterozoic (ca.1200 Ma) hunting formation, Somerset Island, Arctic Canada.Precam Res 111:235–256
Crane PR, Friis EM, Pedersen KR (1995) The origin and early diversi-Wcation of angiosperms. Nature 374:27–33
Crum HA (2001) Structural diversity of bryophytes. The University ofMichigan Herbarium, BloomWeld Hills
123
402 Mol Genet Genomics (2007) 278:393–402
De Bodt S, Maere S, Van de Peer Y (2005) Genome duplication andthe origin of angiosperms. Trends Ecol Evol 523:1–7
Do CB, Mahabhashyam MS, Brudno M, Batzoglou S (2005) Prob-Cons: probabilistic consistency-based multiple sequence align-ment. Genome Res 15:330–340
Dutilh BE, Huynen MA, Snel B (2006) A global deWnition of expres-sion context is conserved between orthologs, but does not corre-late with sequence conservation. BMC Genomics 7:10
Fares MA, Byrne KP, Wolfe KH (2006) Rate asymmetry after genomeduplication causes substantial long-branch attraction artifacts in thephylogeny of Saccharomyces species. Mol Biol Evol 23:245–253
Felsenstein J (1978) Cases in which parsimony and compatibilitymethods will be positively misleading. Syst Zool 27:401–410
Fitch WM (1970) Distinguishing homologous from analogous pro-teins. Syst Zool 19:99–113
Fitch WM (2000) Homology a personal view on some of the problems.Trends Genet 16:227–231
Gray MW, Burger G, Lang BF (2001) The origin and early evolutionof mitochondria. Genome Biol 2:REVIEWS1018
Gutierrez RA, Green PJ, Keegstra K, Ohlrogge JB (2004) PhylogeneticproWling of the Arabidopsis thaliana proteome: what proteins dis-tinguish plants from other organisms? Genome Biol 5:15
Hedges SB, Blair JE, Venturi ML, Shoe JL (2004) A molecular time-scale of eukaryote evolution and the rise of complex multicellularlife. BMC Evol Biol 4:2
Iseli C, Jongeneel CV, Bucher P (1999) ESTScan: a program fordetecting, evaluating, and reconstructing potential coding regionsin EST sequences. Int Conf Intell Syst Mol Biol, 138–148
Kenrick P, Crane PR (1997) The origin and early evolution of plantson land. Nature 389:33–39
Koonin EV, Fedorova ND, Jackson JD, Jacobs AR, Krylov DM,Makarova KS, Mazumder R, Mekhedov SL, Nikolskaya AN,Rao BS, Rogozin IB, Smirnov S, Sorokin AV, Sverdlov AV,Vasudevan S, Wolf YI, Yin JJ, Natale DA (2004) A comprehensiveevolutionary classiWcation of proteins encoded in completeeukaryotic genomes. Genome Biol 5:15
Lang D, Eisinger J, Reski R, Rensing SA (2005) Representation andhigh-quality annotation of the Physcomitrella patens transcrip-tome demonstrates a high proportion of proteins involved inmetabolism among mosses. Plant Biol 7:228–237
Lee Y, Sultana R, Pertea G, Cho J, Karamycheva S, Tsai J, Parvizi B,Cheung F, Antonescu V, White J, Holt I, Liang F, Quackenbush J(2002) Cross-referencing eukaryotic genomes: TIGR Ortholo-gous Gene Alignments (TOGA). Genome Res 12:493–502
Li L, Stoeckert CJ Jr, Roos DS (2003) OrthoMCL: identiWcation of or-tholog groups for eukaryotic genomes. Genome Res 13:2178–2189
Li WH, Yang J, Gu X (2005) Expression divergence between duplicategenes. Trends Genet 21:602–607
Martin W, Rujan T, Richly E, Hansen A, Cornelsen S, Lins T, LeisterD, Stoebe B, Hasegawa M, Penny D (2002) Evolutionary analysisof Arabidopsis, cyanobacterial, and chloroplast genomes revealsplastid phylogeny and thousands of cyanobacterial genes in thenucleus. Proc Natl Acad Sci USA 99:12246–12251
Mulder NJ, Apweiler R, Attwood TK, Bairoch A, Barrell D, BatemanA, Binns D, Biswas M, Bradley P, Bork P, Bucher P, Copley RR,Courcelle E, Das U, Durbin R, Falquet L, Fleischmann W,GriYths-Jones S, Haft D, Harte N, Hulo N, Kahn D, Kanapin A,Krestyaninova M, Lopez R, Letunic I, Lonsdale D, SilventoinenV, Orchard SE, Pagni M, Peyruc D, Ponting CP, Selengut JD,Servant F, Sigrist CJ, Vaughan R, Zdobnov EM (2003) The Inter-Pro Database, 2003 brings increased coverage and new features.Nucleic Acids Res 31:315–318
Mushegian AR, Garey JR, Martin J, Liu LX (1998) Large-scale taxo-nomic proWling of eukaryotic model organisms: a comparison oforthologous proteins encoded by the human, Xy, nematode, andyeast genomes. Genome Res 8:590–598
O’Brien KP, Remm M, Sonnhammer EL (2005) Inparanoid: a compre-hensive database of eukaryotic orthologs. Nucleic Acids Res 33:D476–D480
Raymond J, Zhaxybayeva O, Gogarten JP, Gerdes SY, BlankenshipRE (2002) Whole-genome analysis of photosynthetic prokary-otes. Science 298:1616–1620
Remm M, Storm CE, Sonnhammer EL (2001) Automatic clustering oforthologs and in-paralogs from pairwise species comparisons.J Mol Biol 314:1041–1052
Rensing SA, Fritzowsky D, Lang D, Reski R (2005) Protein encodinggenes in an ancient plant: analysis of codon usage, retained genesand splice sites in a moss, Physcomitrella patens. BMC Genomics6:43
Richardt S, Lang D, Frank W, Reski R, Rensing SA (2007) Plan-TAPDB: a phylogeny-based resource of plant transcriptionassociated proteins. Plant Physiol 143:1452–1466
Rost B (1999) Twilight zone of protein sequence alignments. ProteinEng 12:85–94
Saitou N, Nei M (1987) The neighbor-joining method: a new meth-od for reconstructing phylogenetic trees. Mol Biol Evol 4:406–425
Sanderson MJ (2003) r8s: inferring absolute rates of molecular evolu-tion and divergence times in the absence of a molecular clock.Bioinformatics 19:301–302
Schmidt HA, Strimmer K, Vingron M, von Haeseler A (2002) TREE-PUZZLE: maximum likelihood phylogenetic analysis using quar-tets and parallel computing. Bioinformatics 18:502–504
Shimodaira H, Hasegawa M (1999) Multiple comparisons of log-like-lihoods with applications to phylogenetic inference. Mol BiolEvol 16:1114–1116
Sonnhammer EL, Koonin EV (2002) Orthology, paralogy and pro-posed classiWcation for paralog subtypes. Trends Genet 18:619–620
Stajich JE, Block D, Boulez K, Brenner SE, Chervitz SA, DagdigianC, Fuellen G, Gilbert JG, Korf I, Lapp H, Lehvaslaiho H, MatsallaC, Mungall CJ, Osborne BI, Pocock MR, Schattner P, Senger M,Stein LD, Stupka E, Wilkinson MD, Birney E (2002) The Bioperltoolkit: Perl modules for the life sciences. Genome Res 12:1611–1618
Tatusov RL, Fedorova ND, Jackson JD, Jacobs AR, Kiryutin B,Koonin EV, Krylov DM, Mazumder R, Mekhedov SL, NikolskayaAN, Rao BS, Smirnov S, Sverdlov AV, Vasudevan S, Wolf YI,Yin JJ, Natale DA (2003) The COG database: an updated versionincludes eukaryotes. BMC Bioinformatics 4:41
Taylor TN, Kerp H, Hass H (2005) Life history biology of early landplants: deciphering the gametophyte phase. Proc Natl Acad SciUSA 102:5892–5897
Theissen G, Münster T, Henschel K (2001) Why don’t mosses Xower?New Phytol 150:1–8
Troitsky AV, Melekhovets Yu F, Rakhimova GM, Bobrova VK,Valiejo-Roman KM, Antonov AS (1991) Angiosperm origin andearly stages of seed plant evolution deduced from rRNA sequencecomparisons. J Mol Evol 32:253–261
Vandepoele K, Van de Peer Y (2005) Exploring the plant transcrip-tome through phylogenetic proWling. Plant Physiol 137:31–42
Whelan S, Goldman N (2001) A general empirical model of proteinevolution derived from multiple protein families using a maxi-mum-likelihood approach. Mol Biol Evol 18:691–699
Wolfe KH, Gouy M, Yang YW, Sharp PM, Li WH (1989) Date of themonocot-dicot divergence estimated from chloroplast DNA se-quence data. Proc Natl Acad Sci USA 86:6201–6205
Yang Z (1997) PAML: a program package for phylogenetic analysisby maximum likelihood. Comput Appl Biosci 13:555–556
Yoon HS, Hackett JD, Ciniglia C, Pinto G, Bhattacharya D (2004) Amolecular timeline for the origin of photosynthetic eukaryotes.Mol Biol Evol 21:809–818
123