Dating Late Glacial abrupt climate changes in the 14,570 yr long continuous varve record of Lake...
12
ELSEVIER Palaeogeography, Palaeoclimatology, Palaeoecology 122 (1996) 107-118 PAI 0 ....... CLIMAIOLOG~ Dating Late Glacial abrupt climate changes in the 14,570 yr long continuous varve record of Lake Van, Turkey Gtinter Landmann ", Andreas Reimer ", Gerry Lemcke b, Stephan Kempe c "Institute for Biogeochemistry and Marine Chemistry, Centre for Marine and Climate Research, University of Hamburg, Jungiusstr. 6, D-20355 Hamburg, Germany b EAWAG, Uberlandstr. 133, CH-8600 Dfibendorf Switzerland c Geological Paleontological Institute, T H Darmstadt, Schnittspahnstr. 9, D-64287 Darmstadt, Germany Received 17 october 1994; revised and accepted 19 October 1995 Abstract In summer 1990, during the third international expedition to Lake Van, eastern Anatolia, 10 sediment cores were retrieved from depths up to 446 m. As reported earlier, the sediments of the lake are finely laminated. The seven cores, recovered up to 30 km apart in the main lake basin, presented sediment sequences which correlate well with respect to ash layers and prominent colour changes, but also lamina for lamina. Here we report on the detailed evaluation of this record, which is varved continuously back to 14,570 yr B.P. (calendar years before 1950 AD). It is independent of 14C calibration, i.e. it is not a floating record, and it is the only detailed varve chronology known from the semi-arid Mediterranean region. Important Late Glacial events, such as the termination of the Oldest and Younger Dryas are clearly recorded in the sediments. Chronozones were defined on the basis of changes of the deposition rate and of chemical composition caused by environmental changes. Analysis of the annual deposition rates revealed abrupt changes within only a few years, declining for example by approximately 30% in the transition period between the Oldest Dryas and the Boiling. In most cases, alterations observed in the sedimentation rates are reflected in changes of the geochemical parameters, such as organic and inorganic carbon, opal, and the major elements Si, Ca, Mg, A1. Our results and palynological studies, performed on material recovered in an earlier expedition, are used to reconstruct palaeoenviromental conditions. In this study, the termination of the Younger Dryas is dated to 10,920__ 132 yr B.P. This is younger than the recently published Greenland ice core dates but in accordance with, for example, the central European dendrochronol- ogy. We suspect, that higher sediment deposition rates during the cold periods are due to rapid melting and intense wash out of soil, which was fairly loose because of sparse vegetation. This would lead to higher river discharges. Based on the observed increase of the deposition rate in the record, melting of glaciers can only be detected after the termination of the Younger Dryas. 1. Introduction Lake Van, by volume (576km 3) the fourth largest terminal lake and the largest soda lake on Earth, is located in the highlands of eastern Anatolia (Fig. 1). The surface area amounts to 0031-0182/96/$15.00 © 1996 Elsevier Science B.V. All rights reserved SSDI0031-0182(95)00101-8 3522 km 2, its maximum depth reaches 460 m. Today the lake level stands at 1648 m above sea level. The climate of the region is continental, with hot, dry summers and long, cold winters. Mean annual temperature at Van is around 8.8°C. Highest precipitation in the catchment area of
-
Upload
uni-goettingen -
Category
Documents
-
view
2 -
download
0
Transcript of Dating Late Glacial abrupt climate changes in the 14,570 yr long continuous varve record of Lake...

E L S E V I E R Palaeogeography, Palaeoclimatology, Palaeoecology 122 (1996) 107-118
PAI 0 . . . . . . .
CLIMAIOLOG~
Dating Late Glacial abrupt climate changes in the 14,570 yr long continuous varve record of Lake Van, Turkey
Gtinter Landmann ", Andreas Reimer ", Gerry Lemcke b, Stephan Kempe c
"Institute for Biogeochemistry and Marine Chemistry, Centre for Marine and Climate Research, University of Hamburg, Jungiusstr. 6, D-20355 Hamburg, Germany
b EAWAG, Uberlandstr. 133, CH-8600 Dfibendorf Switzerland c Geological Paleontological Institute, TH Darmstadt, Schnittspahnstr. 9, D-64287 Darmstadt, Germany
Received 17 october 1994; revised and accepted 19 October 1995
Abstract
In summer 1990, during the third international expedition to Lake Van, eastern Anatolia, 10 sediment cores were retrieved from depths up to 446 m. As reported earlier, the sediments of the lake are finely laminated. The seven cores, recovered up to 30 km apart in the main lake basin, presented sediment sequences which correlate well with respect to ash layers and prominent colour changes, but also lamina for lamina. Here we report on the detailed evaluation of this record, which is varved continuously back to 14,570 yr B.P. (calendar years before 1950 AD). It is independent of 14C calibration, i.e. it is not a floating record, and it is the only detailed varve chronology known from the semi-arid Mediterranean region. Important Late Glacial events, such as the termination of the Oldest and Younger Dryas are clearly recorded in the sediments. Chronozones were defined on the basis of changes of the deposition rate and of chemical composition caused by environmental changes. Analysis of the annual deposition rates revealed abrupt changes within only a few years, declining for example by approximately 30% in the transition period between the Oldest Dryas and the Boiling. In most cases, alterations observed in the sedimentation rates are reflected in changes of the geochemical parameters, such as organic and inorganic carbon, opal, and the major elements Si, Ca, Mg, A1. Our results and palynological studies, performed on material recovered in an earlier expedition, are used to reconstruct palaeoenviromental conditions.
In this study, the termination of the Younger Dryas is dated to 10,920__ 132 yr B.P. This is younger than the recently published Greenland ice core dates but in accordance with, for example, the central European dendrochronol- ogy. We suspect, that higher sediment deposition rates during the cold periods are due to rapid melting and intense wash out of soil, which was fairly loose because of sparse vegetation. This would lead to higher river discharges. Based on the observed increase of the deposition rate in the record, melting of glaciers can only be detected after the termination of the Younger Dryas.
1. Introduction
Lake Van, by vo lume ( 5 7 6 k m 3) the four th largest t e rmina l lake and the largest soda lake on Ear th , is loca ted in the h ighlands o f eas tern A n a t o l i a (F ig . 1). The surface a rea amoun t s to
0031-0182/96/$15.00 © 1996 Elsevier Science B.V. All rights reserved SSDI0031-0182(95)00101-8
3522 k m 2, its m a x i m u m dep th reaches 460 m. T o d a y the lake level s tands at 1648 m above sea level. The c l imate o f the region is cont inenta l , with hot , d ry summers and long, cold winters. M e a n annua l t empe ra tu r e at Van is a r o u n d 8.8°C. Highes t p rec ip i t a t ion in the ca t chmen t a rea o f
1 0 8 G. Landmann et al./Palaeogeography, Palaeoclimatology, Palaeoecology 122 (1996) 10~118
A o c o v a z o
43"
3O
I km
39-i
38"
Fig. 1. Location of Lake Van. Circles show position of the cores from the main basin.
approximately 16,000 km 2, occurs between March and May, and between October and December. The annual precipitation rate, highly variable according to the exact location, averages between 400 and 700 mm (Schweizer, 1975). Main input of lithogenic material into Lake Van occurs from April to June during spring rain and snow melt. The lake water is highly alkaline (153 meq 1-1), the pH reaching 9.8. Salinity is at 22 parts per thousand, and calcium concentration (4 mg 1-1) is very low (Kempe et al., 1991). Because of the extreme chemical composition of the water, the lake shows low biodiversity (Gessner, 1957; Danulat and Selguk 1992). The water is highly supersaturated regarding all alkaline earth carbon- ate minerals. Calcite and aragonite precipitate at sites of calcium inputs, extensive whitings being observed at river mouths. In shallow water, at sublacustrine ground water springs and seeps, large columns of up to 40 m height have been discovered. The latter are composed of inorganically precipi- tated calcitic tufa and aragonitic crusts, induced by coccoidal cyanobacteria ("microbialites"; Kempe et al., 1991).
In 1974, the first sediment cores were recovered from the lake (Kempe, 1977; Kempe and Degens, 1978, 1979). They revealed that the sediments were laminated throughout. The subsequent varve count
yielded more than 10,000 light and dark couplets, interpreted to represent annual sedimentation events (Kempe, 1977).
In summer 1990, during the third international expedition, hydrochemical, geochemical, geologi- cal and biological investigations of Lake Van were continued. The aim of the present study was to obtain a precise count and a record of year to year couplet thickness from cores retrieved from the main basin of the lake. Here the detailed chronol- ogy, that forms the basis for future analysis, is discussed in the context of palaeoenviromental conditions.
2. Methods
In June 1990, a total of ten piston cores reaching up to 10 m length were retrieved from Lake Van, seven of which were located in the deep western basin (Fig. 1). The core that penetrated the oldest layers was selected for preparation ("K10"; length: 855 cm; diameter: 58 mm). The geographical posi- tion of the sampling site was 38 ° 32.4' N, 42 ° 48.0' E, the water depth reached 420 m. Since the piston of the corer disturbs the upper sediment layers, short gravity cores ("pilot cores") were taken simultaneously with the piston cores. Comparison

G. Landmann et al./Palaeogeography, Palaeoclirnatology, Palaeoecology 122 (1996) 107-118 109
of the various pilot cores showed that they recover the sediment surface undisturbed. Therefore the upper 60 cm of the sediment record were taken from the pilot core. A total of 188 subsamples were taken down-core, each approximately 5-7 cm in length, including a 1.5 cm overlap with the next subsample. The subsamples were hardened with epoxy resin and thin-sections and polished plates were prepared. To allow a detailed evaluation of the core, the polished plates were scanned with a camera at a resolution of 600 data points per inch. The images were processed using image analysing programs (Cirrus, version 1.5; Image, version 1.41). Counting of the varves and determination of annual sediment accumulation rates was carried out in four steps.
- -Firs t , several (4-8) light absorption curves were extracted in parallel from the image, perpen- dicular to the lamination. These curves were averaged, smoothed, and the minima (light lami- nae) were detected by a statistical program adjusted to the task. In about 90% of the cases this step identified the position of varves correctly.
- -Next , the positions of the varves in the profile were marked manually on a 19 monitor with an image magnification of 10-20 fold and a strong enhancement of contrast. Repeated marking of the same section yielded a standard deviation of + 1.2%. The exact position of the overlap between consecutive subsections was determined by com- paring the overlap on the monitor.
--Subsequently, the automatically and man- ually marked light absorption curves were plotted (magnification 8 fold) and compared with each other. Sections for which the interpretation of the two curves differed were then checked visually by inspection of the polished plates and thin-sections under a microscope. We estimate that this time- consuming procedure at least doubled the precision of the counting.
--Final ly, the marked absorption curves were concatenated for entire core segments and the original core depth of the subsections was intro- duced as y-axis, excluding turbidites and ash layers. Due to poor preparation and to the cutting of the core for transport we lost a total of 460 mm of
record. This loss consists of fourteen small (3-21 ram) and two larger (98 and 151 mm) gaps (Fig. 2A). However, the varve count of the last two gaps could be made on enlarged photographs (85 and 299 years). For the smaller gaps, caused by the core cutting, years were inserted according to both the width of the gap and the varve thickness, measured above and below the gap (a total of about 266 years). In total, 758 years were inserted with the respective varve thickness into the concatenated record, closing the gaps and linking all of the core segments. The added thickness of all turbidites and ash layers occur- ring in the core amounted to 652 ram. Detailed comparison with neighbouring cores showed that the turbidites do not cause loss of varves and can therefore simply be removed from the record.
Since the detectability of the varves varies down- core, it is difficult to estimate the accuracy of the varve counting process (Fig. 2A). Taking into account all error sources, and using the results of duplicated, independent counts, we estimate that the counting error was less than _+ 0.6%. This error compares favourably with similar records. For example, in Lake Holzmaar, counting errors range from 5.9 to 0.7% in different sections of the profile (Zolitschka et al., 1992). With an estimated stan- dard deviation of + 14% at the gaps, the error rises with increasing depth, reaching + 1.4% at 805 cm. In the core section between 805-822 cm, where lamination becomes increasingly vague, we assume that the standard deviation amounts + 10%.
In order to compute the annual sediment depos- ition rate (SDR, in kg m -z yr -1) from the mea- sured accumulation rate (Fig. 3B), the water content of sediments must be taken into account. Water content was measured on 72 samples down- core K10 (Fig. 3A) and on about 300 samples of the other cores which offered the possibility to cross-check the validity of the K10 results. To fit the measurements we used ten different linear (referring to core depth) functions (Fig. 3A). These data and an average dry sediment density of 2.4 g cm-3 (mean of 29 samples taken from other cores at various depths) were used to compute the final
110 G. Landmann et al. / Palaeogeography, Palaeoclimatology, Palaeoecology 122 (1996) 107 118
DEPTH
0 n
(m)
2
3
4
5
6 -
7
8
UNIT/DESCRIPTION
® 1 brown valved clay
2 dark brown varved clay
3a brown valved clay 2.2-2.7m: valves indistinct
b grey varved clay 3.2-3.7m: vames indistinct
3c greenish grey varved clay
3d brownish grey valved clay
4a light grey varved clay
4b grey varved clay
5 light brown varved clay
grey valved clay 6 valves less distinct
depth
top: sandy layer, 7 dark grey clay
GAPS AGE
I (yr B P )
602
1070
1960
2607
2820 =
3600
_ 4530
5160
- 6110
- 6 8 8 8
- 7192
I 8240
10060
10590
11730
12040
13260
~14570
KIO
~ T T T '~' ,~ ~ ~--~:+:-:+ ~ ~- =~ neme ~
'-= ::it:i?
6 '.I - -
'21 m
....... !-----
Corg medium to high Carbonate high
Corg medium to high Carbonate low
Corg low ~ ne valves Carbonate low lapilli
Corg low A - M Ashlayers Carbonate high T Turbictites

G. Landmann et al./Palaeogeography, Palaeoclimatology, Palaeoecology 122 (1996) 107-118 111
13. 60
>
o ) <
Accumulation (mm yr 1 ) SDR Lithogenics (wt %) CH20 (wt %)
Water cont.(wt%) 0,5 1,0 1,5 (kgm "2yr 4) 30 45 60 Opal(wt%) 5 10 15
6 0 7 0 8 0 ~ ~ ~ 0 ,1 0 , 3 0 , 5 ~ ~ ~ 1 2 2 2 3 2 t ~ 0
CaCO 3 (wt %)
2 4 3 6 4 8
10 ~
11
12
13
1 4
08 o i . . . . . . . . . . ~ . . . . . . . . . . . . . ! -
. . . . .
15 . . . . . . . . . . . . . . . . . . . . . . . . . . . . . :
A B C D E F G
Fig. 3. Lake Van sediment stratigraphy (core K10). Dotted vertical lines represent mean values. Time resolution of chemical parameters is approximately 30 yr. A. Measurements of water content of sediments versus varve years (circles). To calculate the sediment deposition rate for every individual year, linear regressions of water content versus core depth were calculated for ten subsections, plotting these regressions versus age gives them a non-linear appearance. B, C. Sediment accumulation (ram yr -1) and sediment deposition rate (SDR; kg m -2 y r - l ) . Curves were smoothed reducing the data by taking an average of five values and then by applying a running mean over eleven values. D - G . Results of geochemical sediment analysis. Lithogenics were calculated as 100% minus the sum of biogenic opal (SiO2), organic carbon (calculated as CH20), and inorganic carbon (calculated as CaCO~). Note that the chemical data extend farther back in time than the varve record; SDR of the lower section of the core was estimated according to the SDR in the lowest laminated section. Data concerning ash layers were removed from the record.
SDR which is plotted versus varve years in Figs. 3C and 4. Density fluctuations of the sediment along the profile, lead to relatively small deviations of the SDR results: for example, considering an increase of dry density by 10% in sediments with
80, 70 or 60% water content, this would result in increases of the SDR values by 0.9, 1.4 and 2%, respectively. Overall, the SDR amounted to 0.178_+0.1 kg m -2 yr -1, with an average accumu- lation rate of 0.5 mm yr -~.
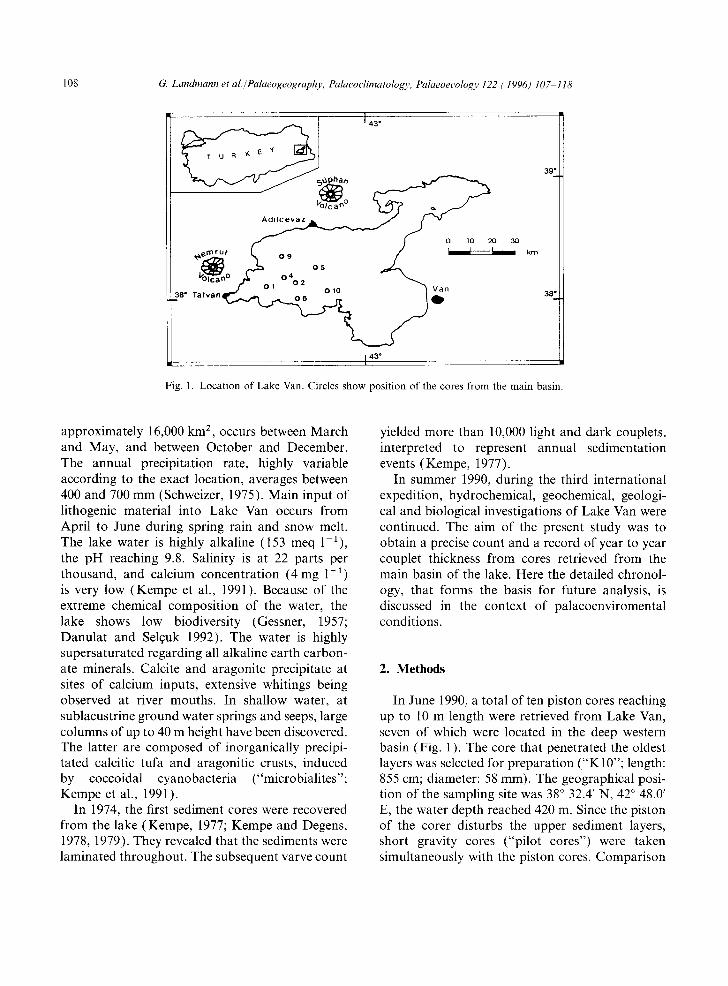
Fig. 2. A. Description of lithology and varve quality of core K10, Lake Van. Colour description of the sediment was made 3-5 hours after opening the core. ML gives the position of the Marker Layer. B. Modified pollen profile from Lake Van made by Van Zeist (1978a). Reliable stratigraphic correlation is possible only at the ashlayers because samples were taken from two different cores. Vertical distance between the samples is 10 cm. In most samples more than 1000 pollen grains and spores were counted.
112 G. Landmann et al./Palaeogeography, Palaeoclimatology, Palaeoecology 122 (1996) 107 118
"T ~, 0,6
E 0,4
n,, o 0,2 CO
10,6 10,7 10,8 10,9 11,0 11,1 11,2 11,3
',- 0,6
E 0,4
v
0,2 CO
13,3 13,4 13,5 13,6 13,7 13,8 13,9 14,0 Age (varve kyr BP)
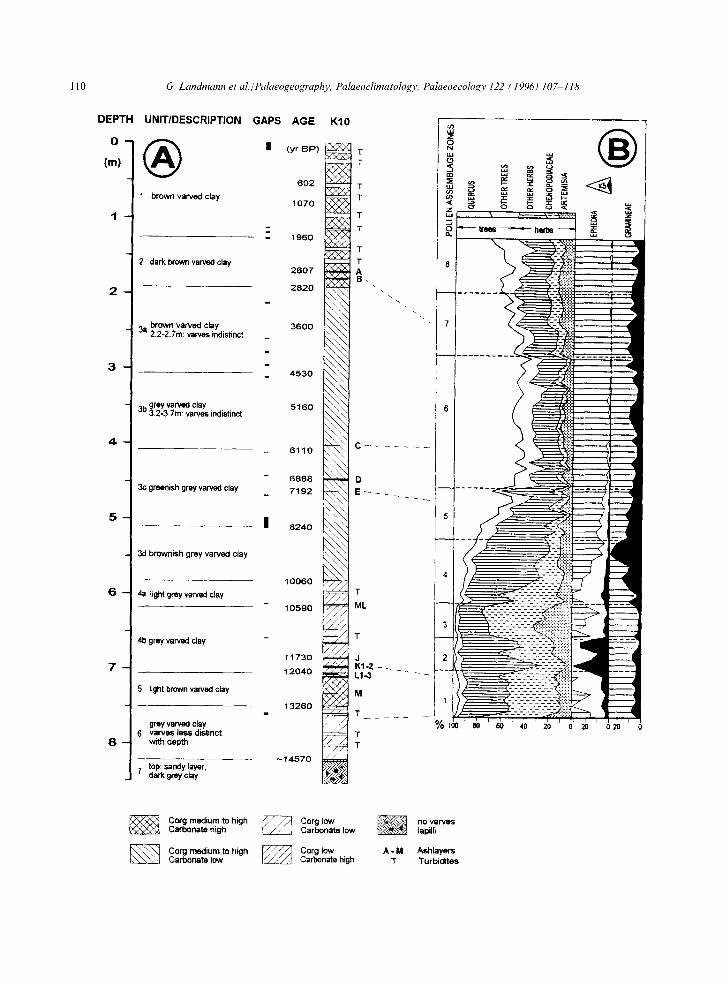
Fig. 4. A, B. High resolution (individual years) sediment deposition rates (SDR) of Lake Van (core K10) versus varve years. Horizontal lines represent mean SDR values of the periods 14,230-13,910 yr B.P., 10,920--.10,550 yr B.P., or of entire chronozones.
3. Chronology
All cores revealed sediment sequences which can easily be correlated by means of ash layers and prominent colour changes (Fig. 2A), but also lamina for lamina. The lightly coloured laminae of the couplets are dominated by authigenic car- bonates. Scanning electron microscope investiga- tions on material caught with sediment traps in the lake showed that in summer and fall micri- tic carbonate is produced in the evaporative sur- face layer (G. Landmann, unpublished results). Aragonite/calcite ratios, determined by X-ray defraction analysis, scatter between 2 and 9 in sediments younger than 3700 yr B.P., and from 1 to 4 in older sediments. The darker laminae of the couplets are characterised by higher amounts of organic material and lithogenic components.
At 14,570_+ 234 varve years B.P., corresponding to a core depth of 822 cm and above a sandy layer, noticeable annual sediment cycles start to develop in Lake Van. Even though the contrast between
light and dark laminae is too weak to detect every individual varve in the first 340 years, the light absorption curves allow to estimate that the accu- mulation rate was about 0 .5ram yr ~. From 14,230 _+ 200 yr B.P. onward, counting was possible continuously.
In the lower section of the core (14,230 13,910 yr B.P.), SDR ranges from 0.2 to 0.6 kg m 2 yr 1 and shows strong oscillations with a periodicity between 10 and 40 years (Fig. 4B). Rapid decreases of SDR are noticed at 13,910 and 13,380 yr B.P., while the magnitude of decadal SDR oscillations decreases and the colour of the sediment turns from grey to light brown at 13,260 yr B.P.
At 12,040 yr B.P., the colour changes back to grey. In the subsequent 200 years, the SDR shows two rapid increases, followed by a gradual decrease ("saw-tooth pattern"). Sediment colour changes back to brown at times of low SDR. A third strong increase at 11,840 yr B.P. initiates a period of elevated SDR (Fig. 3C). Before the end of this period, the SDR describes a pronounced asymmet-
G. Landmann et aL/Palaeogeography, Palaeoclimatology, Palaeoecology 122 (1996) 10~118 113
rical saw-tooth shaped excursion lasting from 11,000 to 10,920 yr B.P. (Fig. 4A).
At 10,920 yr B.P., the SDR increases rapidly once more, i.e. by approximately 40% within only five years (Fig. 4A). The following period shows very high decadal SDR oscillations and deposition rates reach an absolute maximum at 10,500 yr B.P. (0.8 kg m -2 yr-1) . During the next 300 years, the SDR falls gradually to values between 0.1 and 0.2 kg m -2 yr -1 and stays low throughout most of the Holocene record. Periods of higher SDR occur between 5100 and 4800, and 3000 and 2500 yr B.P., respectively (Fig. 3C). Several decadal oscillations of the accumulation rate in the last 2500 years of the record are caused by layers of dark, organic and water-rich sediments. Consideration of the water content of specific layers, as done for the peak around 1100 yr B.P. shown in Fig. 3A, results in smoothing of the SDR record.
It is now generally accepted that the Late Pleistocene transition from the Last Glacial Maximum (LGM: 18,000 yr B.P., corresponding to ~21,500 calendar yr B.P.; Bard et al., 1992) to the Holocene, involved a series of rapid climatic changes. This transition has been documented in detail in the Greenland ice cores. Recently, electri- cal conductivity profiles, oxygen isotope records, and annual layer counts have been published for the GISP 2 and G R I P ice cores (Johnsen et al., 1992; Alley et al., 1993; Dansgaard et al., 1993; Grootes et al., 1993; Taylor et al., 1993a,b).
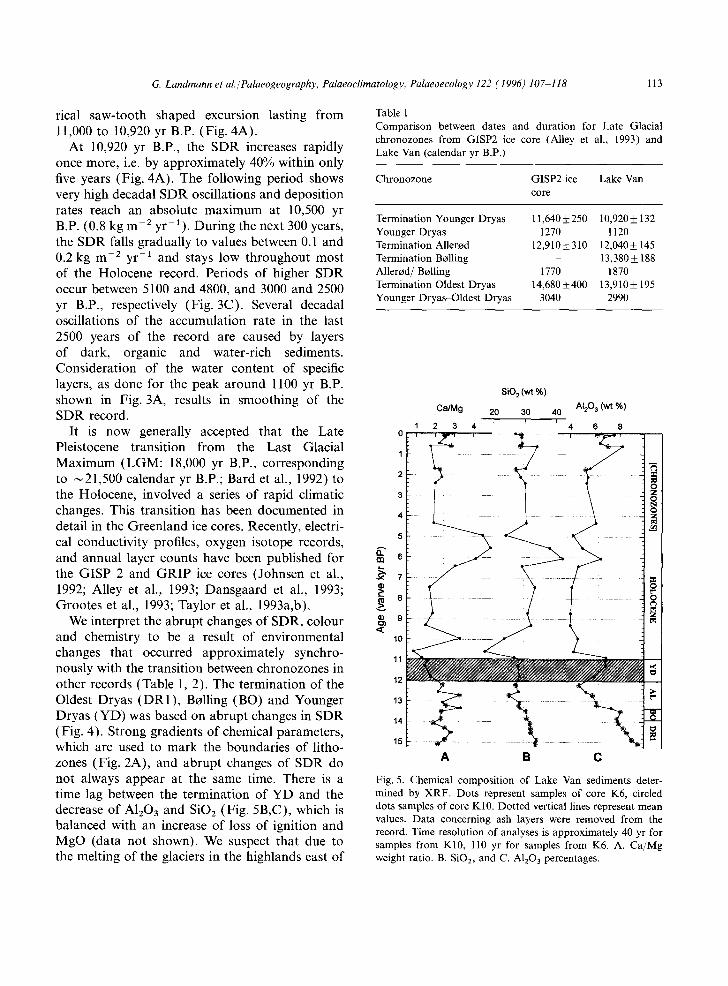
We interpret the abrupt changes of SDR, colour and chemistry to be a result of environmental changes that occurred approximately synchro- nously with the transition between chronozones in other records (Table 1, 2). The termination of the Oldest Dryas (DR1) , Bolling (BO) and Younger Dryas (YD) was based on abrupt changes in SDR (Fig. 4). Strong gradients of chemical parameters, which are used to mark the boundaries of litho- zones (Fig. 2A), and abrupt changes of SDR do not always appear at the same time. There is a time lag between the termination of Y D and the decrease of A120 3 and SiO2 (Fig. 5B,C), which is balanced with an increase of loss of ignition and MgO (data not shown). We suspect that due to the melting of the glaciers in the highlands east of
Table 1 Comparison between dates and duration for Late Glacial chronozones from GISP2 ice core (Alley et al., 1993) and Lake Van (calendar yr B.P.)
Chronozone GISP2 ice Lake Van core
Termination Younger Dryas 11,640 + 250 10,920 ___ 132 Younger Dryas 1270 1120 Termination Allerod 12,910+310 12,040+ 145 Termination Boiling - 13,380 _ 188 Allerod/Boiling 1770 1870 Termination Oldest Dryas 14,680+400 13,910+ 195 Younger Dryas~Oldest Dryas 3040 2990
SiO 2 (wt %)
Ca/Mg 20 30 40 AI203 (wt %)
1 2 3 4 4 6 8
2
°'! i
12
14
15
A B C
Fig. 5. Chemical composition of Lake Van sediments deter- mined by XRF. Dots represent samples of core K6, circled dots samples of core K10. Dotted vertical lines represent mean values. Data concerning ash layers were removed from the record. Time resolution of analyses is approximately 40 yr for samples from K10, 110 yr for samples from K6. A. Ca/Mg weight ratio. B. SiOz, and C. AlzO 3 percentages.
114 G. Landmann et al./Palaeogeography, Palaeoclimatology, Palueoecology 122 (1996) 107-118
Lake Van, the upper cretaceous dolomitic bedrocks were exposed and eroded. The SDR maximum appears 400 yr after termination of the YD (10,500 yr B.P.). This could be due to the melting of the glaciers having reached a climax or due to the high sediment content of the melted ice. The end of the Allerod (AI) is defined by a prominent colour change in the sediment of Lake Van, optical indica- tion for a simultaneously appearing change of chemistry. Taking the main SDR change as crite- rion instead would extend this period by 200 years.
The dates for the termination of the Late Pleistocene chronozones and their duration are compared with the results of the GISP2 ice core in Table 1. In the two records, the duration of Late Pleistocene chronozones agrees better than the absolute dates. Specifically, the duration between the end of the Oldest Dryas and the end of the Younger Dryas, i.e. between the termina- tions of the two Late Pleistocene cold ages, agrees within 50 years (1.6%). The absolute dates for the Late Pleistocene chronozone terminations are about 720-770 years younger in the Lake Van record than in the GISP 2 ice core. Surprisingly, in a recent publication (Kapsner et al., 1995) concerning the same ice core, the termination of the YD was placed at ~ 11,460 yr B.P., while the transition DR1 to BO was dated to ~14,980 yr B.P.
However, the Van dates agree well with other dates, specifically with the Central European den- drochronology (Kromer and Becker, 1992), which places the end of the YD and the beginning of the Holocene at around 11,000 yr B.P. (Table 2). Also
good correlations exist both with the date of the termination and the duration of the YD in the floating sediment record of Lake Soppen (Hajdas- Skowronek, 1993). Here, the boundaries of YD based on palynological studies, was placed at 12,125_+86 and 10,986+69 yr B.P.
Due to indistinct lamination, the standard devia- tion for multiple varve counts on the continous depositional record of Lake Holzmaar for the periods from 0 to 2300 and 10,600 to 12,881 was 4% and 5.9%, respectively. The main part of the core was counted with a standard deviation of 0.7% (Zolitschka et al., 1992). Boundaries between chronozones were set, based on lithological, palaeomagnetical and palynological studies. The duration of YD in the record is given with only 450 yr.
Uncertainties in the varve record of Lake Gosciaz, caused by indistinct and disturbed lamin- ations, exist in the uppermost sediment column. Error estimates of the varve counting results in 2,~nn + 500 ~"" 200 for this period. The major problem in the precise determination of the duration of YD from 180 data is caused by a sandy layer occurring in this chronozone (Rozanski et al., 1992). After comparison with another core, which does not contain this disturbed layer, the authors state preliminarily that the length of this period is >~ 1200 yr.
4. Palaeoenvironment
The new dates for the Lake Van sediment record allow to re-interpret the pollen profile (Fig. 2B)
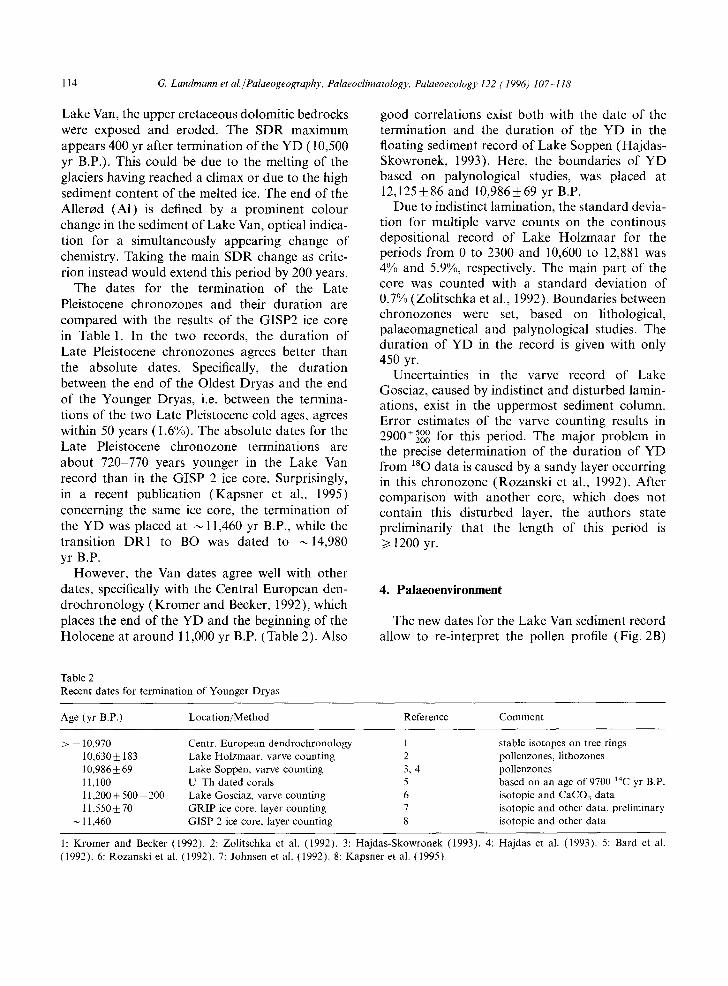
Table 2 Recent dates for termination of Younger Dryas
Age (yr B . P . ) Location/Method Reference Comment
> = 10,970 10,630+ 183 I 0,986 + 69 ll,100 11,200 + 500 - 200 11,550 __+ 70 11,460
Centr. European dendrochronology 1 Lake Holzmaar, varve counting 2 Lake Soppen, varve counting 3, 4 U-Th dated corals 5 Lake Gosciaz, varve counting 6 GRIP ice core, layer counting 7 GISP 2 ice core, layer counting 8
stable isotopes on tree rings pollenzones, lithozones pollenzones based on an age of 9700 14C yr B.P. isotopic and CaCO 3 data isotopic and other data, preliminary isotopic and other data
1: Kromer and Becker (1992). 2: Zolitschka et al. (1992). 3: Hajdas-Skowronek (1993). 4: Hajdas et al. (1993). 5: Bard et al. (1992). 6: Rozanski et al. (1992). 7: Johnsen et al. (1992). 8: Kapsner et al. (1995).
G. Landmann et al. / Palaeogeography, Palaeoc limatology, Palaeoecology 122 (1996) 10 ~118 115
obtained from the cores recovered in 1974 (Van Zeist and Woldring, 1978a,b). They now compare well with the pollen profile of Lake Zeribar, 450 km to the SE of Lake Van (Van Zeist and Woldring, 1978b). This information, together with geochemi- cal analyses (distribution of CaCO3, organic carbon, opal, and major elements as determined by XRF) of the Lake Van sediments (Figs. 3D-G, 5A-C), allows to discuss the sequence of events determining the regional history of the Anatolian Highland during the Late Pleistocene.
Both cold periods (DR1 and YD) are charac- terized by a similarly high SDR. During the trans- ition to the warmer AL and Bolling (BO) the contribution of lithogenics drops sharply while CaCO3 increases step-like in importance. This can be interpreted as the increasing importance of chemical weathering under warmer conditions and reduced dust input into the lake because of an expansion of the vegetation cover. The oldest pollen sample analysed, redated to approximately 13,600 yr B.P., shows that the climate during the BO and the late AL was arid or semiarid (90% herbs, including 40% Chenopodiaceae and 10% Artemisia, and 10% trees). The oxidised core sec- tion, representing the AL, is coloured light brown, possibly indicating the deposition of higher con- centrations of easily oxidisable iron compounds during the warm than during the cold periods. Also the concentration of the organic matter rises sharply 120 years (13,260 yr B.P.) after the onset of the AL (Fig. 3F). Both observations can be interpreted as being caused by the onset of stagna- tion of the lake under a warmer surface layer and the establishment of anoxic conditions in the deeper water column. These tend to preserve the organic carbon better and would form more labile iron sulphides than in a well mixed water column.
The transition from the AL to the YD is marked by a local SDR minimum (Fig. 3C), pronounced shifts in the CaCO3 and lithogenic composition, decreases of both organic matter and opal, and a colour change. During the YD, the CaCO3 contri- bution remains relatively high, but Ca/Mg ratio changes show that larger parts are composed of dolomite, i.e. contributed by eroded and not by authigenic carbonates (Fig. 5A). The pollen record of the YD shows a decrease in trees, an increase
in Ephedra and in pollen transported over greater distances, indicative of drier conditions and a general decline in vegetation (Van Zeist and Woldring, 1978b). This seems to be inconsistent with the higher SDR during this period which should infer higher runoff. However, such apparent contradictions are known from other palaeocli- mate records of the Mediterranean region for the millennia around the LGM. For Lake Ioannina, a type locality for the northern Mediterranean region (39 ° 40'N, 20 ° 53'E, 469 m above sea level), it was shown that pollen evidence for semi-arid condi- tions and geomorphological evidence for high lake levels are compatible with a summer-dry, winter- wet regime and a reduction of seasonal temper- ature by 3-6°C (Prentice et al., 1992). At Lake Van, which is surrounded by terraces 70 m above its present level, similar conditions must have prevailed during the LGM. These terraces have now been dated by 14C to 17,470 _+ 220 yr B.P. and have in fact formed during the LGM. Because the YD is a cold period, winter precipitation and spring thaw may therefore have coincided with a dry summer climate and a declining vegetation cover.
At the end of the YD the SDR rises sharply. Apparently, the rapid increase in temperature, ~7°C within 50 years over the ice sheet of Greenland (Dansgaard et al., 1989) and ~4-5°C in south-western France (Pons et al., 1987) at the end of the YD caused, in contrast to the situation at the end of the DR1, massive melting of the glaciers in the surrounding mountains liberating large amounts of sediments. Low Ca/Mg ratios (Fig. 5A) reveal that much of the carbonate is composed of eroded dolomite.
At around 10,500 yr B.P. a conspicuous layer, consisting of 7-10 dark brown, thick varves ("Marker Layer", Fig. 2A), was deposited in Lake Van. Biomarker analyses of this organic carbon rich layer (Corg 4.48 wt %) showed, that the lipid fraction consist mainly of longchain alkenones (Thiel, 1993). The author concludes that Pry- mnesiophyceae were the primary producers and suggests that a mixing event, following a long time of stagnation, led to the enrichment of nutrients in the lake water. The deposition of this layer starts a period with very high SDR, lasting 200 yr,

116 G. Landmann et al./Palaeogeography, Palaeoclimatology, Palaeoecology 122 (1996) 107 118
followed by a sharp decline of sediment input into the lake over the next 200 yr. Around 10,100 yr B.P., the glaciers must have vanished completely.
Throughout the Holocene, SDR remained at around 0.15 kg m - 2 y r - 1. The significant increase at around 5100 yr B.P. occurred in a period (6200-4000 yr B.P.) characterised by an increased preservation of opal in the sediments (Fig. 3E). During this period the maximum of the Holocene tree pollen value is reached and lake sediments show a high percentage of organic matter preserva- tion. Apparently, this is the time of the Holocene climatic optimum with a climate possibly warmer and wetter than today. Also, indications for a transition from arid to humid conditions was found in sediments from Tigalmamine (Middle Atlas) and Sebkha Mellala (northern Sahara) for the period from 7200 to 4800 yr B.P. (Gasse and Fontes, 1992). Organic carbon content in sedi- ments of Lake Schalkenmehrener Maar (Germany) reach maximum values (up to 28 wt %) in the time between 6000-5100 yr B.P. (Rein and Negendank, 1993). Gasse et al. (1991) have noticed maxima in organic matter and diatom distribution for Lake Sumxi (Tibet) for the period from 7900 to 5500 yr B.P.
At 3000 yr B.P. another significant increase of SDR is observed, probably caused by the advance- ment of new agricultural techniques and changes in settlement and land use associated with the beginning of the iron age in this region. Quercus pollen percentages decrease but values for other trees (Fig. 2B), such as Pinus and the widely planted Juglans (walnut) increase (Van Zeist and Woldering, 1978b).
5. Discussion
Today, precipitation in the area around Lake Van is mainly determined by barometric depres- sions that originate in the Mediterranean Sea around Cyprus in autumn and spring, or in central Anatolia in spring, and move East to the Caspian Sea (Schweizer, 1975). Mean monthly air temper- atures, measured at the meteorological station in Van (1661 m above sea level), are below 0°C from December to February. However, these are not
extreme values because the station is close to the lake. Regarding the vegetation period, it is impor- tant that ground temperatures below 0°C are only absent between May and September (DWD, 1990). Considering that air temperatures were about 5°C lower during the cold periods, the vegetation period would have lasted only two to three months under these conditions, coinciding with the driest period of the year. Taking into account that about half of the catchment area is located higher than 2000 m above sea level, virtu- ally all of the precipitation would have fallen as snow due to the lower temperature. The drainage of the area would have been reduced mainly to a short melting season, leading to an intense wash out of soil which was fairly loose because of sparse vegetation. The present morphology of the river beds, which are wide and show pronounced slopes, indicates that this was indeed the case. Such meteorological conditions and an increase of dust input into the lake because of a reduced vegetation cover would explain the higher SDR-values during the cold periods and is in accordance with the palynogical results.
To explain the rise of SDR by an increase of precipitation presents the following problem: the level of a terminal lake is determined by the balance between evaporation from- and precipita- tion on the lake surface and surface run off. Today the seasonal amplitude of the lake level amounts to about 70 cm. Assuming that the doubling of SDR is caused by an increase of the precipitation rate by 20% with a present day evaporation rate and a run off coefficient (a lower evaporation rate would be expected during cold periods), an increase of lake level of approximately 100 m would be expected (Kempe, 1977). Today an overflow of the lake would occur at ~ 1750 m above sea level. We did not find morphological indicators for such an event. Further studies on other climate related parameters of the Lake Van sediment cores will give more detailed information about the degree of climate changes in this region.
Acknowledgements
We gratefully acknowledge co-operation of the late T. Konuk, M. Duman, D. Yasar, N. Somali,
G. Landmann et al./Palaeogeography, Palaeoclimatology, Palaeoecology 122 (1996) 107-118 117
D. I m b o d e n , J. Wues t , M. Schur t e r , M. H o f e r a n d
J. T h u r o w . W e also t h a n k A. L i p p a n d U . S v e n s s o n
fo r he lp in the field a n d S. B e c k m a n n fo r ana ly t i ca l
w o r k . T h a n k s a re a lso due to F. Gasse , S. B o t t e m a ,
F. S u r l y k a n d E. D a n u l a t fo r he lp fu l c o m m e n t s .
T h i s p ro j ec t was f u n d e d by the G e r m a n R e s e a r c h
C o u n c i l , by the V o l k s w a g e n s t i f t u n g , a n d by an
E A W A G L a n d F r e s e a r c h gran t .
References
Alley, R.B., Meese, D.A., Shuman, C.A., Gow, A.J., Taylor, K.C., Grootes, P.M., White, J.W.C., Ram, M., Waddlington, E.D., Mayewski, P.A. and Zielinski, G.A., 1993. Abrupt increase in Greenland snow accumulation at the end of the Younger Dryas event. Nature, 362:527 529.
Bard, E., Fairbanks, R.G., Arnold, M. and Hamelin, M., 1992. 23°yh/234U and 14C ages obtained by mass spectrometry on corals from Barbados (West Indies), Isabela (Galapagos) and Mururoa (French Polynesia). In: E. Bard and W.S. Broecker (Editors), The Last Deglaciation: Absolute and Radiocarbon Chronologies (NATO ASI Ser., 1, 2). Springer, Berlin, pp. 103-110.
Danulat, E. and Selquk, B., 1992. Life history and environmen- tal conditions of the anadromous Chalcalburnus tarichi (Cyprinidae), endemic to the extremely alkaline Lake Van, Eastern Anatolia, Turkey. Arch. Hydrobiol., 126: 105-125.
Dansgaard, W., White, J.W.C. and Johnson, S.J., 1989. The abrupt termination of the Younger Dryas climate event. Nature, 339: 532-534.
Dansgaard, W., Johnsen, S.J., Clausen, H.B.N., Dahl-Jensen, D., Gundestrup, N.S., Hammer, C.U., Hvidberg, C.S., Steffensen, J.P., Sveinbj6rnsdottir, A.E., Jouzel, J. and Bond, G., 1993. Evidence for general instability of past climate from a 250-kyr ice-core record. Nature, 364: 218-220.
DWD, 1990. Meteorological data, Lake Van area. Dtsch. Wetterdienst, Seewetteramt, Hamburg.
Gasse, F., Arnold, M., Fontes, J.C., Fort, M., Gilbert, E., Huc, A., Bingyan, L., Yuanfang, L., Qing, L., Meli6res, F., Van Campo, E., Fubao, W. and Quingsong, Z., 1991. A 13,000-year climate record from western Tibet. Nature, 353:742 745.
Gasse, F. and Fontes, J.C., 1992. Climatic changes in northwest Africa during the last deglation (16-7 ka BP). In: E. Bard and W.S. Broecker (Editors), The Last Deglaciation: Absolute and Radiocarbon Chronologies (NATO ASI Ser., 1, 2). Springer, Berlin, pp, 295-325.
Gessner, F., 1957. Van G61t~, zur Limnologie des grogen Soda- Sees in Ostanatolien (Tiirkei). Arch. Hydrobiol., 53: 1-22.
Grootes, P.M., Stuiver, M., White, J.W.C., Johnsen, S. and Jouzel, J., 1993. Comparison of oxygen isotope records from the GISP2 and GRIP Greenland ice cores. Nature, 366: 552 554.
Hajdas, I., Ivy, S.D, Beer, J., Bonani, G., Imboden, D.,
Lotter, A.F., Sturm, M. and Suter, M., 1993. AMS radiocarbon dating and varve chronology of Lake Soppensee: 6000 to 12000 14C years BP. Climate Dyn., 9:107 116.
Hajdas-Skowronek, I., 1993. Extension of the radiocarbon calibration curve by AMS dating of laminated sediments of Lake Soopensee and Lake Holzmaar. Thesis. ETH, Ziirich, Nr. 10157, 147 pp.
Johnsen, S.J., Clausen, H.B., Dansgaard, W., Fuhrer, K., Gundelstrup, N., Hammer, C.U., Iversen, P., Jouzel, J., Stauffer, B. and Steffernsen, J.P., 1992. Irregular glacial interstadials recorded in a new Greenland ice core. Nature, 359:311 313.
Kapsner, W.R., Alley, R.B., Shuman, C.A., Anandakrishnan, S. and Grootes, P.M., 1995. Dominant influence of atmo- spheric circulation on snow accumulation in Greenland over the past 18,000 years. Nature, 373:52 54.
Kempe, S., 1977. Hydrographic, Warven-Chronologie und Organische Geochemie des Van Sees, Ost-Ttirkei. Mitt. Geol.-Pal~iont. Inst. Univ. Hamburg, 47: 125-228.
Kempe, S. and Degens, E.T., 1978. Lake Van varve record: The past 10,420 years. In: E.T. Degens and F. Kurtman (Editors), The Geology of Lake Van. M.T.A. Press, Ankara, pp. 56 63.
Kempe, S. and Degens, E.T., 1979. Varves in the Black Sea and Lake Van/Turkey. In: C. Schltichter (Editor), Moraines and Varves. Balkema, Rotterdam, pp. 309-318.
Kempe, S., Kazmierczak, J., Landmann, G., Konuk, T., Reimer, A. and Lipp, A., 1991. Largest known microbialites discovered in Lake Van, Turkey. Nature, 349: 605-608.
Kromer, B. and Becker, B., 1992. Tree-ring 14C calibration at 10,000 BP. In: E. Bard and W.S. Broecker (Editors), The Last Deglaciation: Absolute and Radiocarbon Chronologies (NATO ASI Ser., 1, 2). Springer, Berlin, pp. 3 11.
Pons, A., De Beaulieu, J.L., Guiot, J. and Reille, M., 1987. The Younger Dryas in southwestern Europe: an abrupt climatic change as evidenced from pollen records. In: W.H. Berger and L.D. Labeyrie (Editors), Abrupt Climatic Change. Reidel, Dordrecht, pp. 195-208.
Prentice, I.C., Guiot, J. and Harrison, S.P., 1992. Mediterranean vegetation, lake levels and palaeoclimate at the Last Glacial Maximum. Nature, 360: 658-660.
Rein, B. and Negendank, J.F.W., 1993. Organic carbon contents of sediment from Lake Schalkenmehrener Maar: A paleoclimate indicator. In: J.F.W. Negendank and B. Zolitschka (Editors), Paleolimnology of European Maar Lakes (Lecture Notes Earth Sci.). Springer, Berlin, pp. 163-171.
Rozanski, K., Goslar, T., Dulinski, M., Kuc, T., Pazdur, M.F., and Walanus, A., 1992. The late Glacial-Holocene transition in central Europe derived from isotope studies of laminated sediments from Lake Gosciaz (Poland). In: E. Bard and W.S. Broecker (Editors), The Last Deglaciation: Absolute and Radiocarbon Chronologies (NATO ASI Ser. 1, 2). Springer, Berlin, pp. 69 80.
Schweizer, G., 1975. Untersuchungen zur Physiogeographie yon Ostanatolien und Nordwestiran. Ttib. Geogr. Stud., 60, 145 pp.
118 G. Landmann et al. / Palaeogeography, Palaeoclimat ology, Palaeoecology 122 (1996) 10 ~118
Taylor, K.C., Lamorey, G.W., Doyle, G.A., Alley, R.B., Grootes, P.M., Mayewski, P.A., White, J.W.C. and Barlow, L.K., 1993a. The "flickering switch" of late Pleistocene climate change. Nature, 361: 432-435.
Taylor, K.C., Hammer, C.U., Alley, R.B., Clausen, H.B., Dahl-Jensen, D., Gow, A.J., Gundestrup, N.S., Kipfstuhl, J., Moore, J.C. and Waddington, E.D., 1993b. Electrical conductivity measurements from the GISP2 and GRIP Greenland ice cores. Nature, 366:549 552.
Thiel, V., 1993. Untersuchungen von Biomarkern als Faziesindikatoren ffir limnische Ablagerungsr~iume. Thesis. Fac. Geosci., Univ. Hamburg, 135 pp.
Van Zeist, W. and Woldring, H., 1978a. A pollen profile from
Lake Van; A preliminary report. In: E.T. Degens and F. Kurtman (Editors), The Geology of Lake Van. M.T.A. Press, Ankara, pp. 115 123.
Van Zeist, W. and Woldring, H., 1978b. A postglacial pollen diagram from Lake Van in East Anatolia. Rev. Paleobot. Palynol., 26: 249-276.
Zolitschka, B., Haverkamp, B. and Negendank, J.F.W., 1992. Younger Dryas oscillation--varve dated microstratigraphic, palynological and palaeomagnetic records from Lake Holzmaar, Germany. In: E. Bard and W.S. Broecker (Editors), The Last Deglaciation: Absolute and Radiocarbon Chronologies (NATO ASI Ser. l, 2). Springer, Berlin, pp. 81 101.