Spatial structure of the 8200 cal yr BP event in northern Europe
31
CPD 3, 165–195, 2007 8200 events in Northern Europe H. Sepp ¨ a et al. Title Page Abstract Introduction Conclusions References Tables Figures Back Close Full Screen / Esc Printer-friendly Version Interactive Discussion EGU Clim. Past Discuss., 3, 165–195, 2007 www.clim-past-discuss.net/3/165/2007/ © Author(s) 2007. This work is licensed under a Creative Commons License. Climate of the Past Discussions Climate of the Past Discussions is the access reviewed discussion forum of Climate of the Past Spatial structure of the 8200 cal yr BP event in Northern Europe H. Sepp ¨ a 1 , H. J. B. Birks 2,3,4 , T. Giesecke 5 , D. Hammarlund 6 , T. Alenius 7 , K. Antonsson 8 , A. E. Bjune 2,3 , M. Heikkil ¨ a 1 , G. M. MacDonald 9 , A. E. K. Ojala 7 , R. J. Telford 2,3 , and S. Veski 10 1 Department of Geology, P.O. Box 64, 00014, University of Helsinki, Finland 2 Department of Biology, University of Bergen, All´ egaten 55, 5007 Bergen, Norway 3 Bjerknes Centre for Climate Research, All ´ egaten 55, 5007, Bergen, Norway 4 Environmental Change Research Centre, University College London, 26 Bedford Way, London, WC1H OAP, UK 5 Department of Geography, University of Liverpool, Roxby Building, Liverpool, L69 7ZT, UK 6 GeoBiosphere Science Centre, Quaternary Sciences, Lund University, S¨ olvegatan 12, 223 62 Lund, Sweden 7 Geological Survey of Finland, P.O. Box 96, 02151, Espoo, Finland 8 Department of Earth Sciences, Uppsala University, Villav¨ agen 16, 75236, Uppsala, Sweden 9 Department of Geography, UCLA, 405 Hilgard Avenue, Los Angeles, CA 90095-1524, USA 10 Institute of Geology, Tallinn University of Technology, Ehitajate tee 5, 19086 Tallinn, Estonia Received: 13 December 2006 – Accepted: 15 January 2006 – Published: 22 January 2007 Correspondence to: H. Sepp ¨ a (heikki.seppa@helsinki.fi) 165
Transcript of Spatial structure of the 8200 cal yr BP event in northern Europe

CPD3, 165–195, 2007
8200 events inNorthern Europe
H. Seppa et al.
Title Page
Abstract Introduction
Conclusions References
Tables Figures
J I
J I
Back Close
Full Screen / Esc
Printer-friendly Version
Interactive Discussion
EGU
Clim. Past Discuss., 3, 165–195, 2007www.clim-past-discuss.net/3/165/2007/© Author(s) 2007. This work is licensedunder a Creative Commons License.
Climateof the Past
Discussions
Climate of the Past Discussions is the access reviewed discussion forum of Climate of the Past
Spatial structure of the 8200 cal yr BPevent in Northern EuropeH. Seppa1, H. J. B. Birks2,3,4, T. Giesecke5, D. Hammarlund6, T. Alenius7,K. Antonsson8, A. E. Bjune2,3, M. Heikkila1, G. M. MacDonald9, A. E. K. Ojala7,R. J. Telford2,3, and S. Veski10
1Department of Geology, P.O. Box 64, 00014, University of Helsinki, Finland2Department of Biology, University of Bergen, Allegaten 55, 5007 Bergen, Norway3Bjerknes Centre for Climate Research, Allegaten 55, 5007, Bergen, Norway4Environmental Change Research Centre, University College London, 26 Bedford Way,London, WC1H OAP, UK5Department of Geography, University of Liverpool, Roxby Building, Liverpool, L69 7ZT, UK6GeoBiosphere Science Centre, Quaternary Sciences, Lund University, Solvegatan 12, 22362 Lund, Sweden7Geological Survey of Finland, P.O. Box 96, 02151, Espoo, Finland8Department of Earth Sciences, Uppsala University, Villavagen 16, 75236, Uppsala, Sweden9Department of Geography, UCLA, 405 Hilgard Avenue, Los Angeles, CA 90095-1524, USA10Institute of Geology, Tallinn University of Technology, Ehitajate tee 5, 19086 Tallinn, Estonia
Received: 13 December 2006 – Accepted: 15 January 2006 – Published: 22 January 2007
Correspondence to: H. Seppa ([email protected])
165

CPD3, 165–195, 2007
8200 events inNorthern Europe
H. Seppa et al.
Title Page
Abstract Introduction
Conclusions References
Tables Figures
J I
J I
Back Close
Full Screen / Esc
Printer-friendly Version
Interactive Discussion
EGU
Abstract
A synthesis of well-dated high-resolution pollen records suggests a spatial structurein the 8200 cal yr BP event in northern Europe. The temperate, thermophilous treetaxa, especially Corylus, Ulmus, and Alnus, decline abruptly between 8300 and 8000cal yr BP at most sites located south of 61◦ N, whereas there is no clear change in5
pollen values at the sites located in the North-European tree-line region. Pollen-basedquantitative temperature reconstructions and several other, independent palaeoclimateproxies, such as lacustrine oxygen-isotope records, reflect the same pattern, with nodetectable cooling in the sub-arctic region. The observed pattern would challenge thegeneral view of the wide-spread occurrence of the 8200 cal yr BP event in the North10
Atlantic region. An alternative explanation is that the cooling during the 8200 cal yrBP event took place mostly during the winter and spring, and the ecosystems in thesouth responded sensitively to the cooling during the onset of the growing season.In contrast, in the sub-arctic area, where the vegetation was still dormant and lakesice-covered, the cold event is not reflected in pollen-based or lake-sediment-based15
records. The arctic regions may therefore not always be optimal for detecting pastclimate changes.
1 Introduction
Abrupt climate changes are typically non-linear, taking place when the climate systemis forced over a critical threshold, followed by a rapid transition to a new state (Al-20
ley et al., 2003). High-resolution records have revealed that abrupt climate changeswere frequent during the last glacial when regional temperature changes of as muchas 8◦C to 16◦C may have occurred in a decade or less (Severinghaus and Brook,1998; Stocker, 2000; Alley et al., 2003; Schulz et al., 2004), but also during the earlypost-glacial period characterized by rapidly vanishing ice sheets (Clark et al., 2001,25
2002). The precise origins and processes associated with these events remain contro-
166

CPD3, 165–195, 2007
8200 events inNorthern Europe
H. Seppa et al.
Title Page
Abstract Introduction
Conclusions References
Tables Figures
J I
J I
Back Close
Full Screen / Esc
Printer-friendly Version
Interactive Discussion
EGU
versial (Schulz et al., 2004), as do their spatial expressions (Alley et al., 2003; Wunsch,2006), although most theories invoke the role of the Atlantic meridional overturning cir-culation (AMOC) and its sensitivity to freshening of the North Atlantic surface waterby increased precipitation, runoff from surrounding landmasses, and abrupt fluxes ofglacial melt-water (Clark et al., 2002).5
Many records, especially from the North Atlantic region, provide evidence of a coldevent at 8200 cal yr BP that represents a unique climatic feature within the last 10 000years in terms of magnitude and abruptness (e.g. Alley et al., 1997; von Grafensteinet al., 1998; Klitgaard-Kristensen et al., 1998; Johnsen et al. 2001; Spurk et al., 2002;Veski et al, 2004; Alley and Agustsdottir, 2005). Although it has been suggested that10
the cooling was linked to reduced solar output (Rohling and Palike, 2005), there is accu-mulating evidence that the primary cause of the cooling was a pulse a cold freshwaterreleased by a sudden drainage of the proglacial Laurentide lakes in North America tothe North Atlantic at about 8500 cal yr BP, leading to a transient freshening and cool-ing of the North Atlantic Surface Water (NADW). This probably resulted in a weaker15
AMOC, and a consequent reduction of the northward heat transport and associatedheat release in the North Atlantic region. Compelling support for this hypothesis is pro-vided by the record of Ellison et al. (2006), showing that the near-bottom flow speed ofthe Iceland-Scotland Overflow Water, an important component of the AMOC, declinedsignificantly at the onset of the cold event. This is the first firm palaeoceanographic20
evidence for a reduction of the NADW formation. This theory is supported by climatemodels which, in accordance with palaeoclimatic records, simulate maximum coolingin the North Atlantic region in response to the drainage of the Laurentide lakes (Alleyand Agustsdottir, 2005; Wiersma and Renssen, 2006; Wiersma et al., 2006).
One of the key regions for investigating the continental-scale impacts of the 8200 cal25
yr BP cold event is Northern Europe, located downwind of the North Atlantic Ocean.The climatic conditions there are strongly dependent on the intensity of the North At-lantic Oscillation (NAO) and the associated westerly airflow, which is related to thestrength of the AMOC and to the sea-surface temperatures in the North Atlantic (Hur-
167

CPD3, 165–195, 2007
8200 events inNorthern Europe
H. Seppa et al.
Title Page
Abstract Introduction
Conclusions References
Tables Figures
J I
J I
Back Close
Full Screen / Esc
Printer-friendly Version
Interactive Discussion
EGU
rell 1995; Rodwell et al., 1999; Hurrell et al., 2003; Wu and Rodwell, 2004; Stoufferet al., 2006). Thus, palaeoclimatic records from northern Europe can provide basisfor testing potential processes associated with the 8200 cal yr BP cold event. Sincethe first reported occurrences of the cold event based, for example, on high-resolutionpollen records (Snowball et al., 2001; Veski et al., 2004) and stable isotope records ob-5
tained from calcareous lake sediments (Hammarlund et al., 2003; Veski et al., 2004),the number of well-dated quantitative temperature reconstructions from this region hasincreased rapidly. This improving network of records with high time resolution now per-mits a more detailed spatial and temporal analysis of the climatic changes between9500 to 7000 cal yr BP.10
Here we examine high-resolution pollen-stratigraphical records produced with uni-form methodology in northern Europe along a sector that ranges from 55 to 70◦ Nlatitude and from 18 to 26◦ E longitude and includes two significant climatic gradients:a primary south-to-north gradient of falling temperature and a secondary west-to-eastgradient of decreasing precipitation and oceanicity. We particularly aim to investigate15
the spatial patterns of vegetational and climatic change in order to observe if the evi-dence for the cold event shows consistent features or whether there are geographicaldifferences in the amplitude or occurrence of the event along the two climatic gradi-ents. In addition, we compare the high-resolution pollen records with other, indepen-dent palaeoclimatic records of comparable time resolution, in particular oxygen-isotope20
records obtained on lacustrine carbonates.
2 Material and methods
There are numerous pollen diagrams available from northern Europe, but only a frac-tion of them have sufficient temporal resolution and chronological control to allow as-sessment of climate events of 200–300 years duration. Pollen records from 12 sites25
with adequate resolution and reliable chronologies were selected for this study (Fig. 1,Table 1). The number of analysed pollen samples for the last 10 000 years ranges from
168

CPD3, 165–195, 2007
8200 events inNorthern Europe
H. Seppa et al.
Title Page
Abstract Introduction
Conclusions References
Tables Figures
J I
J I
Back Close
Full Screen / Esc
Printer-friendly Version
Interactive Discussion
EGU
57 (Lake Trehorningen) to over two hundred (Lake Nautajarvi 260 and Lake Rouge237), and the records selected have a minimum of six radiocarbon dates and in gen-eral smooth age-depth models. Two records (Lakes Nautajarvi and Rouge), have ex-ceptionally precise chronologies based on annually laminated sediments (Ojala et al.,2003; Veski et al., 2004). At all sites the pollen percentage values have been calculated5
on the basis of the total sum of all terrestrial pollen and spore types.In addition to the examination of individual pollen curves, pollen-stratigraphical data
were used to derive a quantitative temperature record for each site for the early- tomid-Holocene. Two different temperature parameters were used in the quantitative re-constructions. July mean temperature (Tjul) was reconstructed at four sites located in10
the northern tree-line region, whereas annual mean temperature (Tann) was estimatedfor the rest of the sites located in the central or southern parts of the study area. Thereason for this is that in the far north the growing season is confined to three or foursummer months (MJJA) and a vegetation-based proxy such as pollen arguably pre-dominantly represents summer temperature conditions. No such generalization can15
be made in more southern parts of Fennoscandia, however, because there the grow-ing season is considerably longer, starting often in March or April and continuing toOctober (Rotzer and Chmielewski, 2001; Linderholm et al., 2006). In addition, winterclimatic conditions are important for the distribution and regeneration of many plantspecies, especially those restricted to the most oceanic parts along the west coast20
of Fennoscandia (Dahl, 1998). Thus the pollen records represent a mixture of taxawith different temperature requirements in relation to the seasons and annual meantemperature is probably a better justified climatic parameter to be reconstructed frompollen data in southern and central Fennoscandia than July or summer (JJA) meantemperature (Seppa et al., 2004).25
Pollen-based temperature reconstructions were based on transfer functions derivedfrom North-European pollen-climate calibration sets. These data sets are based onmodern climate data from the Climate Normals period 1961–1990 and on modernpollen samples, collected from top surface sediment samples of small to medium-sized
169

CPD3, 165–195, 2007
8200 events inNorthern Europe
H. Seppa et al.
Title Page
Abstract Introduction
Conclusions References
Tables Figures
J I
J I
Back Close
Full Screen / Esc
Printer-friendly Version
Interactive Discussion
EGU
lakes. All samples were selected, collected, and analysed with standardised methods(see Seppa et al., 2004). The Tjul records were based on 164 surface samples fromNorway, 27 samples from northern Sweden, and 113 samples from Finland (Seppaand Birks, 2001). The Tann reconstructions were carried out using three different cal-ibration subsets. Subset 1 consists of 113 samples from Finland, subset 2 includes5
24 samples from Estonia in addition to the 113 Finnish samples (Seppa et al., 2004),and subset 3 includes 37 samples from Sweden in addition to the 113 Finnish sam-ples and the 24 Estonian samples. Table 1 indicates which subset was used for eachfossil record. The transfer functions were developed using weighted averaging partialleast squares (WA-PLS) regression, a non-linear, unimodal regression and calibration10
technique commonly used in quantitative environmental reconstructions (ter Braak andJuggins, 1993; Birks, 1995, 2003). WA-PLS was implemented by the program CALI-BRATE (S Juggins and CJF ter Braak unpublished program). All terrestrial pollen andspore types were included in the models, and were square-root transformed to stabilizetheir variances and to maximize “the signal to noise” ratio (Prentice, 1980). The perfor-15
mance statistics of the pollen-climate calibration sets are given in Table 2. In generalthe statistics indicate high performance of the models relative to other correspondingmodels based on various biological proxy techniques (Birks and Seppa, 2004).
3 Results
To show the details of the pollen-stratigraphical changes during the 8200 cal yr BP20
event in northern Europe, we focus on key pollen types. In northern Europe pollentypes that mostly decline during the event, indicating either reduced populations and/orpollen productivity, likely caused by the cooling, are the thermophilous deciduous treetaxa, predominantly Corylus, Ulmus and Alnus. The types that usually increase areBetula and/or Pinus (Snowball et al., 2001; Veski et al., 2004; Seppa et al., 2005;25
Sarmaja-Korjonen and Seppa, 2007). The percentage pollen curves of Corylus andUlmus are shown in Fig. 2. As these temperate deciduous tree taxa do not occur in
170

CPD3, 165–195, 2007
8200 events inNorthern Europe
H. Seppa et al.
Title Page
Abstract Introduction
Conclusions References
Tables Figures
J I
J I
Back Close
Full Screen / Esc
Printer-friendly Version
Interactive Discussion
EGU
the pollen records from the tree-line region, curves are shown only for the sites that arelocated in the southern and central part of the research area. Both taxa show a distinctand abrupt decline during the event at four sites, all located south of 61◦ N. Corylusespecially seems to respond strongly to the sudden cooling, its values dropping at LakeRouge, for example, from 10–15% to below 5% at 8250–8050 cal yr BP, and the decline5
is almost equally distinct at the three other southernmost sites. The decline of Ulmus isof similar magnitude apart from the weak signal at Lake Flarken. At Lakes Laihalampiand Nautajarvi, both located north of 61◦ N, Corylus does not decline during the coldevent, but there is a relatively clear decline of Ulmus at Lake Laihalampi (Fig. 2).
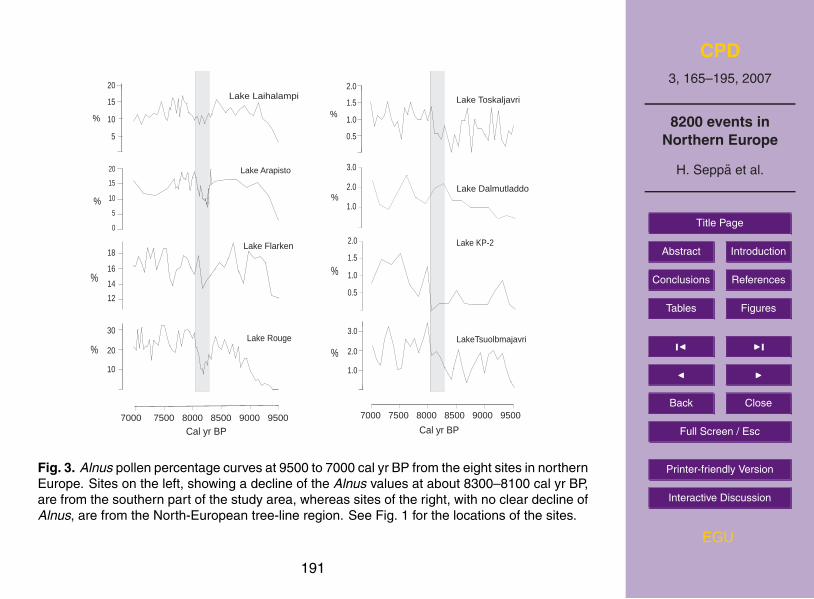
Alnus pollen percentage curves are shown from eight sites (Fig. 3). Alnus is se-10
lected because it is the only thermophilous deciduous tree taxon whose pollen valuescontinuously exceed 1% at all sites, including those at the northern tree-line. Alnuspollen is produced by two tree species, A. incana and A. glutinosa, of which the formeris found up to 68◦ N. The comparison of Alnus pollen records indicates a south to northgradient. There is a clear decline of Alnus values at the southern sites, especially at15
Lakes Rouge and Arapisto, whereas records from central Fennoscandia indicate littleor no decline. Alnus pollen records from the Arctic tree-line region show no evidenceof a decline.
The pollen-based quantitative Tann reconstructions for the period 9500–7000 cal yrBP show broadly the same pattern as the key indicator pollen types (Fig. 4). The results20
indicate a consistent cooling centred around 8200 cal yr BP at the southernmost sites,especially at Lake Rouge in Estonia, Lake Flarken in Sweden, and Lake Arapisto inFinland. At all these sites there is a temperature drop of 0.5 to 1.5◦C. The coolingbegins abruptly at about 8300 cal yr BP, lasts 200 to 300 years, and ends with a suddentemperature rise at about 8000 cal yr BP. As the age-depth models for most sites25
were based on calibrated radiocarbon dates, it is realistic to relate the slight temporaldifferences between the records to the inevitable imprecision of the chronologies. Incontrast, the Tann reconstructions from Lakes Holtjarnen, Laihalampi and Nautajarvi,all located north of 61◦ N, show weak or no evidence of cooling at 8300–8000 cal yr BP.
171

CPD3, 165–195, 2007
8200 events inNorthern Europe
H. Seppa et al.
Title Page
Abstract Introduction
Conclusions References
Tables Figures
J I
J I
Back Close
Full Screen / Esc
Printer-friendly Version
Interactive Discussion
EGU
Tjul records from the Fennoscandian tree-line region do not provide any evidence for atemperature change during the event. All four sites indicate a steady rise of Tjul from9400 cal yr BP toward the mid-Holocene, with variability that is not consistent betweenthe records. Hence, the quantitative reconstructions follow the same spatial pattern asthe key pollen types, namely that there is a distinct cooling between 8300 and 80005
cal yr BP in southern Fennoscandia and in the Baltic countries, weak or no cooling incentral Fennoscandia, and no evidence of cooling in the tree-line region of northernEurope (Figs. 5 and 6).
A synthesis of the pollen-based evidence shows strikingly that the four records wherethe cooling is clearest are from the southernmost sites, located south of 61◦ N. Bio-10
geographically, they are located in the temperate-boreal (boreo-nemoral) zone today(Fig. 1) where the vegetation is characterized by the occurrence of nemoral ther-mophilous tree species such as Tilia cordata, Quercus robur, Corylus avellana, Ulmusglabra, Acer platanoides, and Fraxinus excelsior. All these tree species reach theirnorthern distribution limits close to the border of the nemoral and boreal vegetation15
zones. In contrast, all the records where there is no cooling at 8200 cal yr BP are fromsites that are located north of 61◦ N. Lakes Laihalampi and Nautajarvi are located in thesouthern boreal zone, where the dominant forest type is a mixture of conifers and birch,and Lakes Tsuolbmajavri, KP-2, Dalmutladdo, and Toskaljavri are all situated within thenorthern ecotone of the boreal zone, with significant arctic-alpine components in the20
surrounding vegetation.
4 Discussion
The relatively mild winter climate of northern Europe is a result of the influence ofthe Atlantic Ocean and the westerly airflow over the continent (Seager et al., 2002;Sutton et al., 2003). This influence is particularly strong during the positive phase25
of the NAO with strong westerly wind, greater advection of moist air off the Atlanticand onto the continent, and high temperature and precipitation even in northernmost
172
CPD3, 165–195, 2007
8200 events inNorthern Europe
H. Seppa et al.
Title Page
Abstract Introduction
Conclusions References
Tables Figures
J I
J I
Back Close
Full Screen / Esc
Printer-friendly Version
Interactive Discussion
EGU
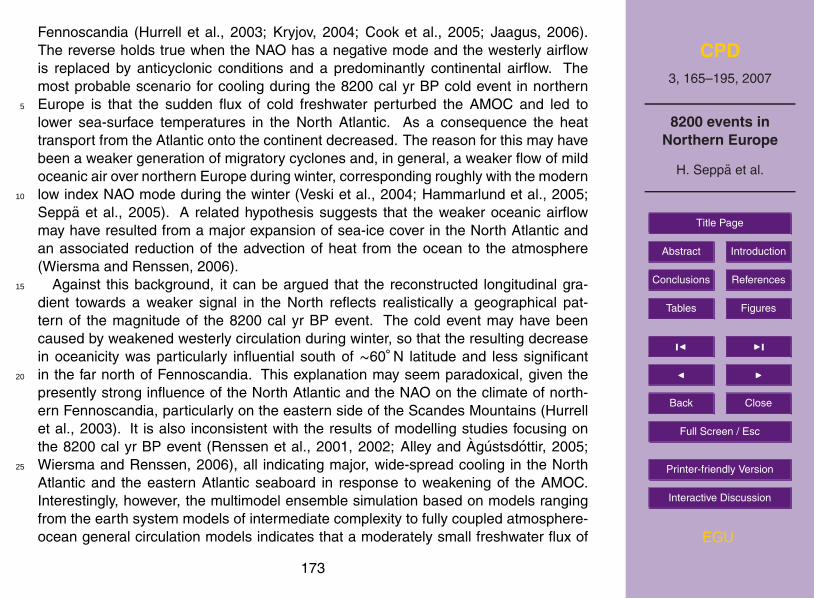
Fennoscandia (Hurrell et al., 2003; Kryjov, 2004; Cook et al., 2005; Jaagus, 2006).The reverse holds true when the NAO has a negative mode and the westerly airflowis replaced by anticyclonic conditions and a predominantly continental airflow. Themost probable scenario for cooling during the 8200 cal yr BP cold event in northernEurope is that the sudden flux of cold freshwater perturbed the AMOC and led to5
lower sea-surface temperatures in the North Atlantic. As a consequence the heattransport from the Atlantic onto the continent decreased. The reason for this may havebeen a weaker generation of migratory cyclones and, in general, a weaker flow of mildoceanic air over northern Europe during winter, corresponding roughly with the modernlow index NAO mode during the winter (Veski et al., 2004; Hammarlund et al., 2005;10
Seppa et al., 2005). A related hypothesis suggests that the weaker oceanic airflowmay have resulted from a major expansion of sea-ice cover in the North Atlantic andan associated reduction of the advection of heat from the ocean to the atmosphere(Wiersma and Renssen, 2006).
Against this background, it can be argued that the reconstructed longitudinal gra-15
dient towards a weaker signal in the North reflects realistically a geographical pat-tern of the magnitude of the 8200 cal yr BP event. The cold event may have beencaused by weakened westerly circulation during winter, so that the resulting decreasein oceanicity was particularly influential south of ∼60◦ N latitude and less significantin the far north of Fennoscandia. This explanation may seem paradoxical, given the20
presently strong influence of the North Atlantic and the NAO on the climate of north-ern Fennoscandia, particularly on the eastern side of the Scandes Mountains (Hurrellet al., 2003). It is also inconsistent with the results of modelling studies focusing onthe 8200 cal yr BP event (Renssen et al., 2001, 2002; Alley and Agustsdottir, 2005;Wiersma and Renssen, 2006), all indicating major, wide-spread cooling in the North25
Atlantic and the eastern Atlantic seaboard in response to weakening of the AMOC.Interestingly, however, the multimodel ensemble simulation based on models rangingfrom the earth system models of intermediate complexity to fully coupled atmosphere-ocean general circulation models indicates that a moderately small freshwater flux of
173

CPD3, 165–195, 2007
8200 events inNorthern Europe
H. Seppa et al.
Title Page
Abstract Introduction
Conclusions References
Tables Figures
J I
J I
Back Close
Full Screen / Esc
Printer-friendly Version
Interactive Discussion
EGU
0.1 Sv (1 Sv=106 m3 s−1) may lead to a strong cooling in the North Atlantic south ofGreenland but a 1–2◦C warming over the Barents Sea and the Nordic Sea east ofSvalbard and no significant temperature change on the northern Fennoscandian main-land (Stouffer et al., 2006). Similarly, a model simulation by Vellinga and Wood (2002)suggests a strong cooling especially in winter in the North Atlantic but no significant5
temperature change in northern Fennoscandia or in the Barents Sea region.An alternative hypothesis can also explain the observed geographical pattern in the
records. Model simulations consistently indicate that the 8200 cal yr BP event was pre-dominantly a winter (DJF) and spring (MAM) event, as is also supported by the majorityof palaeoclimate records from various parts of Europe (Alley and Agustsdottir, 2005;10
Wiersma and Renssen, 2006). The tree taxa that show strong responses to the 8200cal yr BP event, Alnus, Corylus, and Ulmus, start flowering in early spring, in centralEurope often in February–March and in southern and central Fennoscandia in March–April (Jager et al., 1996; Kasprzyk et al., 2004). The start of their flowering and plantdevelopment is in general dependent on air temperature (Wielgolaski, 1999; Aasa et15
al., 2004) and if an abrupt change to cold winters and cold early springs with frequentfrosts took place at the beginning of the event, it may have led to major damage to flow-ers and male catkins, resulting in reduced pollen productivity, sexual regeneration, andpopulation sizes. This hypothesis is supported by investigations of the relationshipsbetween modern phenological phenomema and climate patterns (Kramer et al., 2000)20
and by modern pollen monitoring studies in Europe. For example, cold weather con-ditions during winter and spring result in a reduction of the annual pollen productivityand a delay of the start of the pollen season of tree species that are favoured by hightemperatures, such as Alnus, Corylus and Ulmus (Andersen, 1972; Frenguelli, 1993;Jager et al., 1996; Frei, 1998; Spieksma et al., 2003; Kasprzyk et al., 2004). The clear25
decline of the pollen percentages of these taxa may therefore reflect their phenologi-cal inability to adapt to an abrupt lowering of the winter and early spring temperaturesduring the 8200 cal yr BP event.
In contrast, northernmost Fennoscandia, north of 68◦ N, is characterized by a
174

CPD3, 165–195, 2007
8200 events inNorthern Europe
H. Seppa et al.
Title Page
Abstract Introduction
Conclusions References
Tables Figures
J I
J I
Back Close
Full Screen / Esc
Printer-friendly Version
Interactive Discussion
EGU
markedly different climatic and phenological situation. Here winter conditions with sub-zero diurnal mean temperatures and abundant snow remain long into April. The grow-ing season starts in late May or early June (Linderholm et al., 2006) and its duration istypically only 100–150 days. Winter temperatures can be extremely low, down to below–40◦C, and only the most frost-resistant tree species thrive, i.e. the main northern forest5
components Pinus sylvestris, Picea abies, and Betula (B. pubescens and B. pendula)(Grace et al., 2002). For example, climate chamber experiments have shown that Pi-nus sylvestris can tolerate temperatures as low as <–72◦C during the winter while itsneedles can be lethally damaged when exposed to –10◦C during the summer (Repo,1992; Beck et al., 2004). The continental conifer species Picea abies is also adapted10
to cold winters as its radial growth is positively correlated with low winter temperaturesand negatively correlated with high winter temperatures (Makinen et al., 2000). Of thedeciduous tree taxa that show strong responses to the 8200 cal yr BP event in thesouthern part of the study region, only Alnus grows in northern Fennoscandia, albeitnot north of about 68◦ N. However, Alnus incana is less sensitive to cold periods during15
the late winter and early spring in the far north, because of phenological adaptationof the beginning of flowering, bud break, and leaf expansion, these processes takingplace usually in May to June, about two months later than in the south.
If the cooling took place mostly during winter and early spring, the occurrence, re-generation, and pollen productivity of the northern-boreal tree taxa may not have been20
significantly affected, and the lack of pollen-stratigraphical responses to the cold eventmay reflect largely unaltered climatic conditions during the short growing season ofthese taxa. Many other proxy records that are independent of vegetation patterns in-dicate a weaker signal for the 8200 cal yr BP event towards northern Fennoscandia.In western Scandinavia records based on loss-on-ignition analysis of lake sediments25
reveal a substantial climatic perturbation and clearly decreased aquatic productivity atabout 8200 cal yr BP (Nesje et al., 2001; Bergman et al., 2005). However, in northernFennoscandia the same methods do not display equally clear evidence for a cool-ing. For example, a high-resolution reconstruction of Holocene equilibrium-line altitude
175

CPD3, 165–195, 2007
8200 events inNorthern Europe
H. Seppa et al.
Title Page
Abstract Introduction
Conclusions References
Tables Figures
J I
J I
Back Close
Full Screen / Esc
Printer-friendly Version
Interactive Discussion
EGU
changes from the Lyngen peninsula on the northwestern coast of Norway does notshow any sign of glacier growth between 8500 and 7500 cal yr BP (Bakke et al., 2005),neither does the record of bacterial magnetite from the Lyngen peninsula indicate anycold excursion during the 8200 cal yr BP event (Paasche et al., 2004). Chironomid-based temperature reconstructions from northern Finland and Sweden do not indicate5
any cooling between 8300 and 8000 cal yr BP (Rosen et al., 2001; Bigler et al., 2002,2003; Korhola et al., 2002; Seppa et al., 2002; Larocque and Hall, 2003, 2005). Simi-larly, quantitative and qualitative reconstructions from the Kola Peninsula in northwest-ern Russia do not document any cooling at 8200 cal yr BP (Jones et al., 2004). Korholaet al. (1999) and Bigler et al. (2006) report a cooler period at about 8300 to 8000 cal10
yr BP in diatom-based Tjul reconstructions from the northwestern Fennoscandian tree-line region, but it is unclear whether these results represent summer cooling or aremore related to changes in the length of the lake ice-cover season, which may be themost important climate-related feature reflected in diatom records from alpine regions(Lotter and Bigler, 2000; Sorvari et al., 2002).15
Independent evidence of a considerable influence of winter cooling on the general cli-matic character and expression of the 8200 cal yr BP event in parts of northern Europeis provided by oxygen-isotope records obtained on fine-grained sedimentary calcitefrom small lakes in the study area. Although relatively few records are available, and inspite of complications arising from site-specific hydrological characteristics, some rel-20
evant conclusions can be derived from such a comparison (Fig. 7). The Lake Igelsjonδ18O record from southern Sweden (Fig. 1) is sensitive to changing hydrology, with pe-riods of 18O-enrichment reflecting mainly elevated evaporation/inflow ratio of the basinunder warm and dry summer conditions (Hammarlund et al., 2003). The strong isotopicresponse to the 8200 cal yr BP event therefore predominantly reflects an increase in25
net precipitation during the summer (Hammarlund et al., 2005), perhaps augmented bya generally shorter ice-free season. However, as demonstrated by Seppa et al. (2005),about 40% of the decrease in δ18O during the event can be attributed to a depletion in18O of annual precipitation and groundwater, which is likely coupled to a large extent
176

CPD3, 165–195, 2007
8200 events inNorthern Europe
H. Seppa et al.
Title Page
Abstract Introduction
Conclusions References
Tables Figures
J I
J I
Back Close
Full Screen / Esc
Printer-friendly Version
Interactive Discussion
EGU
to colder and longer winters. The effect of such a change in winter conditions is alsomanifested as a slight depletion in 18O at 8200 cal yr BP in the Lake Rouge record fromsouthern Estonia (Veski et al., 2004), which more directly reflects δ18O of precipitation.
Oxygen-isotope data of comparable resolution are not available from northernFennoscandia, but the Lake Tibetanus δ18O record from northernmost Sweden, close5
to the Atlantic coast (Hammarlund et al., 2002), does not reflect any climatic change atthis stage. Supportive evidence of the absence of an oxygen-isotope response at 8200cal yr BP in this part of Fennoscandia is provided by the more highly resolved δ18Orecord from the SG93 speleothem near the Arctic Circle in Norway (Lauritzen et al.,1999). Although interpreted differently by the authors, the SG93 record exhibits a gen-10
eral depletion in 18O with time during the early Holocene, consistent with the long-termevolution of δ18O of precipitation as inferred from the Lake Tibetanus data (Hammar-lund et al., 2002). It cannot be excluded that the potential effect of a pronounced wintercooling, and an associated depletion in δ18O of precipitation, on the two latter recordsfrom northwestern Scandinavia was offset by lowered summer temperatures during15
the event, leading to 18O-enrichment of lacustrine and speleothem calcite. However,it appears likely from these data that the weakening of the AMOC during the 8200cal yr BP event and the associated cooling of the North Atlantic Ocean (Vellinga andWood, 2002) induced a southward displacement of the Polar Front and the westerliesin winter (Magny et al., 2003), giving rise to a general anti-cyclonic circulation pattern20
over northern Europe. Such a scenario may be invoked to explain the greater inferredcooling in the southern part of the study area in response to enhanced continentallity(Fig. 5), as well as parts of the stronger isotopic response in southern Sweden as com-pared to Estonia (Fig. 7), where the change was of lesser magnitude due to a relativelycontinental baseline climate.25
177

CPD3, 165–195, 2007
8200 events inNorthern Europe
H. Seppa et al.
Title Page
Abstract Introduction
Conclusions References
Tables Figures
J I
J I
Back Close
Full Screen / Esc
Printer-friendly Version
Interactive Discussion
EGU
5 Conclusions
The assessment of the regional impact of the 8200 cal yr BP event is based on a sur-vey of records of positive evidence in the increasingly dense network of temperature-sensitive proxy records. Such a survey is a delicate and difficult process, as the palae-orecords are typically noisy and it is difficult to distinguish regionally restricted and5
representative anomalies. Furthermore, ignoring records with negative evidence cancause bias in such an assessment. In northern Europe, a synthesis of negative andpositive evidence from pollen-based temperature reconstructions indicates a spatialpattern in the 8200 cal yr BP event, with more distinct evidence of the cooling in theBaltic countries and in southern Fennoscandia than in the central and northernmost10
parts of Fennoscandia and adjacent areas. Given the evidence of the wide-spreadnature of the 8200 cal yr BP event in the North-Atlantic region (Alley and Agustsdottir,2005; Wiersma and Renssen, 2006), a cooling probably took place all over northernEurope, including the tree-line region, but, as the cooling was predominantly a winterand spring event, taking place before the start of the growing season or before the15
break-up of lake ice in the north, it is not recorded in the quantitative and qualitativeclimate records obtained from the far north of northern Europe. However, on the basisof evidence presented here we cannot rule out a latitudinal gradient in the magnitudeof the event, with a more pronounced cooling in the south and less or no cooling inthe north. It may be possible to test these two hypotheses in the future by developing20
and applying specific palaeoecological techniques such as analyses of sedimentarychrysophyte cysts (Kamenik and Schmidt, 2005; Pla and Catalan, 2005), clacoceranephippia (Sarmaja-Korjonen, 2004), or diatom records from alpine lakes (Lotter andBigler, 2000) as they may have the potential for reflecting the length of the winter ice-cover of the lakes, hence providing insights into the winter temperature changes during25
the event.If the muted response to the 8200 cal yr BP event at the tree-line sites results from
the insensitivity of the palaeoclimatic records, then an important implication is that
178

CPD3, 165–195, 2007
8200 events inNorthern Europe
H. Seppa et al.
Title Page
Abstract Introduction
Conclusions References
Tables Figures
J I
J I
Back Close
Full Screen / Esc
Printer-friendly Version
Interactive Discussion
EGU
the northern tree-line regions, and in a more general sense, the cold regions of theEarth, may not always be optimal targets for palaeoclimatic reconstruction. In theseregions the biological activity is to a great extent restricted to the short growing sea-son during the summer months, whereas during the long and cold winter both terres-trial and aquatic ecosystems are dormant and therefore less sensitive to temperature5
changes. Consequently, biological proxy techniques such as pollen and chironomidrecords reflect predominantly summer temperatures in these regions. The same prox-ies in regions with a longer biologically active period, such as the ecotone betweenthe temperate and boreal zones, are more sensitive to spring, autumn and perhapswinter temperatures. The evidence associated with the 8200 cal yr BP event provides10
therefore a prime example of the importance of site selection in palaeoclimatologicaland palaeoecological studies.
Acknowledgements. This study is part of the projects “High-resolution climate reconstructionsin eastern Europe”, funded by the Academy of Finland, and “Responses of boreal ecosystemcarbon exchanges to changing environments in different spatio-temporal scales (REBECCA)”,15
funded by the Helsinki University Environmental Research Centre (HERC).
References
Aasa, A., Jaagus, J., Ahas, R., and Sepp, M.: The influence of atmospheric circulation on plantphenological phases in central and eastern Europe, Int. J. Climatol. 24, 1551–1564, 2004.
Alley, R. B. and Agustsdottir, A. M.: The 8 k event: cause and consequences of a major20
Holocene abrupt climate change, Quat. Sci. Rev., 10–11, 1123–1149, 2005.Alley, R. B., Mayewski, P. A., Sowers, T., Stuiver, M., Taylor, K. C., and Clark, P. U.: Holocene cli-
matic instability: A prominent, widespread event 8200 yr ago, Geology, 25, 483–486, 1997.Alley, R. B., Marotzke, J., Nordhaus, W. D., Overpeck, J. T., Peteet, D. M., Pielke Jr., R. A.,
Pierrehumbert, R. T., Rhines, P. B., Stocker, T. F., Talley, L. D., and Wallace, J. M.: Abrupt25
Climate Change, Science, 299, 2005–2010, 2003.Andersen, S. T.: Influence of climatic variation on pollen season severity in wind-pollinated
trees and herbs, Grana, 19, 47–52, 1980.
179

CPD3, 165–195, 2007
8200 events inNorthern Europe
H. Seppa et al.
Title Page
Abstract Introduction
Conclusions References
Tables Figures
J I
J I
Back Close
Full Screen / Esc
Printer-friendly Version
Interactive Discussion
EGU
Antonsson, K. and Seppa, H.: Holocene temperature and forest dynamics in Bohuslan, SWSweden, Boreas, in press, 2007.
Bakke, J., Dahl, S. O., Paasche, Ø., Løvlie, R., and Nesje, A.: Glacier fluctuations,equilibrium-line altitudes and palaeoclimate in Lyngen, northern Norway, during Lateglacialand Holocene, The Holocene, 15, 518–540, 2005.5
Beck, E. H., Heim, R., and Hansen, J.: Plant resistance to cold stress: Mechanism and environ-mental signals triggering frost hardening and dehardening, J. Biosci., 29, 449–459, 2004.
Bergman, J., Hammarlund, D., Hannon, G., Barnekow, L., and Wohlfarth, B.:. Deglacial vege-tation succession and Holocene tree-limit dynamics in the Scandes Mountains, west-centralSweden: stratigraphic data compared to megafossil evidence, Rev. Palaeobotany Palynol.,10
134, 129–151, 2005.Bigler, C., Larocque, I., Peglar, S. M., Birks, H. J. B., and Hall, R.: Quantitative multiproxy
assessment of long-term patterns of Holocene environmental change from a small lake nearAbisko, northern Sweden, The Holocene, 12, 481–496, 2002.
Bigler, C., Grahn, E., Larocque, I., Jeziorski, A., and Hall, R.: Holocene environmental change15
at Lake Njulla (999 m a.s.l.), northern Sweden: a comparison with four small nearby lakesalong an altitudinal gradient, J. Paleolimnol., 29, 13–29, 2003.
Bigler, C., Barnekow, L., Heinrichs, M. L., and Hall, R. I.: Holocene environmental historyof Lake Vuolep Njakajaure (Abisko National Park, northern Sweden) reconstructed usingbiological proxy indicators, Vegetation History and Archaeobotany, 15, 309–320, 2006.20
Birks, H. J. B.: Quantitative palaeoenvironmental reconstructions, in: Statistical modeling ofquaternary science data, edited by: Maddy, D. and Brew, J. S., 161–254, Technical Guide 5.Quaternary Research Association, Cambridge, 1995.
Birks, H. J. B.: Quantitative palaeoenvironmental reconstructions from Holocene biologicaldata, in: Global Change in the Holocene, edited by: Mackay, A., Battarbee, R. W., Birks,25
H. J. B., and Oldfield, F., 107–123, Arnold, London, 2003.Birks, H. J. B. and Seppa, H.: Pollen-based reconstructions of late-Quaternary climate in Eu-
rope – progress, problems, and pitfalls, Acta Palaeobotanica, 44, 317–334, 2004.Bjune, A. E., Birks, H. J. B., and Seppa, H.:. Holocene climate and vegetation history on a
continental-oceanic transect in northern Fennoscandia based on pollen and plant macrofos-30
sils, Boreas, 33, 211–223, 2004.Clark, P. U., Marshall, S. J., Clarke, G. K. C., Hostetler, S. W., Licciardi, J. M., and Teller, J.
T.: Freshwater forcing of abrupt climate change during the last glaciation, Science, 293,
180

CPD3, 165–195, 2007
8200 events inNorthern Europe
H. Seppa et al.
Title Page
Abstract Introduction
Conclusions References
Tables Figures
J I
J I
Back Close
Full Screen / Esc
Printer-friendly Version
Interactive Discussion
EGU
283–287, 2001.Clark, P. U., Pisias, N. G., Stocker, T. S., and Weaver, A. J.: The role of the Atlantic thermohaline
circulation in abrupt climate change, Nature, 415, 863–869, 2002.Cook, B. I., Smith, T. M., and Mann, M. E.: The North Atlantic Oscillation and regional phenol-
ogy prediction over Europe, Global Change Biol., 11, 1–8, 2005.5
Dahl, E.: The phytogeography of Northern Europe. Cambridge University Press: Cambridge;297 pp, 1998.
Ellison, C. R. W., Chapman, M. R., and Hall, I. R..: Surface and Deep Ocean InteractionsDuring the Cold Climate Event 8200 Years Ago, Science, 312, 1929–1932, 2006.
Frei, T.: The effects of climate change in Switzerland 1969–1996 on airborne pollen quantities10
from hazel, birch and grass, Grana, 37, 172–179, 1998.Frenguelli, G., Spieksma, F. T. M, Bricchi, E., Romano, B., Mincigrucci, G., Nikkels, A. H.,
Dankaart, W., and Ferranti, F.: The influence of air temperature on the starting dates of thepollen season of Alnus and Populus, Grana 30, 196–200, 1991.
Gervais, B. R., MacDonald, G. M., Snyder, J. A., and Kremenetski, C. V.: Pinus sylvestris15
treeline development and movement on the Kola Peninsula of Russia: pollen and stomateevidence, J. Ecol., 90, 627–638, 2002.
Giesecke, T.: Holocene dynamics of the southern boreal forest in Sweden, The Holocene, 15,858–872, 2005.
Grace, J., Berninger, F., and Nagy, L.: Impacts of climate change on tree line, Ann. Botany, 90,20
537–544, 2002.Hammarlund, D., Barnekow, L., Birks, H. J. B., Buchardt, B., and Edwards, T. W. D.: Holocene
changes in atmospheric circulation recorded in the oxygen-isotope stratigraphy of lacustrinecarbonates from northern Sweden, The Holocene, 12, 339–351, 2002.
Hammarlund, D., Bjorck, S., Buchardt, B., Israelson, C., and Thomsen, C. T.: Rapid hydrological25
changes during the Holocene revealed by stable isotope records of lacustrine carbonatesfrom Lake Igelsjon, southern Sweden, Quat. Sci. Rev., 22, 353–370, 2003.
Hammarlund, D., Bjorck, S., Buchardt, B., and Thomsen, C. T.: Limnic responses to increasedeffective humidity during the 8200 cal. yr BP cooling event in southern Sweden, J. Paleolim-nol., 34, 471–480, 2005.30
Heikkila, M. and Seppa, H.: A 11 000 yr palaeotemperature reconstruction from the southernboreal zone of Finland, Quat. Sci. Rev., 22, 541–554, 2003.
Hurrell, J. W.: Decadal trends in the North Atlantic Oscillation: Regional temperatures and
181

CPD3, 165–195, 2007
8200 events inNorthern Europe
H. Seppa et al.
Title Page
Abstract Introduction
Conclusions References
Tables Figures
J I
J I
Back Close
Full Screen / Esc
Printer-friendly Version
Interactive Discussion
EGU
precipitation, Science, 269, 676–679, 1995.Hurrell, J. W., Kushnir, Y., Ottersen, G., and Visbeck, M.: On overview of the North Atlantic Os-
cillation, in: The North Atlantic Oscillation: Climatic Significance and Environmental Impact,edited by: Hurrell, J. W., Geophys. Monograph, 1–35, Americal Geophysical Union, 2003.
Jaagus, J.: Climate changes in Estonia during the second half of the 20th century in relationship5
with changes in large-scale atmospheric circulation, Theoretical Appl. Climatol., 83, 77–88,2006.
Jager, S., Nilsson, S., Berggren, B., Pessi, A.-M., Helander, M., and Ramfjord, H.: Trends ofsome airborne tree pollen in the Nordic countries and Austria, 1980–1993, Grana 35, 171–178, 1996.10
Johnsen, S. J., Dahl-Jensen, D., Gundestrup, N., Stefensen, J. P., Clausen, H. B., Miller, H.,Masson-Delmotte, V., Sveinbjornsdottir, A. E., and White, J.: Oxygen isotope and palaeotem-perature records from six Greenland ice core stations: Camp Century, Dye-3, GRIP, GISP2,Renland and NorthGRIP, J. Quat. Sci., 16, 299–307, 2001.
Jones, V. J., Leng, M., Solovieva, N., Sloane, H. J., and Tarasov, P.: Holocene climate of the15
Kola Peninsula: evidence from the oxygen isotope record of diatom silica, Quat. Sci. Rev.,23, 833–839, 2004.
Kamenik, C. and Schmidt, R.: Chrysophyte resting stages: a tool for reconstructing win-ter/spring climate from Alpine lake sediments, Boreas, 34, 477–489, 2005.
Kasprzyk, I., Uruska, A., Szczepanek, K., Latalowa, M., Gawel, J., Harmata, K., Myszkowa, D.,20
Stach, A. and Stepalska, D.: Regional differentiation in the dynamics of the pollen seasonsof Alnus, Corylus and Fraxinus in Poland (preliminary results), Aerobiologia, 20, 141–151,2004.
Klitgaard-Kristensen, D., Sejrup, H. P., Haflidason, H., Johnsen, S., and Spurk, M.: A regional8200 cal. yr BP cooling event in northwest Europe, induced by final stages of the Laurentide25
ice-sheet deglaciation, J. Quat. Sci., 13, 165–169, 1998.Korhola, A., Weckstrom, J., Holmstrom, L., and Erasto, P.: A quantitative Holocene climatic
record from diatoms in Northern Fennoscandia, Quat. Res., 54, 284–294, 1999.Korhola, A., Vasko, K., Toivonen, H., and Olander, H.: Holocene temperature changes in
northern Fennoscandia reconstructed from chironomids using Bayesian modelling, Quat.30
Sci. Rev., 21, 1841–1860, 2002.Kramer, K. Leinonen, I. and Loustau, D.: The importance of phenology for the evaluation of im-
pact of climate changes on growth of boreal, temperate and Mediterranean forests ecosys-
182

CPD3, 165–195, 2007
8200 events inNorthern Europe
H. Seppa et al.
Title Page
Abstract Introduction
Conclusions References
Tables Figures
J I
J I
Back Close
Full Screen / Esc
Printer-friendly Version
Interactive Discussion
EGU
tems: an overview, Int. J. Biometeorol., 44, 67–75, 2000.Kryjov, V. N.: Searching for circulation patterns affecting North Europe annual temperature,
Atmos. Sci. Lett., 5, 23–34, 2004.Larocque, I. and Hall, R. I.: Chironomids as quantitative indicators of mean July air temperature,
validation by comparison with century-long meteorological records from northern Sweden,5
J. Paleolimnol., 29, 475–493, 2003.Larocque, I. and Hall, R. I.: Holocene temperature estimates and chironomid community com-
position in the Abisko Valley, northern Sweden, Quat. Sci. Rev., 23, 2453–2465, 2005.Lauritzen, S.-E. and Lundberg, J.: Calibration of the speleothem delta function: an absolute
temperature record for the Holocene in northern Norway, The Holocene, 9, 659–669, 1999.10
Linderholm, H. W, Walther, A., Chen, D., and Moberg, A.: Twentieth-century trends in thethermal growing season in the Greater Baltic Area, Climatic Change, in press, 2007.
Lotter, A. F. and Bigler, C.: Do diatoms in the Swiss Alps reflect the length of ice-cover?, AquaticSci., 62, 125–141, 2000.
Makinen, H., Nojd, P., and Mielikainen, K.: Climatic signal in annual growth variation of Norway15
spruce (Picea abies) along a transect from central Finland to the Arctic timberline, Can. J.Forest Res., 30, 769–777, 2000.
Magny, M., Begeot, C., Guiot, J., and Peyron, O.: Contrasting patterns of hydrological changesin Europe in response to Holocene climate cooling phases, Quat. Sci. Rev., 22, 1589–1596,2003.20
Nesje, A., and Dahl, S. O.: The Greenland 8200 cal. yr BP event detected in loss-on-ignitionprofiles in Norwegian lacustrine sediment sequences, J. Quat. Sci., 16, 155–166, 2001.
Ojala, A. E. K. and Tiljander, M.: Testing the fidelity of sediment chronology: comparison ofvarve and paleomagnetic results from Holocene lake sediments from central Finland, Quat.Sci. Rev., 22, 1787–1803, 2003.25
Paasche, Ø., Løvlie, R., Dahl, S. O., Bakke, J., and Nesje, A.: Bacterial magnetite in lakesediments: late glacial to Holocene climate and sedimentary changes in northern Norway,Earth Planet. Sci. Lett., 223, 319–333, 2004.
Pla, S. and Catalan, J.: Chrysophyte cysts from lake sediments reveal the submillennialwinter/spring climate variability in the northwestern Mediterranean region throughout the30
Holocene, Clim. Dyn., 24, 264–278, 2005.Prentice, I. C.: Multidimensional scaling as a research tool in Quaternary palynology: a review
of theory and methods, Rev. Palaeobotany Palynol., 31, 71–104, 1980.
183

CPD3, 165–195, 2007
8200 events inNorthern Europe
H. Seppa et al.
Title Page
Abstract Introduction
Conclusions References
Tables Figures
J I
J I
Back Close
Full Screen / Esc
Printer-friendly Version
Interactive Discussion
EGU
Renssen, H., Goosse, H., and Fichefet, T.: Modeling the effect of freshwater pulses on the earlyHolocene climate: the influence of high-frequency climate variability, Paleoceanography, 17,1–16, 2002.
Renssen, H., Goosse, H., Fichefet, T., and Campin, J.-M.: The 8.2 kyr BP event simulated by aglobal atmosphere-seaice-ocean model, Geophys. Res. Lett., 28, 1567–1570, 2001.5
Repo, T.: Seasonal changes of frost hardiness in Picea abies and Pinus sylvestris in Finland,Can. J. Forest Res., 22, 1949–1957, 1992.
Rodwell, M. J., Rowell, D. P., and Folland, C. K.: Oceanic forcing of the wintertime North AtlanticOscillation and European climate, Nature, 398, 320–323, 1999.
Rohling, E. J. amd Palike, H.: Centennial-scale climate cooling with a sudden cold event around10
8200 years ago, Nature, 434, 975–979, 2005.Rosen, P., Segerstrom, U., Eriksson, L., Renberg, I., and Birks, H. J. B.: Holocene climate
change reconstructed from diatoms, chironomids, pollen and near-infrared spectroscopy atan alpine lake (Sjuodjijaure) in northern Sweden, The Holocene, 11, 551–562, 2001.
Rotzer, T. and Chmielewski, F.-M.: Phenological maps of Europe, Clim. Res., 18, 259–257,15
2001.Sarmaja-Korjonen, K.: Chydorid ephippia as indicators of past environmental changes – a new
method, Hydrobiologia, 526, 129–136, 2004.Sarmaja-Korjonen, K. and Seppa, H.: Abrupt and consistent responses of aquatic and terres-
trial ecosystems during the 8200 cal yr cold event – a lacustrine record from Lake Arapisto,20
Finland, The Holocene, in press, 2007.Schulz, M., Paul, A., and Timmermann, A.: Glacial-interglacial contrast in climate variability at
centennial-to-millennial timescales: observations and conceptual model, Quat. Sci. Rev., 23,2219–2230, 2004.
Seager, R., Battisti, D. S., Yin, J., Gordon, N., Naik, N., Clement, A. C., and Cane, M. A.: Is the25
Gulf Stream responsible for Europe’s mild winters?, Q. J. R. Meteorol. Soc., 128, 2563–2586,2002.
Seppa, H. and Birks, H. J. B.: July mean temperature and annual precipitation trends duringthe Holocene in the Fennoscandian tree-line area: pollen-based climate reconstructions,The Holocene, 11, 527–539, 2001.30
Seppa, H. and Birks, H. J. B.: Holocene climate reconstructions from the Fennoscandian tree-line area based on pollen data from Toskaljavri, Quat. Res., 57, 191–199, 2002.
Seppa, H., Nyman, M., Korhola, A., and Weckstrom, J.: Changes in treelines and alpine vege-
184

CPD3, 165–195, 2007
8200 events inNorthern Europe
H. Seppa et al.
Title Page
Abstract Introduction
Conclusions References
Tables Figures
J I
J I
Back Close
Full Screen / Esc
Printer-friendly Version
Interactive Discussion
EGU
tation in relation to post-glacial climate dynamics in northern Fennoscandia based on pollenand chironomid records, J. Quat. Sci., 17, 287–301, 2002.
Seppa, H., Birks, H. J. B, Odland, A., Poska, A., and Veski, S.: A modern pollen-climatecalibration set from northern Europe: testing and developing a tool for palaeoclimatologicalreconstructions, J. Biogeogr., 31, 251–267, 2004.5
Seppa, H., Hammarlund, D., and Antonsson, K.: Low- and high-frequency changes of temper-ature and effective humidity during the Holocene in south central Sweden: Implications foratmospheric and oceanic forcings of climate, Clim. Dyn., 25, 285–297, 2005.
Severinghaus, J. P. and Brook, E. J.: Abrupt climate change at the end of the last glacial periodinferred from trapped air in polar ice, Science, 286, 930–934, 1999.10
Snowball, I., Zillen, L., and Gaillard, M. J.: Rapid early-Holocene environmental changes innorthern Sweden based on studies of two varved lake-sediment sequences, The Holocene,12, 7–16, 2002.
Sorvari, S. Korhola, A., and Thompson, R.: Lake diatom response to recent Arctic warming inFinnish Lapland, Global Change Biol., 8, 153–163, 2002.15
Spieksma, F. T. M., Corden, J. M., Detandt, M., Millington, W. M., Nikkels, H., Nolard, N.,Schoenmakers, C. H. H., Wachter, R., de Weger, L. A., Willems, R., and Emberlin, J.:Quantitative trends in annual totals of five common airborne pollen types (Betula, Quer-cus, Poaceae, Urtica, and Artemisia), at five pollen-monitoring stations in western Europe,Aerobiologia, 19, 171–184, 2003.20
Spurk, M., Leuschner, H. H., Baillie, M. G. L., Briffa, K. R., and Friedrich, M.: Depositionalfrequency of German fossil oaks: climatically and non-climatically induced fluctuations in theHolocene, The Holocene, 12, 707–715, 2002.
Stocker, T.: Past and future reorganisations in the climate system, Quat. Sci. Rev, 19, 301–319,2000.25
Stouffer, R. J., Yin, J., Gregory, J. M., Dixon, K. W., Spelman, M. J., Hurlin, W., Weaver, A. J.,Eby, M., Flato, G. M., Hu, A., Jungclaus, J. H., Kamenkovich, I. V, Levermann, A., Montoya,M., Murakami, S., Nawrath, S., Oka, A., Peltier, W. R., Robitaille, D. Y., Sokolov, A., Vet-toretti, G., and Weber, S. L.: Investigating the Causes of the Response of the ThermohalineCirculation to Past and Future Climate Changes, J. Climate, 19, 1365–1387, 2006.30
Sutton, R. T. and Hodson, D. L. R.: Influence of the Ocean on North Atlantic Climate Variability1871–1999, J. Climate, 16, 3296–3313, 2003.
ter Braak, C. J. F. and Juggins, S.: Weighted averaging partial least squares regression (WA-
185

CPD3, 165–195, 2007
8200 events inNorthern Europe
H. Seppa et al.
Title Page
Abstract Introduction
Conclusions References
Tables Figures
J I
J I
Back Close
Full Screen / Esc
Printer-friendly Version
Interactive Discussion
EGU
PLS): an improved method for reconstructing environmental variables from species assem-blages, Hydrobiologia, 269/270, 485–502, 1993.
Vellinga, M. and Wood, R. A.: Global climatic impacts of a collapse of the Atlantic thermohalinecirculation, Clim. Changes, 54, 251–267, 2002.
Veski S, Seppa, H. and Ojala, A. E. K.: Cold event at 8200 yr B.P. recorded in annually lami-5
nated lake sediments in eastern Europe, Geology, 32, 681–684, 2004.von Grafenstein, U., Erlenkeuser, H., Muller, J., Jouzel, J., and Johnsen, S.: The cold event
8200 years ago documented in oxygen isotope records of precipitation in Europe and Green-land, Clim. Dyn., 14, 73–81, 1998.
Wielgolaski, F.-E.: Starting dates and basic temperatures in phenological observation of plants,10
Int. J. Biometeorol., 42, 158–168., 1999.Wiersma, A. P. and Renssen, H.: Model-data comparison for the 8.2 ka BP event: Confirmation
of a forcing mechanism by catastrophic drainage of Laurentide Lakes, Quat. Sci. Rev., 25,63–88, 2006.
Wiersma, A. P., Renssen, H., Goosse, H., and Fichefet, T.: Evaluation of different freshwater15
forcing scenarios for the 8.2 ka BP event in a coupled climate model, Clim. Dyn., 831–849,doi:10.1007/s00382-006-0166-0, 2006.
Wu, P. and Rodwell, M. J.: Gulf Stream forcing of the winter North Atlantic oscillation, Atmos.Sci. Lett.,, 57–64, 2004.
Wunsch, C.: Abrupt climate change: An alternative view, Quat. Res., 65, 191–203, 2006.20
186

CPD3, 165–195, 2007
8200 events inNorthern Europe
H. Seppa et al.
Title Page
Abstract Introduction
Conclusions References
Tables Figures
J I
J I
Back Close
Full Screen / Esc
Printer-friendly Version
Interactive Discussion
EGU
Table 1. Geographical locations and references of the pollen and oxygen-isotope records dis-cussed in the study.
lat. long. calibration model reference
1 Rouge, Estonia 57◦44′ 26◦54′ Tann-3 Veski et al. (2004)A Igelsjon, Sweden 58◦28′ 13◦44′ Hammarlund et al. (2003, 2005)2 Trehorningen, Sweden 58◦33′ 11◦36′ Tann-3 Antonsson and Seppa (2007)3 Flarken , Sweden 58◦33′ 13◦44′ Tann-3 Seppa et al. (2005)4 Arapisto, Finland 60◦,35′ 24◦05′ Tann-2 Sarmaja-Korjonen and Seppa (2007)5 Holtjarnen, Sweden 60◦39′ 15◦56′ Tann-3 this paper; Giesecke (2005)6 Laihalampi, Finland 61◦29′ 26◦04′ Tann-1 Heikkila and Seppa (2003)7 Nautajarvi, Finland 61◦48′ 24◦41′ Tann-3 Ojala et al. (2007)1
8 Klotjarnen, Sweden 61◦49′ 16◦32′ Tann-3 this paper; Giesecke (2005)B Tibetanus, Sweden 68◦20′ 18◦42′ Hammarlund et al. (2002)9 Tsuolbmajavri, Finland 68◦41′ 22◦05′ Tjul Seppa and Birks (2001)10 KP Lake, Russia 68◦48′ 35◦19′ Tjul this paper; Gervais et al. (2002)11 Dalmutladdo, Norway 69◦10′ 20◦43′ Tjul Bjune et al. (2004)12 Toskaljavri, Finland 69◦12′ 21◦28′ Tjul Seppa and Birks (2002)
1 Ojala, A. E. K., Alenius, T., and Seppa, H.: Integration of the clastic-organic varve record from Finland with a pollen-based climate reconstruction for solving the Holocene seasonal temperature patterns in the high latitudes, submitted,2007.
187

CPD3, 165–195, 2007
8200 events inNorthern Europe
H. Seppa et al.
Title Page
Abstract Introduction
Conclusions References
Tables Figures
J I
J I
Back Close
Full Screen / Esc
Printer-friendly Version
Interactive Discussion
EGU
Table 2. The performance statistics of the pollen-climate calibration models used for producingthe temperature records. RMSEP = root mean square error of prediction, R2 = coefficient ofdetermination between the observed temperature and that predicted by the model.
Model number of samples RMSEP R2 max. bias
Tjul 304 0.99◦C 0.71 3.94◦CTann-1 113 0.91◦C 0.85 2.12◦CTann-2 137 0.89◦C 0.88 2.13◦CTann-3 174 0.95◦C 0.88 2.10◦C
188

CPD3, 165–195, 2007
8200 events inNorthern Europe
H. Seppa et al.
Title Page
Abstract Introduction
Conclusions References
Tables Figures
J I
J I
Back Close
Full Screen / Esc
Printer-friendly Version
Interactive Discussion
EGU
1
7
2 3
Southern arctic zone
Boreal zone
Temperate-Boreal zone
6
1091211
4
5
8
B
A
Fig. 1. The locations of sites (1–12) from which pollen-based temperature reconstructions usedin this study have been obtained, together with sites (1, A, B) with oxygen-isotope records usedfor comparison (Table 1). The approximate boundaries of the main biomes in the region areshown. 1 = Lake Rouge, Estonia, 2 = Lake Trehorningen, Sweden, 3 = Lake Flarken, Sweden,4 = Lake Arapisto, Finland, 5 = Lake Holtjarnen, Sweden, 6 = Lake Laihalampi, Finland, 7 =Lake Nautajarvi, 8 = Lake Klotjarnen, Sweden, Finland, 9 = Lake Tsuolbmajavri, Finland, 10 =Lake KP-2, Russia, 11 = Lake Dalmutladdo, Norway, 12 = Lake Toskaljavri, Finland, A = LakeIgelsjon, Sweden, B = Lake Tibetanus, Sweden.
189

CPD3, 165–195, 2007
8200 events inNorthern Europe
H. Seppa et al.
Title Page
Abstract Introduction
Conclusions References
Tables Figures
J I
J I
Back Close
Full Screen / Esc
Printer-friendly Version
Interactive Discussion
EGU
7000 70007500 75008000 80008500 85009000 90009500 9500Cal yr BP Cal yr BP
Lake Rouge Lake Rouge
Lake Flarken
Lake Arapisto
Lake Laihalampi
Lake Flarken
Lake Arapisto
Lake Laihalampi
A) Corylus B) Ulmus
% %
% %
% %
% %
6.0
6.0
15
15
8.0
20
20
5.0
5.0
5.0
5.0
16.0
4.04.0
4.0
4.0
12.0
8.0
4.0
10
10
3.03.0
3.0
3.0
2.02.0
2.0
2.0
2.0
5.0
5.0
1.0 1.0
1.0
1.0
4.0
Fig. 2. Corylus and Ulmus pollen percentage curves at 9500 to 7000 cal yr BP from four sitesin the southern and central parts of the study area. No records of these pollen types are shownfrom the sites in the far north of Europe because these thermophilous taxa do not occur there.See Fig. 1 for the locations of the sites.
190
CPD3, 165–195, 2007
8200 events inNorthern Europe
H. Seppa et al.
Title Page
Abstract Introduction
Conclusions References
Tables Figures
J I
J I
Back Close
Full Screen / Esc
Printer-friendly Version
Interactive Discussion
EGU
70007000
15
20
20
3.0
3.0
18
2.0
2.0
10
15
2.0
2.0
16
1.5
1.5
5
10
14
1.0
1.0
30
5
1.0
1.0
12
0.5
0.5
20
0
10
75007500 80008000 85008500 90009000 95009500
%
%
%
%
%
%
% %
Cal yr BP Cal yr BP
Lake Arapisto
Lake Flarken
Lake Rouge
Lake Laihalampi
LakeTsuolbmajavri
Lake Toskaljavri
Lake Dalmutladdo
Lake KP-2
Fig. 3. Alnus pollen percentage curves at 9500 to 7000 cal yr BP from the eight sites in northernEurope. Sites on the left, showing a decline of the Alnus values at about 8300–8100 cal yr BP,are from the southern part of the study area, whereas sites of the right, with no clear decline ofAlnus, are from the North-European tree-line region. See Fig. 1 for the locations of the sites.
191

CPD3, 165–195, 2007
8200 events inNorthern Europe
H. Seppa et al.
Title Page
Abstract Introduction
Conclusions References
Tables Figures
J I
J I
Back Close
Full Screen / Esc
Printer-friendly Version
Interactive Discussion
EGU
Cal yr BP
Cal yr BP
Cal yr BP
Cal yr BP
0
0
13.0
13.0
5.0
5.0
5.0
5.0
8.0
8.0
9.0
9.0
13.0
Tjul
Tjul
Tjul
Tann
Tann
Tann
Tann
Tann
Tann
0
0
0
0
0
0
0
-1
-1
12.0
12.011.0
4.0
4.0
3.0
3.0
12.0
11.0
-1
-1
-1
-1
-1
-1
-1
-2
-2
1
1
14.0
14.0
6.0
6.0
6.0
6.0
6.0
6.0
5.0
7.0
7.0
7.0
8.0
7.0
7.0
1
1
1
1
1
1
1
15.0
7000
7000
7000
7000
7400
7400
7400
7400
7800
7800
7800
7800
8200
8200
8200
8200
8600
8600
8600
8600
9000
9000
9000
9000
9400
9400
9400
9400
2
2
A) Lake Rouge
B) Lake Flarken
C) Lake Arapisto
D) Lake Holtjärnen
E) Lake Laihalampi
F) Lake Nautajärvi
H) Lake KP-2
G) Lake Tsuolbmajavri
I) Lake Toskaljavri
Fig. 4. Pollen-based Tann and Tjul reconstructions at nine sites for the time period 9500 to 7000cal yr BP arranged from the southernmost to the northernmost site. Original records are shownon the left hand side. The panel on the right shows the residuals after detrending the recordswith a third-order polynomial curve. See Fig. 1 for the locations of the sites.
192

CPD3, 165–195, 2007
8200 events inNorthern Europe
H. Seppa et al.
Title Page
Abstract Introduction
Conclusions References
Tables Figures
J I
J I
Back Close
Full Screen / Esc
Printer-friendly Version
Interactive Discussion
EGU
1.00.5oC
0
Fig. 5. Map showing the geographical pattern of the temperature change. The blue colourindicates cooling and red colour warming during the 8200 cal yr BP event. The temperaturedeviation at the event is calculated as the difference between the mean temperature at 8350–8050 cal yr BP and the mean for the periods 8850–8350 and 8050–7550 cal yr BP.
193

CPD3, 165–195, 2007
8200 events inNorthern Europe
H. Seppa et al.
Title Page
Abstract Introduction
Conclusions References
Tables Figures
J I
J I
Back Close
Full Screen / Esc
Printer-friendly Version
Interactive Discussion
EGU
56o
58o
60o
62o
64o
66o
68o
70o
-1.4 -1.2 -1.0 -0.8 -0.6 -0.4 -0.2 0 0.2
latit
ude
Temperature deviationCo
Fig. 6. Temperature deviation during the 8200 cal yr BP event along a south-to-north gradient.Data from all 12 pollen-based records are included. The deviation is calculated by comparingthe reconstructed average July mean temperature or annual mean temperature at 8350–8050cal yr BP relative to the mean temperature of the periods 8850–8350 cal yr BP and 8050–7550cal yr BP.
194

CPD3, 165–195, 2007
8200 events inNorthern Europe
H. Seppa et al.
Title Page
Abstract Introduction
Conclusions References
Tables Figures
J I
J I
Back Close
Full Screen / Esc
Printer-friendly Version
Interactive Discussion
EGU
7000 7500 8000 8500 9000 9500
Cal yr BP
-14
-13
-12
-11
-10
-9
-8
-7
-6?18
O(‰
V-P
DB)
Lake Igelsjön (58ON, 13OE)
Lake Tibetanus (68ON, 18OE)
Lake Rouge (58ON, 27OE)
Fig. 7. Comparison of δ18O records obtained on fine-grained sedimentary calcite from smalllakes (0.5–4 ha) in the study area, Lakes Igelsjon (Hammarlund et al., 2003, 2005; Seppa etal., 2005), Rouge (Veski et al., 2004), and Tibetanus (Hammarlund et al., 2002). See Fig. 1 forthe locations of the sites.
195