Data mining for decision support on customer insolvency in telecommunications business
17
Data mining for decision support on customer insolvency in telecommunications business S. Daskalaki a , I. Kopanas b , M. Goudara a , N. Avouris b, * a Department of Engineering Sciences, University of Patras, Rio Patras GR-26500, Greece b Department of Electrical and Computer Engineering, University of Patras, Rio Patras GR-26500, Greece Abstract This paper reports on the findings of a research project that had the objective to build a decision support system to handle customer insolvency for a large telecommunication company. Prediction of customer insolvency, well in ad- vance, and with an accuracy that could make this prediction useful in business terms, was one of the core objectives of the study. In the paper the process of building such a predictive model through knowledge discovery and data mining techniques in vast amounts of heterogeneous as well as noisy data is described. The reported findings are very promising, making the proposed model a useful tool in the decision making process, while some of the discussed problems and limitations are of interest to researchers who intend to use data mining approaches in other similar real- life problems. Ó 2002 Elsevier Science B.V. All rights reserved. Keywords: Decision support systems; Predictive data mining; Classification; Customer insolvency 1. Introduction Telecommunication companies, as well as other service-providing companies, often suffer from in- solvent customers who use the provided services without paying their dues. Companies in tele- communications business take precautions against these customers; however, in most cases this refers to measures applied quite late, often with no sig- nificant effect. As a result many unpaid bills end up in the account of uncollectible debts. Thus, failure of some customers to pay their dues results in con- siderable loss of revenue for the company. Detec- tion and prevention of this behavior is an objective of prime importance for the industry. This is es- pecially important today that strong competition is building in many sectors of the telecommuni- cations industry as monopolies cease to exist. A model, capable of predicting insolvent be- havior of customers well in advance, being avail- able, can be a useful decision support tool for a service-providing company. However building such a model is not a trivial process. The research reported here sets as its prime objective to study the feasibility of building such a tool for a major telecommunications operator using data mining techniques. European Journal of Operational Research 145 (2003) 239–255 www.elsevier.com/locate/dsw * Corresponding author. E-mail addresses: [email protected] (S. Daskalaki), ikop- [email protected] (I. Kopanas), [email protected] tras.gr (M. Goudara), [email protected] (N. Avouris). 0377-2217/03/$ - see front matter Ó 2002 Elsevier Science B.V. All rights reserved. PII:S0377-2217(02)00532-5
Transcript of Data mining for decision support on customer insolvency in telecommunications business
Data mining for decision support on customer insolvencyin telecommunications business
S. Daskalaki a, I. Kopanas b, M. Goudara a, N. Avouris b,*
a Department of Engineering Sciences, University of Patras, Rio Patras GR-26500, Greeceb Department of Electrical and Computer Engineering, University of Patras, Rio Patras GR-26500, Greece
Abstract
This paper reports on the findings of a research project that had the objective to build a decision support system to
handle customer insolvency for a large telecommunication company. Prediction of customer insolvency, well in ad-
vance, and with an accuracy that could make this prediction useful in business terms, was one of the core objectives of
the study. In the paper the process of building such a predictive model through knowledge discovery and data mining
techniques in vast amounts of heterogeneous as well as noisy data is described. The reported findings are very
promising, making the proposed model a useful tool in the decision making process, while some of the discussed
problems and limitations are of interest to researchers who intend to use data mining approaches in other similar real-
life problems.
� 2002 Elsevier Science B.V. All rights reserved.
Keywords: Decision support systems; Predictive data mining; Classification; Customer insolvency
1. Introduction
Telecommunication companies, as well as other
service-providing companies, often suffer from in-
solvent customers who use the provided serviceswithout paying their dues. Companies in tele-
communications business take precautions against
these customers; however, in most cases this refers
to measures applied quite late, often with no sig-
nificant effect. As a result many unpaid bills end up
in the account of uncollectible debts. Thus, failure
of some customers to pay their dues results in con-
siderable loss of revenue for the company. Detec-
tion and prevention of this behavior is an objective
of prime importance for the industry. This is es-
pecially important today that strong competitionis building in many sectors of the telecommuni-
cations industry as monopolies cease to exist.
A model, capable of predicting insolvent be-
havior of customers well in advance, being avail-
able, can be a useful decision support tool for a
service-providing company. However building
such a model is not a trivial process. The research
reported here sets as its prime objective to studythe feasibility of building such a tool for a major
telecommunications operator using data mining
techniques.
European Journal of Operational Research 145 (2003) 239–255
www.elsevier.com/locate/dsw
*Corresponding author.
E-mail addresses: [email protected] (S. Daskalaki), ikop-
[email protected] (I. Kopanas), [email protected]
tras.gr (M. Goudara), [email protected] (N. Avouris).
0377-2217/03/$ - see front matter � 2002 Elsevier Science B.V. All rights reserved.
PII: S0377-2217 (02 )00532-5
The decision to use data mining techniques in
this study is based on the observation that tele-
communication companies collect high volumes of
data relating to different aspects of the interaction
that takes place between the company and its
customers. While in most cases dispersed, thesedata when inter-related may contain valuable in-
formation relating to the insolvency-prediction
problem. Examples of such data are: (a) customer
profiles, (b) usage of the offered service, and (c)
financial transactions of the customers with the
company.
Like fraudsters in other fraud detection prob-
lems, it is assumed that insolvent customers on theaverage behave differently from the rest of the
customers, especially during a critical period pre-
ceding the due-date for payment. The goal is
therefore to reveal those behavioral patterns, which
may distinguish these customers from the rest.
When this information is combined with other
features the whole process may result to rules that
lead to predictions for possible insolvencies. Forthe purposes of this research an experiment was
performed, to prove the hypothesis that in some
cases customer insolvency could be detected much
earlier than it is done today and this in fact may
save the company a considerable amount of lost
revenue.
Some of the inherent limitations that make this
a particularly difficult problem, as identified earlyin the study, were the following:
(a) Insolvent customer�s behavior can be eitherthe result of fraudulence or due to factors beyond
the customer�s will (force majeure, social factorsetc.). The premise of the changing customer be-
havior is obviously related to the former case and
not the latter. Prediction of the second case is
particularly hard, while its existence makes iden-tification of the former cases more difficult.
(b) The available data sets, as often is the case
with real life problems, represent the individual
customer in a limited and distorted way. This is
because the source of our information is exclu-
sively the telecommunication company and the
information that this company can maintain on its
customers. For various ethical and legal reasons,this information cannot be inter-related to other
sources of information; so the customer is repre-
sented as user of the particular service, with no
means of revealing other social or financial aspects
that might had influenced the individual�s behaviorpatterns and might had strong impact towards an
insolvent behavior.(c) In the available large data set, many pa-
rameters can be defined, often deduced from pri-
mary transactional data, which can describe the
behavior of a customer of a modern telecommu-
nications company. Selection of the most relevant
ones for our problem is a tedious process that can
be partly based on statistical analysis tools and
techniques and partly on understanding the sig-nificance of the parameters in the given problem by
the researchers involved. So the process of identi-
fying a subset of these parameters, and subse-
quently using adequate tools for selecting the most
relevant ones is a crucial and important phase,
often directly related to the particular problem and
not easily reproducible.
The outlined difficulties of the problem arecompensated by the fact that there is already a rich
literature on studies with some similarities with
our problem as discussed in Section 2 of the paper.
Also, data mining techniques have matured during
the last years and examples of successful applica-
tion in various areas have been reported. Fur-
thermore, this particular study has been based on a
meticulous and long process of knowledge dis-covery in data found in a multitude of information
systems of the telecommunications operator, as
described in Section 3 of the paper. As discussed in
this paper, statistical analysis and data mining
techniques were used as part of this knowledge
discovery process.
The findings of the study, outlined in the paper,
are significant, since it has been shown that theassumption of differentiation in customer behavior
between insolvent and solvent customers is true. In
particular it has been shown that by using various
data mining techniques, like discriminant analysis,
decision trees and neural networks, it is possible to
predict insolvencies in such a way that this pre-
diction can be operationally useful for the decision
support process of the telecommunications busi-ness relating to this problem.
240 S. Daskalaki et al. / European Journal of Operational Research 145 (2003) 239–255
2. Review of similar problems
Business literature quite often refers to cus-
tomer insolvencies (e.g. Brockett et al., 1997;
Canalli, 2001), however in their terms the cus-tomer almost always refers to corporations, which
become financially delinquent to its creditors and
eventually declare bankruptcy. For our problem,
the telephone company has very limited informa-
tion regarding the financial situation of its cus-
tomers. On the contrary, there are records on
customer transactions either through the billing
department or through the switching centers. Inthat sense, the prediction of customer insolvency
for a telecommunication company as a problem is
closer to the fraud detection problems appearing
in mobile and conventional communications as well
as in credit or calling card operations. The fraud
problems reviewed here carry several common
characteristics, which are summarized below.
• Significant loss of revenue for the company that
provides the service, sometimes exceeding the al-
lowable percentage of the gross margin set as
upper limit for companies in their corresponding
sectors.
• Unpredictability of human behavior, which
makes the problem of fraud detection quite dif-
ficult in general. Fraud detection procedures re-quire study of data that express human behavior
and it is the task of the fraud detector to distin-
guish legitimate from fraudulent behavior.
• Information can be retrieved only after processing
huge amounts of data, which may in fact origi-
nate from several different sources of the com-
pany involved. From previous studies in the
area of fraud detection it is obvious that thedata required are the everyday customer trans-
actions, like the call detail records (CDRs) and
customer purchases. Information regarding
these transactions are routinely collected from
information systems for different purposes, like
billing, customer servicing, etc., however, they
are very important for studying the behavioral
differences between fraudsters and normal cus-tomers. In many cases these data by themselves
are not enough for extracting useful information
and data from other sources in the company is
additionally needed.
• Fraudulent cases are rare compared to the legit-
imate ones. This fact creates an additional diffi-
culty in training algorithms for fraud detection.
In the following, we briefly review studies on
similar problems appearing in the mobile com-
munications, conventional communications and
credit card sectors.
2.1. Fraud in mobile communications
Fraud in telecommunications in general is quite
a common phenomenon, because there is a low
detection risk and in most cases no special equip-
ment is needed; most importantly, however, be-
cause selling the access to the network may create
revenue for the fraudsters (Hoath, 1998).
In mobile telecommunications networks fraudappears with several forms. Some of them may
disappear with the help of technological advances
in the mobile phone and network technology,
however several new others will appear. Service
providers loose a considerable amount of money
and detection of fraud attempts becomes of prime
priority for them. Knowledge discovery along
with data mining techniques promise to provideeffective tools for addressing some of these prob-
lems.
Researchers as in Fawcett and Provost (1997)
have studied data from cellular communication
providers. In this work, it is shown that with the
help of knowledge discovery and data mining
techniques it is possible to detect attempts of
cloning fraud with a high degree of accuracy.Other types of fraud have been studied in Burge
et al. (1997) and Shawe-Taylor et al. (1999) and
neural networks have been applied for detecting
attempts for fraud in systems currently used in
Europe. Accessing real data and testing predictive
algorithms often is a problem. Simulation may
then substitute real situation (Barson et al., 1996),
however the effectiveness of the algorithms may bedoubtful.
S. Daskalaki et al. / European Journal of Operational Research 145 (2003) 239–255 241

2.2. Fraud in conventional communications
Several types of fraud have also been identi-
fied in conventional telecommunications services.
Examples of fraud instances include subscriptionfraud, unauthorised calling card usage, fraud
through PBXs, etc. Global losses due to telephone
fraud are estimated to be as high as billions of
dollars a year (Hoath, 1998). Like with mobile
communications, fraudsters take advantage of
technological loopholes in systems; at the same
time they exploit procedures traditionally applied
by telecommunication companies for buildingtrusting relationship with their customers. The
problem of uncollectible debts resulting from un-
reliable/insolvent customers initially has been ad-
dressed in Ezawa and Norton (1995, 1996). In
these article it is reported that detecting unreliable
customers is possible when treated as a classifica-
tion problem, and the proposed classifier is based
on Bayesian networks.Unauthorised calling card usage has been
studied by Yuhas and initial results are reported in
Yuhas (1993). Due to the lack of clearly identified
fraud cases unsupervised learning models have
been adopted for that study. By means of clus-
tering algorithms users of calling cards are
grouped in clusters based on the values of nine
variables, suitably selected to summarize userprofiles.
2.3. Fraud in credit card usage
Studies with data from credit card usage suggest
that fraud in this area may be detected with a
reasonable level of certainty if treated as classifi-
cation problem, where individual transactions areclassified either as potentially fraud or non-fraud
related. Moreover, with the rapid expansion of
e-commerce worldwide scalable techniques sug-
gested by data mining become indispensable in
order to analyse massive amounts of data in a
timely manner (Chan et al., 1999). Fraud cases in
the credit card domain exist due to lost, stolen,
counterfeit or non-received cards, fraudulent ap-plications and exploitation of the mail-order sys-
tem. For all the aforementioned cases classifiers
based on discriminant analysis (Richardson, 1997),
multi-layer perceptron neural networks (Aleskerov
et al., 1997; Dorronsoro et al., 1997; Ghosh and
Reilly, 1994) have been proposed.
Also, in the credit card domain a few billions of
dollars are lost per year for the service providers to
what is referred as charge-off losses, mainly due topersonal bankruptcy. Application of data mining
techniques for knowledge discovery may result to
the construction of a decision tree to be used as
classifier for the accounts reviewed. As reported in
Donato et al. (1999) combining the decision tree
classifier with neural networks, it is possible to
construct a decision support system for on-line
operation with temporal data like customertransactions.
3. Insolvency prediction as the result of a ‘‘knowl-
edge discovery in data’’ process
The bottom line for all studies that have been
reported so far in the area of fraud detection isthat an experiment has to be set to test whether
detection of fraudulent actions is possible and to
decide about the level of accuracy that is possible
to be achieved. In the case of customer insolvency
with conventional communications one may find
certain characteristics that distinguish this prob-
lem from other fraud cases. Specifically, the cus-
tomers are not mobile, so the characteristic ‘‘originof the call’’ is not a useful classifier. On the other
hand, it is often the case that a telephone con-
nection might correspond to multiple users, while
unauthorised use can be a more frequent reason
for a high bill that can lead to insolvency.
A term often used to describe the process of
building a decision support system based in great
extend on large amounts of available data is thatof knowledge discovery from data (KDD). KDD
is defined as the ‘‘nontrivial process of identifying
valid, novel, potentially useful, and ultimately
understandable patterns in data’’ (Frawley et al.,
1991). The study reported in this paper can
be described as a KDD experiment. Following a
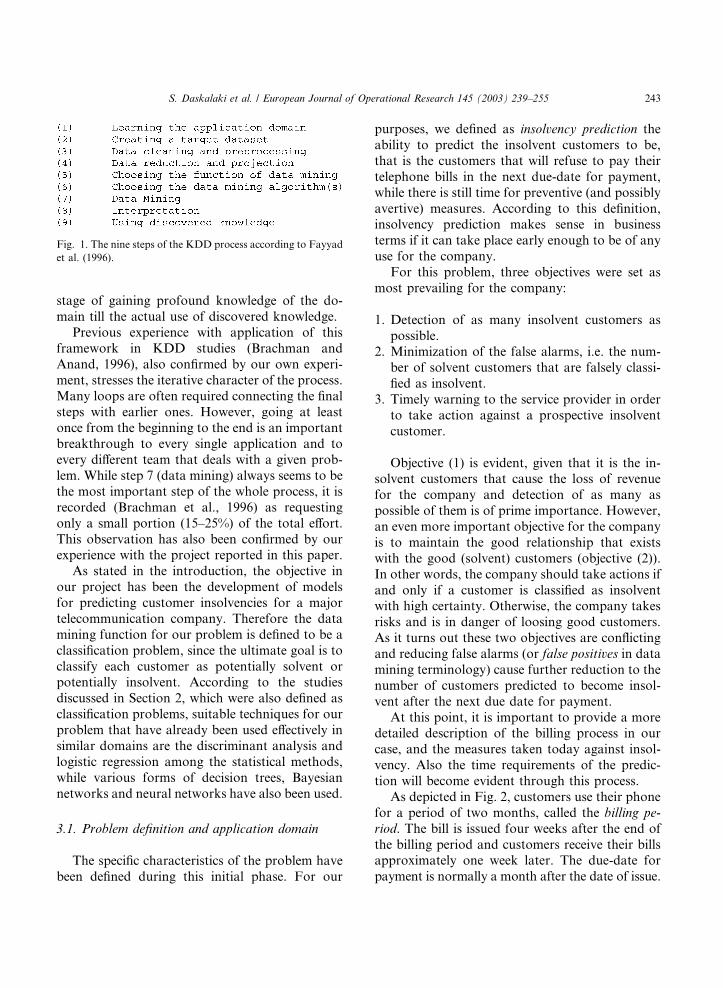
typical KDD framework (Fayyad et al., 1996; Han
and Kamber, 2001), where data mining is the corein the overall process, the experiment went
through all nine steps of Fig. 1, starting from the
242 S. Daskalaki et al. / European Journal of Operational Research 145 (2003) 239–255
stage of gaining profound knowledge of the do-
main till the actual use of discovered knowledge.
Previous experience with application of this
framework in KDD studies (Brachman and
Anand, 1996), also confirmed by our own experi-
ment, stresses the iterative character of the process.
Many loops are often required connecting the final
steps with earlier ones. However, going at leastonce from the beginning to the end is an important
breakthrough to every single application and to
every different team that deals with a given prob-
lem. While step 7 (data mining) always seems to be
the most important step of the whole process, it is
recorded (Brachman et al., 1996) as requesting
only a small portion (15–25%) of the total effort.
This observation has also been confirmed by ourexperience with the project reported in this paper.
As stated in the introduction, the objective in
our project has been the development of models
for predicting customer insolvencies for a major
telecommunication company. Therefore the data
mining function for our problem is defined to be a
classification problem, since the ultimate goal is to
classify each customer as potentially solvent orpotentially insolvent. According to the studies
discussed in Section 2, which were also defined as
classification problems, suitable techniques for our
problem that have already been used effectively in
similar domains are the discriminant analysis and
logistic regression among the statistical methods,
while various forms of decision trees, Bayesian
networks and neural networks have also been used.
3.1. Problem definition and application domain
The specific characteristics of the problem have
been defined during this initial phase. For our
purposes, we defined as insolvency prediction the
ability to predict the insolvent customers to be,
that is the customers that will refuse to pay their
telephone bills in the next due-date for payment,
while there is still time for preventive (and possibly
avertive) measures. According to this definition,insolvency prediction makes sense in business
terms if it can take place early enough to be of any
use for the company.
For this problem, three objectives were set as
most prevailing for the company:
1. Detection of as many insolvent customers as
possible.2. Minimization of the false alarms, i.e. the num-
ber of solvent customers that are falsely classi-
fied as insolvent.
3. Timely warning to the service provider in order
to take action against a prospective insolvent
customer.
Objective (1) is evident, given that it is the in-solvent customers that cause the loss of revenue
for the company and detection of as many as
possible of them is of prime importance. However,
an even more important objective for the company
is to maintain the good relationship that exists
with the good (solvent) customers (objective (2)).
In other words, the company should take actions if
and only if a customer is classified as insolventwith high certainty. Otherwise, the company takes
risks and is in danger of loosing good customers.
As it turns out these two objectives are conflicting
and reducing false alarms (or false positives in data
mining terminology) cause further reduction to the
number of customers predicted to become insol-
vent after the next due date for payment.
At this point, it is important to provide a moredetailed description of the billing process in our
case, and the measures taken today against insol-
vency. Also the time requirements of the predic-
tion will become evident through this process.
As depicted in Fig. 2, customers use their phone
for a period of two months, called the billing pe-
riod. The bill is issued four weeks after the end of
the billing period and customers receive their billsapproximately one week later. The due-date for
payment is normally a month after the date of issue.
Fig. 1. The nine steps of the KDD process according to Fayyad
et al. (1996).
S. Daskalaki et al. / European Journal of Operational Research 145 (2003) 239–255 243
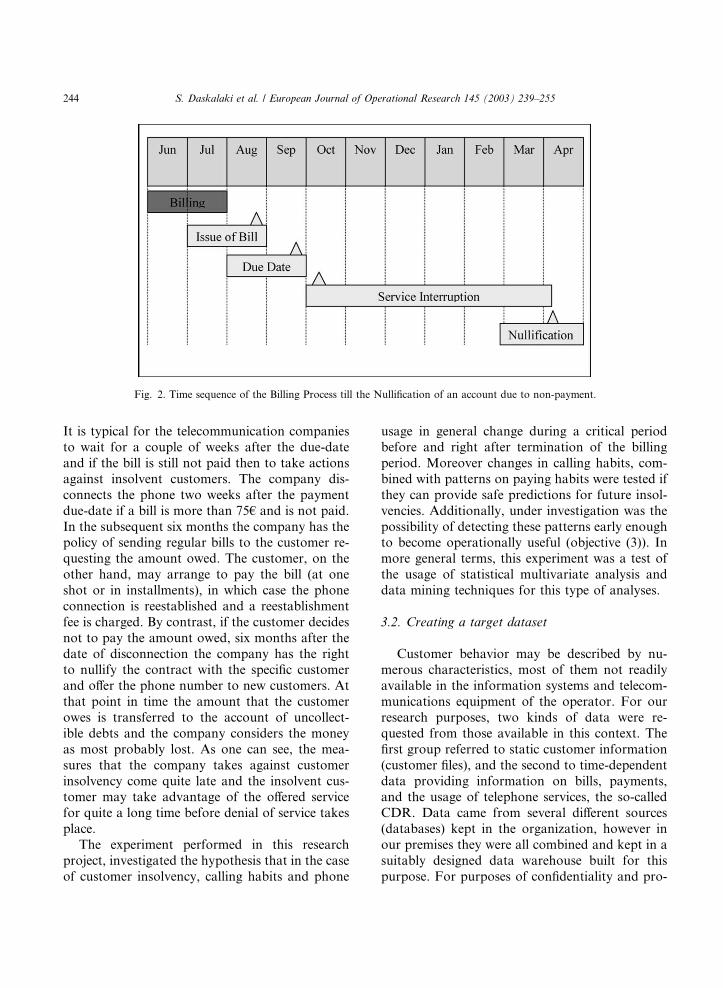
It is typical for the telecommunication companies
to wait for a couple of weeks after the due-date
and if the bill is still not paid then to take actions
against insolvent customers. The company dis-
connects the phone two weeks after the payment
due-date if a bill is more than 75€ and is not paid.
In the subsequent six months the company has thepolicy of sending regular bills to the customer re-
questing the amount owed. The customer, on the
other hand, may arrange to pay the bill (at one
shot or in installments), in which case the phone
connection is reestablished and a reestablishment
fee is charged. By contrast, if the customer decides
not to pay the amount owed, six months after the
date of disconnection the company has the rightto nullify the contract with the specific customer
and offer the phone number to new customers. At
that point in time the amount that the customer
owes is transferred to the account of uncollect-
ible debts and the company considers the money
as most probably lost. As one can see, the mea-
sures that the company takes against customer
insolvency come quite late and the insolvent cus-tomer may take advantage of the offered service
for quite a long time before denial of service takes
place.
The experiment performed in this research
project, investigated the hypothesis that in the case
of customer insolvency, calling habits and phone
usage in general change during a critical period
before and right after termination of the billing
period. Moreover changes in calling habits, com-
bined with patterns on paying habits were tested if
they can provide safe predictions for future insol-
vencies. Additionally, under investigation was the
possibility of detecting these patterns early enoughto become operationally useful (objective (3)). In
more general terms, this experiment was a test of
the usage of statistical multivariate analysis and
data mining techniques for this type of analyses.
3.2. Creating a target dataset
Customer behavior may be described by nu-merous characteristics, most of them not readily
available in the information systems and telecom-
munications equipment of the operator. For our
research purposes, two kinds of data were re-
quested from those available in this context. The
first group referred to static customer information
(customer files), and the second to time-dependent
data providing information on bills, payments,and the usage of telephone services, the so-called
CDR. Data came from several different sources
(databases) kept in the organization, however in
our premises they were all combined and kept in a
suitably designed data warehouse built for this
purpose. For purposes of confidentiality and pro-
Fig. 2. Time sequence of the Billing Process till the Nullification of an account due to non-payment.
244 S. Daskalaki et al. / European Journal of Operational Research 145 (2003) 239–255
tection of customer privacy, data were codified in a
secure way. To be more specific the raw data used
in this research referred to:
• customer information from customer files,
• usage of phone connection from switching cen-ters,
• billing data from the billing information system,
• reports on payments by customers from the bill-
ing information system,
• reports of phone disconnections due to failure of
payment,
• reports of phone reconnections after payment,
and• reports of permanent nullifications of contracts.
In order to make this study more representative
of a cross-section of customers of the operator,
data were collected from three different geographic
areas, one rural/agricultural, one semi-rural/tou-
ristic and one urban/industrial. Altogether, the
three areas totaled 100,000 customers.In terms of time, the data in the target dataset
covered a span of 17 months. Because of the billing
process described previously, there was a two-
month shift between billing data and telephone
usage records; that is to say billing covered data
from 10/1999 to 2/2001, while the call records re-
spectively spanned from 8/1999 to 12/2000. As an
indication for the size of the data warehouse built,collected data were over 10 GB in raw form.
3.3. Data cleaning and preprocessing
At this stage it was essential to test the quality
of the collected data, to filter out information of
no significance to our study and to inter-relate the
heterogeneous data items in the data warehouse.This has been a tedious process. Examples of the
performed operations during this phase are in-
cluded here.
Very early in our study it was clear that a 50%
decrease of the total volume of the data could be
achieved by eliminating inexpensive calls (charging
less than 0.3€). The elimination of these data did
not affect the result of our research given that thecompany is mostly interested on detecting patterns
of expensive calls placed with the ultimate goal not
to be paid.
However low percentage of corrupted data,
certain error correction procedures were applied
whenever appropriate in order to sanitize the data
from missing or erroneous values. Such problemsarose from lack of integration among information
systems within the organization that provided the
data and the dispersion of data sources. For ex-
ample, the planned dates for service interruption
due to lack of payment not always coincided with
the actual disconnection date but this could be
corrected by checking the CRD records. Also,
some phone accounts did not appear in the recordsof payments, however this information could be
deduced by examining the details in the following
bill.
The synchronization of data was an important
and tedious procedure during this step. The goal
was to study the behavior of all customers during a
period starting several weeks before a billing pe-
riod expires. However, billing periods vary to formdifferent groups of phone accounts. So insolvent
customers appear in different points of time during
the period of our study, so synchronization was
absolutely necessary.
3.4. Data reduction and projection
The data cleaning and pre-processing (e.g. re-cords synchronisation) of the previous phase, re-
vealed a number of cases of insolvent customers
with insufficient information that eventually had
to be eliminated from the data set. The next step
was to group information by phone account, so
manipulation of data became much easier.
The study period for the behavior of insolvent
customers was set to be approximately a periodof seven months before the disconnection of the
phone, which usually occurs six months before
the nullification of the account. The decision for
the length of the study period was based on data
analysis and business requirements. Within the
seven-month study period information regarding
call transactions made by the customer was ag-
gregated by two-week periods.With the help of statistical inference at this
point, a number of features were tested with the
S. Daskalaki et al. / European Journal of Operational Research 145 (2003) 239–255 245

ultimate goal to reveal those characteristics that
were discriminant factors for the two categories of
customers. The ones that did not provide any valid
or useful information in distinguishing solvent
from insolvent customers were eliminated.
Indicative of the type of work performed at thisstage are the following statistical tests:
1. Each telephone account belongs uniquely to
one out of twenty three categories (examples
of categories are: domestic, business, public
schools, payphone, etc.). A chi-square hypothe-
sis testing was performed for checking indepen-
dence of the distribution of phone accountsamong the different categories for the two
classes of customers. The hypothesis was re-
jected (p-value� 0:001), concluding that cate-gories of the accounts are not independent of
the customer class.
2. The average amount owed on the bi-monthly
bills was calculated for all solvent and insolvent
customers and was significantly higher for theclass of insolvent customers. This finding was
consistent throughout all different categories
of telephone connections. To support this a hy-
pothesis testing for homogeneity of the ‘‘aver-
age amount owed’’ for the two classes of
customers and the different categories was per-
formed. The hypothesis was rejected (p-
value� 0:001) supporting the conjecture statedabove.
3. For each customer the ‘‘extra charges’’ on the
bi-monthly bills were calculated by comparing
the total charges for the phone usage and the
service offered with the actual amount of the bill
to reveal charges resulting from previous bills,
charges from purchases of other products of
the company (like phone handsets, mobilehandsets, entries in yellow pages, etc.). The hy-
pothesis test performed for homogeneity of this
feature across the two classes of customers and
across the different categories of accounts again
rejected the hypothesis (with a p-value� 0:01)concluding significant differences between the
two classes.
4. Finally, the feature ‘‘payment by installments’’was studied by providing the number of times
a customer had requested payment by install-
ments during the study period. The hypothesis
for equal proportions of customers between
the two classes was rejected, indicating signifi-
cant differences between the two classes of cus-
tomers.
All previously mentioned tests were performed
in the original dataset, however in order to create
customer profiles, and even more so in order to
study the usage of the phone for customers of the
two classes it was important to create a smaller
and more manageable dataset projecting all char-
acteristics from the original one.
3.5. Defining the data mining function and feature
selection
As mentioned earlier, the problem of predicting
customer insolvency may be viewed as a classifi-
cation problem, where each customer is classified
in one of two classes: most possibly solvent or most
possibly insolvent with respect to the following due-
date of payment and the attitude towards the
amount owed in the following six months. As a
classification problem, it carried the following
characteristics:
• The distribution of customers between the two
classes was very uneven in the original dataset:approximately 99.3% were solvent customer
and 0.7% insolvent customers per billing period
in a given group of accounts.
• The absolute number of insolvencies in our data
set was very small, because only a few insol-
vency cases arise in every given billing period.
• The misclassifications for the two classes of cus-
tomers carried different costs, following objec-tives (1) and (2) set in the beginning of our
project and discussed in Section 3.1.
As discussed by Weiss and Provost (2001),
classification problems with these characteristics
are particularly difficult to solve. Therefore, a new
dataset had to be created specifically for the data
mining function through a stratified samplingprocedure for the solvent customers. This is a
recommended procedure in similar problems
(Chan and Stolfo, 1998). In this new dataset the
246 S. Daskalaki et al. / European Journal of Operational Research 145 (2003) 239–255
distribution of customers between the two classes
was altered to approximately 90% of solvent cus-
tomer and 10% of insolvent customers. The new
distribution between the classes was achieved by
maintaining all cases of insolvent customers in the
original data set, while for the solvent customers astratified sampling was performed. Our goal was
to create a representative sample of the solvent
customers, so that the algorithms would be trained
sufficiently well. Therefore, the triad of character-
istics geographic area, type of phone connection,
and group of the phone account were used for
sampling strata. These three characteristics had to
be carried in the sample with the same proportionsas in the original dataset in order (a) to maintain
the three distinct geographic areas in the reduced
data set, mentioned in Section 3.2, (b) to represent
the different types of phone connections, see
analysis in Section 3.4 and (c) to eliminate sea-
sonality associated with groups of phone accounts,
discussed in Section 3.3.
The result of this procedure was a dataset con-sisting of 2066 cases in total (solvent and insolvent).
For these cases a number of primary and secondary
features were created. After a data analysis phase,
briefly outlined in the following, 46 variables,
shown in the Appendix, were selected as candi-
date discriminating factors. Two of those variables
(TYPE, NEWCUST) describe the account, four
(LATENCY, COUNT_X_CHARGES, COUNT_INSTALMENTS, andCOUNT_RESIDUAL) the
behavior of the customer towards previous phone
bills, and the remaining 40 summarizes the call
habits of the customers over 15 two-week periods.
The selection of the last 40 variables was based on
a data analysis performed on the new reduced
dataset.
An adequate study period was established foreach phone account, called critical period during
which patterns of customer behavior were to be
observed. For the accounts that were nullified due
to non-payment, the critical period was defined to
be the last 15 two-week periods before interruption
of service. For the accounts that were not nullified,
the critical period was defined to be a period of
similar length prior to a possible date of inter-ruption had they not paid a certain bill. For each
account there were six possible dates per year for
service interruption, out of which one was selected
in random.
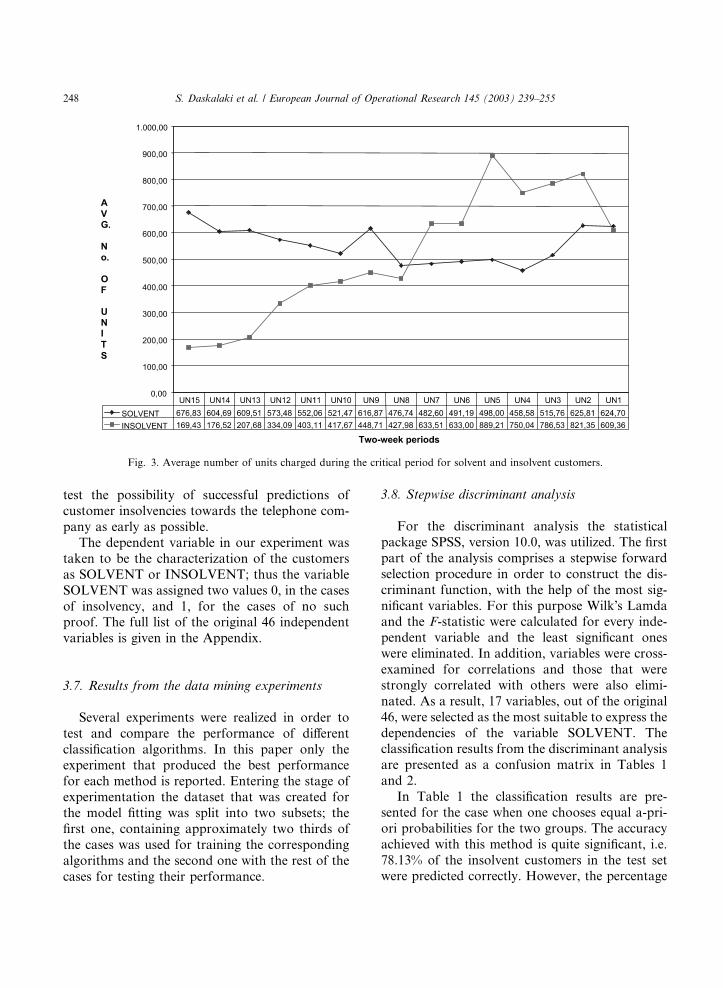
For each account and for every two-week pe-
riod in the critical period several variables were
defined by counting the total number of units
charged to the account, the total amount of timethat the phone was utilized, the number of phone
calls made, and the total count of different num-
bers that were called during that period. Fig. 3
shows one of these variables, the average number
of units charged during their corresponding critical
periods, for the solvent and the insolvent custom-
ers, respectively. A clearly different average be-
havioral pattern in the two populations emergesfrom this figure. On the average the solvent cus-
tomers were charged approximately the same
amount of units during all periods, ranging from
460 units to 680 units. On the contrary, the in-
solvent customers on the average were charged
significantly less units than the solvent during the
first eight two-week periods and afterwards their
behavior changed resulting to significantly moreunits than the solvent customers.
The conclusion of this phase of the study was to
create several new variables describing the usage of
each phone account, compared to a moving aver-
age of four previous two-week periods. Therefore,
as mentioned earlier, many new variables were
created, out of which the 46 variables in the Ap-
pendix were chosen as most prominent. As will beexplained in Section 3.6, the set of the variables
was further reduced with the help of the stepwise
discriminant analysis.
3.6. Selection of classification algorithms
At this stage of our research we tried a number
of alternative classification algorithms for testingour hypothesis, using the reduced dataset and the
selected variables as candidate discriminating
features. The algorithms used in the study were
discriminant analysis, decision trees and neu-
ral networks. Each one of them gives a different
classifier, a linear one produced by the discrimi-
nant analysis, a non-linear by the neural network,
and a rule-based classifier by the decision tree.These algorithms were applied to the dataset cre-
ated for the model fitting with the ultimate goal to
S. Daskalaki et al. / European Journal of Operational Research 145 (2003) 239–255 247
test the possibility of successful predictions of
customer insolvencies towards the telephone com-
pany as early as possible.
The dependent variable in our experiment was
taken to be the characterization of the customers
as SOLVENT or INSOLVENT; thus the variable
SOLVENT was assigned two values 0, in the cases
of insolvency, and 1, for the cases of no suchproof. The full list of the original 46 independent
variables is given in the Appendix.
3.7. Results from the data mining experiments
Several experiments were realized in order to
test and compare the performance of different
classification algorithms. In this paper only theexperiment that produced the best performance
for each method is reported. Entering the stage of
experimentation the dataset that was created for
the model fitting was split into two subsets; the
first one, containing approximately two thirds of
the cases was used for training the corresponding
algorithms and the second one with the rest of the
cases for testing their performance.
3.8. Stepwise discriminant analysis
For the discriminant analysis the statistical
package SPSS, version 10.0, was utilized. The first
part of the analysis comprises a stepwise forward
selection procedure in order to construct the dis-
criminant function, with the help of the most sig-
nificant variables. For this purpose Wilk�s Lamdaand the F-statistic were calculated for every inde-
pendent variable and the least significant ones
were eliminated. In addition, variables were cross-
examined for correlations and those that were
strongly correlated with others were also elimi-
nated. As a result, 17 variables, out of the original
46, were selected as the most suitable to express the
dependencies of the variable SOLVENT. Theclassification results from the discriminant analysis
are presented as a confusion matrix in Tables 1
and 2.
In Table 1 the classification results are pre-
sented for the case when one chooses equal a-pri-
ori probabilities for the two groups. The accuracy
achieved with this method is quite significant, i.e.
78.13% of the insolvent customers in the test setwere predicted correctly. However, the percentage
Fig. 3. Average number of units charged during the critical period for solvent and insolvent customers.
248 S. Daskalaki et al. / European Journal of Operational Research 145 (2003) 239–255
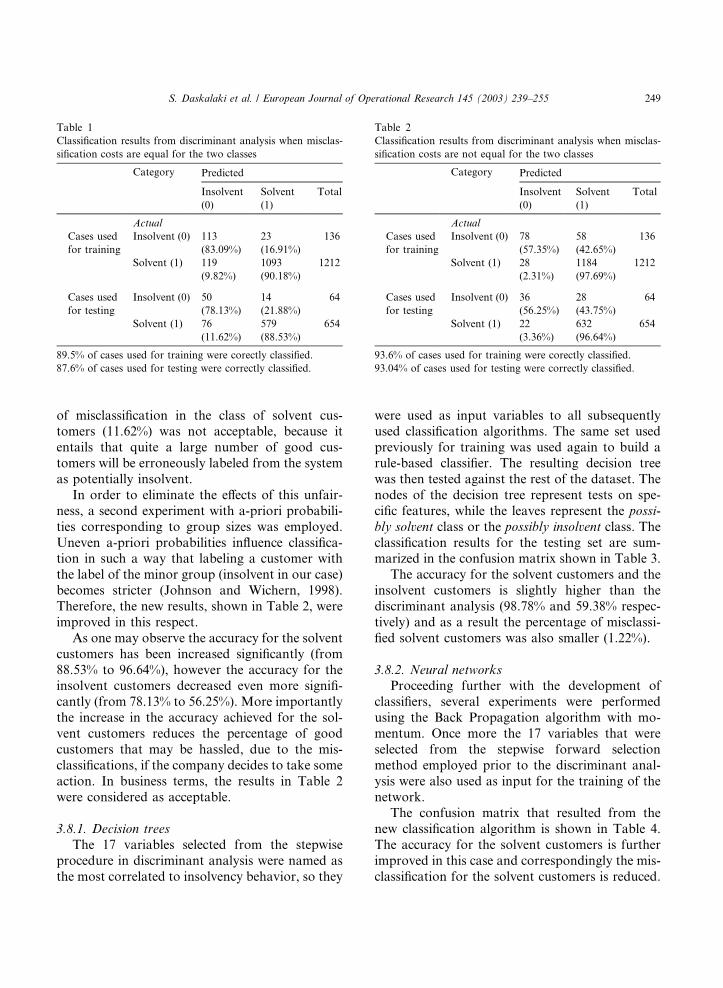
of misclassification in the class of solvent cus-tomers (11.62%) was not acceptable, because it
entails that quite a large number of good cus-
tomers will be erroneously labeled from the system
as potentially insolvent.
In order to eliminate the effects of this unfair-
ness, a second experiment with a-priori probabili-
ties corresponding to group sizes was employed.
Uneven a-priori probabilities influence classifica-tion in such a way that labeling a customer with
the label of the minor group (insolvent in our case)
becomes stricter (Johnson and Wichern, 1998).
Therefore, the new results, shown in Table 2, were
improved in this respect.
As one may observe the accuracy for the solvent
customers has been increased significantly (from
88.53% to 96.64%), however the accuracy for theinsolvent customers decreased even more signifi-
cantly (from 78.13% to 56.25%). More importantly
the increase in the accuracy achieved for the sol-
vent customers reduces the percentage of good
customers that may be hassled, due to the mis-
classifications, if the company decides to take some
action. In business terms, the results in Table 2
were considered as acceptable.
3.8.1. Decision trees
The 17 variables selected from the stepwise
procedure in discriminant analysis were named as
the most correlated to insolvency behavior, so they
were used as input variables to all subsequentlyused classification algorithms. The same set used
previously for training was used again to build a
rule-based classifier. The resulting decision tree
was then tested against the rest of the dataset. The
nodes of the decision tree represent tests on spe-
cific features, while the leaves represent the possi-
bly solvent class or the possibly insolvent class. The
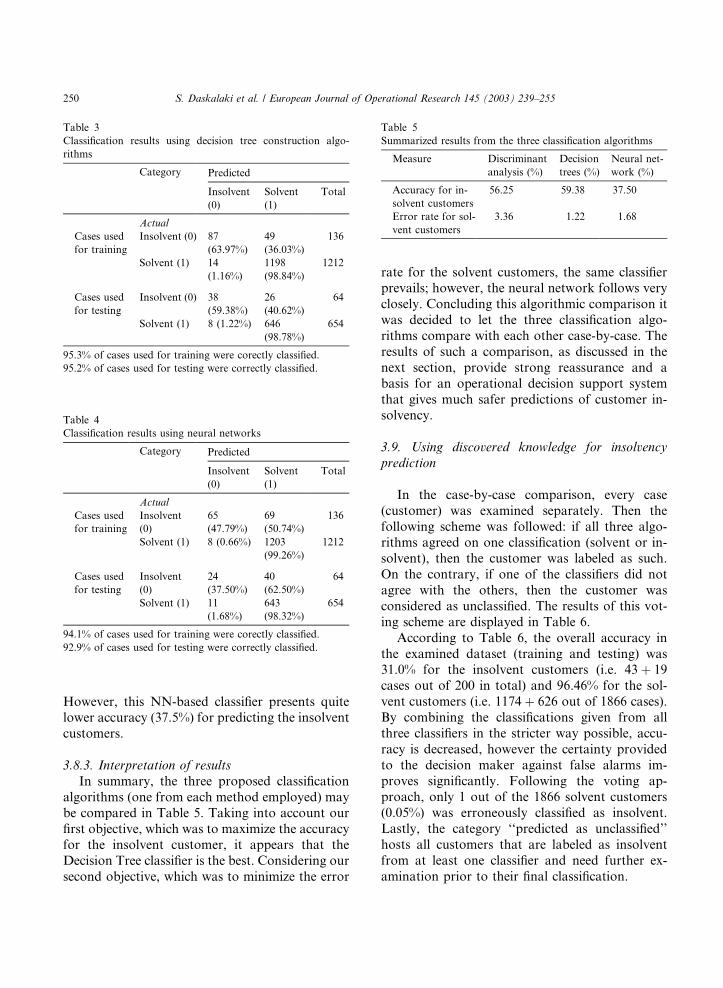
classification results for the testing set are sum-marized in the confusion matrix shown in Table 3.
The accuracy for the solvent customers and the
insolvent customers is slightly higher than the
discriminant analysis (98.78% and 59.38% respec-
tively) and as a result the percentage of misclassi-
fied solvent customers was also smaller (1.22%).
3.8.2. Neural networks
Proceeding further with the development of
classifiers, several experiments were performed
using the Back Propagation algorithm with mo-
mentum. Once more the 17 variables that were
selected from the stepwise forward selection
method employed prior to the discriminant anal-
ysis were also used as input for the training of the
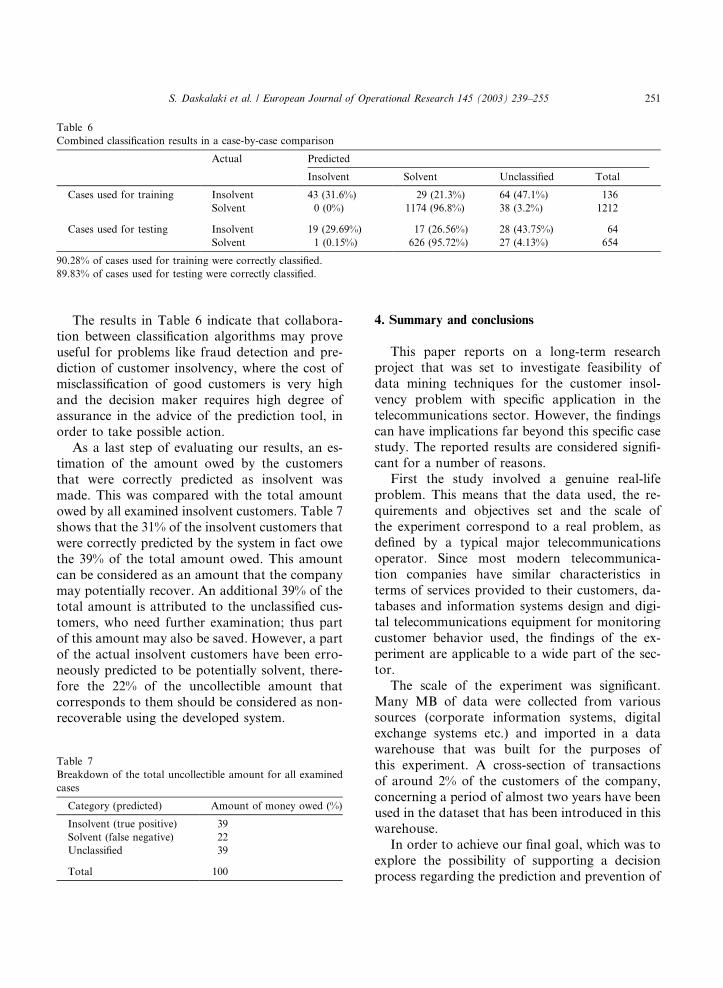
network.The confusion matrix that resulted from the
new classification algorithm is shown in Table 4.
The accuracy for the solvent customers is further
improved in this case and correspondingly the mis-
classification for the solvent customers is reduced.
Table 2
Classification results from discriminant analysis when misclas-
sification costs are not equal for the two classes
Category Predicted
Insolvent
(0)
Solvent
(1)
Total
Actual
Cases used
for training
Insolvent (0) 78
(57.35%)
58
(42.65%)
136
Solvent (1) 28
(2.31%)
1184
(97.69%)
1212
Cases used
for testing
Insolvent (0) 36
(56.25%)
28
(43.75%)
64
Solvent (1) 22
(3.36%)
632
(96.64%)
654
93.6% of cases used for training were corectly classified.
93.04% of cases used for testing were correctly classified.
Table 1
Classification results from discriminant analysis when misclas-
sification costs are equal for the two classes
Category Predicted
Insolvent
(0)
Solvent
(1)
Total
Actual
Cases used
for training
Insolvent (0) 113
(83.09%)
23
(16.91%)
136
Solvent (1) 119
(9.82%)
1093
(90.18%)
1212
Cases used
for testing
Insolvent (0) 50
(78.13%)
14
(21.88%)
64
Solvent (1) 76
(11.62%)
579
(88.53%)
654
89.5% of cases used for training were corectly classified.
87.6% of cases used for testing were correctly classified.
S. Daskalaki et al. / European Journal of Operational Research 145 (2003) 239–255 249
However, this NN-based classifier presents quitelower accuracy (37.5%) for predicting the insolvent
customers.
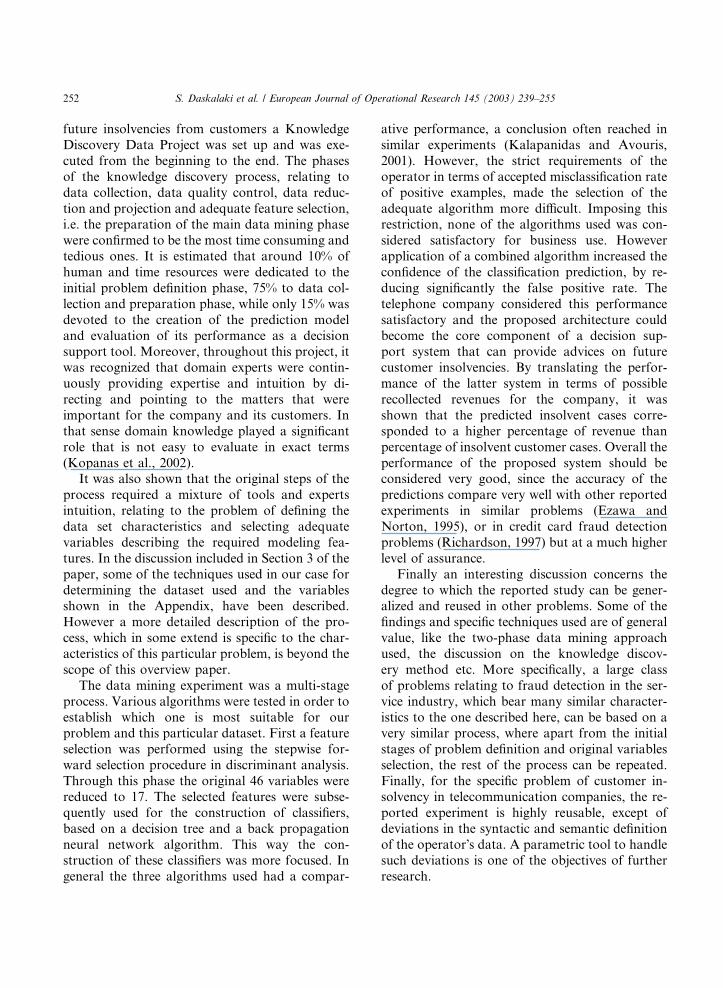
3.8.3. Interpretation of results
In summary, the three proposed classification
algorithms (one from each method employed) may
be compared in Table 5. Taking into account our
first objective, which was to maximize the accuracyfor the insolvent customer, it appears that the
Decision Tree classifier is the best. Considering our
second objective, which was to minimize the error
rate for the solvent customers, the same classifierprevails; however, the neural network follows very
closely. Concluding this algorithmic comparison it
was decided to let the three classification algo-
rithms compare with each other case-by-case. The
results of such a comparison, as discussed in the
next section, provide strong reassurance and a
basis for an operational decision support system
that gives much safer predictions of customer in-solvency.
3.9. Using discovered knowledge for insolvency
prediction
In the case-by-case comparison, every case
(customer) was examined separately. Then the
following scheme was followed: if all three algo-rithms agreed on one classification (solvent or in-
solvent), then the customer was labeled as such.
On the contrary, if one of the classifiers did not
agree with the others, then the customer was
considered as unclassified. The results of this vot-
ing scheme are displayed in Table 6.
According to Table 6, the overall accuracy in
the examined dataset (training and testing) was31.0% for the insolvent customers (i.e. 43þ 19
cases out of 200 in total) and 96.46% for the sol-
vent customers (i.e. 1174þ 626 out of 1866 cases).
By combining the classifications given from all
three classifiers in the stricter way possible, accu-
racy is decreased, however the certainty provided
to the decision maker against false alarms im-
proves significantly. Following the voting ap-proach, only 1 out of the 1866 solvent customers
(0.05%) was erroneously classified as insolvent.
Lastly, the category ‘‘predicted as unclassified’’
hosts all customers that are labeled as insolvent
from at least one classifier and need further ex-
amination prior to their final classification.
Table 3
Classification results using decision tree construction algo-
rithms
Category Predicted
Insolvent
(0)
Solvent
(1)
Total
Actual
Cases used
for training
Insolvent (0) 87
(63.97%)
49
(36.03%)
136
Solvent (1) 14
(1.16%)
1198
(98.84%)
1212
Cases used
for testing
Insolvent (0) 38
(59.38%)
26
(40.62%)
64
Solvent (1) 8 (1.22%) 646
(98.78%)
654
95.3% of cases used for training were corectly classified.
95.2% of cases used for testing were correctly classified.
Table 4
Classification results using neural networks
Category Predicted
Insolvent
(0)
Solvent
(1)
Total
Actual
Cases used
for training
Insolvent
(0)
65
(47.79%)
69
(50.74%)
136
Solvent (1) 8 (0.66%) 1203
(99.26%)
1212
Cases used
for testing
Insolvent
(0)
24
(37.50%)
40
(62.50%)
64
Solvent (1) 11
(1.68%)
643
(98.32%)
654
94.1% of cases used for training were corectly classified.
92.9% of cases used for testing were correctly classified.
Table 5
Summarized results from the three classification algorithms
Measure Discriminant
analysis (%)
Decision
trees (%)
Neural net-
work (%)
Accuracy for in-
solvent customers
56.25 59.38 37.50
Error rate for sol-
vent customers
3.36 1.22 1.68
250 S. Daskalaki et al. / European Journal of Operational Research 145 (2003) 239–255
The results in Table 6 indicate that collabora-tion between classification algorithms may prove
useful for problems like fraud detection and pre-
diction of customer insolvency, where the cost of
misclassification of good customers is very high
and the decision maker requires high degree of
assurance in the advice of the prediction tool, in
order to take possible action.
As a last step of evaluating our results, an es-timation of the amount owed by the customers
that were correctly predicted as insolvent was
made. This was compared with the total amount
owed by all examined insolvent customers. Table 7
shows that the 31% of the insolvent customers that
were correctly predicted by the system in fact owe
the 39% of the total amount owed. This amount
can be considered as an amount that the companymay potentially recover. An additional 39% of the
total amount is attributed to the unclassified cus-
tomers, who need further examination; thus part
of this amount may also be saved. However, a part
of the actual insolvent customers have been erro-
neously predicted to be potentially solvent, there-
fore the 22% of the uncollectible amount that
corresponds to them should be considered as non-recoverable using the developed system.
4. Summary and conclusions
This paper reports on a long-term research
project that was set to investigate feasibility of
data mining techniques for the customer insol-
vency problem with specific application in the
telecommunications sector. However, the findings
can have implications far beyond this specific casestudy. The reported results are considered signifi-
cant for a number of reasons.
First the study involved a genuine real-life
problem. This means that the data used, the re-
quirements and objectives set and the scale of
the experiment correspond to a real problem, as
defined by a typical major telecommunications
operator. Since most modern telecommunica-tion companies have similar characteristics in
terms of services provided to their customers, da-
tabases and information systems design and digi-
tal telecommunications equipment for monitoring
customer behavior used, the findings of the ex-
periment are applicable to a wide part of the sec-
tor.
The scale of the experiment was significant.Many MB of data were collected from various
sources (corporate information systems, digital
exchange systems etc.) and imported in a data
warehouse that was built for the purposes of
this experiment. A cross-section of transactions
of around 2% of the customers of the company,
concerning a period of almost two years have been
used in the dataset that has been introduced in thiswarehouse.
In order to achieve our final goal, which was to
explore the possibility of supporting a decision
process regarding the prediction and prevention of
Table 7
Breakdown of the total uncollectible amount for all examined
cases
Category (predicted) Amount of money owed (%)
Insolvent (true positive) 39
Solvent (false negative) 22
Unclassified 39
Total 100
Table 6
Combined classification results in a case-by-case comparison
Actual Predicted
Insolvent Solvent Unclassified Total
Cases used for training Insolvent 43 (31.6%) 29 (21.3%) 64 (47.1%) 136
Solvent 0 (0%) 1174 (96.8%) 38 (3.2%) 1212
Cases used for testing Insolvent 19 (29.69%) 17 (26.56%) 28 (43.75%) 64
Solvent 1 (0.15%) 626 (95.72%) 27 (4.13%) 654
90.28% of cases used for training were correctly classified.
89.83% of cases used for testing were correctly classified.
S. Daskalaki et al. / European Journal of Operational Research 145 (2003) 239–255 251
future insolvencies from customers a Knowledge
Discovery Data Project was set up and was exe-
cuted from the beginning to the end. The phases
of the knowledge discovery process, relating to
data collection, data quality control, data reduc-
tion and projection and adequate feature selection,i.e. the preparation of the main data mining phase
were confirmed to be the most time consuming and
tedious ones. It is estimated that around 10% of
human and time resources were dedicated to the
initial problem definition phase, 75% to data col-
lection and preparation phase, while only 15% was
devoted to the creation of the prediction model
and evaluation of its performance as a decisionsupport tool. Moreover, throughout this project, it
was recognized that domain experts were contin-
uously providing expertise and intuition by di-
recting and pointing to the matters that were
important for the company and its customers. In
that sense domain knowledge played a significant
role that is not easy to evaluate in exact terms
(Kopanas et al., 2002).It was also shown that the original steps of the
process required a mixture of tools and experts
intuition, relating to the problem of defining the
data set characteristics and selecting adequate
variables describing the required modeling fea-
tures. In the discussion included in Section 3 of the
paper, some of the techniques used in our case for
determining the dataset used and the variablesshown in the Appendix, have been described.
However a more detailed description of the pro-
cess, which in some extend is specific to the char-
acteristics of this particular problem, is beyond the
scope of this overview paper.
The data mining experiment was a multi-stage
process. Various algorithms were tested in order to
establish which one is most suitable for ourproblem and this particular dataset. First a feature
selection was performed using the stepwise for-
ward selection procedure in discriminant analysis.
Through this phase the original 46 variables were
reduced to 17. The selected features were subse-
quently used for the construction of classifiers,
based on a decision tree and a back propagation
neural network algorithm. This way the con-struction of these classifiers was more focused. In
general the three algorithms used had a compar-
ative performance, a conclusion often reached in
similar experiments (Kalapanidas and Avouris,
2001). However, the strict requirements of the
operator in terms of accepted misclassification rate
of positive examples, made the selection of the
adequate algorithm more difficult. Imposing thisrestriction, none of the algorithms used was con-
sidered satisfactory for business use. However
application of a combined algorithm increased the
confidence of the classification prediction, by re-
ducing significantly the false positive rate. The
telephone company considered this performance
satisfactory and the proposed architecture could
become the core component of a decision sup-port system that can provide advices on future
customer insolvencies. By translating the perfor-
mance of the latter system in terms of possible
recollected revenues for the company, it was
shown that the predicted insolvent cases corre-
sponded to a higher percentage of revenue than
percentage of insolvent customer cases. Overall the
performance of the proposed system should beconsidered very good, since the accuracy of the
predictions compare very well with other reported
experiments in similar problems (Ezawa and
Norton, 1995), or in credit card fraud detection
problems (Richardson, 1997) but at a much higher
level of assurance.
Finally an interesting discussion concerns the
degree to which the reported study can be gener-alized and reused in other problems. Some of the
findings and specific techniques used are of general
value, like the two-phase data mining approach
used, the discussion on the knowledge discov-
ery method etc. More specifically, a large class
of problems relating to fraud detection in the ser-
vice industry, which bear many similar character-
istics to the one described here, can be based on avery similar process, where apart from the initial
stages of problem definition and original variables
selection, the rest of the process can be repeated.
Finally, for the specific problem of customer in-
solvency in telecommunication companies, the re-
ported experiment is highly reusable, except of
deviations in the syntactic and semantic definition
of the operator�s data. A parametric tool to handlesuch deviations is one of the objectives of further
research.
252 S. Daskalaki et al. / European Journal of Operational Research 145 (2003) 239–255
Acknowledgements
The research reported here has been funded
under project YPER97-109 of the Greek Secre-
tariat of Research and Technology. Special thanksare also due to E. Argyriou of OTE S.A. and the
group of scientists of the same company that
supplied us with data and continuous support.
Special thanks are also due to IBM for providing
licenses of the DB2� and Intelligent Miner�products under their academic support pro-
gramme.
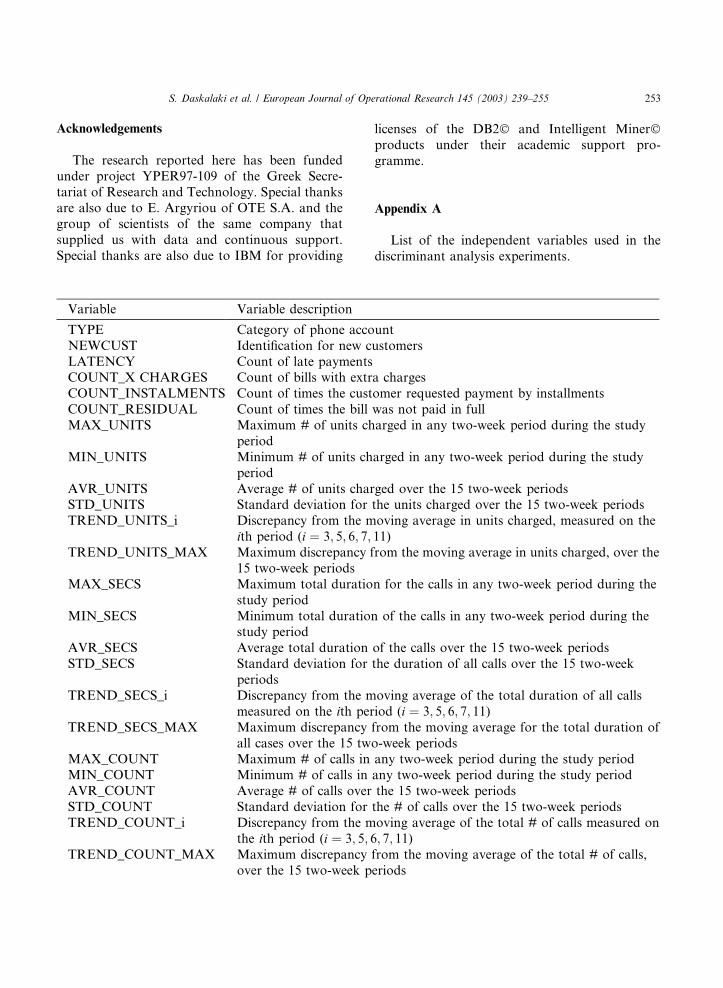
Appendix A
List of the independent variables used in the
discriminant analysis experiments.
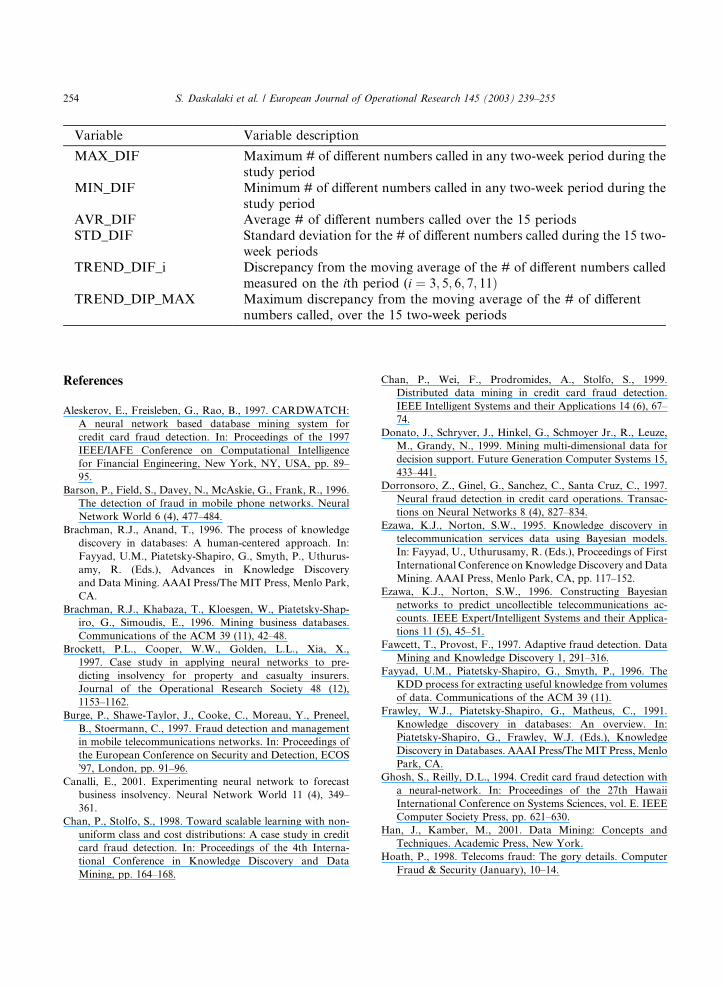
Variable Variable description
TYPE Category of phone account
NEWCUST Identification for new customers
LATENCY Count of late paymentsCOUNT_X CHARGES Count of bills with extra charges
COUNT_INSTALMENTS Count of times the customer requested payment by installments
COUNT_RESIDUAL Count of times the bill was not paid in full
MAX_UNITS Maximum # of units charged in any two-week period during the study
period
MIN_UNITS Minimum # of units charged in any two-week period during the study
period
AVR_UNITS Average # of units charged over the 15 two-week periodsSTD_UNITS Standard deviation for the units charged over the 15 two-week periods
TREND_UNITS_i Discrepancy from the moving average in units charged, measured on the
ith period (i ¼ 3; 5; 6; 7; 11)TREND_UNITS_MAX Maximum discrepancy from the moving average in units charged, over the
15 two-week periods
MAX_SECS Maximum total duration for the calls in any two-week period during the
study period
MIN_SECS Minimum total duration of the calls in any two-week period during thestudy period
AVR_SECS Average total duration of the calls over the 15 two-week periods
STD_SECS Standard deviation for the duration of all calls over the 15 two-week
periods
TREND_SECS_i Discrepancy from the moving average of the total duration of all calls
measured on the ith period (i ¼ 3; 5; 6; 7; 11)TREND_SECS_MAX Maximum discrepancy from the moving average for the total duration of
all cases over the 15 two-week periodsMAX_COUNT Maximum # of calls in any two-week period during the study period
MIN_COUNT Minimum # of calls in any two-week period during the study period
AVR_COUNT Average # of calls over the 15 two-week periods
STD_COUNT Standard deviation for the # of calls over the 15 two-week periods
TREND_COUNT_i Discrepancy from the moving average of the total # of calls measured on
the ith period (i ¼ 3; 5; 6; 7; 11)TREND_COUNT_MAX Maximum discrepancy from the moving average of the total # of calls,
over the 15 two-week periods
S. Daskalaki et al. / European Journal of Operational Research 145 (2003) 239–255 253
References
Aleskerov, E., Freisleben, G., Rao, B., 1997. CARDWATCH:
A neural network based database mining system for
credit card fraud detection. In: Proceedings of the 1997
IEEE/IAFE Conference on Computational Intelligence
for Financial Engineering, New York, NY, USA, pp. 89–
95.
Barson, P., Field, S., Davey, N., McAskie, G., Frank, R., 1996.
The detection of fraud in mobile phone networks. Neural
Network World 6 (4), 477–484.
Brachman, R.J., Anand, T., 1996. The process of knowledge
discovery in databases: A human-centered approach. In:
Fayyad, U.M., Piatetsky-Shapiro, G., Smyth, P., Uthurus-
amy, R. (Eds.), Advances in Knowledge Discovery
and Data Mining. AAAI Press/The MIT Press, Menlo Park,
CA.
Brachman, R.J., Khabaza, T., Kloesgen, W., Piatetsky-Shap-
iro, G., Simoudis, E., 1996. Mining business databases.
Communications of the ACM 39 (11), 42–48.
Brockett, P.L., Cooper, W.W., Golden, L.L., Xia, X.,
1997. Case study in applying neural networks to pre-
dicting insolvency for property and casualty insurers.
Journal of the Operational Research Society 48 (12),
1153–1162.
Burge, P., Shawe-Taylor, J., Cooke, C., Moreau, Y., Preneel,
B., Stoermann, C., 1997. Fraud detection and management
in mobile telecommunications networks. In: Proceedings of
the European Conference on Security and Detection, ECOS
�97, London, pp. 91–96.Canalli, E., 2001. Experimenting neural network to forecast
business insolvency. Neural Network World 11 (4), 349–
361.
Chan, P., Stolfo, S., 1998. Toward scalable learning with non-
uniform class and cost distributions: A case study in credit
card fraud detection. In: Proceedings of the 4th Interna-
tional Conference in Knowledge Discovery and Data
Mining, pp. 164–168.
Chan, P., Wei, F., Prodromides, A., Stolfo, S., 1999.
Distributed data mining in credit card fraud detection.
IEEE Intelligent Systems and their Applications 14 (6), 67–
74.
Donato, J., Schryver, J., Hinkel, G., Schmoyer Jr., R., Leuze,
M., Grandy, N., 1999. Mining multi-dimensional data for
decision support. Future Generation Computer Systems 15,
433–441.
Dorronsoro, Z., Ginel, G., Sanchez, C., Santa Cruz, C., 1997.
Neural fraud detection in credit card operations. Transac-
tions on Neural Networks 8 (4), 827–834.
Ezawa, K.J., Norton, S.W., 1995. Knowledge discovery in
telecommunication services data using Bayesian models.
In: Fayyad, U., Uthurusamy, R. (Eds.), Proceedings of First
International Conference onKnowledge Discovery andData
Mining. AAAI Press, Menlo Park, CA, pp. 117–152.
Ezawa, K.J., Norton, S.W., 1996. Constructing Bayesian
networks to predict uncollectible telecommunications ac-
counts. IEEE Expert/Intelligent Systems and their Applica-
tions 11 (5), 45–51.
Fawcett, T., Provost, F., 1997. Adaptive fraud detection. Data
Mining and Knowledge Discovery 1, 291–316.
Fayyad, U.M., Piatetsky-Shapiro, G., Smyth, P., 1996. The
KDD process for extracting useful knowledge from volumes
of data. Communications of the ACM 39 (11).
Frawley, W.J., Piatetsky-Shapiro, G., Matheus, C., 1991.
Knowledge discovery in databases: An overview. In:
Piatetsky-Shapiro, G., Frawley, W.J. (Eds.), Knowledge
Discovery in Databases. AAAI Press/The MIT Press, Menlo
Park, CA.
Ghosh, S., Reilly, D.L., 1994. Credit card fraud detection with
a neural-network. In: Proceedings of the 27th Hawaii
International Conference on Systems Sciences, vol. E. IEEE
Computer Society Press, pp. 621–630.
Han, J., Kamber, M., 2001. Data Mining: Concepts and
Techniques. Academic Press, New York.
Hoath, P., 1998. Telecoms fraud: The gory details. Computer
Fraud & Security (January), 10–14.
Variable Variable description
MAX_DIF Maximum # of different numbers called in any two-week period during the
study period
MIN_DIF Minimum # of different numbers called in any two-week period during the
study periodAVR_DIF Average # of different numbers called over the 15 periods
STD_DIF Standard deviation for the # of different numbers called during the 15 two-
week periods
TREND_DIF_i Discrepancy from the moving average of the # of different numbers called
measured on the ith period (i ¼ 3; 5; 6; 7; 11ÞTREND_DIP_MAX Maximum discrepancy from the moving average of the # of different
numbers called, over the 15 two-week periods
254 S. Daskalaki et al. / European Journal of Operational Research 145 (2003) 239–255
Johnson, R.A., Wichern, D.W., 1998. Applied Multivariate
StatisticalAnalysis. PrenticeHall, Inc., EnglewoodCliffs,NJ.
Kalapanidas, E., Avouris, N., 2001. Short-term air quality
prediction using a case based classifier. Journal of Environ-
mental Modelling and Software 16 (3), 263–272.
Kopanas, I., Avouris, N., Daskalaki, S., 2002. The role
of domain knowledge in a large scale Data Mining Project.
In: Vlahavas, I.P., Spyropoulos, C.D. (Eds.), Methods
and Applications of Artificial Intelligence. Lecture Notes
in AI, LNAI no. 2308. Springer-Verlag, Berlin, pp. 288–
299.
Richardson, R., 1997. Neural networks compared to statistical
techniques. In: Proceedings of the 1997 IEEE/IAFE Con-
ference on Computational Intelligence for Financial Engi-
neering, New York, pp. 89–95.
Shawe-Taylor, J., Howker, K., Burge, P., 1999. Detection of
fraud in mobile telecommunications. Information Security
Technical Report 4 (1), 16–28.
Weiss, G., Provost, F., 2001. The effect of class distribution on
classifier learning, Technical Report ML-TR-43, Depart-
ment of Computer Science, Rutgers University.
Yuhas, B.P., 1993. Toll-fraud detection. In: Aspector, J.,
Goodman, R., Brown, T.X. (Eds.), Proceedings of the
International Workshop on Applications of Neural Net-
works to Telecommunications. Lawrence Erlbaum Associ-
ates, Mahwah, NJ, pp. 239–244.
S. Daskalaki et al. / European Journal of Operational Research 145 (2003) 239–255 255