Data Driven Methods for Mobile Gait Analysis in Parkinson's ...
112
Data Driven Methods for Mobile Gait Analysis in Parkinson’s Disease Datengetriebene Methoden für die Mobile Ganganalyse beim Parkinson-Syndrom Der Technischen Fakultät der Friedrich-Alexander-Universität Erlangen-Nürnberg zur Erlangung des Doktorgrades Dr.-Ing. vorgelegt von Nooshin Haji Ghassemi
-
Upload
khangminh22 -
Category
Documents
-
view
1 -
download
0
Transcript of Data Driven Methods for Mobile Gait Analysis in Parkinson's ...
Data Driven Methods for MobileGait Analysis in Parkinson’s Disease
Datengetriebene Methoden für die MobileGanganalyse beim Parkinson-Syndrom
Der Technischen Fakultätder Friedrich-Alexander-Universität
Erlangen-Nürnberg
zurErlangung des Doktorgrades Dr.-Ing.
vorgelegt von
Nooshin Haji Ghassemi

Als Dissertation genehmigt von derTechnischen Fakultät der
Friedrich-Alexander-Universität Erlangen-Nürnberg
Tag der mündlichen Prüfung: 09.03.2021
Vorsitzender desPromotionsorgans: Prof. Dr.-Ing. Knut Graichen
Gutachter: Prof. Dr. Björn M. EskofierProf. Dr. Kamiar AminianProf. Dr. Holger Fröhlich

Abstract
Our understanding of Parkinson’s disease (PD), its symptoms and diagnosis havebeen expanded considerably since its formal description by James Parkinson twocenturies ago [Prze 17]. However, this common neurodegenerative disorder has stillbeen a threat to the health and well-being of patients and an economic burden, sincea complete treatment is still a formidable barrier. Impaired gait is one of the mostcharacteristic symptoms in Parkinson’s disease. Assessment of movement impairmentsforms a basis for diagnosis, evaluation of the disease progress and the evaluation oftherapeutic interventions.
The emergence of wearable technologies has permitted the development of mobilesystems for gait analysis. This technology enables us to record large amounts ofpatients’ data not only during clinical visits but also outside clinics. Data drivenmethods hold the potential to analyze the large volume of data to provide an objectivedisease assessment, improve current approaches to manage disease progression, andmonitor patients outside clinics. This thesis aims to leverage data driven methods forthe development of an objective gait assessment using mobile gait analysis systems.
The present thesis answers three main open questions in this domain: developmentand comparison of four widely used data driven methods for gait segmentation, ana-lysis of turning for on-shoe wearable sensors and interpretable classification of motorimpairments.
Regarding segmentation of gait sequence to individual strides, three existing segmen-tation methods are implemented and validated for PD population. For this applica-tion, a novel segmentation method is also introduced and implemented for the firsttime. These methods are evaluated on two data sets with different levels of data he-terogeneity. This contribution presents a fair comparison of segmentation methodson an identical data set. Segmenting gait sequences is the first step in the followingsteps of research: turning analysis and assessing motor impairments in PD.
Further, turning deficits are examined using an on-shoe mobile gait analysis system.A method is introduced for isolation of turning from the whole gait sequence based onthe statistics of turning angles between two consecutive strides. Correlation of turn-derived spatio-temporal features with two widely used clinical scales is examined.This is a proof-of-concept for the feasibility of using on-shoe mobile gait analysissystems for turning analysis in PD. Turn-derived spatio-temporal features, then, areused in the next contribution.
Finally, spatio-temporal features computed from straight walking as well as turningare used for the classification of different levels of motor impairments. Gaussian pro-cesses, a probabilistic machine learning method, is introduced for the first time forthis application. The method provides the classification output as well as an explicituncertainty measure, which captures the confidence of the method in the estimatedoutput. The measure of uncertainty is particularly important in cases when the dataset is small and noisy. A discussion regarding the properties of this type of data drivenmethod and its evaluation is presented.

To conclude, the present thesis centers on the development of data driven methodsfor objective assessment of gait in Parkinson’s disease. The works mentioned abo-ve contribute to the early diagnosis, evaluation of disease progression, assessment oftherapeutic interventions and insights for long-term monitoring of patients outsideclinics. Understanding the potentials and pitfalls of data driven methods in gait ana-lysis leads to deeper insight into Parkinson’s disease and opens new doors for thedisease management.

Zusammenfassung
Unser Verständnis der Parkinson Krankheit, ihrer Symptome und Diagnose ist seit ih-rer formalen Beschreibung durch James Parkinson vor zwei Jahrhunderten erheblicherweitert worden. Trotzdem ist diese verbreitete neurodegenerative Störung immernoch eine Bedrohung für Gesundheit und Wohlbefinden der Patienten als auch ei-ne ökonomische Bürde, da eine vollständige Behandlung der Krankheit immer nocheine beträchtliche Hürde darstellt. Eine Beeinträchtigung des Gehens ist eines dermeistverbreiteten Symptomen der Parkinson Erkrankung. Die Erfassung verschiede-ner Formen der Beeinträchtigung bildet eine Basis für die Diagnose, die Evaluierungdes Krankheitsverlaufes und die therapeutischer Maßnahmen.
Das Aufkommen tragbarer Technologien ermöglichte die Entwicklung mobiler Gang-Analysesysteme. Diese Technologie ermöglicht es uns, große Mengen von Patienten-daten nicht nur während der klinischen Besuche, sondern auch außerhalb der Klinikenaufzuzeichnen. Datengesteuerte Methoden haben das Potenzial, die gros̈se Datenmen-ge zu analysieren, um eine objektive Beurteilung der Krankheit zu ermöglichen, diederzeitigen Ansätze zur Kontrolle des Krankheitsverlaufs zu verbessern und die Pati-enten unbeaufsichtigt zu überwachen. Das Ziel dieser Dissertation ist es, die Bedeu-tung datengetriebener Methoden, für die Entwicklung einer objektiver Ganganalysemittels mobiler Analysegeräte, hervorzuheben.
Die vorliegende Arbeit beantwortet drei offene Hauptfragen in diesem Bereich: Ent-wicklung und Vergleich von vier weit verbreiteten datengesteuerten Methoden zurGangsegmentierung, Analyse von Richtungsänderungen und Umkehrbewegungen durchDatenerfassung von an den Schuhen tragbaren Sensoren sowie die interpretierbareKlassifizierung motorischer Beeinträchtigung.
Bezüglich des Benchmarkings der Methoden für die Segmentierung der Gangsequenzin individuelle Schritte wurden drei bestehende Segmentierungsmethoden werden im-plementiert und für die PD-Population validiert. Zusätzlich wird zum ersten Maleine neue Segmentierungsmethode für diese Anwendung vorgestellt und implemen-tiert. Die Methoden werden an zwei Datensets verschiedenen Levels an Heterogenitätevaluiert. Dieser Beitrag pr asentiert einen Vergleich der verschiedenen Methoden anidentischen Datensets. Die Segmentierung der Gangsequenzen ist der erste Schritt inden folgenden Forschungsschritten: Analyse der Drehung und Bewertung der moto-rischen Beeinträchtigungen bei Morbus Parkinson.
Ferner werden Defizite in der Umkehr und Richtungsänderung examiniert, unter Ver-wendung eines am Schuh befindlichen mobilen Gang-Analysesystems. Es wird eineMethode zur Isolation einer Richtungsänderung aus der gesamten Gangsequenz vor-gestellt, basierend auf der Statistik der Einschlagwinkel zwischen zwei aufeinander-folgenden Schritten. Die Korrelation zwischen aus Richtungsänderungen abgeleiteten

raumzeitlichen Merkmalen und zwei weit verbreiteten klinischen Skalen wird geprüft.Dies stellt einen Proof of Concept dar, für die Zulässigkeit der Verwendung, von anSchuhen befindlichen mobilen Gang-Analysesystemen, für die Analyse von Richtungs-änderungen bei Parkinson. Daraus abgeleitete raumzeitlichen Merkmale werden dannim nächsten Beitrag verwendet.
Schließlich werden raumzeitlichen Merkmale, die sowohl aus dem geraden Gehen alsauch aus der Drehung berechnet werden, zur Klassifizierung der verschiedenen Stu-fen der motorischen Beeinträchtigung verwendet. Für diese Anwendung wird erstmalsdas Gaußsche Verfahren, ein probabilistisches maschinelles Lernverfahren, eingeführt.Diese Methode gibt sowohl die Klassifizierung aus, als auch ein explizites Maß derUnsicherheit, welches das Vertrauen in die Ausgabe der Methode wieder spiegelt. DasMaß der Unsicherheit ist besonders wichtig in Fällen bei denen der Datensatz kleinund verrauscht ist. Eine Diskussion bezüglich der Eigenschaften dieser datengetrie-benen Methode und ihrer Evaluation wird vorgestellt.
Zusammenfassend liegt der Fokus der vorliegenden Arbeit auf datengetriebenen Me-thoden für die objektive Gang-Erfassung bei der Parkinson Erkrankung. Die Obenerwähnten Arbeiten tragen zu Frühdiagnose bei, der Evaluation des Krankheitsver-laufs, der Erfassung therapeutischer Maßnahmen und liefern Einsichten für die Lang-zeitbeobachtung von Patienten außerhalb des klinischen Betriebs. Das Verständnisdes Potenzials sowie der Fallstricke datengetriebener Methoden in der Ganganalyseführt zu einer tieferen Einsicht in die Parkinson Krankheit und öffnet neue Türen fürdie Krankenbetreuung.

Acknowledgment
Working on an interdisciplinary area including a broad range of technical and clinicalconcepts and methods, was not easy. First and foremost, I would like to thank both ofmy supervisors. I would like to thank my thesis advisor, Björn Eskofier, for his super-vision and advice throughout my PhD studies at FAU Erlangen-Nürnberg University.I want to thank him for reviewing this thesis and for his constructive feedback. I amgrateful to Jochen Klucken for supervising me regarding the clinical aspects of thisthesis. During our discussions, I learned a lot about Parkinson’s disease and criticalquestions still need to be answered. Likewise, I am so grateful to Kamiar Aminianfor accepting to be a reviewer of this thesis and to Anne Koelewijan for chairing thedoctoral defense committee.
This research has been partly financed by the Bavarian Research Foundation (BFS)and the Federal Ministry of Education and Research (BMBF). I have been fortunatein this regard.
I would also like to take the chance and thank my colleagues at the Machine Learningand Data Analytics Lab for their support throughout these years. I want to mentionspecifically Julius, Cristian, Matthias, Nils, An, and Felix. I learned a lot from you.I have also been lucky to collaborate with Jochen, Heiko and Franz from MolecularNeurology Department. Our collaboration was so fruitful. I am also grateful to myfriend, Sebastian, who helped me with writing the German abstract.
Finally, thanks to my loving parents for their continuous support throughout my life.I was fortunate in many ways. Also, special thanks to my siblings, Nasim and Nima,who always stand by my side.
Last but not least, I am so grateful to many inspiring people including professors andfriends that I met before my PhD in my home country, Iran, or Europe. I was luckyto have many sources of inspiration and encouragement.
Erlangen, June 2020 Nooshin Haji Ghassemi


Contents
1 Introduction 11.1 Motivation . . . . . . . . . . . . . . . . . . . . . . . . . . . . . . . . . 21.2 Aims & Contributions of this Thesis . . . . . . . . . . . . . . . . . . 51.3 Structure of this Thesis . . . . . . . . . . . . . . . . . . . . . . . . . . 8
2 Clinical & Technical Background 92.1 Parkinson’s Disease & Clinical Assessment . . . . . . . . . . . . . . . 10
2.1.1 Cardinal Symptoms . . . . . . . . . . . . . . . . . . . . . . . . 102.1.2 Clinical Scales . . . . . . . . . . . . . . . . . . . . . . . . . . . 112.1.3 Diagnosis . . . . . . . . . . . . . . . . . . . . . . . . . . . . . 13
2.2 Mobile Gait Analysis Systems . . . . . . . . . . . . . . . . . . . . . . 152.2.1 Human Gait . . . . . . . . . . . . . . . . . . . . . . . . . . . . 152.2.2 Gait Analysis Systems . . . . . . . . . . . . . . . . . . . . . . 16
3 Fundamentals of Data Driven Methods 213.1 Machine Learning . . . . . . . . . . . . . . . . . . . . . . . . . . . . . 21
3.1.1 Hidden Markov Models . . . . . . . . . . . . . . . . . . . . . . 213.1.2 Gaussian Processes . . . . . . . . . . . . . . . . . . . . . . . . 23
3.2 Template Matching Methods . . . . . . . . . . . . . . . . . . . . . . . 25
4 Literature Review 274.1 Segmentation of Gait Sequences & Gait Event Detection . . . . . . . 284.2 Turning Analysis in Parkinson’s Disease . . . . . . . . . . . . . . . . 304.3 Objective Assessment of PD Severity & Motor Impairment . . . . . . 314.4 Related Applications of Mobile Gait Analysis . . . . . . . . . . . . . 31
4.4.1 Gait Processing . . . . . . . . . . . . . . . . . . . . . . . . . . 314.4.2 Gait Characteristics Analysis . . . . . . . . . . . . . . . . . . 33
4.5 Open Research Questions . . . . . . . . . . . . . . . . . . . . . . . . 34
5 Segmentation of Gait Sequences 375.1 Overview . . . . . . . . . . . . . . . . . . . . . . . . . . . . . . . . . . 385.2 Methods . . . . . . . . . . . . . . . . . . . . . . . . . . . . . . . . . . 38
5.2.1 Study Population . . . . . . . . . . . . . . . . . . . . . . . . . 385.2.2 Manual Data Labeling . . . . . . . . . . . . . . . . . . . . . . 395.2.3 Training & Evaluation . . . . . . . . . . . . . . . . . . . . . . 40
i

5.3 Results . . . . . . . . . . . . . . . . . . . . . . . . . . . . . . . . . . . 445.4 Discussion . . . . . . . . . . . . . . . . . . . . . . . . . . . . . . . . . 455.5 Chapter Summary . . . . . . . . . . . . . . . . . . . . . . . . . . . . 475.6 Chapter Highlights . . . . . . . . . . . . . . . . . . . . . . . . . . . . 47
6 Turning Analysis in Parkinson’s Disease 496.1 Overview . . . . . . . . . . . . . . . . . . . . . . . . . . . . . . . . . . 506.2 Methods . . . . . . . . . . . . . . . . . . . . . . . . . . . . . . . . . . 51
6.2.1 Study Population . . . . . . . . . . . . . . . . . . . . . . . . . 516.2.2 Turning Isolation Algorithm . . . . . . . . . . . . . . . . . . . 516.2.3 Turning Features . . . . . . . . . . . . . . . . . . . . . . . . . 536.2.4 Analysis of Turning in PD . . . . . . . . . . . . . . . . . . . . 54
6.3 Results . . . . . . . . . . . . . . . . . . . . . . . . . . . . . . . . . . . 546.4 Discussion . . . . . . . . . . . . . . . . . . . . . . . . . . . . . . . . . 556.5 Chapter Summary . . . . . . . . . . . . . . . . . . . . . . . . . . . . 586.6 Chapter Highlights . . . . . . . . . . . . . . . . . . . . . . . . . . . . 58
7 Objective Assessment of PD Motor Impairments 617.1 Overview . . . . . . . . . . . . . . . . . . . . . . . . . . . . . . . . . . 627.2 Methods . . . . . . . . . . . . . . . . . . . . . . . . . . . . . . . . . . 63
7.2.1 Study Population . . . . . . . . . . . . . . . . . . . . . . . . . 637.2.2 Features . . . . . . . . . . . . . . . . . . . . . . . . . . . . . . 637.2.3 Classification . . . . . . . . . . . . . . . . . . . . . . . . . . . 647.2.4 Performance Evaluation . . . . . . . . . . . . . . . . . . . . . 64
7.3 Results . . . . . . . . . . . . . . . . . . . . . . . . . . . . . . . . . . . 657.4 Discussion . . . . . . . . . . . . . . . . . . . . . . . . . . . . . . . . . 667.5 Chapter Summary . . . . . . . . . . . . . . . . . . . . . . . . . . . . 687.6 Chapter Highlights . . . . . . . . . . . . . . . . . . . . . . . . . . . . 68
8 Summary, Discussion & Outlook 698.1 Summary and Discussion of Contributions . . . . . . . . . . . . . . . 708.2 Limitations & Outlook . . . . . . . . . . . . . . . . . . . . . . . . . . 728.3 Conclusion . . . . . . . . . . . . . . . . . . . . . . . . . . . . . . . . . 74
Appendix A 75
List of Figures 77
List of Tables 79
Terminology 81
List of Symbols 83
List of Abbreviations 84
Bibliography 87
ii

1Introduction
1

2 Chapter 1. Introduction
1.1 MotivationHealthy gait requires a healthy interplay between cognition and motor control [Snij 07]and plays a key factor in human well-being and quality of life [Snij 07, Mahl 13]. Pro-blems associated with gait lead to loss of mobility, falls and injuries [Snij 07, Gray 00].Parkinson’s disease (PD) [Park 17, Prze 17] is the most common neurological disorderthat affects gait. PD is a neurodegenerative disorder, which is caused by a progressiveloss of dopamin in the brian [Jank 08]. Age of onset is high in PD, more specificallyhigher than 60 years [Jank 08]. The cardinal motor symptoms of PD are bradykinesia,rigidity, rest tremor and impaired postural stability [Jank 08]. The pathological gaitin PD includes short steps and shuffling gait [Snij 07]. Difficulty in gait initiation andfreezing of gait are other charactristics symptoms of Parkinsonian gait [Snij 07]. Alt-hough there is no complete cure for PD, anti-parkinsonian medications can improvegait and associated problems [Jank 08] and increase the quality of life [Schr 00].
Assessment of gait is part of the standard clinical examination for diagnosis,treatment and monitoring diseases that affect gait [Jank 08]. Standard and clinicallyvalidated scales have been developed for measuring disease severity [Hoeh 67], motorimpairment nad postural instability [Goet 08] in PD. Gait examinations are performedby visual observation of impaired gait patterns and a large inter-rater varaibility isreported [Reyn 99], which leads to a subjective gait assessment [Bart 17, Rich 94]. Op-tical motion capture systems [Guer 05] and instrumented walkway systems [Bont 98]provide objective ways to assess gait and are considered a gold standard for gait cha-racterization. Although they solve the subjectivity, they are costly and their availa-bility is limited to laboratories [Bart 17]. Moreover, such systems are stationary andlack the capacity to be used for long-term monitoring [Sala 04].
In recent decades, there was a growing interest in developing mobile systemsfor gait analysis to overcome the drawbacks of stationary systems [Maet 16, Sala 04].The central part of such systems are wearable sensors that provide a quantitative andobjective way for quantifying PD signs in clinical examinations [Pasl 15]. They areeasy to use, enabling measurement of large numbers of participants outside clinics.Inertial measurement units (IMU) are a type of wearable sensors widely used inmobile gait systems [Mari 13, Kluc 13, Schl 17, Hann 17, Pane 18], due to their low costand reliability in gait measurement. They are mounted on a defined position on thebody and usually record 3D acceleration and 3D angular velocity [Bart 17, Hann 19].Applicability of IMU sensors to medical applications of gait analysis has been widelyinvestigated [Mari 13, Schl 17]. For a technical validation, gait characterization usingIMUs is compared with the one captured by gold standards like optical motion capturesystems [Klug 17a, Bart 17]. In order to integrate mobile gait systems into clinicalpractice, a clinical validation is also necessary to prove their usability in medicalapplications [Mari 13, Schl 17].
The IMU sensors measure the gait patterns and provide the necessary data for gaitanalysis [Mari 13, Schl 17, Bart 17, Hann 19]. Following the gait measurement step, thegait analysis system includes two further steps of gait processing and gait characteri-stic analysis. The gait measurement step involves the issues related to sensors, datacleaning and calibration [Hann 19], whereas the two higher-level steps deploy me-

1.1. Motivation 3
thodological approaches to transform the measured raw data into scientifically andclinically meaningful information [Schl 17]. Gait processing refers to a wide range ofmethods that process raw data into a higher-level data representation, which is mo-re useful than raw data for the clinical gait analysis. At the end of this pipeline,there exist methods to analyze the higher-level representation for diverse medicalapplications such as early diagnosis, treatment, prognosis evaluation, and long-termmonitoring [Sala 04, Kluc 13, Schl 17, Galp 19].
Data driven methods are bringing a paradigm shift to healthcare, leveraging largevolum of healthcare data [Our , Kluc 13, Hann 16]. Data driven methods in a broadsense refer to those methods that are able to process data in a principled way. Thesemethods help to capture the underlying patterns in a large volume of data to helpto reduce errors in clinical procedures [Our ]. They enable us to make inferencesregarding patients’ condition in a quantitative manner [Our ]. Such inferences can bedone in real-time in order to provide health risk alerts. Moreover, they provide higherlevel of support for patients through long-term monitoring [Our , Sala 04, Galp 19]and improve patients’ condition by personalized treatment [Our , Bloe 19, Ryde 19].
Mobile gait analysis systems also require methods to process gait data for va-rious purposes [Pasl 15]. To be part of a clinical routine, the data driven methodsshould be not only accurate but also objective and reliable [Kluc 13]. The overarchinggoal of mobile gait analysis systems is to provide monitoring for PD patients in anunsupervised manner outside clinics [Sala 04].
Using mobile gait analysis systems for analysing Parkinsonian gait is relativelyyoung [Sala 04, Schl 17]. This thesis addresses three important open questions regar-ding development of data driven methods to used in mobile gait analysis systems. Oneof the most important applications of data driven methods is segmentation of a gaitsequence to its building blocks: individual strides. This is particularly important, sin-ce many gait analysis applications are based on the statistics of strides. A multitudeof methods have been proposed for gait segmentation and evaluated on cohorts withhealthy or pathological gait [Pana 13, Mart 17]. Some of these methods bring a promi-sing result. However, the current literature on gait segmentation is lacking a consistentevaluation and comparison of the diverse proposed methods. This thesis systematical-ly addresses this gap in the literature by evaluation of multiple segmentation methodson the same data set. A powerful gait segmentation method can successfully find theindividual strides in a gait sequence regardless of the strides heterogeneity. Turningepisodes are part of gait in which strides can be highly variable. These gait episodesare very important for gait analysis inside and outside clinics. For such analysis, tur-ning episodes should be isolated from the whole gait sequence. Methods for turningisolation depend on the sensor placement. The next contribution of this thesis is topropose a novel turning isolation algorithm and to analyze the turning in PD formobile gait analysis systems with foot-worn IMUs [El G 14, Pane 18, Mari 13]. Despi-te the importance of turn-derived features, they are missing from most of the gaitanalysis applications. The final contribution of this thesis is to use features extractedfrom straight walking and turning for an automatic assessment of motor impairmentsin PD using Gaussian process (GP) [Will 06] classification. To the best of the author’sknowledge, this is the first time that this important probabilistic machine learning
4 Chapter 1. Introduction
method is used in PD studies. GPs systematically account for modeling uncertainty[Will 06] which is important for medical applications and in particular for small andnoisy data sets.
In general, the current thesis focuses on developing data driven methods for pro-cessing and analyzing Parkinsonian gait measured by inertial sensors in a way to meetthe requirements highlighted above. By that this thesis moves mobile gait analysissystems using inertial sensors closer to be part of clinical routines bringing betterinsights into Parkinson’s disease and improving patients’ care.

1.2. Aims & Contributions of this Thesis 5
1.2 Aims & Contributions of this ThesisThe goals that drive this thesis are integration of mobile gait analysis systems intoclinical routine for an objective assessment of PD. In an abstract level, mobile gaitsystems include gait measurement, processing the measured data, and analysis of datato obtain clinical relevant information. The contribution of this thesis is to apply datadriven methods to address problems that span the two higher levels of gait processingand gait analysis in mobile gait systems.
Segmentation of gait sequences represents a step in gait processing central tomobile gait analysis systems. Inertial sensors measure gait in a continuous manner.The gait sequence usually in the first step is segmented to individual elements, namelystrides. The sequence of strides constitutes a higher level representation of data thatform the basis for the gait analysis. This is probably the most widely used approachin gait analysis. Within this thesis, state-of-the-art methods for stride segmentationhave been implemented and compared with respect to their accuracy in segmentation.Based on the corresponding publication [Haji 18], the individual contributions are:
• Implementation of three stride segmentation methods previously used inthis context, namely: Euclidean based Dynamic Time Warping (DTW),Hierarchical Hidden Markov models and peak detection. Although, thesemethods are fundamentally different, all of them are applied for gaitsegmentation.
• Development and implementation of probabilistic Dynamic Time War-ping for the first time applied to stride segmentation. The notion of di-stance is central to the template matching methods. The majority ofmethods for gait segmentation uses the Euclidean distance, while thisthesis introduces the probabilistic distance.
• Empirical evaluation of methods based on two data sets with differentlevels of complexity in order to identify the best choice of segmentationmethod with respect to the accuracy. The importance of these two sce-narios stems from the fact that they frequently appear in standardizedgait tests in clinical workups. The methods are assessed based on threemetrics of F-score, precision and recall.
These methods are implemented and evaluated using two data sets. Details re-garding the method development and optimization are reported for both scenarios.
Turning analysis during standardized test is crucial to the study of theParkinsonian gait. Turning has its own characteristics and requires its own analysis.The goal of this thesis is to analyze the abnormalities of turning in a standardizedgait test using on-shoe wearable sensors and investigate whether the turn-derivedspatio-temporal features represent gait impairment and severity in PD patients. Tothis end, the following contributions were made [Haji 19]:

6 Chapter 1. Introduction
• Proposing a novel algorithm for isolation of turning episodes from thewhole gait sequence. This algorithm is tailored for the foot-worn mobilegait analysis systems.
• Quantification of turning episodes through turn-derived spatio-temporalfeatures. This thesis considers two sets of features. First, the featuresthat characterize the properties of the whole turn such as turn duration.Second, there are features that are related to the individual strides suchas stride length and time.
• Objective evaluation of turning abnormalities in a large PD cohort. Tothis end, the clinical scores of H&Y, UPDRS III and its two sub-items ofgait and postural instability are considered.
• Clinical validation of objective turning assessment by finding the cor-relation between spatio-temporal features and clinical scores includingdifferent stages of disease severity and motor impairment.
The turning isolation algorithm and feature extraction are implemented and re-sults are reported.
Objective Assessment of PD Motor Impairments is an important areain Parkinson’s disease study that can profit from applying data driven methods.The aim of this contribution is two-fold. First, this thesis examines the feasibilityof performing the classification using solely interpretable spatio-temporal features.Secondly, this thesis proposes of using a certain type of machine learning methodthat can systematically measures model uncertainty. This is particularly importantin the case of small and noisy data sets, as is the case in this application. The followingcontributions were made in this work:
• Introducing a probabilistic machine learning method, Gaussian proces-ses (GP) [Will 06], for objective classification of motor impairments. Tothe best of the author’s knowledge, this is the first time that this methodis applied for this application. The input space for the classifier is multi-dimensional spatio-temporal features, while the output is four classes ofhealthy control, and PD patients with three levels of motor impairmentgrouped based on UPDRS III.
• Evaluation of the classification method is based on the classification ac-curacy, sensitivity and specificity. These metrics evaluate the power ofthe presented method on classification of motor impairments.
• The probabilistic nature of GPs allows to perform an output estimationand measure uncertainty on the corresponding estimation. This charac-teristics is also evaluated through a probabilistic metric.
The whole pipeline including stride segmentation, turning isolation, feature ex-traction and finally classification based on spatio-temporal features is implemented.

1.2. Aims & Contributions of this Thesis 7
In summary, the scientific contributions of this thesis can be grouped in three ca-tegories. The first contribution is to process gait sequence with segmenting it to theindividual strides. By empirical evaluation of four segmentation methods, it becomesclear which method works the best in different scenarios. The second contributionproposes a turning isolation method for mobile systems with foot-worn IMUs. Anobjective turning analysis follows in order to learn if turn-derived spatio-temporalfeatures can reveal turning abnormality. Finally, this thesis proposes to deploy animportant machine learning method, Gaussian processes, for an objective assessmentof motor impairment in PD. This family of probabilistic methods can systematical-ly deal with uncertainty. This has an important implication for medical applicationsespecially for small and noisy data sets. By addressing these points, this thesis has ta-ken one step forward in improvement of mobile gait analysis systems by developmentof data driven methods.

8 Chapter 1. Introduction
1.3 Structure of this ThesisThis section presents an overview of the structure of the current thesis (Fig. 11). Afterpresentation of the motivation as well as outlining the contributions in this chapter,the necessary medical and technical background regarding Parkinson’s disease andmobile gait analysis systems is provided in chapter 2. Fundamentals of data drivenmethods are presented in chapter 3. A thorough literature review regarding datadriven methods for mobile gait analysis is presented in chapter 4. Chapters 5 to 7describe in detail the contributions of this thesis summarized in the previous section.Chapter 8 is the final chapter presenting a joint summary and discussion of all thecontributions and their implications for the study of Parkinson’s disease. Finally, anoutlook that identifies future research directions concludes chapter 8. In appendix A,the software used for the gait analysis in this thesis is presented.
Ch1: Introduction
Ch5: Segmentation of Gait
Sequence Ch6: Turning Analysis during
Standardized Test
Ch7: Objective A
ssessment of
PD M
otor Impairm
ents
Ch2: Clinical & Technical Background
Ch3: Fundamentals of Data Driven Methods
Ch8: Summary, Discussion & Outlook
Ch4: Literature Review
Figure 11: Structure of this thesis: Following the motivation in this chapter, the necessaryclinical and technical background is presented in chapter 2. The fundamental of data drivenmethods is introduced in chapter 3. Chapter 4 presents a thorough literature review regardingthe data driven methods used for mobile gait analysis. The main contributions of this thesisare presented in chapters 5 to 7. Lastly, the contributions and outlook are discussed.

2Clinical & TechnicalBackground
9

10 Chapter 2. Clinical & Technical Background
2.1 Parkinson’s Disease & Clinical AssessmentParkinson’s Disease is a neurodegenerative disorder known as a cause for a variety ofmotor and non-motor symptoms [Park 17, Jank 08]. Age of onset is high in PD, morespecifically higher than 60 years [Jank 08]. Despite the lack of a complete treatment forPD [Prze 17, Jank 08], antiparkinsonian medications like levodopa and dopaminergichave been used to manage the problems caused by PD [Jank 08]. An early diagnosis,progression monitoring and a successful personalized treatment contribute to diseasemanagement and increase patient’s quality of life [Jank 08, Bart 17]. This chapterpresents an overview of the disease’s cardinal symptoms, some of the most importantstandardized tests and clinical assessments [Prze 17].
2.1.1 Cardinal SymptomsThe most reported symptoms of PD are bradykinesia, resting tremor, rigidity, postu-ral instability and pathological gait [Jank 08]. There are also non-motor symptomsthat patients may develop during the disease [Jank 08]. Some of these symptoms aredetected at the early stage of the disease, while others are developed in later stages ofthe disease [Jank 08]. Symptoms, especially at the early stage of the PD, may overlapwith other diseases, e.g. it is difficult to distinguish PD and essential tremor disease[Beni 06] based on tremor.
Bradykinesia
Bradykinesia causes slowness in performing those movements that require motor con-trol, such as walking [Prze 17, Jank 08]. This symptom is evident even in the earlystages of the disease. Clinical assessment of bradykinesia usually covers both armsand foot to examine slowness [Snij 07], particularly in performing repetitive tasks likeheel tapping [Jank 08].
Tremor
Tremor caused by PD is often unilateral, meaning that one side of the body is affectedand occurs at rest [Jank 08, Snij 07]. The tremor frequency in PD is between 4 and 6Hz [Jank 08], which is an important factor in differentiating PD from other diseaseswith the tremor symptom [Jank 08, Beni 06]. Rest tremor in PD can involve otherparts of the body, e.g. lips, chin, jaw and legs [Jank 08]. The symptom also may occuras postural tremor [Jank 08], even earlier than other symptoms. Postural tremor oftencauses more difficulties compared with rest tremor [Jank 08, Bart 17].
Rigidity
Rigidity, a cardinal symptom of PD, contributes to the abnormal posture, with fle-xed neck and trunk [Jank 08]. Rigidity can cause pain in shoulders that might bemistakenly diagnosed as arthritis [Jank 08].
2.1. Parkinson’s Disease & Clinical Assessment 11
Postural Instability
Postural instability occurs in the late stages of the disease [Jank 08]. Postural insta-bility is one of the most common causes of falling, which may cause severe injuriesin old patients [Adki 03, Pick 07]. The clinical assessment of postural instability oftenincludes the pull test [Munh 04, Jank 08], in which the patient’s shoulder is pulledbackward very fast. Having a struggle to regain balance, e.g. taking more two stepsbackward, is an indication of postural instability [Jank 08].
Gait Impairment
Gait is a complex form of motor control [Jank 08, Snij 07]. A PD patient has shufflinggait with a reduced step height and shorter stride length. Gait disorders are amongthe first symptoms of PD [Jank 08]. Parkinsonian gait limits patient’s mobility andnegatively affects their quality of life [Snij 07, Bart 17]. These symptoms might becommon in age-related and other diseases [Snij 07].
Different gait episodes, such as straight walking and turning [Mari 13], demand dif-ferent levels of functioning and interaction between motor control and cognitive abili-ties [Snij 07, Haji 19]. Turning is impaired and slow in PD. Studies showed that gaitdeficits are evident in turning before straight walking, especially in mild PD [El G 14].There is a higher risk of falling in turning than straight walking since turning deficitscan turn to postural instability and eventually falling [Leac 18, Munh 04, Stac 04].
Freezing of gait (FoG) is another source of loss of movement [Jank 08]. Duringa FoG, patients feel “as if the feet become glued to the floor”, as stated in [Snij 07].FoG mostly affects the legs during walking [Jank 08] and is typically provoked duringturning [Manc 18b] and gait initiation. It is a common cause of falls in PD patients[Jank 08, Snij 07]. FoG mostly happens during OFF state, when the level of dopa-minergic medication is low [Manc 19, Manc 18a]. This makes the detection of FoGdifficult since PD patients visit clinicians during ON states [Manc 19, Manc 18a].
Non-motor Symptoms
Non-motor symptoms are an integral part of PD [Jank 08]. For early diagnosis, non-motor symptoms are a key [Jank 08, Wink 11]. The most common symptoms [Broe 13,Aars 10, Dalr 10] include sleep disturbances, memory problems, and anxiety [Jank 08].Most of such symptoms can be assessed with questionnaires and clinical examinations.These are self-rating scales such as the Beck Depression Inventory (BDI) [Beck 61] orZung Self-Rating Depression Scale (SDS) [Zung 65] for depression [Bart 17]. Althoughsuch scales are self-rating, some studies showed that their result could differentiatebetween PD patients and healthy age-matched people [Schr 07, Bart 17].
2.1.2 Clinical ScalesSeveral clinical scales have been developed for PD focusing on the motor and non-motor impairments and disease progression [Goet 04, Goet 08]. Hoehn and Yahr (H&Y)scale [Hoeh 67] has been perhaps the most widely used scale to estimate the severityof PD. The scale evaluates the severity of overall PD impairment based on the criteria

12 Chapter 2. Clinical & Technical Background
in table 21. The original scale was designed as a five-point scale [1-5] [Jank 08], which,later, was extended to a seven-point scale with two additional stages [Bart 17]. Thedifferent stages of PD, according to the H&Y scale are summarized in table 21.
Table 21: Description of PD severity according to the H&Y scale [Goet 04, p. 1021]
Stages Description
1.0 Unilateral involvement only
1.5 Unilateral and axial involvement
2.0 Bilateral involvement without impairment of balance
2.5 Mild bilateral disease with recovery on pull test
3.0 Mild to moderate bilateral disease; some postural instability; physically independent
4.0 Severe disability; still able to walk or stand unassisted
5.0 Wheelchair bound or bedridden unless aided
Table 21 shows that the H&Y scale focuses on the laterality of the disease andpostural instability while in later stages of the disease emphasizes the ability to walkindependently or without any aid [Goet 04]. Although H&Y proved to be valid forthe clinical assessment, this scale does not thoroughly assess all symptoms of PD[Goet 04, Jank 90].
The other widely used scale is the Unified Parkinson Disease Rating Scale (UP-DRS) [Fahn 87]. Unlike H&Y, UPDRS extensively covers the motor and non-motorsymptoms of PD. In clinical practices, UPDRS is the most widely accepted and esta-blished rating scale to examine clinical presentations of PD [Rama 02]. In 2001, theMovement Disorder Society (MDS) published a review of the UPDRS and recommen-ded a refined version that addresses identified problems in the original one [Goet 08].This thesis used the modified version of UPDRS [Goet 08, Goet 07].
The complete UPDRS score addresses different aspects of the disease throughrating four general parts. The overall rating of a part is the sum over ratings ofall of its sub-item. The following is the description of these four parts according toGoetz et al. [Goet 08, p. 2130]
• Part I: Non-motor experiences of daily living
• Part II: Motor experiences of daily living
• Part III: Motor examination
• Part IV: Motor complications
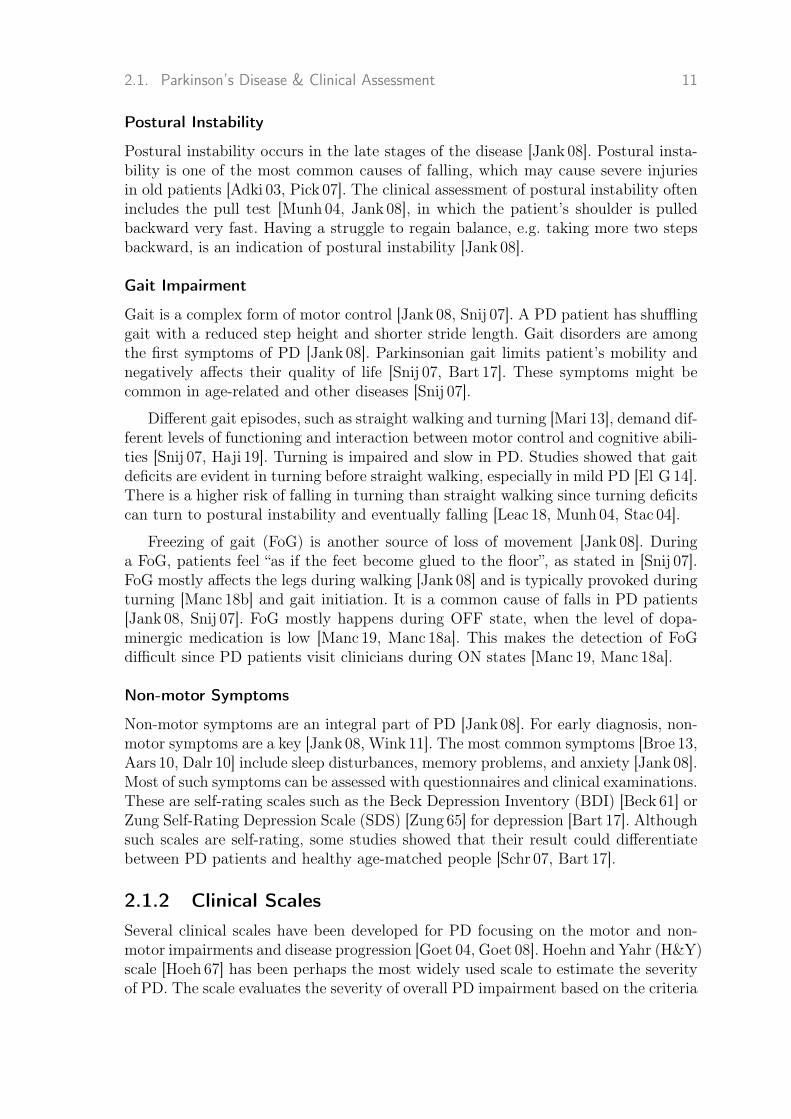
This thesis mainly applies the part III of the UPDRS scale (motor examination),which includes 27 sub-items (Fig. 21).
These sub-items are rated on a five-point scale from 0-4, where the higher scoreindicates a higher impairment. The most important sub-item used in this thesis is

2.1. Parkinson’s Disease & Clinical Assessment 13
gait. There are different definitions of gait impairment. The following table 22 is thedescription of the rating gait sub-item presented in Goetz et al. [Goet 08].
Table 22: Gait sub-item of the UPDRS III presented in [Goet 08, p. 2161].
Score Description
0:Normal No problems
1:Slight Independent walking with minor gait impingement
2:Mild Independent walking with substantial gait impingement
3:Moderate Requires an assistance device for safe walking (Walking stick, walker) but not a person
4:Severe cannot walk at all or only with another person’s assistance
UPDRS scale is widely used for a variety of studies in PD. However, a high inter-rater variability is reported [Reyn 99] that restricts its applicability in individualizedmedical care. Chapter 7 approaches this problem by using a machine learning methodfor an objective assessment of motor impingement.
2.1.3 DiagnosisPD Diagnosis is typically based on the presence of a combination of motor andnon-motor symptoms and the patient’s response to the medications like levodo-pa [Grou 04]. Clinicians can readily diagnose PD when patients manifest clear sym-ptoms, e.g. in advanced stages of the disease [Jank 08]. In the early stage of thedisease, however, symptoms overlap with other diseases, making PD diagnosis chal-lenging. “Diagnostic criteria have been developed by the UK Parkinson’s DiseaseSociety Brain Bank [Hugh 92a] and the National Institute of Neurological Disordersand Stroke (NINDS)” [Jank 08]. In this thesis, PD is defined according to the guide-lines of the German Association for Neurology (DGN), which are similar to the UKPD Society Brain Bank criteria [Haji 19].
14 Chapter 2. Clinical & Technical Background
Figure 21: Rating sheet of the UPDRS III motor score including 27 sub-items. The ratingof sub-items are based on Goetz et al. [Goet 08]. The format of the rating sheet is basedon Barth [Bart 17, p. 46].

2.2. Mobile Gait Analysis Systems 15
2.2 Mobile Gait Analysis SystemsFirst, chapter 1 outlined the advantages of using mobile gait systems for analysis ofPD gait. Diverse systems have been developed to assist gait analysis conducted fora wide range of purposes. Such systems can be conceptually decomposed into threedistinct levels: gait measurement, gait processing and gait analysis (Fig. 22). Whilegait measurement centers on systems and sensors that record the gait, the system’stwo higher levels include methods to process the recorded data and obtain relevantinformation for a certain application scenario. In this chapter, first briefly, characte-ristic of human gait is discussed [Wint 91], with an emphasis on the biomechanics ofgait. Then, technologies and methods involved in different levels of the gait analysissystems are discussed.
Turning Isolation
Stride Segmentation
Spatio-‐temporal Param. Extraction
Gait Characteristics Analysis
Motor Impairment Classification
Introduction
Gait Processing
Gait Measurement
Figure 22: The general pipeline of mobile gait analysis systems. The first step spans tech-nologies and systems used for measuring gait. The next step is processing the measured gaitand preparing it for the following step of gait characteristics analysis.
2.2.1 Human GaitHealthy gait in humans is a result of a successful interplay of many parts of the body.The gait command is activated within the central nervous system and transmitted tothe peripheral nervous system [Silv 20, Vaug 99]. The gait signals, then, cause muscleactivation, which, in turn, generates the necessary forces to move joints and skeletalsegments [Silv 20, Vaug 99]. This chain of processes complete by generating groundreaction forces [Silv 20, Vaug 99].
Various factors such as age, body height, weight and cognitive condition influ-ence the cyclic pattern of healthy gait [Snij 07, Pirk 17]. Problems in any part of thebody mentioned above may cause gait disturbances, which may result in a changein gait patterns [Pirk 17]. This thesis focuses on analyzing the gait patterns and itsabnormalities by analyzing the biomechanics of gait.
The most common approach is to segment a gait sequence to its cycles, referred toas strides [Whit 14]. Differences between gait patterns stems from the differences intheir strides. Hence, analyzing strides forms a basis for obtaining gait characteristics.
Each stride consists of two phases of stance and swing [Whit 14]. During the stancephase, the foot remains on the ground, while a swing phase refers to the entire timethat the foot is not in contact with the ground (Fig. 23) [Vaug 99, Whit 14]. Whenone phase ends, the other phase begins [Whit 14]. Stride phases, in turn, consist ofseveral distinct events. A heel-strike (HS) is when contact between foot and groundoccurs [Whit 14]. A mid-stance (MS) when the foot movement is minimal [Whit 14].

16 Chapter 2. Clinical & Technical Background
A heel-off (HO) and a toe-off (TO) occurs when the heel and toe leaves the ground,respectively [Pirk 17, Whit 14] (Fig. 23).
Figure 23: The healthy gait cycle including gait events and phases. Figure used with kindpermission of Julius Hannink [Hann 19, p. 11].
2.2.2 Gait Analysis SystemsThis section presents different levels of gait analysis systems used for objective as-sessment of gait.
Gait Measurement Systems
Several electronic systems have been used for objective measurement of gait. Thesesystems are different in size, cost and biomechanical resolution. Such systems weretraditionally stationary and could only be used in laboratories. In contrast, recentdevelopment in wearable sensors enables us to develop systems that can be usedoutside of laboratories [Pasl 15]. Here, an overview of the most frequently used systemsis presented.
Stationary Systems
This section gives a short introduction of the two most widely used stationary systemsfor gait analysis.
Optical Motion Capture (MoCap) systems utilize data captured from severalsynchronized cameras to create a 3D model of a subject body. The 3D model isconstructed in a marker-based or marker-less system. The marker-based system usesmarkers on the body in order to model the motion. The marker-less system is base onsilhouette motion tracking [Guer 05]. In either case, the system can detect differentbody , e.g. thigh, shank, and foot [Klug 17a]. Figure 24 shows a MoCap systemincluding 16 cameras and a force plate as a walking surface [Hann 19]. For the gaitmeasurement using the extracted 3D models, it is enough to obtain strides from agait sequence and extract features such as length and time from each stride.
MoCap is widely accepted as a gold standard due to its high precision. The outputof mobile systems using inertial sensing are mostly compared with MoCap systems[Hann 19]. However, it is costly and stationary and can only be used inside of labo-ratories [Klug 17a, Hann 19]. Moreover, the room for capturing images needs to be

2.2. Mobile Gait Analysis Systems 17
large enough to allow recording from a large number of viewpoints. Although therehave been attempts to alleviate the latter problem [Lieb 10].
Pressure Sensitive Walkways are another type of stationary system for ob-jective gait measurement (Fig. 24). These carpets consist of a carpet as a walkingsurface. The carpet is pressure sensitive since a grid of pressure sensors is embeddedin it [Bont 98]. Such systems are primarily designed for gait measurement and providetemporal and spatial gait features [Bont 98]. The GAITRite system [GAIT] (figure 24Right) is a commercial pressure sensitive walkway system that provides the carpetand software to extract a variety of gait features [Hann 19]. The GAITRite systemis considered a gold standard in many studies [Webs 05, McDo 01]. Pressure sensitivewalkways are less costly compared to MoCap systems, yet they are still stationaryand mainly available in laboratories [Hann 19].
Figure 24: Left: An optical motion capture system (red boxes: cameras. green box: a for-ce plate) Right: A pressure sensitive walkways system (green box: pressure-sensitive car-pet, blue box: software system) [Hann 19]. Figure used with kind permission of Julius Han-nink [Hann 19, p. 16].
Mobile Systems
To design a mobile system, the measurement system should include mobile sensors.The goal often is to use such systems for monitoring of PD patients outside labo-ratories [Sala 04, Roth 18]. This part briefly reviews the two most important mobilesensors.
Pressure Insole Sensors [Crea 14] have the same role as pressure sensitive walk-ways to measure pressure data, with the difference that they are mobile [Bont 98].This sensor is wearable and can be attached e.g. inside the shoes. Synchronized leftand right insoles enable us to extract a broader range of gait features such as doublesupport time [Roth 18].
Inertial Sensors are an important family of mobile sensors with numerous ap-plications in capturing motion including body motion [Cloe 08]. Inertial sensors arebased on accelerometer and gyroscope, which measure acceleration and angular velo-city, respectively [Hann 19]. An inertial measurement unit (IMU) including tri-axial

18 Chapter 2. Clinical & Technical Background
accelerometer and tri-axial gyroscope can measure gait and provide necessary datafor gait analysis [Schl 17]. IMUs are increasingly used in wearable mobile gait measu-rement systems [Pasl 15].
IMU sensors can be attached to different human body positions [Jarc 14, Hamm15,Khur 15, Mari 10, Rebu 13, Ramp15]. The sensor position affects the biomechanicalresolution of the gait measurement. It was shown that as sensors get closer to thefoot, higher accuracy for detecting gait events and features can be obtained [Pane 18].Moreover, for long-term monitoring of patients, sensors integrated into footwear areless obtrusive and stigmatizing [Bart 17].
Despite the small size and low cost, IMU sensors possess an inferior biomechanicalresolution compared with MoCap systems. To validate mobile systems using wearablesensors, they are compared with gold standards such as MoCap [Buck 19, Esse 12].
On-Shoe Gait Measurement System
This section presents a specific mobile gait analysis system using sensors mounted onshoes that was used for the experiments presented in this thesis. In this system, datawas recorded using two Shimmer 2R/3 (Fig. 25) IMU (Shimmer Sensing, Dublin,Ireland) [Burn 10]. The frequency of recording is 102.4 Hz. Each unit consisted ofa tri-axial accelerometer (range Shimmer 2R: ± 6 g, Shimmer 3: ± 8 g) and a tri-axial gyroscope (range Shimmer 2R: ± 500 ◦/s, Shimmer 3: ± 1000 ◦/s). The currentsetting has been used previously [Nguy 19, Bart 17].
Figure 25: Shimmer 2R frame including inertial sensors (accelerometer and gyroscope)[Burn 10]. Sensor size is compared to a coin. Figure used with kind permission of JuliusHannink [Hann 19, p. 18].
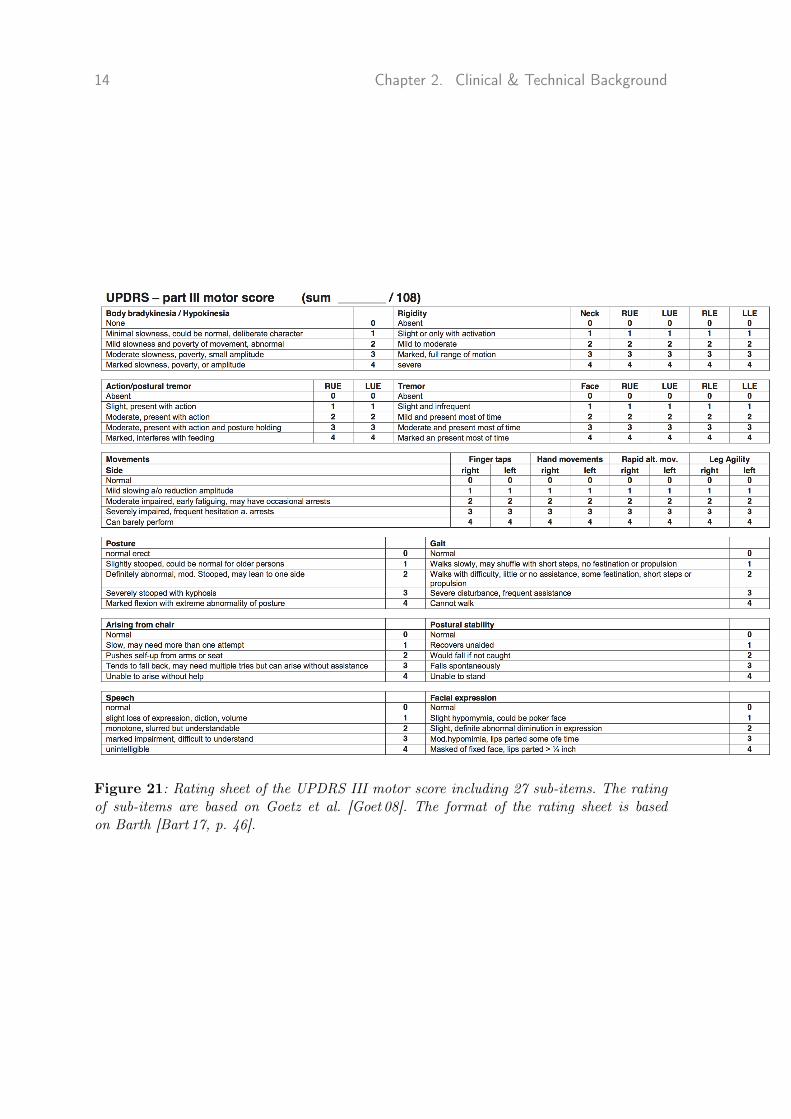
The IMUs were mounted laterally on each shoe below the patient’s ankle [Haji 19,Bart 17] (Fig. 26). This setting has been used previously in other works [Hann 19,Bart 17]. The motivation behind this choice of sensor placement is two-fold. First,Panebianco et al. [Pane 18] suggest that this sensor placement can provide higherbiomechanical resolution. Second, sensors on shoes is less stigmatizing in long-term
2.2. Mobile Gait Analysis Systems 19
monitoring [Bart 17]. The measurements from both feet were included in all experi-ments.
Figure 26: Left: A shoe (Adidas Duramo 3) with a Shimmer sensor unit. Right: Thecoordinate frames of IMUs. Figure used with kind permission of Jens Barth [Bart 17] andJulius Hannink [Hann 19, p. 29].
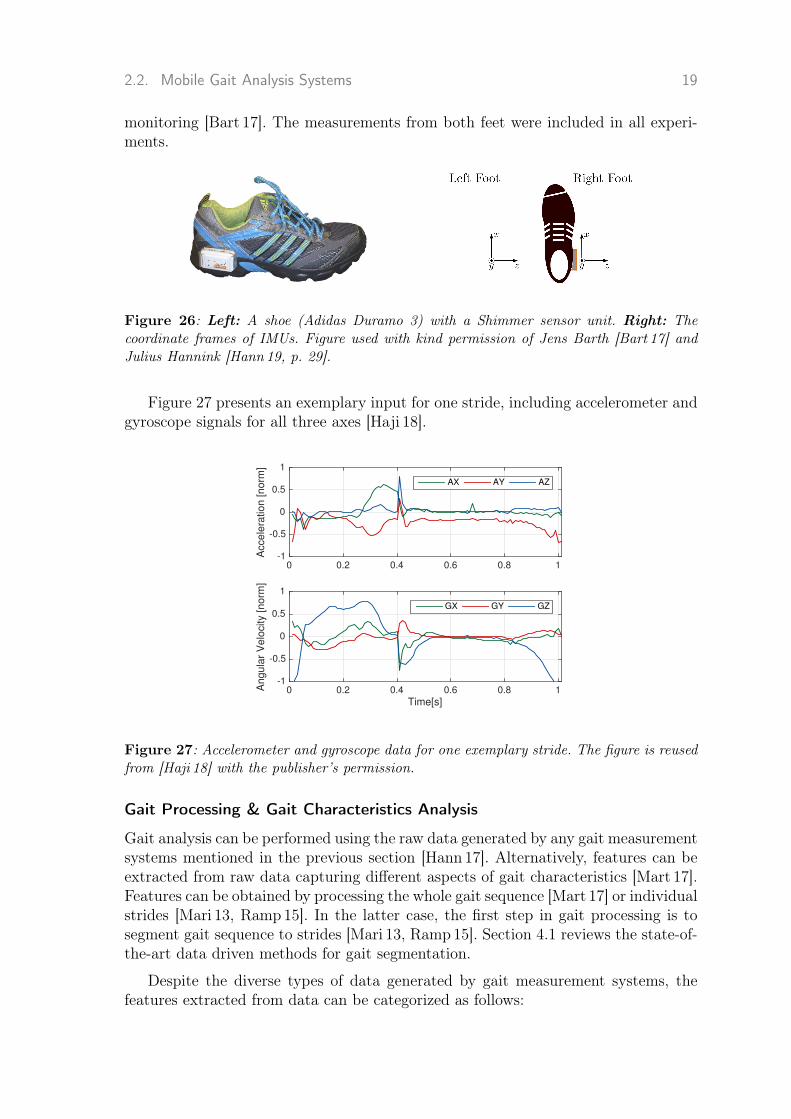
Figure 27 presents an exemplary input for one stride, including accelerometer andgyroscope signals for all three axes [Haji 18].
0 0.2 0.4 0.6 0.8 1
Acce
lera
tio
n [
no
rm]
-1
-0.5
0
0.5
1
AX AY AZ
Time[s]0 0.2 0.4 0.6 0.8 1A
ng
ula
r V
elo
city [
no
rm]
-1
-0.5
0
0.5
1
GX GY GZ
Figure 27: Accelerometer and gyroscope data for one exemplary stride. The figure is reusedfrom [Haji 18] with the publisher’s permission.
Gait Processing & Gait Characteristics Analysis
Gait analysis can be performed using the raw data generated by any gait measurementsystems mentioned in the previous section [Hann 17]. Alternatively, features can beextracted from raw data capturing different aspects of gait characteristics [Mart 17].Features can be obtained by processing the whole gait sequence [Mart 17] or individualstrides [Mari 13, Ramp15]. In the latter case, the first step in gait processing is tosegment gait sequence to strides [Mari 13, Ramp15]. Section 4.1 reviews the state-of-the-art data driven methods for gait segmentation.
Despite the diverse types of data generated by gait measurement systems, thefeatures extracted from data can be categorized as follows:

20 Chapter 2. Clinical & Technical Background
Statistical features such as mean, median, variance, higher-moments and entro-py can be computed in the time and frequency domain [Bart 17]. If raw data of IMUsis processed, features are in time domain. IMU data can be transformed into the fre-quency domain, e.g. by using Fourier transform [Brac 86, Bart 17]. Specific featuresthen can be computed in the frequency domain.
Spatio-temporal features extracted from individual strides are widely used ingait analysis [Amin 02, Ramp15]. These features reveal different spatial and temporalaspects of strides that are readily interpretable for clinicians [Schl 17, Mari 13].
The most commonly used temporal features in this thesis are stride time, stanceand swing time [Schl 17, Mari 13]. In the spatial domain, the stride length is by farthe most important feature [Hann 19, Schl 17] defined as the distance between initi-al and final foot position in a stride, e.g. from mid-stance to mid-stance [Bart 17].Another important spatial feature is the turning angle, which is the change of azi-muth [Mari 13] between two successive MS events [Mari 13, Hann 19]. The turningangle is an important feature to distinguish between straight walk and turning episo-des of gait [Mari 13]. For a comprehensive list of spatio-temporal features, this thesisrefers to chapter 5 of [Bart 17].
Raw data or features prepared in the gait processing step can be used for gaitanalysis in widespread applications in medicine, inside or outside laboratories. Someof these applications are reviewed in chapter 4.

3Fundamentals of DataDriven Methods
3.1 Machine LearningMachine learning (ML) models are the most important data driven methods usedfor processing gait data. In particular, a machine learning model can automaticallydiscover the underlying pattern in data when there is no targets or labels available[Murp 12]. If labels are available in addition to the input, a machine learning modelfinds a mapping or a function that maps the inputs to the labels [Murp 12], knownas supervised learning [Murp 12]. This thesis applied supervised in order to analyzepathological gait (Chapters 5 and 7).
In the first step, a ML model is fit to an available data set. This is known asa learning phase [Murp 12]. Learning a model means finding the optimal values formodel parameters based on a given data set [Murp 12]. This phase mostly includesusing optimization methods in order to find the optimal parameter value [Murp 12].In the next step, the learned model is used to perform an inference on a previouslyunseen data or test data [Murp 12].
This thesis applies different types of ML models and optimization methods. Chap-ters 5 and 7 present an application of hierarchical Hidden Markov Models (HMMs)[Ghah 01, Rabi 86] and Gaussian processes (GPs) [Will 06], respectively.
3.1.1 Hidden Markov Models
Motor Impairment
Classification Motor Impairment Classification Motor Impairment Classification
Gait Characteristics Analysis
Gait Processing
Gait Measurement
Spatio-‐temporal Feat. Extraction
Turning Isolation
Gait Data Pre-‐processing
Stride Segmentation
Statistical Analysis
y1 y2 y2
s1 s2 s3 s4 sT
y3 y4 y2
yT y2
. . .
Figure 31: A hidden Markov model with hidden states and observations. Arrows show themodel dependencies [Ghah 01].
21

22 Chapter 3. Fundamentals of Data Driven Methods
Hidden Markov Models (HMMs) are used in chapter 5 for the segmentation of gaitsequences. Figure 31 shows the graphical model of a HMM. There are three distinctparts is illustrated in this figure as follows:
1. A HMM [Ghah 01, Rabi 86] is seen as a process including multiple states.These states are hidden or latent, meaning that they are not observa-ble [Ghah 01]. These hidden states satisfy the Markov assumption, whichmeans that st depends only on the previous state st−1 and is indepen-dent to the whole history [Ghah 01]. The arrows in figure 31 indicatedependency between states.
2. Observations are denoted by yt. In this thesis the observations are theIMU data. In chapter 5 IMU data is modeled using a specific type ofHHMs. Figure 31 shows that observations also satisfy Markov assump-tion with respect to the hidden states [Ghah 01]. For example, given st,the observation yt is independent of all previous states and observati-ons [Ghah 01]. The Markov assumption makes the model and thereforecomputations simpler [Ghah 01].
3. The final part is the initial state s1 where there is no previous state.This state should be initialized either randomly or learned based on data[Ghah 01].
What mentioned above can be formalized in the joint distribution of states andobservations as stated in [Ghah 01]
p(s1:T , y1:T ) = p(s1)p(y1|s1)T∏t=2
p(st|st−1)p(yt|st) (3.1)
While p(s1) is the initialization of the model, p(st|st−1) is the transition betweenstates and p(yt|st) is the observation model [Ghah 01]. The joint distribution can befactorized to single terms of p(st|st−1) or p(yt|st) [Ghah 01], when states and obser-vations are independent.
Learning in HMM involves finding three groups of model parameters. One groupof parameters are the transition matrix entries [Ghah 01]. If data is continuous likeIMU data in this thesis, observations can be modeled using Gaussian Mixture models(GMMs) [Reyn 09]. A “GMM is a weighted sum of Gaussian component densities”[Reyn 09]. When there are K Gaussian components, the GMM becomes
p(yt) = ΣKk=1πkN (yt|µk, σ
2k) (3.2)
where N () denotes a Gaussian distribution. The parameters of a GMM is a set ofmean µ, variance σ2 and weights for each Gaussian density πk [Reyn 09].
Also, the initial state probabilities can be determined at learning time.

3.1. Machine Learning 23
Since the states are hidden, maximizing equation 3.1 is difficult [Ghah 94]. Thesolution is to use the Expectation Maximization (EM) algorithm [Bilm 98]. In the con-text of HMM, the EM algorithm is known as the Baum-Welch algorithm. [Ghah 01].
One task that appears in many applications of HMM is to compute the most pro-bable state sequence [Ghah 01]. In order to perform it, the Viterbi algorithm [Vite 67]is applied for gait segmentation in chapter 5.
Hierarchical Hidden Markov Models
Chapter 5 deploys a variation of HMMs called hierarchical HMM [Fine 98] for theapplication of gait segmentation. hHMMs are different from the most basic form ofHMMs, mainly in the structure of the model. In hHMM, it is possible to have ahierarchy of model states, which makes it more powerful for data modeling [Fine 98].
Hierarchical HMMs [Fine 98] generalize the HMM models in a way that each statecan be a model itself, e.g. another HMM. Figure 32 shows a hHHM in the case ofa two-level hierarchy. The HMMs in the second level have states in turn, known assub-states. The state transitions can be taken place between states in one level orbetween states and sub-states in different levels [Fine 98]. The lowest level sub-states,in this case the second level sub-states, define the observation model [Fine 98].
2
1 3
2
1
3
4
1
Figure 32: Topology of a two-level hHMM. Large circles represent states in the first levelof the model. Each state in turn is a HMM with sub-states (dark circles). Here, left-to-rightHMMs are applied in the second level. The figure is reused from [Haji 18] with the publisher’spermission.
3.1.2 Gaussian ProcessesGaussian Processes (GPs) are used in chapter 7 for the classification of motor impai-rements in PD. A brief overview is presented here, where for a comprehensive intro-duction, the author refers to the book by Rasmussen and Williams (2006) [Will 06].
The data set is a pair of input-output D = {xi, yi}ni=1. The goal here is to per-form a binary classification where y = ±1. One way to solve this problem is to findthe conditional distribution p(y|x) [Kuss 05]. GPs do the same by introducing anintermediate latent or hidden stochastic process f [Kuss 05, Will 06], where
fi = f(xi), f = [f1, ..., fn]. (3.3)

24 Chapter 3. Fundamentals of Data Driven Methods
Considering the function f , the likelihood is p(y|f) [Kuss 05].
By assuming that data is identically independently distributed, the data likelihoodfactories [Kuss 05].
p(y|f) =n∏
i=1
p(yi|fi) (3.4)
Since it is a binary classification task, a probit function Φ((f(x)) is required tomap the latent function to unit interval [Kuss 05].
p(y|f) =n∏
i=1
p(yi|fi) =n∏
i=1
Φ(yifi) (3.5)
The prior over latent function f is a Gaussian process [Kuss 05]. This type ofprocesses can be fully determined by mean and kernel function k(x, x′) [Kuss 05]
f ∼ GP(m, k) (3.6)
The posterior over latent function f can be estimaed using Bayes theorem for agiven input X [Kuss 05].
p(f|D, θ) =N (f|0,K)
p(D|θ)
n∏i=1
Φ(yifi) (3.7)
where likelihood p(D|θ) and prior N (f|0,K) appear on the numerator. Model hyper-parameters θ are kernel parameters and noise variance [Kuss 05]. The denominatorp(D|θ) is marginal likelihood and a normalizing constant [Kuss 05].
p(D|θ) =
∫p(y|f)p(f|X, θ)df (3.8)
In Bayesian inference, marginal likelihood is optimized in order to find the hyper-parameters of the GP model (type-II maximum likelihood (ML-II)) [Kuss 05, Will 06].However, the posterior in equation 3.7 and the marginal likelihood in equation 3.8 cannot be computed analytically due to the presence of the non-linear probit function[Kuss 05]. Hence, an approximation is needed [Kuss 05].
This thesis used Expectation Propagation (EP) [Mink 13]. EP method gives aGaussian approximation to the posterior [Kuss 05]. The parameters optimization isperformed in an iterative manner. In each iteration, all parameters are marginalizedout except one fi [Kuss 05]. Then the probability of p(fi|D, θ) is approximated by aGaussian distribution [Kuss 05, Will 06]. Hence, the only parameters that are neededto be estimated are the mean m and variance A of the approximated Gaussiandistribution N (fi|mi,Aii) [Kuss 05, Will 06].
For a test input x∗, the approximate predictive f∗ [Kuss 05]

3.2. Template Matching Methods 25
p(f∗|D, θ, x∗) = N (µ∗, σ2∗) (3.9)
where
µ∗ = kT∗K
−1m (3.10)
andσ2∗ = k(x∗, x∗)− kT
∗ (K−1 −K−1AK−1)k∗ (3.11)
where the vector k∗ = [k(x∗, x1), . . . , k(x∗, xn))] contains covariances between x∗ andtraining inputs X [Kuss 05].
and class probabilities y∗ [Kuss 05] are
p(y∗ = 1|D, x∗) = Φ(µ∗√
1 + σ2∗). (3.12)
Kernel
Kernels control the charatristics of the function learned by GP method [Scho 02,Will 06]. For example, a Gaussian or radial basis kernel implies that the function fis smooth [Will 06].
The Gaussian kernel is defined as
k(x,x′) = α2 exp(−1
2
D∑d=1
(x− x′)2
l2d) (3.13)
where the hyper-parameters are the signal variance α2 and the characteristic length-scales ld [Will 06], which control the smoothness of each input dimension d = 1, . . . , D[Haji 14].
3.2 Template Matching MethodsIn chapter 5, Dynamic Time Warping (DTW) [Mull 07, Bart 15, Bart 17] is app-lied to gait segmentation. In general, DTW is used to find the similarity betweentwo time-series sequences. When applied on gait segmentation, the goal is to findmultiple strides in a gait sequence [Bart 17]. Multi-subsequence Dynamic Time War-ping (msDTW) is an extension of DTW that allows us to achieve this [Bart 17]. In thefirst step, a template of a stride is constructed in order to find multiple occurrencessimilar to that template [Bart 17]. The algorithm used here is the same as the workby Barth [Bart 15, Bart 17].
The msDTW is based on a distance of a part of the gait sequence and the template[Bart 17]. Extensions of msDTW are different in the way they compute this distancemetric and create the template. This thesis applies Euclidean and probabilistic baseddistance function.

26 Chapter 3. Fundamentals of Data Driven Methods
Euclidean Dynamic Time Warping
For generating a template, a set of strides of any form and size is considered [Bart 15].For eDTW, the strides are interpolated to the size of the template and are avera-ged sample by sample to generate a representative template [Bart 17] Then, in thefirst step of the DTW algorithm, the Euclidean distance between the samples of theaverage template and the gait sequence is computed [Bart 15, Bart 17].
Probabilistic Dynamic Time Warping
Probabilistic DTW (pDTW) [Baut 13, Hern 14] constructs a probabilistic template.Once all training strides are aligned to the template length, the samples at a certainpoint among all strides are modeled using a Gaussian distribution [Baut 13]. As aresult, Gaussian distributions construct a probabilistic template with the templatelength. The probability of stride samples using the corresponding Gaussian distri-bution is computed, as a distance of a gait sequence to this probabilistic template[Baut 13]. These probabilities provide a similarity measure between samples of thegait sequence and elements of the template. To obtain a distance measure, the expo-nential of negative of similarity measure is computed [Baut 13, Hern 14].

4Literature Review
27

28 Chapter 4. Literature Review
Remarkable increases in the amount of healthcare data have brought a paradigmshift in diseases understanding as well as healthcare [Pasl 15]. One of the areas thatincreasingly profits from the development and deployment of data driven methodsis the study of Parkinson’s disease [Pasl 15]. Wearable sensors enable us to measureParkinsonian gait in large populations and for a long time [Pasl 15]. Leveraging suchadvancements for an objective analysis of PD gait is central to the current thesis. Thischapter, first, reviews applications of data driven methods for mobile gait analysis,addressing various challenges facing Parkinson’s disease studies.
A variety of mobile gait analysis systems have been designed and developed du-ring recent decades. These systems are different in system design: e.g. in sensorstype [Dera 10, Amin 02, Mann 11] and sensor placement [Mari 10, Rebu 13, Jarc 14,Hamm15, Khur 15, Cara 18]. These design choices change data characteristics and,consequently, the development of the data driven methods. Therefore, a wide range ofdata driven methods have been developed for gait analysis [Pana 13, Kluc 13, Bart 15,Esko 16, Hann 16]. This chapter reviews diverse data driven methods that were usedfor mobile gait analysis.
Long-term monitoring of patients outside clinics is another important goal [Sala 04,Sait 04]. Mobile gait analysis systems were initially applied in the context of measu-rement and objective analysis of gait during standardized tests inside clinics [Bart 17,Hann 19]. These two scenarios have clear implications for deployment of data drivenmethods. Data recorded inside clinics or during daily living are very different [Hann 19].The latter results in a higher level of heterogeneity and is more complex [Hann 19].Hence, more robust methods are required to analyze it. Many applications of long-term monitoring are real-time [Mazi 13, Zia 16]. Some examples of applications in thiscategory are fall and FoG predictions [Mazi 16] in order to produce necessary alarmsfor patients. Perhaps the biggest challenge here is to process data in a timely mannerwithout compromising performance.
Next sections review data driven methods applied for different applications inParkinson’s study. Again, the author of this thesis refers to the three conceptuallevels of a mobile gait analysis system: gait measurement, gait processing, and gaitcharacteristics analysis. Data driven methods have been applied to the two higherlevels to process and analyze gait data.
4.1 Segmentation of Gait Sequences & Gait EventDetection
A critical step in gait analysis is to segment a gait sequence to individual strides. Thegoal in gait segmentation is, in particular, to identify two events of the beginningand end of the strides [Jarc 14, Bart 15]. The concept of stride segmentation can beextended to gait event detection, where in addition to the beginning and end of strides,other events, such as heel-strikes or toe-off, are detected [Kidz 19]. Event detection iswidely used for activity recognition in sports and daily life [Lara 12, Leut 13, Blan 15].
If gait were a entirely periodic task, stride segmentation could readily be perfor-med. However, in reality strides are not periodic and there are different sources of

4.1. Segmentation of Gait Sequences & Gait Event Detection 29
variation in their form, length, and other characteristics [Jord 07]. Gait disturban-ces vary from patient to patient (inter-patient gait variability) resulting in differentstride patterns. Moreover, walking speed varies with age considerably affecting strideduration [Kang 08, Klug 17b]. Strides may even vary during a short walk during a cli-nical test (intra-patient gait variability). For example, gait initiation and terminationusually deviate from the rest of the gait sequence. These sources of variation resultin a heterogeneous sequence of strides, which is one of the main challenges in stridesegmentation and calls for intelligent processing methods.
Different algorithmic methods have been applied for gait segmentation, whichcan be summarized into three groups. Historically, signal processing methods werea workhorse for such applications [Naja 03]. Many segmentation methods have be-en proposed based on the detection of stride events in the signals, such as toe-offand heel-strike. Some methods have used clearly defined signal characteristics likepeaks [Sala 04, Sell 05, Libb 08, Dera 10], minimums or zero-crossings [Hund 14] in thegyroscope or accelerometer signal to identify events. Several works proposed usingwavelet analysis to determine stride events. They suggested that events are betteridentified in the wavelet domain rather than in the time domain [Amin 02, Gouw09,Khan 14].
Signal processing alone cannot deal with the variability and heterogeneity in datain a principled way [Bart 15, Bart 17]. An alternative to signal processing approachesis template matching algorithms [Mull 07, Holt 07, Bart 15]. This group of algorithmsis used for computing the similarity between two time series [Bart 15, Bart 17]. ThemsDTW method, presented in section 3.2, has been used by Barth et al. [Bart 15,Bart 17] for gait segmentation. The method allows the identification of multiple stri-des in a sequence though they might differ in length, amplitude and form [Bart 15,Bart 17].
Data driven methods have been used successfully for gait segmentation. Gaitmeasured by IMUs is a type of time series [Diet 02] and there are various works thataddress gait segmentation as processing a time series. This section 4.1 presents anoverview of the most important data driven approaches to gait segmentation.
HMMs are presented in section 3.1.1 as a framework for representing probabilitydistributions over sequences of data [Ghah 01], where finding the targeted eventscan be done based on the underlying probability of the data set. Several studies usedHMMs to segment pathological and healthy gaits [Mann 11, Mart 17]. A HMM can beexpanded hierarchically, where each state at the first level can be a HMM itself withseveral sub-states (Sec. 3.1.1). hHHM proved to be more powerful in modeling thanconventional HMMs and are applied for example to gait segmentation of hereditaryspastic paraplegia (HSP) patients [Mart 17].
The majority of works learn the HMMs in a supervised manner, in which they pro-vide labels for the targeted events [Diet 02]. Semi-supervised learning is also applica-ble, and in particular useful when labels are provided only for some events [Mart 17].For example, in gait segmentation, there may be ground truth labels available forthe beginning and end of the strides but not for the events in between like heel-

30 Chapter 4. Literature Review
strike [Mart 17]. A supervised learning is applied for the events with labels, andunsupervised learning for the rest the gait events [Mart 17, Nata 07, Duon 05].
Gait segmentation can also be performed using DNNs [LeCu 15, Good 16, LeCu 90].This family of methods is non-probabilistic [LeCu 15] and has a different approachto data modeling compared with HMMs. DNNs learn a representation of data bymapping the gait sequence to the targeted labels using several hidden layers of func-tions [LeCu 15, Good 16]. The main role of the hidden layers is to capture the under-lying representation of data that is suitable for the task at hand [LeCu 15, Good 16].
The most widely used variation of DNNs for time series might be Long Short-Term memory (LSTM) [Gers 99, Good 16], which can capture data dependencies in asequential data [LeCu 15, Good 16]. Convolutional neural networks (CNN) [LeCu 15],another variation of DNNs, have also been applied for processing time series [Hann 16,Hann 17]. Kidzinski et al. [Kidz 19] applied LSTM to gait event detection in childrenwith healthy and pathological gait. The study shows the viability of LSTMs for gaitsegmentation, although gait was measured using ground reaction forces [Kidz 19].Gadaleta et al. [Gada 19] developed an event detection method based on CNN usingIMU data to detect initial and final foot contacts.
4.2 Turning Analysis in Parkinson’s DiseaseOutside the clinics and in the majority of standardized clinical tests, a gait sequenceincludes both straight walking and turning [Stac 04, Stac 06]. In order to differentiatebetween these two episodes of gait, different definitions of turning have been presentedin the literature. For example, turning was defined as the movement between twopre-defined points that indicate the initiation and termination of turning [Stac 04].Salarian et al. [Sala 09] used mathematical modeling in order to isolate turns from thewhole gait sequence. Spatio-temporal features extracted from individual strides aredifferent in straight walking compared to turning. Many studies used statistics of suchfeatures to define turning [Mari 13, El G 14, Manc 18a]. Without a standard turningdefinition, studies then conducted clinical validations to support their definitions, e.g.they showed that turning features correlated to the established clinical scores [Mari 13,El G 14, Manc 18a].
Some studies have attempted to objectively assess turning deficits [Stac 06, Mak 08,Huxh 08a, Hong 09, Hong 10] by utilizing the definition of disease stages and motorimpairments by UPDRS-III [Goet 08] and H&Y [Hoeh 67] clinical scores. Studies onspatio-temporal features quantifying turning have demonstrated reduced speed, lon-ger duration of turning and more strides as the disease progresses [Huxh 08b, Sala 09,King 12, El G 14]. Postural stability also decreases during turning for PD patients incomparison to healthy controls, particularly during fast walking [Mell 16].

4.3. Objective Assessment of PD Severity & Motor Impairment 31
4.3 Objective Assessment of PD Severity & MotorImpairment
Objective assessment of the disease and gait in particular is an important applicationof data driven methods [Kluc 13]. The two most widely used standardized scales ofUPDRS [Goet 08] and H&Y [Hoeh 67] have mostly been used for disease assessment.In data analysis, this can be done by partitioning the scales to different classes,e.g. early, mild and advanced stages of the disease, and perform a classification ofthese classes. The majority of works in the literature adopted this approach [Kluc 13,Wahi 15, Cara 18, Abdu 18].
Data driven methods have been applied to assess PD based on pathologicalspeech [Pola 19, Haq 18], tremor [Haji 16] and gait [Kluc 13, Pitt 18]. Table 41 presentsan overview of the works that applied gait analysis in their assessments and reportsan overall classification accuracy for distinguishing healthy subjects and PD patientsin all classes.
The works are remarkably diverse, in terms of sensors used for gait measurement,features extracted from sensor data and data driven methods used for the analysis.The findings strongly suggest the viability of these approaches [El M19, Zhao 18,Vasq 18, Cara 18, Wahi 15].
Due to varied study designs, a fair comparison of the methods is not possible;a crude comparison suggests that DNNs surpass other methods in this applicati-on [Cara 18, El M19, Zhao 18]. Despite state-of-the-art results brought by DNNs,these methods have a huge parameter space. Learning large number of parameters ispossible only when large data sets with relevant labels are available.
4.4 Related Applications of Mobile Gait Analysis4.4.1 Gait ProcessingGait processing prepares gait data recorded by sensors for gait analysis. Besides thestride segmentation and gait event detection presented in section 4.1, data drivenmethods have been mostly applied for spatio-temporal features calculation.
Spatio-temporal Feature Calculation
In clinical workups, physicians are not interested in interpreting acceleration andgyroscope signals for a given stride, but instead want to obtain biomechanical featuressuch as stride length, time and velocity [Schl 17, Hann 16]. Hence, one of the mostcrucial components of gait analysis systems is the accurate estimation of the stride-by-stride spatio-temporal features [Schl 17, Ramp15, Hann 16].
In practice, the raw signal recorded by IMUs is not immediately ready for com-puting spatial and temporal features [Ramp15, Bart 17, Hann 19]. Some importantsteps of pre-processing are required [Hann 19]. The source of the problem is the driftin signals [Hann 19]. This drift corrupts the result of the feature calculation usingdouble integration [Hann 19, Saba 15]. The velocity and sensor position are obtained

32 Chapter 4. Literature Review
Tab
le41
:Objective
assessmentof
PD
severity
andmotor
impairmen
tby
classificationof
healthysubjects
andpatien
tswithdiffe
rent
levels
ofdiseaseseverity
ormotor
impairment
Subjects
Sen
sors
Features
Method
Overall
Classification
Accuracy
PD
Patient
Con
trol
Klucken
etal.[Kluc1
3]42
39IM
UGeneric
and
spatio-tem
poralfeatures
SVM
81%
Wah
idet
al.[Wah
i15]
2326
Pressure-sensitive
mats(G
aitR
ite)
Spatio-tem
poralfeatures
Ran
dom
Forest
93%
Caram
iaet
al.[Cara18]
2727
IMU
Generic
and
spatio-tem
poralfeatures
SVM
96%
Vasqu
ez-C
orre
etal.[Vasq18]
4439
Multimod
almeasurementof
speech
andgaitusingIM
Us
DNN
features
CNN
98%
Reyes
etal.[Reye1
9]88
94MSKinect
DNN
features
Com
binedLS
TM
andCNN
83%
Zhao
etal.[Zh
ao18]
9373
Groun
dreaction
force
DNN
features
Com
binedLS
TM
andCNN
99%
Maachie
tal.[ElM
19]
9373
Groun
dreaction
force
DNN
feature
1D-C
NN
99%
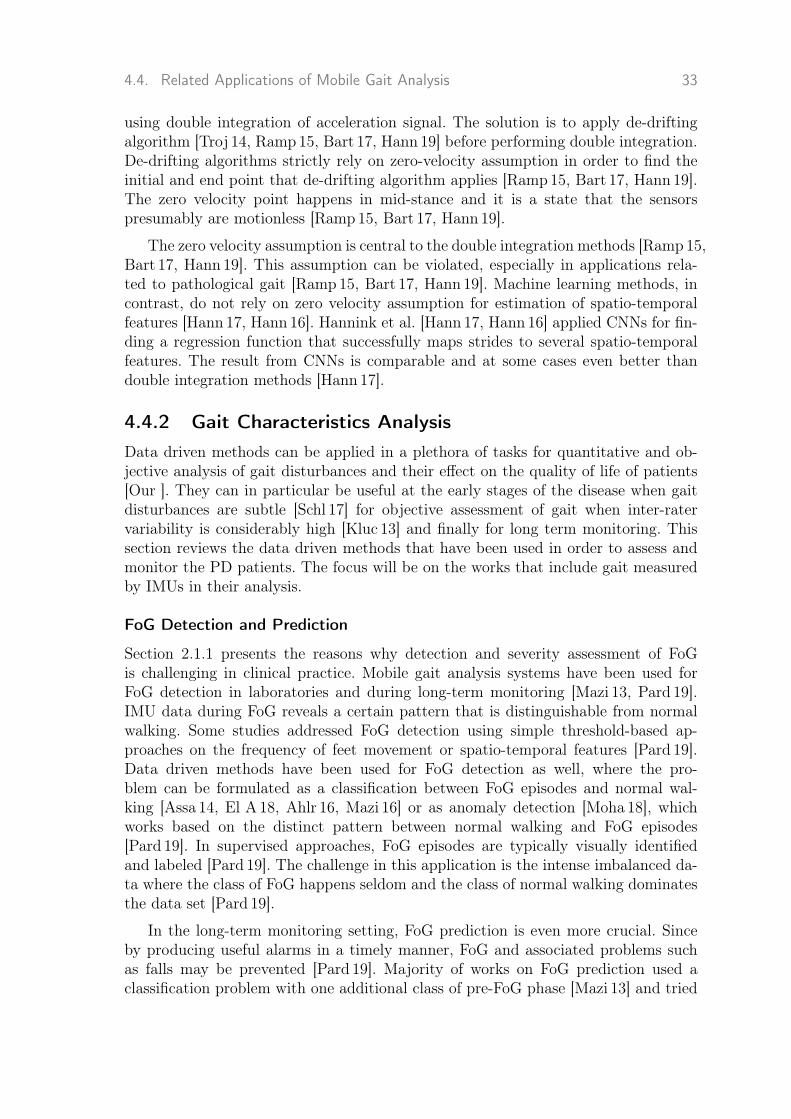
4.4. Related Applications of Mobile Gait Analysis 33
using double integration of acceleration signal. The solution is to apply de-driftingalgorithm [Troj 14, Ramp15, Bart 17, Hann 19] before performing double integration.De-drifting algorithms strictly rely on zero-velocity assumption in order to find theinitial and end point that de-drifting algorithm applies [Ramp 15, Bart 17, Hann 19].The zero velocity point happens in mid-stance and it is a state that the sensorspresumably are motionless [Ramp15, Bart 17, Hann 19].
The zero velocity assumption is central to the double integration methods [Ramp15,Bart 17, Hann 19]. This assumption can be violated, especially in applications rela-ted to pathological gait [Ramp 15, Bart 17, Hann 19]. Machine learning methods, incontrast, do not rely on zero velocity assumption for estimation of spatio-temporalfeatures [Hann 17, Hann 16]. Hannink et al. [Hann 17, Hann 16] applied CNNs for fin-ding a regression function that successfully maps strides to several spatio-temporalfeatures. The result from CNNs is comparable and at some cases even better thandouble integration methods [Hann 17].
4.4.2 Gait Characteristics AnalysisData driven methods can be applied in a plethora of tasks for quantitative and ob-jective analysis of gait disturbances and their effect on the quality of life of patients[Our ]. They can in particular be useful at the early stages of the disease when gaitdisturbances are subtle [Schl 17] for objective assessment of gait when inter-ratervariability is considerably high [Kluc 13] and finally for long term monitoring. Thissection reviews the data driven methods that have been used in order to assess andmonitor the PD patients. The focus will be on the works that include gait measuredby IMUs in their analysis.
FoG Detection and Prediction
Section 2.1.1 presents the reasons why detection and severity assessment of FoGis challenging in clinical practice. Mobile gait analysis systems have been used forFoG detection in laboratories and during long-term monitoring [Mazi 13, Pard 19].IMU data during FoG reveals a certain pattern that is distinguishable from normalwalking. Some studies addressed FoG detection using simple threshold-based ap-proaches on the frequency of feet movement or spatio-temporal features [Pard 19].Data driven methods have been used for FoG detection as well, where the pro-blem can be formulated as a classification between FoG episodes and normal wal-king [Assa 14, El A 18, Ahlr 16, Mazi 16] or as anomaly detection [Moha 18], whichworks based on the distinct pattern between normal walking and FoG episodes[Pard 19]. In supervised approaches, FoG episodes are typically visually identifiedand labeled [Pard 19]. The challenge in this application is the intense imbalanced da-ta where the class of FoG happens seldom and the class of normal walking dominatesthe data set [Pard 19].
In the long-term monitoring setting, FoG prediction is even more crucial. Sinceby producing useful alarms in a timely manner, FoG and associated problems suchas falls may be prevented [Pard 19]. Majority of works on FoG prediction used aclassification problem with one additional class of pre-FoG phase [Mazi 13] and tried

34 Chapter 4. Literature Review
to capture the subtle changes before the occurrence of FoG [Mazi 13]. Pre-FoG phaseis very short and difficult to be identified visually, which imposes challenges on datalabeling [Pard 19].
Several studies tried to detect and predict FoG by personalized methods, in whichthe trained models are adjusted to represent the gait characteristics of a specific sub-ject [Assa 14, Mazi 16]. FoG prediction in real-time is challenging since the transitionbetween normal walking and FoG is short and abnormality is subtle [Mazi 16]. Thestudies are mainly preliminary and there is more investigation needed to address thisproblem with an acceptable precision [Mazi 13, Zia 16].
Other Applications
Other areas of Parkinson’s studies have profited from deploying data driven methods,although covered on a smaller scale than the previous applications. Some of theseworks are as follows: classification of different tremor types [Pan 12], distinguishingPD with other diseases with overlapping symptoms [Haji 16, De V19], detection ofbradykinesia [Esko 16, Dane 17], automatic scoring of motor state in PD [Ilia 17],identifying motor fluctuations between ON and OFF states [Hssa 18], assessment ofanti-Parkinsonian medication [Hssa 18] and automatic tremor detection [Zhan 18].
4.5 Open Research QuestionsThis thesis addresses several open questions regarding the successful integration ofdata driven methods into the mobile gait analysis systems:
Section 4.1 presents a variety of methods that have been implemented success-fully for a robust stride segmentation. However, not all of these studies focused onPD patients with their specific pathological gait [Pfau 08, Pana 13, Khan 14, Mart 17].The systems used varied in terms of applied sensors and sensor placement [Mart 17,Pana 13]. Their study populations differed in terms of size and characteristics [Mart 17,Pana 13]. Moreover, studies reported different metrics to evaluate segmentation me-thods [Mart 17, Pana 13]. Due to the reasons mentioned above, a fair comparison ofthe gait segmentation methods is currently impossible. This work evaluates segmen-tation methods in two different scenarios in PD assessment and provides insight intoeach scenario (Chapter 5).
In turning analysis, sensor placement plays a crucial role [Sala 09, Mari 13, El G 14].Many turning studies place the sensors on the upper extremity [Mari 13, El G 14,Manc 18a]. One advantage is that turning is readily detectable in sensor signals[Sala 09]. However, gait disturbances such as FoG cannot be readily detected fromsensors on the upper extremity [Sala 09]. Such systems still need additional sensorson the lower extremity in order to fully quantify and assess turning [Sala 09, El G 14].It was shown that sensors on the lower extremity provide higher biomechanical re-solution [Pane 18]. Moreover, for long-term monitoring, sensors integrated into shoesare less obtrusive and stigmatizing. This thesis presents a new definition for turningrecorded by on-shoe IMUs and provides an assessment of pathological gait duringturning (Chapter 6).

4.5. Open Research Questions 35
Various data driven methods have been proposed and validated for the assessmentof motor state and disease severity in PD (Sec. 4.3). This problem can be formulatedas a classification problem [Kluc 13, Pitt 18]. Several studies tried to address thatusing different feature inputs and classification methods. However, a reliable and in-terpretable PD assessment is still far from resolved. This thesis pursues to objectivelyclassify motor impairment in PD using Gaussian processes [Will 06], a probabilisticmachine learning method. The output of GPs is a pair of classification output andan uncertainty measure indicating the model confidence for the corresponding classi-fication output [Will 06] (Chapter 7).


5Segmentation of GaitSequences
37

38 Chapter 5. Segmentation of Gait Sequences
This chapter is a close adaptation of paper [Haji 18]. The author of this thesis mainlyproposed the research question, designed the experiments, implemented the methods,analyzed the results presented in this chapter. The gait data used in this chapterwas recorded with close cooperation by the Molecular Neurology Department at theUniversity Hospital Erlangen, Germany, with the purpose of being used in PD studies[Bart 17]. This chapter was published in the Sensors journal as a paper [Haji 18], whichwas written by the author of this thesis as the main author.
5.1 OverviewOne of the most important applications of moile gait analysis is the segmentationof gait to strides, since individual strides form the basis for the assessment of gaitand related pathologies [Mari 13, Schl 17]. Gait segmentation is the first step in thepipeline of gait processing. Any error in this step propagates to the next steps of thepipeline. Hence, it is crucial to adopt an appropriate segmentation method for thetask at hand.
Diverse methods have been deployed for gait segmentation. However, these me-thods were applied on different data sets and were evaluated based on different me-trics, which makes a fair comparison difficult. Hence, the goal of this chapter is tocontribute a comprehensive comparison of four prevalent gait segmentation methodsfor PD, which are peak detection, two variants of DTW methods namely Euclide-an DTW (eDTW) and probabilistic DTW (pDTW) and hHHM [Sala 04, Mann 11,Bart 15, Bart 17]. This chapter examined two experiments with different level of com-plexity representing a wide range of gait studies in PD [El G 14, Kluc 13, Bart 17,Mari 13].This chapter analyzes the advantages and disadvantages of each method formobile gait analysis in PD through these two experiments. In particular, the compa-rison of methods reveals which method works the best under each scenario and canbe applied in similar cases.
5.2 MethodsFour methods are applied in this chapter including hHMM, eDTW, pDTW and peakdetection to the problem of gait segmentation from foot-worn IMUs (Sec. 2.2.2). Peakdetection, msDTW and hHMM are widely used for gait segmentation. pDTW hasbeen used in other applications such as gesture recognition [Baut 13]. To the best ofthe author’s knowledge, pDTW has not been applied to gait segmentation before. Itis worth mentioning that while the implementation procedures presented here can bereplicated for similar cases, the examined range of parameters that will be presentedin this section highly depends on the data set at hand.
5.2.1 Study PopulationTen patients diagnosed with idiopathic PD (63 ± 9.3 years old, 5 males) with UPDRSmotor score of 12.7 ± 6.0 and H&Y score of 1.7 ± 0.9 were included in the firstexperiment. For this experiment, patients walked four times 10 m at a self-selectedspeed. Between each 10 m walk, there was a 180◦ turn which was excluded from the

5.2. Methods 39
data using videos, hence, the final data included only a sequence of straight walkstrides. For this experiment, the total number of strides for all patients was 496.
For the second experiment, the population consisted of 34 patients with idiopathicPD (63 ± 11 years old, 24 males). Subjects were in early to moderate stages of thedisease with UPDRS motor score of 18.8 ± 8.9 and H&Y score of 2.2 ± 0.6. Thetotal number of strides for this experiment was 458. Each patient performed a TimedUp and Go Test (TUG) test at a self-selected speed. The TUG test is a commonlyused clinical test to evaluate balance and mobility. The patient stands up from achair, walks for 3 meters, performs 180◦ turns, walks back for 3 meters and finallysits again [Pods 91]. The test includes straight walking and turning. In PD, turning ismore impaired than straight walk [Cren 07a]. Hence, data from this experiment hasa higher intra-patient gait variability and results in a more heterogeneous set of stri-des than the first experiment. Transitions between sit-to-stand and stand-to-sit makestride segmentation challenging, because the methods need to distinguish transitionmovements from stride movements. All patients were capable of finishing the TUGtest without episodes of freezing or dyskinesia. For both experiments, written infor-med consent was obtained from all participants (IRB-approval-No. 4208, 21.04.2010,IRB, Medical Faculty, Friedrich-Alexander University Erlangen-Nürnberg, Germany),which follows the declaration of Helsinki 1975, as revised in 2000.
Figure 51: Labeling of an example of gyroscope signal including two strides, the followi-ng transition (non-stride) movement and rest. The figure is reused from [Haji 18] with thepublisher’s permission.
5.2.2 Manual Data LabelingThe strides were labeled using simultaneous analysis of video and sensor data. The vi-deo and sensors were synchronized using a synchronization movement based on liftingone foot three times. The start and end point of each stride were labeled manual-ly using acquired information of gyroscope and the stride definition from [Bart 15,Bart 17]. Angular velocity in the sagittal plane (GZ) was used. The negative peaks inGZ represent the change in foot rotation during one stride and were used to definethe start and end of the strides. The strides start was set to the negative peak beforethe swing phase and stride end to the negative peak at the end of the stance phase(Fig. 51). The end of one stride coincides with the start of the following stride forconsecutive strides.
For the TUG segmentation, in addition to strides, rests and transitions were la-beled. The rest phase refers to the part that the patient stands still and transition is

40 Chapter 5. Segmentation of Gait Sequences
any movement other than stride movements as defined by [Mart 17]. Figure 51 showsan example of the way the gait sequence was labeled. The labeling was performed bya person familiar with gait data.
5.2.3 Training & EvaluationThis section provides an overview of the choices made regarding the structure ofmethods and optimization of their parameters.
hHMM
The fundamental of hHHMs is presented in section 3.1.1. A two-level hHMM wasconsidered for gait segmentation for both experiments. In the first experiment, therewas only one state to capture strides, while in the second experiment, there werethree states of stride, rest, and transition. The second level of hHMM included left-to-right HMMs, which could include multiple sub-states in turn. The optimal numberof sub-states were determined during the model training. It was expected that thenumber of required sub-states grows as the pattern becomes more complicated. Inthe first level learning was done in a supervised manner using labels of stride borders,while in the second level an unsupervised approach was applied. The advantage ofsemi-supervised learning is that there is no need to provide labels for the second level,but learning is done based on the underlying data.
The input to the hHMMwas a set of features extracted from the raw data using thesliding window approach. In this approach, the data were segmented into overlappingtime frames. The windowing was done using Hann window instead of rectangularwindow to reduce the effect of windowing on the edges. From each window a setof features was extracted, including the raw data itself, mean, variance, energy andthree coefficient of the second-order polynomial fit [Mart 17]. The final feature setwas constructed by concatenating the features from all IMU axes. The feature setwas then normalized. The sliding window size was chosen so that the features bestrepresent the underlying data [Pana 13, Mart 17]. To get the most relevant featuresand reduce the data dimensionality Principal Component Analysis (PCA) was used.
For optimizing the number of principal components that were fed to the hHMM,as well as parameters that controlled the structure of the hHMM such as the num-ber of sub-states and number of components per GMM a grid search was used. Ta-ble 51 shows the values for these parameters, which were chosen partially based onliterature [Mart 17, Pana 13] and partially determined during the model training.hHMM model parameters included transition matrices, initial state probabilities aswell as GMM parameters, including means, diagonal covariance matrices and weightsof GMM components. The first level transition matrix and GMM parameters we-re initialized based on the statistics of the strides, transitions and rests. Transitionmatrices for second-level HMMs were initialized uniformly, meaning that initially allstates were equally probable. For optimizing the model parameters, the BW algo-rithm was performed at most for 20 iterations. For inference and gait segmentationthe Viterbi algorithm [Vite 67] was used.

5.2. Methods 41
For feature extraction and dimensionality reduction using PCA, MATLAB 2015awas used. For learning and inference of the hHMM the Java Speech Toolkit (JSTK)was used [Stei 11] since this toolbox allows for semi-supervised learning and inference.
Table 51: Grid search for hHMM parameter optimization. The table is reused from [Haji 18]with the publisher’s permission.
Sliding Window length [s] (steps of 0.20) 0.10-0.70
Number of sub-states for stride | transition | rest (steps of 2) 4-12 | 2-4 | 1
Number of GMM components (steps of 2) 8-12
Number of principal components (steps of 2) 1-15
Euclidean DTW
The fundemental of DTW is introduced in section 3.2. The input to the DTW wasraw data [Bart 15, Bart 17, Mart 17]. For template generation, a template of the size200 samples (N = 200) was chosen, since the template must have a proper length tocapture subtle variations in strides [Bart 15, Bart 17, Mart 17]. Manually segmentedstrides were linearly interpolated to the size of 200 samples and the average of a samplevector at a certain point n among all strides was computed. The template axes werethen normalized to the range of sensors (±6 g for accelerometer and ±500 ◦/s forgyroscope axes).
Figure 52 shows the axes of the template for eDTW. The axes AZ, GX and GYare nearly constant signals and do not convey information. Hence, three axes of AZ,GX and GY were omitted from computations. The combination of axes and thres-holds used for template matching is shown in Table 52. As mentioned in Section 3.2,thresholds in the DTW algorithm are used to determine the end of the strides, whichis, in turn, based on the distance between the template and part of the gait sequence.Using multiple axes instead of one axis increased the distance; therefore, the thres-hold was increased accordingly (Tab. 52). Also, the time of overlap of a given warpingpath must be less than 200 ms for the stride to be segmented [Bart 15, Bart 17]. Ina post-processing step, time constraints were applied to the output of the algorithm.A stride must be longer than 600 ms and shorter than 2500 ms [Bart 15, Bart 17].These time constraints were inferred based on the biomechanics of human gait andwere equally applied for pDTW and hHHM algorithms. The template generation wasimplemented in MATLAB 2015a. For the eDTW algorithm, the implementation usedwas part of a software toolbox (App. A) [Hann 19], which is implemented in Matlab.

42 Chapter 5. Segmentation of Gait Sequences
Length [samples]0 40 80 120 160 200
Acce
lera
tio
n [
no
rm]
-1
-0.5
0
0.5
1
AX AY AZ
Length [samples]0 40 80 120 160 200
An
gu
lar
Ve
locity [
no
rm]
-1
-0.5
0
0.5
1
GX GY GZ
Figure 52: Stride template based on average of Left: 3 dimensional accelerometer signal,Right: 3 dimensional gyroscope signal. Axes AX, GX and GY have a low variation. Thefigure is reused from [Haji 18] with the publisher’s permission.
Table 52: Grid search for eDTW parameter optimization. The table is reused from [Haji 18]with the publisher’s permission.
Axes combination GZ AXGZ AYGZ AXAYGZ
Threshold (steps of 5) 10-25 20-30 20-30 25-40
Probabilistic DTW
The input to pDTW is raw data and the same constraints as used in eDTW wereapplied here as well. Template generation and computing distance between the gaitsequence and template were explained in Section 3.2.
The output of a probability density function is between 0 and 1 for univariateand multivariate data. Hence, the distance function output is the same for single-axis (univariate) or multi-axes (multivariate) data. Accordingly, the threshold stayedthe same for any combination of axes. Due to the difference between Euclidean andprobabilistic cost functions, the range of thresholds for eDTW and pDTW algorithmsare different. Table 53 shows the combination of the axes and thresholds. Again,template generation was implemented in MATLAB 2015a. For the pDTW algorithm,the implementation used was part of a software toolbox (App. A) [Hann 19], whichis implemented in Matlab.
Table 53: Grid search for pDTW parameter optimization. The table is reused from [Haji 18]with the publisher’s permission.
Axes combination GZ AXGZ AYGZ AXAYGZ
Threshold (steps of 1) 8-15 8-15 8-15 8-15
Peak Detection
Identifying peaks in a given data sequence is important, as they often indicate signi-ficant events in the signal. Formulation of a peak detection method depends on thespecific signal characteristics. But usually two basic requirements must be fulfilled toidentify a data point as a peak. First, the signal magnitude should be higher than a

5.2. Methods 43
certain threshold, which can be set based on the signal characteristics. Second, theminimum time between two consecutive peaks must be greater than a certain thres-hold to avoid finding two or more peaks in one stride. Other requirements can beapplied as well, e.g. the first and second derivatives of the signal may meet certaincriteria. Performing these straightforward steps, the stride can be segmented usingthe identified peaks.
For peak detection the gyroscope signal Z-axis (GZ) was used [Mari 13, Bart 15,Bart 17]. Peaks in the GZ signal corresponded to the middle of swing phase in thestrides. For this method, only one point in the stride and no stride borders wererecognized. There were two conditions in order to detect a peak. Firstly, angularvelocity had to be higher than 150 ◦/s [Mari 13, Bart 15, Bart 17]. Moreover, thetemporal distance between two peaks had to be longer than 600 ms, which wasconsidered the lower bound for the stride time according to the biomechanics of gait[Bart 17]. This time constraint was applied equally for all methods. In the case ofdetecting multiple peaks in this region, only the highest amplitude was selected. Forimplementation, the peak detection function in MATLAB 2015a was used.
Performance Evaluation
The goal in segmentation was two-fold: 1) to minimize the number of missed stri-des, 2) to minimize signal parts which are wrongly detected as strides. True positives(TP) are strides segmented by the method and labeled as strides in the ground truth.False negatives (FN) are the strides that were not recognized by the segmentationalgorithms. If there is no ground truth stride and a method segments a stride, forexample, at rest or transition time then a false positive (FP) occurs. Based on thementioned parameters three metrics were computed. Precision considers false posi-tives and would be equal to one only if all the recognized strides were labeled inthe ground truth. Recall considers the false negatives and would be equal to one ifno stride was missed. F-score, which takes into account missing strides and wronglydetected strides equally, is the primary metric for comparison of methods and gridsearch optimization has been performed based on that.
Precision =ΣTP
ΣTP + ΣFP(5.1)
Recall =ΣTP
ΣTP + ΣFN(5.2)
F-score = 2× Precision× Recall
Precision + Recall(5.3)
For all methods the segmented strides were compared with the ground truth strideborders and were marked as correctly segmented if the start and end borders werewithin ±100 ms of the ground truth borders, which is approximately 10% of stridetime [Mann 12, Pfau 08, Bart 15, Bart 17].
The first experiment was performed in a leave-one-subject-out cross validationscheme. Data from both feet of one patient were left out on each iteration and the

44 Chapter 5. Segmentation of Gait Sequences
rest of the data was used as a training set. Parameter tuning as well as templategeneration were performed based on the training set. In the case of the second expe-riment, a 4-fold outer cross-validation was applied for the evaluation of methods. Forvalidation and parameter estimation an internal 4-fold cross-validation was used. Thecross-validation was performed such that no patient used for training and validationappeared in the test set. To remove any possible bias, the data was randomized forchoosing the test and validation sets. The randomization was equally applied for allmethods.
To identify significant differences between methods, statistical tests were perfor-med. Wilcoxon test was used as a non-parametric statistical test for pair-wise com-parison of the result because of the small number of samples and possibility of havingnon-normal distributions.
5.3 ResultsIn the case of the first experiment, three of the methods of choice hHMM, eDTW andpeak detection could detect all strides with a F-score of 100%. Probabilistic DTWyielded a slightly worse result with the F-score of 99.8 ± 0.4 %.
Regrading the second experiment, table 54 lists average statistics across test foldsfor each method’s best set of parameters. Methods were evaluated based on theirF-scores.
Table 54: Results of the second experiment in terms of precision, recall and F-score. Thetable is reused from [Haji 18] with the publisher’s permission.
Method Precision [%] Recall [%] F-score [%]
hHMM 98.5 ± 0.4 93.5 ± 1.9 95.9 ± 0.9
eDTW 94 ± 1.2 93.5 ± 0.8 93.8 ± 0.5
Peak Detection 87.4 ± 1.2 95.9 ± 1.8 91.5 ± 0.4
pDTW 91.8 ± 2.1 90.1 ± 2.2 90.9 ± 1.4
Figure 53 shows the result of the pair-wise tests. In the case of precision, alltests showed a significant difference (p<0.05) except for the comparison of eDTWto pDTW (p=0.20). The result showed a higher variance for the recall metric. Themethods showed no significant difference (p>0.05) in the case of recall excluding forthe test between peak detection and pDTW (p<0.05). For the F-scores, the variancefor all methods decreased, which was accounted for the significant difference in mostof the tests (p<0.05) except for the test between peak detection and pDTW (p=0.88).

5.4. Discussion 45
* * **
*
Precision
hHM
M
eDTW
Peak Det
ectio
n
pDTW
0
20
40
60
80
100*
Recall
hHM
M
eDTW
Peak Det
ectio
n
pDTW
0
20
40
60
80
100* *
**
*F-score
hHM
M
eDTW
Peak Det
ectio
n
pDTW
0
20
40
60
80
100
Figure 53: Mean ± STD of precision, recall and F-score for four methods. Asterisks re-present 5% significant difference between methods corresponding to 95% confidence interval.The figure is reused from [Haji 18] with the publisher’s permission.
5.4 DiscussionOne main approach to quantitative assessment of gait in PD is to analyze spatio-temporal features extracted from individual strides [Ramp 15, Bart 17, Hann 17, Hann 19],which emphasizes the importance of robust stride segmentation. This chapter compa-red four prominent segmentation methods with the focus on the pathological gait ofPD patients. To cover a wide range of gait studies in PD [El G 14, Kluc 13, Bart 17],gait segmentation methods were assessed under two scenarios with different levelsof complexity. In the first scenario, a data set including only straight walking wasconsidered. The second scenario focused on a more challenging data set includingstride and non-stride movements, as well as turnings. Intra-patient gait variabilityincreased as turning strides were combined with strides from straight walking.
The result from the first scenario showed the methods perform similarly well, with100% accuracy. This result suggested that when there is only a sequence of strideswith low variability derived from a very rigid supervised test assessment paradigm,all methods perform similarly. In contrast, in the second scenario, the performanceof all methods diminished considerably. The methods also demonstrated differentperformances (Tab. 54). hHMM significantly outperformed the other methods withan accuracy of 96% and a low standard deviation, which is a promising result for gaitanalysis applications. eDTW yielded 94% F-score while peak detection and pDTWobtained only 91% and 90% F-score, respectively.
Different studies were conducted to monitor and analyze gait fluctuations in PDduring a day [Zamp11, Sait 04]. The most important aspect of a gait segmentationmethod for long-term monitoring lies in its ability to deal with gait variability ina non-supervised and non-standardized test setting with high accuracy. The experi-ments demonstrate how the methods can deal with variability on a smaller scale thanin long-term monitoring.
The results revealed that for dealing with inter- and intra-patient gait variability,hHMM methods surpassed the other methods. hHMM achieved a high precision ofnearly 99%, meaning a low rate of false positives. The probabilistic representationof the data was effective in distinguishing between stride and non-stride movements

46 Chapter 5. Segmentation of Gait Sequences
and there were only a few cases in which non-stride movements were segmented asstrides.
eDTW significantly surpassed pDTW by 4% in terms of the F-score. The tem-plates in eDTW were generated simply by computing the average of strides, whilein pDTW a series of probability distributions modeled the template. It was specu-lated that a probabilistic template would result in a more flexible template than anaverage based template. However, in practice, eDTW proved more effective in gaitsegmentation. The pDTW is a probabilistic template matching method and does notutilize the fully probabilistic representation of data the same way as HMMs.
Peak detection yielded the best recall of 95% among all methods in the secondexperiment. From a methodological point of view, peak detection is a very simplemethod in which, unlike hHHM and DTW methods, there is no need for parameterlearning. In particular, peak detection is a suitable method of choice for small-sizedata sets, where enough data is not available for parameter tuning. However, thelow precision rate in the second experiment suggests that the applicability of thismethod is limited in the case of more complicated data sets since it produces manyfalse positives.
Although the F-score was the main metric for performance evaluation, in clinicalapplications of gait analysis, a low false positive rate is more critical than a low falsenegative rate. Because clinical gait analysis, which follows gait segmentation, is basedon statistics of spatio-temporal features extracted from strides. Parameters extractedfrom false positive strides may destroy the underlying statistics. Hence, in PD studiesthe precision is more critical than the recall. Precision versus recall tendencies varyamong methods. DTW methods showed a balance between precision and recall, whilehHMM yielded a high precision and peak detection a high recall. Precision in hHMMis significantly higher than all other methods.
The main limitation of the methods stemmed from their low recall rate. Stati-stical analysis showed no significant difference between recall rates, except for thecomparison between pDTW and peak detection. The methods segmented all stridescorrectly in a homogeneous sequence as shown by the first experiment. However, ina heterogeneous setting, as shown by the second experiment, all methods tendedto miss strides that deviate from normal strides in form and length. In such cases,hHMM might fail to generalize to these strides and the template in DTW methodsmight not be able to match such strides. One solution for that is to have a lar-ge enough number of such atypical strides in the data set. Although, this chapterused one of the largest data sets for the gait segmentation problem in the litera-ture [Mann 11, Bart 15, Bart 17, Mart 17], an even larger population may mitigatevariable strides. It is a general rule in any application that a large population canlead to a better representation of data in HMM and in the same manner more generictemplates for DTW methods.
The inter-patient gait variability may be more effectively addressed using indivi-dualized models, in such a way that models better reflect the specific gait charactri-stics of each individual patient. In particular, as PD progresses, the motor impair-ment increases, which results in a more significant deviation of pathological gait from

5.5. Chapter Summary 47
normal gait. An atypical gait pattern that largely deviates from the average of thepopulation results in an inferior performance of the methods. In such extreme casesindividualization can be helpful. hHMM provides the theoretical foundation to ad-apt models to individual patients [Legg 95]. For DTW methods, it is also possible toconstruct templates based on an individual patient. An individualized template maymap the patient’s strides better than a generic template.
5.5 Chapter SummaryThe sensor-based gait segmentation is an important building block in the process ofgait analysis. This chapter compared four segmentation methods, three most widelyused methods in the literature and a novel method introduced for this application.The experiments showed that the accuracy of segmentation methods depends on thestride variability in data sets. The variability can stem from the pathological gaitof PD patients, specific gait patterns and the difference between straight walkingand turning movements. In the case of a homogeneous data, even a simple methodsuch as peak detection proved useful, while, in the case of the heterogeneous dataset, probabilistic hHMM significantly outperformed the other methods. The resultsof the current study can be applied to any PD study inside the clinic and provideuseful insights for long-term monitoring outside the clinic.
Lastly, gait analysis can also provide valuable clinical information for other neuro-logical disorders that affect gaits such as hereditary spastic paraplegia (HSP) [Mart 17]or multiple sclerosis. Gait disturbances vary among these diseases, hence, segmenta-tion methods should be adapted to specific gait patterns of each disease.
5.6 Chapter HighlightsIn summary, the main highlights of this chapter are:
1. Implementation of three gait segmentation methods of peak detection,Euclidean DTW and hHHM from literature and introducing a novel me-thod of probabilistic DTW.
2. Evaluation of these method on two different data sets of PD cohort withdifferent levels of heterogeneity.
3. Presentation of a detailed comparison between these methods to identifythe best segmentation method for each data set.

6Turning Analysis inParkinson’s Disease
49

50 Chapter 6. Turning Analysis in Parkinson’s Disease
This chapter is a close adaptation of paper [Haji 19]. The author of this thesis mainlyproposed the research question, designed the experiments, implemented the methods,analyzed the results presented in this chapter. The gait data used in this chapter wasrecorded at the University Hospital Erlangen for the purpose of Parkinson’s studies[Bart 17]. This chapter was published in the Sensors journal as a paper [Haji 19],which was written by the author of this thesis as the main author.
6.1 OverviewThe focus of this chapter is on the analysis of PD patients. Figure 61 visualizes theprocessing pipeline for turning analysis.
Motor Impairment Classification Motor Impairment Classification Motor Impairment Classification
Gait Characteristics Analysis
Gait Processing
Gait Measurement
Spatio-‐temporal Feat. Extraction
Turning Isolation
Gait Data Pre-‐processing
Stride Segmentation
Statistical Analysis
Figure 61: The pipeline of the turning analysis used in this chapter. The first step aftermeasuring gait is to segment it to the individual strides covered in chapter 5. Turning iso-lation is performed in the next step to divide the gait sequence to straight walking bouts andturning episodes. Spatio-temporal features are extracted from turning episodes of gait. Thefinal step is analyzing these features statistically.
Chapter 2.1 presents the characteristics of a Parkinsonian gait. It is discussedthat for a person with impaired mobility caused by PD, turning is challenging andpotentially risky [Pick 07, Stac 04] even more than straight walking [Stac 08, Cren 07b].There have been attempts to identify and characterize turning abnormalities usingmobile gait systems. This chapter investigates if mobile gait systems using on-shoeIMU sensors (Sec. 2.2.2) can identify turning deficits in standardized clinical tests.
In order to isolate turning from gait, this thesis uses the statistics of spatio-temporal features. This chapter aims to show the applicability of the system in anobjective analysis of turning as well as to evaluate if it confirms the findings of otherstudies. To this thesis first introduces the novel turning isolation algorithm targetingdata from a standardized 4 × 10 m gait test measured with wearable sensors placedon the shoe. The turnings are quantified through several spatio-temporal featuresthat proved to be effective in detecting pathological gait [Ramp15, Bart 17, Schl 17,Gass 19]. Through the statistical analysis, the turning abnormalities are evaluated ina large PD cohort.

6.2. Methods 51
Turning Angle
PathLength
Stride Length
10m(a) (b)
Figure 62: Definition of turning angle, stride length, path length and swing width. Thefigure is reused from [Haji 19] with the publisher’s permission.
6.2 Methods6.2.1 Study PopulationIn this work, 108 PD patients are recruited during their regular visit to the movementdisorder outpatient center at the University Hospital Erlangen. Figure 62 shows thesensor placement on the shoe used for data recording and the definition of strideand path length. Sporadic PD was defined according to the guidelines of the GermanAssociation for Neurology (DGN), which are similar to the UK PD Society BrainBank criteria [Hugh 92b]. Patients had to be able to walk independently (H&Y < 4,UPDRS gait item < 3) [Goet 08, Hoeh 67]. All PD patients were clinically (UPDRS-III) and biomechanically (gait analysis) investigated in stable ON medication withoutclinically relevant motor fluctuations during the assessments. There was an exclusioncriterion for severe cognitive impairment. Controls were 42 age-matched subjectswhen recruited that had no signs of PD or other motor impairments. Concerning age,height and body-mass-index (BMI), PD and control cohorts were matched (Tab. 61).Data regarding laterality of the disease can be found in table 61, where the UPDRSsub-items of rigidity lower and upper extremity were reported. This data shows thatthe right and left side affected patients are nearly equally represented in the cohort.Written informed consent was obtained from all participants (Sec. 5.2.1).
Participants walked freely at a comfortable, self-chosen speed in an obstacle-freeand flat environment for 4 × 10 meter. After each 10-meter straight walking, parti-cipants were instructed to turn 180◦ in a defined direction.
6.2.2 Turning Isolation AlgorithmThe standardized 4 × 10 meter walking includes four straight gait bouts and threeturnings in between every two bouts for straight walking. The goal was to isola-te the three turnings from the whole gait sequence. To this end, the gait sequencewas segmented to individual strides semi-automatically using methods explained in
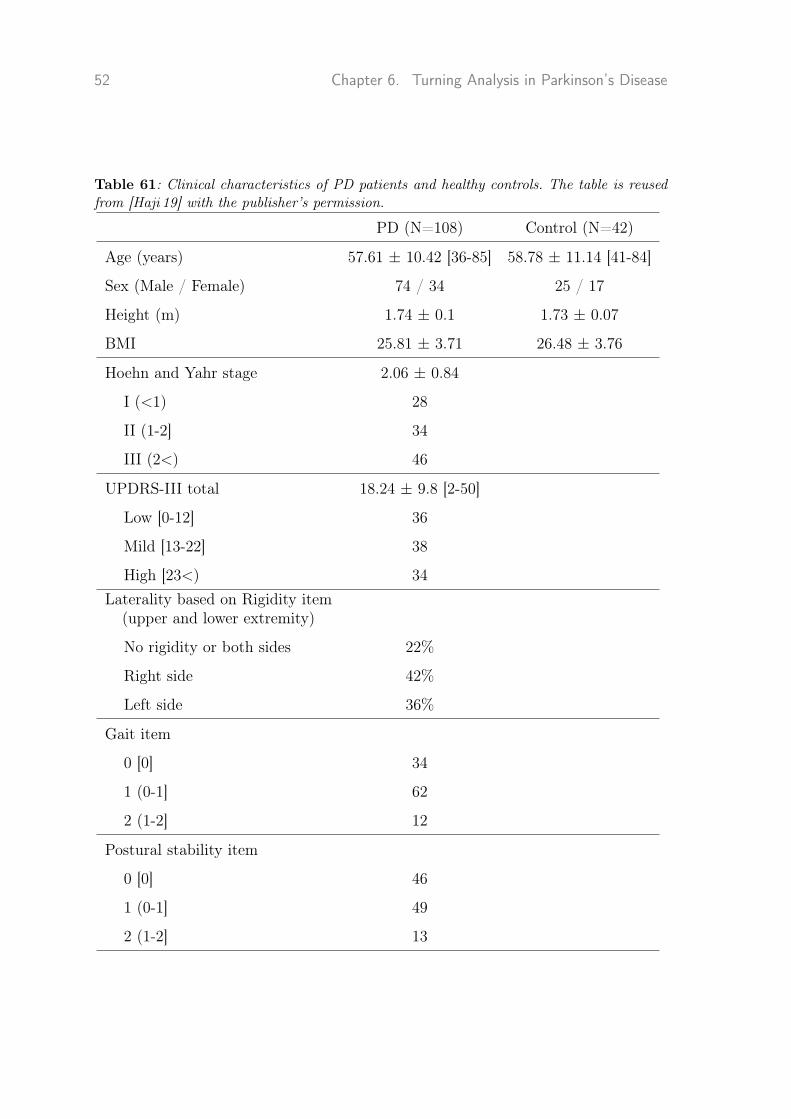
52 Chapter 6. Turning Analysis in Parkinson’s Disease
Table 61: Clinical characteristics of PD patients and healthy controls. The table is reusedfrom [Haji 19] with the publisher’s permission.
PD (N=108) Control (N=42)
Age (years) 57.61 ± 10.42 [36-85] 58.78 ± 11.14 [41-84]
Sex (Male / Female) 74 / 34 25 / 17
Height (m) 1.74 ± 0.1 1.73 ± 0.07
BMI 25.81 ± 3.71 26.48 ± 3.76
Hoehn and Yahr stage 2.06 ± 0.84
I (<1) 28
II (1-2] 34
III (2<) 46
UPDRS-III total 18.24 ± 9.8 [2-50]
Low [0-12] 36
Mild [13-22] 38
High [23<) 34Laterality based on Rigidity item
(upper and lower extremity)
No rigidity or both sides 22%
Right side 42%
Left side 36%
Gait item
0 [0] 34
1 (0-1] 62
2 (1-2] 12
Postural stability item
0 [0] 46
1 (0-1] 49
2 (1-2] 13

6.2. Methods 53
chapter 5. These strides are then categorized as straight walking, turning and tran-sition between straight walking and turning. In order to differentiate between thesecategories, statistics of spatio-temporal features are used.
The change of azimuth between two successive mid-stances (Fig. 62) was definedas the turning angle between consecutive strides. The absolute values of turning angleswere considered since the sign of values only showed the direction of the turnings,which is not relevant in the analysis. Like Mariani et al. [Mari 13], strides with turningangles larger than 20◦ were classified as turning.
In order to identify transition strides in a gait sequence [Mari 13] statistics of tur-ning angles were used, since this feature is the best indicator of spatial movementduring turning (Fig. 62). The turning strides with angles larger than 20◦ were elimi-nated from the sequence. A gamma distribution was then fitted to the tuning anglesfrom the rest of the strides. The reason for the choice of Gamma distribution is dueto the fact that the distribution is one-hand tailed, in a way that strides from straightwalking mainly centers on the mean. The highest 10% of the distribution was classi-fied as the transition if the strides are adjacent to the turning strides. The strides inthe highest 10% of the distribution were considered an anomaly in the distributionof straight strides. Finally, for turning analysis, only turning and transition strideswere considered.
6.2.3 Turning FeaturesAfter turning isolation, there were three sets of strides related to three turns inthe standardized test. Spatio-temporal features were extracted from these stridesbased on the algorithms in the previous works [Ramp15, Bart 17]. The algorithms forobtaining features from the wearable sensor-based system were validated previouslyusing a gold standard such as an optical motion capture system or instrumentedwalkway. To quantify turning, two sets of features were computed for each turning;per-stride features and global features per-turn.
For the first group, a set of features was extracted from each stride: stride time,path length (normalized on patient’s height), stride length (normalized on patient’sheight), stride velocity, and swing width. A stride likely has a curved trajectoryrather than a straight line during turning. Stride length is the movement in thestraight line between initial and final foot position in a stride. Furthermore, pathlength was introduced to measure curve length between the beginning and end of astride (Fig. 62). All these features were calculated from the mid-stance of a stride tothe successive mid-stance.
In the case of global features, features like the number of strides and total durationper-turn were calculated that specify the characteristics of the whole turn.
The author of this thesis implemented the pipeline of turning isolation and featureestimation in MATLAB R2015a. The feature extraction algorithms were mostly thesame as the implementation in the software toolbox (App. A). Tuning angle estima-tion was implemented by the second author of the paper [Haji 19] published basedon the current chapter.

54 Chapter 6. Turning Analysis in Parkinson’s Disease
6.2.4 Analysis of Turning in PDIn order to determine whether features can distinguish between different groups (con-trols and three stages of disease (Tab. 61), one-way analysis of variance (ANOVA)was applied. When a significant difference was found, a post-hoc analysis was per-formed using Bonferroni’s test to obtain a pairwise comparison between groups. Thesignificance level was set at p < 0.05. For measuring effect sizes, η2 defined as theratio of variability between groups to the total variation in the data was used. Cutoffvalues for small, medium and large effect sizes are set at 0.01, 0.06 and 0.14, respec-tively, according to Cohen [Cohe 13]. Statistical analysis and feature computationswere performed using MATLAB R2015a.
6.3 ResultsAs the disease progresses, gait impairment becomes more prevalent. This sectionexamines if spatio-temporal features that characterize turning can reflect gait im-pairments.
Figures 63 and 64 show spatio-temporal features that are characteristic of tur-ning for global and per-stride features. Clinical scores in PD studies determine theseverity of gait impairment and disease stages: the H&Y, UPDRS-III score and theUPDRS-III sub-items gait and postural instability. Patients in different stages ofdisease severity (Tab. 61) and controls were statistically compared using ANOVA,followed by Bonferroni’s post-hoc test.
H&Yc I II III
Nu
mb
er
of
Str
ide p
er
Tu
rn
4.5
5
5.5
6
6.5
7
7.5
8
8.5
*
**
**
UPDRSc L M H
4.5
5
5.5
6
6.5
7
7.5
8
8.5
*
*
**
**
GAITc 0 1 2
4.5
5
5.5
6
6.5
7
7.5
8
8.5
*
*
**
**
Postural Instabilityc 0 1 2
4.5
5
5.5
6
6.5
7
7.5
8
8.5
*
*
**
**
H&Yc I II III
Tu
rnin
g T
ime [
s]
5
5.5
6
6.5
7
7.5
8
8.5
9
9.5
**
**
UPDRSc L M H
5
5.5
6
6.5
7
7.5
8
8.5
9
9.5
*
**
**
GAITc 0 1 2
5
5.5
6
6.5
7
7.5
8
8.5
9
9.5
*
*
**
**
Postural Instabilityc 0 1 2
5
5.5
6
6.5
7
7.5
8
8.5
9
9.5
*
**
**
Figure 63: Global features characterizing turning, e.g. number of strides per-turn and tur-ning time were calculated for controls and PD patients. These features were grouped accordingto H&Y disease stage, UPDRS-III total score, the single items gait and postural instabilityof the UPDRS-III. Group data are displayed as mean ± SEM and compared using one-wayANOVA followed by Bonferroni’s post-hoc test, where * indicates p < 0.05. The figure isreused from [Haji 19] with the publisher’s permission.

6.4. Discussion 55
As the disease progresses, stride velocity, path length, stride length and swingwidth (per-stride features) decreases and as a result, patients need more strides andtime (global features) to complete a turn. This pattern applies to all clinical scores,although two sub-items of gait and postural instability show a more substantial dif-ference between stages of the disease. Stride time shows no visible change betweendifferent groups.
Global features showed that PD patients, in contrast to controls, need significantlymore extended time and strides to complete a turn (Fig. 63). The number of stridesper-turn in particular shows a significant difference between control and even earlystage of the disease for the UPDRS-III score and its two sub-items. Moreover, thereare significant differences between the stages of the disease in most comparisons.Per-stride features except stride time show a significant difference between controls,mild and severe stages of the disease for all clinical scores 64. Stride velocity, stridelength, path length and swing width can differentiate disease severity utilizing alltested clinical scores (Fig. 64).
To quantify effect sizes, η2 is reported in table 62. The effect sizes range fromsmall to large. The most significant effect sizes are obtained consistently over allclinical scores with p < 0.001 by the global features, number of strides per-turn andturning time. Path length showed consistently higher effect-sizes than stride length,which suggests that it is a more prominent feature for estimation of spatial footdisplacement in turning. The effect sizes of per-stride duration are tiny.
6.4 DiscussionThe present chapter aimed to investigate whether an on-shoe sensor-based gait analy-sis system reflects turning abnormalities and can objectively complement physicians’gait assessment. To this end, 108 PD patients and 42 age-matched controls wererecruited and their gait was measured during the 4 × 10 m walk using the sys-tem presented in this chapter. The turnings then were isolated from the whole gaitsequence and quantified them using several spatio-temporal features. The featuresextracted using an on-shoe wearable system were previously validated against goldstandard systems such as an optical motion capturing system [Kanz 16] or instru-mented walkway [Ramp15, Bart 17] and results indicated their technical validity.The clinical validation that followed turn quantification showed that turning featuresextracted using the measurement system used in this thesis and the turn isolationalgorithm can adequately reflect gait abnormalities and can be successfully used forobjective assessment of turning.
There have been many studies regarding turning analysis in PD [El G 14, Mari 13,Sala 09]. Nonetheless, there is no unique way to define turning. Turning has beendefined using mathematical modeling [Sala 09], statistics of spatio-temporal featu-res [Mari 13] or the path between two pre-defined points [Stac 04]. One reason forthose diverse turning definitions is that basically, there is no standard way to de-termine the start and end of the turning. Common gold standards, such as motioncapture systems or videos, cannot provide ground truth for turning. Since transitionsbetween straight walking and turning happen gradually, it is inherently difficult to

56 Chapter 6. Turning Analysis in Parkinson’s Disease
H&Yc I II III
Str
ide V
elo
cit
y [
m/s
]
0.37
0.42
0.47
0.52
0.57
0.62
0.67
0.72
*
*
**
*
UPDRSc L M H
0.37
0.42
0.47
0.52
0.57
0.62
0.67
0.72
**
**
*
GAITc 0 1 2
0.37
0.42
0.47
0.52
0.57
0.62
0.67
0.72
**
**
*
Postural Instabilityc 0 1 2
0.37
0.42
0.47
0.52
0.57
0.62
0.67
0.72
**
**
**
H&Yc I II III
Path
Len
gth
[m
]
0.43
0.48
0.53
0.58
0.63
0.68
0.73
0.78
**
**
*
UPDRSc L M H
0.43
0.48
0.53
0.58
0.63
0.68
0.73
0.78
**
**
*
GAITc 0 1 2
0.43
0.48
0.53
0.58
0.63
0.68
0.73
0.78
**
**
*
Postural Instabilityc 0 1 2
0.43
0.48
0.53
0.58
0.63
0.68
0.73
0.78
**
**
**
H&Yc I II III
Str
ide L
en
gth
[m
]
0.38
0.43
0.48
0.53
0.58
0.63
*
**
*
UPDRSc L M H
0.38
0.43
0.48
0.53
0.58
0.63
**
**
*
GAITc 0 1 2
0.38
0.43
0.48
0.53
0.58
0.63
*
**
*
Postural Instabilityc 0 1 2
0.38
0.43
0.48
0.53
0.58
0.63
*
**
*
H&Yc I II III
Sw
ing
Wid
th [
m]
0.05
0.1
0.15
0.2
**
**
*
UPDRSc L M H
0.05
0.1
0.15
0.2
*
*
**
*
GAITc 0 1 2
0.05
0.1
0.15
0.2
**
**
*
Postural Instabilityc 0 1 2
0.05
0.1
0.15
0.2
**
**
**
Figure 64: Per-stride features characterizing turning, e.g. stride velocity, path length, stridelength and swing width were calculated for controls and PD patients. These features weregrouped according to H&Y disease stage, UPDRS-III score, the single items gait and posturalinstability of the UPDRS-III. Group data are displayed as mean ± SEM and compared usingone-way ANOVA followed by Bonferroni’s post-hoc test, where * indicates p < 0.05. Thefigure is reused from [Haji 19] with the publisher’s permission.
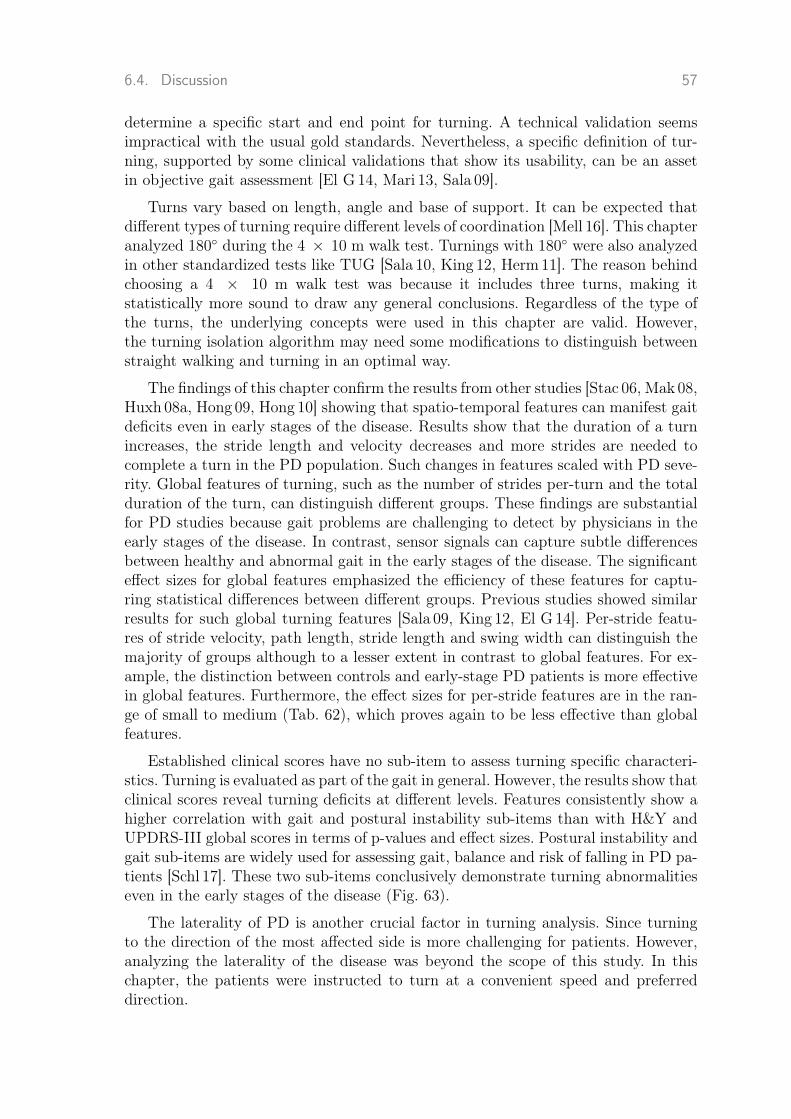
6.4. Discussion 57
determine a specific start and end point for turning. A technical validation seemsimpractical with the usual gold standards. Nevertheless, a specific definition of tur-ning, supported by some clinical validations that show its usability, can be an assetin objective gait assessment [El G 14, Mari 13, Sala 09].
Turns vary based on length, angle and base of support. It can be expected thatdifferent types of turning require different levels of coordination [Mell 16]. This chapteranalyzed 180◦ during the 4 × 10 m walk test. Turnings with 180◦ were also analyzedin other standardized tests like TUG [Sala 10, King 12, Herm11]. The reason behindchoosing a 4 × 10 m walk test was because it includes three turns, making itstatistically more sound to draw any general conclusions. Regardless of the type ofthe turns, the underlying concepts were used in this chapter are valid. However,the turning isolation algorithm may need some modifications to distinguish betweenstraight walking and turning in an optimal way.
The findings of this chapter confirm the results from other studies [Stac 06, Mak 08,Huxh 08a, Hong 09, Hong 10] showing that spatio-temporal features can manifest gaitdeficits even in early stages of the disease. Results show that the duration of a turnincreases, the stride length and velocity decreases and more strides are needed tocomplete a turn in the PD population. Such changes in features scaled with PD seve-rity. Global features of turning, such as the number of strides per-turn and the totalduration of the turn, can distinguish different groups. These findings are substantialfor PD studies because gait problems are challenging to detect by physicians in theearly stages of the disease. In contrast, sensor signals can capture subtle differencesbetween healthy and abnormal gait in the early stages of the disease. The significanteffect sizes for global features emphasized the efficiency of these features for captu-ring statistical differences between different groups. Previous studies showed similarresults for such global turning features [Sala 09, King 12, El G 14]. Per-stride featu-res of stride velocity, path length, stride length and swing width can distinguish themajority of groups although to a lesser extent in contrast to global features. For ex-ample, the distinction between controls and early-stage PD patients is more effectivein global features. Furthermore, the effect sizes for per-stride features are in the ran-ge of small to medium (Tab. 62), which proves again to be less effective than globalfeatures.
Established clinical scores have no sub-item to assess turning specific characteri-stics. Turning is evaluated as part of the gait in general. However, the results show thatclinical scores reveal turning deficits at different levels. Features consistently show ahigher correlation with gait and postural instability sub-items than with H&Y andUPDRS-III global scores in terms of p-values and effect sizes. Postural instability andgait sub-items are widely used for assessing gait, balance and risk of falling in PD pa-tients [Schl 17]. These two sub-items conclusively demonstrate turning abnormalitieseven in the early stages of the disease (Fig. 63).
The laterality of PD is another crucial factor in turning analysis. Since turningto the direction of the most affected side is more challenging for patients. However,analyzing the laterality of the disease was beyond the scope of this study. In thischapter, the patients were instructed to turn at a convenient speed and preferreddirection.
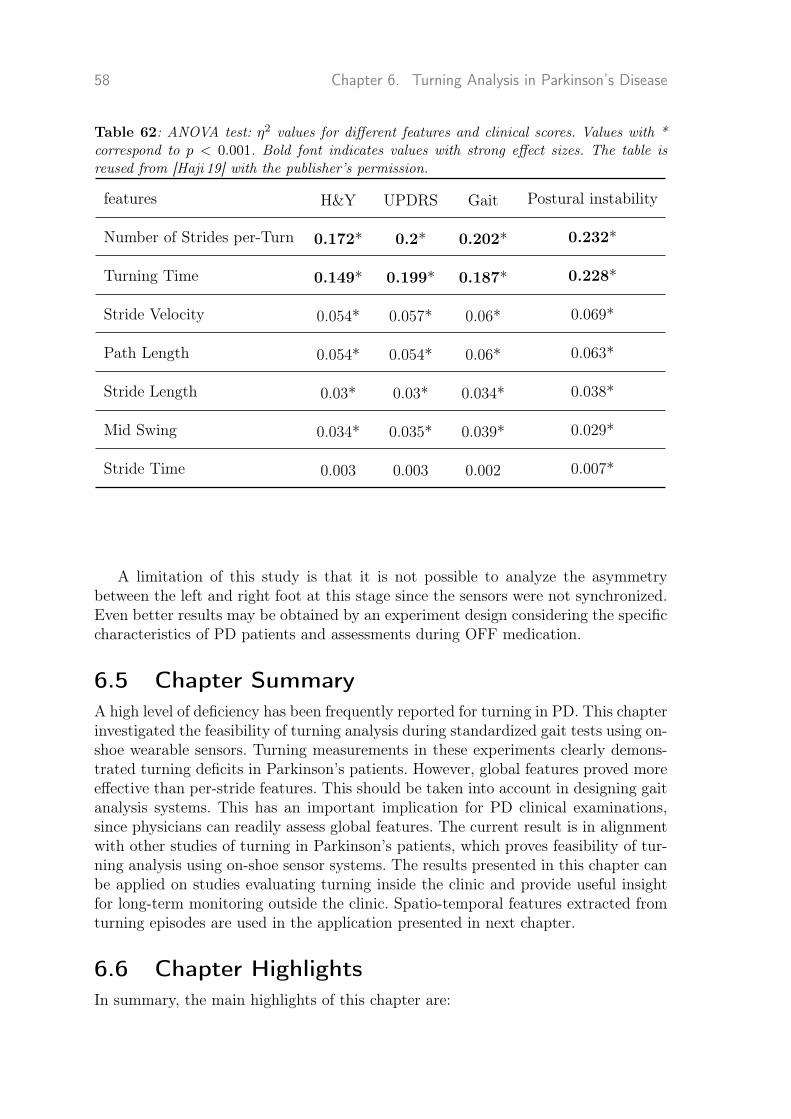
58 Chapter 6. Turning Analysis in Parkinson’s Disease
Table 62: ANOVA test: η2 values for different features and clinical scores. Values with *correspond to p < 0.001. Bold font indicates values with strong effect sizes. The table isreused from [Haji 19] with the publisher’s permission.
features H&Y UPDRS Gait Postural instability
Number of Strides per-Turn 0.172* 0.2* 0.202* 0.232*
Turning Time 0.149* 0.199* 0.187* 0.228*
Stride Velocity 0.054* 0.057* 0.06* 0.069*
Path Length 0.054* 0.054* 0.06* 0.063*
Stride Length 0.03* 0.03* 0.034* 0.038*
Mid Swing 0.034* 0.035* 0.039* 0.029*
Stride Time 0.003 0.003 0.002 0.007*
A limitation of this study is that it is not possible to analyze the asymmetrybetween the left and right foot at this stage since the sensors were not synchronized.Even better results may be obtained by an experiment design considering the specificcharacteristics of PD patients and assessments during OFF medication.
6.5 Chapter SummaryA high level of deficiency has been frequently reported for turning in PD. This chapterinvestigated the feasibility of turning analysis during standardized gait tests using on-shoe wearable sensors. Turning measurements in these experiments clearly demons-trated turning deficits in Parkinson’s patients. However, global features proved moreeffective than per-stride features. This should be taken into account in designing gaitanalysis systems. This has an important implication for PD clinical examinations,since physicians can readily assess global features. The current result is in alignmentwith other studies of turning in Parkinson’s patients, which proves feasibility of tur-ning analysis using on-shoe sensor systems. The results presented in this chapter canbe applied on studies evaluating turning inside the clinic and provide useful insightfor long-term monitoring outside the clinic. Spatio-temporal features extracted fromturning episodes are used in the application presented in next chapter.
6.6 Chapter HighlightsIn summary, the main highlights of this chapter are:

6.6. Chapter Highlights 59
1. Objective evaluation of turning pathology for the PD cohort by exami-ning the correlation of spatio-temporal features with clinical scores.
2. Presentation of a novel algorithm for turning isolation based on statisticalcharacteristics of turning angles.
3. Clinical validation of the proposed turning isolation algorithm.


7Objective Assessment of PDMotor Impairments
61
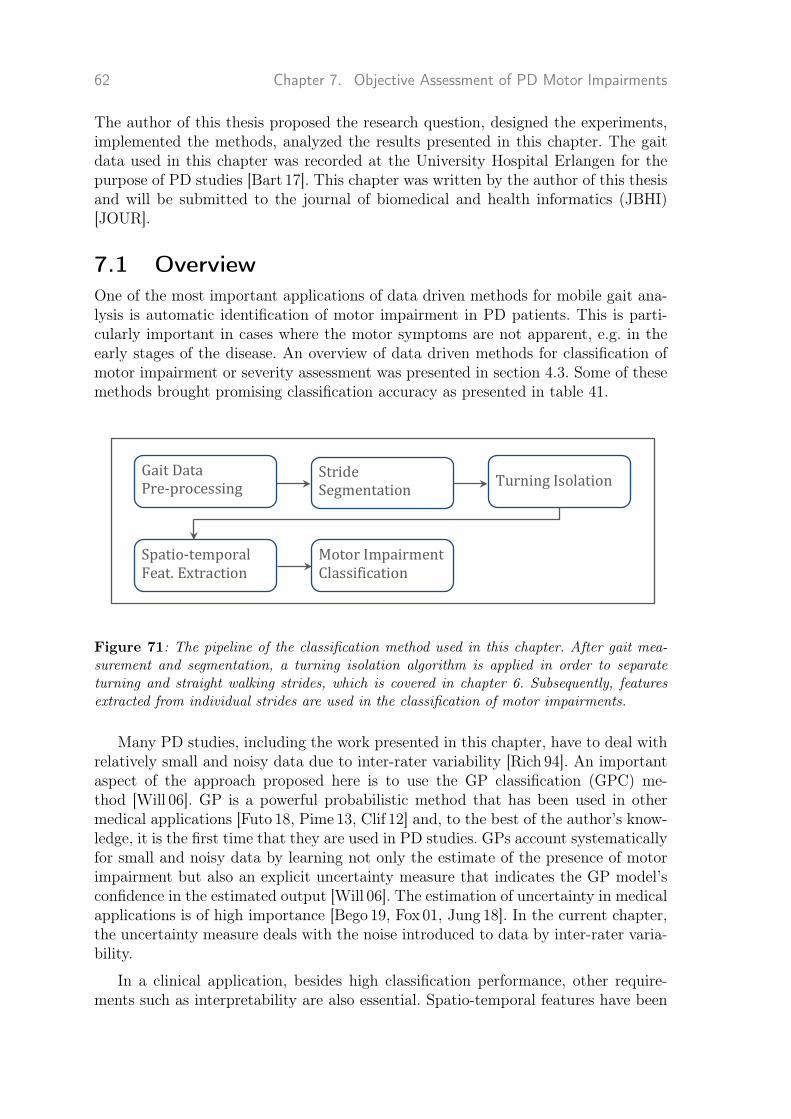
62 Chapter 7. Objective Assessment of PD Motor Impairments
The author of this thesis proposed the research question, designed the experiments,implemented the methods, analyzed the results presented in this chapter. The gaitdata used in this chapter was recorded at the University Hospital Erlangen for thepurpose of PD studies [Bart 17]. This chapter was written by the author of this thesisand will be submitted to the journal of biomedical and health informatics (JBHI)[JOUR].
7.1 OverviewOne of the most important applications of data driven methods for mobile gait ana-lysis is automatic identification of motor impairment in PD patients. This is parti-cularly important in cases where the motor symptoms are not apparent, e.g. in theearly stages of the disease. An overview of data driven methods for classification ofmotor impairment or severity assessment was presented in section 4.3. Some of thesemethods brought promising classification accuracy as presented in table 41.
Motor Impairment Classification Motor Impairment Classification Motor Impairment Classification
Gait Characteristics Analysis
Gait Processing
Gait Measurement
Spatio-‐temporal Feat. Extraction
Turning Isolation
Gait Data Pre-‐processing
Stride Segmentation
Motor Impairment Classification
Figure 71: The pipeline of the classification method used in this chapter. After gait mea-surement and segmentation, a turning isolation algorithm is applied in order to separateturning and straight walking strides, which is covered in chapter 6. Subsequently, featuresextracted from individual strides are used in the classification of motor impairments.
Many PD studies, including the work presented in this chapter, have to deal withrelatively small and noisy data due to inter-rater variability [Rich 94]. An importantaspect of the approach proposed here is to use the GP classification (GPC) me-thod [Will 06]. GP is a powerful probabilistic method that has been used in othermedical applications [Futo 18, Pime 13, Clif 12] and, to the best of the author’s know-ledge, it is the first time that they are used in PD studies. GPs account systematicallyfor small and noisy data by learning not only the estimate of the presence of motorimpairment but also an explicit uncertainty measure that indicates the GP model’sconfidence in the estimated output [Will 06]. The estimation of uncertainty in medicalapplications is of high importance [Bego 19, Fox 01, Jung 18]. In the current chapter,the uncertainty measure deals with the noise introduced to data by inter-rater varia-bility.
In a clinical application, besides high classification performance, other require-ments such as interpretability are also essential. Spatio-temporal features have been

7.2. Methods 63
Table 71: Clinical characteristics of healthy controls.
Control (N=39)
Age (years) 58.80 ± 11.13 [41-84]
Sex (Male / Female) 23 / 16
Height (m) 1.73 ± 0.07
BMI (Kg/m2) 26.48 ± 3.9
most widely studied and clinically validated features [Schl 17, Haji 19] and provideinterpretability for clinicians, which is critical in medical applications. Many stu-dies reported strong correlation between spatio-temporal features and clinical sco-res [Schl 17, Mari 13] for both straight walk and turning episodes of gait [Schl 17,Haji 19]. Mariani et al. [Mari 13] showed such features can differentiate ON and OFFstates of the disease.
In this chapter, the classification of motor impairments is performed based onspatio-temporal features, extracted from straight walking and turning episodes ofgait. Figure 71 visualizes the processing pipeline for the method used here. A detailedclassification of different levels of motor impairment using the UPDRS III scale hasbeen performed. The current approach is fully automatic and feature selection wasperformed to choose the best set of features relevant for the classification task.
7.2 Methods7.2.1 Study PopulationThe study design is the same as the previous chapter 6. Subjects performed thestandardized test of 4 × 10 m walk. The characteristics of patients can be found intable 61. Three controls were removed from the population due to the presence ofanomalies in features extracted from their straight walking. The characteristics of thecontrols population in this chapter is presented in table 71.
7.2.2 FeaturesThe 4×10 mwalk test includes four straight walking bouts and three turning episodes.The first step is to segment the gait sequence to individual strides using methodspresented in chapter 5. Turning strides are then isolated from straight walking strides.In this chapter, the turning isolation algorithm is used that was presented in chapter 6.
The following spatio-temporal features were calculated for all straight strides:stride time, swing time, stance time, stride length, stride velocity, heel strike an-gle, maximal toe clearance, path length, toe-off angle, and turning angle [Mari 13,Ramp15, Bart 17, Hann 19, Nguy 19]. Path length and stride length were normali-zed by the subjects’ body height to control for height-dependent gait characteristics.

64 Chapter 7. Objective Assessment of PD Motor Impairments
The swing and stance time were both computed relative to the stride time. For eachsubject, the mean and variance of each feature were calculated [Kluc 13, Nguy 19].
Features calculated per turn were the number of strides and turning time. Themean of each of the two features over all three turns was calculated. Furthermore,the following features per turning stride for all turns were calculated: stride length,stride time, stride velocity and path length (Fig. 62).
7.2.3 ClassificationFeature Selection
Due to a large number of features, feature selection was first performed in a forwardselection manner, in which features were progressively incorporated into larger andlarger subsets until the classification performance stabilized and did not improveanymore. To decrease the computational cost of the forward selection, a smaller subsetof features is chosen that is most relevant to the classification task [Guyo 03].
For each feature, several metrics were calculated including the µ1j and µ−1j and
standard deviation σ1j and σ−1j for the classes y ∈ {1,−1}. The goal was to find
features that provide higher discrimination between classes [Guyo 03]. To this end,the following score was calculated
Fj = ‖µ1j − µ−1j
σ1j + σ−1j
‖, (7.1)
which is higher for those features that differ most from the average while also favoringthose with small deviation in scores in the respective classes.
Classification
In supervised classification, there exists a training set of n labeled observationsD = {(xi, yi)|i = 1, . . . , n} with labels yi ∈ {1,−1}, drawn from independent andidentically distributed, but fixed, joint probability distribution p(x, y). The inputsto the model are spatio-temporal features and the output is the data point’s label.Classification task is a mapping from inputs to the labels. In this chapter, Gaussianprocess is used for the classification task. Section 3.1.2 presents an introduction toGP classification models.
In section 3.1.2, it is discussed that the hyper-parameters of a GPC model are noisevariance and kernel parameters. The Gaussian kernel is perhaps the most widely usednon-linear kernel (Sec. 3.1.2) and has been used in this chapter. The kernel parametersare a signal variance and a length-scale parameter for each dimension (Sec. 3.1.2).
7.2.4 Performance EvaluationThe model is evaluated based on two metrics of classification accuracy and NegativeLog Predictive Density (NLPD) [Will 06], where the latter takes into account the

7.3. Results 65
Table 72: Average classification accuracy, sensitivity, specificity and NLPD for each clas-sification task
Classification Accuracy [%] Sensitivity [%] Specificity [%] NLPD
Control vs UPDRS-low 65.7 65 66.6 0.65
Control vs UPDRS-mild 76.6 80 72.9 0.5
Control vs UPDRS-high 83.5 85 81.8 0.41
uncertainty associated with the predictions as well. Let p∗ = p(yi = 1|D, θ, xi) be themodel’s prediction, then the NLPD becomes:
NLPD(p∗i , yi) = −1
2
[(1 + yi) log2(p
∗i ) + (1− yi) log2(1− p∗i )
](7.2)
A 20-fold cross-validation has been performed for finding the best feature set andleave-one-subject-out for model evaluation. The choice of a large number of folds andleave-one-subject-out is because that the data set is small and generalization on asmall training set is highly challenging. For finding the best hyper-parameters forGP, marginal likelihood estimation (ML-II) is applied using EP method (Sec. 3.1.2).Feature extraction is similar to the previous chapter 6. Development of Gaussianprocess classification was performed using MATLAB R2015a and the GPML tool-box [Rasm10].
7.3 ResultsThe classification was performed between PD patients and healthy controls taking in-to account different levels of motor impairment. Table 72 shows the average accuracy,sensitivity, specificity and NLPD for each classification. As motor impairment beco-mes more severe, classification accuracy, sensitivity and specificity increase to over80%. The classification accuracy improved with increased motor impairment, wherefor the most affected patients (UPDRS-high) reached 83%. Accuracy was lower formildly affected patients (77%) and patients at the the early stages of the disease(66%). NLPD measures uncertainty in addition to usual point predictions. The ave-rage NLPD decreases and better predictions are obtained as the severity of motorimpairment increases, which is alignment with other evaluation metrics.
The predictive distribution in GPs is a Gaussian distribution (Equ. 3.10 and 3.11).Table 73 shows the predictive density of two correctly classified and two misclassifiedcases, where controls are labeled as 1 and PDs are labeled as −1. At zero, each classhas a 50% chance. The first two moments of the predictive density are shown foreach classification. The model presents low uncertainty (low variance) in cases ofcorrect classification (densities in blue) and high uncertainty (high variance) in casesof misclassifications (densities in red).

66 Chapter 7. Objective Assessment of PD Motor Impairments
Table 73: Predictive densities for four subjects, two patients and two controls. Blue andred densities represent correctly classified and misclassified cases, respectively. The first twomoments for each density have been shown for each classification.
Predicted Class
Control PD Group I
Actua
lClass Con
trol
-1
PD Group I
0 0.86 1
Control
Pre
dic
tiv
e D
en
sit
y
0
0.5
1
1.5
2Predictive mean: 0.86 Predictive variance: 0.26
-1
PD Group I
-0.13 0 1
Control
Pre
dic
tiv
e D
en
sit
y
0
0.5
1
1.5
2Predictive mean: -0.13 Predictive variance: 0.98
PD
Group
I
-1
PD Group I
0 0.18 1
Control
Pre
dic
tiv
e D
en
sit
y
0
0.5
1
1.5
2Predictive mean: 0.18 Predictive variance: 0.97
-1
PD Group I
-0.89 0 1
Control
Pre
dic
tiv
e D
en
sit
y
0
0.5
1
1.5
2Predictive mean: -0.89 Predictive variance: 0.21
7.4 DiscussionOne major goal of this chapter is to investigate if it is feasible to automatically classi-fy different levels of motor impairment using spatio-temporal features obtained fromIMU data. The classification can be used as an objective complement for clinicalassessment. The second goal of this chapter was to introduce GP methods for classi-fication of motor impairment, which can systematically deal with model uncertainty,particularly in the presence of small and noisy data sets which are often the case inmedical applications.
In order to investigate the feasibility of the differentiation between PD patientsand controls, the patients were divided by different levels of motor impairment definedby UPDRS III scale (UPDRS-low, -mild, -high, Tab. 61). The classification accuracyimproved with increased motor impairment. The accuracy of this method for patientswith UPDRS-mild and -high is reasonable when taking into account that the accuracyof the clinical diagnosis of PD patients ranges between 50% and 80% [Tolo 06]. Inthis application, both sensitivity and specificity are crucial, where they are high forpatients with UPDRS-mild and -high and low for UPDRS-low. The result indicatesthat spatio-temporal features in the early stages of the disease are not capable ofsufficiently reflect the difference of the gait pattern between control and patients.
The strength of the presented method is to use GP classification, which mea-sures the model uncertainty, that quantitatively indicates the model confidence inestimating an output [Haji 16]. The output of the GPC is a Gaussian predictive den-

7.4. Discussion 67
sity whose variance is a measure of the confidence of the model in the estimatedoutput. Figure 73 shows four classifications between controls and PD patients withUPDRS-low (Group I). In the case of correct classifications (densities in blue), mo-del uncertainty is low, whereas in the case of misclassifications (densities in red),model uncertainty is high. Predictive densities in red have a mean close to zero andassign almost equal probability to both classes. The interpretation of these densitiesis straightforward. Lower variance means more certain predictions and the modeloutput can reliably be integrated into the clinical practice, whereas a high variancemeans that model uncertainty is high for a particular case and the model outputis not entirely reliable. This is in particular important for noisy small data sets asfinding an optimal classification boundary is difficult. The average NLPD in table 72indicates that the predictions improve as the motor impairment becomes more severe.
By having a large data set, where the number of features is much smaller thanthe number of data points, all features could be included in modeling. However, thedata sets used here are relatively small and the best features should be selected forthe classification task. A valid automatic feature selection is essential for successfulclassification. Despite the small data set, the feature selection was stable and featuressuch as a number of strides per turning, mean of turning angle [Haji 19, Mari 13]and mean of heel strike angle [Hann 19] were mostly among the selected features. Inparticular, number of strides per turning was frequently reported [Haji 19, El G 14] tobring the significant difference between controls and patients with different levels ofmotor impairment, where patients with more severe disease require a larger numberof strides for completing a turn.
The work in this chapter is closely related to two previous works by Klucken et al.[Kluc 13] and Caramia et al. [Cara 18]. Klucken et al. [Kluc 13] used gait analysis sys-tem with sensors on the shoes but considered generic features in addition to spatio-temporal features. However, unlike this work, they only considered spatio-temporalfeatures from straight walking. Caramia et al. [Cara 18] analyzed spatio-temporal fea-tures and a ranges of motions obtained from sensors on different parts of the body.Both of these works could obtain higher accuracy than the work presented in thischapter. There are two main differences compared to this work: the classifier and fea-tures used for the classification. In both of these works SVM was used to classify sub-jects using various features including generic, statistical and spatio-temporal features.It was shown that the expressive power of SVMs and GPs are the same [Oppe 00].Hence, the type of classifier should not be the reason for this difference. This sug-gests that only using spatio-temporal features does not lead to high accuracy. Featureengineering should be enhanced, though this may reduce interpretability.
A limitation of this study is having a relatively small cohort, which limits themodel’s capacity, although it is common in PD studies. Massive data sets can helpfind better decision boundaries in the input space and improve the classificationresult.

68 Chapter 7. Objective Assessment of PD Motor Impairments
7.5 Chapter SummaryThe overarching goals of mobile gait analysis systems are objective assessment aswell as long-term and decentralized monitoring of patients. This chapter presentedan essential step towards these goals by developing an automatic method that candifferentiate between healthy subjects and PD patients that can complement clinicaldiagnosis. This chapter presented an application of Gaussian Processes, a probabili-stic machine learning method, to systematically measure model uncertainty. It wasdiscussed how such an additional information is crucial in order to reliably integratethe model output into the clinical procedures. This method displays the potential forfurther improvement and a wider application to distinguish other motor impairmentcauses.
7.6 Chapter HighlightsIn summary, the main highlights of this chapter are:
1. Implementation of a pipeline for the classification of motor impairmentin PD.
2. Introducing the GP classification method for the first time to the appli-cation of objective assessment of motor impairment.
3. Presentation of advantages of models such as GP that deals with dataand model uncertainty in a principled way.
4. Evaluation of the method in a data set including PD patients and healthycontrols.

8Summary, Discussion &Outlook
69

70 Chapter 8. Summary, Discussion & Outlook
In this chapter, first, a summary of motivation and contributions is given in secti-on 8.1. The pre-requisite of the current contributions are hardware system for mobilegait analysis, presented in section 2.2.2 and the software that process raw gait data,presented in appendix A.
The second part, section 8.2, combines a discussion of limitations and future work:
1. Segmentation of Gait Sequences in chapter 5
2. Turning analysis in Parkinson’s Disease in chapter 6
3. Objective Assessment of PD Motor Impairments in chapter 7
Finally, the conclusion of this thesis is provided in section 8.3.
8.1 Summary and Discussion of ContributionsParkinson’s disease is the most common neurodegenerative disorder that affects gaitwith a considerable impact on the health and quality of life of patients as well asan economic burden [Jank 08, Bart 17]. Therefore, diagnosis in the early stages ofthe disease, prognosis and treatment of patients is of essential importance [Jank 08,Snij 07]. Another goal that increasingly attracted attention in recent decades is long-term monitoring of patients outside of clinics [Sala 04, Bart 17]. Mobile gait analysissystems using wearable sensors have been developed in alignment with these goals[Pasl 15]. Wearable sensors enable us to measure gait outside clinics. But this is farfrom enough. There is an urgent need to develope methods that process these dataand produce clinically meaningful output [Mazi 13, Kluc 13, Hann 16]. Currently, datadriven methods are state-of-the-art for performing a plethora of tasks on data. Thepresented thesis describes the development and evaluation of data driven methodsfor mobile gait analysis of Parkinson’s patients mainly in three directions.
Segmentation of Gait Sequences
A robust gait segmentation is a basis for mobile gait analysis. Section 4.1 reviewsa wide range of data driven methods applied for gait segmentation. Currently, aunified evaluation of gait segmentation methods in Parkinson’s disease is missing. Inchapter 5, this thesis compared four common gait segmentation methods in order toreveal their strengths and drawbacks in gait processing. Four methods were consideredincluding peak detection from event-based methods, two variations of Dynamic TimeWarping from template matching methods and hierarchical Hidden Markov Modelsfrom machine learning methods. To evaluate the methods, two experiments wereperformed that are widely used in the assessment of Parkinsonian gait. In the firstexperiment, a sequence of strides from straight walking was measured from 10 PDpatients. In the second experiment, a more heterogeneous data set, including straightwalking, turning strides and non-stride movements, was examined for 34 PD patients.The last experiment’s goal was to evaluate the methods in challenging situations,including turning strides and non-stride movements.

8.1. Summary and Discussion of Contributions 71
Results showed no significant difference between the methods for the first scenario,in which all methods reached almost 100% accuracy in terms of F-score. Hence, it canbe concluded that in the case of a homogeneous sequence of strides all methods can beapplied equally. However, in the second experiment the difference between methodsbecame evident with hHMM reaching 96% F-score and significantly outperformingthe other methods. hHMM also proved promising in distinguishing between stridesand non-stride movements, which is critical for clinical gait analysis.
Turning analysis in Parkinson’s Disease
A closer look at gait in Parkinson’s disease reveals that turning has its own charac-teristics and requires to be analyzed separately form straight walking. The goal ofchapter 6 was to present a system with on-shoe wearable sensors in order to analyzethe abnormalities of turning in a standardized gait test for PD. This thesis investiga-ted turning abnormalities in a large cohort of 108 PD patients and 42 age-matchedcontrols. The turning was quantified through several spatio-temporal features inclu-ding stride time, path length, stride length, stride velocity, and swing width as per-strides features. The second group of features characterizes the whole turn includingthe number of strides and total duration per-turn.
Analysis of turn-derived features revealed differences of turn-related gait impair-ment concerning different disease stages and motor impairment. Global features suchas number of strides per turn and turning time proved more effective than per-stridefeatures such as stride length and time. This thesis’s findings confirm and extend theresults from previous studies and show the applicability of the system used in thisthesis in turning analysis.
Objective Assessment of PD Motor Impairments
Chapter 7 examines the feasibility of automatic and objective classification of differentlevels of motor impairments using mobile gait analysis systems (Sec. 4.3). Gait wasmeasured from 39 healthy individuals and 108 age-matched PD patients during astandardized clinical test. Patients were divided to three groups of UPDRS-low, -mildand -high. This work adopted a probabilistic approach to classification, set within aGaussian process framework, a principled way to deal with noisy data sets, typicallycaused by inter-rater variability. The input to the classifier is the spatio-temporalfeatures derived from straight walking and turning episodes of gait. The results showthe subjects with advanced PD can be better differentiated from healthy controls. Thecomparison with other works suggests that complementing spatio-temporal featureswith generic and other features may improve the classifier’s accuracy. NLPD can beused to assess the probabilistic prediction of the GP model. This metric decreases asthe disease progresses, which is in alignment with other metrics.

72 Chapter 8. Summary, Discussion & Outlook
8.2 Limitations & OutlookThe scientific contributions covered in this thesis aimed to target some of the mostfundamental building blocks of sensor-based mobile gait analysis systems using datadriven methods. This section presents limitations of these works and some of thepotential directions of future works.
Segmentation of Gait Sequences
Accessibility of large data can bring a paradigm shift to healthcare only in the pre-sence of powerful methods to process it. All building blocks in the pipeline of mobilegait analysis systems should be optimized to provide the highest performance in thetask at hand. Inefficiency in any building block affects the whole pipeline. Many app-lications require segmentation of the whole gait sequence to individual strides as theirfirst step. Statistics of strides form the basis of inference in many medical applicati-ons. False positives of stride segmentation methods lead to incorrect and misleadingstatistics and negatively affect the inference. Hence, a powerful stride segmentationmethod is crucial for many applications of gait analysis [Bobi 18].
Chapter 5 presents a comparison of four segmentation methods. The best resultfor a challenging data set with variable strides was achieved by hHHMs. Later ap-plications developed Deep Neural Networks for gait segmentation with promisingresults (Sec. 4.1). These methods are totally different in terms of the way they repre-sent data. While HMMs and their variants are well-known probabilistic methods forprocessing time series with rich theoretical foundation [Ghah 01], DNNs are relativelynew and rather poor in interpretability. Another important aspect about these twofamilies of methods is that, in general, DNNs are more data intensive compared toHMMs. Future research work can be to add the variants of DNNs to the comparison.
If the concepts of mobile gait analysis in clinics will be transferred to long-term mo-nitoring, gait segmentation will be necessary outside clinics as well [Luek 19, Mile 18].This imposes an unprecedented challenge on stride segmentation methods, as differentpossible activities should be distinguished from gait as well. Evaluation of segmenta-tion methods in gait recorded in clinics can provide some useful insights for long-termmonitoring. However, it cannot reveal the strengths and drawbacks of methods, tothe full extent, in the case of long-term monitoring.
Turning analysis in Parkinson’s Disease
Strides during turning differ from strides during straight walking. This clearly re-flects in spatio-temporal features such as stride length and velocity. Studies showpathology of turning is stronger manifestation of PD [El G 14]. However, turning isoften missing from gait analysis applications using data driven methods. A futureresearch direction can be to analyze the effect of including turning characteristics ingait analysis applications.
Long-term monitoring of patients during a day can provide better insight into theirdisease condition in contrast to time-limited examinations inside the clinics [El G 14].Moreover, continuous monitoring of patients can be supplemented with preventati-

8.2. Limitations & Outlook 73
ve strategies for falling and FoG. The fact that turning during standardized testsdemonstrates clear signs of deficiency emphasizes that turning analysis needs to beintegrated into the long-term gait analysis. Turning isolation during long-term mo-nitoring is even more challenging than in a standardized test. The distribution ofturning angles was assumed to have a particular parametric form. This assumptionmight not be held in long-term monitoring, since the form and length of turns canbe highly diverse. Some studies successfully addressed turning analysis in long-termmonitoring [El G 14, Manc 18a], although they did not use on-shoe sensor systems.A potential future work would be to examine the strengths and drawbacks of themethod presented in this thesis for unconstrained environments.
Objective Assessment of PD Motor Impairments
Spatio-temporal features used in this work are interpretable for clinicians. However, toextract such features from raw data, stride segmentation is necessary in advance. Asdiscussed above, the current stride segmentation methods are prone to errors. Evena small error necessitates manual correction after automatic segmentation. Otherwi-se the feature statistics is questionable. This manual check and correction is time-consuming and limits us to fully leverage the power of large data sets. When thesegmentation barrier would be resolved, and large data sets could be used for classi-fication of motor impairments, better classification boundaries can be attained. Thisinvestment is necessary in applications of mobile gait analysis where interpretabilityis crucial.
Gaussian processes, a type of probabilistic method, measure model uncertaintyin a principled way [Will 06]. GPs estimate not only a classification output but alsoa measure of model uncertainty for a given output [Will 06]. This has an importantimplication for clinical applications, since uncertain output should be used with ne-cessary caution. GP models were introduced to PD studies for classification of motorimpairments for the first time in this thesis. Applying this type of models in otherapplications of mobile gait analysis systems would be a promising research direction.
Finally, the clinical diagnosis is limited to the differentiation of healthy and PDsubjects and includes differential diagnosis of other neurological disorders with gaitimpairment. In future work, a feasibility study for a more comprehensible classifica-tion of healthy individuals and patients with neurological disorders affecting gait isdesirable.

74 Chapter 8. Summary, Discussion & Outlook
8.3 ConclusionThis thesis’s findings indicate the applicability and usability of the integration ofdata-driven methods into mobile gait analysis using inertial sensing. Data driven me-thods have been developed and evaluated for some of the most important applicationsof mobile gait systems. The first contribution of this thesis evaluated three computa-tional methods of peak detection, Euclidean and probabilistic DTW for segmentationof PD gait. Furthermore, hHMMs as a machine learning method were applied for gaitsegmentation. These methods were evaluated under two scenarios. The first scenarioincludes only straight walking strides and hence strides variability is low. Whereas,the second data set includes strides from straight walking, turning and non-stridemovements. The second scenario is a challenging task that appears in many clinicalstandardized tests. The findings of this thesis show that in the case of a simple dataset, these methods perform equally well. However, the complex scenario proved thepower of machine learning methods in stride segmentation as hHMMs surpassed theother methods. A robust gait segmentation is required for the next two contributionsof this thesis. The second contribution focuses on turning analysis in PD for mobilegait systems with foot-worn IMUs. This contribution proposed and developed a novelalgorithm for isolating the turning episodes in a gait sequence. The spatio-temporalfeatures were extracted from turning episodes. The goal here was to investigate ifturn-derived spatio-temporal features can bring about abnormalities during turning.The findings suggest that such features can differentiate a PD and healthy control aswell as different levels of PD disease. The approach presented in this work is applicablefor any turning analysis using foot-worn sensors. The final part of this thesis presentsan objective assessment of motor impairment in PD. This can be formulated as aclassification task where gait sequence is mapped to a class including healthy control,UPDRS-low, -mild and -high. This thesis used interpretable spatio-temporal featuresas input to the classifier. The results of this work suggest that the model capturesthe PD characteristics so that a higher level of impairment is detectable with higheraccuracy. These results are in line with our understanding of PD in which the highermotor impairment leads to a gait with clear distinction with healthy gait. This thesisused the GP classifier, which is a probabilistic method that besides the predictionprovides an uncertainty measure for the corresponding prediction. Knowing the mo-del confidence in predictions can be valuable in integrating the classifier output intoclinical workups. These contributions are essential in the developments of mobile gaitanalysis systems and assist in improving disease management and enhancing patientcare.

Appendix A
Section 2.2.2 presents the hardware for the mobile gait analysis system used in thisthesis. This Appendix presents the software toolbox (Fig. A.1) used for all the pre-processing steps required in the gait analysis 2.2. This software was developed as partof a P.hD. thesis [Hann 19].
To process recorded gait, a data point or a data population can be loaded intothe system. The low-level operations such as reading sensor data and calibration canbe done automatically [Hann 19]. Higher-level algorithms for gait segmentation andfeature extraction are available. An implementaion of msDTW [Bart 15] is avilablewith the option to modify the threshold parameter [Hann 19]. It is also possible toextract a wide range of spatio-temporal features using this toolbox [Hann 19]. Itis easy to detect anomalies in features and correct them in this toolbox. A GUIwas designated to visualize pipelines and processes as well as the results [Hann 19].Different functions of GUI is explained in figure A.1. The data sets can be load andsave as a project [Hann 19]. It is possible to perform processes in an individual orbatch way [Hann 19]. The result of the processes can be exported [Hann 19].
75

76 Chapter 8. Appendix
Figure A.1: The screenshot of the GUI of the Toolbox. Figure used with kind permissionof Julius Hannink [Hann 19, p. 113].

List of Figures
11 Structure of this thesis . . . . . . . . . . . . . . . . . . . . . . . . . . . . 8
21 Rating sheet of the UPDRS III motor score . . . . . . . . . . . . . . . . 14
22 The general pipeline of mobile gait analysis systems . . . . . . . . . . . . 15
23 The healthy gait cycle including gait events and phases. . . . . . . . . . 16
24 An optical motion capture system . . . . . . . . . . . . . . . . . . . . . . 17
25 Shimmer 2R sensor . . . . . . . . . . . . . . . . . . . . . . . . . . . . . . 18
26 A shoe with a Shimmer sensor unit . . . . . . . . . . . . . . . . . . . . . 19
27 Accelerometer and gyroscope data for one exemplary stride . . . . . . . . 19
31 A hidden Markov model with hidden states and observations. Arrows showthe model dependencies. . . . . . . . . . . . . . . . . . . . . . . . . . . . 21
32 Topology of a two-level hHMM . . . . . . . . . . . . . . . . . . . . . . . 23
51 Labeling of an example of gyroscope signal including two strides, the fol-lowing transition (non-stride) movement and rest. . . . . . . . . . . . . . 39
52 Stride templates . . . . . . . . . . . . . . . . . . . . . . . . . . . . . . . 42
53 Precision, recall and F-score for four methods . . . . . . . . . . . . . . . 45
61 The pipeline of the turning analysis used in this chapter. . . . . . . . . . 50
62 Definition of turning angle, stride length, path length and swing width. . 51
63 Global features characterizing turning . . . . . . . . . . . . . . . . . . . . 54
64 Per-stride features characterizing turning . . . . . . . . . . . . . . . . . . 56
71 The pipeline of the classification method used in this chapter . . . . . . . 62
A.1 The screenshot of the GUI for the Toolbox. . . . . . . . . . . . . . . . . 76
77


List of Tables
21 Description of PD severity according to the H&Y scale . . . . . . . . . . 12
22 UPDRS III Sub-item Gait . . . . . . . . . . . . . . . . . . . . . . . . . . 13
41 Objective assessment of PD severity and motor impairment . . . . . . . . 32
51 Grid search for hHMM parameter optimization. . . . . . . . . . . . . . . 41
52 Grid search for eDTW parameter optimization. . . . . . . . . . . . . . . 42
53 Grid search for pDTW parameter optimization. . . . . . . . . . . . . . . 42
54 Results of the second experiment in terms of precision, recall and F-score. 44
61 Clinical characteristics of PD patients and healthy controls. . . . . . . . 52
62 ANOVA test: η2 values for different features and clinical scores. . . . . . 58
71 Clinical characteristics of healthy controls. . . . . . . . . . . . . . . . . . 63
72 Average classification accuracy, sensitivity, specificity and NLPD for eachclassification task . . . . . . . . . . . . . . . . . . . . . . . . . . . . . . . 65
73 Gaussian process predictive densities for four subjects . . . . . . . . . . . 66
79


Terminology
feature is a type of data characterization that can be sparser and, at the same time,more expressive compared with raw data.
feature selection is a process to remove irrelevant features that do not provideany new information.
hidden state in HMMs is a state of a process that cannot be observed.
latent representation is referred to the representation of data that a machinelearning method learns. DNNs can learn very powerful latent representation of datathrough their hierarchy of hidden neurons.
maximum likelihood estimation is a fundamental method for learning a mo-del based on a data set.
model hyperparameters control the parameters of a model, thereby in an indi-rect way, control the model itself.
model parameters control the characteristics of a model.
non-parametric model does not assume any parametric form for the model.
observation is another way to refer to a data point in the context of machine lear-ning methods.
personalized method aims to tailor a model to a specific subject. This allevia-tes the problem of high inter-variability in data.
parameter learning refers to any method for learning the model parameters basedon the data. Maximum likelihood estimation is a commonly used method for para-meter learning.
stochastic processes are a generalization of a finite-dimensional random variablesto functions [Will 06].
zero velocity assumption is used in the context of double integration methods.
81

82 Chapter 8. Terminology
This means, it is assumed that sensors have zero velocity at points during gait, e.g.in mid-stances [Hann 19].

List of Symbols
∼ distributed according to; e.g. x ∼ N (µ, σ2)
D data setD dimension of input space X
exp exponential functionGP Gaussian Processld characteristic length-scales in kernels
log logarithm functionL Likelihood
k(x, x′) kernel functionK kernel or covariance matrix
N (µ,Σ) Gaussian (Normal) distribution with mean vector µ andcovariance matrix Σ
p(x|y) conditional random variable x given y and its probabilityΦ probit function
t, T scalars t, T (lowercase and uppercase)θ model parametersx vector x (boldface, lowercase)
x∗, f∗ test inputX matrix X (boldface, uppercase)
83


List of Abbreviations
ANOVA Analysis Of Variance
BMI Body Mass Index
CNN Convolutional Neural Network
DGN DGNGerman Association for Neurology
DNN Deep Neural Network
DTW Dynamic Time Warping
GMM Gaussian Mixture Model
GP Gaussian Processes
GUI Graphical User Interface
hHMM Hierarchical Hidden Markov Model
HO Heel-off
HS Heel-Strike
HSP Hereditary Spastic Paraplegia
H&Y Hoehn & Yahr Disease Stage
IMU Inertial Measurement Unit
LSTM Long Short-Term Memory
ML Machine Learning
MoCap Motion Capture
MS Mid-Stance
NINDS National Institute of Neurological Disorders and Stroke
NLPD Negative Log Predictive Density
NN Neural Network
85

86 Chapter 8. List of Abbreviations
PD Parkinson’s Disease
QoL Quality of Life
SEM Standard Error on the Mean
STD Standard Deviation
SVM Support Vector Machine
TO Toe-Off
TUG Timed Up and Go
UPDRS Unified Parkinson’s Disease Rating Scale

Bibliography
[Aars 10] D. Aarsland, K. Bronnick, C. Williams-Gray, D. Weintraub, K. Mar-der, J. Kulisevsky, D. Burn, P. Barone, J. Pagonabarraga, L. Allcock,et al. “Mild cognitive impairment in Parkinson disease: a multicenterpooled analysis”. Neurology , Vol. 75, No. 12, pp. 1062–1069, 2010.
[Abdu 18] E. Abdulhay, N. Arunkumar, K. Narasimhan, E. Vellaiappan, andV. Venkatraman. “Gait and tremor investigation using machine lear-ning techniques for the diagnosis of Parkinson disease”. Future Ge-neration Computer Systems , Vol. 83, pp. 366–373, 2018.
[Adki 03] A. L. Adkin, J. S. Frank, and M. S. Jog. “Fear of falling and posturalcontrol in Parkinson’s disease”. Movement disorders , Vol. 18, No. 5,pp. 496–502, 2003.
[Ahlr 16] C. Ahlrichs, A. Samà, M. Lawo, J. Cabestany, D. Rodríguez-Martín,C. Pérez-López, D. Sweeney, L. R. Quinlan, G. Ò. Laighin, T. Cou-nihan, et al. “Detecting freezing of gait with a tri-axial accelerometerin Parkinson’s disease patients”. Medical & biological engineering &computing , Vol. 54, No. 1, pp. 223–233, 2016.
[Amin 02] K. Aminian, B. Najafi, C. Büla, P.-F. Leyvraz, and P. Robert.“Spatio-temporal parameters of gait measured by an ambulatory sys-tem using miniature gyroscopes”. Journal of biomechanics , Vol. 35,No. 5, pp. 689–699, 2002.
[Assa 14] R. Assam and T. Seidl. “Prediction of freezing of gait from parkin-son’s disease movement time series using conditional random fields”.In: Proceedings of the Third ACM SIGSPATIAL International Work-shop on the Use of GIS in Public Health, pp. 11–20, ACM, 2014.
[Bart 15] J. Barth, C. Oberndorfer, C. Pasluosta, S. Schülein, H. Gassner,S. Reinfelder, P. Kugler, D. Schuldhaus, J. Winkler, J. Klucken, andB. M. Eskofier. “Stride segmentation during free walk movementsusing multi-dimensional subsequence dynamic time warping on iner-tial sensor data”. Sensors (Switzerland), Vol. 15, No. 3, pp. 6419–6440, 2015.
[Bart 17] J. G. Barth. Development and Validation of a Mobile Gait Ana-lysis System Providing Clinically Relevant Target Parameters inParkinson’s Disease. PhD thesis, Friedrich-Alexander-UniversitätErlangen-Nürnberg, 2017.
[Baut 13] M. Bautista, A. Hernandez-Vela, V. Ponce, X. Perez-Sala, X. Bar,O. Pujol, C. Angulo, and S. Escalera. “Probability-based Dynamic
87

88 Bibliography
TimeWarping for Gesture Recognition on RGB-D data”. Adv. DepthImage Anal. Appl., Vol. 7854, pp. 126–135, 2013.
[Beck 61] A. T. Beck, C. Ward, M. Mendelson, J. Mock, and J. Erbaugh. “Beckdepression inventory (BDI)”. Arch Gen Psychiatry , Vol. 4, No. 6,pp. 561–571, 1961.
[Bego 19] E. Begoli, T. Bhattacharya, and D. Kusnezov. “The need for uncer-tainty quantification in machine-assisted medical decision making”.Nature Machine Intelligence, Vol. 1, No. 1, pp. 20–23, 2019.
[Beni 06] J. Benito-Leon and E. D. Louis. “Essential tremor: emerging viewsof a common disorder”. Nature clinical practice Neurology , Vol. 2,No. 12, pp. 666–678, 2006.
[Bilm 98] J. A. Bilmes. “A gentle tutorial of the EM algorithm and its app-lication to parameter estimation for Gaussian mixture and hiddenMarkov models”. International Computer Science Institute, Vol. 4,No. 510, p. 126, 1998.
[Blan 15] P. Blank, J. Hoßbach, D. Schuldhaus, and B. M. Eskofier. “Sensor-based stroke detection and stroke type classification in table tennis”.In: Proceedings of the 2015 ACM International Symposium on Wea-rable Computers , pp. 93–100, 2015.
[Bloe 19] B. Bloem, W. Marks, A. S. de Lima, M. Kuijf, T. van Laar, B. Ja-cobs, M. Verbeek, R. Helmich, B. van de Warrenburg, L. Evers, etal. “The Personalized Parkinson Project: examining disease progres-sion through broad biomarkers in early Parkinson’s disease”. BMCneurology , Vol. 19, No. 1, p. 160, 2019.
[Bobi 18] V. N. Bobić, M. D. Djurić-Jovièić, S. M. Radovanović, N. T. Dra-gaević, V. S. Kostić, and M. B. Popović. “Challenges of Stride Seg-mentation and Their Implementation for Impaired Gait”. In: 201840th Annual International Conference of the IEEE Engineering inMedicine and Biology Society (EMBC), pp. 2284–2287, IEEE, 2018.
[Bont 98] E. L. Bontrager. “Instrumented gait analysis (review of Instrumentedgait analysis systems)”. Gait Analysis in the Science of Rehabilita-tion, Vol. 2, p. 11, 1998.
[Brac 86] R. N. Bracewell and R. N. Bracewell. The Fourier transform andits applications . Vol. 31999, McGraw-Hill New York, 1986.
[Broe 13] M. Broeders, R. De Bie, D. C. Velseboer, J. D. Speelman, D. Musli-movic, and B. Schmand. “Evolution of mild cognitive impairment inParkinson disease”. Neurology , Vol. 81, No. 4, pp. 346–352, 2013.
[Buck 19] C. Buckley, L. Alcock, R. McArdle, R. Z. U. Rehman, S. Del Din,C. Mazzà, A. J. Yarnall, and L. Rochester. “The role of movementanalysis in diagnosing and monitoring neurodegenerative conditions:Insights from gait and postural control”. Brain sciences , Vol. 9,No. 2, p. 34, 2019.
[Burn 10] A. Burns, B. R. Greene, M. J. McGrath, T. J. O’Shea, B. Kuris,S. M. Ayer, F. Stroiescu, and V. Cionca. “SHIMMER–A wirelesssensor platform for noninvasive biomedical research”. IEEE SensorsJournal , Vol. 10, No. 9, pp. 1527–1534, 2010.

Bibliography 89
[Cara 18] C. Caramia, D. Torricelli, M. Schmid, A. Muñoz-Gonzalez,J. Gonzalez-Vargas, F. Grandas, and J. L. Pons. “IMU-Based Classi-fication of Parkinson’s Disease From Gait: A Sensitivity Analysis onSensor Location and Feature Selection”. IEEE journal of biomedicaland health informatics , Vol. 22, No. 6, pp. 1765–1774, 2018.
[Clif 12] L. Clifton, D. A. Clifton, M. A. Pimentel, P. J. Watkinson, and L. Ta-rassenko. “Gaussian processes for personalized e-health monitoringwith wearable sensors”. IEEE Transactions on Biomedical Enginee-ring , Vol. 60, No. 1, pp. 193–197, 2012.
[Cloe 08] T. Cloete and C. Scheffer. “Benchmarking of a full-body inertial mo-tion capture system for clinical gait analysis”. In: 2008 30th AnnualInternational Conference of the IEEE Engineering in Medicine andBiology Society , pp. 4579–4582, IEEE, 2008.
[Cohe 13] J. Cohen. Statistical power analysis for the behavioral sciences .Routledge, 2013.
[Crea 14] S. Crea, M. Donati, S. De Rossi, C. Oddo, and N. Vitiello. “A wirelessflexible sensorized insole for gait analysis”. Sensors , Vol. 14, No. 1,pp. 1073–1093, 2014.
[Cren 07a] P. Crenna, I. Carpinella, M. Rabuffetti, E. Calabrese, P. Mazzoleni,R. Nemni, and M. Ferrarin. “The association between impaired tur-ning and normal straight walking in Parkinson’s disease”. Gait &posture, Vol. 26, No. 2, pp. 172–178, 2007.
[Cren 07b] P. Crenna, I. Carpinella, M. Rabuffetti, E. Calabrese, P. Mazzoleni,R. Nemni, and M. Ferrarin. “The association between impaired tur-ning and normal straight walking in Parkinson’s disease”. Gait &posture, Vol. 26, No. 2, pp. 172–178, 2007.
[Dalr 10] J. Dalrymple-Alford, M. MacAskill, C. Nakas, L. Livingston, C. Gra-ham, G. Crucian, T. Melzer, J. Kirwan, R. Keenan, S. Wells, et al.“The MoCA: well-suited screen for cognitive impairment in Parkinsondisease”. Neurology , Vol. 75, No. 19, pp. 1717–1725, 2010.
[Dane 17] J.-F. Daneault, S. I. Lee, F. N. Golabchi, S. Patel, L. C. Shih, S. Paga-noni, and P. Bonato. “Estimating bradykinesia in Parkinson’s diseasewith a minimum number of wearable sensors”. In: Proceedings of thesecond IEEE/ACM international conference on connected health: ap-plications, systems and engineering technologies , pp. 264–265, IEEEPress, 2017.
[De V19] M. De Vos, J. Prince, T. Buchanan, J. FitzGerald, and C. A. An-toniades. “Discriminating Progressive Supranuclear Palsy from Par-kinson’s Disease using wearable technology”. medRxiv , p. 19006866,2019.
[Dera 10] M. O. Derawi, P. Bours, and K. Holien. “Improved Cycle Detectionfor Accelerometer Based Gait Authentication”. Sixth InternationalConference on Intelligent Information Hiding and Multimedia SignalProcessing , 2010.
[Diet 02] T. G. Dietterich. “Machine learning for sequential data: A review”.In: Joint IAPR International Workshops on Statistical Techniquesin Pattern Recognition (SPR) and Structural and Syntactic PatternRecognition (SSPR), pp. 15–30, Springer, 2002.

90 Bibliography
[Duon 05] T. V. Duong, H. H. Bui, D. Q. Phung, and S. Venkatesh. “Activi-ty recognition and abnormality detection with the switching hiddensemi-markov model”. In: 2005 IEEE Computer Society Conferenceon Computer Vision and Pattern Recognition (CVPR’05), pp. 838–845, IEEE, 2005.
[El A 18] A. El-Attar, A. S. Ashour, N. Dey, H. A. El-Kader, M. M. A. El-Naby,and F. Shi. “Hybrid DWT-FFT Features for Detecting Freezing ofGait in Parkinson’s Disease.”. In: ITITS , pp. 117–126, 2018.
[El G 14] M. El-Gohary, S. Pearson, J. McNames, M. Mancini, F. Horak,S. Mellone, and L. Chiari. “Continuous monitoring of turning in pati-ents with movement disability”. Sensors , Vol. 14, No. 1, pp. 356–369,2014.
[El M19] I. El Maachi, G.-A. Bilodeau, and W. Bouachir. “Deep 1D-Convnetfor accurate Parkinson disease detection and severity prediction fromgait”. Expert Systems with Applications , p. 113075, 2019.
[Esko 16] B. M. Eskofier, S. I. Lee, J.-F. Daneault, F. N. Golabchi, G. Ferreira-Carvalho, G. Vergara-Diaz, S. Sapienza, G. Costante, J. Klucken,T. Kautz, et al. “Recent machine learning advancements in sensor-based mobility analysis: Deep learning for Parkinson’s disease assess-ment”. In: 2016 38th Annual International Conference of the IEEEEngineering in Medicine and Biology Society (EMBC), pp. 655–658,IEEE, 2016.
[Esse 12] P. Esser, H. Dawes, J. Collett, M. G. Feltham, and K. Howells. “Va-lidity and inter-rater reliability of inertial gait measurements in Par-kinson’s disease: a pilot study”. Journal of neuroscience methods ,Vol. 205, No. 1, pp. 177–181, 2012.
[Fahn 87] S. Fahn. “Unified Parkinson’s disease rating scale”. Recent develop-ment in Parkinson’s disease, 1987.
[Fine 98] S. Fine, Y. Singer, and N. Tishby. “The hierarchical hidden Markovmodel: Analysis and applications”. Machine learning , Vol. 32, No. 1,pp. 41–62, 1998.
[Fox 01] J. Fox, D. Glasspool, and J. Bury. “Quantitative and qualitativeapproaches to reasoning under uncertainty in medical decision ma-king”. In: Conference on Artificial Intelligence in Medicine in Eu-rope, pp. 272–282, Springer, 2001.
[Futo 18] J. Futoma. Gaussian process-based models for clinical time series inhealthcare. PhD thesis, Duke University, 2018.
[Gada 19] M. Gadaleta, G. Cisotto, M. Rossi, R. Z. U. Rehman, L. Rochester,and S. Del Din. “Deep Learning Techniques for Improving DigitalGait Segmentation”. In: 2019 41st Annual International Conferenceof the IEEE Engineering in Medicine and Biology Society (EMBC),pp. 1834–1837, IEEE, 2019.
[GAIT] “GAITRite | World Leader in Temporospatial Gait Analysis”. htt-ps://www.gaitrite.com. Accessed: 2020-06-23.

Bibliography 91
[Galp 19] I. Galperin, I. Hillel, S. Del Din, E. M. Bekkers, A. Nieuwboer, G. Ab-bruzzese, L. Avanzino, F. Nieuwhof, B. R. Bloem, L. Rochester, et al.“Associations between daily-living physical activity and laboratory-based assessments of motor severity in patients with falls and Parkin-son’s disease”. Parkinsonism & related disorders , Vol. 62, pp. 85–90,2019.
[Gass 19] H. Gassner, C. Raccagni, B. M. Eskofier, J. Klucken, and G. K. Wen-ning. “The diagnostic scope of sensor-based gait analysis in atypicalParkinsonism: further observations”. Frontiers in neurology , Vol. 10,p. 5, 2019.
[Gers 99] F. A. Gers, J. Schmidhuber, and F. Cummins. “Learning to forget:Continual prediction with LSTM”. 1999.
[Ghah 01] Z. Ghahramani. “An introduction to hidden Markov models andBayesian networks”. International Journal of Pattern Recognitionand Artificial Intelligence, Vol. 15, No. 01, pp. 9–42, 2001.
[Ghah 94] Z. Ghahramani and M. I. Jordan. “Supervised learning from incom-plete data via an EM approach”. In: Advances in neural informationprocessing systems , pp. 120–127, 1994.
[Goet 04] C. G. Goetz, W. Poewe, O. Rascol, C. Sampaio, G. T. Stebbins,C. Counsell, N. Giladi, R. G. Holloway, C. G. Moore, G. K. Wenning,et al. “Movement Disorder Society Task Force report on the Hoehnand Yahr staging scale: status and recommendations the MovementDisorder Society Task Force on rating scales for Parkinson’s disease”.Movement disorders , Vol. 19, No. 9, pp. 1020–1028, 2004.
[Goet 07] C. G. Goetz, S. Fahn, P. Martinez-Martin, W. Poewe, C. Sampaio,G. T. Stebbins, M. B. Stern, B. C. Tilley, R. Dodel, B. Dubois, etal. “Movement Disorder Society-sponsored revision of the UnifiedParkinson’s Disease Rating Scale (MDS-UPDRS): process, format,and clinimetric testing plan”. Movement Disorders , Vol. 22, No. 1,pp. 41–47, 2007.
[Goet 08] C. G. Goetz, B. C. Tilley, S. R. Shaftman, G. T. Stebbins, S. Fahn,P. Martinez-Martin, W. Poewe, C. Sampaio, M. B. Stern, R. Dodel,et al. “Movement Disorder Society-sponsored revision of the UnifiedParkinson’s Disease Rating Scale (MDS-UPDRS): scale presentationand clinimetric testing results”. Movement disorders: official journalof the Movement Disorder Society , Vol. 23, No. 15, pp. 2129–2170,2008.
[Good 16] I. Goodfellow, Y. Bengio, and A. Courville. Deep learning . MITpress, 2016.
[Gouw09] D. Gouwanda and S. A. Senanayake. “Application of hybrid multi-resolution wavelet decomposition method in detecting human wal-king gait events”. In: International Conference of Soft Computingand Pattern Recognition, 2009. SOCPAR’09 , pp. 580–585, IEEE,2009.
[Gray 00] P. Gray and K. Hildebrand. “Fall risk factors in Parkinson’s disease”.Journal of Neuroscience Nursing , Vol. 32, No. 4, pp. 222–8, 2000.

92 Bibliography
[Grou 04] P. S. Group. “Levodopa and the progression of Parkinson’s disease”.New England Journal of Medicine, Vol. 351, No. 24, pp. 2498–2508,2004.
[Guer 05] G. Guerra-Filho. “Optical Motion Capture: Theory and Implemen-tation.”. RITA, Vol. 12, No. 2, pp. 61–90, 2005.
[Guyo 03] I. Guyon and A. Elisseeff. “An introduction to variable and featureselection”. Journal of machine learning research, Vol. 3, No. Mar,pp. 1157–1182, 2003.
[Haji 14] N. HajiGhassemi and M. Deisenroth. “Analytic long-term forecastingwith periodic Gaussian processes”. In: Artificial Intelligence andStatistics , pp. 303–311, 2014.
[Haji 16] N. Haji Ghassemi, F. Marxreiter, C. F. Pasluosta, P. Kugler, J. Schla-chetzki, A. Schramm, B. M. Eskofier, and J. Klucken. “Combined ac-celerometer and EMG analysis to differentiate essential tremor fromParkinson’s disease”. In: 2016 38th Annual International Conferenceof the IEEE Engineering in Medicine and Biology Society (EMBC),pp. 672–675, IEEE, 2016.
[Haji 18] N. Haji Ghassemi, J. Hannink, C. Martindale, H. Gaßner, M. Mül-ler, J. Klucken, and B. Eskofier. “Segmentation of gait sequences insensor-based movement analysis: a comparison of methods in Par-kinson’s disease”. Sensors , Vol. 18, No. 1, p. 145, 2018.
[Haji 19] N. Haji Ghassemi, J. Hannink, N. Roth, H. Gaßner, F. Marxreiter,J. Klucken, and B. M. Eskofier. “Turning Analysis during Standar-dized Test Using On-Shoe Wearable Sensors in Parkinson’s Disease”.Sensors , Vol. 19, No. 14, p. 3103, 2019.
[Hamm15] N. Y. Hammerla, J. Fisher, P. Andras, L. Rochester, R. Walker, andT. Plötz. “PD disease state assessment in naturalistic environmentsusing deep learning”. In: Twenty-Ninth AAAI Conference on Arti-ficial Intelligence, 2015.
[Hann 16] J. Hannink, T. Kautz, C. F. Pasluosta, J. Barth, S. Schülein, K.-G.Gaßmann, J. Klucken, and B. M. Eskofier. “Stride length estimationwith deep learning”. arXiv preprint arXiv:1609.03321 , 2016.
[Hann 17] J. Hannink, T. Kautz, C. Pasluosta, J. Barth, S. Schulein, K.-G.Gassmann, J. Klucken, and B. Eskofier. “Mobile Stride Length Esti-mation with Deep Convolutional Neural Networks”. IEEE Journalof Biomedical and Health Informatics , 2017.
[Hann 19] J. Hannink. Mobile Gait Analysis: From Prototype towards Cli-nical Grade Wearable. PhD thesis, Friedrich-Alexander-UniversitätErlangen-Nürnberg, 2019.
[Haq 18] A. U. Haq, J. Li, M. H. Memon, J. Khan, S. U. Din, I. Ahad, R. Sun,and Z. Lai. “Comparative analysis of the classification performanceof machine learning classifiers and deep neural network classifier forprediction of Parkinson disease”. In: 2018 15th International Compu-ter Conference on Wavelet Active Media Technology and InformationProcessing (ICCWAMTIP), pp. 101–106, IEEE, 2018.

Bibliography 93
[Herm11] T. Herman, N. Giladi, and J. M. Hausdorff. “Properties of the ‘timedup and go’test: more than meets the eye”. Gerontology , Vol. 57,No. 3, pp. 203–210, 2011.
[Hern 14] A. Hernández-Vela, M. Á. Bautista, X. Perez-Sala, V. Ponce-López,S. Escalera, X. Baró, O. Pujol, and C. Angulo. “Probability-baseddynamic time warping and bag-of-visual-and-depth-words for humangesture recognition in rgb-d”. Pattern Recognition Letters , Vol. 50,pp. 112–121, 2014.
[Hoeh 67] M. M. Hoehn and M. D. Yahr. “Parkinsonism: onset, progressionand mortality”. Neurology , Vol. 17, pp. 427–42, May 1967.
[Holt 07] G. A. ten Holt, M. J. Reinders, and E. A. Hendriks. “Multi-Dimensional Dynamic Time Warping for Gesture Recognition”. InThirteenth annual conference of the Advanced School for Computingand Imaging , 2007.
[Hong 09] M. Hong, J. S. Perlmutter, and G. M. Earhart. “A kinematic andelectromyographic analysis of turning in people with Parkinson’s di-sease”. Neurorehabilitation and neural repair , Vol. 23, No. 2, pp. 166–176, 2009.
[Hong 10] M. Hong and G. M. Earhart. “Effects of medication on turning defi-cits in individuals with Parkinson’s disease”. Journal of neurologicphysical therapy: JNPT , Vol. 34, No. 1, p. 11, 2010.
[Hssa 18] M. D. Hssayeni, J. L. Adams, and B. Ghoraani. “Deep Learning forMedication Assessment of Individuals with Parkinson’s Disease UsingWearable Sensors”. In: 2018 40th Annual International Conferenceof the IEEE Engineering in Medicine and Biology Society (EMBC),pp. 1–4, IEEE, 2018.
[Hugh 92a] A. J. Hughes, S. E. Daniel, L. Kilford, and A. J. Lees. “Accura-cy of clinical diagnosis of idiopathic Parkinson’s disease: a clinico-pathological study of 100 cases.”. Journal of Neurology, Neurosur-gery & Psychiatry , Vol. 55, No. 3, pp. 181–184, 1992.
[Hugh 92b] A. J. Hughes, S. E. Daniel, L. Kilford, and A. J. Lees. “Accura-cy of clinical diagnosis of idiopathic Parkinson’s disease: a clinico-pathological study of 100 cases.”. Journal of Neurology, Neurosur-gery & Psychiatry , Vol. 55, No. 3, pp. 181–184, 1992.
[Hund 14] S. R. Hundza, W. R. Hook, C. R. Harris, S. V. Mahajan, P. A.Leslie, C. A. Spani, L. G. Spalteholz, B. J. Birch, D. T. Commandeur,and N. J. Livingston. “Accurate and reliable gait cycle detection inParkinson’s disease”. IEEE Transactions on Neural Systems andRehabilitation Engineering , Vol. 22, No. 1, pp. 127–137, 2014.
[Huxh 08a] F. Huxham, R. Baker, M. E. Morris, and R. Iansek. “Footstep ad-justments used to turn during walking in Parkinson’s disease”. Mo-vement Disorders , Vol. 23, No. 6, pp. 817–823, 2008.
[Huxh 08b] F. Huxham, R. Baker, M. E. Morris, and R. Iansek. “Head and trunkrotation during walking turns in Parkinson’s disease”. Movementdisorders: official journal of the Movement Disorder Society , Vol. 23,No. 10, pp. 1391–1397, 2008.

94 Bibliography
[Ilia 17] T. Ilias, B. Filip, C. Radu, N. Dag, S. Marina, and M. Mevludin.“Using measurements from wearable sensors for automatic scoring ofParkinson’s disease motor states: Results from 7 patients”. In: 201739th Annual International Conference of the IEEE Engineering inMedicine and Biology Society (EMBC), pp. 131–134, IEEE, 2017.
[Jank 08] J. Jankovic. “Parkinson’s disease: clinical features and diagnosis”.Journal of neurology, neurosurgery & psychiatry , Vol. 79, No. 4,pp. 368–376, 2008.
[Jank 90] J. Jankovic, M. McDermott, J. Carter, S. Gauthier, C. Goetz, L. Gol-be, S. Huber, W. Koller, C. Olanow, I. Shoulson, et al. “Variableexpression of Parkinson’s disease: A base-line analysis of the DATATOP cohort”. Neurology , Vol. 40, No. 10, pp. 1529–1529, 1990.
[Jarc 14] D. Jarchi, C. Wong, R. M. Kwasnicki, B. Heller, G. A. Tew, and G.-Z. Yang. “Gait parameter estimation from a miniaturized ear-wornsensor using singular spectrum analysis and longest common subse-quence”. IEEE Transactions on Biomedical Engineering , Vol. 61,No. 4, pp. 1261–1273, 2014.
[Jord 07] K. Jordan, J. H. Challis, and K. M. Newell. “Walking speed influenceson gait cycle variability”. Gait & posture, Vol. 26, No. 1, pp. 128–134,2007.
[JOUR] “JOURNAL OF Biomedical And Health Informatics”. htt-ps://www.embs.org/jbhi/. Accessed: 2020-06-23.
[Jung 18] A. Jungo, R. Meier, E. Ermis, M. Blatti-Moreno, E. Herrmann,R. Wiest, and M. Reyes. “On the effect of inter-observer variabilityfor a reliable estimation of uncertainty of medical image segmentati-on”. In: International Conference on Medical Image Computing andComputer-Assisted Intervention, pp. 682–690, Springer, 2018.
[Kang 08] H. G. Kang and J. B. Dingwell. “Separating the effects of age andwalking speed on gait variability”. Gait & Posture, Vol. 27, pp. 572–577, 2008.
[Kanz 16] C. M. Kanzler, J. Barth, J. Klucken, and B. M. Eskofier. “Inertial sen-sor based gait analysis discriminates subjects with and without visualimpairment caused by simulated macular degeneration”. In: 201638th Annual International Conference of the IEEE Engineering inMedicine and Biology Society (EMBC), pp. 4979–4982, IEEE, 2016.
[Khan 14] S. Khandelwal and N. Wickstrom. “Identification of Gait Eventsusing Expert Knowledge and Continuous Wavelet Transform Analy-sis”. In Proceedings of the International Conference on Bio-inspiredSystems and Signal Processing , pp. 197–204, 2014.
[Khur 15] T. Khurelbaatar, K. Kim, S. Lee, and Y. H. Kim. “Consistent ac-curacy in whole-body joint kinetics during gait using wearable iner-tial motion sensors and in-shoe pressure sensors”. Gait & posture,Vol. 42, No. 1, pp. 65–69, 2015.
[Kidz 19] Ł. Kidziński, S. Delp, and M. Schwartz. “Automatic real-time gaitevent detection in children using deep neural networks”. PloS one,Vol. 14, No. 1, p. e0211466, 2019.

Bibliography 95
[King 12] L. A. King, M. Mancini, K. Priest, A. Salarian, F. Rodrigues-de Pau-la, and F. Horak. “Do clinical scales of balance reflect turning abnor-malities in people with Parkinson’s disease?”. Journal of NeurologicPhysical Therapy , Vol. 36, No. 1, p. 25, 2012.
[Kluc 13] J. Klucken, J. Barth, P. Kugler, J. Schlachetzki, T. Henze, F. Marx-reiter, Z. Kohl, R. Steidl, J. Hornegger, B. Eskofier, and J. Winkler.“Unbiased and Mobile Gait Analysis Detects Motor Impairment inParkinson’s Disease”. PLoS ONE , Vol. 8, 2013.
[Klug 17a] F. Kluge, H. Gaßner, J. Hannink, C. Pasluosta, J. Klucken, and B. M.Eskofier. “Towards mobile gait analysis: concurrent validity and test-retest reliability of an inertial measurement system for the assessmentof spatio-temporal gait parameters”. Sensors , Vol. 17, No. 7, p. 1522,2017.
[Klug 17b] F. Kluge, S. Krinner, M. Lochmann, and B. M. Eskofier. “Speeddependent effects of laterally wedged insoles on gait biomechanics inhealthy subjects”. Gait & Posture, Vol. 55, pp. 145–149, 2017.
[Kuss 05] M. Kuss and C. E. Rasmussen. “Assessing approximate inference forbinary Gaussian process classification”. Journal of machine learningresearch, Vol. 6, No. Oct, pp. 1679–1704, 2005.
[Lara 12] O. D. Lara and M. A. Labrador. “A survey on human activity re-cognition using wearable sensors”. IEEE communications surveys &tutorials , Vol. 15, No. 3, pp. 1192–1209, 2012.
[Leac 18] J. M. Leach, S. Mellone, P. Palumbo, S. Bandinelli, and L. Chiari.“Natural turn measures predict recurrent falls in community-dwellingolder adults: a longitudinal cohort study”. Scientific reports , Vol. 8,No. 1, pp. 1–9, 2018.
[LeCu 15] Y. LeCun, Y. Bengio, and G. Hinton. “Deep learning”. Nature,Vol. 521, No. 7553, pp. 436–444, 2015.
[LeCu 90] Y. LeCun, B. E. Boser, J. S. Denker, D. Henderson, R. E. Howard,W. E. Hubbard, and L. D. Jackel. “Handwritten digit recognitionwith a back-propagation network”. In: Advances in neural informa-tion processing systems , pp. 396–404, 1990.
[Legg 95] C. J. Leggetter and P. C. Woodland. “Maximum likelihood linear re-gression for speaker adaptation of continuous density hidden Markovmodels”. Computer Speech & Language, Vol. 9, No. 2, pp. 171–185,1995.
[Leut 13] H. Leutheuser, D. Schuldhaus, and B. M. Eskofier. “Hierarchical,multi-sensor based classification of daily life activities: comparisonwith state-of-the-art algorithms using a benchmark dataset”. PloSone, Vol. 8, No. 10, 2013.
[Libb 08] R. Libby. “A simple method for reliable footstep detection on em-bedded sensor platforms”. Sensors (Peterborough, NH), Vol. 116,2008.
[Lieb 10] D. E. Lieberman, M. Venkadesan, W. A. Werbel, A. I. Daoud,S. D’andrea, I. S. Davis, R. O. Mang’Eni, and Y. Pitsiladis. “Footstrike patterns and collision forces in habitually barefoot versus shodrunners”. Nature, Vol. 463, No. 7280, p. 531, 2010.

96 Bibliography
[Luek 19] M. Lueken, W. ten Kate, J. P. Batista, C. Ngo, C. Bollheimer, andS. Leonhardt. “Peak Detection Algorithm for Gait Segmentationin Long-Term Monitoring for Stride Time Estimation using InertialMeasurement Sensors”. In: 2019 IEEE EMBS International Con-ference on Biomedical & Health Informatics (BHI), pp. 1–4, IEEE,2019.
[Maet 16] W. Maetzler, J. Klucken, and M. Horne. “A clinical view on the deve-lopment of technology-based tools in managing Parkinson’s disease”.Movement Disorders , Vol. 31, No. 9, pp. 1263–1271, 2016.
[Mahl 13] P. Mahlknecht, S. Kiechl, B. R. Bloem, J. Willeit, C. Scherfler,A. Gasperi, G. Rungger, W. Poewe, and K. Seppi. “Prevalence andburden of gait disorders in elderly men and women aged 60–97 years:a population-based study”. PLoS One, Vol. 8, No. 7, p. e69627, 2013.
[Mak 08] M. K. Mak, A. Patla, and C. Hui-Chan. “Sudden turn during walkingis impaired in people with Parkinson’s disease”. Experimental brainresearch, Vol. 190, No. 1, pp. 43–51, 2008.
[Manc 18a] M. Mancini, C. Curtze, S. Stuart, M. El-Gohary, J. G. Nutt, F. B.Horak, et al. “The impact of freezing of gait on balance perceptionand mobility in community-living with Parkinson’s disease”. In: 201840th Annual International Conference of the IEEE Engineering inMedicine and Biology Society (EMBC), pp. 3040–3043, IEEE, 2018.
[Manc 18b] M. Mancini, A. Weiss, T. Herman, and J. M. Hausdorff. “Turn aroundfreezing: community-living turning behavior in people with Parkin-son’s disease”. Frontiers in neurology , Vol. 9, p. 18, 2018.
[Manc 19] M. Mancini, B. R. Bloem, F. B. Horak, S. J. Lewis, A. Nieuwboer,and J. Nonnekes. “Clinical and methodological challenges for asses-sing freezing of gait: Future perspectives”. Movement Disorders ,Vol. 34, No. 6, pp. 783–790, 2019.
[Mann 11] A. Mannini and A. M. Sabatini. “A hidden Markov model-basedtechnique for gait segmentation using a foot-mounted gyroscope”. In:Engineering in Medicine and Biology Society (EMBC), 33th AnnualInternational Conference of the IEEE , pp. 4369–4373, 2011.
[Mann 12] A. Mannini and A. M. Sabatini. “Gait phase detection and discrimi-nation between walking–jogging activities using hidden Markov mo-dels applied to foot motion data from a gyroscope”. Gait & posture,Vol. 36, No. 4, pp. 657–661, 2012.
[Mari 10] B. Mariani, C. Hoskovec, S. Rochat, C. Büla, J. Penders, and K. Ami-nian. “3D gait assessment in young and elderly subjects using foot-worn inertial sensors”. Journal of biomechanics , Vol. 43, No. 15,pp. 2999–3006, 2010.
[Mari 13] B. Mariani, M. C. Jiménez, F. J. Vingerhoets, and K. Aminian. “On-shoe wearable sensors for gait and turning assessment of patientswith Parkinson’s disease”. IEEE Transactions on Biomedical Engi-neering , Vol. 60, No. 1, pp. 155–158, 2013.
[Mart 17] C. F. Martindale, M. Strauss, H. Gaßner, J. List, M. Müller, J. Klu-cken, Z. Kohl, and B. M. Eskofier. “Segmentation of Gait Sequences

Bibliography 97
using Inertial Sensor Data in Hereditary Spastic Paraplegia”. In Pro-ceedings of the International Conference of the IEEE Engineering inMedicine and Biology Society (EMBC), 2017.
[Mazi 13] S. Mazilu, A. Calatroni, E. Gazit, D. Roggen, J. M. Hausdorff, andG. Tröster. “Feature learning for detection and prediction of freezingof gait in Parkinson’s disease”. In: International workshop on ma-chine learning and data mining in pattern Recognition, pp. 144–158,Springer, 2013.
[Mazi 16] S. Mazilu, U. Blanke, A. Calatroni, E. Gazit, J. M. Hausdorff, andG. Tröster. “The role of wrist-mounted inertial sensors in detectinggait freeze episodes in Parkinson’s disease”. Pervasive and MobileComputing , Vol. 33, pp. 1–16, 2016.
[McDo 01] A. L. McDonough, M. Batavia, F. C. Chen, S. Kwon, and J. Ziai.“The validity and reliability of the GAITRite system’s measurements:A preliminary evaluation”. Archives of physical medicine and reha-bilitation, Vol. 82, No. 3, pp. 419–425, 2001.
[Mell 16] S. Mellone, M. Mancini, L. A. King, F. B. Horak, and L. Chiari. “Thequality of turning in Parkinson’s disease: a compensatory strategyto prevent postural instability?”. Journal of neuroengineering andrehabilitation, Vol. 13, No. 1, p. 39, 2016.
[Mile 18] I. Mileti, M. Germanotta, E. Di Sipio, I. Imbimbo, A. Pacilli, C. Erra,M. Petracca, S. Rossi, Z. Del Prete, A. Bentivoglio, et al. “Measu-ring gait quality in Parkinson’s disease through real-time gait phaserecognition”. Sensors , Vol. 18, No. 3, p. 919, 2018.
[Mink 13] T. P. Minka. “Expectation propagation for approximate Bayesianinference”. arXiv preprint arXiv:1301.2294 , 2013.
[Moha 18] N. Mohammadian Rad, T. van Laarhoven, C. Furlanello, and E. Mar-chiori. “Novelty Detection using Deep Normative Modeling for IMU-Based Abnormal Movement Monitoring in Parkinson’s Disease andAutism Spectrum Disorders”. Sensors , Vol. 18, No. 10, p. 3533,2018.
[Mull 07] M. Müller. “Dynamic time warping”. Information Retrieval forMusic and Motion, pp. 69–84, 2007.
[Munh 04] R. Munhoz, J.-Y. Li, M. Kurtinecz, P. Piboolnurak, A. Constantino,S. Fahn, and A. Lang. “Evaluation of the pull test technique inassessing postural instability in Parkinson’s disease”. Neurology ,Vol. 62, No. 1, pp. 125–127, 2004.
[Murp 12] K. P. Murphy. Machine learning: a probabilistic perspective. MITpress, 2012.
[Naja 03] B. Najafi, K. Aminian, A. Paraschiv-Ionescu, F. Loew, C. J. Bula,and P. Robert. “Ambulatory system for human motion analysis usinga kinematic sensor: monitoring of daily physical activity in the elder-ly”. IEEE Transactions on biomedical Engineering , Vol. 50, No. 6,pp. 711–723, 2003.
[Nata 07] P. Natarajan and R. Nevatia. “Coupled hidden semi markov modelsfor activity recognition”. In: 2007 IEEE Workshop on Motion andVideo Computing (WMVC’07), pp. 10–10, IEEE, 2007.

98 Bibliography
[Nguy 19] A. Nguyen, N. Roth, N. H. Ghassemi, J. Hannink, T. Seel, J. Klucken,H. Gassner, and B. M. Eskofier. “Development and clinical valida-tion of inertial sensor-based gait-clustering methods in Parkinson’sdisease”. Journal of NeuroEngineering and Rehabilitation, Vol. 16,No. 1, p. 77, 2019.
[Oppe 00] M. Opper and O. Winther. “Gaussian processes for classificati-on: Mean-field algorithms”. Neural computation, Vol. 12, No. 11,pp. 2655–2684, 2000.
[Our ] “Our data-driven future in healthcare; People and partnerships atthe heart of health related technologies”. https://acmedsci.ac.uk/file-download/74634438. Accessed: 2020-06-23.
[Pan 12] S. Pan, S. Iplikci, K. Warwick, and T. Z. Aziz. “Parkinson’s Diseasetremor classification–A comparison between Support Vector Machi-nes and neural networks”. Expert Systems with Applications , Vol. 39,No. 12, pp. 10764–10771, 2012.
[Pana 13] G. Panahandeh, N. Mohammadiha, A. Leijon, and P. Handel. “Con-tinuous Hidden Markov Model for Pedestrian Activity Classificationand Gait Analysis”. IEEE Transactions on Instrumentation andMeasurement , Vol. 62, No. 5, pp. 1073–1083, 2013.
[Pane 18] G. P. Panebianco, M. C. Bisi, R. Stagni, and S. Fantozzi. “Analysis ofthe performance of 17 algorithms from a systematic review: Influenceof sensor position, analysed variable and computational approach ingait timing estimation from IMU measurements”. Gait & posture,Vol. 66, pp. 76–82, 2018.
[Pard 19] S. Pardoel, J. Kofman, J. Nantel, and E. D. Lemaire. “Wearable-Sensor-based Detection and Prediction of Freezing of Gait in Par-kinson’s Disease: A Review”. Sensors , Vol. 19, No. 23, p. 5141,2019.
[Park 17] J. Parkinson. “An essay on the shaking palsy.”. London, U.K.: Neely& Jones , 1817.
[Pasl 15] C. F. Pasluosta, H. Gassner, J. Winkler, J. Klucken, and B. M. Es-kofier. “An emerging era in the management of Parkinson’s disease:wearable technologies and the internet of things”. IEEE Journal ofBiomedical and Health Informatics , Vol. 19, No. 6, pp. 1873–1881,2015.
[Pfau 08] T. Pfau, M. Ferrari, K. Parsons, and A. Wilson. “A hidden Markovmodel-based stride segmentation technique applied to equine inertialsensor trunk movement data”. Journal of Biomechanics , Vol. 41,No. 1, pp. 216–220, 2008.
[Pick 07] R. M. Pickering, Y. A. Grimbergen, U. Rigney, A. Ashburn, G. Ma-zibrada, B. Wood, P. Gray, G. Kerr, and B. R. Bloem. “A meta-analysis of six prospective studies of falling in Parkinson’s disease”.Movement Disorders , Vol. 22, No. 13, pp. 1892–1900, 2007.
[Pime 13] M. Pimentel, D. Clifton, L. Clifton, and L. Tarassenko. “Modellingpatient time-series data from electronic health records using Gaus-sian processes”. In: Adv Neural Inf Process Syst Workshop MachLearn Clin Data Anal , pp. 1–4, 2013.

Bibliography 99
[Pirk 17] W. Pirker and R. Katzenschlager. “Gait disorders in adults and theelderly”. Wiener Klinische Wochenschrift , Vol. 129, No. 3-4, pp. 81–95, 2017.
[Pitt 18] B. Pittman, R. H. Ghomi, and D. Si. “Parkinson’s Disease Classi-fication of mPower Walking Activity Participants”. In: 2018 40thAnnual International Conference of the IEEE Engineering in Medi-cine and Biology Society (EMBC), pp. 4253–4256, IEEE, 2018.
[Pods 91] D. Podsiadlo and S. Richardson. “The timed Up & Go: a test ofbasic functional mobility for frail elderly persons”. Journal of theAmerican Geriatrics Society , Vol. 39, No. 2, pp. 142–8, 1991.
[Pola 19] K. Polat. “A Hybrid Approach to Parkinson Disease Classificati-on Using Speech Signal: The Combination of SMOTE and RandomForests”. In: 2019 Scientific Meeting on Electrical-Electronics & Bio-medical Engineering and Computer Science (EBBT), pp. 1–3, IEEE,2019.
[Prze 17] S. Przedborski. “The two-century journey of Parkinson disease rese-arch”. Nature Reviews Neuroscience, Vol. 18, No. 4, p. 251, 2017.
[Rabi 86] L. Rabiner and B. Juang. “An introduction to hidden Markov mo-dels”. IEEE ASSP Magazine, Vol. 3, No. 1, pp. 4–16, 1986.
[Rama 02] C. Ramaker, J. Marinus, A. M. Stiggelbout, and B. J. Van Hilten.“Systematic evaluation of rating scales for impairment and disabilityin Parkinson’s disease”. Movement disorders: official journal of theMovement Disorder Society , Vol. 17, No. 5, pp. 867–876, 2002.
[Ramp15] A. Rampp, J. Barth, S. Schülein, K.-G. Gaßmann, J. Klucken, andB. M. Eskofier. “Inertial Sensor-Based Stride Parameter CalculationFrom Gait Sequences in Geriatric Patients”. IEEE Transactions onBiomedical Engineering , Vol. 62, No. 4, pp. 1089–1097, 2015.
[Rasm10] C. E. Rasmussen and H. Nickisch. “Gaussian processes for machinelearning (GPML) toolbox”. Journal of machine learning research,Vol. 11, No. Nov, pp. 3011–3015, 2010.
[Rebu 13] J. R. Rebula, L. V. Ojeda, P. G. Adamczyk, and A. D. Kuo. “Mea-surement of foot placement and its variability with inertial sensors”.Gait & posture, Vol. 38, No. 4, pp. 974–980, 2013.
[Reye 19] J. F. Reyes, J. S. Montealegre, Y. J. Castano, C. Urcuqui, and A. Na-varro. “LSTM and Convolution Networks exploration for Parkinson’sDiagnosis”. In: 2019 IEEE Colombian Conference on Communica-tions and Computing (COLCOM), pp. 1–4, IEEE, 2019.
[Reyn 09] D. A. Reynolds. “Gaussian Mixture Models.”. Encyclopedia of bio-metrics , Vol. 741, 2009.
[Reyn 99] N. C. Reynolds Jr, J. B. Myklebust, T. E. Prieto, and B. M. Mykle-bust. “Analysis of gait abnormalities in Huntington disease”. Archi-ves of physical medicine and rehabilitation, Vol. 80, No. 1, pp. 59–65,1999.
[Rich 94] M. Richards, K. Marder, L. Cote, and R. Mayeux. “Interrater relia-bility of the unified Parkinson’s disease rating scale motor examina-tion”. Movment Disorders , Vol. 9, pp. 89–91, Jan 1994.

100 Bibliography
[Roth 18] N. Roth, C. F. Martindale, B. M. Eskofier, H. Gaßner, Z. Kohl, andJ. Klucken. “Synchronized sensor insoles for clinical gait analysis inhome-monitoring applications”. Current Directions in BiomedicalEngineering , Vol. 4, No. 1, pp. 433–437, 2018.
[Ryde 19] L. E. Ryden and S. J. Lewis. “Parkinson’s Disease in the Era ofPersonalised Medicine: One Size Does Not Fit All”. Drugs & aging ,Vol. 36, No. 2, pp. 103–113, 2019.
[Saba 15] A. M. Sabatini, G. Ligorio, and A. Mannini. “Fourier-based integra-tion of quasi-periodic gait accelerations for drift-free displacementestimation using inertial sensors”. Biomedical engineering online,Vol. 14, No. 1, p. 106, 2015.
[Sait 04] N. Saito, T. Yamamoto, Y. Sugiura, S. Shimizu, and M. Shimizu.“Lifecorder: a new device for the long-term monitoring of motor ac-tivities for Parkinson’s disease”. Internal Medicine, Vol. 43, No. 8,pp. 685–692, 2004.
[Sala 04] A. Salarian, H. Russmann, F. J. Vingerhoets, C. Dehollain, Y. Blanc,P. R. Burkhard, and K. Aminian. “Gait assessment in Parkin-son’s disease: toward an ambulatory system for long-term monito-ring”. IEEE Transactions on Biomedical Engineering , Vol. 51, No. 8,pp. 1434–1443, 2004.
[Sala 09] A. Salarian, C. Zampieri, F. B. Horak, P. Carlson-Kuhta, J. G. Nutt,and K. Aminian. “Analyzing 180 degree turns using an inertial sys-tem reveals early signs of progression of parkinson’s disease”. In:2009 Annual International Conference of the IEEE Engineering inMedicine and Biology Society , pp. 224–227, IEEE, 2009.
[Sala 10] A. Salarian, F. B. Horak, C. Zampieri, P. Carlson-Kuhta, J. G. Nutt,and K. Aminian. “iTUG, a sensitive and reliable measure of mo-bility”. IEEE Transactions on Neural Systems and RehabilitationEngineering , Vol. 18, No. 3, pp. 303–310, 2010.
[Schl 17] J. C. Schlachetzki, J. Barth, F. Marxreiter, J. Gossler, Z. Kohl,S. Reinfelder, H. Gassner, K. Aminian, B. M. Eskofier, J. Wink-ler, et al. “Wearable sensors objectively measure gait parameters inParkinson’s disease”. PloS one, Vol. 12, No. 10, p. e0183989, 2017.
[Scho 02] B. Schölkopf, A. J. Smola, F. Bach, et al. Learning with kernels:support vector machines, regularization, optimization, and beyond .MIT press, 2002.
[Schr 00] A. Schrag, M. Jahanshahi, and N. Quinn. “How does Parkinson’sdisease affect quality of life? A comparison with quality of life in thegeneral population”. Movement Disorders , Vol. 15, No. 6, pp. 1112–8, 2000.
[Schr 07] A. Schrag, P. Barone, R. G. Brown, A. F. Leentjens, W. M. McDo-nald, S. Starkstein, D. Weintraub, W. Poewe, O. Rascol, C. Sampaio,et al. “Depression rating scales in Parkinson’s disease: critique andrecommendations”. Movement disorders , Vol. 22, No. 8, pp. 1077–1092, 2007.

Bibliography 101
[Sell 05] R. W. Selles, M. A. G. Formanoy, J. B. J. Bussmann, P. J. Janssens,and H. J. Stam. “Automated Estimation of Initial and TerminalContact Timing Using Accelerometers ; Development and Validationin Transtibial Amputees and Controls”. IEEE Transaction on NeuralSystems and Rehabilitation Engineering , Vol. 13, No. 1, pp. 81–88,2005.
[Silv 20] L. M. Silva and N. Stergiou. “The basics of gait analysis”. Biome-chanics and Gait Analysis , Vol. 164, p. 231, 2020.
[Snij 07] A. H. Snijders, B. P. Van DeWarrenburg, N. Giladi, and B. R. Bloem.“Neurological gait disorders in elderly people: clinical approach andclassification”. The Lancet Neurology , Vol. 6, No. 1, pp. 63–74, 2007.
[Stac 04] E. Stack, K. Jupp, and A. Ashburn. “Developing methods to evaluatehow people with Parkinson’s Disease turn 180: an activity frequentlyassociated with falls”. Disability and rehabilitation, Vol. 26, No. 8,pp. 478–484, 2004.
[Stac 06] E. L. Stack, A. M. Ashburn, and K. E. Jupp. “Strategies used bypeople with Parkinson’s disease who report difficulty turning”. Par-kinsonism & related disorders , Vol. 12, No. 2, pp. 87–92, 2006.
[Stac 08] E. Stack and A. Ashburn. “Dysfunctional turning in Parkinson’sdisease”. Disability and rehabilitation, Vol. 30, No. 16, pp. 1222–1229, 2008.
[Stei 11] S. Steidl, K. Riedhammer, T. Bocklet, H. Florian, and E. Nöth. “JavaVisual Speech Components for Rapid Application Development ofGUI based Speech Processing Applications”. in INTERSPEECH2011, 12th Annu. Conf. Int. Speech Commun. Assoc., 2011.
[Tolo 06] E. Tolosa, G. Wenning, and W. Poewe. “The diagnosis of Parkinson’sdisease”. The Lancet Neurology , Vol. 5, No. 1, pp. 75–86, 2006.
[Troj 14] D. Trojaniello, A. Cereatti, E. Pelosin, L. Avanzino, A. Mirelman,J. M. Hausdorff, and U. Della Croce. “Estimation of step-by-stepspatio-temporal parameters of normal and impaired gait using shank-mounted magneto-inertial sensors: application to elderly, hemipare-tic, parkinsonian and choreic gait”. Journal of neuroengineering andrehabilitation, Vol. 11, No. 1, p. 152, 2014.
[Vasq 18] J. C. Vasquez-Correa, T. Arias-Vergara, J. Orozco-Arroyave, B. M.Eskofier, J. Klucken, and E. Noth. “Multimodal assessment of Parkin-son’s disease: a deep learning approach”. IEEE journal of biomedicaland health informatics , 2018.
[Vaug 99] C. Vaughan, B. Davis, and J. O’connor. “Dynamics of human gait.”.Cape Town: Kiboho Publishers , 1999.
[Vite 67] A. Viterbi. “Error bounds for convolutional codes and an asympto-tically optimum decoding algorithm”. IEEE Transactions on Infor-mation Theory , Vol. 13, No. 2, pp. 260–269, 1967.
[Wahi 15] F. Wahid, R. K. Begg, C. J. Hass, S. Halgamuge, and D. C. Ackland.“Classification of Parkinson’s disease gait using spatial-temporal gaitfeatures”. IEEE journal of biomedical and health informatics ,Vol. 19, No. 6, pp. 1794–1802, 2015.

102 Bibliography
[Webs 05] K. E. Webster, J. E. Wittwer, and J. A. Feller. “Validity of theGAITRite® walkway system for the measurement of averaged andindividual step parameters of gait”. Gait & posture, Vol. 22, No. 4,pp. 317–321, 2005.
[Whit 14] M. W. Whittle. Gait analysis: an introduction. Butterworth-Heinemann, 2014.
[Will 06] C. K. Williams and C. E. Rasmussen. Gaussian processes for ma-chine learning . Vol. 2, MIT press Cambridge, MA, 2006.
[Wink 11] J. Winkler, R. Ehret, T. Büttner, U. Dillmann, W. Fogel, M. Sabolek,J. Winkelmann, and J. Kassubek. “Parkinson’s disease risk score:moving to a premotor diagnosis”. Journal of neurology , Vol. 258,No. 2, p. 311, 2011.
[Wint 91] D. A. Winter. Biomechanics and motor control of human gait: nor-mal, elderly and pathological . 1991.
[Zamp 11] C. Zampieri, A. Salarian, P. Carlson-Kuhta, J. G. Nutt, and F. B.Horak. “Assessing mobility at home in people with early Parkinson’sdisease using an instrumented Timed Up and Go test”. Parkinsonism& related disorders , Vol. 17, No. 4, pp. 277–280, 2011.
[Zhan 18] A. Zhang, R. San-Segundo, S. Panev, G. Tabor, K. Stebbins,A. Whitford, F. De la Torre, and J. Hodgins. “Automated Tre-mor Detection in Parkinson’s Disease Using Accelerometer Signals”.In: 2018 IEEE/ACM International Conference on Connected He-alth: Applications, Systems and Engineering Technologies (CHASE),pp. 13–14, IEEE, 2018.
[Zhao 18] A. Zhao, L. Qi, J. Li, J. Dong, and H. Yu. “A hybrid spatio-temporalmodel for detection and severity rating of Parkinson’s Disease fromgait data”. Neurocomputing , Vol. 315, pp. 1–8, 2018.
[Zia 16] J. Zia, A. Tadayon, T. McDaniel, and S. Panchanathan. “Utilizingneural networks to predict freezing of gait in parkinson’s patients”. In:Proceedings of the 18th International ACM SIGACCESS Conferenceon Computers and Accessibility , pp. 333–334, ACM, 2016.
[Zung 65] W. W. Zung. “A self-rating depression scale”. Archives of generalpsychiatry , Vol. 12, No. 1, pp. 63–70, 1965.
Total number references: 189