DalSpace - Dalhousie University
315
Age-Related Changes in Cognitive, Emotional, and Motor Behaviour in Male and Female 3xTg-AD Mice: A Longitudinal Study by Kurt Robert James Stover Submitted in partial fulfilment of the requirements for the degree of Doctor of Philosophy at Dalhousie University Halifax, Nova Scotia May 2015 © Copyright by Kurt Robert James Stover, 2015
-
Upload
khangminh22 -
Category
Documents
-
view
0 -
download
0
Transcript of DalSpace - Dalhousie University
Age-Related Changes in Cognitive, Emotional, and Motor Behaviour in Male and Female 3xTg-AD Mice: A Longitudinal
Study
by
Kurt Robert James Stover
Submitted in partial fulfilment of the requirements
for the degree of Doctor of Philosophy
at
Dalhousie University
Halifax, Nova Scotia
May 2015
© Copyright by Kurt Robert James Stover, 2015

ii
TABLE OF CONTENTS
LIST OF TABLES .................................................................... xii
LIST OF FIGURES ................................................................ xvii
ABSTRACT...... ..................................................................... xxii
LIST OF ABBRIVIATIONS USED .......................................... xxiii
ACKNOWLEDGMENTS .......................................................... xxv
CHAPTER 1 INTRODUCTION ................................................ 1
1.1 ALZHEIMER’S DISEASE ................................................... 1
1.1.1 Overview and Impact .................................................... 1
1.1.1.1 Brief description of history, symptoms, and progression of AD. .... 1
1.1.1.2 Prevalence by age .................................................................... 1
1.1.1.3 Economic impact of the disease in Canada and the world ............ 1
1.1.2 Behavioural Symptoms ................................................. 2
1.1.2.1 Cognitive Deficits ...................................................................... 2
1.1.2.2 Neuropsychological Symptoms .................................................. 2
1.1.2.5 Motor Behaviour ....................................................................... 3
1.1.3 NEUROPATHOLOGY ...................................................... 3
1.1.3.1 Aβ pathology ............................................................................ 3
1.1.3.1 What is Aβ, and how does the pathology develop? ................... 3
1.1.3.2 Progression of Aβ pathology ..................................................... 4
1.1.3.2 Tau pathology .......................................................................... 5
1.1.3.2.1 What are neurofibrillary tangles and how are they made? ...... 5
1.1.3.2.2 Progression of tau pathology .................................................. 5
1.1.3.3 Other Neurodegeneration .......................................................... 6
iii
1.1.4 Genetic and Environmental Risk Factors .......................... 6
1.1.5 Proposed Causes of Alzheimer’s Disease .......................... 7
1.1.5.1 The Cholinergic Hypothesis ....................................................... 7
1.1.5.2 The Amyloid Cascade Hypothesis ............................................... 8
1.1.5.3 Other Hypotheses ..................................................................... 9
1.1.6 Treatment of Alzheimer’s Disease ................................... 9
1.2 ANIMAL MODELS OF ALZHEIMER’S DISEASE ................. 10
1.2.1 History and types of models ........................................ 10
1.2.2 Criteria for a “good” model .......................................... 11
1.3 THE 3XTG-AD MOUSE MODEL OF ALZHEIMER’S
DISEASE ....................................................................... 12
1.3.1 Development and Genetics .......................................... 12
1.3.2 Pathology .................................................................. 13
1.3.3 Behavioural Deficits .................................................... 15
1.3.3.1 Learning and Memory ............................................................. 15
1.3.3.2 Anxiety-like symptoms ............................................................ 16
1.3.3.3 Social Behaviour ..................................................................... 16
1.3.3.4 Motor Behaviour ..................................................................... 16
1.4 USE OF THE 3XTG-AD MICE TO ASSESS POTENTIAL THERAPIES FOR ALZHEIMER’S DISEASE ....................... 17
1.5 RATIONALE ................................................................... 18
1.6 OUTLINE OF EXPERIMENTS .......................................... 19
1.6.1 Experiment 1. Longitudinal Behavioural Assessment of the Effects of Maternal Genotype on Behaviour at 2, 6,
12, and 18 months of age. .......................................... 19
1.6.2 Experiment 2. Characterization of the Motor Phenotype of the 3xTg-AD Mouse ................................................. 22
iv
1.6.3 Experiment 3. Early Cognitive Deficit Detection in the
3xTg-AD Mouse Model of Alzheimer’s Disease at 6.5 Months of age ............................................................ 22
1.7 REFERENCES ................................................................. 24
CHAPTER 2 AGE-RELATED CHANGES IN MOTOR
BEHAVIOUR AND ANXIETY IN THE 3XTG-AD MOUSE MODEL OF ALZHEIMER’S DISEASE: A
LONGITUDINAL STUDY ................................... 34
2.1 ABSTRACT ..................................................................... 35
2.2 INTRODUCTION ............................................................ 36
2.3 METHODS ...................................................................... 39
2.3.1 Breeding, Cross-Fostering & Pre-Weaning Treatment of Mice ......................................................................... 39
2.3.2 Procedure .................................................................. 39
2.3.3 Test Battery ............................................................... 41
2.3.3.1 Elevated Plus Maze ................................................................. 41
2.3.3.2 Open Field ............................................................................. 42
2.3.3.3 Rotarod ................................................................................. 43
2.3.4 Histology ................................................................... 43
2.3.4.1 Tissue Preparation .................................................................. 44
2.3.4.2 Aβ Immunohistochemistry ....................................................... 44
2.3.4.3 Tau Immunohistochemistry ..................................................... 45
2.3.5 Statistical Analyses ..................................................... 46
2.4 RESULTS ....................................................................... 47
2.4.1 Elevated Plus Maze ..................................................... 47
2.4.1.1 Locomotor Behaviours ............................................................ 47
2.4.1.2 Anxiety-Like Behaviours .......................................................... 49

v
2.4.1.3 Grooming ............................................................................... 52
2.4.2 Open Field ................................................................. 52
2.4.2.1 Locomotor Behaviours ............................................................ 52
2.4.2.2 Anxiety-Like Behaviours .......................................................... 53
2.4.2.3 Grooming ............................................................................... 55
2.4.3 Rotarod ..................................................................... 58
2.4.4 Neuropathology.......................................................... 60
2.4.5 Relationship of Neuropathology and Behaviour ............... 65
2.4.6 Effect Size Comparison ............................................... 65
2.5 DISCUSSION ................................................................. 69
2.5.1 Do 3xTg-AD and B6129SF2 mice differ in anxiety-like
behaviour across ages? ............................................... 69
2.5.2 Do 3xTg-AD and B6129SF2 Mice differ in Locomotor
Behaviour Across Ages? .............................................. 70
2.5.3 Do 3xTg-AD and B6129SF2 Mice Differ in Motor
Coordination and Motor Learning Across Ages? .............. 70
2.5.4 Are There Sex Differences in Behaviour in 3xTg-AD and
B6129SF2 Mice? ........................................................ 71
2.5.5 Is Adult Locomotor Behaviour Related to Locomotor
Behaviour During Development? .................................. 71
2.5.6 Does Maternal Genotype Effect Behaviour in Adult
Mice? ........................................................................ 72
2.5.7 Is There a Relationship Between Neuropathology and
Behaviour? ................................................................ 72
2.5.8 General Discussion and Conclusions .............................. 72
2.6 ACKNOWLEDGEMENTS .................................................. 74
2.7 REFERENCES ................................................................. 75
2.8 SUPPLEMENTAL TABLES ................................................ 79
vi
2.9 SUPPLEMENTAL FIGURES ............................................. 88
CHAPTER 3 AGE-RELATED CHANGES IN ACOUSTIC STARTLE AND PREPULSE INHIBITION IN
THE 3XTG-AD MOUSE MODEL OF ALZHEIMER’S DISEASE: A LONGITUDINAL
STUDY ............................................................. 90
3.1 ABSTRACT ..................................................................... 91
3.2 INTRODUCTION ............................................................ 92
3.3 METHODS ...................................................................... 93
3.3.1 Breeding, Cross-Fostering & Pre-Weaning Treatment of Mice ......................................................................... 93
3.3.2 Procedure .................................................................. 94
3.3.3 Acoustic Startle and Prepulse Inhibition ......................... 95
3.3.4 Statistical Analyses ..................................................... 96
3.4 RESULTS ....................................................................... 97
3.5 DISCUSSION ............................................................... 100
3.6 ACKNOWLEDGEMENTS ................................................ 103
3.7 REFERENCES ............................................................... 104
3.8 SUPPLEMENTAL TABLES .............................................. 107
3.9 SUPPLEMENTAL FIGURE ............................................. 110
CHAPTER 4 LEARNING AND MEMORY IN THE 3XTG-AD MOUSE MODEL OF ALZHEIMER’S DISEASE
AT 2, 6, 12, AND 18 MONTHS OF AGE ............ 111
4.1 ABSTRACT ................................................................... 112
4.2 INTRODUCTION .......................................................... 113
4.3 METHODS .................................................................... 115
4.3.1 Breeding, Cross-Fostering & Pre-Weaning Treatment of Mice ........................................................................ 115
vii
4.3.2 Procedure ................................................................. 116
4.3.3 Morris Water Maze ..................................................... 116
4.3.4 Conditioned Odour Preference Task .............................. 118
4.3.5 Correlations of Neuropathology and Behaviour .............. 119
4.3.6 Statistical Analyses .................................................... 119
4.4 RESULTS ..................................................................... 120
4.4.1 Morris Water Maze ..................................................... 120
4.4.1.1 Acquisition ........................................................................... 120
4.4.1.2 Reversal ............................................................................... 130
4.4.1.3 Probe Memory Trial .............................................................. 132
4.4.2 Conditioned Odour Preference Task .............................. 134
4.4.3 Correlations of Neuropathology and Behaviour .............. 138
4.4.4 Effect Sizes ............................................................... 138
4.5 DISCUSSION ............................................................... 140
4.6 ACKNOWLEDGEMENTS ................................................ 144
4.7 REFERENCES ............................................................... 145
4.8 SUPPLEMENTAL TABLES .............................................. 148
4.9 SUPPLEMENTAL FIGURES ........................................... 151
CHAPTER 5 AGE-RELATED CHANGES IN SOCIAL
BEHAVIOUR IN THE 3XTG-AD MOUSE MODEL OF ALZHEIMER’S DISEASE FROM 2
TO 18 MONTHS OF AGE ................................. 153
5.1 ABSTRACT ................................................................... 154
5.2 INTRODUCTION .......................................................... 155
5.3 METHODS .................................................................... 156

viii
2.3.1 Breeding, Cross-Fostering & Pre-Weaning Treatment of
Mice ........................................................................ 156
5.3.2 Procedure ................................................................. 157
5.3.4 Home Cage Observations ........................................... 158
5.3.5 Social Novelty/Preference ........................................... 159
5.3.6 Tube Test of Social Dominance .................................... 160
5.3.7 Correlations of Neuropathology and Behaviour .............. 160
5.3.8 Statistical Analyses .................................................... 160
5.4 RESULTS ..................................................................... 161
5.4.1 Home Cage Observations ........................................... 161
5.4.2 Social Novelty/Preference ........................................... 165
5.4.3 Tube Test of Social Dominance .................................... 166
5.4.5 Correlations of Neuropathology and Behaviour .............. 166
5.4.6 Effect Sizes ............................................................... 167
5.5 DISCUSSION ............................................................... 168
5.6 ACKNOWLEDGEMENTS ................................................ 170
5.7 REFERENCES ............................................................... 171
5.8 SUPPLEMENTAL TABLE................................................ 173
5.9 SUPPLEMENTAL FIGURES ........................................... 174
CHAPTER 6 ANALYSIS OF MOTOR FUNCTION IN 6
MONTH OLD MALE AND FEMALE 3XTG-AD MICE ............................................................. 175
6.1 ABSTRACT ................................................................... 176
6.2 INTRODUCTION .......................................................... 177
6.3 METHODS .................................................................... 179
6.3.1 Animals .................................................................... 179
ix
6.3.2 Body Weight ............................................................. 180
6.3.3 Rotarod .................................................................... 180
3.3.4 Grip Strength ............................................................ 181
6.3.5 Gait Analysis ............................................................. 181
6.3.6 Balance Beam ........................................................... 181
6.3.7 Voluntary Wheel-Running ........................................... 182
6.3.8 Statistical Analyses .................................................... 182
6.4 RESULTS ..................................................................... 183
6.4.1 Body Weight ............................................................. 183
6.4.2 Rotarod .................................................................... 184
6.4.3 Grip Strength ............................................................ 185
6.4.4 Gait Analysis ............................................................. 186
6.4.5 Balance Beam ........................................................... 187
6.4.6 Voluntary Wheel-Running ........................................... 188
6.4.7 Effect Size Comparison .............................................. 190
6.5 DISCUSSION ............................................................... 191
6.6 ACKNOWLEDGEMENTS ................................................ 196
6.7 REFERENCES ............................................................... 197
6.8 SUPPLEMENTAL TABLES .............................................. 201
CHAPTER 7 EARLY DETECTION OF COGNITIVE DEFICITS
IN THE 3XTG-AD MOUSE MODEL OF ALZHEIMER’S DISEASE ................................. 206
7.1 ABSTRACT ................................................................... 207
7.2. INTRODUCTION ......................................................... 208
7.3 METHODS .................................................................... 210
x
7.3.1 Animals .................................................................... 210
7.3.2 Y-maze Test of Spontaneous Alternation ....................... 211
7.3.3 Novel Object Recognition Task .................................... 211
7.3.4 Barnes Maze Test of Spatial Learning and Memory ......... 212
7.3.5 Contextual and Cued Fear Conditioning ........................ 214
7.3.6 Statistical Analyses .................................................... 215
7.4 RESULTS ..................................................................... 216
7.4.1 Y-Maze Test of Spontaneous Alternation ....................... 216
7.4.2 Novel Object Recognition Task .................................... 216
7.4.3 Barnes Maze ............................................................. 217
7.4.4 Contextual and Cued Fear Memory .............................. 224
7.5.5 Effect Size Comparison .............................................. 226
7.5 DISCUSSION ............................................................... 228
7.6 ACKNOWLEDGEMENTS ................................................ 234
7.7 REFERENCES ............................................................... 235
7.8 SUPPLEMENTAL TABLES .............................................. 239
CHAPTER 8 GENERAL DISCUSSION .................................. 245
8.1 SUMMARY OF FINDINGS ............................................. 245
8.1.1 Genotype Differences ................................................. 245
8.1.2 Sex Differences ......................................................... 246
8.1.3 Age Differences ......................................................... 247
8.1.4 Maternal Genotype Differences.................................... 248
8.2 ASSESSMENT OF THE 3XTG-AD AS A MOUSE MODEL OF AD ......................................................................... 249
8.3 GENERAL CONCLUSIONS ............................................. 252
xi
8.4 REFERENCES ............................................................... 255
REFERENCES....... ................................................................ 257
APPENDIX 1 COPYRIGHT PERMISSION LETTERS ............. 275
CHAPTER 6 COPYRIGHT PERMISSION LETTER .................. 275
CHAPTER 7 COPYRIGHT PERMISSION LETTER .................. 283
xii
LIST OF TABLES
Table 2.1. Number of mice used at each age. ................................................................. 40
Table 2.2 Genotype Effect Size Estimates. Calculated with a pooled SD and
Hedges correction for models including genotype with CI’s that provided
evidence for an effect. Positive values indicate 3xTg-AD mice had higher scores
than B6129SF2 wildtype mice and negative scores indicate B6129SF2 wildtype
mice had higher scores than 3xTg-AD mice. A ‘#’ indicates that the confidence
interval includes zero. ..................................................................................................... 66
Table 2.3 Sex Effect Size Estimates. Calculated with a pooled SD and Hedges
correction for models including sex with CI’s that provided evidence for an effect.
Positive values indicate female mice had higher scores than male mice and
negative scores indicate male mice had higher scores than female mice. A ‘#’
indicates that the confidence interval includes zero. ...................................................... 66
Table 2.4 Foster Mother Genotype Effect Size Estimates. Calculated with a
pooled SD and Hedges correction for models including sex with CI’s that
provided evidence for an effect. Positive values indicate mice reared by 3xTg-AD
mothers had higher scores than mice reared by B6129SF2 mothers and negative
scores indicate mice reared by B6129SF2 had higher scores than mice reared by
3xTg-AD mothers. A ‘#’ indicates that the confidence interval includes zero .............. 67
Supplemental Table 2.1.1 Elevated Plus Maze – Distance ............................................. 80
Supplemental Table 2.1.2 Elevated Plus Maze – Number of Rears ............................... 80
Supplemental Table 2.1.3 Elevated Plus Maze – Number of Head Dips ....................... 80
Supplemental Table 2.1.4 Elevated Plus Maze – Distance in Closed Arms................... 81
Supplemental Table 2.1.5 Elevated Plus Maze – Time in Closed Arms ........................ 81
Supplemental Table 2.1.6 Elevated Plus Maze – Time Spent Freezing ......................... 81
Supplemental Table 2.1.7 Elevated Plus Maze – Number of SAPs ............................... 82
Supplemental Table 2.1.8 Elevated Plus Maze – Time Spent Grooming ....................... 82
Supplemental Table 2.2.1 Open Field – Distance Travelled .......................................... 82
Supplemental Table 2.2.2 Open Field – Number of Rears ............................................. 83
Supplemental Table 2.2.3 Open Field – Center Entries.................................................. 83
Supplemental Table 2.2.4 Open Field – Time in Center ................................................ 83
xiii
Supplemental Table 2.2.5 Open Field – Center Rears .................................................... 84
Supplemental Table 2.2.6 Open Field – Time Spent Freezing ....................................... 84
Supplemental Table 2.2.7 Open Field – Number of stretch Attend Postures ................. 84
Supplemental Table 2.2.8 Open Field – Time Spent Grooming..................................... 85
Supplemental Table 2.3 Body Weight ............................................................................ 85
Supplemental Table 2.4 Rotarod - Latency to Fall ......................................................... 86
Supplemental Table 2.5 Correlations of Neuropathology and Behavior. Pearson’s-
r scores for correlations between measures levels of amyloid beta and tau in the
brain of 3xTg-AD mice and behavioral measures with a genotype difference at 18
months of age. A ‘*’ indicates a significant correlation (p < 0.05). ............................... 86
Table 3.1 Distribution of mice by pup genotype and maternal genotype at each
age tested. ........................................................................................................................ 95
Table 3.2 Effect size estimates calculated with a pooled SD and Hedges
correction. A ‘#’ indicates that the confidence interval includes zero .......................... 100
Supplemental Table 3.1.1 PPI – Acoustic Startle ......................................................... 108
Supplemental Table 3.1.2 PPI – Prepulse Inhibition .................................................... 109
Supplemental Table 3.2 Correlations of Neuropathology and Behavior. Pearson’s-
r scores for correlations between measures levels of amyloid beta and tau in the
brain of 3xTg-AD mice and behavioral measures at 18 months of age. There were
no significant correlations (all p > 0.05). ...................................................................... 109
Table 4.1 Distribution of mice by pup genotype and maternal genotype at each
age. ................................................................................................................................ 116
Table 4.2 Correlation of Neuropathology and Behaviour. The Pearson’s-r values
for correlations between measures levels of amyloid beta and tau in the brain of
19 month old 3xTg-AD mice and behavioral measures with a genotype difference
at 18 months of age. A ‘*’ indicates a significant correlation (p < 0.05). .................... 138
Table 4.3 Genotype Effect Size Estimates. Cohen’s d calculated with a pooled SD
and Hedges correction for all models that included genotype and had a CI that
provided evidence for an effect. Positive values indicate 3xTg-AD mice had
higher scores than B6129SF2 wildtype mice and negative scores indicate
B6129SF2 wildtype mice had higher scores than 3xTg-AD mice. A ‘#’ indicates
that the confidence interval includes zero. .................................................................... 139
xiv
Table 4.4 Sex Effect Size Estimates. Cohen’s d calculated with a pooled SD and
Hedges correction for all models that included sex and had a CI that provided
evidence for an effect. Positive values indicate male mice had higher scores than
female mice and negative scores indicate female mice had higher scores than male
mice. A ‘#’ indicates that the confidence interval includes zero. ................................. 139
Table 4.5 Foster Mother Genotype Effect Size Estimates. Cohen’s d calculated
with a pooled SD and Hedges correction for all models that included foster
mother genotype and had a CI that provided evidence for an effect. Positive
values indicate mice reared by 3xTg-AD mothers had higher scores than mice
reared by B6129SF2 mothers and negative scores indicate mice reared by
B619SF2 mothers had higher scores than mice reared by 3xTg-AD mothers. A ‘#’
indicates that the confidence interval includes zero. .................................................... 140
Supplemental Table 4.1.1 MWM – Time in Correct Quadrant .................................... 148
Supplemental Table 4.1.2 MWM – Correct Annulus Crossings .................................. 148
Supplemental Table 4.2.1 COPT – Short Term Memory ............................................. 149
Supplemental Table 4.2.2 COPT – 2m Odour at 6m .................................................... 149
Supplemental Table 4.2.3 COPT – 2m Odour at 12m .................................................. 149
Supplemental Table 4.2.4 COPT – 6m odour at 12m ................................................... 149
Supplemental Table 4.2.5 COPT – 2m odour at 18m ................................................... 149
Supplemental Table 4.2.6 COPT – 6m odour at 18m ................................................... 150
Supplemental Table 4.2.7 COPT – 12m odour at 18m ................................................. 150
Table 5.1 Distribution of mice by pup genotype and maternal genotype at each
age. ................................................................................................................................ 157
Table 5.2 Correlation of Neuropathology and Behaviour. The Pearson’s-r values
for correlations between measures levels of amyloid beta and tau in the brain of
19 month old 3xTg-AD mice and behavioral measures with a genotype difference
at 18 months of age. A ‘*’ indicates a significant correlation (p < 0.05). .................... 167
Table 5.3 Effect Size Estimates. Cohen’s d calculated with a pooled SD and
Hedges correction for all models that had a CI that provided evidence for an
effect. A ‘#’ indicates that the confidence interval includes zero. HCO = home
cage observations, SNSP = social novelty / preference. ............................................... 168
Supplemental Table 5.1 SNSP Preference Score .......................................................... 173

xv
Table 6.1 Genotype Effect Size Estimates. Cohen’s d was calculated with a
pooled SD and Hedges correction (dunb) for all models that included genotype.
Positive values indicate that 3xTg-AD mice had higher scores than wildtypes and
negative scores indicate that wildtype mice had higher scores than transgenic
mice. .............................................................................................................................. 191
Supplemental Table 6.1 Body Weight. ......................................................................... 201
Supplemental Table 6.2 Rotarod – Latency to Fall. ..................................................... 202
Supplemental Table 6.3.1 Wire Hang – Latency to Fall............................................... 202
Supplemental Table 6.3.2 Grid Suspension – Latency to Fall. ..................................... 202
Supplemental Table 6.4.1 Gait Analysis – Length. ...................................................... 203
Supplemental Table 6.4.2 Gait Analysis – Width......................................................... 203
Supplemental Table 6.5.1 Balance Beam – Latency to Fall. ........................................ 203
Supplemental Table 6.5.2 Balance Beam – Distance Travelled. .................................. 204
Supplemental Table 6.5.3 Balance Beam – Speed. ...................................................... 204
Supplemental Table 6.5.4 Balance Beam – Foot Slips. ................................................ 204
Supplemental Table 6.6.1 Voluntary Wheel Running – Total Rotations. .................... 205
Supplemental Table 6.6.2 Voluntary Wheel Running – Percentage During Light
Cycle. ............................................................................................................................ 205
Table 7.1 Genotype difference effect size estimates were calculated with a pooled
SD and Hedges correction for all models including genotype. Positive values
indicate 3xTg-AD mice had higher scores than B6129SF2 wildtype mice and
negative scores indicate B6129SF2 wildtype mice had higher scores than 3xTg-
AD mice. A ‘#’ indicates that the confidence interval includes zero. .......................... 226
Table 7.2 Sex defence effect size estimates were calculated with a pooled SD and
Hedges correction for all models including sex. Positive values indicate male mice
had higher scores than female mice and negative scores indicate female mice had
higher scores than male mice. A ‘#’ indicates that the confidence interval includes
zero ................................................................................................................................ 228
Supplemental Table 7.1.1 Y-Maze – SAB.................................................................... 239
Supplemental Table 7.1.2 Y-Maze – AAR. .................................................................. 239
Supplemental Table 7.1.3 Y-Maze – SAR.................................................................... 240
xvi
Supplemental Table 7.2.1 NORT – Interaction Number Decimation Score ................ 240
Supplemental Table 7.2.3 NORT –Interaction Time Discrimination Score. ................ 240
Supplemental Table 7.3.1 Barnes Maze – Acquisition Latency. .................................. 240
Supplemental Table 7.3.2 Barnes Maze – Acquisition Distance. ................................. 240
Supplemental Table 7.3.3 Barnes Maze – Acquisition Errors. ..................................... 241
Supplemental Table 7.3.4 Barnes Maze – Acquisition Speed. ..................................... 241
Supplemental Table 7.3.5 Barnes Maze –Acquisition Probe Duration Correct. .......... 241
Supplemental Table 7.3.6 Barnes Maze –Acquisition Probe Frequency Correct......... 242
Supplemental Table 7.3.7 Barnes Maze – Curtain Probe Duration Correct. ................ 243
Supplemental Table 7.3.8 Barnes Maze – Curtain Probe Frequency Correct. ............. 243
Supplemental Table 7.3.9 Barnes Maze – Reversal Latency........................................ 243
Supplemental Table 7.3.10 Barnes Maze – Reversal Distance. ................................... 243
Supplemental Table 7.3.11 Barnes Maze – Reversal Errors. ....................................... 243
Supplemental Table 7.3.12 Barnes Maze – Reversal Speed. ........................................ 244
Supplemental Table 7.3.13 Barnes Maze – Reversal Probe Duration Correct. ............ 244
Supplemental Table 7.3.14 Barnes Maze – Reversal Probe Frequency Correct. ......... 244
Supplemental Table 7.4.1 Fear Conditioning – Context Freezing Time. ..................... 244
Supplemental Table 7.4.2 Fear Conditioning – Cued Freezing Time. ......................... 244
xvii
LIST OF FIGURES
Figure 1. Timeline of experiment 1 ................................................................................ 21
Figure 2.1 The Elevated Plus Maze. The mean (± S.E.M) total distance travelled
(A), number of rears (B) and head dips (C), percentage of distance (D) and time
(E) spent in the closed arms, the time spent freezing (F), number of stretch attend
postures (G) and time spent grooming (H) of 3xTg-AD (TG_P) and B6129SF2
(WT_P) mice reared by 3xTg-AD (TG_M) and B6129SF2 (WT_M) foster
mothers in the elevated plus maze. ................................................................................. 51
Figure 2.2 The Open Field. The mean (± S.E.M) total distance travelled (A),
number of rears (B), center entries (C), time spent in the center (D), number of
center rears (E), time spent freezing (F), number of stretch attend postures (G),
and time spent grooming (H) of 3xTg-AD (TG_P) and B6129SF2 (WT_P) mice
reared by 3xTg-AD (TG_M) and B6129SF2 (WT_M) foster mothers in the open
field. ................................................................................................................................ 57
Figure 2.3 Body Weight. The mean (± S.E.M) total body weight of 3xTg-AD
(TG_P) and B6129SF2 (WT_P) mice reared by 3xTg-AD (TG_M) and B6129SF2
(WT_M) foster mothers. ................................................................................................. 58
Figure 2.4 Rotarod. The mean (± S.E.M) latency to fall from the Rotarod at 2 (A),
6 (B), 12 (C), and 18 (D) months of age in 3xTg-AD and B6129SF2 mice reared
by 3xTg-AD (TG_M) and B6129SF2 (WT_M) foster mothers. .................................... 60
Figure 2.5 Tau Pathology. The mean (± S.E.M) density of tau positive neurons in
the hippocampus (A) and amygdala (B) of 3xTG-AD mice reared by 3xTg-AD
(TG_M) and B6129SF2 (WT_M) foster mothers. .......................................................... 61
Figure 2.6 Aβ Pathology. The mean (± S.E.M) percentage of the hippocampus
(A) amygdala (B), and cortex (C) covered by amyloid beta plaques of 3xTG-AD
mice reared by 3xTg-AD (TG_M) and B6129SF2 (WT_M) foster mothers. ................ 62
Figure 2.7 Hippocampus and Cortex Immunohistochemistry. Example sections of
19 month old 3xTg-AD mice stained for amyloid beta (A) or tau (C) and
B6129SF2 control mice strained for amyloid beta (B) or tau (D) .................................. 63
Figure 2.8 Amygdala Immunohistochemistry. Example sections of 19 month old
3xTg-AD mice strained for amyloid beta (A) or tau (C) and B6129SF2 control
mice strained for amyloid beta (B) or tau (D). ................................................................ 64
xviii
Figure 2.9 Effect Size Estimates. The Cohen’s d effect size estimates with a
Hedge’s correction and 95% confidence intervals. The vertical dotted line
represents an effect size of 0 (no difference between groups). For genotype (A),
positive values indicate that 3xTg-AD mice had higher scores than B6129SF2
(WT) wildtype mice. For sex (B) positive values indicate that female mice had
higher scores than male mice, and for foster mother genotype (C) positive values
indicate mice reared by 3xTg-AD mothers had higher scores than mice reared by
B6129SF2 (WT) mothers. ............................................................................................... 68
Supplemental Figure 2.1 The Elevated Plus Maze. The mean (± S.E.M) total
distance travelled (A), number of rears (B) and head dips (C), percentage of
distance (D) and time (E) spent in the closed arms, the time spent freezing (F),
number of stretch attend postures (G) and time spent grooming (H) of 3xTg-AD
(TG_P) and B6129SF2 (WT_P) mice reared by 3xTg-AD (TG_M) and B6129SF2
(WT_M) foster mothers in the elevated plus maze. ........................................................ 88
Supplemental Figure 2.2 The Open Field. The mean (± S.E.M) total distance
travelled (A), number of rears (B), center entries (C), time spent in the center (D),
number of center rears (E), time spent freezing (F), number of stretch attend
postures (G), and time spent grooming (H) of 3xTg-AD (TG_P) and B6129SF2
(WT_P) mice reared by 3xTg-AD (TG_M) and B6129SF2 (WT_M) foster
mothers in the open field................................................................................................. 89
Figure 3.1 Mean (± S.E.M) startle response (A) of 3xTg-AD (TG_P) and
B6129SF2 (WT_P) mice at 2, 6, 12, and 18 months of age. The mean (± S.E.M)
percentage of prepulse inhibition at 2 (B), 6 (C), 12 (D), and 18 (E) months of age
in 3xTg-AD and B6129SF2 mice reared by 3xTg-AD (TG_M) and B6129SF2
(WT_M) foster mothers. ................................................................................................. 99
Supplemental Figure 3.1 Mean (± S.E.M) startle response (A) of male and female
3xTg-AD (TG_P) and B6129SF2 (WT_P) mice reared by 3xTg-AD (TG_M) and
B6129SF2 (WT_M) at 2, 6, 12, and 18 months of age. ................................................ 110
Figure 4.1.1 Latency in the Morris Water Maze. The mean (± S.E.M) latency to
reach the hidden platform during each day of acquisition and reversal at 2 (A), 6
(B), 12 (C), and 18 (D) months of age of 3xTg-AD (TG_P) and B6129SF2
(WT_P) mice reared by 3xTg-AD (TG_M) and B6129SF2 (WT_M) foster
mothers. ......................................................................................................................... 122
Figure 4.1.2 Distance in the Morris Water Maze. The mean (± S.E.M) distance to
reach the hidden platform during each day of acquisition and reversal at 2 (A), 6
(B), 12 (C), and 18 (D) months of age of 3xTg-AD (TG_P) and B6129SF2
(WT_P) mice reared by 3xTg-AD (TG_M) and B6129SF2 (WT_M) foster
mothers. ......................................................................................................................... 125

xix
Figure 4.1.3 Swim Speed in the Morris Water Maze. The mean (± S.E.M) swim
speed for each day of acquisition and reversal at 2 (A), 6 (B), 12 (C), and 18 (D)
months of age of 3xTg-AD (TG_P) and B6129SF2 (WT_P) mice reared by 3xTg-
AD (TG_M) and B6129SF2 (WT_M) foster mothers. ................................................. 127
Figure 4.1.4 Thigmotaxis in the Morris Water Maze. The mean (± S.E.M)
percentage of thigmotaxis for each day of acquisition and reversal at 2 (A), 6 (B),
12 (C), and 18 (D) months of age of 3xTg-AD (TG_P) and B6129SF2 (WT_P)
mice reared by 3xTg-AD (TG_M) and B6129SF2 (WT_M) foster mothers. .............. 129
Figure 4.1.5 Morris Water Maze Probe Trial. The mean (± S.E.M) percentage of
time spent in the correct quadrant (A) and of the Morris water maze during the
probe trial of 3xTg-AD (TG_P) and B6129SF2 (WT_P) mice at each age, and the
number of correct annulus crossings (B) at each age. .................................................. 134
Figure 4.2 Conditioned Odour Preference Task. The mean (± S.E.M) percentage
of time spent digging the correct odour cup at each age for short-term memory
(A), the 2 month odour at 6 months (B), the 2 month odour at 12 months (C), the
6 month odour at 12 months (D), the 2 month odour at 12 months (E), the 6 month
odour at 18 months (F), and the 12 month odour at 18 months (G) in in 3xTg-AD
(TG_P) and B6129SF2 (WT_P) mice reared by 3xTg-AD (TG_M) and B6129SF2
(WT_M) foster mothers. ............................................................................................... 137
Supplemental Figure 4.1 Morris Water Maze Probe Trial. The mean (± S.E.M)
percentage of time spent in the correct quadrant (A) and number of annulus
crossings at each age of the probe trial in the Morris water maze mouse of 3xTg-
AD (TG_P) and B6129SF2 (WT_P) mice reared by 3xTg-AD (TG_M) and
B6129SF2 (WT_M) foster mothers. ............................................................................. 151
Supplemental Figure 4.2 Conditioned Odour Preference Task. The mean (±
S.E.M) percentage of time spent digging the correct odour cup at each age for the
2 month odour at 6 months (A), the 2 month odour at 12 months (B), the 6 month
odour at 18 months (C), and the 6 month odour at 18 months (D) and the 12
month odour at 18 months (E) in in 3xTg-AD (TG_P) and B6129SF2 (WT_P)
mice reared by 3xTg-AD (TG_M) and B6129SF2 (WT_M) foster mothers. .............. 152
Figure 5.1 Home Cage Observations. The mean (± S.E.M) number of affiliative
(A-D), agonistic (E-H), and non-social (I-L) behaviours at each age of 3xTg-AD
(TG_P) and B6129SF2 (WT_P) mice reared by 3xTg-AD (TG_M) and B6129SF2
(WT_M) foster mothers during home cage observations. ............................................ 164
Figure 5.2 Social Novelty / Preference. The mean (± S.E.M) preference score for
interacting with the novel mouse of 3xTg-AD (TG_P) and B6129SF2 (WT_P)
mice reared by 3xTg-AD (TG_M) and B6129SF2 (WT_M) foster mothers. .............. 165
Figure 5.3 Tube Test of Social Dominance. The number of wins of 3xTg-AD
(TG_P) and B6129SF2 (WT_P) mice at each age. * = p < 0.05. ................................. 166
xx
Supplemental Figure 5.1 Home Cage Observations. The mean (± S.E.M) number
of affiliative behaviours at 2 (A), 6 (B), 12 (C), and 18 (D) months of age in
3xTg-AD (TG_P) and B6129SF2 (WT_P) mice reared by 3xTg-AD (TG_M) and
B6129SF2 (WT_M) foster mothers during home cage observations. .......................... 174
Supplemental Figure 5.2 Social Novelty / Preference. The mean (± S.E.M)
preference score for interacting with the novel mouse of 3xTg-AD (TG_P) and
B6129SF2 (WT_P) mice reared by 3xTg-AD (TG_M) and B6129SF2 (WT_M)
foster mothers at each age. ............................................................................................ 174
Figure 6.1 Body Weight. Mean (± SEM) body weight (g) at the beginning of the
testing period in male and female 3xTg-AD and B6129SF2 mice. Male mice
weighed more than females and male B6129SF2 mice weighed more than male
3xTg-AD mice. * = a difference between groups at a 95% confidence interval. ......... 183
Figure 6.2 Rotarod. Mean (± SEM) latency (s) to fall from the Rotarod (A) for
male and female 3xTg-AD and B6129SF2 mice over five days of testing. (B) The
latency to fall from the Rotarod given the weight of each mouse for both
genotypes on each of the five days of testing. The 3xTg-AD mice had a longer
latency to fall from the Rotarod, and by day 5 lighter mice were performing better
than heavier mice. ......................................................................................................... 185
Figure 6.3 Grip Strength. Mean (± SEM) latency (s) to fall during the wire hang
(A) and grid suspension (B) tasks for male and female 3xTg-AD and B6129SF2
mice. There were no genotype or sex differences in wire hang task, while
B6129SF2 mice had a longer latency to fall than the 3xTg-AD mice in the grid
suspension task. * = a difference between groups at a 95% confidence interval. ........ 186
Figure 6.4 Gait Analysis. Mean (± SEM) stride length (A) and width (B) in cm in
male and female 3xTg-AD and B6129SF2 mice. The 3xTg-AD mice had a longer
stride than the B6129SF2 mice, and the B6129SF2 males had a wider stride than
the B6129SF2 females. * = a difference between groups at a 95% confidence
interval. ......................................................................................................................... 187
Figure 6.5 Balance Beam. Mean (± SEM) latency to fall (s) (A), distance travelled
(cm) (B), speed (cm/s) (C), and number of foot slips (D) on the balance beam for
male and female 3xTg-AD and B6129SF2 mice. The number of foot slips by
weight (g) (E) for all mice and 3xTg-AD and B6129SF2 mice separately. The
dotted line on (A) represents the maximum trial length. The 3xTg-AD made more
foot slips than the B6129SF2 mice and the lighter 3xTg-AD mice had more foot
slips than the heavier 3xTg-AD mice, but there was no effect of weight in the
B6129SF2 mice. * = a difference between groups at a 95% confidence interval. ....... 188

xxi
Figure 6.6 Wheel Running. Mean (± SEM) total rotations over the seven day
period (A), and percentage of total rotations which occurred during the light phase
of the light:dark cycle (B) for male and female 3xTg-AD and B6129SF2 mice. (C)
Total rotations by weight for all mice and both genotypes separately. Female
3xTg-AD mice had more rotations than female B6129SF2 mice, and 3xTg-AD
mice had more rotations in the light phase than B6129SF2. In 3xTg-AD mice the
number of rotations increased with weight while in B6129SF2 mice the number of
rotations decreased with weight. . * = a difference between groups at a 95%
confidence interval. ....................................................................................................... 190
Figure 7.1 Mean (± SEM) percentage of spontaneous alternation behaviours (A),
alternate arm returns (B), and same arm returns (C) for male and female 3xTg-AD
and B6129SF2 mice in the Y-maze test of spontaneous alternation. * = a
difference between groups at a 95% confidence interval. ............................................ 216
Figure 7.2 Mean (± SEM) discrimination score for the amount of time (A) and
number of bouts (B) interacting with the novel object compared to the familiar
object for male and female 3xTg-AD and B6129SF2 mice in the novel object
recognition task. The dotted line represents no preference between the novel and
familiar object. .............................................................................................................. 217
Figure 7.3 Mean (± SEM) latency (s) to escape (A), distance travelled (B),
number of incorrect head dips (Errors, C), and moving speed (D) for male and
female 3xTg-AD and B6129SF2 mice during acquisition and reversal learning in
the Barnes maze ............................................................................................................ 220
Figure 7.4 Mean (± SEM) duration of time spent in the correct zone during the
acquisition (A), curtain (C) and reversal (E) probe trials in the Barnes maze. The
dotted line represents chance performance. Mean (± SEM) frequency of entries
into the correct zone during the acquisition (B), curtain (D), and reversal (F) probe
trial in the Barnes maze for male and female 3xTg-AD and B6129SF2 mice. * = a
difference between groups at a 95% confidence interval. ............................................ 222
Figure 7.5 Mean (± SEM) time spent freezing during the context (A), and cued
(B) memory tests for male and female 3xTg-AD and B6129SF2 mice. * = a
difference between groups at a 95% confidence interval. ............................................ 225
xxii
ABSTRACT
The 3xTg-AD mouse model of Alzheimer’s disease has three transgenes
(APPswe, PS1M146V, and Tau P301L) that cause the development of amyloid beta
plaques, neurofibrillary tangles, and cognitive deficits. The breeding system of the 3xTg-
AD mice requires that the transgenic mice be reared by transgenic mothers and the
wildtype controls (B6129SF2) reared by wildtype mothers. To assess the effect of
maternal genotype we cross-fostered pups to create mixed genotype litters and tested
pups in a longitudinal study from 2 to 18 months of age. We found little evidence of a
lasting effect of maternal genotype on behaviour or neuropathology. The 3xTg-AD mice
had enhanced motor abilities on Rotarod and decreased anxiety-like behaviour from 2 to
18 months of age. We found no deficits in social behaviour at any age tested. The 3xTg-
AD mice had a deficit in spatial learning and memory in the MWM from 2 – 18 months
of age. To further characterize the motor phenotype we performed an extensive motor test
battery at six months of age and found the 3xTg-AD mice had enhanced motor
performance on the Rotarod, but worse performance on the grid suspension task. The
3xTg-AD mice had a longer stride length in gait analysis and made more foot slips on the
balance beam than wildtype mice. There was no difference in voluntary wheel-running
activity between genotypes, but there was a disruption in circadian activity rhythm in
3xTg-AD mice. We then tested mice at 6.5 months of age on a series of cognitive tasks to
determine which was the most sensitive to detect cognitive deficits. We found that the
Barnes maze was the most sensitive; the 3xTg-AD mice had impaired learning and
memory in the Barnes maze but performed better than B6129SF2 wildtype mice in the Y-
Maze and in contextual fear conditioning. Neither genotype demonstrated a preference in
novel object recognition nor was there a genotype difference in cued fear conditioning.
Overall the 3xTg-AD mouse develops some of the deficits that would be expected of a
mouse model of Alzheimer’s disease but has fairly mild cognitive deficits even at 18
months of age.

xxiii
LIST OF ABBRIVIATIONS USED
% .............. Percentage
AD ............ Alzheimer’s Disease
AICc ......... Akaike Information Criterion
APOE ....... Apolipoprotein E
APP .......... Amyloid Precursor Protein
Aβ ............. Amyloid Beta
CI95 ................. 95% Confidence Interval
COPT ....... Conditioned Odour Preference Task
DAB ......... Diaminobenzidine Tetrahydrochloride
dH20 ........ Distilled Water
EPM ......... Elevated Plus Maze
FAD.......... Familial Alzheimer’s Disease
GSK3........ Glycogen Synthase Kinase 3
HCO ......... Home Cage Observations
H202 .......... Hydrogen Peroxide
MWM ....... Morris Water Maze
NFT .......... Neurofibrillary Tangles
NMDA ..... N-methyl-D-aspartate
NORT ....... Novel Object Recognition Task
OF ............ Open Field
PB ............. Phosphate Buffer
PBS .......... Phosphate Buffered Saline

xxiv
PPI ............ Prepulse Inhibition
PS1 ........... Presenilin 1
PS2 ........... Presenilin 2
SNSP ........ Social Novelty / Social Preference Task

xxv
ACKNOWLEDGMENTS
I would like to thank my PhD supervisor, Dr. Richard brown for his support
throughout my degree. I am grateful for the opportunities and assistance that he provided
me throughout my time as a graduate student. I would also like to thank Dr. Ian Weaver
and Dr. Leslie Phillmore for serving on my thesis committee. Thanks to Dr. Kenneth
Rockwood, who provided valuable input on my thesis. Thanks to Dr. Robert Gerlai for
serving as my external examiner.
I would also like to acknowledge the contributions of the other members of the
Dr. Brown’s lab, including Rhian Gunn, who help to organize the projects involved in
this thesis and assisted with the breeding. Thanks to Dr. Timothy O’Leary for his
invaluable input and advice in planning my thesis. Thanks to Dr. Aimee Wong for her
advice and support. Thanks to Michelle Hicks, Kaitlyn Gordon, Christine Van Winssen,
Mackenzie Campbell, and Daniel Ikpi for their assistance with the behavioural testing. I
would also like to thank the other students and numerous volunteers in Dr. Brown’s lab
who directly or indirectly assisted me with this project.
Thanks to Dr. Sultan Darvesh for his advice on the design of the
immunohistochemistry portions on the thesis and the members of his lab, Andrew Reid
and Meghan Cash, for their assistance and training in completing the
immunohistochemistry for this project.
Lastly I would like to thank my family for their support and encouragement
throughout my time as a graduate student.

1
CHAPTER 1 INTRODUCTION
1.1 ALZHEIMER’S DISEASE
1.1.1 OVERVIEW AND IMPACT
1.1.1.1 BRIEF DESCRIPTION OF HISTORY, SYMPTOMS, AND PROGRESSION OF
AD.
Alzheimer’s disease (AD) is a progressive neurodegenerative disease that is the
most common form of dementia. Alzheimer’s disease causes increasing memory loss, can
affect many other cognitive functions, and is ultimately fatal. The neuropathology of AD
involves the progressive deposition of amyloid beta (Aβ) plaques, neurofibrillary tangles,
and other neuropathological hallmarks (Braak and Braak, 1991). The disease and
associated neuropathology were described by Alois Alzheimer, its namesake, in 1906,
though senile dementia has been known as a disease since antiquity (Goedert and
Spillantini, 2006; Cipriani et al., 2011). The prevalence of AD was approximately 1.5%
in the Canadian population in 2008 and is expected to rise to 2.8% by 2038, mainly as a
result of the ageing population (Alzheimer Society of Canada, 2010).
1.1.1.2 PREVALENCE BY AGE
The prevalence of AD increases dramatically with age. Women generally have a
higher prevalence than men at any given age; the prevalence of dementia in those aged 85
or older in Canada in 2008 was 33% in men and 46% in women, and is expected to
increase as the population ages (Alzheimer Society of Canada, 2010).
1.1.1.3 ECONOMIC IMPACT OF THE DISEASE IN CANADA AND THE WORLD
Alzheimer’s disease causes a significant burden on the Canadian healthcare
system and on unpaid caregivers who support those who suffer from AD. The total

2
economic burden of AD, a measure approximating the direct healthcare costs, indirect
costs, and lost potential wages of unpaid caregivers, was approximately $15 billion in
2008 and is expected to rise to $150 billion by 2038 (Alzheimer Society of Canada, 2010;
World Health Organization, 2012).
1.1.2 BEHAVIOURAL SYMPTOMS
1.1.2.1 COGNITIVE DEFICITS
The progression of symptoms in AD tends to follow a characteristic pattern,
though there is evidence for distinct genetically defined subtypes with differences in
symptom progression. The symptoms increase with time, eventually leading to profound
cognitive deficits (Becker et al., 1988; Murray et al., 2011). One of the earliest and most
prominent symptoms of AD is memory loss, specifically episodic memory, which is the
memory for events that have occurred in a person’s life. The episodic memory deficit is
likely the result of an inability to consolidate memories, as AD patients typically exhibit
accelerated forgetting and equally poor recall and recognition. Patients with AD also
have deficits in semantic memory, which is general knowledge, concepts, and facts. This
has been determined by assessing knowledge for concepts or facts across multiple
methods of retrieval. A lack of semantic memory is characterized by a deficit in
performance that is consistent across retrieval methods (Weintraub et al., 2012). Working
memory and executive function can also be impaired in AD (Baudic et al., 2006;
Belleville et al., 2007).
1.1.2.2 NEUROPSYCHOLOGICAL SYMPTOMS
Elevated anxiety is a common symptom in AD, and is present early in the course
of the disease. Elevated anxiety is correlated with a higher rate of other behavioural

3
symptoms and a decrease in the ability to perform activities of daily living (Teri et al.,
1999; Ferretti et al., 2001). Apathy and depression are also common symptoms of early
AD (Devanand et al., 1996; Landes et al., 2001). A variety of other neuropsychological
symptoms can develop in advanced AD, including hallucinations, delusions, and sleep
disturbances (Jost and Grossberg, 1996).
1.1.2.5 MOTOR BEHAVIOUR
Motor dysfunction is a fairly common symptom in early AD and typically
presents as slowing and a minor deficit in performing complex or fine motor tasks, but
without a deficit in gross motor ability (Kluger et al., 1997; Pettersson et al., 2005). Later
in the disease more gross deficits in motor functions may be present, including gait
disturbances (Braak and Braak, 1991; Allan et al., 2005).
1.1.3 NEUROPATHOLOGY
There are two historical histological hallmarks of AD pathology, Aβ plaques and
neurofibrillary tangles, which are thought to be responsible for the synaptic dysfunction
and cell death that cause the neural, cognitive, and behavioural symptoms of AD.
1.1.3.1 AΒ PATHOLOGY
1.1.3.1 What is Aβ, and how does the pathology develop?
In the pathogenesis of AD the amyloid precursor protein (APP) is cleaved by the
beta-secretase enzyme then by the gamma-secretase enzyme, producing Aβ peptide. This
peptide is normally 40 residues long (Aβ40) but a proportion of the peptides are 42
residues long (Aβ42). The Aβ42 peptide is more likely to aggregate and is the primary
form found in Aβ plaques (LaFerla et al., 2007). An autosomal dominant form of AD is
caused by mutations in the genes encoding APP or presenilin 1 or 2 (PS1 or PS2), a
4
component of the gamma-secretase protein, which cause the overproduction of Aβ42
relative to Aβ40 and the development of amyloid beta pathology (Scheuner et al., 1996).
The Aβ peptide can aggregate to form oligomers and fibrils, which can develop into Aβ
plaques. The exact mechanism by which any species of Aβ results in neurotoxicity or
synaptic dysfunction is a subject of debate, and there is little correlation between the
levels of Aβ plaques and cognitive dysfunction in AD patients, however the relationship
between autosomal dominant AD and mutations in the genes associated with Aβ
production demonstrate that Aβ is an important part of AD neuropathology (Walsh et al.,
2002; LaFerla et al., 2007; Benilova et al., 2012).
1.1.3.2 Progression of Aβ pathology
The extracellular Aβ plaques of AD develop in a manner that varies considerably
between individuals, but in a generally characteristic pattern, increasing in density in
previously affected areas and spreading to additional areas of the brain over time. Braak
and Braak (1991, 1996) describe the progression of Aβ plaques in the cortex of the
ageing brain in three stages. The first stage of Aβ plaque deposition, A, consists of a low
level of Aβ plaques in the basal occipital, temporal, and frontal lobes and in the
entorhinal cortex. In stage B there is a medium level of Aβ plaques in most areas of the
neocortex, with the exception of the motor and sensory cortex, and few Aβ plaques in the
hippocampus. In the final stage, C, almost all of the neocortex has dense Aβ plaques,
with some plaques in the hippocampus and many subcortical areas begin to develop Aβ
plaques. While most cases of dementia that Braak and Braak (1991, 1996) examined had
high levels of Aβ plaques in the brain, many non-demented individuals also had Aβ
5
plaques throughout the cortex, highlighting the lack of a direct relationship between Aβ
plaques and cognitive dysfunction.
1.1.3.2 TAU PATHOLOGY
1.1.3.2.1 What are neurofibrillary tangles and how are they made?
The second hallmark of AD neuropathology, neurofibrillary tangles (NFTs), are
aggregations of hyperphosphorylated tau proteins. These NFTs develop in the neurons
and cause neuronal dysfunction either through the loss of normal tau function, which
stabilizes microtubules, or a pathological function of the aggregated tau protein (for a
review see Ballatore et al., 2007). The progression of tau pathology is more closely
correlated with cognitive deficits than Aβ plaques and follows a more well defined spatial
and temporal pattern in AD (Braak and Braak, 1991, 1996; Arriagada et al., 1992).
1.1.3.2.2 Progression of tau pathology
Generally the NFTs first appear in the entorhinal cortex, then spread to the limbic
system and finally to the neocortex. Braak and Braak (1991, 1996) describe six stages (I
– VI) of NFT development, which has much less variability between AD patients than the
development of Aβ plaques. In stage I there are some NFTs in the area of the cortex
where the entorhinal and temporal cortices meet, with the possibility of a few NFTs in the
surrounding areas. In stage II the density of NFTs in the stage I areas has increased and
spread to the CA1 region of the hippocampus. Stages III and IV involve increasing
densities in the affected areas from the preceding stages, a spread of NFTs throughout the
hippocampus, and the appearance of low density NFTs in the neocortex. Stages V and VI
again involve an increasing density of NFTs in the previously affected areas and the
spread of NFTs to the neocortex, and in stage VI to the subcortical nuclei.
6
1.1.3.3 OTHER NEURODEGENERATION
Synaptic loss and neuronal death are two additional hallmarks of AD that are
highly correlated with cognitive deficits. Synaptic loss and neuronal death are thought to
result from either Aβ plaques, tau NFTs, or some combination of the two pathologies
(Mark et al., 1995; Feinstein and Wilson, 2005; Schindowski et al., 2006; Lacor et al.,
2007). Neuronal cell death progresses in a similar pattern as tau, described above, and
leads to progressive brain atrophy compared to controls without AD (Braak and Braak,
1991; Chan et al., 2003). The majority of the cell death in AD appears to be the result of
apoptosis and, while the exact cause is unknown, there is evidence that both Aβ and tau
pathologies can cause apoptosis (Mark et al., 1995; Smale et al., 1995; Feinstein and
Wilson, 2005)
1.1.4 GENETIC AND ENVIRONMENTAL RISK FACTORS
There are two main patterns of inheritance for AD, sporadic and familial.
Sporadic AD is the primary type, it generally occurs at an advanced age and has genetic
risk factors. Familial AD generally has an early onset (before age 65), is inherited, and is
typically caused by an autosomal dominant mutation. There are three genes with
mutations thought to cause familial AD. One encodes for the amyloid precursor protein
which is cleaved to form Aβ, the other two genes encode for presenilin 1 and 2, which
forms a portion of the gamma-secretase complex that cleaves the APP. These mutations
either cause an increase in the ratio of production of Aβ or in the ratio of Aβ42 to Aβ40,
either of which cause the development of AB plaques. Familial AD makes up a small
minority of the cases of AD (<5%), but the study of the genes associated with FAD has

7
been crucial to understanding the disease process and creating animal models of AD
(Campion et al., 1995, 1999; Haass et al., 1995; Hardy, 1997). While the genetic causes
of FAD and sporadic AD are different, the underlying neuropathology is very similar, as
are the clinical features of the disease, though FAD tends to have a longer disease course,
likely because of the earlier age of onset (Duara et al., 1993).
The most common genetic risk factors for sporadic AD are mutations in the gene
encoding for apolipoprotein E (APOE), though a number of other genes and loci have
been implicated (Lambert et al., 2013). APOE may be involved in the clearance of Aβ in
the brain and mutations associated with AD, and mutations in APOE are good predictors
for the levels of Aβ, but not tau, pathology in unaffected carriers (Strittmatter et al., 1993;
Morris et al., 2010; Castellano et al., 2011). APOE mutations alone are generally not
sufficient to cause AD, and so do not generally cause autosomal dominant AD. The most
well studied APOE mutation is the ε4 allele. One study found a 2.84 fold increase in the
risk of AD in people with one copy of the allele and a 8.07 fold increase with two
(Corder et al., 1993). The strongest risk factor for AD is age; After age 65 the risk of AD
rises dramatically and by age 85 over 30% of the population has developed AD
(Alzheimer Society of Canada, 2010). There are a number of environmental risk factors
for AD, including smoking, head injuries, diabetes, and obesity (Mortimer et al., 1991;
Anstey et al., 2007; Profenno et al., 2010).
1.1.5 PROPOSED CAUSES OF ALZHEIMER’S DISEASE
1.1.5.1 THE CHOLINERGIC HYPOTHESIS
The cholinergic hypothesis is one of the oldest hypotheses about the development
of AD (for a review see Francis and Meaney, 1999; Francis et al., 1999). The cholinergic
8
hypothesis proposes that the loss of cholinergic neurons in the basal forebrain and other
brain areas results in a general decrease in cholinergic neurotransmission, which causes
the behavioural symptoms of AD. While many patients with AD exhibit a decrease in
cholinergic function early in the disease this is not a universal symptom and there is
evidence that neurodegenerative changes not associated with cholinergic transmission
also contribute to cognitive decline. The actual cause of AD is likely more complex than
the cholinergic hypothesis proposes, however cholinesterase inhibitors, which increase
cholinergic neurotransmission, are one of only two classes of drugs currently approved
for treatment of AD (Scarpini et al., 2003).
1.1.5.2 THE AMYLOID CASCADE HYPOTHESIS
One of the most influential hypotheses about the development of AD is the
amyloid cascade hypothesis (Hardy and Higgins, 1992). The amyloid cascade hypothesis
proposes that Aβ is the causative agent of AD. This means that all the other symptoms,
including neurofibrillary tangles, neuronal loss, and cognitive deficits are the result of the
deposition of Aβ and the formation of plaques, and is likely a result of an imbalance
between the production of Aβ and its clearance. There are several facts that support the
hypothesis and others that call at least part of it into question. Supporting facts include
that the majority of familial AD cases are caused by mutations that directly affect Aβ,
that people with Down’s syndrome, which involves a duplication of the APP gene and
overproduction of Aβ, develop AD at very high rate, that many of the genes implicated in
late onset AD are thought to be involved in Aβ production or clearance, and lastly that
the majority of mutations associated with tau are not associated with AD. Some
limitations include the fact that amyloid pathology does not correlate well with cognitive
9
developments (Arriagada et al., 1992), that the oligomeric form of Aβ may be the toxic
species, not the Aβ plaque, and that few of the therapeutics designed based on the
hypothesis have had any success (Lee et al., 2004; Pimplikar, 2009).
1.1.5.3 OTHER HYPOTHESES
Partially as a result of the issues with the amyloid cascade hypothesis, several
other hypotheses about the development of AD have been proposed, though none are
currently as prevalent as the amyloid cascade hypothesis. The early tau hypothesis
proposes that tau, not Aβ, is the causative agent of AD, and is supported by the fact that
cognitive functions in AD are much better correlated with tau pathology than Aβ, and
proposes that a number of factors, including Aβ, cause tau hyperphosphorylation and
neuronal cell death, which releases the hyperphosphorylated tau and begins the cascade
(Maccioni et al., 2010). Other proposed causes of AD are the oxidative stress hypothesis,
which suggests that an increases in oxidative stress in the brain causes AD (Markesbery,
1997), and the Glycogen synthase kinase 3 (GSK3) hypothesis, which proposes that over
activity of GSK3 is responsible for the development of AD, as GSK3’s deregulation is
hypothesized to cause the hyperphosphorylation of tau and an increase in Aβ production
(Hooper et al., 2008).
1.1.6 TREATMENT OF ALZHEIMER’S DISEASE
Despite a wealth of research on AD and many clinical trials there are only two
classes of drugs currently approved for the treatment of AD, both of which provide
mainly symptomatic relief (for a review see Anand et al., 2014 and Scarpini et al., 2003).
The first class of drugs are acetylcholinesterase inhibitors, which were developed based
on the cholinergic hypothesis and improve cholinergic neurotransmission by decreasing
10
the rate of the breakdown of acetlycholine. These drugs improve cognitive function in
mild and moderate AD, though their effect on disease progression is unclear. The only
other drug approved to treat AD is Memantine, which is a NMDA-receptor partial
antagonist, may protect neurons from glutamate excitotoxicity. Memantine has been
shown to slow the decline of cognitive and other functions in late stage AD, though
whether it is of any long term benefit is currently unknown.
1.2 ANIMAL MODELS OF ALZHEIMER’S DISEASE
1.2.1 HISTORY AND TYPES OF MODELS
The first attempts to model AD in animals focused on the cholinergic hypothesis.
The first animal models involved treating non-human primates with Scopolamine, an
anti-cholinergic drug, which produced cognitive deficits similar those seen in old age.
Rodent models of cholinergic dysfunction were then developed using pharmacological
and surgical methods (for a review see Bartus, 2000 and LaFerla and Green, 2012). With
the rise in popularity of the amyloid cascade hypothesis animal models were created by
injecting various forms of Aβ directly into the brain, which resulted in neurotoxicity,
causing apoptosis, and cognitive dysfunction. Researchers then developed transgenic
animals which harboured human APP and PS1 genes that are associated with familial
AD. Those transgenic animals developed Aβ plaques and cognitive dysfunction similar to
AD, but did not develop the tau deposits or neurofibrillary tangles (Games et al., 1995;
Hsiao et al., 1996; Jankowsky et al., 2004; Oakley et al., 2006). In an attempt to more
fully model AD neuropathology the 3xTg-AD transgenic mice were created by inserting
transgenic APP, PS1 and a tau gene (tauP301L), which causes the mice to develop
neurofibrillary tangles as well as amyloid beta plaques (Oddo et al., 2003).
11
1.2.2 CRITERIA FOR A “GOOD” MODEL
Willner (1984) proposed three criteria for an animal model of disease; (1)
predictive validity, which is that any treatments in the animal will translate into
treatments in humans; (2) face validity, whether the symptoms of the model are the same
as the human disease; and (3) construct validity, whether the same disease process is
being modeled as is present in the human disease. The ideal mouse model of AD would
thus replicate the behavioural and neuropathological symptoms of AD, which would
mean developing Aβ plaques, neurofibrillary tangles, synaptic dysfunction and cell loss,
as well as progressive deficits in memory and finally death. It would also have the same
underlying disease process, which for the majority of cases of AD does not involve
autosomal dominant mutations in APP or PS1, unlike the majority of mouse models.
Treatments which ameliorate symptoms in the ideal model of AD should translate to
treatments in humans with AD if the model has good predicative validity, though this has
not yet been successful with transgenic models of AD. While the current models of AD
do not meet all the criteria, there is value in incomplete models of AD. Webster et al.
(2014) provide a thorough review the neuropathology and behaviour of 10 commonly
used mouse models of AD.
Modeling only one aspect of the disease can allow for a better understanding of
the mechanisms of that aspect and the creation of interventions based on those
mechanisms, even if they do not fully address all aspects of the disease (Radde et al.,
2008). The cholinergic models of AD are a good example of this, they had little construct
validity, as the neuropathology was not similar to AD, but they had similar behavioral
symptoms. The cholinergic models also had some predictive validity as the drugs that

12
ameliorated their symptoms provide some symptomatic relief in AD (Yamada and
Nabeshima, 2000). The current transgenic models may lead to a better understanding of
the disease and treatments, despite being incomplete.
1.3 THE 3XTG-AD MOUSE MODEL OF ALZHEIMER’S DISEASE
1.3.1 DEVELOPMENT AND GENETICS
The B6;129-Psen1tm1Mpm Tg(APPSwe,tauP301L)1Lfa (3xTg-AD) mouse
model of AD was designed to develop both of the pathological hallmarks of AD: Aβ
plaques and neurofibrillary tangles. To accomplish this, two transgenes, APPswe and
tauP301L, were subcloned onto the same Thy1.2 expression cassette and injected into the
single celled embryo of a transgenic mouse with the PS1M146V transgene, to create a
homozygous transgenic mouse with all three transgenes. These mice were backcrossed
onto the original PS1M146V parental strain. The APPswe gene encodes for a human APP
with a the Swedish mutation associated with familial AD, and the PS1M146V transgene
encodes for a mouse PS1 with a section of the mouse gene replaced with the homologous
section of human PS1 with a mutation associated with familial AD. The tauP301L
transgene encodes for human tau and has a mutation associated with the development of
frontotemporal dementia. This strain is maintained by breeding homozygous transgenic
mice with other homozygous transgenic mice and the approximate wildtype controls
(B6129SF2/J) with one another, which means that the strains are bred separately (Oddo
et al., 2003).
Early life environment can have a lasting effect on the brain and behaviour (Denenberg
et al., 1968; Liu et al., 1997). Several factors have been shown to have long-term effects
on behaviour in both humans and rodents, including early stress and differences in

13
maternal care (Francis and Meaney, 1999). Priebe et al. (2005) cross-fostered pups from
two mouse strains with differing levels of maternal care and found that maternal care had
a lasting effect on anxiety-like behaviour later in life. In addition to post-natal care, the
pre-natal environment can have a lasting effect on brain and behaviour. Francis et al.
(2003) cross fostered single cell mouse embryos and compared them to mice cross
fostered immediately after birth and found differences in behaviour between the two
types of cross fostering, which demonstrates that the pre-natal environment can have a
lasting effect on later life development. Because the 3xTg-AD and B6129SF2 strains are
bred separately it is possible that the strains have differing levels of maternal care which
could have lasting effects on the behaviour throughout the lifespan.
1.3.2 PATHOLOGY
Mastrangelo and Bowers (2008) provide a detailed description of the development
of Aβ and tau neuropathology in the 3xTg-AD mouse. The cleaved human Aβ gene
product is first detectable in the hippocampus, entorhinal cortex, and motor cortex in
3xTg-AD at two months. Intracellular Aβ deposition begins at two to three months of age
in the hippocampus, entorhinal cortex, and motor cortex, and in the amygdala by six
months of age. Mastrangelo and Bowers (2008) report that extracellular Aβ deposition
does not begin until 15 months of age with dense plaques developing by 18 months of
age, however Billings et al., (2005) report that there is extracellular Aβ deposition in the
hippocampus and amygdala by six months of age.
Mastrangelo and Bowers, (2008) found that the tau transgene product can be
detected in some pyramidal neurons in the hippocampus by two months of age, and in
most by six months of age. Phosphorylated tau can be detected in the hippocampus by six

14
months of age, spreading throughout the hippocampus with age and extending to the
motor cortex at nine months of age and the entorhinal cortex by 26 months of age. Paired
helical filaments, a component of neurofibrillary tangles, were not detectable until 15
months of age in the CA1 region of the hippocampus and in the subiculum, spreading to
other areas of the hippocampus, entorhinal cortex, and amygdala, only at 26 months of
age. The original study on 3xTg-AD mice reports that paired helical filaments develop
earlier, with extensive staining at 18 months of age (Oddo et al., 2003).
The brains of the 3xTg-AD mice also developed increased inflammation in their
brains relative to control mice. The levels of microglial activation increase beginning at 2
months of age in the rostral CA1 region of the hippocampus and remain stable until 18
months of age, when microglial activation spreads to other regions of the hippocampus.
A similar pattern of microglial activation was found in the amygdala and motor cortex.
Astrocyte activation was first detectable in the hippocampus, with lower levels in the
amygdala, entorhinal cortex, and motor cortex, remaining relatively constant until 15
months of age when there was a decrease in the hippocampus that continued until at least
26 months of age (Mastrangelo and Bowers, 2008).
In addition to Aβ and tau neuropathology the 3xTg-AD also develop synaptic
dysfunction and deficits in long term potentiation in the hippocampus beginning at six
months of age, with the deficit increasing with age (Oddo et al., 2003). The 3xTg-AD
develop immunological dysfunction by 2 months of age, with enlarged spleens, which by
12 months of age are an order of magnitude larger than wildtypes, and differences in the
levels of immune cells compare to wildtype controls (Marchese et al., 2014).

15
1.3.3 BEHAVIOURAL DEFICITS
The 3xTg-AD mice develop a number of behavioural deficits which change over
time. The behavioural deficits are described in a brief overview here and the following
chapters provide a more detailed description.
1.3.3.1 LEARNING AND MEMORY
The 3xTg-AD mice develop deficits in learning and memory which worsen with
age, though the nature and age of onset of these deficits is unclear. Spatial memory
deficits have been detected using the Morris water maze (MWM) beginning between 2.5
and 4 months of age (Billings et al., 2005; Clinton et al., 2007; Marchese et al., 2014),
and these deficits are present at later ages and appear to worsen with age (Billings et al.,
2007; McKee et al., 2008; Movsesyan et al., 2008; Corona et al., 2010; García-Mesa et
al., 2011; Chen et al., 2013). This spatial memory deficit in 3xTg-AD mice has also been
detected using the Barnes maze at six months of age (Clinton et al., 2010). In the radial
arm maze, another measure of spatial learning and memory, the 3xTg-AD are impaired in
both working and reference memory beginning at two months of age (Stevens and
Brown, 2014).
Some studies have reported deficits in contextual fear conditioning in 3xTg-AD
mice beginning at six months of age (Billings et al., 2005; España et al., 2010), while
others found no difference in contextual fear conditioning at either six or 13 months of
age (Pietropaolo et al., 2008; Chu et al., 2012).
In a test of short term memory, the Y-Maze test of spontaneous alternation
behaviour there are conflicting reports with some finding a deficit in the 3xTg-AD mice
at six to seven months of age and others finding no difference between 3xTg-AD mice

16
and wildtype controls at six months of age (Rosario et al., 2006; Carroll et al., 2007;
Zhang et al., 2010). In the novel object recognition task, some studies have reported
deficits beginning between six and nine months of age (Blanchard et al., 2010; Martinez-
Coria et al., 2010; Chen et al., 2013), though Clinton et al. (2007) did not find a deficit in
the 3xTg-AD until 9 months of age. The cause of these inconsistencies is unclear, they
may be related to subtle differences in testing protocols, minor differences in the genetics
due to differing sources of the mice, or variability between mice.
1.3.3.2 ANXIETY-LIKE SYMPTOMS
There are conflicting reports about the development of anxiety-like behaviour in
the 3xTg-AD mice. There are reports of no differences between 3xTg-AD and controls in
anxiety-like behavior on the elevated plus maze (EPM) between 7 and 14 months of age
(Pietropaolo et al., 2008; Filali et al., 2012). However there are also reports of an increase
in anxiety-like behaviour in the 3xTg-AD mice relative to B6129SF2 mice at 7 months of
age (Blanchard et al., 2010; Chen et al., 2013).
1.3.3.3 SOCIAL BEHAVIOUR
There have been few studies of social behaviour in the 3xTg-AD mice. One study
using the social recognition test reported that at 18 months of age the 3xTg-AD had
impaired social recognition compared to controls (Medeiros et al., 2011).
1.3.3.4 MOTOR BEHAVIOUR
In a neurodevelopmental test battery performed on the mice used for the
experiment in chapters 2 – 5 we found that 3xTg-AD pups reached physical milestones
earlier than control mice (Blaney et al., 2013). Several studies, including one from our
lab, have found that the 3xTg-AD mice have enhanced performance on the Rotarod
17
compared to control mice beginning at two months and continuing until at least fifteen
months of age (Blanchard et al., 2010; Filali et al., 2012; Chen et al., 2013; Oore et al.,
2013). On the wire hang test, a measure of forelimb strength, two studies found no
deficits in 3xTg-AD mice relative to controls (Sterniczuk et al., 2010a; Arsenault et al.,
2011). These results suggest that the 3xTg-AD do no develop motor deficits, which are
present in some mouse models with tau mutations, and that they 3xTg-AD may have
enhanced motor functioning compared to controls.
1.4 USE OF THE 3XTG-AD MICE TO ASSESS POTENTIAL
THERAPIES FOR ALZHEIMER’S DISEASE
The 3xTg-AD mouse model has been used to assess several potential therapies for
AD, with varying degrees of success at ameliorating the behavioural and
neuropathological deficits. Aβ immunotherapy involves treatment with antibodies against
Aβ, which are intended to increase the clearance of Aβ from the brain. In the 3xTg-AD
mouse Aβ immunotherapy decreases the levels of Aβ pathology and prevents the
development of spatial memory deficits in the MWM (Movsesyan et al., 2008; Giménez-
Llort et al., 2013). However there is a report that both Aβ and tau immunotherapy are
required to ameliorate spatial memory deficits 3xTg-AD mice in the MWM (Oddo et al.,
2006). Aβ immunotherapy also appears to delay, but not prevent, the development of tau
pathology (Oddo et al., 2004). Clinical trials in humans with AD had some early success
but some trials were halted due to the development of meningoencephalitis, a swelling of
the brain and meninges, and others have shown little to no effect on cognitive function,
though the trials have not yet tested Aβ immunotherapies’ effectiveness in preventing AD
(for a review see Lemere, 2013). Other studies have found that ovariectomy or

18
orchiectomy increases Aβ and tau pathology and causes memory deficits on the Y-maze,
and subsequent supplementation with estrogen (in females) or testosterone (in males)
reversed those effects, which may have implications for women with AD, and implies
that the sex hormones play a role in the development of the neuropathology of AD
(Rosario et al., 2006; Carroll et al., 2007; Carroll and Pike, 2008). Though trials in
humans have had mixed results, with no large scale clinical trials to date (Mulnard, 2000;
Cherrier et al., 2005; Carson, 2006).
1.5 RATIONALE
Several other studies have examined treatments thought to help prevent AD and
found that they decrease the levels of neuropathology and cognitive deficits in 3xTg-AD
mice, including exercise (Adlard et al., 2005), anti-inflammatory drugs (McKee et al.,
2008), previous learning (Billings et al., 2007), and Memantine, a drug approved to treat
AD described in section 1.6 (Martinez-Coria et al., 2010). A number of studies have
found that novel drugs for AD reduce neuropathology and or cognitive deficits (Caccamo
et al., 2006; Green et al., 2007, 2008; Wang et al., 2010; Himeno et al., 2011; Medina et
al., 2011), but whether or not these will translate into treatments for AD remains unclear.
As described in the preceding sections, the literature on the behaviour of the
3xTg-AD mouse is inconsistent, and the effect of maternal genotype remains unstudied.
Our overall rationale for these experiments was to conduct a detailed behavioural analysis
of the 3xTg-AD and B6129SF2 hybrid mice across the lifespan, using multiple tests of
each aspect of behaviour, in order to create a more thorough behavioural characterization
of these mice. Additionally, we sought to study what, if any, effect maternal genotype has
on both the behavioural development of these mice and the development of

19
neuropathology. After conducting our longitudinal experiment on the behaviour of these
mice we were left with two additional experimental questions: 1) as we found enhanced
performance in the Rotarod in the longitudinal study, we wanted to determine the nature
of the motor phenotype of the 3xTg-AD and B6129SF2 control mice, 2) as we found that
the 3xTg-AD had some cognitive deficits in the Morris water maze, but other behavioural
studies used different tasks, we wanted to determine which is the most sensitive task to
detect cognitive deficits with the 3xTg-AD.
1.6 OUTLINE OF EXPERIMENTS
1.6.1 EXPERIMENT 1. LONGITUDINAL BEHAVIOURAL ASSESSMENT OF
THE EFFECTS OF MATERNAL GENOTYPE ON BEHAVIOUR AT 2, 6, 12,
AND 18 MONTHS OF AGE.
Experiment 1 and 2 used the same mice in a longitudinal study of the effects of
maternal genotype on behaviour throughout the lifespan. After cross fostering, the mice
underwent a neurodevelopmental test battery (Blaney et al., 2013). The mice were then
tested at 2, 6, 12, and 18 months of age on a behavioural test battery. After the
behavioural test battery was complete the levels of amyloid beta plaques and
neurofibrillary tangles were assessed and correlated with the behavioural measures. The
results of the 2 and 6 month time points were described in my MSc thesis (Stover, 2012).
In this dissertation results of the test battery were split into four chapters, chapter 2 details
the anxiety and motor behaviour test results, and chapter 3 details the results of the
acoustic startle and prepulse inhibition tasks, chapter 4 contains the results of the learning
and memory tasks, and chapter 5 has the results of the social behaviour tasks. Chapter 2
20
has the results of the neuropathology assessment and chapters 2 – 5 all contain
correlations of levels of neuropathology to the respective behavioural tasks.
I had assistance with the behavioural testing for this experiment from a number of
students. Kaitlyn Gordon assisted with behavioural testing for one cohort of mice for her
Honours project during her BSc, Michelle Hicks assisted in the behavioural testing for
another cohort of mice for course credit in a third year research project, and Daniel Ikpi
assisted with the third cohort during his time as a visiting PhD student in Dr. Richard
Brown’s lab. Dr. Darvesh provided the lab space for the neuropathology and Andrew
Reid and Meghan Cash trained me on how to complete the histology and quantification
of neuropathology. I trained the students, and completed the remainder of the behaviour
testing, the histology, quantification of neuropathology, statistical analysis, and wrote the
chapters.

21
Figure 1. Timeline of experiment 1
Neurodevelopmental Test Battery
Behavioural Test Battery
Behavioural Test Battery
Behavioural Test Battery
Behavioural Test Battery
Sacrefice and Assess Neuropathology
2 Months 6 Months 12 Months
Months
18 Months 19 Months PND 2-24
22
1.6.2 EXPERIMENT 2. CHARACTERIZATION OF THE MOTOR
PHENOTYPE OF THE 3XTG-AD MOUSE
In the first experiment we found that the 3xTg-AD mice had enhanced
performance on the Rotarod beginning at 2 months of age and continuing until 18 months
of age and there is additional evidence from the literature that the 3xTg-AD show
improved motor functioning compared to control mice (Blanchard et al., 2010; Chen et
al., 2013). In order to further characterize the motor phenotype of this strain we ran the
3xTg-AD on a motor test battery. The results of this experiment are presented in chapter
6. This chapter has been published in Behavioural Brain Research (Stover et al., 2015a).
I had assistance in the behavioural testing from Mackenzie A. Campbell, who
completed some of the behavioural testing for two of the three cohorts of mice as a part
of her honours project for her BSc degree, and Christine M. Van Winssen who also
completed some of the behavioural testing for two of the cohorts for course credit in a
third year research project. I trained the students, completed the remaining behavioural
testing for the two cohorts and completed the behavioural testing for the final cohort. I
also completed the statistical analysis and wrote the manuscript, which Dr. Richard
Brown edited.
1.6.3 EXPERIMENT 3. EARLY COGNITIVE DEFICIT DETECTION IN THE
3XTG-AD MOUSE MODEL OF ALZHEIMER’S DISEASE AT 6.5 MONTHS
OF AGE
For the final experiment in my PhD thesis we sought to determine which
cognitive deficits were present at 6.5 months of age in the 3xTg-AD mice, and which test
was the most sensitive at detecting those deficits. We used the same mice as in

23
experiment 2 and ran them on a series of cognitive tasks after they had completed the
motor tasks. We compared the effect sizes of the different tasks to determine which was
the most sensitive. I had the same assistance as described in experiment 2. The results of
this experiment are presented in chapter 7.

24
1.7 REFERENCES
Adlard PA, Perreau VM, Pop V, Cotman CW (2005) Voluntary exercise decreases
amyloid load in a transgenic model of Alzheimer’s disease. J Neurosci 25:4217–
4221.
Allan LM, Ballard CG, Burn DJ, Kenny RA (2005) Prevalence and severity of gait
disorders in Alzheimer’s and non-Alzheimer's dementias. J Am Geriatr Soc
53:1681–1687.
Alzheimer Society of Canada (2010) Rising Tide : The Impact of Dementia on Canadian
Society.
Anand R, Gill KD, Mahdi AA (2014) Therapeutics of Alzheimer’s disease: Past, present
and future. Neuropharmacology 76:27–50.
Anstey KJ, Von Sanden C, Salim A, O’Kearney R (2007) Smoking as a risk factor for
dementia and cognitive decline: A meta-analysis of prospective studies. Am J
Epidemiol 166:367–378.
Arriagada P V., Growdon JH, Hedley-Whyte ET, Hyman BT (1992) Neurofibrillary
tangles but not senile plaques parallel duration and severity of Alzheimer’s disease.
Neurology 42:631–639.
Arsenault D, Julien C, Tremblay C, Calon F (2011) DHA improves cognition and
prevents dysfunction of entorhinal cortex neurons in 3xTg-AD mice. PLoS One
6:e17397.
Ballatore C, Lee VM-Y, Trojanowski JQ (2007) Tau-mediated neurodegeneration in
Alzheimer’s disease and related disorders. Nat Rev Neurosci 8:663–672.
Bartus RT (2000) On neurodegenerative diseases, models, and treatment strategies:
lessons learned and lessons forgotten a generation following the cholinergic
hypothesis. Exp Neurol 163:495–529.
Baudic S, Barba GD, Thibaudet MC, Smagghe A, Remy P, Traykov L (2006) Executive
function deficits in early Alzheimer’s disease and their relations with episodic
memory. Arch Clin Neuropsychol 21:15–21.
Becker JT, Huff FJ, Nebes RD, Holland A, Boller F (1988) Neuropsychological function
in Alzheimer’s disease. Pattern of impairment and rates of progression. Arch Neurol
45:263–268.
Belleville S, Chertkow H, Gauthier S (2007) Working memory and control of attention in
persons with Alzheimer’s disease and mild cognitive impairment. Neuropsychology
21:458–469.

25
Benilova I, Karran E, De Strooper B (2012) The toxic Aβ oligomer and Alzheimer’s
disease: an emperor in need of clothes. Nat Neurosci 15:349–357.
Billings LM, Green KN, McGaugh JL, LaFerla FM (2007) Learning decreases A beta*56
and tau pathology and ameliorates behavioral decline in 3xTg-AD mice. J Neurosci
27:751–761.
Billings LM, Oddo S, Green KN, McGaugh JL, LaFerla FM (2005) Intraneuronal Abeta
causes the onset of early Alzheimer’s disease-related cognitive deficits in transgenic
mice. Neuron 45:675–688.
Blanchard J, Wanka L, Tung Y-C, Cárdenas-Aguayo M del C, LaFerla FM, Iqbal K,
Grundke-Iqbal I (2010) Pharmacologic reversal of neurogenic and neuroplastic
abnormalities and cognitive impairments without affecting Aβ and tau pathologies in
3xTg-AD mice. Acta Neuropathol 120:605–621.
Blaney CE, Gunn RK, Stover KR, Brown RE (2013) Maternal genotype influences
behavioral development of 3xTg-AD mouse pups. Behav Brain Res 252:40–48.
Braak H, Braak E (1991) Neuropathological stageing of Alzheimer-related changes. Acta
Neuropathol 82:239–259.
Braak H, Braak E (1996) Evolution of the neuropathology of Alzheimer’s disease. Acta
Neurol Scand Suppl 165:3–12.
Caccamo A, Oddo S, Billings LM, Green KN, Martinez-Coria H, Fisher A, LaFerla FM
(2006) M1 receptors play a central role in modulating AD-like pathology in
transgenic mice. Neuron 49:671–682.
Campion D, Dumanchin C, Hannequin D, Dubois B, Belliard S, Puel M, Thomas-
Anterion C, Michon A, Martin C, Charbonnier F, Raux G, Camuzat A, Penet C,
Mesnage V, Martinez M, Clerget-Darpoux F, Brice A, Frebourg T (1999) Early-
onset autosomal dominant Alzheimer disease: prevalence, genetic heterogeneity, and
mutation spectrum. Am J Hum Genet 65:664–670.
Campion D, Flaman JM, Brice A, Hannequin D, Dubois B, Martin C, Moreau V,
Charbonnier F, Didierjean O, Tardieu S (1995) Mutations of the presenilin I gene in
families with early-onset Alzheimer’s disease. Hum Mol Genet 4:2373–2377.
Carroll JC, Pike CJ (2008) Selective estrogen receptor modulators differentially regulate
Alzheimer-like changes in female 3xTg-AD mice. Endocrinology 149:2607–2611.
Carroll JC, Rosario ER, Chang L, Stanczyk FZ, Oddo S, LaFerla FM, Pike CJ (2007)
Progesterone and estrogen regulate Alzheimer-like neuropathology in female 3xTg-
AD mice. J Neurosci 27:13357–13365.
Carson CC (2006) Effects of testosterone on cognition and mood in male patients with
mild Alzheimer’s disease and elderly men. Curr Urol Rep 7:471–472.

26
Castellano JM, Kim J, Stewart FR, Jiang H, DeMattos RB, Patterson BW, Fagan AM,
Morris JC, Mawuenyega KG, Cruchaga C, Goate AM, Bales KR, Paul SM, Bateman
RJ, Holtzman DM (2011) Human apoE isoforms differentially regulate brain
amyloid-β peptide clearance. Sci Transl Med 3:89ra57.
Champagne FA, Curley JP (2009) Epigenetic mechanisms mediating the long-term
effects of maternal care on development. Neurosci Biobehav Rev 33:593–600.
Chan D, Janssen JC, Whitwell JL, Watt HC, Jenkins R, Frost C, Rossor MN, Fox NC
(2003) Change in rates of cerebral atrophy over time in early-onset Alzheimer’s
disease: Longitudinal MRI study. Lancet 362:1121–1122.
Chen Y, Liang Z, Blanchard J, Dai C-L, Sun S, Lee MH, Grundke-Iqbal I, Iqbal K, Liu F,
Gong C-X (2013) A Non-transgenic mouse model (icv-STZ mouse) of Alzheimer’s
disease: Similarities to and differences from the transgenic model (3xTg-AD
mouse). Mol Neurobiol 47:711–725.
Cherrier MM, Matsumoto a M, Amory JK, Asthana S, Bremner W, Peskind ER, Raskind
M a, Craft S (2005) Testosterone improves spatial memory in men with Alzheimer
disease and mild cognitive impairment. Neurology 64:2063–2068.
Chu J, Giannopoulos PF, Ceballos-Diaz C, Golde TE, Praticò D (2012) 5-Lipoxygenase
gene transfer worsens memory, amyloid, and tau brain pathologies in a mouse model
of Alzheimer disease. Ann Neurol 72:442–454.
Cipriani G, Dolciotti C, Picchi L, Bonuccelli U (2011) Alzheimer and his disease: A brief
history. Neurol Sci 32:275–279.
Clinton LK, Billings LM, Green KN, Caccamo A, Ngo J, Oddo S, McGaugh JL, LaFerla
FM (2007) Age-dependent sexual dimorphism in cognition and stress response in
the 3xTg-AD mice. Neurobiol Dis 28:76–82.
Clinton LK, Blurton-Jones M, Myczek K, Trojanowski JQ, LaFerla FM (2010)
Synergistic Interactions between Abeta, tau, and alpha-synuclein: acceleration of
neuropathology and cognitive decline. J Neurosci 30:7281–7289.
Corder EH, Saunders a M, Strittmatter WJ, Schmechel DE, Gaskell PC, Small GW,
Roses AD, Haines JL, Pericak-Vance MA (1993) Gene dose of apolipoprotein E
type 4 allele and the risk of Alzheimer’s disease in late onset families. Science
261:921–923.
Corona C, Masciopinto F, Silvestri E, Viscovo A Del, Lattanzio R, Sorda R La,
Ciavardelli D, Goglia F, Piantelli M, Canzoniero LMT, Sensi SL (2010) Dietary zinc
supplementation of 3xTg-AD mice increases BDNF levels and prevents cognitive
deficits as well as mitochondrial dysfunction. Cell Death Dis 1:e91.
27
Denenberg VH, Rosenberg KM, Paschke R, Hess JL, Zarrow MX (1968) Plasma
corticosterone levels as a function of cross-species fostering and species differences.
Endocrinology 83:900–902.
Devanand DP, Sano M, Tang M-X, Taylor S, Gurland BJ, Wilder D, Stern Y, Mayeux R
(1996) Depressed Mood and the Incidence of Alzheimer’s Disease in the Elderly
Living in the Community. Arch Gen Psychiatry 53:175–182.
Duara R, Lopez-Alberola RF, Barker WW, Loewenstein DA, Zatinsky M, Eisdorfer CE,
Weinberg GB (1993) A comparison of familial and sporadic Alzheimer’s disease.
Neurology 43:1377–1384.
España J, Giménez-Llort L, Valero J, Miñano A, Rábano A, Rodriguez-Alvarez J, LaFerla
FM, Saura CA (2010) Intraneuronal beta-amyloid accumulation in the amygdala
enhances fear and anxiety in Alzheimer’s disease transgenic mice. Biol Psychiatry
67:513–521.
Feinstein SC, Wilson L (2005) Inability of tau to properly regulate neuronal microtubule
dynamics: A loss-of-function mechanism by which tau might mediate neuronal cell
death. Biochim Biophys Acta - Mol Basis Dis 1739:268–279.
Ferretti L, McCurry SM, Logsdon R, Gibbons L, Teri L (2001) Anxiety and Alzheimer’s
disease. J Geriatr Psychiatry Neurol 14:52–58.
Filali M, Lalonde R, Theriault P, Julien C, Calon F, Planel E (2012) Cognitive and non-
cognitive behaviors in the triple transgenic mouse model of Alzheimer’s disease
expressing mutated APP, PS1, and Mapt (3xTg-AD). Behav Brain Res 234:334–342.
Francis DD, Meaney MJ (1999) Maternal care and the development of stress responses.
Curr Opin Neurobiol 9:128–134.
Francis PT, Palmer AM, Snape M, Wilcock GK (1999) The cholinergic hypothesis of
Alzheimer’s disease: a review of progress. J Neurol Neurosurg Psychiatry 66:137–
147.
Games D, Adams D, Alessandrini R, Barbour R, Berthelette P, Blackwell C, Carr T,
Clemens J, Donaldson T, Gillespie F (1995) Alzheimer-type neuropathology in
transgenic mice overexpressing V717F beta-amyloid precursor protein. Nature
373:523–527.
García-Mesa Y, López-Ramos JC, Giménez-Llort L, Revilla S, Guerra R, Gruart A,
Laferla FM, Cristòfol R, Delgado-García JM, Sanfeliu C (2011) Physical exercise
protects against Alzheimer’s disease in 3xTg-AD mice. J Alzheimers Dis 24:421–
454.

28
Giménez-Llort L, Rivera-Hernández G, Marin-Argany M, Sánchez-Quesada JL, Villegas
S (2013) Early intervention in the 3xTg-AD mice with an amyloid β-antibody
fragment ameliorates first hallmarks of alzheimer disease. MAbs 5:665–677.
Goedert M, Spillantini MG (2006) A century of Alzheimer’s disease. Science 314:777–
781.
Green KN, Martinez-Coria H, Khashwji H, Hall EB, Yurko-Mauro K a, Ellis L, LaFerla
FM (2007) Dietary docosahexaenoic acid and docosapentaenoic acid ameliorate
amyloid-beta and tau pathology via a mechanism involving presenilin 1 levels. J
Neurosci 27:4385–4395.
Green KN, Steffan JS, Martinez-Coria H, Sun X, Schreiber SS, Thompson LM, LaFerla
FM (2008) Nicotinamide restores cognition in Alzheimer’s disease transgenic mice
via a mechanism involving sirtuin inhibition and selective reduction of Thr231-
phosphotau. J Neurosci 28:11500–11510.
Gudsnuk K, Champagne F a (2012) Epigenetic influence of stress and the social
environment. ILAR J 53:279–288.
Haass C, Lemere C a., Capell A, Citron M, Seubert P, Schenk D, Lannfelt L, Selkoe DJ
(1995) The Swedish mutation causes early-onset Alzheimer’s disease by beta-
secretase cleavage within the secretory pathway. Nat Med 1:1291–1296.
Hardy J (1997) Amyloid, the presenilins and Alzheimer’s disease. Trends Neurosci
20:154–159.
Hardy J a, Higgins G a (1992) Alzheimer’s disease: the amyloid cascade hypothesis.
Science 256:184–185.
Himeno E, Ohyagi Y, Ma L, Nakamura N, Miyoshi K, Sakae N, Motomura K, Soejima
N, Yamasaki R, Hashimoto T, Tabira T, M. Laferla F, Kira JI (2011) Apomorphine
treatment in Alzheimer mice promoting amyloid-β degradation. Ann Neurol 69:248–
256.
Hooper C, Killick R, Lovestone S (2008) The GSK3 hypothesis of Alzheimer’s disease. J
Neurochem 104:1433–1439.
Hsiao K, Chapman P, Nilsen S, Eckman C, Harigaya Y, Younkin S, Yang F, Cole G
(1996) Correlative memory deficits, Abeta elevation, and amyloid plaques in
transgenic mice. Science 274:99–102.
Jankowsky JL, Fadale DJ, Anderson J, Xu GM, Gonzales V, Jenkins N a., Copeland NG,
Lee MK, Younkin LH, Wagner SL, Younkin SG, Borchelt DR (2004) Mutant
presenilins specifically elevate the levels of the 42 residue β-amyloid peptide in
vivo: Evidence for augmentation of a 42-specific γ secretase. Hum Mol Genet
13:159–170.

29
Jost BC, Grossberg GT (1996) The evolution of psychiatric symptoms in Alzheimer’s
disease: a natural history study. J Am Geriatr Soc 44:1078–1081.
Kluger A, Gianutsos JJG, Golomb J, Ferris SH, Reisberg B (1997) Motor/psychomotor
dysfunction in normal aging, mild cognitive decline, and early Alzheimer’s disease:
diagnostic and differential diagnostic features. Int Psychogeriatrics 9:307–316.
Kundakovic M, Champagne F a (2014) Early-Life Experience, Epigenetics, and the
Developing Brain. Neuropsychopharmacology 40:141–153.
Lacor PN, Buniel MC, Furlow PW, Clemente AS, Velasco PT, Wood M, Viola KL, Klein
WL (2007) Abeta oligomer-induced aberrations in synapse composition, shape, and
density provide a molecular basis for loss of connectivity in Alzheimer’s disease. J
Neurosci 27:796–807.
LaFerla FM, Green KN (2012) Animal models of Alzheimer disease. Cold Spring Harb
Perspect Med 2:a006320.
LaFerla FM, Green KN, Oddo S (2007) Intracellular amyloid-beta in Alzheimer’s
disease. Nat Rev Neurosci 8:499–509.
Lambert JC et al. (2013) Meta-analysis of 74,046 individuals identifies 11 new
susceptibility loci for Alzheimer’s disease. Nat Genet 45:1452–1458.
Landes AM, Sperry SD, Strauss ME, Geldmacher DS (2001) Apathy in Alzheimer’s
disease. J Am Geriatr Soc 49:1700–1707.
Lee HG, Casadesus G, Zhu X, Takeda A, Perry G, Smith MA (2004) Challenging the
amyloid cascade hypothesis: Senile plaques and amyloid-β as protective adaptations
to Alzheimer disease. In: Annals of the New York Academy of Sciences, pp 1–4.
Lemere CA (2013) Immunotherapy for Alzheimer’s disease: hoops and hurdles. Mol
Neurodegener 8:36.
Liu D, Diorio J, Tannenbaum B, Caldji C, Francis D, Freedman a, Sharma S, Pearson D,
Plotsky PM, Meaney MJ (1997) Maternal care, hippocampal glucocorticoid
receptors, and hypothalamic-pituitary-adrenal responses to stress. Science
277:1659–1662.
Maccioni RB, Farías G, Morales I, Navarrete L (2010) The Revitalized Tau Hypothesis
on Alzheimer’s Disease. Arch Med Res 41:226–231.
Marchese M, Cowan D, Head E, Ma D, Karimi K, Ashthorpe V, Kapadia M, Zhao H,
Davis P, Sakic B (2014) Autoimmune manifestations in the 3xTg-AD model of
Alzheimer’s disease. J Alzheimers Dis 39:191–210.

30
Mark RJ, Hensley K, Butterfield D A, Mattson MP (1995) Amyloid beta-peptide impairs
ion-motive ATPase activities: evidence for a role in loss of neuronal Ca2+
homeostasis and cell death. J Neurosci 15:6239–6249.
Markesbery WR (1997) Oxidative stress hypothesis in Alzheimer’s disease. Free Radic
Biol Med 23:134–147.
Martinez-Coria H, Green KN, Billings LM, Kitazawa M, Albrecht M, Rammes G,
Parsons CG, Gupta S, Banerjee P, LaFerla FM (2010) Memantine improves
cognition and reduces Alzheimer’s-like neuropathology in transgenic mice. Am J
Pathol 176:870–880.
Mastrangelo MA, Bowers WJ (2008) Detailed immunohistochemical characterization of
temporal and spatial progression of Alzheimer’s disease-related pathologies in male
triple-transgenic mice. BMC Neurosci 9:81.
McKee AC, Carreras I, Hossain L, Ryu H, Klein WL, Oddo S, LaFerla FM, Jenkins BG,
Kowall NW, Dedeoglu A (2008) Ibuprofen reduces Abeta, hyperphosphorylated tau
and memory deficits in Alzheimer mice. Brain Res 1207:225–236.
Medina DX, Caccamo A, Oddo S (2011) Methylene blue reduces Aβ levels and rescues
early cognitive deficit by increasing proteasome activity. Brain Pathol 21:140–149.
Morris JC, Roe CM, Xiong C, Fagan AM, Goate AM, Holtzman DM, Mintun M a.
(2010) APOE predicts amyloid-beta but not tau Alzheimer pathology in cognitively
normal aging. Ann Neurol 67:122–131.
Mortimer J a, van Duijn CM, Chandra V, Fratiglioni L, Graves a B, Heyman A, Jorm a F,
Kokmen E, Kondo K, Rocca W a (1991) Head trauma as a risk factor for
Alzheimer’s disease: a collaborative re-analysis of case-control studies. EURODEM
Risk Factors Research Group. Int J Epidemiol 20 Suppl 2:S28–S35.
Movsesyan N, Ghochikyan A, Mkrtichyan M, Petrushina I, Davtyan H, Olkhanud PB,
Head E, Biragyn A, Cribbs DH, Agadjanyan MG (2008) Reducing AD-like
pathology in 3xTg-AD mouse model by DNA epitope vaccine - a novel
immunotherapeutic strategy. PLoS One 3:e2124.
Mulnard RA (2000) Estrogen Replacement Therapy for Treatment of Mild to Moderate
Alzheimer Disease: A Randomized Controlled Trial. JAMA J Am Med Assoc
283:1007–1015.
Murray ME, Graff-Radford NR, Ross O a, Petersen RC, Duara R, Dickson DW (2011)
Neuropathologically defined subtypes of Alzheimer’s disease with distinct clinical
characteristics: a retrospective study. Lancet Neurol 10:785–796.
31
Oakley H, Cole SL, Logan S, Maus E, Shao P, Craft J, Guillozet-Bongaarts A, Ohno M,
Disterhoft J, Van Eldik L, Berry R, Vassar R (2006) Intraneuronal beta-amyloid
aggregates, neurodegeneration, and neuron loss in transgenic mice with five familial
Alzheimer’s disease mutations: potential factors in amyloid plaque formation. J
Neurosci 26:10129–10140.
Oddo S, Billings L, Kesslak JP, Cribbs DH, LaFerla FM (2004) Abeta immunotherapy
leads to clearance of early, but not late, hyperphosphorylated tau aggregates via the
proteasome. Neuron 43:321–332.
Oddo S, Caccamo A, Shepherd JD, Murphy MP, Golde TE, Kayed R, Metherate R,
Mattson MP, Akbari Y, LaFerla FM (2003) Triple-transgenic model of Alzheimer’s
Disease with plaques and tangles: Intracellular Aβ and synaptic dysfunction. Neuron
39:409–421.
Oddo S, Vasilevko V, Caccamo A, Kitazawa M, Cribbs DH, LaFerla FM (2006)
Reduction of soluble Abeta and tau, but not soluble Abeta alone, ameliorates
cognitive decline in transgenic mice with plaques and tangles. J Biol Chem
281:39413–39423.
Oore JJ, Fraser LM, Brown RE (2013) Age-related changes in motor ability and motor
learning in triple transgenic (3xTg-AD) and control (B6129SF1/J) mice on the
accelerating Rotarod. Proc Nov Scotian Inst Sci 74:281–296.
Pettersson AF, Olsson E, Wahlund L-O (2005) Motor function in subjects with mild
cognitive impairment and early Alzheimer’s disease. Dement Geriatr Cogn Disord
19:299–304.
Pietropaolo S, Feldon J, Yee BK (2008) Age-dependent phenotypic characteristics of a
triple transgenic mouse model of Alzheimer disease. Behav Neurosci 122:733–747.
Pimplikar SW (2009) Reassessing the amyloid cascade hypothesis of Alzheimer’s
disease. Int J Biochem Cell Biol 41:1261–1268.
Priebe K, Brake WG, Romeo RD, Sisti HM, Mueller A, McEwen BS, Francis DD, Sisti
HM, Mueller A, McEwen BS, Brake WG (2005) Maternal influences on adult stress
and anxiety-like behavior in C57BL/6J and BALB/CJ mice: A cross-fostering study.
Dev Psychobiol 47:398–407.
Profenno L a., Porsteinsson AP, Faraone S V. (2010) Meta-Analysis of Alzheimer’s
Disease Risk with Obesity, Diabetes, and Related Disorders. Biol Psychiatry
67:505–512.
Radde R, Duma C, Goedert M, Jucker M (2008) The value of incomplete mouse models
of Alzheimer’s disease. Eur J Nucl Med Mol Imaging 35:S70–S74.
32
Rosario ER, Carroll JC, Oddo S, LaFerla FM, Pike CJ (2006) Androgens regulate the
development of neuropathology in a triple transgenic mouse model of Alzheimer’s
disease. J Neurosci 26:13384–13389.
Scarpini E, Scheltens P, Feldman H (2003) Treatment of Alzheimer’s disease: Current
status and new perspectives. Lancet Neurol 2:539–547.
Scheuner D et al. (1996) Secreted amyloid β–protein similar to that in the senile plaques
of Alzheimer’s disease is increased in vivo by the presenilin 1 and 2 and APP
mutations linked to familial Alzheimer's disease. Nat Med 2:864–870.
Schindowski K, Bretteville A, Leroy K, Bégard S, Brion J-P, Hamdane M, Buée L (2006)
Alzheimer’s disease-like tau neuropathology leads to memory deficits and loss of
functional synapses in a novel mutated tau transgenic mouse without any motor
deficits. Am J Pathol 169:599–616.
Smale G, Nichols NR, Brady DR, Finch CE, Horton WE (1995) Evidence for apoptotic
cell death in Alzheimer’s disease. Exp Neurol 133:225–230.
Sterniczuk R, Antle MC, Laferla FM, Dyck RH (2010) Characterization of the 3xTg-AD
mouse model of Alzheimer’s disease: part 2. Behavioral and cognitive changes.
Brain Res 1348:149–155.
Stevens LM, Brown RE (2014) Reference and working memory deficits in the 3xTg-AD
mouse between 2 and 15-months of age: A cross-sectional study. Behav Brain Res
278C:496–505.
Stover KR (2012) Effects of Maternal Environment on Behavioural Development in
Young Adult 3xTg-AD and B6129S/F2 Mice. MSc Thesis, Dalhousie University.
Stover KR, Campbell MA, Van Winssen CM, Brown RE (2015) Analysis of motor
function in 6 month old male and female 3xTg-AD mice. Behav Brain Res 281:16–
23.
Strittmatter WJ, Saunders a M, Schmechel D, Pericak-Vance M, Enghild J, Salvesen GS,
Roses a D (1993) Apolipoprotein E: high-avidity binding to beta-amyloid and
increased frequency of type 4 allele in late-onset familial Alzheimer disease. Proc
Natl Acad Sci U S A 90:1977–1981.
Teri L, Ferretti LE, Gibbons LE, Logsdon RG, McCurry SM, Kukull WA, McCormick
WC, Bowen JD, Larson EB (1999) Anxiety of Alzheimer’s disease: prevalence, and
comorbidity. J Gerontol A Biol Sci Med Sci 54:M348–M352.
Walsh DM, Klyubin I, Fadeeva J V, Rowan MJ, Selkoe DJ (2002) Amyloid-beta
oligomers: their production, toxicity and therapeutic inhibition. Biochem Soc Trans
30:552–557.

33
Wang JM, Singh C, Liu L, Irwin RW, Chen S, Chung EJ, Thompson RF, Brinton RD
(2010) Allopregnanolone reverses neurogenic and cognitive deficits in mouse model
of Alzheimer’s disease. Proc Natl Acad Sci U S A 107:6498–6503.
Webster SJ, Bachstetter AD, Nelson PT, Schmitt FA, Van Eldik LJ (2014) Using mice to
model Alzheimer’s dementia: an overview of the clinical disease and the preclinical
behavioral changes in 10 mouse models. Front Genet 5:88.
Weintraub S, Wicklund AH, Salmon DP (2012) The neuropsychological profile of
Alzheimer disease. Cold Spring Harb Perspect Med 2.
Willner P (1984) The validity of animal models of depression. Psychopharmacology
(Berl) 83:1–16.
World Health Organization (2012) Dementia: a public health priority.
Yamada K, Nabeshima T (2000) Animal models of Alzheimer’s disease and evaluation of
anti-dementia drugs. Pharmacol Ther 88:93–113.
Zhang Y, Kurup P, Xu J, Carty N, Fernandez SM, Nygaard HB, Pittenger C, Greengard P,
Strittmatter SM, Nairn AC, Lombroso PJ (2010) Genetic reduction of striatal-
enriched tyrosine phosphatase (STEP) reverses cognitive and cellular deficits in an
Alzheimer’s disease mouse model. Proc Natl Acad Sci U S A 107:19014–19019.

34
CHAPTER 2 AGE-RELATED CHANGES IN MOTOR BEHAVIOUR
AND ANXIETY IN THE 3XTG-AD MOUSE MODEL OF ALZHEIMER’S
DISEASE: A LONGITUDINAL STUDY
Kurt R. Stover1, Michelle E. Hicks1, Kaitlyn M. Gordon1, Sultan Darvesh2, and Richard
E. Brown1
1Departments of Psychology and Neuroscience 2Department of Medicine (Neurology) & Medical Neuroscience
Dalhousie University
PO Box 1500, Halifax, NS
Canada B3H 4R2
Submitted to Developmental Psychobiology
35
2.1 ABSTRACT
The breeding system of the 3xTg-AD mice requires that transgenic mice be reared
by transgenic mothers and wildtype controls (B6129SF2) reared by wildtype mothers to
create homozygous 3xTg-AD mice. We assessed the effect of maternal genotype by cross
fostering pups to create mixed genotype litters and tested pups in a longitudinal study
from 2, 6, 12, and 18 months of age. On the Rotarod 3xTg-AD mice performed better
than controls, females performed better than males, and all mice reared by wildtype
mothers performed better than those reared by 3xTg-AD mothers. In the elevated plus
maze and open field, the 3xTg-AD mice had decreased anxiety-like behaviour. Mice
reared by 3xTg-AD mothers had a higher density of tau-positive neurons in the
amygdala, but no difference in levels of amyloid beta. Overall the 3xTg-AD mice had
enhanced motor behaviour, decreased anxiety-like behaviour and maternal genotype had
little effect on the phenotype of 3xTg-AD and control mice in adulthood.
36
2.2 INTRODUCTION
Early life environment and maternal care have a lasting epigenetic effect on
neurobehavioral development (Kundakovic and Champagne, 2014). Such factors as
early-life stress and differences in level and quality of maternal care (Francis and
Meaney, 1999) can have long-term effects on the behaviour of rodents and humans. By
cross-fostering litters from two strains of mice with differing levels of maternal care
Priebe et al. (2005) found that the level and quality of maternal care affected anxiety-like
behaviour later in life.
Studying the interaction of genetics and environment is essential to fully
characterize mouse models of AD (Chouliaras et al., 2010). The 3xTg-AD mouse model
of Alzheimer’s disease (AD) co-expresses three human familial AD genes, presenilin-1
(M146V), amyloid precursor protein (APP swe-K67ON/M671L) and tau (P30IL) (Oddo
et al., 2003). This combination of transgenes causes the 3xTg-AD mouse to develop Aß
plaques and tau neuropathology. The intracellular Aß is detectable in the hippocampal
neurons at around three months of age, and extracellular Aß begins to develop at six and
fifteen months of age (Billings et al., 2005; Mastrangelo and Bowers, 2008). Tau
pathology is present in the hippocampal neurons at six months of age, and by nine
months of age tau pathology spreads to the motor cortex (Mastrangelo and Bowers,
2008).
Previous studies have shown that the 3xTg-AD mice differ from their B6129SF2
control mice in anxiety-like and motor behaviour. We have shown that the 3xTg-AD
mice have enhanced motor performance on the Rotarod, a test that measures motor
ability, grip strength, and a longer stride than B6129SF2 control mice at six months of

37
age (Stover et al., 2015a). Enhanced Rotarod performance in the 3xTg-AD mice at six
and seven months of age have also been reported previously (Blanchard et al., 2010;
Chen et al., 2013; Oore et al., 2013). However, Sterniczuk et al. (2010a) found no
differences between 7.5-11 month old female 3xTg-AD and C57BL/6J mice on the
Rotarod, which could be the result of having used C57BL/6J rather than B6129SF2
control mice, as there are strain differences in Rotarod performance. The motor
enhancement on the Rotarod appears to be stable with age, since Filali et al. (2012) have
demonstrated that female 3xTg-AD mice backcrossed to C57BL/6J mice also have
enhanced performance on the Rotarod relative to C57BL/6J control mice at 12-14 months
of age.
There are conflicting reports about the exploratory behaviour and activity levels
of 3xTg-AD mice as measured in the open field. Some reports that the 3xTg-AD mice are
less active than B6129SF2 mice from 4-15 months of age (Pietropaolo et al., 2009;
García-Mesa et al., 2011; Filali et al., 2012), others report no differences between 3xTg-
AD and control mice (Pietropaolo et al., 2008; Blanchard et al., 2010; Sterniczuk et al.,
2010a), and still others report increased activity in the open field in female 3xTg-AD
relative to B6129SF2 mice at seven (Chen et al., 2013) and 12 months (Pietropaolo et al.,
2008) of age. These conflict reports may be the result of a number of factors including
different origins of the mice, differing behavioural protocols, and differing housing
conditions.
Anxiety is a common symptom of AD in humans (Teri et al., 1999) and 3xTg-AD
mice have been tested for anxiety in the elevated plus maze. However, there are
conflicting reports about the level of anxiety in these mice. Some studies found no
38
differences in anxiety-like behavior on the EPM between 3xTg-AD and B6129SF2
control mice at 12-14 months of age (Filali et al., 2012) or 7 to 12 months of age
(Pietropaolo et al., 2008). Other studies report increased anxiety-like behaviour in female
3xTg-AD mice relative to B6129SF2 controls at 7 months of age (Blanchard et al., 2010;
Chen et al., 2013): One study reported a sex-dependant effect at 15 months of age, where
female 3xTg-AD displayed less anxiety-like behaviour than female B6129SF2 controls,
but there was no genotype difference in male mice (Pietropaolo et al., 2009). Because
measures of anxiety are confounded by differences in motor behaviour (O’Leary et al.,
2013), it is important to determine whether anxiety measures in 3xTg-AD mice are not
merely reflections of differences in locomotor behavior.
The 3xTg-AD females are bred with 3xTg-AD males to produce homozygous
transgenic pups, so 3xTg-AD mice are reared by 3xTg-AD mothers, and wildtype
(B6129SF2) mice are reared by B6129SF2 mothers. There are strain differences in
maternal care in mice (Brown et al., 1999b; Priebe et al., 2005; Champagne et al., 2007),
and since 3xTg-AD and wildtype control pups are reared by mothers of different
genotypes, some behavioural deficits in 3xTg-AD pups may be due to differing levels
and quality of maternal care. We have shown that maternal genotype affects behaviour in
the 3xTg-AD mouse pups between 2 and 24 days by cross fostering pups to mothers of
each genotype (Blaney et al., 2013). In order to determine the long term effects of
maternal genotype on anxiety-like and motor behaviour, we conducted a longitudinal
behavioural study of the cross-fostered pups from Blaney et al., (2013) at 2, 6, 12, and 18
months of age. After behavioural testing was completed we examined whether behaviour
differences in early life predicted differences at later ages and we analyzed the levels of
39
amyloid beta and tau pathology in the brains of these mice at 19 months of age to
determine whether the amount of pathology correlates with behaviour.
2.3 METHODS
2.3.1 BREEDING, CROSS-FOSTERING & PRE-WEANING TREATMENT OF
MICE
To produce mice for this experiment we bred four pairs of 3xTg-AD mice (JAX #
004807) and four pairs of B6129S/F2 mice (JAX# 101045), which were purchased from
Jackson Laboratories (Bar Harbor, Maine). These two strains are bred as separate lines,
so 3xTg-AD mice are always reared by 3xTg-AD mothers, and B6129SF2 mice are
always reared by B6129SF2 mothers. In order to study the effects of maternal genotype
we cross-fostered litters of 3xTg-AD and B6129SF2 mice to create mixed genotype
litters; no mother reared her own pups. To study early development in this strain the mice
underwent a neurodevelopmental test battery from post natal day 0-24, (see Blaney et al.,
2013). After weaning, the mice were housed in same sex mixed genotype groups of two
to four mice, in clear plastic cages measuring 18.75 x 28 x 12.5 cm, with wood chip
bedding, a PVC tube (4 cm diameter x 7 cm length) for enrichment, and metal wire
covers. They were fed Purina rodent chow (#5001, Purina, St. Louis, Missouri) and tap
water ad libitum, unless otherwise indicated. The colony room was maintained at 22±2
°C on a reversed 12:12 light:dark cycle, with lights off at 10:00am. This experiment was
approved by the Dalhousie University Committee on Animal Care.
2.3.2 PROCEDURE
We tested a total of 78 mice, 40 3xTg-AD (17 male and 24 female) and 38
B6129S/F2 (19 male and 19 female), in a longitudinal study with testing at 2, 6, 12, and
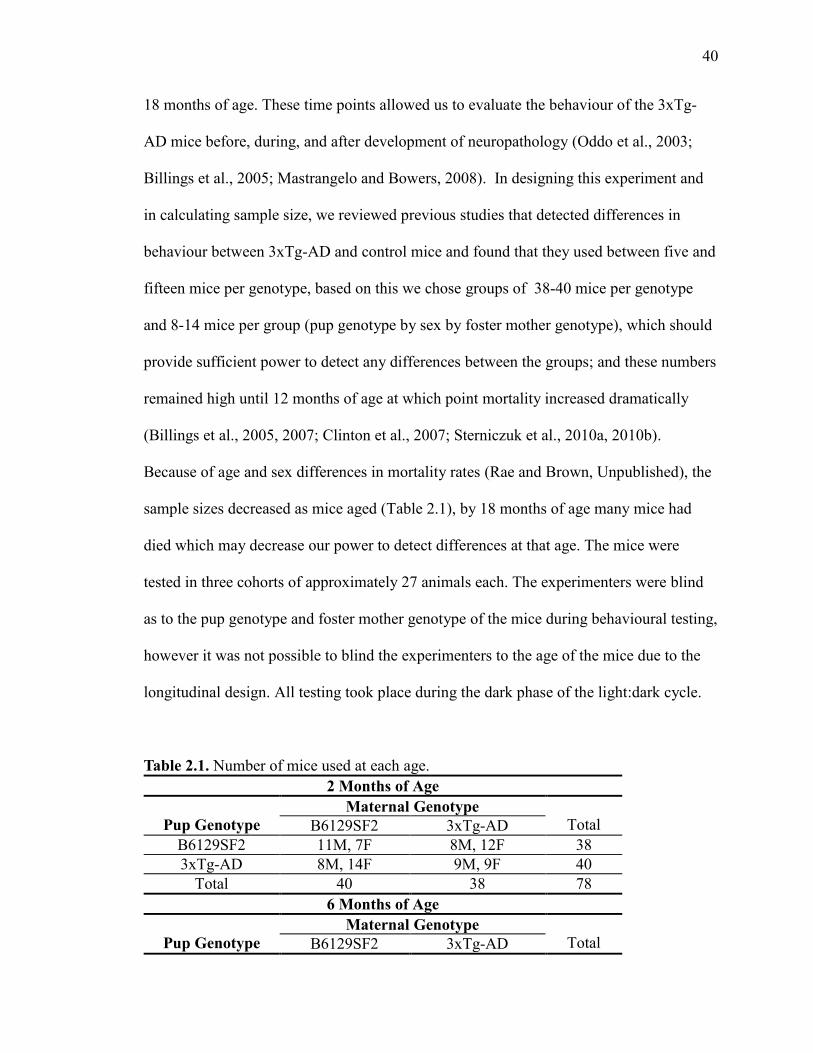
40
18 months of age. These time points allowed us to evaluate the behaviour of the 3xTg-
AD mice before, during, and after development of neuropathology (Oddo et al., 2003;
Billings et al., 2005; Mastrangelo and Bowers, 2008). In designing this experiment and
in calculating sample size, we reviewed previous studies that detected differences in
behaviour between 3xTg-AD and control mice and found that they used between five and
fifteen mice per genotype, based on this we chose groups of 38-40 mice per genotype
and 8-14 mice per group (pup genotype by sex by foster mother genotype), which should
provide sufficient power to detect any differences between the groups; and these numbers
remained high until 12 months of age at which point mortality increased dramatically
(Billings et al., 2005, 2007; Clinton et al., 2007; Sterniczuk et al., 2010a, 2010b).
Because of age and sex differences in mortality rates (Rae and Brown, Unpublished), the
sample sizes decreased as mice aged (Table 2.1), by 18 months of age many mice had
died which may decrease our power to detect differences at that age. The mice were
tested in three cohorts of approximately 27 animals each. The experimenters were blind
as to the pup genotype and foster mother genotype of the mice during behavioural testing,
however it was not possible to blind the experimenters to the age of the mice due to the
longitudinal design. All testing took place during the dark phase of the light:dark cycle.
Table 2.1. Number of mice used at each age.
2 Months of Age
Pup Genotype
Maternal Genotype
Total B6129SF2 3xTg-AD
B6129SF2 11M, 7F 8M, 12F 38
3xTg-AD 8M, 14F 9M, 9F 40
Total 40 38 78
6 Months of Age
Pup Genotype
Maternal Genotype
Total B6129SF2 3xTg-AD

41
B6129SF2 11M, 7F 8M, 12F 38
3xTg-AD 7M, 14F 9M, 8F 38
Total 39 37 76
12 Months of Age
Pup Genotype
Maternal Genotype
Total B6129SF2 3xTg-AD
B6129SF2 11M, 5F 8M, 12F 36
3xTg-AD 6M, 13F 9M, 8F 36
Total 35 37 72
18 Months of Age
Pup Genotype
Maternal Genotype
Total B6129SF2 3xTg-AD
B6129SF2 10M, 5F 7M, 7F 29
3xTg-AD 1M, 11F 2M, 5F 19
Total 27 21 48
Mice used for Histology at 19 Months of Age
Pup Genotype
Maternal Genotype
Total B6129SF2 3xTg-AD
3xTg-AD 1M, 9F 0M, 5F 15
Total 10 5
2.3.3 TEST BATTERY
The tests were completed in the order described below. This was designed such
that the order of administration of the tests was from least to most stressful to minimize
the effect of stress on test results. The mice also underwent a test battery to assess
prepulse inhibition, cognitive, and social behaviour.
2.3.3.1 ELEVATED PLUS MAZE
The elevated plus maze apparatus and test procedure described by Brown et al.
(1999) were used. The apparatus consisted of a plus shaped maze with two open arms (30
x 5 cm) with a 4 mm lip to prevent the mouse from slipping off, and two closed arms (30
x 5 cm) with transparent Plexiglas walls (15 cm high). The arms were connected by a
center square (5 x 5 cm). The floor of the maze was grey Plexiglas. Testing was
completed in a room (2 x 5 m) illuminated by two 60 W white bulbs. Each mouse was

42
tested on one five minute trial and between mice the maze was cleaned with a 70%
ethanol solution. At the beginning of the trial the mice were placed in the center square
facing an open arm. A camera 2.1 m above the maze recorded the movement of the mice
throughout the trial. The time in the open and closed arms, and the distance travelled
were recorded by a computerized tracking system (Limelight, Actimetrics Inc., Wilmette,
IL). The duration of grooming, freezing (remaining completely immobile expect for
respiration), the number of bouts of rearing (removing forepaws from the floor of the
maze), stretch attend postures (extending its head and then returning to the previous
position), and head dips (moving its head over the edge of the maze and pointing
downwards) were recorded. In the elevated plus maze distance travelled, rears and head
dips are measures of locomotor behaviour and the percentage of time in the closed arms,
stretch attend postures, and time spent freezing are measures of anxiety (O’Leary et al.,
2013).
2.3.3.2 OPEN FIELD
The open field test was performed using the procedure of Brown et al. (1999).
The open field was a square box constructed from wood and painted white (72 x 72 cm
with 36 cm high walls). The floor was covered with transparent Plexiglas which had an
18 x 18 cm center square drawn in the middle. Testing occurred in the same room as the
elevated plus maze. To begin a trial a mouse was placed in a corner of the open field and
their behaviour was recorded for five minutes. The time in the centre square, and total
distance travelled were recorded by the Limelight computerized tracking system and the
experimenter recorded the number of center square entries, rears against the wall, rears in
the center of the maze (forepaws not touching any walls), time spent grooming, number
43
of stretch attend postures, and time spent freezing. Between mice the maze was cleaned
with a 70% ethanol and allowed to dry. In the open field rears and distance travelled are
measures of locomotion while stretch attend postures, time in the centre, center rears, and
time spent freezing are measures of anxiety.
2.3.3.3 ROTAROD
In order to examine motor coordination and learning, mice were tested on the
accelerating Rotarod for six trials a day for five days (Accuscan Instruments Inc.
Columbus, Ohio), using the procedure described by Brown and Wong (2007). The
Rotarod consisted of a plastic rod (3 cm diameter) which was divided by plastic dividers
(14 cm diameter) into four sections (11 cm wide). Holding chambers were located 39 cm
below each of the four sections. The mice were weighed each day and then placed on the
Rotarod which accelerated from 0 to 48 rpm over a trial lasting a maximum of 360
seconds. The latency to fall for each mouse was recorded. If a mouse did not fall after
360 seconds it was placed in the holding chamber. The mice were given a 60 second
inter-trial interval after the last mouse fell from the rod. Mice were tested in the dark
phase of the L:D cycle in a room lit by a 60 W red bulb. The average latency to fall each
day was analyzed.
2.3.4 HISTOLOGY
After behavioural testing was completed at 19 months of age the levels of
amyloid beta and tau pathology in the brains of the mice were evaluated. We used 15
mice for this analysis (see Table 2.1).

44
2.3.4.1 TISSUE PREPARATION
Mice were deeply anaesthetized with an intraperitoneal injection of sodium
pentobarbital (200mg/kg) and perfused with 0.1M phosphate buffered saline (PBS),
followed by 4% paraformaldehyde in 0.1M phosphate buffer (PB). The brains were
removed and post-fixed in 4% paraformaldehyde in PB for one hour. They were then
cryo-protected in PB with 30% sucrose for a minimum of 72 hours. Entire brains were
cut in 40μm thick equal sections in coronal plane using a Leica SM2000R microtome
with a freezing stage (Leica Microsystems Inc., Nussloch, Germany) and stored in PBS
with 0.1% sodium azide. The brains were separated into six series, and adjacent sections
were used for Aß and tau immunohistochemistry.
2.3.4.2 AΒ IMMUNOHISTOCHEMISTRY
Aβ immunohistochemistry was performed using the procedure described by
Darvesh et al. (2012). Briefly, sections were rinsed for 5 minutes in 0.05 M PB (pH 7.4),
followed by distilled water (dH2O), and then treated with 90% formic acid for 2 minutes
to improve antigen retrieval (Kitamoto et al., 1987). Sections were then rinsed 5 times in
dH2O for 1 minute each and twice in PB for 15 minutes. Sections were placed in 0.3%
H2O2 in PB for 30 minutes and rinsed for 30 minutes in PB. Sections were then incubated
in PB containing 0.1% Triton X-100, normal goat serum (1:100), and a polyclonal rabbit
anti-amyloid antibody (1:400; 71-5800, Invitrogen, Camarillo, CA), which is specific for
the 4- to 5-kDa amyloid peptide derived by cleavage from the amyloid precursor protein
(Jankowsky et al., 2007), for approximately 16 hours at room temperature. After rinsing,
sections were incubated in PB with 0.1% Triton X-100, biotinylated goat anti-rabbit
secondary antibody (1:500), and normal goat serum (1:1000) for 1 hour. After another
45
rinse, sections were placed in PB with 0.1% Triton X-100 and Vectastain Elite ABC kit
(1:182; PK-6100, Vector Laboratories, Burlingame, CA), according to the manufacturer’s
instructions for 1 hour. Sections were rinsed and developed in a solution of PB containing
1.39 M 3,3 diaminobenzidine tetrahydrochloride (DAB). After 5 minutes, 50 µL of
0.3%H2O2 in dH2O was added per milliliter of DAB solution, and the sections incubated
for 10 minutes. The reaction was stopped by rinsing the sections in 0.01 M acetate buffer
(pH 3.3). In control experiments, no staining was observed when the primary antibody
was omitted. The total area of Aβ plaque load was assessed in the hippocampus,
amygdala, and the cerebral cortex using the National Institute of Health ImageJ software.
The areas of interest were parcellated according to the Paxinos and Franklin mouse atlas
(Paxinos and Franklin, 2001). An intensity threshold was chosen to distinguish between
plaque immunoreactivity and background staining and was kept constant throughout
quantification.
2.3.4.3 TAU IMMUNOHISTOCHEMISTRY
The tau Immunohistochemistry was performed as above except the primary
antibodies were polyclonal rabbit anti-human tau (Dako #A0024) and the secondary
antibodies were biotinylated goat anti-rabbit secondary antibody (1:500). The levels of
tau pathology in the amygdala and the pyramidal cell layer of the hippocampus were
quantified using unbiased stereology, as described by Tran et al. (2011). Breifly, the
StereoInvestigator software was used to selecte the area of interest optical fractionator
stereological method was used to estimate the number of tau positive neurons in that area.
There was little tau straining in the cerebral cortex or other layers of the hippocampus, so
they were not analyzed.

46
2.3.5 STATISTICAL ANALYSES
Statistical analyses were performed with R (www.R-project.org) using linear
mixed effects models, with genotype, foster mother genotype, sex and age as possible
predictors. For behaviours without repeated measures all of the possible models were
constructed, and the second order Akaike information criterion (AICc), Akaike weight,
and evidence ratio were calculated for each model. The model with the lowest AICc was
chosen as the ‘best’ model. For behaviours with a repeated measures component the
model was chosen using backwards elimination. Models with three-way or greater
interactions involving age were excluded due to the low numbers of mice in some groups
at 18 months of age. The chosen model was compared to the null model with a χ2 test
(Akaike, 1974; Burnham and Anderson, 2002). We calculated confidence intervals (95%)
for all effects in the model. For measures with significant effects of genotype, sex, or
foster mother genotype, the effect size was calculated using Cohen’s d with a Hedge’s
(dunb) for an unbiased measure (Hedges, 1981; Cumming, 2014).
In order to examine the relationship between locomotor behaviour before weaning
and at later ages we included activity in the open field from the study conducted by
Blaney et al. (2013) as a possible predictor of locomotor behaviours in the OF, EPM, and
Rotarod.
The relationship between neuropathology and behaviour was analyzed by
correlating levels of neuropathology with behavioural measures that had genotype
differences using Pearson’s r for all mice with neuropathology data. If there was more
than one measure that evaluated a similar behaviour (e.g. Time in the closed arms and
distance in the closed arms in the elevated plus maze), the measure with the larger effect
47
size was included in the correlation to decrease the number of similar measures included
in the correlation and to prevent issues with multiple comparisons.
2.4 RESULTS
The number of animals tested at each age group, their genotypes and sex are
summarized in Table 2.1.
2.4.1 ELEVATED PLUS MAZE
2.4.1.1 LOCOMOTOR BEHAVIOURS
The best model for distance travelled had genotype, foster mother genotype, sex,
age, a genotype by foster mother genotype interaction, a genotype by sex interaction, a
foster mother genotype by sex interaction and a genotype by age interaction
(AICc=4064.248, Figure 2.1A; See also Supplemental Table 2.1.1 and Supplemental
Figure 2.1A), which differed significantly from the null model (χ2(12, N=272)= 159.39, p
<0.0001). Confidence intervals (CIs) indicated that B6129SF2 mice travelled a greater
distance than 3xTg-AD mice (CI95= 275.49 – 546.24cm) and mice reared by B6129SF2
mothers travelled a greater distance than those reared by 3xTg-AD mothers (CI95= -
429.91 – -62.08cm). Although there was no overall sex effect (CI95= -90.53 –
283.16cm), the pup genotype by sex interaction showed that 3xTg-AD females travelled
a greater distance than 3xTg-AD males (CI95= -11.159 – 378.292 cm) while B6129SF2
females travelled a shorter distance than B6129SF2 males (CI95= -285.729 – 90.072 cm).
The maternal genotype by sex interaction showed that females reared by B6129SF2
mothers travelled a greater distance than males (-32.838 – 344.130 cm) while there was
no sex difference in mice reared by 3xTg-AD mothers (CI95= -116.455 – 257.676 cm).
The total distance travelled was highest at 2 months of age and was lower at 6, 12, and 18
48
months of age (2m vs 6m: CI95= -931.03 – -594.91, 12m: CI95= -981.14 – -652.04, 18m:
CI95= -1045.25 – -685.13). The pup genotype by foster mother genotype interaction
occurred because there was no difference between maternal genotypes in 3xTg-AD mice
(CI95= -243.726 – 132.136 cm), but B6129SF2 mice reared by B6129SF2 mothers
travelled a greater distance than B6129SF2 mice reared by 3xTg-AD mothers (CI95=
58.214 – 430.646 cm). The age by genotype interaction showed a large difference
between genotypes at two months of age (CI95= 527.876 – 903. 998cm) but this
difference was smaller later ages (18m: CI95= 111.660 – 588.456cm).
For the number of rears the best model had only age (AICc=1451.552, Figure
2.1B; See also Supplemental Table 2.1.2 and Supplemental Figure 2.1B), which differed
significantly from the null model (χ2(3, N=272)= 12.548, p =0.0057). The number of
rears decreased from 2 to 6 months of age (CI95= -2.057 – 0.043 rears), and from 2 to 12
months of age (CI95= 2.235 – -0.060 rears), and returned to near the 2 month levels at 18
months of age (CI95= -0.531 – 1.917 rears).
The best model for the number of head dips had age, genotype, and a genotype by
age interaction (AICc=1985.685, Figure 2.1C; See also Supplemental Table 2.1.3 and
Supplemental Figure 2.1C), which differed significantly from the null model (χ2(4,
N=272)= 22.008, p =0.0025). The number of head dips decreased from 2 to 18 months of
age (CI95= -7.202 – -0.960 dips). And although there was no difference between
genotypes (CI95= -8.171 – 2.407 dips), the genotype by age interaction showed that the
3xTg-AD mice made more head dips than B6129SF2 mice at 18 months of age (CI95=
1.647 – 9.784 dips), but there was no genotype difference at earlier ages.
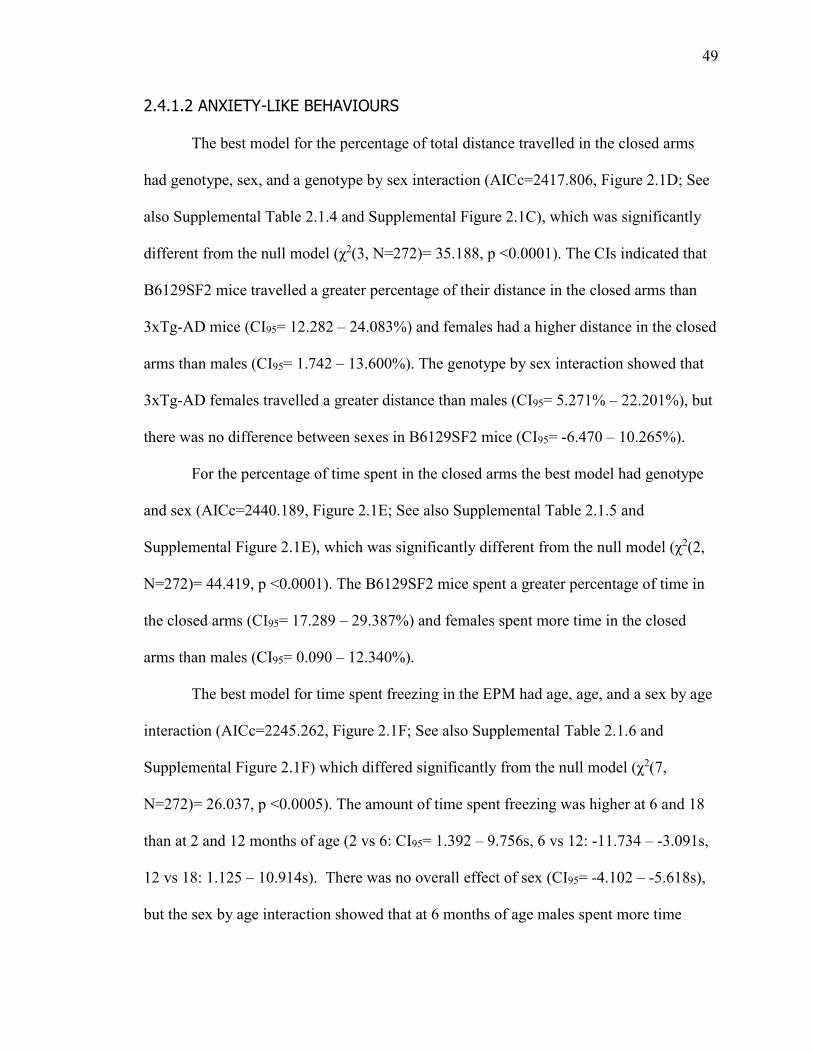
49
2.4.1.2 ANXIETY-LIKE BEHAVIOURS
The best model for the percentage of total distance travelled in the closed arms
had genotype, sex, and a genotype by sex interaction (AICc=2417.806, Figure 2.1D; See
also Supplemental Table 2.1.4 and Supplemental Figure 2.1C), which was significantly
different from the null model (χ2(3, N=272)= 35.188, p <0.0001). The CIs indicated that
B6129SF2 mice travelled a greater percentage of their distance in the closed arms than
3xTg-AD mice (CI95= 12.282 – 24.083%) and females had a higher distance in the closed
arms than males (CI95= 1.742 – 13.600%). The genotype by sex interaction showed that
3xTg-AD females travelled a greater distance than males (CI95= 5.271% – 22.201%), but
there was no difference between sexes in B6129SF2 mice (CI95= -6.470 – 10.265%).
For the percentage of time spent in the closed arms the best model had genotype
and sex (AICc=2440.189, Figure 2.1E; See also Supplemental Table 2.1.5 and
Supplemental Figure 2.1E), which was significantly different from the null model (χ2(2,
N=272)= 44.419, p <0.0001). The B6129SF2 mice spent a greater percentage of time in
the closed arms (CI95= 17.289 – 29.387%) and females spent more time in the closed
arms than males (CI95= 0.090 – 12.340%).
The best model for time spent freezing in the EPM had age, age, and a sex by age
interaction (AICc=2245.262, Figure 2.1F; See also Supplemental Table 2.1.6 and
Supplemental Figure 2.1F) which differed significantly from the null model (χ2(7,
N=272)= 26.037, p <0.0005). The amount of time spent freezing was higher at 6 and 18
than at 2 and 12 months of age (2 vs 6: CI95= 1.392 – 9.756s, 6 vs 12: -11.734 – -3.091s,
12 vs 18: 1.125 – 10.914s). There was no overall effect of sex (CI95= -4.102 – -5.618s),
but the sex by age interaction showed that at 6 months of age males spent more time

50
freezing than females (CI95= 1.805 - 15.644s), at 18 months of age females spent more
time freezing than males (CI95= -1.041 – 15.887s), and there was no difference between
males and females at other ages.
For the number of stretch attend postures the best model had only age
(AICc=1138.767, Figure 2.1G; See also Supplemental Table 2.1.7 and Supplemental
Figure 2.1G), which differed significantly from the null model (χ2(3, N=272)=23.481 , p
<0.0001). The number of SAPs increased from 2 to 12 (CI95= 0.478 –1.703 SAPs) and 2
to 18 (CI95= 0.676 – 2.080 SAPs) months of age.

51
2 6 1 2 1 8
0
2 0
4 0
6 0
% T im e C lo s e d A rm s
A ge (m )
% T
ime
in
Clo
se
d A
rm
s
F e m a le M ale
T G _ P W T _ P T G _ P W T _ P T G _ P W T _ P T G _ P W T _ P
2 6 1 2 1 8
0
5 0 0
1 0 0 0
1 5 0 0
2 0 0 0
2 5 0 0
D is ta n c e
A ge (m )
Dis
tan
ce
(c
m)
TG _M TG _M
W T _ M W T _ M
T G _ P W T _ P T G _ P W T _ P T G _ P W T _ P T G _ P W T _ P
F e m a le M ale
*
2 6 1 2 1 8
0
2 0
4 0
6 0
8 0
% D is ta n c e C lo s e d A rm s
% D
ista
nc
e i
n C
los
ed
Arm
s
F e m a le M ale
T G _ P W T _ P T G _ P W T _ P T G _ P W T _ P T G _ P W T _ P
2 6 1 2 1 8
0
5
1 0
1 5
2 0F r e e z in g
A g e (m )
Fre
ez
ing
(s
)
F e m a le
M ale*
*
2 6 1 2 1 8
0
5
1 0
1 5
2 0
2 5
G r o o m in g
A g e (m )
Tim
e S
pe
nt
Gro
om
ing
(s
)
F e m a le
M ale
T G _ P W T _ P T G _ P W T _ P T G _ P W T _ P T G _ P W T _ P
*
2 6 1 2 1 8
0
5
1 0
1 5
2 0 H e a d D ip s
A g e (m )
He
ad
Dip
s (
n)
T G _ P W T _ P T G _ P W T _ P T G _ P W T _ P T G _ P W T _ P
TG _P
W T _ P
*
2 6 1 2 1 8
0
1
2
3
4
5
R e a rs
A ge (m )
Re
ars
(n
)
*
2 6 1 2 1 8
0
1
2
3
S A P s
A ge (m )
SA
Ps
(n
)
*
A B
C D
E F
G H
Figure 2.1 The Elevated Plus Maze. The mean (± S.E.M) total distance travelled (A),
number of rears (B) and head dips (C), percentage of distance (D) and time (E) spent in
the closed arms, the time spent freezing (F), number of stretch attend postures (G) and
time spent grooming (H) of 3xTg-AD (TG_P) and B6129SF2 (WT_P) mice reared by
3xTg-AD (TG_M) and B6129SF2 (WT_M) foster mothers in the elevated plus maze.

52
2.4.1.3 GROOMING
For the amount of time spent grooming the best model had genotype, sex, and
age, a genotype by sex interaction, and a genotype by age interaction (AICc=1878.803,
Figure 2.4.1H; See also Supplemental Table 2.1.8 and Supplemental Figure 2.1H), which
differed significantly from the null model (χ2(9, N=272)= 44.089, p <0.0001). The
B6129SF2 mice spent more time grooming than 3xTg-AD mice (CI95= 3.197 – 11.893s),
males spent more time grooming than females (CI95= -0.849 – 3.362s), and the amount of
time spent grooming increased from 2 to 18 months of age (CI95= 2.422 – 7.615s). The
genotype by sex interaction occurred because male B6129SF2 mice spent more time
grooming than females (CI95= 0.207 – 6.152s), but there was no difference between the
sexes in 3xTg-AD mice (CI95= -3.591 – 2.285s). The genotype by age interaction was
caused by B6129SF2 mice spending more time grooming than 3xTg-AD mice at 12
months of age (CI95= 1.094 – 8.007s) and 18 months of age (CI95= 3.234 – 11.951s) but
not earlier ages.
2.4.2 OPEN FIELD
2.4.2.1 LOCOMOTOR BEHAVIOURS
In the open field the best model for the distance travelled had only age
(AICc=4354.535, Figure 2.2A, See also Supplemental Table 2.2.1 Supplemental Figure
2.2A), which was significantly different from the null model (χ2(3, N=273)=49.604, p
<0.0001). The distance travelled decreased with age (2-18m: CI95= -908.243 – -
460.112cm), though it did not change from 12-18 months of age (CI95=-254.140 –
198.252cm).
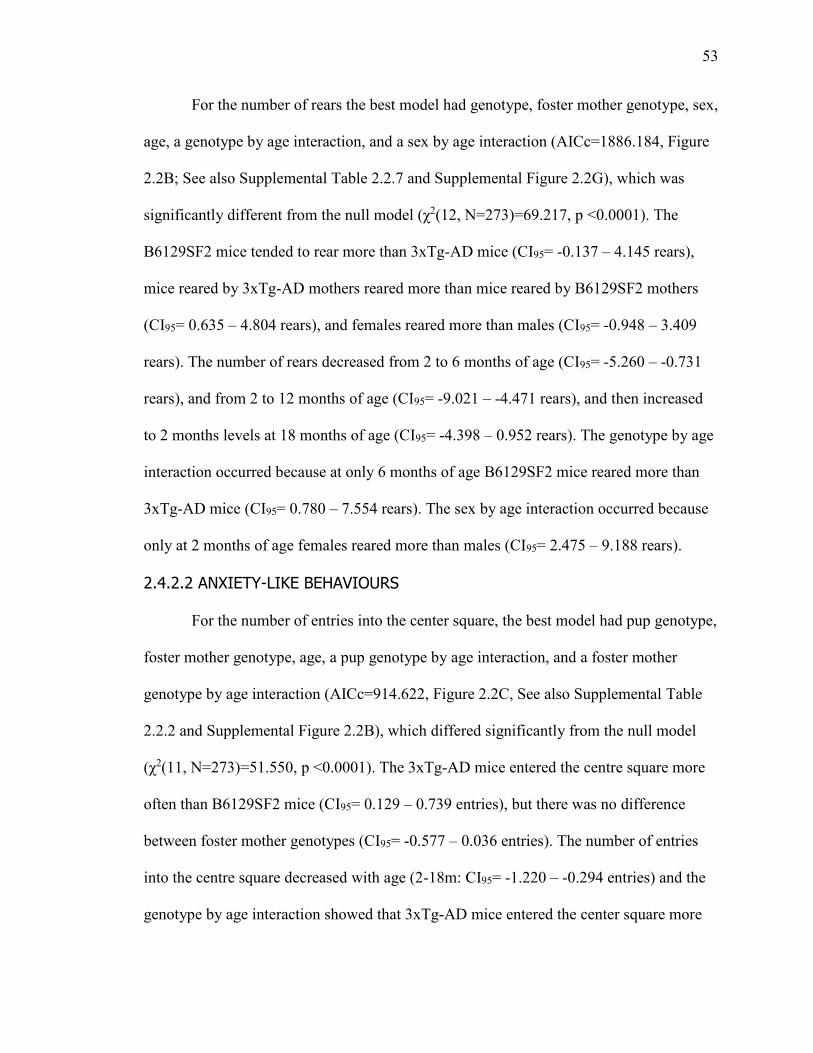
53
For the number of rears the best model had genotype, foster mother genotype, sex,
age, a genotype by age interaction, and a sex by age interaction (AICc=1886.184, Figure
2.2B; See also Supplemental Table 2.2.7 and Supplemental Figure 2.2G), which was
significantly different from the null model (χ2(12, N=273)=69.217, p <0.0001). The
B6129SF2 mice tended to rear more than 3xTg-AD mice (CI95= -0.137 – 4.145 rears),
mice reared by 3xTg-AD mothers reared more than mice reared by B6129SF2 mothers
(CI95= 0.635 – 4.804 rears), and females reared more than males (CI95= -0.948 – 3.409
rears). The number of rears decreased from 2 to 6 months of age (CI95= -5.260 – -0.731
rears), and from 2 to 12 months of age (CI95= -9.021 – -4.471 rears), and then increased
to 2 months levels at 18 months of age (CI95= -4.398 – 0.952 rears). The genotype by age
interaction occurred because at only 6 months of age B6129SF2 mice reared more than
3xTg-AD mice (CI95= 0.780 – 7.554 rears). The sex by age interaction occurred because
only at 2 months of age females reared more than males (CI95= 2.475 – 9.188 rears).
2.4.2.2 ANXIETY-LIKE BEHAVIOURS
For the number of entries into the center square, the best model had pup genotype,
foster mother genotype, age, a pup genotype by age interaction, and a foster mother
genotype by age interaction (AICc=914.622, Figure 2.2C, See also Supplemental Table
2.2.2 and Supplemental Figure 2.2B), which differed significantly from the null model
(χ2(11, N=273)=51.550, p <0.0001). The 3xTg-AD mice entered the centre square more
often than B6129SF2 mice (CI95= 0.129 – 0.739 entries), but there was no difference
between foster mother genotypes (CI95= -0.577 – 0.036 entries). The number of entries
into the centre square decreased with age (2-18m: CI95= -1.220 – -0.294 entries) and the
genotype by age interaction showed that 3xTg-AD mice entered the center square more

54
often than wildtype mice at 2 months of age (CI95= 0.684 – 1.831 entries) but by 18
months of age there was no longer a difference between genotypes (CI95= -0.547 – 0.920
entries). Similarly the foster mother genotype by age interaction occurred because at 2
months of age mice reared by 3xTg-AD mothers entered the center square more often
than mice reared by B6129SF2 mothers (CI95= 0.447 – 1.560 entries), but by 18 months
of age there was no difference (CI95= -0.557 – 0.885 entries).
For the amount of time spent in the center the best model had genotype, age, and a
genotype by age interaction (AICc= 1210.696, Figure 2.2D; See also Supplemental Table
2.2.3 and Supplemental Figure 2.2C), which differed significantly from the null model
(χ2(7, N=273)=29.165, p =0.0001). The 3xTg-AD mice spent more time in the center
square than B6129SF2 mice (CI95= 0.408 – 1.500 s), and the amount of time in the center
square decreased from 2 to 6 (CI95= -1.455 – -0.137 s) and 2 to 12 months of age (CI95= -
1.772 – -0.392 s), but increased at 18 months of age (CI95= -1.219 – 0.340 s). The
genotype by age interaction occurred because at 2 and 18 months of age 3xTg-AD mice
spent more time in the center square than B6129SF2 mice (CI95= 0.943 – 2.847s, and
CI95= 0.042 – 2.569s, respectively), but there was no difference at 6 or 12 months of age
(CI95= -0.526 – 1.415s, and CI95= -0.911 – 1.123s, respectively).
For the number of center rears the best model had pup genotype, foster mother
genotype, sex, age, a foster mother genotype by age interaction, and a sex by age
interaction (AICc=1102.712, , Figure 2.2E; See also Supplemental Table 2.2.4 and
Supplemental Figure 2.2D), which differed significantly from the null model (χ2(12,
N=273)=36.768, p =0.0002). The 3xTg-AD mice had more center rears than B6129SF2
mice (CI95= 0.092 – 1.05 rears), there was no difference between foster mother genotypes

55
(CI95= -0.317 – 0.665 rears), and there was some evidence that males had more center
rears than females (CI95= -0.0004 – 0.975 rears). The number of rears increased from 2 to
18 months of age (CI95= 0.188 – 1.442 rears), but there no difference between 2 and 6
months of age (CI95= -0.801 – 0.287 rears), or 2 and 12 (CI95= -0.990 – 0.134 rears). The
foster mother genotype by age interaction occurred because mice reared by 3xTg-AD
mothers had more center rears than mice reared by B6129SF2 mothers only at 18 months
of age (CI95= 0.454 – 2.56 rears), and the sex by age interaction occurred because only at
18 months of age males reared in the center more than females (CI95= 0.766 – 2.786
rears).
For the time spent freezing the best model had only foster mother genotype
(AICc=2159.739, Figure 2.2F; See also Supplemental Table 2.2.6 and Supplemental
Figure 2.2F), which was significantly different from the null model (χ2(8, N=273)=6.766,
p =0.0093). Mice reared by B6129SF2 mothers spent more time freezing than mice
reared by 3xTg-AD mothers (CI95= 0.986 – 7.033 s).
For the number of stretch attend postures the best model had only age
(AICc=1139.625, Figure 2.2H; See also Supplemental Table 2.2.8 and Supplemental
Figure 2.2G), which differed significantly from the null model (χ2(3, N=273)=16.649, p
<0.0002). The number of SAPs increased from 2 to 6 (CI95= 0.528 – 1.620 SAPs), and 2
to 12 (CI95= 0.395 – 1.527 SAPs) months of age, but there was no difference between 2
and 18 months of age (CI95= -0.460 – 0.809 SAPs).
2.4.2.3 GROOMING
For the amount of time spent grooming the best model had genotype, foster
mother genotype, sex, age, a genotype by sex interaction, and a foster mother genotype
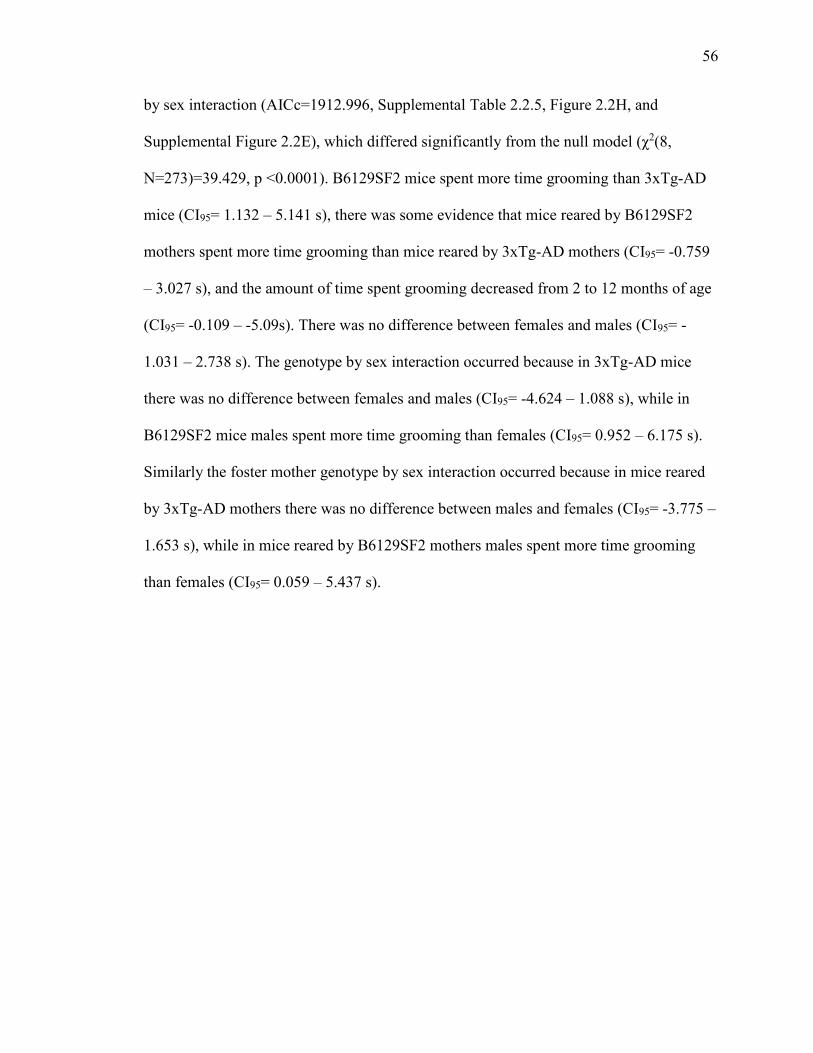
56
by sex interaction (AICc=1912.996, Supplemental Table 2.2.5, Figure 2.2H, and
Supplemental Figure 2.2E), which differed significantly from the null model (χ2(8,
N=273)=39.429, p <0.0001). B6129SF2 mice spent more time grooming than 3xTg-AD
mice (CI95= 1.132 – 5.141 s), there was some evidence that mice reared by B6129SF2
mothers spent more time grooming than mice reared by 3xTg-AD mothers (CI95= -0.759
– 3.027 s), and the amount of time spent grooming decreased from 2 to 12 months of age
(CI95= -0.109 – -5.09s). There was no difference between females and males (CI95= -
1.031 – 2.738 s). The genotype by sex interaction occurred because in 3xTg-AD mice
there was no difference between females and males (CI95= -4.624 – 1.088 s), while in
B6129SF2 mice males spent more time grooming than females (CI95= 0.952 – 6.175 s).
Similarly the foster mother genotype by sex interaction occurred because in mice reared
by 3xTg-AD mothers there was no difference between males and females (CI95= -3.775 –
1.653 s), while in mice reared by B6129SF2 mothers males spent more time grooming
than females (CI95= 0.059 – 5.437 s).
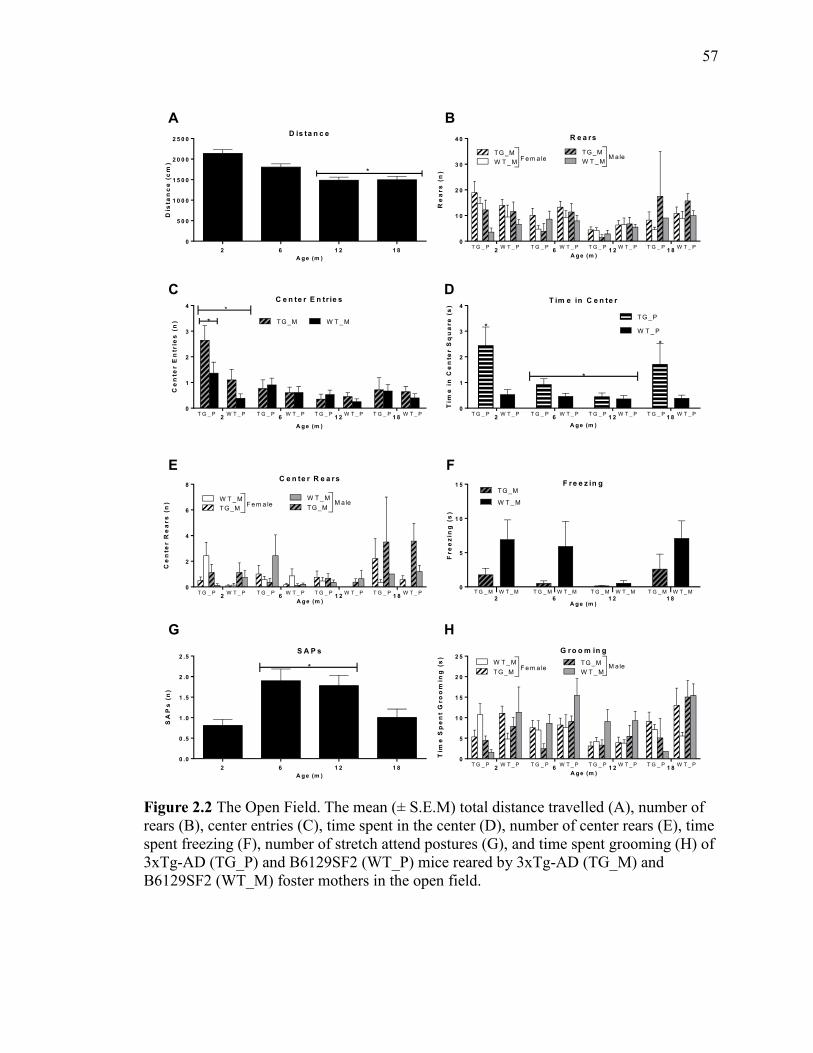
57
2 6 1 2 1 8
0
5 0 0
1 0 0 0
1 5 0 0
2 0 0 0
2 5 0 0D is ta n c e
A ge (m )
Dis
tan
ce
(c
m)
*
2 6 1 2 1 8
0
1
2
3
4C e n te r E n tr ie s
A ge (m )
Ce
nte
r E
ntr
ies
(n
)
T G _ P W T _ P T G _ P W T _ P T G _ P W T _ P T G _ P W T _ P
TG _M W T _ M*
*
2 6 1 2 1 8
0
1
2
3
4T im e in C e n te r
A ge (m )
Tim
e i
n C
en
ter S
qu
are
(s
)
T G _ P W T _ P T G _ P W T _ P T G _ P W T _ P T G _ P W T _ P
TG _P
W T _ P*
*
*
T G _ M W T _ M
2 6 1 2 1 8
0
5
1 0
1 5 F r e e z in g
A g e (m )
Fre
ez
ing
(s
)
T G _ M W T _ M T G _ M W T _ M T G _ M W T _ M
TG _M
W T _ M
2 6 1 2 1 8
0
5
1 0
1 5
2 0
2 5G r o o m in g
A ge (m )
Tim
e S
pe
nt
Gro
om
ing
(s
)
TG _M
T G _ P W T _ P T G _ P W T _ P T G _ P W T _ P T G _ P W T _ P
TG _MW T _ M
W T _ MF e m a le M ale
2 6 1 2 1 8
0
2
4
6
8C e n te r R e a r s
A ge (m )
Ce
nte
r R
ea
rs
(n
)
T G _ P W T _ P T G _ P W T _ P T G _ P W T _ P T G _ P W T _ P
F e m a le M aleTG _M
W T _ M
TG _M
W T _ M
2 6 1 2 1 8
0
1 0
2 0
3 0
4 0 R e a rs
A ge (m )
Re
ars
(n
)
T G _ P W T _ P T G _ P W T _ P T G _ P W T _ P T G _ P W T _ P
F e m a le M aleTG _M
W T _ M
TG _M
W T _ M
2 6 1 2 1 8
0 .0
0 .5
1 .0
1 .5
2 .0
2 .5S A P s
A ge (m )
SA
Ps
(n
)
*
A B
C D
E F
G H
Figure 2.2 The Open Field. The mean (± S.E.M) total distance travelled (A), number of
rears (B), center entries (C), time spent in the center (D), number of center rears (E), time
spent freezing (F), number of stretch attend postures (G), and time spent grooming (H) of
3xTg-AD (TG_P) and B6129SF2 (WT_P) mice reared by 3xTg-AD (TG_M) and
B6129SF2 (WT_M) foster mothers in the open field.

58
2.4.3 ROTAROD
The best model for body weight had pup genotype, foster mother genotype, sex,
age, a genotype by sex interaction, a genotype by age interaction, and a foster mother
genotype by sex by age interaction (AICc=1539.390, Figure 2.3A; See also Supplemental
Table 2.3), which differed significantly from the null model (χ2(20,N= 273)= 318.88, p <
0.001). Male mice were heavier than female mice (CI95= 0.761 – 6.665g) and the mice
increased in weight with age (2-18m: CI95= 9.150 – 14.377 g). Although there was no
main effect of genotype (CI95= -2.485 – 0.960 g), in female mice 3xTg-AD mice
weighed more than B6129SF2 mice (CI95= 0.0251 – 4.889 g) and at 12 months of age
3xTg-AD mice weighed more than B6129SF2 mice (CI95= 0.353 –4.712 g). At 12
months of age in female mice only the mice reared by 3xTg-AD mothers weighed more
than the mice reared by B6129SF2 mothers (CI95= 1.827 – 9.359 g).
2 6 1 2 1 8
0
1 0
2 0
3 0
4 0
5 0
A ge (m )
We
igh
t (g
)
TG _M
W T _ M
TG _M
W T _ MF e m a le M ale
B o d y W e ig h t
T G _ P W T _ P T G _ P W T _ P T G _ P W T _ P T G _ P W T _ P
Figure 2.3 Body Weight. The mean (± S.E.M) total body weight of 3xTg-AD (TG_P)
and B6129SF2 (WT_P) mice reared by 3xTg-AD (TG_M) and B6129SF2 (WT_M)
foster mothers.

59
For latency to fall from the Rotarod the best model had day, pup genotype, foster
mother genotype, sex, age, a day by pup genotype interaction, a day by age interaction, a
pup genotype by sex by age interaction, and a foster mother genotype by sex by age
interaction (AICc=13771.900, Figure 2.4A; See also Supplemental Table 2.4), which
differed significantly from the null model (χ2(43,N= 1355)= 808.53, p < 0.001). The
latency to fall increased from day 1 to 5 (CI95= 65.882 – 78.280s), 3xTg-AD mice had a
longer latency to fall than B6129SF2 mice (CI95= 24.678 – 52.691s), mice reared by
B6129SF2 mothers had a longer latency to fall than mice reared by 3xTg-AD mothers
(CI95= 0.495 - 27.643s), and females had a longer latency to fall than males (CI95= 2.913
– 29.998s). The latency to fall increased from 2 to 6 (CI95= 3.820 – 14.093s) and 2 to 12
months of age (CI95= 11.462 – 21.880s), but decreased from 2 to 18 months of age (CI95=
-20.324 – -4.062s). There was a day by genotype interaction as in 3xTg-AD mice the
latency to fall increased each day, while in B6129SF2 mice the latency to fall increased
only until day 4 (CI95= -0.282 – 16.518s). The day by age interaction occurred because at
every age the latency to fall increased from day 1 to day 5, except at 18 months of age
when there no difference between day 1 and 2 (CI95= -12.951 – 5.708s). The genotype by
sex by age interaction occurred because the female 3xTg-AD mice had a longer latency
to fall than the males only at 18 months of age (CI95= 28.158 – 91.967s), while there was
no sex difference in B6129SF2 mice (CI95= -19.785 – 23.130s). The foster mother
genotype by sex by age interaction occurred because only at 18 months of age female
mice reared by B6129SF2 mothers had a longer latency to fall than male mice (CI95=
20.064 – 69.423s), while there was no sex difference in mice reared by 3xTg-AD (CI95=
8.180 – 44.111s). In order to determine if body weight was a confounding factor for the
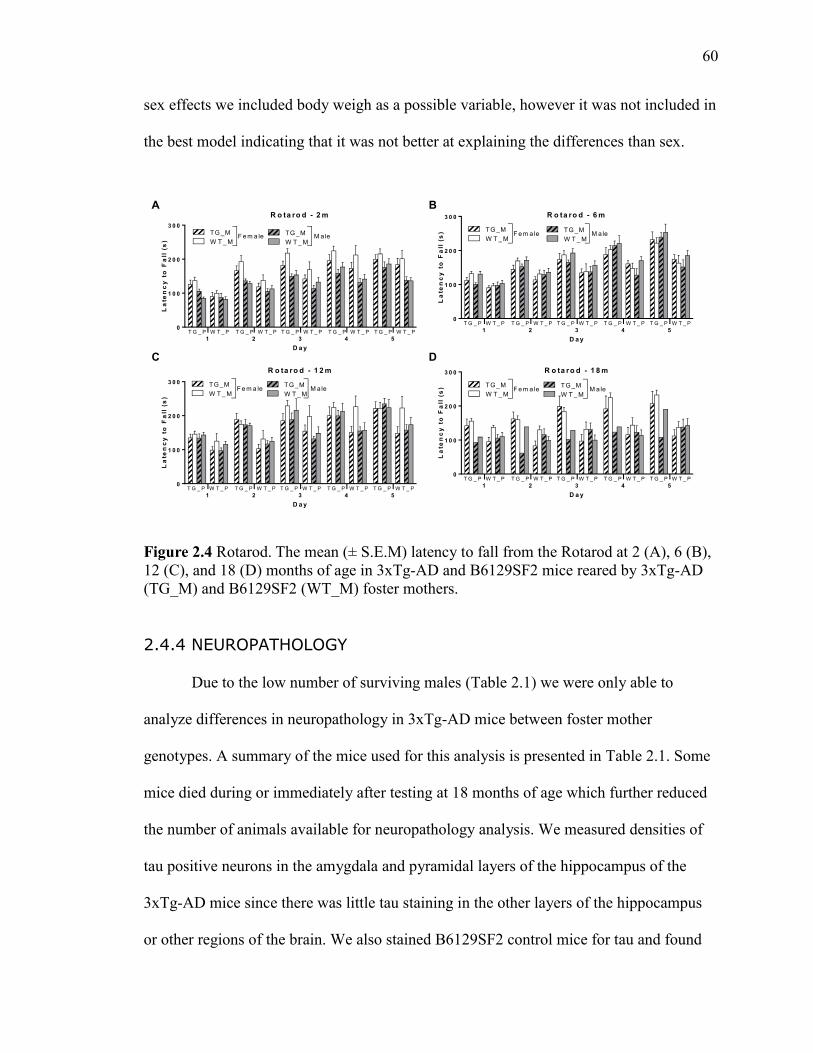
60
sex effects we included body weigh as a possible variable, however it was not included in
the best model indicating that it was not better at explaining the differences than sex.
1 2 3 4 5
0
1 0 0
2 0 0
3 0 0
R o ta ro d - 2 m
D a y
La
ten
cy
to
Fa
ll (
s)
TG _M
W T _ M
TG _M
W T _ M
T G _ P W T _ P T G _ P W T _ P T G _ P W T _ P T G _ P W T _ P T G _ P W T _ P
F e m a le M ale
1 2 3 4 5
0
1 0 0
2 0 0
3 0 0 R o ta ro d - 6 m
D a y
La
ten
cy
to
Fa
ll (
s) TG _M
W T _ M
TG _M
W T _ M
T G _ P W T _ P T G _ P W T _ P T G _ P W T _ P T G _ P W T _ P T G _ P W T _ P
F e m a le M ale
1 2 3 4 5
0
1 0 0
2 0 0
3 0 0
R o ta ro d - 1 2 m
D a y
La
ten
cy
to
Fa
ll (
s)
TG _M
W T _ M
TG _M
W T _ M
T G _ P W T _ P T G _ P W T _ P T G _ P W T _ P T G _ P W T _ P T G _ P W T _ P
F e m a le M ale
1 2 3 4 5
0
1 0 0
2 0 0
3 0 0 R o ta ro d - 1 8 m
D a y
La
ten
cy
to
Fa
ll (
s) TG _M
W T _ M
TG _M
W T _ M
T G _ P W T _ P T G _ P W T _ P T G _ P W T _ P T G _ P W T _ P T G _ P W T _ P
F e m a le M ale
A B
C D
Figure 2.4 Rotarod. The mean (± S.E.M) latency to fall from the Rotarod at 2 (A), 6 (B),
12 (C), and 18 (D) months of age in 3xTg-AD and B6129SF2 mice reared by 3xTg-AD
(TG_M) and B6129SF2 (WT_M) foster mothers.
2.4.4 NEUROPATHOLOGY
Due to the low number of surviving males (Table 2.1) we were only able to
analyze differences in neuropathology in 3xTg-AD mice between foster mother
genotypes. A summary of the mice used for this analysis is presented in Table 2.1. Some
mice died during or immediately after testing at 18 months of age which further reduced
the number of animals available for neuropathology analysis. We measured densities of
tau positive neurons in the amygdala and pyramidal layers of the hippocampus of the
3xTg-AD mice since there was little tau staining in the other layers of the hippocampus
or other regions of the brain. We also stained B6129SF2 control mice for tau and found
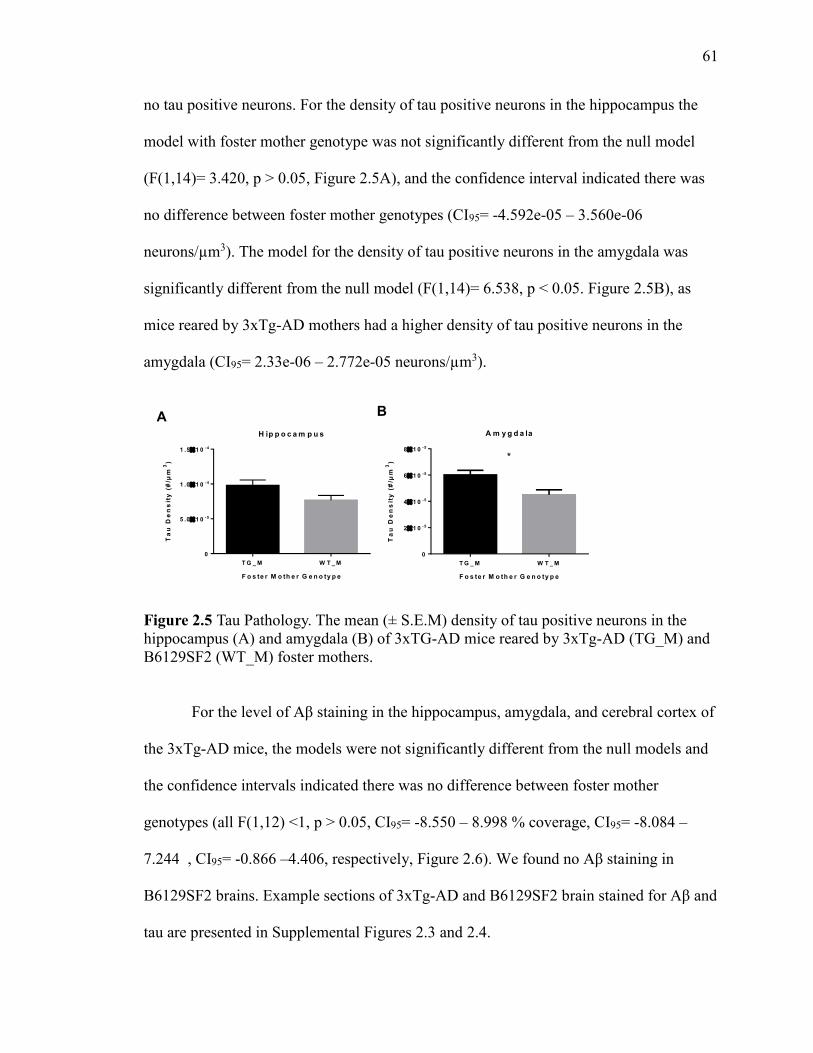
61
no tau positive neurons. For the density of tau positive neurons in the hippocampus the
model with foster mother genotype was not significantly different from the null model
(F(1,14)= 3.420, p > 0.05, Figure 2.5A), and the confidence interval indicated there was
no difference between foster mother genotypes (CI95= -4.592e-05 – 3.560e-06
neurons/µm3). The model for the density of tau positive neurons in the amygdala was
significantly different from the null model (F(1,14)= 6.538, p < 0.05. Figure 2.5B), as
mice reared by 3xTg-AD mothers had a higher density of tau positive neurons in the
amygdala (CI95= 2.33e-06 – 2.772e-05 neurons/µm3).
T G _ M W T _ M
0
5 .01 0 -5
1 .01 0 -4
1 .51 0 -4
H ip p o c a m p u s
F o s te r M o th e r G e n o ty p e
Ta
u D
en
sit
y (
#/µ
m3
)
T G _ M W T _ M
0
21 0 -5
41 0 -5
61 0 -5
81 0 -5
A m y g d a la
F o s te r M o th e r G e n o ty p e
Ta
u D
en
sit
y (
#/µ
m3
)
*
A B
Figure 2.5 Tau Pathology. The mean (± S.E.M) density of tau positive neurons in the
hippocampus (A) and amygdala (B) of 3xTG-AD mice reared by 3xTg-AD (TG_M) and
B6129SF2 (WT_M) foster mothers.
For the level of Aβ staining in the hippocampus, amygdala, and cerebral cortex of
the 3xTg-AD mice, the models were not significantly different from the null models and
the confidence intervals indicated there was no difference between foster mother
genotypes (all F(1,12) <1, p > 0.05, CI95= -8.550 – 8.998 % coverage, CI95= -8.084 –
7.244 , CI95= -0.866 –4.406, respectively, Figure 2.6). We found no Aβ staining in
B6129SF2 brains. Example sections of 3xTg-AD and B6129SF2 brain stained for Aβ and
tau are presented in Supplemental Figures 2.3 and 2.4.
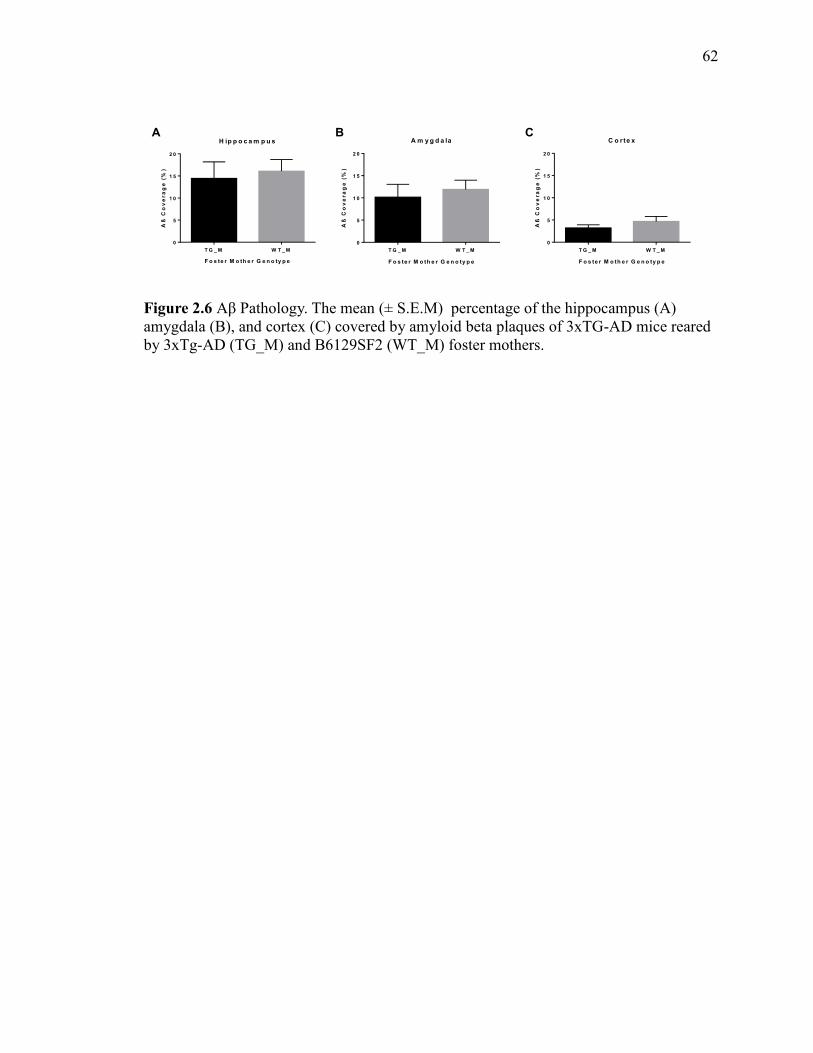
62
T G _ M W T _ M
0
5
1 0
1 5
2 0
H ip p o c a m p u s
F o s te r M o th e r G e n o ty p e
Aß
Co
ve
ra
ge
(%
)
T G _ M W T _ M
0
5
1 0
1 5
2 0
A m y g d a la
F o s te r M o th e r G e n o ty p e
Aß
Co
ve
ra
ge
(%
)
T G _ M W T _ M
0
5
1 0
1 5
2 0
C o rte x
F o s te r M o th e r G e n o ty p e
Aß
Co
ve
ra
ge
(%
)
A B C
Figure 2.6 Aβ Pathology. The mean (± S.E.M) percentage of the hippocampus (A)
amygdala (B), and cortex (C) covered by amyloid beta plaques of 3xTG-AD mice reared
by 3xTg-AD (TG_M) and B6129SF2 (WT_M) foster mothers.
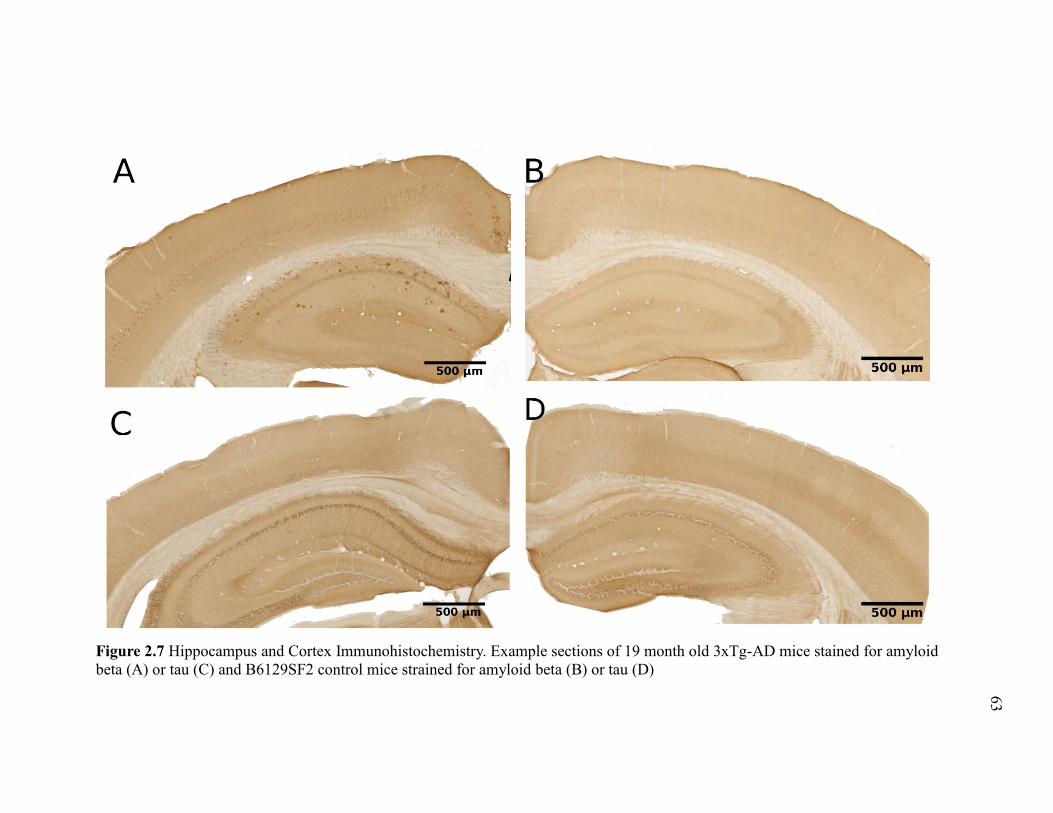
63
Figure 2.7 Hippocampus and Cortex Immunohistochemistry. Example sections of 19 month old 3xTg-AD mice stained for amyloid
beta (A) or tau (C) and B6129SF2 control mice strained for amyloid beta (B) or tau (D)

64
64
64
Figure 2.8 Amygdala Immunohistochemistry. Example sections of 19 month old 3xTg-
AD mice strained for amyloid beta (A) or tau (C) and B6129SF2 control mice strained
for amyloid beta (B) or tau (D).
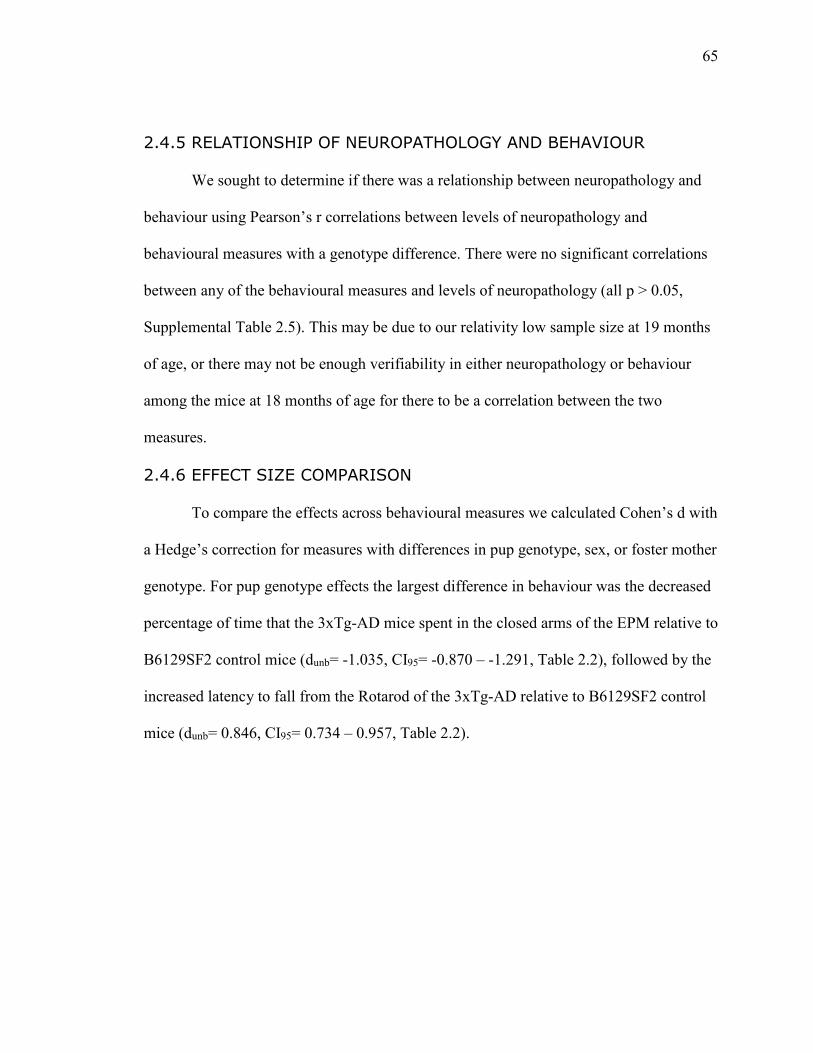
65
65
65
2.4.5 RELATIONSHIP OF NEUROPATHOLOGY AND BEHAVIOUR
We sought to determine if there was a relationship between neuropathology and
behaviour using Pearson’s r correlations between levels of neuropathology and
behavioural measures with a genotype difference. There were no significant correlations
between any of the behavioural measures and levels of neuropathology (all p > 0.05,
Supplemental Table 2.5). This may be due to our relativity low sample size at 19 months
of age, or there may not be enough verifiability in either neuropathology or behaviour
among the mice at 18 months of age for there to be a correlation between the two
measures.
2.4.6 EFFECT SIZE COMPARISON
To compare the effects across behavioural measures we calculated Cohen’s d with
a Hedge’s correction for measures with differences in pup genotype, sex, or foster mother
genotype. For pup genotype effects the largest difference in behaviour was the decreased
percentage of time that the 3xTg-AD mice spent in the closed arms of the EPM relative to
B6129SF2 control mice (dunb= -1.035, CI95= -0.870 – -1.291, Table 2.2), followed by the
increased latency to fall from the Rotarod of the 3xTg-AD relative to B6129SF2 control
mice (dunb= 0.846, CI95= 0.734 – 0.957, Table 2.2).
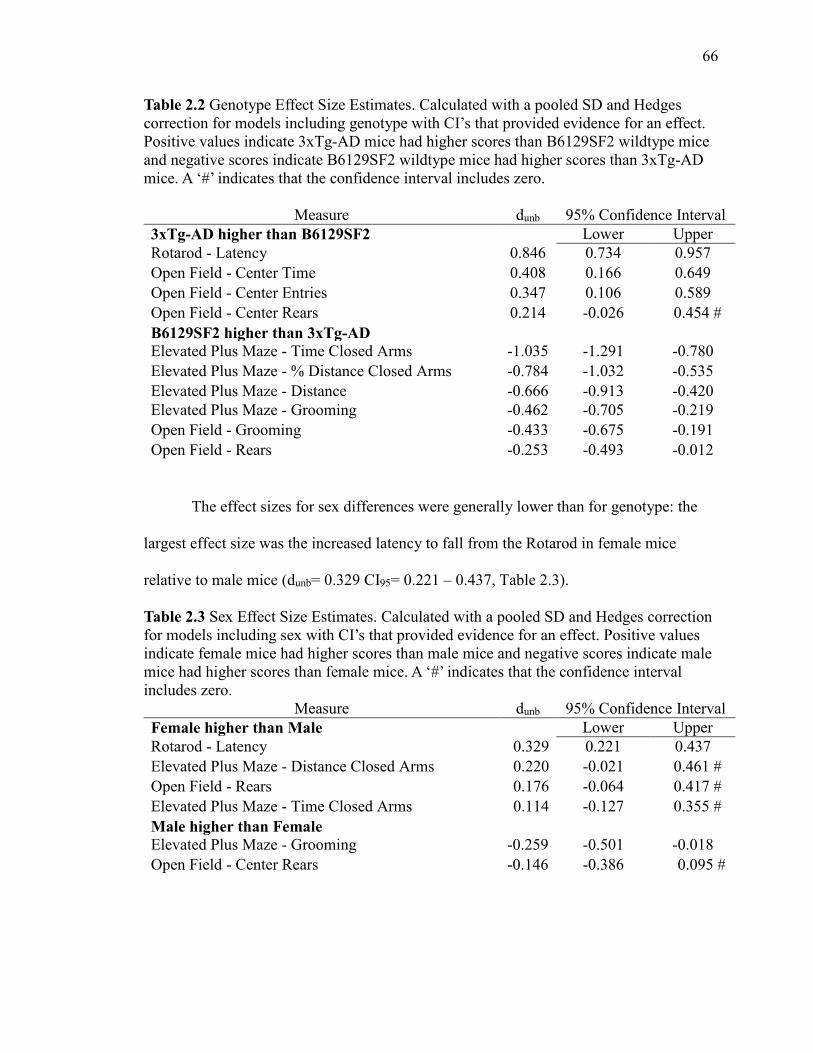
66
66
66
Table 2.2 Genotype Effect Size Estimates. Calculated with a pooled SD and Hedges
correction for models including genotype with CI’s that provided evidence for an effect.
Positive values indicate 3xTg-AD mice had higher scores than B6129SF2 wildtype mice
and negative scores indicate B6129SF2 wildtype mice had higher scores than 3xTg-AD
mice. A ‘#’ indicates that the confidence interval includes zero.
Measure dunb 95% Confidence Interval
3xTg-AD higher than B6129SF2 Lower Upper
Rotarod - Latency 0.846 0.734 0.957
Open Field - Center Time 0.408 0.166 0.649
Open Field - Center Entries 0.347 0.106 0.589
Open Field - Center Rears 0.214 -0.026 0.454 #
B6129SF2 higher than 3xTg-AD
Elevated Plus Maze - Time Closed Arms -1.035 -1.291 -0.780
Elevated Plus Maze - % Distance Closed Arms -0.784 -1.032 -0.535
Elevated Plus Maze - Distance -0.666 -0.913 -0.420
Elevated Plus Maze - Grooming -0.462 -0.705 -0.219
Open Field - Grooming -0.433 -0.675 -0.191
Open Field - Rears -0.253 -0.493 -0.012
The effect sizes for sex differences were generally lower than for genotype: the
largest effect size was the increased latency to fall from the Rotarod in female mice
relative to male mice (dunb= 0.329 CI95= 0.221 – 0.437, Table 2.3).
Table 2.3 Sex Effect Size Estimates. Calculated with a pooled SD and Hedges correction
for models including sex with CI’s that provided evidence for an effect. Positive values
indicate female mice had higher scores than male mice and negative scores indicate male
mice had higher scores than female mice. A ‘#’ indicates that the confidence interval
includes zero.
Measure dunb 95% Confidence Interval
Female higher than Male Lower Upper
Rotarod - Latency 0.329 0.221 0.437
Elevated Plus Maze - Distance Closed Arms 0.220 -0.021 0.461 #
Open Field - Rears 0.176 -0.064 0.417 #
Elevated Plus Maze - Time Closed Arms 0.114 -0.127 0.355 #
Male higher than Female
Elevated Plus Maze - Grooming -0.259 -0.501 -0.018
Open Field - Center Rears -0.146 -0.386 0.095 #

67
67
67
The effect sizes for foster mother genotype were generally lower than both pup
genotype and sex, the largest with a confidence interval that did not include 0 was for the
number of rears in the OF, which was higher in mice reared by 3xTg-AD mothers (dunb=
0.348, CI95= 0.107 – 0.589, Table 2.4). Figure 2.9 gives a visual image of the effect sizes
for pup genotype, sex, and maternal genotype.
Table 2.4 Foster Mother Genotype Effect Size Estimates. Calculated with a pooled SD
and Hedges correction for models including sex with CI’s that provided evidence for an
effect. Positive values indicate mice reared by 3xTg-AD mothers had higher scores than
mice reared by B6129SF2 mothers and negative scores indicate mice reared by
B6129SF2 had higher scores than mice reared by 3xTg-AD mothers. A ‘#’ indicates that
the confidence interval includes zero
Measure dunb 95% Confidence Interval
3xTg-AD Mothers higher than B6129SF2
Mothers
Lower Upper
Neuropathology - Amygdala Tau 1.318 -0.087 2.724 #
Open Field - Rearing 0.348 0.107 0.589
B6129SF2 Mothers higher than 3xTg-AD
Mothers
Open Field - Freezing -0.318 -0.559 -0.078
Rotarod Latency -0.303 -0.411 -0.196
Open Field - Grooming -0.173 -0.413 0.067 #
Elevated Plus Maze - Distance -0.167 -0.407 0.073 #
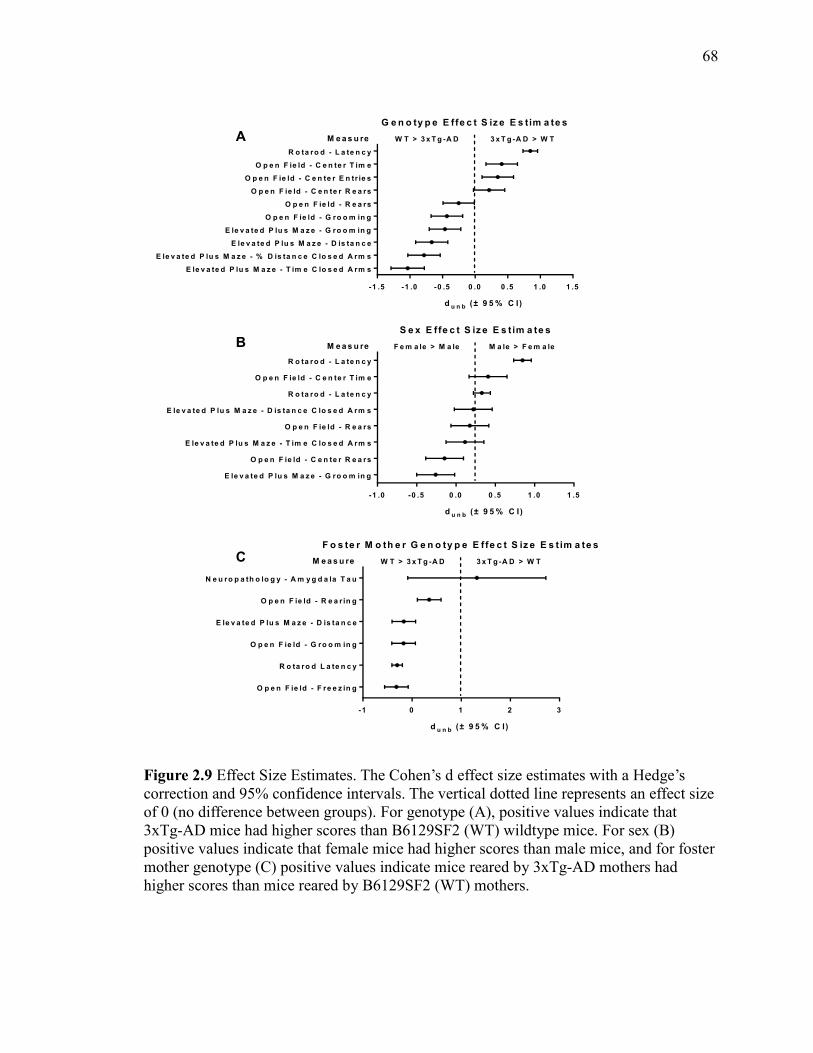
68
68
68
-1 .5 -1 .0 -0 .5 0 .0 0 .5 1 .0 1 .5
E le v a te d P lu s M a z e - T im e C lo s e d A rm s
E le v a te d P lu s M a z e - % D is ta n c e C lo s e d A rm s
E le v a te d P lu s M a z e - D is ta n c e
E le v a te d P lu s M a z e - G ro o m in g
O p e n F ie ld - G ro o m in g
O p e n F ie ld - R e a rs
O p e n F ie ld - C e n te r R e a rs
O p e n F ie ld - C e n te r E n tr ie s
O p e n F ie ld - C e n te r T im e
R o ta ro d - L a te n c y
G e n o ty p e E ffe c t S iz e E s tim a te s
d u n b (± 9 5 % C I)
M e a s u re W T > 3 x T g -A D 3 x T g -A D > W T
-1 .0 -0 .5 0 .0 0 .5 1 .0 1 .5
E le v a te d P lu s M a z e - G ro o m in g
O p e n F ie ld - C e n te r R e a rs
E le v a te d P lu s M a z e - T im e C lo s e d A rm s
O p e n F ie ld - R e a rs
E le v a te d P lu s M a z e - D is ta n c e C lo s e d A rm s
R o ta ro d - L a te n c y
O p e n F ie ld - C e n te r T im e
R o ta ro d - L a te n c y
S e x E ffe c t S iz e E s t im a te s
d u n b (± 9 5 % C I)
M e a s u re F e m a le > M a le M a le > F e m a le
-1 0 1 2 3
O p e n F ie ld - F re e z in g
R o ta ro d L a te n c y
O p e n F ie ld - G ro o m in g
E le v a te d P lu s M a z e - D is ta n c e
O p e n F ie ld - R e a r in g
N e u ro p a th o lo g y - A m y g d a la T a u
F o s te r M o th e r G e n o ty p e E ffe c t S iz e E s t im a te s
d u n b (± 9 5 % C I)
M e a s u re W T > 3 x T g -A D 3 x T g -A D > W T
A
B
C
Figure 2.9 Effect Size Estimates. The Cohen’s d effect size estimates with a Hedge’s
correction and 95% confidence intervals. The vertical dotted line represents an effect size
of 0 (no difference between groups). For genotype (A), positive values indicate that
3xTg-AD mice had higher scores than B6129SF2 (WT) wildtype mice. For sex (B)
positive values indicate that female mice had higher scores than male mice, and for foster
mother genotype (C) positive values indicate mice reared by 3xTg-AD mothers had
higher scores than mice reared by B6129SF2 (WT) mothers.

69
69
69
2.5 DISCUSSION
2.5.1 DO 3XTG-AD AND B6129SF2 MICE DIFFER IN ANXIETY-LIKE
BEHAVIOUR ACROSS AGES?
The 3xTg-AD exhibited less anxiety-like behaviour than B6129SF2 control mice.
In the EPM the 3xTg-AD spent less time and travelled less of their total distance in the
closed arms than B619SF2 mice. There was a high level of variability in freezing
behaviour and so it is difficult to draw any conclusions based on the results. In the open
field the 3xTg-AD mice exhibited less anxiety-like behaviour than the B6129SF2 mice as
they entered the center of the OF more often and reared more in the center of the maze.
There is a great deal of variability in the measurement of anxiety-like behaviours
both within and between laboratories (Crabbe et al., 1999; Wahlsten et al., 2003, 2006),
so we chose to conduct two tests of anxiety-like and locomotor behaviour to ensure our
results were consistent at least within our laboratory. Different tests of anxiety measure
different aspects of anxiety-like behaviour in mice, and so the measures interpreted as
anxiety-like behaviour should be carefully chosen (O’Leary et al., 2013). Taking into
consideration the consistent results between the OF and EPM it appears that the 3xTg-
AD mice exhibit less anxiety-like behaviour in both the EPM and OF and this difference
appears to persist with age, which is supported by some previous findings (Blanchard et
al., 2010; Chen et al., 2013). The decreased anxiety-like behaviour of the 3xTg-AD in the
EPM has a large effect size, and in the OF there is a moderate effect size (Table 2.2),
which further supports the idea that the 3xTg-AD have decreased anxiety-like behaviour.
The anxiety-like behaviour could be explained by behavioural disinhibition, another
symptom of AD, and several other mouse models of AD have reduced anxiety-like
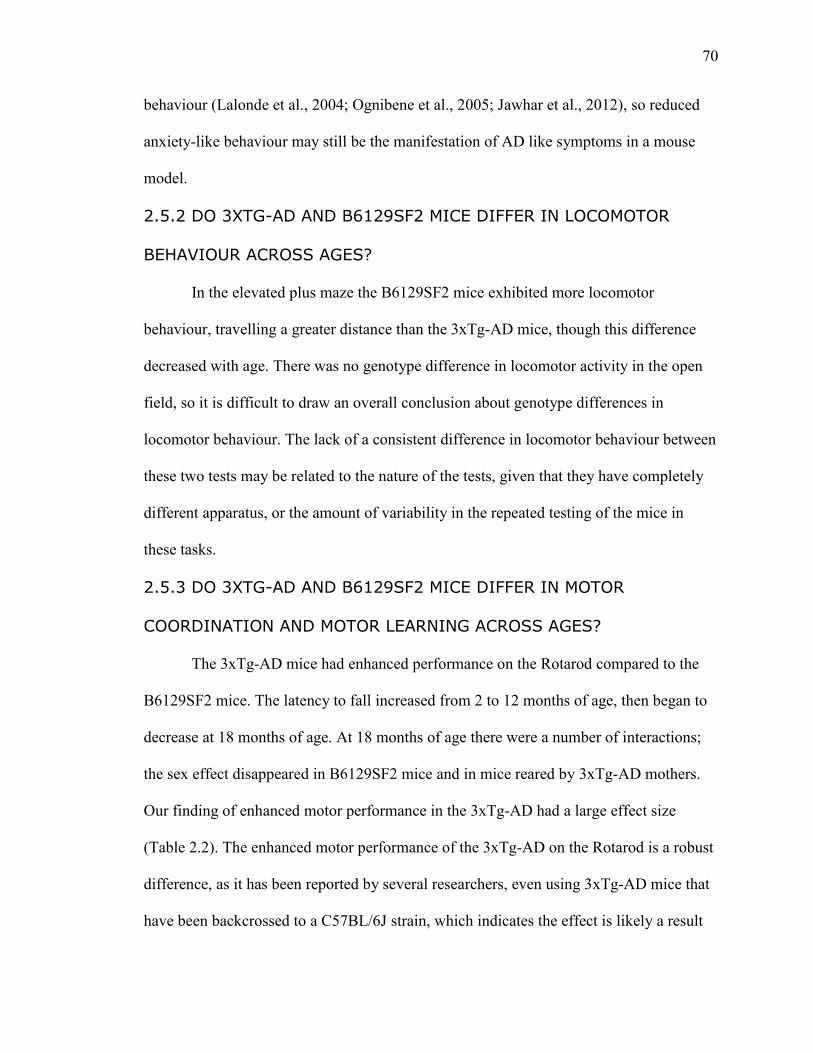
70
70
70
behaviour (Lalonde et al., 2004; Ognibene et al., 2005; Jawhar et al., 2012), so reduced
anxiety-like behaviour may still be the manifestation of AD like symptoms in a mouse
model.
2.5.2 DO 3XTG-AD AND B6129SF2 MICE DIFFER IN LOCOMOTOR
BEHAVIOUR ACROSS AGES?
In the elevated plus maze the B6129SF2 mice exhibited more locomotor
behaviour, travelling a greater distance than the 3xTg-AD mice, though this difference
decreased with age. There was no genotype difference in locomotor activity in the open
field, so it is difficult to draw an overall conclusion about genotype differences in
locomotor behaviour. The lack of a consistent difference in locomotor behaviour between
these two tests may be related to the nature of the tests, given that they have completely
different apparatus, or the amount of variability in the repeated testing of the mice in
these tasks.
2.5.3 DO 3XTG-AD AND B6129SF2 MICE DIFFER IN MOTOR
COORDINATION AND MOTOR LEARNING ACROSS AGES?
The 3xTg-AD mice had enhanced performance on the Rotarod compared to the
B6129SF2 mice. The latency to fall increased from 2 to 12 months of age, then began to
decrease at 18 months of age. At 18 months of age there were a number of interactions;
the sex effect disappeared in B6129SF2 mice and in mice reared by 3xTg-AD mothers.
Our finding of enhanced motor performance in the 3xTg-AD had a large effect size
(Table 2.2). The enhanced motor performance of the 3xTg-AD on the Rotarod is a robust
difference, as it has been reported by several researchers, even using 3xTg-AD mice that
have been backcrossed to a C57BL/6J strain, which indicates the effect is likely a result

71
71
71
of the transgenes (Blanchard et al., 2010; Filali et al., 2012; Chen et al., 2013; Oore et al.,
2013). The only dissenting report is from Sterniczuk et al. (2010a), who used the
C57BL/6J control strain, which may explain their finding, as there are strain differences
in motor behaviour. In a previous study we examined the motor behaviour of 6 month old
3xTg-AD mice in detail (Stover et al., 2015a), and found enhanced performance on the
Rotarod but a deficit in the grid suspension task in 3xTg-AD mice relative to B6129SF2
mice, which indicated the motor phenotype of these mice is more complex than a simple
enhancement of motor behaviour.
2.5.4 ARE THERE SEX DIFFERENCES IN BEHAVIOUR IN 3XTG-AD AND
B6129SF2 MICE?
Males exhibited less anxiety-like behaviour as they spent less time in the closed
arms in the EPM, though for the distance in the closed arms the effect was only present in
the 3xTg-AD mice. Female mice performed better than male mice on the Rotarod, which
indicates they have enhanced motor behaviour, and although female mice weighed less
than male mice this did not account for their enhanced performance.
2.5.5 IS ADULT LOCOMOTOR BEHAVIOUR RELATED TO LOCOMOTOR
BEHAVIOUR DURING DEVELOPMENT?
None of the best models for any locomotor activity contained the locomotor
activity from the automated OF during development, which indicates there is no
relationship between locomotor activity before weaning and later in life.

72
72
72
2.5.6 DOES MATERNAL GENOTYPE EFFECT BEHAVIOUR IN ADULT
MICE?
There was some evidence that mice reared by 3xTg-AD mothers exhibited less
anxiety-like behaviour than mice reared by B6129SF2 mothers, as they entered the center
of the OF more often, and spent less time freezing. Mice reared by B6129SF2 mothers
travelled a greater distance than those reared by B6129SF2 mice in the EPM, but not the
OF, which may indicate they have a higher level of anxiety, but without consistent results
this is difficult to confirm. In the Rotarod the mice reared by B6129SF2 mothers had a
better motor performance than mice reared by 3xTg-AD mothers.
2.5.7 IS THERE A RELATIONSHIP BETWEEN NEUROPATHOLOGY AND
BEHAVIOUR?
The only difference in neuropathology we observed was an increase in the density
of tau positive neurons in the amygdala of mice reared by 3xTg-AD mothers compared to
mice reared by B6129SF2 mothers, which had a large effect size, though the range of the
95% confidence interval included 0, so caution should be used when interpreting the
effect size. We found no correlations between neuropathology levels and behaviour. It
does not appear that maternal genotype had a large effect on neuropathology at 19
months of age, possibly because the effect was small enough that it was masked by age or
genotype effects.
2.5.8 GENERAL DISCUSSION AND CONCLUSIONS
The mice seem to habituate to the mazes over time as distance travelled and other
locomotor behaviours decreased with age, however the effect of habituation is impossible
to separate from the effect of age due to the longitudinal design. Interestingly there seems

73
73
73
to be a shift in behaviour at 18 months of age with a greater number of interactions
occurring, though with no overall pattern of differences. This shift could be the result of a
general increase in variability at 18 months of age, or the result of a survivor effect, as the
number of surviving mice decreased by a third from 12 to 18 months of age, and these
mice may be differnet in some way, possibly with lower levels of neuropathology or
other differences that contributed to their longer lives.
An issue that must be considered in longitudinal behaviour studies is the effect of
previous experience on later test scores. For example, the tests of anxiety-like behaviour
often rely on the aversive nature of the open aspects of a maze (the open arms of the EPM
or the center of the OF), but animals may become habituated with repeated exposure, so
habitation could confound the results. In the current study we have attributed general
changes over time to habituation in the case of the tests of anxiety-like behaviour, and
with motor learning in the Rotarod. Another issue is with the statistical analysis: In our
long-term longitudinal study almost 40% of the animals died before the final time point.
In a traditional repeated measures ANOVA with age as a factor those animals would have
to be excluded due to missing data, which is why we chose to use linear mixed effects
modeling, which does not require each mouse to have a value at each time point. Despite
these issues, longitudinal studies are the only way to measures changes in behaviour in
the same animals over time, which is important for tracking the changes caused by both
the transgenes and early-life environment.
In summary, we found that the 3xTg-AD mouse model of AD has decreased
anxiety-like behaviour on the EPM and OF, enhanced motor performance on the Rotarod.
These findings appear to be relatively stable across the lifespan, with some evidence of

74
74
74
change beginning at 18 months of age. Future studies on mice older than 18 months
would be useful but the relatively high mortality in the transgenic mice poses a problem.
The only difference that we found in neuropathology was an increased density of tau
positive neurons in the amygdala of mice reared by 3xTg-AD, but no differences in the
hippocampus or in amyloid beta staining. It is unclear why there would be a difference in
the amygdala and not the hippocampus, it is possible that we were unable to detect the
effect in the hippocampus due to our low sample size. We found that females had better
performance on the Rotarod than males, both of which had moderate effect sizes, but
little evidence of a sex difference in anxiety-like behaviour. While there were several
individual effects of foster mother genotype on measures in the four tasks that we
conducted there were few consistent or stable findings, though the mice reared by
B6129SF2 mothers had a better motor performance on the Rotarod than mice reared by
3xTg-AD mothers, which contradicts our previous finding of decayed development of
motor reflexes in mice reared by B6129SF2 mothers, and the effect size was fairly small.
Overall it appears that maternal genotype had little lasting effect on pup behaviour, but
that the 3xTg-AD decreased anxiety-like behaviour and enhanced performance on the
Rotarod compared to B6129SF2 mice.
2.6 ACKNOWLEDGEMENTS
This research was funded by an NSERC grant to REB. The authors would like to
thank Andrew Reid, Megan Chas, Rhian Gunn, and Daniel Ikpi for their assistance in this
project.
75
75
75
2.7 REFERENCES
Akaike H (1974) A new look at the statistical model identification. Autom Control IEEE
Trans 19:716–723.
Billings LM, Green KN, McGaugh JL, LaFerla FM (2007) Learning decreases A beta*56
and tau pathology and ameliorates behavioral decline in 3xTg-AD mice. J Neurosci
27:751–761.
Billings LM, Oddo S, Green KN, McGaugh JL, LaFerla FM (2005) Intraneuronal Abeta
causes the onset of early Alzheimer’s disease-related cognitive deficits in transgenic
mice. Neuron 45:675–688.
Blanchard J, Wanka L, Tung Y-C, Cárdenas-Aguayo M del C, LaFerla FM, Iqbal K,
Grundke-Iqbal I (2010) Pharmacologic reversal of neurogenic and neuroplastic
abnormalities and cognitive impairments without affecting Aβ and tau pathologies in
3xTg-AD mice. Acta Neuropathol 120:605–621.
Blaney CE, Gunn RK, Stover KR, Brown RE (2013) Maternal genotype influences
behavioral development of 3xTg-AD mouse pups. Behav Brain Res 252:40–48.
Brown RE, Corey SC, Moore AK (1999a) Differences in measures of exploration and
fear in MHC-congenic C57BL/6J and B6-H-2K mice. Behav Genet 29:263–271.
Brown RE, Mathieson WB, Stapleton J, Neumann PE (1999b) Maternal behavior in
female C57BL/6J and DBA/2J inbred mice. Physiol Behav 67:599–605.
Brown RE, Wong AA (2007) The influence of visual ability on learning and memory
performance in 13 strains of mice. Learn Mem 14:134.
Burnham KP, Anderson DR (2002) Model selection and multimodel inference: A
practical information-theoretic approach, 2nd ed. New York: Springer Science &
Business Media.
Champagne FA, Curley JP (2009) Epigenetic mechanisms mediating the long-term
effects of maternal care on development. Neurosci Biobehav Rev 33:593–600.
Champagne FA, Curley JP, Keverne EB, Bateson PPG (2007) Natural variations in
postpartum maternal care in inbred and outbred mice. Physiol Behav 91:325–334.
Chen Y, Liang Z, Blanchard J, Dai C-L, Sun S, Lee MH, Grundke-Iqbal I, Iqbal K, Liu F,
Gong C-X (2013) A Non-transgenic mouse model (icv-STZ mouse) of Alzheimer’s
disease: Similarities to and differences from the transgenic model (3xTg-AD
mouse). Mol Neurobiol 47:711–725.
76
76
76
Chouliaras L, Sierksma a SR, Kenis G, Prickaerts J, Lemmens M a M, Brasnjevic I, van
Donkelaar EL, Martinez-Martinez P, Losen M, De Baets MH, Kholod N, van
Leeuwen F, Hof PR, van Os J, Steinbusch HWM, van den Hove DL a, Rutten BPF
(2010) Gene-environment interaction research and transgenic mouse models of
Alzheimer’s disease. Int J Alzheimers Dis 2010.
Clinton LK, Billings LM, Green KN, Caccamo A, Ngo J, Oddo S, McGaugh JL, LaFerla
FM (2007) Age-dependent sexual dimorphism in cognition and stress response in
the 3xTg-AD mice. Neurobiol Dis 28:76–82.
Crabbe JC, Wahlsten D, Dudek BC (1999) Genetics of mouse behavior: interactions with
laboratory environment. Science 284:1670–1672.
Cumming G (2014) The new statistics: why and how. Psychol Sci 25:7–29.
Darvesh S, Cash MK, Reid GA, Martin E, Mitnitski A, Geula C (2012)
Butyrylcholinesterase is associated with β-amyloid plaques in the transgenic
APPSWE/PSEN1dE9 mouse model of Alzheimer disease. J Neuropathol Exp
Neurol 71:2–14.
Filali M, Lalonde R, Theriault P, Julien C, Calon F, Planel E (2012) Cognitive and non-
cognitive behaviors in the triple transgenic mouse model of Alzheimer’s disease
expressing mutated APP, PS1, and Mapt (3xTg-AD). Behav Brain Res 234:334–342.
Francis DD, Meaney MJ (1999) Maternal care and the development of stress responses.
Curr Opin Neurobiol 9:128–134.
García-Mesa Y, López-Ramos JC, Giménez-Llort L, Revilla S, Guerra R, Gruart A,
Laferla FM, Cristòfol R, Delgado-García JM, Sanfeliu C (2011) Physical exercise
protects against Alzheimer’s disease in 3xTg-AD mice. J Alzheimers Dis 24:421–
454.
Gudsnuk K, Champagne F a (2012) Epigenetic influence of stress and the social
environment. ILAR J 53:279–288.
Hedges L V. (1981) Distribution theory for Glass’s estimator of effect size and related
estimators. J Educ Behav Stat 6:107–128.
Jankowsky JL, Younkin LH, Gonzales V, Fadale DJ, Slunt HH, Lester H a., Younkin SG,
Borchelt DR (2007) Rodent Aβ modulates the solubility and distribution of amyloid
deposits in transgenic mice. J Biol Chem 282:22707–22720.
Jawhar S, Trawicka A, Jenneckens C, Bayer TA, Wirths O (2012) Motor deficits, neuron
loss, and reduced anxiety coinciding with axonal degeneration and intraneuronal Aβ
aggregation in the 5XFAD mouse model of Alzheimer’s disease. Neurobiol Aging
33:196.e29–e40.
77
77
77
Kitamoto T, Ogomori K, Tateishi J, Prusiner SB (1987) Formic acid pretreatment
enhances immunostaining of cerebral and systemic amyloids. Lab Invest 57:230–
236.
Kundakovic M, Champagne F a (2014) Early-Life Experience, Epigenetics, and the
Developing Brain. Neuropsychopharmacology 40:141–153.
Lalonde R, Kim HD, Fukuchi K (2004) Exploratory activity, anxiety, and motor
coordination in bigenic APPswe + PS1/DeltaE9 mice. Neurosci Lett 369:156–161.
Mastrangelo MA, Bowers WJ (2008) Detailed immunohistochemical characterization of
temporal and spatial progression of Alzheimer’s disease-related pathologies in male
triple-transgenic mice. BMC Neurosci 9:81.
O’Leary TP, Gunn RK, Brown RE (2013) What are we measuring when we test strain
differences in anxiety in mice? Behav Genet 43:34–50.
Oddo S, Caccamo A, Shepherd JD, Murphy MP, Golde TE, Kayed R, Metherate R,
Mattson MP, Akbari Y, LaFerla FM (2003) Triple-transgenic model of Alzheimer’s
Disease with plaques and tangles: Intracellular Aβ and synaptic dysfunction. Neuron
39:409–421.
Ognibene E, Middei S, Daniele S, Adriani W, Ghirardi O, Caprioli A, Laviola G (2005)
Aspects of spatial memory and behavioral disinhibition in Tg2576 transgenic mice
as a model of Alzheimer’s disease. Behav Brain Res 156:225–232.
Oore JJ, Fraser LM, Brown RE (2013) Age-related changes in motor ability and motor
learning in triple transgenic (3xTg-AD) and control (B6129SF1/J) mice on the
accelerating Rotarod. Proc Nov Scotian Inst Sci 74:281–296.
Paxinos G, Franklin KBJ (2001) The Mouse Brain in Stereotaxic Coordinates, 2nd
Editio. San Diego, CA: Academic Press.
Pietropaolo S, Feldon J, Yee BK (2008) Age-dependent phenotypic characteristics of a
triple transgenic mouse model of Alzheimer disease. Behav Neurosci 122:733–747.
Pietropaolo S, Sun Y, Li R, Brana C, Feldon J, Yee BK (2009) Limited impact of social
isolation on Alzheimer-like symptoms in a triple transgenic mouse model. Behav
Neurosci 123:181–195.
Priebe K, Brake WG, Romeo RD, Sisti HM, Mueller A, McEwen BS, Francis DD, Sisti
HM, Mueller A, McEwen BS, Brake WG (2005) Maternal influences on adult stress
and anxiety-like behavior in C57BL/6J and BALB/CJ mice: A cross-fostering study.
Dev Psychobiol 47:398–407.
Rae EA, Brown RE (2015) The problem of genotype and sex differences in life
expectancy in transgenic mice. Unpublshed Results.

78
78
78
Sterniczuk R, Antle MC, Laferla FM, Dyck RH (2010a) Characterization of the 3xTg-AD
mouse model of Alzheimer’s disease: part 2. Behavioral and cognitive changes.
Brain Res 1348:149–155.
Sterniczuk R, Dyck RH, Laferla FM, Antle MC (2010b) Characterization of the 3xTg-
AD mouse model of Alzheimer’s disease: part 1. Circadian changes. Brain Res
1348:139–148.
Stover KR, Campbell MA, Van Winssen CM, Brown RE (2015) Analysis of motor
function in 6 month old male and female 3xTg-AD mice. Behav Brain Res 281:16–
23.
Teri L, Ferretti LE, Gibbons LE, Logsdon RG, McCurry SM, Kukull WA, McCormick
WC, Bowen JD, Larson EB (1999) Anxiety of Alzheimer’s disease: prevalence, and
comorbidity. J Gerontol A Biol Sci Med Sci 54:M348–M352.
Tran HT, LaFerla FM, Holtzman DM, Brody DL (2011) Controlled cortical impact
traumatic brain injury in 3xTg-AD mice causes acute intra-axonal amyloid-β
accumulation and independently accelerates the development of tau abnormalities. J
Neurosci 31:9513–9525.
Wahlsten D et al. (2003) Different data from different labs: Lessons from studies of gene-
environment interaction. J Neurobiol 54:283–311.
Wahlsten D, Bachmanov A, Finn D a, Crabbe JC (2006) Stability of inbred mouse strain
differences in behavior and brain size between laboratories and across decades. Proc
Natl Acad Sci U S A 103:16364–16369.

79
79
79
2.8 SUPPLEMENTAL TABLES
Description of supplemental tables 2.1 – 2.4.
These supplemental tables provide the statistics used to determine the best model for each measure. The best five models for each
measure are included. The model column describes the factors analyzed, terms separated by a ‘*’ indicate both individual main effects
and interactions between those two terms, terms separated by a ‘+’ are both simple main effects, and terms separated by a ‘:’ indicate
an interaction alone. The ‘AICc’ column is the second order Akaike information criterion, which is a measure used to evaluate the
models based on the complexity and how well the model fits the data; lower values are better. The “∆ AICc” column provides the
difference between the given model’s AICc and the model with the lowest AICc. The ‘Wt’ column is the Akaike weight, a measure of
relative likelihood that the fit is the best, ranging from 0 (unlikely) – 1(likely). The ‘ER’ column is the evidence ratio which provides
the likelihood that the model with the lowest AICc is better than the model in question.

80
80
80
Supplemental Table 2.1.1 Elevated Plus Maze – Distance
Supplemental Table 2.1.2 Elevated Plus Maze – Number of Rears
Model AICc ∆ AICc Wt ER
Age 1451.552 0 0.330 1
Sex+Age 1453.446 1.894 0.128 2.578
FMGenotype+Age 1453.452 1.900 0.128 2.585
Genotype+Age 1453.645 2.093 0.116 2.848
FMGenotype+Sex+Age 1455.367 3.815 0.049 6.737
Supplemental Table 2.1.3 Elevated Plus Maze – Number of Head Dips
Model AICc ∆ AICc Wt ER
(Genotype+Age)+(Genotype:Age) 1985.685 0 0.198 1
(Genotype+Sex+Age)+(Genotype:Age) 1986.346 0.661 0.143 1.392
(Genotype+Sex+Age) 1987.013 1.328 0.102 1.943
(Genotype+Age) 1987.148 1.463 0.096 2.078
(Genotype+FMGenotype+Age)+(Genotype:FMGenotype)+(Genotype:Age) 1987.621 1.936 0.075 2.633
Model AICc ∆ AICc Wt ER
(Genotype+FMGenotype+Sex+Age)+(Genotype:FMGenotype)+(Genotype:Sex)
+(FMGenotype:Sex)+(Genotype:Age) 4064.248 0 0.063 1
(Genotype+FMGenotype+Sex+Age)+(Genotype:FMGenotype:Sex)+(Genotype:Age) 4064.964 0.715 0.044 1.430
(Genotype+FMGenotype+Sex+Age)+(Genotype:Sex)+(FMGenotype:Sex)
+(Genotype:FMGenotype:Sex)+(Genotype:Age) 4064.964 0.715 0.044 1.430
(Genotype+FMGenotype+Sex+Age)+(Genotype:FMGenotype)+(Genotype:Sex)
+(FMGenotype:Sex)+(Genotype:FMGenotype:Sex)+(Genotype:Age) 4064.964 0.715 0.044 1.430
(Genotype+FMGenotype+Sex+Age)+(Genotype:FMGenotype)+(FMGenotype:Sex)
+(Genotype:FMGenotype:Sex)+(Genotype:Age) 4064.964 0.715 0.044 1.430

81
81
81
Supplemental Table 2.1.4 Elevated Plus Maze – Distance in Closed Arms
Model AICc ∆ AICc Wt ER
Genotype+Sex+Genotype:Sex 2417.806 0 0.328 1
Genotype+Sex 2419.597 1.791 0.134 2.449
(Genotype+FMGenotype+Sex)+(Genotype:Sex) 2419.772 1.966 0.123 2.673
(Genotype+FMGenotype+Sex)+(Genotype:FMGenotype)+(Genotype:Sex) 2421.298 3.492 0.057 5.732
Genotype+FMGenotype+Sex 2421.687 3.882 0.047 6.965
Supplemental Table 2.1.5 Elevated Plus Maze – Time in Closed Arms
Model AICc ∆ AICc Wt ER
Genotype+Sex 2440.189 0 0.247 1
(Genotype+Sex)+(Genotype:Sex) 2441.610 1.421 0.121 2.035
Genotype 2442.016 1.827 0.099 2.493
(Genotype+FMGenotype+Sex) 2442.145 1.956 0.093 2.659
(Genotype+FMGenotype+Sex)+(Genotype:FMGenotype) 2443.579 3.390 0.045 5.446
Supplemental Table 2.1.6 Elevated Plus Maze – Time Spent Freezing
Model AICc ∆ AICc Wt ER
(Sex+Age)+(Sex:Age) 2245.262 0 0.128 1
(FMGenotype+Sex+Age)+(Sex:Age) 2246.168 0.906 0.081 1.573
(Genotype+Sex+Age)+(Sex:Age) 2246.319 1.058 0.076 1.697
(FMGenotype+Sex+Age)+(FMGenotype:Sex)+(Sex:Age) 2247.057 1.796 0.052 2.454
(Genotype+FMGenotype+Sex+Age)+(Genotype:FMGenotype)+(FMGenotype:Sex)
+(Sex:Age) 2247.071 1.809 0.052 2.471
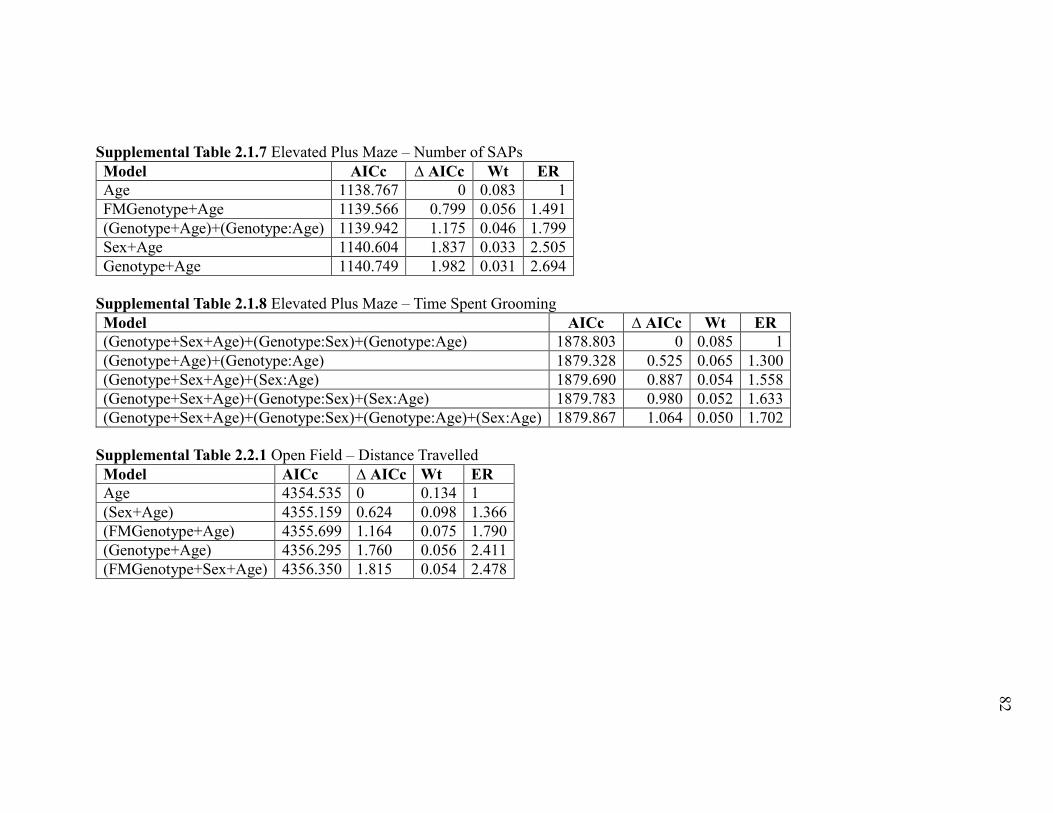
82
82
82
Supplemental Table 2.1.7 Elevated Plus Maze – Number of SAPs
Model AICc ∆ AICc Wt ER
Age 1138.767 0 0.083 1
FMGenotype+Age 1139.566 0.799 0.056 1.491
(Genotype+Age)+(Genotype:Age) 1139.942 1.175 0.046 1.799
Sex+Age 1140.604 1.837 0.033 2.505
Genotype+Age 1140.749 1.982 0.031 2.694
Supplemental Table 2.1.8 Elevated Plus Maze – Time Spent Grooming
Model AICc ∆ AICc Wt ER
(Genotype+Sex+Age)+(Genotype:Sex)+(Genotype:Age) 1878.803 0 0.085 1
(Genotype+Age)+(Genotype:Age) 1879.328 0.525 0.065 1.300
(Genotype+Sex+Age)+(Sex:Age) 1879.690 0.887 0.054 1.558
(Genotype+Sex+Age)+(Genotype:Sex)+(Sex:Age) 1879.783 0.980 0.052 1.633
(Genotype+Sex+Age)+(Genotype:Sex)+(Genotype:Age)+(Sex:Age) 1879.867 1.064 0.050 1.702
Supplemental Table 2.2.1 Open Field – Distance Travelled
Model AICc ∆ AICc Wt ER
Age 4354.535 0 0.134 1
(Sex+Age) 4355.159 0.624 0.098 1.366
(FMGenotype+Age) 4355.699 1.164 0.075 1.790
(Genotype+Age) 4356.295 1.760 0.056 2.411
(FMGenotype+Sex+Age) 4356.350 1.815 0.054 2.478

83
83
83
Supplemental Table 2.2.2 Open Field – Number of Rears
Model AICc ∆ AICc Wt ER
(Genotype+FMGenotype+Sex+Age)+(Genotype:Age)+(Sex:Age) 1886.184 0 0.090 1
(Genotype+FMGenotype+Sex+Age)+(Genotype:Age)+(FMGenotype:Age)+(Sex:Age) 1887.151 0.967 0.056 1.622
(Genotype+FMGenotype+Sex+Age)+(Genotype:Sex)+(Genotype:Age)+(Sex:Age) 1887.532 1.349 0.046 1.963
(Genotype+FMGenotype+Sex+Age)+(Genotype:FMGenotype)+(Genotype:Age)+(Sex:Age) 1888.373 2.189 0.030 2.988
(Genotype+FMGenotype+Sex+Age)+(FMGenotype:Sex)+(Genotype:Age)+(Sex:Age) 1888.441 2.257 0.029 3.091
Supplemental Table 2.2.3 Open Field – Center Entries
Model AICc ∆ AICc Wt ER
(Genotype+FMGenotype+Age)+(Genotype:Age)+(FMGenotype:Age) 914.622 0 0.159 1
(Genotype+FMGenotype+Sex+Age)+(Genotype:Age)+(FMGenotype:Age) 916.704 2.082 0.056 2.832
(Genotype+FMGenotype+Sex+Age)+(FMGenotype:Sex)+(Genotype:Age)+
(FMGenotype:Age) 916.798 2.177 0.054 2.969
(Genotype+FMGenotype+Age)+(Genotype:FMGenotype)+(Genotype:Age)+
(FMGenotype:Age) 916.861 2.240 0.052 3.064
(Genotype+FMGenotype+Age)+(Genotype:Age) 916.969 2.348 0.049 3.234
Supplemental Table 2.2.4 Open Field – Time in Center
Model AICc ∆ AICc Wt ER
(Genotype*Age) 1210.696 0 0.230 1
(Genotype+Age) 1212.412 1.716 0.097 2.359
(Genotype+FMGenotype+Age)+(Genotype:Age) 1212.427 1.731 0.097 2.377
(Genotype+Sex+Age)+(Genotype:Age) 1212.732 2.036 0.083 2.768
(Genotype+FMGenotype+Age)+(Genotype:FMGenotype)+(Genotype:Age) 1213.184 2.489 0.066 3.471
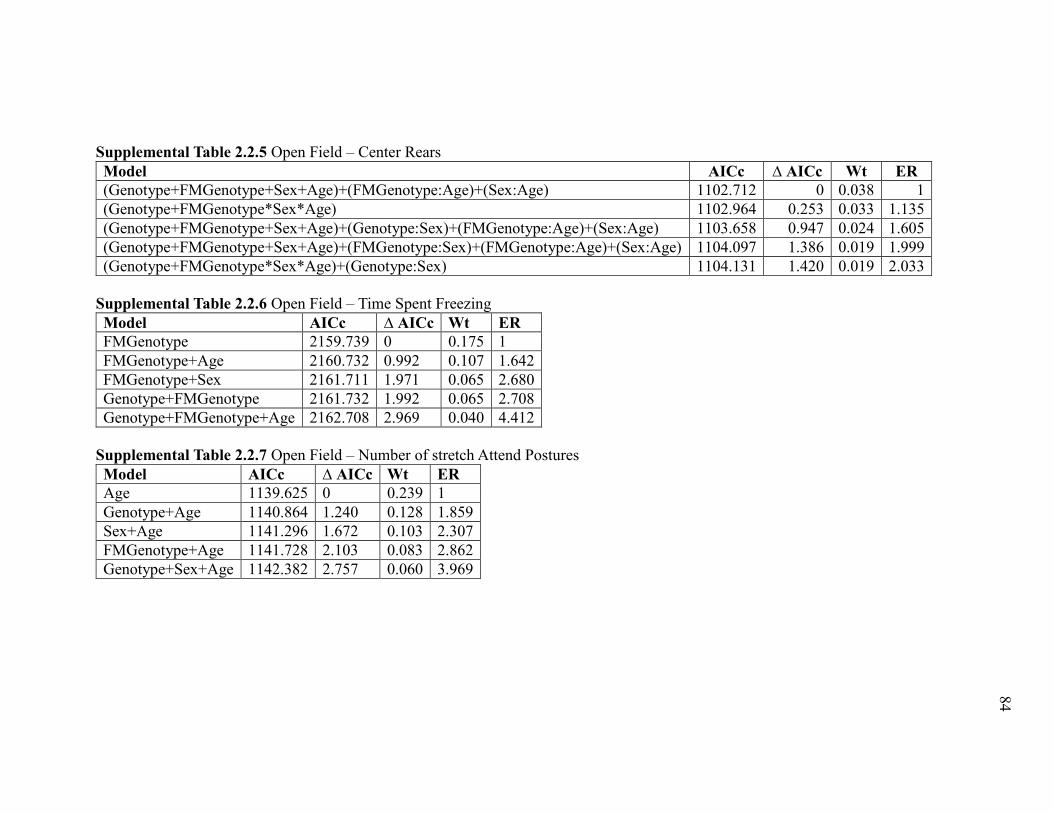
84
84
84
Supplemental Table 2.2.5 Open Field – Center Rears
Model AICc ∆ AICc Wt ER
(Genotype+FMGenotype+Sex+Age)+(FMGenotype:Age)+(Sex:Age) 1102.712 0 0.038 1
(Genotype+FMGenotype*Sex*Age) 1102.964 0.253 0.033 1.135
(Genotype+FMGenotype+Sex+Age)+(Genotype:Sex)+(FMGenotype:Age)+(Sex:Age) 1103.658 0.947 0.024 1.605
(Genotype+FMGenotype+Sex+Age)+(FMGenotype:Sex)+(FMGenotype:Age)+(Sex:Age) 1104.097 1.386 0.019 1.999
(Genotype+FMGenotype*Sex*Age)+(Genotype:Sex) 1104.131 1.420 0.019 2.033
Supplemental Table 2.2.6 Open Field – Time Spent Freezing
Model AICc ∆ AICc Wt ER
FMGenotype 2159.739 0 0.175 1
FMGenotype+Age 2160.732 0.992 0.107 1.642
FMGenotype+Sex 2161.711 1.971 0.065 2.680
Genotype+FMGenotype 2161.732 1.992 0.065 2.708
Genotype+FMGenotype+Age 2162.708 2.969 0.040 4.412
Supplemental Table 2.2.7 Open Field – Number of stretch Attend Postures
Model AICc ∆ AICc Wt ER
Age 1139.625 0 0.239 1
Genotype+Age 1140.864 1.240 0.128 1.859
Sex+Age 1141.296 1.672 0.103 2.307
FMGenotype+Age 1141.728 2.103 0.083 2.862
Genotype+Sex+Age 1142.382 2.757 0.060 3.969

85
85
85
Supplemental Table 2.2.8 Open Field – Time Spent Grooming
Model AICc ∆ AICc Wt ER
(Genotype+FMGenotype+Sex+Age)+(Genotype:Sex)+(FMGenotype:Sex) 1912.996 0 0.064 1
(Genotype+Sex+Age)+(Genotype:Sex) 1913.866 0.870 0.041 1.545
(Genotype*FMGenotype*Sex+Age) 1914.260 1.264 0.034 1.881
(Genotype+FMGenotype+Sex+Age)+(Genotype:FMGenotype)+(Genotype:Sex)
+(FMGenotype:Sex) 1914.324 1.328 0.033 1.943
(Genotype+FMGenotype+Sex+Age)+(Genotype:Sex)+(FMGenotype:Sex)+(Sex:Age) 1914.618 1.622 0.028 2.250
Supplemental Table 2.3 Body Weight
Model AICc ∆ AICc Wt ER
(Genotype+FMGenotype+Sex+Age)+(Genotype:Sex)+(Genotype:Age)+ (FMGenotype:Sex:Age)
1539.390 0.000 0.039 1.000
(Genotype+FMGenotype+Sex+Age)+(Genotype:FMGenotype)+(Genotype:Sex)+ (Genotype:Age+(FMGenotype:Sex:Age)
1541.768 2.378 0.012 3.284
(Genotype+FMGenotype+Sex+Age)+(Genotype:Sex)+(Sex:Age)+ (Genotype:Sex:Age)+(FMGenotype:Sex:Age)
1541.778 2.388 0.012 3.301
(Genotype+FMGenotype+Sex+Age)+(Genotype:Age)+(FMGenotype:Sex:Age) 1542.193 2.803 0.010 4.061
(Genotype+FMGenotype+Sex+Age)+(Genotype:FMGenotype:Sex)+ (Genotype:Age)+(FMGenotype:Sex:Age)
1544.002 4.611 0.004 10.032
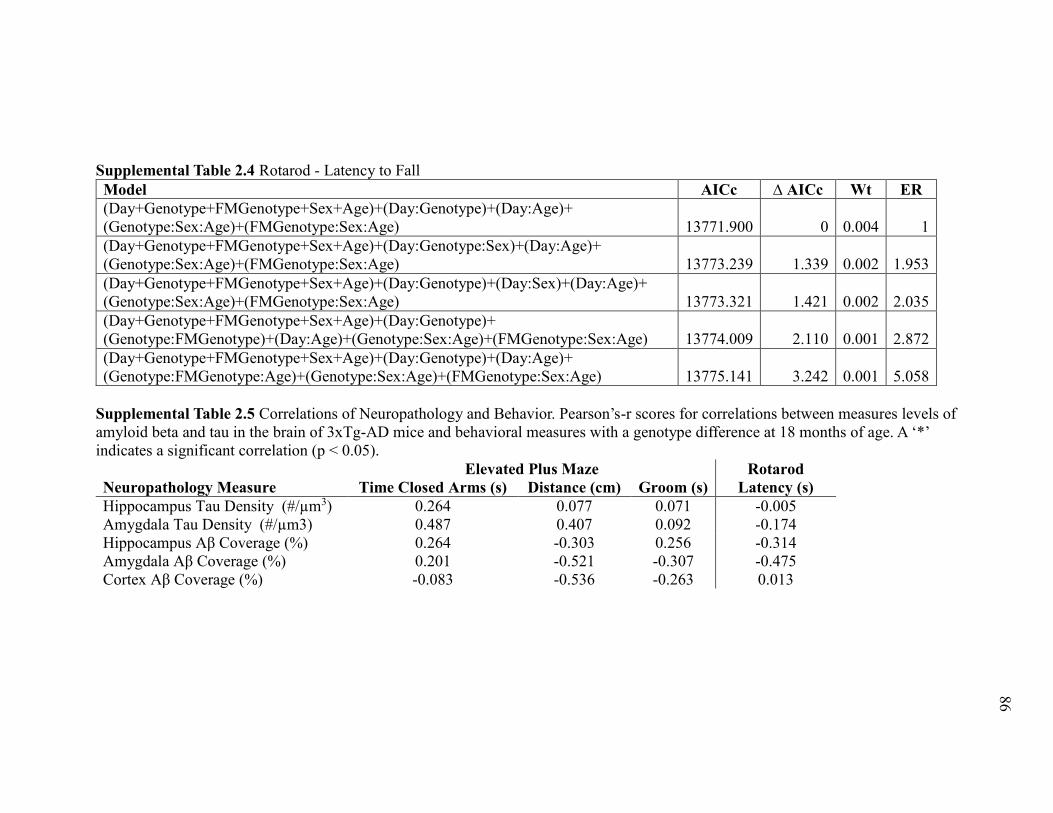
86
86
86
Supplemental Table 2.4 Rotarod - Latency to Fall
Model AICc ∆ AICc Wt ER
(Day+Genotype+FMGenotype+Sex+Age)+(Day:Genotype)+(Day:Age)+
(Genotype:Sex:Age)+(FMGenotype:Sex:Age) 13771.900 0 0.004 1
(Day+Genotype+FMGenotype+Sex+Age)+(Day:Genotype:Sex)+(Day:Age)+
(Genotype:Sex:Age)+(FMGenotype:Sex:Age) 13773.239 1.339 0.002 1.953
(Day+Genotype+FMGenotype+Sex+Age)+(Day:Genotype)+(Day:Sex)+(Day:Age)+
(Genotype:Sex:Age)+(FMGenotype:Sex:Age) 13773.321 1.421 0.002 2.035
(Day+Genotype+FMGenotype+Sex+Age)+(Day:Genotype)+
(Genotype:FMGenotype)+(Day:Age)+(Genotype:Sex:Age)+(FMGenotype:Sex:Age) 13774.009 2.110 0.001 2.872
(Day+Genotype+FMGenotype+Sex+Age)+(Day:Genotype)+(Day:Age)+
(Genotype:FMGenotype:Age)+(Genotype:Sex:Age)+(FMGenotype:Sex:Age) 13775.141 3.242 0.001 5.058
Supplemental Table 2.5 Correlations of Neuropathology and Behavior. Pearson’s-r scores for correlations between measures levels of
amyloid beta and tau in the brain of 3xTg-AD mice and behavioral measures with a genotype difference at 18 months of age. A ‘*’
indicates a significant correlation (p < 0.05).
Elevated Plus Maze Rotarod
Neuropathology Measure Time Closed Arms (s) Distance (cm) Groom (s) Latency (s)
Hippocampus Tau Density (#/µm3) 0.264 0.077 0.071 -0.005
Amygdala Tau Density (#/µm3) 0.487 0.407 0.092 -0.174
Hippocampus Aβ Coverage (%) 0.264 -0.303 0.256 -0.314
Amygdala Aβ Coverage (%) 0.201 -0.521 -0.307 -0.475
Cortex Aβ Coverage (%) -0.083 -0.536 -0.263 0.013
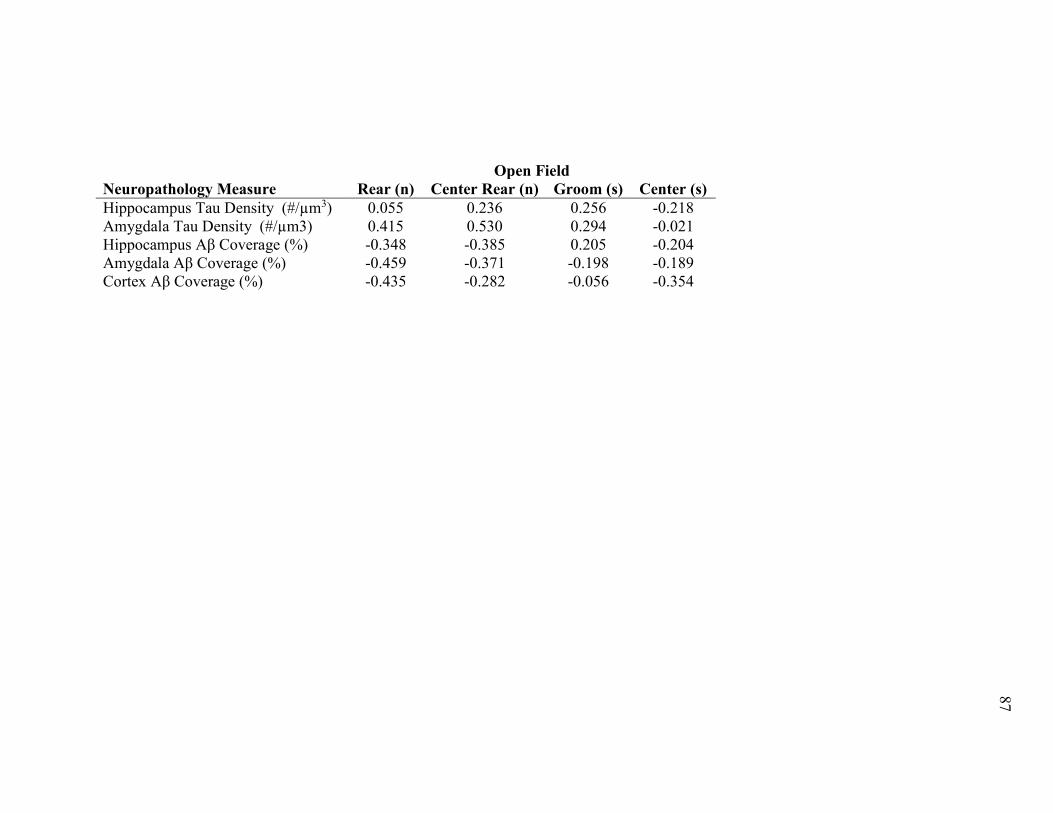
87
87
87
Open Field
Neuropathology Measure Rear (n) Center Rear (n) Groom (s) Center (s)
Hippocampus Tau Density (#/µm3) 0.055 0.236 0.256 -0.218
Amygdala Tau Density (#/µm3) 0.415 0.530 0.294 -0.021
Hippocampus Aβ Coverage (%) -0.348 -0.385 0.205 -0.204
Amygdala Aβ Coverage (%) -0.459 -0.371 -0.198 -0.189
Cortex Aβ Coverage (%) -0.435 -0.282 -0.056 -0.354

88
88
88
2.9 SUPPLEMENTAL FIGURES
W T _ P T G _ P2 6 1 2 1 8
0
5 0 0
1 0 0 0
1 5 0 0
2 0 0 0
2 5 0 0 D is ta n c e
A ge (m )
Dis
tan
ce
(c
m)
TG _M
W T _ M
TG _M
W T _ MF M
T G _ P W T _ P T G _ P W T _ P T G _ P W T _ P
W T _ P T G _ P2 6 1 2 1 8
0
2 0
4 0
6 0
8 0 D is ta n c e C lo s e d A rm s
A g e (m )%
Dis
tan
ce
in
Clo
se
d A
rm
s
T G _ P W T _ P T G _ P W T _ P T G _ P W T _ P
W T _ P T G _ P2 6 1 2 1 8
0
2 0
4 0
6 0
8 0T im e C lo s e d A rm s
A ge (m )
% T
ime
in
Clo
se
d A
rm
s
T G _ P W T _ P T G _ P W T _ P T G _ P W T _ P W T _ P T G _ P2 6 1 2 1 8
0
2 0
4 0
6 0
8 0F r e e z in g
A ge (m )
Tim
e F
re
ez
ing
(s
)
T G _ P W T _ P T G _ P W T _ P T G _ P W T _ P
2 6 1 2 1 8
0
1 0
2 0
3 0 G r o o m in g
A ge (m )
Tim
e G
ro
om
ing
(s
)
T G _ P W T _ P T G _ P W T _ P T G _ P W T _ P T G _ P W T _ P
2 6 1 2 1 8
0
1 0
2 0
3 0H e a d D ip s
A ge (m )
He
ad
Dip
s (
n)
T G _ P W T _ P T G _ P W T _ P T G _ P W T _ P T G _ P W T _ P
2 6 1 2 1 8
0
2
4
6
8
1 0R e a rs
A ge (m )
Re
ars
(n
)
T G _ P W T _ P T G _ P W T _ P T G _ P W T _ P T G _ P W T _ P
2 6 1 2 1 8
0
2
4
6 S A P s
A g e (m )
SA
Ps
(n
)
T G _ P W T _ P T G _ P W T _ P T G _ P W T _ P T G _ P W T _ P
A . B .
C . D .
E . F .
G . H .
Supplemental Figure 2.1 The Elevated Plus Maze. The mean (± S.E.M) total distance
travelled (A), number of rears (B) and head dips (C), percentage of distance (D) and time
(E) spent in the closed arms, the time spent freezing (F), number of stretch attend
postures (G) and time spent grooming (H) of 3xTg-AD (TG_P) and B6129SF2 (WT_P)
mice reared by 3xTg-AD (TG_M) and B6129SF2 (WT_M) foster mothers in the elevated
plus maze.
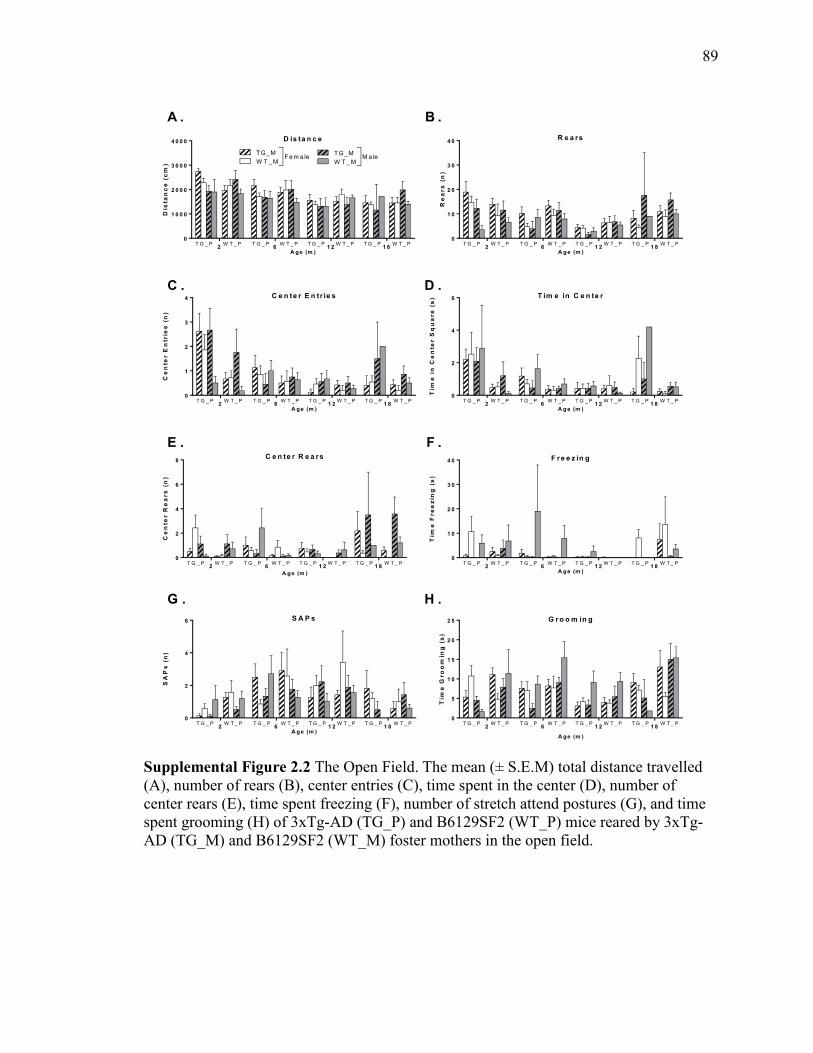
89
89
89
W T _ P T G _ P2 6 1 2 1 8
0
1 0 0 0
2 0 0 0
3 0 0 0
4 0 0 0 D is ta n c e
A ge (m )
Dis
tan
ce
(c
m)
TG _M
W T _ M
TG _M
W T _ MF e m a le M ale
T G _ P W T _ P T G _ P W T _ P T G _ P W T _ P
W T _ P T G _ P2 6 1 2 1 8
0
1
2
3
4 C e n te r E n tr ie s
A g e (m )
Ce
nte
r E
ntr
ies
(n
)
T G _ P W T _ P T G _ P W T _ P T G _ P W T _ P W T _ P T G _ P2 6 1 2 1 8
0
2
4
6 T im e in C e n te r
A ge (m )
Tim
e i
n C
en
ter S
qu
are
(s
)
T G _ P W T _ P T G _ P W T _ P T G _ P W T _ P
W T _ P T G _ P2 6 1 2 1 8
0
1 0
2 0
3 0
4 0 F r e e z in g
A ge (m )
Tim
e F
re
ez
ing
(s
)
T G _ P W T _ P T G _ P W T _ P T G _ P W T _ P
2 6 1 2 1 8
0
5
1 0
1 5
2 0
2 5 G r o o m in g
A ge (m )
Tim
e G
ro
om
ing
(s
)
T G _ P W T _ P T G _ P W T _ P T G _ P W T _ P T G _ P W T _ P
2 6 1 2 1 8
0
2
4
6
8C e n te r R e a r s
A ge (m )
Ce
nte
r R
ea
rs
(n
)
T G _ P W T _ P T G _ P W T _ P T G _ P W T _ P T G _ P W T _ P
2 6 1 2 1 8
0
1 0
2 0
3 0
4 0R e a rs
A g e (m )
Re
ars
(n
)
T G _ P W T _ P T G _ P W T _ P T G _ P W T _ P T G _ P W T _ P
2 6 1 2 1 8
0
2
4
6 S A P s
A ge (m )
SA
Ps
(n
)
T G _ P W T _ P T G _ P W T _ P T G _ P W T _ P T G _ P W T _ P
A . B .
C . D .
E . F .
G . H .
Supplemental Figure 2.2 The Open Field. The mean (± S.E.M) total distance travelled
(A), number of rears (B), center entries (C), time spent in the center (D), number of
center rears (E), time spent freezing (F), number of stretch attend postures (G), and time
spent grooming (H) of 3xTg-AD (TG_P) and B6129SF2 (WT_P) mice reared by 3xTg-
AD (TG_M) and B6129SF2 (WT_M) foster mothers in the open field.
90
90
90
CHAPTER 3 AGE-RELATED CHANGES IN ACOUSTIC STARTLE
AND PREPULSE INHIBITION IN THE 3XTG-AD MOUSE MODEL
OF ALZHEIMER’S DISEASE: A LONGITUDINAL STUDY
Kurt R. Stover, Michelle E. Hicks, Kaitlyn M. Gordon, and Richard E. Brown
Department of Psychology and Neuroscience
Dalhousie University
PO Box 1500, Halifax, NS
Canada B3H 4R2
Submitted to Physiology and Behaviour
91
91
91
3.1 ABSTRACT
Prepulse inhibition (PPI) occurs when a weak prepulse causes the inhibition of the
startle response to a stronger stimulus. Deficits in PPI are associated with deficits in
sensorimotor gating, and occur in schizophrenia and other neuropsychiatric disorders.
The 3xTg-AD transgenic mouse model of Alzheimer’s disease (AD) has three transgenes,
two associated with familial AD and one with frontotemporal dementia and is commonly
used in AD research as it develops amyloid beta plaques, neurofibrillary tangles, and
cognitive deficits. The 3xTg-AD mice have been reported to have an increase in acoustic
startle response and a decrease in prepulse inhibition relative to B6129SF2 control mice
at 7 months of age. We tested male and female 3xTg-AD and B6129SF2 mice in acoustic
startle and PPI in a longitudinal study at 2, 6, 12, and 18 months of age. Female 3xTg-AD
mice had a larger acoustic startle response than males, and the magnitude of acoustic
startle increased from 2 to 6 months of age, then decreased. All mice exhibited evidence
of PPI, and at the highest prepulse intensity the 3xTg-AD mice exhibited more PPI than
B6129SF2 mice. The amount of PPI increased with age for all mice. Overall there was an
increase in acoustic startle response and no deficit in sensorimotor gating in 3xTg-AD
mice relative to B6129SF2 control mice.

92
92
92
3.2 INTRODUCTION
The 3xTg-AD mouse model of Alzheimer’s disease (AD) has three transgenes,
two associated with familial AD and one with frontotemporal dementia. This strain is
commonly used in AD research as it develops amyloid beta plaques, neurofibrillary
tangles, and cognitive deficits. The breeding system requires that the 3xTg-AD females
be bred with 3xTg-AD males and the wildtype control (B6129SF2) mice be bred with
other wildtype mice. This results in the 3xTg-AD mice being be reared by 3xTg-AD
mothers, and B6129SF2 controls being reared by B6129SF2 mothers (Oddo et al., 2003).
Because differences in maternal care or early life environment can have a lasting effect
on brain and behaviour (Priebe et al., 2005; Szyf et al., 2007), we cross-fostered litters of
3xTg-AD and B6129SF2 pups to create mixed genotype litters and assessed the
development of reflexes, learning, memory, and activity before weaning (see Blaney et
al., 2013). The present study examines the long-term effects of maternal genotype on
acoustic startle and prepulse inhibition of startle in these mice.
Prepulse inhibition (PPI) occurs when a weak prepulse causes the inhibition of the
startle response to a stronger stimulus. Prepulse inhibition is conserved across species;
both humans and mice exhibit PPI (Geyer et al., 2002). Deficits in PPI are associated
with deficits in sensorimotor gating, and occur in schizophrenia and other
neuropsychiatric disorders, though there are mixed reports about PPI impairments in AD
(Braff et al., 1978; Hejl et al., 2004; Ueki et al., 2006). Some transgenic mouse models of
AD are reported to have deficits in prepulse inhibition (McCool et al., 2003; Esposito et
al., 2006). In the only studies on 3xTg-AD mice, Pietropaolo et al., (2008) found an
increased startle response at 6 months of age in male and female 3xTg-AD mice relative
93
93
93
to control mice, and García-Mesa et al. (2011) found an increase in acoustic startle
response and a decrease in prepulse inhibition in male and female 3xTg-AD mice relative
to B6129SF2 control mice at 7 months of age. To determine if there were maternal
effects and age-related changes in acoustic startle and PPI in male and female 3xTg-AD
mice, we conducted a longitudinal study to assess the effect of pup genotype, maternal
genotype, sex, and age at 2, 6, 12, and 18 months of age.
3.3 METHODS
3.3.1 BREEDING, CROSS-FOSTERING & PRE-WEANING TREATMENT OF
MICE
The mice in this experiment were bred from four pairs of 3xTg-AD mice (JAX #
004807) and four pairs of B6129SF2 mice (JAX# 101045), which were purchased from
Jackson Laboratories (Bar Harbor, Maine). The 3xTg-AD and B6129SF3 are bred
separately, so 3xTg-AD mice are always reared by 3xTg-AD mothers, and B6129SF2
mice are always reared by B6129SF2 mothers. To study the effect of maternal genotype
we cross-fostered 3xTg-AD and B6129SF2 pups to create mixed genotype litters and no
mother had a litter containing her own pups. The mice underwent a neurodevelopmental
test battery from post natal day 0-24 to study pup and maternal differences in
development (see Blaney et al., 2013). After weaning, the mice were housed in same sex
mixed genotype groups of two to four mice, in clear plastic cages measuring 18.75 x 28 x
12.5 cm, with wood chip bedding, a PVC tube (4 cm diameter x 7 cm length) for
enrichment, and metal wire covers. They were fed Purina rodent chow (#5001, Purina, St.
Louis, Missouri) and tap water ad libitum, unless otherwise indicated. The colony room
was maintained at 22±2 °C on a reversed 12:12 light:dark cycle, with lights off at
94
94
94
10:00am. All procedures used in this experiment was approved by the Dalhousie
University Committee on Animal Care.
3.3.2 PROCEDURE
We tested a total of 78 mice, 40 3xTg-AD (17 male and 24 female) and 38
B6129SF2 (19 ale and 19 female), in a longitudinal study at 2, 6, 12, and 18 months of
age. Because of age and sex differences in mortality rates (Rae and Brown, 2015), the
sample sizes decreased unequally as mice aged (Table 3.1). The mice used in this study
also underwent a test battery to assess anxiety-like, motor, cognitive and social behaviour
as described by Stover et al. (2015a, 2015b, 2015c). The mice were tested in three
cohorts of approximately 27 animals each. During behavioural testing the experimenters
were kept blind to the pup genotype and foster mother genotype of the mice, however due
to the longitudinal design it was not possible to blind the experimenters to the age of the
mice. All testing took place during the dark phase of the light:dark cycle.
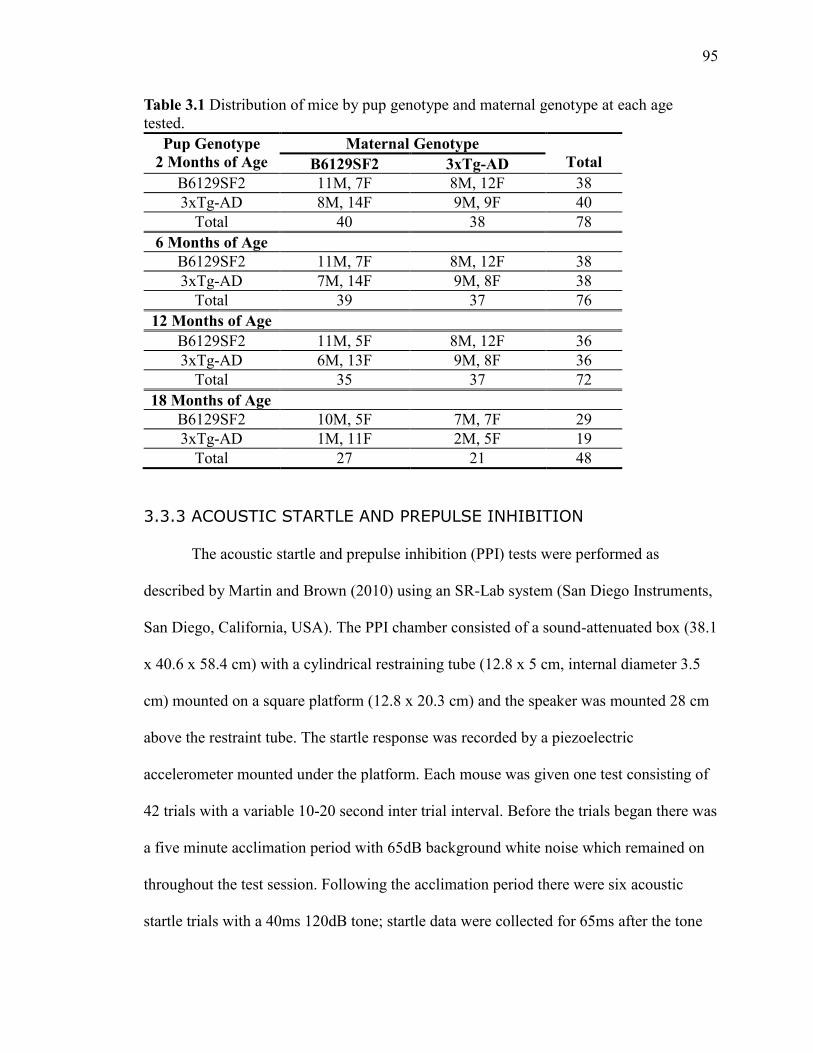
95
95
95
Table 3.1 Distribution of mice by pup genotype and maternal genotype at each age
tested.
Pup Genotype
2 Months of Age
Maternal Genotype
Total B6129SF2 3xTg-AD
B6129SF2 11M, 7F 8M, 12F 38
3xTg-AD 8M, 14F 9M, 9F 40
Total 40 38 78
6 Months of Age
B6129SF2 11M, 7F 8M, 12F 38
3xTg-AD 7M, 14F 9M, 8F 38
Total 39 37 76
12 Months of Age
B6129SF2 11M, 5F 8M, 12F 36
3xTg-AD 6M, 13F 9M, 8F 36
Total 35 37 72
18 Months of Age
B6129SF2 10M, 5F 7M, 7F 29
3xTg-AD 1M, 11F 2M, 5F 19
Total 27 21 48
3.3.3 ACOUSTIC STARTLE AND PREPULSE INHIBITION
The acoustic startle and prepulse inhibition (PPI) tests were performed as
described by Martin and Brown (2010) using an SR-Lab system (San Diego Instruments,
San Diego, California, USA). The PPI chamber consisted of a sound-attenuated box (38.1
x 40.6 x 58.4 cm) with a cylindrical restraining tube (12.8 x 5 cm, internal diameter 3.5
cm) mounted on a square platform (12.8 x 20.3 cm) and the speaker was mounted 28 cm
above the restraint tube. The startle response was recorded by a piezoelectric
accelerometer mounted under the platform. Each mouse was given one test consisting of
42 trials with a variable 10-20 second inter trial interval. Before the trials began there was
a five minute acclimation period with 65dB background white noise which remained on
throughout the test session. Following the acclimation period there were six acoustic
startle trials with a 40ms 120dB tone; startle data were collected for 65ms after the tone

96
96
96
was presented. After the initial startle trials there were 30 prepulse inhibition and 6 no-
stimulus trials (with only background white noise) presented in a semi-random order.
Prepulse inhibition trials lasted 185ms and had a pairing of a lower prepulse tone and a
120dB startle tone. For the first 20ms of the trial a prepulse tone of 74, 78, 82, 86, or 90
dB was presented, followed by 100 ms background white noise, and then a final 40 ms
120 dB startle tone. During PPI trials, startle data were collected for 65 ms after the
120dB startle tone and the auditory startle (response to only the initial startle trials) and
percentage of inhibition ((𝑆𝑡𝑎𝑟𝑡𝑙𝑒 𝑅𝑒𝑠𝑝𝑜𝑛𝑠𝑒 𝑖𝑛 𝑃𝑃𝐼 𝑇𝑟𝑖𝑎𝑙
𝑆𝑡𝑎𝑟𝑡𝑙𝑒 𝑅𝑒𝑠𝑝𝑜𝑛𝑠𝑒 𝑖𝑛 120𝑑𝐵 𝑇𝑟𝑖𝑎𝑙) ∗ 100) were analyzed.
3.3.4 STATISTICAL ANALYSES
Statistical analyses were performed with R (www.R-project.org) using linear
mixed effects models, with pup genotype, foster mother genotype, sex, and age as
possible predictors. For acoustic startle all of the possible models were constructed, and
the second order Akaike information criterion (AICc), Akaike weight, and evidence ratio
were calculated for each model. The model with the lowest AICc was chosen as the ‘best’
model. For prepulse inhibition the model was chosen using backwards elimination. The
best model was compared to the null model with a χ2 test (Akaike, 1974; Burnham and
Anderson, 2002) and we calculated confidence intervals (95%) for all effects in that
model. For measures with significant main effects of pup genotype, sex, or foster mother
genotype, the effect size was calculated using Cohen’s d with a Hedge’s (dunb) for an
unbiased measure (Hedges, 1981; Cumming, 2014). The levels of amyloid beta and tau
neuropathology were assessed after behavioural testing at 19 months of age (Stover et al.,
2015e), and the data were correlated with acoustic startle and the percentage of PPI at the
highest prepulse intensity using Pearson’s-r.
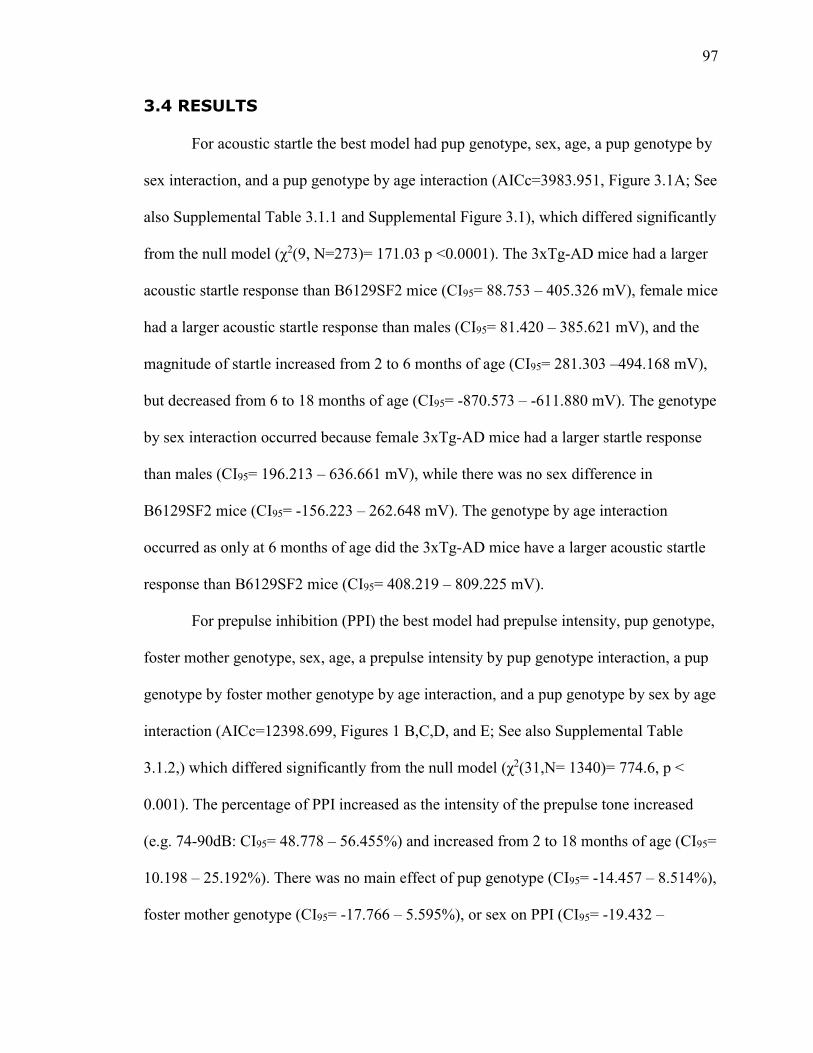
97
97
97
3.4 RESULTS
For acoustic startle the best model had pup genotype, sex, age, a pup genotype by
sex interaction, and a pup genotype by age interaction (AICc=3983.951, Figure 3.1A; See
also Supplemental Table 3.1.1 and Supplemental Figure 3.1), which differed significantly
from the null model (χ2(9, N=273)= 171.03 p <0.0001). The 3xTg-AD mice had a larger
acoustic startle response than B6129SF2 mice (CI95= 88.753 – 405.326 mV), female mice
had a larger acoustic startle response than males (CI95= 81.420 – 385.621 mV), and the
magnitude of startle increased from 2 to 6 months of age (CI95= 281.303 –494.168 mV),
but decreased from 6 to 18 months of age (CI95= -870.573 – -611.880 mV). The genotype
by sex interaction occurred because female 3xTg-AD mice had a larger startle response
than males (CI95= 196.213 – 636.661 mV), while there was no sex difference in
B6129SF2 mice (CI95= -156.223 – 262.648 mV). The genotype by age interaction
occurred as only at 6 months of age did the 3xTg-AD mice have a larger acoustic startle
response than B6129SF2 mice (CI95= 408.219 – 809.225 mV).
For prepulse inhibition (PPI) the best model had prepulse intensity, pup genotype,
foster mother genotype, sex, age, a prepulse intensity by pup genotype interaction, a pup
genotype by foster mother genotype by age interaction, and a pup genotype by sex by age
interaction (AICc=12398.699, Figures 1 B,C,D, and E; See also Supplemental Table
3.1.2,) which differed significantly from the null model (χ2(31,N= 1340)= 774.6, p <
0.001). The percentage of PPI increased as the intensity of the prepulse tone increased
(e.g. 74-90dB: CI95= 48.778 – 56.455%) and increased from 2 to 18 months of age (CI95=
10.198 – 25.192%). There was no main effect of pup genotype (CI95= -14.457 – 8.514%),
foster mother genotype (CI95= -17.766 – 5.595%), or sex on PPI (CI95= -19.432 –

98
98
98
3.367%). The pup genotype by prepulse intensity interaction occurred because at the
highest level of prepulse intensity (90dB) the 3xTg-AD mice tended to have a higher
percentage of PPI than B6129SF2 mice (CI95= -2.112 – 22.540%), but there was no
difference at lower prepulse intensities. The pup genotype by foster mother genotype by
age interaction occurred because only at 2 months of age did the B6129SF2 mice reared
by B6129SF2 mothers have a higher percentage of PPI than mice reared by 3xTg-AD
mothers (CI95= -1.906 – 20.676%), while the 3xTg-AD mice reared by 3xTg-AD mothers
had a higher percentage of PPI than the mice reared by B6129SF2 mothers (CI95= 13.968
– 39.465%. The pup genotype by sex by age interaction occurred because only at 6
months of age did the male 3xTg-AD mice have a higher percentage of PPI than females
(CI95= 7.676 – 34.024%), while there was no sex difference in B6129SF2 mice (CI95= -
22.570 – 11.728%).

99
99
99
W T _ P T G _ P
2 6 1 2 1 8
0
5 0 0
1 0 0 0
1 5 0 0
2 0 0 0 A c o u s t ic S ta r t le
A ge (m )
Ac
ou
sti
c S
tartl
e (
mV
)
F e m a le
T G _ P W T _ P T G _ P W T _ P T G _ P W T _ P
M ale
*
7 4 7 8 8 2 8 6 9 0
0
2 0
4 0
6 0
8 0
1 0 0 P P I - 2 m
P re p u ls e In te n s ity (d B )
Pre
pu
lse
In
hib
itio
n (
%)
TG _M
W T _ M
TG _M
W T _ MF e m a le M ale
T G _ P W T _ P T G _ P W T _ P T G _ P W T _ P T G _ P W T _ P T G _ P W T _ P
7 4 7 8 8 2 8 6 9 0
0
2 0
4 0
6 0
8 0
1 0 0 P P I - 6 m
P re p u ls e In te n s ity (d B )
Pre
pu
lse
In
hib
itio
n (
%)
TG _M
W T _ M
TG _M
W T _ M
T G _ P W T _ P T G _ P W T _ P T G _ P W T _ P T G _ P W T _ P T G _ P W T _ P
F e m a le M ale
7 4 7 8 8 2 8 6 9 0
0
2 0
4 0
6 0
8 0
1 0 0 P P I - 1 2 m
P re p u ls e In te n s ity (d B )
Pre
pu
lse
In
hib
itio
n (
%)
TG _M
W T _ M
TG _M
W T _ M
T G _ P W T _ P T G _ P W T _ P T G _ P W T _ P T G _ P W T _ P T G _ P W T _ P
F e m a le M ale
7 4 7 8 8 2 8 6 9 0
0
2 0
4 0
6 0
8 0
1 0 0 P P I - 1 8 m
P re p u ls e In te n s ity (d B )
Pre
pu
lse
In
hib
itio
n (
%)
TG _M
W T _ M
TG _M
W T _ M
T G _ P W T _ P T G _ P W T _ P T G _ P W T _ P T G _ P W T _ P T G _ P W T _ P
F e m a le M ale
A
B C
D E
Figure 3.1 Mean (± S.E.M) startle response (A) of 3xTg-AD (TG_P) and B6129SF2
(WT_P) mice at 2, 6, 12, and 18 months of age. The mean (± S.E.M) percentage of
prepulse inhibition at 2 (B), 6 (C), 12 (D), and 18 (E) months of age in 3xTg-AD and
B6129SF2 mice reared by 3xTg-AD (TG_M) and B6129SF2 (WT_M) foster mothers.
The effect sizes of models with a main effect of genotype, sex, or foster mother
genotype are shown in Table 3.2, which shows that the acoustic startle had the only effect
size that did not include zero.
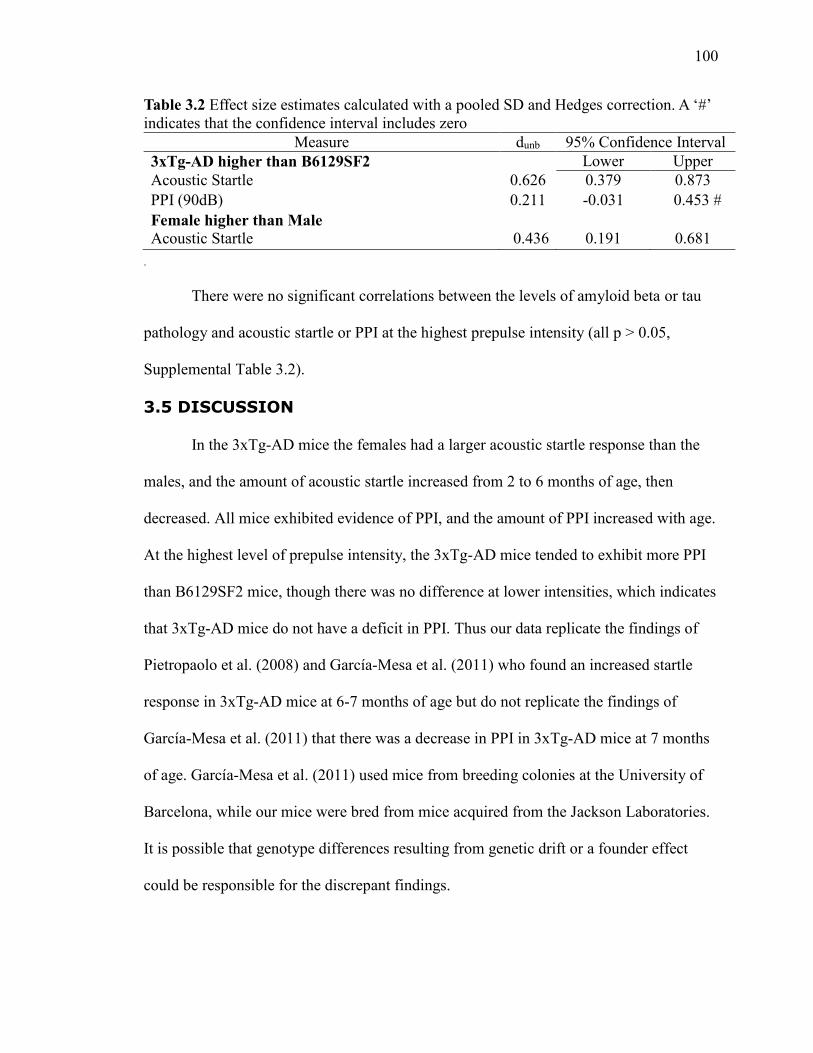
100
100
100
Table 3.2 Effect size estimates calculated with a pooled SD and Hedges correction. A ‘#’
indicates that the confidence interval includes zero
Measure dunb 95% Confidence Interval
3xTg-AD higher than B6129SF2 Lower Upper
Acoustic Startle 0.626 0.379 0.873
PPI (90dB) 0.211 -0.031 0.453 #
Female higher than Male
Acoustic Startle 0.436 0.191 0.681
.
There were no significant correlations between the levels of amyloid beta or tau
pathology and acoustic startle or PPI at the highest prepulse intensity (all p > 0.05,
Supplemental Table 3.2).
3.5 DISCUSSION
In the 3xTg-AD mice the females had a larger acoustic startle response than the
males, and the amount of acoustic startle increased from 2 to 6 months of age, then
decreased. All mice exhibited evidence of PPI, and the amount of PPI increased with age.
At the highest level of prepulse intensity, the 3xTg-AD mice tended to exhibit more PPI
than B6129SF2 mice, though there was no difference at lower intensities, which indicates
that 3xTg-AD mice do not have a deficit in PPI. Thus our data replicate the findings of
Pietropaolo et al. (2008) and García-Mesa et al. (2011) who found an increased startle
response in 3xTg-AD mice at 6-7 months of age but do not replicate the findings of
García-Mesa et al. (2011) that there was a decrease in PPI in 3xTg-AD mice at 7 months
of age. García-Mesa et al. (2011) used mice from breeding colonies at the University of
Barcelona, while our mice were bred from mice acquired from the Jackson Laboratories.
It is possible that genotype differences resulting from genetic drift or a founder effect
could be responsible for the discrepant findings.
101
101
101
We found only one sex difference: At six months of age male 3xTg-AD mice had
a higher percentage of PPI than females, but there was no sex difference in B6129SF2
mice. Willott et al. (2003) assessed PPI in 40 strains of inbred mice and found a sex
difference in only two strains of mice, and neither of these were the background strains of
the 3xTg-AD mice (C57BL/6J and 129S1/SVImJ), so the sex difference may be due to
the transgenes, a spurious result, or due to some neurodevelopmental event that is
particular to 6 month old mice, though it is unclear why it would only be present at six
months of age. We analyzed the levels of amyloid beta and tau pathology in the brains of
the mice used in this study at 19 months of age (See Stover et al., 2015c) and we found
no correlation between PPI and levels of neuropathology.
There is considerable variation in the levels of both acoustic startle and PPI
between strains of mice, though F1 hybrids generally have more homogenous PPI scores
(Logue et al., 1997). The B6129SF2 mice used as a background strain for the 3xTg-AD
mice and a control strain are F2 hybrids, so it is possible that there will be independent
segregation of the genes related to PPI, for example disrupted in schizophrenia 1
(DISC1), a gene associated with schizophrenia in humans and schizophrenia-like
symptoms in mice, which could lead to increased variability between mice. We observed
fairly high levels of variability in PPI in both genotypes at all ages tested (see Figure 3.1
B-E). There is also variability between laboratories when assessing the levels of acoustic
startle and PPI in the same strain (Bullock et al., 1997; Crawley et al., 1997; Willott et al.,
2003). The 3xTg-AD mice are bred as a separate line from the B6129SF2 control mice,
and so there is the possibility of several issues with genetic differences including genetic
drift between 3xTg-AD and B6129SF2 mice, which are an approximate control strain, a

102
102
102
founder effect, or the influence of maternal genotype on development. The only
difference that we found due to maternal genotype was a pup genotype by maternal
genotype interaction at two months of age, where mice who were reared by the same
genotype mothers had higher levels of PPI than those who were reared by mothers of
different genotypes. Thus even at two months of age there was no overall effect of
maternal genotype on acoustic startle or PPI, though during a neurodevelopmental test
battery before weaning we found that maternal genotype affected the development of
several reflexes and mice reared by B6129SF2 mothers had a higher frequency of rearing
(vertical beam breaks in an automated open field) than mice reared by 3xTg-AD mothers
(Blaney et al., 2013).
McCool et al. (2003) found no difference in PPI between AD model mice that
were tested longitudinally and those that were tested cross-sectionally, indicating that
there is no detectable habituation to PPI in mice. Willott et al., (2003) tested the PPI of 40
strains of inbred mice and found that with an immediate re-test there was no habituation
in the majority of strains tested. These findings indicate that there is little effect of re-
testing on PPI in mice. In our study we found that the percentage of PPI increased with
age, which is likely a result of ageing, not habituation or sensitization to the test.
There have been mixed reports about whether humans with AD develop deficits
in PPI (Hejl et al., 2004; Ueki et al., 2006), so it is unclear whether PPI is a desirable trait
in a mouse model of AD, though at least two other mouse models of AD (TgCRND8 and
hAPP), develop deficits in PPI (McCool et al., 2003; Esposito et al., 2006). Overall it
appears that there is an increase in acoustic startle response and no deficit in sensorimotor

103
103
103
gating in both male and female 3xTg-AD mice relative to B6129SF2 control mice at all
ages tested.
3.6 ACKNOWLEDGEMENTS
This research was funded by an NSERC grant to REB. The authors would like to
thank Rhian Gunn and Daniel Ikpi for their assistance in this project
104
104
104
3.7 REFERENCES
Akaike H (1974) A new look at the statistical model identification. Autom Control IEEE
Trans 19:716–723.
Blaney CE, Gunn RK, Stover KR, Brown RE (2013) Maternal genotype influences
behavioral development of 3xTg-AD mouse pups. Behav Brain Res 252:40–48.
Braff D, Stone C, Callaway E, Geyer M, Glick I, Bali L (1978) Prestimulus effects on
human startle reflex in normals and schizophrenics. Psychophysiology 15:339–343.
Bullock AE, Slobe BS, Vázquez V, Collins AC (1997) Inbred mouse strains differ in the
regulation of startle and prepulse inhibition of the startle response. Behav Neurosci
111:1353–1360.
Burnham KP, Anderson DR (2002) Model selection and multimodel inference: A
practical information-theoretic approach, 2nd ed. New York: Springer Science &
Business Media.
Champagne FA, Curley JP (2009) Epigenetic mechanisms mediating the long-term
effects of maternal care on development. Neurosci Biobehav Rev 33:593–600.
Crawley JN, Belknap JK, Collins A, Crabbe JC, Frankel W, Henderson N, Hitzemann RJ,
Maxson SC, Miner LL, Silva AJ, Wehner JM, Wynshaw-Boris A, Paylor R (1997)
Behavioral phenotypes of inbred mouse strains: Implications and recommendations
for molecular studies. Psychopharmacology (Berl) 132:107–124.
Cumming G (2014) The new statistics: why and how. Psychol Sci 25:7–29.
Esposito L, Raber J, Kekonius L, Yan F, Yu G-Q, Bien-Ly N, Puoliväli J, Scearce-Levie
K, Masliah E, Mucke L (2006) Reduction in mitochondrial superoxide dismutase
modulates Alzheimer’s disease-like pathology and accelerates the onset of
behavioral changes in human amyloid precursor protein transgenic mice. J Neurosci
26:5167–5179.
García-Mesa Y, López-Ramos JC, Giménez-Llort L, Revilla S, Guerra R, Gruart A,
Laferla FM, Cristòfol R, Delgado-García JM, Sanfeliu C (2011) Physical exercise
protects against Alzheimer’s disease in 3xTg-AD mice. J Alzheimers Dis 24:421–
454.
Geyer MA, McIlwain KL, Paylor R (2002) Mouse genetic models for prepulse inhibition:
an early review. Mol Psychiatry 7:1039–1053.
Hedges L V. (1981) Distribution theory for Glass’s estimator of effect size and related
estimators. J Educ Behav Stat 6:107–128.
Hejl A-M, Glenthøj B, Mackeprang T, Hemmingsen R, Waldemar G (2004) Prepulse
inhibition in patients with Alzheimer’s disease. Neurobiol Aging 25:1045–1050.
105
105
105
Logue SF, Owen EH, Rasmussen DL, Wehner JM (1997) Assessment of locomotor
activity, acoustic and tactile startle, and prepulse inhibition of startle in inbred mouse
strains and F1 hybrids: Implications of genetic background for single gene and
quantitative trait loci analyses. Neuroscience 80:1075–1086.
Martin AL, Brown RE (2010) The lonely mouse: verification of a separation-induced
model of depression in female mice. Behav Brain Res 207:196–207.
McCool MF, Varty GB, Del Vecchio R a, Kazdoba TM, Parker EM, Hunter JC, Hyde LA
(2003) Increased auditory startle response and reduced prepulse inhibition of startle
in transgenic mice expressing a double mutant form of amyloid precursor protein.
Brain Res 994:99–106.
Oddo S, Caccamo A, Shepherd JD, Murphy MP, Golde TE, Kayed R, Metherate R,
Mattson MP, Akbari Y, LaFerla FM (2003) Triple-transgenic model of Alzheimer’s
Disease with plaques and tangles: Intracellular Aβ and synaptic dysfunction. Neuron
39:409–421.
Pietropaolo S, Feldon J, Yee BK (2008) Age-dependent phenotypic characteristics of a
triple transgenic mouse model of Alzheimer disease. Behav Neurosci 122:733–747.
Priebe K, Brake WG, Romeo RD, Sisti HM, Mueller A, McEwen BS, Francis DD, Sisti
HM, Mueller A, McEwen BS, Brake WG (2005) Maternal influences on adult stress
and anxiety-like behavior in C57BL/6J and BALB/CJ mice: A cross-fostering study.
Dev Psychobiol 47:398–407.
Rae EA, Brown RE (2015) The problem of genotype and sex differences in life
expectancy in transgenic mice. Unpublshed Results.
Stover KR, Hicks ME, Gordon KM, Ikpi D, Brown RE (2015a) Age-related changes in
social behaviour in the 3xTg-AD mouse model of Alzheimer’s disease from 2 to 18
months of age. Unpublished.
Stover KR, Hicks ME, Gordon KM, Ikpi D, Brown RE (2015b) Learning and memory in
the 3xTg-AD mouse model of Alzheimer’s disease at 2, 6, 12, and 18 months of age.
Unpublished.
Stover KR, Hicks ME, Gordon KM, Ikpi D, Darvesh S, Brown RE (2015c) Age-related
changes in motor behaviour and anxiety in the 3xTg-AD mouse model of
Alzheimer’s disease: A longitudinal study. Unpublished.
Szyf M, Weaver I, Meaney M (2007) Maternal care, the epigenome and phenotypic
differences in behavior. Reprod Toxicol 24:9–19.
Ueki A, Goto K, Sato N, Iso H, Morita Y (2006) Prepulse inhibition of acoustic startle
response in mild cognitive impairment and mild dementia of Alzheimer type.
Psychiatry Clin Neurosci 60:55–62.

106
106
106
Willott JF, Tanner L, O’Steen J, Johnson KR, Bogue MA, Gagnon L (2003) Acoustic
startle and prepulse inhibition in 40 inbred strains of mice. Behav Neurosci
117:716–727.

107
3.8 SUPPLEMENTAL TABLES
Description of supplemental table 3.1
These supplemental tables provide the statistics used to determine the best model for each measure. The best five models for
each measure are included. The model column describes the factors analyzed, terms separated by a ‘*’ indicate both individual main
effects and interactions between those two terms, terms separated by a ‘+’ are both simple main effects, and terms separated by a ‘:’
indicate an interaction alone. The ‘AICc’ column is the second order Akaike information criterion, which is a measure used to
evaluate the models based on the complexity and how well the model fits the data; lower values are better. The “∆ AICc” column
provides the difference between the given model’s AICc and the model with the lowest AICc. The ‘Wt’ column is the Akaike weight,
a measure of relative likelihood that the fit is the best, ranging from 0 (unlikely) – 1(likely). The ‘ER’ column is the evidence ratio
which provides the likelihood that the model with the lowest AICc is better than the model in question.
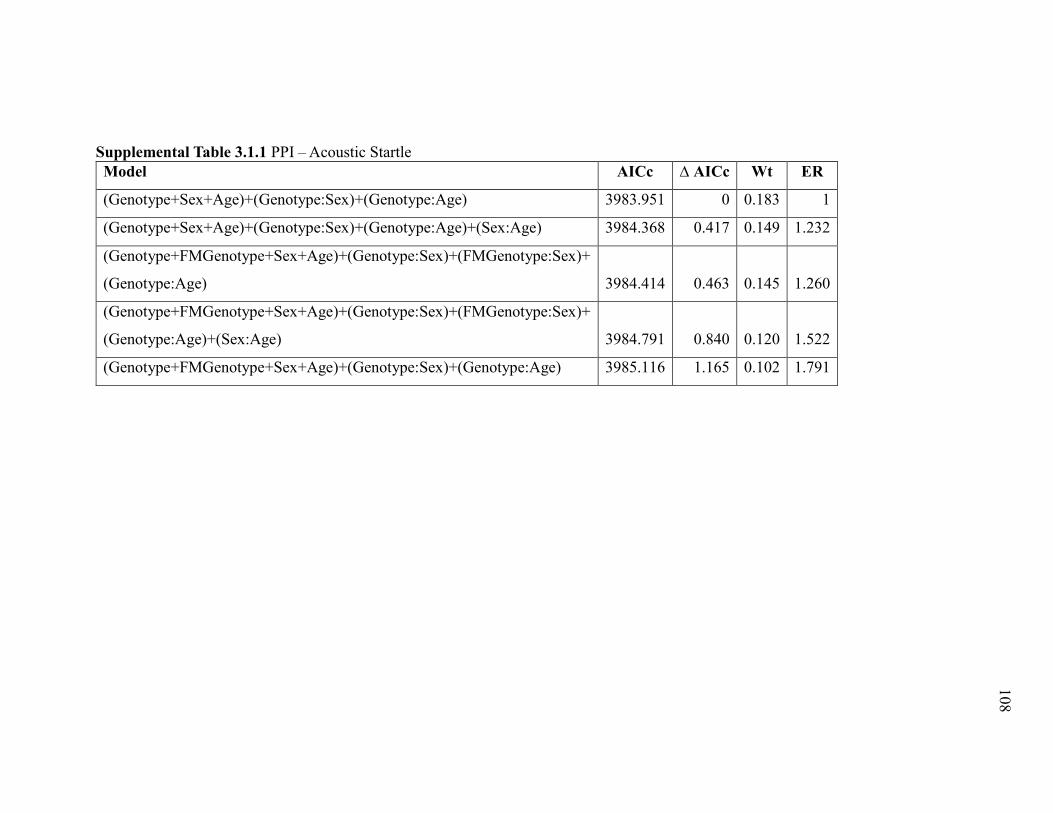
108
Supplemental Table 3.1.1 PPI – Acoustic Startle
Model AICc ∆ AICc Wt ER
(Genotype+Sex+Age)+(Genotype:Sex)+(Genotype:Age) 3983.951 0 0.183 1
(Genotype+Sex+Age)+(Genotype:Sex)+(Genotype:Age)+(Sex:Age) 3984.368 0.417 0.149 1.232
(Genotype+FMGenotype+Sex+Age)+(Genotype:Sex)+(FMGenotype:Sex)+
(Genotype:Age) 3984.414 0.463 0.145 1.260
(Genotype+FMGenotype+Sex+Age)+(Genotype:Sex)+(FMGenotype:Sex)+
(Genotype:Age)+(Sex:Age) 3984.791 0.840 0.120 1.522
(Genotype+FMGenotype+Sex+Age)+(Genotype:Sex)+(Genotype:Age) 3985.116 1.165 0.102 1.791
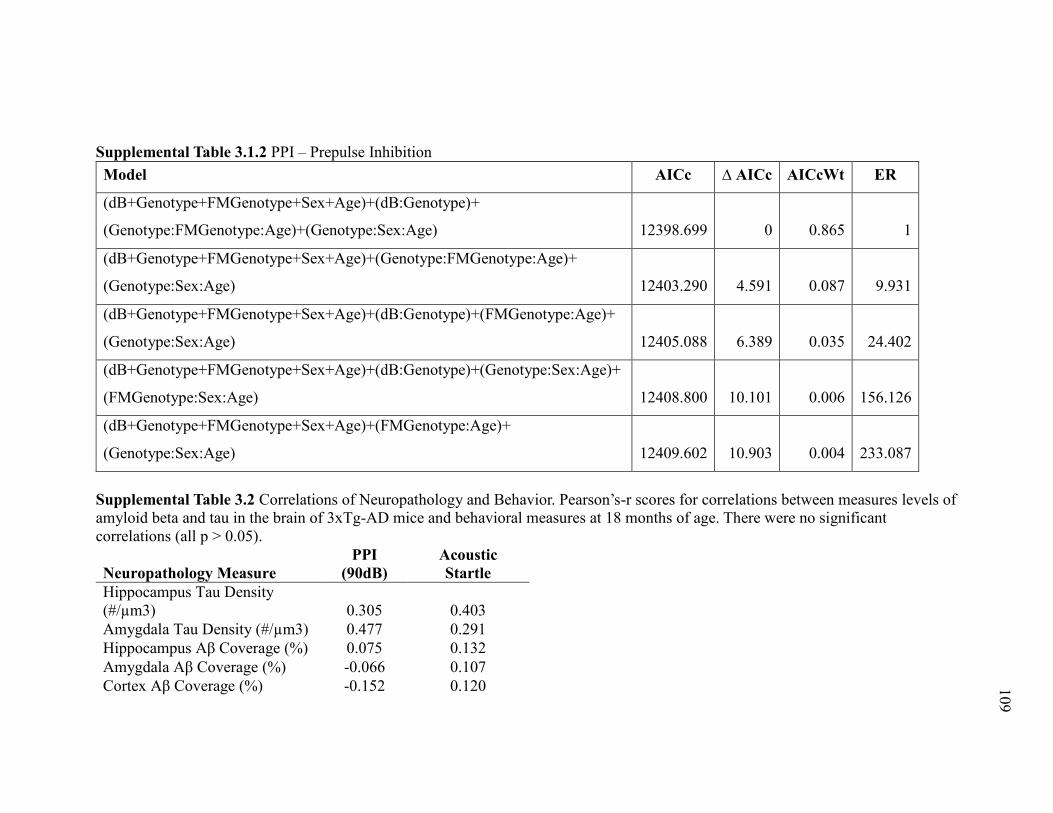
109
Supplemental Table 3.1.2 PPI – Prepulse Inhibition
Model AICc ∆ AICc AICcWt ER
(dB+Genotype+FMGenotype+Sex+Age)+(dB:Genotype)+
(Genotype:FMGenotype:Age)+(Genotype:Sex:Age) 12398.699 0 0.865 1
(dB+Genotype+FMGenotype+Sex+Age)+(Genotype:FMGenotype:Age)+
(Genotype:Sex:Age) 12403.290 4.591 0.087 9.931
(dB+Genotype+FMGenotype+Sex+Age)+(dB:Genotype)+(FMGenotype:Age)+
(Genotype:Sex:Age) 12405.088 6.389 0.035 24.402
(dB+Genotype+FMGenotype+Sex+Age)+(dB:Genotype)+(Genotype:Sex:Age)+
(FMGenotype:Sex:Age) 12408.800 10.101 0.006 156.126
(dB+Genotype+FMGenotype+Sex+Age)+(FMGenotype:Age)+
(Genotype:Sex:Age) 12409.602 10.903 0.004 233.087
Supplemental Table 3.2 Correlations of Neuropathology and Behavior. Pearson’s-r scores for correlations between measures levels of
amyloid beta and tau in the brain of 3xTg-AD mice and behavioral measures at 18 months of age. There were no significant
correlations (all p > 0.05).
Neuropathology Measure
PPI
(90dB)
Acoustic
Startle
Hippocampus Tau Density
(#/µm3) 0.305 0.403
Amygdala Tau Density (#/µm3) 0.477 0.291
Hippocampus Aβ Coverage (%) 0.075 0.132
Amygdala Aβ Coverage (%) -0.066 0.107
Cortex Aβ Coverage (%) -0.152 0.120
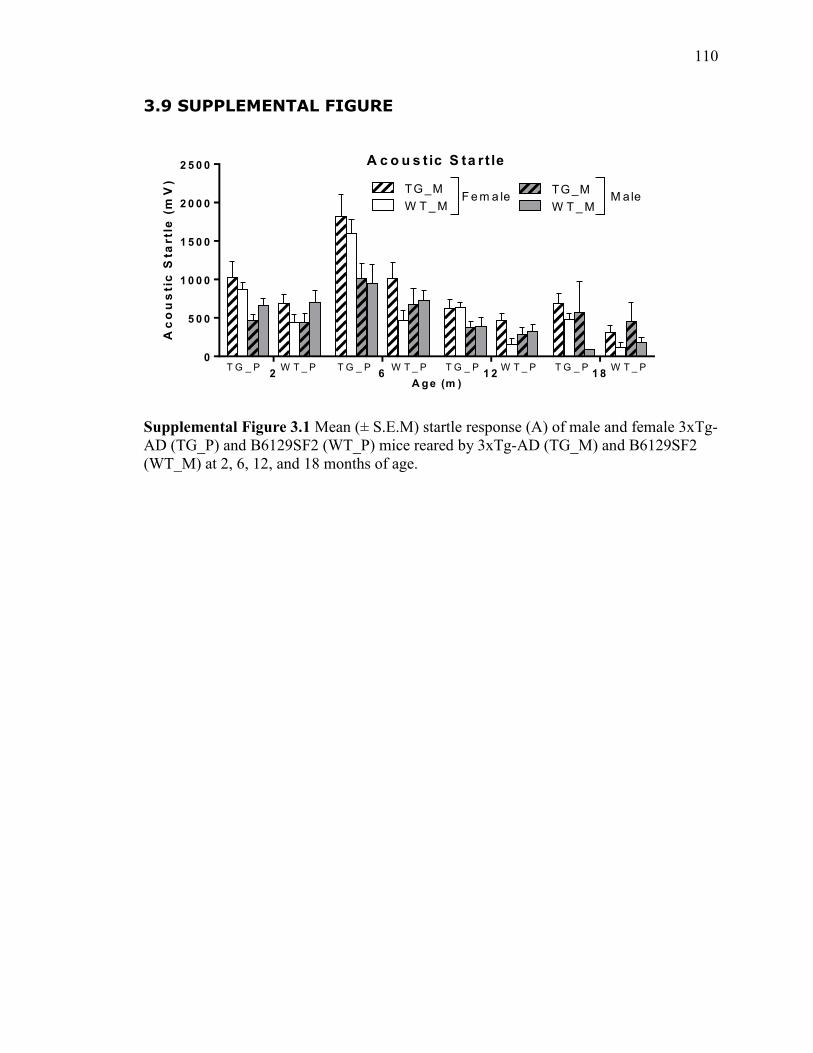
110
3.9 SUPPLEMENTAL FIGURE
W T _ P T G _ P2 6 1 2 1 8
0
5 0 0
1 0 0 0
1 5 0 0
2 0 0 0
2 5 0 0 A c o u s t ic S ta r t le
A ge (m )
Ac
ou
sti
c S
tartl
e (
mV
)
TG _M
W T _ M
TG _M
W T _ MF e m a le M ale
T G _ P W T _ P T G _ P W T _ P T G _ P W T _ P
Supplemental Figure 3.1 Mean (± S.E.M) startle response (A) of male and female 3xTg-
AD (TG_P) and B6129SF2 (WT_P) mice reared by 3xTg-AD (TG_M) and B6129SF2
(WT_M) at 2, 6, 12, and 18 months of age.
111
CHAPTER 4 LEARNING AND MEMORY IN THE 3XTG-AD
MOUSE MODEL OF ALZHEIMER’S DISEASE AT 2, 6, 12, AND 18
MONTHS OF AGE
Kurt R. Stover, Kaitlyn M. Gordon, Michelle E. Hicks, and Richard E. Brown
Department of Psychology and Neuroscience
Dalhousie University
PO Box 1500, Halifax, NS
Canada B3H 4R2

112
4.1 ABSTRACT
To study the effects of maternal genotype on adult behaviour in the 3xTg-AD
mouse model of Alzheimer’s disease we cross fostered litters of 3xTg-AD and B6129SF2
control mice to create mixed genotype litters where no mother reared her own pup. We
then conducted a longitudinal study on the mice at 2, 6, 12, and 18 months of age to
assess spatial learning and memory. We found that the 3xTg-AD mice had a deficit in
spatial learning and an age-dependant deficit in spatial memory in the Morris water maze.
There was no genotype difference in short or long term olfactory-dependant memory.
The mice reared by B6129SF2 mothers appear to have a deficit in both spatial and
olfactory memory, though this finding was not consistent across ages. There were no
consistent differences between the sexes in spatial memory, but male mice tended to have
better olfactory memory than female mice. Overall the 3xTg-AD mice are useful for
modeling the spatial memory deficits of AD as they had spatial memory deficits at 6 and
12 months of age in the MWM, and the effect of maternal genotype was not large enough
to effect this deficit.

113
4.2 INTRODUCTION
The 3xTg-AD mouse is a commonly used model of Alzheimer’s disease (AD)
that has three transgenes which cause it to develop amyloid beta plaques, tau pathology,
and behavioural deficits. The three transgenes are an amyloid precursor protein gene with
the Swedish mutation associated with familial AD (APPswe), a presenilin gene with a
mutation also associated with familial AD (PS1M146V), and a microtubule protein
associated protein tau gene with a mutation (TauP301L) that causes tau pathology to
develop (Oddo et al., 2003). These mutations cause the development of both amyloid beta
plaques and tau tangles in the brain, which in turn are thought to cause a number of
behavioural deficits.
The 3xTg-AD mice develop a deficit in spatial learning and memory on the
Morris water maze (MWM), though there is some variability in the timeline of its
development. The deficit has been reported as early as 2.5 months of age (Marchese et
al., 2014), though there are reports of no deficit at 2 months of age with the defect
developing at 4 months of age (Billings et al., 2005; Clinton et al., 2007), and one study
found no deficit even at six months of age, though they used a protocol with only four
trials, compared to many protocols which use four trials a day for several days
(Giménez-Llort et al., 2010). There are many reports of deficits in the MWM at older
ages (McKee et al., 2008; Movsesyan et al., 2008; Corona et al., 2010; García-Mesa et
al., 2011; Chen et al., 2013). One longitudinal study found a deficit in MWM
performance in the 3xTg-AD from 2.5 to 9 months of age (Marchese et al., 2014).
Another study compared the deficit of the 3xTg-AD mice in the MWM using both cross-
sectional and longitudinal methodology and found that at earlier ages the effect of

114
previous testing enhanced performance on the MWM, this masked the deficits in younger
3xTg-AD mice, but by 12 months of age the deficit was detectable in cross-sectional and
longitudinal testing groups and by 15 months of age there was little effect of pervious
learning in the longitudinal group (Billings et al., 2007).
Compared to spatial memory there are few studies on olfactory learning and
memory in transgenic mice, though mice are largely olfactory animals. At least one study
on olfactory function in the 3xTg-AD mice found a deficit in olfactory discrimination in
the 3xTg-AD mice compared to B6129SF2 mice beginning at 10 months of age
(Coronas-Sámano et al., 2014).
The breeding system of the 3xTg-AD requires that 3xTg-AD only be bred with
3xTg-AD, and B6129SF2 wildtype controls only be bred with B6129SF2 mice. This
system causes mice to only be reared by mothers of the same genotype, and thus any
genotypic differences in maternal behaviour could influence pup development. Several
previous studies have shown that maternal care and early life environment can have a
lasting effect on behaviour (Priebe et al., 2005; Szyf et al., 2007). In order to study the
effect of maternal genotype we cross-fostered litters of both genotypes to make mixed
genotype litters and first conducted a neurodevelopmental test battery from birth to
weaning which has been published (Blaney et al., 2013). We then conducted a
longitudinal study on the mice at 2, 6, 12, and 18 months of age to determine the long
term effects of maternal genotype on adult behaviours. In addition to the experiments
described in this study the mice also underwent a behavioural test battery at each age to
assess prepulse inhibition, anxiety-like, motor, and social behaviours (Stover et al.,
2015b, 2015d, 2015e) .
115
4.3 METHODS
4.3.1 BREEDING, CROSS-FOSTERING & PRE-WEANING TREATMENT OF
MICE
We used 3xTg-AD mice (B6;129-Psen1tm1Mpm
Tg(APPSwe,tauP301L)1Lfa/Mmjax) and B6129S/F2 mice, bred from animals purchased
from Jackson Laboratories (Strain #004807 and #004807, respectively, Bar Harbor,
Maine). All procedures used in this experiment were approved by the Dalhousie
University Committee on Animal Care.
In order to examine maternal effects on development we cross fostered all litters
at post natal day 0 (the day of birth) or 1, so that half the mice of each genotype had a
3xTg-AD foster mother and half had a B6129SF2 foster mother, and no mother reared
her own pups. These mice were tested in a neurodevelopmental test battery as described
by Blaney et al. (2013).
The mice were housed in same sex groups of two to four foster-littermates in clear
plastic cages measuring (18.75 x 28 x 12.5 cm), with wire tops, wood chip bedding, and a
PVC tube (4 cm diameter x 7 cm length) for enrichment. The colony room was kept at
22±2 °C on a reversed 12:12 light:dark cycle, with lights off at 10:00am.
The mice were fed Purina 5001 rodent chow (Purina, St. Louis, Missouri) and tap
water ad libitum, except for when food restricted as desired in the procedure. This
experiment was approved by the Dalhousie University Committee on Laboratory
Animals.
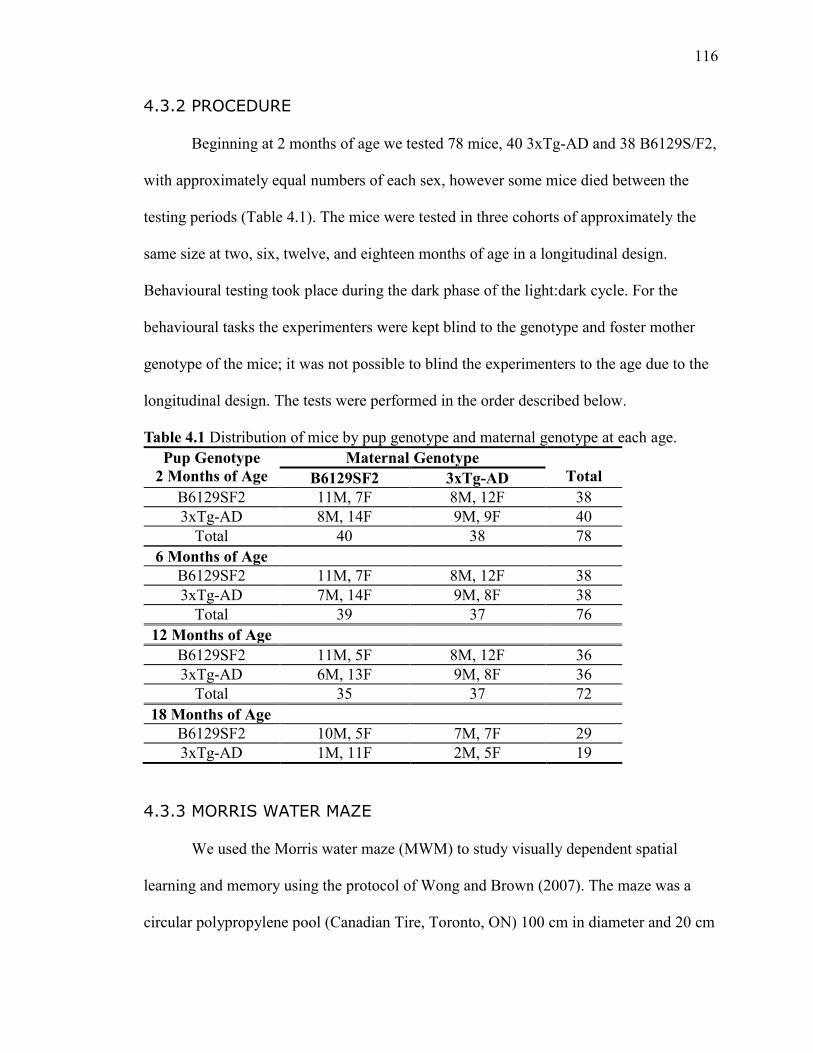
116
4.3.2 PROCEDURE
Beginning at 2 months of age we tested 78 mice, 40 3xTg-AD and 38 B6129S/F2,
with approximately equal numbers of each sex, however some mice died between the
testing periods (Table 4.1). The mice were tested in three cohorts of approximately the
same size at two, six, twelve, and eighteen months of age in a longitudinal design.
Behavioural testing took place during the dark phase of the light:dark cycle. For the
behavioural tasks the experimenters were kept blind to the genotype and foster mother
genotype of the mice; it was not possible to blind the experimenters to the age due to the
longitudinal design. The tests were performed in the order described below.
Table 4.1 Distribution of mice by pup genotype and maternal genotype at each age.
Pup Genotype
2 Months of Age
Maternal Genotype
Total B6129SF2 3xTg-AD
B6129SF2 11M, 7F 8M, 12F 38
3xTg-AD 8M, 14F 9M, 9F 40
Total 40 38 78
6 Months of Age
B6129SF2 11M, 7F 8M, 12F 38
3xTg-AD 7M, 14F 9M, 8F 38
Total 39 37 76
12 Months of Age
B6129SF2 11M, 5F 8M, 12F 36
3xTg-AD 6M, 13F 9M, 8F 36
Total 35 37 72
18 Months of Age
B6129SF2 10M, 5F 7M, 7F 29
3xTg-AD 1M, 11F 2M, 5F 19
4.3.3 MORRIS WATER MAZE
We used the Morris water maze (MWM) to study visually dependent spatial
learning and memory using the protocol of Wong and Brown (2007). The maze was a
circular polypropylene pool (Canadian Tire, Toronto, ON) 100 cm in diameter and 20 cm

117
deep. The maze was filled with 14 cm of water made opaque to obscure the platform
location using non-toxic white paint (Schola, Marieville, PQ). The pool had an escape
platform (13.5 cm high, 9 cm diameter) which mice were trained to locate. Shapes and
posters were placed on the walls to serve as extra-maze visual cues; these cues were not
changed for the duration of testing. The mice were tested in squads of four to six. To
begin a trial the mice were released from one of four possible release points, which were
equally spaced around the perimeter of the pool (N, S, E, and W). All the mice in a group
were released from the same point for each trial and the release point varied semi-
randomly over trials, ensuring that mice were never released from the same point twice in
a row. The maze was divided into four quadrants based on the four release points. For the
acquisition trials the platform was placed in the middle of one of the quadrants and were
given four trials a day for three days to find the platform. For the reversal phase, the
platform was moved to the opposite side of the pool and mice were given another three
days of training with four trials a day. If a mouse did not locate the platform within 60
seconds it was led to the platform using a plastic bucket and left on the platform for 30
seconds to learn its location. The latency to find the platform, swim speed, distance
travelled, and amount of time spent within 10 cm of the side of the pool (thigmotaxis)
were determined using an automated tracking system (WaterMaze, Actimetrics,
Willamette, IL) with a camera placed 2.1 m above the pool. After acquisition and reversal
trials were completed, a single probe trial was given on day seven. During the probe trials
the platform was removed and the mice were placed in the pool for 60 seconds. The
tracking system recorded the total amount of time spent in each quadrant, and the number
of crossings of an imaginary annulus drawn around the locations of the platform during

118
acquisition and reversal. The following day the mice were given a visual cued platform
trial with an attachment on the platform to raise it above the water level and a flag to
indicate its location, as a simple test of visual ability. For this test the mouse was given
four trials using the procedure used in acquisition and reversal.
4.3.4 CONDITIONED ODOUR PREFERENCE TASK
To assess olfactory learning and memory we used the conditioned odour
preference task, using the protocol of Schellinck et al. (2001). In this task the mice were
trained to associate an odour (CS+) with a buried sugar reward and trained to associate
another odour (CS-) with no reward. The CS+ odour varied semi-randomly between
cages; all mice in a cage were assigned the same CS+. The mice were food deprived to
between 85% and 90% of their starting body weight over three days before training. The
training boxes were clear plastic cages identical to their home cages with the bottoms
covered with pine chip bedding. In each cage an odour pot consisting of 0.5ml of the
odorant absorbed on piece of filter paper (55 mm diameter) in a plastic cup (1.5cm
height, 6.25-cm diameter) covered by the cover of a plastic Petri dish with 10-12 holes.
For the CS+ odours pieces of sugar were placed on top of the petri dish cover, but no
sugar was included with the CS- odours, and the odour cups were buried in 2cm of the
wood chip bedding. Four rooms were used for training, one for each odour, a third where
mice were kept between trials, and a fourth where preference testing took place. For
training, mice were given four ten-minute trials per day (2 trials per odour), alternating
between CS+ and CS- odours with a ten minute inter-trial interval each day for four days
(total 16 trials, 8 per odour). On day five the mice were given a memory test. The test
apparatus was an open box (69 x 20 x 20 cm) made of clear plastic with three chambers

119
(each 23 x 20 x 20 cm) connected by openings in the walls (6 x 5.5 cm). First the mice
were given a habituation trial lasting two minutes with cups containing no odour in each
end chamber. The total amount of time spent in each end chamber was recorded. If the
mice spent more than 75% time in one end chamber the CS+ was placed in the non-
preferred end. Then 24 hours after the last habituation trial, the mice were given a test
trial where an odour cup containing the CS+ (with no sugar) was placed in one end
chamber and an odour cup containing the CS- (with no sugar) was placed in the other
end chamber. The total amount of time spent digging (defined as displacing the wood
chip bedding with the snout or paws) in each odour cup was recorded. At each age the
mice trained using a new set of odours and were re-tested for the odour learned at
previous ages. Therefore mice learned a new odour pair at two, six, twelve and eighteen
months of age and were tested at six, twelve, and eighteen months of age on the odours
learned at previous ages.
4.3.5 CORRELATIONS OF NEUROPATHOLOGY AND BEHAVIOUR
All measures that had genotype difference were correlated with levels of tau and
amyloid beta neuropathology in the brains of the mice at 19 months of age. If there was
more than one measure of the same underlying difference (e.g. latency and distance in the
MWM) then only the one with the largest effect size was included in the analysis to
prevent multiple comparisons of the same measure. The methodology used to determine
the levels of neuropathology is described in Stover et al. (2015e)
4.3.6 STATISTICAL ANALYSES
The statistical analyses described in the following section were performed using R
(www.R-project.org). We used linear regression to assess the long-term memory tasks in
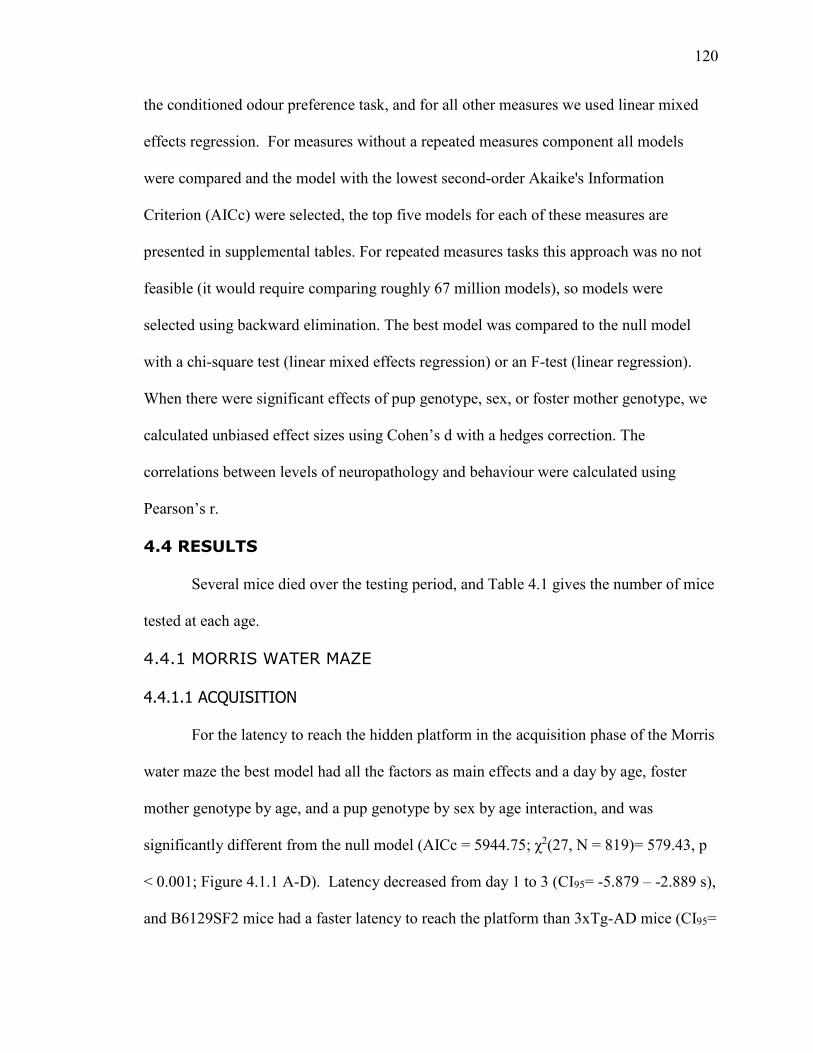
120
the conditioned odour preference task, and for all other measures we used linear mixed
effects regression. For measures without a repeated measures component all models
were compared and the model with the lowest second-order Akaike's Information
Criterion (AICc) were selected, the top five models for each of these measures are
presented in supplemental tables. For repeated measures tasks this approach was no not
feasible (it would require comparing roughly 67 million models), so models were
selected using backward elimination. The best model was compared to the null model
with a chi-square test (linear mixed effects regression) or an F-test (linear regression).
When there were significant effects of pup genotype, sex, or foster mother genotype, we
calculated unbiased effect sizes using Cohen’s d with a hedges correction. The
correlations between levels of neuropathology and behaviour were calculated using
Pearson’s r.
4.4 RESULTS
Several mice died over the testing period, and Table 4.1 gives the number of mice
tested at each age.
4.4.1 MORRIS WATER MAZE
4.4.1.1 ACQUISITION
For the latency to reach the hidden platform in the acquisition phase of the Morris
water maze the best model had all the factors as main effects and a day by age, foster
mother genotype by age, and a pup genotype by sex by age interaction, and was
significantly different from the null model (AICc = 5944.75; χ2(27, N = 819)= 579.43, p
< 0.001; Figure 4.1.1 A-D). Latency decreased from day 1 to 3 (CI95= -5.879 – -2.889 s),
and B6129SF2 mice had a faster latency to reach the platform than 3xTg-AD mice (CI95=
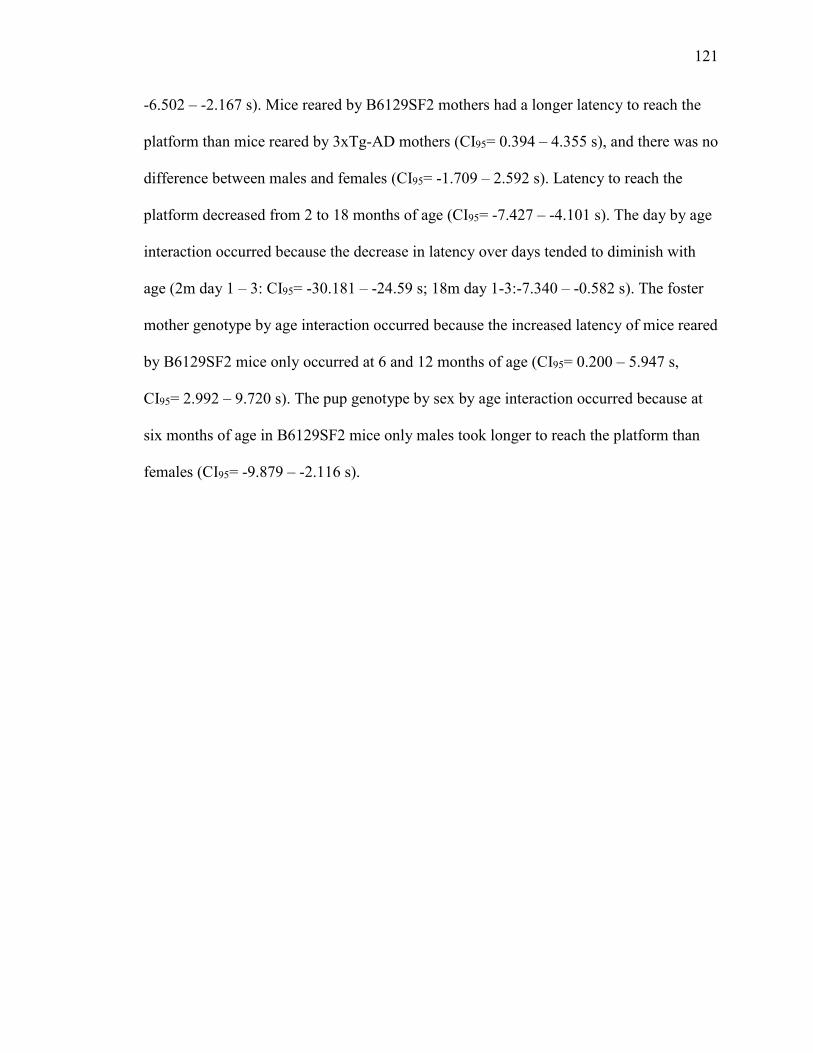
121
-6.502 – -2.167 s). Mice reared by B6129SF2 mothers had a longer latency to reach the
platform than mice reared by 3xTg-AD mothers (CI95= 0.394 – 4.355 s), and there was no
difference between males and females (CI95= -1.709 – 2.592 s). Latency to reach the
platform decreased from 2 to 18 months of age (CI95= -7.427 – -4.101 s). The day by age
interaction occurred because the decrease in latency over days tended to diminish with
age (2m day 1 – 3: CI95= -30.181 – -24.59 s; 18m day 1-3:-7.340 – -0.582 s). The foster
mother genotype by age interaction occurred because the increased latency of mice reared
by B6129SF2 mice only occurred at 6 and 12 months of age (CI95= 0.200 – 5.947 s,
CI95= 2.992 – 9.720 s). The pup genotype by sex by age interaction occurred because at
six months of age in B6129SF2 mice only males took longer to reach the platform than
females (CI95= -9.879 – -2.116 s).
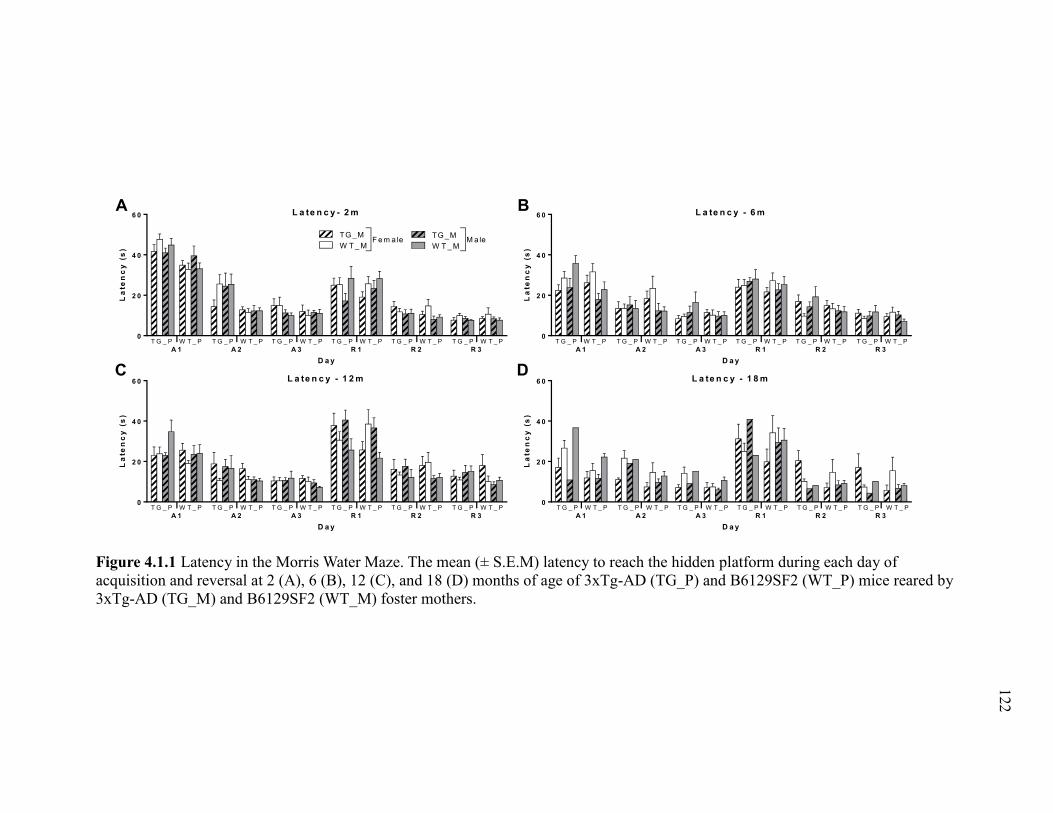
122
A 1 A 2 A 3 R 1 R 2 R 3
0
2 0
4 0
6 0 L a te n c y - 2 m
D a y
La
ten
cy
(s
)
TG _M
W T _ M
TG _M
W T _ MF e m a le M ale
T G _ P W T _ P T G _ P W T _ P T G _ P W T _ P T G _ P W T _ P T G _ P W T _ P T G _ P W T _ P
A 1 A 2 A 3 R 1 R 2 R 3
0
2 0
4 0
6 0 L a te n c y - 6 m
D a y
La
ten
cy
(s
)
T G _ P W T _ P T G _ P W T _ P T G _ P W T _ P T G _ P W T _ P T G _ P W T _ P T G _ P W T _ P
A 1 A 2 A 3 R 1 R 2 R 3
0
2 0
4 0
6 0 L a te n c y - 1 2 m
D a y
La
ten
cy
(s
)
T G _ P W T _ P T G _ P W T _ P T G _ P W T _ P T G _ P W T _ P T G _ P W T _ P T G _ P W T _ P
A 1 A 2 A 3 R 1 R 2 R 3
0
2 0
4 0
6 0 L a te n c y - 1 8 m
D a yL
ate
nc
y (
s)
T G _ P W T _ P T G _ P W T _ P T G _ P W T _ P T G _ P W T _ P T G _ P W T _ P T G _ P W T _ P
A B
C D
Figure 4.1.1 Latency in the Morris Water Maze. The mean (± S.E.M) latency to reach the hidden platform during each day of
acquisition and reversal at 2 (A), 6 (B), 12 (C), and 18 (D) months of age of 3xTg-AD (TG_P) and B6129SF2 (WT_P) mice reared by
3xTg-AD (TG_M) and B6129SF2 (WT_M) foster mothers.
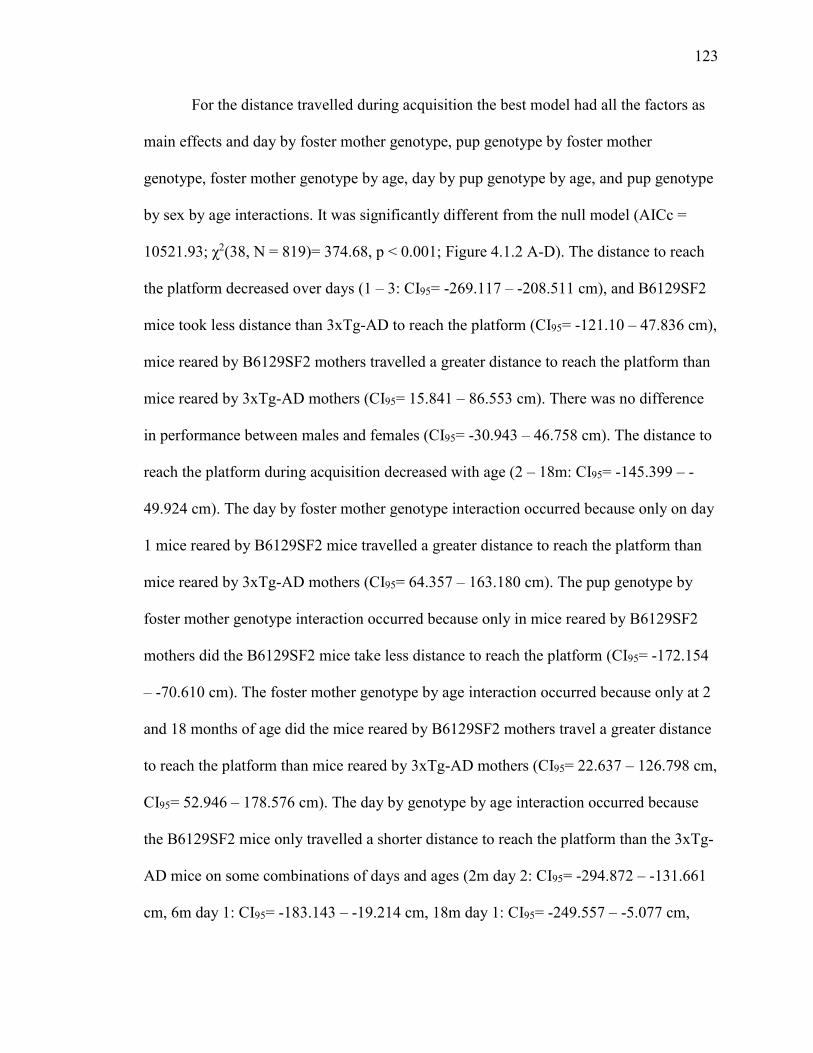
123
For the distance travelled during acquisition the best model had all the factors as
main effects and day by foster mother genotype, pup genotype by foster mother
genotype, foster mother genotype by age, day by pup genotype by age, and pup genotype
by sex by age interactions. It was significantly different from the null model (AICc =
10521.93; χ2(38, N = 819)= 374.68, p < 0.001; Figure 4.1.2 A-D). The distance to reach
the platform decreased over days (1 – 3: CI95= -269.117 – -208.511 cm), and B6129SF2
mice took less distance than 3xTg-AD to reach the platform (CI95= -121.10 – 47.836 cm),
mice reared by B6129SF2 mothers travelled a greater distance to reach the platform than
mice reared by 3xTg-AD mothers (CI95= 15.841 – 86.553 cm). There was no difference
in performance between males and females (CI95= -30.943 – 46.758 cm). The distance to
reach the platform during acquisition decreased with age (2 – 18m: CI95= -145.399 – -
49.924 cm). The day by foster mother genotype interaction occurred because only on day
1 mice reared by B6129SF2 mice travelled a greater distance to reach the platform than
mice reared by 3xTg-AD mothers (CI95= 64.357 – 163.180 cm). The pup genotype by
foster mother genotype interaction occurred because only in mice reared by B6129SF2
mothers did the B6129SF2 mice take less distance to reach the platform (CI95= -172.154
– -70.610 cm). The foster mother genotype by age interaction occurred because only at 2
and 18 months of age did the mice reared by B6129SF2 mothers travel a greater distance
to reach the platform than mice reared by 3xTg-AD mothers (CI95= 22.637 – 126.798 cm,
CI95= 52.946 – 178.576 cm). The day by genotype by age interaction occurred because
the B6129SF2 mice only travelled a shorter distance to reach the platform than the 3xTg-
AD mice on some combinations of days and ages (2m day 2: CI95= -294.872 – -131.661
cm, 6m day 1: CI95= -183.143 – -19.214 cm, 18m day 1: CI95= -249.557 – -5.077 cm,

124
18m day 2: CI95= -285.763 – -49.134 cm). The pup genotype by sex by age interaction
occurred because in female mice only at every age except 6 months the B6129SF2 mice
had a lower latency to reach the platform than the 3xTg-AD mice (2m: CI95= -210.281 – -
66.625 cm, 6m: CI95= -60.937 – 84.461 cm, 12m: CI95= -159.188 – -0.767 cm. 18m:
CI95= -193.680 – -31.976 cm).
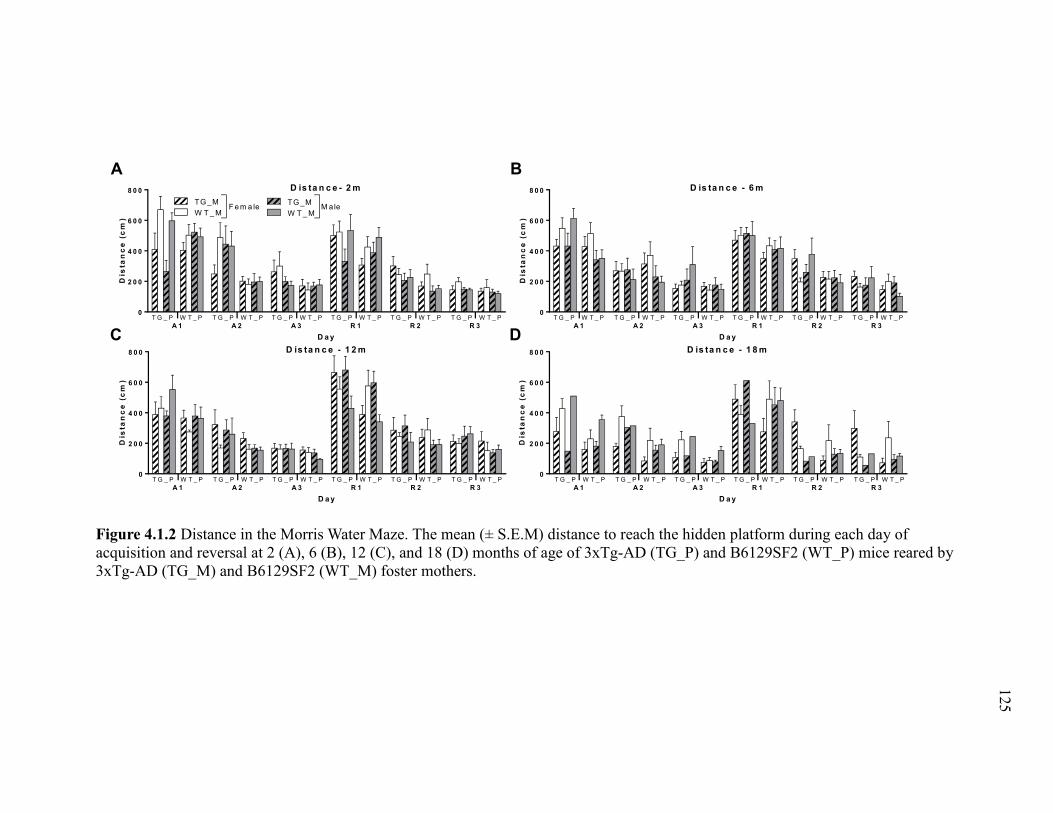
125
A B
C DA 1 A 2 A 3 R 1 R 2 R 3
0
2 0 0
4 0 0
6 0 0
8 0 0 D is ta n c e - 2 m
D a y
Dis
tan
ce
(c
m)
TG _M
W T _ M
TG _M
W T _ MF e m a le M ale
T G _ P W T _ P T G _ P W T _ P T G _ P W T _ P T G _ P W T _ P T G _ P W T _ P T G _ P W T _ P
A 1 A 2 A 3 R 1 R 2 R 3
0
2 0 0
4 0 0
6 0 0
8 0 0 D is ta n c e - 6 m
D a y
Dis
tan
ce
(c
m)
T G _ P W T _ P T G _ P W T _ P T G _ P W T _ P T G _ P W T _ P T G _ P W T _ P T G _ P W T _ P
A 1 A 2 A 3 R 1 R 2 R 3
0
2 0 0
4 0 0
6 0 0
8 0 0 D is ta n c e - 1 2 m
D a y
Dis
tan
ce
(c
m)
T G _ P W T _ P T G _ P W T _ P T G _ P W T _ P T G _ P W T _ P T G _ P W T _ P T G _ P W T _ P
A 1 A 2 A 3 R 1 R 2 R 3
0
2 0 0
4 0 0
6 0 0
8 0 0 D is ta n c e - 1 8 m
D a y
Dis
tan
ce
(c
m)
T G _ P W T _ P T G _ P W T _ P T G _ P W T _ P T G _ P W T _ P T G _ P W T _ P T G _ P W T _ P
Figure 4.1.2 Distance in the Morris Water Maze. The mean (± S.E.M) distance to reach the hidden platform during each day of
acquisition and reversal at 2 (A), 6 (B), 12 (C), and 18 (D) months of age of 3xTg-AD (TG_P) and B6129SF2 (WT_P) mice reared by
3xTg-AD (TG_M) and B6129SF2 (WT_M) foster mothers.

126
For the swim speed during acquisition the best model had all the factors as main
effects and pup genotype by sex, foster mother genotype by age, day by pup genotype by
foster mother genotype, and day by pup genotype by age interactions. This model was
significantly different from the null model (AICc = 3959.164; χ2(34 N = 819)= 330.66, p
< 0.001; Figure 4.1.3 A-D). The swim speed increased from day 1 to 2 (CI95= 0.576 –
1.517 cm/s), then decreased from day 2 to 3 (CI95= -1.045 – -0.113 cm/s). The 3xTg-AD
mice swam faster than the B6129SF2 mice (CI95= 0.651 – 2.144 cm/s). There were no
main effects of foster mother genotype (CI95= -0.924 – 0.551 cm/s), or sex (CI95= -0.475
– 1.019 cm/s). The swim speed increased from 2 to 6 months of age (CI95= 1.552 – 2.528
cm/s), then decreased from 6 to 12 (CI95= -2.432 – -1.423 cm/s), and 12 to 18 months of
age (CI95= -1.914 – -0.711 cm/s). The pup genotype by sex interaction occurred because
only in female mice the 3xTg-AD swam faster than the B6129SF2 mice (CI95= 1.818 –
3.816 cm/s). The foster mother genotype by age interaction occurred because at 2 and 18
months of age mice reared by B6129SF2 mothers swam faster than mice reared by 3xTg-
AD mothers (CI95= 0.144 – 1.967, CI95= 0.113 – 2.363 cm/s), but at 6 months of age
mice reared by 3xTg-AD mothers swam faster than mice reared by B6129SF2 mothers
(CI95= 0.643 – 2.480 cm/s). The day by pup genotype by foster mother genotype
interaction occurred because 3xTg-AD mice swam faster than B6129SF2 mice except in
mice reared by 3xTg-AD mothers on day 1, when there was no difference between
genotypes (CI95= -0.669 –1.893 cm/s). The day by age by pup genotype interaction
occurred because the genotype difference was present at every day and age except day 1
at 2 months of age (CI95= 0.869 – 3.555 cm/s).
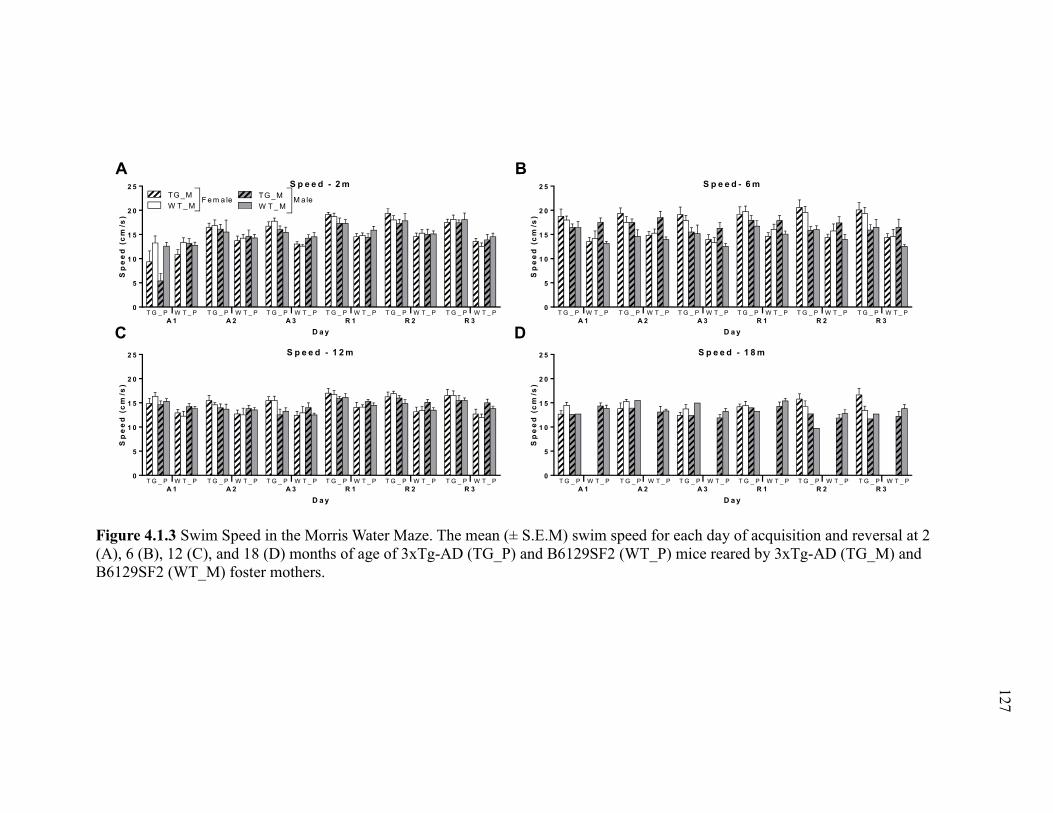
127
A B
C DA 1 A 2 A 3 R 1 R 2 R 3
0
5
1 0
1 5
2 0
2 5 S p e e d - 2 m
D a y
Sp
ee
d (
cm
/s)
TG _M
W T _ M
TG _M
W T _ MF e m a le M ale
T G _ P W T _ P T G _ P W T _ P T G _ P W T _ P T G _ P W T _ P T G _ P W T _ P T G _ P W T _ P
A 1 A 2 A 3 R 1 R 2 R 3
0
5
1 0
1 5
2 0
2 5 S p e e d - 6 m
D a y
Sp
ee
d (
cm
/s)
T G _ P W T _ P T G _ P W T _ P T G _ P W T _ P T G _ P W T _ P T G _ P W T _ P T G _ P W T _ P
A 1 A 2 A 3 R 1 R 2 R 3
0
5
1 0
1 5
2 0
2 5 S p e e d - 1 2 m
D a y
Sp
ee
d (
cm
/s)
T G _ P W T _ P T G _ P W T _ P T G _ P W T _ P T G _ P W T _ P T G _ P W T _ P T G _ P W T _ P
A 1 A 2 A 3 R 1 R 2 R 3
0
5
1 0
1 5
2 0
2 5 S p e e d - 1 8 m
D a y
Sp
ee
d (
cm
/s)
T G _ P W T _ P T G _ P W T _ P T G _ P W T _ P T G _ P W T _ P T G _ P W T _ P T G _ P W T _ P
Figure 4.1.3 Swim Speed in the Morris Water Maze. The mean (± S.E.M) swim speed for each day of acquisition and reversal at 2
(A), 6 (B), 12 (C), and 18 (D) months of age of 3xTg-AD (TG_P) and B6129SF2 (WT_P) mice reared by 3xTg-AD (TG_M) and
B6129SF2 (WT_M) foster mothers.
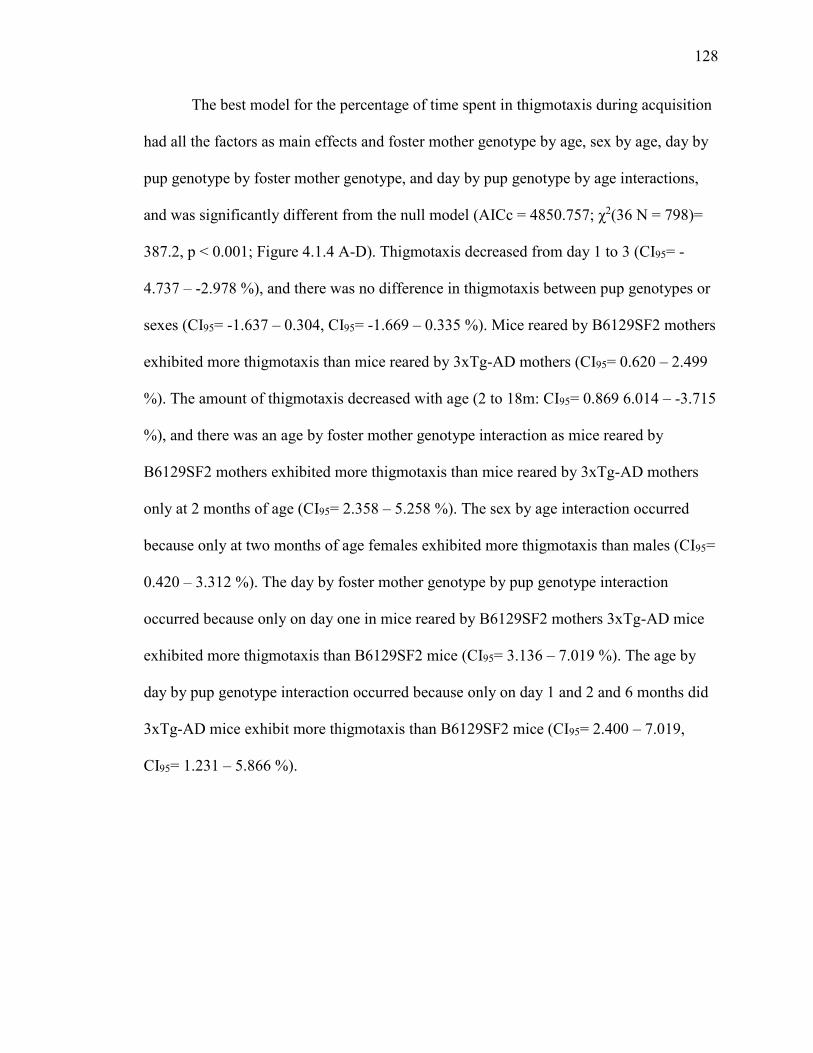
128
The best model for the percentage of time spent in thigmotaxis during acquisition
had all the factors as main effects and foster mother genotype by age, sex by age, day by
pup genotype by foster mother genotype, and day by pup genotype by age interactions,
and was significantly different from the null model (AICc = 4850.757; χ2(36 N = 798)=
387.2, p < 0.001; Figure 4.1.4 A-D). Thigmotaxis decreased from day 1 to 3 (CI95= -
4.737 – -2.978 %), and there was no difference in thigmotaxis between pup genotypes or
sexes (CI95= -1.637 – 0.304, CI95= -1.669 – 0.335 %). Mice reared by B6129SF2 mothers
exhibited more thigmotaxis than mice reared by 3xTg-AD mothers (CI95= 0.620 – 2.499
%). The amount of thigmotaxis decreased with age (2 to 18m: CI95= 0.869 6.014 – -3.715
%), and there was an age by foster mother genotype interaction as mice reared by
B6129SF2 mothers exhibited more thigmotaxis than mice reared by 3xTg-AD mothers
only at 2 months of age (CI95= 2.358 – 5.258 %). The sex by age interaction occurred
because only at two months of age females exhibited more thigmotaxis than males (CI95=
0.420 – 3.312 %). The day by foster mother genotype by pup genotype interaction
occurred because only on day one in mice reared by B6129SF2 mothers 3xTg-AD mice
exhibited more thigmotaxis than B6129SF2 mice (CI95= 3.136 – 7.019 %). The age by
day by pup genotype interaction occurred because only on day 1 and 2 and 6 months did
3xTg-AD mice exhibit more thigmotaxis than B6129SF2 mice (CI95= 2.400 – 7.019,
CI95= 1.231 – 5.866 %).

129
A B
C DA 1 A 2 A 3 R 1 R 2 R 3
0
1 0
2 0
3 0 T h ig m o ta x is - 2 m
D a y
Th
igm
ota
xis
(%
)
TG _M
W T _ M
TG _M
W T _ MF e m a le M ale
T G _ P W T _ P T G _ P W T _ P T G _ P W T _ P T G _ P W T _ P T G _ P W T _ P T G _ P W T _ P
A 1 A 2 A 3 R 1 R 2 R 3
0
1 0
2 0
3 0 T h ig m o ta x is - 6 m
D a y
Th
igm
ota
xis
(%
)
T G _ P W T _ P T G _ P W T _ P T G _ P W T _ P T G _ P W T _ P T G _ P W T _ P T G _ P W T _ P
A 1 A 2 A 3 R 1 R 2 R 3
0
1 0
2 0
3 0 T h ig m o ta x is - 1 2 m
D a y
Th
igm
ota
xis
(%
)
T G _ P W T _ P T G _ P W T _ P T G _ P W T _ P T G _ P W T _ P T G _ P W T _ P T G _ P W T _ P
A C Q 1 A C Q 2 A C Q 3 R E V 1 R E V 2 R E V 3
0
1 0
2 0
3 0 T h ig m o ta x is - 1 8 m
D a y
Th
igm
ota
xis
(%
)
T G _ P W T _ P T G _ P W T _ P T G _ P W T _ P T G _ P W T _ P T G _ P W T _ P T G _ P W T _ P
Figure 4.1.4 Thigmotaxis in the Morris Water Maze. The mean (± S.E.M) percentage of thigmotaxis for each day of acquisition and
reversal at 2 (A), 6 (B), 12 (C), and 18 (D) months of age of 3xTg-AD (TG_P) and B6129SF2 (WT_P) mice reared by 3xTg-AD
(TG_M) and B6129SF2 (WT_M) foster mothers.
130
4.4.1.2 REVERSAL
For the latency to find the hidden platform during the reversal phase the model
had day, pup genotype, foster mother genotype, age, and a genotype by foster mother
genotype by age interaction, and was significantly different from the null model (AICc =
6031.077; χ2(17 N = 819)= 428.92,p < 0.001; Figure 4.1.1 A-D). The latency to the
platform decreased during reversal (day 1 to 3: CI95= -18.176 – -15.024 s) and there was
no difference between pup genotypes (CI95= -4.047 – 0.181 s), or foster mother
genotypes (CI95= -2.839 – 1.482 s). Latency generally increased with age (2 to 18m:
CI95= 0.341 – 4.490 s), and the age by foster mother genotype by pup genotype
interaction occurred because only at 18 months of age in mice reared by 3xTg-AD
mothers the 3xTg-AD mice exhibited more thigmotaxis than the B6129SF2 mice (CI95=
4.549 – 16.084 s).
For the distance travelled during the reversal phase the best model had all the
factors as main effects and age by pup genotype by foster mother genotype, and pup
genotype by foster mother genotype by age interactions. The model was significantly
different from the null model (AICc = 10533.74; χ2(21 N = 819)= 450.16, p < 0.001;
Figure 4.1.2 A-D).The distance to reach the platform decreased across days (day 1 to 3:
CI95= -317.22 – -263.819 cm), and the B6129SF2 mice travelled a shorter distance to the
platform than the 3xTg-AD mice (CI95= -104.057 – -32.309 cm). There was no difference
in distance between foster mother genotypes or sexes (CI95= -42.269 – 29.772, CI95= -
42.722 – 27.402 cm). The distance travelled increased from 2 to 12 months of age (CI95=
24.992 – 87.110cm), then decreased from 12 to 18 months of age (CI95= -98.887 – -
27.052 cm). The age by foster mother genotype by pup genotype interaction occurred

131
because at every age after 2 months in mice reared by 3xTg-AD mothers the B6129SF2
mice travelled a shorter distance to the platform (6m: CI95= -147.456 – -5.536, 12m:
CI95= -180.980 – -35.035, 18m: CI95= -273.971 – -83.886 cm). The sex by foster mother
genotype by pup genotype interaction occurred because in female mice there was a
genotype effect in mice reared by 3xTg-AD mothers (CI95=-323.618 – -119.423 cm), and
some evidence for one in B6129SF2 mice (CI95= -8.283 – 172.268cm), but in male mice
the pup genotype effect was only present in mice reared by 3xTg-AD mothers (CI95= -
250.783 – -26.572 cm).
For the swim speed during reversal the best model again contained all the factors
as main effects, and had pup genotype by age, pup genotype by sex, and foster mother
genotype by sex by age interactions. The best model was significantly different from the
null model (AICc = 3877.682; χ2(22 N = 801)= 239.7, p < 0.001; Figure 4.1.3 A-D). The
swim speed decreased across days (1 to 3: CI95= -1.292 – -0.447 cm/s) and the 3xTg-AD
swam significantly faster than the B6129SF2 mice (CI95= 1.475 – 3.067 cm/s). There was
no difference between foster mother genotypes (CI95= -0.869 – 0.632 cm/s) or sexes
(CI95= -0.201 – 1.338 cm/s), and swim speed decreased with age (2 to 18m: CI95= -3.450
– 2.297 cm/s). The pup genotype by age interaction occurred because the pup genotype
effect was present at all ages except 18 months (CI95= -1.562 – 0.884 cm/s). The pup
genotype by sex interaction occurred because the faster swim speed of the 3xTg-AD was
only present in female mice (CI95= -4.538 – -2.480 cm/s). The age by sex by foster
mother genotype interaction occurred because only at six months in males the mice
reared by 3xTg-AD mothers swam faster than mice reared by B6129SF2 mothers (CI95= -
3.190 – -0.438 cm/s).
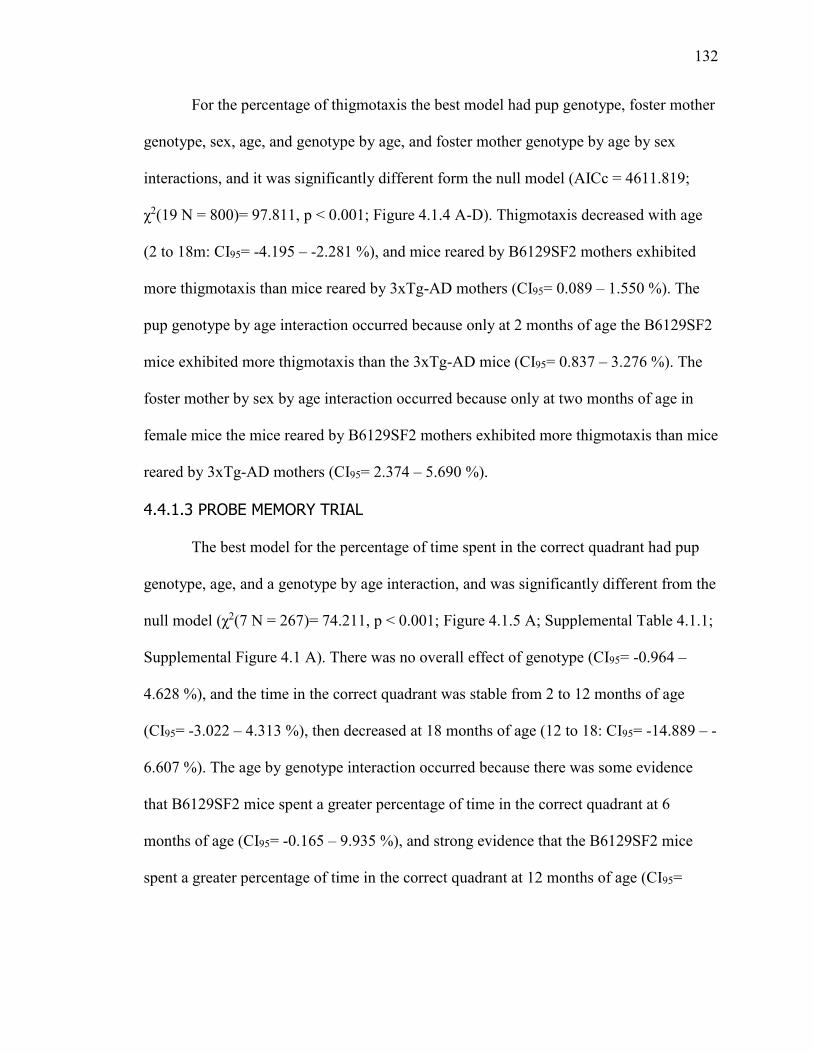
132
For the percentage of thigmotaxis the best model had pup genotype, foster mother
genotype, sex, age, and genotype by age, and foster mother genotype by age by sex
interactions, and it was significantly different form the null model (AICc = 4611.819;
χ2(19 N = 800)= 97.811, p < 0.001; Figure 4.1.4 A-D). Thigmotaxis decreased with age
(2 to 18m: CI95= -4.195 – -2.281 %), and mice reared by B6129SF2 mothers exhibited
more thigmotaxis than mice reared by 3xTg-AD mothers (CI95= 0.089 – 1.550 %). The
pup genotype by age interaction occurred because only at 2 months of age the B6129SF2
mice exhibited more thigmotaxis than the 3xTg-AD mice (CI95= 0.837 – 3.276 %). The
foster mother by sex by age interaction occurred because only at two months of age in
female mice the mice reared by B6129SF2 mothers exhibited more thigmotaxis than mice
reared by 3xTg-AD mothers (CI95= 2.374 – 5.690 %).
4.4.1.3 PROBE MEMORY TRIAL
The best model for the percentage of time spent in the correct quadrant had pup
genotype, age, and a genotype by age interaction, and was significantly different from the
null model (χ2(7 N = 267)= 74.211, p < 0.001; Figure 4.1.5 A; Supplemental Table 4.1.1;
Supplemental Figure 4.1 A). There was no overall effect of genotype (CI95= -0.964 –
4.628 %), and the time in the correct quadrant was stable from 2 to 12 months of age
(CI95= -3.022 – 4.313 %), then decreased at 18 months of age (12 to 18: CI95= -14.889 – -
6.607 %). The age by genotype interaction occurred because there was some evidence
that B6129SF2 mice spent a greater percentage of time in the correct quadrant at 6
months of age (CI95= -0.165 – 9.935 %), and strong evidence that the B6129SF2 mice
spent a greater percentage of time in the correct quadrant at 12 months of age (CI95=
133
1.810 – 12.793 %) as the confidence interval did not include 0, but there was no
difference at 2 or 18 months of age.
For the number of crossings of the correct annulus the best model had only age
and was significantly different from the null model (χ2(3 N = 273)= 63.9, p < 0.001;
Figure 4.1.5 B; Supplemental Table 4.1.2; Supplemental Figure 4.1 B). The number of
correct annulus crossings decreased with age after 6 months (2 to 6m: CI95= -0.909 –
0.376, 6 to 18m: -3.557 – -2.156 crossings).

134
2 6 1 2 1 8
0
2
4
6
P ro b e A n n u lu s C r o s s in g s
A g e (m )
An
nu
lus
Cro
ss
ing
s (
n)
*
A
B
F ig u re 4 .5
2 6 1 2 1 8
0
2 0
4 0
6 0
T im e in C o r re c t Q u a d r a n t
A ge
% T
Ime
in
Co
rre
ct
Qu
ad
ra
nt
T G _ P W T _ P T G _ P W T _ P T G _ P W T _ P T G _ P W T _ P
#
*
Figure 4.1.5 Morris Water Maze Probe Trial. The mean (± S.E.M) percentage of time
spent in the correct quadrant (A) and of the Morris water maze during the probe trial of
3xTg-AD (TG_P) and B6129SF2 (WT_P) mice at each age, and the number of correct
annulus crossings (B) at each age.
4.4.2 CONDITIONED ODOUR PREFERENCE TASK
The best model for short term memory was the null model (AICc = 2649.318,
Figure 4.2 A; and Supplemental Table 4.1.1), which indicates there was no difference
between any groups. For the long term memory of the 2 month odour at 6 months of age
135
the best model had foster mother genotype and sex, which was significantly different
from the null model (AICc = 108.301, (F(2,75) = 4.776, p <0.05; Figure 4.2 B;
Supplemental Figure 4.2 A; and Supplemental Table 4.2.2). Mice reared by 3xTg-AD
mothers had better long term memory retention from 2 to 6 months of age (CI95= 6.215 –
48.087 %) but there was no difference between male and female mice (CI95= -3.482 –
39.406 %). For memory of the 2 month odor at 12 months of age the best model had
foster mother genotype and sex, which was significantly different from the null model
(AICc = 724.593, (F(2,69) = 9.775, p <0.001; Figure 4.2 C; Supplemental Figure 4.2 B;
and Supplemental Table 4.2.3). Mice reared by 3xTg-AD mothers had better long term
memory from 2 to 12 months of age (CI95= 17.95 – 56.61 %) and male mice had better
retention than female mice (CI95= -3.482 – 39.406 %). The best model for memory of the
2 month odour at 18 months was the null model (AICc= 480.892, Figure 4.2 D; and
Supplemental Table 4.2.5), which indicates there was no difference between groups.
The best model for the memory of the 6 month odour at 12 months of age had
only sex and was significantly different from the null model (AICc= 75.503; F(1,
69)=5.612, p < 0.05; Figure 4.2 E; Supplemental Figure 4.2 C; and Supplemental Table
4.2.4), as males performed better than females (CI95= 4.845 – 41.546 %). For memory of
the 6 month odour at 18 months of age the best model had only sex, though it was not
different from the null model and there was no difference between the sexes (AICc=
475.468; F(1,45)= 3.306, p > 0.05; Figure 4.5 F; CI95= -1.572 – 42.734; Supplemental
Figure 4.2 D; and Supplemental Table 4.2.6). For memory of the 12 month odour at 18
months the best model had foster mother genotype, sex, and an interaction between foster
mother genotype and sex and was significantly different from the null model (AICc =

136
454.430; F(3,45)= 6.650, p < 0.001; Figure 4.2 G; Supplemental Figure 4.2 E; and
Supplemental Table 4.2.7). Mice reared by 3xTg-AD mothers had worse memory for the
12 month odour at 18 months of age (CI95= -38.364 – -13.947 %). Males performed
better than females (CI95= 2.201 – 36.962 %), though the foster mother genotype by sex
interaction indicated that males performed better than females only in mice reared by
3xTg-AD mothers (CI95= 28.592 – 77.378 %).
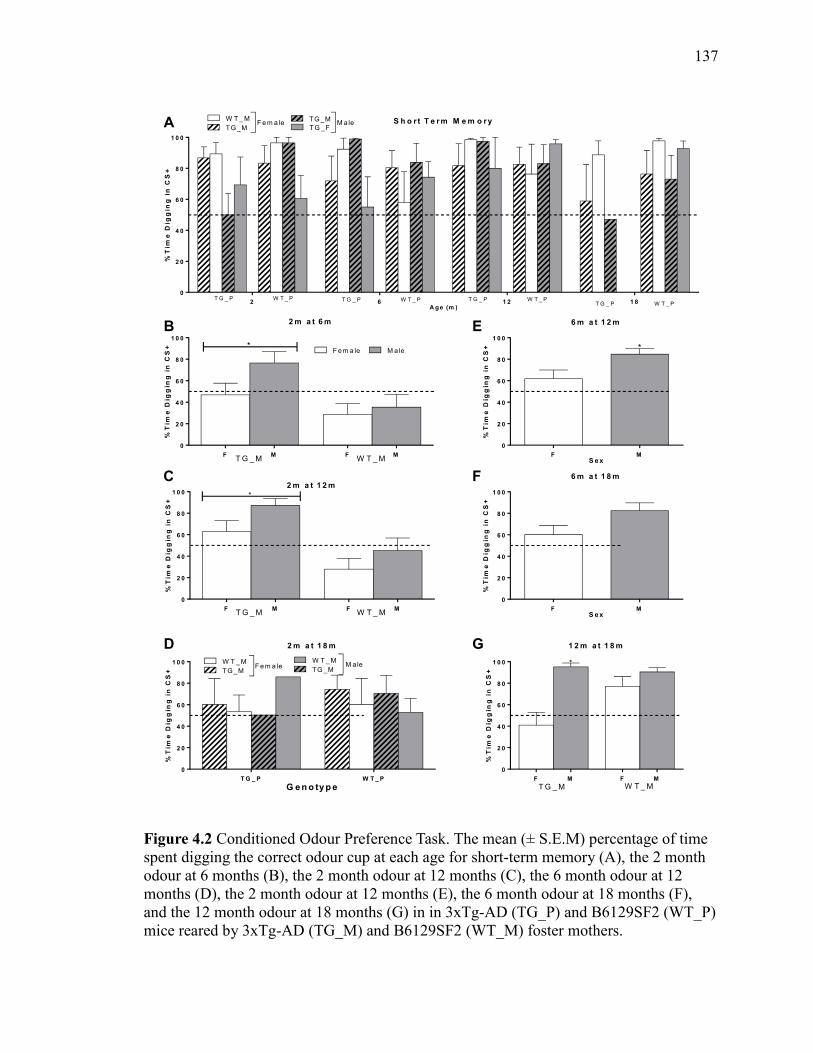
137
F M F M
0
2 0
4 0
6 0
8 0
1 0 02 m a t 1 2 m
%T
ime
Dig
gin
g i
n C
S+
T G _ M W T _ M
*
2 6 1 2 1 8
0
2 0
4 0
6 0
8 0
1 0 0
S h o r t T e r m M e m o r y
A g e (m )
%T
ime
Dig
gin
g i
n C
S+
TG _M
W T _ M TG _M
TG _FF e m a le M ale
T G _ P W T _ P T G _ P W T _ P T G _ P W T _ PT G _ P W T _ P
F M F M
0
2 0
4 0
6 0
8 0
1 0 0
2 m a t 6 m
%T
ime
Dig
gin
g i
n C
S+
T G _ M W T _ M
F e m a le M ale*
F M F M
0
2 0
4 0
6 0
8 0
1 0 0
1 2 m a t 1 8 m
%T
ime
Dig
gin
g i
n C
S+
T G _ M W T _ M
*
F M
0
2 0
4 0
6 0
8 0
1 0 0
6 m a t 1 2 m
S e x
%T
ime
Dig
gin
g i
n C
S+ *
T G _ P W T _ P
0
2 0
4 0
6 0
8 0
1 0 0
2 m a t 1 8 m
G e n o ty p e
%T
ime
Dig
gin
g i
n C
S+ TG _M
W T _ M
TG _M
W T _ MF e m a le M ale
F M
0
2 0
4 0
6 0
8 0
1 0 0
6 m a t 1 8 m
S e x
%T
ime
Dig
gin
g i
n C
S+
A
B
C
E
D
F
G
Figure 4.2 Conditioned Odour Preference Task. The mean (± S.E.M) percentage of time
spent digging the correct odour cup at each age for short-term memory (A), the 2 month
odour at 6 months (B), the 2 month odour at 12 months (C), the 6 month odour at 12
months (D), the 2 month odour at 12 months (E), the 6 month odour at 18 months (F),
and the 12 month odour at 18 months (G) in in 3xTg-AD (TG_P) and B6129SF2 (WT_P)
mice reared by 3xTg-AD (TG_M) and B6129SF2 (WT_M) foster mothers.
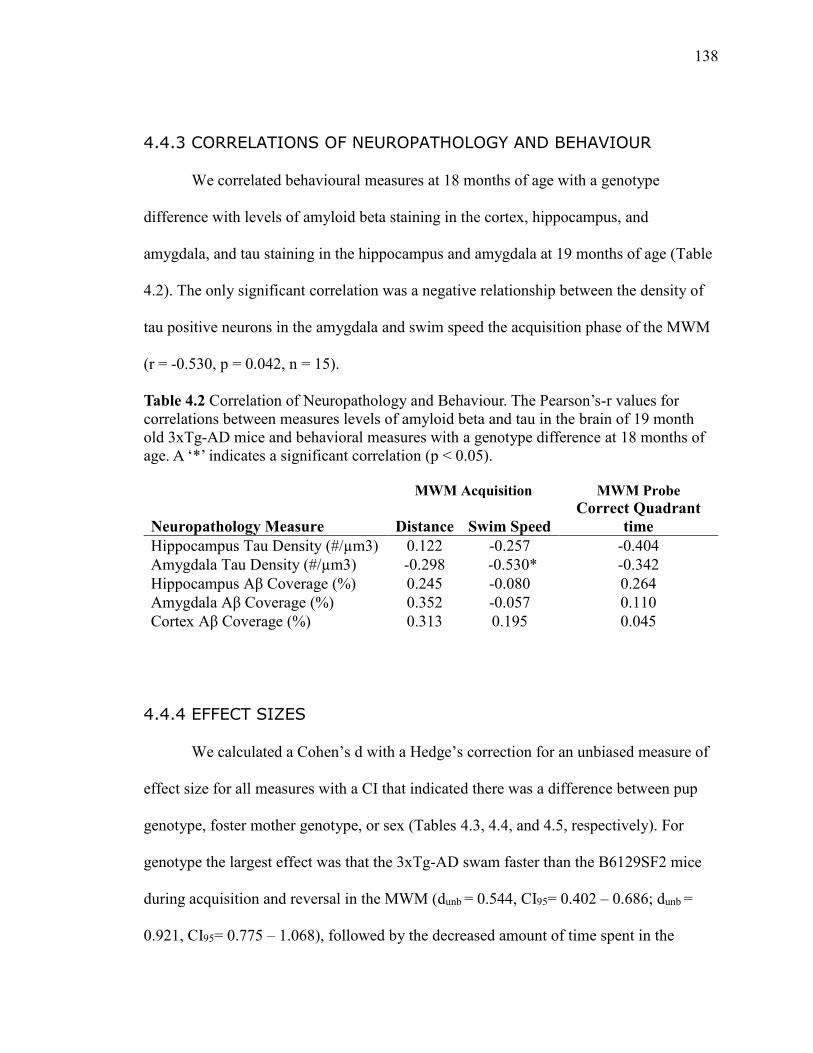
138
4.4.3 CORRELATIONS OF NEUROPATHOLOGY AND BEHAVIOUR
We correlated behavioural measures at 18 months of age with a genotype
difference with levels of amyloid beta staining in the cortex, hippocampus, and
amygdala, and tau staining in the hippocampus and amygdala at 19 months of age (Table
4.2). The only significant correlation was a negative relationship between the density of
tau positive neurons in the amygdala and swim speed the acquisition phase of the MWM
(r = -0.530, p = 0.042, n = 15).
Table 4.2 Correlation of Neuropathology and Behaviour. The Pearson’s-r values for
correlations between measures levels of amyloid beta and tau in the brain of 19 month
old 3xTg-AD mice and behavioral measures with a genotype difference at 18 months of
age. A ‘*’ indicates a significant correlation (p < 0.05).
MWM Acquisition MWM Probe
Neuropathology Measure Distance Swim Speed
Correct Quadrant
time
Hippocampus Tau Density (#/µm3) 0.122 -0.257 -0.404
Amygdala Tau Density (#/µm3) -0.298 -0.530* -0.342
Hippocampus Aβ Coverage (%) 0.245 -0.080 0.264
Amygdala Aβ Coverage (%) 0.352 -0.057 0.110
Cortex Aβ Coverage (%) 0.313 0.195 0.045
4.4.4 EFFECT SIZES
We calculated a Cohen’s d with a Hedge’s correction for an unbiased measure of
effect size for all measures with a CI that indicated there was a difference between pup
genotype, foster mother genotype, or sex (Tables 4.3, 4.4, and 4.5, respectively). For
genotype the largest effect was that the 3xTg-AD swam faster than the B6129SF2 mice
during acquisition and reversal in the MWM (dunb = 0.544, CI95= 0.402 – 0.686; dunb =
0.921, CI95= 0.775 – 1.068), followed by the decreased amount of time spent in the
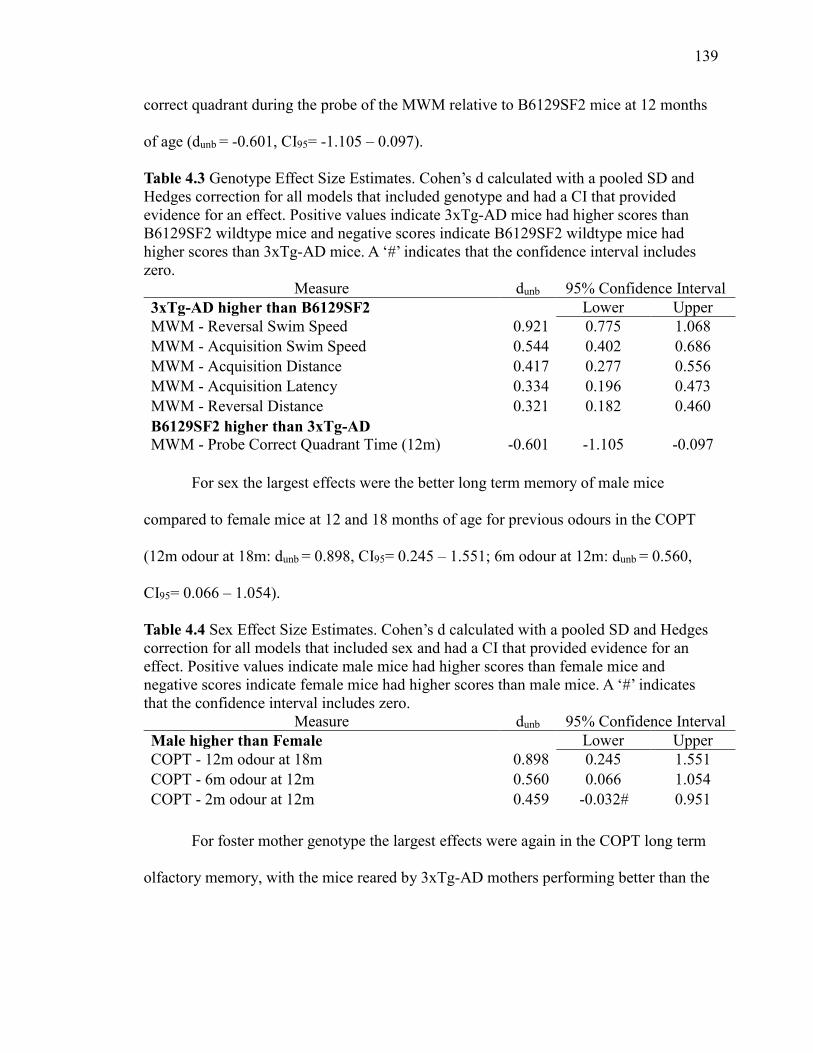
139
correct quadrant during the probe of the MWM relative to B6129SF2 mice at 12 months
of age (dunb = -0.601, CI95= -1.105 – 0.097).
Table 4.3 Genotype Effect Size Estimates. Cohen’s d calculated with a pooled SD and
Hedges correction for all models that included genotype and had a CI that provided
evidence for an effect. Positive values indicate 3xTg-AD mice had higher scores than
B6129SF2 wildtype mice and negative scores indicate B6129SF2 wildtype mice had
higher scores than 3xTg-AD mice. A ‘#’ indicates that the confidence interval includes
zero.
Measure dunb 95% Confidence Interval
3xTg-AD higher than B6129SF2 Lower Upper
MWM - Reversal Swim Speed 0.921 0.775 1.068
MWM - Acquisition Swim Speed 0.544 0.402 0.686
MWM - Acquisition Distance 0.417 0.277 0.556
MWM - Acquisition Latency 0.334 0.196 0.473
MWM - Reversal Distance 0.321 0.182 0.460
B6129SF2 higher than 3xTg-AD
MWM - Probe Correct Quadrant Time (12m) -0.601 -1.105 -0.097
For sex the largest effects were the better long term memory of male mice
compared to female mice at 12 and 18 months of age for previous odours in the COPT
(12m odour at 18m: dunb = 0.898, CI95= 0.245 – 1.551; 6m odour at 12m: dunb = 0.560,
CI95= 0.066 – 1.054).
Table 4.4 Sex Effect Size Estimates. Cohen’s d calculated with a pooled SD and Hedges
correction for all models that included sex and had a CI that provided evidence for an
effect. Positive values indicate male mice had higher scores than female mice and
negative scores indicate female mice had higher scores than male mice. A ‘#’ indicates
that the confidence interval includes zero.
Measure dunb 95% Confidence Interval
Male higher than Female Lower Upper
COPT - 12m odour at 18m 0.898 0.245 1.551
COPT - 6m odour at 12m 0.560 0.066 1.054
COPT - 2m odour at 12m 0.459 -0.032# 0.951
For foster mother genotype the largest effects were again in the COPT long term
olfactory memory, with the mice reared by 3xTg-AD mothers performing better than the
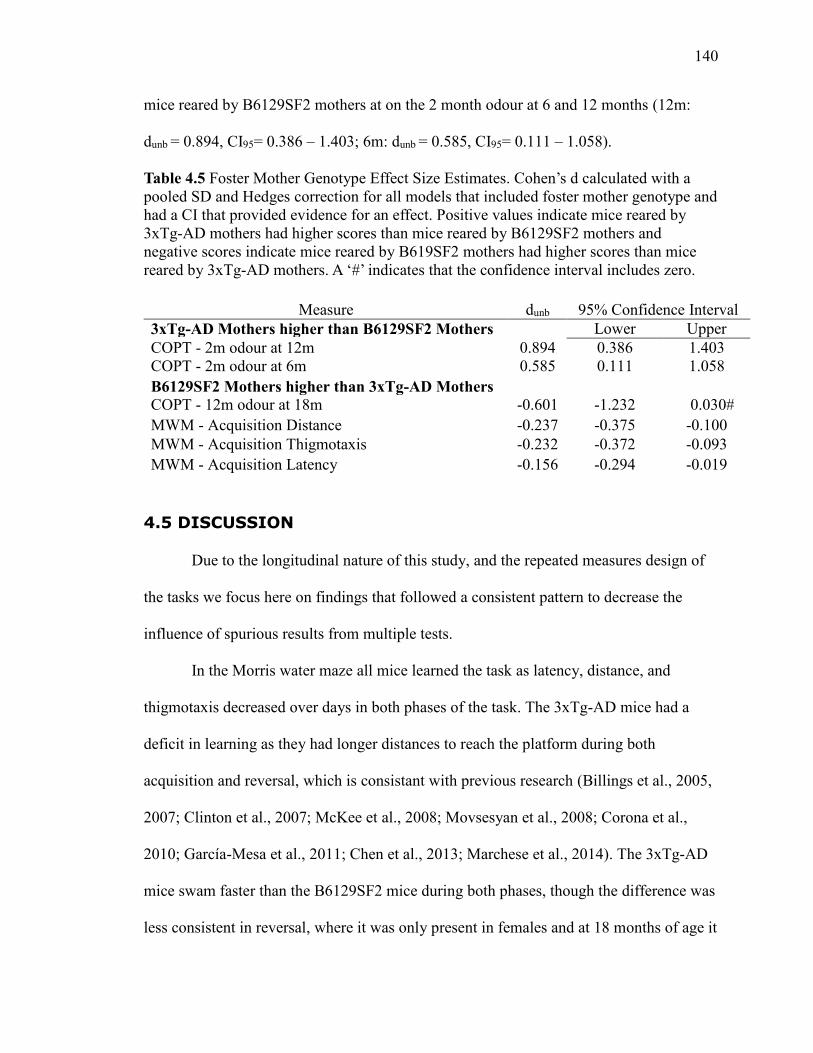
140
mice reared by B6129SF2 mothers at on the 2 month odour at 6 and 12 months (12m:
dunb = 0.894, CI95= 0.386 – 1.403; 6m: dunb = 0.585, CI95= 0.111 – 1.058).
Table 4.5 Foster Mother Genotype Effect Size Estimates. Cohen’s d calculated with a
pooled SD and Hedges correction for all models that included foster mother genotype and
had a CI that provided evidence for an effect. Positive values indicate mice reared by
3xTg-AD mothers had higher scores than mice reared by B6129SF2 mothers and
negative scores indicate mice reared by B619SF2 mothers had higher scores than mice
reared by 3xTg-AD mothers. A ‘#’ indicates that the confidence interval includes zero.
Measure dunb 95% Confidence Interval
3xTg-AD Mothers higher than B6129SF2 Mothers Lower Upper
COPT - 2m odour at 12m 0.894 0.386 1.403
COPT - 2m odour at 6m 0.585 0.111 1.058
B6129SF2 Mothers higher than 3xTg-AD Mothers
COPT - 12m odour at 18m -0.601 -1.232 0.030#
MWM - Acquisition Distance -0.237 -0.375 -0.100
MWM - Acquisition Thigmotaxis -0.232 -0.372 -0.093
MWM - Acquisition Latency -0.156 -0.294 -0.019
4.5 DISCUSSION
Due to the longitudinal nature of this study, and the repeated measures design of
the tasks we focus here on findings that followed a consistent pattern to decrease the
influence of spurious results from multiple tests.
In the Morris water maze all mice learned the task as latency, distance, and
thigmotaxis decreased over days in both phases of the task. The 3xTg-AD mice had a
deficit in learning as they had longer distances to reach the platform during both
acquisition and reversal, which is consistant with previous research (Billings et al., 2005,
2007; Clinton et al., 2007; McKee et al., 2008; Movsesyan et al., 2008; Corona et al.,
2010; García-Mesa et al., 2011; Chen et al., 2013; Marchese et al., 2014). The 3xTg-AD
mice swam faster than the B6129SF2 mice during both phases, though the difference was
less consistent in reversal, where it was only present in females and at 18 months of age it
141
was no longer present. The enhanced swim speed of the 3xTg-AD mice is consistent with
previous findings of enhanced motor performance in the Rotarod (Blanchard et al., 2010;
Chen et al., 2013; Oore et al., 2013; Stover et al., 2015a). Mice reared by 3xTg-AD foster
mothers also swam faster than those reared by B6129SF2 foster mothers which suggests
a long-term maternal effect of motor behaviour. The increased swim speed of the 3xTg-
AD mice relative to the B6129SF2 mice can confound the latency measure, so distance
should be used instead of latency as a measure of learning in this strain. The amount of
thigmotaxis decreased after the first day of acquisition and with age, which may explain
why many of the differences in thigmotaxis were only present on day 1. The 3xTg-AD
mice exhibited more thigmotaxis than B6129SF2 mice on day 1 and 2 of acquisition at 6
months of age, which provides further evidence of a deficit in spatial learning, as
thigmotaxis is a strategy that demonstrates no knowledge of the task. At two months of
age only, mice reared by B6129SF2 mothers exhibited more thigmotaxis, and at 2 and 18
months of age mice reared by B6129SF2 foster mothers took a longer distance to reach
the platform in acquisition which may indicate that they have a deficit in spatial learning.
Although there is at least one report of an age-dependant sex difference in 3xTg-
AD mice in the MWM where females have a larger deficit than males before 12 months
of age, with the deficit disappearing at later ages (Clinton et al., 2007), we found no
overall sex effects in learning or memory across the lifespan. It is possible that the effect
of previous training in the MWM was large enough to mask any sex difference. Billings
et al. (2007) compared MWM performance between cross-sectional and longitudinal
designs and found that the effect of previous learning improved MWM performance to
the point where at earlier ages there was no deficit in 3xTg-AD mice, but by 12 months

142
of age the deficit was detectable and by 15 months of age there was no longer an
improvement in the longitudinal group relative to the cross-sectional group. Marchese et
al. (2014) also performed and longitudinal study on the 3xTg-AD mice in the MWM and
found deficits from 2.5 to 12 months of age. In our study we found a consistent deficit in
learning in the MWM, though the deficit in memory was only present at 6 and 12 months
of age. It is possible that that at 18 months of age any memory deficit in the 3xTg-AD
mice was masked by the effect of previous training, though Billings et al. (2007) found
little effect of previous training at 15 months of age. Another possible explanation is that
the age-related decline in cognitive function of the B6129SF2 mice has caused their
memory to degrade to the point where they perform similarly to the 3xTg-AD at 18
months of age, as both groups performed just above chance (Figure 4.4.5). Lastly the low
number of animals surviving at 18 months of age (Table 4.1) may have decreased our
statistical power to the point where we were not able to detect a genotype difference.
In the conditioned odor preference short term memory task all mice performed
well and there were no differences between any groups in short term memory. There
were several differences in the measures of long term memory, but overall males tended
to perform better than females. Mice reared by B619SF2 mice had a deficit relative to
mice reared by 3xTg-AD mothers in two long term olfactory memory test (2 month odour
at 6 months, and 2 month odour at 12 months), and in one test (12 month odour at 18
months) the effect was reversed and mice reared by 3xTg-AD mothers had a deficit
relative to mice reared by B6129SF2 mothers.
We found a negative correlation between the density of tau positive neurons in the
amygdala and swim speed the acquisition phase of the MWM. The implication of this
143
relationship is unclear; it may be a spurious result given the number of correlations
calculated. Though some studies have shown that in humans there is little relationship
between amyloid beta plaque levels and behavioural deficits, there is some evidence that
tau pathology is correlated with behavioural deficits as there is a temporal correlation
with the development of tau pathology and behavioural deficits as well as a correlation
between the amount of tau pathology and the severity of the behavioural deficits
(Snowdon, 1997; Tiraboschi et al., 2004). However, there is also evidence that soluable
Aβ itelf causes synaptic dysfunction and behavioural deficits, and that the Aβ we
currently measure are not necessicaly representative of soluable Aβ levels (Cleary et al.,
2005). In the 3xTg-AD mice there is also evidence of a temporal correlation between the
development of amyloid beta neuropathology in certain areas of the brain and deficits
associated with those areas (Billings et al., 2005), though the longitudinal design of our
study prevented us from evaluating the temporal progression of neuropathology in our
animals.
The act of cross fostering itself can have lasting effects on mice. Bartolomucci et
al. (2004) compared cross fostered CD-1 mice to normally reared mice and found that the
cross fostered mice had increased weight and at three months of age the male mice
exhibited less anxiety-like behaviour. Several other studies have shown that cross
fostering between strains can influence learning and other behaviours later in life
(Zaharia et al., 1996; Francis et al., 2003; Priebe et al., 2005). It is therefore possible that
some of the effects we observed could be due to the stress of cross fostering itself. A
cross-sectional study performed in our lab on the 3xTg-AD mice found that the 3xTg-AD
mice had deficits in reference and working memory in the 8-arm radial maze from 2 to 15
144
months of age, which demonstrates the effect of our longitudinal design and cross
fostering did not mask the cognitive deficits found in the 3xTg-AD mice (Stevens and
Brown, 2014).
The 3xTg-AD mice have a deficit in spatial learning, an age-dependent deficit in
spatial memory, and the mice reared by B6129SF2 mothers appear to have a deficit in
both spatial and olfactory memory, though this finding was not consistent. In the MWM
there was evidence of age-related cognitive decline in all mice by 18 months of age.
Despite the deficit of the 3xTg-AD mice in spatial memory, there was no genotype
difference in short or long term olfactory-dependent memory. Short term olfactory-
dependent memory did not change with age. There was no consistent difference between
the sexes in spatial memory (but male mice tended to have better olfactory memory than
female mice). The 3xTg-AD are useful for modeling the spatial learning deficits of AD
across the life span and the memory deficits of AD at 6 and 12 months of age in the
MWM and learning deficits across the life span, though the effect of maternal genotype
was not large enough to mask these differences.
4.6 ACKNOWLEDGEMENTS
This research was funded by an NSERC grant to REB. The authors would like to
thank Rhian Gunn and Daniel Ikpi for their assistance in this project.

145
4.7 REFERENCES
Bartolomucci a., Gioiosa L, Chirieleison A, Ceresini G, Parmigiani S, Palanza P (2004)
Cross fostering in mice: Behavioral and physiological carry-over effects in
adulthood. Genes, Brain Behav 3:115–122.
Billings LM, Green KN, McGaugh JL, LaFerla FM (2007) Learning decreases A beta*56
and tau pathology and ameliorates behavioral decline in 3xTg-AD mice. J Neurosci
27:751–761.
Billings LM, Oddo S, Green KN, McGaugh JL, LaFerla FM (2005) Intraneuronal Abeta
causes the onset of early Alzheimer’s disease-related cognitive deficits in transgenic
mice. Neuron 45:675–688.
Blanchard J, Wanka L, Tung Y-C, Cárdenas-Aguayo M del C, LaFerla FM, Iqbal K,
Grundke-Iqbal I (2010) Pharmacologic reversal of neurogenic and neuroplastic
abnormalities and cognitive impairments without affecting Aβ and tau pathologies in
3xTg-AD mice. Acta Neuropathol 120:605–621.
Blaney CE, Gunn RK, Stover KR, Brown RE (2013) Maternal genotype influences
behavioral development of 3xTg-AD mouse pups. Behav Brain Res 252:40–48.
Champagne FA, Curley JP (2009) Epigenetic mechanisms mediating the long-term
effects of maternal care on development. Neurosci Biobehav Rev 33:593–600.
Chen Y, Liang Z, Blanchard J, Dai C-L, Sun S, Lee MH, Grundke-Iqbal I, Iqbal K, Liu F,
Gong C-X (2013) A Non-transgenic mouse model (icv-STZ mouse) of Alzheimer’s
disease: Similarities to and differences from the transgenic model (3xTg-AD
mouse). Mol Neurobiol 47:711–725.
Cleary JP, Walsh DM, Hofmeister JJ, Shankar GM, Kuskowski M a, Selkoe DJ, Ashe KH
(2005) Natural oligomers of the amyloid-beta protein specifically disrupt cognitive
function. Nat Neurosci 8:79–84.
Clinton LK, Billings LM, Green KN, Caccamo A, Ngo J, Oddo S, McGaugh JL, LaFerla
FM (2007) Age-dependent sexual dimorphism in cognition and stress response in
the 3xTg-AD mice. Neurobiol Dis 28:76–82.
Corona C, Masciopinto F, Silvestri E, Viscovo A Del, Lattanzio R, Sorda R La,
Ciavardelli D, Goglia F, Piantelli M, Canzoniero LMT, Sensi SL (2010) Dietary zinc
supplementation of 3xTg-AD mice increases BDNF levels and prevents cognitive
deficits as well as mitochondrial dysfunction. Cell Death Dis 1:e91.
Coronas-Sámano G, Portillo W, Beltrán Campos V, Medina-Aguirre GI, Paredes RG,
Diaz-Cintra S (2014) Deficits in odor-guided behaviors in the transgenic 3xTg-AD
female mouse model of Alzheimer’s disease. Brain Res 1572:18–25.
146
Francis DD, Szegda K, Campbell G, Martin WD, Insel TR (2003) Epigenetic sources of
behavioral differences in mice. Nat Neurosci 6:445–446.
García-Mesa Y, López-Ramos JC, Giménez-Llort L, Revilla S, Guerra R, Gruart A,
Laferla FM, Cristòfol R, Delgado-García JM, Sanfeliu C (2011) Physical exercise
protects against Alzheimer’s disease in 3xTg-AD mice. J Alzheimers Dis 24:421–
454.
Giménez-Llort L, García Y, Buccieri K, Revilla S, Suñol C, Cristofol R, Sanfeliu C
(2010) Gender-Specific Neuroimmunoendocrine Response to Treadmill Exercise in
3xTg-AD Mice. Int J Alzheimers Dis 2010:128354.
Marchese M, Cowan D, Head E, Ma D, Karimi K, Ashthorpe V, Kapadia M, Zhao H,
Davis P, Sakic B (2014) Autoimmune manifestations in the 3xTg-AD model of
Alzheimer’s disease. J Alzheimers Dis 39:191–210.
McKee AC, Carreras I, Hossain L, Ryu H, Klein WL, Oddo S, LaFerla FM, Jenkins BG,
Kowall NW, Dedeoglu A (2008) Ibuprofen reduces Abeta, hyperphosphorylated tau
and memory deficits in Alzheimer mice. Brain Res 1207:225–236.
Movsesyan N, Ghochikyan A, Mkrtichyan M, Petrushina I, Davtyan H, Olkhanud PB,
Head E, Biragyn A, Cribbs DH, Agadjanyan MG (2008) Reducing AD-like
pathology in 3xTg-AD mouse model by DNA epitope vaccine - a novel
immunotherapeutic strategy. PLoS One 3:e2124.
Oddo S, Caccamo A, Shepherd JD, Murphy MP, Golde TE, Kayed R, Metherate R,
Mattson MP, Akbari Y, LaFerla FM (2003) Triple-transgenic model of Alzheimer’s
Disease with plaques and tangles: Intracellular Aβ and synaptic dysfunction. Neuron
39:409–421.
Oore JJ, Fraser LM, Brown RE (2013) Age-related changes in motor ability and motor
learning in triple transgenic (3xTg-AD) and control (B6129SF1/J) mice on the
accelerating Rotarod. Proc Nov Scotian Inst Sci 74:281–296.
Priebe K, Brake WG, Romeo RD, Sisti HM, Mueller A, McEwen BS, Francis DD, Sisti
HM, Mueller A, McEwen BS, Brake WG (2005) Maternal influences on adult stress
and anxiety-like behavior in C57BL/6J and BALB/CJ mice: A cross-fostering study.
Dev Psychobiol 47:398–407.
Schellinck HM, Forestell C a, LoLordo VM (2001) A simple and reliable test of olfactory
learning and memory in mice. Chem Senses 26:663–672.
Snowdon DA a. (1997) Aging and Alzheimer’s disease: lessons from the Nun Study.
Gerontologist 37:150–156.
Stevens LM, Brown RE (2014) Reference and working memory deficits in the 3xTg-AD
mouse between 2 and 15-months of age: A cross-sectional study. Behav Brain Res
278C:496–505.
147
Stover KR, Campbell MA, Van Winssen CM, Brown RE (2015a) Analysis of motor
function in 6 month old male and female 3xTg-AD mice. Behav Brain Res 281:16–
23.
Stover KR, Hicks ME, Gordon KM, Ikpi D, Brown RE (2015b) Age-related changes in
social behaviour in the 3xTg-AD mouse model of Alzheimer’s disease from 2 to 18
months of age. Unpublished.
Stover KR, Hicks ME, Gordon KM, Ikpi D, Brown RE (2015c) Age-related changes in
acoustic startle and prepulse inhibition in the 3xTg-AD mouse model of Alzheimer’s
disease: A longitudinal study. Unpublished.
Stover KR, Hicks ME, Gordon KM, Ikpi D, Darvesh S, Brown RE (2015d) Age-related
changes in motor behaviour and anxiety in the 3xTg-AD mouse model of
Alzheimer’s disease: A longitudinal study. Unpublished.
Szyf M, Weaver I, Meaney M (2007) Maternal care, the epigenome and phenotypic
differences in behavior. Reprod Toxicol 24:9–19.
Tiraboschi P, Hansen L a, Thal LJ, Corey-Bloom J (2004) The importance of neuritic
plaques and tangles to the development and evolution of AD. Neurology 62:1984–
1989.
Wong AA, Brown RE (2007) Age-related changes in visual acuity, learning and memory
in C57BL/6J and DBA/2J mice. Neurobiol Aging 28:1577–1593.
Zaharia MD, Kulczycki J, Shanks N, Meaney MJ, Anisman H (1996) The effects of early
postnatal stimulation on Morris water-maze acquisition in adult mice: Genetic and
maternal factors. Psychopharmacology (Berl) 128:227–239.

148
4.8 SUPPLEMENTAL TABLES
These supplemental tables provide the statistics used to determine the best model for each
measure. The top five models for each measure are included. The model column
describes the factors included in the model, terms separated by a ‘*’ that there were main
effects and interactions for the terms, those separated by a ‘+’ are simple main effects,
and those separated by a ‘:’ indicate an interaction alone. The ‘AICc’ column contains the
second order Akaike information criterion, which is a measure used to evaluate the
models based on the complexity and goodness of fit of the model to the data, with lower
values being better. The “∆ AICc” column is difference between that model’s AICc and
the model with the lowest AICc. The ‘Wt’ column is the Akaike weight, a measure of
relative likelihood that the model is the best, ranging from 0, meaning unlikely, to 1,
meaning likely. The ‘ER’ column is the evidence ratio, it is the likelihood that the model
with the lowest AICc is better than that model.
Supplemental Table 4.1.1 MWM – Time in Correct Quadrant
Model AICc ∆ AICc AICcWt ER
Genotype*Age 2057.589 0 0.087 1
(Genotype+Sex+Age)+( Genotype:Age ) 2059.525 1.935 0.033 2.632
(Genotype*Age+FMGenotype 2059.679 2.090 0.030 2.843
(Genotype+Sex+Age)+( Genotype:Age)+
(Sex:Age) 2060.416 2.827 0.021 4.110
(Genotype+Sex+Age)+(Genotype:Sex)+
(Genotype:Age) 2060.43 2.841 0.021 4.140
Supplemental Table 4.1.2 MWM – Correct Annulus Crossings
Model AICc ∆ AICc AICcWt ER
Age 1195.234 0 0.126 1
Genotype+Age 1196.791 1.558 0.058 2.179
Sex+Age 1196.914 1.681 0.054 2.317
FMGenotype+Age 1197.199 1.965 0.047 2.672
Sex*Age 1197.583 2.350 0.038 3.237
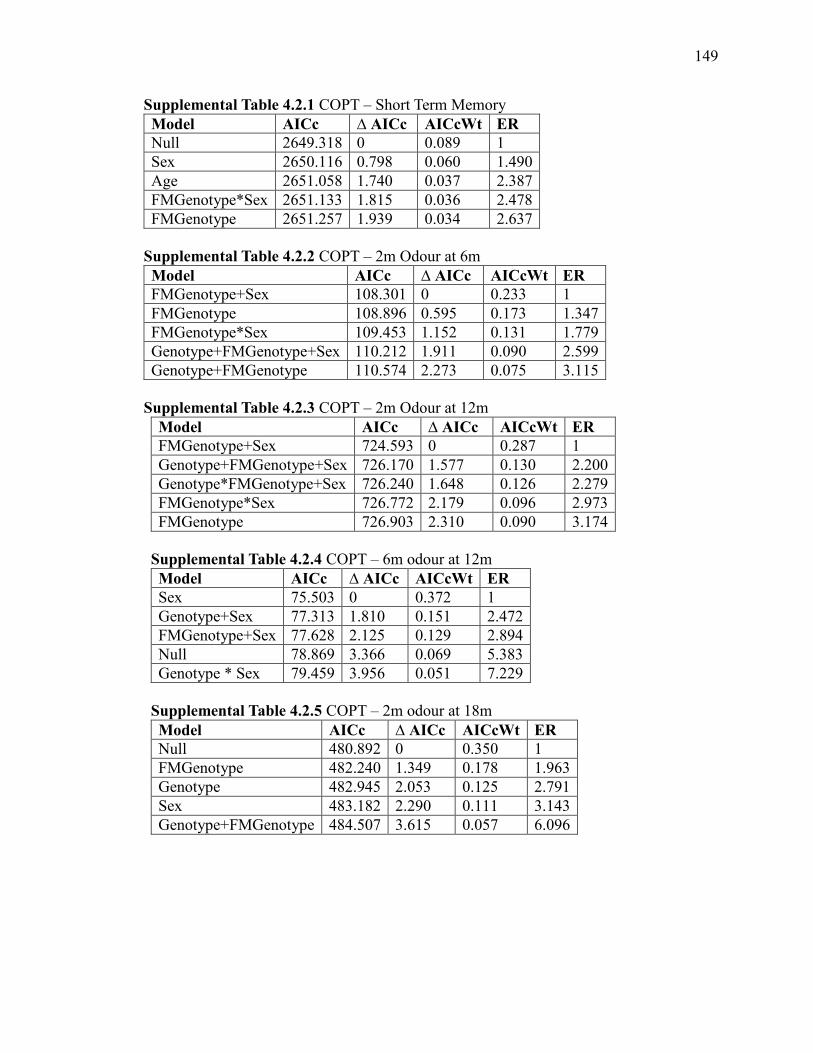
149
Supplemental Table 4.2.1 COPT – Short Term Memory
Model AICc ∆ AICc AICcWt ER
Null 2649.318 0 0.089 1
Sex 2650.116 0.798 0.060 1.490
Age 2651.058 1.740 0.037 2.387
FMGenotype*Sex 2651.133 1.815 0.036 2.478
FMGenotype 2651.257 1.939 0.034 2.637
Supplemental Table 4.2.2 COPT – 2m Odour at 6m
Model AICc ∆ AICc AICcWt ER
FMGenotype+Sex 108.301 0 0.233 1
FMGenotype 108.896 0.595 0.173 1.347
FMGenotype*Sex 109.453 1.152 0.131 1.779
Genotype+FMGenotype+Sex 110.212 1.911 0.090 2.599
Genotype+FMGenotype 110.574 2.273 0.075 3.115
Supplemental Table 4.2.3 COPT – 2m Odour at 12m
Model AICc ∆ AICc AICcWt ER
FMGenotype+Sex 724.593 0 0.287 1
Genotype+FMGenotype+Sex 726.170 1.577 0.130 2.200
Genotype*FMGenotype+Sex 726.240 1.648 0.126 2.279
FMGenotype*Sex 726.772 2.179 0.096 2.973
FMGenotype 726.903 2.310 0.090 3.174
Supplemental Table 4.2.4 COPT – 6m odour at 12m
Model AICc ∆ AICc AICcWt ER
Sex 75.503 0 0.372 1
Genotype+Sex 77.313 1.810 0.151 2.472
FMGenotype+Sex 77.628 2.125 0.129 2.894
Null 78.869 3.366 0.069 5.383
Genotype * Sex 79.459 3.956 0.051 7.229
Supplemental Table 4.2.5 COPT – 2m odour at 18m
Model AICc ∆ AICc AICcWt ER
Null 480.892 0 0.350 1
FMGenotype 482.240 1.349 0.178 1.963
Genotype 482.945 2.053 0.125 2.791
Sex 483.182 2.290 0.111 3.143
Genotype+FMGenotype 484.507 3.615 0.057 6.096
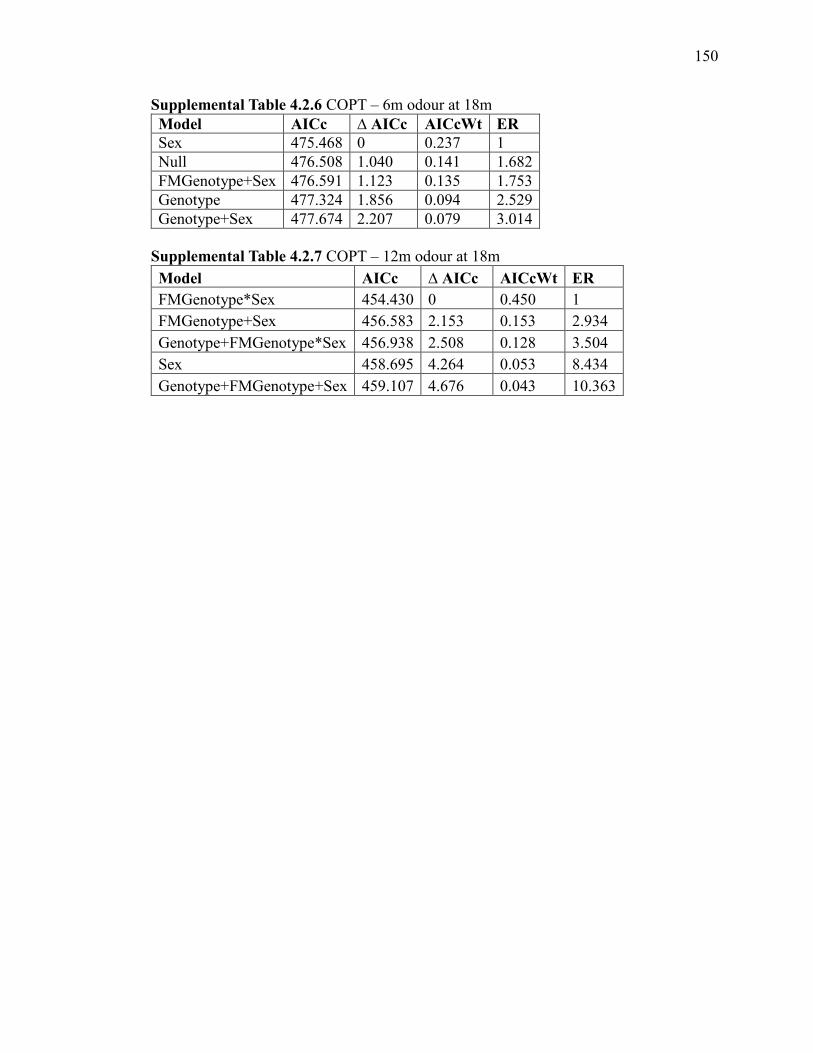
150
Supplemental Table 4.2.6 COPT – 6m odour at 18m
Model AICc ∆ AICc AICcWt ER
Sex 475.468 0 0.237 1
Null 476.508 1.040 0.141 1.682
FMGenotype+Sex 476.591 1.123 0.135 1.753
Genotype 477.324 1.856 0.094 2.529
Genotype+Sex 477.674 2.207 0.079 3.014
Supplemental Table 4.2.7 COPT – 12m odour at 18m
Model AICc ∆ AICc AICcWt ER
FMGenotype*Sex 454.430 0 0.450 1
FMGenotype+Sex 456.583 2.153 0.153 2.934
Genotype+FMGenotype*Sex 456.938 2.508 0.128 3.504
Sex 458.695 4.264 0.053 8.434
Genotype+FMGenotype+Sex 459.107 4.676 0.043 10.363

151
4.9 SUPPLEMENTAL FIGURES
2 6 1 2 1 8
0
2
4
6
8
1 0 P ro b e A n n u lu s C r o s s in g s
A g e (m )
An
nu
lus
Cro
ss
ing
s (
n)
T G _ P W T _ P T G _ P W T _ P T G _ P W T _ P T G _ P W T _ P
2 6 1 2 1 8
0
2 0
4 0
6 0
8 0
1 0 0 P ro b e T im e in th e C o rr e c t Q u a d r a n t
A g e (m )
% T
Ime
in
Co
rre
ct
Qu
ad
ra
nt
T G _ P W T _ P
TG _MTG _M
W T _ M W T _ MF e m a le M ale
T G _ P W T _ P T G _ P W T _ P T G _ P W T _ P
A
B
Supplemental Figure 4.1 Morris Water Maze Probe Trial. The mean (± S.E.M)
percentage of time spent in the correct quadrant (A) and number of annulus crossings at
each age of the probe trial in the Morris water maze mouse of 3xTg-AD (TG_P) and
B6129SF2 (WT_P) mice reared by 3xTg-AD (TG_M) and B6129SF2 (WT_M) foster
mothers.
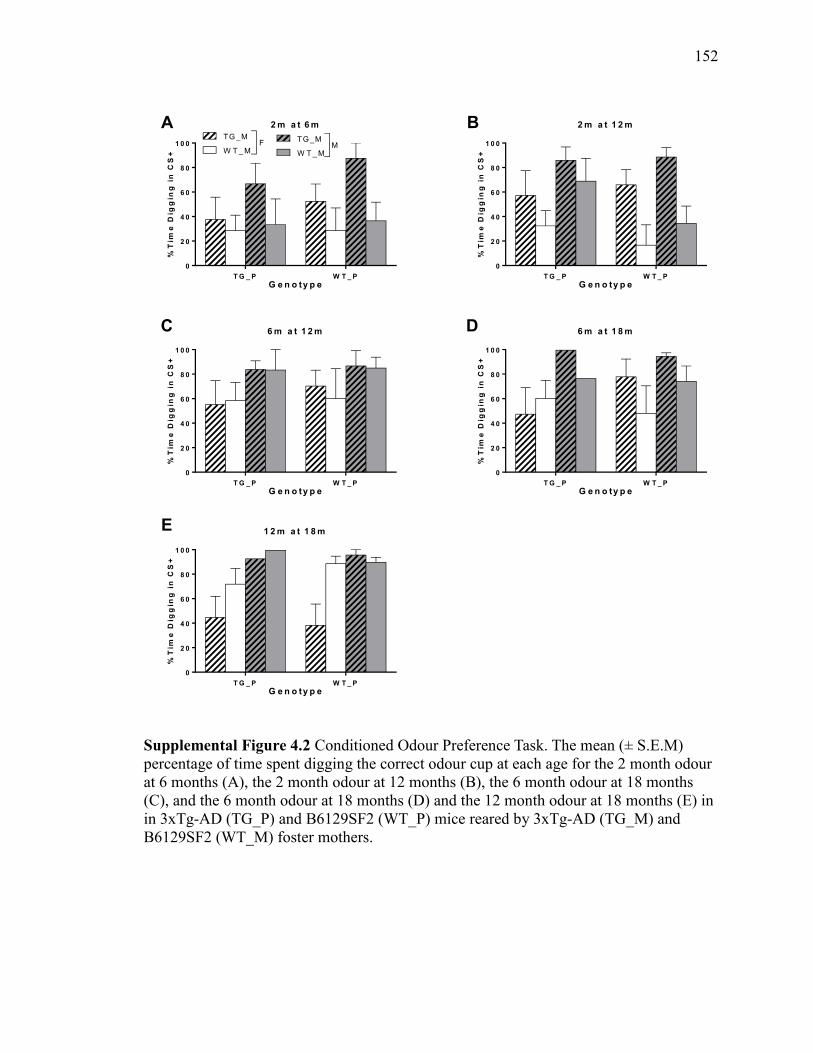
152
T G _ P W T _ P
0
2 0
4 0
6 0
8 0
1 0 0
2 m a t 6 m
G e n o ty p e
%T
ime
Dig
gin
g i
n C
S+
TG _M
W T _ M
TG _M
W T _ M
F M
T G _ P W T _ P
0
2 0
4 0
6 0
8 0
1 0 0
2 m a t 1 2 m
G e n o ty p e
%T
ime
Dig
gin
g i
n C
S+
T G _ P W T _ P
0
2 0
4 0
6 0
8 0
1 0 0
6 m a t 1 2 m
G e n o ty p e
%T
ime
Dig
gin
g i
n C
S+
T G _ P W T _ P
0
2 0
4 0
6 0
8 0
1 0 0
6 m a t 1 8 m
G e n o ty p e
%T
ime
Dig
gin
g i
n C
S+
T G _ P W T _ P
0
2 0
4 0
6 0
8 0
1 0 0
1 2 m a t 1 8 m
G e n o ty p e
%T
ime
Dig
gin
g i
n C
S+
A B
C D
E
Supplemental Figure 4.2 Conditioned Odour Preference Task. The mean (± S.E.M)
percentage of time spent digging the correct odour cup at each age for the 2 month odour
at 6 months (A), the 2 month odour at 12 months (B), the 6 month odour at 18 months
(C), and the 6 month odour at 18 months (D) and the 12 month odour at 18 months (E) in
in 3xTg-AD (TG_P) and B6129SF2 (WT_P) mice reared by 3xTg-AD (TG_M) and
B6129SF2 (WT_M) foster mothers.

153
CHAPTER 5 AGE-RELATED CHANGES IN SOCIAL BEHAVIOUR
IN THE 3XTG-AD MOUSE MODEL OF ALZHEIMER’S DISEASE
FROM 2 TO 18 MONTHS OF AGE
Kurt R. Stover, Kaitlyn M. Gordon, Michelle E. Hicks, and Richard E. Brown
Department of Psychology and Neuroscience
Dalhousie University
PO Box 1500, Halifax, NS
Canada B3H 4R2
154
5.1 ABSTRACT
Patients with AD develop a number of behavioural symptoms associated with a
decrease in social behaviour including apathy, depression, and anxiety. Additionally the
cognitive deficits of AD can make maintaining social interactions difficult as symptoms
progress. Ideally a mouse model of AD would replicate these deficits. We tested the
3xTg-AD mouse model of AD longitudinally at 2, 6, 12, and 18 months of age using a
behavioural test battery to assess social behaviour. We found that male mice were more
aggressive than female mice and that there was no consistent change in social behaviour
with age. There was some indication that mice reared by B6129SF2 mothers had reduced
aggression compared to mice reared by 3xTg-AD mothers in home cage observations.
Interestingly neither the 3xTg-AD nor the B6129SF2 mice exhibited a preference for
social novelty, which indicates that this is not an appropriate test to assess social
behaviour in this strain. Overall the 3xTg-AD mice do not appear to have a deficit in
social behaviour compared to the B6129SF2 mice.
155
5.2 INTRODUCTION
Patients with AD develop a number of behavioural symptoms associated with a
decrease in social behaviour including apathy, depression, and anxiety. Additionally the
cognitive deficits of AD can make maintaining social interactions difficult as symptoms
progress (Devanand et al., 1996; Teri et al., 1999; Ferretti et al., 2001; Landes et al.,
2001). Ideally a mouse model of AD would replicate these deficits. A study of social
behaviour in the 3xTg-AD mice using a social recognition task found that the 3xTg-AD
mice had impaired social recognition compared to control mice at 18 months of age
(Medeiros et al., 2011). Other studies have found deficits in social behaviours in the
APPswe/PS1dE9 and 5xFAD mouse models of AD (Filali et al., 2011; Flanigan et al.,
2014). These deficits may be the result of either decreases in social behaviour or deficits
in cognitive function that impair the memory required for social recognition.
The 3xTg-AD mouse is a commonly used model of Alzheimer’s disease (AD)
with three transgenes, two associated with familial AD (APPswe and PS1M146V) and one
with tau pathology (TauP301L). As a result of these transgenes the 3xTg-AD develops a
number of behavioural and neuropathological deficits (Oddo et al., 2003). To create
homozygous genotypes 3xTg-AD females are bred with 3xTg-AD males, and the in the
B6129SF2 control strain, the B6129SF2 females are bred with B6129SF2 mice. This
results in pups only being reared by mothers of the same genotype. Maternal care can
have a long term effect on pup behaviour, and strain differences in maternal care could
result in neural and behavioural differences in adulthood (Priebe et al., 2005; Szyf et al.,
2007). We cross-fostered litters of 3xTg-AD and B6129SF2 mice to study the effect of
maternal genotype. We then assessed the mice on a neurodevelopmental test battery

156
before weaning (Blaney et al., 2013). In this study we conducted a longitudinal study on
the mice at 2, 6, 12, and 18 months. The mice also underwent a behavioural test battery to
assess prepulse inhibition and anxiety-like, motor, and cognitive behaviours (Stover et
al., 2015c, 2015d, 2015e).
5.3 METHODS
2.3.1 BREEDING, CROSS-FOSTERING & PRE-WEANING TREATMENT OF
MICE
We used four breeding pairs each of 3xTg-AD mice (B6;129-Psen1tm1Mpm
Tg(APPSwe,tauP301L)1Lfa/Mmjax) and B6129S/F2 mice, which were purchased from
Jackson Laboratories (Strain #004807 and #004807, respectively, Bar Harbor, Maine).
All procedures used in this experiment were approved by the Dalhousie University
Committee on Animal Care.
In order to examine maternal effects on development we cross fostered all litters
at post natal day 0 (the day of birth) or 1, so that half the mice of each genotype had
3xTg-AD foster mothers and half had B6129SF2 foster mothers, and no mother reared
her own pups. These mice were tested in a neurodevelopmental test battery (Blaney et al.,
2013).
The mice were housed in same sex groups of two to four foster-littermates in clear
plastic cages measuring (18.75 x 28 x 12.5 cm), with wire tops, wood chip bedding, and a
PVC tube (4 cm diameter x 7 cm length) for enrichment. The colony room was kept at
22±2 °C on a reversed 12:12 light:dark cycle, with lights off at 10:00am. The mice were
fed Purina 5001 rodent chow (Purina, St. Louis, Missouri) and tap water ad libitum.

157
5.3.2 PROCEDURE
Beginning at 2 months of age we tested 78 mice, 40 3xTg-AD and 38 B6129SF2,
with approximately equal numbers of each sex, however some mice died between the
testing periods (Table 5.1). The mice were tested in three cohorts of approximately the
same size at two, six, twelve, and eighteen months of age in a longitudinal design.
Behavioural testing took place during the dark phase of the light:dark cycle. For the
behavioural tasks the experimenters were blind to the genotype and foster mother
genotype of the mice; it was not possible to blind the experimenters to the age due to the
longitudinal design. The tests were performed in the order described below, except
between home cage observations and social preference / novelty the mice underwent a
test battery to assess motor and anxiety-like behaviour (See Stover et al., 2015c). The
tests were ordered from least to most stressful to attempt to decrease the effect of stress.
Table 5.1 Distribution of mice by pup genotype and maternal genotype at each age.
Pup Genotype
2 Months of Age
Maternal Genotype
Total B6129SF2 3xTg-AD
B6129SF2 11M, 7F 8M, 12F 38
3xTg-AD 8M, 14F 9M, 9F 40
Total 40 38 78
6 Months of Age
B6129SF2 11M, 7F 8M, 12F 38
3xTg-AD 7M, 14F 9M, 8F 38
Total 39 37 76
12 Months of Age
B6129SF2 11M, 5F 8M, 12F 36
3xTg-AD 6M, 13F 9M, 8F 36
Total 35 37 72
18 Months of Age
B6129SF2 10M, 5F 7M, 7F 29
3xTg-AD 1M, 11F 2M, 5F 19
158
5.3.4 HOME CAGE OBSERVATIONS
Home cage observations were completed to study social behavior using a
procedure adapted from D’Andrea et al. (2007). To aid in identification of the mice we
marked them with a black non-toxic maker in unique patterns. The home cage
observations took place in the colony room during the dark phase of the light:dark cycle
and the cages were illuminated using a red 60 W light. Behaviours were scored using
one-zero sampling with time sampling every two minutes. No more than five cages were
scored at one time and there were 10 minutes between each set of observations per cage.
If fewer than five cages were observed breaks were added to maintain the 10 minute
break between observations. We completed three sets of observations in one day which
were evenly spaced over the 12 hours of the dark phase of the light:dark cycle. Three
categories of behaviour were recorded: affiliative, agonistic, and non-social (Grant and
Mackintosh, 1963). The affiliative behaviours were: sniffing (touching a cage mate with
their snout) and social grooming (stroking with paws or licking the fur of a cage mate).
The agonistic behaviours were: attacking (biting, striking with paws), aggressive
grooming (aggressively grooming a cage mate), offensive upright posture (on hind limbs
facing a cage mate), defensive upright posture (on hind limbs pushing against an
attacking cage mate), submissive upright posture (on hind limbs turned away from an
attacking cage mate), crouched posture (lying on floor of cage with head touching cage),
freezing (only respiration), fleeing (quickly moving away from a cage mate), and tail
rattling (pointing the tail upwards and moving it from side to side). The non-social
behaviours were: wall rearing (placing one or both fore paws against the wall of the cage
with the hind paws on the floor of the cage), self-grooming, immobility, brief contact

159
with a cage mate, eating, and drinking. The frequency of each category of behaviour was
analyzed at the three time points at each age.
5.3.5 SOCIAL NOVELTY/PREFERENCE
To measure social behaviour we used the social novelty/preference test using a
procedure adapted from Moy et al. (2004) and (Pearson et al., 2010). The apparatus was
an open box (69 x 20 x 20 cm) made of clear plastic with three chambers (each 23 x 20 x
20 cm) connected by openings in the walls (6 x 5.5 cm). We used two male C57BL/6J
(Stock Number: 000664, Jackson Laboratories, Bar Harbour, ME) as stimulus mice
(Mouse A & B). There were two phases: in phase one mouse A was placed in a wire
cylinder in the center of one end chamber and a small plastic toy was placed in a wire
cylinder in the center of other end chamber. To begin the trials the mouse being tested
was placed in the centre chamber, and was allowed to explore the apparatus for ten
minutes. In phase two mouse A was moved to the opposite end chamber and a novel
stimulus mouse, mouse B, was placed in the other end chamber. The same procedure was
repeated and the amount of time spent interacting with each mouse was recorded. Mice
will normally express a preference for the novel mouse and spend more time interacting
with the novel mouse. There was a one hour interval between phase one and phase two.
The mice were tested individually in groups of four, all four mice completed phase one
before beginning phase two. The apparatus was cleaned with ethanol between mice. A
novel mouse preference score was calculated for the amount of time spent interacting
with each mouse in phase two (𝐴 − 𝐵
𝐴 + 𝐵) ∗ 100.
160
5.3.6 TUBE TEST OF SOCIAL DOMINANCE
To study social behaviour and aggression we used the social dominance tube
method adapted from Koh et al. (2008) and Lijam et al. (1997). The tube test apparatus
was made of clear Plexiglas, had two holding chambers (10 x 10 cm) which were
connected by a tube (30 long x 3 cm diameter), blocked by a removable piece of
Plexiglas. The apparatus was mounted on a wooden board (12.5 x 58 cm) painted white.
To begin a trial the two mice were placed in the opposing holding chambers and the tube
was opened. If one mouse forced the other to back out of the tube it was considered the
“winner”, if no mouse forced the other out of the tube within 10 minutes the trial was
considered a draw. Only mice of the same sex were tested, they were only tested against
mice who were not cage mates and were of different genotypes. Each pair was given two
trials. The mice were matched on weight.
5.3.7 CORRELATIONS OF NEUROPATHOLOGY AND BEHAVIOUR
All measures that had genotype differences were correlated with levels of tau and
amyloid beta neuropathology in the brains of the mice at 19 months of age. The
methodology used to determine the levels of neuropathology is described in (Stover et al.,
2015e). Briefly, the levels of tau pathology were calculated using unbiased stereology
and the levels of Aβ were calculated using a thresholding technique.
5.3.8 STATISTICAL ANALYSES
The statistical analyses described in the following section were performed using R
(www.R-project.org). For the tube test of social dominance the differences between
genotypes were analyzed using a chi-squared test at each age. We used linear mixed
effects regression to assess difference between genotype, sex, foster mother genotype,
161
and age. For social novelty / recognition all models were compared and the model with
the lowest second-order Akaike's Information Criterion (AICc) were selected, the top five
models for is presented in Supplemental Table 5.1. For home cage observations, which
has a repeated measures design, models were selected using backward elimination. The
best model was compared to the null model with a chi-square test. When there were
significant effects of genotype, sex, or foster mother genotype, we calculated unbiased
effect sizes using Cohen’s d with a hedges correction. The correlations between levels of
neuropathology and behaviour were calculated using Pearson’s r.
5.4 RESULTS
Several mice died over the testing period, see Table 5.1 for the total number of
mice at each age.
5.4.1 HOME CAGE OBSERVATIONS
The best linear mixed effects model for the number of affiliative behaviours had
pup genotype, foster mother genotype, age, and a foster mother genotype by age
interaction, which was significantly different from the null model (AICc=1523.094; χ2(8,
N= 768)= 106.67, p < 0.001; Figure 5.1 A-D; and Supplemental Figure 5.1 A). Overall
B6129SF2 mice exhibited more affiliative behaviours than 3xTg-AD mice (CI95= 0.018 –
0.215 behaviours), and there was some evidence that mice reared by B6129SF2 mothers
exhibited more affiliative behaviours than mice reared by 3xTg-AD mothers (CI95= -
0.002 – 0.212 behaviours). The number of affiliative behaviours decreased from 2-6
months of age (CI95= -0.311 -0.083 behaviours), and increased from 2-12 (CI95= 0.189 –
0.427 behaviours) and 2-18 (CI95= 0.220 – 0.515 behaviours) months of age. The foster
mother genotype by age interaction occurred because at both 2 and 12 months of age

162
mice reared by B6129SF2 mice exhibited more affiliative behaviours than mice reared by
3xTg-AD mice (CI95= 0.005 – 0.344 behaviours, and CI95= 0.114 – 0.472 behaviours,
respectively).
For the number of agonistic behaviours the best model had time point, pup
genotype, foster mother genotype, sex, age, a time point by foster mother genotype
interaction, a foster mother genotype by age interaction, and a pup genotype by sex by
age interaction, which was significantly different from the null model (AICc=971.4635;
χ2(23, N= 768)= 78.033, p < 0.001; Figure 5.1 F-H). Confidence intervals provided little
evidence of a main effect of time point, genotype (CI95= -0.150 –0.178), or foster mother
genotype (CI95= -0.122 – 0.005 behaviours). Males exhibited more agonistic behaviour
than females (CI95=.0497 – 0.374 behaviours), and mice exhibited more agnostic
behaviours at six months than at any other age (6-2: CI95= 0.130 – 0.444, 6-12: CI95=
0.069 – 0.393, 6-18: CI95= 0.034 – 0.368 behaviours). The time point by foster mother
genotype interaction occurred because only at the first time point mice reared by
B6129SF2 mothers exhibited more agonistic behaviours than mice reared by 3xTg-AD
mothers (CI95= 0.005 – 0.292 behaviours). The foster mother genotype by age interaction
occurred because at 2 and 12 months only the mice reared by B6129SF2 mothers
exhibited fewer agonistic behaviours than mice reared by 3xTg-AD mothers (2: CI95= -
0.293 – -0.062, 12: CI95= -0.271 – -0.034 behaviours).
The best model for non-social behaviours had time point, pup genotype, foster
mother genotype, sex, age, a time point by sex by age interaction, and a pup genotype by
foster mother genotype by sex interaction, and was significantly different from the null
model (AICc = 2321.035; χ2(39, N= 768)= 128.37, p > 0.001); Figure 5.1 I-L). There
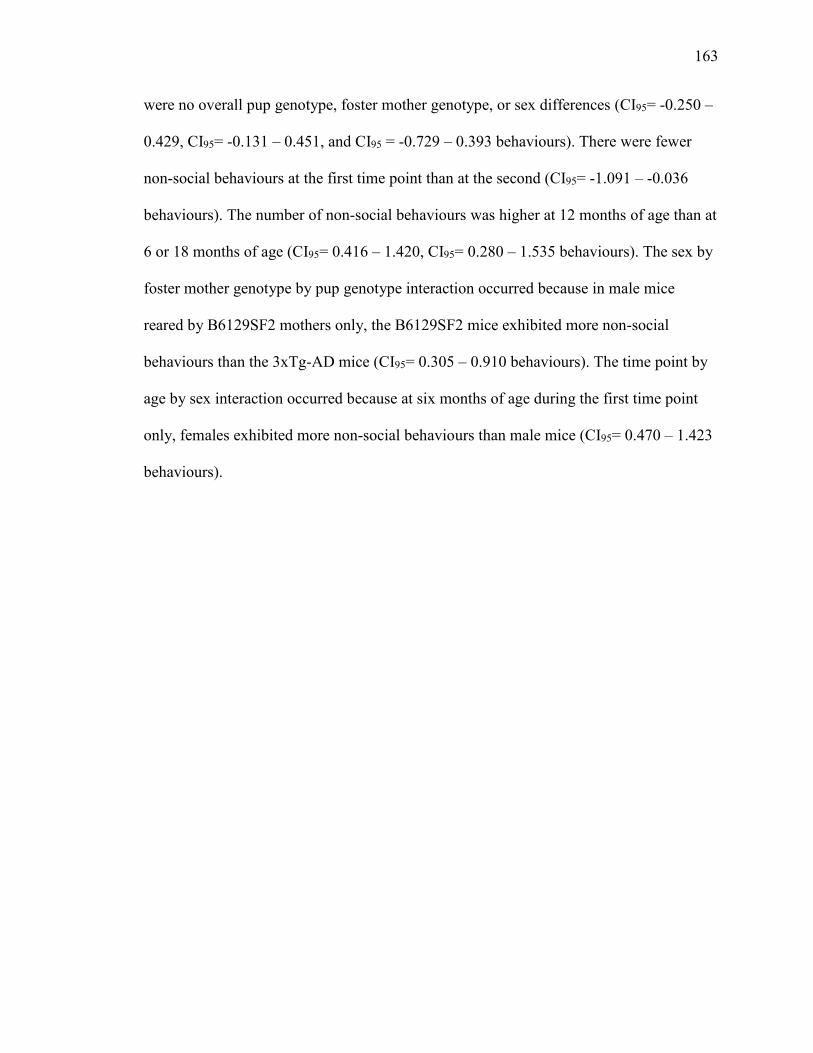
163
were no overall pup genotype, foster mother genotype, or sex differences (CI95= -0.250 –
0.429, CI95= -0.131 – 0.451, and CI95 = -0.729 – 0.393 behaviours). There were fewer
non-social behaviours at the first time point than at the second (CI95= -1.091 – -0.036
behaviours). The number of non-social behaviours was higher at 12 months of age than at
6 or 18 months of age (CI95= 0.416 – 1.420, CI95= 0.280 – 1.535 behaviours). The sex by
foster mother genotype by pup genotype interaction occurred because in male mice
reared by B6129SF2 mothers only, the B6129SF2 mice exhibited more non-social
behaviours than the 3xTg-AD mice (CI95= 0.305 – 0.910 behaviours). The time point by
age by sex interaction occurred because at six months of age during the first time point
only, females exhibited more non-social behaviours than male mice (CI95= 0.470 – 1.423
behaviours).
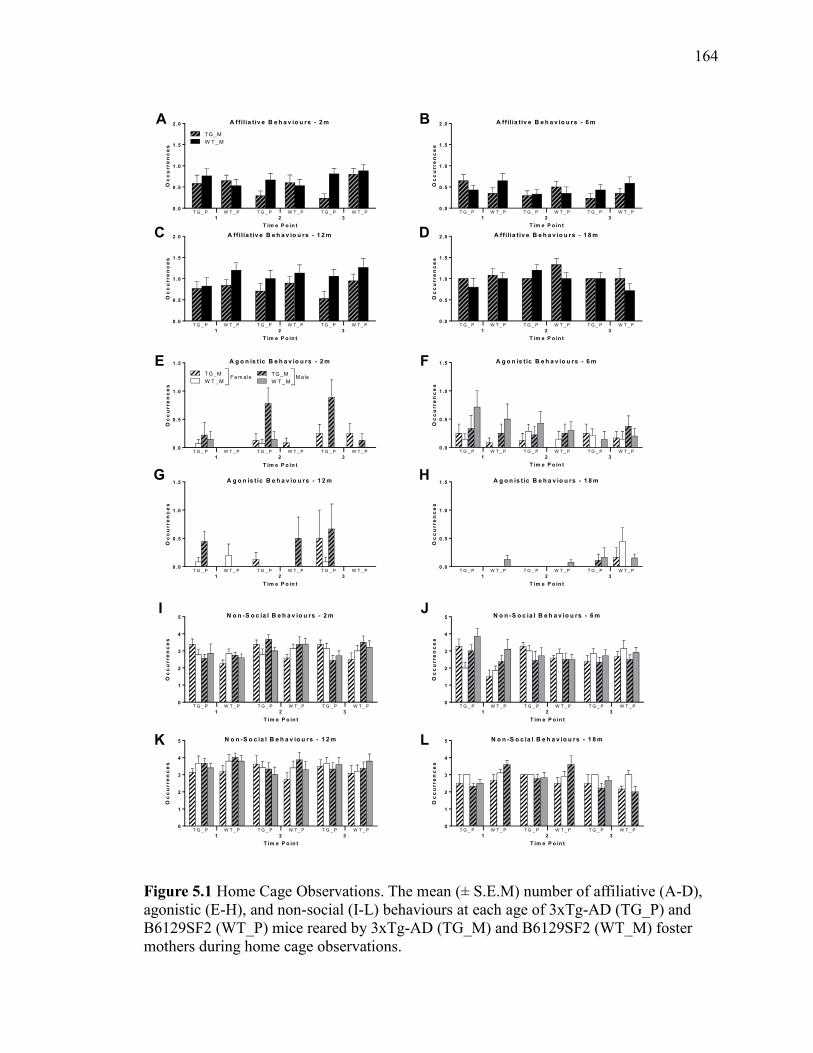
164
1 2 3
0 .0
0 .5
1 .0
1 .5
2 .0 A ffil ia t iv e B e h a v io u rs - 2 m
T im e P o in t
Oc
cu
rre
nc
es
TG _M
W T _ M
T G _ P W T _ P T G _ P W T _ P T G _ P W T _ P
1 2 3
0 .0
0 .5
1 .0
1 .5
2 .0 A ffil ia t iv e B e h a v io u rs - 6 m
T im e P o in t
Oc
cu
rre
nc
es
T G _ P W T _ P T G _ P W T _ P T G _ P W T _ P
1 2 3
0 .0
0 .5
1 .0
1 .5
2 .0 A ffilia t iv e B e h a v io u rs - 1 2 m
T im e P o in t
Oc
cu
rre
nc
es
T G _ P W T _ P T G _ P W T _ P T G _ P W T _ P
1 2 3
0 .0
0 .5
1 .0
1 .5
2 .0 A ffilia t iv e B e h a v io u rs - 1 8 m
T im e P o in t
Oc
cu
rre
nc
es
T G _ P W T _ P T G _ P W T _ P T G _ P W T _ P
1 2 3
0 .0
0 .5
1 .0
1 .5 A g o n is t ic B e h a v io u rs - 2 m
T im e P o in t
Oc
cu
rre
nc
es
TG _M
W T _ M
TG _M
W T _ MF e m a le M ale
T G _ P W T _ P T G _ P W T _ P T G _ P W T _ P
1 2 3
0 .0
0 .5
1 .0
1 .5 A g o n is t ic B e h a v io u rs - 6 m
T im e P o in t
Oc
cu
rre
nc
es
T G _ P W T _ P T G _ P W T _ P T G _ P W T _ P
1 2 3
0 .0
0 .5
1 .0
1 .5 A g o n is t ic B e h a v io u rs - 1 2 m
T im e P o in t
Oc
cu
rre
nc
es
T G _ P W T _ P T G _ P W T _ P T G _ P W T _ P
1 2 3
0 .0
0 .5
1 .0
1 .5 A g o n is t ic B e h a v io u rs - 1 8 m
T im e P o in t
Oc
cu
rre
nc
es
T G _ P W T _ P T G _ P W T _ P T G _ P W T _ P
1 2 3
0
1
2
3
4
5 N o n -S o c ia l B e h a v io u rs - 2 m
T im e P o in t
Oc
cu
rre
nc
es
T G _ P W T _ P T G _ P W T _ P T G _ P W T _ P
1 2 3
0
1
2
3
4
5 N o n -S o c ia l B e h a v io u rs - 6 m
T im e P o in t
Oc
cu
rre
nc
es
T G _ P W T _ P T G _ P W T _ P T G _ P W T _ P
1 2 3
0
1
2
3
4
5 N o n -S o c ia l B e h a v io u rs - 1 2 m
T im e P o in t
Oc
cu
rre
nc
es
T G _ P W T _ P T G _ P W T _ P T G _ P W T _ P
1 2 3
0
1
2
3
4
5 N o n -S o c ia l B e h a v io u rs - 1 8 m
T im e P o in t
Oc
cu
rre
nc
es
T G _ P W T _ P T G _ P W T _ P T G _ P W T _ P
A B
C D
E F
G H
I J
K L
Figure 5.1 Home Cage Observations. The mean (± S.E.M) number of affiliative (A-D),
agonistic (E-H), and non-social (I-L) behaviours at each age of 3xTg-AD (TG_P) and
B6129SF2 (WT_P) mice reared by 3xTg-AD (TG_M) and B6129SF2 (WT_M) foster
mothers during home cage observations.
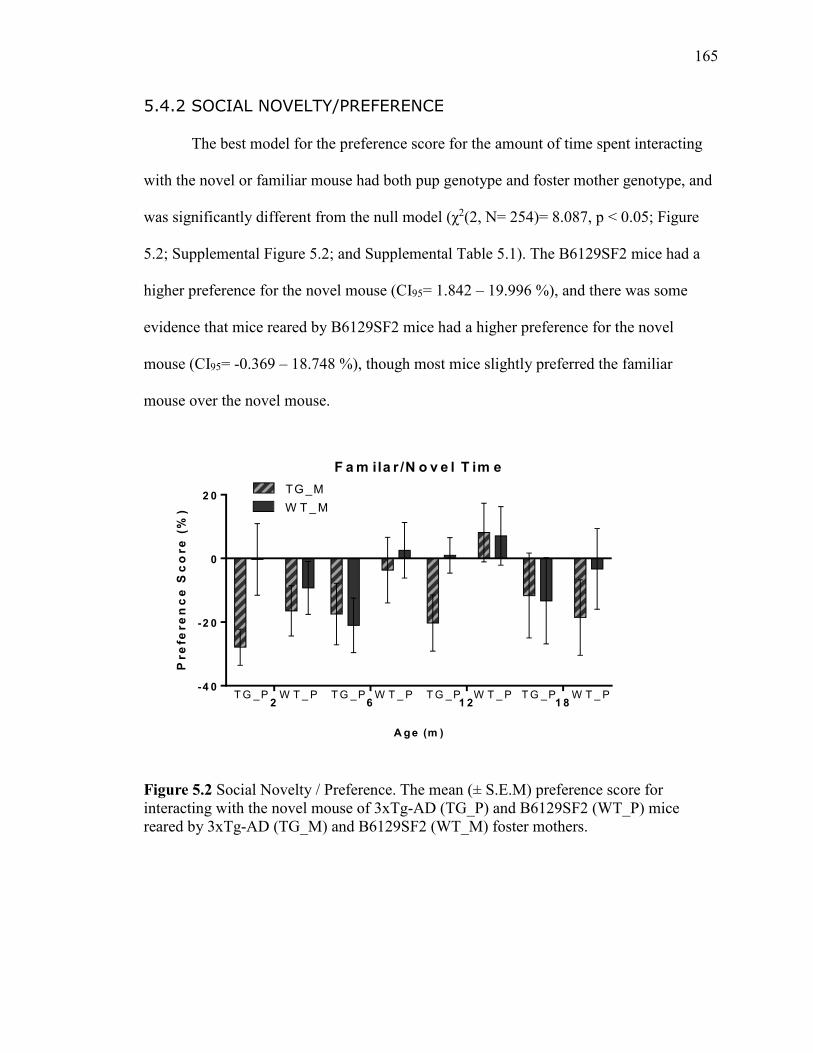
165
5.4.2 SOCIAL NOVELTY/PREFERENCE
The best model for the preference score for the amount of time spent interacting
with the novel or familiar mouse had both pup genotype and foster mother genotype, and
was significantly different from the null model (χ2(2, N= 254)= 8.087, p < 0.05; Figure
5.2; Supplemental Figure 5.2; and Supplemental Table 5.1). The B6129SF2 mice had a
higher preference for the novel mouse (CI95= 1.842 – 19.996 %), and there was some
evidence that mice reared by B6129SF2 mice had a higher preference for the novel
mouse (CI95= -0.369 – 18.748 %), though most mice slightly preferred the familiar
mouse over the novel mouse.
2 6 1 2 1 8
-4 0
-2 0
0
2 0
F a m ila r /N o v e l T im e
A ge (m )
Pre
fere
nc
e S
co
re
(%
)
TG _M
W T _ M
T G _P W T _ P T G _P W T _ P T G _P W T _ P T G _P W T _ P
Figure 5.2 Social Novelty / Preference. The mean (± S.E.M) preference score for
interacting with the novel mouse of 3xTg-AD (TG_P) and B6129SF2 (WT_P) mice
reared by 3xTg-AD (TG_M) and B6129SF2 (WT_M) foster mothers.

166
5.4.3 TUBE TEST OF SOCIAL DOMINANCE
At 2 months of age there was no significant difference between the number of
wins between genotypes (χ2(1, N= 76)= 0.819, p > 0.05), and at 6 months of age each
genotype had the same number of wins (Figure 5.3). At 12 months of age the B6129SF2
mice won significantly more often than the 3xTg-AD mice (χ2(1, N= 62)= 4.129, p <
0.05), but at 18 months of age there was again no difference between the genotypes
(χ2(1, N= 35)= 0.714, p < 0.05, Figure 5.3).
T G _ P W T _ P T G _ P W T _ P T G _ P W T _ P T G _ P W T _ P
0
1 0
2 0
3 0
4 0
5 0T u b e T e s t
A ge (m )
Nu
mb
er o
f W
ins
2 6 12 18
F ig u re 3
TG _P
W T _ P*
Figure 5.3 Tube Test of Social Dominance. The number of wins of 3xTg-AD (TG_P) and
B6129SF2 (WT_P) mice at each age. * = p < 0.05.
5.4.5 CORRELATIONS OF NEUROPATHOLOGY AND BEHAVIOUR
We correlated behavioural measures at 18 months of age with a genotype
difference with levels of amyloid beta staining in the cortex, hippocampus, and
amygdala, and tau staining in the hippocampus and amygdala at 19 months of age (Table
5.2). The only significant correlation was a negative correlation between the level of
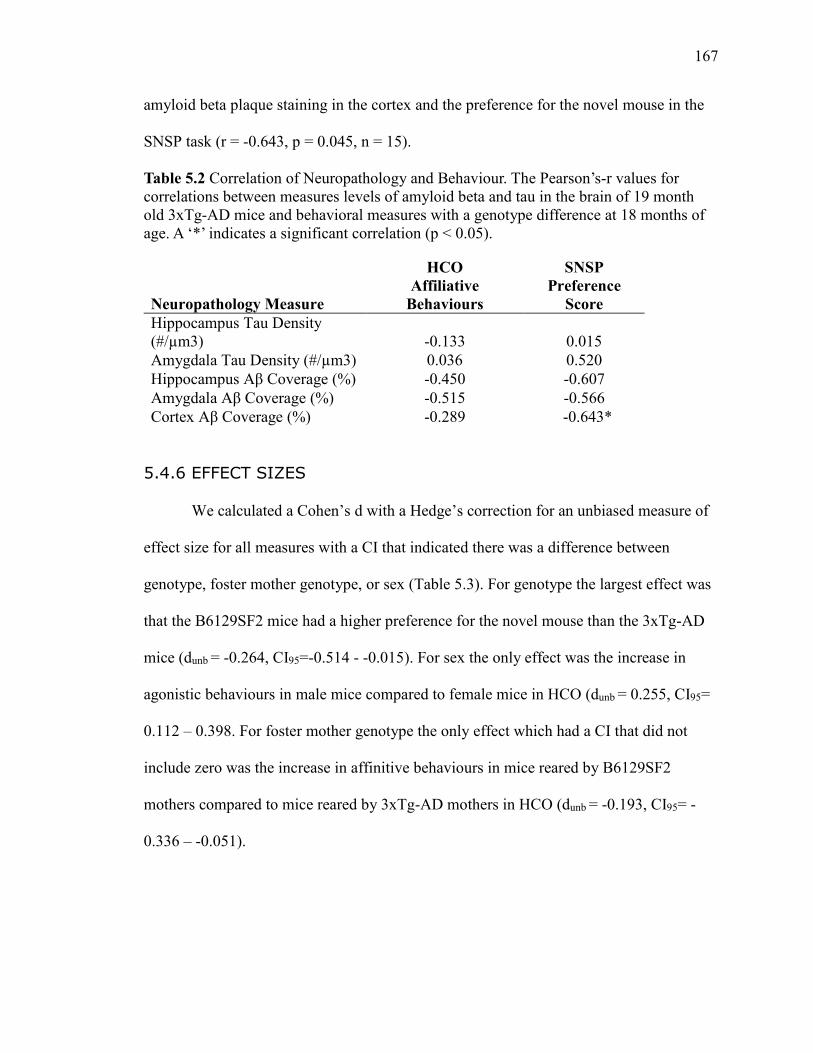
167
amyloid beta plaque staining in the cortex and the preference for the novel mouse in the
SNSP task (r = -0.643, p = 0.045, n = 15).
Table 5.2 Correlation of Neuropathology and Behaviour. The Pearson’s-r values for
correlations between measures levels of amyloid beta and tau in the brain of 19 month
old 3xTg-AD mice and behavioral measures with a genotype difference at 18 months of
age. A ‘*’ indicates a significant correlation (p < 0.05).
HCO SNSP
Neuropathology Measure
Affiliative
Behaviours
Preference
Score
Hippocampus Tau Density
(#/µm3) -0.133 0.015
Amygdala Tau Density (#/µm3) 0.036 0.520
Hippocampus Aβ Coverage (%) -0.450 -0.607
Amygdala Aβ Coverage (%) -0.515 -0.566
Cortex Aβ Coverage (%) -0.289 -0.643*
5.4.6 EFFECT SIZES
We calculated a Cohen’s d with a Hedge’s correction for an unbiased measure of
effect size for all measures with a CI that indicated there was a difference between
genotype, foster mother genotype, or sex (Table 5.3). For genotype the largest effect was
that the B6129SF2 mice had a higher preference for the novel mouse than the 3xTg-AD
mice (dunb = -0.264, CI95=-0.514 - -0.015). For sex the only effect was the increase in
agonistic behaviours in male mice compared to female mice in HCO (dunb = 0.255, CI95=
0.112 – 0.398. For foster mother genotype the only effect which had a CI that did not
include zero was the increase in affinitive behaviours in mice reared by B6129SF2
mothers compared to mice reared by 3xTg-AD mothers in HCO (dunb = -0.193, CI95= -
0.336 – -0.051).
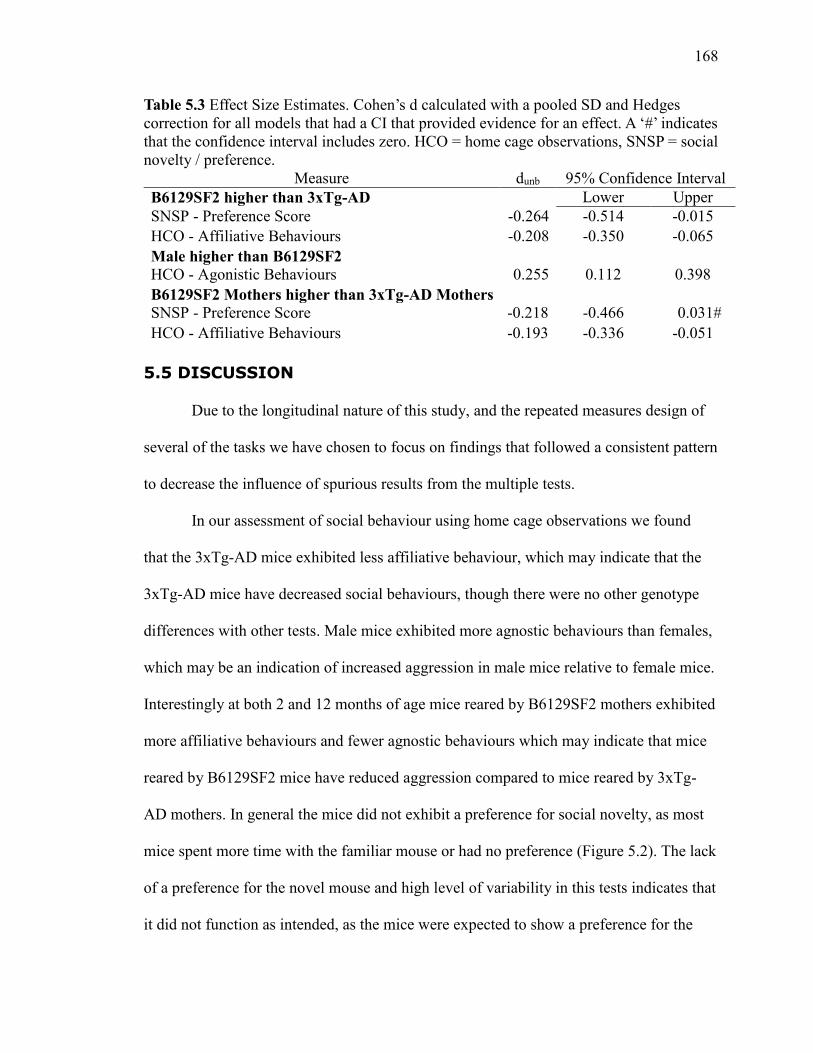
168
Table 5.3 Effect Size Estimates. Cohen’s d calculated with a pooled SD and Hedges
correction for all models that had a CI that provided evidence for an effect. A ‘#’ indicates
that the confidence interval includes zero. HCO = home cage observations, SNSP = social
novelty / preference.
Measure dunb 95% Confidence Interval
B6129SF2 higher than 3xTg-AD Lower Upper
SNSP - Preference Score -0.264 -0.514 -0.015
HCO - Affiliative Behaviours -0.208 -0.350 -0.065
Male higher than B6129SF2
HCO - Agonistic Behaviours 0.255 0.112 0.398
B6129SF2 Mothers higher than 3xTg-AD Mothers
SNSP - Preference Score -0.218 -0.466 0.031#
HCO - Affiliative Behaviours -0.193 -0.336 -0.051
5.5 DISCUSSION
Due to the longitudinal nature of this study, and the repeated measures design of
several of the tasks we have chosen to focus on findings that followed a consistent pattern
to decrease the influence of spurious results from the multiple tests.
In our assessment of social behaviour using home cage observations we found
that the 3xTg-AD mice exhibited less affiliative behaviour, which may indicate that the
3xTg-AD mice have decreased social behaviours, though there were no other genotype
differences with other tests. Male mice exhibited more agnostic behaviours than females,
which may be an indication of increased aggression in male mice relative to female mice.
Interestingly at both 2 and 12 months of age mice reared by B6129SF2 mothers exhibited
more affiliative behaviours and fewer agnostic behaviours which may indicate that mice
reared by B6129SF2 mice have reduced aggression compared to mice reared by 3xTg-
AD mothers. In general the mice did not exhibit a preference for social novelty, as most
mice spent more time with the familiar mouse or had no preference (Figure 5.2). The lack
of a preference for the novel mouse and high level of variability in this tests indicates that
it did not function as intended, as the mice were expected to show a preference for the

169
novel mouse (Moy et al., 2004). One possible confound in our study of home cage
behaviour is the number of mice in each cage, which varied from 2 to 4. Mice who were
housed with more cage mates have more opportunity for social interactions (both
affiliative and agonistic), which could influence the results. In the tube test of social
dominance we found no consistent genotype difference. Male mice were more aggressive
than female mice, and there was some evidence that the 3xTg-AD mice have decreased
social behaviour relative to B6129SF2 controls. Social withdrawal is a common symptom
in early AD (Jost and Grossberg, 1996; Förstl and Kurz, 1999), and the decreased social
behaviour of the 3xTg-AD relative to B6129SF2 controls may be a manifestation of this
symptom in mice.
We found a negative correlation between the level of amyloid beta plaque staining
in the cortex and the preference for the novel mouse in the SNSP task, though that task
did not work as intended so interpreting the correlation result is difficult. The correlation
may be a spurious effect due to the number of correlations we calculated.
Overall male mice were more aggressive than female mice, and there was some
evidence that the 3xTg-AD mice have decreased social behaviour relative to B6129SF2
controls. There was no consistent change in social behaviour with age. There was some
indication that mice reared by B6129SF2 mice had reduced aggression compared to mice
reared by 3xTg-AD mothers in home cage observations. Interestingly neither the 3xTg-
AD nor the B6129SF2 mice exhibited a preference for social novelty, which indicates
that this is not an appropriate test to assess social behaviour in this strain. The 3xTg-AD
do not appear to have a pronounced difference in social behaviour compared to the
B6129SF2 mice.

170
5.6 ACKNOWLEDGEMENTS
This research was funded by an NSERC grant to REB. The authors would like to
thank Rhian Gunn and Daniel Ikpi for their assistance in this project.
171
5.7 REFERENCES
Blaney CE, Gunn RK, Stover KR, Brown RE (2013) Maternal genotype influences
behavioral development of 3xTg-AD mouse pups. Behav Brain Res 252:40–48.
Champagne FA, Curley JP (2009) Epigenetic mechanisms mediating the long-term
effects of maternal care on development. Neurosci Biobehav Rev 33:593–600.
D’Andrea I, Alleva E, Branchi I (2007) Communal nesting, an early social enrichment,
affects social competences but not learning and memory abilities at adulthood.
Behav Brain Res 183:60–66.
Devanand DP, Sano M, Tang M-X, Taylor S, Gurland BJ, Wilder D, Stern Y, Mayeux R
(1996) Depressed Mood and the Incidence of Alzheimer’s Disease in the Elderly
Living in the Community. Arch Gen Psychiatry 53:175–182.
Ferretti L, McCurry SM, Logsdon R, Gibbons L, Teri L (2001) Anxiety and Alzheimer’s
disease. J Geriatr Psychiatry Neurol 14:52–58.
Filali M, Lalonde R, Rivest S (2011) Anomalies in social behaviors and exploratory
activities in an APPswe/PS1 mouse model of Alzheimer’s disease. Physiol Behav
104:880–885.
Flanigan TJ, Xue Y, Rao SK, Dhanushkodi A, McDonald MP (2014) Abnormal vibrissa-
related behavior and loss of barrel field inhibitory neurons in 5xFAD transgenics.
Genes, Brain Behav 13:488–500.
Förstl H, Kurz a (1999) Clinical features of Alzheimer’s disease. Eur Arch Psychiatry
Clin Neurosci 249:288–290.
Grant E, Mackintosh J (1963) A comparison of the social postures of some common
laboratory rodents. Behaviour 21:246–259.
Jost BC, Grossberg GT (1996) The evolution of psychiatric symptoms in Alzheimer’s
disease: a natural history study. J Am Geriatr Soc 44:1078–1081.
Koh H-Y, Kim D, Lee J, Lee S, Shin H-S (2008) Deficits in social behavior and
sensorimotor gating in mice lacking phospholipase Cbeta1. Genes Brain Behav
7:120–128.
Landes AM, Sperry SD, Strauss ME, Geldmacher DS (2001) Apathy in Alzheimer’s
disease. J Am Geriatr Soc 49:1700–1707.
Lijam N, Paylor R, McDonald MP, Crawley JN, Deng CX, Herrup K, Stevens KE,
Maccaferri G, McBain CJ, Sussman DJ, Wynshaw-Boris a (1997) Social interaction
and sensorimotor gating abnormalities in mice lacking Dvl1. Cell 90:895–905.

172
Medeiros R, Kitazawa M, Caccamo A, Baglietto-Vargas D, Estrada-Hernandez T, Cribbs
DH, Fisher A, Laferla FM (2011) Loss of muscarinic M1 receptor exacerbates
Alzheimer’s disease-like pathology and cognitive decline. Am J Pathol 179:980–
991.
Moy S, Nadler J, Perez A, Barbaro R, Johns J, Magnuson T, Piven J, Crawley J (2004)
Sociability and preference for social novelty in five inbred strains: an approach to
assess autistic-like behavior in mice. Genes, Brain Behav 3:287–302.
Oddo S, Caccamo A, Shepherd JD, Murphy MP, Golde TE, Kayed R, Metherate R,
Mattson MP, Akbari Y, LaFerla FM (2003) Triple-transgenic model of Alzheimer’s
Disease with plaques and tangles: Intracellular Aβ and synaptic dysfunction. Neuron
39:409–421.
Pearson BL, Defensor EB, Blanchard DC, Blanchard RJ (2010) C57BL/6J mice fail to
exhibit preference for social novelty in the three-chamber apparatus. Behav Brain
Res 213:189–194.
Priebe K, Brake WG, Romeo RD, Sisti HM, Mueller A, McEwen BS, Francis DD, Sisti
HM, Mueller A, McEwen BS, Brake WG (2005) Maternal influences on adult stress
and anxiety-like behavior in C57BL/6J and BALB/CJ mice: A cross-fostering study.
Dev Psychobiol 47:398–407.
Stover KR, Hicks ME, Gordon KM, Ikpi D, Brown RE (2015a) Learning and memory in
the 3xTg-AD mouse model of Alzheimer’s disease at 2, 6, 12, and 18 months of age.
Unpublished.
Stover KR, Hicks ME, Gordon KM, Ikpi D, Brown RE (2015b) Age-related changes in
acoustic startle and prepulse inhibition in the 3xTg-AD mouse model of Alzheimer’s
disease: A longitudinal study. Unpublished.
Stover KR, Hicks ME, Gordon KM, Ikpi D, Darvesh S, Brown RE (2015c) Age-related
changes in motor behaviour and anxiety in the 3xTg-AD mouse model of
Alzheimer’s disease: A longitudinal study. Unpublished.
Szyf M, Weaver I, Meaney M (2007) Maternal care, the epigenome and phenotypic
differences in behavior. Reprod Toxicol 24:9–19.
Teri L, Ferretti LE, Gibbons LE, Logsdon RG, McCurry SM, Kukull WA, McCormick
WC, Bowen JD, Larson EB (1999) Anxiety of Alzheimer’s disease: prevalence, and
comorbidity. J Gerontol A Biol Sci Med Sci 54:M348–M352.

173
5.8 SUPPLEMENTAL TABLE
Supplemental Table 5.1 provides the statistics used to determine the best model
for each measure. The top five models are included. The model column describes the
factors included in the model, terms separated by a ‘*’ that there were main effects and
interactions for the terms, those separated by a ‘+’ are simple main effects, and those
separated by a ‘:’ indicate an interaction alone. The ‘AICc’ column contains the second
order Akaike information criterion, which is a measure used to evaluate the models based
on the complexity and goodness of fit of the model to the data, with lower values being
better. The “∆ AICc” column is difference between that model’s AICc and the model
with the lowest AICc. The ‘Wt’ column is the Akaike weight, a measure of relative
likelihood that the model is the best, ranging from 0, meaning unlikely, to 1, meaning
likely. The ‘ER’ column is the evidence ratio, it is the likelihood that the model with the
lowest AICc is better than that model.
Supplemental Table 5.1 SNSP Preference Score
Model AICc ∆ AICc AICcWt ER
Genotype+FMGenotype 236.857 0 0.064 1
Genotype+FMGenotype*Sex 237.686 0.822 0.042 1.514
Genotype+FMGenotype+Sex 237.853 0.996 0.039 1.646
Genotype*FMGenotype*Sex 238.249 1.391 0.032 2.01
Genotype*FMGenotype 238.404 1.547 0.029 2.168

174
5.9 SUPPLEMENTAL FIGURES
1 2 3
0 .0
0 .5
1 .0
1 .5 A ffil ia t iv e B e h a v io u rs - 2 m
T im e P o in t
Oc
cu
rre
nc
es
TG _M
W T _ M
TG _M
W T _ MF e m a le M ale
T G _ P W T _ P T G _ P W T _ P T G _ P W T _ P
1 2 3
0 .0
0 .5
1 .0
1 .5 A ffil ia t iv e B e h a v io u rs - 6 m
T im e P o in t
Oc
cu
rre
nc
es
T G _ P W T _ P T G _ P W T _ P T G _ P W T _ P
1 2 3
0 .0
0 .5
1 .0
1 .5
2 .0 A ffilia t iv e B e h a v io u rs - 1 2 m
T im e P o in t
Oc
cu
rre
nc
es
T G _ P W T _ P T G _ P W T _ P T G _ P W T _ P
1 2 3
0 .0
0 .5
1 .0
1 .5
2 .0
2 .5 A ffilia t iv e B e h a v io u rs - 1 8 m
T im e P o in t
Oc
cu
rre
nc
es
T G _ P W T _ P T G _ P W T _ P T G _ P W T _ P
A B
C D
Supplemental Figure 5.1 Home Cage Observations. The mean (± S.E.M) number of
affiliative behaviours at 2 (A), 6 (B), 12 (C), and 18 (D) months of age in 3xTg-AD
(TG_P) and B6129SF2 (WT_P) mice reared by 3xTg-AD (TG_M) and B6129SF2
(WT_M) foster mothers during home cage observations.
2 6 1 2 1 8
-1 .0
-0 .5
0 .0
0 .5 F a m ila r /N o v e l T im e
A g e (m )
Pre
fere
nc
e S
co
re
TG _M
W T _ M
TG _M
W T _ M
W T _ P T G _ PT G _ P W T _ P T G _ P W T _ P T G _ P W T _ P
F e m a le M ale
Supplemental Figure 5.2 Social Novelty / Preference. The mean (± S.E.M) preference
score for interacting with the novel mouse of 3xTg-AD (TG_P) and B6129SF2 (WT_P)
mice reared by 3xTg-AD (TG_M) and B6129SF2 (WT_M) foster mothers at each age.
175
CHAPTER 6 ANALYSIS OF MOTOR FUNCTION IN 6 MONTH
OLD MALE AND FEMALE 3XTG-AD MICE
Kurt R. Stover, Mackenzie A. Campbell, Christine M. Van Winssen, and Richard E.
Brown
Department of Psychology and Neuroscience
Dalhousie University
PO Box 1500, Halifax, NS
Canada B3H 4R2
Published in Behavioural Brain Research, 2015, Volume 281, Pages 16–23
176
6.1 ABSTRACT
The 3xTg-AD mouse has high validity as a model of Alzheimer’s disease (AD)
because it develops both amyloid beta plaques and neurofibrillary tangles. Human
patients with AD typically develop motor deficits, which worsen as the disease
progresses, but 3xTg-AD mice have been reported to show enhanced motor abilities. We
investigated the motor behaviour phenotype of male and female 3xTg-AD and B6129SF2
wildtype mice on a battery of motor behaviours at 6 months of age. Compared to
wildtype mice, the 3xTg-AD mice had enhanced motor performance on the Rotarod, but
worse performance on the grid suspension task. In gait analysis 3xTg-AD mice had a
longer stride length and made more foot slips on the balance beam than wildtype mice.
There was no overall difference in voluntary wheel-running activity between genotypes,
but there was a disruption in circadian activity rhythm in 3xTg-AD mice. In some motor
tasks, such as the Rotarod and balance beam, females appeared to perform better than
males, but this sex differences was accounted for by differences in body weight. Our
results indicate that while the 3xTg-AD mice show enhanced performance on the
Rotarod, they have poorer performance on other motor behaviour tasks, indicating that
their motor behaviour phenotype is more complex than previously reported. The
presence of the P301L transgene may explain the enhancement of Rotarod performance
but the poorer performance on other motor behaviour tasks may be due to other
transgenes.

177
6.2 INTRODUCTION
The 3xTg-AD mouse is one of many mouse models of Alzheimer’s disease (AD)
(Chin, 2011; LaFerla and Green, 2012; Webster et al., 2014). It has been rated as having
the highest face and construct validly among mouse models by Bilkei-Gorzo (2014)
because it harbours three transgenes: a human amyloid precursor protein associated with
familiar AD (APPswe); a mouse Presenilin1 (PS1) gene carrying a human mutation also
associated with familiar AD (PS1M146V); and a human gene associated with tau pathology
(TauP301L). The 3xTg-AD mouse was created by adding the tau and APP mutations to a
mouse with the PS1M146V mutation (Oddo et al., 2003). This combination of
transgenes produces a strain that develops both amyloid beta (Aβ) plaques and tau
tangles, the classic hallmarks of human AD neuropathology (Oddo et al., 2003; Billings
et al., 2005; Mastrangelo and Bowers, 2008). The 3xTg-AD mouse develops
neuropathology as a result of its transgenes, beginning with abnormal myelination in the
Schaffer collateral fibers at two months of age (Desai et al., 2009), followed by
intracellular Aβ in the neocortex at three months of age and in the hippocampus between
three and six months of age. Extracellular plaques develop in the neocortex by six months
of age (Billings et al., 2005; Mastrangelo and Bowers, 2008). Tau pathology develops
later than Aβ pathology in 3xTg-AD mice, with the first phosphorylated tau, which is
associated with neurofibrillary tangles, detectable in the hippocampus by six months of
age and spreading to the motor cortex by nine months of age (Mastrangelo and Bowers,
2008).
Alzheimer’s disease in humans begins with memory deficits, which are followed
by deficits in language, vision, and motor function (McKhann et al., 1984; Carrillo et al.,
178
2013). The motor deficits in AD manifest early in the progression of the disease as mild
problems as complex motor control and fine motor skills, which progress to problems
with gross motor functioning (Kluger et al., 1997; Pettersson et al., 2005). Motor learning
appears to remain intact in AD patients (Eslinger and Damasio, 1986; Dick et al., 1995).
There are, however, indications that impairments in motor function may be a common
feature of pre-clinical AD and that age-related decline may occur in both motor and
cognitive behaviour in AD patients (Buchman and Bennett, 2011; Albers et al., 2014).
Because there are a wide range of motor behaviours that can be measured including
balance, motor coordination, strength, and gait, a battery of tests is required to accurately
assess age-related changes in motor function in Alzheimer’s and non-Alzheimer’s
patients (Reuben et al., 2013; Gras et al., 2014). Similarly, motor behaviour test batteries
are available for mice (Brooks and Dunnett, 2009; Justice et al., 2014), and we have used
such a test battery to assess motor function in 3xTg-AD mice at six months of age, a time
when they begin to show the onset of AD-like symptoms (Billings et al., 2007; Clinton et
al., 2007; Blanchard et al., 2010; España et al., 2010; Chen et al., 2013).
Previous results from our lab found that 3xTg-AD mice had improved
performance on the Rotarod compared to wildtype mice beginning at two months of age
and continuing until at least fifteen months of age (Oore et al., 2013), and results from a
neurodevelopmental test battery demonstrated that newborn 3xTg-AD mice reach
physical milestones earlier than wildtype mice (Blaney et al., 2013). Other researchers
have also found that the 3xTg-AD mice show improved motor functioning compared to
control mice on the Rotarod (Blanchard et al., 2010; Filali et al., 2012; Chen et al., 2013).
However, Sterniczuk et al. (2010a) found no difference between 3xTg-AD and C57BL/6J
179
control mice on Rotarod performance, and neither Sterniczuk et al. (2010a) nor Arsenault
et al. (2011) found any deficits in 3xTg-AD mice on the wire hang task. The 3xTg-AD
mice performed more voluntary wheel-running than wildtype control mice over a one
month period (García-Mesa et al., 2011), and, although Sterniczuk et al. (2010b) found
no difference in total amount of wheel running between 3xTg-AD and C57BL/6J mice,
they did find that the 3xTg-AD mice had disrupted circadian running rhythms compared
to C57BL/6J mice.
Because motor behaviour can include activity level, gait, strength, balance,
coordination, and endurance (Justice et al., 2014), we used a battery of tests to
characterize the motor behaviour phenotype of 3xTg-AD mice compared to B6129SF2
wildtype controls at six months of age. Grip strength was examined using the wire hang
and grid suspension tasks, motor coordination and motor learning using the Rotarod,
balance using the balance beam, and spontaneous activity using a running wheel in the
home cage. We hypothesized that the 3xTg-AD mice would have enhanced performance
on the Rotarod relative to wildtype mice, and that this difference would be associated
with enhanced performance on other motor behaviour tasks.
6.3 METHODS
6.3.1 ANIMALS
Eighty-five mice, forty-two 3xTg-AD (21 male and 21 female) and forty-three
B6129SF2 (22 male and 21 female), were tested at six months of age in three cohorts of
approximately 28 mice each. The mice were bred at Dalhousie University from parents
purchased from the Jackson Laboratory in Bar Harbor, Maine (Stock #'s 004807 &
101045). After weaning at 21 days of age the mice were housed in same sex groups of 2
180
to 4 littermates in plastic cages (18.75 x 28 x 12.5 cm), with a PVC tube (4 cm diameter x
7 cm length) for enrichment, wood chips for bedding, and metal wire covers. The mice
were fed rodent chow (Purina #5001) and tap water ad libitum and they were housed in a
colony room at 22±2ºc on a reversed 12:12 light:dark cycle with lights off at 10:00 am.
The tests were performed during the dark phase of the light:dark cycle (10:00-22:00) in
the order described. The mice were genotyped by Dr. Chris Sinal (Pharmacology
Department, Dalhousie University) using polymerase chain reaction of an ear punch
tissue sample which was taken when the mice were ear-punched for identification at
weaning. This experiment was approved by the Dalhousie University Committee on
Laboratory Animals.
6.3.2 BODY WEIGHT
Each day before testing on the Rotarod the mice were weighed using an OHAUS
CS 200 scale (Parsippany, NJ). Body weight was analyzed separately and used as a factor
for the analysis of performance in other tasks.
6.3.3 ROTAROD
To assess motor coordination and motor learning as well as endurance, mice were
trained for five days on the accelerating Rotarod (Accuscan Instruments, Columbus,
Ohio), as described by Brown and Wong (2007). The apparatus consisted of a PVC
rotating rod (3cm diameter) with four opaque Plexiglas barriers (15cm diameter)
dividing the rod into four 11cm sections which had individual holding chambers located
39cm below the rod. The Rotarod was housed in a small room which was illuminated
with a 60w red light bulb. Mice were placed on the rod facing away from the
experimenter and the rod began to accelerate from 0-48rpm over 360 seconds. After the

181
last mouse fell from the rod, or if 360 seconds elapsed, the mice were given a one minute
rest and then placed back on the rod for the next trial. Mice were trained for six trials per
day for five days and the mean latency to fall over the six trials each day was analyzed.
3.3.4 GRIP STRENGTH
Grip strength was assessed using two tasks. In the wire hang task, mice were
suspended by their forepaws from a wire 26 cm above a padded cushion and the latency
to fall was recorded (to a maximum of 60 seconds). In the grid suspension task, mice
were placed on a wire grid (15 by 20 cm) which was inverted 26 cm above a padded
cushion and the latency to fall (up to a maximum of 60 seconds) was recorded
(Sterniczuk et al., 2010a). Mice were tested on three consecutive trials for each test with
an inter-trial interval of approximately 20 minutes, and the mean latency to fall over the
three trials was used for analysis.
6.3.5 GAIT ANALYSIS
Mice were trained to walk down a narrow corridor for a food reward and, once
trained, their hind paws were marked with paint (non-toxic liquid tempera, Schola,
Marieville, Quebec, Canada), and they were placed in the corridor for a single trial with
the floor covered by a paper sheet (21cm wide by 55cm long). Mean stride length and
width from four to sixteen footsteps were analyzed by measuring the distance between
paw prints on the paper using ImageJ (http://imagej.nih.gov/ij/) (Fleming et al., 2004).
6.3.6 BALANCE BEAM
To assess balance and motor coordination, the mice were placed on a balance
beam (100cm by 2cm, elevated 40cm) for a single trial lasting a maximum of two

182
minutes and the distance travelled, number of foot slips, number of turns, and latency to
fall (if applicable) were recorded and analyzed (Carter et al., 1999).
6.3.7 VOLUNTARY WHEEL-RUNNING
In order to assess activity levels mice were housed individually in the colony
room for seven days in a cage with a running wheel (15.5cm diameter) using the
procedure described by Wright and Brown (2002). The number and timing of the
rotations was recorded automatically by hardware and software developed in our
laboratory. The number of rotations and percentage of the total rotations that took place
in the light phase of the light:dark cycle were analyzed.
6.3.8 STATISTICAL ANALYSES
The data were analyzed using linear mixed effects models for the Rotarod, and
linear regression models for all other tasks. Genotype, sex, and weight were used as
possible predictor variables. Body weight was included in the analyses as a possible
predictor variable in order to control for weight as a confounding factor in sex effects.
The second order Akaike information criterion (AICc), Akaike weight, and evidence ratio
for all possible models was calculated, and the model with the lowest AICc was selected
and compared to the null model with either an F-test (linear regression models), or a χ2
test (linear mixed effects models). The AIC is a measure used to evaluate statistical
models based on the complexity of the model and how well the model fits the data. The
second order AIC (AICc) applies a correction for small sample sizes and does not differ
from AIC for larger sample sizes, so was used for our analyses (Akaike, 1974; Burnham
and Anderson, 2002). Confidence intervals (95%) for the effects in the models were
calculated and, to determine which behavioural measures had the largest genotype
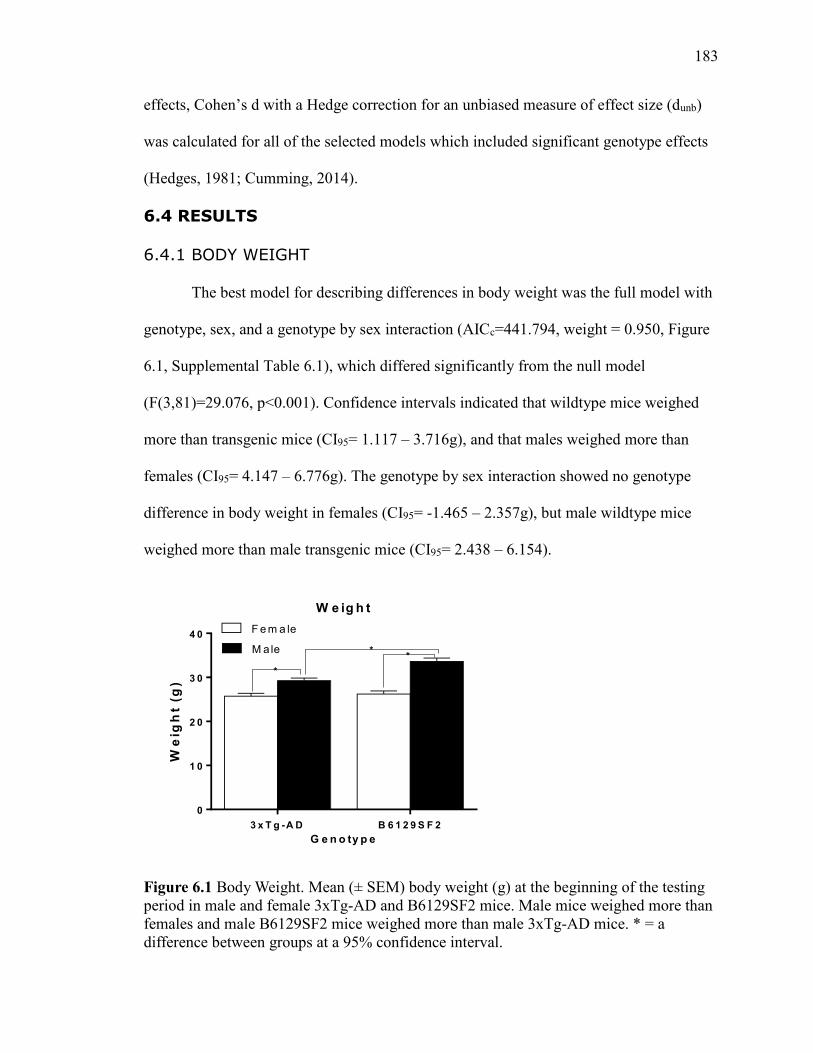
183
effects, Cohen’s d with a Hedge correction for an unbiased measure of effect size (dunb)
was calculated for all of the selected models which included significant genotype effects
(Hedges, 1981; Cumming, 2014).
6.4 RESULTS
6.4.1 BODY WEIGHT
The best model for describing differences in body weight was the full model with
genotype, sex, and a genotype by sex interaction (AICc=441.794, weight = 0.950, Figure
6.1, Supplemental Table 6.1), which differed significantly from the null model
(F(3,81)=29.076, p<0.001). Confidence intervals indicated that wildtype mice weighed
more than transgenic mice (CI95= 1.117 – 3.716g), and that males weighed more than
females (CI95= 4.147 – 6.776g). The genotype by sex interaction showed no genotype
difference in body weight in females (CI95= -1.465 – 2.357g), but male wildtype mice
weighed more than male transgenic mice (CI95= 2.438 – 6.154).
3 x T g -A D B 6 1 2 9 S F 2
0
1 0
2 0
3 0
4 0
W e ig h t
G e n o ty p e
We
igh
t (g
)
F e m a le
M ale **
*
Figure 6.1 Body Weight. Mean (± SEM) body weight (g) at the beginning of the testing
period in male and female 3xTg-AD and B6129SF2 mice. Male mice weighed more than
females and male B6129SF2 mice weighed more than male 3xTg-AD mice. * = a
difference between groups at a 95% confidence interval.
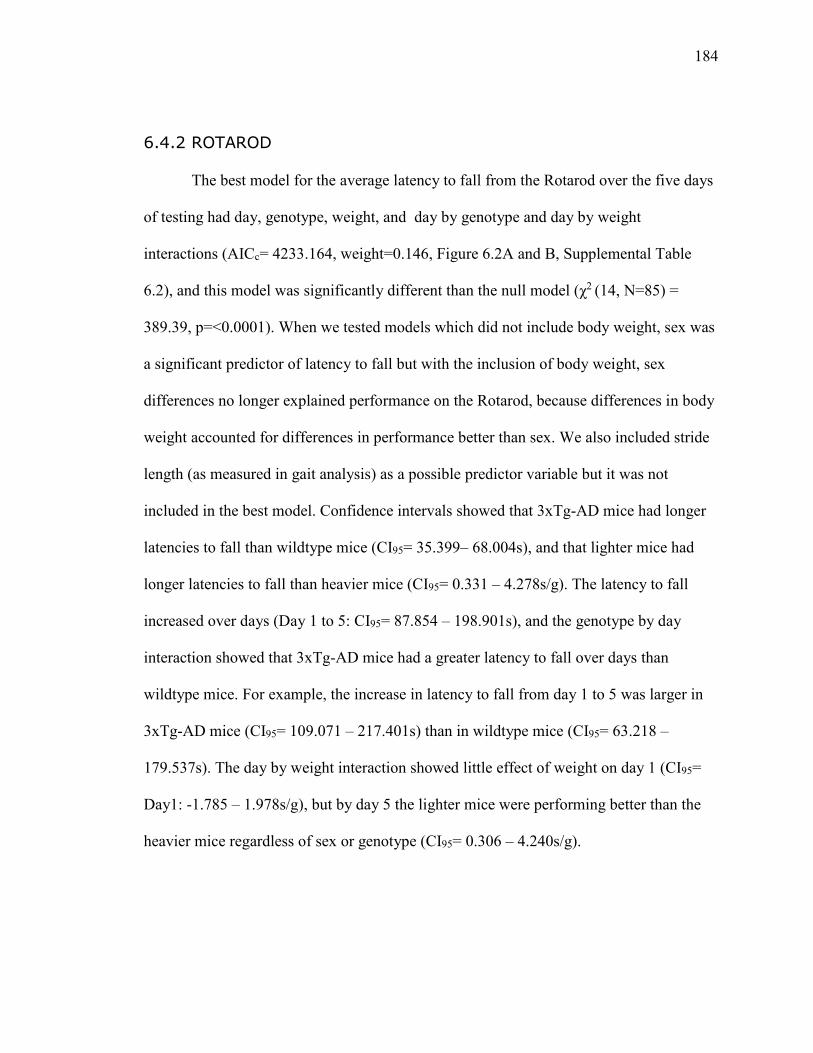
184
6.4.2 ROTAROD
The best model for the average latency to fall from the Rotarod over the five days
of testing had day, genotype, weight, and day by genotype and day by weight
interactions (AICc= 4233.164, weight=0.146, Figure 6.2A and B, Supplemental Table
6.2), and this model was significantly different than the null model (χ2 (14, N=85) =
389.39, p=<0.0001). When we tested models which did not include body weight, sex was
a significant predictor of latency to fall but with the inclusion of body weight, sex
differences no longer explained performance on the Rotarod, because differences in body
weight accounted for differences in performance better than sex. We also included stride
length (as measured in gait analysis) as a possible predictor variable but it was not
included in the best model. Confidence intervals showed that 3xTg-AD mice had longer
latencies to fall than wildtype mice (CI95= 35.399– 68.004s), and that lighter mice had
longer latencies to fall than heavier mice (CI95= 0.331 – 4.278s/g). The latency to fall
increased over days (Day 1 to 5: CI95= 87.854 – 198.901s), and the genotype by day
interaction showed that 3xTg-AD mice had a greater latency to fall over days than
wildtype mice. For example, the increase in latency to fall from day 1 to 5 was larger in
3xTg-AD mice (CI95= 109.071 – 217.401s) than in wildtype mice (CI95= 63.218 –
179.537s). The day by weight interaction showed little effect of weight on day 1 (CI95=
Day1: -1.785 – 1.978s/g), but by day 5 the lighter mice were performing better than the
heavier mice regardless of sex or genotype (CI95= 0.306 – 4.240s/g).
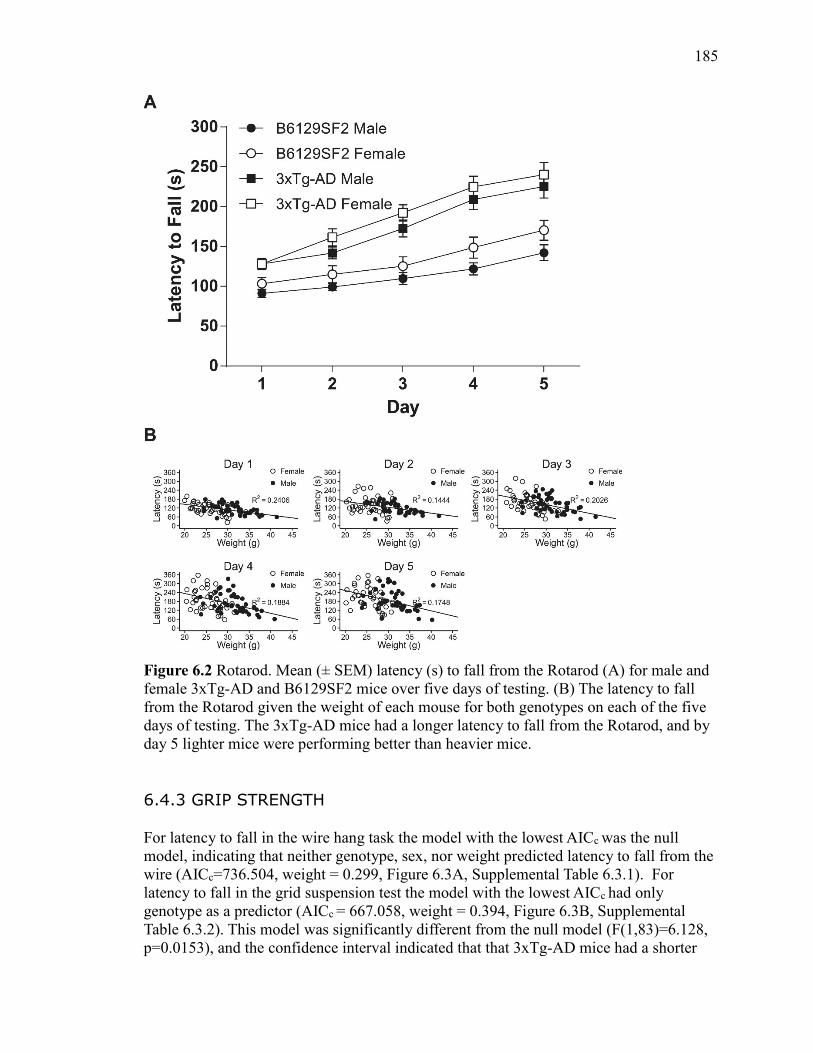
185
Figure 6.2 Rotarod. Mean (± SEM) latency (s) to fall from the Rotarod (A) for male and
female 3xTg-AD and B6129SF2 mice over five days of testing. (B) The latency to fall
from the Rotarod given the weight of each mouse for both genotypes on each of the five
days of testing. The 3xTg-AD mice had a longer latency to fall from the Rotarod, and by
day 5 lighter mice were performing better than heavier mice.
6.4.3 GRIP STRENGTH
For latency to fall in the wire hang task the model with the lowest AICc was the null
model, indicating that neither genotype, sex, nor weight predicted latency to fall from the
wire (AICc=736.504, weight = 0.299, Figure 6.3A, Supplemental Table 6.3.1). For
latency to fall in the grid suspension test the model with the lowest AICc had only
genotype as a predictor (AICc = 667.058, weight = 0.394, Figure 6.3B, Supplemental
Table 6.3.2). This model was significantly different from the null model (F(1,83)=6.128,
p=0.0153), and the confidence interval indicated that that 3xTg-AD mice had a shorter

186
latency to fall than wildtype mice (CI95= -12.509 – -2.125s).
3 x T g -A D B 6 1 2 9 S F 2
0
1 0
2 0
3 0
4 0
W ire H a n g
G e n o ty p e
La
ten
cy
to
Fa
ll (
s)
F e m a le
M ale
3 x T g -A D B 6 1 2 9 S F 2
0
2 0
4 0
6 0
8 0
G r id S u s p e n s io n
G e n o ty p e
La
ten
cy
to
Fa
ll (
s)
F e m a le
M ale*
A B
Figure 6.3 Grip Strength. Mean (± SEM) latency (s) to fall during the wire hang (A) and
grid suspension (B) tasks for male and female 3xTg-AD and B6129SF2 mice. There were
no genotype or sex differences in wire hang task, while B6129SF2 mice had a longer
latency to fall than the 3xTg-AD mice in the grid suspension task. * = a difference
between groups at a 95% confidence interval.
6.4.4 GAIT ANALYSIS
The gait of three mice (two male wildtypes and one male 3xTg-AD) could not be
analyzed because the mice did not walk down the corridor, so no footprints could be
measured. An average of nine steps per mouse was analyzed. For stride length the best
model had only genotype as a predictor (AICc=146.940, weight= 0.389, Figure 6.4A,
Supplemental Table 6.4.1), which differed significantly from the null model (F(3,78)=
4.695, p <0.005). Confidence intervals indicated that transgenic mice had a longer stride
length than wildtype mice (CI95= -0.713 – -0.217cm). For stride width the full model with
genotype, sex, and a genotype by sex interaction (AICc=62.222, weight = 0.263, Figure
6.4B, Supplemental Table 6.4.2) differed significantly from the null model (F(3,78)=
7.217, p <0.001). Confidence intervals showed little evidence for a genotype difference
(CI95= -0.063 – 0.228cm), although there was a larger stride width in males compared to
females (CI95= 0.163 – 0.460cm), and there was a genotype by sex interaction as

187
wildtype male mice had a wider stride than females (CI95= 0.228 – 0.697cm), but there
was no sex difference in the 3xTg-AD mice (CI95= -0.019 – 0.340cm).
3 x T g -A D B 6 1 2 9 S F 2
0
2
4
6
8
S tr id e L e n g th
Dis
tan
ce
(c
m)
F e m a le
M ale
3 x T g -A D B 6 1 2 9 S F 2
0
1
2
3
4
S tr id e W id th
Dis
tan
ce
(c
m)
F e m a le
M ale
A B
**
Figure 6.4 Gait Analysis. Mean (± SEM) stride length (A) and width (B) in cm in male
and female 3xTg-AD and B6129SF2 mice. The 3xTg-AD mice had a longer stride than
the B6129SF2 mice, and the B6129SF2 males had a wider stride than the B6129SF2
females. * = a difference between groups at a 95% confidence interval.
6.4.5 BALANCE BEAM
For the latency to fall from the balance beam, distance travelled, and locomotor
speed the null model was the best model (AICcs= 820.773, 1086.210, 280.621, weights =
0.288, 0.292, 0.297, Figures 6.5 A, B, C, and Supplemental Tables 6.5.1, 6.5.2, 6.5.3,
respectively), indicating that there were no genotype, sex, or weight effects. For the
number of foot slips the best model had genotype, weight, and a genotype by weight
interaction (AICc=303.970, weight = 0.628, Figure 6.5 D and E, Supplemental Table
6.5.4), and differed significantly from the null model (F(1,84)= 5.86, p = 0.0001). The
confidence interval analysis showed that the 3xTg-AD mice had a greater number of foot
slips than wildtype controls (CI95= 0.0193 – 1.1687 slips). There was also an interaction
between body weight and genotype as the number of foot slips decreased with weight in
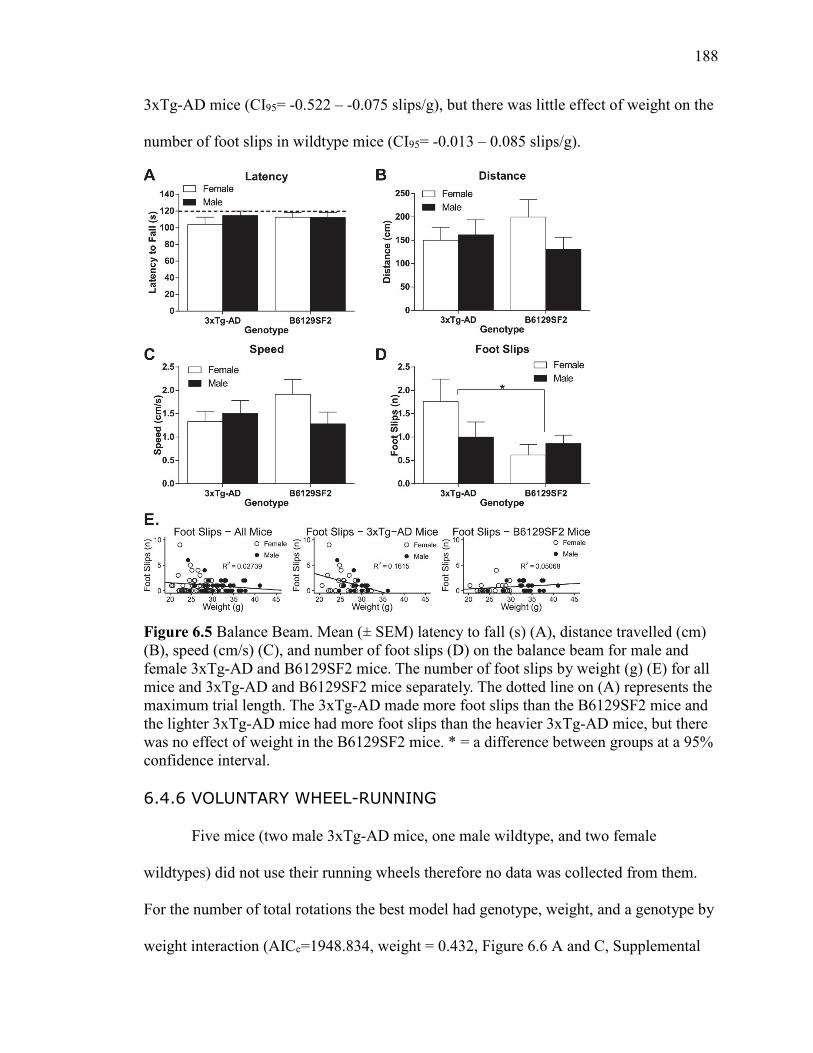
188
3xTg-AD mice (CI95= -0.522 – -0.075 slips/g), but there was little effect of weight on the
number of foot slips in wildtype mice (CI95= -0.013 – 0.085 slips/g).
Figure 6.5 Balance Beam. Mean (± SEM) latency to fall (s) (A), distance travelled (cm)
(B), speed (cm/s) (C), and number of foot slips (D) on the balance beam for male and
female 3xTg-AD and B6129SF2 mice. The number of foot slips by weight (g) (E) for all
mice and 3xTg-AD and B6129SF2 mice separately. The dotted line on (A) represents the
maximum trial length. The 3xTg-AD made more foot slips than the B6129SF2 mice and
the lighter 3xTg-AD mice had more foot slips than the heavier 3xTg-AD mice, but there
was no effect of weight in the B6129SF2 mice. * = a difference between groups at a 95%
confidence interval.
6.4.6 VOLUNTARY WHEEL-RUNNING
Five mice (two male 3xTg-AD mice, one male wildtype, and two female
wildtypes) did not use their running wheels therefore no data was collected from them.
For the number of total rotations the best model had genotype, weight, and a genotype by
weight interaction (AICc=1948.834, weight = 0.432, Figure 6.6 A and C, Supplemental
189
Table 6.6.1), and was significantly different from the null model (F(3,76)=3.298,
p=0.0251). Transgenic mice did not differ in number of total rotations from wildtype
mice (CI95= -32165 – 14104 rotations), but the weight by genotype interaction showed
that the 3xTg-AD mice had an increased number of rotations as body weight increased
(CI95= 272 – 9239 rotations/g), but the wildtype mice had a decrease in number of
rotations with increased weight (CI95= -5496 – 136 rotations/g). For the percentage of
rotations that took place in the light portion of the light:dark cycle, the best model had
only genotype (AICc=635.748, weight = 0.299, Figure 6.6B, Supplemental Table 6.6.2).
This model fell just short of differing significantly from the null model, (F(1,78)=3.936,
p=0.051), however confidence interval analysis indicated that the transgenic mice had a
greater percentage of their rotations during the light portion of the light:dark cycle than
the wildtype mice (CI95= 0.67 – 11.99%).
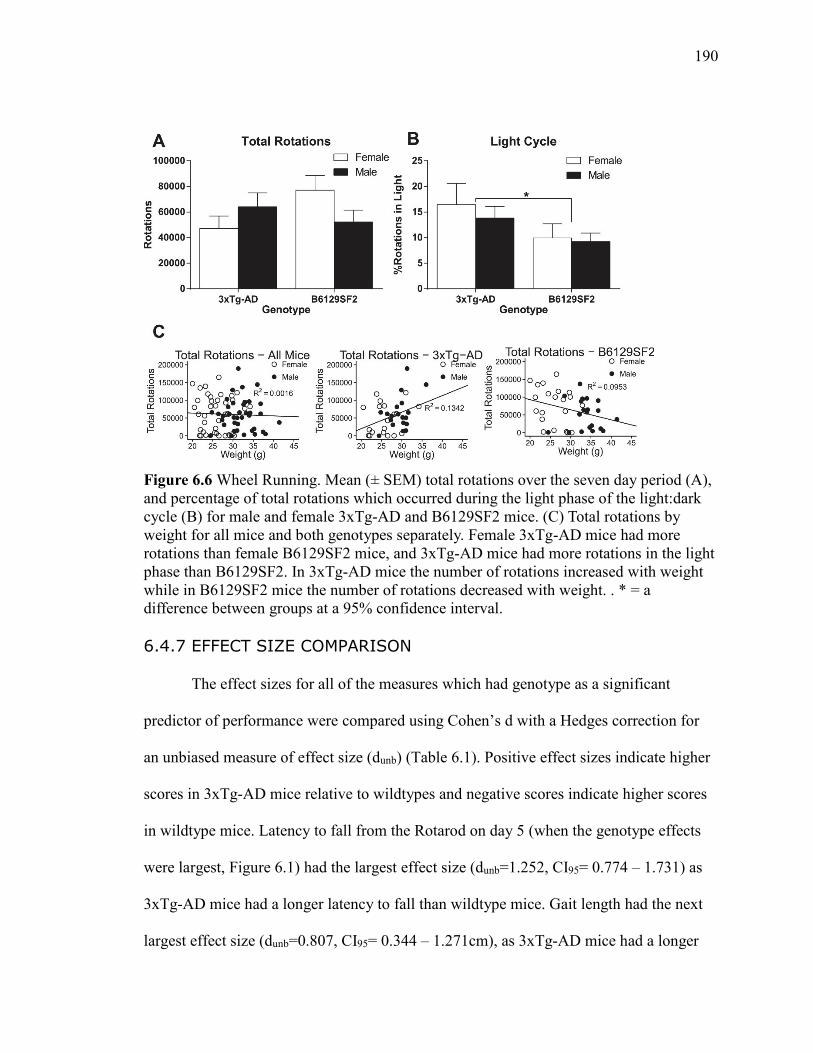
190
Figure 6.6 Wheel Running. Mean (± SEM) total rotations over the seven day period (A),
and percentage of total rotations which occurred during the light phase of the light:dark
cycle (B) for male and female 3xTg-AD and B6129SF2 mice. (C) Total rotations by
weight for all mice and both genotypes separately. Female 3xTg-AD mice had more
rotations than female B6129SF2 mice, and 3xTg-AD mice had more rotations in the light
phase than B6129SF2. In 3xTg-AD mice the number of rotations increased with weight
while in B6129SF2 mice the number of rotations decreased with weight. . * = a
difference between groups at a 95% confidence interval.
6.4.7 EFFECT SIZE COMPARISON
The effect sizes for all of the measures which had genotype as a significant
predictor of performance were compared using Cohen’s d with a Hedges correction for
an unbiased measure of effect size (dunb) (Table 6.1). Positive effect sizes indicate higher
scores in 3xTg-AD mice relative to wildtypes and negative scores indicate higher scores
in wildtype mice. Latency to fall from the Rotarod on day 5 (when the genotype effects
were largest, Figure 6.1) had the largest effect size (dunb=1.252, CI95= 0.774 – 1.731) as
3xTg-AD mice had a longer latency to fall than wildtype mice. Gait length had the next
largest effect size (dunb=0.807, CI95= 0.344 – 1.271cm), as 3xTg-AD mice had a longer
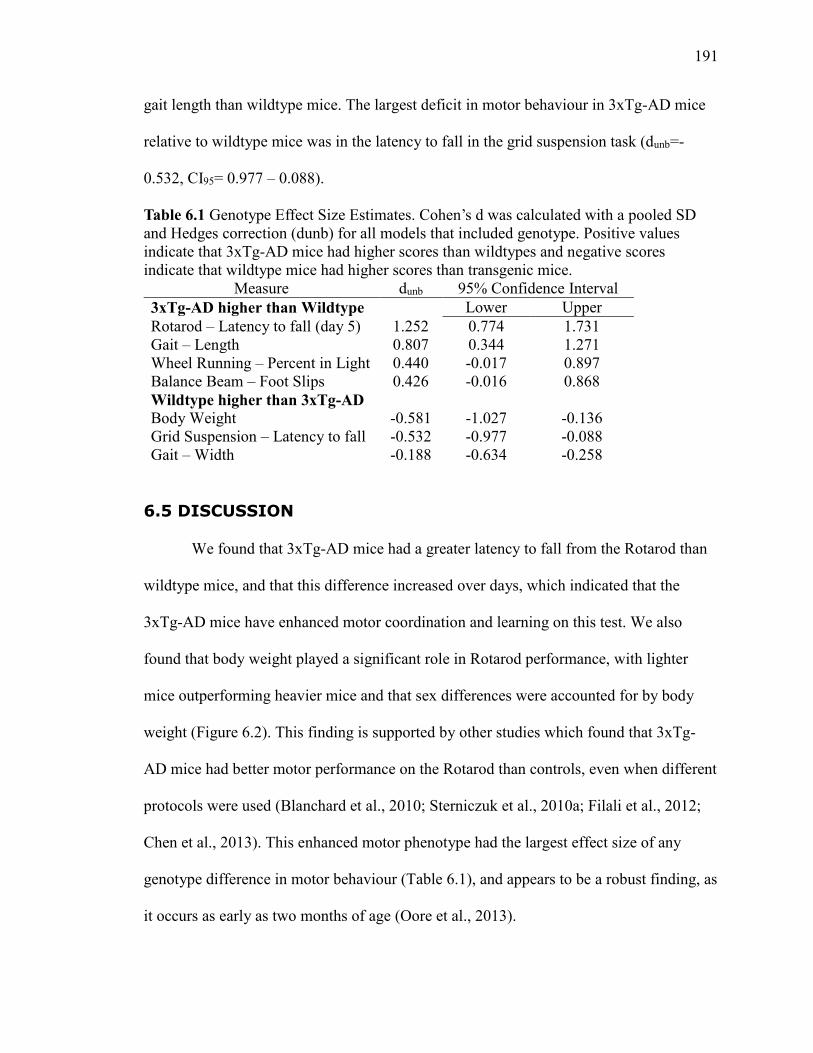
191
gait length than wildtype mice. The largest deficit in motor behaviour in 3xTg-AD mice
relative to wildtype mice was in the latency to fall in the grid suspension task (dunb=-
0.532, CI95= 0.977 – 0.088).
Table 6.1 Genotype Effect Size Estimates. Cohen’s d was calculated with a pooled SD
and Hedges correction (dunb) for all models that included genotype. Positive values
indicate that 3xTg-AD mice had higher scores than wildtypes and negative scores
indicate that wildtype mice had higher scores than transgenic mice.
Measure dunb 95% Confidence Interval
3xTg-AD higher than Wildtype Lower Upper
Rotarod – Latency to fall (day 5) 1.252 0.774 1.731
Gait – Length 0.807 0.344 1.271
Wheel Running – Percent in Light 0.440 -0.017 0.897
Balance Beam – Foot Slips 0.426 -0.016 0.868
Wildtype higher than 3xTg-AD
Body Weight -0.581 -1.027 -0.136
Grid Suspension – Latency to fall -0.532 -0.977 -0.088
Gait – Width -0.188 -0.634 -0.258
6.5 DISCUSSION
We found that 3xTg-AD mice had a greater latency to fall from the Rotarod than
wildtype mice, and that this difference increased over days, which indicated that the
3xTg-AD mice have enhanced motor coordination and learning on this test. We also
found that body weight played a significant role in Rotarod performance, with lighter
mice outperforming heavier mice and that sex differences were accounted for by body
weight (Figure 6.2). This finding is supported by other studies which found that 3xTg-
AD mice had better motor performance on the Rotarod than controls, even when different
protocols were used (Blanchard et al., 2010; Sterniczuk et al., 2010a; Filali et al., 2012;
Chen et al., 2013). This enhanced motor phenotype had the largest effect size of any
genotype difference in motor behaviour (Table 6.1), and appears to be a robust finding, as
it occurs as early as two months of age (Oore et al., 2013).
192
In order to further investigate the motor phenotype of the 3xTg-AD mouse we
used tests of strength, gait, balance, and voluntary activity. In the wire hang test there was
no difference between genotypes or sexes in grip strength, which replicates what others
have found (Sterniczuk et al., 2010a; Arsenault et al., 2011) (Figure 6.3A). In the grid
suspension task, 3xTg-AD mice had poorer grip strength than wildtype mice
independently of body weight (Figure 6.3B). To our knowledge this is the first time the
3xTg-AD mice have been assessed on this task. Different results from these two
measures of grip strength may occur because the wire hang test requires mice only to use
their forepaws while the grid suspension test requires mice to use both their hind and
forepaws, which may be a more valid measure of the grip strength. There was also much
less variability in performance in the grid suspension task suggesting that it has higher
reliability than the wire hang task (Figure 6.3 A and B). Based on these findings it
appears that the 3xTg-AD mice have a deficit in grip strength by six months of age.
In terms of gait, the 3xTg-AD mice had a longer stride than wildtype mice (Figure
6.4A. Male wildtype mice had a wider stride than females, but there was no sex
difference in gait width in 3xTg-AD mice. This may be the result of a difference in
overall body size, though body weight had no effect on gait. The only previous
assessment of gait in the 3xTg-AD mice was qualitative and all mice assessed had normal
gait (Filali et al., 2012). Differences in gait could influence motor tasks that involve
locomotion and balance, such as the Rotarod or balance beam.
On the balance beam the 3xTg-AD mice made more foot slips than wildtype
mice, but did not fall off the beam faster than wildtype mice (Figure 6.5 A and D), which
may be the result of their better motor coordination. There was also a genotype-
193
dependant weight effect, in which the number of foot slips increased with weight in
wildtype mice and decreased with weight in transgenic mice (Figure 6.5E). An increased
ability to recover from a foot slip would enhance performance on the Rotarod, however
having more foot slips would decrease performance, so it is unclear how this finding
could explain performance on the Rotarod. Other mice with the P301L mutation have
been reported to have better performance on the balance beam than control mice (Morgan
et al., 2008).
In voluntary wheel-running there were no genotype or sex differences in total
number of rotations, but there was a genotype-dependant weight effect; the heavier 3xTg-
AD mice had a higher number of rotations but lighter wildtype mice had the higher
number of rotations (Figure 6.6C). The 3xTg-AD mice appeared to have a disrupted
circadian rhythm, as they spent a greater percentage of time running during the light
phase of the light:dark cycle than wildtype mice. These findings are similar to those of
Sterniczuk et al. (2010b), who found that the 3xTg-AD have disrupted circadian rhythms,
and this is also a common symptom of AD.
There was only one sex difference in motor function: females had a narrower
stride width than males; however there were several effects of body weight. The heavier
3xTg-AD mice had better motor functioning than lighter mice, as they had fewer foot
slips on the balance beam and a higher number of rotations in voluntary wheel running.
In wildtype mice weight had the opposite effect, as heavier mice performed more poorly
than lighter mice on the Rotarod in the later days of training. These results indicate that
body weight is an important factor in motor function and should be taken into
consideration when examining motor ability. Male mice weighed more than female mice
194
and if weight was not taken into account then spurious sex differences would be detected.
Figures 6.2B and 6.5E show that male and female mice with the same weight did not
differ in performance, and since females were lighter than males weight was often a
useful predictor of performance in our models while sex was not.
Overall, we found that the 3xTg-AD mice had enhanced performance on the
Rotarod at six months of age, which may be explained by their longer gait and their better
ability to recover from foot-slips on the balance beam. But the 3xTg-AD mice had poorer
grip strength on the grid suspension task and a disrupted circadian rhythm in voluntary
wheel running. It seems likely that the enhanced motor performance of the 3xTg-AD
mice on the Rotarod is a result of the P301L transgene, since other strains of mice with
the P301L mutation as well as the 3xTg-AD have the same enhancement of motor
behavior performance on the Rotarod (Morgan et al., 2008; Blanchard et al., 2010;
Sterniczuk et al., 2010b; Filali et al., 2012; Chen et al., 2013). There are no reports of
enhanced motor performance in mice with the APPswe or PS1M146V mutations,
however some mice with APP or PS1 mutations have motor deficits on the Rotarod
(Peters et al., 2013; Héraud et al., 2014; Kuwabara et al., 2014). Another transgenic strain
harbouring the P301L mutation, JNPL3 mice, also have enhanced performance on the
Rotarod, and this enhanced motor phenotype remained intact when the strain was crossed
with the Tg2576AD model mouse (Morgan et al., 2008). The JNPL3 and other P301L
mutant mice also have enhanced cognitive performance before seven months of age,
suggesting that while the P301L mutation causes tau pathology with motor and cognitive
deficits at older ages, it may confer some benefits at younger ages, before the mice
develop motor deficits (Boekhoorn et al., 2006; Morgan et al., 2008). Most mouse models

195
with the P301L mutation develop motor deficits with age (Lewis et al., 2000; Morgan et
al., 2008), however the 3xTg-AD does not (Blanchard et al., 2010; Sterniczuk et al.,
2010a; Chen et al., 2013), and it appears that the enhanced motor phenotype on the
Rotarod is maintained until at least 15 months of age (Oore et al., 2013).
In the 3xTg-AD mice the separate locus of the APPswe and TauP301L mutations
from the PS1M146V mutation means that two groups of transgenes would segregate
independently and produce a number genotypes, so the transgenic mice are bred together
and the wildtype control mice (B6129SF2) are bred separately. This can lead to maternal
effects in the development of these mice (Blaney et al., 2013). Irrespective of their
maternal genotype the 3xTg-AD mice reach physical milestones earlier than wildtype
mice (Blaney et al., 2013). The lack of age-related development of motor deficits in
3xTg-AD mice on the Rotarod (Oore et al., 2013) may be related to the inclusion of the
other two transgenes or to the background strains of these mice (B6129SF2). The tau
P301L mutation may also provide an explanation for the relatively mild cognitive deficits
in this strain, as it has been reported have a positive effect on some aspects of cognition
early in life (Boekhoorn et al., 2006; Morgan et al., 2008). Future studies should examine
the possible role of the tau P301L in motor phenotype enhancement and examine whether
it has a protective effect on cognitive function in the 3xTg-AD mice.
Given that there are age-related changes in motor abilities and gait in AD patients
(Cedervall et al., 2014) we would expect to find an age-related decline in motor
performance in 3xTg-AD mice, however the Rotarod performance in the 3xTg-AD mice
is considerably better than that of wildtype controls from two months of age and there is
no decline in Rotarod performance with age (Oore et al., 2013). It is therefore important

196
to examine age-related changes in the entire motor test battery in the 3xTg-AD mice, as
motor behaviour has been found to decline in activity level, strength, and endurance in
C57BL/6 mice after 20 months of age (Justice et al., 2014). Future studies in the 3xTg-
AD should examine the motor phenotype of these mice across the lifespan. The enhanced
motor performance of the 3xTg-AD mice on the Rotarod appears to be a robust finding
and should be taken into account when selecting a cognitive task in future experiments.
However it appears that the motor phenotype of this strain is more complex than a simple
enhancement of Rotarod performance, and other aspects of motor performance, such as
grip strength, may show an age related decline.
6.6 ACKNOWLEDGEMENTS
This research was funded by an NSERC grant to REB. The authors would like to
thank Dr. Rachel Dingle and Dr. Aimee Wong for their assistance in this project.
197
6.7 REFERENCES
Akaike H (1974) A new look at the statistical model identification. Autom Control IEEE
Trans 19:716–723.
Albers MW et al. (2014) At the interface of sensory and motor dysfunctions and
Alzheimer’s disease. Alzheimer’s Dement:1–29.
Arsenault D, Julien C, Tremblay C, Calon F (2011) DHA improves cognition and
prevents dysfunction of entorhinal cortex neurons in 3xTg-AD mice. PLoS One
6:e17397.
Bilkei-Gorzo A (2014) Genetic mouse models of brain ageing and Alzheimer’s disease.
Pharmacol Ther 142:244–257.
Billings LM, Green KN, McGaugh JL, LaFerla FM (2007) Learning decreases A beta*56
and tau pathology and ameliorates behavioral decline in 3xTg-AD mice. J Neurosci
27:751–761.
Billings LM, Oddo S, Green KN, McGaugh JL, LaFerla FM (2005) Intraneuronal Abeta
causes the onset of early Alzheimer’s disease-related cognitive deficits in transgenic
mice. Neuron 45:675–688.
Blanchard J, Wanka L, Tung Y-C, Cárdenas-Aguayo M del C, LaFerla FM, Iqbal K,
Grundke-Iqbal I (2010) Pharmacologic reversal of neurogenic and neuroplastic
abnormalities and cognitive impairments without affecting Aβ and tau pathologies in
3xTg-AD mice. Acta Neuropathol 120:605–621.
Blaney CE, Gunn RK, Stover KR, Brown RE (2013) Maternal genotype influences
behavioral development of 3xTg-AD mouse pups. Behav Brain Res 252:40–48.
Boekhoorn K, Terwel D, Biemans B, Borghgraef P, Wiegert O, Ramakers GJA, de Vos K,
Krugers H, Tomiyama T, Mori H, Joels M, van Leuven F, Lucassen PJ (2006)
Improved long-term potentiation and memory in young tau-P301L transgenic mice
before onset of hyperphosphorylation and tauopathy. J Neurosci 26:3514–3523.
Brooks SP, Dunnett SB (2009) Tests to assess motor phenotype in mice: a user’s guide.
Nat Rev Neurosci 10:519–529.
Brown RE, Wong AA (2007) The influence of visual ability on learning and memory
performance in 13 strains of mice. Learn Mem 14:134.
Buchman AAS, Bennett DA (2011) Loss of motor function in preclinical Alzheimer’s
disease. Expert Rev Neurother 11:665–676.
Burnham KP, Anderson DR (2002) Model selection and multimodel inference: A
practical information-theoretic approach, 2nd ed. New York: Springer Science &
Business Media.
198
Carrillo MC, Dean RA, Nicolas F, Miller DS, Berman R, Khachaturian Z, Bain LJ,
Schindler R, Knopman D (2013) Revisiting the framework of the National Institute
on Aging-Alzheimer’s Association diagnostic criteria. Alzheimers Dement 9:594–
601.
Carter RJ, Lione LA, Humby T, Mangiarini L, Mahal A, Bates GP, Dunnett SB, Morton
AJ (1999) Characterization of progressive motor deficits in mice transgenic for the
human Huntington’s disease mutation. J Neurosci 19:3248–3257.
Cedervall Y, Halvorsen K, Aberg AC (2014) A longitudinal study of gait function and
characteristics of gait disturbance in individuals with Alzheimer’s disease. Gait
Posture 39:1022–1027.
Chen Y, Liang Z, Blanchard J, Dai C-L, Sun S, Lee MH, Grundke-Iqbal I, Iqbal K, Liu F,
Gong C-X (2013) A Non-transgenic mouse model (icv-STZ mouse) of Alzheimer’s
disease: Similarities to and differences from the transgenic model (3xTg-AD
mouse). Mol Neurobiol 47:711–725.
Chin J (2011) Selecting a Mouse Model of Alzheimer’s Disease Roberson ED, ed.
Methods Mol Biol (Clifton, NJ) 670.
Clinton LK, Billings LM, Green KN, Caccamo A, Ngo J, Oddo S, McGaugh JL, LaFerla
FM (2007) Age-dependent sexual dimorphism in cognition and stress response in
the 3xTg-AD mice. Neurobiol Dis 28:76–82.
Cumming G (2014) The new statistics: why and how. Psychol Sci 25:7–29.
Desai MK, Sudol KL, Janelsins MC, Mastrangelo M a, Frazer ME, Bowers WJ (2009)
Triple-transgenic Alzheimer’s disease mice exhibit region-specific abnormalities in
brain myelination patterns prior to appearance of amyloid and tau pathology. Glia
57:54–65.
Dick MB, Nielson KA, Beth RE, Shankle WR, Cotman CW (1995) Acquisition and long-
term retention of a fine motor skill in Alzheimer’s disease. Brain Cogn 29:294–306.
Eslinger PJ, Damasio AR (1986) Preserved motor learning in Alzheimer’s disease:
implications for anatomy and behavior. J Neurosci 6:3006–3009.
España J, Giménez-Llort L, Valero J, Miñano A, Rábano A, Rodriguez-Alvarez J, LaFerla
FM, Saura CA (2010) Intraneuronal beta-amyloid accumulation in the amygdala
enhances fear and anxiety in Alzheimer’s disease transgenic mice. Biol Psychiatry
67:513–521.
Filali M, Lalonde R, Theriault P, Julien C, Calon F, Planel E (2012) Cognitive and non-
cognitive behaviors in the triple transgenic mouse model of Alzheimer’s disease
expressing mutated APP, PS1, and Mapt (3xTg-AD). Behav Brain Res 234:334–342.
199
Fleming SM, Salcedo J, Fernagut P, Rockenstein E, Masliah E, Levine MS, Chesselet M-
F (2004) Early and progressive sensorimotor anomalies in mice overexpressing
wild-type human alpha-synuclein. J Neurosci 24:9434–9440.
García-Mesa Y, López-Ramos JC, Giménez-Llort L, Revilla S, Guerra R, Gruart A,
Laferla FM, Cristòfol R, Delgado-García JM, Sanfeliu C (2011) Physical exercise
protects against Alzheimer’s disease in 3xTg-AD mice. J Alzheimers Dis 24:421–
454.
Gras LZ, Kanaan SF, McDowd JM, Colgrove YM, Burns J, Pohl PS (2014) Balance and
Gait of Adults With Very Mild Alzheimer Disease. J Geriatr Phys Ther.
Hedges L V. (1981) Distribution theory for Glass’s estimator of effect size and related
estimators. J Educ Behav Stat 6:107–128.
Héraud C, Goufak D, Ando K, Leroy K, Suain V, Yilmaz Z, De Decker R, Authelet M,
Laporte V, Octave J-N, Brion J-P (2014) Increased misfolding and truncation of tau
in APP/PS1/tau transgenic mice compared to mutant tau mice. Neurobiol Dis
62:100–112.
Justice JN, Carter CS, Beck HJ, Gioscia-Ryan RA, McQueen M, Enoka RM, Seals DR
(2014) Battery of behavioral tests in mice that models age-associated changes in
human motor function. Age (Omaha) 36:583–592.
Kluger A, Gianutsos JJG, Golomb J, Ferris SH, Reisberg B (1997) Motor/psychomotor
dysfunction in normal aging, mild cognitive decline, and early Alzheimer’s disease:
diagnostic and differential diagnostic features. Int Psychogeriatrics 9:307–316.
Kuwabara Y, Ishizeki M, Watamura N, Toba J, Yoshii A, Inoue T, Ohshima T (2014)
Impairments of long-term depression induction and motor coordination precede Aβ
accumulation in the cerebellum of APPswe/PS1dE9 double transgenic mice. J
Neurochem 130:432–443.
LaFerla FM, Green KN (2012) Animal models of Alzheimer disease. Cold Spring Harb
Perspect Med 2:a006320.
Lewis J et al. (2000) Neurofibrillary tangles, amyotrophy and progressive motor
disturbance in mice expressing mutant (P301L) tau protein. Nat Genet 25:127.
Mastrangelo MA, Bowers WJ (2008) Detailed immunohistochemical characterization of
temporal and spatial progression of Alzheimer’s disease-related pathologies in male
triple-transgenic mice. BMC Neurosci 9:81.
McKhann G, Drachman D, Folstein M, Katzman R, Price D, Stadlan EM (1984) Clinical
diagnosis of Alzheimer’s disease: report of the NINCDS-ADRDA Work Group
under the auspices of Department of Health and Human Services Task Force on
Alzheimer's Disease. Neurology 34:939–944.
200
Morgan D, Munireddy S, Alamed J, DeLeon J, Diamond DM, Bickford P, Hutton M,
Lewis J, McGowan E, Gordon MN (2008) Apparent behavioral benefits of tau
overexpression in P301L tau transgenic mice. J Alzheimers Dis 15:605–614.
Oddo S, Caccamo A, Shepherd JD, Murphy MP, Golde TE, Kayed R, Metherate R,
Mattson MP, Akbari Y, LaFerla FM (2003) Triple-transgenic model of Alzheimer’s
Disease with plaques and tangles: Intracellular Aβ and synaptic dysfunction. Neuron
39:409–421.
Oore JJ, Fraser LM, Brown RE (2013) Age-related changes in motor ability and motor
learning in triple transgenic (3xTg-AD) and control (B6129SF1/J) mice on the
accelerating Rotarod. Proc Nov Scotian Inst Sci 74:281–296.
Peters OM, Shelkovnikova T, Tarasova T, Springe S, Kukharsky MS, Smith GA, Brooks
S, Kozin SA, Kotelevtsev Y, Bachurin SO, Ninkina N, Buchman VL (2013) Chronic
administration of Dimebon does not ameliorate amyloid-β pathology in 5xFAD
transgenic mice. J Alzheimers Dis 36:589–596.
Pettersson AF, Olsson E, Wahlund L-O (2005) Motor function in subjects with mild
cognitive impairment and early Alzheimer’s disease. Dement Geriatr Cogn Disord
19:299–304.
Reuben DB, Magasi S, McCreath HE, Bohannon RW, Wang Y-C, Bubela DJ, Rymer WZ,
Beaumont J, Rine RM, Lai J-S, Gershon RC (2013) Motor assessment using the
NIH Toolbox. Neurology 80:S65–S75.
Sterniczuk R, Antle MC, Laferla FM, Dyck RH (2010a) Characterization of the 3xTg-AD
mouse model of Alzheimer’s disease: part 2. Behavioral and cognitive changes.
Brain Res 1348:149–155.
Sterniczuk R, Dyck RH, Laferla FM, Antle MC (2010b) Characterization of the 3xTg-
AD mouse model of Alzheimer’s disease: part 1. Circadian changes. Brain Res
1348:139–148.
Webster SJ, Bachstetter AD, Nelson PT, Schmitt FA, Van Eldik LJ (2014) Using mice to
model Alzheimer’s dementia: an overview of the clinical disease and the preclinical
behavioral changes in 10 mouse models. Front Genet 5:88.
Wright SL, Brown RE (2002) The importance of paternal care on pup survival and pup
growth in Peromyscus californicus when required to work for food. Behav Processes
60:41–52.
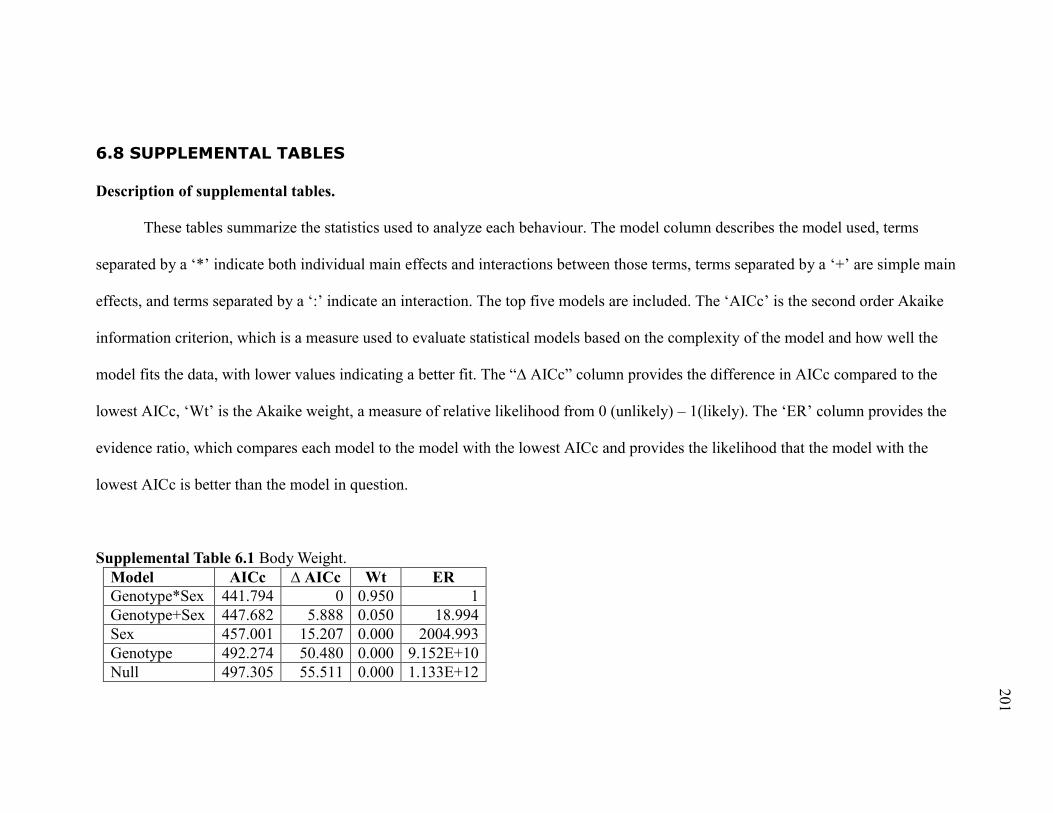
201
6.8 SUPPLEMENTAL TABLES
Description of supplemental tables.
These tables summarize the statistics used to analyze each behaviour. The model column describes the model used, terms
separated by a ‘*’ indicate both individual main effects and interactions between those terms, terms separated by a ‘+’ are simple main
effects, and terms separated by a ‘:’ indicate an interaction. The top five models are included. The ‘AICc’ is the second order Akaike
information criterion, which is a measure used to evaluate statistical models based on the complexity of the model and how well the
model fits the data, with lower values indicating a better fit. The “∆ AICc” column provides the difference in AICc compared to the
lowest AICc, ‘Wt’ is the Akaike weight, a measure of relative likelihood from 0 (unlikely) – 1(likely). The ‘ER’ column provides the
evidence ratio, which compares each model to the model with the lowest AICc and provides the likelihood that the model with the
lowest AICc is better than the model in question.
Supplemental Table 6.1 Body Weight.
Model AICc ∆ AICc Wt ER
Genotype*Sex 441.794 0 0.950 1
Genotype+Sex 447.682 5.888 0.050 18.994
Sex 457.001 15.207 0.000 2004.993
Genotype 492.274 50.480 0.000 9.152E+10
Null 497.305 55.511 0.000 1.133E+12

202
Supplemental Table 6.2 Rotarod – Latency to Fall.
Model AICc ∆ AICc Wt ER
Day+Genotype+Weight+(Day:Genotype )+(Day:Weight) 4233.164 0 0.146 1
Day+Genotype+Weight+(Day:Genotype) 4233.920 0.756 0.100 1.459
Day+Genotype+Weight+(Day:Genotype)+(Day:Weight)+(Genotype:Weight) 4234.483 1.318 0.076 1.933
Day+Genotype+Weight+(Day:Genotype)+(Genotype:Weight) 4235.148 1.984 0.054 2.697
Day+Genotype+Sex+Weight+(Day:Genotype)+(Day:Weight) 4235.329 2.164 0.050 2.951
Supplemental Table 6.3.1 Wire Hang – Latency to Fall.
Model AICc ∆ AICc Wt ER
Null 736.505 0 0.299 1
Sex 737.857 1.353 0.152 1.967
Weight 738.342 1.837 0.119 2.506
Genotype 738.484 1.979 0.111 2.690
Genotype*Sex 738.799 2.294 0.095 3.149
Supplemental Table 6.3.2 Grid Suspension – Latency to Fall.
Model AICc ∆ AICc Wt ER
Genotype 667.058 0 0.394 1
Genotype+Sex 669.023 1.966 0.147 2.672
Genotype+Weight 669.194 2.136 0.135 2.910
Null 670.962 3.905 0.056 7.046
Genotype*Weight 671.096 4.039 0.052 7.533

203
Supplemental Table 6.4.1 Gait Analysis – Length.
Model AICc ∆ AICc Wt ER
Genotype 146.940 0 0.389 1
Genotype+Sex 149.026 2.086 0.137 2.838
Genotype+Weight 149.143 2.203 0.129 3.008
Genotype*Weight 149.574 2.633 0.104 3.731
Genotype*Sex 150.690 3.750 0.060 6.520
Supplemental Table 6.4.2 Gait Analysis – Width.
Model AICc ∆ AICc Wt ER
Genotype*Sex 62.222 0 0.263 1
Sex 62.711 0.488 0.206 1.277
Genotype+Sex+Weight+(Genotype:Sex) 63.080 0.858 0.171 1.535
Genotype+Sex 63.817 1.594 0.118 2.219
Genotype+Sex+Weight+(Genotype:Sex)+(Weight:Sex) 65.171 2.948 0.060 4.368
Supplemental Table 6.5.1 Balance Beam – Latency to Fall.
Model AICc ∆ AICc Wt ER
Null 820.773 0 0.288 1
Sex 822.248 1.474 0.138 2.090
Genotype 822.669 1.895 0.112 2.580
Weight 822.796 2.023 0.105 2.749
Genotype+Sex 824.204 3.431 0.052 5.559

204
Supplemental Table 6.5.2 Balance Beam – Distance Travelled.
Model AICc ∆ AICc Wt ER
Null 1086.210 0 0.292 1
Weight 1087.195 0.985 0.178 1.637
Sex 1087.450 1.240 0.157 1.859
Genotype 1088.278 2.069 0.104 2.813
Genotype+Weight 1089.012 2.802 0.072 4.060
Supplemental Table 6.5.3 Balance Beam – Speed.
Model AICc ∆ AICc Wt ER
Null 280.621 0 0.297 1
Sex 282.000 1.379 0.149 1.992
Genotype 282.349 1.728 0.125 2.373
Weight 282.746 2.124 0.103 2.893
Genotype*Sex 283.703 3.082 0.064 4.670
Supplemental Table 6.5.4 Balance Beam – Foot Slips.
Model AICc ∆ AICc Wt ER
Genotype*Weight 303.970 0 0.628 1
Genotype+Weight+Sex+(Genotype:Weight) 306.286 2.316 0.197 3.183
Genotype+Sex+Weight+(Weight:Sex)+(Weight:Genotype) 308.573 4.603 0.063 9.988
Genotype+Sex+Weight+(Genotype:Sex)+(Weight:Genotype) 308.596 4.626 0.062 10.105
Genotype 312.273 8.303 0.010 63.536

205
Supplemental Table 6.6.1 Voluntary Wheel Running – Total Rotations.
Model AICc ∆ AICc Wt ER
Genotype*Weight 1948.834 0 0.432 1
Genotype+Weight+Sex+(Genotype:Weight) 1950.988 2.154 0.147 2.935
Null 1951.944 3.110 0.091 4.734
Genotype+Sex+Weight+(Weight:Sex)+(Weight:Genotype) 1952.646 3.812 0.064 6.726
Genotype+Sex+Weight+(Genotype:Sex)+(Weight:Genotype) 1953.288 4.454 0.047 9.273
Supplemental Table 6.6.2 Voluntary Wheel Running – Percentage During Light Cycle.
Model AICc ∆ AICc Wt ER
Genotype 635.748 0 0.299 1
Null 637.526 1.778 0.123 2.433
Genotype+Sex 637.632 1.885 0.116 2.566
Genotype+Weight 637.842 2.094 0.105 2.850
Genotype+Sex+Weight 638.974 3.226 0.060 5.019

206
CHAPTER 7 EARLY DETECTION OF COGNITIVE DEFICITS IN
THE 3XTG-AD MOUSE MODEL OF ALZHEIMER’S DISEASE
Kurt R. Stover, Mackenzie A. Campbell, Christine M. Van Winssen and Richard E.
Brown
Department of Psychology and Neuroscience
Dalhousie University
PO Box 1500, Halifax, NS
Canada B3H 4R2
Published in Behavioural Brain Research, 2015, Volume 289, Pages 29–38

207
7.1 ABSTRACT
At what age can cognitive deficits first be detected in mouse models of
Alzheimer’s disease? The 3xTg-AD mouse model of Alzheimer’s disease (AD) has three
transgenes (APPswe, PS1M146V, and Tau P301L) which cause the development of
amyloid beta plaques, neurofibrillary tangles, and cognitive deficits with age. However,
the published literature is in disagreement about the age at which cognitive deficits are
first detected in these mice. In order to determine which task is the most sensitive in the
early detection of cognitive deficits, we compared 3xTg-AD and B6129SF2 wildtype
mice at 6.5 months of age on a test battery including spontaneous alternation in the Y-
Maze, novel object recognition, spatial memory in the Barnes maze, and cued and
contextual fear conditioning. The 3xTg-AD mice had impaired learning and memory in
the Barnes maze but performed better than B6129SF2 wildtype mice in the Y-Maze and
in contextual fear conditioning. Neither genotype demonstrated a preference in the novel
object recognition task nor was there a genotype difference in cued fear conditioning but
females performed better than males. From our results we conclude that the 3xTg-AD
mice have mild cognitive deficits in spatial learning and memory and that the Barnes
maze was the most sensitive test for detecting these cognitive deficits in 6.5 month old
mice.
208
7.2. INTRODUCTION
The 3xTg-AD mouse model of familial Alzheimer’s disease (AD) was created by
inserting the Swedish amyloid precursor protein (APPswe) and tau (TauP301L) genes into
the embryo of a PS1M146V transgenic mouse (Oddo et al., 2003). The APPswe gene is a
human gene with a mutation associated with familial AD and the PS1M146V gene is a
mouse presenilin 1 (PS1) gene which has a human mutation associated with familial AD
inserted. The TauP301L mutation is associated with human tau pathology. With these
transgenes the 3xTg-AD mouse develops both amyloid and tau pathology. The first
detectable pathology is the development of intracellular amyloid beta at three months of
age followed by the development of extracellular plaques in the neocortex and
hippocampus at six months of age (Billings et al., 2005; Mastrangelo and Bowers, 2008).
The development of tau pathology begins at six months of age, when phosphorylated tau
is detectable in the hippocampus. The phosphorylated tau develops into neurofibrillary
tangles between 18 and 26 months of age (Mastrangelo and Bowers, 2008).
There have been several studies delineating the cognitive behaviour phenotype of
the 3xTg-AD mouse and using behavioural bio-assays to evaluate novel drug treatments
for AD. However the results have not been consistent; differing according to the age and
sex of the mice and the test procedures used. In the Y-Maze test of spontaneous
alternation, a commonly used measure of short term memory, some studies reported that
female 3xTg-AD mice have no deficit at six months of age, some reported a deficit at six
months of age, and others found no deficits until seven months of age (Rosario et al.,
2006; Carroll et al., 2007; Zhang et al., 2010). In the novel object recognition task, some
studies found deficits in six month old female 3xTg-AD mice compared to B6129SF2
209
mice in a 15 minute delay task (Blanchard et al., 2010; Chen et al., 2013). However
Clinton et al. (2007) did not find a deficit in novel object recognition in either male or
female 3xTg-AD mice until 9 months of age in either the 1.5 hour or 24 hour delay task,
likewise Martinez-Coria et al. (Martinez-Coria et al., 2010) found a deficit in both 1.5
hour and 24 hour retention in the novel object recognition task in 9 month old male and
female 3xTg-AD mice compared to age-matched B6129SF2 wildtypes. In the Barnes
maze, six month old 3xTg-AD mice of both sexes had significantly longer escape
latencies and made more errors than control mice (Clinton et al., 2010). In the radial arm
maze the 3xTg-AD mice were impaired in both working and reference memory relative
to B6129SF2 control mice starting at two months of age (Stevens and Brown, 2014).
Some studies have reported deficits in contextual fear conditioning by six months of age
in 3xTg-AD mice of both sexes (Billings et al., 2005; España et al., 2010). Others found
no difference between six month old 3xTg-AD and B6129SF2 wildtype mice in
contextual fear conditioning with a 24 hour delay, but the 3xTg-AD were impaired in in
longer term memory (Pietropaolo et al., 2008). On the other hand Chu et al. (2012)
reported no difference between 3xTg-AD and B6129SF2 mice of either sex in cued or
contextual fear conditioning at 13-14 months of age.
The 3xTg-AD mice are commonly used to assess potential therapies for the
treatment of AD (Adlard et al., 2005; Oddo et al., 2006; Caccamo et al., 2007; Corona et
al., 2010; Hasegawa et al., 2010). In order to determine the effectiveness of novel
therapeutic agents on cognition in the 3xTg-AD mice, one or more of many behavioural
tasks, which differ in sensitivity to detect cognitive impairments in this strain, have been
used. Although there is variability in the ages of the 3xTg-AD mice to test potential AD
210
treatments, cognitive deficits have been reported by 6.5 months of age. However, the
effect size for the cognitive deficits are seldom reported in these studies. If the effect
sizes for the cognitive deficits is very small it may not be replicable and the effect of any
drug treatments will be non-significant; if there are no deficits then cognition cannot be
improved with any drug treatment. The purpose of the present experiment, therefore, was
to test male and female 3xTg-AD mice on a number of commonly used behavioural tests
of cognitive function: spontaneous alternation in the Y-maze, novel object recognition
(NORT), the Barnes maze of spatial memory, and cued and contextual fear conditioning
tasks, in order to determine which test is the most sensitive to the cognitive deficits of
these mice at this age. The sensitivity of each test was evaluated by comparing the effect
sizes for the genotype differences detected in that test. Knowing which test is the most
sensitive will allow researchers to more efficiently screen new therapies by decreasing
the number of animals required to detect a difference and increasing the likelihood of
detecting any differences. Because sex differences in memory have been found in
transgenic mice (Mizuno and Giese, 2010), including the 3xTg-AD mice (Blázquez et al.,
2014), we also examined the effect sizes of sex differences in these cognitive tasks.
7.3 METHODS
7.3.1 ANIMALS
Eighty-five mice, 42 3xTG-AD (21 female and 21 male, Stock # 004807), and 43
B6129SF2 (22 male and 21 female, Stock #101045), were bred in our lab from parents
purchased from the Jackson Laboratory (Bar Harbor, Maine). The mice were weaned at
21 days of age and tested at 6.5 months of age in three cohorts of approximately 28 mice.
The mice were housed in groups of 2-4 same sex littermates in plastic cages (18.75 x 28 x
211
12.5 cm), with a PVC tube (4 cm diameter x 7 cm length) for enrichment, wood chip
bedding, and metal wire covers. They were provided with rodent chow (Purina 5001) and
tap water ad libitum. The mice were individually identified by ear punch and were
genotyped using polymerase chain reaction of the ear punch tissue samples, by Dr. Chris
Sinal (Pharmacology Department, Dalhousie University). The mice were housed in a
colony room maintained at 22±2ºc with a reversed 12:12 light:dark (L:D) cycle (lights off
at 10:00 am). They were tested during the dark phase of the L:D cycle in the order
described below. These mice had completed a motor assessment battery prior to cognitive
testing (Stover et al., 2015a).This research was approved by the Dalhousie University
Committee on Laboratory Animals.
7.3.2 Y-MAZE TEST OF SPONTANEOUS ALTERNATION
The spontaneous alternation test was performed in a symmetrical black Plexiglas
Y-maze with three arms (20 cm long by10 cm wide and 20 cm high) at 120° angles,
designated A, B, and C. Based on the procedure of Carroll et al. (2007), the mice were
placed in the distal end of arm A and allowed to explore the maze for 8 minutes. A video
camera mounted above the maze recorded the movements of the mice for analysis. The
arm entries were recorded and the percentage of alternations (entry in to an arm that
differs from the previous two entries) was calculated with the following formula:
(𝐴𝑙𝑡𝑒𝑟𝑛𝑎𝑡𝑖𝑜𝑛𝑠
𝐴𝑟𝑚 𝐸𝑛𝑡𝑟𝑖𝑒𝑠−2) ∗ 100. The percentage of alternate arm returns (AAR, ex. ABA), and
same arm returns (SAR, ex. AA) were also calculated.
7.3.3 NOVEL OBJECT RECOGNITION TASK
The novel object recognition task (NORT) was performed in an open field (38x38
cm wide by 38 cm tall) with three white walls, and one clear Plexiglas wall for
212
observation , as described by Yan et al. (2004). A camera mounted above the open field
recorded the movements of the mouse throughout the trial. Mice were first given a five
minute habituation trial with no objects in the open field, and then a test phase that
consisted of two trials beginning twenty-four hours later. In the first trial two different
objects were placed in diagonally opposite corners of the open field and the mice were
allowed to explore them for five minutes. Fifteen minutes later one of the objects was
replaced with a novel object and the mouse was again placed in the maze for a second
five minute trial. The objects used were small plastic toys of similar sizes. The maze was
cleaned using 70% ethanol between each trial. The discrimination score for novel object
exploration was calculated with the following formula:
(𝑡𝑖𝑚𝑒 𝑒𝑥𝑝𝑙𝑜𝑟𝑖𝑛𝑔 𝑛𝑜𝑣𝑒𝑙 𝑜𝑏𝑗𝑒𝑐𝑡
𝑡𝑖𝑚𝑒 𝑒𝑥𝑝𝑙𝑜𝑟𝑖𝑛𝑔 𝑛𝑜𝑣𝑒𝑙 𝑜𝑏𝑗𝑒𝑐𝑡 + 𝑡𝑖𝑚𝑒 𝑒𝑥𝑝𝑙𝑜𝑟𝑖𝑛𝑔 𝑓𝑎𝑚𝑖𝑙𝑖𝑎𝑟 𝑜𝑏𝑗𝑒𝑐𝑡) ∗ 100 .
7.3.4 BARNES MAZE TEST OF SPATIAL LEARNING AND MEMORY
The Barnes maze was a white polyethylene platform (122 cm diameter) elevated
48.4 cm from the floor with sixteen holes (4.45 cm diameter) equally spaced around the
perimeter 1.3 cm from the edge, as described by O’Leary and Brown (2012). Four of the
holes (4, 8, 12 and 16) were capable of having a black plastic escape box beneath them. A
buzzer (0–37.2 kHz, 89 dB) and two 150W flood lamps placed 155 cm above the maze
were used as aversive stimuli. A polyvinylchloride tube (8 cm diameter, 12.5cm height)
was used to hold the mouse in the center of the maze before the trial began. A camera
was mounted 1.7 m above the maze and the Limelight tracking system (Actimetrics) used
to track the location of the mice.
Mice were tested in groups of 3-4 and each mouse in the group was assigned a
different escape hole location. There were five phases in the test procedure: habituation,

213
acquisition training, acquisition probe, reversal training, and reversal probe (O’Leary and
Brown, 2013). During the habituation phase, mice were placed in a 2L glass beaker
which was inverted over the assigned escape hole. The mice were then free to explore the
escape hole, escape box, and the adjacent area for two minutes. The acquisition training
phase consisted of two trials per day for 15 days. On each trial, mice were placed in the
center tube and after an interval of 5-10 seconds the tube was lifted and the buzzer was
turned on. The mice were given of 300 seconds to locate the escape hole and if they did
not enter the escape box within this time they were led to the escape hole with a plastic
cup which was used to transport the mice. The maze was cleaned between trials to
prevent odour cues from developing around the escape holes. The latency to enter the
escape hole, distance travelled, and average speed were analyzed for each trial using
Ethovision (Noldus, Wageningen, The Netherlands). The number of errors (when a
mouse dips its head into a hole that is not the escape hole) were recorded by the
experimenter. Repeated head-dips into the same hole were recorded as one error.
The day after acquisition training the mice were given a five minute memory
probe trial with no buzzer turned on. During this trial the escape box was removed and
the maze was rotated 45º so that a non-escape hole was in the correct escape hole
location. For analysis of spatial memory the maze was divided into 16 pie shaped zones
and the number of entries and time spent in each zone were recorded. The following day
mice were given a curtain probe trial using the same procedure with no spatial cues, as
the maze was surrounded by a black curtain. The mice were then given two more days of
acquisition training to counter any effect of the probe trials and then a five day reversal
training phase the escape hole was moved to the opposite side of the maze and. Finally a
214
reversal probe trial (with no curtain) was given using the same procedure as during the
acquisition probe trial.
7.3.5 CONTEXTUAL AND CUED FEAR CONDITIONING
Cued and contextual fear conditioning and testing took place in two identical
MED Associates Inc. (St. Albans, VT) fear conditioning chambers, as described in
Martin and Brown (2010). The front, top, and back of the chamber were transparent
Plexiglas and the other two sides were stainless steel. The floor of the chamber consisted
of 36 3.2 mm stainless steel rods that were capable of delivering a shock. A speaker was
attached to one of the stainless steel walls and a video camera was mounted in front of
one of the Plexiglas walls to record the behaviour of the mouse.
The procedure consisted of a training and test phase, which took place on two
consecutive days. During the training phase, mice were placed in the chamber and their
levels of baseline freezing were recorded for 120 seconds. The mice were then presented
with an 80dB tone for 30 seconds, co-terminating with a two second 0.7mA foot shock,
followed by another 120 second interval and a second tone and foot-shock pairing. Thirty
seconds after the second shock the mice were removed from the chamber and returned to
their home cage. In the memory test phase, mice were given two trials, first contextual
then cued memory. For the contextual memory test, mice were placed in the same
chamber used during training for five minutes, with no tones or shocks delivered, and the
duration of freezing behaviour was recorded using a stopwatch. Differences between
groups in time spent freezing were analyzed. For cued fear memory testing, black
Plexiglas was placed over the floor of the chamber to cover the steel rods, the inside
walls of the testing chamber were covered with black and white striped plastic, and a
215
novel orange odor was introduced into the chamber. The mice were then placed in the
modified chamber and their freezing time was recorded for three minutes, and then a
continuous three minute 80dB tone identical to the tone presented during training was
presented and their level of freezing behaviour was recorded for a second three minutes.
The time spent freezing during the three minute baseline measurement and during the
three minute cued portion of the testing trial were analyzed.
7.3.6 STATISTICAL ANALYSES
For the repeated measures designs (Barnes maze acquisition and reversal tasks
and the cued fear conditioning tasks) linear mixed effects modeling was used to analyze
the measures described. For all other tasks, linear regression models were used. The
second order Akaike information criterion (AICc), the Akaike weight, and the evidence
ratio for all models was calculated, and the model with the lowest AICc was selected and
compared to the null model with an F-test (linear regression models), or a χ2 test (linear
mixed effects models). Confidence intervals (95%) of the coefficients in the models were
calculated. The AIC takes into account the complexity of the model and how well the
model fits the data, while the second order AIC (AICc) corrects for small sample sizes,
but approaches the same value as the the AIC with larger sample sizes (Akaike, 1974;
Burnham and Anderson, 2002). For models with genotype or sex effects, an unbiased
effect size was calculated (Cohen’s d with a Hedge correction, dunb) to determine which
measures showed the largest effects (Cumming, 2014).

216
7.4 RESULTS
7.4.1 Y-MAZE TEST OF SPONTANEOUS ALTERNATION
Three measures of alternation behaviour were calculated: the percentage of
spontaneous alternation behaviours (SAB), the percentage of alternate arm returns
(AAR), and the percentage of same arm returns (SAR). For the percentage of SABs the
linear regression model with the lowest AICc was the model with only genotype
(AICc=714.038, weight=0.429, Supplemental Table 7.1.1, Figure 7.1A), which differed
significantly from the null model (F(1,83)=6.273, p=0.014). Confidence intervals
indicated that the 3xTg-AD mice exhibited significantly more spontaneous alternations
than B6129SF2 (CI95= 1.745 – 15.002 SABs). There were no differences between
genotypes or sexes in the percentage of AARs (Figure 7.1B, Supplemental Table 7.1.2)
or SARs (Figure 7.1C, Supplemental Table 7.1.3).
3 x T g -A D B 6 1 2 9 S F 2
0
2 0
4 0
6 0
S A B
G e n o ty p e
SA
B (
n)
F e m a le
M ale*
3 x T g -A D B 6 1 2 9 S F 2
0
2 0
4 0
6 0
A A R
G e n o ty p e
AA
R (
n)
F e m a le
M ale
3 x T g -A D B 1 2 9 S F 2
0
1 0
2 0
3 0
4 0
S A R
G e n o ty p e
SA
R (
n)
F e m a le
M ale
A B C
Figure 7.1 Mean (± SEM) percentage of spontaneous alternation behaviours (A),
alternate arm returns (B), and same arm returns (C) for male and female 3xTg-AD and
B6129SF2 mice in the Y-maze test of spontaneous alternation. * = a difference between
groups at a 95% confidence interval.
7.4.2 NOVEL OBJECT RECOGNITION TASK
During the test phase of the NORT task, discrimination scores for the amount of
time spent interacting with each object and for the number of interaction bouts were
calculated. There was a slight preference for the novel object (Figure 7.2A and 7.2B),

217
however the best model for each measure was the null model (Supplemental Tables 2.1
and 2.2), which indicated that neither genotype nor sex affected scores for the NORT
task. All groups had scores near 50%, which indicates they spent roughly equal time with
each object.
3 x T g -A D B 1 2 9 S F 2
0
2 0
4 0
6 0
8 0
N O R T T im e
G e n o ty p e
Re
co
gn
itio
n I
nd
ex
(T
ime
)
F e m a le
M ale
3 x T g -A D B 1 2 9 S F 2
0
2 0
4 0
6 0
8 0
N O R T In te ra c t io n s
G e n o ty p e
Re
co
gn
itio
n I
nd
ex
(# I
nte
ra
cti
on
s)
F e m a le
M ale
A B
Figure 7.2 Mean (± SEM) discrimination score for the amount of time (A) and number of
bouts (B) interacting with the novel object compared to the familiar object for male and
female 3xTg-AD and B6129SF2 mice in the novel object recognition task. The dotted
line represents no preference between the novel and familiar object.
7.4.3 BARNES MAZE
For the latency to find the escape hole during the acquisition phase of the Barnes
maze task (Figure 7.3A) the linear mixed effects model with day and sex
(AICc=14131.662, weight=0.300, Supplemental Table 7.3.1), was the best and differed
significantly from the null model (χ2(15, N=85)=539.62, p<0.001). Confidence intervals
indicated females had shorter latencies to escape than males (CI95= -2.033 – 43.134s),
and that the latency to escape decreased over acquisition trials (Day 1 to 15: CI95= -
110.168 – -76.998s).
For the distance travelled during acquisition (Figure 7.3B) the best model had
only day (AICc=18374.018, weight=0.341, supplemental Table 7.3.2), which differed
218
significantly from the null model (χ2(14, N=85)=183.6, p<0.001), indicating that neither
genotype nor sex predicted the distance travelled. Confidence intervals showed that the
distance travelled decreased over days (Day 1 to 15: CI95= -488.380 -303.865cm).
The number of errors (head dips into incorrect escape holes) during acquisition
was best explained by a model with genotype, day, sex, and a genotype by sex interaction
(AICc=8810.488, weight=0.469, Supplemental Table 7.3.3, Figure 7.3D), which differed
significantly from the null model (χ2(17, N=85)=136.39, p<0.0001). Confidence intervals
showed that 3xTg-AD mice made more errors than B6129SF2 wildtype mice (CI95= -
0.397 – 3.619 errors), and that the number of errors decreased throughout acquisition
(CI95= -6.343 – -2.071). The genotype by sex interaction occurred because the male
3xTg-AD mice made more errors than the females (CI95= 0.121 – 5.835 errors), while in
the male B6129SF2 mice made equal or slightly fewer errors than females (CI95= -1.067
– 4.519 errors).
The best model for the average speed during the acquisition trials had day,
genotype, and sex, and both day by sex and day by genotype interactions
(AICc=7082.355, weight=0.677, Supplemental Table 7.3.4, Figure 7.3C), which differed
significantly from the null model (χ2(44,N=85)= 428.66, p<0.0001). Confidence intervals
indicated that 3xTg-AD mice moved faster than B6129SF2 wildtype mice (CI95= 0.517 –
3.381 cm/s), that females moved faster than males (CI95= 1.167 –3.998 cm/s), and that
the average speed increased over days (Day 1 to 15: CI95= 6.900 – 9.001 cm/s). The
genotype by day interaction occurred because there was no difference between genotypes
on day 1 (CI95= -2.067 – 2.054 cm/s), but by day 15 3xTg-AD mice moved faster than
B6129SF2 wildtype mice (CI95= 1.630 – 5.672 cm/s). The day by sex interaction was due
219
to by a similar pattern: on day 1 there was little evidence for a sex difference (CI95= -
1.997 – 2.117 cm/s), but by day 15 females were moving faster than males (CI95= 1.459 –
5.575 cm/s).

220
1 2 3 4 5 6 7 8 9 1 0 1 1 1 2 1 3 1 4 1 5 1 2 3 4 5
0
5 0
1 0 0
1 5 0
2 0 0
2 5 0
L a te n c y to E s c a p e
D a y
La
ten
cy
(s
)
3 xT g -A D F e m a le
3 xT g -A D M a le
B 6 1 2 9 S F 2 F e m a le
B 61 2 9S F 2 M a le
A cq u is itio n R e v e rs a l
1 2 3 4 5 6 7 8 9 1 0 1 1 1 2 1 3 1 4 1 5 1 2 3 4 5
0
2 0 0
4 0 0
6 0 0
8 0 0
1 0 0 0
D is ta n c e
D a y
Dis
tan
ce
(c
m)
3 xT g -A D F e m a le
3 xT g -A D M a le
B 6 1 2 9 S F 2 F e m a le
B 61 2 9S F 2 M a le
A cq u is itio n R e v e rs a l
1 2 3 4 5 6 7 8 9 1 0 1 1 1 2 1 3 1 4 1 5 1 2 3 4 5
0
5
1 0
1 5
2 0
S p e e d
D a y
Sp
ee
d (
cm
/s)
3 xT g -A D F e m a le
3 xT g -A D M a le
B 6 1 2 9 S F 2 F e m a le
B 61 2 9S F 2 M a le
A cq u is itio n R e v e rs a l
1 2 3 4 5 6 7 8 9 1 0 1 1 1 2 1 3 1 4 1 5 1 2 3 4 5
0
5
1 0
1 5
2 0
2 5
E r r o r s
D a y
Erro
rs
(n
)
3 xT g -A D F e m a le
3 xT g -A D M a le
B 6 1 2 9 S F 2 F e m a le
B 61 2 9S F 2 M a le
A cq u is itio n R e v e rs a l
A B
C D
Figure 7.3 Mean (± SEM) latency (s) to escape (A), distance travelled (B), number of incorrect head dips (Errors, C), and moving
speed (D) for male and female 3xTg-AD and B6129SF2 mice during acquisition and reversal learning in the Barnes maze

221
On the acquisition probe trial the data for one 3xTg-AD male mouse was not
collected due to an equipment error. The best linear regression model for the duration of
time spent in the correct zone (Figure 7.4A) had only genotype (AICc=896.423,
weight=0.419, Supplemental Table 7.3.5), which was significantly different from the null
model (F(1,82)=4.766, p=0.032). Confidence intervals indicated that 3xTg-AD mice
spent less time in the correct zone than B6129SF2 wildtype mice (CI95= -44.63 – -3.38 s).
For the frequency of entries into the correct zone during the acquisition probe trial
(Figure 7.4B) the best model had only sex (AICc=529.332, weight=0.382, Supplemental
Table 7.3.6) as there was a trend for males to enter the correct zone less frequently than
females (CI95= -4.318 – 0.415 entries), however the model did not differ significantly
from the null model (F(1,82)=82.012, p=0.104).
During the probe trial with a curtain blocking the spatial cues the null model was
the best model for both time spent in the correct zone (AICc=635.461, weight=0.439,
Figure 7.4C, Supplemental Table 7.3.7) and the frequency of entries into the correct zone
(AICc=401.454, weight=0.375, Figure 7.4D, Supplemental Table 7.3.8), indicating that
neither genotype nor sex predicted the amount of time spent in the correct quadrant
during the curtain probe.

222
3 x T g -A D B 6 1 2 9 S F 2
0
5 0
1 0 0
1 5 0
A c q u is ito n P ro b e - D u ra t io n
G e n o ty p e
Du
ra
tio
n i
n C
orre
ct
(s)
F e m a le
M ale
*
3 x T g -A D B 6 1 2 9 S F 2
0
5
1 0
1 5
A c q u is ito n P ro b e - F re q u e n c y
G e n o ty p e
Fre
qu
en
cy
in
Co
rre
ct
(n) F e m a le
M ale
3 x T g -A D B 6 1 2 9 S F 2
0
1 0
2 0
3 0
C u rta in P ro b e - D u ra t io n
G e n o ty p e
Du
ra
tio
n i
n C
orre
ct
(s) F e m a le
M ale
3 x T g -A D B 6 1 2 9 S F 2
0
2
4
6
8
1 0
C u rta in P r o b e - F r e q u e n c y
G e n o ty p e
Fre
qu
en
cy
in
Co
rre
ct
(n) F e m a le
M ale
3 x T g -A D B 6 1 2 9 S F 2
0
1 0
2 0
3 0
4 0
R e v e rs a l P ro b e - D u ra t io n
G e n o ty p e
Du
ra
tio
n i
n C
orre
ct
(s) F e m a le
M ale
3 x T g -A D B 6 1 2 9 S F 2
0
2
4
6
8
1 0
R e v e rs a l P ro b e - F re q u e n c y
G e n o ty p e
Fre
qu
en
cy
in
Co
rre
ct
(n) F e m a le
M ale
*
A B
C
E
D
F
Figure 7.4 Mean (± SEM) duration of time spent in the correct zone during the
acquisition (A), curtain (C) and reversal (E) probe trials in the Barnes maze. The dotted
line represents chance performance. Mean (± SEM) frequency of entries into the correct
zone during the acquisition (B), curtain (D), and reversal (F) probe trial in the Barnes
maze for male and female 3xTg-AD and B6129SF2 mice. * = a difference between
groups at a 95% confidence interval.

223
For the latency to escape during reversal training (Figure 7.3A) the best linear
mixed effects model had genotype, sex, and day (AICc=4522.949, weight=0.09,
Supplemental Table 7.3.9), which was significantly different from the null model (χ2(6,
N=85)=57.527, p<0.0001). The confidence intervals indicated that 3xTg-AD mice
escaped faster than B6129SF2 wildtype mice (CI95= -2.643 – 60.568 s), that females
escaped faster than males (CI95= -5.734 – 56.82 s), and that latency to escape decreased
over days (Day 1 to 5: CI95= -53.847 – -30.405 s).
The best linear mixed effects model for average distance travelled during reversal
learning (Figure 7.3B) had day, genotype, sex, and a genotype by sex interaction
(AICc=5801.704, weight=0.657, Supplemental Table 7.3.10), which was significantly
different from the null model (χ2(7, N=85)=55.867, p<0.0001). Confidence intervals
indicated that there was a significant decrease in distanced travelled over days during
reversal (Day 1 to 5: CI95= -282.336 – -153.0194), and the genotype by sex interaction
showed that male 3xTg-AD mice travelled a longer distance than females (CI95= 71.363 –
323.625 cm), but within B6129SF2 wildtypes there was no sex difference (CI95= -
201.098 – 46.962 cm).
The number of errors during reversal learning (Figure 7.3C) was best explained
by a model with day, genotype, sex, and a genotype by sex interaction (AICc=2778.690,
weight=0.747, Supplemental Table 7.3.11), which was significantly different from the
null model (χ2(7,N=85)=55.061, p<0.0001). Confidence intervals showed that 3xTg-AD
mice made more errors than B6129SF2 wildtypes (CI95= 0.185 – 4.364 errors), that males
made more errors than females (CI95= -0.600 – 3.544 errors), and that the number of
errors decreased over days (Day 1 to 5: -7.333 -3.814 errors). There was a genotype by
224
sex interaction as there was no difference between male and female B6129SF2 wildtype
mice (CI95= -1.218 – 4.738 errors), but the 3xTg-AD males made more errors than 3xTg-
AD females (CI95= 1.804 – 7.702 errors).
For average speed during the reversal trials (Figure 7.3D) the best model had day,
genotype, and sex (AICc=2393.387, weight=0.299, Supplemental Table 7.3.12), which
was significantly different from the null model (χ2(6, N=85)=79.194, p<0.0001).
Confidence intervals indicated that 3xTg-AD mice moved faster than B6129SF2 wildtype
mice (CI95= -0.200 – 3.812 cm/s), that females moved faster than males (CI95= 1.217 –
5.300 cm/s), and that speed increased over days (CI95= 2.622 – 4.623 cm/s).
During the reversal phase probe trial the data of two mice (both female B6129SF2
wildtypes) was not collected due to an equipment error. The best model for the duration
of time spent in the correct zone (Figure 7.4E) was the null model (AICc=732.973,
weight=0.454, Supplemental Table 7.3.13). The best model for the frequency of entries
into the correct zone (Figure 7.4F) had only genotype (AICc=466.261, weight=0.597,
Supplemental Table 7.3.14), which was significantly different from the null model
(F(1,81)=11.003, p=0.001). The confidence intervals indicated that 3xTg-AD mice
performed better on the reversal probe as they made more entries into the correct zone
than B6129SF2 wildtype mice (CI95= 1.047 – 4.543 entries).
7.4.4 CONTEXTUAL AND CUED FEAR MEMORY
During the fear memory tests the total time spent freezing was analyzed. The data
from 2 mice were lost due to an equipment error (one 3xTg-AD female and one
B6129SF2 wildtype female). During the contextual fear memory trial the best linear
regression model for amount of time spent freezing (Figure 7.5A) had both genotype and

225
sex (AICc=919.399, weight=0.625, Supplemental Table 7.4.1), which was significantly
different from the null model (χ2(7, N=83)=7.068, p<0.001). Confidence intervals
indicated that the 3xTg-AD mice spent more time freezing than B6129SF2 wildtype mice
(CI95= 8.66 – 59.40 s), and that females spent more time freezing than males (CI95= 12.78
– 63.33 s).
The data of five mice were lost due to an equipment error for the cued trials (one
3xTg-AD male, one 3xTg-AD female, and three B6129SF2 wildtype females). For the
amount of time spent freezing (Figure 7.5B) the best model had test phase, sex, and a test
phase by sex interaction (AICc=1587.764, weight=.0245, Supplemental Table 7.4.2),
which was significantly different from the null model (χ2(3, N=80)=195.42, p<0.0001).
Confidence intervals indicated that mice spent more time freezing during the cue phase
(CI95= 90.927 – 109.581 s), and that females spent more time freezing than males (CI95=
5.911– 30.0275 s). The test phase by sex interaction occurred because there was no sex
difference during the no-cue phase (CI95= -23.055 – 7.706 s), but females spent more
time freezing than males during the cue phase (CI95= 12.683 – 43.545 s).
3 x T g -A D B 6 1 2 9 S F 2
0
5 0
1 0 0
1 5 0
C o n te x t F re e z in g T im e
G e n o ty p e
Tim
e F
re
ez
ing
(s
)
F e m a le
M ale
*
A
3 xT g -A D
N o C u e C u e
0
5 0
1 0 0
1 5 0
2 0 0C u e d T im e F re e z in g
Fre
ez
ing
Tim
e (
s)
F e m a le
M ale
B 6 1 2 9 S F 2 3 xT g -A D B 6 1 2 9 S F 2
* *
B
Figure 7.5 Mean (± SEM) time spent freezing during the context (A), and cued (B)

226
memory tests for male and female 3xTg-AD and B6129SF2 mice. * = a difference
between groups at a 95% confidence interval.
7.5.5 EFFECT SIZE COMPARISON
For all of the measures with significant genotype or sex differences, the effect
sizes were compared using Cohen’s d with a Hedges correction for an unbiased measure
of effect size (dunb) (Tables 1 and 2). In Table 7.1 positive effect sizes indicate higher
scores in 3xTg-AD mice relative to B6129SF2 wildtypes and negative scores indicate
higher scores in B6129SF2 wildtypes. The largest deficit in cognitive function in 3xTg-
AD mice compared to B6129SF2 wildtypes was the decreased amount of time that 3xTg-
AD mice spent in the correct zone during the acquisition probe trial in the Barnes maze
relative to B6129SF2 wildtype mice (dunb=-0.472, CI95= -0.918 – -0.026) and the next
largest deficit with a CI that does not include 0 was the number of errors during the
reversal phase in the Barnes maze (dunb= 0.300 CI95= 0.107 – 0.494). This indicates that
the Barnes maze was the most sensitive test for detecting cognitive deficits in the 3xTg-
AD mice at 6.5 months of age.
Table 7.1 Genotype difference effect size estimates were calculated with a pooled SD and
Hedges correction for all models including genotype. Positive values indicate 3xTg-AD
mice had higher scores than B6129SF2 wildtype mice and negative scores indicate
B6129SF2 wildtype mice had higher scores than 3xTg-AD mice. A ‘#’ indicates that the
confidence interval includes zero. Measure dunb 95% Confidence Interval
3xTg-AD higher than Wildtype Lower Upper
Barnes Maze – Reversal Probe Frequency Correct 0.721 0.265 1.178
Fear Conditioning – Context Freezing Time 0.554 0.103 1.004
Y-Maze – SAB 0.538 0.094 0.983
Barnes Maze – Acquisition Speed (Day 15) 0.490 0.046 0.933
Barnes Maze – Reversal Errors 0.300 0.107 0.494
Barnes Maze – Reversal Speed 0.286 0.093 0.480
Barnes Maze – Reversal Distance 0.185 0.008 0.378
Wildtype higher than 3xTg-AD
Barnes Maze – Reversal Latency (Day 5) -0.526 -0.970 -0.082
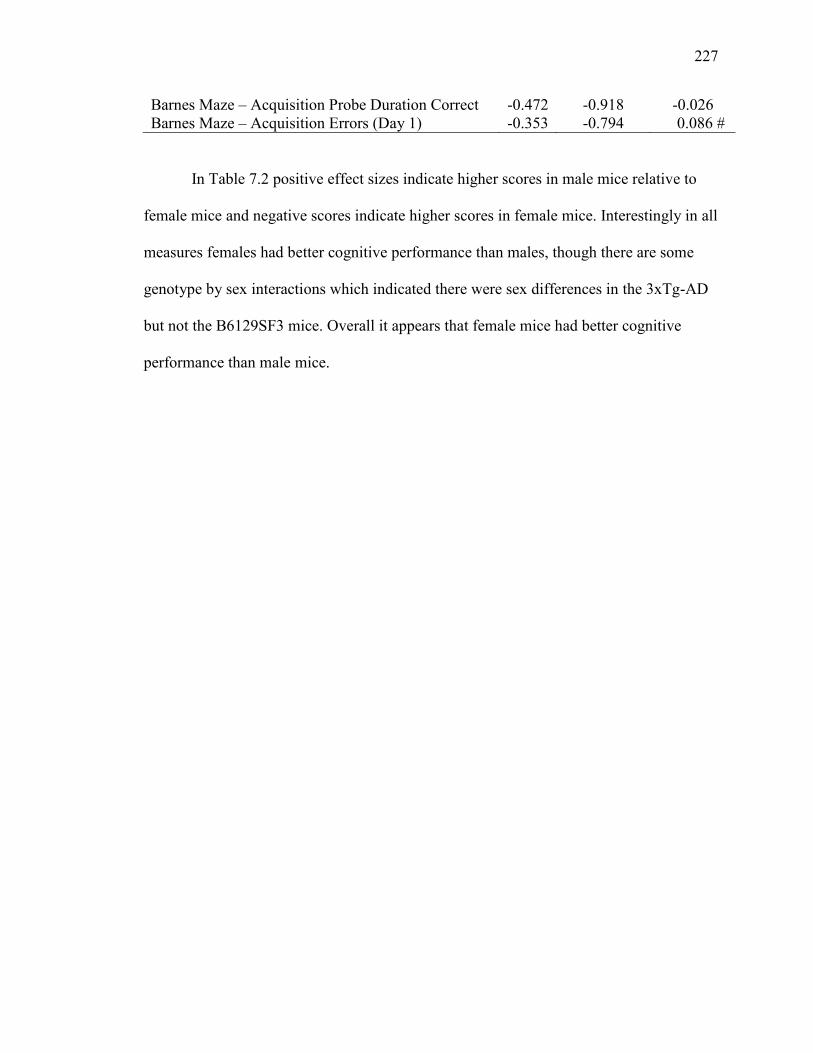
227
Barnes Maze – Acquisition Probe Duration Correct -0.472 -0.918 -0.026
Barnes Maze – Acquisition Errors (Day 1) -0.353 -0.794 0.086 #
In Table 7.2 positive effect sizes indicate higher scores in male mice relative to
female mice and negative scores indicate higher scores in female mice. Interestingly in all
measures females had better cognitive performance than males, though there are some
genotype by sex interactions which indicated there were sex differences in the 3xTg-AD
but not the B6129SF3 mice. Overall it appears that female mice had better cognitive
performance than male mice.
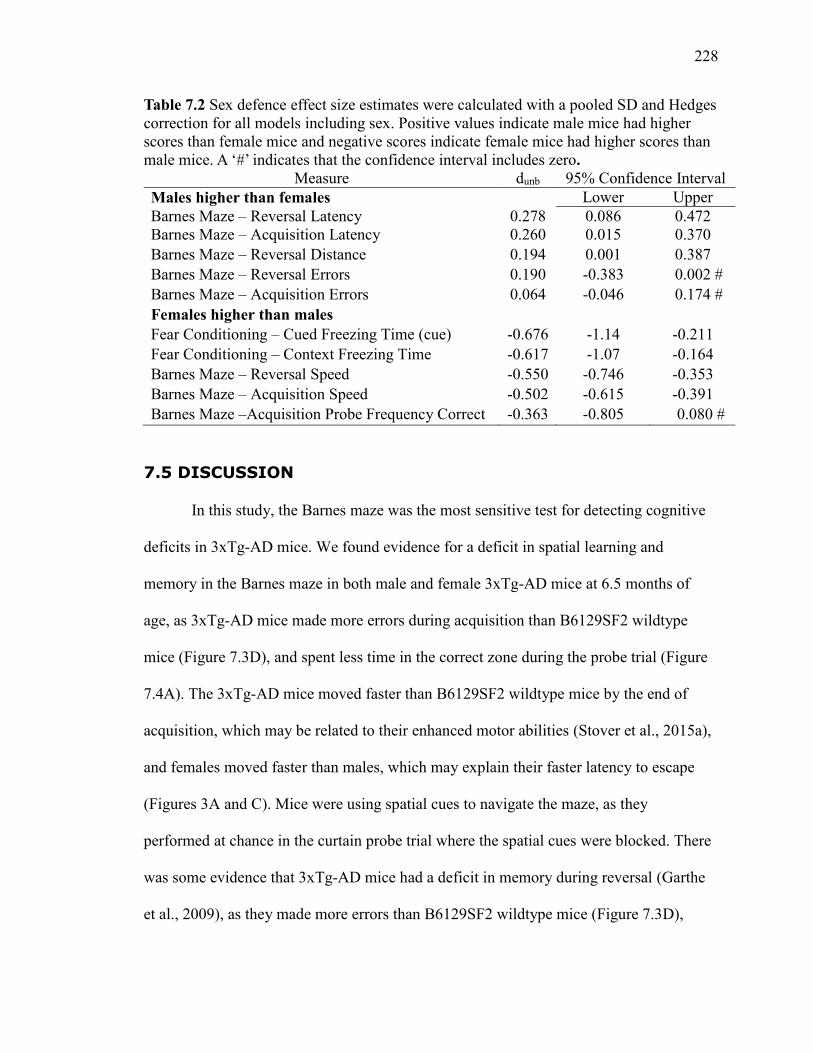
228
Table 7.2 Sex defence effect size estimates were calculated with a pooled SD and Hedges
correction for all models including sex. Positive values indicate male mice had higher
scores than female mice and negative scores indicate female mice had higher scores than
male mice. A ‘#’ indicates that the confidence interval includes zero.
Measure dunb 95% Confidence Interval
Males higher than females Lower Upper
Barnes Maze – Reversal Latency 0.278 0.086 0.472
Barnes Maze – Acquisition Latency 0.260 0.015 0.370
Barnes Maze – Reversal Distance 0.194 0.001 0.387
Barnes Maze – Reversal Errors 0.190 -0.383 0.002 #
Barnes Maze – Acquisition Errors 0.064 -0.046 0.174 #
Females higher than males
Fear Conditioning – Cued Freezing Time (cue) -0.676 -1.14 -0.211
Fear Conditioning – Context Freezing Time -0.617 -1.07 -0.164
Barnes Maze – Reversal Speed -0.550 -0.746 -0.353
Barnes Maze – Acquisition Speed -0.502 -0.615 -0.391
Barnes Maze –Acquisition Probe Frequency Correct -0.363 -0.805 0.080 #
7.5 DISCUSSION
In this study, the Barnes maze was the most sensitive test for detecting cognitive
deficits in 3xTg-AD mice. We found evidence for a deficit in spatial learning and
memory in the Barnes maze in both male and female 3xTg-AD mice at 6.5 months of
age, as 3xTg-AD mice made more errors during acquisition than B6129SF2 wildtype
mice (Figure 7.3D), and spent less time in the correct zone during the probe trial (Figure
7.4A). The 3xTg-AD mice moved faster than B6129SF2 wildtype mice by the end of
acquisition, which may be related to their enhanced motor abilities (Stover et al., 2015a),
and females moved faster than males, which may explain their faster latency to escape
(Figures 3A and C). Mice were using spatial cues to navigate the maze, as they
performed at chance in the curtain probe trial where the spatial cues were blocked. There
was some evidence that 3xTg-AD mice had a deficit in memory during reversal (Garthe
et al., 2009), as they made more errors than B6129SF2 wildtype mice (Figure 7.3D),
229
which could also be an indication that they have decreased cognitive flexibility.
However, there was no evidence of a memory deficit in the reversal probe trial (Figures
4E and F). These findings are similar to those of Clinton et al. (2010), who found that
3xTg-AD mice made more errors and had a longer latency to escape than B6129SF2
wildtype mice at six months of age in their Barnes maze protocol. Our analysis of effect
sizes indicated that the Barnes maze was the best task of those we used for detecting
memory deficits in the 3xTg-AD mice, but the apparatus and procedure used must be
carefully considered. O’Leary and Brown (2012, 2013) demonstrated that a curtain probe
trial where the spatial cues are blocked must be used to indicate whether or not the mice
are using a spatial strategy and determined the optimal apparatus design to ensure the
mice are able to use spatial search strategies, and we used these parameters in this study.
This Barnes maze paradigm has also been used to detect cognitive deficits in the
APPswe/PS1dE9 mouse model of AD at 16 months of age (O’Leary and Brown, 2009).
In contextual fear conditioning we found no evidence for a memory deficit in
3xTg-AD mice at 6.5 months of age. In fact the 3xTg-AD mice spent a greater amount of
time freezing than the B6129SF2 wildtype mice (Figure 7.5A), so it is possible that the
3xTg-AD mice have better memory on this task or found the stimulus more anxiety-
inducing than the B6129SF2 wildtype mice. Females spent a greater amount of time
freezing than males in both genotypes. There are conflicting reports about when the
3xTg-AD develop a deficit in this task, with some reporting a deficit by six months of
age and others reporting no difference between genotypes by that age or even at 13
months of age (Billings et al., 2005; Pietropaolo et al., 2008; España et al., 2010; Chu et
al., 2012). Our results showed an increase in the amount of time spent freezing during the

230
cue, indicating that all mice learned the task (Figure 7.5B). During the cued phase female
mice spent more time freezing than male mice, which may indicate that males had a small
memory deficit. In support of our findings with 6.5 month old mice Chu et al. (2012)
found no difference between male or female 3xTg-AD and B6129SF2 mice in cued fear
conditioning at 13-14 months of age.
In the Barnes maze, we found sex differences in memory as male 3xTg-AD
performed worse than female 3xTg-AD mice, but there was no sex effect in B6129SF2
mice. This finding is supported by the results of Stevens and Brown (2014), who found
that male 3xTg-AD mice had worse working and reference memory performance than
females on the radial arm maze at 2, 6, 12, and 15 months of age in a cross-sectional
study, but no difference in B6129SF2 mice. There are other reports of sex differences in
spatial memory in this strain. Clinton et al. (2007) found that on the reference memory
task in the Morris water maze (MWM) female mice performed worse than male mice at
six and nine months of age, but there were no sex differences at two, four, twelve of
fifteen months of age. Blázquez et al. (Blázquez et al., 2014) also found that female
3xTg-AD had poorer learning than males in the MWM at 12 and 15 months of age. In
fear conditioning we found that female mice of both genotypes had better performance
than males in both cued and contextual fear memory. However Clinton et al. (2007)
found that female 3xTg-AD mice performed worse than male mice in an inhibitory
avoidance task.
Male 3xTg-AD mice have a greater immune dysfunction and a higher mortality
rate than female 3xTg-AD mice (Giménez-Llort et al., 2008). Immune function appears
to be impaired in 3xTg-AD mice at two months of age, and by 12 months of age there are

231
severe immunological abnormalities, including splenomegaly, which may be the result of
autoimmune disease in transgenic mice, though this has only been studied in male 3xTg-
AD mice (Marchese et al., 2014). We have found that male 3xTg-AD mice died
significantly earlier than females (450 vs 744 days), which may explain why males
performed worse than females on some tasks (Rae and Brown, Unpublished Results).
In the Y-maze spatial alternation test we found that 6.5 month old 3xTg-AD mice
performed more spontaneous alternations than the B6129SF2 wildtype mice, indicating
they have no deficit in this task at this age (Figure 7.1A and 7.1C). We found similar
levels of spontaneous alternations in our 3xTg-AD mice (~50%, Figure 7.1A), but lower
levels (~35%, Figure 7.1A) in our B6129SF2 wildtype mice compared to other reports
(Rosario et al., 2006; Carroll et al., 2007; Zhang et al., 2010). In the novel object
recognition task we found no difference between genotypes or sexes, no mice appeared to
have a preference for the novel object, indicating that the mice did not perform the task as
expected (Figure 7.2A and 7.2B). There are conflicting reports in the literature about
when the 3xTg-AD mice develop a deficit on this task. There are reports of a deficit in a
15 minute delay short-term memory version of this task in female 3xTg-AD at six months
of age (Blanchard et al., 2010; Chen et al., 2013), and reports of no differences until 9
months of age in 1.5 and 24 hour memory versions of this task (Clinton et al., 2007;
Martinez-Coria et al., 2010). It is possible that the 3xTg-AD mice have only a deficit in
short term memory at six months of age, which is why we were unable to detect a
difference in our 24 hour test. Another issue may be differences in our control mice; we
found little preference for the novel object (~50%) in our B6129SF2 wildtype mice,
while other studies typically find a preference score above 70%.

232
Both the Y-maze and the novel object recognition task are often used as
behavioural tests when assessing novel drug treatments for AD (Rosario et al., 2006;
Carroll et al., 2007; Ma et al., 2009; Blanchard et al., 2010; Corona et al., 2010; García-
Mesa et al., 2011). However we found no difference between 3xTg-AD and B6129SF2
mice using these tasks at 6.5 months of age. In addition to the Y-maze or novel object
recognition task a test of spatial memory, such as the Barnes maze, should be used to
increase the chances of detecting a deficit, and any reduction in that deficit.
One issue that arises when attempting to compare the results of behavioural tests
of 3xTg-AD mice across studies is the variety of control strains that have been used, each
of which may have a distinct behavioural phenotype. Some studies have used the original
background strain provided by Dr. Frank LaFerla
(C7BL/6;129X1/SvJ;129S1/Sv)(Billings et al., 2007), while others, including us, used
B6129SF2 mice (the second generation offspring of mice created by a cross between
C57BL/6J females and 129S1/SvImJ males), which approximates the control strain and
are recommend by the supplier of 3xTg-AD mice
(http://jaxmice.jax.org/strain/004807.html), and one study used C57BL/6J as a control
group (Sterniczuk et al., 2010b).
Another issue is the age of the control mice used: two studies used only one age
of B6129SF2 wildtype mice when comparing across several ages of 3xTg-AD mice,
while others used C57BL/6J rather than B6129SF2 mice as a control strain (Rosario et
al., 2006; Carroll et al., 2007; Sterniczuk et al., 2010b). A third problem is the source of
the mice: some researchers received the mice from the creator of the strain (Dr. Frank
233
LaFerla), while others purchased the mice from the Jackson Laboratories (Rosario et al.,
2006; Carroll et al., 2007).
Differences in motor performance between 3xTg-AD and B6129SF3 mice are an
important consideration when evaluating behavioural tasks. We have previously found
enhanced motor performance on the Rotarod in the 3xTg-AD relative to B6129SF2 mice
(Oore et al., 2013; Stover et al., 2015a), and in the present study we found that the 3xTg-
AD mice travelled faster than the B6129SF2 mice during the acquisition phase of the
Barnes maze, which can confound the latency measure.
After comparing the effect sizes for significant genotype differences (Table 7.1),
the largest cognitive deficit in 3xTg-AD mice relative to B6129SF2 wildtype mice was
the amount of time spent in the correct quadrant during the acquisition probe of the
Barnes maze (dunb= -0.472, CI95= -0.026 – 0.918). The Barnes maze, specifically the
acquisition phase and probe, appears to be the most sensitive task to detect a cognitive
deficit in the 3xTg-AD mice. The reversal phase of the Barnes maze showed little
difference between the genotypes, possibly due to the amount of training, and so could be
omitted in future testing. We also found that females generally had better cognitive
performance than males. Overall at six months of age the 3xTg-AD mice have some mild
cognitive deficits compared to B6129SF2 mice and so could be suitable for testing
interventions that are expected to have a large effect, for more subtle effects the 3xTg-
AD may need to be used at an older age when the cognitive deficits are more
pronounced. However the sex difference in mortality suggests that male and female
3xTg-AD mice differ in rates of ageing, or that males die at middle age, possibly due to
immune complications, which may confound the results of neuro-behavioural studies.

234
7.6 ACKNOWLEDGEMENTS
This research was funded by an NSERC grant to REB. The authors would like to
thank Dr. Rachel Dingle and Dr. Aimee Wong for their assistance in this project.
235
7.7 REFERENCES
Adlard PA, Perreau VM, Pop V, Cotman CW (2005) Voluntary exercise decreases
amyloid load in a transgenic model of Alzheimer’s disease. J Neurosci 25:4217–
4221.
Akaike H (1974) A new look at the statistical model identification. Autom Control IEEE
Trans 19:716–723.
Billings LM, Green KN, McGaugh JL, LaFerla FM (2007) Learning decreases A beta*56
and tau pathology and ameliorates behavioral decline in 3xTg-AD mice. J Neurosci
27:751–761.
Billings LM, Oddo S, Green KN, McGaugh JL, LaFerla FM (2005) Intraneuronal Abeta
causes the onset of early Alzheimer’s disease-related cognitive deficits in transgenic
mice. Neuron 45:675–688.
Blanchard J, Wanka L, Tung Y-C, Cárdenas-Aguayo M del C, LaFerla FM, Iqbal K,
Grundke-Iqbal I (2010) Pharmacologic reversal of neurogenic and neuroplastic
abnormalities and cognitive impairments without affecting Aβ and tau pathologies in
3xTg-AD mice. Acta Neuropathol 120:605–621.
Blázquez G, Cañete T, Tobeña A, Giménez-Llort L, Fernández-Teruel A (2014) Cognitive
and emotional profiles of aged Alzheimer’s disease (3×TgAD) mice: Effects of
environmental enrichment and sexual dimorphism. Behav Brain Res 268:185–201.
Burnham KP, Anderson DR (2002) Model selection and multimodel inference: A
practical information-theoretic approach, 2nd ed. New York: Springer Science &
Business Media.
Caccamo A, Oddo S, Tran LX, LaFerla FM (2007) Lithium reduces tau phosphorylation
but not A beta or working memory deficits in a transgenic model with both plaques
and tangles. Am J Pathol 170:1669–1675.
Carroll JC, Rosario ER, Chang L, Stanczyk FZ, Oddo S, LaFerla FM, Pike CJ (2007)
Progesterone and estrogen regulate Alzheimer-like neuropathology in female 3xTg-
AD mice. J Neurosci 27:13357–13365.
Chen Y, Liang Z, Blanchard J, Dai C-L, Sun S, Lee MH, Grundke-Iqbal I, Iqbal K, Liu F,
Gong C-X (2013) A Non-transgenic mouse model (icv-STZ mouse) of Alzheimer’s
disease: Similarities to and differences from the transgenic model (3xTg-AD
mouse). Mol Neurobiol 47:711–725.
Chu J, Giannopoulos PF, Ceballos-Diaz C, Golde TE, Praticò D (2012) 5-Lipoxygenase
gene transfer worsens memory, amyloid, and tau brain pathologies in a mouse model
of Alzheimer disease. Ann Neurol 72:442–454.
236
Clinton LK, Billings LM, Green KN, Caccamo A, Ngo J, Oddo S, McGaugh JL, LaFerla
FM (2007) Age-dependent sexual dimorphism in cognition and stress response in
the 3xTg-AD mice. Neurobiol Dis 28:76–82.
Clinton LK, Blurton-Jones M, Myczek K, Trojanowski JQ, LaFerla FM (2010)
Synergistic Interactions between Abeta, tau, and alpha-synuclein: acceleration of
neuropathology and cognitive decline. J Neurosci 30:7281–7289.
Corona C, Masciopinto F, Silvestri E, Viscovo A Del, Lattanzio R, Sorda R La,
Ciavardelli D, Goglia F, Piantelli M, Canzoniero LMT, Sensi SL (2010) Dietary zinc
supplementation of 3xTg-AD mice increases BDNF levels and prevents cognitive
deficits as well as mitochondrial dysfunction. Cell Death Dis 1:e91.
Cumming G (2014) The new statistics: why and how. Psychol Sci 25:7–29.
España J, Giménez-Llort L, Valero J, Miñano A, Rábano A, Rodriguez-Alvarez J, LaFerla
FM, Saura CA (2010) Intraneuronal beta-amyloid accumulation in the amygdala
enhances fear and anxiety in Alzheimer’s disease transgenic mice. Biol Psychiatry
67:513–521.
García-Mesa Y, López-Ramos JC, Giménez-Llort L, Revilla S, Guerra R, Gruart A,
Laferla FM, Cristòfol R, Delgado-García JM, Sanfeliu C (2011) Physical exercise
protects against Alzheimer’s disease in 3xTg-AD mice. J Alzheimers Dis 24:421–
454.
Garthe A, Behr J, Kempermann G (2009) Adult-generated hippocampal neurons allow
the flexible use of spatially precise learning strategies. PLoS One 4.
Giménez-Llort L, Arranz L, Maté I, De la Fuente M (2008) Gender-specific
neuroimmunoendocrine aging in a triple-transgenic 3xTg-AD mouse model for
Alzheimer’s disease and its relation with longevity. Neuroimmunomodulation
15:331–343.
Hasegawa T, Mikoda N, Kitazawa M, LaFerla FM (2010) Treatment of Alzheimer’s
disease with anti-homocysteic acid antibody in 3xTg-AD male mice. PLoS One
5:e8593.
Ma Q-L, Yang F, Rosario ER, Ubeda OJ, Beech W, Gant DJ, Chen PP, Hudspeth B, Chen
C, Zhao Y, Vinters H V, Frautschy SA, Cole GM (2009) Beta-amyloid oligomers
induce phosphorylation of tau and inactivation of insulin receptor substrate via c-Jun
N-terminal kinase signaling: suppression by omega-3 fatty acids and curcumin. J
Neurosci 29:9078–9089.
Marchese M, Cowan D, Head E, Ma D, Karimi K, Ashthorpe V, Kapadia M, Zhao H,
Davis P, Sakic B (2014) Autoimmune manifestations in the 3xTg-AD model of
Alzheimer’s disease. J Alzheimers Dis 39:191–210.

237
Martin AL, Brown RE (2010) The lonely mouse: verification of a separation-induced
model of depression in female mice. Behav Brain Res 207:196–207.
Martinez-Coria H, Green KN, Billings LM, Kitazawa M, Albrecht M, Rammes G,
Parsons CG, Gupta S, Banerjee P, LaFerla FM (2010) Memantine improves
cognition and reduces Alzheimer’s-like neuropathology in transgenic mice. Am J
Pathol 176:870–880.
Mastrangelo MA, Bowers WJ (2008) Detailed immunohistochemical characterization of
temporal and spatial progression of Alzheimer’s disease-related pathologies in male
triple-transgenic mice. BMC Neurosci 9:81.
Mizuno K, Giese KP (2010) Towards a molecular understanding of sex differences in
memory formation. Trends Neurosci 33:285–291.
O’Leary TP, Brown RE (2009) Visuo-spatial learning and memory deficits on the Barnes
maze in the 16-month-old APPswe/PS1dE9 mouse model of Alzheimer’s disease.
Behav Brain Res 201:120–127.
O’Leary TP, Brown RE (2012) The effects of apparatus design and test procedure on
learning and memory performance of C57BL/6J mice on the Barnes maze. J
Neurosci Methods 203:315–324.
O’Leary TP, Brown RE (2013) Optimization of apparatus design and behavioral
measures for the assessment of visuo-spatial learning and memory of mice on the
Barnes maze. Learn Mem 20:85–96.
Oddo S, Caccamo A, Shepherd JD, Murphy MP, Golde TE, Kayed R, Metherate R,
Mattson MP, Akbari Y, LaFerla FM (2003) Triple-transgenic model of Alzheimer’s
Disease with plaques and tangles: Intracellular Aβ and synaptic dysfunction. Neuron
39:409–421.
Oddo S, Vasilevko V, Caccamo A, Kitazawa M, Cribbs DH, LaFerla FM (2006)
Reduction of soluble Abeta and tau, but not soluble Abeta alone, ameliorates
cognitive decline in transgenic mice with plaques and tangles. J Biol Chem
281:39413–39423.
Oore JJ, Fraser LM, Brown RE (2013) Age-related changes in motor ability and motor
learning in triple transgenic (3xTg-AD) and control (B6129SF1/J) mice on the
accelerating Rotarod. Proc Nov Scotian Inst Sci 74:281–296.
Pietropaolo S, Feldon J, Yee BK (2008) Age-dependent phenotypic characteristics of a
triple transgenic mouse model of Alzheimer disease. Behav Neurosci 122:733–747.
Rae EA, Brown RE (2015) The problem of genotype and sex differences in life
expectancy in transgenic mice. Unpublshed Results.
238
Rosario ER, Carroll JC, Oddo S, LaFerla FM, Pike CJ (2006) Androgens regulate the
development of neuropathology in a triple transgenic mouse model of Alzheimer’s
disease. J Neurosci 26:13384–13389.
Sterniczuk R, Dyck RH, Laferla FM, Antle MC (2010) Characterization of the 3xTg-AD
mouse model of Alzheimer’s disease: part 1. Circadian changes. Brain Res
1348:139–148.
Stevens LM, Brown RE (2014) Reference and working memory deficits in the 3xTg-AD
mouse between 2 and 15-months of age: A cross-sectional study. Behav Brain Res
278C:496–505.
Stover KR, Campbell MA, Van Winssen CM, Brown RE (2015) Analysis of motor
function in 6 month old male and female 3xTg-AD mice. Behav Brain Res 281:16–
23.
Yan QJ, Asafo-Adjei PK, Arnold HM, Brown RE, Bauchwitz RP (2004) A phenotypic
and molecular characterization of the fmr1-tm1Cgr fragile X mouse. Genes Brain
Behav 3:337–359.
Zhang Y, Kurup P, Xu J, Carty N, Fernandez SM, Nygaard HB, Pittenger C, Greengard P,
Strittmatter SM, Nairn AC, Lombroso PJ (2010) Genetic reduction of striatal-
enriched tyrosine phosphatase (STEP) reverses cognitive and cellular deficits in an
Alzheimer’s disease mouse model. Proc Natl Acad Sci U S A 107:19014–19019.
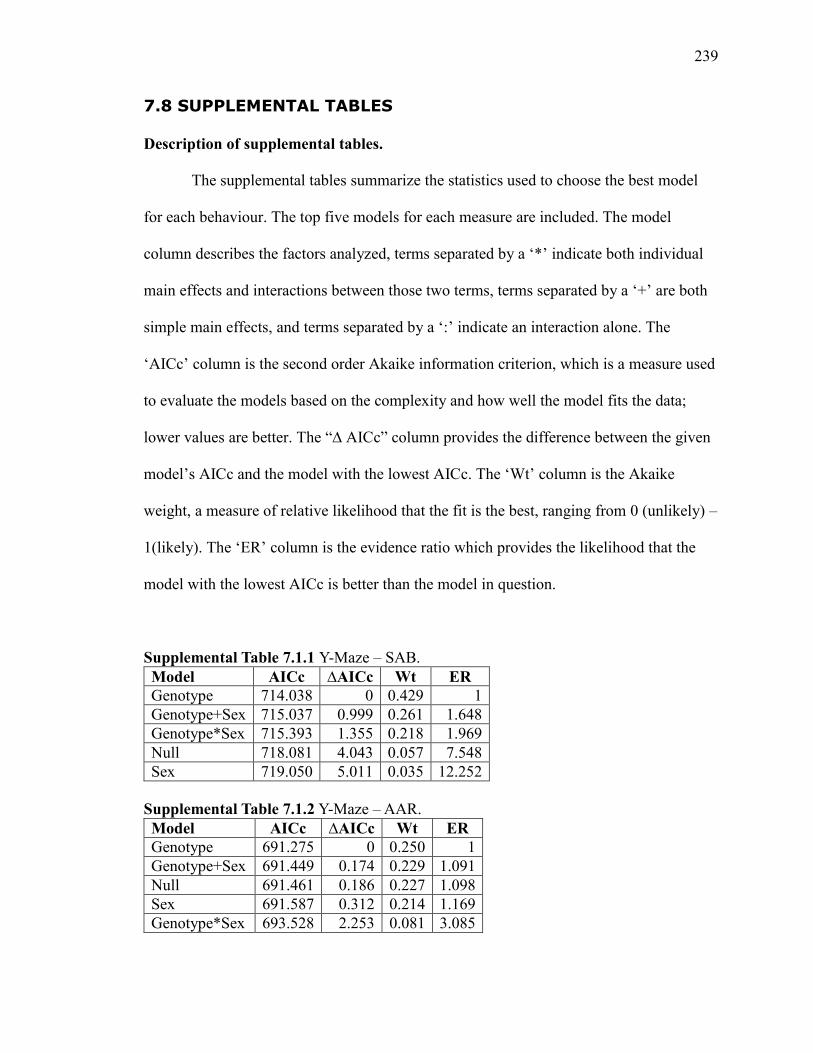
239
7.8 SUPPLEMENTAL TABLES
Description of supplemental tables.
The supplemental tables summarize the statistics used to choose the best model
for each behaviour. The top five models for each measure are included. The model
column describes the factors analyzed, terms separated by a ‘*’ indicate both individual
main effects and interactions between those two terms, terms separated by a ‘+’ are both
simple main effects, and terms separated by a ‘:’ indicate an interaction alone. The
‘AICc’ column is the second order Akaike information criterion, which is a measure used
to evaluate the models based on the complexity and how well the model fits the data;
lower values are better. The “∆ AICc” column provides the difference between the given
model’s AICc and the model with the lowest AICc. The ‘Wt’ column is the Akaike
weight, a measure of relative likelihood that the fit is the best, ranging from 0 (unlikely) –
1(likely). The ‘ER’ column is the evidence ratio which provides the likelihood that the
model with the lowest AICc is better than the model in question.
Supplemental Table 7.1.1 Y-Maze – SAB.
Model AICc ∆AICc Wt ER
Genotype 714.038 0 0.429 1
Genotype+Sex 715.037 0.999 0.261 1.648
Genotype*Sex 715.393 1.355 0.218 1.969
Null 718.081 4.043 0.057 7.548
Sex 719.050 5.011 0.035 12.252
Supplemental Table 7.1.2 Y-Maze – AAR.
Model AICc ∆AICc Wt ER
Genotype 691.275 0 0.250 1
Genotype+Sex 691.449 0.174 0.229 1.091
Null 691.461 0.186 0.227 1.098
Sex 691.587 0.312 0.214 1.169
Genotype*Sex 693.528 2.253 0.081 3.085
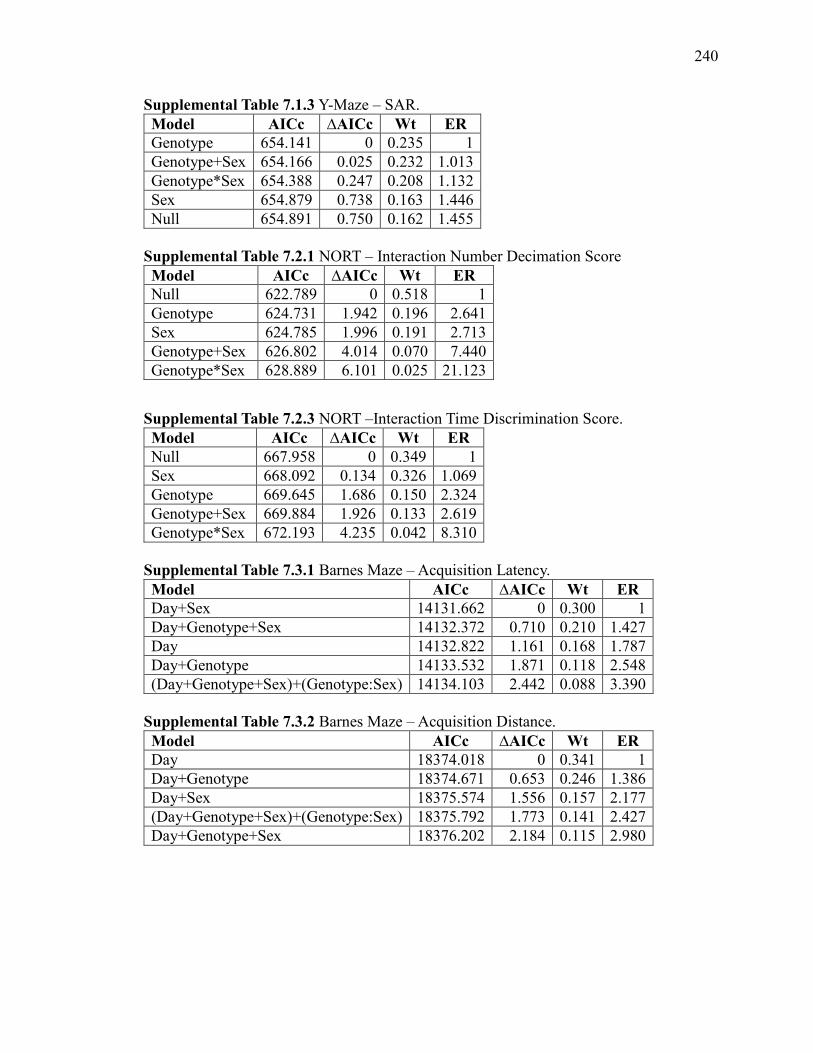
240
Supplemental Table 7.1.3 Y-Maze – SAR.
Model AICc ∆AICc Wt ER
Genotype 654.141 0 0.235 1
Genotype+Sex 654.166 0.025 0.232 1.013
Genotype*Sex 654.388 0.247 0.208 1.132
Sex 654.879 0.738 0.163 1.446
Null 654.891 0.750 0.162 1.455
Supplemental Table 7.2.1 NORT – Interaction Number Decimation Score
Model AICc ∆AICc Wt ER
Null 622.789 0 0.518 1
Genotype 624.731 1.942 0.196 2.641
Sex 624.785 1.996 0.191 2.713
Genotype+Sex 626.802 4.014 0.070 7.440
Genotype*Sex 628.889 6.101 0.025 21.123
Supplemental Table 7.2.3 NORT –Interaction Time Discrimination Score.
Model AICc ∆AICc Wt ER
Null 667.958 0 0.349 1
Sex 668.092 0.134 0.326 1.069
Genotype 669.645 1.686 0.150 2.324
Genotype+Sex 669.884 1.926 0.133 2.619
Genotype*Sex 672.193 4.235 0.042 8.310
Supplemental Table 7.3.1 Barnes Maze – Acquisition Latency.
Model AICc ∆AICc Wt ER
Day+Sex 14131.662 0 0.300 1
Day+Genotype+Sex 14132.372 0.710 0.210 1.427
Day 14132.822 1.161 0.168 1.787
Day+Genotype 14133.532 1.871 0.118 2.548
(Day+Genotype+Sex)+(Genotype:Sex) 14134.103 2.442 0.088 3.390
Supplemental Table 7.3.2 Barnes Maze – Acquisition Distance.
Model AICc ∆AICc Wt ER
Day 18374.018 0 0.341 1
Day+Genotype 18374.671 0.653 0.246 1.386
Day+Sex 18375.574 1.556 0.157 2.177
(Day+Genotype+Sex)+(Genotype:Sex) 18375.792 1.773 0.141 2.427
Day+Genotype+Sex 18376.202 2.184 0.115 2.980

241
Supplemental Table 7.3.3 Barnes Maze – Acquisition Errors.
Model AICc ∆AICc Wt ER
(Day+Genotype+Sex)+(Genotype:Sex) 8810.488 0 0.469 1
Day+Genotype 8812.127 1.639 0.207 2.269
Day 8812.604 2.115 0.163 2.880
Day+Genotype+Sex 8813.871 3.382 0.087 5.426
Day+Sex 8814.374 3.885 0.067 6.977
Supplemental Table 7.3.4 Barnes Maze – Acquisition Speed.
Model AICc ∆AICc Wt ER
(Day+Genotype+Sex)+(Day:Genotype)+(Day:Sex) 7082.355 0 0.677 1
(Day+Genotype+Sex)+(Day:Genotype)+(Day:Sex)+(Genotype:Sex) 7083.890 1.535 0.314 2.154
(Day+Genotype+Sex)+(Day:Genotype) 7091.823 9.468 0.006 113
(Day+Genotype+Sex)+(Day:Genotype)+(Genotype:Sex) 7093.310 10.955 0.003 239
Day*Genotype*Sex 7101.321 18.966 0.000 13132
Supplemental Table 7.3.5 Barnes Maze –Acquisition Probe Duration Correct.
Model AICc ∆AICc Wt ER
Genotype 896.423 0 0.419 1
Genotype+Sex 897.777 1.354 0.213 1.968
Genotype*Sex 897.987 1.564 0.192 2.186
Null 899.016 2.594 0.115 3.657
Sex 900.268 3.845 0.061 6.840

242
Supplemental Table 7.3.6 Barnes Maze –Acquisition Probe Frequency Correct.
Model AICc ∆AICc Wt ER
Sex 529.332 0 0.382 0.382
Null 529.904 0.572 0.287 0.668
Genotype+Sex 531.395 2.062 0.136 0.804
Genotype 531.886 2.554 0.106 0.911
Genotype*Sex 532.239 2.907 0.089 1
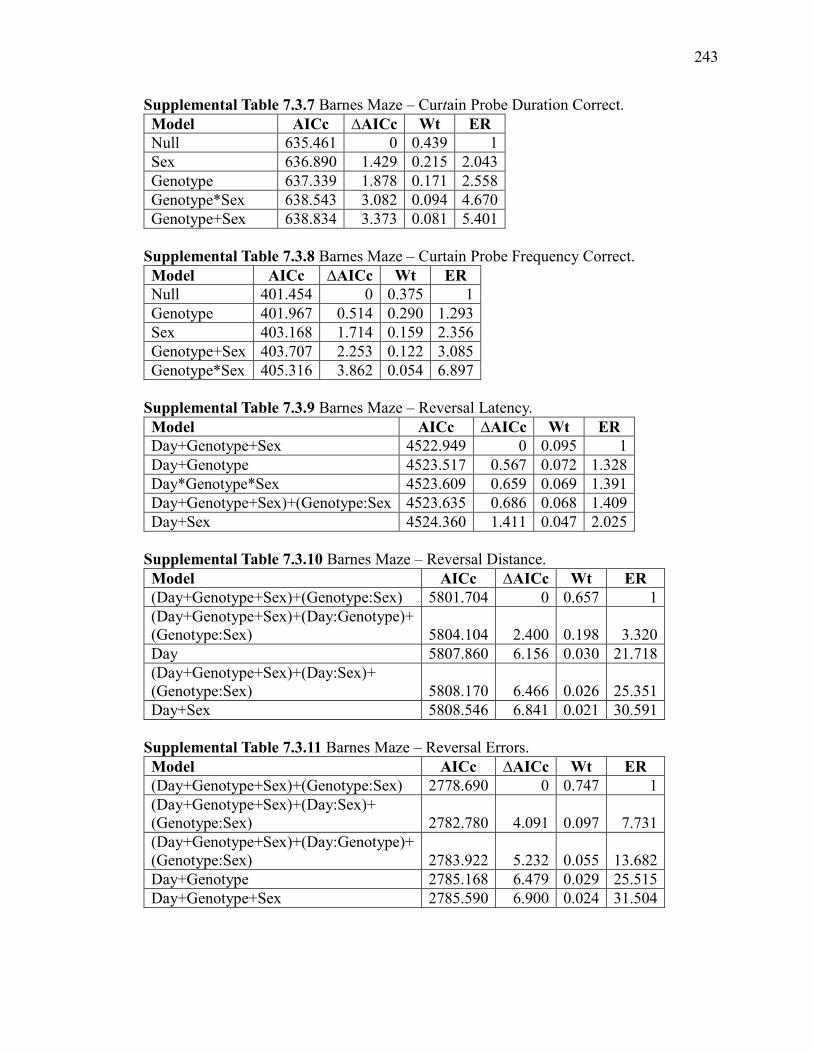
243
Supplemental Table 7.3.7 Barnes Maze – Curtain Probe Duration Correct.
Model AICc ∆AICc Wt ER
Null 635.461 0 0.439 1
Sex 636.890 1.429 0.215 2.043
Genotype 637.339 1.878 0.171 2.558
Genotype*Sex 638.543 3.082 0.094 4.670
Genotype+Sex 638.834 3.373 0.081 5.401
Supplemental Table 7.3.8 Barnes Maze – Curtain Probe Frequency Correct.
Model AICc ∆AICc Wt ER
Null 401.454 0 0.375 1
Genotype 401.967 0.514 0.290 1.293
Sex 403.168 1.714 0.159 2.356
Genotype+Sex 403.707 2.253 0.122 3.085
Genotype*Sex 405.316 3.862 0.054 6.897
Supplemental Table 7.3.9 Barnes Maze – Reversal Latency.
Model AICc ∆AICc Wt ER
Day+Genotype+Sex 4522.949 0 0.095 1
Day+Genotype 4523.517 0.567 0.072 1.328
Day*Genotype*Sex 4523.609 0.659 0.069 1.391
Day+Genotype+Sex)+(Genotype:Sex 4523.635 0.686 0.068 1.409
Day+Sex 4524.360 1.411 0.047 2.025
Supplemental Table 7.3.10 Barnes Maze – Reversal Distance.
Model AICc ∆AICc Wt ER
(Day+Genotype+Sex)+(Genotype:Sex) 5801.704 0 0.657 1
(Day+Genotype+Sex)+(Day:Genotype)+
(Genotype:Sex) 5804.104 2.400 0.198 3.320
Day 5807.860 6.156 0.030 21.718
(Day+Genotype+Sex)+(Day:Sex)+
(Genotype:Sex) 5808.170 6.466 0.026 25.351
Day+Sex 5808.546 6.841 0.021 30.591
Supplemental Table 7.3.11 Barnes Maze – Reversal Errors.
Model AICc ∆AICc Wt ER
(Day+Genotype+Sex)+(Genotype:Sex) 2778.690 0 0.747 1
(Day+Genotype+Sex)+(Day:Sex)+
(Genotype:Sex) 2782.780 4.091 0.097 7.731
(Day+Genotype+Sex)+(Day:Genotype)+
(Genotype:Sex) 2783.922 5.232 0.055 13.682
Day+Genotype 2785.168 6.479 0.029 25.515
Day+Genotype+Sex 2785.590 6.900 0.024 31.504
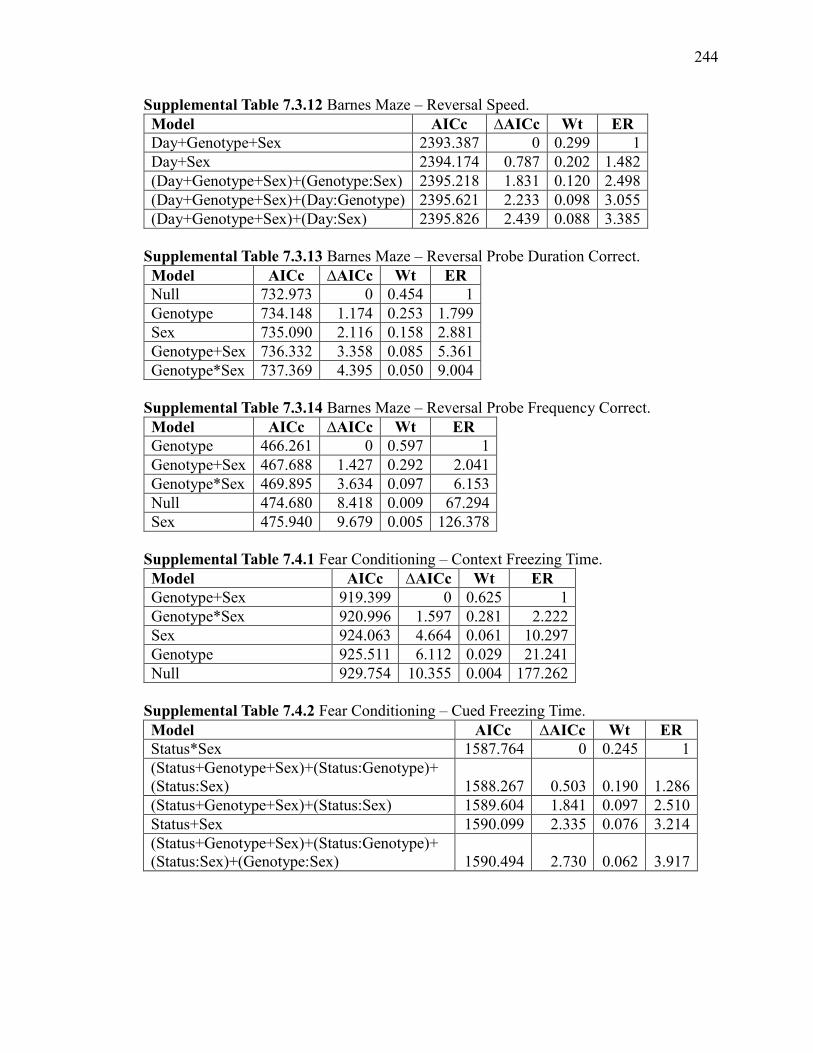
244
Supplemental Table 7.3.12 Barnes Maze – Reversal Speed.
Model AICc ∆AICc Wt ER
Day+Genotype+Sex 2393.387 0 0.299 1
Day+Sex 2394.174 0.787 0.202 1.482
(Day+Genotype+Sex)+(Genotype:Sex) 2395.218 1.831 0.120 2.498
(Day+Genotype+Sex)+(Day:Genotype) 2395.621 2.233 0.098 3.055
(Day+Genotype+Sex)+(Day:Sex) 2395.826 2.439 0.088 3.385
Supplemental Table 7.3.13 Barnes Maze – Reversal Probe Duration Correct.
Model AICc ∆AICc Wt ER
Null 732.973 0 0.454 1
Genotype 734.148 1.174 0.253 1.799
Sex 735.090 2.116 0.158 2.881
Genotype+Sex 736.332 3.358 0.085 5.361
Genotype*Sex 737.369 4.395 0.050 9.004
Supplemental Table 7.3.14 Barnes Maze – Reversal Probe Frequency Correct.
Model AICc ∆AICc Wt ER
Genotype 466.261 0 0.597 1
Genotype+Sex 467.688 1.427 0.292 2.041
Genotype*Sex 469.895 3.634 0.097 6.153
Null 474.680 8.418 0.009 67.294
Sex 475.940 9.679 0.005 126.378
Supplemental Table 7.4.1 Fear Conditioning – Context Freezing Time.
Model AICc ∆AICc Wt ER
Genotype+Sex 919.399 0 0.625 1
Genotype*Sex 920.996 1.597 0.281 2.222
Sex 924.063 4.664 0.061 10.297
Genotype 925.511 6.112 0.029 21.241
Null 929.754 10.355 0.004 177.262
Supplemental Table 7.4.2 Fear Conditioning – Cued Freezing Time.
Model AICc ∆AICc Wt ER
Status*Sex 1587.764 0 0.245 1
(Status+Genotype+Sex)+(Status:Genotype)+
(Status:Sex) 1588.267 0.503 0.190 1.286
(Status+Genotype+Sex)+(Status:Sex) 1589.604 1.841 0.097 2.510
Status+Sex 1590.099 2.335 0.076 3.214
(Status+Genotype+Sex)+(Status:Genotype)+
(Status:Sex)+(Genotype:Sex) 1590.494 2.730 0.062 3.917
245
CHAPTER 8 GENERAL DISCUSSION
8.1 SUMMARY OF FINDINGS
8.1.1 GENOTYPE DIFFERENCES
In each of the four chapters we report a number of behavioural differences
between the 3xTg-AD and B6129SF2 control mice. In chapter 2 we found that the 3xTg-
AD have decreased anxiety-like behaviour on both the EPM and OF, and enhanced motor
ability on the Rotarod. These findings were relatively stable from 2 to 18 months of age,
though there was some evidence of a shift in behaviours at 18 months of age. In chapter 3
we found that the 3xTg-AD had an increased acoustic startle response relative to the
B6129SF2 mice and no deficit at PPI at any age. In chapter 4 in the MWM we found that
the 3xTg-AD mice have a deficit in spatial learning and an age-dependant deficit in
spatial memory. By 18 months of age the performance of all mice decreased in the
MWM, indicating there was an age-related cognitive decline. There was no genotype
difference olfactory-dependant memory, even when testing 12 month long term memory.
In chapter 5 we found some evidence that the 3xTg-AD mice have decreased social
behaviour relative to B6129SF2 controls in the SNSP task, but no consistent changes
with age.
When assessing the motor phenotype of the 3xTg-AD at six months of age in
chapter 6 we found that the 3xTg-AD mice had enhanced performance on the Rotarod,
which supports our findings in chapter 2. The enhanced motor performance may be
explained by their longer gait that we found in gait analysis, and their better ability to
recover from foot-slips we found on the balance beam. Interestingly the 3xTg-AD mice

246
had poorer grip strength on the grid suspension task. The 3xTg-AD mice also had a
disrupted circadian rhythm in voluntary wheel running.
In chapter 7 we ran the 3xTg-AD on several commonly used cognitive tasks to
determine which was the most sensitive at detecting the cognitive deficits present at 6.5
months of age and found that the Barnes maze was the most sensitive. In the Barnes maze
the 3xTg-AD mice made more errors during acquisition than B6129SF2 wildtype mice
and spent less time in the correct zone during the acquisition probe, and this difference
had the largest effect size of the cognitive tasks. There was some evidence that the 3xTg-
AD mice had enhanced performance on contextual fear conditioning compared to
B6129SF2 wildtype mice, and no difference between genotypes in cued fear
conditioning. The 3xTg-AD also performed better than the B1269SF2 control mice in the
Y-maze test of spatial alternation test. Neither the 3xTg-AD nor the B6129SF2 mice had
a preference for the novel or familiar object, indicating that the mice did not perform the
task as expected.
Overall the 3xTg-AD mice have decreased anxiety-like behaviour, an enhanced
motor phenotype, and deficits in spatial learning and memory in the MWM and Barnes
mazes. These genotype differences are present at 2 months of age and generally continue
until at least 18 months of age.
8.1.2 SEX DIFFERENCES
In each of the chapters we found several differences between sexes and some
interactions between sex and genotype, though the sex differences were generally smaller
than the genotype differences. In chapter two when assessing mice longitudinally from 2
to 18 months of age we found that female mice had a larger acoustic startle response and
247
better performance on the Rotarod than male mice, but little evidence of a sex difference
in anxiety-like behaviour. In chapter five we found that male mice were more aggressive
than female mice in home cage observations. Males generally had better olfactory
memory than females, and there was no consistent sex difference in spatial memory.
In our analysis of motor function at six months of age in chapter six the only sex
difference we found was that females had a narrower stride width than males. There were
several other differences in motor behaviour that we initially attributed to sex but were
better explained by body weight. In our assessment of cognitive tasks in 6.5 month old
3xTg-AD mice we found that female mice moved faster than males in the Barnes maze
and performed better than males in cued and contextual fear conditioning. In the Barnes
maze there was also a genotype by sex interaction, as the 3xTg-AD males performed
worse than females, but there was a smaller sex difference in B6129SF2 mice.
8.1.3 AGE DIFFERENCES
In chapter 2, 3, 4, and 5 we tested mice on a longitudinal study from 2 to 18
months of age. In the two measures of anxiety, the elevated plus maze and open field, we
found that the measures of locomotion tended to decrease with age, possibly due to
habituation, but the measures of anxiety were relatively stable with age. The enhanced
performance of the 3xTg-AD relative to the B6129SF2 mice was stable from 2 to 18
months of age. The amount of acoustic startle increased from 2 to 6 months of age then
decreased with age. The increase from 2 to 6 months of age could be the result of an
increase in body weight, and the decrease from 6 to 18 months of age could be the result
of habituation or hearing loss. The amount of prepulse inhibition increased from 2 to 18
months of age. In the Morris water maze performance generally increased with age, as

248
the latency and distance to reach the platform decreased from 2 to 18 months of age. In
the conditioned odour preference task there was no difference in short term memory with
age. Generally mice had better memory for the more recent odours than more distant
odours. Overall the mice habituated to the mazes with age, the anxiety, motor, and
learning phenotypes were stable with age.
8.1.4 MATERNAL GENOTYPE DIFFERENCES
In chapters 2, 3, 4, and 5 we analyzed the effect of maternal genotype on
behaviour and neuropathology in the 3xTg-AD mice in a longitudinal study from 2 to 18
months of age. Overall we found few consistent, lasting differences between mice reared
by 3xTg-AD and B6129SF2 mothers. In Morris water maze and the conditioned odour
preference task we found some evidence that the mice reared by B6129SF2 mothers had
deficits in spatial and olfactory memory, though the results were not consistent across
ages. The only consistent difference was that mice reared by B6129SF2 mothers had
better motor performance on the Rotarod than mice reared by 3xTg-AD mothers, though
the effect size was fairly small. This contrasts with our findings in these mice during a
neurodevelopmental test battery, where maternal genotype affected the development of
several reflexes, pups reared by 3xTg-AD mothers weighed more than those reared by
B6129SF2 mothers, and mice reared by B6129SF2 mice reared more in an automated
open field (Blaney et al., 2013). In our assessment of the levels of Aβ and tau
neuropathology we found an increased density of tau positive neurons in the amygdala of
mice reared by 3xTg-AD mothers, but no difference in tau in the hippocampus or in Aβ
levels between maternal genotypes.
249
Blaney et al. (2013) found no differences in maternal care between the 3xTg-AD
and B6129SF2 mothers, so it is possible the causes of the maternal effect are small and
difficult to detect, and could be a factor other than behaviour, for example the quality of
milk. Many studies have shown that maternal care and early life environment can have a
lasting effect on behaviour (Priebe et al., 2005; Szyf et al., 2007), so the similar levels of
care of 3xTg-AD and B6129SF2 mothers may explain why there were few lasting effects
of maternal genotype. The relatively large differences between genotypes may have also
masked any subtle differences in behaviour caused by maternal genotype.
Overall it appears that maternal genotype may have affected pup behaviour early
in development, but there were few lasting effects of maternal genotype on behaviour at
later ages in the 3xTg-AD. Moreover, the differences in cognitive behaviours between
genotypes were not affected by maternal genotype, so maternal genotype does not appear
to be an important consideration when using this strain as a mouse model of AD.
8.2 ASSESSMENT OF THE 3XTG-AD AS A MOUSE MODEL OF AD
The 3xTg-AD mouse develops neuropathology and behavioural deficits that are
analogous to some aspects of AD. The introduction described three criteria for a mouse
model of AD: face validity (are the symptoms in the animal model the same as in human
AD), construct validity (does the model have the same mechanisms underlying the
disease process as in human AD), and predictive validity (will treatments that work in the
animal model translate to humans) (Willner, 1984).
The predictive validity of the 3xTg-AD mice has yet to be determined. To date
none of the treatments assessed in the 3xTg-AD mice have translated into treatments for
AD, though there were some successes in clinical trials for immunization therapy had

250
been previously tested in the 3xTg-AD mice, and research intro treatments using the
3xTg-AD mouse is ongoing (Giménez-Llort et al., 2013; Lemere, 2013). The only animal
models of AD with any predictive validity thus far have been the cholinergic models, as
cholinesterase drugs first tested in those models have been approved for use in AD
(Scarpini et al., 2003; LaFerla and Green, 2012). However, the cholinergic models had
little face validity, as their neuropathology was very different from AD, with no
development of Aβ plaques or NFTs. The cholinergic models also had very little
construct validity, as the underlying process was completely different.
The 3xTg-AD mouse model has a fairly high level of face validity in terms of
neuropathology compared to other models of AD. The 3xTg-AD mouse develops the two
hallmarks of AD neuropathology, Aβ plaques and NFTs; to date no other mouse model of
AD develops both Aβ plaques and NFTs. The 3xTg-AD also develops synaptic
dysfunction, similarly to human AD (Oddo et al., 2003). This neuropathology also
increases with age, as in AD. However the face validity of the behavioural symptoms is
much lower. While the 3xTg-AD mice develop a deficit in learning and memory, we
found that the deficits in the MWM were relatively stable from 2 to 18 months of age,
while in AD the memory deficits increase with age (Becker et al., 1988). The memory
deficits that are present also appear to be relevantly mild and restricted to spatial memory
until at least 18 months of age, while in AD the memory deficits become severe and
spread to virtually all types of memory as the disease progresses. Another study on the
3xTg-AD in our lab found that the 3xTg-AD had a deficit in working and reference
memory in the radial arm maze from 2 to 15 months in a cross-sectional study (Stevens
and Brown, 2014). This supports our finding and suggests that the deficits can be

251
detected even with our longitude design. The 3xTg-AD also do not have increased
anxiety or any of the other associated neuropsychiatric symptoms that would be expected
in a model of AD.
Like all mouse models of AD, the construct validity of the 3xTg-AD is relatively
low. While the 3xTg-AD do have two transgenes associated with AD (APPswe and
PS1M146V), these genes are associated with familial AD. Familial AD a fairly rare (< 5%
of AD cases) subtype of AD with an earlier onset and different genetic risk factors than
sporadic late-onset AD (Campion et al., 1999). Due to the sporadic nature of AD using
genes associated with familial AD is currently the best method for recapitulating AD-like
symptoms in transgenic mice. The tau gene in the 3xTg-AD, tauP301L, is associated with
the development of frontotemporal dementia, and thus the development of tau pathology
in the 3xTg-AD likely has different underlying mechanisms than the development of tau
pathology in AD (Hutton et al., 1998). In humans mutations in the APP or PS1 genes
alone are sufficient to cause familial AD, which involves the development of both Aβ and
tau neuropathology (Campion et al., 1999), while in mice mutations in APP or PS1 alone
can cause the development of Aβ pathology but not NFTs (Garcia-Alloza et al., 2006;
Kanno et al., 2014). This discrepancy points to a difference between human and mouse
physiology which will necessarily limit the face validity of the neuropathology and
resulting behavioural changes of any mouse model of AD.
Another factor to consider when assessing the face and construct validity of the
3xTg-AD is the timing of gene expression in development. The transgenes are all
expressed from an early stage of development and the first signs of neuropathology are
present in the 3xTg-AD at two to three months of age (Mastrangelo and Bowers, 2008).
252
The development of neuropathology fairly early in the lifespan of this model provides
relatively poor construct and face validity, as AD develops at an advanced age, and FAD
develops in late adulthood. Additionally the presence of these transgenes from conception
and the resulting neuropathology could interfere with normal developmental processes
and cause behavioural and other deficits not directly related to the neuropathology in the
adult brain.
While the 3xTg-AD mouse model may not perfectly recapitulate all the
behavioural and neuropathological changes of AD there is still value in animal models
which only partially model AD. The cholinergic models of AD had far worse face and
construct validity but were still useful for assessing therapies based on the cholinergic
system for AD. Similarly mouse models of AD which replicate the neuropathology of
AD still be useful for assessing therapies to treat the neuropathology, even if the
underlying mechanism and behaviour symptoms differ (Radde et al., 2008).
8.3 GENERAL CONCLUSIONS
Overall we found little evidence of a lasting effect of maternal genotype on the
behaviour or neuropathology of the 3xTg-AD mice from 2 to 18 months of age. There
were also few sex differences. Male mice had somewhat better olfactory-dependant
memory than female mice and female mice performed better on fear conditioning.
Female mice performed better on the Rotarod though this was better explained by body
weight, were faster in the Barnes maze, and male mice had a wider stride length than
female mice, likely due to a larger body size. The most reliable behavioural difference
between the 3xTg-AD and B6129SF2 control mice was the enhanced motor phenotype of
the 3xTg-AD on the Rotarod. Another mouse model with the tauP301L mutation, JNPL3

253
mice, develops enhanced motor behaviour relative to controls on the Rotarod (Morgan et
al., 2008), and so this is likely the cause of the enhanced motor behaviors of the 3xTg-
AD relative to the B6129SF2 mice. We also found that the 3xTg-AD have decreased
anxiety-like behaviour, which was stable from 2 to 18 months of age. The only cognitive
deficits we detected in the 3xTg-AD relative to B6129SF2 mice were in spatial learning
and memory, in the MWM from 2 to 18 months of age and in the Barnes maze at 6
months of age. The 3xTg-AD had enhanced performance in fear conditioning and no
deficits in the novel object recognition task or the Y-maze relative to B6129SF2 mice.
The tauP301L gene may again be responsible for this phenotype. Transgenic mice with the
tauP301L transgene alone display enhanced cognitive abilities early in life (Boekhoorn et
al., 2006; Morgan et al., 2008), this may be masking the effect of the other two transgenes
(APPswe and PS1M146V), which generally produce cognitive deficits in other strains. The
relativity late onset of tau pathology in the 3xTg-AD mouse may mean that the cognitive
enhancing properties of the tauP301Lgene may last until the development of tau pathology,
around 12-18 months of age, as the development of cognitive deficits in
tauP301Ltransgenic mice follow the development of tau pathology (Ramsden et al., 2005;
Boekhoorn et al., 2006). We saw some changes in behaviour in our longitudinal study at
18 months of age, which may reflect the beginnings of these changes, however due to
relatively high mortality ageing mice past 18 months of age is impractical.
The relatively minor cognitive deficits in the 3xTg-AD relative to wildtype mice
may be difficult to reliability detect, thus assessing if any potential therapy is improving
cognition in the 3xTg-AD may be difficult. However development of both Aβ and tau
neuropathology is unique to the 3xTg-AD, which allows for the reliable assessment of

254
treatments targeted at reducing Aβ or tau neuropathology. Overall the 3xTg-AD is an
advancement in modeling the neuropathology of AD but offers few advantages in
modeling behavioural symptoms compared to other mouse models of AD.
255
8.4 REFERENCES
Becker JT, Huff FJ, Nebes RD, Holland A, Boller F (1988) Neuropsychological function
in Alzheimer’s disease. Pattern of impairment and rates of progression. Arch Neurol
45:263–268.
Blaney CE, Gunn RK, Stover KR, Brown RE (2013) Maternal genotype influences
behavioral development of 3xTg-AD mouse pups. Behav Brain Res 252:40–48.
Boekhoorn K, Terwel D, Biemans B, Borghgraef P, Wiegert O, Ramakers GJA, de Vos K,
Krugers H, Tomiyama T, Mori H, Joels M, van Leuven F, Lucassen PJ (2006)
Improved long-term potentiation and memory in young tau-P301L transgenic mice
before onset of hyperphosphorylation and tauopathy. J Neurosci 26:3514–3523.
Campion D, Dumanchin C, Hannequin D, Dubois B, Belliard S, Puel M, Thomas-
Anterion C, Michon A, Martin C, Charbonnier F, Raux G, Camuzat A, Penet C,
Mesnage V, Martinez M, Clerget-Darpoux F, Brice A, Frebourg T (1999) Early-
onset autosomal dominant Alzheimer disease: prevalence, genetic heterogeneity, and
mutation spectrum. Am J Hum Genet 65:664–670.
Champagne FA, Curley JP (2009) Epigenetic mechanisms mediating the long-term
effects of maternal care on development. Neurosci Biobehav Rev 33:593–600.
Garcia-Alloza M, Robbins EM, Zhang-Nunes SX, Purcell SM, Betensky R a, Raju S,
Prada C, Greenberg SM, Bacskai BJ, Frosch MP (2006) Characterization of amyloid
deposition in the APPswe/PS1dE9 mouse model of Alzheimer disease. Neurobiol
Dis 24:516–524.
Giménez-Llort L, Rivera-Hernández G, Marin-Argany M, Sánchez-Quesada JL, Villegas
S (2013) Early intervention in the 3xTg-AD mice with an amyloid β-antibody
fragment ameliorates first hallmarks of alzheimer disease. MAbs 5:665–677.
Hutton M et al. (1998) Association of missense and 5’-splice-site mutations in tau with
the inherited dementia FTDP-17. Nature 393:702–705.
Kanno T, Tsuchiya A, Nishizaki T (2014) Hyperphosphorylation of Tau at Ser396 occurs
in the much earlier stage than appearance of learning and memory disorders in
5XFAD mice. Behav Brain Res 274:302–306.
LaFerla FM, Green KN (2012) Animal models of Alzheimer disease. Cold Spring Harb
Perspect Med 2:a006320.
Lemere CA (2013) Immunotherapy for Alzheimer’s disease: hoops and hurdles. Mol
Neurodegener 8:36.
Mastrangelo MA, Bowers WJ (2008) Detailed immunohistochemical characterization of
temporal and spatial progression of Alzheimer’s disease-related pathologies in male
triple-transgenic mice. BMC Neurosci 9:81.
256
Morgan D, Munireddy S, Alamed J, DeLeon J, Diamond DM, Bickford P, Hutton M,
Lewis J, McGowan E, Gordon MN (2008) Apparent behavioral benefits of tau
overexpression in P301L tau transgenic mice. J Alzheimers Dis 15:605–614.
Oddo S, Caccamo A, Shepherd JD, Murphy MP, Golde TE, Kayed R, Metherate R,
Mattson MP, Akbari Y, LaFerla FM (2003) Triple-transgenic model of Alzheimer’s
Disease with plaques and tangles: Intracellular Aβ and synaptic dysfunction. Neuron
39:409–421.
Priebe K, Brake WG, Romeo RD, Sisti HM, Mueller A, McEwen BS, Francis DD, Sisti
HM, Mueller A, McEwen BS, Brake WG (2005) Maternal influences on adult stress
and anxiety-like behavior in C57BL/6J and BALB/CJ mice: A cross-fostering study.
Dev Psychobiol 47:398–407.
Radde R, Duma C, Goedert M, Jucker M (2008) The value of incomplete mouse models
of Alzheimer’s disease. Eur J Nucl Med Mol Imaging 35:S70–S74.
Ramsden M, Kotilinek L, Forster C, Paulson J, McGowan E, SantaCruz K, Guimaraes A,
Yue M, Lewis J, Carlson G, Hutton M, Ashe KH (2005) Age-dependent
neurofibrillary tangle formation, neuron loss, and memory impairment in a mouse
model of human tauopathy (P301L). J Neurosci 25:10637–10647.
Scarpini E, Scheltens P, Feldman H (2003) Treatment of Alzheimer’s disease: Current
status and new perspectives. Lancet Neurol 2:539–547.
Stevens LM, Brown RE (2014) Reference and working memory deficits in the 3xTg-AD
mouse between 2 and 15-months of age: A cross-sectional study. Behav Brain Res
278C:496–505.
Szyf M, Weaver I, Meaney M (2007) Maternal care, the epigenome and phenotypic
differences in behavior. Reprod Toxicol 24:9–19.
Willner P (1984) The validity of animal models of depression. Psychopharmacology
(Berl) 83:1–16.
257
REFERENCES
Adlard PA, Perreau VM, Pop V, Cotman CW (2005) Voluntary exercise decreases
amyloid load in a transgenic model of Alzheimer’s disease. J Neurosci 25:4217–
4221.
Akaike H (1974) A new look at the statistical model identification. Autom Control IEEE
Trans 19:716–723.
Albers MW et al. (2014) At the interface of sensory and motor dysfunctions and
Alzheimer’s disease. Alzheimer’s Dement:1–29.
Allan LM, Ballard CG, Burn DJ, Kenny RA (2005) Prevalence and severity of gait
disorders in Alzheimer’s and non-Alzheimer's dementias. J Am Geriatr Soc
53:1681–1687.
Alzheimer Society of Canada (2010) Rising Tide : The Impact of Dementia on Canadian
Society.
Anand R, Gill KD, Mahdi AA (2014) Therapeutics of Alzheimer’s disease: Past, present
and future. Neuropharmacology 76:27–50.
Anstey KJ, Von Sanden C, Salim A, O’Kearney R (2007) Smoking as a risk factor for
dementia and cognitive decline: A meta-analysis of prospective studies. Am J
Epidemiol 166:367–378.
Arriagada P V., Growdon JH, Hedley-Whyte ET, Hyman BT (1992) Neurofibrillary
tangles but not senile plaques parallel duration and severity of Alzheimer’s disease.
Neurology 42:631–639.
Arsenault D, Julien C, Tremblay C, Calon F (2011) DHA improves cognition and
prevents dysfunction of entorhinal cortex neurons in 3xTg-AD mice. PLoS One
6:e17397.
Ballatore C, Lee VM-Y, Trojanowski JQ (2007) Tau-mediated neurodegeneration in
Alzheimer’s disease and related disorders. Nat Rev Neurosci 8:663–672.
Bartolomucci a., Gioiosa L, Chirieleison A, Ceresini G, Parmigiani S, Palanza P (2004)
Cross fostering in mice: Behavioral and physiological carry-over effects in
adulthood. Genes, Brain Behav 3:115–122.
Bartus RT (2000) On neurodegenerative diseases, models, and treatment strategies:
lessons learned and lessons forgotten a generation following the cholinergic
hypothesis. Exp Neurol 163:495–529.

258
Baudic S, Barba GD, Thibaudet MC, Smagghe A, Remy P, Traykov L (2006) Executive
function deficits in early Alzheimer’s disease and their relations with episodic
memory. Arch Clin Neuropsychol 21:15–21.
Becker JT, Huff FJ, Nebes RD, Holland A, Boller F (1988) Neuropsychological function
in Alzheimer’s disease. Pattern of impairment and rates of progression. Arch Neurol
45:263–268.
Belleville S, Chertkow H, Gauthier S (2007) Working memory and control of attention in
persons with Alzheimer’s disease and mild cognitive impairment. Neuropsychology
21:458–469.
Benilova I, Karran E, De Strooper B (2012) The toxic Aβ oligomer and Alzheimer’s
disease: an emperor in need of clothes. Nat Neurosci 15:349–357.
Bilkei-Gorzo A (2014) Genetic mouse models of brain ageing and Alzheimer’s disease.
Pharmacol Ther 142:244–257.
Billings LM, Green KN, McGaugh JL, LaFerla FM (2007) Learning decreases A beta*56
and tau pathology and ameliorates behavioral decline in 3xTg-AD mice. J Neurosci
27:751–761.
Billings LM, Oddo S, Green KN, McGaugh JL, LaFerla FM (2005) Intraneuronal Abeta
causes the onset of early Alzheimer’s disease-related cognitive deficits in transgenic
mice. Neuron 45:675–688.
Blanchard J, Wanka L, Tung Y-C, Cárdenas-Aguayo M del C, LaFerla FM, Iqbal K,
Grundke-Iqbal I (2010) Pharmacologic reversal of neurogenic and neuroplastic
abnormalities and cognitive impairments without affecting Aβ and tau pathologies
in 3xTg-AD mice. Acta Neuropathol 120:605–621.
Blaney CE, Gunn RK, Stover KR, Brown RE (2013) Maternal genotype influences
behavioral development of 3xTg-AD mouse pups. Behav Brain Res 252:40–48.
Blázquez G, Cañete T, Tobeña A, Giménez-Llort L, Fernández-Teruel A (2014)
Cognitive and emotional profiles of aged Alzheimer’s disease (3×TgAD) mice:
Effects of environmental enrichment and sexual dimorphism. Behav Brain Res
268:185–201.
Boekhoorn K, Terwel D, Biemans B, Borghgraef P, Wiegert O, Ramakers GJA, de Vos
K, Krugers H, Tomiyama T, Mori H, Joels M, van Leuven F, Lucassen PJ (2006)
Improved long-term potentiation and memory in young tau-P301L transgenic mice
before onset of hyperphosphorylation and tauopathy. J Neurosci 26:3514–3523.
Braak H, Braak E (1991) Neuropathological stageing of Alzheimer-related changes. Acta
Neuropathol 82:239–259.
259
Braak H, Braak E (1996) Evolution of the neuropathology of Alzheimer’s disease. Acta
Neurol Scand Suppl 165:3–12.
Braff D, Stone C, Callaway E, Geyer M, Glick I, Bali L (1978) Prestimulus effects on
human startle reflex in normals and schizophrenics. Psychophysiology 15:339–343.
Brooks SP, Dunnett SB (2009) Tests to assess motor phenotype in mice: a user’s guide.
Nat Rev Neurosci 10:519–529.
Brown RE, Corey SC, Moore AK (1999a) Differences in measures of exploration and
fear in MHC-congenic C57BL/6J and B6-H-2K mice. Behav Genet 29:263–271.
Brown RE, Mathieson WB, Stapleton J, Neumann PE (1999b) Maternal behavior in
female C57BL/6J and DBA/2J inbred mice. Physiol Behav 67:599–605.
Brown RE, Wong AA (2007) The influence of visual ability on learning and memory
performance in 13 strains of mice. Learn Mem 14:134.
Buchman AAS, Bennett DA (2011) Loss of motor function in preclinical Alzheimer’s
disease. Expert Rev Neurother 11:665–676.
Bullock AE, Slobe BS, Vázquez V, Collins AC (1997) Inbred mouse strains differ in the
regulation of startle and prepulse inhibition of the startle response. Behav Neurosci
111:1353–1360.
Burnham KP, Anderson DR (2002) Model selection and multimodel inference: A
practical information-theoretic approach, 2nd ed. New York: Springer Science &
Business Media.
Caccamo A, Oddo S, Billings LM, Green KN, Martinez-Coria H, Fisher A, LaFerla FM
(2006) M1 receptors play a central role in modulating AD-like pathology in
transgenic mice. Neuron 49:671–682.
Caccamo A, Oddo S, Tran LX, LaFerla FM (2007) Lithium reduces tau phosphorylation
but not A beta or working memory deficits in a transgenic model with both plaques
and tangles. Am J Pathol 170:1669–1675.
Campion D, Dumanchin C, Hannequin D, Dubois B, Belliard S, Puel M, Thomas-
Anterion C, Michon A, Martin C, Charbonnier F, Raux G, Camuzat A, Penet C,
Mesnage V, Martinez M, Clerget-Darpoux F, Brice A, Frebourg T (1999) Early-
onset autosomal dominant Alzheimer disease: prevalence, genetic heterogeneity, and
mutation spectrum. Am J Hum Genet 65:664–670.
Campion D, Flaman JM, Brice A, Hannequin D, Dubois B, Martin C, Moreau V,
Charbonnier F, Didierjean O, Tardieu S (1995) Mutations of the presenilin I gene in
families with early-onset Alzheimer’s disease. Hum Mol Genet 4:2373–2377.
260
Carrillo MC, Dean RA, Nicolas F, Miller DS, Berman R, Khachaturian Z, Bain LJ,
Schindler R, Knopman D (2013) Revisiting the framework of the National Institute
on Aging-Alzheimer’s Association diagnostic criteria. Alzheimers Dement 9:594–
601.
Carroll JC, Pike CJ (2008) Selective estrogen receptor modulators differentially regulate
Alzheimer-like changes in female 3xTg-AD mice. Endocrinology 149:2607–2611.
Carroll JC, Rosario ER, Chang L, Stanczyk FZ, Oddo S, LaFerla FM, Pike CJ (2007)
Progesterone and estrogen regulate Alzheimer-like neuropathology in female 3xTg-
AD mice. J Neurosci 27:13357–13365.
Carson CC (2006) Effects of testosterone on cognition and mood in male patients with
mild Alzheimer’s disease and elderly men. Curr Urol Rep 7:471–472.
Carter RJ, Lione LA, Humby T, Mangiarini L, Mahal A, Bates GP, Dunnett SB, Morton
AJ (1999) Characterization of progressive motor deficits in mice transgenic for the
human Huntington’s disease mutation. J Neurosci 19:3248–3257.
Castellano JM, Kim J, Stewart FR, Jiang H, DeMattos RB, Patterson BW, Fagan AM,
Morris JC, Mawuenyega KG, Cruchaga C, Goate AM, Bales KR, Paul SM, Bateman
RJ, Holtzman DM (2011) Human apoE isoforms differentially regulate brain
amyloid-β peptide clearance. Sci Transl Med 3:89ra57.
Cedervall Y, Halvorsen K, Aberg AC (2014) A longitudinal study of gait function and
characteristics of gait disturbance in individuals with Alzheimer’s disease. Gait
Posture 39:1022–1027.
Champagne FA, Curley JP, Keverne EB, Bateson PPG (2007) Natural variations in
postpartum maternal care in inbred and outbred mice. Physiol Behav 91:325–334.
Chan D, Janssen JC, Whitwell JL, Watt HC, Jenkins R, Frost C, Rossor MN, Fox NC
(2003) Change in rates of cerebral atrophy over time in early-onset Alzheimer’s
disease: Longitudinal MRI study. Lancet 362:1121–1122.
Chen Y, Liang Z, Blanchard J, Dai C-L, Sun S, Lee MH, Grundke-Iqbal I, Iqbal K, Liu F,
Gong C-X (2013) A Non-transgenic mouse model (icv-STZ mouse) of Alzheimer’s
disease: Similarities to and differences from the transgenic model (3xTg-AD
mouse). Mol Neurobiol 47:711–725.
Cherrier MM, Matsumoto a M, Amory JK, Asthana S, Bremner W, Peskind ER, Raskind
M a, Craft S (2005) Testosterone improves spatial memory in men with Alzheimer
disease and mild cognitive impairment. Neurology 64:2063–2068.
Chin J (2011) Selecting a Mouse Model of Alzheimer’s Disease Roberson ED, ed.
Methods Mol Biol (Clifton, NJ) 670.

261
Chouliaras L, Sierksma a SR, Kenis G, Prickaerts J, Lemmens M a M, Brasnjevic I, van
Donkelaar EL, Martinez-Martinez P, Losen M, De Baets MH, Kholod N, van
Leeuwen F, Hof PR, van Os J, Steinbusch HWM, van den Hove DL a, Rutten BPF
(2010) Gene-environment interaction research and transgenic mouse models of
Alzheimer’s disease. Int J Alzheimers Dis 2010.
Chu J, Giannopoulos PF, Ceballos-Diaz C, Golde TE, Praticò D (2012) 5-Lipoxygenase
gene transfer worsens memory, amyloid, and tau brain pathologies in a mouse model
of Alzheimer disease. Ann Neurol 72:442–454.
Cipriani G, Dolciotti C, Picchi L, Bonuccelli U (2011) Alzheimer and his disease: A brief
history. Neurol Sci 32:275–279.
Cleary JP, Walsh DM, Hofmeister JJ, Shankar GM, Kuskowski M a, Selkoe DJ, Ashe
KH (2005) Natural oligomers of the amyloid-beta protein specifically disrupt
cognitive function. Nat Neurosci 8:79–84.
Clinton LK, Billings LM, Green KN, Caccamo A, Ngo J, Oddo S, McGaugh JL, LaFerla
FM (2007) Age-dependent sexual dimorphism in cognition and stress response in
the 3xTg-AD mice. Neurobiol Dis 28:76–82.
Clinton LK, Blurton-Jones M, Myczek K, Trojanowski JQ, LaFerla FM (2010)
Synergistic Interactions between Abeta, tau, and alpha-synuclein: acceleration of
neuropathology and cognitive decline. J Neurosci 30:7281–7289.
Corder EH, Saunders a M, Strittmatter WJ, Schmechel DE, Gaskell PC, Small GW,
Roses a D, Haines JL, Pericak-Vance M a (1993) Gene dose of apolipoprotein E
type 4 allele and the risk of Alzheimer’s disease in late onset families. Science
261:921–923.
Corona C, Masciopinto F, Silvestri E, Viscovo A Del, Lattanzio R, Sorda R La,
Ciavardelli D, Goglia F, Piantelli M, Canzoniero LMT, Sensi SL (2010) Dietary
zinc supplementation of 3xTg-AD mice increases BDNF levels and prevents
cognitive deficits as well as mitochondrial dysfunction. Cell Death Dis 1:e91.
Coronas-Sámano G, Portillo W, Beltrán Campos V, Medina-Aguirre GI, Paredes RG,
Diaz-Cintra S (2014) Deficits in odor-guided behaviors in the transgenic 3xTg-AD
female mouse model of Alzheimer’s disease. Brain Res 1572:18–25.
Crabbe JC, Wahlsten D, Dudek BC (1999) Genetics of mouse behavior: interactions with
laboratory environment. Science 284:1670–1672.
Crawley JN, Belknap JK, Collins A, Crabbe JC, Frankel W, Henderson N, Hitzemann RJ,
Maxson SC, Miner LL, Silva AJ, Wehner JM, Wynshaw-Boris A, Paylor R (1997)
Behavioral phenotypes of inbred mouse strains: Implications and recommendations
for molecular studies. Psychopharmacology (Berl) 132:107–124.
262
Cumming G (2014) The new statistics: why and how. Psychol Sci 25:7–29.
D’Andrea I, Alleva E, Branchi I (2007) Communal nesting, an early social enrichment,
affects social competences but not learning and memory abilities at adulthood.
Behav Brain Res 183:60–66.
Darvesh S, Cash MK, Reid GA, Martin E, Mitnitski A, Geula C (2012)
Butyrylcholinesterase is associated with β-amyloid plaques in the transgenic
APPSWE/PSEN1dE9 mouse model of Alzheimer disease. J Neuropathol Exp
Neurol 71:2–14.
Denenberg VH, Rosenberg KM, Paschke R, Hess JL, Zarrow MX (1968) Plasma
corticosterone levels as a function of cross-species fostering and species differences.
Endocrinology 83:900–902.
Desai MK, Sudol KL, Janelsins MC, Mastrangelo M a, Frazer ME, Bowers WJ (2009)
Triple-transgenic Alzheimer’s disease mice exhibit region-specific abnormalities in
brain myelination patterns prior to appearance of amyloid and tau pathology. Glia
57:54–65.
Devanand DP, Sano M, Tang M-X, Taylor S, Gurland BJ, Wilder D, Stern Y, Mayeux R
(1996) Depressed Mood and the Incidence of Alzheimer’s Disease in the Elderly
Living in the Community. Arch Gen Psychiatry 53:175–182.
Dick MB, Nielson KA, Beth RE, Shankle WR, Cotman CW (1995) Acquisition and long-
term retention of a fine motor skill in Alzheimer’s disease. Brain Cogn 29:294–306.
Duara R, Lopez-Alberola RF, Barker WW, Loewenstein DA, Zatinsky M, Eisdorfer CE,
Weinberg GB (1993) A comparison of familial and sporadic Alzheimer’s disease.
Neurology 43:1377–1384.
Eslinger PJ, Damasio AR (1986) Preserved motor learning in Alzheimer’s disease:
implications for anatomy and behavior. J Neurosci 6:3006–3009.
España J, Giménez-Llort L, Valero J, Miñano A, Rábano A, Rodriguez-Alvarez J,
LaFerla FM, Saura CA (2010) Intraneuronal beta-amyloid accumulation in the
amygdala enhances fear and anxiety in Alzheimer’s disease transgenic mice. Biol
Psychiatry 67:513–521.
Esposito L, Raber J, Kekonius L, Yan F, Yu G-Q, Bien-Ly N, Puoliväli J, Scearce-Levie
K, Masliah E, Mucke L (2006) Reduction in mitochondrial superoxide dismutase
modulates Alzheimer’s disease-like pathology and accelerates the onset of
behavioral changes in human amyloid precursor protein transgenic mice. J Neurosci
26:5167–5179.
263
Feinstein SC, Wilson L (2005) Inability of tau to properly regulate neuronal microtubule
dynamics: A loss-of-function mechanism by which tau might mediate neuronal cell
death. Biochim Biophys Acta - Mol Basis Dis 1739:268–279.
Ferretti L, McCurry SM, Logsdon R, Gibbons L, Teri L (2001) Anxiety and Alzheimer’s
disease. J Geriatr Psychiatry Neurol 14:52–58.
Filali M, Lalonde R, Rivest S (2011) Anomalies in social behaviors and exploratory
activities in an APPswe/PS1 mouse model of Alzheimer’s disease. Physiol Behav
104:880–885.
Filali M, Lalonde R, Theriault P, Julien C, Calon F, Planel E (2012) Cognitive and non-
cognitive behaviors in the triple transgenic mouse model of Alzheimer’s disease
expressing mutated APP, PS1, and Mapt (3xTg-AD). Behav Brain Res 234:334–
342.
Flanigan TJ, Xue Y, Rao SK, Dhanushkodi A, McDonald MP (2014) Abnormal vibrissa-
related behavior and loss of barrel field inhibitory neurons in 5xFAD transgenics.
Genes, Brain Behav 13:488–500.
Fleming SM, Salcedo J, Fernagut P, Rockenstein E, Masliah E, Levine MS, Chesselet M-
F (2004) Early and progressive sensorimotor anomalies in mice overexpressing
wild-type human alpha-synuclein. J Neurosci 24:9434–9440.
Förstl H, Kurz a (1999) Clinical features of Alzheimer’s disease. Eur Arch Psychiatry
Clin Neurosci 249:288–290.
Francis DD, Meaney MJ (1999) Maternal care and the development of stress responses.
Curr Opin Neurobiol 9:128–134.
Francis DD, Szegda K, Campbell G, Martin WD, Insel TR (2003) Epigenetic sources of
behavioral differences in mice. Nat Neurosci 6:445–446.
Francis PT, Palmer AM, Snape M, Wilcock GK (1999) The cholinergic hypothesis of
Alzheimer’s disease: a review of progress. J Neurol Neurosurg Psychiatry 66:137–
147.
Games D, Adams D, Alessandrini R, Barbour R, Berthelette P, Blackwell C, Carr T,
Clemens J, Donaldson T, Gillespie F (1995) Alzheimer-type neuropathology in
transgenic mice overexpressing V717F beta-amyloid precursor protein. Nature
373:523–527.
Garcia-Alloza M, Robbins EM, Zhang-Nunes SX, Purcell SM, Betensky R a, Raju S,
Prada C, Greenberg SM, Bacskai BJ, Frosch MP (2006) Characterization of amyloid
deposition in the APPswe/PS1dE9 mouse model of Alzheimer disease. Neurobiol
Dis 24:516–524.

264
García-Mesa Y, López-Ramos JC, Giménez-Llort L, Revilla S, Guerra R, Gruart A,
Laferla FM, Cristòfol R, Delgado-García JM, Sanfeliu C (2011) Physical exercise
protects against Alzheimer’s disease in 3xTg-AD mice. J Alzheimers Dis 24:421–
454.
Garthe A, Behr J, Kempermann G (2009) Adult-generated hippocampal neurons allow
the flexible use of spatially precise learning strategies. PLoS One 4.
Geyer MA, McIlwain KL, Paylor R (2002) Mouse genetic models for prepulse inhibition:
an early review. Mol Psychiatry 7:1039–1053.
Giménez-Llort L, Arranz L, Maté I, De la Fuente M (2008) Gender-specific
neuroimmunoendocrine aging in a triple-transgenic 3xTg-AD mouse model for
Alzheimer’s disease and its relation with longevity. Neuroimmunomodulation
15:331–343.
Giménez-Llort L, García Y, Buccieri K, Revilla S, Suñol C, Cristofol R, Sanfeliu C
(2010) Gender-Specific Neuroimmunoendocrine Response to Treadmill Exercise in
3xTg-AD Mice. Int J Alzheimers Dis 2010:128354.
Giménez-Llort L, Rivera-Hernández G, Marin-Argany M, Sánchez-Quesada JL, Villegas
S (2013) Early intervention in the 3xTg-AD mice with an amyloid β-antibody
fragment ameliorates first hallmarks of alzheimer disease. MAbs 5:665–677.
Goedert M, Spillantini MG (2006) A century of Alzheimer’s disease. Science 314:777–
781.
Grant E, Mackintosh J (1963) A comparison of the social postures of some common
laboratory rodents. Behaviour 21:246–259.
Gras LZ, Kanaan SF, McDowd JM, Colgrove YM, Burns J, Pohl PS (2014) Balance and
Gait of Adults With Very Mild Alzheimer Disease. J Geriatr Phys Ther.
Green KN, Martinez-Coria H, Khashwji H, Hall EB, Yurko-Mauro K a, Ellis L, LaFerla
FM (2007) Dietary docosahexaenoic acid and docosapentaenoic acid ameliorate
amyloid-beta and tau pathology via a mechanism involving presenilin 1 levels. J
Neurosci 27:4385–4395.
Green KN, Steffan JS, Martinez-Coria H, Sun X, Schreiber SS, Thompson LM, LaFerla
FM (2008) Nicotinamide restores cognition in Alzheimer’s disease transgenic mice
via a mechanism involving sirtuin inhibition and selective reduction of Thr231-
phosphotau. J Neurosci 28:11500–11510.
Haass C, Lemere C a., Capell A, Citron M, Seubert P, Schenk D, Lannfelt L, Selkoe DJ
(1995) The Swedish mutation causes early-onset Alzheimer’s disease by beta-
secretase cleavage within the secretory pathway. Nat Med 1:1291–1296.
265
Hardy J (1997) Amyloid, the presenilins and Alzheimer’s disease. Trends Neurosci
20:154–159.
Hardy J a, Higgins G a (1992) Alzheimer’s disease: the amyloid cascade hypothesis.
Science 256:184–185.
Hasegawa T, Mikoda N, Kitazawa M, LaFerla FM (2010) Treatment of Alzheimer’s
disease with anti-homocysteic acid antibody in 3xTg-AD male mice. PLoS One
5:e8593.
Hedges L V. (1981) Distribution theory for Glass’s estimator of effect size and related
estimators. J Educ Behav Stat 6:107–128.
Hejl A-M, Glenthøj B, Mackeprang T, Hemmingsen R, Waldemar G (2004) Prepulse
inhibition in patients with Alzheimer’s disease. Neurobiol Aging 25:1045–1050.
Héraud C, Goufak D, Ando K, Leroy K, Suain V, Yilmaz Z, De Decker R, Authelet M,
Laporte V, Octave J-N, Brion J-P (2014) Increased misfolding and truncation of tau
in APP/PS1/tau transgenic mice compared to mutant tau mice. Neurobiol Dis
62:100–112.
Himeno E, Ohyagi Y, Ma L, Nakamura N, Miyoshi K, Sakae N, Motomura K, Soejima
N, Yamasaki R, Hashimoto T, Tabira T, M. Laferla F, Kira JI (2011) Apomorphine
treatment in Alzheimer mice promoting amyloid-β degradation. Ann Neurol 69:248–
256.
Hooper C, Killick R, Lovestone S (2008) The GSK3 hypothesis of Alzheimer’s disease. J
Neurochem 104:1433–1439.
Hsiao K, Chapman P, Nilsen S, Eckman C, Harigaya Y, Younkin S, Yang F, Cole G
(1996) Correlative memory deficits, Abeta elevation, and amyloid plaques in
transgenic mice. Science 274:99–102.
Hutton M et al. (1998) Association of missense and 5’-splice-site mutations in tau with
the inherited dementia FTDP-17. Nature 393:702–705.
Jankowsky JL, Fadale DJ, Anderson J, Xu GM, Gonzales V, Jenkins N a., Copeland NG,
Lee MK, Younkin LH, Wagner SL, Younkin SG, Borchelt DR (2004) Mutant
presenilins specifically elevate the levels of the 42 residue β-amyloid peptide in
vivo: Evidence for augmentation of a 42-specific γ secretase. Hum Mol Genet
13:159–170.
Jankowsky JL, Younkin LH, Gonzales V, Fadale DJ, Slunt HH, Lester H a., Younkin SG,
Borchelt DR (2007) Rodent Aβ modulates the solubility and distribution of amyloid
deposits in transgenic mice. J Biol Chem 282:22707–22720.
266
Jawhar S, Trawicka A, Jenneckens C, Bayer TA, Wirths O (2012) Motor deficits, neuron
loss, and reduced anxiety coinciding with axonal degeneration and intraneuronal Aβ
aggregation in the 5XFAD mouse model of Alzheimer’s disease. Neurobiol Aging
33:196.e29–e40.
Jost BC, Grossberg GT (1996) The evolution of psychiatric symptoms in Alzheimer’s
disease: a natural history study. J Am Geriatr Soc 44:1078–1081.
Justice JN, Carter CS, Beck HJ, Gioscia-Ryan RA, McQueen M, Enoka RM, Seals DR
(2014) Battery of behavioral tests in mice that models age-associated changes in
human motor function. Age (Omaha) 36:583–592.
Kanno T, Tsuchiya A, Nishizaki T (2014) Hyperphosphorylation of Tau at Ser396 occurs
in the much earlier stage than appearance of learning and memory disorders in
5XFAD mice. Behav Brain Res 274:302–306.
Kitamoto T, Ogomori K, Tateishi J, Prusiner SB (1987) Formic acid pretreatment
enhances immunostaining of cerebral and systemic amyloids. Lab Invest 57:230–
236.
Kluger A, Gianutsos JJG, Golomb J, Ferris SH, Reisberg B (1997) Motor/psychomotor
dysfunction in normal aging, mild cognitive decline, and early Alzheimer’s disease:
diagnostic and differential diagnostic features. Int Psychogeriatrics 9:307–316.
Koh H-Y, Kim D, Lee J, Lee S, Shin H-S (2008) Deficits in social behavior and
sensorimotor gating in mice lacking phospholipase Cbeta1. Genes Brain Behav
7:120–128.
Kundakovic M, Champagne F a (2014) Early-Life Experience, Epigenetics, and the
Developing Brain. Neuropsychopharmacology 40:141–153.
Kuwabara Y, Ishizeki M, Watamura N, Toba J, Yoshii A, Inoue T, Ohshima T (2014)
Impairments of long-term depression induction and motor coordination precede Aβ
accumulation in the cerebellum of APPswe/PS1dE9 double transgenic mice. J
Neurochem 130:432–443.
Lacor PN, Buniel MC, Furlow PW, Clemente AS, Velasco PT, Wood M, Viola KL,
Klein WL (2007) Abeta oligomer-induced aberrations in synapse composition,
shape, and density provide a molecular basis for loss of connectivity in Alzheimer’s
disease. J Neurosci 27:796–807.
LaFerla FM, Green KN (2012) Animal models of Alzheimer disease. Cold Spring Harb
Perspect Med 2:a006320.
LaFerla FM, Green KN, Oddo S (2007) Intracellular amyloid-beta in Alzheimer’s
disease. Nat Rev Neurosci 8:499–509.

267
Lalonde R, Kim HD, Fukuchi K (2004) Exploratory activity, anxiety, and motor
coordination in bigenic APPswe + PS1/DeltaE9 mice. Neurosci Lett 369:156–161.
Lambert JC et al. (2013) Meta-analysis of 74,046 individuals identifies 11 new
susceptibility loci for Alzheimer’s disease. Nat Genet 45:1452–1458.
Landes AM, Sperry SD, Strauss ME, Geldmacher DS (2001) Apathy in Alzheimer’s
disease. J Am Geriatr Soc 49:1700–1707.
Lee HG, Casadesus G, Zhu X, Takeda A, Perry G, Smith MA (2004) Challenging the
amyloid cascade hypothesis: Senile plaques and amyloid-β as protective adaptations
to Alzheimer disease. In: Annals of the New York Academy of Sciences, pp 1–4.
Lemere CA (2013) Immunotherapy for Alzheimer’s disease: hoops and hurdles. Mol
Neurodegener 8:36.
Lewis J et al. (2000) Neurofibrillary tangles, amyotrophy and progressive motor
disturbance in mice expressing mutant (P301L) tau protein. Nat Genet 25:127.
Lijam N, Paylor R, McDonald MP, Crawley JN, Deng CX, Herrup K, Stevens KE,
Maccaferri G, McBain CJ, Sussman DJ, Wynshaw-Boris a (1997) Social interaction
and sensorimotor gating abnormalities in mice lacking Dvl1. Cell 90:895–905.
Liu D, Diorio J, Tannenbaum B, Caldji C, Francis D, Freedman a, Sharma S, Pearson D,
Plotsky PM, Meaney MJ (1997) Maternal care, hippocampal glucocorticoid
receptors, and hypothalamic-pituitary-adrenal responses to stress. Science
277:1659–1662.
Logue SF, Owen EH, Rasmussen DL, Wehner JM (1997) Assessment of locomotor
activity, acoustic and tactile startle, and prepulse inhibition of startle in inbred
mouse strains and F1 hybrids: Implications of genetic background for single gene
and quantitative trait loci analyses. Neuroscience 80:1075–1086.
Ma Q-L, Yang F, Rosario ER, Ubeda OJ, Beech W, Gant DJ, Chen PP, Hudspeth B,
Chen C, Zhao Y, Vinters H V, Frautschy SA, Cole GM (2009) Beta-amyloid
oligomers induce phosphorylation of tau and inactivation of insulin receptor
substrate via c-Jun N-terminal kinase signaling: suppression by omega-3 fatty acids
and curcumin. J Neurosci 29:9078–9089.
Maccioni RB, Farías G, Morales I, Navarrete L (2010) The Revitalized Tau Hypothesis
on Alzheimer’s Disease. Arch Med Res 41:226–231.
Marchese M, Cowan D, Head E, Ma D, Karimi K, Ashthorpe V, Kapadia M, Zhao H,
Davis P, Sakic B (2014) Autoimmune manifestations in the 3xTg-AD model of
Alzheimer’s disease. J Alzheimers Dis 39:191–210.

268
Mark RJ, Hensley K, Butterfield DA, Mattson MP (1995) Amyloid beta-peptide impairs
ion-motive ATPase activities: evidence for a role in loss of neuronal Ca2+
homeostasis and cell death. J Neurosci 15:6239–6249.
Markesbery WR (1997) Oxidative stress hypothesis in Alzheimer’s disease. Free Radic
Biol Med 23:134–147.
Martin AL, Brown RE (2010) The lonely mouse: verification of a separation-induced
model of depression in female mice. Behav Brain Res 207:196–207.
Martinez-Coria H, Green KN, Billings LM, Kitazawa M, Albrecht M, Rammes G,
Parsons CG, Gupta S, Banerjee P, LaFerla FM (2010) Memantine improves
cognition and reduces Alzheimer’s-like neuropathology in transgenic mice. Am J
Pathol 176:870–880.
Mastrangelo MA, Bowers WJ (2008) Detailed immunohistochemical characterization of
temporal and spatial progression of Alzheimer’s disease-related pathologies in male
triple-transgenic mice. BMC Neurosci 9:81.
McCool MF, Varty GB, Del Vecchio R a, Kazdoba TM, Parker EM, Hunter JC, Hyde
LA (2003) Increased auditory startle response and reduced prepulse inhibition of
startle in transgenic mice expressing a double mutant form of amyloid precursor
protein. Brain Res 994:99–106.
McKee AC, Carreras I, Hossain L, Ryu H, Klein WL, Oddo S, LaFerla FM, Jenkins BG,
Kowall NW, Dedeoglu A (2008) Ibuprofen reduces Abeta, hyperphosphorylated tau
and memory deficits in Alzheimer mice. Brain Res 1207:225–236.
McKhann G, Drachman D, Folstein M, Katzman R, Price D, Stadlan EM (1984) Clinical
diagnosis of Alzheimer’s disease: report of the NINCDS-ADRDA Work Group
under the auspices of Department of Health and Human Services Task Force on
Alzheimer's Disease. Neurology 34:939–944.
Medeiros R, Kitazawa M, Caccamo A, Baglietto-Vargas D, Estrada-Hernandez T, Cribbs
DH, Fisher A, Laferla FM (2011) Loss of muscarinic M1 receptor exacerbates
Alzheimer’s disease-like pathology and cognitive decline. Am J Pathol 179:980–
991.
Medina DX, Caccamo A, Oddo S (2011) Methylene blue reduces Aβ levels and rescues
early cognitive deficit by increasing proteasome activity. Brain Pathol 21:140–149.
Mizuno K, Giese KP (2010) Towards a molecular understanding of sex differences in
memory formation. Trends Neurosci 33:285–291.

269
Morgan D, Munireddy S, Alamed J, DeLeon J, Diamond DM, Bickford P, Hutton M,
Lewis J, McGowan E, Gordon MN (2008) Apparent behavioral benefits of tau
overexpression in P301L tau transgenic mice. J Alzheimers Dis 15:605–614.
Morris JC, Roe CM, Xiong C, Fagan AM, Goate AM, Holtzman DM, Mintun M a.
(2010) APOE predicts amyloid-beta but not tau Alzheimer pathology in cognitively
normal aging. Ann Neurol 67:122–131.
Mortimer J a, van Duijn CM, Chandra V, Fratiglioni L, Graves a B, Heyman A, Jorm a F,
Kokmen E, Kondo K, Rocca W a (1991) Head trauma as a risk factor for
Alzheimer’s disease: a collaborative re-analysis of case-control studies. EURODEM
Risk Factors Research Group. Int J Epidemiol 20 Suppl 2:S28–S35.
Movsesyan N, Ghochikyan A, Mkrtichyan M, Petrushina I, Davtyan H, Olkhanud PB,
Head E, Biragyn A, Cribbs DH, Agadjanyan MG (2008) Reducing AD-like
pathology in 3xTg-AD mouse model by DNA epitope vaccine - a novel
immunotherapeutic strategy. PLoS One 3:e2124.
Moy S, Nadler J, Perez A, Barbaro R, Johns J, Magnuson T, Piven J, Crawley J (2004)
Sociability and preference for social novelty in five inbred strains: an approach to
assess autistic-like behavior in mice. Genes, Brain Behav 3:287–302.
Mulnard RA (2000) Estrogen Replacement Therapy for Treatment of Mild to Moderate
Alzheimer Disease: A Randomized Controlled Trial. JAMA J Am Med Assoc
283:1007–1015.
Murray ME, Graff-Radford NR, Ross O a, Petersen RC, Duara R, Dickson DW (2011)
Neuropathologically defined subtypes of Alzheimer’s disease with distinct clinical
characteristics: a retrospective study. Lancet Neurol 10:785–796.
O’Leary TP, Brown RE (2009) Visuo-spatial learning and memory deficits on the Barnes
maze in the 16-month-old APPswe/PS1dE9 mouse model of Alzheimer’s disease.
Behav Brain Res 201:120–127.
O’Leary TP, Brown RE (2012) The effects of apparatus design and test procedure on
learning and memory performance of C57BL/6J mice on the Barnes maze. J
Neurosci Methods 203:315–324.
O’Leary TP, Brown RE (2013) Optimization of apparatus design and behavioral
measures for the assessment of visuo-spatial learning and memory of mice on the
Barnes maze. Learn Mem 20:85–96.
O’Leary TP, Gunn RK, Brown RE (2013) What are we measuring when we test strain
differences in anxiety in mice? Behav Genet 43:34–50.
270
Oakley H, Cole SL, Logan S, Maus E, Shao P, Craft J, Guillozet-Bongaarts A, Ohno M,
Disterhoft J, Van Eldik L, Berry R, Vassar R (2006) Intraneuronal beta-amyloid
aggregates, neurodegeneration, and neuron loss in transgenic mice with five familial
Alzheimer’s disease mutations: potential factors in amyloid plaque formation. J
Neurosci 26:10129–10140.
Oddo S, Billings L, Kesslak JP, Cribbs DH, LaFerla FM (2004) Abeta immunotherapy
leads to clearance of early, but not late, hyperphosphorylated tau aggregates via the
proteasome. Neuron 43:321–332.
Oddo S, Caccamo A, Shepherd JD, Murphy MP, Golde TE, Kayed R, Metherate R,
Mattson MP, Akbari Y, LaFerla FM (2003) Triple-transgenic model of Alzheimer’s
Disease with plaques and tangles: Intracellular Aβ and synaptic dysfunction. Neuron
39:409–421.
Oddo S, Vasilevko V, Caccamo A, Kitazawa M, Cribbs DH, LaFerla FM (2006)
Reduction of soluble Abeta and tau, but not soluble Abeta alone, ameliorates
cognitive decline in transgenic mice with plaques and tangles. J Biol Chem
281:39413–39423.
Ognibene E, Middei S, Daniele S, Adriani W, Ghirardi O, Caprioli A, Laviola G (2005)
Aspects of spatial memory and behavioral disinhibition in Tg2576 transgenic mice
as a model of Alzheimer’s disease. Behav Brain Res 156:225–232.
Oore JJ, Fraser LM, Brown RE (2013) Age-related changes in motor ability and motor
learning in triple transgenic (3xTg-AD) and control (B6129SF1/J) mice on the
accelerating Rotarod. Proc Nov Scotian Inst Sci 74:281–296.
Paxinos G, Franklin KBJ (2001) The Mouse Brain in Stereotaxic Coordinates, 2nd
Editio. San Diego, CA: Academic Press.
Pearson BL, Defensor EB, Blanchard DC, Blanchard RJ (2010) C57BL/6J mice fail to
exhibit preference for social novelty in the three-chamber apparatus. Behav Brain
Res 213:189–194.
Peters OM, Shelkovnikova T, Tarasova T, Springe S, Kukharsky MS, Smith GA, Brooks
S, Kozin SA, Kotelevtsev Y, Bachurin SO, Ninkina N, Buchman VL (2013) Chronic
administration of Dimebon does not ameliorate amyloid-β pathology in 5xFAD
transgenic mice. J Alzheimers Dis 36:589–596.
Pettersson AF, Olsson E, Wahlund L-O (2005) Motor function in subjects with mild
cognitive impairment and early Alzheimer’s disease. Dement Geriatr Cogn Disord
19:299–304.
Pietropaolo S, Feldon J, Yee BK (2008) Age-dependent phenotypic characteristics of a
triple transgenic mouse model of Alzheimer disease. Behav Neurosci 122:733–747.
271
Pietropaolo S, Sun Y, Li R, Brana C, Feldon J, Yee BK (2009) Limited impact of social
isolation on Alzheimer-like symptoms in a triple transgenic mouse model. Behav
Neurosci 123:181–195.
Pimplikar SW (2009) Reassessing the amyloid cascade hypothesis of Alzheimer’s
disease. Int J Biochem Cell Biol 41:1261–1268.
Priebe K, Brake WG, Romeo RD, Sisti HM, Mueller A, McEwen BS, Francis DD, Sisti
HM, Mueller A, McEwen BS, Brake WG (2005) Maternal influences on adult stress
and anxiety-like behavior in C57BL/6J and BALB/CJ mice: A cross-fostering study.
Dev Psychobiol 47:398–407.
Profenno L a., Porsteinsson AP, Faraone S V. (2010) Meta-Analysis of Alzheimer’s
Disease Risk with Obesity, Diabetes, and Related Disorders. Biol Psychiatry
67:505–512.
Radde R, Duma C, Goedert M, Jucker M (2008) The value of incomplete mouse models
of Alzheimer’s disease. Eur J Nucl Med Mol Imaging 35:S70–S74.
Rae EA, Brown RE (2015) The problem of genotype and sex differences in life
expectancy in transgenic mice. Unpublshed Results.
Ramsden M, Kotilinek L, Forster C, Paulson J, McGowan E, SantaCruz K, Guimaraes A,
Yue M, Lewis J, Carlson G, Hutton M, Ashe KH (2005) Age-dependent
neurofibrillary tangle formation, neuron loss, and memory impairment in a mouse
model of human tauopathy (P301L). J Neurosci 25:10637–10647.
Reuben DB, Magasi S, McCreath HE, Bohannon RW, Wang Y-C, Bubela DJ, Rymer
WZ, Beaumont J, Rine RM, Lai J-S, Gershon RC (2013) Motor assessment using
the NIH Toolbox. Neurology 80:S65–S75.
Rosario ER, Carroll JC, Oddo S, LaFerla FM, Pike CJ (2006) Androgens regulate the
development of neuropathology in a triple transgenic mouse model of Alzheimer’s
disease. J Neurosci 26:13384–13389.
Scarpini E, Scheltens P, Feldman H (2003) Treatment of Alzheimer’s disease: Current
status and new perspectives. Lancet Neurol 2:539–547.
Schellinck HM, Forestell C a, LoLordo VM (2001) A simple and reliable test of olfactory
learning and memory in mice. Chem Senses 26:663–672.
Scheuner D et al. (1996) Secreted amyloid β–protein similar to that in the senile plaques
of Alzheimer’s disease is increased in vivo by the presenilin 1 and 2 and APP
mutations linked to familial Alzheimer's disease. Nat Med 2:864–870.

272
Schindowski K, Bretteville A, Leroy K, Bégard S, Brion J-P, Hamdane M, Buée L (2006)
Alzheimer’s disease-like tau neuropathology leads to memory deficits and loss of
functional synapses in a novel mutated tau transgenic mouse without any motor
deficits. Am J Pathol 169:599–616.
Smale G, Nichols NR, Brady DR, Finch CE, Horton WE (1995) Evidence for apoptotic
cell death in Alzheimer’s disease. Exp Neurol 133:225–230.
Snowdon DA a. (1997) Aging and Alzheimer’s disease: lessons from the Nun Study.
Gerontologist 37:150–156.
Sterniczuk R, Antle MC, Laferla FM, Dyck RH (2010a) Characterization of the 3xTg-
AD mouse model of Alzheimer’s disease: part 2. Behavioral and cognitive changes.
Brain Res 1348:149–155.
Sterniczuk R, Dyck RH, Laferla FM, Antle MC (2010b) Characterization of the 3xTg-
AD mouse model of Alzheimer’s disease: part 1. Circadian changes. Brain Res
1348:139–148.
Stevens LM, Brown RE (2014) Reference and working memory deficits in the 3xTg-AD
mouse between 2 and 15-months of age: A cross-sectional study. Behav Brain Res
278C:496–505.
Stover KR (2012) Effects of Maternal Environment on Behavioural Development in
Young Adult 3xTg-AD and B6129S/F2 Mice.
Stover KR, Campbell MA, Van Winssen CM, Brown RE (2015a) Analysis of motor
function in 6 month old male and female 3xTg-AD mice. Behav Brain Res 281:16–
23.
Stover KR, Hicks ME, Gordon KM, Ikpi D, Brown RE (2015b) Age-related changes in
social behaviour in the 3xTg-AD mouse model of Alzheimer’s disease from 2 to 18
months of age. Unpublished.
Stover KR, Hicks ME, Gordon KM, Ikpi D, Brown RE (2015c) Learning and memory in
the 3xTg-AD mouse model of Alzheimer’s disease at 2, 6, 12, and 18 months of age.
Unpublished.
Stover KR, Hicks ME, Gordon KM, Ikpi D, Brown RE (2015d) Age-related changes in
acoustic startle and prepulse inhibition in the 3xTg-AD mouse model of Alzheimer’s
disease: A longitudinal study. Unpublished.
Stover KR, Hicks ME, Gordon KM, Ikpi D, Darvesh S, Brown RE (2015e) Age-related
changes in motor behaviour and anxiety in the 3xTg-AD mouse model of
Alzheimer’s disease: A longitudinal study. Unpublished.
273
Strittmatter WJ, Saunders a M, Schmechel D, Pericak-Vance M, Enghild J, Salvesen GS,
Roses a D (1993) Apolipoprotein E: high-avidity binding to beta-amyloid and
increased frequency of type 4 allele in late-onset familial Alzheimer disease. Proc
Natl Acad Sci U S A 90:1977–1981.
Szyf M, Weaver I, Meaney M (2007) Maternal care, the epigenome and phenotypic
differences in behavior. Reprod Toxicol 24:9–19.
Teri L, Ferretti LE, Gibbons LE, Logsdon RG, McCurry SM, Kukull WA, McCormick
WC, Bowen JD, Larson EB (1999) Anxiety of Alzheimer’s disease: prevalence, and
comorbidity. J Gerontol A Biol Sci Med Sci 54:M348–M352.
Tiraboschi P, Hansen L a, Thal LJ, Corey-Bloom J (2004) The importance of neuritic
plaques and tangles to the development and evolution of AD. Neurology 62:1984–
1989.
Tran HT, LaFerla FM, Holtzman DM, Brody DL (2011) Controlled cortical impact
traumatic brain injury in 3xTg-AD mice causes acute intra-axonal amyloid-β
accumulation and independently accelerates the development of tau abnormalities. J
Neurosci 31:9513–9525.
Ueki A, Goto K, Sato N, Iso H, Morita Y (2006) Prepulse inhibition of acoustic startle
response in mild cognitive impairment and mild dementia of Alzheimer type.
Psychiatry Clin Neurosci 60:55–62.
Wahlsten D et al. (2003) Different data from different labs: Lessons from studies of gene-
environment interaction. J Neurobiol 54:283–311.
Wahlsten D, Bachmanov A, Finn D a, Crabbe JC (2006) Stability of inbred mouse strain
differences in behavior and brain size between laboratories and across decades. Proc
Natl Acad Sci U S A 103:16364–16369.
Walsh DM, Klyubin I, Fadeeva J V, Rowan MJ, Selkoe DJ (2002) Amyloid-beta
oligomers: their production, toxicity and therapeutic inhibition. Biochem Soc Trans
30:552–557.
Wang JM, Singh C, Liu L, Irwin RW, Chen S, Chung EJ, Thompson RF, Brinton RD
(2010) Allopregnanolone reverses neurogenic and cognitive deficits in mouse model
of Alzheimer’s disease. Proc Natl Acad Sci U S A 107:6498–6503.
Webster SJ, Bachstetter AD, Nelson PT, Schmitt FA, Van Eldik LJ (2014) Using mice to
model Alzheimer’s dementia: an overview of the clinical disease and the preclinical
behavioral changes in 10 mouse models. Front Genet 5:88.
Weintraub S, Wicklund AH, Salmon DP (2012) The neuropsychological profile of
Alzheimer disease. Cold Spring Harb Perspect Med 2.

274
Willner P (1984) The validity of animal models of depression. Psychopharmacology
(Berl) 83:1–16.
Willott JF, Tanner L, O’Steen J, Johnson KR, Bogue MA, Gagnon L (2003) Acoustic
startle and prepulse inhibition in 40 inbred strains of mice. Behav Neurosci
117:716–727.
Wong AA, Brown RE (2007) Age-related changes in visual acuity, learning and memory
in C57BL/6J and DBA/2J mice. Neurobiol Aging 28:1577–1593.
World Health Organization (2012) Dementia: a public health priority.
Wright SL, Brown RE (2002) The importance of paternal care on pup survival and pup
growth in Peromyscus californicus when required to work for food. Behav Processes
60:41–52.
Yamada K, Nabeshima T (2000) Animal models of Alzheimer’s disease and evaluation
of anti-dementia drugs. Pharmacol Ther 88:93–113.
Yan QJ, Asafo-Adjei PK, Arnold HM, Brown RE, Bauchwitz RP (2004) A phenotypic
and molecular characterization of the fmr1-tm1Cgr fragile X mouse. Genes Brain
Behav 3:337–359.
Zaharia MD, Kulczycki J, Shanks N, Meaney MJ, Anisman H (1996) The effects of early
postnatal stimulation on Morris water-maze acquisition in adult mice: Genetic and
maternal factors. Psychopharmacology (Berl) 128:227–239.
Zhang Y, Kurup P, Xu J, Carty N, Fernandez SM, Nygaard HB, Pittenger C, Greengard
P, Strittmatter SM, Nairn AC, Lombroso PJ (2010) Genetic reduction of striatal-
enriched tyrosine phosphatase (STEP) reverses cognitive and cellular deficits in an
Alzheimer’s disease mouse model. Proc Natl Acad Sci U S A 107:19014–19019.

275
APPENDIX 1 COPYRIGHT PERMISSION LETTERS
CHAPTER 6 COPYRIGHT PERMISSION LETTER
ELSEVIER LICENSE
TERMS AND CONDITIONS
Mar 16, 2015
This is a License Agreement between Kurt R Stover ("You") and Elsevier ("Elsevier")
provided by Copyright Clearance Center ("CCC"). The license consists of your order
details, the terms and conditions provided by Elsevier, and the payment terms and
conditions.
All payments must be made in full to CCC. For payment instructions, please see information listed at the bottom of this form.
Supplier Elsevier Limited The Boulevard,Langford Lane Kidlington,Oxford,OX5 1GB,UK
Registered Company Number 1982084
Customer name Kurt R Stover
Customer address 1355 Oxford Street, P.O. Box 15000
Halifax, NS B3H 4R2
License number 3567161125258
License date Feb 13, 2015
Licensed content publisher Elsevier
Licensed content publication Behavioural Brain Research
Licensed content title Analysis of motor function in 6-month-old male and female 3xTg-AD mice
Licensed content author None
Licensed content date 15 March 2015
Licensed content volume number 281
Licensed content issue number n/a
Number of pages 8
Start Page 16
End Page 23
Type of Use reuse in a thesis/dissertation
Portion full article
Format both print and electronic
276
Are you the author of this Elsevier article?
Yes
Will you be translating? No
Title of your thesis/dissertation Age-related changes in cognitive, emotional, and motor behaviour in male and female 3xTg-AD mice: A longitudinal study
Expected completion date May 2015
Estimated size (number of pages) 200
Elsevier VAT number GB 494 6272 12
Permissions price 0.00 CAD
VAT/Local Sales Tax 0.00 CAD / 0.00 GBP
Total 0.00 CAD
Terms and Conditions
INTRODUCTION
1. The publisher for this copyrighted material is Elsevier. By clicking "accept" in
connection with completing this licensing transaction, you agree that the following terms
and conditions apply to this transaction (along with the Billing and Payment terms and
conditions established by Copyright Clearance Center, Inc. ("CCC"), at the time that you
opened your Rightslink account and that are available at any time at
http://myaccount.copyright.com).
GENERAL TERMS
2. Elsevier hereby grants you permission to reproduce the aforementioned material subject
to the terms and conditions indicated.
3. Acknowledgement: If any part of the material to be used (for example, figures) has
appeared in our publication with credit or acknowledgement to another source, permission
must also be sought from that source. If such permission is not obtained then that
material may not be included in your publication/copies. Suitable acknowledgement to the
source must be made, either as a footnote or in a reference list at the end of your
publication, as follows:
"Reprinted from Publication title, Vol /edition number, Author(s), Title of article / title of
chapter, Pages No., Copyright (Year), with permission from Elsevier [OR APPLICABLE
SOCIETY COPYRIGHT OWNER]." Also Lancet special credit - "Reprinted from The
Lancet, Vol. number, Author(s), Title of article, Pages No., Copyright (Year), with
permission from Elsevier."
4. Reproduction of this material is confined to the purpose and/or media for which
permission is hereby given.
277
5. Altering/Modifying Material: Not Permitted. However figures and illustrations may be
altered/adapted minimally to serve your work. Any other abbreviations, additions,
deletions and/or any other alterations shall be made only with prior written authorization
of Elsevier Ltd. (Please contact Elsevier at [email protected])
6. If the permission fee for the requested use of our material is waived in this instance,
please be advised that your future requests for Elsevier materials may attract a fee.
7. Reservation of Rights: Publisher reserves all rights not specifically granted in the
combination of (i) the license details provided by you and accepted in the course of this
licensing transaction, (ii) these terms and conditions and (iii) CCC's Billing and Payment
terms and conditions.
8. License Contingent Upon Payment: While you may exercise the rights licensed
immediately upon issuance of the license at the end of the licensing process for the
transaction, provided that you have disclosed complete and accurate details of your
proposed use, no license is finally effective unless and until full payment is received from
you (either by publisher or by CCC) as provided in CCC's Billing and Payment terms and
conditions. If full payment is not received on a timely basis, then any license
preliminarily granted shall be deemed automatically revoked and shall be void as if never
granted. Further, in the event that you breach any of these terms and conditions or any of
CCC's Billing and Payment terms and conditions, the license is automatically revoked and
shall be void as if never granted. Use of materials as described in a revoked license, as
well as any use of the materials beyond the scope of an unrevoked license, may constitute
copyright infringement and publisher reserves the right to take any and all action to
protect its copyright in the materials.
9. Warranties: Publisher makes no representations or warranties with respect to the
licensed material.
10. Indemnity: You hereby indemnify and agree to hold harmless publisher and CCC, and
their respective officers, directors, employees and agents, from and against any and all
claims arising out of your use of the licensed material other than as specifically authorized
pursuant to this license.
11. No Transfer of License: This license is personal to you and may not be sublicensed,
assigned, or transferred by you to any other person without publisher's written permission.
12. No Amendment Except in Writing: This license may not be amended except in a
writing signed by both parties (or, in the case of publisher, by CCC on publisher's behalf).
13. Objection to Contrary Terms: Publisher hereby objects to any terms contained in any
purchase order, acknowledgment, check endorsement or other writing prepared by you,
which terms are inconsistent with these terms and conditions or CCC's Billing and
Payment terms and conditions. These terms and conditions, together with CCC's Billing
and Payment terms and conditions (which are incorporated herein), comprise the entire

278
agreement between you and publisher (and CCC) concerning this licensing transaction. In
the event of any conflict between your obligations established by these terms and
conditions and those established by CCC's Billing and Payment terms and conditions,
these terms and conditions shall control.
14. Revocation: Elsevier or Copyright Clearance Center may deny the permissions
described in this License at their sole discretion, for any reason or no reason, with a full
refund payable to you. Notice of such denial will be made using the contact information
provided by you. Failure to receive such notice will not alter or invalidate the denial. In
no event will Elsevier or Copyright Clearance Center be responsible or liable for any
costs, expenses or damage incurred by you as a result of a denial of your permission
request, other than a refund of the amount(s) paid by you to Elsevier and/or Copyright
Clearance Center for denied permissions.
LIMITED LICENSE
The following terms and conditions apply only to specific license types:
15. Translation: This permission is granted for non-exclusive world English rights only
unless your license was granted for translation rights. If you licensed translation rights
you may only translate this content into the languages you requested. A professional
translator must perform all translations and reproduce the content word for word
preserving the integrity of the article. If this license is to re-use 1 or 2 figures then
permission is granted for non-exclusive world rights in all languages.
16. Posting licensed content on any Website: The following terms and conditions apply
as follows: Licensing material from an Elsevier journal: All content posted to the web site
must maintain the copyright information line on the bottom of each image; A hyper-text
must be included to the Homepage of the journal from which you are licensing
athttp://www.sciencedirect.com/science/journal/xxxxx or the Elsevier homepage for
books athttp://www.elsevier.com; Central Storage: This license does not include
permission for a scanned version of the material to be stored in a central repository such
as that provided by Heron/XanEdu.
Licensing material from an Elsevier book: A hyper-text link must be included to the
Elsevier homepage at http://www.elsevier.com . All content posted to the web site must
maintain the copyright information line on the bottom of each image.
Posting licensed content on Electronic reserve: In addition to the above the following
clauses are applicable: The web site must be password-protected and made available only
to bona fide students registered on a relevant course. This permission is granted for 1 year
only. You may obtain a new license for future website posting.
17. For journal authors: the following clauses are applicable in addition to the above:

279
Preprints:
A preprint is an author's own write-up of research results and analysis, it has not been
peer-reviewed, nor has it had any other value added to it by a publisher (such as
formatting, copyright, technical enhancement etc.).
Authors can share their preprints anywhere at any time. Preprints should not be added to
or enhanced in any way in order to appear more like, or to substitute for, the final versions
of articles however authors can update their preprints on arXiv or RePEc with their
Accepted Author Manuscript (see below).
If accepted for publication, we encourage authors to link from the preprint to their formal
publication via its DOI. Millions of researchers have access to the formal publications on
ScienceDirect, and so links will help users to find, access, cite and use the best available
version. Please note that Cell Press, The Lancet and some society-owned have different
preprint policies. Information on these policies is available on the journal homepage.
Accepted Author Manuscripts: An accepted author manuscript is the manuscript of an
article that has been accepted for publication and which typically includes author-
incorporated changes suggested during submission, peer review and editor-author
communications.
Authors can share their accepted author manuscript:
immediately
o via their non-commercial person homepage or blog
o by updating a preprint in arXiv or RePEc with the accepted manuscript
o via their research institute or institutional repository for internal
institutional uses or as part of an invitation-only research collaboration
work-group
o directly by providing copies to their students or to research collaborators
for their personal use
o for private scholarly sharing as part of an invitation-only work group on
commercial sites with which Elsevier has an agreement
after the embargo period
o via non-commercial hosting platforms such as their institutional repository
o via commercial sites with which Elsevier has an agreement
In all cases accepted manuscripts should:
link to the formal publication via its DOI
bear a CC-BY-NC-ND license - this is easy to do
if aggregated with other manuscripts, for example in a repository or other site,
be shared in alignment with our hosting policy not be added to or enhanced in any
way to appear more like, or to substitute for, the published journal article.
280
Published journal article (JPA): A published journal article (PJA) is the definitive final
record of published research that appears or will appear in the journal and embodies all
value-adding publishing activities including peer review co-ordination, copy-editing,
formatting, (if relevant) pagination and online enrichment.
Policies for sharing publishing journal articles differ for subscription and gold open access
articles:
Subscription Articles: If you are an author, please share a link to your article rather than
the full-text. Millions of researchers have access to the formal publications on
ScienceDirect, and so links will help your users to find, access, cite, and use the best
available version.
Theses and dissertations which contain embedded PJAs as part of the formal submission
can be posted publicly by the awarding institution with DOI links back to the formal
publications on ScienceDirect.
If you are affiliated with a library that subscribes to ScienceDirect you have additional
private sharing rights for others' research accessed under that agreement. This includes
use for classroom teaching and internal training at the institution (including use in course
packs and courseware programs), and inclusion of the article for grant funding purposes.
Gold Open Access Articles: May be shared according to the author-selected end-user
license and should contain a CrossMark logo, the end user license, and a DOI link to the
formal publication on ScienceDirect.
Please refer to Elsevier's posting policy for further information.
18. For book authors the following clauses are applicable in addition to the
above: Authors are permitted to place a brief summary of their work online only. You
are not allowed to download and post the published electronic version of your chapter, nor
may you scan the printed edition to create an electronic version. Posting to a
repository: Authors are permitted to post a summary of their chapter only in their
institution's repository.
19. Thesis/Dissertation: If your license is for use in a thesis/dissertation your thesis may
be submitted to your institution in either print or electronic form. Should your thesis be
published commercially, please reapply for permission. These requirements include
permission for the Library and Archives of Canada to supply single copies, on demand, of
the complete thesis and include permission for Proquest/UMI to supply single copies, on
demand, of the complete thesis. Should your thesis be published commercially, please
reapply for permission. Theses and dissertations which contain embedded PJAs as part of
the formal submission can be posted publicly by the awarding institution with DOI links
back to the formal publications on ScienceDirect.

281
Elsevier Open Access Terms and Conditions
You can publish open access with Elsevier in hundreds of open access journals or in
nearly 2000 established subscription journals that support open access publishing.
Permitted third party re-use of these open access articles is defined by the author's choice
of Creative Commons user license. See our open access license policy for more
information.
Terms & Conditions applicable to all Open Access articles published with Elsevier:
Any reuse of the article must not represent the author as endorsing the adaptation of the
article nor should the article be modified in such a way as to damage the author's honour
or reputation. If any changes have been made, such changes must be clearly indicated.
The author(s) must be appropriately credited and we ask that you include the end user
license and a DOI link to the formal publication on ScienceDirect.
If any part of the material to be used (for example, figures) has appeared in our
publication with credit or acknowledgement to another source it is the responsibility of the
user to ensure their reuse complies with the terms and conditions determined by the rights
holder.
Additional Terms & Conditions applicable to each Creative Commons user license:
CC BY: The CC-BY license allows users to copy, to create extracts, abstracts and new
works from the Article, to alter and revise the Article and to make commercial use of the
Article (including reuse and/or resale of the Article by commercial entities), provided the
user gives appropriate credit (with a link to the formal publication through the relevant
DOI), provides a link to the license, indicates if changes were made and the licensor is not
represented as endorsing the use made of the work. The full details of the license are
available at http://creativecommons.org/licenses/by/4.0.
CC BY NC SA: The CC BY-NC-SA license allows users to copy, to create extracts,
abstracts and new works from the Article, to alter and revise the Article, provided this is
not done for commercial purposes, and that the user gives appropriate credit (with a link
to the formal publication through the relevant DOI), provides a link to the license,
indicates if changes were made and the licensor is not represented as endorsing the use
made of the work. Further, any new works must be made available on the same
conditions. The full details of the license are available
at http://creativecommons.org/licenses/by-nc-sa/4.0.
CC BY NC ND: The CC BY-NC-ND license allows users to copy and distribute the
Article, provided this is not done for commercial purposes and further does not permit
distribution of the Article if it is changed or edited in any way, and provided the user

282
gives appropriate credit (with a link to the formal publication through the relevant DOI),
provides a link to the license, and that the licensor is not represented as endorsing the use
made of the work. The full details of the license are available
at http://creativecommons.org/licenses/by-nc-nd/4.0. Any commercial reuse of Open
Access articles published with a CC BY NC SA or CC BY NC ND license requires
permission from Elsevier and will be subject to a fee.
Commercial reuse includes:
Associating advertising with the full text of the Article
Charging fees for document delivery or access
Article aggregation
Systematic distribution via e-mail lists or share buttons
Posting or linking by commercial companies for use by customers of those companies.
20. Other Conditions:
Questions? [email protected] or +1-855-239-3415 (toll free in the US) or +1-978-646-2777.
Gratis licenses (referencing $0 in the Total field) are free. Please retain this printable license for your reference. No payment is required.

283
CHAPTER 7 COPYRIGHT PERMISSION LETTER
ELSEVIER LICENSE
TERMS AND CONDITIONS
May 31, 2015
This is a License Agreement between Kurt R Stover ("You") and Elsevier ("Elsevier")
provided by Copyright Clearance Center ("CCC"). The license consists of your order
details, the terms and conditions provided by Elsevier, and the payment terms and
conditions.
All payments must be made in full to CCC. For payment instructions, please see
information listed at the bottom of this form.
Supplier Elsevier Limited The Boulevard,Langford Lane Kidlington,Oxford,OX5 1GB,UK
Registered Company Number 1982084
Customer name Kurt R Stover
Customer address 1355 Oxford Street, P.O. Box 15000
Halifax, NS B3H 4R2
License number 3639150300128
License date May 31, 2015
Licensed content publisher Elsevier
Licensed content publication Behavioural Brain Research
Licensed content title Early detection of cognitive deficits in the 3xTg-AD mouse model of Alzheimer's disease
Licensed content author Kurt R. Stover,Mackenzie A. Campbell,Christine M. Van
Winssen,Richard E. Brown
Licensed content date 1 August 2015
Licensed content volume number 289
Licensed content issue number n/a
Number of pages 10
Start Page 29
End Page 38
Type of Use reuse in a thesis/dissertation
Intended publisher of new work other
Portion full article
284
Format electronic
Are you the author of this Elsevier
article?
Yes
Will you be translating? No
Title of your thesis/dissertation Age-related changes in cognitive, emotional, and motor behaviour in male and female 3xTg-AD mice: A
longitudinal study
Expected completion date May 2015
Estimated size (number of pages) 200
Elsevier VAT number GB 494 6272 12
Permissions price 0.00 USD
VAT/Local Sales Tax 0.00 USD / 0.00 GBP
Total 0.00 USD
Terms and Conditions
INTRODUCTION
1. The publisher for this copyrighted material is Elsevier. By clicking "accept" in
connection with completing this licensing transaction, you agree that the following terms
and conditions apply to this transaction (along with the Billing and Payment terms and
conditions established by Copyright Clearance Center, Inc. ("CCC"), at the time that you
opened your Rightslink account and that are available at any time
athttp://myaccount.copyright.com).
GENERAL TERMS
2. Elsevier hereby grants you permission to reproduce the aforementioned material subject
to the terms and conditions indicated.
3. Acknowledgement: If any part of the material to be used (for example, figures) has
appeared in our publication with credit or acknowledgement to another source, permission
must also be sought from that source. If such permission is not obtained then that
material may not be included in your publication/copies. Suitable acknowledgement to the
source must be made, either as a footnote or in a reference list at the end of your
publication, as follows:
"Reprinted from Publication title, Vol /edition number, Author(s), Title of article / title of
chapter, Pages No., Copyright (Year), with permission from Elsevier [OR APPLICABLE

285
SOCIETY COPYRIGHT OWNER]." Also Lancet special credit - "Reprinted from The
Lancet, Vol. number, Author(s), Title of article, Pages No., Copyright (Year), with
permission from Elsevier."
4. Reproduction of this material is confined to the purpose and/or media for which
permission is hereby given.
5. Altering/Modifying Material: Not Permitted. However figures and illustrations may be
altered/adapted minimally to serve your work. Any other abbreviations, additions,
deletions and/or any other alterations shall be made only with prior written authorization
of Elsevier Ltd. (Please contact Elsevier at [email protected])
6. If the permission fee for the requested use of our material is waived in this instance,
please be advised that your future requests for Elsevier materials may attract a fee.
7. Reservation of Rights: Publisher reserves all rights not specifically granted in the
combination of (i) the license details provided by you and accepted in the course of this
licensing transaction, (ii) these terms and conditions and (iii) CCC's Billing and Payment
terms and conditions.
8. License Contingent Upon Payment: While you may exercise the rights licensed
immediately upon issuance of the license at the end of the licensing process for the
transaction, provided that you have disclosed complete and accurate details of your
proposed use, no license is finally effective unless and until full payment is received from
you (either by publisher or by CCC) as provided in CCC's Billing and Payment terms and
conditions. If full payment is not received on a timely basis, then any license
preliminarily granted shall be deemed automatically revoked and shall be void as if never
granted. Further, in the event that you breach any of these terms and conditions or any of
CCC's Billing and Payment terms and conditions, the license is automatically revoked and
shall be void as if never granted. Use of materials as described in a revoked license, as
well as any use of the materials beyond the scope of an unrevoked license, may constitute
copyright infringement and publisher reserves the right to take any and all action to
protect its copyright in the materials.
9. Warranties: Publisher makes no representations or warranties with respect to the
licensed material.
10. Indemnity: You hereby indemnify and agree to hold harmless publisher and CCC, and
their respective officers, directors, employees and agents, from and against any and all
claims arising out of your use of the licensed material other than as specifically authorized
pursuant to this license.
11. No Transfer of License: This license is personal to you and may not be sublicensed,
assigned, or transferred by you to any other person without publisher's written permission.

286
12. No Amendment Except in Writing: This license may not be amended except in a
writing signed by both parties (or, in the case of publisher, by CCC on publisher's behalf).
13. Objection to Contrary Terms: Publisher hereby objects to any terms contained in any
purchase order, acknowledgment, check endorsement or other writing prepared by you,
which terms are inconsistent with these terms and conditions or CCC's Billing and
Payment terms and conditions. These terms and conditions, together with CCC's Billing
and Payment terms and conditions (which are incorporated herein), comprise the entire
agreement between you and publisher (and CCC) concerning this licensing transaction. In
the event of any conflict between your obligations established by these terms and
conditions and those established by CCC's Billing and Payment terms and conditions,
these terms and conditions shall control.
14. Revocation: Elsevier or Copyright Clearance Center may deny the permissions
described in this License at their sole discretion, for any reason or no reason, with a full
refund payable to you. Notice of such denial will be made using the contact information
provided by you. Failure to receive such notice will not alter or invalidate the denial. In
no event will Elsevier or Copyright Clearance Center be responsible or liable for any
costs, expenses or damage incurred by you as a result of a denial of your permission
request, other than a refund of the amount(s) paid by you to Elsevier and/or Copyright
Clearance Center for denied permissions.
LIMITED LICENSE
The following terms and conditions apply only to specific license types:
15. Translation: This permission is granted for non-exclusive world English rights only
unless your license was granted for translation rights. If you licensed translation rights
you may only translate this content into the languages you requested. A professional
translator must perform all translations and reproduce the content word for word
preserving the integrity of the article. If this license is to re-use 1 or 2 figures then
permission is granted for non-exclusive world rights in all languages.
16. Posting licensed content on any Website: The following terms and conditions apply
as follows: Licensing material from an Elsevier journal: All content posted to the web site
must maintain the copyright information line on the bottom of each image; A hyper-text
must be included to the Homepage of the journal from which you are licensing
athttp://www.sciencedirect.com/science/journal/xxxxx or the Elsevier homepage for
books athttp://www.elsevier.com; Central Storage: This license does not include
permission for a scanned version of the material to be stored in a central repository such
as that provided by Heron/XanEdu.
Licensing material from an Elsevier book: A hyper-text link must be included to the
Elsevier homepage at http://www.elsevier.com . All content posted to the web site must
maintain the copyright information line on the bottom of each image.
287
Posting licensed content on Electronic reserve: In addition to the above the following
clauses are applicable: The web site must be password-protected and made available only
to bona fide students registered on a relevant course. This permission is granted for 1 year
only. You may obtain a new license for future website posting.
17. For journal authors: the following clauses are applicable in addition to the above:
Preprints:
A preprint is an author's own write-up of research results and analysis, it has not been
peer-reviewed, nor has it had any other value added to it by a publisher (such as
formatting, copyright, technical enhancement etc.).
Authors can share their preprints anywhere at any time. Preprints should not be added to
or enhanced in any way in order to appear more like, or to substitute for, the final versions
of articles however authors can update their preprints on arXiv or RePEc with their
Accepted Author Manuscript (see below).
If accepted for publication, we encourage authors to link from the preprint to their formal
publication via its DOI. Millions of researchers have access to the formal publications on
ScienceDirect, and so links will help users to find, access, cite and use the best available
version. Please note that Cell Press, The Lancet and some society-owned have different
preprint policies. Information on these policies is available on the journal homepage.
Accepted Author Manuscripts: An accepted author manuscript is the manuscript of an
article that has been accepted for publication and which typically includes author-
incorporated changes suggested during submission, peer review and editor-author
communications.
Authors can share their accepted author manuscript:
immediately
o via their non-commercial person homepage or blog
o by updating a preprint in arXiv or RePEc with the accepted
manuscript
o via their research institute or institutional repository for internal
institutional uses or as part of an invitation-only research
collaboration work-group
o directly by providing copies to their students or to research
collaborators for their personal use
o for private scholarly sharing as part of an invitation-only work
group on commercial sites with which Elsevier has an agreement
after the embargo period
o via non-commercial hosting platforms such as their institutional
repository

288
o via commercial sites with which Elsevier has an agreement
In all cases accepted manuscripts should:
link to the formal publication via its DOI
bear a CC-BY-NC-ND license - this is easy to do
if aggregated with other manuscripts, for example in a repository or other site,
be shared in alignment with our hosting policy not be added to or enhanced in any
way to appear more like, or to substitute for, the published journal article.
Published journal article (JPA): A published journal article (PJA) is the definitive final
record of published research that appears or will appear in the journal and embodies all
value-adding publishing activities including peer review co-ordination, copy-editing,
formatting, (if relevant) pagination and online enrichment.
Policies for sharing publishing journal articles differ for subscription and gold open access
articles:
Subscription Articles: If you are an author, please share a link to your article rather than
the full-text. Millions of researchers have access to the formal publications on
ScienceDirect, and so links will help your users to find, access, cite, and use the best
available version.
Theses and dissertations which contain embedded PJAs as part of the formal submission
can be posted publicly by the awarding institution with DOI links back to the formal
publications on ScienceDirect.
If you are affiliated with a library that subscribes to ScienceDirect you have additional
private sharing rights for others' research accessed under that agreement. This includes
use for classroom teaching and internal training at the institution (including use in course
packs and courseware programs), and inclusion of the article for grant funding purposes.
Gold Open Access Articles: May be shared according to the author-selected end-user
license and should contain a CrossMark logo, the end user license, and a DOI link to the
formal publication on ScienceDirect.
Please refer to Elsevier's posting policy for further information.
18. For book authors the following clauses are applicable in addition to the
above: Authors are permitted to place a brief summary of their work online only. You
are not allowed to download and post the published electronic version of your chapter, nor
may you scan the printed edition to create an electronic version. Posting to a
repository: Authors are permitted to post a summary of their chapter only in their
institution's repository.

289
19. Thesis/Dissertation: If your license is for use in a thesis/dissertation your thesis may
be submitted to your institution in either print or electronic form. Should your thesis be
published commercially, please reapply for permission. These requirements include
permission for the Library and Archives of Canada to supply single copies, on demand, of
the complete thesis and include permission for Proquest/UMI to supply single copies, on
demand, of the complete thesis. Should your thesis be published commercially, please
reapply for permission. Theses and dissertations which contain embedded PJAs as part of
the formal submission can be posted publicly by the awarding institution with DOI links
back to the formal publications on ScienceDirect.
Elsevier Open Access Terms and Conditions
You can publish open access with Elsevier in hundreds of open access journals or in
nearly 2000 established subscription journals that support open access publishing.
Permitted third party re-use of these open access articles is defined by the author's choice
of Creative Commons user license. See our open access license policy for more
information.
Terms & Conditions applicable to all Open Access articles published with Elsevier:
Any reuse of the article must not represent the author as endorsing the adaptation of the
article nor should the article be modified in such a way as to damage the author's honour
or reputation. If any changes have been made, such changes must be clearly indicated.
The author(s) must be appropriately credited and we ask that you include the end user
license and a DOI link to the formal publication on ScienceDirect.
If any part of the material to be used (for example, figures) has appeared in our
publication with credit or acknowledgement to another source it is the responsibility of the
user to ensure their reuse complies with the terms and conditions determined by the rights
holder.
Additional Terms & Conditions applicable to each Creative Commons user license:
CC BY: The CC-BY license allows users to copy, to create extracts, abstracts and new
works from the Article, to alter and revise the Article and to make commercial use of the
Article (including reuse and/or resale of the Article by commercial entities), provided the
user gives appropriate credit (with a link to the formal publication through the relevant
DOI), provides a link to the license, indicates if changes were made and the licensor is not
represented as endorsing the use made of the work. The full details of the license are
available at http://creativecommons.org/licenses/by/4.0.
CC BY NC SA: The CC BY-NC-SA license allows users to copy, to create extracts,
abstracts and new works from the Article, to alter and revise the Article, provided this is

290
not done for commercial purposes, and that the user gives appropriate credit (with a link
to the formal publication through the relevant DOI), provides a link to the license,
indicates if changes were made and the licensor is not represented as endorsing the use
made of the work. Further, any new works must be made available on the same
conditions. The full details of the license are available
at http://creativecommons.org/licenses/by-nc-sa/4.0.
CC BY NC ND: The CC BY-NC-ND license allows users to copy and distribute the
Article, provided this is not done for commercial purposes and further does not permit
distribution of the Article if it is changed or edited in any way, and provided the user
gives appropriate credit (with a link to the formal publication through the relevant DOI),
provides a link to the license, and that the licensor is not represented as endorsing the use
made of the work. The full details of the license are available
at http://creativecommons.org/licenses/by-nc-nd/4.0. Any commercial reuse of Open
Access articles published with a CC BY NC SA or CC BY NC ND license requires
permission from Elsevier and will be subject to a fee.
Commercial reuse includes:
Associating advertising with the full text of the Article
Charging fees for document delivery or access
Article aggregation
Systematic distribution via e-mail lists or share buttons
Posting or linking by commercial companies for use by customers of those companies.
20. Other Conditions:
v1.7
Questions? [email protected] or +1-855-239-3415 (toll free in the US) or +1-978-646-2777.